ANXIETY LEVELS OF AN INDIVIDUAL IS AFFECTED BY THE BUSINESS CYCLE OF A COUNTRY BY ANNISA TIARA INDIVIDUAL RESEARCH PROJECT Submitted as a requirement for the marking fulfillment in the following subjects; Economy & Sociology, in Victory Plus High School. Bekasi, Indonesia, 2013/2014.
Transcript
ANXIETY LEVELS OF AN INDIVIDUAL IS
AFFECTED BY THE BUSINESS CYCLE OF A
COUNTRY
BY ANNISA TIARA
INDIVIDUAL RESEARCH PROJECT
Submitted as a requirement for the marking fulfillment in the following subjects; Economy &
Sociology, in Victory Plus High School.
Bekasi, Indonesia, 2013/2014.
PREFACE
I would like to thank my beloved mentor, Ms. Fenty Gultom, for sparing her time to look into my
project and consult with me for improvements. As she is my former Economics teacher and my
current Business Studies teacher, I am inspired by her and also her knowledge in psychology,
leading me to my project’s topic.
My family, especially my dad, I would like to thank him for his time giving me further
explanations when needed about the world of economy.
I would like to thank my friends for always supporting me in finishing my project also the Senior
High School Students of Victory Plus for cooperating with me in giving their parents
questionnaires. To the parents of the students, thank you too.
Last and my utmost gratefulness is to God, the ultimate beginning and end, the eternity, for giving
me the ability to finish the project well, and for life. I am grateful for everything.
Here’s to humanity and our mental health.
Cheers.
Annisa Tiara,
24th February 2014
ABSTRACT
The conducted research is about anxiety levels of individuals whether or not they are affected by the Business Cycle of a country. This aims to find out relationships between the two variables. The basic question that is trying to be answered is if anxiety is affected, to what extent does it affect it? To answer the question, questionnaires were spread out regarding the financial factors and anxiety. The population is randomly chosen as I used a random sampling method. I have learned that financial instability does affect anxiety levels. Though, no clear extent is determined. This is due to individuals being different from one to another. My hypothesis has proven to be right.
TABLE OF CONTENT
1. INTRODUCTION
1.1 Research Question
1.2 Aim & Objectives
1.4 Hypothesis
2. SUPPORTING THEORY
2.1 Understanding The Variables
2.2 Variable X: Business Cycle
a. Monetarist Theory
b. Austrian Theory (Schumpeter)
c. Burns, Mitchell & The Keynesian Theory
d. Conclusion to The Business Cycle
2.3 Variable Y: Anxiety
a. Types and Symptoms of Anxiety
2.4 Correlation of X and Y
3. METHODOLOGY
3.1 Conducting The Research
3.2 Analysis Of Results
a. Employed Respondents Results
b. Unemployed Respondent Results
4. CONCLUSION
1. INTRODUCTION Anxiety an insidious plague that most of us ignore, which turned out to be more deadly rather than
car crashes. In the United States of America during year 2010, according to the C.D.C, people
who died due to vehicle accidents were 33,687 people, and suicidal death were counted by 38,364
(New York Times, Parker-Pope, 2013).
“Personal factors are often a source of [anxiety]. These include career related concerns such as…
financial concerns” (Walonick, S. 1993). A fluctuation in an economic system of a country (The
Business Cycle) –which causes financial shifts stimulates financial concerns. All the phases that
the cycle seemed to have an effect towards people and their anxiety levels, especially the phase of
recession. Thus, this thesis will be investigating the relationship of the Business Cycle and the
anxiety levels.
1.1 RESEARCH QUESTION
To what extent could a Business Cycle affect the anxiety level of an individual?
1.2 AIM & OBJECTIVES
To make aware of society about anxiety and also to help humanity understand more about
themselves and what they are feeling.
1.3 HYPOTHESIS
I believe that by doing this investigation I would come to a result where anxiety level of an
individual is indeed affected a business cycle of a country. Financial instability causes anxiety
levels to increase.
2. SUPPORTING BACKGROUND 2.1 UNDERSTANDING THE VARIABLES
A variable is a characteristic that varies and changes according to the relationship between factors.
Basically there are two variables; Independent Variable (IV) and Dependent Variable (DV).
“The following is a hypothesis for a study.
1. "There will be a statistically significant difference in graduation rates of at-risk high-school seniors who participate in an intensive study program as opposed to at-risk high-school seniors who do not participate in the intensive study program." (LaFountain & Bartos, 2002, p. 57)
IV: Participation in intensive study program.
DV: Graduation rates”.
Independent & dependent variables. (n.d.). Retrieved from http://www.uncp.edu/home/collierw/ivdv.htm
Simply, the IV (variable X) is the main factor on the research; a presumed cause, whereas the DV
(variable Y) is the resultant; the presumed effect. In this research, the two variables that take part
is the Anxiety Level as the dependent variable and the Business Cycle as the independent variable.
2.2 VARIABLE X: BUSINESS CYCLE
A. THE MONETARIST THEORY
According to the explanation by Professor Tyler Cowen in the Monetarist Theory, “…monetary
growth is very important to the business cycle…” This theory is basically an economic concept
that exhibits the significance of the rate of economic growth. An idea proposed by Milton
Friedman stated that when the monetary supply is stabilized it would prevent excessive growth or
declines that might lead to inflations or economic downturns. The Monetarist Theory has a
relationship with the Quantity Theory of Money, which was developed by the first monetarist in
the United States, Irving Fisher. The theory was;
MV=PT
Whereas M stands for the money supply, V is the velocity of the circulation, P is the price level
and T stands for the transactions (output).
There are several events that evince the Monetary Theory to be proven. The deflationary pressures
that lead to an economic downturn in the period of 1970s, when a stagflation 1 occurs, is one of 1 Stagflation: A persistent high inflation combined with high unemployment and stagnant
demand in a country’s economy.
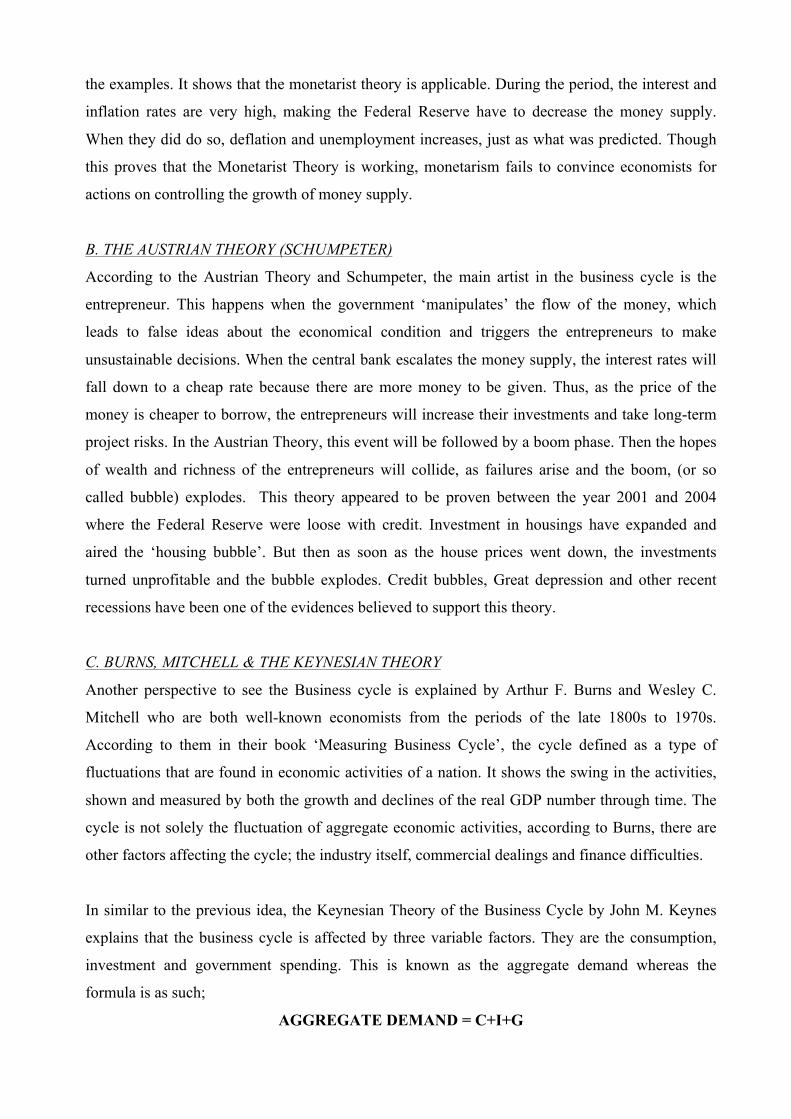
the examples. It shows that the monetarist theory is applicable. During the period, the interest and
inflation rates are very high, making the Federal Reserve have to decrease the money supply.
When they did do so, deflation and unemployment increases, just as what was predicted. Though
this proves that the Monetarist Theory is working, monetarism fails to convince economists for
actions on controlling the growth of money supply.
B. THE AUSTRIAN THEORY (SCHUMPETER)
According to the Austrian Theory and Schumpeter, the main artist in the business cycle is the
entrepreneur. This happens when the government ‘manipulates’ the flow of the money, which
leads to false ideas about the economical condition and triggers the entrepreneurs to make
unsustainable decisions. When the central bank escalates the money supply, the interest rates will
fall down to a cheap rate because there are more money to be given. Thus, as the price of the
money is cheaper to borrow, the entrepreneurs will increase their investments and take long-term
project risks. In the Austrian Theory, this event will be followed by a boom phase. Then the hopes
of wealth and richness of the entrepreneurs will collide, as failures arise and the boom, (or so
called bubble) explodes. This theory appeared to be proven between the year 2001 and 2004
where the Federal Reserve were loose with credit. Investment in housings have expanded and
aired the ‘housing bubble’. But then as soon as the house prices went down, the investments
turned unprofitable and the bubble explodes. Credit bubbles, Great depression and other recent
recessions have been one of the evidences believed to support this theory.
C. BURNS, MITCHELL & THE KEYNESIAN THEORY
Another perspective to see the Business cycle is explained by Arthur F. Burns and Wesley C.
Mitchell who are both well-known economists from the periods of the late 1800s to 1970s.
According to them in their book ‘Measuring Business Cycle’, the cycle defined as a type of
fluctuations that are found in economic activities of a nation. It shows the swing in the activities,
shown and measured by both the growth and declines of the real GDP number through time. The
cycle is not solely the fluctuation of aggregate economic activities, according to Burns, there are
other factors affecting the cycle; the industry itself, commercial dealings and finance difficulties.
In similar to the previous idea, the Keynesian Theory of the Business Cycle by John M. Keynes
explains that the business cycle is affected by three variable factors. They are the consumption,
investment and government spending. This is known as the aggregate demand whereas the
formula is as such;
AGGREGATE DEMAND = C+I+G
In the Keynesian Theory, is believed that when the aggregate demand falls the production of
goods and services are also decreasing as they realize that consumers are loosing the propensity to
consume. When people are starting to loose interest in spending, firms will try to attract them back
by lowering the price. To handle this adjustment and still making profit, the firm has no more
choice than to reduce the production cost, e.g.: cutting wages. Cost cutting by wage cutting is
cutting also the motivation of labor thus; cut of productivity. In the end, delayering happens and
this increases unemployment, dragging the aggregate demand further down. Combining the fall of
the aggregate demand and the cost cutting, this will lead to systemic crisis. Overall the Keynesian
Theory gives accurate points on describing the real-world fluctuations of the business cycle but
Keynesian Theory is short of solutions to solve crisis.
D. CONCLUSION TO THE BUSINESS CYCLE
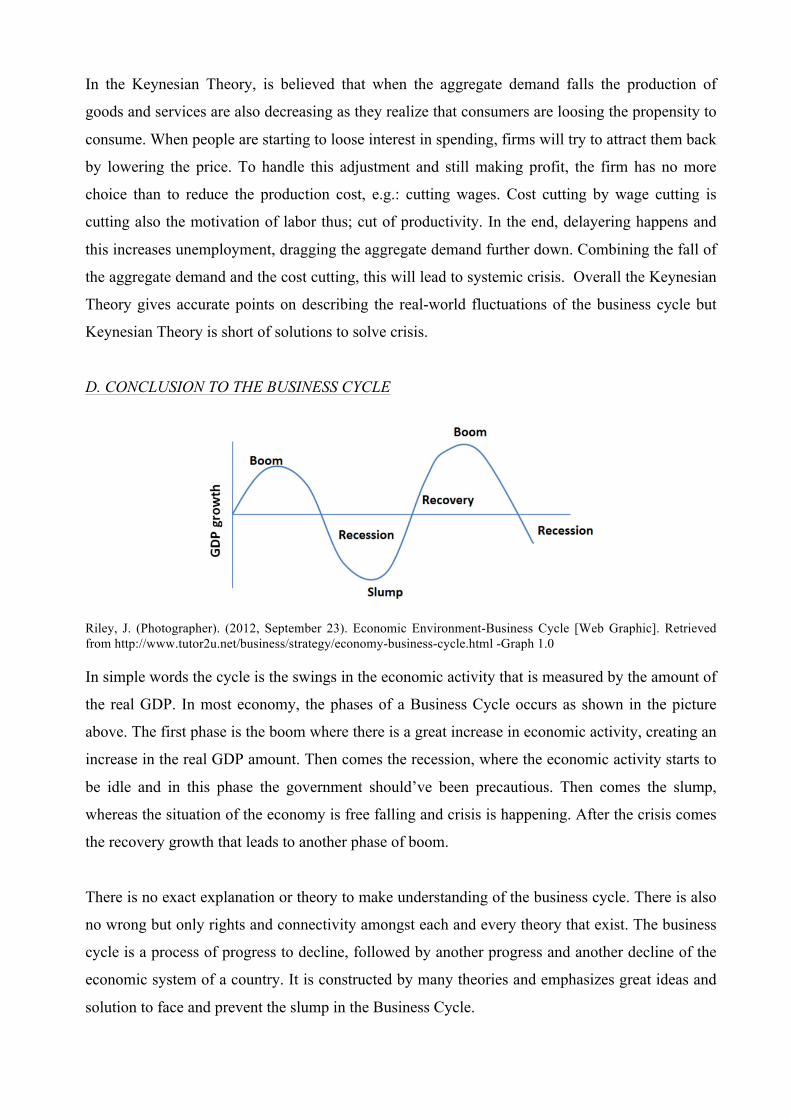
Riley, J. (Photographer). (2012, September 23). Economic Environment-Business Cycle [Web Graphic]. Retrieved from http://www.tutor2u.net/business/strategy/economy-business-cycle.html -Graph 1.0 In simple words the cycle is the swings in the economic activity that is measured by the amount of
the real GDP. In most economy, the phases of a Business Cycle occurs as shown in the picture
above. The first phase is the boom where there is a great increase in economic activity, creating an
increase in the real GDP amount. Then comes the recession, where the economic activity starts to
be idle and in this phase the government should’ve been precautious. Then comes the slump,
whereas the situation of the economy is free falling and crisis is happening. After the crisis comes
the recovery growth that leads to another phase of boom.
There is no exact explanation or theory to make understanding of the business cycle. There is also
no wrong but only rights and connectivity amongst each and every theory that exist. The business
cycle is a process of progress to decline, followed by another progress and another decline of the
economic system of a country. It is constructed by many theories and emphasizes great ideas and
solution to face and prevent the slump in the Business Cycle.
2.3 VARIABLE Y: ANXIETY
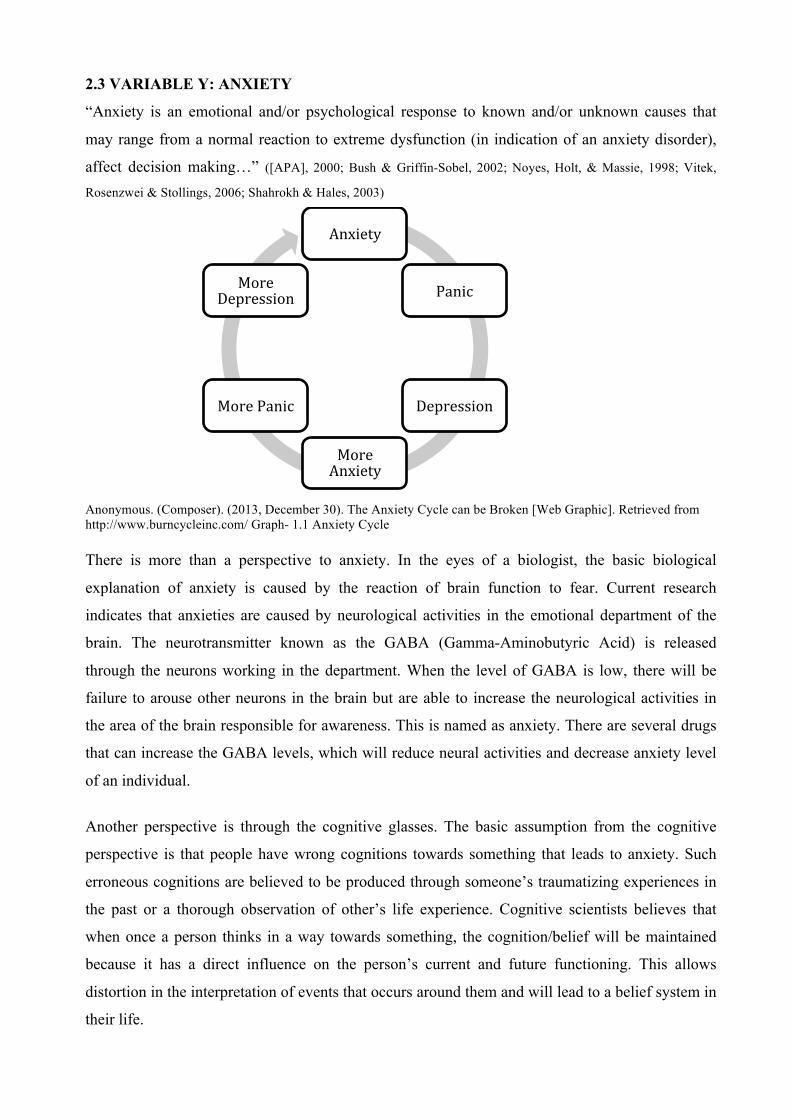
“Anxiety is an emotional and/or psychological response to known and/or unknown causes that
may range from a normal reaction to extreme dysfunction (in indication of an anxiety disorder),
Anonymous. (Composer). (2013, December 30). The Anxiety Cycle can be Broken [Web Graphic]. Retrieved from http://www.burncycleinc.com/ Graph- 1.1 Anxiety Cycle
There is more than a perspective to anxiety. In the eyes of a biologist, the basic biological
explanation of anxiety is caused by the reaction of brain function to fear. Current research
indicates that anxieties are caused by neurological activities in the emotional department of the
brain. The neurotransmitter known as the GABA (Gamma-Aminobutyric Acid) is released
through the neurons working in the department. When the level of GABA is low, there will be
failure to arouse other neurons in the brain but are able to increase the neurological activities in
the area of the brain responsible for awareness. This is named as anxiety. There are several drugs
that can increase the GABA levels, which will reduce neural activities and decrease anxiety level
of an individual.
Another perspective is through the cognitive glasses. The basic assumption from the cognitive
perspective is that people have wrong cognitions towards something that leads to anxiety. Such
erroneous cognitions are believed to be produced through someone’s traumatizing experiences in
the past or a thorough observation of other’s life experience. Cognitive scientists believes that
when once a person thinks in a way towards something, the cognition/belief will be maintained
because it has a direct influence on the person’s current and future functioning. This allows
distortion in the interpretation of events that occurs around them and will lead to a belief system in
their life.
Anxiety
Panic
Depression
More Anxiety
More Panic
More Depression
Through the learning theorists’ perspective, anxiety is conditioned as a response and they are
learned as behaviors. Anxiety shows when a previously neutral stimulus paired with a condition
develops into fear. Similar events to the condition that develops the neutral stimulus will also
elicit fear, which triggers the same anxiety. For instance, when someone was bitten by a dog will
begin elicit fear in dogs or perhaps other animals similar to dogs.
To explain the states and or maintenance, causes of anxiety there has no theory that can fully take
into account all factors. Many depend and vary to each individual. There are no specific or exact
theories to predict or determine the level of anxiety in an individual.
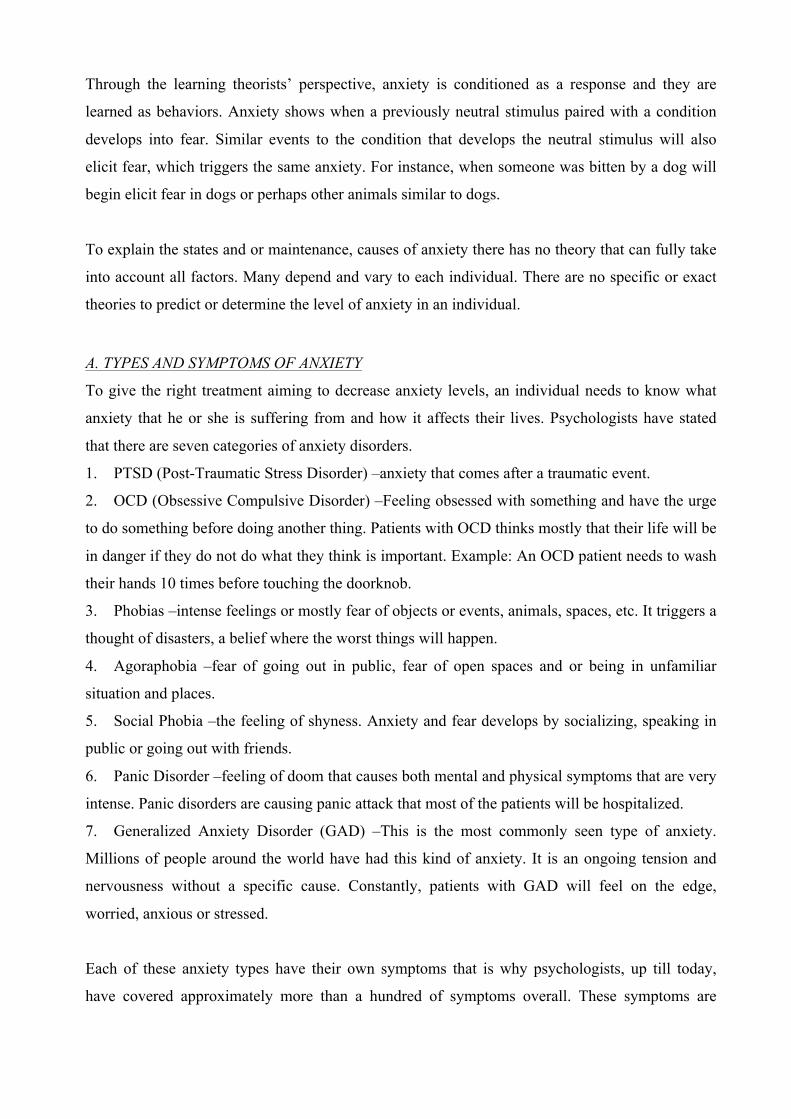
A. TYPES AND SYMPTOMS OF ANXIETY
To give the right treatment aiming to decrease anxiety levels, an individual needs to know what
anxiety that he or she is suffering from and how it affects their lives. Psychologists have stated
that there are seven categories of anxiety disorders.
1. PTSD (Post-Traumatic Stress Disorder) –anxiety that comes after a traumatic event.
2. OCD (Obsessive Compulsive Disorder) –Feeling obsessed with something and have the urge
to do something before doing another thing. Patients with OCD thinks mostly that their life will be
in danger if they do not do what they think is important. Example: An OCD patient needs to wash
their hands 10 times before touching the doorknob.
3. Phobias –intense feelings or mostly fear of objects or events, animals, spaces, etc. It triggers a
thought of disasters, a belief where the worst things will happen.
4. Agoraphobia –fear of going out in public, fear of open spaces and or being in unfamiliar
situation and places.
5. Social Phobia –the feeling of shyness. Anxiety and fear develops by socializing, speaking in
public or going out with friends.
6. Panic Disorder –feeling of doom that causes both mental and physical symptoms that are very
intense. Panic disorders are causing panic attack that most of the patients will be hospitalized.
7. Generalized Anxiety Disorder (GAD) –This is the most commonly seen type of anxiety.
Millions of people around the world have had this kind of anxiety. It is an ongoing tension and
nervousness without a specific cause. Constantly, patients with GAD will feel on the edge,
worried, anxious or stressed.
Each of these anxiety types have their own symptoms that is why psychologists, up till today,
have covered approximately more than a hundred of symptoms overall. These symptoms are
affecting individuals physically after their thoughts affect their mental health. Generally speaking,
the most familiar symptoms of anxiety are shown in the picture.
Anonymous. (Composer). (2012, November 06). The Real Truth About Anxiety Disorder [Web Graphic]. Retrieved from http://www.diseasesymptomstreatment.com/anxiety-disorders.html/ -Graph 1.2
2.4 CORRELATION OF X AND Y
“Q: In the face of a wobbly economic recovery, when unemployment remains high, and the average worker's spirits remain low, it's clear that the stock market's foundation appears to be less than solid. From a "sanity" perspective, how does one cope with this constant flow of uncertainty and insecurity? A: Collective anxiety and increased tension go hand in hand with uncertainty. When individuals experience stress, they can slip into patterns of irrational behavior or thinking, rapid mood swings and highly unpredictable feelings.”
Kass, N. (2012, May 27). Coping with economic uncertainty. Huffington Post. Retrieved from http://www.huffingtonpost.com/noah-kass/uncertainty_b_1459861.html
Though it is mentioned that GAD is caused without specific reasons, slight events in life might be
the reason. There are lots of variables, which can cause GAD, but to be specific we will be talking
about the economic situation. Stated in the quoted article from Huffington Post above was: the
economic instability and uncertainty can cause anxieties due to tensions and worries. Thus, in the
world of economy there is another type of anxiety called Economic anxiety. According to
inverstorswords.com, economic anxiety is psychological state of worry and concern of an
individual towards the condition of the economy. This tends to occur when markets crash and
stays in a recession for period of time longer than expected. For consumers (mostly investors) the
graphic bellow shows the cycle of emotions collected due to changes or shifts in the economic
condition.
Journals about researches regarding the correlation between the economic situation and anxiety
levels have been done too by well-known psychologists and psychiatrists. The following quotation
emphasizes and evinces the actual relationship between recessions that occurs and the stress and
anxiety that comes along with. “Psychiatrists who read CURRENT PSYCHIATRY and were polled in March 2009 agree. Most were seeing an increase in patients experiencing psychological stress because of the recession, which by then had persisted 16 months. "All my patients are reporting increased stress as a result of the economic situation. The more successful my patient is, the more distress they seem to be feeling," says a psychiatrist from Melbourne, FL.” (Palmer, Rediger, & Kauffman, 2009) “Symptoms. Depression, anxiety, or both are the most common symptoms associated with patients' financial difficulties, survey respondents say. Other symptoms include insomnia, hopelessness, helplessness, loss of trust, anger, bitterness, resentment, suicidal ideation or attempts, numbness, desires for retaliation, increased alcohol/drug use, fear of being unable to afford medications or of losing a job, paranoia, and marital problems.” (Palmer, Rediger, & Kauffman, 2009)
There is such thing as an Economic Anxiety. People might not see it as a serious problem in
the beginning as the stimuli develops primarily as only anxiety. But as the recessions are
held up to a longer time than predicted, then anxiety will develop to the next stages until
depression. “One out of six patients with depression thinks of suicide” (Leonard Holmes,
2003), leading us back to the fact where basically anxiety is more deadly than a car crash.
Graph 1.3 Economic emotions
3. METHODOLOGY To prove my hypothesis and compare the similarities with the theory I have looked upon to, I
conducted a test research with a group of population. The method I use to obtain the data I’m
looking for is by distributing questionnaires to the parents of Senior High School students of
Victory Plus School and to several random adults. I distributed 95 question papers by using a
random sampling method. Below is questionnaire sample. I decided to write it in Indonesian
language to allow 100% respondents to understand. My concern is that if it is in English, not all of
the population understands fluently.
Graph 1.4 – IRP Questionnaire Sample
TABLE 1
TABLE 2
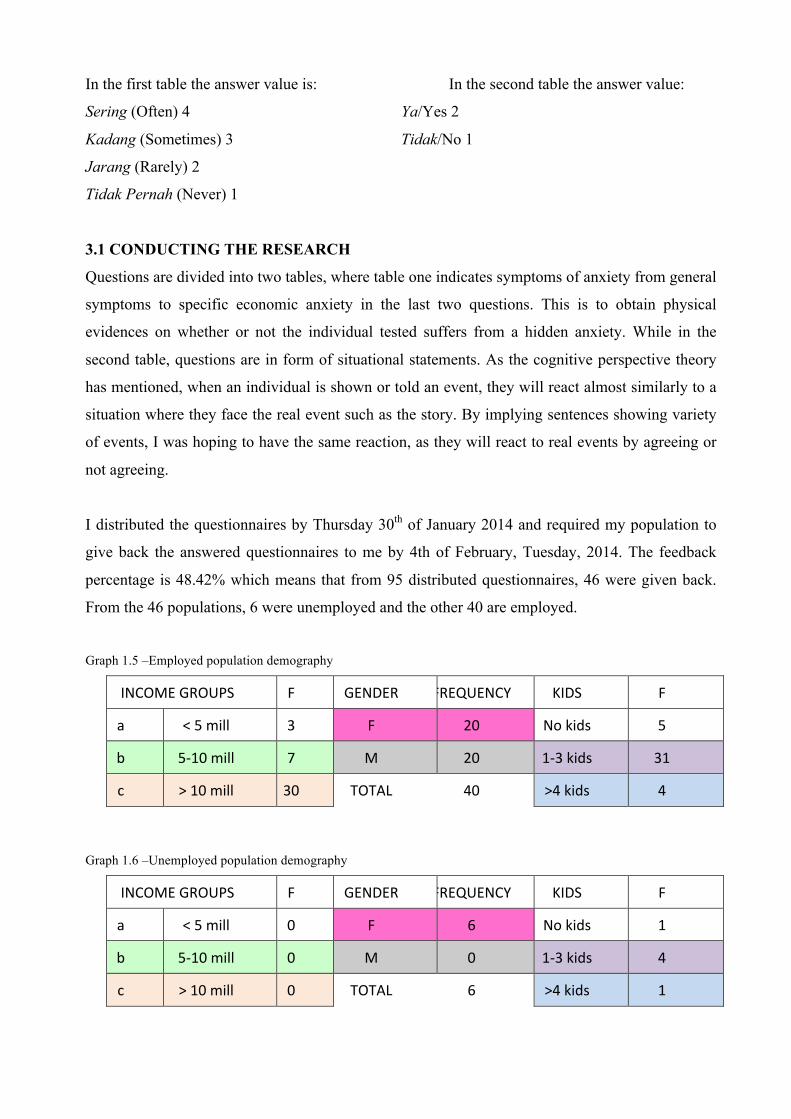
In the first table the answer value is: In the second table the answer value:
Sering (Often) 4 Ya/Yes 2
Kadang (Sometimes) 3 Tidak/No 1
Jarang (Rarely) 2
Tidak Pernah (Never) 1
3.1 CONDUCTING THE RESEARCH
Questions are divided into two tables, where table one indicates symptoms of anxiety from general
symptoms to specific economic anxiety in the last two questions. This is to obtain physical
evidences on whether or not the individual tested suffers from a hidden anxiety. While in the
second table, questions are in form of situational statements. As the cognitive perspective theory
has mentioned, when an individual is shown or told an event, they will react almost similarly to a
situation where they face the real event such as the story. By implying sentences showing variety
of events, I was hoping to have the same reaction, as they will react to real events by agreeing or
not agreeing.
I distributed the questionnaires by Thursday 30th of January 2014 and required my population to
give back the answered questionnaires to me by 4th of February, Tuesday, 2014. The feedback
percentage is 48.42% which means that from 95 distributed questionnaires, 46 were given back.
From the 46 populations, 6 were unemployed and the other 40 are employed.
Graph 1.5 –Employed population demography
INCOME GROUPS F GENDER FREQUENCY KIDS F
a < 5 mill 3 F 20 No kids 5
b 5-‐10 mill 7 M 20 1-‐3 kids 31
c > 10 mill 30 TOTAL 40 >4 kids 4
Graph 1.6 –Unemployed population demography
INCOME GROUPS F GENDER FREQUENCY KIDS F
a < 5 mill 0 F 6 No kids 1
b 5-‐10 mill 0 M 0 1-‐3 kids 4
c > 10 mill 0 TOTAL 6 >4 kids 1
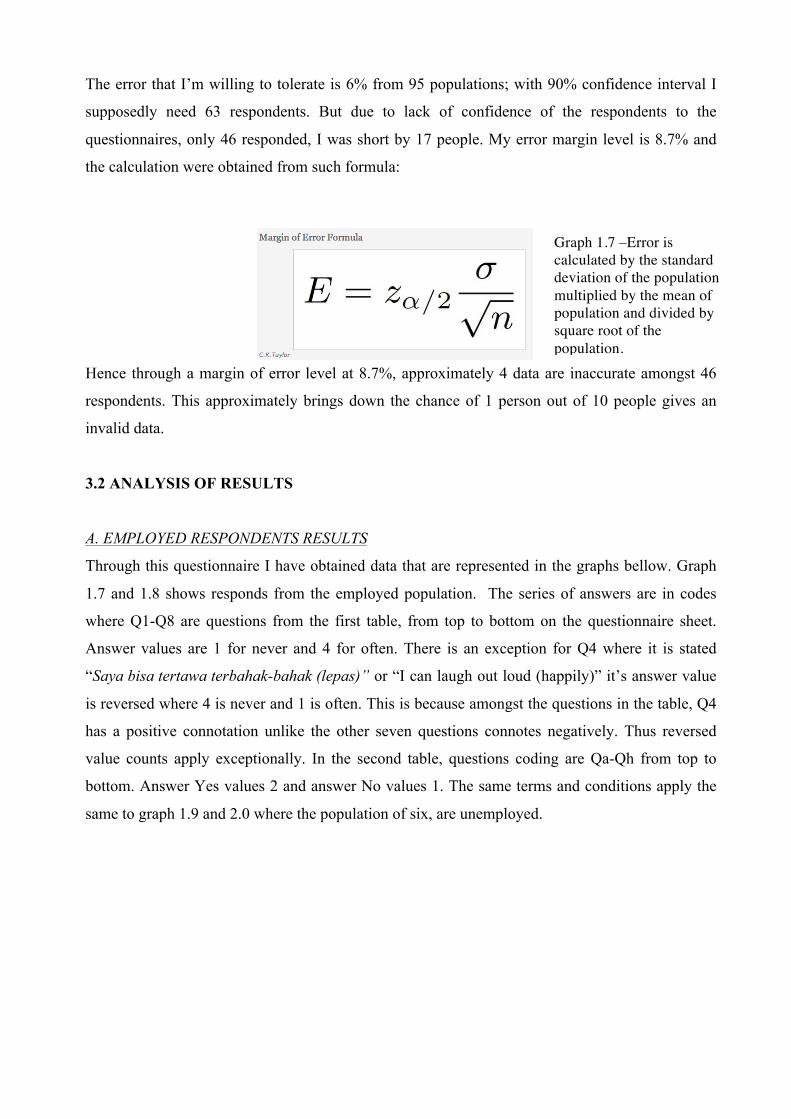
The error that I’m willing to tolerate is 6% from 95 populations; with 90% confidence interval I
supposedly need 63 respondents. But due to lack of confidence of the respondents to the
questionnaires, only 46 responded, I was short by 17 people. My error margin level is 8.7% and
the calculation were obtained from such formula:
Hence through a margin of error level at 8.7%, approximately 4 data are inaccurate amongst 46
respondents. This approximately brings down the chance of 1 person out of 10 people gives an
invalid data.
3.2 ANALYSIS OF RESULTS
A. EMPLOYED RESPONDENTS RESULTS
Through this questionnaire I have obtained data that are represented in the graphs bellow. Graph
1.7 and 1.8 shows responds from the employed population. The series of answers are in codes
where Q1-Q8 are questions from the first table, from top to bottom on the questionnaire sheet.
Answer values are 1 for never and 4 for often. There is an exception for Q4 where it is stated
“Saya bisa tertawa terbahak-bahak (lepas)” or “I can laugh out loud (happily)” it’s answer value
is reversed where 4 is never and 1 is often. This is because amongst the questions in the table, Q4
has a positive connotation unlike the other seven questions connotes negatively. Thus reversed
value counts apply exceptionally. In the second table, questions coding are Qa-Qh from top to
bottom. Answer Yes values 2 and answer No values 1. The same terms and conditions apply the
same to graph 1.9 and 2.0 where the population of six, are unemployed.
Graph 1.7 –Error is calculated by the standard deviation of the population multiplied by the mean of population and divided by square root of the population.
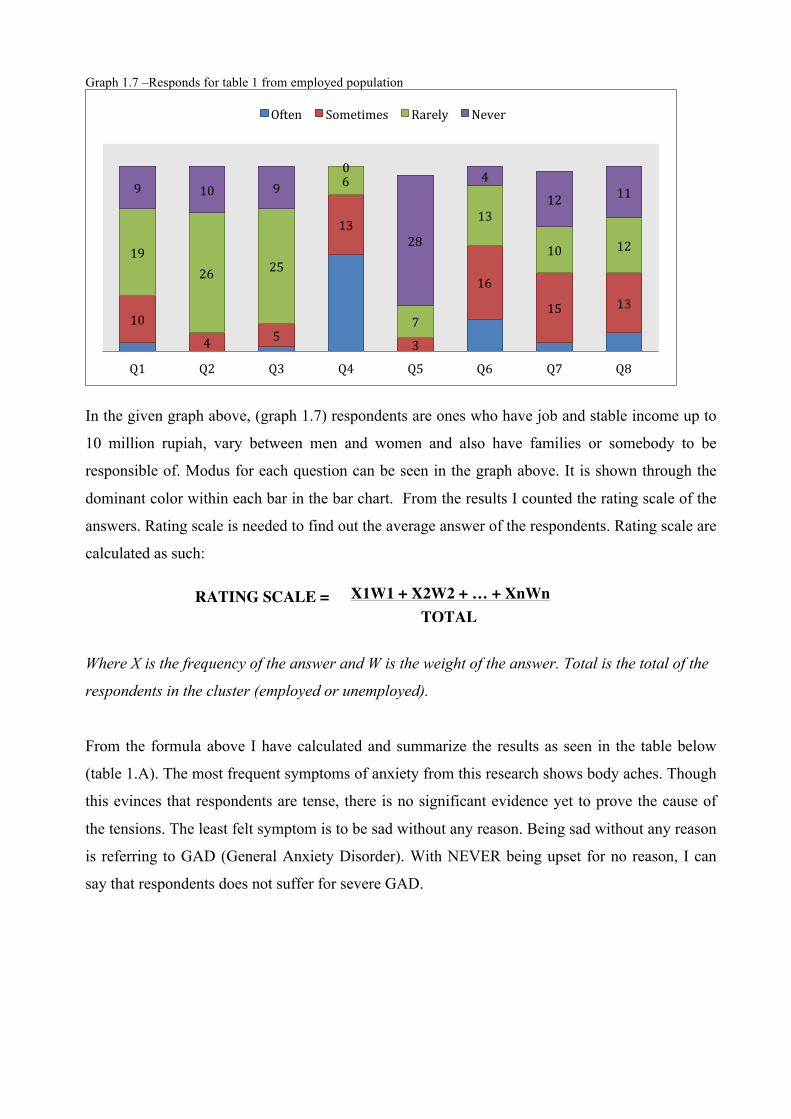
Graph 1.7 –Responds for table 1 from employed population
In the given graph above, (graph 1.7) respondents are ones who have job and stable income up to
10 million rupiah, vary between men and women and also have families or somebody to be
responsible of. Modus for each question can be seen in the graph above. It is shown through the
dominant color within each bar in the bar chart. From the results I counted the rating scale of the
answers. Rating scale is needed to find out the average answer of the respondents. Rating scale are
calculated as such:
Where X is the frequency of the answer and W is the weight of the answer. Total is the total of the
respondents in the cluster (employed or unemployed).
From the formula above I have calculated and summarize the results as seen in the table below
(table 1.A). The most frequent symptoms of anxiety from this research shows body aches. Though
this evinces that respondents are tense, there is no significant evidence yet to prove the cause of
the tensions. The least felt symptom is to be sad without any reason. Being sad without any reason
is referring to GAD (General Anxiety Disorder). With NEVER being upset for no reason, I can
say that respondents does not suffer for severe GAD.
10
4 5
13
3
16
15 13
19 26 25
6
7
13
10 12
9 10 9 0
28
4
12 11
Q1 Q2 Q3 Q4 Q5 Q6 Q7 Q8
Often Sometimes Rarely Never
RATING SCALE = X1W1 + X2W2 + … + XnWn TOTAL
Questions From Table 1 Q RESULT RATE
Hard to sleep / Sulit tidur 1 Rarely 2.1/4
Bad dreams / mimpi buruk 2 Rarely 1.9/4
Uncomfortable sleep / tidak tenang tidurnya 3 Rarely 2.0/4
Can laugh out loud / Bisa tertawa lepas 4 Rarely 1.6/4
Upset for no reason/sedih tanpa alasan 5 Never 1.3/4
Body ache/ badan linu dan pegal 6 Sometimes 2.7/4
Money stresses me/ uang membuat saya stress 7 Rarely 2.2/4
Worry about finance/ khawatir akan finansial 8 Rarely 2.3/4 Table 1.A –Results of rating scale from table one, employed population
B. UNEMPLOYED RESPONDENTS RESULTS
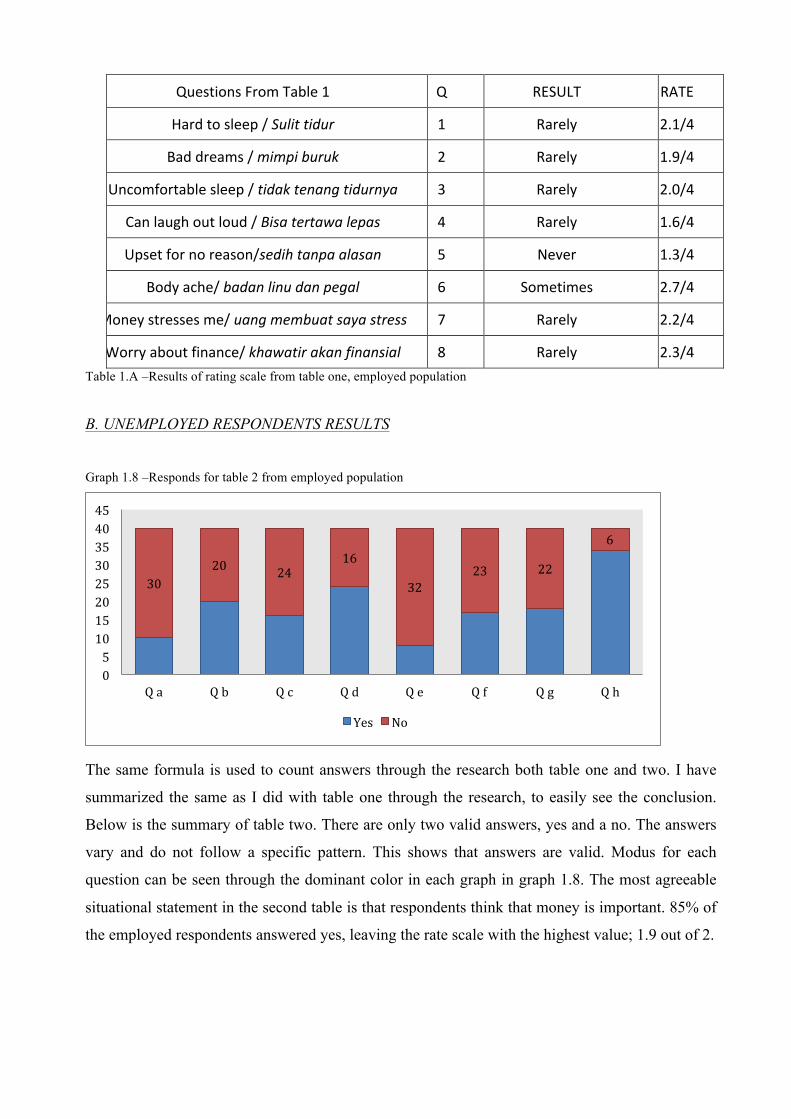
Graph 1.8 –Responds for table 2 from employed population
The same formula is used to count answers through the research both table one and two. I have
summarized the same as I did with table one through the research, to easily see the conclusion.
Below is the summary of table two. There are only two valid answers, yes and a no. The answers
vary and do not follow a specific pattern. This shows that answers are valid. Modus for each
question can be seen through the dominant color in each graph in graph 1.8. The most agreeable
situational statement in the second table is that respondents think that money is important. 85% of
the employed respondents answered yes, leaving the rate scale with the highest value; 1.9 out of 2.
30 20 24
16
32 23 22
6
0 5 10 15 20 25 30 35 40 45
Q a Q b Q c Q d Q e Q f Q g Q h
Yes No
Questions Q Result Rate
Worries or fear easily/ Mudah takut/khawatir a No 1.3/2
Is happy with more money/ Bahagia banyak uang b Yes 1.5/2
Afraid to lose job/ Takut kehilangan pekerjaan c No 1.4/2
Afraid to have no money/ Takut tidak punya uang d Yes 1.6/2 Economic situations tenses me/ Situasi ekonomi membuat tegang e No 1.2/2
Fear of bankruptcy/ Takut bankrut f Yes 1.4/2 Fear of monetary crisis in 98/
Takut krisis 98 terulang g Yes 1.5/2
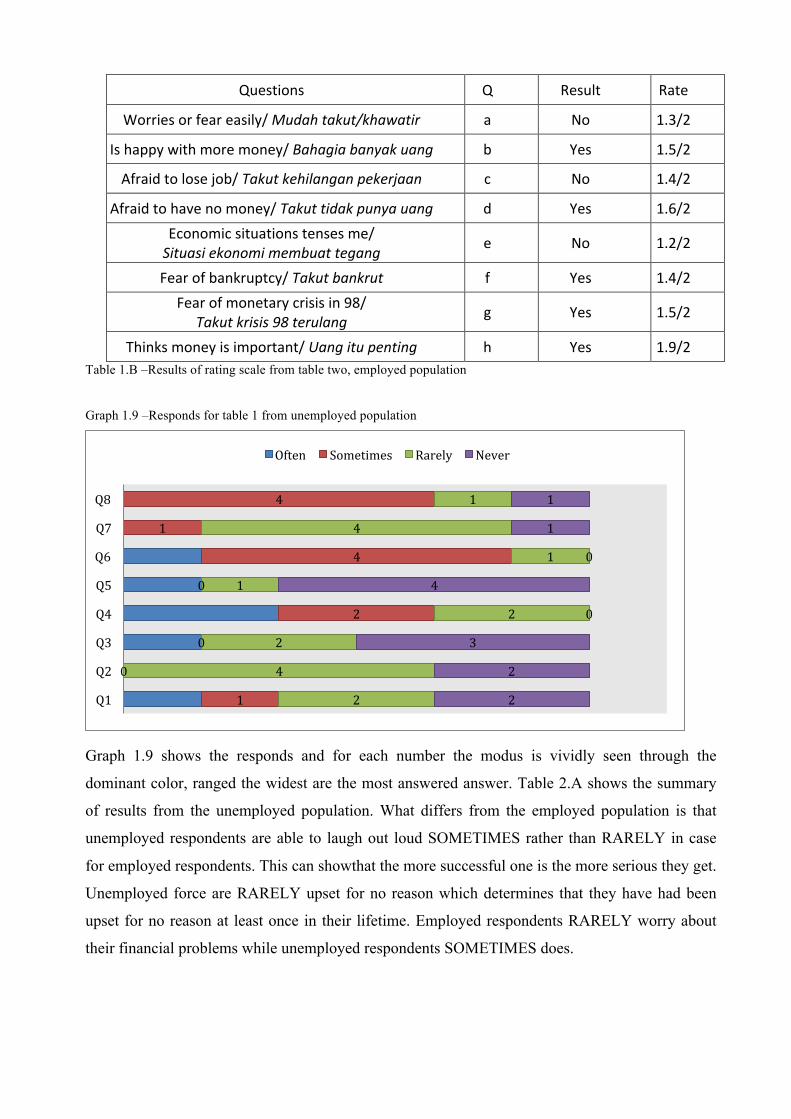
Thinks money is important/ Uang itu penting h Yes 1.9/2 Table 1.B –Results of rating scale from table two, employed population
Graph 1.9 –Responds for table 1 from unemployed population
Graph 1.9 shows the responds and for each number the modus is vividly seen through the
dominant color, ranged the widest are the most answered answer. Table 2.A shows the summary
of results from the unemployed population. What differs from the employed population is that
unemployed respondents are able to laugh out loud SOMETIMES rather than RARELY in case
for employed respondents. This can showthat the more successful one is the more serious they get.
Unemployed force are RARELY upset for no reason which determines that they have had been
upset for no reason at least once in their lifetime. Employed respondents RARELY worry about
their financial problems while unemployed respondents SOMETIMES does.
1
0
0
2
0
4
1
4
2
4
2
2
1
1
4
1
2
2
3
0
4
0
1
1
Q1
Q2
Q3
Q4
Q5
Q6
Q7
Q8
Often Sometimes Rarely Never
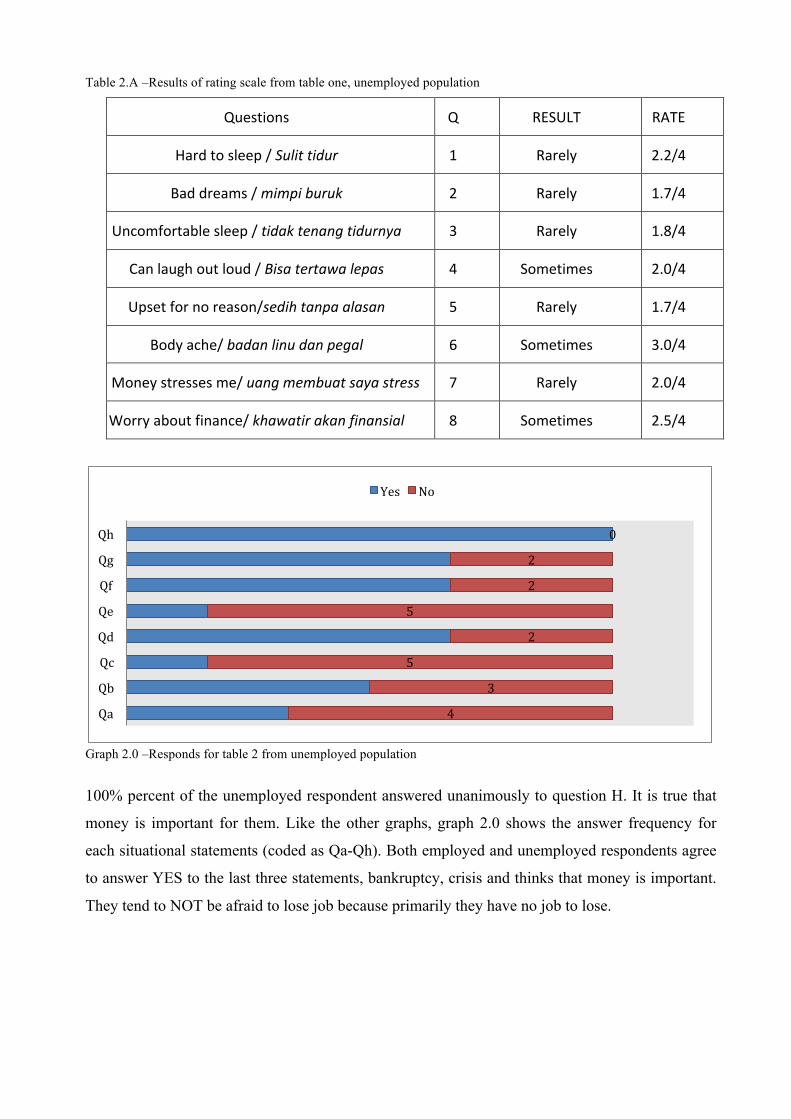
Table 2.A –Results of rating scale from table one, unemployed population
Questions Q RESULT RATE
Hard to sleep / Sulit tidur 1 Rarely 2.2/4
Bad dreams / mimpi buruk 2 Rarely 1.7/4
Uncomfortable sleep / tidak tenang tidurnya 3 Rarely 1.8/4
Can laugh out loud / Bisa tertawa lepas 4 Sometimes 2.0/4
Upset for no reason/sedih tanpa alasan 5 Rarely 1.7/4
Body ache/ badan linu dan pegal 6 Sometimes 3.0/4
Money stresses me/ uang membuat saya stress 7 Rarely 2.0/4
Worry about finance/ khawatir akan finansial 8 Sometimes 2.5/4
Graph 2.0 –Responds for table 2 from unemployed population
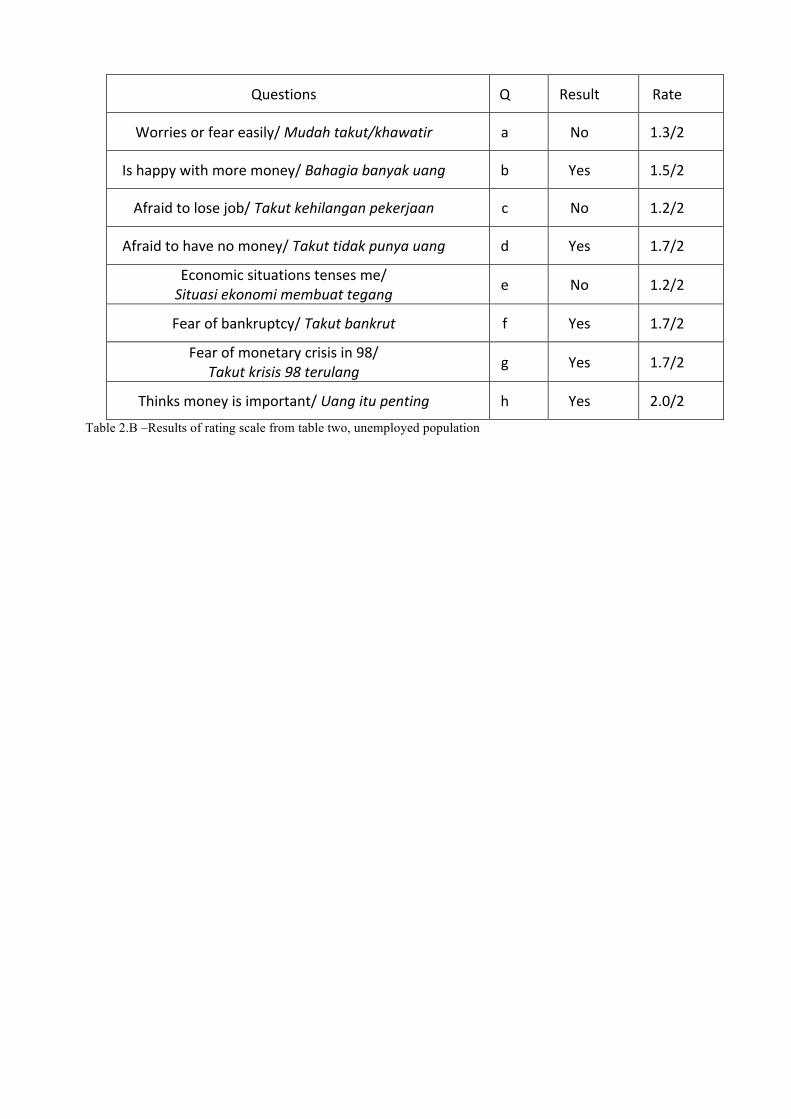
100% percent of the unemployed respondent answered unanimously to question H. It is true that
money is important for them. Like the other graphs, graph 2.0 shows the answer frequency for
each situational statements (coded as Qa-Qh). Both employed and unemployed respondents agree
to answer YES to the last three statements, bankruptcy, crisis and thinks that money is important.
They tend to NOT be afraid to lose job because primarily they have no job to lose.
4
3
5
2
5
2
2
0
Qa
Qb
Qc
Qd
Qe
Qf
Qg
Qh
Yes No
Questions Q Result Rate
Worries or fear easily/ Mudah takut/khawatir a No 1.3/2
Is happy with more money/ Bahagia banyak uang b Yes 1.5/2
Afraid to lose job/ Takut kehilangan pekerjaan c No 1.2/2
Afraid to have no money/ Takut tidak punya uang d Yes 1.7/2
Economic situations tenses me/ Situasi ekonomi membuat tegang e No 1.2/2
Fear of bankruptcy/ Takut bankrut f Yes 1.7/2
Fear of monetary crisis in 98/ Takut krisis 98 terulang g Yes 1.7/2
Thinks money is important/ Uang itu penting h Yes 2.0/2
Table 2.B –Results of rating scale from table two, unemployed population
4. CONCLUSION Through the research that I have conducted through December 2013 to February 2014, I have
come to a conclusion and an answer to my research question. The business cycle does affect the
anxiety level of an individual, though to a varied extent. This depends on each individual’s ability
to cope with situations. Each and every human in this world remains unique and are one of a kind,
born and raised through different experiences, thus the aptitude to adjust are different. The same
thing amongst the individuals from my respondents is that both groups; unemployed and
employed, thinks that money is important. 87% percent from the respondents decides to agree on
the statement.
The main concern from this research is regarding money. How individuals obtain money is by
having a job. These jobs are very much likely to rely on the stability of an economic situation.
Thus, as mentioned in the theory above when recessions occur, many jobs are no longer secure.
Financial instability does trigger the thought of fear that mostly develops into anxiety through
prolonging worries. I find my hypothesis to be proven from the answers that I obtained.
Especially, respondents’ answers in range of rarely to sometimes when are asked to agree on
worrying about finance.
Financial instability, due to whatever the cause is, will most likely to affect on a person’s mental
health. I have learnt that money is one of many factors in life that affects an individual’s mental
state. Though I must say, because emotions cannot be determined by a math formula, the specific
extent of money affecting one’s state of mind is not determined homogenously.
RESOURCES 1. Independent & dependent variables. (n.d.). Retrieved from
http://www.uncp.edu/home/collierw/ivdv.htm
2. Stimpson, P., & Farquharson, A. (2002). Business studies. (2nd ed., p. 113). Cambridge, United
Kingdom: Cambridge University press.
3. Business Cycle Theory. (n.d). Retrieved from http://en.wikipedia.org/wiki/Business_cycle#Theory
4. Binder, E. (1999). Fear and anxiety. Retrieved from