102
Succeeding Together Maximising the potential for joint opportunities between Australia and Indonesia November 2015

SucceedingTogetherMaximising the potential for jointopportunities between Australiaand Indonesia
November 2015

Succeeding Together i
Acknowledgements
The Australia-Indonesia Centre, ANZ and PwC would like to acknowledge the contributions of the
following individuals: Dr Titik Anas (Managing Director and Founder, Rumah Riset Presisi Indonesia); Mr
James Castle (Founder, Castle Asia); Dr Harry Darsono (Founder, Harry Darsono Couture); Dr Dino Patti Djalal
(Founder, Foreign Policy Community of Indonesia); Mr Ir Bernardus Djonoputro (Chairman, Indonesian Planners
Association (IAP)); Mr Kevin Evans (Indonesia Director, Australia-Indonesia Centre); Mr Kym Hewett (Minister,
Senior Trade Commissioner, Australian Embassy, Jakarta); H.E. Mr Nadjib Riphat Kesoema (Indonesian
Ambassador to Australia); Mr Adhi S. Lukman (Chairman, All Indonesian Food and Beverage Business
Association (GAPPMI)); Mr Dennis King (Secretary of the Australian Hides Skins and Leather Exporters
Association and the Executive Officer of the Australian Renderers Association); Dr B. Raksaka Mahi (Lecturer
and Researcher, Faculty of Economics, University of Indonesia); H.E. Mr Simon Merrifield (Australian
Ambassador to ASEAN); Ms Dina Midiani (Indonesian Fashion Designers Association (APPMI)); Dr Dionisius
Narjoko (Founder, Rumah Riset Presisi Indonesia); Dr Raoul Oberman (Director Emeritus, McKinsey & Co); Dr
Mari Pangestu (Former Minister of Tourism and Creative Economy and one time Minister of Trade, Government
of Indonesia); Mr John Paterson (Senior Adviser, Taskforce for New and Renewable Energy, Ministry of Energy
and Mineral Resources); Adjunct Professor Richard Price (Research Director, Australia-Indonesia Centre); Mr
Paul Ramadge (Director, Australia-Indonesia Centre); Ms Katrina Reid (Research Assistant, Australia-Indonesia
Centre); Professor George Rivers (Associate Dean for Research Collaboration, Monash University); The Hon.
Andrew Robb AO, MP (Australian Minister for Trade and Investment); Ms Felia Salim (Former Deputy President
Director, Bank Negara Indonesia); Mr Andre Omer Siregar (Indonesian Consul in Darwin); Mr Mahendra Siregar
(Former Chair of the Investment Coordination Agency and Former Deputy Minister of Finance, Government of
Indonesia); Mr Ade Sudrajat (Chairman, Indonesian Textiles Association (API)); Dr Nasir Tamara (Director, PT
Sri Rejeki Isman Tbk (Sritex)); Representative from Toll Global Logistics; Dr Julio Tradenta (Monash University);
Mr Nick Trim (General Manager Operations, Eastern Pearl Flour Mills, Makassar); Ms Astrida Upitis (Counsellor
(Education & Science), Australian Embassy, Jakarta); Mr Darrin Vouch (Senior Manager of Trade Engagement –
South East Asia at the State Government of Victoria); and Mr Irwan S. Widjaja (Head of Small and Medium
Business Component, All Indonesian Food and Beverage Business Association (GAPPMI)).
ANZ would also like to thank: Warren Hogan (ANZ Chief Economist, Sydney); Glenn Maguire (ANZ South
Asia, ASEAN and Pacific Chief Economist, Singapore); Leonie Lethbridge (Regional Chief Operating Officer
ANZ, Shanghai); Joseph Abraham (CEO ANZ Indonesia, Jakarta); Justin Fabo (ANZ Australia Senior Economist,
Sydney); Daniel Wilson (ANZ Americas, New York); Weiwen Ng (ANZ ASEAN Economist, Singapore); and Eugin
Lee (ASEAN Analyst, Singapore).
PwC would also like to thank: Mr Jeremy Thorpe (Partner, Economics & Policy, PwC Sydney); Mr Andrew
Parker (Partner, Asia Practice Leader, PwC Sydney); Mr Eshan Motwani (Senior Associate, Economics & Policy,
PwC Sydney); and Mr Rhett Wilcox (Senior Associate, Economics & Policy, PwC Sydney).
This report has been prepared by ANZ Research (ANZ) and PricewaterhouseCoopers (PwC) in their capacity as advisers to theAustralia-Indonesia Centre. The information, statements, statistics and commentary contained in this report have beenprepared by ANZ and PwC from publicly available material and from discussions held with various stakeholders affiliated withthe Australia-Indonesia Centre. This report is based on information received or obtained, on the basis that such information isaccurate. The information contained in this report has not been independently verified.

Succeeding Together ii
Foreword
The Hon. Andrew Robb AO, MP – Australian Minister for Trade and Investment
Australia is committed to building a closer and
sustainable trade and investment relationship with
Indonesia.
Our future prosperity will be built on successful and
enduring commercial partnerships.
We need to focus on our industry strengths, where
working better together will make us more
competitive.
There is scope for renewed cooperation in sectors
such as infrastructure, resources and energy,
tourism, education and skills training, food-
processing, textiles/fashion, animal products and
logistics among others.
Working together will provide opportunities to gain
greater access to value chains for our goods and
services, particularly in the ASEAN region.
This report produced by the Australia-Indonesia
Centre, ANZ and PwC examines ways to do this by
utilising our shared comparative advantages.
The report highlights sectors in which industry and
government can work together.
The approach complements the Australian
Government’s commitment to building closer trade
and investment ties through trade agreements with
China, Japan and Korea, and other broader trade
initiatives including the ASEAN-Australia-New
Zealand Free Trade Agreement, the continuing
Regional Comprehensive Economic Partnership and
the Trans Pacific Partnership.
In time, the Indonesia-Australia Comprehensive
Economic Partnership Agreement will play an
important role in encouraging investment and aiding
our competitive entry to global supply chains.
I congratulate the Australia-Indonesia Centre on
taking the initiative to highlight our mutual strengths
and ANZ and PwC for their contribution.
The report is a valuable addition to Indonesia
Australia Business Week, which aims to build long-
term business relationships. I am sure it will
stimulate much discussion.
The Hon. Andrew Robb AO, MP
Minister for Trade and Investment
Commonwealth of Australia

Succeeding Together iii
Why competitive advantage now?
The ‘new normal’ after the global financial crisis
includes a few important structural and fundamental
changes that face both Australia and Indonesia.
These changes imply that both Australia and
Indonesia need to find new sources of competitive
advantage, as well as leverage the relationship to
increase bilateral trade and investment flows. Four
key changes are noteworthy.
First, global economic growth is expected to be on a
slow growth trajectory for the next five years due to
a slowdown in productivity growth as well as the
shifting demographics in advanced countries. The
slowdown in China is expected to result in lower
GDP growth of 6 to 7 per cent compared to pre-
crisis of 8 to 9 per cent. Chinese demand for goods
and services from other countries is also likely to
slow, which is the new reality facing primary
commodity exporters such as Indonesia and
Australia.
Second, global trade has not only slowed because
of economic conditions, but studies have shown that
the growth of trade has, in fact, halved since the
global crisis.1
In the 1990s, 1 per cent global
economic growth led to 2.2 per cent growth in trade,
but in the 2000s 1 per cent economic growth led to
1.3 per cent growth in trade. The main causes for
this structural change are related to the maturation
of global value chains (GVCs), especially in China,
whereby more parts and components are produced
domestically rather than sourced from other
countries.
Furthermore, the trade slowdown is not as a result
of increased protectionism but because the benefits
of liberalisation from early reforms have already
been achieved. Starting in the mid-1980s to early
2000, there was a lot of liberalisation and reform
achieved due to unilateral actions, including World
Trade Organisation (WTO) processes and regional
1 C. Constantinescu, A. Mattoo and M. Ruta. (2015), WorldBank Policy Research Working Paper No. 7158
agreements such as the ASEAN Economic
Community. Average tariffs have come down from
30 per cent to less than 15 per cent in developing
countries and from 10 per cent to 5 per cent in
developed countries. Most intra-ASEAN trade and
trade under the ASEAN-Australia-New Zealand Free
Trade Area does not carry a tariff. The easy part of
reforms, like tariff reductions, is complete and there
is a need to address other more difficult reforms.
Third, there are fundamental changes in the Asian
region. China will navigate to its new normal through
structural reforms that will result in labour-intensive
production being replaced by services and
innovation, which in turn will change the nature of
GVCs and the role of China as a hub. Other
fundamental changes are related to the ageing of
the population in Northeast Asia. In contrast, most of
Southeast Asia is expected to enjoy a demographic
bonus through to 2025/2030, and also continue to
experience a growing middle class with increasing
purchasing power.
Fourth, GVCs have become even more fragmented.
As GVCs mature, the slowdown in growth is greater
for manufactured products that are produced in
vertically specialised industries. Technology and
innovation, especially information communications
technology, has also led to greater fragmentation,
which involves not just goods but services. The
fragmentation of GVCs offers opportunities for
countries – individually or jointly – to identify parts or
tasks within the value chain for which they have a
competitive advantage. GVCs offer new
opportunities for developing countries and small-and
medium-sized enterprises to leapfrog to higher-
value-added parts of the GVC. The agenda for the
2015 Group of Twenty (G20) major economies
meeting identified that small-and medium-sized
enterprises can be an integral part of the export
value chain with lesser developed countries, which
bring lower value added manufacturing and services
because of lower entry costs and less capital
intensity. Middle and higher income countries

operate in higher value added activities with higher
skills and specialisations.
These fundamental trends imply that countries like
Indonesia and Australia will have to diversify away
from their traditional strengths like resources to find
new sources of competitive advantage. Each
country could do this on their own, or together.
Given complementarities and proximity between
Indonesia and Australia, serious consideration
should be given to the possibilities for joint
development of competitive advantage to face the
challenges ahead as well as to take advantage of
the opportunities opening up. This is, of course, the
subject of this study and thus its recommendations
could not come at a more timely moment.
Mari Pangestu
Former Minister of Tourism and Creative Economy
(2011-2014)
and Former Minister of Trade (2004-2011)
Republic of Indonesia

Succeeding Together v
Glossary
AANZFTA ASEAN-Australia-New Zealand Free Trade Area
ABS Australian Bureau of Statistics
AEC ASEAN Economic Community
ANZCERTA Australia-New Zealand Closer Economic Relations Trade Agreement
ASEAN Association of Southeast Asian Nations
AUD Australian Dollar
Bn billion
CAGR compound annual growth rate
DFAT Australian Department of Foreign Affairs and Trade
FDI foreign direct investment
FTA free trade area
G20 Group of Twenty
GDP gross domestic product
GLI Grubel-Lloyd index
GSP General System of Preference
HS Harmonised System
IA-CEPA Indonesia-Australia Comprehensive Economic Agreement
IMF International Monetary Fund
IIT index intra-industry trade
LNG liquefied natural gas
LoI Letter of Intent
LPG liquefied petroleum gas
MER market exchange rate
NIL Negative Investment List
OBM original brand manufacturing
ODM original design manufacturing
PTA preferential trade agreement
R&D research and development
RCA revealed comparative advantage
RIRDC Australian Rural Industries Research and Development Corporation
SMEs small and medium enterprises
STM goods simply transformed manufactured goods
TPP Trans Pacific Partnership
trn trillion
USD United States Dollar
VAT value added tax
VET vocational education and training
WTO World Trade Organisation
Y/Y year-on-year
Contents
01 02 03 04Executive summary The Australia-Indonesia
realities
The importance ofcomparative advantages
Steps to progress therelationship
A B C DCase studies Additional research and
evidence that underpinsthe analysis
References Figures and tables

01Executive summary

Succeeding Together 2
The shared opportunity: combining,creating and selling
With a three-trillion-dollar opportunity opening up in
South East Asia, the timing could not be better for
Indonesia and Australia to work together in new
ways to increase trade and investment.
The growth in trade within the Association of
Southeast Asian Nations (ASEAN) economy and
from ASEAN members to their major trading
partners provides opportunities on multiple fronts
related to trade and investment. In the first instance
at least a trillion dollar opportunity can be identified
in foreign direct investment (FDI); a vital enabler to
accessing the very strong growth in intra-and extra
ASEAN trade. There is the potential for as much as
USD3 trillion (trn) in trade growth over the next
decade.
Indonesia and Australia can enhance shared
benefits by rethinking some of the fundamentals
underpinning the existing commercial relationship.
Importantly, the shared benefits can be achieved
by combining emerging complementary comparative
advantages to create competitive advantages (see
Box 1). Together, the aim of these joint competitive
advantages will be to capture the growing
opportunities presented by shifts in global
supply chains.
For Indonesia, these shifts could potentially
stimulate a second manufacturing revolution akin to
that experienced in the late 1980s when the newly
industrialised economies of north Asia moved their
manufacturing capacity south.
For Australia, the shifts present opportunities for
adding value to physical, biological, intellectual and
service-rich resources.
In short, these shifts are highly favourable to those
strategic partnerships that show characteristics
beyond traditional modes of two-way bilateral trade.
The mode advocated here is that of combining
comparative advantages, creating competitive
advantages, and selling into third markets.
Box 1: Comparative and joint competitiveadvantages
Comparative advantage occurs when aneconomy can produce goods more efficiently (orat a lower opportunity cost) than its competitors.Australia and Indonesia have historically had acomparative advantage in producing animal,vegetable and food products as well as mineralsand fuels. Australia’s strongest comparativeadvantage is in minerals (iron ore) followed byanimal products (beef and mutton); whileIndonesia’s strongest comparative advantage is infootwear followed by vegetable products (palm oil)and coal.
Joint competitive advantage emerges whencomparative advantages can be combined inways that enable the partnership to work togetherto compete and win market share overcompetitors. Implicit in this is finding or creatingsynergies in the process of combining theadvantages so that competitiveness is enhanced.
Competitive and comparative advantage canchange over time. For example, as somecountries have transformed their economies fromlow to middle to high income levels, they haveconceded some advantages such as low labourcosts while gaining others such as sophisticatedknowledge and technology. Because this is aforward looking report, it deals with the importantdistinction between static and dynamiccomparative advantage.
The shared imperative: Act now
An immediate call to action is needed for three
reasons:
1. Global supply chains are a fundamental
dynamic of international trade and neither
country can afford to operate exclusively
outside of these.
2. Asia is the dominant global economic hub, the
axis of which is moving south east towards the
immediate region. Opportunities surround
Indonesia and Australia now, but these will be
captured by other countries if there is no action.
3. While both countries seek to consolidate and
strengthen domestic economic security to
varying degrees, both are also acutely aware of
the opportunities presented by an emerging
generation of entrepreneurs keen to capture
global returns.

Succeeding Together 3
The shared platform: The Asianconvergence
The size of the Australian and Indonesian
economies – 12th and 16th largest respectively –
suggests that their trade flows should be strong.
Fortunately some pre-conditions for this are
converging. Together both economies are situated
in the centre of the world’s largest and fastest-
growing trade hub, reflected in and driven by rising
demand for a wide range of products and services in
northern Asia (see Figure 1).
Figure 1: The shared platform – The Asian convergence
Source: Oliver Wyman. 2012, ‘The Future of Asian Banking: Volume 2’
At the same time, the world is moving into a second
phase of the Asian Century, with capital flows from
North Asia spreading quickly to the south. The
sense is that the economic centre of gravity within
Asia is shifting south and east, thereby creating a
‘Factory Asia’ in our immediate region.
The south-easterly drift is destined to benefit
Indonesia’s younger, lower-cost and
demographically endowed labour force. Additionally,
the shift of capital flows is coinciding with an
urbanisation of Indonesia’s population. It can be
expected that this will result in a rise in aggregate
income and that a large consuming class will rapidly
emerge.
Conceivably Indonesia’s growing domestic market
could consume all that it can produce, resulting in a
declining capacity to export. While a larger
Indonesian middle class will present opportunities
for Indonesian and Australian small-medium-sized
businesses to engage in joint ventures, additional
benefits may arise by creating the efficiencies
Indonesia needs to reduce its reliance on imports
while increasing its capacity for export growth.
In summary, global supply chains are being
competitively transformed as nations jockey to gain
advantages by harnessing rapid shifts in technology,
systems and services. With these global and
regional issues in focus, this study puts the case
that Indonesia and Australia have much to gain by
Succeeding Together 4
responding quickly and that in doing so both
economies can ‘succeed together’.
This report
This report, a product of Indonesian and Australian
collaborators, provides an evidence-based
argument that the opportunities to capture a
significant part of a multi-trillion dollar market are
real and that capturing them through combining,
creating and selling are, in the words of ANZ CEO
Mike Smith, ‘attainable without having to do too
much to make them happen.’
Through this report, an invitation is extended to
policy makers, industry groups and individual
businesses to think innovatively about a trade and
investment relationship based on joint competitive
advantage, and to respond strategically to the
opportunities that exist.
The findings
The study shows that the scope for improving the
Australian and Indonesian commercial relationship
exists; it depends on the willingness of various
stakeholders in both countries to act to realise these
gains and make the most of these emerging joint
competitive advantages.
Indonesia’s comparative advantage has been
relatively static over the past decade as has
Australia’s. That dynamic is expected to change for
both economies, especially for Indonesia, given less
reliance on exports of natural resources in future
years. Box 2 outlines the projected advantages of
both Indonesia and Australia.
Indeed, an important finding is that for Australia and
Indonesia much of the comparative advantages are
not static; they are dynamic and evolving over time.
More broadly, and most importantly, the report finds
that the timeline with which comparative advantage
evolves is shortening.
In the ASEAN and Indonesian context, and by
including the Australian corridor, the formation of the
ASEAN Economic Community (AEC) as a key
multilateral development may prove to be an
enabler of dynamic comparative advantage changes
for both economies.
‘The regional impact of the economic
transformation currently unfolding in China
cannot be underestimated. New opportunities
for opening investment and trade and to
collaborate in penetrating regional and global
value chains in products and services are
unfolding very quickly. In spite of near-term
challenges, regional economies such as
Indonesia and Australia need to move fast
together to take effective advantage of this
trillion dollar bonanza.’
- Dr Raoul Oberman, Emeritus Director,McKinsey & Co
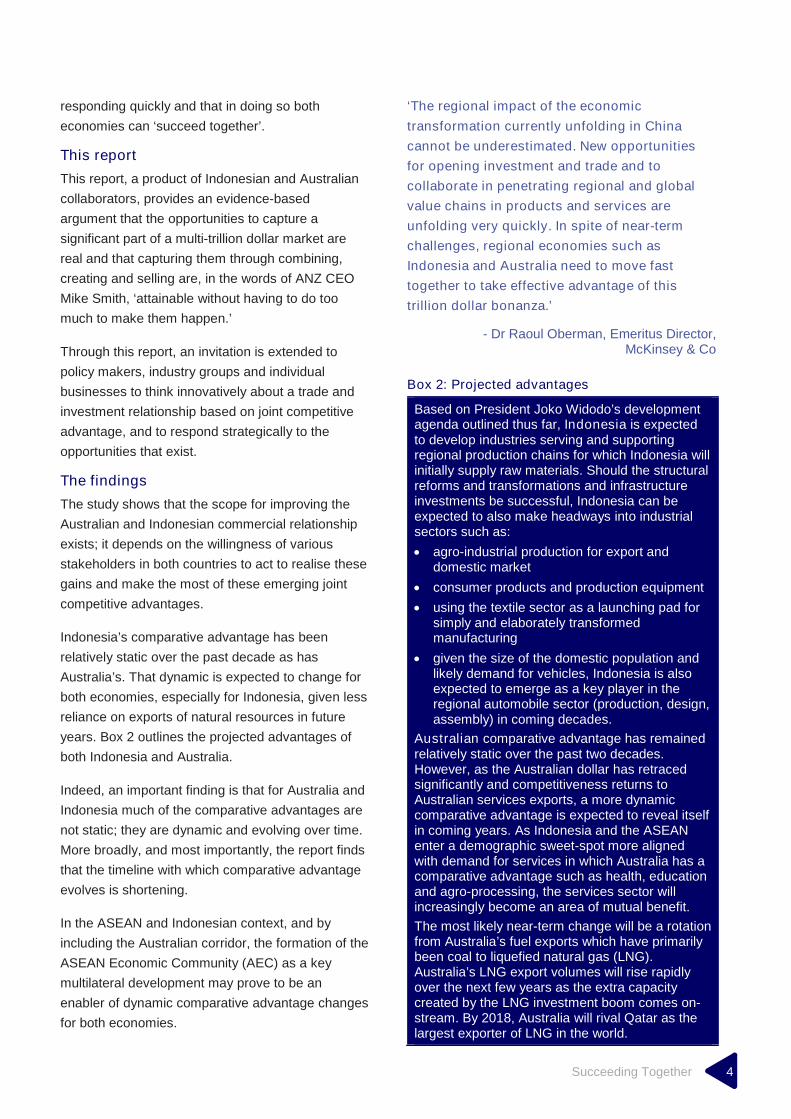
Box 2: Projected advantages
Based on President Joko Widodo’s developmentagenda outlined thus far, Indonesia is expectedto develop industries serving and supportingregional production chains for which Indonesia willinitially supply raw materials. Should the structuralreforms and transformations and infrastructureinvestments be successful, Indonesia can beexpected to also make headways into industrialsectors such as:
agro-industrial production for export anddomestic market
consumer products and production equipment
using the textile sector as a launching pad forsimply and elaborately transformedmanufacturing
given the size of the domestic population andlikely demand for vehicles, Indonesia is alsoexpected to emerge as a key player in theregional automobile sector (production, design,assembly) in coming decades.
Australian comparative advantage has remainedrelatively static over the past two decades.However, as the Australian dollar has retracedsignificantly and competitiveness returns toAustralian services exports, a more dynamiccomparative advantage is expected to reveal itselfin coming years. As Indonesia and the ASEANenter a demographic sweet-spot more alignedwith demand for services in which Australia has acomparative advantage such as health, educationand agro-processing, the services sector willincreasingly become an area of mutual benefit.
The most likely near-term change will be a rotationfrom Australia’s fuel exports which have primarilybeen coal to liquefied natural gas (LNG).Australia’s LNG export volumes will rise rapidlyover the next few years as the extra capacitycreated by the LNG investment boom comes on-stream. By 2018, Australia will rival Qatar as thelargest exporter of LNG in the world.
Succeeding Together 5
This study focuses on:
Two Indonesian sectors that have a comparative
advantage over Australia:
– Textiles/Fashion.
– Food-Processing.
Two Australian sectors that have a comparative
advantage over Indonesia, including:
– Logistics.
– Animal Products.
These four sectors were selected for this study for
several reasons:
The analysis found that Indonesia or Australia
has existing comparative advantages in these
sectors because of their long-term expertise or
experience in developing their respective
sectors.
Existing comparative advantages in these
sectors indicates that there is capacity for both
countries to achieve joint competitive
advantages.
Achieving joint competitive advantages in these
sectors will assist the Australian and Indonesian
economies to subsequently tap into larger
regional and global value chains.
Accompanying case studies provide lessons for the
innovation that will be required to build on or capture
other existing and emerging opportunities.
An important message received through interviews
with stakeholders is that the findings of the report
and its subsequent recommendations are pertinent
to a range of businesses. This study acknowledges
that in addition to the large established companies
of both countries, Australia’s small–medium-sized
businesses play a pivotal role in the Australian
economy and that the expansion of small-medium-
sized businesses in Indonesia will be critical to the
overall growth of its economy.
In fact, small and medium enterprises (SMEs) are
an integral part of both Indonesian and Australian
economies. In Indonesia they account for more than
95 per cent of total firms and are responsible for
more than 90 per cent of total employment, while in
Australia they account for approximately 96 per cent
of all businesses and 63 per cent of total
employment. With greater trade liberalisation it can
be expected that the importance of small- medium-
sized businesses in each economy will continue
to grow.
The innovation and entrepreneurialism required to
capture competitive advantage from combining
comparative advantages can, and will need to,
emerge from businesses at every level.
A similar level of thinking is also required to emerge
from our respective governments, industry bodies
and supporting academic institutions.
The recommendations
This report puts forward two sets of
recommendations:
Enabling recommendations. These steps and
themes – aimed at creating an environment
conducive to investment and partnerships – are
broad and may be applicable across a broader
range of industries.
Sector-specific recommendations. These are
considered to be necessary steps to advance
joint competitive advantages in the four sectors.
These recommendations have been developed after
research was aligned with interviews conducted in
both nations with government and business leaders.
The recommendations and prospective sectors
identified in this report are the result of a preliminary
analysis. Further research and work is
recommended to build on this analysis, particularly
towards identifying other sectors that are equally
worth focusing on to achieve joint competitive
advantages. Both economies will benefit from their
neighbour being healthy and vibrant, however
Australia and Indonesia need to be more ambitious
in how they think about their relationship and the
possibilities it brings for the future.

Succeeding Together 6
Enabling recommendations
1 Favour a new approach to trade and
investment
Both governments have recognised the importance
of accelerating cooperation in key sectors of
interest. The Indonesia Australia Partnership on
Food Security in the Red Meat and Cattle Sector is
a strong example of how the nations are working to
create stronger business partnerships that could
result in competitive advantages in third markets.
Deeper business ties will build trust in the
relationship and provide greater ballast in times of
differences. It is recommended that both
governments explore opportunities for applying
similar creative approaches in those sectors with the
greatest potential for shared competitive advantage.
New approaches to cooperation should include
policy-makers seeking the input of multiple
stakeholders from both economies who can inform
policy dialogue through their expertise. These
stakeholders can include businesses, industry or
peak body representatives that are familiar with the
commercial environment and academics who can
assist with research or provide support studies.
New approaches to cooperation should also
encourage meetings between officials from relevant
ministries/agencies from both economies on a more
frequent basis. The purpose of these meetings will
be to identify and pursue opportunities to better
align commercial potential into regional and global
value chains.

Succeeding Together 7
2 Create a better business and
investment environment
Investment is the key to developing and driving
competitive advantage, and investment is more
likely to flow in a supportive environment. Australia
can assist Indonesia with governance, policy
development, and legal and regulatory settings.
In both countries regulation is particularly costly for
businesses that operate in global markets. These
businesses rely on the efficiency of the domestic
regulatory and administrative setting to ensure that
their competitiveness is not harmed. Regulations
that are overly-prescriptive can lead to direct costs
(i.e. time and money to ensure that paperwork
complies with regulations) as well as indirect costs
(i.e. less time or budget to focus on innovation). The
costs of doing business should be minimised to
encourage business efficiency and to attract
investors to establish new operations. Both
Australian and Indonesian businesses can benefit
by a simpler regulatory environment in both
countries to ensure productivity and facilitate
opportunities for trade.
The ASEAN-Australia-New Zealand Free Trade
Area (AANZFTA) and the Indonesia Australia
Comprehensive Economic Partnership Agreement
(IA-CEPA) negotiations should be used to identify
specific regulations that restrict or inhibit the
potential for joint commercial collaboration so as to
accelerate mutually advantageous investment
conditions and opportunities.
For the Textiles/Fashion sector, both countriescan achieve joint competitive advantages througha simplification and acceleration of licensingprocedures; an opening up of the trade regime toallow for the freer flow of goods, services andworkers from the two countries; and via reforms intheir respective tax systems (i.e. expeditiousprocessing of refunds and allowances).
The Food-Processing sector can benefit from arelaxing of Indonesia’s Negative Investment List(NIL) that determines the openness of itsinvestment regime.
For the Logistics sector, the legislationenvironment in both countries should be madeconsistent to assist businesses when investing injoint ventures in either Indonesia or Australia.
The Animal Products sector could similarly benefitfrom a further streamlined registration process inboth countries to encourage small to mediumsized businesses to trade with their counterpartsby lowering delays and allowing them to realisetheir return on investment quicker.

Succeeding Together 8
3 Improve infrastructure
Transport infrastructure (i.e. railways, roads,
seaports, airports) and the services provided by the
logistics sector are crucial for moving goods and
services to and from exporting and importing
countries. Good infrastructure and efficient logistics
sectors can therefore support trade in both Australia
and Indonesia.
Improving infrastructure connectivity between
eastern Indonesia and northern Australia can
increase economic cooperation between the two
economies. Enhancements to these areas can
further reduce trading costs and permit greater
opportunities to reveal joint competitive advantages
to enter third markets together.
Australian capability in infrastructure development,
notably through Infrastructure Australia and the
Global Infrastructure Fund, should be leveraged by
Indonesia.
Infrastructure policies and plans also need to ensure
that the digital infrastructure is deployed to assist
Australian and Indonesian firms and consumers to
transition to a digital economy.
This step mainly involves efforts by both countriestowards two specific industries, as outlined in thecase studies included in this report.
The Logistics sector can benefit through possibleAustralian/Indonesian government or industryinvestment in ports infrastructure in both countriesto help tailor bilateral trade to specific exports (i.e.livestock exports require greater refrigerationfacilities at ports in both countries).
The Animal Products sector can similarly benefitfrom the establishment of key facilities in targetedlocations. For example, raw Australian wool canbe exported to Indonesia upon establishment ofan early stage wool processing facility inIndonesia. This would allow both economies tojointly approach third markets.
Succeeding Together 9
4 Build skills and capacity requirements
Australia has high wage costs, which is an
impediment to growth, while Indonesia has a large
pool of lower-cost and skilled workers, and a huge
demographic dividend. For Indonesia to cascade up
value chains and avoid the middle income trap, it
will need skills development.
An educated labour force does not necessarily
mean that graduates are entering the labour market
with the right skills. It is therefore important for
Australia and Indonesia to develop and re-align the
skillsets of its existing and future labour forces to
leverage the opportunities created by greater trade
facilitation between the two economies and third
markets. Appropriate skillsets are particularly
necessary for those entering the labour force who
may be involved with the production or provision of
goods/services in the near future that each economy
has a comparative advantage in.
Australian firms can transfer their knowledge and
expertise to their Indonesian counterparts in order to
achieve joint competitive advantages. Implicit in this
knowledge transfer is suitably targeting Indonesia’s
expanding capacity and growing labour force (i.e.
Indonesia’s total working age population is expected
to be close to 175 million by 2050). Efforts are
required by both economies to ensure that any
knowledge transfer is directed appropriately to
Indonesia’s generous demographic dividend.
Developing partnerships in the areas of vocational
education and training (VET) can assist in this
process. Partnerships can be developed directly
between industry and training centres or via
collaboration with training institutions of both
countries and their respective industries.
The challenge is urgent: Indonesia cannot cascade
up value chains and avoid the middle-income trap if
skills are not addressed; and Australia needs to
address its high wage base. Despite its higher wage
costs, Australia is ideally positioned to help. The IA-
CEPA Skilled Workforce Pilot recommended by the
Business Partnership Group – ‘to support increased
skills development in Indonesia and Australia by
facilitating easier movement of skilled people
between countries and increased capability
transfer’2
– should be accelerated and formalised.
Logistics: Australian SMEs should collaborate withIndonesian firms of a similar size to tap intoIndonesia's growing capital base. Additionally,Australian businesses that have expertise inroad/rail transportation can work with Indonesianfirms to train their employees in using advancedmanufacturing or processing equipment.
Animal Products: Indonesian wool producers canbenefit from Australian knowledge in woolspinning, weaving and product development.
Textiles/Fashion: Australian textile firms cancollaborate with Indonesian firms to assist inupgrading their technological capabilities formanufacturing.
Food-Processing: Indonesian SMEs in the sectorcan benefit from the lessons of their Australiancounterparts in using advanced technology forproduction of certain animal by-products.Similarly, Australian small processors couldleverage Indonesian techniques for energy-efficient production, such as methane-recycling intofu production.
2 Indonesia-Australia Business Partnership Group. (2012),Position Paper on Considerations Towards the Indonesia-Australia Comprehensive Economic Partnership Agreement,p54
Succeeding Together 10
5 Empower business
Maximising the competitive advantages of Australia
and Indonesia cannot be achieved through steps
that require government efforts alone.
Businesses in both economies should embrace
policy reforms where applicable and re-orient their
thinking to facilitate mutually advantageous trade
and investment opportunities. To support
businesses in this exercise the IA-CEPA Business
Partnership Group recommendations on facilitating
investment access should be progressed and
formalised.
This is especially important given that shifts in
relative comparative advantages between the two
economies indicate that Australian and Indonesian
firms are increasingly partners, not competitors, in
any regional trade. In this environment businesses
should be seeking to cooperate along the value
chain to identify cross-border value chains that allow
participants in their country to focus on their
comparative strengths within the value chain.3
3 Indonesia-Australia Business Partnership Group 2012,Position Paper on Considerations Towards the Indonesia-Australia Comprehensive Economic Partnership Agreement,p53
This step can be applied to all industriesconsidered in the case studies, albeit throughdifferent methods.
In the Textiles/Fashion sector, where Indonesiahas a comparative advantage, Australian andIndonesian designers can collaborate to createdesigns that suit Australian and wider Westernpreferences. The designers can furthercollaborate to determine customer preferences inAustralian and other economies to strengthenmarket access for new and jointly developedproducts.
The Food-Processing sectors of Australia andIndonesia can benefit through efforts led bybusinesses associations within both economies todevelop a robust economic case to encourage theIndonesian government to relax the next issuedNIL (updated every six months).
Businesses in the Logistics and Animal Productsindustries in Australia can benefit similarly throughcoordinated efforts with their Indonesiancounterparts.
Australian businesses in the Logistics sector, forexample, can function as the promoters andexecuters of projects with Indonesia to approachthird markets and further facilitate the introductionof products from third markets into Indonesia.
With regard to the Animal Products sector,research and development (R&D) projects couldbe jointly conducted in the area of livestockgenetics with the aim of boosting profitabilitythroughout cattle, sheep and goat value chains.Joint projects could be further conducted infeeding, finishing and nutrition R&D to increaseproductivity and profitability of producers in botheconomies.

Succeeding Together 11
Sector-specific recommendations
6 Develop competitive advantages in
Textiles/Fashion
Encourage Australian firms to invest in
Indonesia. The textile industry in Indonesia
needs large investments for its revitalisation. The
barrier for Australian investors is Indonesia’s
complicated business climate. Simplifying and
accelerating licensing procedures is an important
first step. Opening the trade regime will allow for
the freer flow of goods, services and workers
from the two countries. Reforms to the tax
system in both countries are required for
expeditious processing of refunds and
allowances.
Collaborate for product diversification.
Technical collaboration in upgrading the
technological capabilities in textiles
manufacturing can benefit both countries.
Australian know-how in producing high-quality
fabrics such as wool-based products can assist
Indonesian textile manufacturing to diversify wool
products.
Expand in Australia. Australian designers can
collaborate with Indonesian designers to work
on designs that suit Australian and wider
Western preferences. Additionally, for market
access of new products, both parties could
collaborate to determine customers’ preferences
both in Australia and in third countries for export.
The ASEAN-Australia-New Zealand Free Trade
Agreement will be crucial to fully maximise the
benefits of market access granted under the
Free Trade Area (FTA).
7 Develop competitive advantages in
Food-Processing
Upskill Indonesian firms to use advanced
technology for production. Indonesian
companies, particularly small- and medium-sized
firms, can benefit from Australian expertise and
thereby increase the capability of the Indonesian
food-processing industry in meeting international
standards.
Share information about export markets with
Indonesian firms. Australian food-processing
firms can share their knowledge of the
international market with Indonesian firms. The
incentive for Australian producers is greater
access to Indonesia’s large domestic market
while Indonesian producers may benefit through
increased exports. This can be achieved via
direct investment – or establishment – of
Australian food-processing producers in
Indonesia. This can facilitate joint access and
greater exports for both countries in the wider
region and to global markets.
Encourage food-processing business
associations (and other relevant
associations) in both countries to
collaborate. These associations can work
together to gather necessary information and
share it with food producers in Australia to
minimise transaction costs to invest for
Australian producers. Additionally, business
associations should develop economic cases
to encourage the Indonesian government to relax
the NIL (updated every six months).

Succeeding Together 12
8 Develop competitive advantages
in Logistics
Simplify the regulation/legislation
environment in Indonesia. Consistent
legislation will encourage Australian companies
to undertake joint ventures with Indonesian
businesses.
Transfer knowledge/expertise. Capitalise on
Indonesia’s growing capacity and generous
demographic dividend by training Indonesian
firms in both road and rail transportation
equipment/machinery.
Build relevant infrastructure to support
bilateral trade. There may be opportunities for
possible Australian/Indonesian government or
industry investment in ports infrastructure in both
countries to help tailor bilateral trade to specific
exports (i.e. livestock exports require more
refrigeration facilities at ports in both countries).
Collaborate with counterparts to enter third
markets. Businesses in both countries can
coordinate their efforts to approach third markets
via joint ventures. For example, Toll Global
Logistics currently benefits from a joint venture
with an Indonesian dairy company based in
Jakarta. This joint venture successfully combines
the comparative advantages of the Australian
logistics and Indonesian food-processing sectors
to approach third markets together.
Explore opportunities for collaboration in the
logistics of energy. Australia’s strength in the
logistics of energy production and distribution
(e.g. liquefied petroleum gas, or LPG) should be
embraced by Indonesia to capture the benefits of
proximity in energy supply.
Explore opportunities for collaboration in
data management and facilities to support
logistics capabilities. Strong data capabilities
will be key for Indonesia to cascade to higher
value logistics-heavy supply chains (e.g. airlines,
ports, etc.).
9 Develop competitive advantages in
Animal Products
Simplify the regulation/legislation
environment. A more balanced and predictable
approach to setting import quotas for goods in
Indonesia may lead to growing business
opportunities between Australia and Indonesia.
Additionally, a more streamlined registration
process may encourage small Australian
businesses to trade with Indonesia by lowering
delays and allowing them to realise their return
on investment quicker.
Establish facilities in targeted locations. For
example, wool exports to Indonesia cannot be in
the form of raw wool currently. Wool must be
processed in Australia prior to being sent to
Indonesia. The establishment of an early stage
wool processing facility will assist both countries
to jointly approach third markets.
Upskill existing labour force. Indonesian and
Australian producers of goods and services can
benefit from the knowledge and expertise of
each other’s workers to make their skills and
subsequently their products or services more
relevant to their domestic markets.
Undertake joint R&D projects. Joint R&D
projects can potentially be conducted in areas of
livestock genetics to boost profitability in cattle,
sheep and goat value chains. Joint projects may
also be conducted to increase productivity and
profitability of producers in both countries for
feeding, finishing and nutrition.

02The Australia-Indonesia
realities
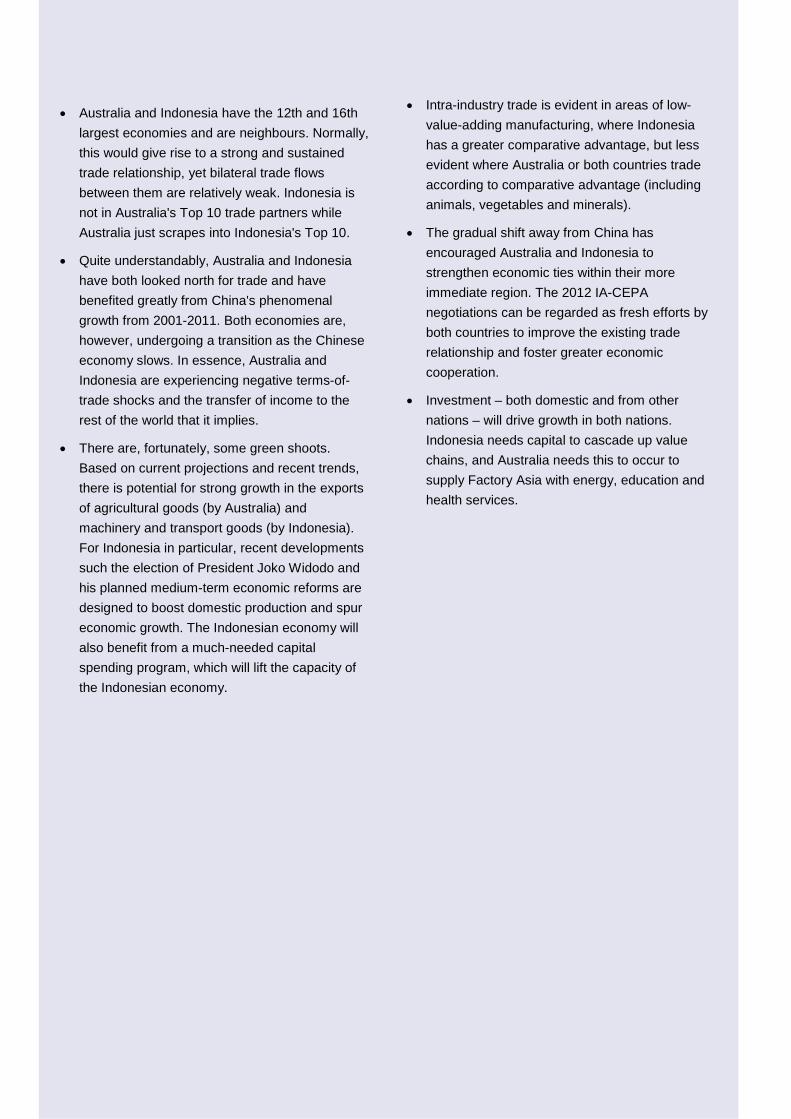
Australia and Indonesia have the 12th and 16th
largest economies and are neighbours. Normally,
this would give rise to a strong and sustained
trade relationship, yet bilateral trade flows
between them are relatively weak. Indonesia is
not in Australia's Top 10 trade partners while
Australia just scrapes into Indonesia's Top 10.
Quite understandably, Australia and Indonesia
have both looked north for trade and have
benefited greatly from China's phenomenal
growth from 2001-2011. Both economies are,
however, undergoing a transition as the Chinese
economy slows. In essence, Australia and
Indonesia are experiencing negative terms-of-
trade shocks and the transfer of income to the
rest of the world that it implies.
There are, fortunately, some green shoots.
Based on current projections and recent trends,
there is potential for strong growth in the exports
of agricultural goods (by Australia) and
machinery and transport goods (by Indonesia).
For Indonesia in particular, recent developments
such the election of President Joko Widodo and
his planned medium-term economic reforms are
designed to boost domestic production and spur
economic growth. The Indonesian economy will
also benefit from a much-needed capital
spending program, which will lift the capacity of
the Indonesian economy.
Intra-industry trade is evident in areas of low-
value-adding manufacturing, where Indonesia
has a greater comparative advantage, but less
evident where Australia or both countries trade
according to comparative advantage (including
animals, vegetables and minerals).
The gradual shift away from China has
encouraged Australia and Indonesia to
strengthen economic ties within their more
immediate region. The 2012 IA-CEPA
negotiations can be regarded as fresh efforts by
both countries to improve the existing trade
relationship and foster greater economic
cooperation.
Investment – both domestic and from other
nations – will drive growth in both nations.
Indonesia needs capital to cascade up value
chains, and Australia needs this to occur to
supply Factory Asia with energy, education and
health services.

Succeeding Together 15
2.1 The Australian and Indonesian economies
There is an indisputable logic that, if only because of
our proximity as neighbours (i.e. with the attendant
lower logistics costs), Australia and Indonesia should
naturally be economic partners.
There is more to this relationship, however.
Australia and Indonesia are neighbours but not
twins (Table 1). Rather, the economies are
complementary around key success/competition
factors – particularly FDI and human capital – which
can dynamically drive competitive advantage:
Australia is generally very effective at attracting FDI.
This is due to the maturity of governance, ease of
doing business and human capital aspects, all of
which Indonesia needs to compete in the AEC.
Both Australia and Indonesia need capital, but
Australia can help Indonesia with governance
requirements necessary to attract FDI, without
which, Indonesia risks not being able to
compete with its ASEAN competitors.
Demographics and labour forces are mutually
favourable, including Indonesia's abundant
cost-competitive labour force, versus Australia's
generally more highly educated, but expensive
labour force. IA-CEPA should enable this,
including via liberalisation of visa
requirements.4
Indonesia has demonstrated capability in simply
transformed manufactured (STM) goods, and
Australia needs access to this, including in
textiles/fashion, food-processing, etc.
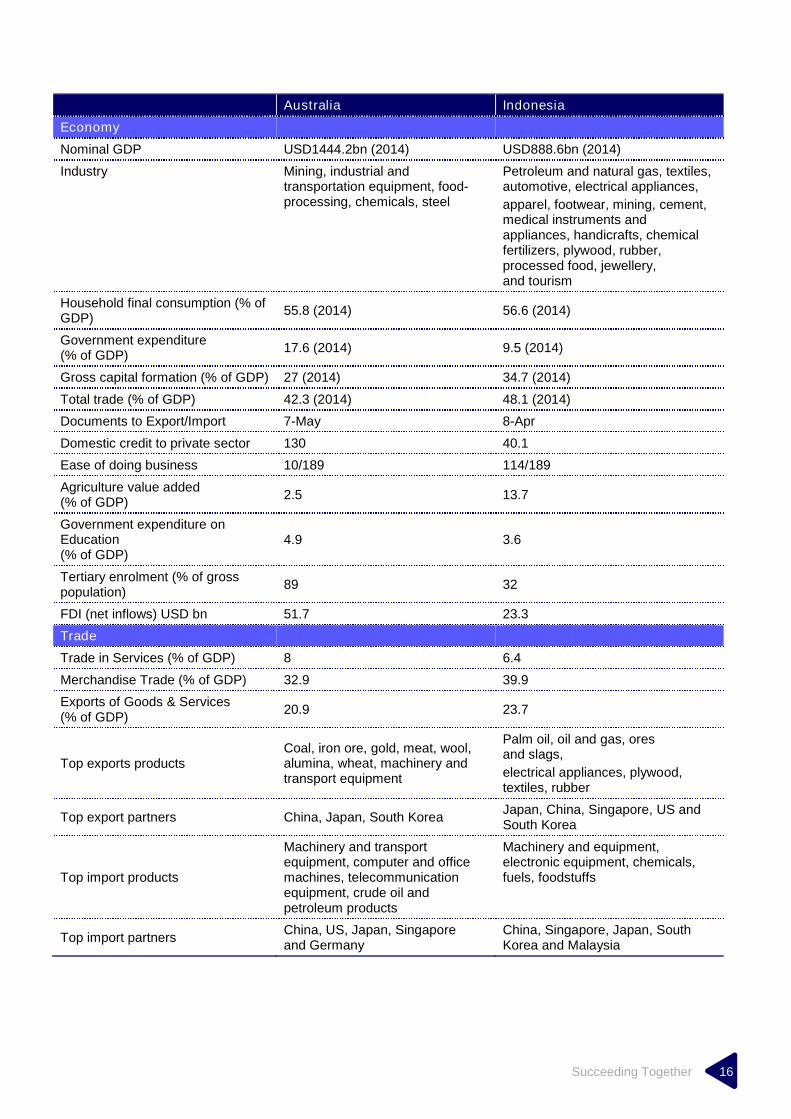
Table 1: Key comparative facts about Australia and Indonesia
Australia Indonesia
Geography
Geography Continent Archipelago
Land Size 7.7m sq km 1.9m sq km
Arable Land (% of total) 11.1 13
People and Society
Population 24 million 255 million
Population composition MulticulturalHundreds of indigenousethnic groups
Urban Population 89% 53%
Urban population growth 1.7 (2014) 2.6 (2014)
Labour Force 12.37m 124.3m
Life Expectancy at BirthFemale/Male
84/80 73/68
Labour Force 12.2 million 120.3 million
Labour force with Primaryeducation (% of labour force)
27.3 (2008) 53.5 (2008)
Labour force with Secondaryeducation (% of labour force)
38.9 (2008) 22.3 (2008)
Labour force with Tertiaryeducation (% of labour force)
33.8 (2008) 7.1 (2008)
Median age of population 38.3 years 29.2 years
Total Dependency ratio 0.5 0.51
Income share held by lowest 20%(% of pop)
7 (2003) 8 (2010)
4 See Indonesia-Australia Business Partnership Group 2012, Position Paper on Considerations Towards the Indonesia-AustraliaComprehensive Economic Partnership Agreement,
Succeeding Together 16
Australia Indonesia
Economy
Nominal GDP USD1444.2bn (2014) USD888.6bn (2014)
Industry Mining, industrial andtransportation equipment, food-processing, chemicals, steel
Petroleum and natural gas, textiles,automotive, electrical appliances,
apparel, footwear, mining, cement,medical instruments andappliances, handicrafts, chemicalfertilizers, plywood, rubber,processed food, jewellery,and tourism
Household final consumption (% ofGDP)
55.8 (2014) 56.6 (2014)
Government expenditure(% of GDP)
17.6 (2014) 9.5 (2014)
Gross capital formation (% of GDP) 27 (2014) 34.7 (2014)
Total trade (% of GDP) 42.3 (2014) 48.1 (2014)
Documents to Export/Import 7-May 8-Apr
Domestic credit to private sector 130 40.1
Ease of doing business 10/189 114/189
Agriculture value added(% of GDP)
2.5 13.7
Government expenditure onEducation(% of GDP)
4.9 3.6
Tertiary enrolment (% of grosspopulation)
89 32
FDI (net inflows) USD bn 51.7 23.3
Trade
Trade in Services (% of GDP) 8 6.4
Merchandise Trade (% of GDP) 32.9 39.9
Exports of Goods & Services(% of GDP)
20.9 23.7
Top exports productsCoal, iron ore, gold, meat, wool,alumina, wheat, machinery andtransport equipment
Palm oil, oil and gas, oresand slags,
electrical appliances, plywood,textiles, rubber
Top export partners China, Japan, South KoreaJapan, China, Singapore, US andSouth Korea
Top import products
Machinery and transportequipment, computer and officemachines, telecommunicationequipment, crude oil andpetroleum products
Machinery and equipment,electronic equipment, chemicals,fuels, foodstuffs
Top import partnersChina, US, Japan, Singaporeand Germany
China, Singapore, Japan, SouthKorea and Malaysia
Succeeding Together 17
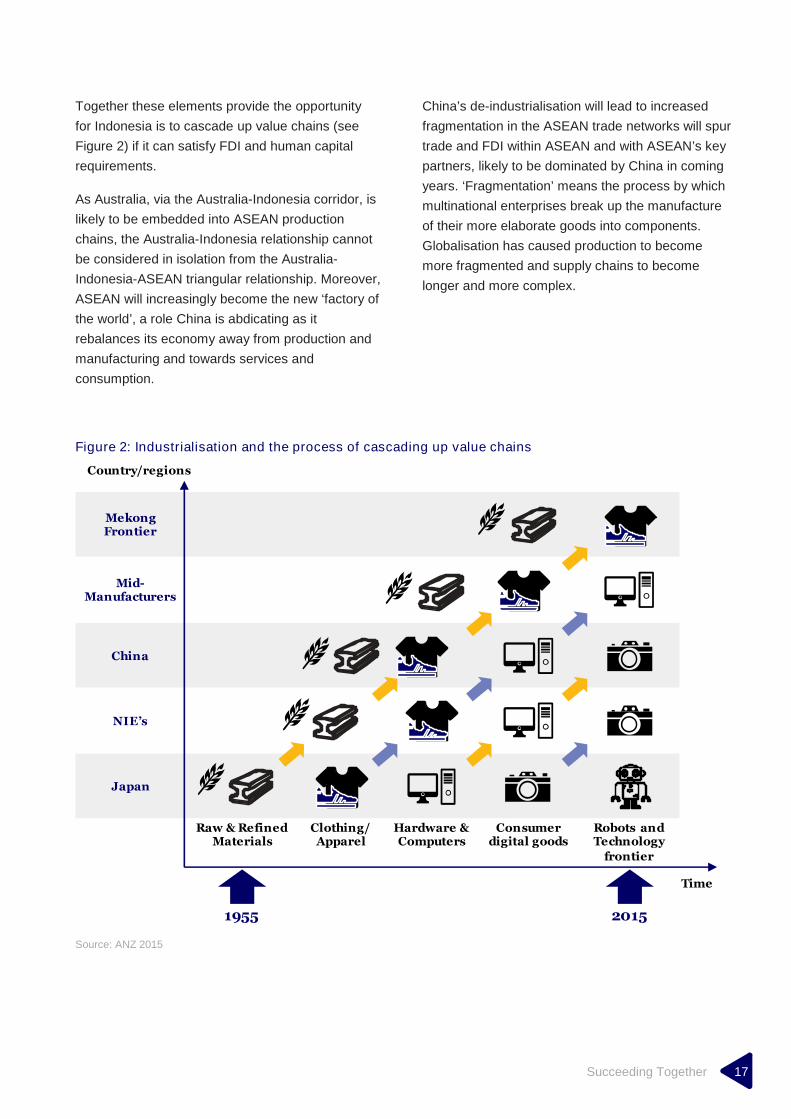
Together these elements provide the opportunity
for Indonesia is to cascade up value chains (see
Figure 2) if it can satisfy FDI and human capital
requirements.
As Australia, via the Australia-Indonesia corridor, is
likely to be embedded into ASEAN production
chains, the Australia-Indonesia relationship cannot
be considered in isolation from the Australia-
Indonesia-ASEAN triangular relationship. Moreover,
ASEAN will increasingly become the new ‘factory of
the world’, a role China is abdicating as it
rebalances its economy away from production and
manufacturing and towards services and
consumption.
China’s de-industrialisation will lead to increased
fragmentation in the ASEAN trade networks will spur
trade and FDI within ASEAN and with ASEAN’s key
partners, likely to be dominated by China in coming
years. ‘Fragmentation’ means the process by which
multinational enterprises break up the manufacture
of their more elaborate goods into components.
Globalisation has caused production to become
more fragmented and supply chains to become
longer and more complex.
Figure 2: Industrialisation and the process of cascading up value chains
Source: ANZ 2015
Raw & RefinedMaterials
Clothing/Apparel
Robots andTechnology
frontier
Consumerdigital goods
Hardware &Computers
MekongFrontier
Mid-Manufacturers
China
Japan
NIE’s
Country/regions
1955 2015
Time

Succeeding Together 18
In ASEAN’s case, this process has evolved into
remarkably complex networks. Not only is trade
vertically integrated within companies and supply
chains, it is also distributed across economies and
labour forces as companies look to fully exploit
specialised pools of labour. A key factor in the
development of these highly sophisticated supply
chains has been FDI, particularly from multinational
enterprises over the past decade.
Such deepening cross-ASEAN relationships have
stimulated both the growth in trade within the
ASEAN economy (Figure 3), and from ASEAN
members to their major trading partners (Figure 4).
Figure 3: Compound annual growth rates forintra-ASEAN trade
Source: ANZ 2015
Figure 4: Projections for extra-ASEAN trade
Source: ANZ 2015
The size of the prize for both Australia and
Indonesia of collaboratively linking into global supply
chains that directly feed into a rebalanced Chinese
economy is at risk of being vastly under-estimated.
China’s growing urban middle class will more than
double its spending over the next 15 years, helping
lift China’s consumption, as a portion of GDP, to
almost 50 per cent. By way of comparison, that
means China’s consumption in 2030 would exceed
US GDP today and the growth in consumption
between now and then would exceed the euro
area’s GDP in 2014.
These new opportunities are already becoming
apparent across multiple sectors in which Australia
and Indonesia are identified as having both
individual and joint comparative and competitive
advantages. New and/or deeper opportunities are
already arising as the discretionary spending power
of China’s urban middle class grows. For Australia
and Indonesia, those opportunities include:
High quality iron ore and base metals for housing
and automobiles.
Coal, LNG, mineral fuels and chemical products
to meet increasing energy needs.
Education services.
Agriculture and Aquaculture, both fresh, refined
and processed.
Tourism.
Demand for health, finance and construction
services on the ground in China.
With a potential FDI prize of around USD1trn and a
potential trade size of between USD3-4trn just for
ASEAN trade with China, it is vital that Australia and
Indonesia identify their joint competitive advantages
and work constructively together to realise them, to
be able to capture as large a slice of this prize as
possible for the mutual benefit of each country.
What follows is a snapshot of the Australian and
Indonesian economies in terms of output, labour
force, trade, industry structure, and how recent
trends have shaped these variables.
-
0.2
0.4
0.6
0.8
1.0
1.2
2000 2005 2010 2015 2020 2025
USD
trn
CAGR (2014-2025):4.8%
CAGR (2000-2013):9.7%
forecasts
0
500
1000
1500
2000
2500
Japan US Europe China
USD
bn
2005 2010 2015 2020 2025

Succeeding Together 19
2.1.1 The Australian economy
The Australian economy is the 12th largest in the
world. Total output, as measured by gross domestic
product (GDP), is around AUD1.60 trn per year.
GDP per capita was AUD67 thousand in 2014,
making it the 15th wealthiest economy in the world
according to the International Monetary Fund (IMF).
The Australian economy employs about 11.7 million
people to achieve this level of production. The
unemployment rate has fallen from as high as 11
per cent in the mid-1990s to approximately 6 per
cent in 2015.
Australia’s chief exports are raw materials, including
iron ore and coal, while some services, including
education and tourism, are also very important.
Australia’s primary imports are tourism, energy and
cars. Figure 5 provides a breakdown of Australia’s
key exports and imports.
Figure 5: Australia’s key exports and imports(2013-14)
Source: ABS and ANZ research 2015
0
5
10
15
20
25
0
10
20
30
40
50
60
70
80
1Ir
on
ore
2C
oa
l
3N
atu
ralG
as
4E
du
catio
n-r
ela
ted
travel
serv
ice
s
5P
ers
on
alt
rave
lse
rvic
es
6G
old
7C
rude
pe
tro
leu
m
8B
ee
f
9W
he
at
10
Alu
min
ium
ore
s&
con
c
Exports
($bn) % share
0
5
10
15
20
25
0
10
20
30
40
50
60
70
80
1P
ers
on
alt
rave
lse
rvic
es
2C
rude
pe
tro
leu
m
3R
efin
ed
pe
trole
um
4P
ass
eng
er
veh
icle
s
5F
reig
httr
ansp
ort
serv
ice
s
6T
ele
com
seq
uip
me
nt
7M
edic
am
ents
8C
om
pu
ters
9P
ass
eng
er
tra
nsport
serv
ices
10
Good
sve
hic
les
Imports
($bn) % share
Succeeding Together 20
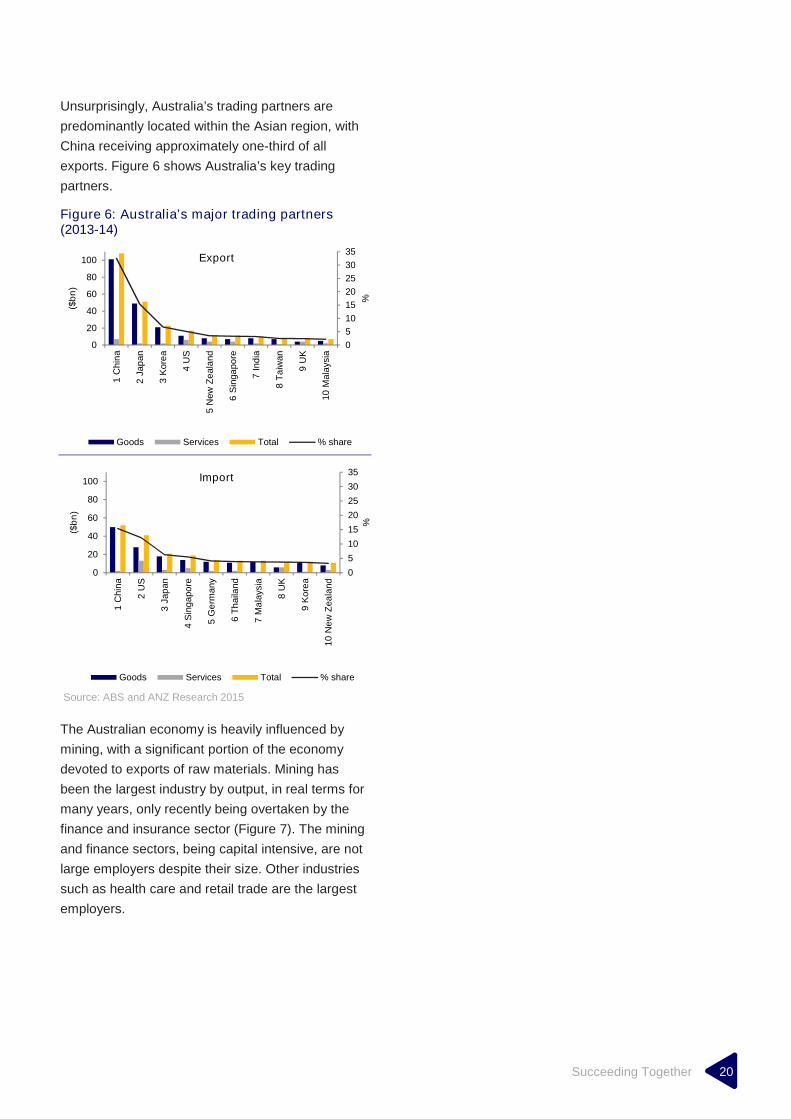
Unsurprisingly, Australia’s trading partners are
predominantly located within the Asian region, with
China receiving approximately one-third of all
exports. Figure 6 shows Australia’s key trading
partners.
Figure 6: Australia’s major trading partners(2013-14)
Source: ABS and ANZ Research 2015
The Australian economy is heavily influenced by
mining, with a significant portion of the economy
devoted to exports of raw materials. Mining has
been the largest industry by output, in real terms for
many years, only recently being overtaken by the
finance and insurance sector (Figure 7). The mining
and finance sectors, being capital intensive, are not
large employers despite their size. Other industries
such as health care and retail trade are the largest
employers.
0
5
10
15
20
25
30
35
0
20
40
60
80
100
1C
hin
a
2Ja
pan
3K
ore
a
4U
S
5N
ew
Ze
ala
nd
6S
inga
po
re
7In
dia
8T
aiw
an
9U
K
10
Mala
ysia
%
($b
n)
Export
Goods Services Total % share
0
5
10
15
20
25
30
35
0
20
40
60
80
100
1C
hin
a
2U
S
3Ja
pan
4S
inga
po
re
5G
erm
any
6T
haila
nd
7M
ala
ysia
8U
K
9K
ore
a
10
Ne
wZ
ea
land
%
($b
n)
Import
Goods Services Total % share
Succeeding Together 21
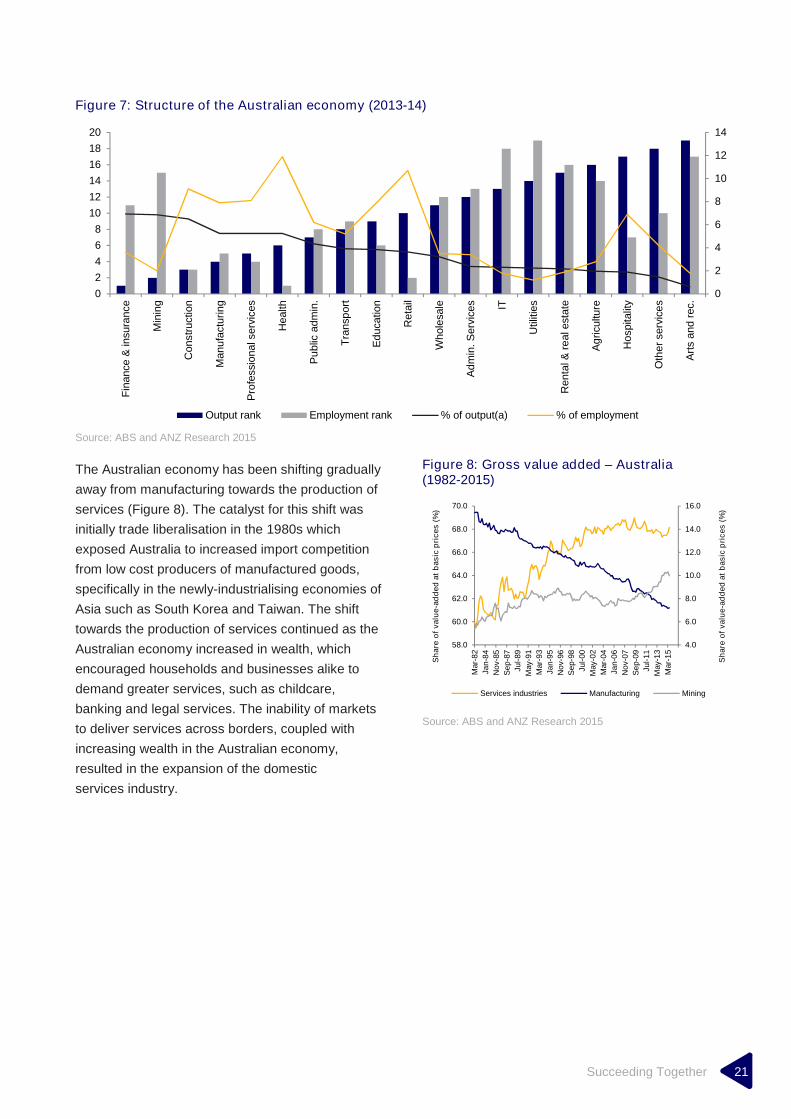
Figure 7: Structure of the Australian economy (2013-14)
Source: ABS and ANZ Research 2015
The Australian economy has been shifting gradually
away from manufacturing towards the production of
services (Figure 8). The catalyst for this shift was
initially trade liberalisation in the 1980s which
exposed Australia to increased import competition
from low cost producers of manufactured goods,
specifically in the newly-industrialising economies of
Asia such as South Korea and Taiwan. The shift
towards the production of services continued as the
Australian economy increased in wealth, which
encouraged households and businesses alike to
demand greater services, such as childcare,
banking and legal services. The inability of markets
to deliver services across borders, coupled with
increasing wealth in the Australian economy,
resulted in the expansion of the domestic
services industry.
Figure 8: Gross value added – Australia(1982-2015)
Source: ABS and ANZ Research 2015
0
2
4
6
8
10
12
14
0
2
4
6
8
10
12
14
16
18
20F
inance
&in
sura
nce
Min
ing
Constr
uctio
n
Manufa
ctu
ring
Pro
fessi
onals
erv
ices
Health
Pu
blic
adm
in.
Tra
nsp
ort
Ed
uca
tion
Reta
il
Whole
sale
Ad
min
.S
erv
ices IT
Util
itie
s
Renta
l&re
ale
state
Ag
ricu
lture
Hospita
lity
Oth
er
serv
ice
s
Art
sand
rec.
Output rank Employment rank % of output(a) % of employment
4.0
6.0
8.0
10.0
12.0
14.0
16.0
58.0
60.0
62.0
64.0
66.0
68.0
70.0
Mar-
82
Jan
-84
No
v-85
Se
p-8
7
Jul-
89
May-
91
Mar-
93
Jan
-95
No
v-96
Se
p-9
8
Jul-
00
May-
02
Mar-
04
Jan
-06
No
v-07
Se
p-0
9
Jul-
11
May-
13
Mar-
15
Sh
are
of
va
lue
-ad
de
da
tb
as
icp
ric
es
(%)
Sh
are
of
va
lue
-ad
de
da
tb
as
icp
ric
es
(%)
Services industries Manufacturing Mining

Succeeding Together 22
2.1.2 The Indonesian economy
Indonesia is one of the largest emerging economies
in the world, and is expected to generate
approximately USD900bn of GDP in 2015, ranking it
the 16th largest out of any economy in the world. It
has a population of 250 million people with a GDP
per capita of USD3,600 (in 2014).
The Indonesian economy remains in an embedded
slowdown. Over the first half of 2015 most
categories of expenditure have slowed – particularly
public and private investment and household
consumption – and the economy is mired in a trade
recession. In a somewhat similar experience to
Australia, Indonesia is also working through the
aftermath of the resources boom, which among
other things saw the country emerge as the world’s
largest exporter of coal and palm oil. Like Australia
too, Indonesia has been struggling with the need to
find new sectors to propel long-term development.
Recent developments should improve the efficiency
of the Indonesian economy and deliver higher and
more stable growth, lower inflation and reduced
financial market volatility. Specifically these
developments include the Cabinet reshuffle in
August 2015 as well as President Joko Widodo’s
planned medium-term economic reforms to boost
domestic production and spur economic growth.
‘Indonesia was trapped with the natural
resource curse. This explains, to an extent,
why Indonesia’s economy has become less
integrated into global supply chains. The
country also relied for its development on
expansion of its domestic economic market,
especially after the Global Financial Crisis’
- Felia Salim, Senior FinancialSector Expert
GDP growth in Indonesia has been slowing since
2011 falling from approximately 6.4 per cent to
4.6 per cent year-on-year (y/y) range most recently.
This is the weakest level of growth since the global
financial crisis of 2007-08 (Figure 9). The main
driver behind this slowdown has been persistent
underinvestment;5
gross fixed capital formation
(investment) growth slowed from about 9 per cent
y/y in 2011 to only 4 per cent y/y in 2014. This is
lower than GDP growth, which is atypical and
detrimental for economies in Indonesia’s state of
development (Figure 9).
Figure 9: Indonesia’s GDP growth (4Q rollingaverage) and investment over GDP
Source: CEIC and ANZ Research 2015
5 The level of investment is often a reliable indicator of futuregrowth. Investment is typically found in capacity buildingactivities in early stages of development.
2.0
3.0
4.0
5.0
6.0
7.0
8.0
1995 1999 2003 2007 2011 2015
%,
y/y
20
22
24
26
28
30
32
34
36
38
40
93 95 97 99 01 03 05 07 09 11 13 15
Investm
en
t/G
DP
,%
Investment/GDP
-13.7%in AFC

Succeeding Together 23
President Joko Widodo’s administration has shown
that it is aware of the underinvestment trend and
that it is willing to take decisive action to remedy this
issue. In his first budget in 2015, President Joko
Widodo has more than doubled capital expenditure
to around USD23bn and asked parliament to
increase the recently tabled 2016 budget to
USD25bn. In 2016, the Government plans to build
376km of new roads, 110km of new railroad, and
11 new airports.
Primarily, this infrastructure spending will be aimed
at raising the productive capacity and ultimately the
prosperity of the 250 million people in Indonesia
(Figure 10). Over the next ten years Indonesia is set
to add almost 30 million people to the labour force,
more than the population of Australia. Higher-grade
infrastructure and a relaxation of investment and
trade constraints will be important to ensure that
these 30 million people will have productive jobs
within the economy. The relationship with Australia
should be a pivotal part of this development with
both hard infrastructure development and soft
agricultural food needed inputs.
While additional direct investment is one part of the
solution, in the context where FTAs and FDI are
driving global dynamics, additional focus is required
to satisfy conditions to broaden the sources of
capital, specifically including FDI, domestic capital,
and possibly foreign debt.
Indonesia is a largely domestically dominated
country, with trade to GDP only at 45 per cent.
However trade is still large in absolute terms,
totalling nearly USD412bn in 2014 – more than
double New Zealand’s GDP – comprising exports of
USD199.8bn and imports of USD212.5bn.
Indonesia’s chief exports are raw materials,
including crude oil, gas coal, rubber and palm oil in
addition to travel services and machinery and
transport equipment. Indonesia’s chief imports are
refined mineral fuels, electrical machinery, transport
machinery, and transport services (Table 2,
next page).
Figure 10: Indonesia’s population pyramid(250m people) and working age population toadd nearly 30m by 2025
Source: CEIC, BPS and ANZ Research 2015
(20.0) (10.0) 0.0 10.0 20.0
0-4
5-9
10-14
15-19
20-24
25-29
30-34
35-39
40-44
45-49
50-54
55-59
60-64
65+
Million People
Men Women
140
150
160
170
180
190
200
2014 2019 2024
Millio
nP
eo
ple
Population aged 15-65 Additional Entrants 2014-19
Additional Entrants 2019-24
+8.8%
+6.8%

Succeeding Together 24
Table 2: Key Indonesian imports and exports (2014)
Exports USDbn % share Imports USDbn % share
Mineral Fuels 51.4 25.8 Refined Mineral Fuels 43.9 20.7
Palm Oil 21.1 10.6 Appliance` 25.8 12.2
Travel Services 9.8 4.9 Electrical Machinery 17.2 8.1
Electrical Machinery 9.7 4.9 Transport Services 12.0 5.6
Rubber 7.1 3.6 Iron and Steel 8.4 3.9
Other Business Services 6.0 3.0 Plastics 7.8 3.7
Appliance 6.0 3.0 Travel Services 7.7 3.6
Vehicles 5.2 2.6 Organic Chemicals 7.1 3.3
Pearls & Precious Stones 4.6 2.3 Other Business Services 7.0 3.3
Misc. Chemical Products 4.2 2.1 Vehicles 6.3 2.9
Source: CEIC, WITS and ANZ Research 2015
Unsurprisingly, Indonesia’s major merchandise goods
trading partners are located in the region with Japan,
China, Singapore and India holding four of the top five
export destinations. China, Singapore, Japan, Korea,
and Malaysia lead the main import sources (Table 3).
Table 3: Indonesia’s major trading partners (2014)
Exportdestinations
Goods(USDbn)
Services(USDbn)
Total(USDbn)
% Share(Merchandise)
Importsources
Goods($bn)
Services($bn)
Total($bn)
% Share(Merchandise)
Japan 23.2 – 13.1 China 30.6 – 17.3
China 17.6 – 10.0 Singapore 25.2 – 14.2
Singapore 16.8 – 9.5 Japan 17.0 – 9.6
USA 16.5 – 9.4 Korea 11.8 – 6.7
India 12.2 – 7.0 Malaysia 10.9 – 6.1
Korea 10.6 – 6.0 Thailand 9.8 – 5.5
Malaysia 9.8 – 5.5 USA 8.2 – 4.6
Taiwan 6.4 – 3.6 Saudi Arabia 6.5 – 3.7
Thailand 5.8 – 3.3 Australia 5.6 – 3.2
Australia 5.0 – 2.9 Germany 4.1 – 2.3
All countries 176.2 23.5 199.8 All countries 177.5 33.5 211.0
Source: CEIC, WITS and ANZ Research 2015

Succeeding Together 25
As previously mentioned, the Indonesian economy
is largely domestically driven and employees in the
manufacturing, wholesale and retail trade,
accommodation, agriculture and construction
industries account for 75 per cent of all employment.
The services sector has grown in recent years,
however primary (agriculture and mining) and
secondary segments (manufacturing) account for
48 per cent of employment and 43 per cent of gross
output (Table 4).
Table 4: Structure of the Indonesian economy (2014)
Industry Structure% of
output(a)Output
rank% of
employmentEmployment
rank
Manufacturing 21.6 1 13.3 11
Wholesale & Retail 13.7 221.7
15
Accommodation & Food 3.0 11 3
Agriculture 13.1 3 34.0 5
Construction 9.7 4 6.4 4
Public Admin 3.5 9
16.1
1
Education 3.1 10 8
Health & Social 1.1 16 9
Other Services 1.6 14 6
Mining 9.1 5 1.3 2
Transportation & Storage 3.9 74.5
12
Information & Communication 4.5 6 13
Financial & Insurance 3.8 8
2.6
18
Real Estate 3.0 12 19
Business Services 1.6 13 16
Electricity & Gas Supply 1.1 15 0.3 14
Source: CEIC, BPS, WITS and ANZ Research 2015
Succeeding Together 26
2.2 Economies in transition
The headline profiles of the Australian and
Indonesian economies have broadly been similar
through both the Asian and global financial crises,
reflecting similar endowments and competition for
similar external markets. Both economies have been
characterised by historically long periods of growth
with low volatility. However, since mid-2013 both
economies have been undergoing a transition as the
Chinese economy slows.6
‘We have entered an age of the new normal.
China cannot sustain being the global
economic furnace heating the economies
of its neighbours at GDP levels experienced
over the past twenty years’
- Mahendra Siregar, Former Chair ofthe Investment Coordination Agency
and one time Deputy Minister ofFinance, Indonesia
The combination of both real (China driven) and
financial (investor driven) demand for commodities
provided a profound boom for commodity exporters
from 2002 to 2011 with a surge in both the volume
and price of commodity exports.
This basic macro backdrop provides the necessary,
though not entirely sufficient, explanation for the
current economic underperformance each economy
is experiencing. In short, both Indonesia and
Australia are now dealing with negative terms-of-
trade shocks and the transfer of income to the rest
of the world implicit in that shock.
Domestic overlays need to be added to complete
the picture of why each country’s economic
performance is less than it could be. A brief
summary of the domestic factors in consideration
as well as the short-term economic concerns and
medium-term economic promises are provided
below.
6 The slowdown of the Chinese economy reflects a rebalancingaway from a commodity intensive investment-led growthmodel to a consumption-led growth model.
2.2.1 Australia: A shift awayfrom reliance on China
The period of sustained industrialisation and
expansion of productive capacity of the Chinese
economy was a once in a generation – if not
historically speaking a one-off – opportunity for the
Australian economy. The commodity and mining
boom associated with the rise of China was much
greater than any preceding commodity boom (such
as the 1980s commodity boom). The major
difference between the two periods is that the
more recent boom benefited from deeper and
sophisticated financial markets over the past
decades and greater speculative demand, i.e.
with hedge and mutual funds investing significantly
into physical assets.
The Australian and Indonesian responses to the
China and speculator led commodity booms were
different, mainly because of Australia’s supply
response to the booms.
Australia was able to significantly expand capacity
of existing resources and also create capacity for
new exports (such as LNG) rather than exhausting
its domestic supply.
‘We need to go beyond trade which is
transactional. The relationship there stops at the
border. Investment produces commercial
cooperation at a deeper level and builds solid
longer term commitment’
- Gordon Flake, CEO Perth USAsiaCentre, University of Western Australia
It is often argued, however, that there were
significant costs involved. In particular, the
Australian dollar appreciated to record levels
against the USD, which helped contain inflation but
greatly damaged the competitiveness of the trade-
exposed manufacturing sector. Moreover, the boom
in mining export receipts did not translate to an
equally large rise in taxation revenue, creating a
structural fiscal deficit.

Succeeding Together 27
The Australian car manufacturing industry’s
competiveness in particular was severely damaged
following the global financial crisis in 2007-08. Car
manufacturers cited the sustained strength of the
Australian dollar, high costs of production and a
small domestic market as their primary reasons for
eventually ceasing production activities. Specifically,
the AUD’s rise led to increased labour and material
costs. This resulted in significant reductions in
profits from vehicle sales. In 2009 Mitsubishi was
the first manufacturer to announce its plans to stop
vehicle productions and in 2014 Toyota was the last
of Australia’s vehicle manufacturers to announce its
withdrawal from Australia (scheduled for 2017).
The experience of the Australian grains industry is a
further sign that the Australian economy is in a
period of transition. Australia has traditionally been
in a good position to supply grain for the ever
increasing demand from Asia. In 2014
approximately 75 per cent of Australian grain was
exported to Asia.7
However this domination is no
longer certain as Canada, the US, Russia and
Ukraine are increasingly placing emphasis on
improving their exports to Asia and are therefore
putting pressure on prices. As a result Australian
grain producers may lose their market share in
Asia over time.
Although the transition of the Australian economy
has presented some challenges, it also presents
some opportunities. The Prime Minister of Australia,
Malcom Turnbull, recently signalled his intention to
diversify Australia’s economy, possibly in
recognition that there are emerging sectors where
Australia can develop competitive advantages.
Specifically, the Prime Minister has targeted digital
technology to transform Australia’s global business.
The Prime Minister has noted that the business
community can benefit, particularly from innovation
derived from the unique mixture of connectivity and
processing power that digital technologies offer. The
Australian economy can therefore reasonably
7 PwC. 2014. The Australian Grains Industry: The Basics.Retrieved fromhttp://www.pwc.com.au/industry/agribusiness/assets/Australian-Grains-Industry-Nov11.pdf
expect a transition to a more innovative environment
to compete with businesses globally.
2.2.2 Indonesia’s global upsand downs
Indonesia is powerfully positioned as ASEAN’s
largest economy. It also has the largest labour force
within the region with an average age of 29. By
2050 it is expected that Indonesia’s total working
age population will be close to 175 million. This
sizeable labour force can strengthen Indonesia’s
comparative advantages over time to help the
economy become more actively involved in global
supply chains.
‘The resources boom is over. We need a new
model. We cannot rely on basic commodities
for exports anymore.’
- Dr Dino Patti Djalal, Former DeputyMinister of Foreign Affairs of Indonesia
Indonesia has recently undertaken various initiatives
designed to improve the productivity of its economy.
President Joko Widodo has made infrastructure
improvement a top policy priority with infrastructure
spending to be increased by an average of 8 per
cent annually over 2016 - 2019. Another example is
the President’s efforts towards enhancing the
Indonesia’s investment climate to remove
constraints on the private sector, such as the recent
establishment of a one-stop shop for business
licensing to harmonise complex national and local
regulations.8
In particular, Indonesia’s efforts
towards greater trade integration has led to a trade
surplus of USD7.13bn in the first nine months of
2015 (the largest trade surplus from January to
September in four years).9
Like Australia, the Indonesian economy is in a
period of transition. Indonesia’s depletion of its own
8 International Monetary Fund. (2015, 1 September). Poisedfor Take-off—Unleashing Indonesia’s Economic Potential.Retrieved fromhttps://www.imf.org/external/np/speeches/2015/090115.htm
9 The Jakarta Post (2015, 15 October). Indonesia records 4-year biggest trade surplus of $7.13b. Retrieved fromhttp://www.thejakartapost.com/news/2015/10/15/indonesia-records-4-year-biggest-trade-surplus-713b.html

Succeeding Together 28
oil and energy sources meant that it could no longer
meet domestic demand from local production. This
led Indonesia to switch from being a major energy
and resource exporter to an importing nation in the
past three to four years. At the height of the
commodity boom, when Indonesia should have
been posting large sustained current account
surpluses and boosting foreign-exchange reserves,
the opposite dynamic occurred. Indonesia’s
substantial domestic energy and resource
requirements led to a massive swing from a current
account surplus into a current account deficit as well
as deterioration in the fiscal balance as resource-
related revenues fell sharply.
The problematic nature of this dynamic extended
beyond lost export revenue. The major loss of
export revenues and a swing into current account
deficit and larger fiscal deficits resulted in the
Indonesian economy being perceived as fragile by
fickle and highly mobile speculative capital in 2013.
In this period:
The Indonesian currency plummeted.
Interest rates had to be increased to stabilise the
currency and prevent inflation pass-through from
a weaker currency.
A range of trade barriers were put in place to
stabilise the current account deficit.
The economy slowed sharply.
Indonesia has undertaken a range of beneficial
fiscal policies over the course of 2014, both
regionally and globally. It used the decline in global
oil prices to dismantle highly complex, ineffective
and expensive fuel subsidies. These subsidy
savings, which should amount to around 2-3 per
cent of GDP per year, can be directed to higher
multiplier public-works spending that will have a
stronger economic impact (relative to subsidies) and
ultimately improve the efficiency of the Indonesian
economy.
With these factors in mind, it is premature to
conclude that the Indonesian economy has troughed
and that growth is likely to base around 4.5 per cent.
It can be expected that this below-trend pace of
growth is likely to be maintained for the foreseeable
future. Growth can be expected to range around 4-5
per cent for the next two years before increasing to
6 per cent in the 2017-18 timeframe. Indonesia has
fortunately shown a high propensity to leverage off
more competitive currency levels and engineer
trade-led recoveries in the past following difficult
economic adjustments. It is possible that they will do
this again.
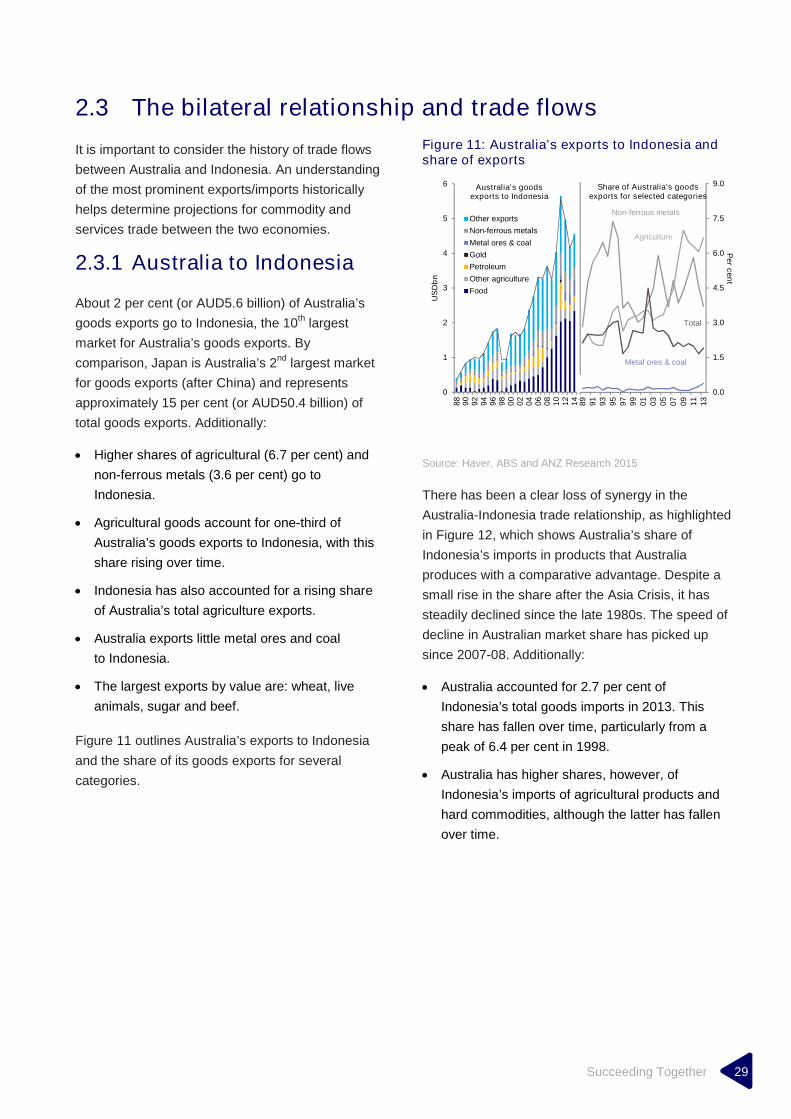
Succeeding Together 29
2.3 The bilateral relationship and trade flows
It is important to consider the history of trade flows
between Australia and Indonesia. An understanding
of the most prominent exports/imports historically
helps determine projections for commodity and
services trade between the two economies.
2.3.1 Australia to Indonesia
About 2 per cent (or AUD5.6 billion) of Australia’s
goods exports go to Indonesia, the 10th
largest
market for Australia’s goods exports. By
comparison, Japan is Australia’s 2nd
largest market
for goods exports (after China) and represents
approximately 15 per cent (or AUD50.4 billion) of
total goods exports. Additionally:
Higher shares of agricultural (6.7 per cent) and
non-ferrous metals (3.6 per cent) go to
Indonesia.
Agricultural goods account for one-third of
Australia’s goods exports to Indonesia, with this
share rising over time.
Indonesia has also accounted for a rising share
of Australia’s total agriculture exports.
Australia exports little metal ores and coal
to Indonesia.
The largest exports by value are: wheat, live
animals, sugar and beef.
Figure 11 outlines Australia’s exports to Indonesia
and the share of its goods exports for several
categories.
Figure 11: Australia’s exports to Indonesia andshare of exports
Source: Haver, ABS and ANZ Research 2015
There has been a clear loss of synergy in the
Australia-Indonesia trade relationship, as highlighted
in Figure 12, which shows Australia’s share of
Indonesia’s imports in products that Australia
produces with a comparative advantage. Despite a
small rise in the share after the Asia Crisis, it has
steadily declined since the late 1980s. The speed of
decline in Australian market share has picked up
since 2007-08. Additionally:
Australia accounted for 2.7 per cent of
Indonesia’s total goods imports in 2013. This
share has fallen over time, particularly from a
peak of 6.4 per cent in 1998.
Australia has higher shares, however, of
Indonesia’s imports of agricultural products and
hard commodities, although the latter has fallen
over time.
0
1
2
3
4
5
6
88
90
92
94
96
98
00
02
04
06
08
10
12
14
US
Db
n
Other exports
Non-ferrous metals
Metal ores & coal
Gold
Petroleum
Other agriculture
Food
0.0
1.5
3.0
4.5
6.0
7.5
9.0
89
91
93
95
97
99
01
03
05
07
09
11
13
Share of Australia’s goodsexports for selected categories
Pe
rc
en
t
Australia’s goodsexports to Indonesia
Metal ores & coal
Total
Agriculture
Non-ferrous metals

Succeeding Together 30
Figure 12: Australia as a source for Indonesia’s imports
Source: Haver, ABS and ANZ Research 2015
Australia’s export growth to Indonesia has been
multi-speed in recent decades. Whereas hard
commodity exports had a strong growth period from
2000-2010, agricultural exports have recorded
similar rates of growth in the 1980s, 1990s and
2000s (Figure 13). A range of 5 to 9 per cent per
annum growth seems plausible given the historical
rates of export growth. The value of Australian
agricultural exports could increase from around
USD2.5bn now to nearly USD7bn by 2024 under a
higher growth scenario (Figure 13).
Australia’s services exports to Indonesia are even
less diversified than goods exports with the
education and tourism sectors dominating
(Figure 14). Education accounts for 45 per cent of
Australia’s services exports to Indonesia, however,
Indonesians accounted for just 3.2 per cent of
international students in Australia at end 2014. By
comparison, Chinese and Indian students (the top
two nationalities for higher education enrolment in
Australia) account for 36.1 per cent and
10.5 per cent respectively.
0
5
10
15
20
25
30
35
40
45
89 90 91 92 93 94 95 96 97 98 99 00 01 02 03 04 05 06 07 08 09 10 11 12 13
%o
fIn
do
nesia
’sim
po
rts
for
each
cate
go
ry
Hard commodities
Food, beverages & live animals
Total agriculture
Total

Succeeding Together 31
Figure 13: Projections for hard commodityexports to Indonesia and agricultural exports toIndonesia
Source:Haver, ABS and ANZ Research 2015
Figure 14: Services exports to Indonesia andprojections for services exports
Source: Haver, ABS and ANZ Research 2015
0
1
1
2
2
3
88 90 92 94 96 98 00 02 04 06 08 10 12 14 16 18 20 22 24
US
Db
n
Australia's hard commodity exports to Indonesia
0
1
2
3
4
5
6
7
88 90 92 94 96 98 00 02 04 06 08 10 12 14 16 18 20 22 24
US
Db
n
Australia's agriculture exports to Indonesia
1.0
1.5
2.0
2.5
3.0
3.5
4.0
4.5
0.0
0.2
0.4
0.6
0.8
1.0
1.2
1.4
87 90 93 96 99 02 05 08 11 89 92 95 98 01 04 07 10 13
Pe
rc
en
tUS
Db
n
Education
Travel (other than education)
Transport
Other services
0.0
0.5
1.0
1.5
2.0
2.5
3.0
88 90 92 94 96 98 00 02 04 06 08 10 12 14 16 18 20 22 24
US
Db
n
Australia's services exports to Indonesia
15% pa
2% p.a
9% p.a
7.5% p.a
6% p.a
4.5% p.a
Projections
5% pa
26% pa
9% pa
9% pa
7% pa
5% pa
Projections
9% pa
7% pa
5% pa
10% pa
10% pa
13% pa
Projections
Australia’s servicesexports toIndonesia
No. of short-term visitors toAustralia from Indonesia

Succeeding Together 32
Australia’s services exports to Indonesia may
overtake hard-commodity exports by around 2020 if
current growth rates per annum are maintained.
This should highlight the potential for a more
diversified engagement with Indonesia beyond the
hard commodity focus.
In terms of projecting Australia’s merchandise
imports for Indonesia, the declining pace of import
growth is apparent in recent decades. After
sustaining 20 per cent per annum growth in the
1980s-90s, import growth slowed to around 13 per
cent per annum in the 2000s and has averaged just
6 per cent per annum over the past five years. This
deceleration suggests some degree of cautiousness
is necessary in forecasting the likely future growth
rate for imports.
2.3.2 Indonesia to Australia
At present around 3.5 per cent of Indonesia’s goods
exports go to Australia, the 10th
largest market for
Indonesia’s exports. Additionally:
Higher shares of petroleum (10 per cent of
Indonesia’s total petroleum exports) and metal
and metal ores (9 per cent) are exported to
Australia.
Petroleum accounted for 25.5 per cent of
Indonesia’s total merchandise exports to
Australia in 2014. Metals and ores account for
22.2 per cent and machinery and transport
equipment account for 18.9 per cent. The latter
two groups have seen their shares rise over the
past five years.
Textiles, paper and wood, and other agricultural
products round out the remaining top categories
that are shipped to Australia.
On a product basis: petroleum, metal
manufactured goods, industrial equipment, iron
and steel, and non-ferrous metals are the top five
product exports to Australia.
Figure 15 outlines Indonesia’s exports to Australia
and the share of its goods exports for several
categories.
Figure 15: Total merchandise exports fromIndonesia to Australia and share of Indonesia’sexports to Australia
Source: WITS and ANZ Research 2015
0.0
10.0
20.0
30.0
40.0
50.0
60.0
70.0
80.0
90.0
100.0
90 91 92 93 94 95 96 97 98 99 00 01 02 03 04 05 06 07 08 09 10 11 12 13 14
Share
ofC
ate
gory
inIn
donesi
ato
tale
xport
sto
Aust
ralia
,%
Petroleum Metals+Metal Ore Machinery & Transport Equip
Paper & Wood Textile & Footware Other Agricultural
Other
0
2
4
6
8
10
12
14
16
18
20
89 91 93 95 97 99 01 03 05 07 09 11 13
0
1
2
3
4
5
6
88 90 92 94 96 98 00 02 04 06 08 10 12 14U
SD
bn
Petroleum
Metal & Ore
Machine & Trans Eq.
Paper & Wood
Textiles & Footwear
Other Agriculture
Other Exports
Petroleum
Metal & Ore
Total
Machine & Trans Eq.
Pe
rc
en
t
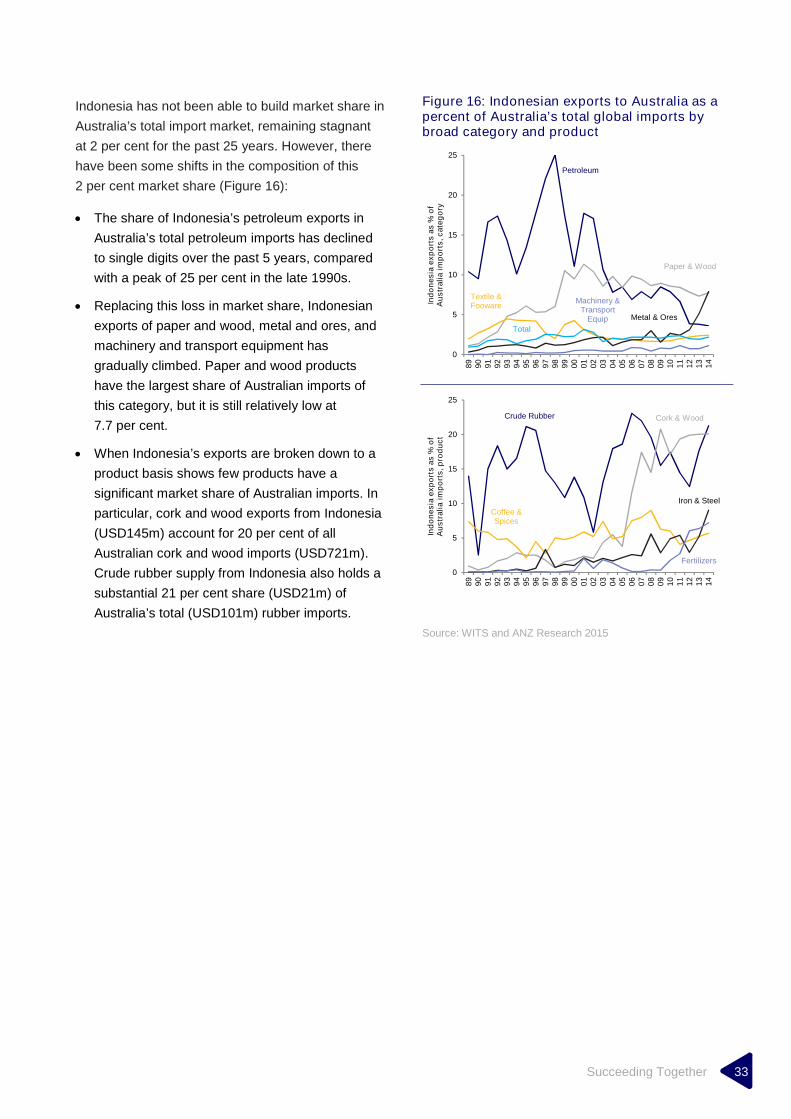
Succeeding Together 33
Indonesia has not been able to build market share in
Australia’s total import market, remaining stagnant
at 2 per cent for the past 25 years. However, there
have been some shifts in the composition of this
2 per cent market share (Figure 16):
The share of Indonesia’s petroleum exports in
Australia’s total petroleum imports has declined
to single digits over the past 5 years, compared
with a peak of 25 per cent in the late 1990s.
Replacing this loss in market share, Indonesian
exports of paper and wood, metal and ores, and
machinery and transport equipment has
gradually climbed. Paper and wood products
have the largest share of Australian imports of
this category, but it is still relatively low at
7.7 per cent.
When Indonesia’s exports are broken down to a
product basis shows few products have a
significant market share of Australian imports. In
particular, cork and wood exports from Indonesia
(USD145m) account for 20 per cent of all
Australian cork and wood imports (USD721m).
Crude rubber supply from Indonesia also holds a
substantial 21 per cent share (USD21m) of
Australia’s total (USD101m) rubber imports.
Figure 16: Indonesian exports to Australia as apercent of Australia’s total global imports bybroad category and product
Source: WITS and ANZ Research 2015
Petroleum
Paper & Wood
Textile &Fooware
Metal & Ores
Machinery &Transport
Equip
Total
0
5
10
15
20
25
89
90
91
92
93
94
95
96
97
98
99
00
01
02
03
04
05
06
07
08
09
10
11
12
13
14
Ind
on
es
iae
xp
ort
sa
s%
of
Au
str
ali
aim
po
rts
,c
ate
go
ry
Crude Rubber Cork & Wood
Coffee &Spices
Iron & Steel
Fertilizers
0
5
10
15
20
25
89
90
91
92
93
94
95
96
97
98
99
00
01
02
03
04
05
06
07
08
09
10
11
12
13
14
Ind
on
es
iae
xp
ort
sa
s%
of
Au
str
ali
aim
po
rts
,p
rod
uc
t
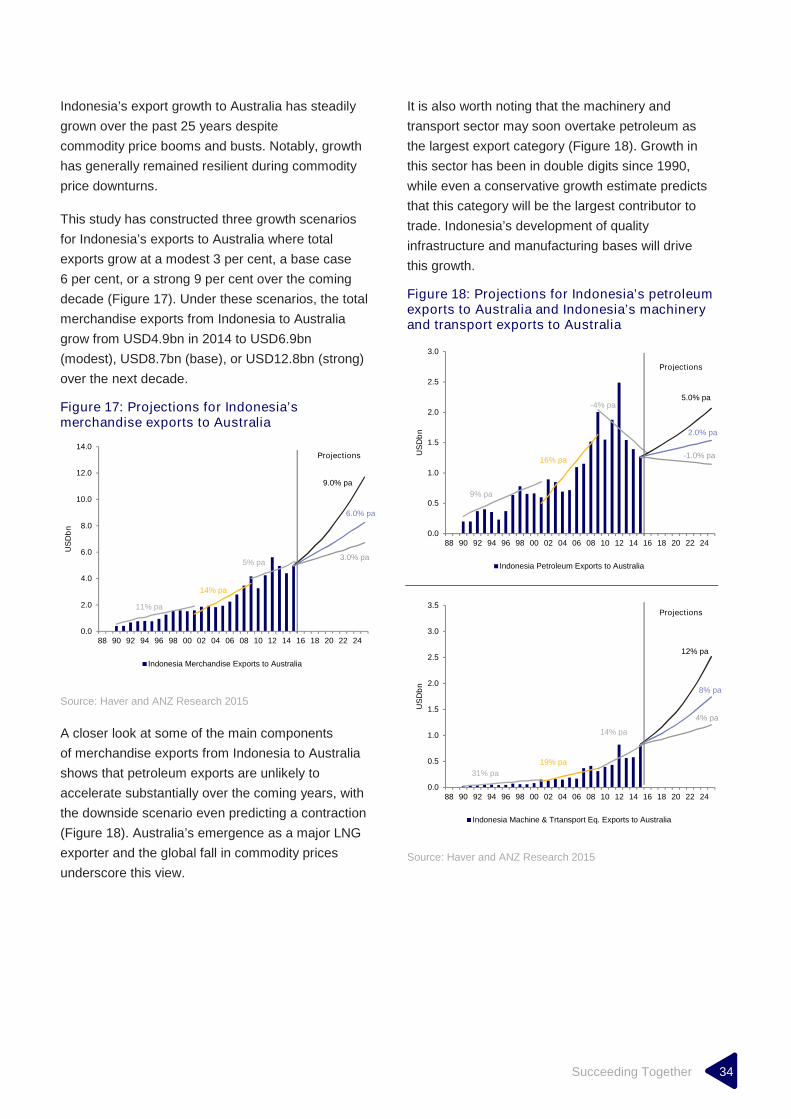
Succeeding Together 34
Indonesia’s export growth to Australia has steadily
grown over the past 25 years despite
commodity price booms and busts. Notably, growth
has generally remained resilient during commodity
price downturns.
This study has constructed three growth scenarios
for Indonesia’s exports to Australia where total
exports grow at a modest 3 per cent, a base case
6 per cent, or a strong 9 per cent over the coming
decade (Figure 17). Under these scenarios, the total
merchandise exports from Indonesia to Australia
grow from USD4.9bn in 2014 to USD6.9bn
(modest), USD8.7bn (base), or USD12.8bn (strong)
over the next decade.
Figure 17: Projections for Indonesia’smerchandise exports to Australia
Source: Haver and ANZ Research 2015
A closer look at some of the main components
of merchandise exports from Indonesia to Australia
shows that petroleum exports are unlikely to
accelerate substantially over the coming years, with
the downside scenario even predicting a contraction
(Figure 18). Australia’s emergence as a major LNG
exporter and the global fall in commodity prices
underscore this view.
It is also worth noting that the machinery and
transport sector may soon overtake petroleum as
the largest export category (Figure 18). Growth in
this sector has been in double digits since 1990,
while even a conservative growth estimate predicts
that this category will be the largest contributor to
trade. Indonesia’s development of quality
infrastructure and manufacturing bases will drive
this growth.
Figure 18: Projections for Indonesia’s petroleumexports to Australia and Indonesia’s machineryand transport exports to Australia
Source: Haver and ANZ Research 2015
0.0
2.0
4.0
6.0
8.0
10.0
12.0
14.0
88 90 92 94 96 98 00 02 04 06 08 10 12 14 16 18 20 22 24
US
Db
n
Indonesia Merchandise Exports to Australia
11% pa
14% pa
5% pa
9.0% pa
6.0% pa
3.0% pa
0.0
0.5
1.0
1.5
2.0
2.5
3.0
88 90 92 94 96 98 00 02 04 06 08 10 12 14 16 18 20 22 24
US
Db
n
Indonesia Petroleum Exports to Australia
9% pa
16% pa
-4% pa5.0% pa
2.0% pa
-1.0% pa
0.0
0.5
1.0
1.5
2.0
2.5
3.0
3.5
88 90 92 94 96 98 00 02 04 06 08 10 12 14 16 18 20 22 24
US
Db
n
Indonesia Machine & Trtansport Eq. Exports to Australia
31% pa
19% pa
14% pa
12% pa
8% pa
4% pa
Projections
Projections
Projections
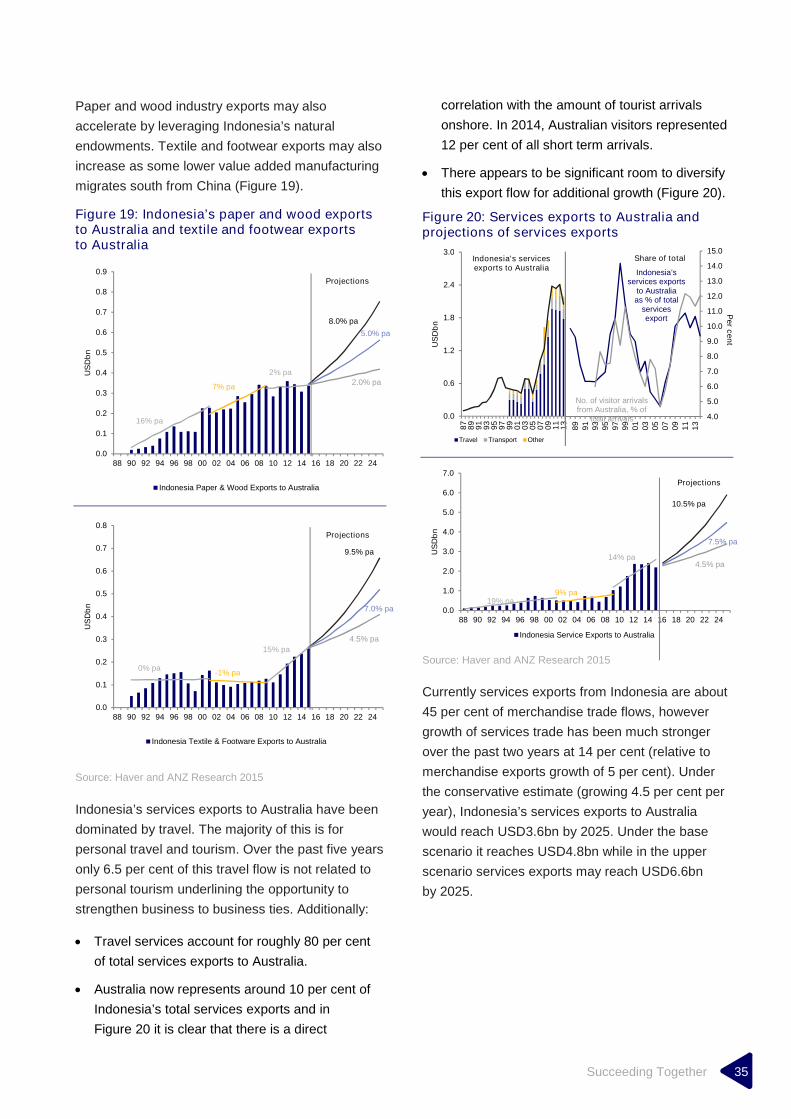
Succeeding Together 35
Paper and wood industry exports may also
accelerate by leveraging Indonesia’s natural
endowments. Textile and footwear exports may also
increase as some lower value added manufacturing
migrates south from China (Figure 19).
Figure 19: Indonesia’s paper and wood exportsto Australia and textile and footwear exportsto Australia
Source: Haver and ANZ Research 2015
Indonesia’s services exports to Australia have been
dominated by travel. The majority of this is for
personal travel and tourism. Over the past five years
only 6.5 per cent of this travel flow is not related to
personal tourism underlining the opportunity to
strengthen business to business ties. Additionally:
Travel services account for roughly 80 per cent
of total services exports to Australia.
Australia now represents around 10 per cent of
Indonesia’s total services exports and in
Figure 20 it is clear that there is a direct
correlation with the amount of tourist arrivals
onshore. In 2014, Australian visitors represented
12 per cent of all short term arrivals.
There appears to be significant room to diversify
this export flow for additional growth (Figure 20).
Figure 20: Services exports to Australia andprojections of services exports
Source: Haver and ANZ Research 2015
Currently services exports from Indonesia are about
45 per cent of merchandise trade flows, however
growth of services trade has been much stronger
over the past two years at 14 per cent (relative to
merchandise exports growth of 5 per cent). Under
the conservative estimate (growing 4.5 per cent per
year), Indonesia’s services exports to Australia
would reach USD3.6bn by 2025. Under the base
scenario it reaches USD4.8bn while in the upper
scenario services exports may reach USD6.6bn
by 2025.
0.0
0.1
0.2
0.3
0.4
0.5
0.6
0.7
0.8
0.9
88 90 92 94 96 98 00 02 04 06 08 10 12 14 16 18 20 22 24
US
Db
n
Indonesia Paper & Wood Exports to Australia
16% pa
7% pa
2% pa
8.0% pa
5.0% pa
2.0% pa
0.0
0.1
0.2
0.3
0.4
0.5
0.6
0.7
0.8
88 90 92 94 96 98 00 02 04 06 08 10 12 14 16 18 20 22 24
US
Db
n
Indonesia Textile & Footware Exports to Australia
0% pa-1% pa
15% pa
9.5% pa
7.0% pa
4.5% pa
0.0
1.0
2.0
3.0
4.0
5.0
6.0
7.0
88 90 92 94 96 98 00 02 04 06 08 10 12 14 16 18 20 22 24
US
Db
n
Indonesia Service Exports to Australia
19% pa9% pa
14% pa
10.5% pa
7.5% pa
4.5% pa
4.0
5.0
6.0
7.0
8.0
9.0
10.0
11.0
12.0
13.0
14.0
15.0
89
91
93
95
97
99
01
03
05
07
09
11
13
0.0
0.6
1.2
1.8
2.4
3.0
87
89
91
93
95
97
99
01
03
05
07
09
11
13
US
Db
nTravel Transport Other
Projections
Projections
Pe
rc
en
t
Share of total
Indonesia’sservices exports
to Australiaas % of total
servicesexport
Indonesia’s servicesexports to Australia
No. of visitor arrivalsfrom Australia, % of
total arrivals
Projections

Succeeding Together 36
2.3.3 Intra-industry trade
The intra-industry trade (IIT) index measures trade
that occurs within industries and product groups. IIT
conceptually reflects differing tastes and consumer
preferences and economies of scale, rather than
differing ‘factor endowments’10
, and typically
becomes a rising share of bilateral trade as
economies and incomes become similar over time.
This relationship has been measured using the
Grubel-Lloyd index (GLI), calculated from the ratio
of trade overlap to total trade within a product or
product group. GLI ranges from 0 to 1; when GLI=
0, there is no IIT and the countries are strictly
exporters or importers of that good, and when
GLI=1, there is only IIT, and the country exports
as much as it imports of that good.
The results are presented in Table 5, which shows
the GLI by broad product group11
and the share of
that product group in total trade.
Table 5 also shows the proportion of products within
the broad group12
that have a GLI less than 0.5.
This illustrates the extent to which IIT is evident
across a broad range of products within the group
(closer to 0 per cent), or driven by IIT trade across
different products within that group (closer to 100
per cent). That is, it acknowledges that when
applied to broader product groups, the GLI can
mask existing patterns of production fragmentation.
10 A ‘factor endowment’ is the amount of labour, capital, landand entrepreneurship that an economy can use towardsmanufacturing.
11 This is measured using Harmonised System (HS) commodityclassification at the broad 1-digit (HS1) level. Product groupscan be disaggregated further into lower levels – for examplethe next level of disaggregation is HS2.
12 Measured at the HS2 level.
The analysis bears patterns also evident in
‘revealed comparative advantage’ (RCA),
discussed in more detail in Chapter 3 of this
study. Unsurprisingly, the results suggest that
little IIT occurs in industries where Australia or
both countries have a RCA, including in animal,
vegetables and food products as well as minerals
and fuels.
However, an interesting observation is that IIT is
evident in products for which neither country has a
comparative advantage, particularly intermediate
products such as chemicals, plastics and hides, or
final manufactures, which Indonesia has a RCA,
such as textiles.
However, this evidence of intra-industry trade masks
diversity within production chains – for instance,
while IIT is evident for hides, this reflects the fact
that Australia exports raw hides (GLI of 0.01), but
then imports processed articles of leather (GLI of
0.03). Similarly, within the textiles group, Australia
exports cotton (GLI of 0.02) but imports Indonesian
apparel (GLI 0.01). Strengthening these
relationships as ‘Factory Asia’ moves south will
be a key component of joint competitive advantage
in future.
Chapter 2 explores the possible opportunities
presented by ‘Factory’ Asia in some additional
detail.
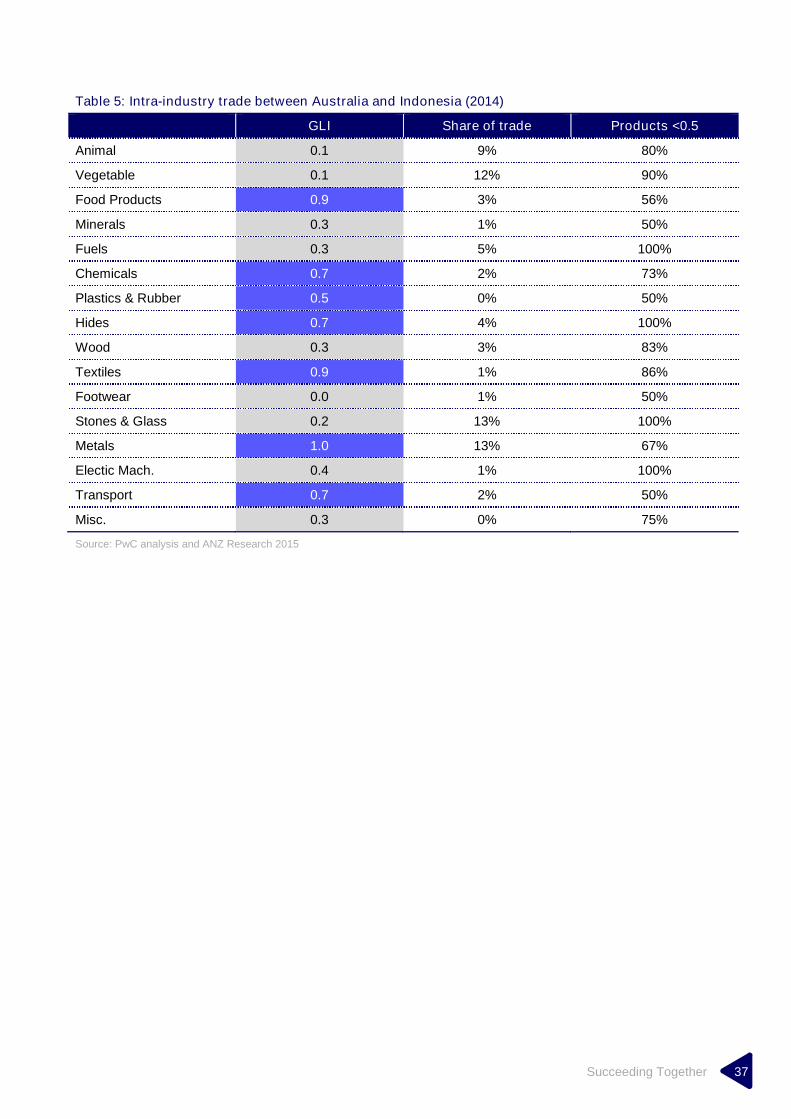
Succeeding Together 37
Table 5: Intra-industry trade between Australia and Indonesia (2014)
GLI Share of trade Products <0.5
Animal 0.1 9% 80%
Vegetable 0.1 12% 90%
Food Products 0.9 3% 56%
Minerals 0.3 1% 50%
Fuels 0.3 5% 100%
Chemicals 0.7 2% 73%
Plastics & Rubber 0.5 0% 50%
Hides 0.7 4% 100%
Wood 0.3 3% 83%
Textiles 0.9 1% 86%
Footwear 0.0 1% 50%
Stones & Glass 0.2 13% 100%
Metals 1.0 13% 67%
Electic Mach. 0.4 1% 100%
Transport 0.7 2% 50%
Misc. 0.3 0% 75%
Source: PwC analysis and ANZ Research 2015

Succeeding Together 38
2.3.4 Recent bilateral and regional trade negotiations
There is potential for a strong corridor relationship to
develop between Australia and Indonesia,
particularly given the conclusion in late 2014 of the
AANZFTA – Australia’s most ambitious trade deal to
date.
The AANZFTA is Australia’s first multi-country FTA,
signalling its willingness to cooperate multilaterally,
and it is also the first time that ASEAN has
embarked on FTA negotiations covering all sectors
including goods, services, investment and
intellectual property simultaneously. This makes it
the most comprehensive trade agreement that the
ASEAN has ever negotiated.
‘Global and regional value chains are having a
major impact on Southeast Asian economies.
They are spurring growth and are a key driver of
ASEAN integration. They present an array of
new opportunities for trade and investment. And
because of how value chains work, they present
ideal pathways for collaboration among
economies, including SMEs. Australia and
Indonesia have opportunities to jointly tap into
regional value chains, and can use the ASEAN-
Australia-NZ FTA to do so.’
- H.E. Simon Merrifield, AustralianAmbassador to ASEAN
Indonesia is likely to dominate the AEC that will
come into effect from December 2015. It will
account for over one-third of the ASEAN economic
mass and around one-half of the ASEAN population.
In this regard, it can be expected that the Australia-
Indonesia corridor will become a vitally important
conduit for a range of macro-economic flows that
range from goods, to services, to people and capital.
The IA-CEPA builds on the AANZFTA and covers
tariffs, cooperation, capacity building and
investment. IA-CEPA negotiations commenced in
2012 with the aim to strengthen and expand the
trade, investment and economic cooperation
relationship between Indonesia and Australia.
Negotiations have stalled since 2013. However, this
report finds it is in both countries’ interests to
reinvigorate those negotiations.

03The importance of
comparative advantages

Australia and Indonesia have historically had a
comparative advantage in producing animal,
vegetable and food products as well as minerals
and fuels. Analysis shows that Australia’s
strongest comparative advantage is in minerals
(iron ore) followed by animal products (beef and
mutton), while Indonesia’s strongest comparative
advantage is in footwear followed by vegetable
products (palm oil).
Examination of Indonesia’s projected
comparative advantage suggests that it will
gradually move up the value-added chain in the
primary industry sectors and embed itself in
regional and global production chains due to its
generous demographic dividend (i.e. Indonesia’s
total working age population is expected to be
close to 175 million people by 2050). In
particular, Indonesia is expected to climb up the
value chain in most primary industry sectors
through the economic reforms launched recently
by President Joko Widodo that will focus on
infrastructure, maritime highways and the
development of dedicated industrial zones.
If the Widodo structural reforms are successful,
Indonesia may achieve significant advancement
in industrial sectors such as agro-industrial
production for export and domestic products and
consumer products and production equipment
amongst several others. The concentration of the
Indonesian industry in the textile and
clothing/apparel industries will see Indonesia
continue to have a comparative and competitive
advantage in this sector.
Australia’s projected comparative advantage is
less straightforward largely due to its widely
fluctuating currency in recent decades. The
currency fluctuations have historically meant that
Australian export growth has been strongest in
those sectors where export demand has been
price-insensitive. This has largely been aligned
with Chinese demand for Australian commodities
(energy and agricultural) during its
industrialisation.
The Australian dollar weakened significantly from
2012-15, helping improve the competitiveness
for Australian manufacturing (although the sector
is still recovering). The compound annual growth
rates (CAGRs) in new export sectors are
therefore likely to be slow to build. The most
likely near-term change for Australia will be a
shift within its fuel exports from coal to LNG. By
2018 Australia will rival Qatar as the largest
exporter of LNG in the world.
Both Indonesia’s and Australia’s comparative
advantage has been relatively stagnant over the
past decade. However this pattern is expected to
change for both economies given less reliance
on natural resources exports in coming years
and decades. The AANZFTA will broaden
Australia’s export base and capitalise on
Australia’s proximity to the fast-growing markets
of Asia including Indonesia, with complementary
opportunities arising from their respective
comparative advantages.
Without concerted action, comparative
advantage will slowly evolve and whilst more
specialised manufacturing is likely to emerge in
both economies, the joint comparative advantage
between Australia and Indonesia may remain
concentrated in the sectors highlighted above.

Succeeding Together 41
3.1 Exploring comparative advantage
The concept of comparative advantage suggests
that the gains from trade are greatest when an
economy specialises in the production of goods or
services aligned to its economic endowments (i.e.
labour, capital and technology). The RCA index
extends this concept to identify the sectors in which
a joint comparative advantage between two
economies is located. The RCA index is calculated
as the ratio of a country’s share of the product in the
country’s total exports to the share of world exports
of the product in total world exports. A country is
said to have a RCA if the value of the index exceeds
one and a revealed competitive disadvantage if the
index’s value is below one.
Identifying the areas of specialisation that an
economy should occupy is crucial from a
development and allocative efficiency perspective.
Economies are generally unable to successfully
transition from low-income to middle-income and
eventually high-income without correctly positioning
themselves to their comparative and competitive
advantages (see Box 3 for a distinction between
comparative and competitive advantage).
For a developed, high-income economy, the
efficient allocation of resources within an economy
is generally guided by its comparative advantages.
An economy’s allocative efficiency, gains from trade
and productivity are highest when resources are
dedicated to those areas of production and export
where a comparative advantage is present.
Figure 21 shows the RCA for both Australia and
Indonesia. The figure shows that both countries
have a RCA in the lower-value added space and in
primary commodity products in particular. The figure
also shows that comparative advantage has been
largely unchanged for both economies over the
past decade.
Box 3: Comparative versus competitiveadvantage
Comparative advantage is part of competitiveadvantage, but competitive advantage is not partof comparative advantage. The relationship in thissense is asymmetric.
A country – or company or individual for thatmatter – is said to have a comparative advantagewhen it can produce goods more efficiently (or ata lower opportunity cost) than its competitors.
Competitive advantage is a broader term thatincorporates comparative advantage but is ageneral extension to include any advantage thatone country or competitor may have over another.This would include access to raw materials, lowerlabour costs, productivity differentials, and thequality and quantity of infrastructure, transport andlogistics networks. For example, China and SaudiArabia are both efficient refiners of diesel.However, as Saudi Arabia has ready access to oil,whereas China generally needs to import it, it canbe concluded that Saudi Arabia would have acomparative advantage over China in theproduction of diesel.

Succeeding Together 42
Figure 21: Revealed comparative advantage in 2013/14 and in 2005
2013/14 Australia Indonesia 2005 Australia Indonesia
Animal 3.7 0.9 Animal 4.1 1.3
Vegetable 1.4 3.4 Vegetable 1.7 2.6
Food Products 1.1 1.0 Food Products 1.9 0.9
Minerals 14.1 2.8 Minerals 13.3 3.3
Fuels 2.4 1.8 Fuels 2.0 2.0
Chemicals 0.5 0.5 Chemicals 0.8 0.4
Plastics & Rubber 0.2 1.4 Plastics & Rubber 0.2 1.2
Hides 0.4 0.6 Hides 1.1 0.6
Wood 0.6 2.2 Wood 0.6 2.6
Textiles 0.2 1.9 Textiles 0.6 1.8
Footwear 0.0 3.8 Footwear 0.1 2.4
Stones & Glass 2.5 0.5 Stones & Glass 1.9 0.6
Metals 0.8 0.7 Metals 1.4 0.7
Electic Mach. 0.1 0.4 Electic Mach. 0.2 0.6
Transport 0.2 0.3 Transport 0.4 0.1
Misc 0.4 0.4 Misc 0.4 0.6
Source: RAPBN 2015, IISD and ANZ Research 2015
Comparative advantage can be examined further by
considering advantage at any point in time (‘static’
comparative advantage) and advantage over time
(‘dynamic’ comparative advantage). Whereas
industrialising economies have tended to exhibit a
‘dynamic’ comparative advantage over time, primary
producing and commodity economies tend to have a
more ‘static’ comparative advantage. The sections
below explore the static and dynamic comparative
advantages of Australia and Indonesia.
3.1.1 Static comparativeadvantage
Australia and Indonesia have historically had a
comparative advantage in producing animal,
vegetable and food products as well as minerals
and fuels (Figure 21). Both economies have a
comparative advantage primarily concentrated in the
agricultural and resources sector with some
evidence of a comparative advantage in simply
transformed manufactured (STM) goods.
Table 6 shows that Indonesia has a comparative
advantage in the Plastics, Rubber and Wood
sectors and some STM goods such as Textiles and
Footwear. Its strongest comparative advantage is in
Footwear followed by Vegetable (palm oil).
Australia’s strongest comparative advantage is in
Minerals (iron ore) followed by the Animal (beef and
mutton) sectors.

Succeeding Together 43
Table 6: Export growth (%) – RCA in 2014 and RCA in 2005
2014 Australia Indonesia 2005 Australia Indonesia
Animal 5.00 1.71 Animal 6.70 4.90
Vegetable 5.79 10.57 Vegetable 11.11 16.71
Food Products 1.84 2.85 Food Products 1.52 10.83
Minerals 31.51 5.14 Minerals 19.91 13.24
Fuels 25.87 31.65 Fuels 10.00 10.99
Chemicals 4.70 4.80 Chemicals 3.58 11.70
Plastics & Rubber 0.44 6.13 Plastics & Rubber 2.77 11.07
Hides 0.50 0.34 Hides 4.67 7.73
Wood 0.95 4.91 Wood 3.86 2.76
Textiles 2.18 7.15 Textiles 4.18 6.44
Footwear 0.03 2.81 Footwear 4.59 14.12
Stones & Glass 6.06 1.73 Stones & Glass 10.88 8.17
Metals 5.09 4.36 Metals 5.04 7.49
Electic Mach. 3.36 9.83 Electic Mach. 4.11 1.35
Transport 1.88 2.59 Transport 1.49 20.53
Misc 4.80 3.43 Misc 2.96 5.40
Source: RAPBN 2015, IISD and ANZ Research 2015
Table 6 further shows the export growth rates in the
sectors where a comparative advantage has been
revealed. It indicates that export performance has
generally aligned with the RCA as economic theory
suggests for Australia, but less clearly so for
Indonesia. Additionally:
Australia has enjoyed extraordinarily strong
growth in the Minerals sector over the past
decade (i.e. nearly 20 per cent annually). This is
the sector in which Australia has the largest
comparative advantage.
Australia has also enjoyed strong growth in the
Fuels (coal) sector of 10 per cent over the
past decade.
Strong growth has also been recorded in the
Animal and Vegetable sectors for which Australia
has a RCA.
Interestingly, Indonesia has enjoyed the fastest
growth in the Transport sector. CAGRs of over 20
per cent growth here is unusual in that this is not a
sector in which a comparative advantage has been
revealed. In fact, quite the opposite, Indonesia has a
comparative disadvantage in this sector.13
In other
sectors, export performance aligns with comparative
advantage. Additionally:
Indonesia has enjoyed strong growth of around
15 per cent in both the Footwear and Vegetable
sectors.
Double-digit export growth has also been
revealed in the Minerals and Fuel sectors, again
comparative advantage sectors.
Export growth in the STM space – Wood and
Textiles has been modest but not spectacular.
13 Although growth in this sector does not align with RCA, it isimportant to note that growth in sectors may have occurredfor other reasons; such as subsidisation based on non-economic or political imperatives. It is outside of the scope ofthis study to explore these other reasons in depth.
Succeeding Together 44
3.1.2 Dynamic comparativeadvantage
Analysis of comparative advantage in Asia has
shown that it is dynamic and that it evolves over
time. For example, Asian nations have consistently
cascaded up value chains in the 60 year period of
Asian modernisation and industrialisation that
commenced with Japan in the 1950s. This created
the economic space for less developed economies
like Indonesia to commence cascading up value
chains, thereby pushing out their production
possibility frontiers.
Possible enablers of dynamic comparative
advantage changes for both Australia and Indonesia
include:
The AEC – In December 2015 the members of
ASEAN will form the AEC. It can be expected
that the AEC will become a key enabler of
dynamic comparative advantage through the
deepening of global value chains and the
formation of industrial clusters that ASEAN is
likely to encourage. This segmentation will allow
global supply chains, enabled by multinational
corporations, to extend through ASEAN.
The role of manufacturing in dynamic
comparative advantage – Indonesia’s young
and sizable population can push the economy as
a key manufacturing centre over the coming
decades. Low-value added exports currently
dominate the manufactured shipments out of
Indonesia. The share of low value-added exports
has however declined in the last decade,
suggesting less reliance on cheap labour and
natural resources (that are abundant within
Indonesia). Labour and resource-intensive
production account for the majority of
manufactured exports despite this decline.
FDI is already enabling this change – In 2015
FDI flows into ASEAN surpassed FDI into China
for the first time. Analysis shows that ASEAN will
emerge as the new ‘Factory Asia’ in the coming
decades where Indonesia will play an
increasingly important role due to the size and
growth of its labour force. Indonesia has the
largest projected increase in its working age
population of the ASEAN economies (rising by
50 million people by 2050). Indonesia’s total
working age population is expected to be close
to 175 million people by 2050.
Succeeding Together 45
3.2 Projected comparative advantages
The sections below continue and extend the
concept of dynamic comparative advantage by
anticipating how the Indonesian and Australian
economies will progress in the coming decades. In
particular, these sections identify the industries that
are most likely to thrive in each economy. The
identification of these sectors can encourage both
economies to cooperate and mutually benefit from
their competitive advantages.
3.2.1 Indonesia
It is expected that Indonesia will move up the value-
added chain in the primary industry sectors as well
as embedding itself in regional and global
production chains because of its large and growing
labour force. Indonesia is expected to climb up the
value chain in most primary industry sectors through
the economic reforms launched by President Joko
Widodo that will focus on infrastructure, maritime
tollways and the development of dedicated industrial
zones. These reforms form a longer-term
industrialisation and modernisation strategy that will
provide clarity to foreign multinational enterprises.
However, this long-term strategy should not be at
the expense of more flexible shorter term projects
and plans.
It can therefore be expected that Indonesia will
develop industries serving and supporting regional
productions chains (for which Indonesia will initially
supply raw materials). If the longer-term structural
reforms are successful, Indonesia should advance
into industrial sectors such as:
Agri-industrial production for export and domestic
markets.
Consumer products and production equipment.
Using the textile sector as a launching pad for
simply and elaborately transformed
manufacturing.
Given the size of the domestic population and
likely demand for vehicles, Indonesia is also
expected to emerge as a key player in the
regional automobile sector (production, design,
assembly) in coming decades.
The high concentration of Indonesian industry in the
textile and clothing/apparel industries will see
Indonesia continue to have a comparative and
competitive advantage in this sector.
3.2.2 Australia
Australia’s projected comparative advantage is less
straightforward largely due to its widely fluctuating
currency in recent decades. From 1985 to 1995 the
AUD-USD generally declined from around
USD0.80c to USD75c before declining to less than
USD0.50c by 2001. The currency then more than
doubled, appreciating above parity with the USD
through 2010-2011.
These moves in the currency have largely meant
that Australian export growth has been strongest in
those sectors where export demand has been price-
insensitive. This has largely been aligned with
Chinese demand for Australian commodities
(energy, mineral ores and agricultural) during
China’s own period of industrialisation.
The Australian Dollar weakened significantly from
2012-15, leading to a return of competitiveness for
Australian manufacturing. CAGR in new export
sectors is therefore likely to be slow to build with
many Australian manufacturing and goods
producing sectors previously damaged due to the
strong Australian dollar over the China boom years.
However, given the low base, high levels of CAGR
in newly competitive sectors can be expected to
reveal themselves in coming years.
Additionally, the lower dollar will revitalise a number
of Australian service sectors with relatively strong
comparative advantages. These likely include
Financial Services, Health and Education.
The most likely near-term change will be a rotation
from Australia’s Fuel exports which have primarily
been coal to date to LNG. Australia’s LNG export
volumes will rise rapidly over the next few years as
the extra capacity created by the LNG investment

Succeeding Together 46
boom arrives. By 2018, Australia will rival Qatar as
the largest exporter of LNG in the world. The long-
term global outlook for LNG is strong and Asia is
expected to emerge as a major source of demand,
particularly as demand for clean energy rises.
Australia’s engagement with Asia is likely to become
more diverse with Indonesia emerging as a large
manufacturing centre in ASEAN, a more
competitively priced currency and LNG supply
embedding Australia into regional production and
supply chains. The AEC in particular may be a key
enabler of dynamic changes in comparative
advantage for Australia.
3.2.3 Joint competitiveadvantage
Both Indonesia’s and Australia’s comparative
advantage has been relatively stagnant over the
past decade. However this pattern is expected to
change for both economies given less reliance on
natural resources exports in coming years and
decades. The AANZFTA will broaden Australia’s
export base and capitalise on Australia’s proximity
to the fast-growing markets of Asia including
Indonesia, with complementary opportunities arising
from their respective comparative advantages.
The geographical location of global energy demand
is likely to move closer to both Australia and
Indonesia as ‘Factory Asia’ moves south into the
ASEAN region and towards Indonesia in particular.
It is likely that industrial structures within both
Australia and Indonesia are unlikely to change
significantly over the medium-to-long run with
improved connectivity between the two economies.
‘Factory Asia’ can be expected to remain energy
hungry and is likely to source that energy from
within its own region.
The drift south in manufacturing and production
platforms from the more expensive north-Asian
economies will benefit Indonesia’s younger, cheaper
and demographically endowed labour force.
Additionally, this shift of capital flows towards
‘Factory Asia’ will coincide with an urbanisation of
Indonesia’s population. It can be expected that this
will result in a rise in aggregate income and that a
genuine consuming class will rapidly emerge. A
larger Indonesian middle class will present
opportunities for Australian small- medium-sized
businesses to engage in joint ventures with their
Indonesian counterparts.
In fact, SMEs are an integral part of both Indonesian
and Australian economies. In Indonesia they
account for more than 95 per cent of total firms and
are responsible for more than 90 per cent of total
employment, while in Australia they account for
approximately 96 per cent of all businesses and 63
per cent of total employment.14
With greater trade
liberalisation it can be expected that the importance
of SMEs in each economy will continue to grow.
Specifically, increases in productivity and output
growth could raise the average wage paid by SMEs
in Indonesia. This can help to alleviate youth
unemployment in Indonesia (20 per cent, or four
times larger compared to the overall unemployment
rate) and thereby add to its already sizeable labour
force.15
This can create further opportunities for
businesses in both countries to eventually
collaborate with their counterparts.
Although comparative advantage will slowly evolve
and more specialised manufacturing is likely to
emerge in both economies, the joint comparative
advantages between Australia and Indonesia may
remain concentrated in the sectors highlighted
above – specifically, the Animal, Vegetable, Food,
Mineral and Fuel sectors. The likely long-standing
comparative advantage that can be expected for
Australia and Indonesia strongly suggests that these
joint-comparative advantages should be capitalised
on for both economies to benefit.
14 RAND Corporation. (2015). Reforming Indonesia's PoliciesTowards Small and Medium Sized Enterprises. Retrievedfromhttp://www.rand.org/labor/centers/rapid/projects/reforming-indonesia-smes.html; and ASMEA. (2015). SME Facts.Retrieved from http://www.asmea.org.au/SMEFacts
15 International Monetary Fund. (2015, September 1). Poisedfor Take-off—Unleashing Indonesia’s Economic Potential.Retrieved fromhttps://www.imf.org/external/np/speeches/2015/090115.htm

Succeeding Together 47
04Steps to progress the
relationship

Succeeding Together 48
Efforts are required to grasp the multi-trillion-
dollar opportunity for both Australia and
Indonesia, to avoid the adoption of protectionist
policies that can undermine long-term economic
growth. Greater bilateral cooperation and
stronger economic integration is essential to
improve current trade and investment patterns.
Additionally, economic cooperation is required to
develop cross-border integrated industries and
value chains in both goods and services that use
the comparative advantages of each economy to
supply domestic and third markets. These can be
achieved by a variety of broad steps that can
help both economies tap into larger regional and
global value chains.
These broad steps can be categorised as:
– Step 1: Favour a new approach to tradeand investment.
– Step 2: Create a better business andinvestment environment – simplifyregulatory procedures and removeduplications.
– Step 3: Improve infrastructure – identifyand develop ‘gateway’ infrastructure projects,cooperate to expand the scope ofinfrastructure initiatives and leverage broaderregional efforts.
– Step 4: Build skills and capacityrequirements – reconcile required skills witheducation providers, upskill the existinglabour forces, collaborate with internationalcounterparts, exchange knowledge and easevisa requirements for skilled workers.
– Step 5: Empower business – share marketinformation, cooperate to approach thirdmarkets together and collaborate to developnew products for domestic or third markets.

Succeeding Together 49
Australia and Indonesia have been aware of
creating potential in joint competitive advantage in
red meat for several years. In 2013 the two
countries announced the Indonesia-Australia
Partnership on Food Security in the Red Meat and
Cattle Sector to encourage and promote joint
investments within the red meat and cattle sector.
Members of the Partnership are selected from
industry and government in both Australia and
Indonesia and meet regularly to discuss how their
AUD60m in funding should be used towards their
aim of improving the productivity, sustainability and
competitiveness of the red meat and cattle sector in
Australia and Indonesia. In simple terms, the
Partnership facilitates closer dialogue between
Australia and Indonesia to underpin food security
and strengthen their relationship as part of an
internationally competitive supply chain by
encouraging:16
Breeding activities to be centralised in Australia.
Fattening of imported Australian livestock to
occur in Indonesia.
Establishment and use of abattoirs in Indonesia
for distribution of red meat to the rest of Asia.
This is one example of joint competitive advantages
in practice. This report explores similar opportunities
in other sectors. For example, there is an
opportunity of complementarity between Australia
and Indonesia in the wool industry. Australia is the
global leader in producing premium wool, however it
is not being used in Indonesia at a time when its
Fashion/Textile sector is gaining momentum in
global markets. Additionally, Indonesia has
established market relationships in third markets like
the USA and Japan but its supply is limited to the
spring and summer seasons. Australia, however,
has primary knowledge of the winter season. These
two competitive advantages could potentially be
combined to approach third markets together.
16 Department of Agriculture and Water Resources (2015.August 21). Indonesia-Australia Partnership on Food SecurityCommunique 21 August 2015. Retrieved fromhttp://www.agriculture.gov.au/about/media-centre/communiques/indonesia-australia-food-security
‘A big area of opportunity is building an
investment footprint by both countries in each
other's economy. We both have a need and
opportunity to penetrate more deeply into global
value chains’
- Mr Kym Hewitt, Senior TradeCommissioner, Australian
Embassy, Jakarta
Efforts are required in both Australia and Indonesia
to avoid the adoption of protectionist policies that
can undermine long-term economic growth. Greater
bilateral cooperation and stronger economic
integration is essential to improve current trade and
investment patterns. Additionally, economic
cooperation is required to develop cross-border
integrated industries and value chains in both goods
and services that use the comparative advantages
of each economy to supply domestic and third
markets. These can be achieved by a variety of
steps that can help both economies tap into larger
regional and global value chains.
The broad aim of these steps for both countries
should be to reduce costs and increase efficiency in
trading goods and or services with the other party.
In general, these steps can be categorised as:
Step 1: Favour a new approach to trade and
investment.
Step 2: Create a better business and investment
environment.
Step 3: Improve infrastructure.
Step 4: Build skills and capacity requirements.
Step 5: Empower business.
This study has tested the likelihood of these broad
steps succeeding by applying them to four case
studies (see Appendix A). The two case studies that
focus on Indonesian industries that have a
comparative advantage over Australia are:
Textiles/Fashion.
Food-Processing.

Succeeding Together 50
Similarly, two case studies focus on Australian
industries that have a comparative advantage over
Indonesia. These are:
Logistics.
Animal Products.
These four sectors were selected for this study for
several reasons:
Analysis found that Indonesia or Australia has
existing comparative advantages in these
sectors because of their long-term expertise or
experience in developing their respective
sectors.
Existing comparative advantages in these
sectors indicate that there is capacity for both
countries to achieve joint competitive
advantages.
Achieving joint competitive advantages in these
sectors will assist the Australian and Indonesian
economies to subsequently tap into larger
regional and global value chains.
Box 4 provides a brief overview of each industry and
areas of potential collaboration between Australia
and Indonesia.
It is clear that in each of these case studies that
even where one country enjoys a competitive
advantage over the other, the second country will
still be able to play a key role in supporting the
success of the other.
Maximising the comparative advantage of Australia
and Indonesia cannot be achieved through steps
that require government efforts alone. Businesses in
both economies should embrace policy reforms
where applicable and re-orient their thinking to
facilitate mutually advantageous trade opportunities.
Each step is briefly explored in the following
sections.
Box 4: Industry snapshots
Textiles/Fashion
The industry: Indonesia has a comparativeadvantage in the Textiles/Fashion sector. Theindustry contributed approximately 8 per centof the manufacturing value added in 2012while exports of textiles/fashion in 2014 wereapproximately USD12.4bn.
Areas for potential collaboration: Theindustry has been undergoing a slowdown overthe past 15 years. Increased collaboration withAustralia can reverse this trend. Areas forpotential collaboration include investing torevitalise the industry, technical cooperation toupgrade the industry’s technologicalcapabilities and jointly identifying expansionopportunities within Australia.
Food-Processing
The industry: Indonesia has a comparativeadvantage in the Food-Processing industry. In2012 the industry contributed 20 per cent oftotal output of the manufacturing sector.
Areas for potential collaboration: Theindustry lacks the application of advancedtechnology and its main export destinations aredeveloped countries with strict standards thatcan act as barriers to entry. The industry canimprove through importing Australian food-processing technology. Australia can shareinformation about export markets withIndonesian firms to expand their marketknowledge.
Livestock Logistics
The industry: Australia has a comparativeadvantage in the Livestock Logistics industry.The value of Australia’s live animal exportsincreased by almost 54 per cent between 2013and 2014 and most of this trade has beenchannelled through two ports located in thenorth of the country.
Areas for potential collaboration: Livestocktrade with Indonesia is important for cattlefarmers in northern Australia as well as for thelogistics and transportation firms thatspecialise in the industry. There areopportunities for Indonesian companies toinvest in ports infrastructure in Australia to helpcustomise bilateral operations. The twoeconomies can collaborate to improve time-to-market for goods through the development ofIndonesian ports to better target mutualinterests in Europe.

Succeeding Together 51
Animal Products
The industry: Australia has a comparativeadvantage in the Animal Products industry.Cattle and calve meat and wool represent thelargest animal product sectors in Australia,followed by milk, sheep and lamb meat. In2014 the total value of Australia’s animalproducts exports was AUD40.5 billion and 6.9per cent higher relative to the previous year.
Areas for potential collaboration: In regardsto wool, there is an opportunity for rawAustralian wool to be processed in Indonesiafor export to third markets. For livestockgenetics, Australia can offer its knowledge onlivestock management and husbandry toimprove the productivity of local andIndonesian stock. Australia and Indonesia canalso establish one or more meat processingplants in northern Australia to improve foodsecurity, generate employment and encourageskills transfers between workers.
Note: Refer to Appendix A for full case studies
Succeeding Together 52
4.1 Step 1: Favour a new approach to trade andinvestment
Both governments have recognised the importance
of accelerating cooperation in key sectors of
interest. The Indonesia Australia Partnership on
Food Security in the Red Meat and Cattle Sector is
a strong example of how the nations are working to
create stronger business partnerships that could
result in competitive advantages in third markets.
Deeper business ties will build trust in the
relationship and provide greater ballast in times of
differences. It is recommended that both
governments explore opportunities for applying
similar creative approaches to explore opportunities
in those sectors with the greatest potential for
shared competitive advantage.
New approaches to cooperation should include
policy-makers seeking the input of multiple
stakeholders from both economies that can inform
policy dialogue through their expertise. These
stakeholders can include businesses, industry or
peak body representatives that are familiar with the
commercial environment and academics that can
assist with research or provide support studies.
New approaches to cooperation should also
encourage meetings between officials from relevant
ministries/agencies from both economies on a more
frequent basis. The purpose of these meetings will
be to identify and pursue opportunities to better
align commercial potential into regional and global
value chains.
4.2 Step 2: Create a better business and investmentenvironment
Regulation is particularly costly for businesses that
operate in global markets. These businesses rely on
the efficiency of the domestic regulatory and
administrative setting to ensure that their
competitiveness is not harmed. Regulations that are
overly-prescriptive can lead to direct costs (i.e. time
and money to ensure that paperwork complies with
regulations) as well as indirect costs (i.e. less time
or budget to focus on innovation).
The costs of doing business should be minimised to
encourage business efficiency and to attract
investors to establish new operations. Both
Australian and Indonesian businesses can benefit
by a simpler regulatory environment to ensure
productivity and facilitate opportunities for trade.
The AANZFTA and the IA-CEPA negotiations
should be used to identify specific regulations that
restrict or inhibit the potential for joint commercial
collaboration.
Implementing trade-enabling measures can lead to
various benefits for both economies, such as:17
17 Refer to the following link for a more comprehensive list and
Export competitiveness. Local firms can be
more competitive in international markets
through a reduction in trade costs and lead
times.
Private sector development and FDI. New jobs
and providing local producers and consumers
with greater choice and better products can be
achieved via lower trade costs and entry barriers
to attract foreign direct investors.
Market integration. Economies can more easily
integrate regionally when trade costs fall. Trade
facilitation can benefit every party along the
value chain (domestic or foreign) within or
outside a preferential trade agreement (PTA),
which can sometimes result in trade diversion.
Economic growth and employment. Trade
facilitation can stimulate growth and employment
via greater investment in transport and trade-
related infrastructure.
supporting information: http://www3.weforum.org/docs/WEF_GlobalEnablingTrade _Report_2014.pdf
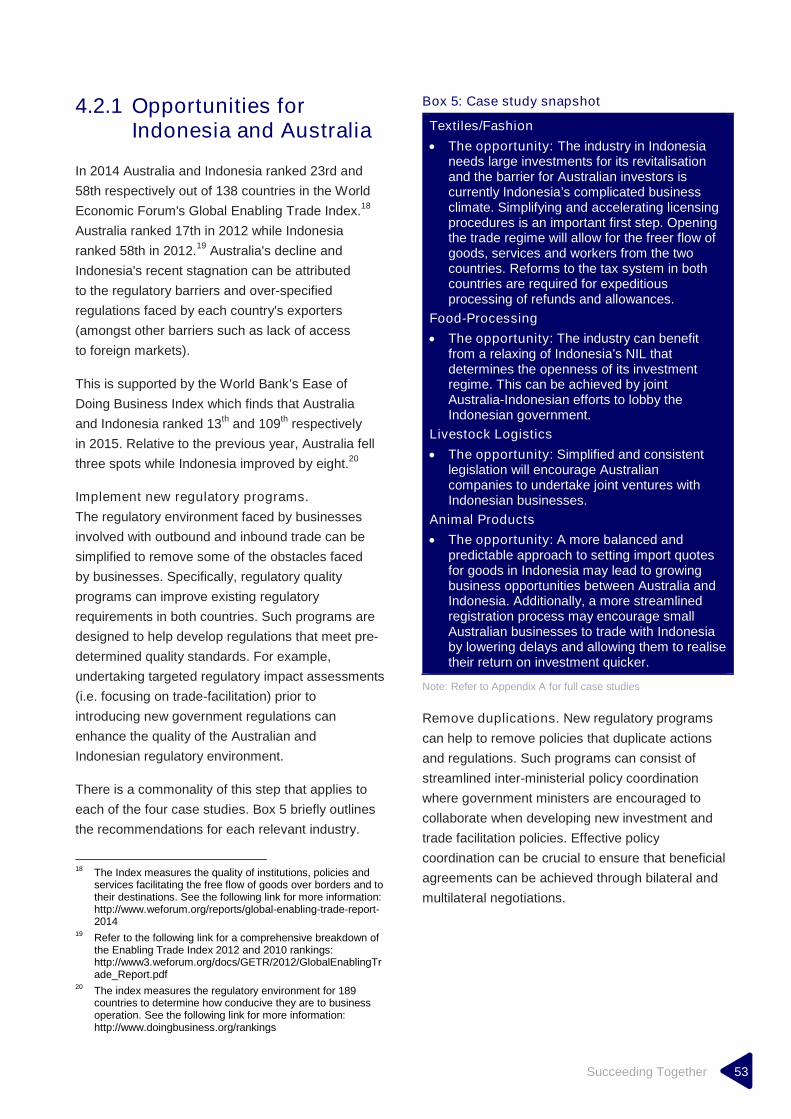
Succeeding Together 53
4.2.1 Opportunities forIndonesia and Australia
In 2014 Australia and Indonesia ranked 23rd and
58th respectively out of 138 countries in the World
Economic Forum's Global Enabling Trade Index.18
Australia ranked 17th in 2012 while Indonesia
ranked 58th in 2012.19
Australia's decline and
Indonesia's recent stagnation can be attributed
to the regulatory barriers and over-specified
regulations faced by each country's exporters
(amongst other barriers such as lack of access
to foreign markets).
This is supported by the World Bank’s Ease of
Doing Business Index which finds that Australia
and Indonesia ranked 13th
and 109th
respectively
in 2015. Relative to the previous year, Australia fell
three spots while Indonesia improved by eight.20
Implement new regulatory programs.
The regulatory environment faced by businesses
involved with outbound and inbound trade can be
simplified to remove some of the obstacles faced
by businesses. Specifically, regulatory quality
programs can improve existing regulatory
requirements in both countries. Such programs are
designed to help develop regulations that meet pre-
determined quality standards. For example,
undertaking targeted regulatory impact assessments
(i.e. focusing on trade-facilitation) prior to
introducing new government regulations can
enhance the quality of the Australian and
Indonesian regulatory environment.
There is a commonality of this step that applies to
each of the four case studies. Box 5 briefly outlines
the recommendations for each relevant industry.
18 The Index measures the quality of institutions, policies andservices facilitating the free flow of goods over borders and totheir destinations. See the following link for more information:http://www.weforum.org/reports/global-enabling-trade-report-2014
19 Refer to the following link for a comprehensive breakdown ofthe Enabling Trade Index 2012 and 2010 rankings:http://www3.weforum.org/docs/GETR/2012/GlobalEnablingTrade_Report.pdf
20 The index measures the regulatory environment for 189countries to determine how conducive they are to businessoperation. See the following link for more information:http://www.doingbusiness.org/rankings
Box 5: Case study snapshot
Textiles/Fashion
The opportunity: The industry in Indonesianeeds large investments for its revitalisationand the barrier for Australian investors iscurrently Indonesia’s complicated businessclimate. Simplifying and accelerating licensingprocedures is an important first step. Openingthe trade regime will allow for the freer flow ofgoods, services and workers from the twocountries. Reforms to the tax system in bothcountries are required for expeditiousprocessing of refunds and allowances.
Food-Processing
The opportunity: The industry can benefitfrom a relaxing of Indonesia’s NIL thatdetermines the openness of its investmentregime. This can be achieved by jointAustralia-Indonesian efforts to lobby theIndonesian government.
Livestock Logistics
The opportunity: Simplified and consistentlegislation will encourage Australiancompanies to undertake joint ventures withIndonesian businesses.
Animal Products
The opportunity: A more balanced andpredictable approach to setting import quotesfor goods in Indonesia may lead to growingbusiness opportunities between Australia andIndonesia. Additionally, a more streamlinedregistration process may encourage smallAustralian businesses to trade with Indonesiaby lowering delays and allowing them to realisetheir return on investment quicker.
Note: Refer to Appendix A for full case studies
Remove duplications. New regulatory programs
can help to remove policies that duplicate actions
and regulations. Such programs can consist of
streamlined inter-ministerial policy coordination
where government ministers are encouraged to
collaborate when developing new investment and
trade facilitation policies. Effective policy
coordination can be crucial to ensure that beneficial
agreements can be achieved through bilateral and
multilateral negotiations.

Succeeding Together 54
Simplify regulatory procedures. New regulatory
programs can facilitate goods and services trade by
simplifying procedures. For example, Australia's
recent Customs Amendment Act 2015 removes
various time-consuming procedures for
importing/exporting businesses that achieve 'trusted
trader' status. The Act is a trade-facilitation measure
and aims to harmonise international trade
procedures to help with the movement of goods.
Businesses that are accredited as 'trusted traders'
can benefit through streamlined reporting
requirements and being provided a single point of
reference when communicating with the Australian
Department of Immigration and Border Protection.
Businesses can largely avoid licensing and
transiting formalities (and the costs involved to
address these procedures) that involve detailed and
technical administrative processes and lengthy
documentation requirements. The Indonesian
government could establish a similar program to
encourage trade facilitation. In addition, Australia
and Indonesia could cooperate to strengthen the
status of trading Australian/Indonesian businesses
in their respective economies.

Succeeding Together 55
4.3 Step 3: Improve infrastructure
Transport infrastructure (i.e. railways, roads,
seaports, airports, etc.) and the services provided by
the logistics sector are crucial for moving goods and
services to and from exporting and importing
countries. Good infrastructure and efficient logistics
sectors can support trade in both Australia and
Indonesia.
‘In practical terms for developing pioneer areas
in eastern Indonesia, Australia being a hub of
world class expertise and professional services,
actually offers critical development value added
before these regions are actually ready to
absorb the bulk capital investments from the
major infrastructure capital providers.’
- Bernardus Djonoputro, President ofthe Indonesian Association of Urban
and Regional Planners and Non-executive Director of PT
Jababeka Infrastruktur
Improving infrastructure connectivity between
eastern Indonesia and northern Australia can
increase economic cooperation between the two
economies. Enhancements to these areas can
further reduce trading costs and permit greater
opportunities to reveal joint competitive advantages
to enter third markets.
High-quality infrastructure for sea, land and air
transport can lead to higher volumes of trade more
broadly.21
Transport infrastructure, in particular, can
impact trade activities due to its influence over an
economy’s comparative advantage. For example,
the Australian Animal Products industry is sensitive
to the quality of infrastructure and therefore access
to good infrastructure can strengthen and maintain
its comparative advantage in the sector.
21 See the following link for more information on the studies andtheir findings in relation to infrastructure and the logisticssector and their impact on trade facilitation:https://www.wto.org/english/res_e/booksp_e/anrep_e/wtr04_2b_e.pdf
4.3.1 Opportunities forIndonesia and Australia
Identify and develop ‘gateway’ infrastructure
projects. The Australian and Indonesian
governments can support their importing/exporting
businesses by identifying then developing large
'gateway' infrastructure projects. The purpose of
these projects can be to improve both economies'
ability to access each other's markets as well as
international markets.
The Indonesian Government can look to Australia's
2015 White Paper on Developing Northern Australia
as an example of Australia's recognition and support
of gateway infrastructure projects to facilitate trade.
The White Paper acknowledges for example that the
redevelopment of the Port of Darwin is to capitalise
on Darwin's potential to be a gateway into Asia.
Indonesia can aim to support similar gateway
projects by improving its sea transport and inter-
island trading facilities. The need for better quality
infrastructure was highlighted by President Joko
Widodo in April 2015 upon sealing a 'maritime
partnership' with China that will see joint projects
between Chinese and Indonesian firms on ports,
highways, and railroads for example. Australia
should be encouraged by Indonesia's willingness to
cooperate with regional countries to improve its own
infrastructure. Additionally, Australia can propose a
similar partnership with Indonesia to jointly develop
gateway infrastructure projects that can facilitate the
trade of goods between both economies.
Cooperate to expand scope of infrastructure
initiatives. A proposed partnership on gateway
projects should go beyond the objectives of existing
Australia-Indonesia infrastructure initiatives (i.e. the
2008-2015 Indonesia Infrastructure Initiative Facility,
the 2005-2014 Eastern Indonesia National Road
Improvement Project). Such initiatives aim to
improve infrastructure facilities within Indonesia;
these can be regarded as a good first step to a
broader partnership that seeks to develop targeted
infrastructure projects in both countries to facilitate
trade. Additionally, improved engagement between

Succeeding Together 56
Australia and Indonesia can enhance regional
productivity within the ASEAN region by providing a
more open and predictable environment for
businesses in the region.
In relation to the case studies, this step mainly
involves efforts by both countries towards the
Logistics and Animal Products industries. Box 6
briefly outlines the recommendations for each
relevant industry.
Box 6: Case study snapshot
Livestock Logistics
The opportunity: The Logistics industry canbenefit through possible Australian/Indonesiangovernment or industry investment in portsinfrastructure in both countries to help tailorbilateral trade to specific exports (i.e. livestockexports require greater refrigeration facilities atports in both countries)
Animal products
The opportunity: The Animal Productsindustry can benefit from the establishment ofkey facilities in targeted locations. Forexample, raw Australian wool can be exportedto Indonesia upon establishment of an earlystage wool-processing facility in Indonesia inorder to jointly approach third markets.
Note: Refer to Appendix A for full case studies
Leverage broader regional efforts. Indonesia will
aim to benefit from the recently established AEC
Blueprint that is due for implementation by the end
of 2015. The Blueprint aims to accelerate the
implementation of physical connectivity (i.e.
infrastructure) through cooperation initiatives and
investment projects across ASEAN. As outlined in
Chapter 2, Indonesia has an important role to play
as a leader in the AEC given it will account for over
one-third of the ASEAN economic mass and
approximately half of ASEAN's population. There is
an opportunity here for Australia to leverage its
relationship with Indonesia to seek greater
involvement in the implementation and investment
of infrastructure projects. Australia’s strengths in
public-private partnerships and financial services in
infrastructure are particular areas where skills can
be shared. In particular, Australia can seek
involvement in specific infrastructure projects in
Indonesia that facilitate trade to the rest of the
ASEAN region.

Succeeding Together 57
4.4 Step 4: Build skills and capacity requirements
An educated labour force does not necessarily
mean that graduates are entering the labour market
with the right skills. It is important for Australia and
Indonesia to develop and re-align the skillsets of its
existing and future labour force to leverage the
opportunities created by greater trade facilitation
between the two economies. Appropriate skillsets
are particularly necessary for those entering the
labour force who may be involved with the
production or provision of goods/services in the near
future in which each economy has a comparative
advantage in.
Australian firms can transfer their knowledge and
expertise to their Indonesian counterparts in order to
achieve joint competitive advantages. Implicit in this
knowledge transfer is suitably targeting Indonesia’s
expanding capacity and growing labour force (i.e.
Indonesia’s total working age population is expected
to be close to 175 million by 2050). Efforts are
required by both economies to ensure that any
knowledge transfer is directed appropriately to
Indonesia’s generous demographic dividend.
Developing partnerships in the areas of VET can
assist in this process. Partnerships can be
developed directly between industry and training
centres or via collaboration with training institutions
of both countries and their respective industries.
‘We do not just need more Indonesianists in
Australia, we need more Australianists in
Indonesia’
- Andre Omer Siregar, IndonesianConsul in Darwin
Additionally, Australians need to learn from
Indonesians about ‘how to do business in Asia/in an
Asian culture’. If Australia is move into the Asian
Century then its people have significant knowledge
to gain in this space. Perhaps just through being
there is the only way to truly learn.
4.4.1 Opportunities forIndonesia and Australia
Reconcile required skills with education
providers. A review of the status of vocational and
tertiary education providers can be undertaken in
both countries to determine whether training
providers can better align the skills needed by
industries that have comparative advantages. These
reviews can be undertaken by joint industry-
government partnerships to identify current and
future skills gaps in each country. The partnerships
can further:
Design strategies to address these gaps.
Increase the supply of quality training institutions
that provide relevant training in strategic sectors.
Upskill existing labour force. Upgrading the skills
of the existing labour force in both economies may
be required to address the skills shortages of those
already in the labour market. Australia and
Indonesia can focus on improving the quality of
training by potentially incentivising quality
improvements from vocational and tertiary training
providers.
This step applies to all case studies, albeit through
different methods. Box 7 briefly outlines the
recommendations for each relevant industry.
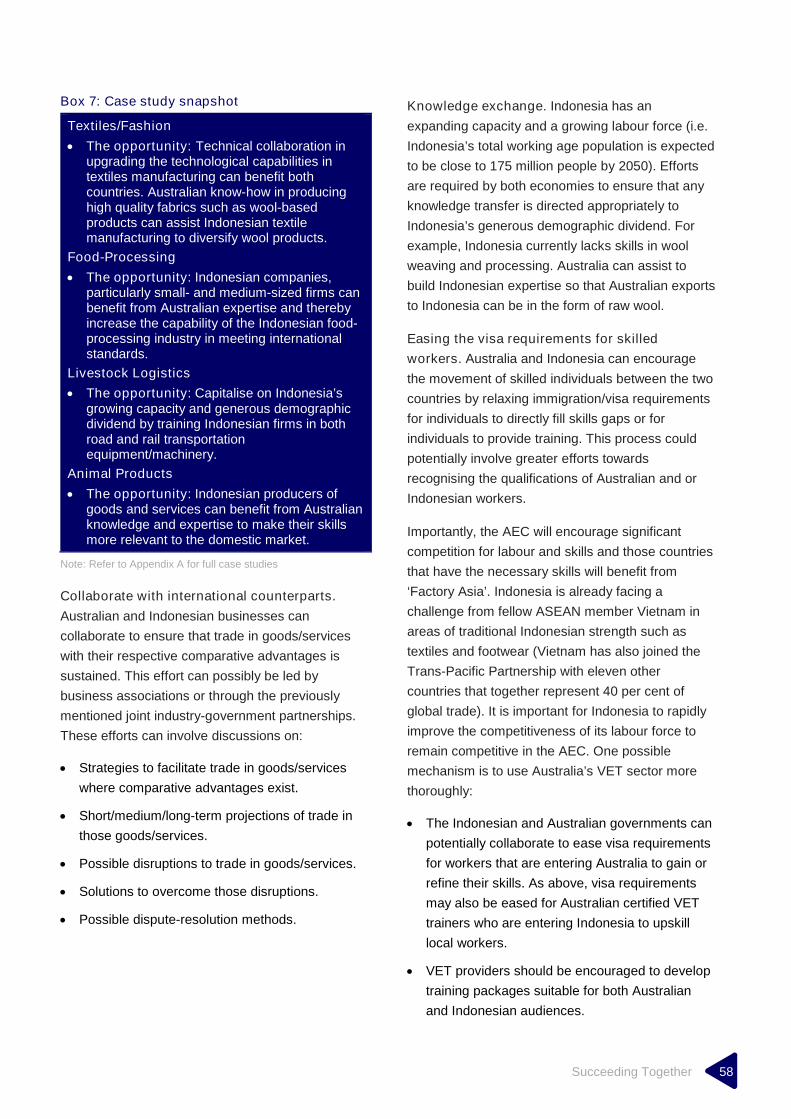
Succeeding Together 58
Box 7: Case study snapshot
Textiles/Fashion
The opportunity: Technical collaboration inupgrading the technological capabilities intextiles manufacturing can benefit bothcountries. Australian know-how in producinghigh quality fabrics such as wool-basedproducts can assist Indonesian textilemanufacturing to diversify wool products.
Food-Processing
The opportunity: Indonesian companies,particularly small- and medium-sized firms canbenefit from Australian expertise and therebyincrease the capability of the Indonesian food-processing industry in meeting internationalstandards.
Livestock Logistics
The opportunity: Capitalise on Indonesia’sgrowing capacity and generous demographicdividend by training Indonesian firms in bothroad and rail transportationequipment/machinery.
Animal Products
The opportunity: Indonesian producers ofgoods and services can benefit from Australianknowledge and expertise to make their skillsmore relevant to the domestic market.
Note: Refer to Appendix A for full case studies
Collaborate with international counterparts.
Australian and Indonesian businesses can
collaborate to ensure that trade in goods/services
with their respective comparative advantages is
sustained. This effort can possibly be led by
business associations or through the previously
mentioned joint industry-government partnerships.
These efforts can involve discussions on:
Strategies to facilitate trade in goods/services
where comparative advantages exist.
Short/medium/long-term projections of trade in
those goods/services.
Possible disruptions to trade in goods/services.
Solutions to overcome those disruptions.
Possible dispute-resolution methods.
Knowledge exchange. Indonesia has an
expanding capacity and a growing labour force (i.e.
Indonesia’s total working age population is expected
to be close to 175 million people by 2050). Efforts
are required by both economies to ensure that any
knowledge transfer is directed appropriately to
Indonesia’s generous demographic dividend. For
example, Indonesia currently lacks skills in wool
weaving and processing. Australia can assist to
build Indonesian expertise so that Australian exports
to Indonesia can be in the form of raw wool.
Easing the visa requirements for skilled
workers. Australia and Indonesia can encourage
the movement of skilled individuals between the two
countries by relaxing immigration/visa requirements
for individuals to directly fill skills gaps or for
individuals to provide training. This process could
potentially involve greater efforts towards
recognising the qualifications of Australian and or
Indonesian workers.
Importantly, the AEC will encourage significant
competition for labour and skills and those countries
that have the necessary skills will benefit from
‘Factory Asia’. Indonesia is already facing a
challenge from fellow ASEAN member Vietnam in
areas of traditional Indonesian strength such as
textiles and footwear (Vietnam has also joined the
Trans-Pacific Partnership with eleven other
countries that together represent 40 per cent of
global trade). It is important for Indonesia to rapidly
improve the competitiveness of its labour force to
remain competitive in the AEC. One possible
mechanism is to use Australia’s VET sector more
thoroughly:
The Indonesian and Australian governments can
potentially collaborate to ease visa requirements
for workers that are entering Australia to gain or
refine their skills. As above, visa requirements
may also be eased for Australian certified VET
trainers who are entering Indonesia to upskill
local workers.
VET providers should be encouraged to develop
training packages suitable for both Australian
and Indonesian audiences.

Succeeding Together 59
4.5 Step 5: Empower business
Maximising the competitive advantages of Australia
and Indonesia cannot be achieved through steps
that require government efforts alone. Businesses in
both economies should embrace policy reforms
where applicable and re-orient their thinking to
facilitate mutually advantageous trade opportunities.
‘Get Australians going to other places outside
Bali. More familiarity with these locations could
stir new opportunities.’
- Nick Trim, General ManagerOperations, Eastern Pearl
Flour Mills, Makassar
4.5.1 Opportunities forIndonesia and Australia
Share market information. Australian and
Indonesian businesses should be encouraged to
share information on their domestic markets in order
to reduce transaction costs for investments by
Australian/Indonesian producers of goods or
services. Information on domestic markets (i.e. size,
nature of regulation, competitors, growth, etc.) can
be shared directly between businesses or via
business associations that can offer a broader and
possibly more representative view of markets.
Cooperate to approach third markets together.
Australia and Indonesia have strong independent
relationships with their respective trading partners.
As a result both countries have gathered valuable
information on international markets for goods
where they have comparative advantages. Australia
and Indonesia can choose to share this information
in order to gain better access to third markets via
joint ventures.
All industries considered in the case studies can
potentially benefit through the application of this
step. Box 8 briefly outlines the recommendations for
each relevant industry.
Box 8: Case study snapshot
Textiles/Fashion
The opportunity: Australian designers cancollaborate with Indonesian designers to workon designs that suit Australian and widerWestern preferences. Additionally, for marketaccess of new products both parties shouldcollaborate to determine customers’preferences both in Australia and in thirdcountries for export. The AANZFTA will becrucial to securing market access in the region.
Food-Processing
The opportunity: Food-processing businessassociations (and other relevant associations)in both countries should be encouraged tocollaborate. These associations can worktogether to gather necessary information andshare it with food producers in Australia tominimize transaction costs to invest forAustralian producers. Additionally, businessassociations may together lobby theIndonesian government – informing withevidence on the potential benefits – to relaxthe next issued Indonesian NIL.
Livestock Logistics
The opportunity: Businesses in the Logisticsand Animal Products industries in Australia canbenefit through coordinated efforts with theirIndonesian counterparts. Australian logisticscompanies for example can function as thepromoters and executers of projects withIndonesia to approach third markets andfurther facilitate the introduction of productsfrom third markets into Indonesia.
Animal Products
The opportunity: R&D projects could bejointly conducted in the area of livestockgenetics with the aim of boosting profitabilitythroughout cattle, sheep and goat valuechains. Joint projects could be furtherconducted in feeding, finishing and nutritionR&D to increase productivity and profitability ofproducers in both economies.
Note: Refer to Appendix A for full case studies

Succeeding Together 60
Actively encourage liberalisation of bilateral
investment opportunities under IA-CEPA.
Businesses in both economies should embrace
activities and policy reforms to facilitate mutually
advantageous investment opportunities. To support
businesses in this exercise the IA-CEPA Business
Partnership Group recommendations on facilitating
investment access should be progressed and
formalised.
Collaborate to develop new products. Australian
and Indonesian businesses can cooperate to jointly
develop new products for their own domestic
markets or for third markets. Producers can take
advantage of Australian or Indonesian skills for the
manufacturing process and use their shared market
information on consumer preferences to tailor their
products. In addition, Australian and Indonesian
businesses can undertake joint R&D projects to
identify the scope for new products or to improve the
productivity of existing goods/services. There is a
role for organisations such as AIC to stimulate R&D
to identify and capture further opportunities for trade
based on joint comparative advantage.
Collaborate to develop a new generation of
entrepreneurs. Trade based on combining
comparative advantage, creating competitive
advantage and selling into third markets requires a
new way of thinking about trade and the trading
relationship between Australia and Indonesia.
Greater collaboration between both countries’
younger generation could discover innovative ways
to utilise joint comparative advantage.

Succeeding Together 61
Appendices

Succeeding Together 62
Appendix ACase studies
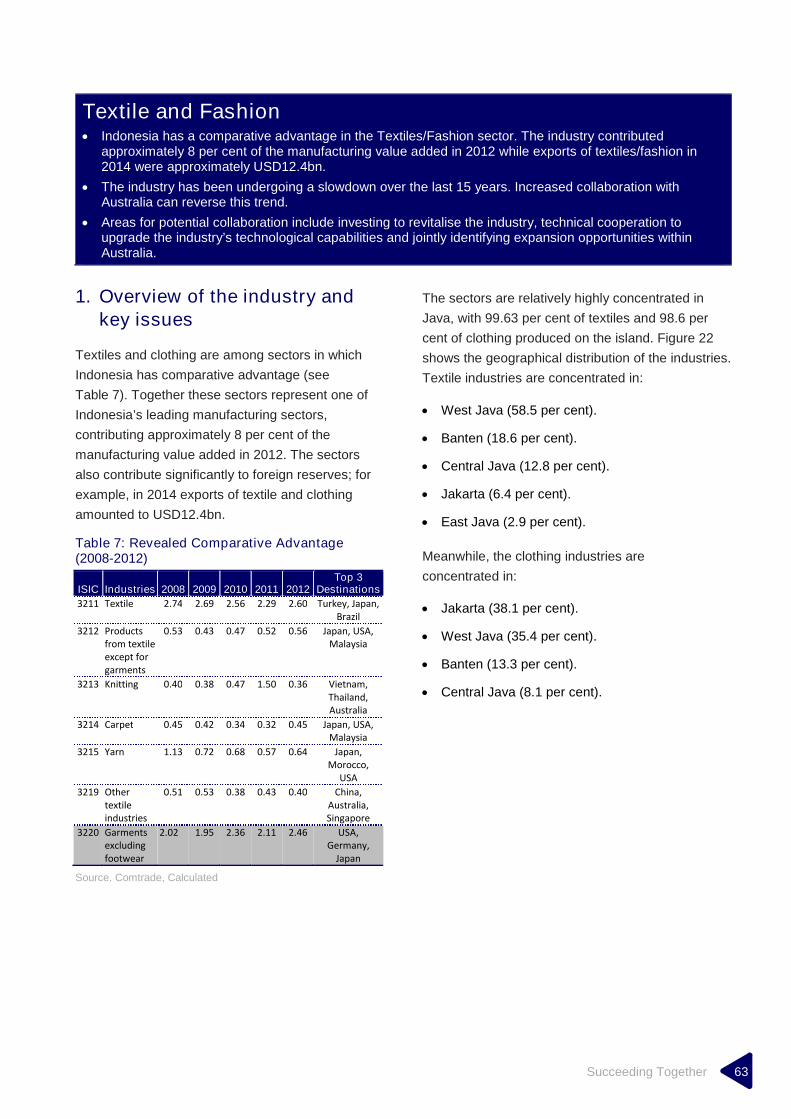
Succeeding Together 63
Textile and Fashion Indonesia has a comparative advantage in the Textiles/Fashion sector. The industry contributed
approximately 8 per cent of the manufacturing value added in 2012 while exports of textiles/fashion in2014 were approximately USD12.4bn.
The industry has been undergoing a slowdown over the last 15 years. Increased collaboration withAustralia can reverse this trend.
Areas for potential collaboration include investing to revitalise the industry, technical cooperation toupgrade the industry’s technological capabilities and jointly identifying expansion opportunities withinAustralia.
1. Overview of the industry andkey issues
Textiles and clothing are among sectors in which
Indonesia has comparative advantage (see
Table 7). Together these sectors represent one of
Indonesia’s leading manufacturing sectors,
contributing approximately 8 per cent of the
manufacturing value added in 2012. The sectors
also contribute significantly to foreign reserves; for
example, in 2014 exports of textile and clothing
amounted to USD12.4bn.
Table 7: Revealed Comparative Advantage(2008-2012)
ISIC Industries 2008 2009 2010 2011 2012Top 3
Destinations
3211 Textile 2.74 2.69 2.56 2.29 2.60 Turkey, Japan,Brazil
3212 Productsfrom textileexcept forgarments
0.53 0.43 0.47 0.52 0.56 Japan, USA,Malaysia
3213 Knitting 0.40 0.38 0.47 1.50 0.36 Vietnam,Thailand,Australia
3214 Carpet 0.45 0.42 0.34 0.32 0.45 Japan, USA,Malaysia
3215 Yarn 1.13 0.72 0.68 0.57 0.64 Japan,Morocco,
USA
3219 Othertextileindustries
0.51 0.53 0.38 0.43 0.40 China,Australia,Singapore
3220 Garmentsexcludingfootwear
2.02 1.95 2.36 2.11 2.46 USA,Germany,
Japan
Source. Comtrade, Calculated
The sectors are relatively highly concentrated in
Java, with 99.63 per cent of textiles and 98.6 per
cent of clothing produced on the island. Figure 22
shows the geographical distribution of the industries.
Textile industries are concentrated in:
West Java (58.5 per cent).
Banten (18.6 per cent).
Central Java (12.8 per cent).
Jakarta (6.4 per cent).
East Java (2.9 per cent).
Meanwhile, the clothing industries are
concentrated in:
Jakarta (38.1 per cent).
West Java (35.4 per cent).
Banten (13.3 per cent).
Central Java (8.1 per cent).

Succeeding Together 64
Figure 22: Textile Industries in Indonesia
Clothing Industries in Indonesia: Geographic Distribution
Exports from these sectors have historically been
among Indonesia’s top-ten leading exports; however
they have undergone a sustained slowdown in the
last 15 years. In 2000, textiles and clothing
contributed 14 per cent of the manufacturing
sector’s value added. By 2012 this figure to 8 per
cent. Furthermore, there was a relative decline in
exports as a percentage of total manufacturing
exports from 32 per cent in 2000 to 17 per cent in
2012 (see Figure 23 and Figure 24).
Figure 23: Exports of textile and clothing vs.manufacturing (USDbn), 1989-2014
Source. Comtrade, calculated.
0
20
40
60
80
US
$b
n
Textile and garments
Manufactures

Succeeding Together 65
Figure 24: Value Added Textile, Clothing andManufacturing, 2000-2012
Source. BPS, Survey of Medium and Large ManufacturingEstablishments, various years, calculated.
The declining share of the textiles and clothing
sectors is due to several factors. First, restrictive
labour market regulations, including several sharp
increases in minimum wages and high severance
pay have been a key factor for the sectors’ decline.
Prior to the 1997 Asian Financial Crisis, the labour
market was conducive to business while labour
unions were well controlled and minimum wages
were set below market rate (Aswicahyono, et al.,
2010). After the 1997 crisis, labour unions became
more demanding and minimum wages increased by
over 90 per cent in the period 1999-2002. The new
labour law, enacted in 2003, had several affects: it
made the labour market more restrictive and
minimum wages increased frequently. For example,
from 2008-2013 minimum wages increased by 8
to 19 per cent annually (Kuncoro, 2013). High
severance pays have also made the risks of
hiring costly.
Restrictive labour market regulations have resulted
in increased unit labour costs (Aswicahyono et al,
2014) while labour productivity has not increased as
quickly (particularly in the unskilled labour intensive
manufacturing sector of textiles and garments). As
an unskilled labour intensive sector, the increase to
minimum wages has led to substantial increases in
costs of production (see Figure 25). Kuncoro (2013)
reports that labour costs represent approximately 13
per cent of total production costs in textiles
manufacturing and 16 per cent of total production
cost in clothing manufacturing.
Figure 25: Skill worker ratio, R&D intensity,foreign ownership and employment
Second, the textile and clothing sector is
constrained by high energy costs. The textile
industry is an energy intensive industry, particularly
in Indonesia where a large proportion of textiles and
garments machinery were purchased in the 1990s
and therefore largely energy inefficient. The cost of
energy in Indonesia (USD10.5cent/kwh) is relatively
higher compared to competing countries, such as
Vietnam (USD7cent/kwh), Pakistan
(USD6.6cent/kwh) and Bangladesh
(USD3cent/kwh). The reliability of electricity supply
is another challenge for producers, particularly those
that are based outside Java.
0
1,000,000
2,000,000
3,000,000
2000 2001 2002 2003 2004 2005 2006 2007 2008 2009 2010 2011 2012
Value Added (in Billion Rupiah)
Textile Manufacturing
214,383
21,927
743,808
44,851
2,879,926
120,795
0
1,000,000
2,000,000
3,000,000
2000 2001 2002 2003 2004 2005 2006 2007 2008 2009 2010 2011 2012
Value Added (in Billion Rupiah)
Garment Manufacturing
214,383
8,899
743,808
30,987104,305
2,879,926
4.182
3.161
6.169
Skilled Worker Ratio(in %)
Textile Garment Manufacturing
0.020
0.029
0.049
R&D intensity(in %)
Textile Garment Manufacturing
20.1
35.5
26.5
Foreign ownership(in %)
Textile Garment Manufacturing
565.9 579.4
4535.2
Employment(by th person)
Textile Garment Manufacturing

Succeeding Together 66
Third, textile industries have lacked technological
advancement. Based on a 2012 survey of
manufacturing firms, there were more than 2,000
medium and large textile companies and more than
1,869 medium and large clothing companies where
R&D intensity was relatively low. The average for
companies in these sectors was approximately
0.023 per cent compared to 0.05 per cent average
for the manufacturing sector overall (see Figure 25).
Fourth, the textile manufacturing sector is not
adaptive to the dynamics of its downstream
industries. Textile manufacturers rarely collaborate
closely with designers. Therefore the manufacturers
are unlikely to be aware of changes in customers’
preferences and current trends. Dina Midiani from
the Association of Designers and Fashion
Entrepreneurs suggested that: ‘A partnership
between designers and textile companies will be
beneficial for both textile manufacturers and clothing
industries’.
Fifth, frequent changes to trade regulations create
uncertainty around acquiring imported inputs. The
textiles and clothing sectors rely significantly on
imported inputs – 32.2 per cent for textiles and
51.56 per cent for clothing. In addition, intra industry
trade in textile and clothing is also quite significant.
Sectors that rely heavily on imports and engage in
intra industry trade activities do not benefit from an
unpredictable trade environment. Harry Darsono
from Harry Darsono Couture remarked that: ‘The
supply of raw materials remains a key challenge for
the industry’.
Sixth, a value added tax (VAT) of 10 per cent on
cotton is a constraint. This tax commenced in July
2014 and has led to higher capital costs for
businesses (that are required to pay the VAT when
sourcing their inputs) and increased prices for retail
goods for consumers.
Seventh, the requirement to use the Indonesian
Rupiah in all transactions within domestic markets
has resulted in higher transaction costs as the
Rupiah has fluctuated and hedging costs have
increased.
The challenge for textiles and clothing
manufacturers in the near future is the likelihood of
Indonesia graduating from its low-income country
status, which will make it ineligible for the General
System of Preference (GSP). Currently, Indonesia
exports its textiles and garments to the EU and US
under the GSP preference. The EU and US’
engagement of Indonesia’s competition in the region
(i.e. Vietnam) poses another threat to Indonesian
textile and garment exports. Ade Sudrajat from the
Indonesian Textile Association noted that ‘the
phasing out of the GSP scheme leaves Indonesia's
textile and garments manufactures vulnerable, an
FTA with the largest buyers is needed’.
Another challenge for Indonesia’s clothing industries
is to determine how to tap into department store
chains (Wall Mart in the US, Target in both the US
and Australia and Grace Bros and Myer in Australia)
and move up the ladder, from unskilled intensive to
skilled (designer) based clothing manufacturing.
Mass production clothing will remain important for
Indonesia in terms of labour absorption. Indonesia
has significant potential for designer based clothing
manufacturing with many well-known designers and
unique local materials (i.e. hand-made batik and
hand-woven materials). However the main
constraint for designer clothing is the availability of
raw materials (particular cotton-based, silk or wool
fabrics). In addition, many local textile companies
produce fabrics in large quantities, which are not
suitable for designer clothing. In response, some
textile manufacturers have developed production
lines for low quantity fabrics (however the majority of
textile manufacturers are bulk producers). As a
result, Indonesian designers have often resorted to
imported materials available in small quantities.

Succeeding Together 67
2. Potential Collaboration
The decline of the textiles and clothing sectors is
due to problems internal to Indonesia. Policy
reforms are required to improve the business
environment for the industries. The current
government, through its reform packages is
expected to address the impediments to growth of
these sectors. The most crucial factors are labour
regulations, energy costs, ease of doing business
and an open trade policy. Potential collaboration
between Indonesia and Australia can be facilitated
by addressing these major issues promptly.
There are a number of potential areas for enhanced
collaboration with Australia. First, invest in
Indonesia. The textiles and clothing industries in
Indonesia need large investments for their
revitalisation. Kuncoro (2013) reported that 82 per
cent of weaving machines, 84 per cent of knitting
machines, 93 per cent of finishing machines and 78
per cent of garment machines in Indonesia were
technologically outdated. A large amount of
investment is needed to advance processing
technologies in order to revitalise the industries,
create higher quality fabrics and improve the value
added performance of the textiles industry.
Second, collaboration for product
diversification. Technical collaboration in
upgrading the technological capabilities in textiles
manufacturing can also benefit both countries.
Australian know how in producing high quality
fabrics such as wool-based products can assist
Indonesian textile manufacturing to diversify wool
products. However, a key aspect of collaboration is
market access. Dr Nasir Tamara of Sritex perfectly
noted that ‘the biggest challenge is to find markets
to maintain growth’.
Collaboration on the supply side, however, should to
be combined with the ability to tap into new markets
(countries and products). Indonesia will likely
continue to be a lower cost textile and clothing
manufacturing nation compared to Australia, it
would therefore be beneficial to have production
bases in Indonesia to export the products to
Australia. Previous studies also show that strategic
partnerships with foreign investors can contribute to
the advancement of industries. For example, the
development and progress of the Indonesian textile
industry in the 1980s was driven by the relocation of
textile multinational corporations (Thee, 2009 in
Vickers, 2012). Suyanto, et al. (2012) notes that FDI
in the garment industry has led to increased total
productivity and technological change. However,
FDI in the industry has declined in recent times due
to an unfavourable business climate (see
Figure 25).
Third, expanding in Australia. Indonesian clothing
industries need to shift from low unskilled
manufacturing (with high labour costs) to higher
value-added clothing production. This can be
achieved by producing Original Design
Manufacturing (ODM) for Australian shopping
outlets or Original Brand Manufacturing (OBM) for
Australian brands. On the supply side, Indonesia
remains a potential source for producing ODM or
OBM garments because of its’ large pool of talented
designers and its unique fabrics. There is potential
for Australia and Indonesia to collaborate in this
market segment targeted to Australian and other
Western markets. Australian designers can
collaborate with Indonesian designers to work on
designs that suit Australian and wider Western
preferences.

Succeeding Together 68
3. Potential Barriers andSuggested Solutions
First, invest in Indonesia. The barrier in attracting
Australian investors to invest in Indonesia is
Indonesia’s complex and evolving business
environment. This different environment can have
the effect of making Australian investors
uncomfortable and thereby hesitant to invest in
Indonesia. The Indonesian deregulation package
announced in September 2015 represents a start in
the right direction. The package includes:
The simplification and acceleration of licensing
procedures.
An open trade regime allowing for the freer flow
of goods, services and workers between the two
countries.
Reforms to the tax system (including the
expeditious processing of refunds and
allowances).
Second, collaboration for product
diversification. Collaboration for product
diversification requires market access for inputs and
outputs. The free flow of inputs requires a more
open trade regime. To gain market access for new
products, both parties need to work on customer
preferences both in Australia and in third countries
to export.
Third, expanding in the Australian market. There
are several obstacles to entering into the Australian
market. These include competition from China and
other non-ASEAN low cost producers. Obtaining
access to Australian department stores will be
important, as well as, taking advantage of better
market access provided through the AANZFTA.

Succeeding Together 69
Food-Processing Indonesia has a comparative advantage in the Food-Processing industry. In 2012 the industry contributed
20 per cent of total output of the manufacturing sector.
The industry lacks the application of advanced technology and its main export destinations are developedcountries with strict standards that can act as barriers to entry.
The industry can improve through importing Australian food-processing technology. Australia can furtherchoose to share information about export markets with Indonesian firms to expand their marketknowledge (and in turn gain access to Indonesia’s large domestic market).
1. Overview of the industry andkey issues
The food-processing industry contributes
significantly to the overall output of the Indonesian
manufacturing sector. The first chart in Figure 26
shows that in 2012, the food-processing industry’s
output was approximately 20 per cent of total output
of the manufacturing sector. However since the mid-
2000s, food-processing output growth has fallen
behind total manufacturing output growth (see first
chart in Figure 26).
The trend for labour productivity in the food-
processing industry shows a somewhat different
picture in terms of the industry’s performance (see
the third chart in Figure 26). The growth pattern in
labour productivity for the food-processing industry
closely matches that experience of the
manufacturing sector during the 2000s. A slowdown
in value added growth over time combined with a
sustained increase in labour productivity during the
2000s implies a substitution of labour for capital and
a sign of increased mechanization in the industry.
Greater labour productivity in food-processing may
have come about through increased foreign
investment. Another trend is the significant increase
in the share of foreign ownership from
approximately 10 to 15 per cent in the first half of
the 2000s to more than 20 per cent in the latter half
of the 2000s (see the second chart in Figure 26).
One of the main characteristics of the food-
processing sector in Indonesia is its high
dependency on imported raw materials. For
example, according to the Chairman of the
Indonesia Association of Food and Beverage
(Gabungan Pengusaha Makanan dan Minuman
Seluruh Indonesia, GAPMMI), Indonesia is
importing 100 per cent of its flour and raw sugar
needs and around 70 per cent of its soy and milk
needs for the food industry.22
Domestic production
has not been able to fill the gap due to several
factors, including rising demand for key food inputs.
Critical dependency on imported raw materials has
made the Indonesian food-processing industry
vulnerable to exchange rate movements, particularly
when the markets are mostly domestically oriented.
Figure 26: Performance trends of processedfoods industries
22 From the article on Liputan 6 news website, published onMarch 18, 2015.http://bisnis.liputan6.com/read/2193282/rupiah-loyo-pengusaha-makanan-dan-minuman-mulai-evaluasi-harga
0
1,000,000
2,000,000
3,000,000
2000 2001 2002 2003 2004 2005 2006 2007 2008 2009 2010 2011 2012
Value Added (in Billion Rupiah)
Processed Foods Manufacturing
0.0
10.0
20.0
30.0
40.0
2000 2001 2002 2003 2004 2005 2006 2007 2008 2009 2010 2011 2012
Ratio of Foreign Ownership (in %)
Processed Foods Manufacturing

Succeeding Together 70
The major challenge for food-processing is in
relation to adding value (see the first chart in
Figure 26). The Indonesian food-processing industry
is dominated by SMEs using simple technologies
and mostly lack the skilled human resources needed
to support the use of more advanced technology
(however some of larger producers are now utilizing
more sophisticated means of processing). Some
larger industry companies involved in food-
processing have recently adopted advanced
technology, albeit their representation is relatively
small when compared to the total population of
companies undertaking manufacturing in the
industry.23
A lack of application of advanced technology in the
Indonesian food-processing industry is illustrated by
low R&D expenditure of the industry (also termed as
technical intensity) (see Figure 27), which is less
than 1 per cent of the total expenditure in the
industry. This is despite the relatively high extent of
R&D expenditure, as well as, the use of skilled
workers employed in the overall Indonesian
manufacturing sector.
23 Examples of these are such as PT. Sunpack and PT. TioNiaga Jaya Lestari have been aiming to use the latesttechnology to ease the production processes within theindustry. The food processing machinery, though, are stillmainly imported from the countries like PRC and Germany(Converging Knowledge Pte. Ltd., 2012).
Another constraint to adding value in the food-
processing sector relates to the sector’s export
destinations, which is currently mostly represented
by developed countries. Standards for food products
required by these countries can sometimes act as
barriers-to-entry replacing traditional tariffs and non-
tariff measures. For example, European Union
regulations requiring dairy products to use
mechanically milked processes initially led to a
greater than 60 per cent reduction in imports from
developing countries.
Another main challenge for Indonesia’s food-
processing industry is in its distribution. Refrigerated
logistical technology is the key issue here mainly for
traditional distributors. The use of cold storage
facilities in Indonesia is still limited to only raw or
some processed marine products. On this issue,
Indonesia shares similar conditions with other
developing countries. Most food loss in ASEAN and
Africa occurs between production and retailing
processes and not at stores or at the consumption
stage (Save Food Congress, Dusseldorf, 2011).24
Estimated food losses in the Indonesian domestic
market are 28 per cent (FAO, 2014) due to poor
product quality, cold chain management and
storage, and post-harvest handling, packaging and
logistics (Van der Laan, 2015). Temperature
fluctuations during storage and distribution are
common especially in hot and humid tropical
countries like Indonesia. This climate could increase
the cost of cold-storage construction. Indonesia
inevitably needs to invest in a comprehensive
logistic system to better handle perishable
commodities and avoid more food loss in the future.
24 As presented by Mr. Naoji Kato from Nichirei Foods Inc. onAPEC Policy Partnership on Food Security in Jakarta,January 25-26, 2013.
0.0
200.0
400.0
600.0
800.0
2000 2001 2002 2003 2004 2005 2006 2007 2008 2009 2010 2011 2012
Labor Productivity (th Value Added / th person)
Processed Foods Manufacturing

Succeeding Together 71
Figure 27: Performance comparison ofprocessed foods industries
Although Australian food products only contributed
to 1.8 per cent of its total exports (World Bank
2014), their role in the Australian economy has been
crucial. Food, Beverage and Tobacco products
represent 24 per cent or the largest value added
proportion in the manufacturing sector,
notwithstanding that the overall manufacturing
sector constitutes only 6.5 per cent of Australia’s
gross value added (Australia Bureau of
Statistics/ABS 2014). The role of food production
in the manufacturing sector of Australia also has
led to increased employment in the sector over
time – from 18.7 per cent of total manufacturing
employment in 2004 to 24 per cent in 2014
(ABS 2014). Dominated by the smallholders local
industries (ABS 2014) and highly concentrated
along eastern seaboard e.g. Victoria, New South
Wales and Queensland, Australia has managed
to become a major global exporter of food
products such as wheat, sugar, barley, beef and
sheep meat, dairy and wine (Australian Trade
Commission, 2013).
Australia has also aimed to capture the growing
number of opportunities in being a major food
supplier to Asia. In doing so, Australia seeks to find
niche markets as being a major provider of more
specialised products such as organic products,
portion-controlled meals, desserts and other tailored
catering solutions for international hotels,
restaurants and the catering industry (Australian
Trade Commission, 2013).The Australian food
manufacturing industry is heavily mechanised and
relies on the world-class technologies in food-
processing to ensure that their food products exhibit
the high standards of food quality. The Australian
Trade Commission in 2013 further noted that
Australia’s food processors excel in applying the
latest food technologies and manufacturing
processes to simple packaging processes to
logistics handling.
Despite its vital position in the Australian economy,
the food-processing sector has faced some
immediate challenges. Andrew White (a
spokesperson for AusVeg) noted in 2013 that
increasing costs of manufacturing including labour,
electricity and freight (that were not followed by
greater Government incentives for processors and
R&D investment) threatened the food industry’s
competitiveness.25
The Australian Government
acknowledges that that innovation is essential for
the industry to be successful in international
competition.26
However limited profit margins and
lack of government assistance for R&D in the sector
have resulted in low levels of R&D investment
(confirmed by ABS figures of food manufacturing
R&D). After experiencing frequent increases in R&D
expenditure from the 2005-06 through to 2010-11,
there was a decline in 2011-2012 despite food
product exports being valued at around USD27
billion in that same year.27
Other challenges include:
regulatory burden through the imposition of higher
standards than those of importing countries; a
declining appetite to enrol in food and food science
tertiary education; and increased competition with
the mining sector – which was the country’s top
exporting sector (World Bank, 2014) – to attract
the needed investment.
25 http://www.abc.net.au/radionational/programs/breakfast/food-processing/4737622
26 http://www.aph.gov.au/About_Parliament/Parliamentary_Departments/Parliamentary_Library/pubs/BriefingBook44p/ProcessedFood
27 http://www.australianmanufacturing.com.au/7821/board-members-of-food-industry-precinct-announced
5.46
6.17
Skilled Worker Ratio(in %)
Processed Foods Manufacturing
0.03
0.05
Technical intensity(in %)
Processed Foods Manufacturing
24.2
34.9
Foreign ownershipRatio (in %)
Processed Foods Manufacturing
743.7
4334.7
Employment(by th person)
Processed Foods Manufacturing
Succeeding Together 72
2. Potential collaboration
The overview of the processed food industry in
Indonesia and Australia indicates the following two
potential areas of collaboration between private
sector/companies in their industries.
First, the use of advanced technology by
Indonesian food-processing firms through
importing or installing Australian food-processing
technology and know-how to Indonesia.
Indonesian companies, particularly SMEs, could
learn from their counterparts in Australia in using
advanced technology for production. There are at
least two elements to this: mechanisation; and the
use of cold-storage technology.
Each of these elements offers considerable merit to
increase the capability of the Indonesian food-
processing industry in meeting rigorous international
standards. For Australian firms, there is an
opportunity to expand their earnings from the
intellectual property rights associated with the
technology and systems developed in Australia.
Second, sharing information about international
export markets with Indonesian firms. The
Indonesian interest lies firmly with increasing
revenue from exporting from the both the
perspective of companies and the nation. Deep
knowledge about export markets is critical for
success in international markets, therefore the
experiences accumulated by Australian food-
processing firms can be valuable for their
Indonesian counterparts.
The major incentive for Australian producers to
share their knowledge base is gaining access to the
large Indonesian domestic market. In this scenario,
Australian producers will have access to the
Indonesian market while Indonesian producers can
increase their exports in the wider regional and
global markets. Potential collaboration between
Australian and Indonesian companies can be
facilitated through direct investment or through the
establishment of Australian food-processing
producers in Indonesia.
3. Potential barriers andsuggested solutions
Increased levels of direct investment by Australian
producers in the Indonesian processed food industry
and possible investment by Indonesian firms into
Australia’s food-processing industry can be the main
stimuli to improve the performance of the food-
processing industries in each economy. However
there are several barriers that can prevent greater
Australian participation in Indonesia.
The first barrier is the openness of the investment
regime in Indonesia, which is governed by its NIL.
The latest NIL was issued in 2014 and is regarded
as relatively more open by some compared to its
previous version. However some aspects of the NIL
remain restrictive. For example, direct foreign
investment in many sectors is still closed for SMEs.
Another barrier is the lack of human capital. Benefits
from FDI generally occur when there is sufficient
domestic absorption capacity. In the case of
Indonesia, there is a lack in the absorption capacity
arising from the lack of supply of skilled workers.
Training locals can be an expensive exercise in
Indonesia and Indonesian training standards may
not always meet those required by multinational
companies. One Australian investment manager
noted that they had to send several staff from
Indonesia to Switzerland for 6 months in order to
raise skills levels to those needed to manage key
technical aspects of the company’s operations.
There are several possible solutions to these
barriers. First, in regards to the lack of
knowledge of investing in Indonesia, the food-
processing business association (and other
relevant associations) from Indonesia and
Australia can collaborate to gather necessary
information and share it with the food producers
in Australia. This is important for minimising
transaction costs and encouraging investment by
Australian producers in Indonesia.

Succeeding Together 73
Second, greater collaboration between business
associations in Indonesia and Australia could
help to relax Indonesia’s investment regime. The
business associations could undertake research and
subsequently present the Indonesian government
with strong evidence to show the benefits to relaxing
Indonesia’s NIL (usually revised every six months).
Collaboration between the business associations of
Indonesia and Australia should encompass
industries that are related to the value-chain of the
food-processing sector. The aim of including these
industries could be to extend the positive impacts
experienced by the food-processing sector through
any collaborative activities.
Third, the provision of in-house training by
companies in Indonesia could improve the stock
of skilled Indonesian workers. Training that is
tailored to the requirements of large companies can
provide workers with valuable skill-sets and can be
less expensive compared to general up-skilling via
training organisations. Another approach to raising
skills within companies could include partnering with
dedicated centres of training expertise within the
sector. This could include working with TAFE
organisations in Australia and/or polytechnics in
Indonesia.
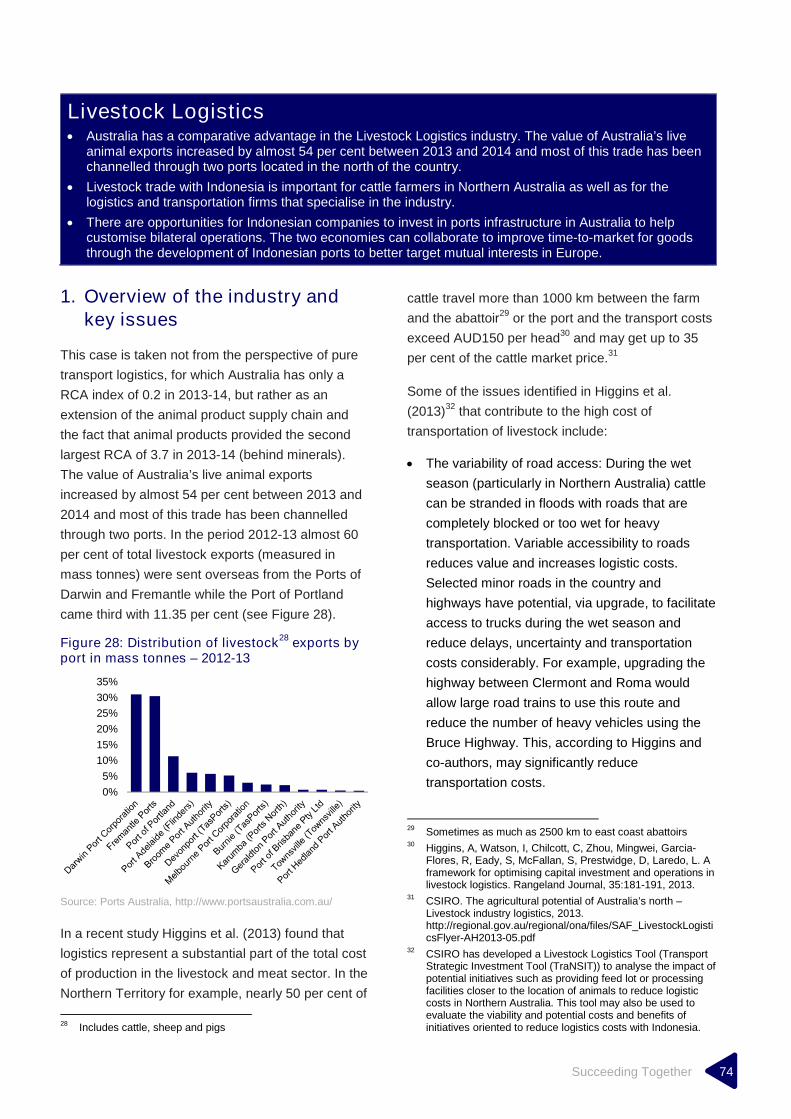
Succeeding Together 74
Livestock Logistics Australia has a comparative advantage in the Livestock Logistics industry. The value of Australia’s live
animal exports increased by almost 54 per cent between 2013 and 2014 and most of this trade has beenchannelled through two ports located in the north of the country.
Livestock trade with Indonesia is important for cattle farmers in Northern Australia as well as for thelogistics and transportation firms that specialise in the industry.
There are opportunities for Indonesian companies to invest in ports infrastructure in Australia to helpcustomise bilateral operations. The two economies can collaborate to improve time-to-market for goodsthrough the development of Indonesian ports to better target mutual interests in Europe.
1. Overview of the industry andkey issues
This case is taken not from the perspective of pure
transport logistics, for which Australia has only a
RCA index of 0.2 in 2013-14, but rather as an
extension of the animal product supply chain and
the fact that animal products provided the second
largest RCA of 3.7 in 2013-14 (behind minerals).
The value of Australia’s live animal exports
increased by almost 54 per cent between 2013 and
2014 and most of this trade has been channelled
through two ports. In the period 2012-13 almost 60
per cent of total livestock exports (measured in
mass tonnes) were sent overseas from the Ports of
Darwin and Fremantle while the Port of Portland
came third with 11.35 per cent (see Figure 28).
Figure 28: Distribution of livestock28
exports byport in mass tonnes – 2012-13
Source: Ports Australia, http://www.portsaustralia.com.au/
In a recent study Higgins et al. (2013) found that
logistics represent a substantial part of the total cost
of production in the livestock and meat sector. In the
Northern Territory for example, nearly 50 per cent of
28 Includes cattle, sheep and pigs
cattle travel more than 1000 km between the farm
and the abattoir29
or the port and the transport costs
exceed AUD150 per head30
and may get up to 35
per cent of the cattle market price.31
Some of the issues identified in Higgins et al.
(2013)32
that contribute to the high cost of
transportation of livestock include:
The variability of road access: During the wet
season (particularly in Northern Australia) cattle
can be stranded in floods with roads that are
completely blocked or too wet for heavy
transportation. Variable accessibility to roads
reduces value and increases logistic costs.
Selected minor roads in the country and
highways have potential, via upgrade, to facilitate
access to trucks during the wet season and
reduce delays, uncertainty and transportation
costs considerably. For example, upgrading the
highway between Clermont and Roma would
allow large road trains to use this route and
reduce the number of heavy vehicles using the
Bruce Highway. This, according to Higgins and
co-authors, may significantly reduce
transportation costs.
29 Sometimes as much as 2500 km to east coast abattoirs30 Higgins, A, Watson, I, Chilcott, C, Zhou, Mingwei, Garcia-
Flores, R, Eady, S, McFallan, S, Prestwidge, D, Laredo, L. Aframework for optimising capital investment and operations inlivestock logistics. Rangeland Journal, 35:181-191, 2013.
31 CSIRO. The agricultural potential of Australia’s north –Livestock industry logistics, 2013.http://regional.gov.au/regional/ona/files/SAF_LivestockLogisticsFlyer-AH2013-05.pdf
32 CSIRO has developed a Livestock Logistics Tool (TransportStrategic Investment Tool (TraNSIT)) to analyse the impact ofpotential initiatives such as providing feed lot or processingfacilities closer to the location of animals to reduce logisticcosts in Northern Australia. This tool may also be used toevaluate the viability and potential costs and benefits ofinitiatives oriented to reduce logistics costs with Indonesia.
0%
5%
10%
15%
20%
25%
30%
35%

Succeeding Together 75
The need for long detours: Suitability of roads for
type 1 and 2 vehicles represents a problem in
some areas due to gradients and sharp turns.
This requires detours that significantly increase
travel distance when compared to the direct
route (up to 300 km in Queensland for example).
Underutilisation of multi-modal transportation:
Livestock logistics heavily rely on road
transportation. For example, in Queensland and
the Northern Territory only 6 per cent of cattle
are delivered to Queensland abattoirs by rail.
Investment in infrastructure that includes hubs
and depots may facilitate multi-modal
transportation. As an example Higgins et al.
(2013) consider the case of the Adelaide to
Darwin rail link, which could be utilised for
movements to Darwin with appropriate
investments in cattle-loading facilities in suitable
locations with depots at Katherine.
Tick infection: Another issue identified by CSIRO
that increases the logistic costs in Australia’s
north is that parts of the country are infected by
ticks such as Queensland, which requires cattle
to be dipped with the consequent increase in
delays and costs.
Livestock trade with Indonesia plays an important
role for Australia. It is not only important for cattle
farmers, but it is also vital for the logistics and
transportation firms that specialise in this industry.
The Federal ban imposed on cattle trade in 2011
demonstrated a degree of vulnerability of this sector
to disruptions to external markets, and in particular
with Indonesia. After the ban was lifted, live exports
doubled the transportation workload, as declared by
truck drivers for an ABC report in 2014.33
Fred Troncone, CEO of Wellard Rural Trade,
considers that the bigger demand for feeder cattle
weighing less than 350 kg comes from Indonesia
and he foresees a boost in the number of live cattle
exports to Indonesia in the future. According to
Mr Troncone, Indonesia’s cattle herd has declined
while beef consumption continues to grow, which
33 ABC media report (2014). http://www.abc.net.au/news/2014-09-09/behind-the-scenes-live-export-preparation/5721584
are welcome news for all the workers involved in the
cattle trade, including truck drivers and logistic
personnel.34
The dependency of the Australian livestock industry
to trade with Indonesia presents particular
challenges for the logistics sector. Goucher (2011)
finds that transport costs of beef cattle from the
Australian farm to the destination port overseas
represents a major component of the total cost to
produce and deliver the product, which is
particularly true in the case of Indonesia. Goucher
compares the transportation cost of delivering beef
cattle from the western Darling Downs in
Queensland to Japan, with the transportation cost of
delivering beef cattle from the Victoria River District
(Northern Territory) to Indonesia. What he finds is
that delivering to Japan represented 13.1 per cent of
the total cost, while delivering to Indonesia
represented 28.6 per cent.
A possible partial explanation to this difference in
costs relies on the nature of the operations with
Indonesia. As suggested by Higgins et al. (2013),
uncertainty in relation to export permits and quotas
makes planning of live exports of cattle very difficult
for producers, which may increase logistics costs.
On the one hand, there is only a short time interval
between the export permit granted and the arrival of
the ship to the port. This imposes great pressure on
the domestic stage of the supply chain to get the
cattle on board the ship in time. On the other hand,
since quotas dictate the supply of live cattle for each
shipment, a quick identification of sources of cattle
of the requested weight to ensure a reliable supply
to the port is very difficult, particularly in moments of
adverse weather conditions. For these reasons,
higher certainty and lead times for orders would
allow better planning of the necessary actions and
logistics to be put in practice to ensure a reliable
supply and to optimise benefits at each stage of the
supply chain.
An interview with a representative of Toll Global
Logistics also noted the problems around getting to
Java due to infrastructure constraints in terms of
34 In declarations to the same ABC media report (2014).
Succeeding Together 76
moving products around the island. Infrastructure
constraints can be particularly problematic the
further away those products need to move from
Java and into other islands in the country.
2. Potential collaboration
Toll Global Logistics have pointed to the
‘opportunities for Indonesian companies to invest in
ports infrastructure in Australia to help customise
the bilateral operations’. They add that Australian
ports are in general not equipped for livestock
exports and there is room for improvement with
respects to meat product logistics (considering the
need for refrigeration for example).
However, there is also potential to improve time-to-
market through the development of Indonesian ports
and the manufacturing sector to target mutual
western interests.35
Efficient ports in Indonesia
would potentially provide new shipping access to the
Indian Ocean, bypassing the Malacca Straits and
improving shipping times to the Indian Ocean Rim
markets (including Africa, India and the Middle East)
and to Europe by many days. This would reduce
costs for exporters and open up access to global
supply chains for businesses in both Australia and
Indonesia.36
Toll Global Logistics has added that
there could also be potential to further strengthen
the developed international logistics capabilities of
the maritime sector of Indonesia by leveraging the
knowledge of the mining logistics sector of Australia.
There are several potential areas for collaboration.
First, Australia can transfer knowledge and
expertise to Indonesia in regards to road and rail
transportation. Second, there are opportunities of
joint ventures between Australian and Indonesian
firms to penetrate third markets together. Toll Global
Logistics mentions a particular joint venture with a
dairy company in Jakarta, which has successfully
combined comparative advantages of the Australian
logistics and Indonesian food-processing. However,
the key for these types of successful joint ventures
35 http://dfat.gov.au/trade/agreements/iacepa/Documents/ia-bpg-position-paper.pdf
36 http://dfat.gov.au/trade/agreements/iacepa/Documents/ia-bpg-position-paper.pdf
in the Australian – Indonesian context is the level of
mutual trust between the partners and how mature
their relationship is. Third, Australian logistic
companies could work as the promoters and
executers of projects with Indonesia to approach
third markets or facilitate the introduction of products
from third markets into Indonesia.
3. Potential barriers andsuggested solutions
The differing regulatory environments in each
economy can be a challenge for Australian or
Indonesian investors who may be uncomfortable
investing in a market that they do not fully
understand. Investor unfamiliarity can further
prevent common ventures into third markets.
Toll Global Logistics noted that to realise benefits
around knowledge transfer, the right investment
environment should be created to motivate
Australian companies to go into joint ventures with
Indonesian partners. Also the legislation
environment should be consistent enough so that
Australian companies are comfortable in making
those investments.
Based on their particular experience Toll Global
Logistics view is that, even though there are big
opportunities for investment in Indonesia, Australian
firms face resistance from internal lobbying and
there is not enough confidence from the investor’s
perspective to take advantage of those opportunities
to grow their business. Furthermore, any strategy to
promote joint venture projects with Indonesia would
need to consider the need for a long-term vision, as
opposed to a quick win, or be applied to current
business relationships that are already mature
enough.

Succeeding Together 77
Animal Products Australia has a comparative advantage in the Animal Products industry. Cattle and calve meat and wool
represent the largest animal product sectors in Australia, followed by milk, sheep and lamb meat. In 2014the total value of Australia’s animal products exports was AUD40.5 billion and 6.9 per cent higher relativeto the previous year.
In regards to wool, there is an opportunity for raw Australian wool to be processed in Indonesia for exportto third markets.
For livestock genetics, Australia can offer its knowledge on livestock management and husbandry toimprove the productivity of local and Indonesian stock.
Australia and Indonesia can establish one or more meat processing plants in Northern Australia toimprove food security, generate employment and encourage skills transfers between workers.
1. Overview of the industry andkey issues
Animal product industries – settingthe scene
Animal products come from sectors in which
Australia has comparative advantage, shown by the
RCA index of 3.7 in 2013-14 (see Figure 21 of the
main report). Cattle & calve meat and wool
represent the largest animal product sectors in
Australia, followed by milk then sheep and
lamb meat.
Despite this comparative advantage, the
contribution of animal products to total agricultural
production in Australia decreased from 52.5 per cent
in 2002-03 to 45 per cent in 2013-14. The fall in the
contribution of animal products to total agricultural
output between 2002-03 and 2013-14 can be
explained by a relative decrease in output share of
two major industries. The first relates to the cattle
and calves industry, whose share fell from 19.7 to
16.8 per cent, while the second is the wool industry,
with a decrease in contribution from 10.2 to 5 per
cent. At the same time the share of cereals for grain
(including wheat and barley) increased from 14.2 to
almost 20 per cent during this period (see
Figure 29).
Figure 29: Industry contribution to agriculturaloutput, 2002-03 to 2013-14
Source: Australian Bureau of Statistics (ABS), 2015, - Value ofAgricultural Commodities Produced, Australia, Catalogue 7503.0,2013-14
Cattle and calve meat: The value of cattle and
calve meat production (see Figure 30) dominates
agricultural commodities (valued at AUD8.54 billion
in 2013-14). Australia is the world's seventh-largest
beef producer, supplying 4 per cent of the world’s
beef.37
In 2013-14, Australia produced
approximately 2.5 million tonnes of beef and veal,
with the largest contribution coming from
Queensland. The direct contribution of beef and live
cattle to GDP is approximately 1 per cent.
The 2013-14 production of meat reached record
highs not achieved since 1978-79, despite the
recent falling trend in its contribution to total
agricultural output shown in Figure 29. The driver
of this increase in production has been the adverse
climatic conditions across most of the eastern
states, registering severe droughts throughout 2013
37 http://www.mla.com.au/About-the-red-meat-industry/Industry-overview/Cattle
0%
5%
10%
15%
20%
25%
2002/03 2013/14

Succeeding Together 78
(particularly in Queensland). The dry conditions
forced farmers to increase the number of cattle
slaughter by 12 per cent from the previous year,
with a reduction in total herd of around 6 per cent.38
As a result, the sector has suffered a marked drop in
prices (as reported by MLA). However, the negative
impact on prices has been mitigated by a strong
demand of meat exports across global markets.
Figure 30: Value of Agricultural CommoditiesProduced, Livestock slaughterings & otherdisposals & livestock products 2013-14
Source: Australian Bureau of Statistics (ABS), 2015, - Value ofAgricultural Commodities Produced, Australia, Catalogue 7503.0,2013-14
Sheep meat and wool: The sheep industry is
organised into the wool sector and sheep meat
sector – worth approximately AUD2.53 and
AUD2.64 billion in 2013-14 respectively (see Figure
30). Sheep and lamb numbers are mainly located in
New South Wales, Victoria and Western Australia
and South Australia.39
Australia is the second-largest wool producer
globally and dominates the world market for all
wools.40
The predominant breed of Australian wool
is Merino and a small sector of the industry
produces ultrafine wool (11.5–15 µm in diameter).
Despite the significant volume of raw wool
production, a representative from the Australian
wool industry has noted the industry does not cover
any early stages of wool-processing. Australia’s
processing sector has shifted to China.
38 Meat and Livestock Australia (MLA). Annual Report, 2013-14.39 Australian Bureau of Statistics (ABS) 2015 – Agricultural
Commodities by State & Territory - Cat. No. 7121.0, 2013-1440 In 2012 China produced 400,000 metric tonnes and Australia
produced 362,100 metric tonnes (see FAO STAT - UnitedNations (2014); USDA NASS (2015))
The future appears to be dominated by both a
combination of the two products: wool and
sheep/lamb meat. The growth in global sheep/lamb
meat demand will continue to encourage producers
towards meat production at the expense of fine wool
production and a substitution towards the growth in
medium wool (19.6–22.9 µm) production at the
expense of fine wool (18.6 to 19.5 µm).41
Animal product exports
In 2014 the total value of Australia’s rural exports
was AUD40.5 billion – 6.9 per cent higher than in
the previous year. However, most of this growth was
driven by a change in commodity prices, which
increased 7.2 per cent between 2013 and 2014. The
only rural industry that registered a growth in both
value and volume of exports during this period was
the meat industry (Figure 31).
Figure 31: Australia’s rural exports growth –2013-14
Source: Department of Foreign Affairs and Trade (DFAT),Composition of Trade Australia, 2014.
As a consequence, the contribution of the meat
industry to total rural exports increased from 22.9
per cent in 2013 to 28.6 per cent in 2014. Within the
meat industry the total value of beef exported in
2014 was AUD6.5 billion, 27.3 per cent higher than
in 2013. Sheep meat and goat meat exports also
increased during this period. Sheep meat reached
a total of AUD2.3 billion and goat meat AUD199
million exports in 2014, with an annual increase of
40.8 per cent and 36.5 per cent, respectively.42
41 http://www.mecardo.com.au/commodities/analysis/global-sheep-flock-report.aspx?GoMobile=0
42 Meat and Livestock Australia (MLA). Annual Report, 2013-14.
0 1,000 2,000 3,000 4,000 5,000 6,000 7,000 8,000 9,000
Eggs
Milk
Wool
Poultry
Pigs
Sheep and lambs
Cattle and calves
$ million
7.5
33.8
-1.2
-8.5
0.3
-0.3
9
-0.5
-8
-3.5
-15
-10
-5
0
5
10
15
20
25
30
35
40
Value
Volume
Total Meat Cereals Wool ‘Other’ rural

Succeeding Together 79
Australia’s meat sales to all main export destinations
rose in 2014 when compared to the previous year.
As shown in Table 8, the most significant growth
was observed in meat exports to the United States,
with an annual increase of 111 per cent, which
positioned the United States at the top of the list of
destinations with 24 per cent of total meat exports
in 2014.
Table 8: Australia’s meat exports43
by selectedmarkets (2013-2014)
CountryA$000(2013) %
A$000(2014) %
Growth2013-2014
%
Japan 1,723,354 18 1,976,005 15 15
UnitedStates
1,488,522 15 3,136,805 24 111
China 1,374,103 14 1,428,553 11 4
MiddleEast
1,076,351 11 1,305,062 10 21
Korea 884,517 9 1,090,028 8 23
Indonesia 520,491 5 896,257 7 72
OtherMarkets
2,651,119 27 3,382,905 26 28
Total 9,718,456 100 13,215,616 100
Source: Department of Foreign Affairs and Trade (DFAT),Australia Merchandise Exports and Imports, 2015.
The participation of other important trade partners in
total meat exports decreased during this period, with
the exception of Indonesia. The share of Indonesia’s
purchases in total Australia’s meat exports rose
from 5 to 7 per cent between 2013 and 2014 (see
Table 8). Indonesia consumes only around 4.3
kilograms of meat per capita per annum (poultry the
largest proportion consumed).44
In comparison,
Vietnam and Australia consume 49.9 kg and 111.5
kg of meat per capita, respectively, with a world
average meat consumption of 41.9 kg per capita.45
Australia is Indonesia’s main supplier of frozen and
chilled meat, live animals and offal.46
Indonesia is
43 Meat exports include the categories of meat and meatpreparation and live animals chiefly for food.
44 Australian Trade Commission. Trade Opportunities withIndonesia, 2014
45 FAO 2013, Current Worldwide Annual Meat Consumption percapita, Livestock and Fish Primary Equivalent, Food andAgriculture Organization of the United Nations, viewed 31stMarch, 2013,
46 Australian Trade Commission. Trade Opportunities withIndonesia, 2014
also Australia’s largest market for live cattle. In
2013, Indonesia’s imports of live cattle accounted
for 53 per cent of total Australia’s exports in this
industry.47
Live animal exports to Indonesia
increased by 85 per cent from AUD302 million in
2013 to AUD560 million in 2014, while meat and
meat preparation exports increased by 54 per cent
from AUD219 million to AUD336 million in the same
period.
However, in 2013 the Indonesian Government
implemented a policy of import quotas that are
adjusted according to fluctuations in the domestic
price of beef.48
Since 2015 the Indonesian policy
has been to issue import permits for Australian
feeder cattle only (which is then fattened in feedlots
in Indonesia). Permits vary significantly from period
to period, as they depend on variations in beef
prices, and in some occasions permits to slaughter-
ready cattle have also been issued. The Indonesian
Government has announced an increase in permits
issued to Australia’s feeder cattle, but details about
the number of permits have not been confirmed yet.
It is expected that the Indonesian demand for
Australian beef will remain strong in the future,
despite the efforts to achieve self-sufficiency.
The high variability and lack of predictability in
import quotas issued by Indonesia affects the export
capacity of Australian producers. A senior manager
of trade engagement (South East Asia) considers
that a more balanced and predictable approach to
setting import quotas for meat and meat products
would lead to growing business opportunities
between Australia and Indonesia. Moreover,
according to this senior manager, a further
streamlined registration process would encourage
smaller business to trade with Indonesia by lowering
delays and allowing them to realise their return on
investment quicker, making the market more
attractive.
47 Australian Trade Commission. Trade Opportunities withIndonesia, 2014
48 Australian Bureau of Agricultural and Resource Economicsand Sciences (ABARES). (2015). Agricultural Commodities:September Quarter 2015. P.90
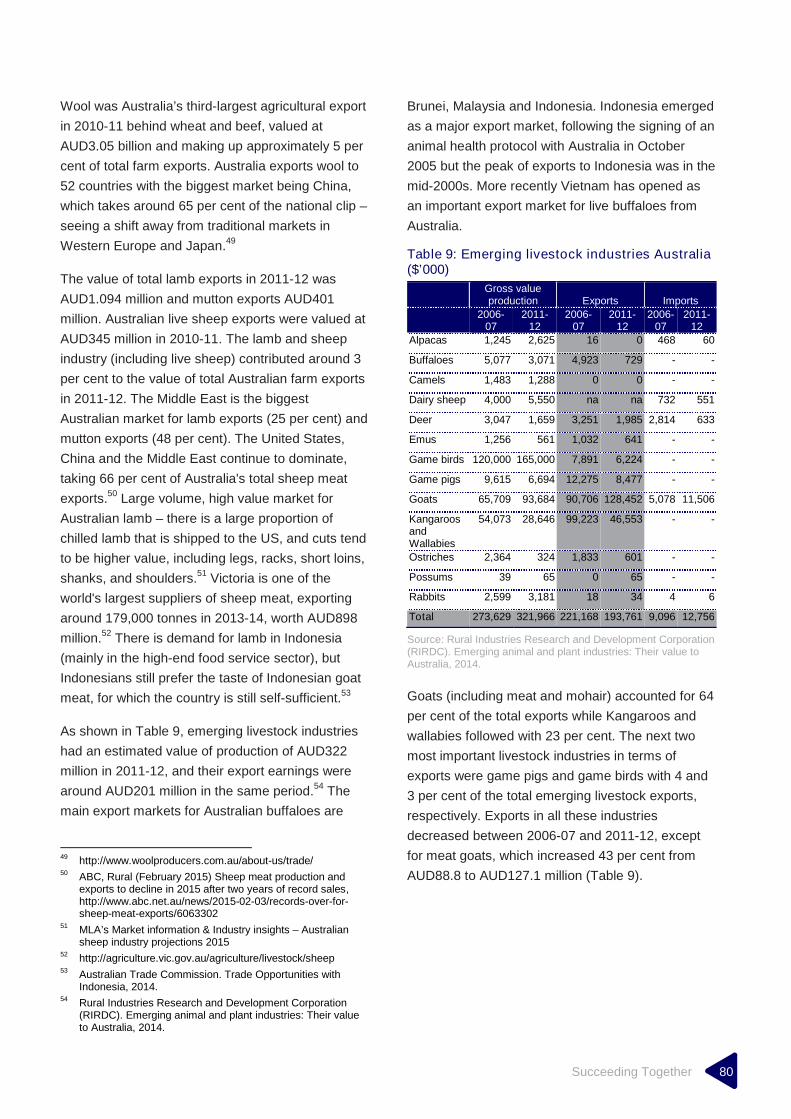
Succeeding Together 80
Wool was Australia’s third-largest agricultural export
in 2010-11 behind wheat and beef, valued at
AUD3.05 billion and making up approximately 5 per
cent of total farm exports. Australia exports wool to
52 countries with the biggest market being China,
which takes around 65 per cent of the national clip –
seeing a shift away from traditional markets in
Western Europe and Japan.49
The value of total lamb exports in 2011-12 was
AUD1.094 million and mutton exports AUD401
million. Australian live sheep exports were valued at
AUD345 million in 2010-11. The lamb and sheep
industry (including live sheep) contributed around 3
per cent to the value of total Australian farm exports
in 2011-12. The Middle East is the biggest
Australian market for lamb exports (25 per cent) and
mutton exports (48 per cent). The United States,
China and the Middle East continue to dominate,
taking 66 per cent of Australia's total sheep meat
exports.50
Large volume, high value market for
Australian lamb – there is a large proportion of
chilled lamb that is shipped to the US, and cuts tend
to be higher value, including legs, racks, short loins,
shanks, and shoulders.51
Victoria is one of the
world's largest suppliers of sheep meat, exporting
around 179,000 tonnes in 2013-14, worth AUD898
million.52
There is demand for lamb in Indonesia
(mainly in the high-end food service sector), but
Indonesians still prefer the taste of Indonesian goat
meat, for which the country is still self-sufficient.53
As shown in Table 9, emerging livestock industries
had an estimated value of production of AUD322
million in 2011-12, and their export earnings were
around AUD201 million in the same period.54
The
main export markets for Australian buffaloes are
49 http://www.woolproducers.com.au/about-us/trade/50 ABC, Rural (February 2015) Sheep meat production and
exports to decline in 2015 after two years of record sales,http://www.abc.net.au/news/2015-02-03/records-over-for-sheep-meat-exports/6063302
51 MLA’s Market information & Industry insights – Australiansheep industry projections 2015
52 http://agriculture.vic.gov.au/agriculture/livestock/sheep53 Australian Trade Commission. Trade Opportunities with
Indonesia, 2014.54 Rural Industries Research and Development Corporation
(RIRDC). Emerging animal and plant industries: Their valueto Australia, 2014.
Brunei, Malaysia and Indonesia. Indonesia emerged
as a major export market, following the signing of an
animal health protocol with Australia in October
2005 but the peak of exports to Indonesia was in the
mid-2000s. More recently Vietnam has opened as
an important export market for live buffaloes from
Australia.
Table 9: Emerging livestock industries Australia($’000)
Gross valueproduction Exports Imports
2006-07
2011-12
2006-07
2011-12
2006-07
2011-12
Alpacas 1,245 2,625 16 0 468 60
Buffaloes 5,077 3,071 4,923 729 - -
Camels 1,483 1,288 0 0 - -
Dairy sheep 4,000 5,550 na na 732 551
Deer 3,047 1,659 3,251 1,985 2,814 633
Emus 1,256 561 1,032 641 - -
Game birds 120,000 165,000 7,891 6,224 - -
Game pigs 9,615 6,694 12,275 8,477 - -
Goats 65,709 93,684 90,706 128,452 5,078 11,506
KangaroosandWallabies
54,073 28,646 99,223 46,553 - -
Ostriches 2,364 324 1,833 601 - -
Possums 39 65 0 65 - -
Rabbits 2,599 3,181 18 34 4 6
Total 273,629 321,966 221,168 193,761 9,096 12,756
Source: Rural Industries Research and Development Corporation(RIRDC). Emerging animal and plant industries: Their value toAustralia, 2014.
Goats (including meat and mohair) accounted for 64
per cent of the total exports while Kangaroos and
wallabies followed with 23 per cent. The next two
most important livestock industries in terms of
exports were game pigs and game birds with 4 and
3 per cent of the total emerging livestock exports,
respectively. Exports in all these industries
decreased between 2006-07 and 2011-12, except
for meat goats, which increased 43 per cent from
AUD88.8 to AUD127.1 million (Table 9).
Succeeding Together 81
2. Potential collaboration
Wool collaboration: There is a significant
opportunity for Australia and Indonesia to
collaborate in the area of wool production and wool-
processing. Australia produced 362,100 metric
tonnes of raw wool in 2013-14 with 65 per cent
being sent to China. Moreover, all wool-processing
has been moved from Australia to China. At the
same time it has been identified that the Indonesian
clothing sector is seeking to move to skilled
(designer) based clothing manufacturing but faces
constraints on the availability of raw materials such
as wool fabrics. There is an opportunity here for raw
wool to be processed in Indonesia (which has a
comparative advantage in textile, clothing and
footwear sectors) and in so doing create the
opportunity for value creation and retention of such
value for both countries. Collaboration of these key
sectors with comparative advantage (i.e. the
Australian wool sector and the Indonesian textile
and clothing sectors) will generate competitive
advantage and make good the use of the
opportunities afforded through relationships in third
markets, which have the need for warmer wool-
based garments.
A representative of the wool industry has noted that
Indonesia already has established market
relationships in third markets like the US and Japan.
There is opportunity for complementarity because
Indonesia has a supply and expertise focused on
the spring and summer seasons based on bulk
fabrics produced in large quantities but which are
not suitable for designer clothing. On the other
hand, Australia has primary knowledge of dealing
with fabrics for winter season garments and
requirements around wool-processing. These two
competitive advantages could be combined to
approach third markets together.
The representative of the wool industry notes that,
opposite to what may happen in other industries,
developing a commercial or joint venture
relationship with Indonesian producers in the wool
sector may not take very long: ‘maybe three to four
years provided that the right conditions are given in
Indonesia in terms of improving their wool-
processing capacities’. Indonesia has certainly
proven capacity to process cotton and that may
facilitate the development of the industry towards
processing wool. To optimise the outcome of the
potential integration with Indonesia in this area (i.e.
extract maximum returns) it would be ideal to count
on capital and capabilities in both countries without
the intervention of third parties. The Australian wool
industry went through a cooperation and industry
development process with Vietnam, and it could be
replicated with Indonesia.
Collaboration around R&D initiatives in livestock
genetics: Taking consideration of import quotas
and the desire by Indonesia for self-sufficiency
policy, the focus on collaboration is not on Australia
providing more meat exports to Indonesia, per se,
but rather, on the opportunity for Australia to offer its
know-how on livestock management and husbandry
for the purpose of improving the productivity of both
its stock and Indonesian stock.
One of the factors affecting Australia’s trade
relationship with Indonesia is around Indonesia’s
beef self-sufficiency policy. Since 2010 the
Indonesian Government has implemented a trade
policy with the aim of controlling the volume of cattle
imports, as discussed earlier in Section 1, to
achieve food security in relation to beef.
This was an extension of historic self-sufficiency
policy on other products like rice and sugar (now
extended to beef), in part, to deal with fluctuating
commodity prices and in part reflecting a
commitment to maintain the overall stability of food
security with the signing of a Letter of Intent (LoI)
with the UN’s Food and Agriculture Organisation in
March 2009.55
55 ACIL Tasman, An economic analysis of the live exportation ofcattle from northern Australia, prepared for WSPA, October2012

Succeeding Together 82
‘The more I learn of the field conditions of our
country, the more I’m convinced that in the next
four or five years, we’ll be able to achieve the
so-called food self-sufficiency, food security and
food sovereignty.’
- President Joko Widodo, openingspeech of the 2015 Jakarta Food
Security Summit
The Australian Minister for Agriculture and Water
Resources, Barnaby Joyce, has stated that:
‘Australia understands the high importance that
Indonesia attaches to building up its cattle industry
and beef production as a key part of strengthening
its long-term food security. Australia supports a
number of development assistance programs which
aim to support Indonesia’s goal of lifting its
agricultural productivity and food security.’56
An Australian senior manager of trade engagement
for South East Asia57
considers that there are
opportunities of collaboration for R&D initiatives
between Australia and Indonesia. These initiatives
could relate to animal health, welfare and
biosecurity. Also, there could be collaboration
opportunities around R&D projects, which could be
jointly conducted in the area of livestock genetics
with the aim of boosting profitability throughout
cattle, sheep and goat value chains. In addition, joint
projects could be conducted in feeding, finishing and
nutrition R&D to increase productivity and
profitability of producers in both countries.
Collaboration around meat processing in
Northern Australia: An opportunity for collaboration
between Australian and Indonesia is identified with
respect to establishing one or more meat processing
plants in North of Australia, which would require an
investment of around AUD160 million58
(covering
56 (Hon) Joyce, B Minister for Agriculture Water Resources,Working together for a bright future for Indonesian andAustralian cattle industries, Media Release, 6 October 2015
57 These comments are individual opinions and do notrepresent the views of the Victorian or AustralianGovernments.
58 In October 2012 dollars (see ACIL Tasman, An economicanalysis of the live exportation of cattle from northernAustralia, prepared for WSPA, October 2012)
operating and capital costs). The advantages for
Indonesia include59
:
A more profitable and productive Northern
Australian beef herd which is integrated into the
Indonesian beef market is likely to be a more
efficient way of improving beef security.
Additional employment benefits consistent with
the objectives of the Indonesian beef self-
sufficiency Blue Print where Indonesian labour
could be utilised to reduce the labour constraints
in Northern Australia.
Technology transfers between Northern
Australian facilities and the Indonesian
processing industry including labour skill transfer
with a rotation of the Indonesian abattoir
workforce being rotated through facilities under
training programs and then returning to their
Indonesian plant.
3. Potential barriers andsuggested solutions
Challenges and solutions around wool
collaboration: According to a representative of the
Australian wool industry, barriers in Indonesian
markets depend on the level of processing of
products. For the finished products there are no
clear barriers and the opportunities are high
considering that wool products can be targeted
towards the growing middle class in Indonesia.
However, at the raw commodity level the barriers
may relate to prices not being competitive in
Indonesia. A softening Australian dollar, however, is
currently providing some relief in this regard.
With regards to a joint venture between Australian
woolgrowers and Indonesian fabric processors,
there are at least three challenges. The first one is
the lack of early stage processing in Indonesia.
Exports to Indonesia cannot be in the form of raw
wool and currently have to be processed before
being sent to Indonesia. The solution to this would
be for Indonesia to invest in necessary capital
required to establish early processing wool cleaning
59 ACIL Tasman, An economic analysis of the live exportation ofcattle from northern Australia, prepared for WSPA, October2012
Succeeding Together 83
and scouring facilities in Indonesia but that funding
remaining between Australian and Indonesia to
maximise returns.
The second issue relates to the current lack of
knowledge of Indonesian producers in relation to
spinning, weaving and product make up with at
different processing levels. The representative of the
Australian wool industry recommends assistance in
the form of transfer of knowledge in the form of
education and training with wool fabrics to help
Indonesian fabric processors move up the ladder.
There is an explicit need for training in this regard
before a competitive advantage in Indonesia can be
achieved by Australian Wool growers to break into
third markets and keep more of the rents which are
currently being extracted by Chinese processors.
Thirdly, the Australian wool industry will need to
provide end market introductions for major wool
fabric users, in the instance where third market
demand is driven by international garment
designers, labels, and manufacturers.
In relation to the threats that may present to the
Australian wool industry from a potential
strengthening of the integration process with
Indonesia, the representative of the wool industry
considers that there are currently no clear risks. The
representative notes that this is because the
Australian industry does not cover any early stages
of the wool processing. Opportunities could also
arise for reverse trade with Australia, as wool
products could be exported back to Australia after
processing in Indonesia.
Challenges and solutions around collaboration
around R&D initiatives in livestock genetics:
One of the current obstacles for joint bilateral
projects in R&D relates to the perceived high cost of
implementing research programs versus the
perceived benefits. To help overcome this obstacle
a senior manager of trade engagement (South East
Asia) considers that more emphasis should be put in
providing cost-benefit analysis with detailed
information about the expected benefits to
producers in both countries. That is to say a full
business case should be made to allow for
evidenced based decisions with regards to R&D
investments. Moreover, clearer investment protocols
and assistance identifying joint venture partners
from both nations will be necessary to promote
investments and maximise cross investment
benefits for both nations’ partners.
Challenges and solutions around collaboration
around meat processing in Northern Australia:
The Australian beef industry, in association with the
WA, NT and Australian Governments, will need to
prepare a comprehensive plan to be presented to
the Indonesian Government to integrate the
Australian and Indonesian beef industries.60
60 ACIL Tasman, An economic analysis of the live exportation ofcattle from northern Australia, prepared for WSPA, October2012 Australian Trade Commission. 2015. Agribusiness toIndonesia.
Succeeding Together 84
Appendix BAdditional research andevidence that underpins
the analysis

Succeeding Together 85
In isolation, if there are product segments in
Australian and Indonesia that are both greater than
1 (or, >1) it would suggest that they could combine
forces to gain an even greater advantage. The
results of this analysis are not overly surprising.
Most of the shared RCA >1 are in the commodity
sector, ore, minerals and coal metals. Figure 32
shows only those products where both Indonesian
and Australian RCA is >1.61
Figure 32: Revealed comparative advantage(2 digit HS Classification)
Source: ANZ Research 2015
The same pattern emerges when extending this
analysis to a HS 4 digit classification system (see
Figure 33). Only 26 products out of a possible 1,200
emerge where both countries have an RCA >1
under this analysis. The products that stand out are
mainly primary goods such as nickel ores and coal
(with very few secondary goods).
61 The formula to calculate RCA is derived from: K = industrialindex; j = country index; and X = exports
Figure 33: Revealed comparative advantage(4 digit HS Classification)
Source: ANZ research
In isolation, the top 10 product groups were
Australia has an RCA (HS classification 2) is
presented in Figure 34.
Figure 34: Top 10 Australian products withan RCA
Source: ANZ Research 2015
0
5
10
15
20
25
Ore
s,sl
ag
an
da
sh
Min
era
lFu
el(
coa
l)
Oth
er
Co
mm
od
itie
s
Nic
kel
Co
pp
er
Co
tton
Re
ve
ale
dc
om
pa
rati
ve
ad
va
nta
ge
leve
lre
ad
ing
HS classification – 2 digit breakdown – ~97 products
Aus Indonesia
0
5
10
15
20
25
30
Nic
kelO
res
Co
al
Alu
min
ium
ore
sN
icke
lOre
sC
op
per
ore
sS
lag
&A
shP
ea
rls
Wo
od
for
Fu
el
Co
rala
nd
sim
ilar
Oth
er
ore
sM
ola
sse
sG
old
Am
mon
iaL
ive
fish
Ess
en
tialo
ilsC
op
per
Art
icle
sV
an
illa
Oth
er
mea
tsW
ork
ed
bo
ne/S
he
llR
aw
hid
es
Wo
od
flou
rF
ilin
gca
bin
ets
Marg
ari
ne
Oth
er
nuts
Tin
Art
icle
sM
ollu
scs
Re
ve
ale
dc
om
pa
rati
ve
ad
va
nta
ge
leve
lre
ad
ing
Ind Aus
0
5
10
15
20
25O
res,
sla
gan
da
sh
Wo
ol
Le
ad
Zin
c
Mea
t
Liv
ean
ima
ls
Ce
rea
ls
Inorg
an
icch
em
ica
ls
Mill
ing
indu
stry
Pe
arl
s
Re
ve
ale
dc
om
pa
rati
ve
ad
va
nta
ge
leve
lre
ad
ing
Australia – HS Classification – 2 digit breakdown– ~97 products

Succeeding Together 86
Similarly, Figure 35 presents the top 10 product
groups where Indonesia has an RCA (HS
classification 2).
Figure 35: Top 10 Indonesian products withan RCA
Figure 36 shows the top 20 product groups where
Australia has an RCA (HS classification 4).
Figure 36: Top 20 Australian products with anRCA (HS classification 4)
Source: ANZ Research 2015
Likewise, Figure 37 shows the top 20
product groups where Indonesia has an RCA
(HS classification 4).
Figure 37: Top 20 Indonesian products with anRCA (HS classification 4)
Source: ANZ Research 2015
05
101520253035
Tin
Ve
geta
ble
Oil
Musi
calin
str
um
ents
Ve
geta
ble
pla
iting
Nic
kel
Man-m
ade
fibre
s
Rubber
Pre
pare
dfe
ath
ers
Cocoa
Str
aw
&W
icke
r
Reveale
dco
mp
ara
tive
ad
van
tag
ele
velre
ad
ing
Ind – HS Classification – 2 digit breakdown– ~97 products
0
5
10
15
20
25
30
35
40
45
Wo
ol
Iron
Ore
Tin
Ore
Co
al
Co
run
du
m
Man
gne
seO
res
Ra
wS
kin
s
Nic
kelO
re
Mea
tS
he
ep
Nic
kelP
rodu
cts
Wh
eat
Liv
eS
hee
p
Le
ad
Ore
s
Pre
ciou
sm
eta
lore
Ro
ots
Zin
co
res
Barl
ey
Anim
alF
ats
Bee
f
Pea
rls
Reveale
dco
mp
ara
tive
ad
van
tag
ele
vel
read
ing
Aus – HS Classification – 4 digit breakdown– ~ 1200 products
0
10
20
30
40
50
60
70
Edib
leA
nim
al
Lig
nite
(bro
wn
coa
l)P
alm
Oil
Un
wro
ug
httin.
Co
con
ut
Ru
bb
er
Alu
min
ium
Tin
Pro
duct
sN
icke
lOre
Nic
kelI
nte
rme
dia
teC
innam
on
Yarn
Nu
tme
gV
eg
eta
ble
Pla
nts
Co
pra
Sla
gan
dA
shP
ian
os
Co
al
Musi
calI
nst
rum
ents
Yarn
Synth
etic
Reveale
dco
mp
ara
tive
ad
van
tag
ele
velre
ad
ing
Ind – HS Classification – 4 digit breakdown– ~1200 products

Succeeding Together 87
Appendix CReferences

Succeeding Together 88
Preliminaries and Chapters 1 to 4ASMEA. (2015). SME Facts. Retrieved from
http://www.asmea.org.au/SMEFacts
Australian Government. (2015, June 18). Our North, OurFuture: White Paper on Developing Northern Australia.Retrieved fromhttp://northernaustralia.infrastructure.gov.au/white-paper/files/northern_australia_white_paper.pdf
Australian Business: Consulting and Solutions. (2012,October 3). IA-CEPA – Indonesia Australia –Comprehensive Economic Partnership Agreement.Retrieved fromhttp://www.australianbusiness.com.au/international-trade/news/iacepa-indonesia-australia-comprehensive-econ
Balassa, B. (1965). Trade Liberalisation and RevealedComparative Advantage. The Manchester School, Vol.33, Issue 2, pages 99-123
Brann, M. and Locke, S. (2012, 25 October). Lack oflanguage skills will hurt Australian trade with Indonesia.ABC Rural. Retrieved from http://www.abc.net.au/site-archive/rural/nt/content/201210/s3618677.htm
Centre for Socio-Economic Development. (2014). Policycoordination and consultation in Indonesia. Retrievedfrom http://www.csend.org/publications/trade-policy-governance/387-policy-coordination-and-consultation-in-indonesia
C. Constantinescu, A. Mattoo and M. Ruta (2015), WorldBank Policy Research Working Paper No. 7158
Department of Agriculture and Water Resources (2015.August 21). Indonesia-Australia Partnership on FoodSecurity Communique 21 August 2015. Retrieved fromhttp://www.agriculture.gov.au/about/media-centre/communiques/indonesia-australia-food-security
Department of Foreign Affairs and Trade. Infrastructureassistance in Indonesia. Retrieved fromhttp://dfat.gov.au/geo/indonesia/development-assistance/Pages/infrastructure-assistance-in-indonesia.aspx
Department of Foreign Affairs and Trade. Infrastructureinitiatives. Retrieved fromhttp://dfat.gov.au/aid/topics/investment-priorities/infrastructure-trade-facilitation-international-competitiveness/infrastructure/Pages/infrastructure-initiatives.aspx
Egger, H., Egger, P. and Greenaway, D. (2004). Intra-Industry Trade with Multinational Firms: Theory,Measurement and Determinants. The University ofNottingham. Retrieved fromhttp://www.nottingham.ac.uk/gep/documents/papers/2004/04-10.pdf
Hanouz, M., Geiger, T. and Doherty, S. (2014). The GlobalEnabling Trade Report 2014. World Economic Forum.Retrieved fromhttp://www3.weforum.org/docs/WEF_GlobalEnablingTrade_Report_2014.pdf
Hill, C. Australia and Indonesia: from good neighbours tostrategic partners? Parliament of Australia. Retrievedfrom http://www.aph.gov.au/About_Parliament/
Parliamentary_Departments/Parliamentary_Library/pubs/BriefingBook44p/AustIndo
International Monetary Fund. (2015, September 1). Poised forTake-off—Unleashing Indonesia’s Economic Potential.Retrieved from https://www.imf.org/external/np/speeches/2015/090115.htm
The Jakarta Post (2015, 15 October). Indonesia records 4-year biggest trade surplus of $7.13b. Retrieved fromhttp://www.thejakartapost.com/news/2015/10/15/indonesia-records-4-year-biggest-trade-surplus-713b.html
Oliver Wyman. (2012), ‘The Future of Asian Banking:Volume 2’
Organisation for Economic Co-operation and Development.(2006). Cutting Red Tape: National Strategies forAdministrative Simplification. Retrieved fromhttp://www.oecd.org/gov/regulatory-policy/38103089.pdf
Parliament of Australia. (2015). Customs Amendment(Australian Trusted Trader Programme) Bill 2015.Retrieved fromhttp://www.aph.gov.au/Parliamentary_Business/Bills_Legislation/bd/bd1415a/15bd125#_Toc422401608
PwC. (2015). PwC’s Growth Markets Framework. Retrievedfrom http://www.pwc.com/gx/en/growth-markets-centre/index.jhtml
PwC. (2014). The Australian Grains Industry: The Basics.Retrieved fromhttp://www.pwc.com.au/industry/agribusiness/assets/Australian-Grains-Industry-Nov11.pdf
PwC. (2015). The World in 2050: Will the shift in globaleconomic power continue?. Retrieved fromhttp://www.pwc.com/gx/en/issues/the-economy/assets/world-in-2050-february-2015.pdf
RAND Corporation. (2015). Reforming Indonesia's PoliciesTowards Small and Medium Sized Enterprises. Retrievedfromhttp://www.rand.org/labor/centers/rapid/projects/reforming-indonesia-smes.html
Waltham Trade Policy Review. (2014, April 7). How CanAustralia Improve its Global Trade Ranking? Retrievedfrom https://tradepolicy.wordpress.com/2014/04/07/how-can-australia-improve-its-global-trade-ranking/
World Bank. (2014, May). Indonesia: Avoiding The Trap.Retrieved fromhttp://www.worldbank.org/content/dam/Worldbank/document/EAP/Indonesia/Indonesia-development-policy-review-2014-english.pdf
World Trade Organisation (2004). Infrastructure in trade andeconomic development. Retrieved fromhttps://www.wto.org/english/res_e/booksp_e/anrep_e/wtr04_2b_e.pdf
The World Bank. (2015). Data: Ease of doing business index.Retrieved fromhttp://data.worldbank.org/indicator/IC.BUS.EASE.XQ
Textile and Fashion Case StudyAswicahyono, H., Hill, H., & Narjoko, D. (2010).
Industrialisation after a Deep Economic Crisis: Indonesia.Journal of Development Studies, 46(6), 1084–1108.http://doi.org/10.1080/00220380903318087

Succeeding Together 89
Kuncoro, M. (2013). Indonesia ’ s textile and its productsindustry : Recent development and challenges, 1(3), 60-74
Suyanto, Bloch, H., & Salim, R. a. (2012). Foreign DirectInvestment Spillovers and Productivity Growth inIndonesian Garment and Electronics Manufacturing.Journal of Development Studies, (September 2013), 1–15. http://doi.org/10.1080/00220388.2011.646992
Vickers, A. (2012). Clothing Production in Indonesia : A Divided Industry, 4(3), 41–60
Food-Processing Case StudyAriyanti, F. (2014), ‘Produsen Lokal Diminta Mulai
Memproduksi Gula Mentah’, Liputan 6 15 Desember2014. Available at:<http://bisnis.liputan6.com/read/2147773/produsen-lokal-diminta-mulai-memproduksi-gula-mentah>. [Accessed 17September 2015]
Australian Trade Comission, (2013). Processed Food.Sydney: Commonwealth of Australia.
Converging Knowledge Pte. Ltd., (2012). Processed Foodand Food Processing Machinery and Equipment Sectorsin ASEAN. Osec Business Network Switzerland.
Deny, S. (2015), ‘Rupiah Loyo, Pengusaha Makanan danMinuman Mulai Evaluasi Harga’, Liputan 6 18 Maret2015. Available at:<http://bisnis.liputan6.com/read/2193282/rupiah-loyo-pengusaha-makanan-dan-minuman-mulai-evaluasi-harga>. [Accessed 17 September 2015]
Dossor, R. (n.d.). ‘The future of the Australian processed foodsector’. Parliament of Australia [online]. Available at:<http://www.aph.gov.au/About_Parliament/Parliamentary_Departments/Parliamentary_Library/pubs/BriefingBook44p/ProcessedFood>. [Accessed 25 September 2015]
Genner, M. (2013), ‘Australian Food Processing to Go theWay of the Auto Industry?’, ABC Radio National 6 June2013. Available at:<http://www.abc.net.au/radionational/programs/breakfast/food-processing/4737622>. [Accessed 25 September2015]
Jongwanich, J. (2009), ‘Impact of Food Safety Standards onProcessed Food Exports from Developing Countries’,ADB Economics Working Paper Series, No. 154, Manila:ADB
Kato, N. (2013). A Cold Chain Proposal for Food Losses -Learning from the Past and Present of Japan.
Kitinoja, L. (2013), ‘Use of Cold Chains for Reducing FoodLosses in Developing Countries’, The PostharvestEducation Foundation (PEF) White Paper, No. 13-03,Oregon: PEF
Wilson, J. (2002). Standards, Regulation and Trade: WTORules and Developing Country Concerns. In: B.Hoekman, A. Mattoo and P. English, ed., Development,Trade and the WTO: A Handbook, Washington, DC: TheWorld Bank, pp.428-438.
Livestock Logistics Case StudyABC media report. 2014. From salesyard to port: the logistics
of live export. Retrieved fromhttp://www.abc.net.au/news/2014-09-09/behind-the-scenes-live-export-preparation/5721584
CSIRO. 2013. The agricultural potential of Australia’s north –Livestock industry logistics. Retrieved fromhttp://regional.gov.au/regional/ona/files/SAF_LivestockLogisticsFlyer-AH2013-05.pdf
Higgins, A, Watson, I, Chilcott, C, Zhou, Mingwei, Garcia-Flores, R, Eady, S, McFallan, S, Prestwidge, D, Laredo,L. 2013. ‘A framework for optimising capital investmentand operations in livestock logistics’. Rangeland Journal,35:181-191
Indonesia-Australia Business Partnership Group. 2012.Position Paper on Considerations Towards the Indonesia-Australia Comprehensive Economic PartnershipAgreement. Retrieved fromhttp://dfat.gov.au/trade/agreements/iacepa/Documents/ia-bpg-position-paper.pdf
Ports Australia. 2015. Home page. Retrieved fromhttp://www.portsaustralia.com.au/
Animal Products Case StudyAustralian Bureau of Statistics (ABS), 2015 – Agricultural
Commodities by State & Territory - Cat. No. 7121.0,2013-14
Australian Bureau of Statistics (ABS), 2015 - Value ofAgricultural Commodities Produced, Australia, Catalogue7503.0, 2013-14
Australian Bureau of Agricultural and Resource Economicsand Sciences (ABARES) Agricultural Commodities:September Quarter 2015.http://data.daff.gov.au/data/warehouse/agcomd9abcc004/agcomd9abcc20150915/AgCommodities201509_1.0.0.pdf, [Accessed 24 September 2015]
Austrade. 2014, June 2. Agribusiness to Indonesia. Retrievedfromhttp://www.austrade.gov.au/Australian/Export/Exportmarkets/Countries/Indonesia/Industries/agribusiness
ABC, Rural (February 2015) Sheep meat production andexports to decline in 2015 after two years of record sales,http://www.abc.net.au/news/2015-02-03/records-over-for-sheep-meat-exports/6063302, [Accessed 09 October2015]
ACIL Tasman, An economic analysis of the live exportation ofcattle from northern Australia, prepared for WSPA,October 2012
Australian Trade Commission. 2015. Agribusiness toIndonesia
Cardellino, R. 2015, July 16. Global sheep flock – whathappened and where to now? Retrieved fromhttp://www.mecardo.com.au/commodities/analysis/global-sheep-flock-report.aspx?GoMobile=0
IBIS World, Leather and Leather Substitute ProductManufacturing in Australia: Market Research Report,ANZSIC C1320, April 2015
Dairy Australia. About the Australian Dairy Industry. Retrievedfrom http://www.dairyaustralia.com.au/Industry-information/About-the-industry/About-the-Australian-dairy-industry.aspx
Dairy Australia. International market overview. Retrieved fromhttp://www.dairyaustralia.com.au/Markets-and-

Succeeding Together 90
statistics/Exports-and-trade/Dairy-export-markets/International-market-overview.aspx
Dairy Australia. Production summary. Retrieved fromhttp://www.dairyaustralia.com.au/Markets-and-statistics/Production-and-sales/Production-Summary.aspx
Department of Foreign Affairs and Trade (DFAT),Composition of Trade Australia, 2014
Department of Foreign Affairs and Trade (DFAT), AustraliaMerchandise Exports and Imports, 2015
FAO 2013, Current Worldwide Annual Meat Consumption percapita, Livestock and Fish Primary Equivalent, Food andAgriculture Organization of the United Nations, viewed31st March, 2013
Foster, Max and Rural Industries Research and DevelopmentCorporation (Australia). 2014. ‘Emerging Animal andPlant Industries : Their Value to Australia’. Barton, A.C.T. RIRDC
Jakarta Globe. Jokowi: Indonesia can attain food self-sufficiency in next four years. Retrieved fromhttp://jakartaglobe.beritasatu.com/news/jokowi-indonesia-can-attain-food-self-sufficiency-next-four-years/
(Hon) Joyce, B Minister for Agriculture Water Resources,Working together for a bright future for Indonesian andAustralian cattle industries, Media Release, 6 October2015
Meat and Livestock Australia (MLA). 2013-14. Annual Report
MLA’s Market information & Industry insights – Australiansheep industry projections 2015
Meat & Livestock Australia. Cattle. Retrieved fromhttp://www.mla.com.au/About-the-red-meat-industry/Industry-overview/Cattle
State Government of Victoria. 2015. Sheep. Retrieved fromhttp://agriculture.vic.gov.au/agriculture/livestock/sheep
The Australian Association of Leather Industries. 2003.Submission to the Productivity Commission Inquiry intothe textile clothing and footwear and leather industrieswith respects to post 2005 industry assistance measures
Wool Producers Australia. Wool trade. Retrieved fromhttp://www.woolproducers.com.au/about-us/trade/
Succeeding Together 91
Appendix DFigures and tables
Succeeding Together 92
FiguresFigure 1: The shared platform – The Asian convergence 3
Figure 2: Industrialisation and the process of cascading up value chains 17
Figure 3: Compound annual growth rates for intra-ASEAN trade 18
Figure 4: Projections for extra-ASEAN trade 18
Figure 5: Australia’s key exports and imports (2013-14) 19
Figure 6: Australia’s major trading partners (2013-14) 20
Figure 7: Structure of the Australian economy (2013-14) 21
Figure 8: Gross value added – Australia (1982-2015) 21
Figure 9: Indonesia’s GDP growth (4Q rolling average) and investment over GDP 22
Figure 10: Indonesia’s population pyramid (250m people) and working age population to add nearly 30m by2025 23
Figure 11: Australia’s exports to Indonesia and share of exports 29
Figure 12: Australia as a source for Indonesia’s imports 30
Figure 13: Projections for hard commodity exports to Indonesia and agricultural exports to Indonesia 31
Figure 14: Services exports to Indonesia and projections for services exports 31
Figure 15: Total merchandise exports from Indonesia to Australia and share of Indonesia’s exports toAustralia 32
Figure 16: Indonesian exports to Australia as a percent of Australia’s total global imports by broad categoryand product 33
Figure 17: Projections for Indonesia’s merchandise exports to Australia 34
Figure 18: Projections for Indonesia’s petroleum exports to Australia and Indonesia’s machinery andtransport exports to Australia 34
Figure 19: Indonesia’s paper and wood exports to Australia and textile and footwear exports to Australia 35
Figure 20: Services exports to Australia and projections of services exports 35
Figure 21: Revealed comparative advantage in 2013/14 and in 2005 42
Figure 22: Textile Industries in Indonesia 64
Figure 23: Exports of textile and clothing vs. manufacturing (US$bn), 1989-2014 64
Figure 24: Value Added Textile, Clothing and Manufacturing, 2000-2012 65
Figure 25: Skill worker ratio, R&D intensity, foreign ownership and employment 65
Figure 26: Performance trends of processed foods industries 69
Figure 27: Performance comparison of processed foods industries 71
Figure 28: Distribution of livestock exports by port in mass tonnes – 2012-13 74
Figure 29: Industry contribution to agricultural output, 2002-03 to 2013-14 77
Figure 30: Value of Agricultural Commodities Produced, Livestock slaughterings & other disposals &livestock products 2013-14 78
Figure 31: Australia’s rural exports growth – 2013-14 78
Figure 32: Revealed comparative advantage (2 digit HS Classification) 85
Figure 33: Revealed comparative advantage (4 digit HS Classification) 85
Figure 34: Top 10 Australian products with an RCA 85
Figure 35: Top 10 Indonesian products with an RCA 86
Figure 36: Top 20 Australian products with an RCA (HS classification 4) 86
Figure 37: Top 20 Indonesian products with an RCA (HS classification 4) 86
TablesTable 1: Key comparative facts about Australia and Indonesia 15
Table 2: Key Indonesian imports and exports (2014) 24
Table 3: Indonesia’s major trading partners (2014) 24
Table 4: Structure of the Indonesian economy (2014) 25
Table 5: Intra-industry trade between Australia and Indonesia (2014) 37
Table 6: Export growth (%) – RCA in 2014 and RCA in 2005 43
Table 7: Revealed Comparative Advantage (2008-2012) 63
Table 8: Australia’s meat exports by selected markets (2013-2014) 79
Table 9: Emerging livestock industries Australia ($’000) 80

www.australiaindonesiacentre.orgwww.anz.com.au/corporate/research/www.pwc.com.au
© ANZ Research and PwC. All rights reserved.PwC refers to the Australian member firm, and may sometimes refer to the PwC network.Each member firm is a separate legal entity. Please see www.pwc.com/structure for further details.PwC liability limited by a scheme approved under Professional Standards Legislation


