CHAPTER 7 Reporting the incidence and prevalence of renal transplantation in Australia and New Zealand; summarizing immunosuppression regimens, rejection episodes and graft and patient survival.
During 2018, there were 1149 kidney transplants performed in Australia and 182 performed in New Zealand, with
live donor transplants contributing 20.7% and 46.2% of total transplants, respectively. The 29.8% growth in kidney
transplants between 2013 and 2018 in Australia parallels the increase in the number of deceased donors, whereas
the number of live donors has remained unchanged. In New Zealand, there has been a 56.9% growth over the same
period, with corresponding increases of 71.9% and 42.4% in deceased and live donor transplants, respectively.
There is a substantial geographical variation in the transplantation rate in Australia, with Tasmania and Victoria
having the highest transplant rate of dialysed patients in 2018. Even though the number of kidney transplants in
every ethnic group has increased over time, Caucasian patients contribute to 65.9% and 53.8% of total patients
transplanted in Australia and New Zealand, respectively; whereas Aboriginal/Torres Strait Islander and Māori
patients contribute 4.3% and 15.9%, respectively (2018 data).
The number of prevalent patients with functioning kidney transplants has grown in the last decade, increasing by
52.2% between 2009 and 2018 (from 8053 to 12,253 recipients) in Australia, and by 39.7% (from 1407 to 1966
recipients) in New Zealand. At the end of 2018, 9.8% and 11.8% of prevalent transplants had functioned for at least
20 years in Australia and New Zealand, respectively. Death with a functioning graft and chronic allograft nephropathy
were the two most common causes of allograft failure, accounting for 42.1% and 33.0% of all allograft failures in
Australia, respectively; and 50.0% and 31.6% in New Zealand, respectively (2018 data). Cancer was the most
common cause of death with a functioning graft in Australia, whereas cardiovascular disease remained the most
common in New Zealand.
The proportion of first kidney transplant recipients who had experienced acute rejection in the first 6 months has
remained similar over the last 5 years, with respective rejection rates of 19.1% and 18.5% for patients who have
received primary live and deceased donor kidney transplants during 2017. There has been considerable
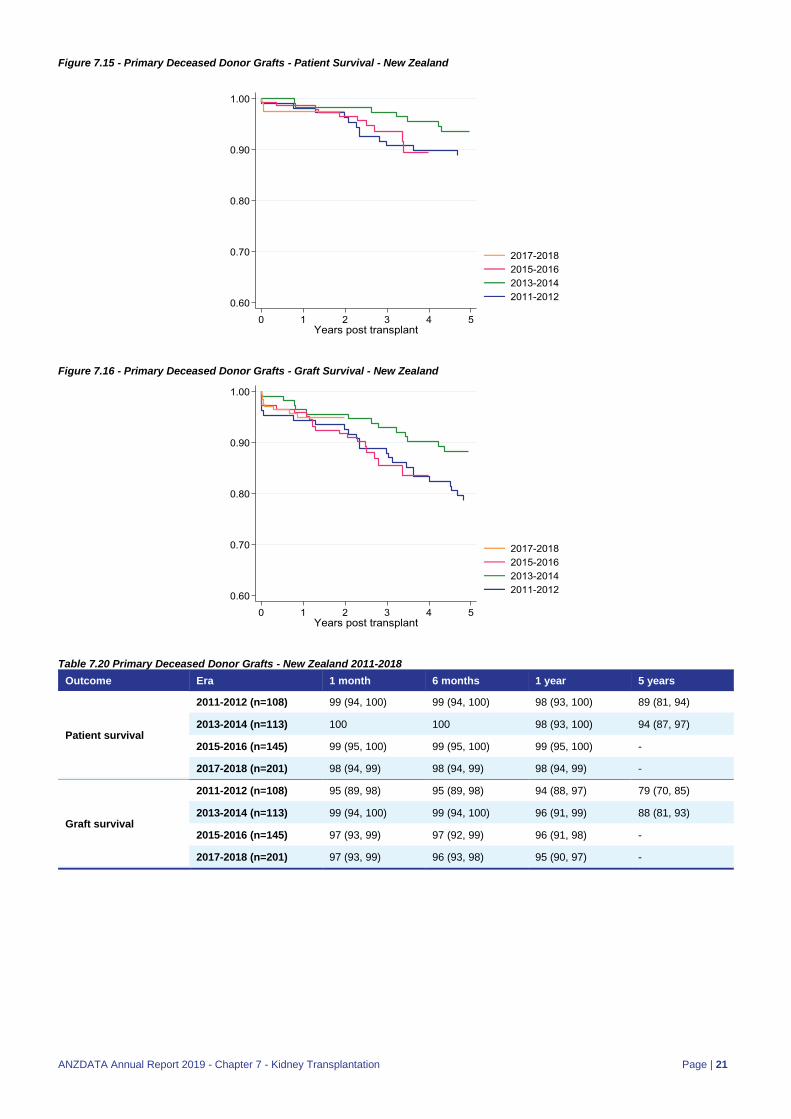
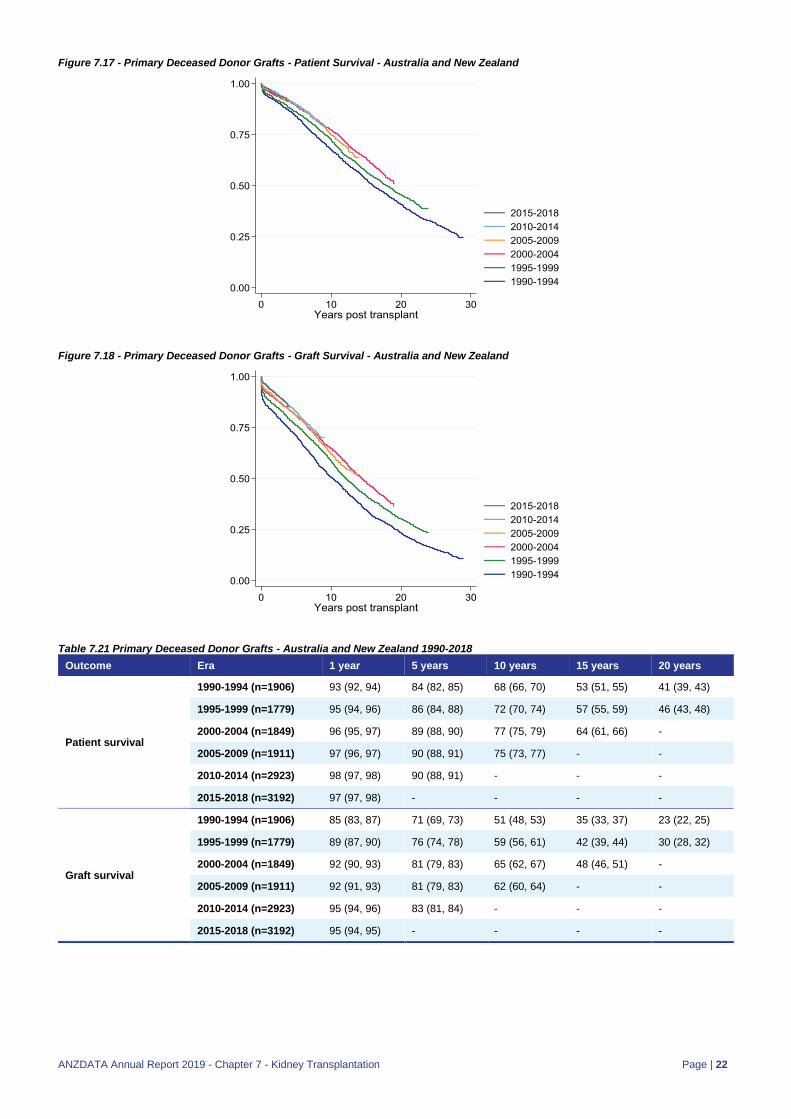
improvement in short and intermediate-term allograft and patient survivals following live and deceased donor kidney
transplants since 1990, with 1-year (95% confidence interval) allograft survival in Australia for primary live and
deceased donor kidney transplants of 97% (95%, 99%) and 96% (95%, 97%), respectively; and 97% (91%, 99%)
and 95% (90%, 97%) in New Zealand, respectively (2017-2018 data).
Suggested Citation
ANZDATA Registry. 42nd Report, Chapter 7: Kidney Transplantation. Australia and New Zealand Dialysis and Transplant Registry, Adelaide, Australia. 2019. Available at: http://www.anzdata.org.au
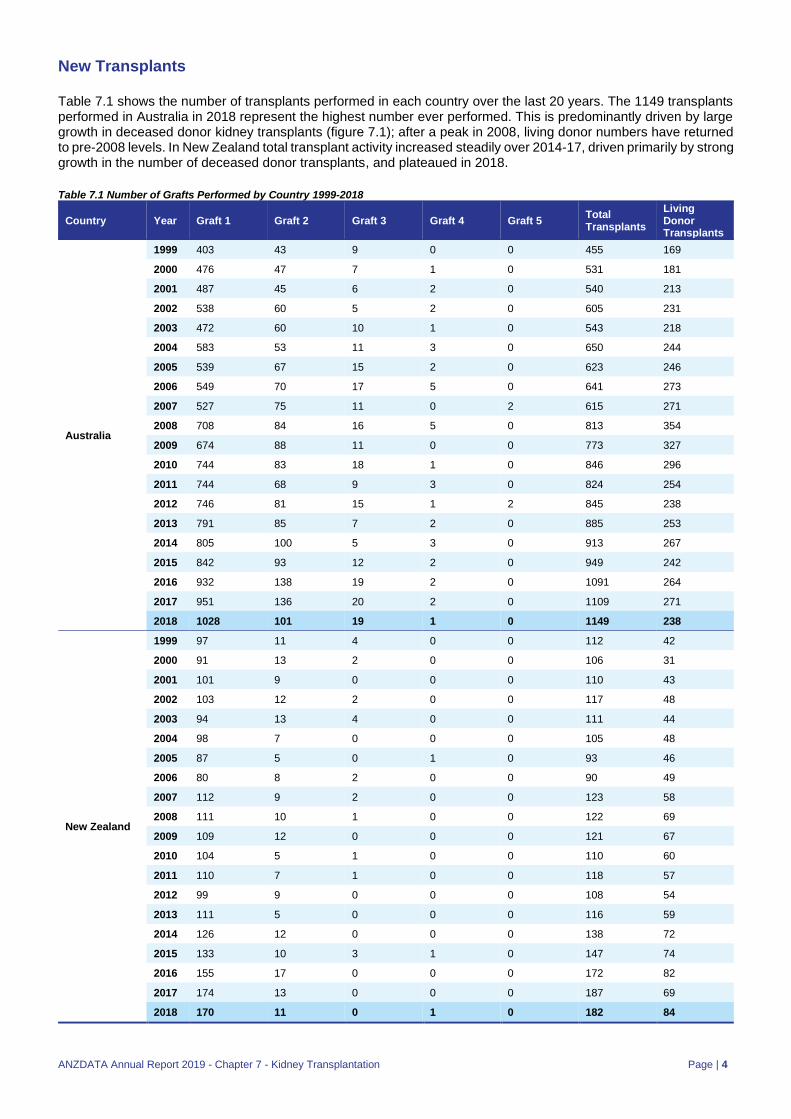
Table 7.1 shows the number of transplants performed in each country over the last 20 years. The 1149 transplants performed in Australia in 2018 represent the highest number ever performed. This is predominantly driven by large growth in deceased donor kidney transplants (figure 7.1); after a peak in 2008, living donor numbers have returned to pre-2008 levels. In New Zealand total transplant activity increased steadily over 2014-17, driven primarily by strong growth in the number of deceased donor transplants, and plateaued in 2018.
Table 7.1 Number of Grafts Performed by Country 1999-2018
Country Year Graft 1 Graft 2 Graft 3 Graft 4 Graft 5 Total Transplants
Living Donor Transplants
Australia
1999 403 43 9 0 0 455 169
2000 476 47 7 1 0 531 181
2001 487 45 6 2 0 540 213
2002 538 60 5 2 0 605 231
2003 472 60 10 1 0 543 218
2004 583 53 11 3 0 650 244
2005 539 67 15 2 0 623 246
2006 549 70 17 5 0 641 273
2007 527 75 11 0 2 615 271
2008 708 84 16 5 0 813 354
2009 674 88 11 0 0 773 327
2010 744 83 18 1 0 846 296
2011 744 68 9 3 0 824 254
2012 746 81 15 1 2 845 238
2013 791 85 7 2 0 885 253
2014 805 100 5 3 0 913 267
2015 842 93 12 2 0 949 242
2016 932 138 19 2 0 1091 264
2017 951 136 20 2 0 1109 271
2018 1028 101 19 1 0 1149 238
New Zealand
1999 97 11 4 0 0 112 42
2000 91 13 2 0 0 106 31
2001 101 9 0 0 0 110 43
2002 103 12 2 0 0 117 48
2003 94 13 4 0 0 111 44
2004 98 7 0 0 0 105 48
2005 87 5 0 1 0 93 46
2006 80 8 2 0 0 90 49
2007 112 9 2 0 0 123 58
2008 111 10 1 0 0 122 69
2009 109 12 0 0 0 121 67
2010 104 5 1 0 0 110 60
2011 110 7 1 0 0 118 57
2012 99 9 0 0 0 108 54
2013 111 5 0 0 0 116 59
2014 126 12 0 0 0 138 72
2015 133 10 3 1 0 147 74
2016 155 17 0 0 0 172 82
2017 174 13 0 0 0 187 69
2018 170 11 0 1 0 182 84
Figure 7.1.1 - Deceased and Living Donor Transplants - Australia 2009-2018
Figure 7.1.2 - Deceased and Living Donor Transplants - New Zealand 2009-2018
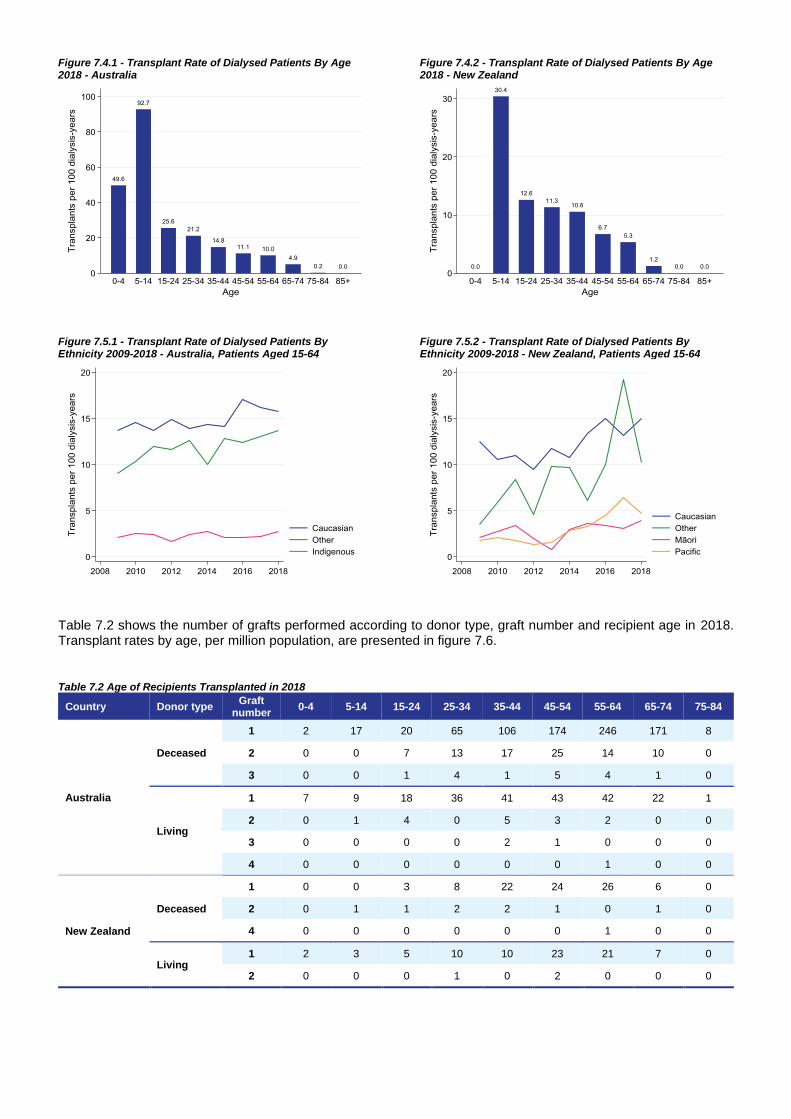
The transplant rate of dialysed patients is presented in figure 7.2 (for all dialysis patients) and figure 7.3 (for patients aged 15-64 years). Note that the denominator for these rates is dialysis-years. Differences in the rates between states and countries depend on a number of factors including the casemix of the dialysis patients and the local deceased donation rate. These rates are presented by age in figure 7.4, and by ethnicity in patients aged 15-64 years in figure 7.5. In both countries, the transplant rate of indigenous patients is lower than in other ethnic groups; see also chapters 10 and 11.
Figure 7.2 - Transplant Rate of Dialysed Patients 2018 - All Dialysis Patients
Figure 7.4.1 - Transplant Rate of Dialysed Patients By Age 2018 - Australia
Figure 7.4.2 - Transplant Rate of Dialysed Patients By Age 2018 - New Zealand
Figure 7.5.1 - Transplant Rate of Dialysed Patients By Ethnicity 2009-2018 - Australia, Patients Aged 15-64
Figure 7.5.2 - Transplant Rate of Dialysed Patients By Ethnicity 2009-2018 - New Zealand, Patients Aged 15-64
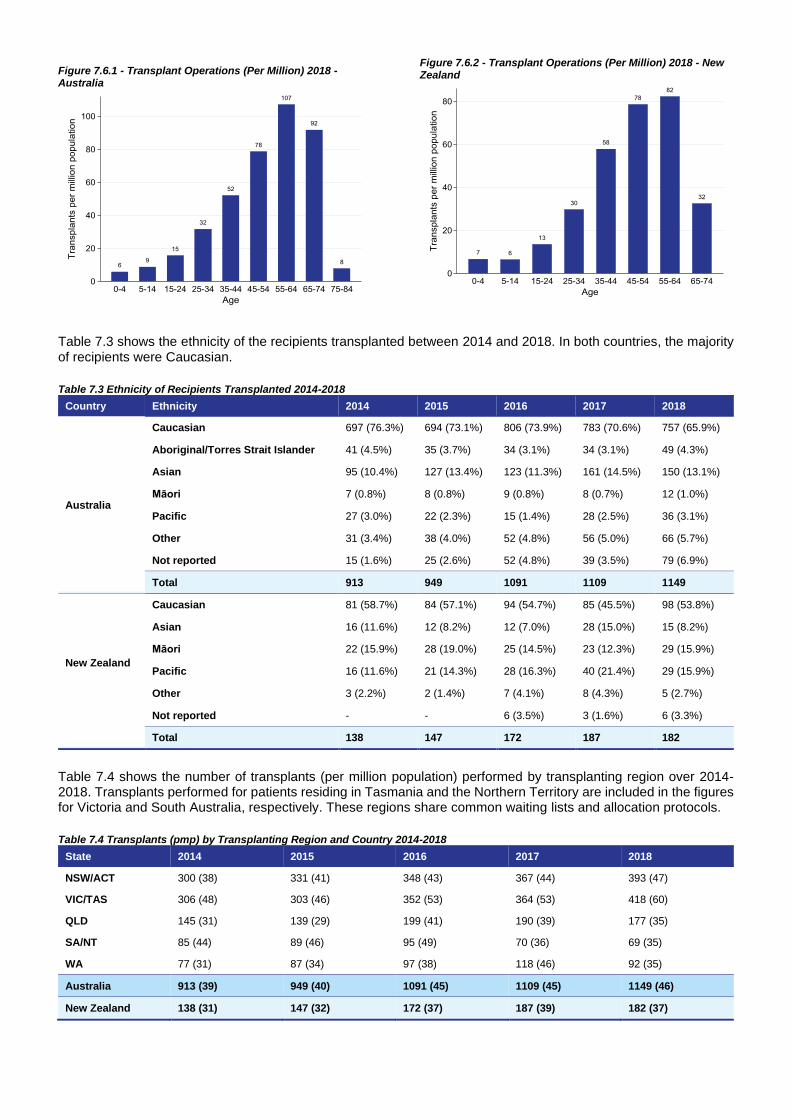
Table 7.2 shows the number of grafts performed according to donor type, graft number and recipient age in 2018. Transplant rates by age, per million population, are presented in figure 7.6.
Table 7.2 Age of Recipients Transplanted in 2018
Country Donor type Graft number 0-4 5-14 15-24 25-34 35-44 45-54 55-64 65-74 75-84
Australia
Deceased
1 2 17 20 65 106 174 246 171 8
2 0 0 7 13 17 25 14 10 0
3 0 0 1 4 1 5 4 1 0
Living
1 7 9 18 36 41 43 42 22 1
2 0 1 4 0 5 3 2 0 0
3 0 0 0 0 2 1 0 0 0
4 0 0 0 0 0 0 1 0 0
New Zealand
Deceased
1 0 0 3 8 22 24 26 6 0
2 0 1 1 2 2 1 0 1 0
4 0 0 0 0 0 0 1 0 0
Living 1 2 3 5 10 10 23 21 7 0
2 0 0 0 1 0 2 0 0 0
Figure 7.6.1 - Transplant Operations (Per Million) 2018 - Australia
Table 7.4 shows the number of transplants (per million population) performed by transplanting region over 2014-2018. Transplants performed for patients residing in Tasmania and the Northern Territory are included in the figures for Victoria and South Australia, respectively. These regions share common waiting lists and allocation protocols.
Table 7.4 Transplants (pmp) by Transplanting Region and Country 2014-2018 State 2014 2015 2016 2017 2018
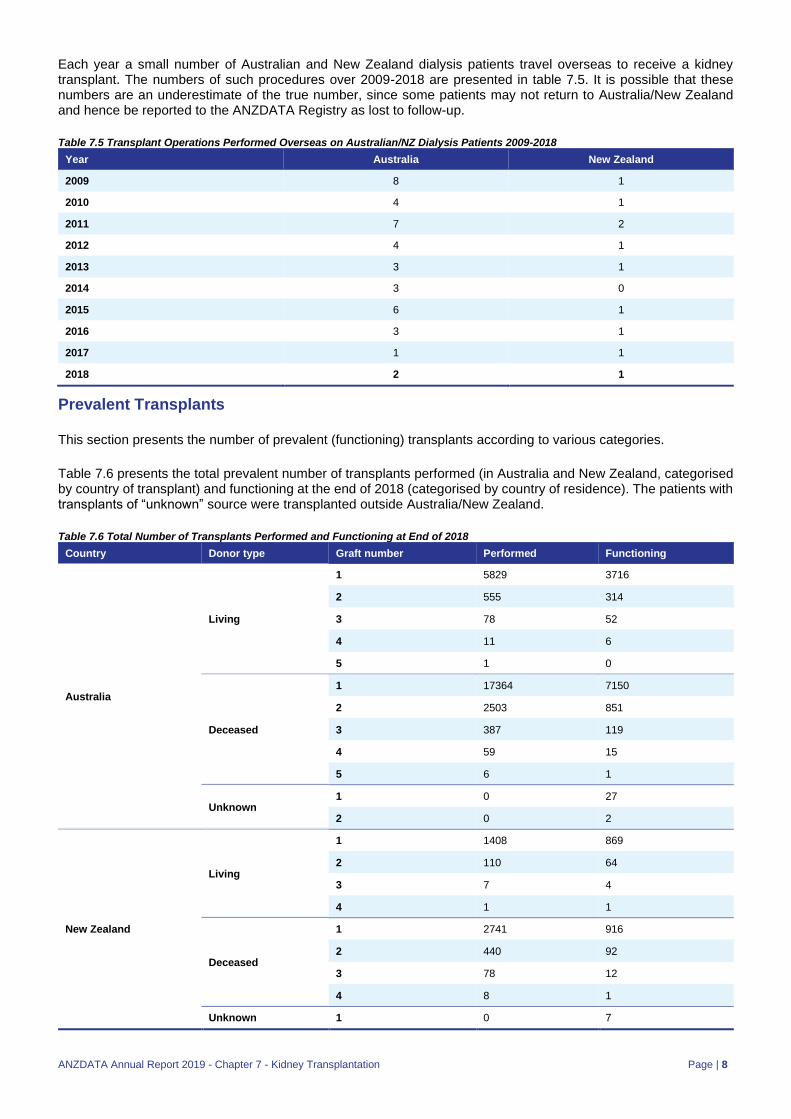
Each year a small number of Australian and New Zealand dialysis patients travel overseas to receive a kidney transplant. The numbers of such procedures over 2009-2018 are presented in table 7.5. It is possible that these numbers are an underestimate of the true number, since some patients may not return to Australia/New Zealand and hence be reported to the ANZDATA Registry as lost to follow-up.
Table 7.5 Transplant Operations Performed Overseas on Australian/NZ Dialysis Patients 2009-2018 Year Australia New Zealand
2009 8 1
2010 4 1
2011 7 2
2012 4 1
2013 3 1
2014 3 0
2015 6 1
2016 3 1
2017 1 1
2018 2 1
Prevalent Transplants
This section presents the number of prevalent (functioning) transplants according to various categories.
Table 7.6 presents the total prevalent number of transplants performed (in Australia and New Zealand, categorised by country of transplant) and functioning at the end of 2018 (categorised by country of residence). The patients with transplants of “unknown” source were transplanted outside Australia/New Zealand.
Table 7.6 Total Number of Transplants Performed and Functioning at End of 2018 Country Donor type Graft number Performed Functioning
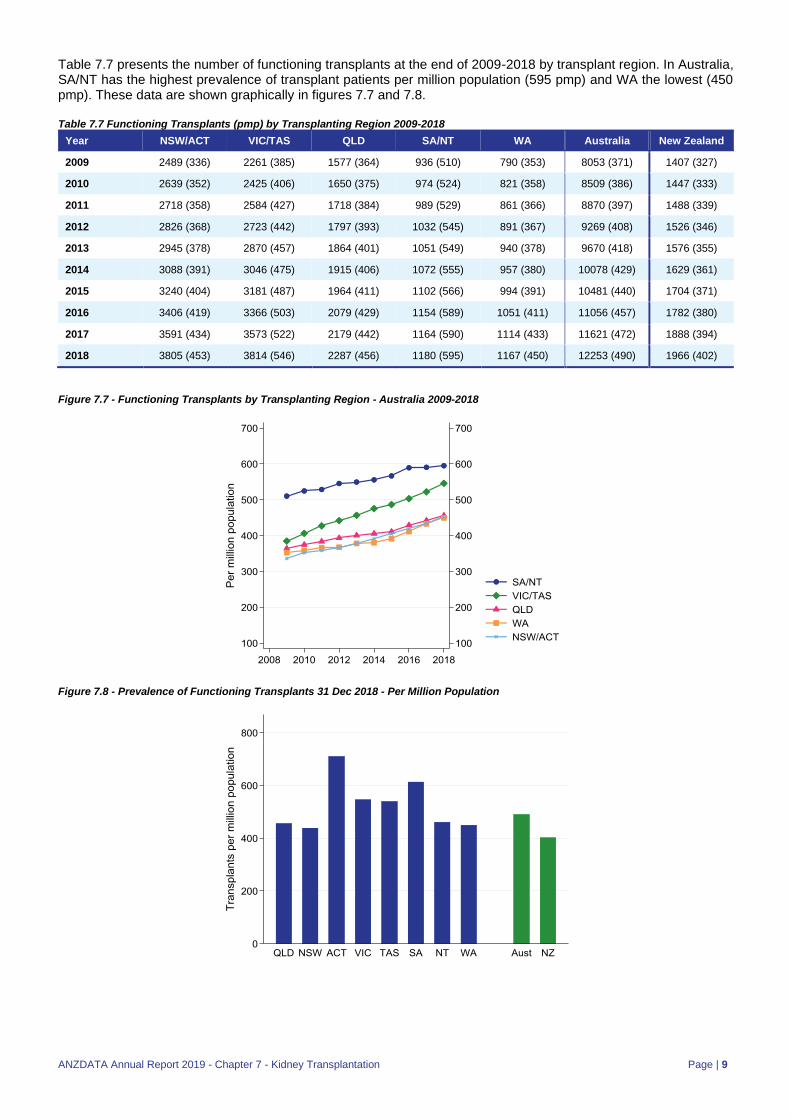
Table 7.7 presents the number of functioning transplants at the end of 2009-2018 by transplant region. In Australia, SA/NT has the highest prevalence of transplant patients per million population (595 pmp) and WA the lowest (450 pmp). These data are shown graphically in figures 7.7 and 7.8. Table 7.7 Functioning Transplants (pmp) by Transplanting Region 2009-2018
Year NSW/ACT VIC/TAS QLD SA/NT WA Australia New Zealand
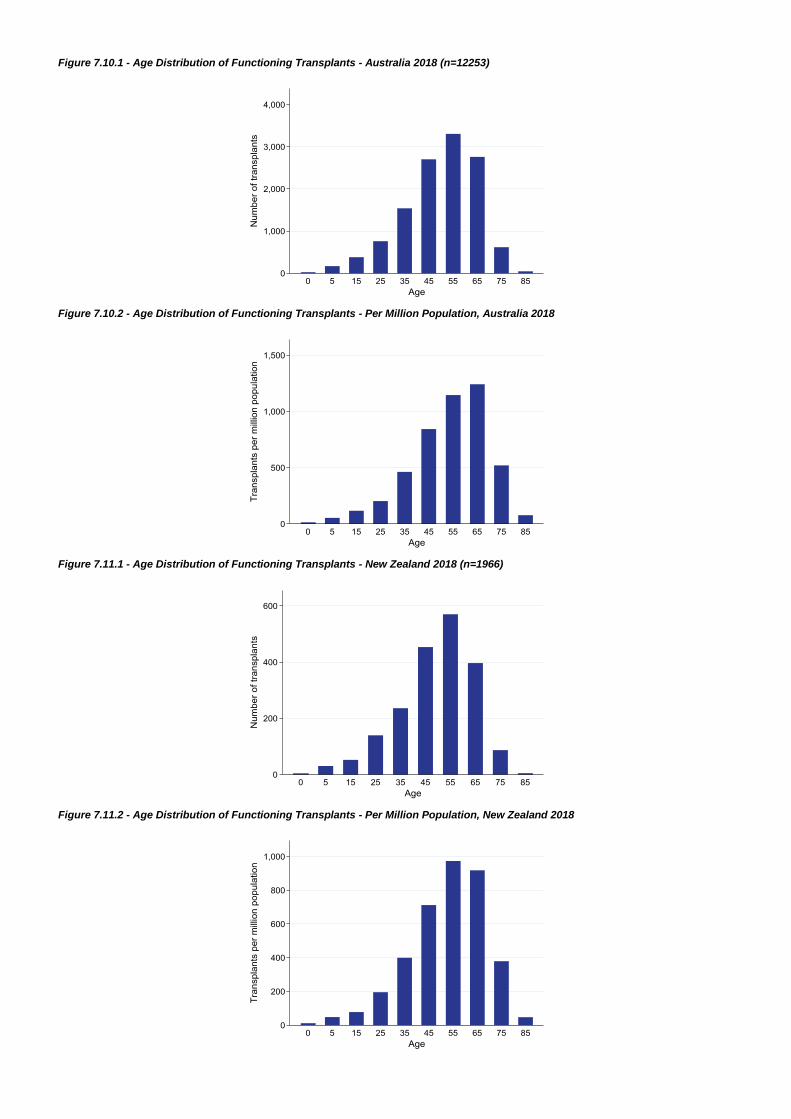
The age distribution of prevalent transplant patients as a proportion of patients on renal replacement therapy is shown in figure 7.9. There is a greater proportion of functioning live-donor grafts in younger patients. The number of prevalent transplant patients by age and donor source is shown in table 7.8. Finally, the age distribution, and distribution per million population, are shown in figures 7.10 and 7.11 for Australia and New Zealand, respectively.
Figure 7.9.1 - Prevalence of Functioning Transplants - as Mode of RRT, Australia 2018
Figure 7.9.2 - Prevalence of Functioning Transplants - as Mode of RRT, New Zealand 2018
Table 7.8 Age Distribution of Functioning Transplant Patients - 31 Dec 2018
Country Donor source
Graft number 0-4 5-14 15-24 25-34 35-44 45-54 55-64 65-74 75-84 85+ Total
Australia
All All 18 164 376 756 1532 2693 3305 2758 613 38 12253
Unknown
1 - - 1 1 8 6 7 4 - - 27
2 - - - 1 - 1 - - - - 2
All - - 1 2 8 7 7 4 - - 29
Deceased
1 7 66 145 299 742 1502 2071 1857 432 29 7150
2 - 4 25 73 117 245 225 142 19 1 851
3 - - 2 10 19 44 32 12 - - 119
4 - - - - 2 7 6 - - - 15
5 - - - - - - 1 - - - 1
All 7 70 172 382 880 1798 2335 2011 451 30 8136
Living
1 11 93 184 338 573 784 874 697 155 7 3716
2 - 1 19 29 58 83 76 40 7 1 314
3 - - - 5 12 18 12 5 - - 52
4 - - - - 1 3 1 1 - - 6
All 11 94 203 372 644 888 963 743 162 8 4088
New Zealand
All All 3 30 52 138 235 453 569 396 86 4 1966
Unknown 1 - - - - - 4 2 1 - - 7
All - - - - - 4 2 1 - - 7
Deceased
1 - 5 9 42 101 197 290 214 54 4 916
2 - - 2 6 11 31 24 17 1 - 92
3 - - - - - 6 5 - 1 - 12
4 - - - - - - 1 - - - 1
All - 5 11 48 112 234 320 231 56 4 1021
Living
1 3 25 40 83 109 188 233 158 30 - 869
2 - - 1 7 14 24 12 6 - - 64
3 - - - - - 2 2 - - - 4
4 - - - - - 1 - - - - 1
All 3 25 41 90 123 215 247 164 30 - 938
Figure 7.10.1 - Age Distribution of Functioning Transplants - Australia 2018 (n=12253)
Figure 7.10.2 - Age Distribution of Functioning Transplants - Per Million Population, Australia 2018
Figure 7.11.1 - Age Distribution of Functioning Transplants - New Zealand 2018 (n=1966)
Figure 7.11.2 - Age Distribution of Functioning Transplants - Per Million Population, New Zealand 2018
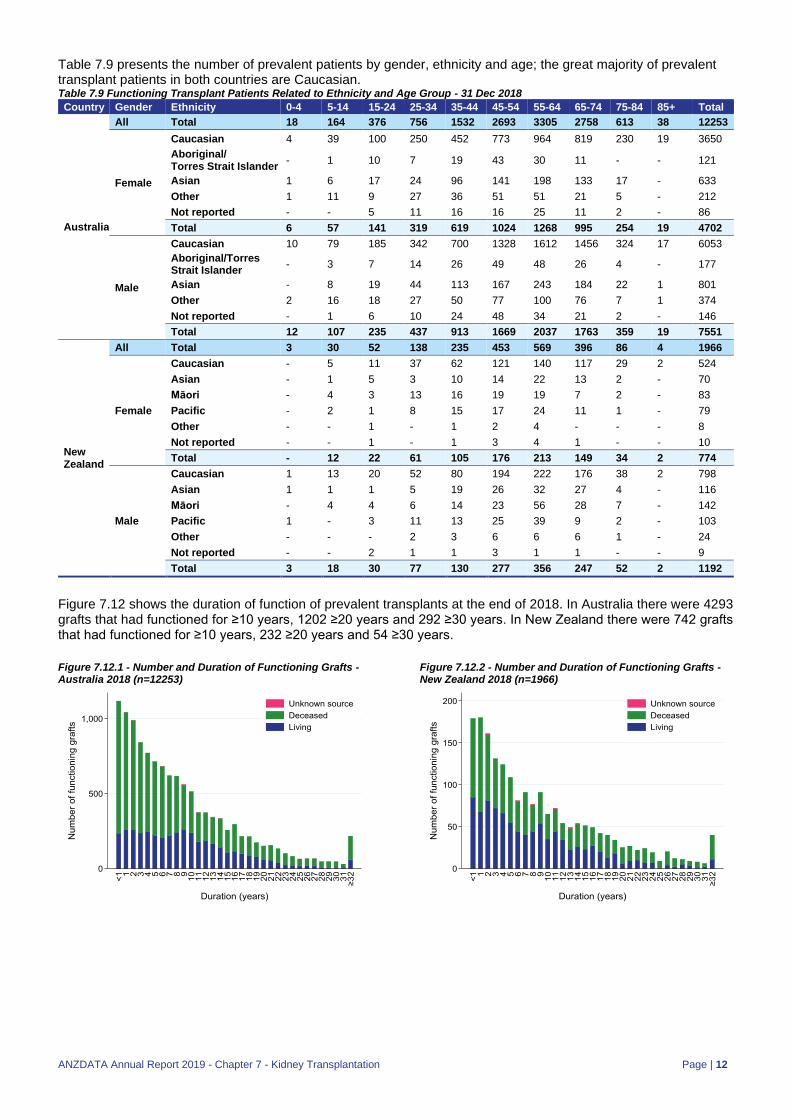
Table 7.9 presents the number of prevalent patients by gender, ethnicity and age; the great majority of prevalent transplant patients in both countries are Caucasian. Table 7.9 Functioning Transplant Patients Related to Ethnicity and Age Group - 31 Dec 2018 Country Gender Ethnicity 0-4 5-14 15-24 25-34 35-44 45-54 55-64 65-74 75-84 85+ Total
Australia
All Total 18 164 376 756 1532 2693 3305 2758 613 38 12253
Figure 7.12 shows the duration of function of prevalent transplants at the end of 2018. In Australia there were 4293 grafts that had functioned for ≥10 years, 1202 ≥20 years and 292 ≥30 years. In New Zealand there were 742 grafts that had functioned for ≥10 years, 232 ≥20 years and 54 ≥30 years.
Figure 7.12.1 - Number and Duration of Functioning Grafts - Australia 2018 (n=12253)
Figure 7.12.2 - Number and Duration of Functioning Grafts - New Zealand 2018 (n=1966)
Table 7.10 presents the overall graft loss rate in 2009-2018 by country, stratified into graft failure and death with a functioning graft. These rates are expressed as graft losses per 100 graft-years. Approximately half of grafts are lost due to graft failure and half due to patient death.
Table 7.10 Graft Loss Rate 2009-2018 Country Outcome 2009 2010 2011 2012 2013 2014 2015 2016 2017 2018
The causes of graft loss over 2009-2018 are presented in table 7.11. The Registry is in the process of revising the reportable causes of graft loss. Chronic allograft nephropathy dominates the causes of graft failure, whilst graft failure due to acute rejection is an uncommon event. These data are further categorised by timing post-transplant (first year versus later years) for 2014-2018 in table 7.12. Cancer and cardiovascular disease are the most common causes of death with a functioning graft in both Australia and New Zealand.
Table 7.11 Causes of Graft Loss 2009-2018 Country Cause of graft loss 2009 2010 2011 2012 2013 2014 2015 2016 2017 2018 Total
Australia
Death with function 149 178 223 174 232 215 229 241 240 221 2102
The use of antibodies for induction immunosuppression is shown in table 7.13.
Table 7.13 Antibody Use for Induction Immunosuppression 2014-2018; Number of Kidney Transplant Recipients Receiving Each Agent by Year (% Total New Transplants)
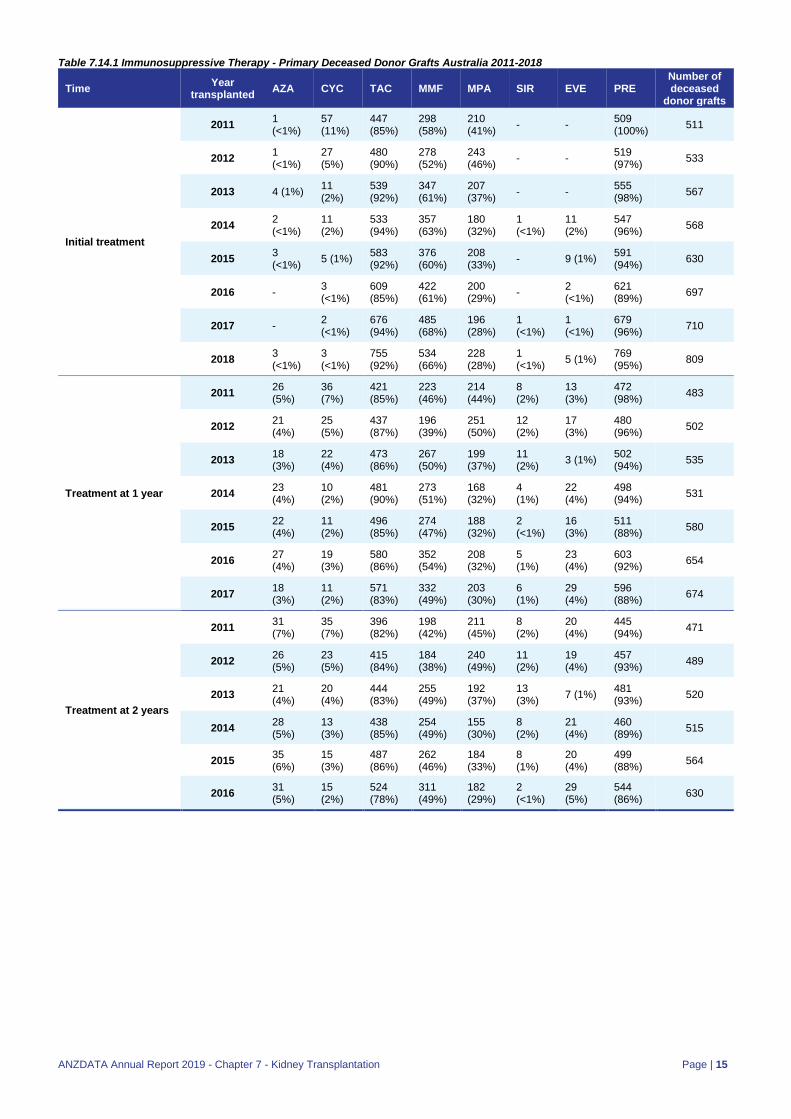
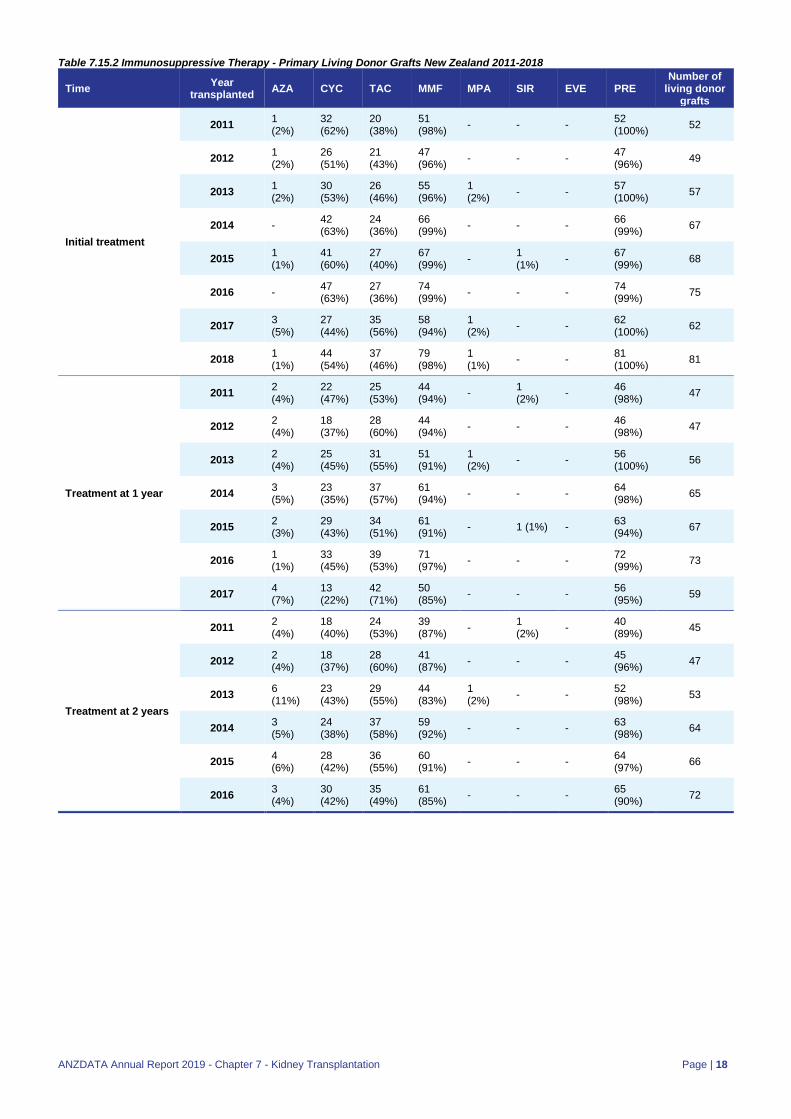
Immunosuppressive therapy at baseline, 1 and 2 years post-transplant for primary grafts over 2011-2018 is presented for deceased and living donors in tables 7.14 and 7.15, respectively. Tacrolimus is the most commonly prescribed calcineurin inhibitor in Australia, whereas in New Zealand cyclosporin predominates.
Table 7.15.2 Immunosuppressive Therapy - Primary Living Donor Grafts New Zealand 2011-2018
Time Year transplanted AZA CYC TAC MMF MPA SIR EVE PRE
Number of living donor
grafts
Initial treatment
2011 1 (2%)
32 (62%)
20 (38%)
51 (98%) - - - 52
(100%) 52
2012 1 (2%)
26 (51%)
21 (43%)
47 (96%) - - - 47
(96%) 49
2013 1 (2%)
30 (53%)
26 (46%)
55 (96%)
1 (2%) - - 57
(100%) 57
2014 - 42 (63%)
24 (36%)
66 (99%) - - - 66
(99%) 67
2015 1 (1%)
41 (60%)
27 (40%)
67 (99%) - 1
(1%) - 67 (99%) 68
2016 - 47 (63%)
27 (36%)
74 (99%) - - - 74
(99%) 75
2017 3 (5%)
27 (44%)
35 (56%)
58 (94%)
1 (2%) - - 62
(100%) 62
2018 1 (1%)
44 (54%)
37 (46%)
79 (98%)
1 (1%) - - 81
(100%) 81
Treatment at 1 year
2011 2 (4%)
22 (47%)
25 (53%)
44 (94%) - 1
(2%) - 46 (98%) 47
2012 2 (4%)
18 (37%)
28 (60%)
44 (94%) - - - 46
(98%) 47
2013 2 (4%)
25 (45%)
31 (55%)
51 (91%)
1 (2%) - - 56
(100%) 56
2014 3 (5%)
23 (35%)
37 (57%)
61 (94%) - - - 64
(98%) 65
2015 2 (3%)
29 (43%)
34 (51%)
61 (91%) - 1 (1%) - 63
(94%) 67
2016 1 (1%)
33 (45%)
39 (53%)
71 (97%) - - - 72
(99%) 73
2017 4 (7%)
13 (22%)
42 (71%)
50 (85%) - - - 56
(95%) 59
Treatment at 2 years
2011 2 (4%)
18 (40%)
24 (53%)
39 (87%) - 1
(2%) - 40 (89%) 45
2012 2 (4%)
18 (37%)
28 (60%)
41 (87%) - - - 45
(96%) 47
2013 6 (11%)
23 (43%)
29 (55%)
44 (83%)
1 (2%) - - 52
(98%) 53
2014 3 (5%)
24 (38%)
37 (58%)
59 (92%) - - - 63
(98%) 64
2015 4 (6%)
28 (42%)
36 (55%)
60 (91%) - - - 64
(97%) 66
2016 3 (4%)
30 (42%)
35 (49%)
61 (85%) - - - 65
(90%) 72
Rejection
The proportion of patients experiencing any rejection episode by 6 months post-transplant, stratified by donor type and graft number, is presented in table 7.16. Antibody-mediated rejection rates are presented in table 7.17; rates are notably higher in re-grafts. Years shown are those in which the transplants were performed.
Table 7.16 Rejection Rates at Six Months Post-Transplant 2008-2017 Donor Type Graft Number 2008 2009 2010 2011 2012 2013 2014 2015 2016 2017
Living donor First 17.0% 16.8% 17.8% 17.5% 14.1% 19.2% 22.4% 17.1% 17.4% 19.1%
Second and subsequent 30.0% 24.3% 12.9% 19.2% 10.0% 16.1% 28.6% 11.1% 16.7% 21.6%
Second and subsequent 15.8% 24.3% 13.0% 11.3% 10.3% 10.3% 12.9% 17.6% 8.6% 9.7%
Table 7.18 shows the number of people who received antibody agents for treating acute rejection by calendar year. The number is also reported as a proportion of new transplant recipients in each calendar year, but readers should be aware that although the large majority of people experiencing acute rejection do so within the first six months of transplantation, some experience rejection after this time (when they would not necessarily be counted as a new transplant). For this reason the total number of transplant recipients treated during the year is also reported.
Table 7.18 Antibody Therapy for Acute Rejection 2014-2018 Country Type of agent 2014 2015 2016 2017 2018
Total transplants at risk 1714 1776 1876 1969 2070
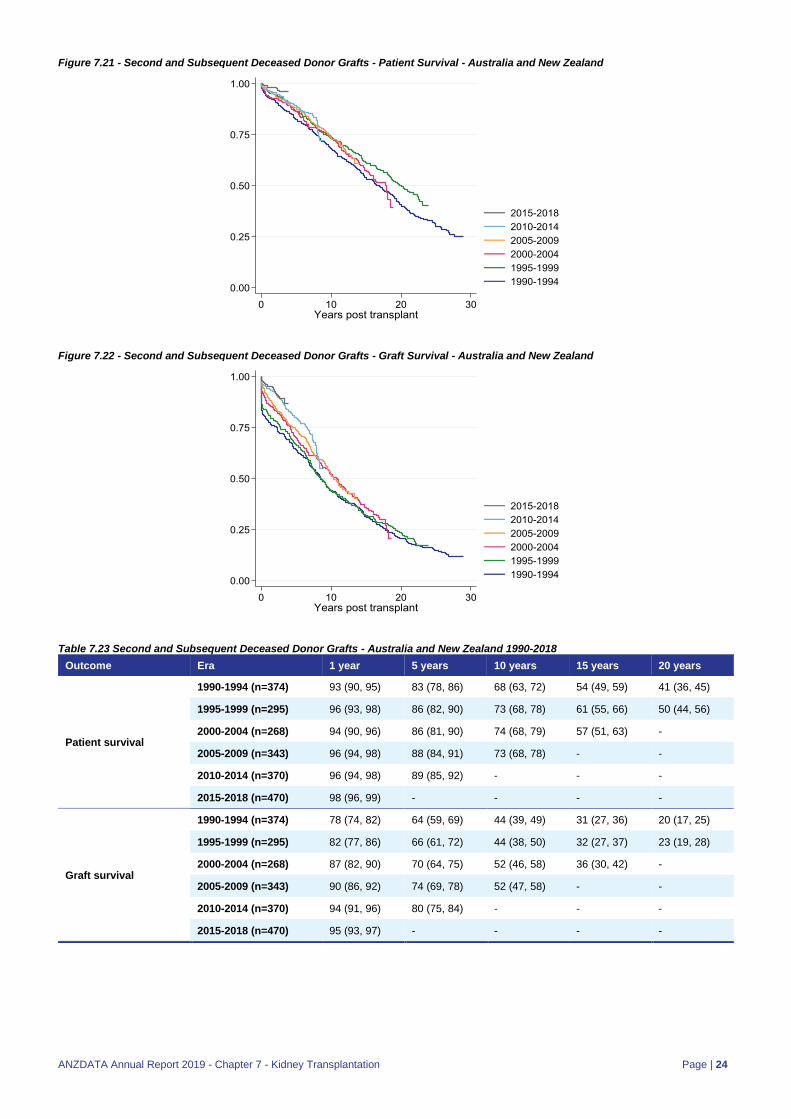
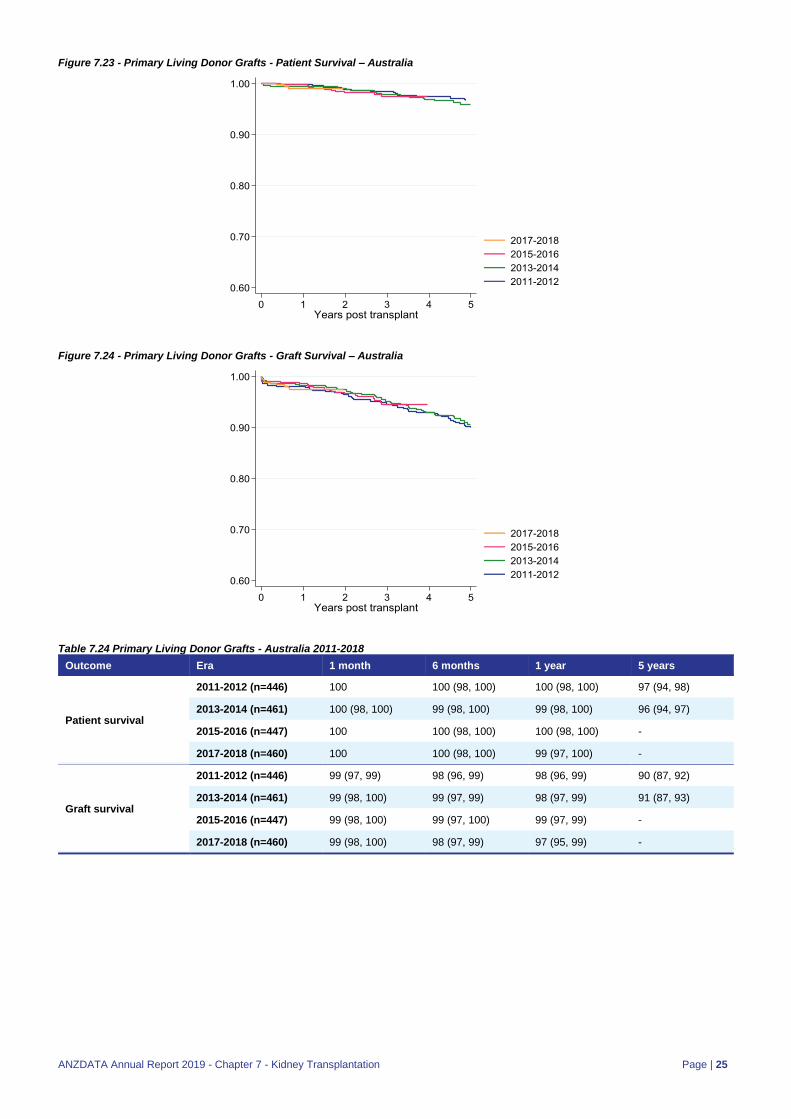
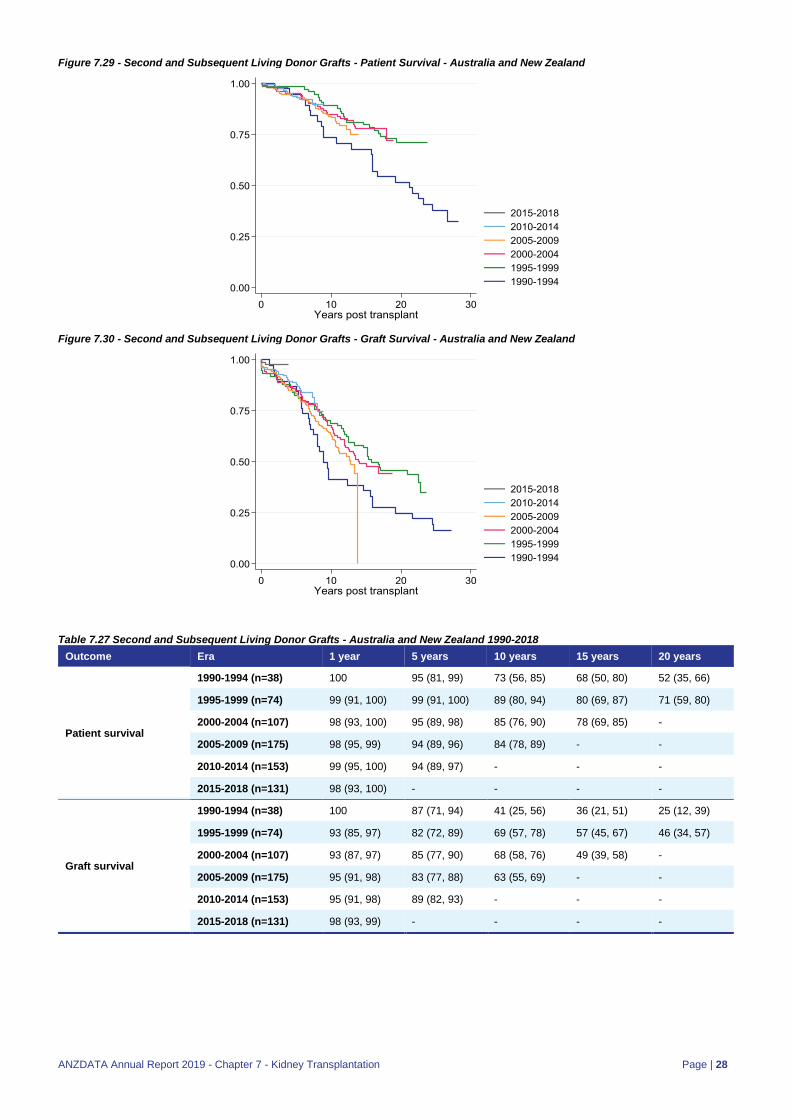
Patient and Graft Survival
The remainder of the chapter presents patient and graft survival by transplant era and within a number of different categories combining country, graft number and donor type. Each page shows the patient and graft survival graphically, and in tabular form (with 95% confidence intervals) at selected time-points post-transplant. In each case the survivor function is calculated using the Kaplan-Meier method. Graft survival is not censored for death. All of these survival statistics are unadjusted. Note that in the survival graphs out to 5 years, the y axis ranges from 0.60 to 1.00 in order to show the differences between the eras more clearly, whereas in the long-term graphs (out to 30 years) the y axis starts at 0.