Page 1
Point of Contact: [email protected] (+32 9 210 9860)
“A scorecard for bank performance:
the Belgian Banking Industry.”
Prof. Dr. André Thibeault, Corneel Defrancq and Jessie Vantieghem
Vlerick Centre for Financial Services
Page 3
Table of Contents
THE KPMG – VLERICK PRIME FOUNDATION PARTNERSHIP .................................................................... 1
Acknowledgment .................................................................................................................................... 3
Executive Summary ................................................................................................................................. 5
Introduction ............................................................................................................................................ 7
Structure of the report ............................................................................................................................ 7
Chapter 1: Industry overview ................................................................................................................. 9
Contribution to the Belgian economy ............................................................................................... 10
Trends over time ........................................................................................................................... 10
Savings ratio of households .............................................................................................................. 14
Banking sector’s contribution compared with European peers ....................................................... 16
Internationalisation of the Belgian banking landscape .................................................................... 18
Chapter 2: The value chain ................................................................................................................... 19
Sample selection and segments description..................................................................................... 20
Sample Selection ........................................................................................................................... 20
ECB segmentation ......................................................................................................................... 20
Size segmentation ......................................................................................................................... 22
Fortis Bank SA/ NV-BNP Paribas Fortis ................................................................................................. 22
ING Belgium SA/NV-ING ........................................................................................................................ 22
BankScope segmentation.............................................................................................................. 23
Operational income to total assets ................................................................................................... 24
Net interest income to total assets................................................................................................... 27
Net commissions and fees to total assets......................................................................................... 32
Financial transactions to total assets ................................................................................................ 36
Operational expenses to total assets ................................................................................................ 40
Loan loss provisions to total assets................................................................................................... 45
Conclusion ......................................................................................................................................... 48
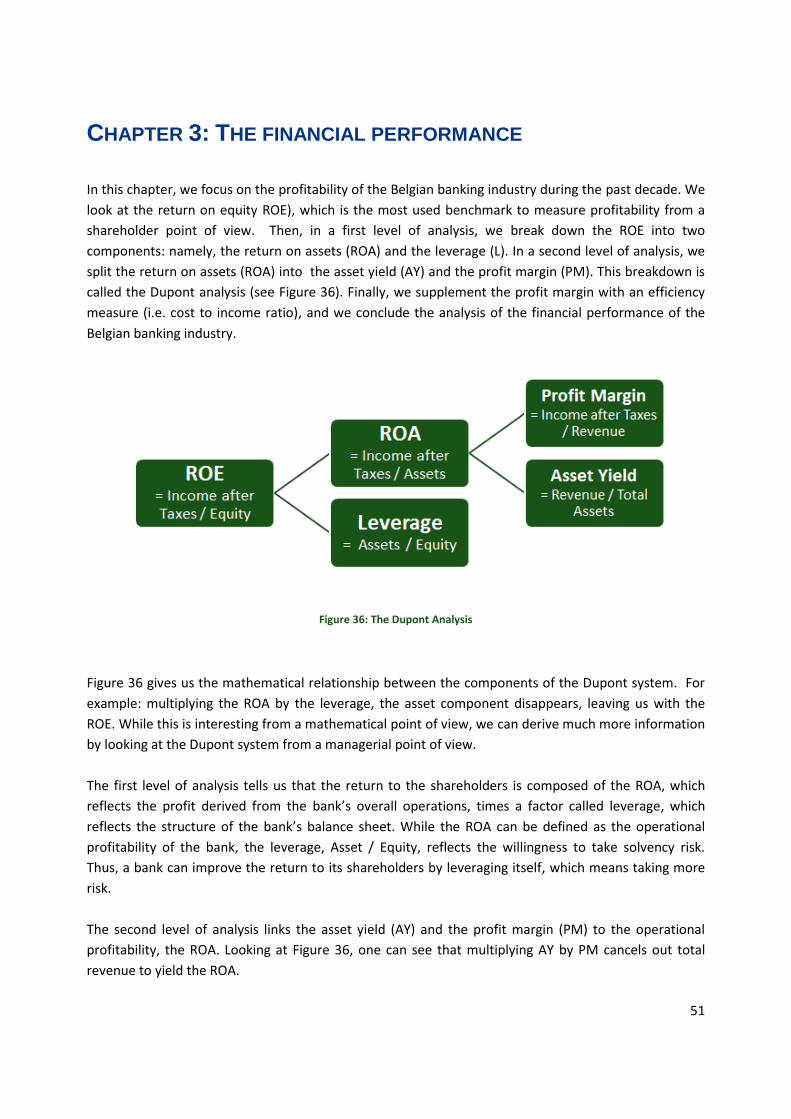
Chapter 3: The financial performance .................................................................................................. 51
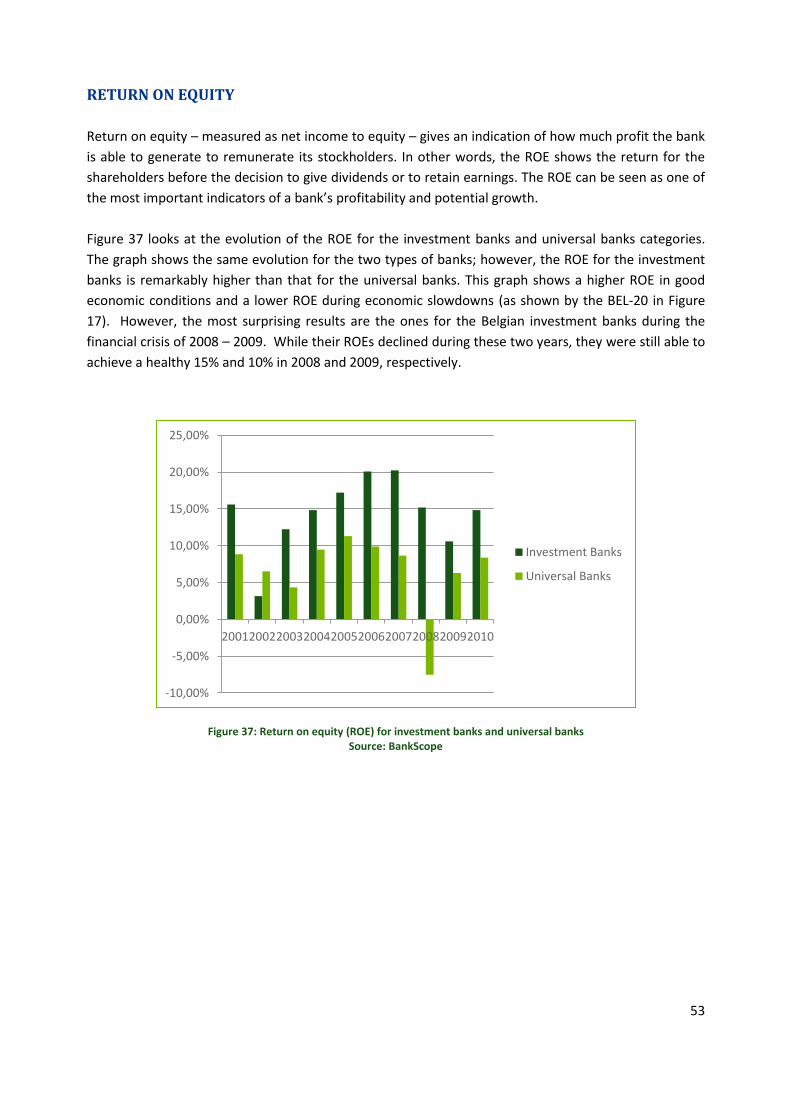
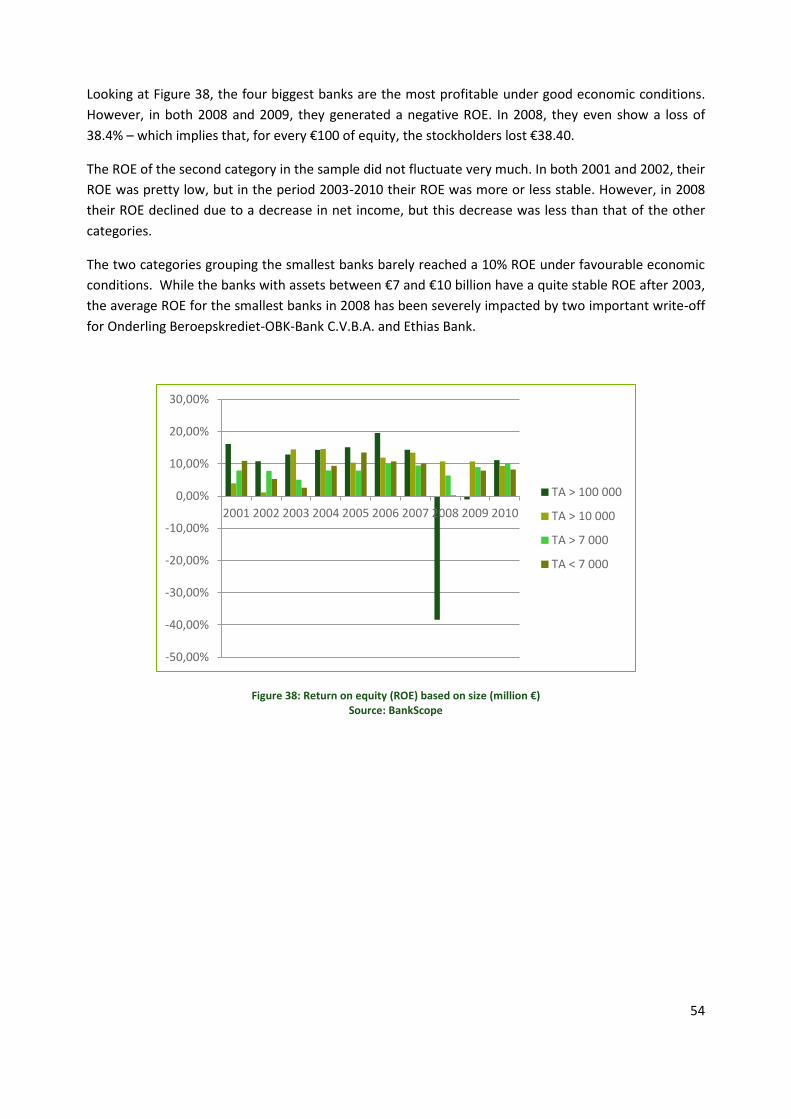
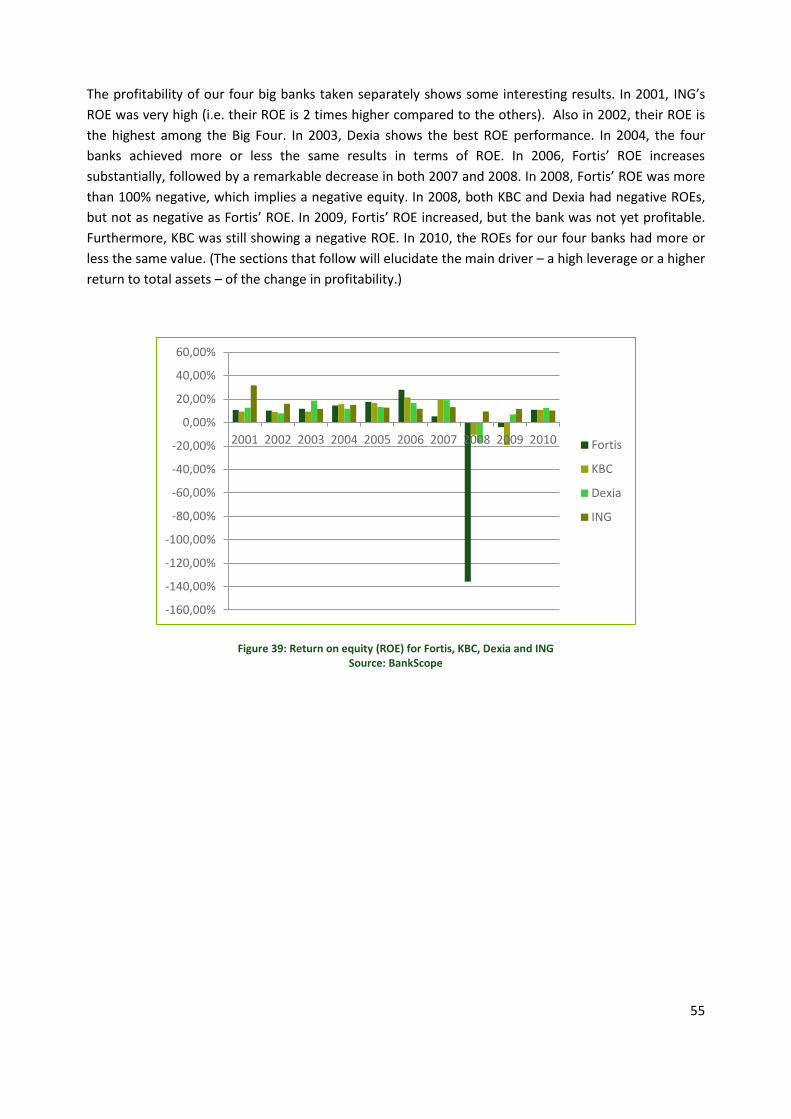
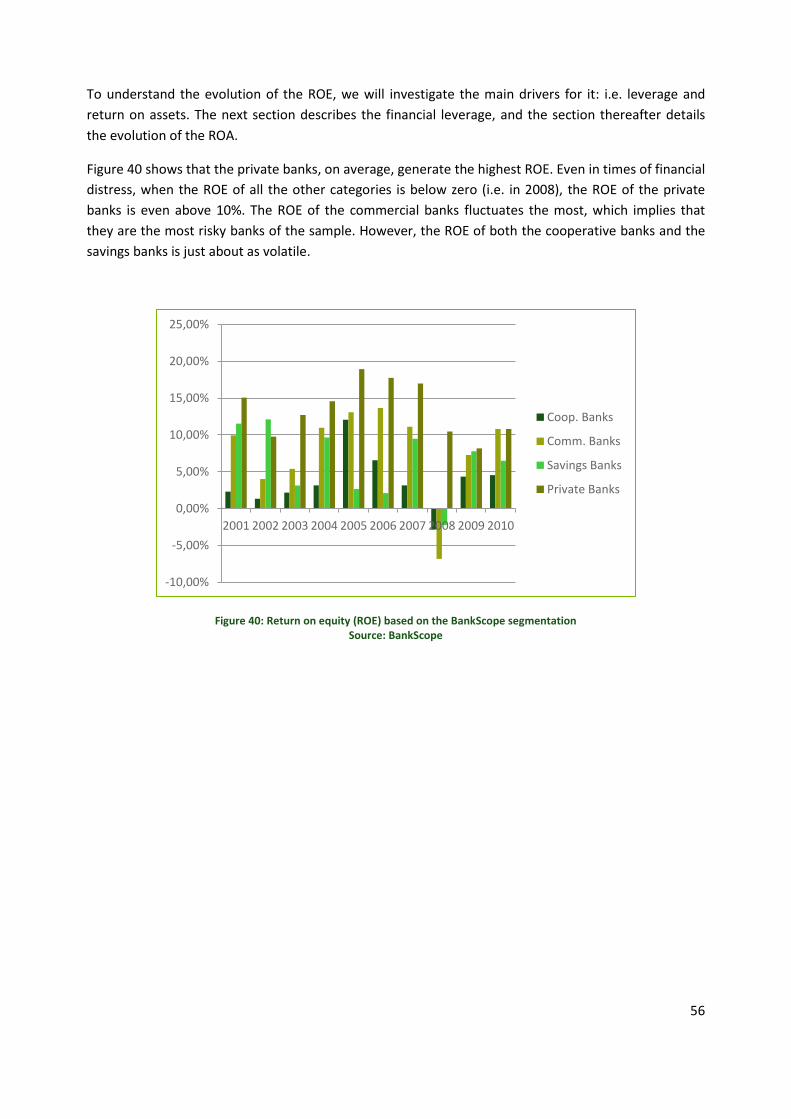
Return on equity ............................................................................................................................... 53
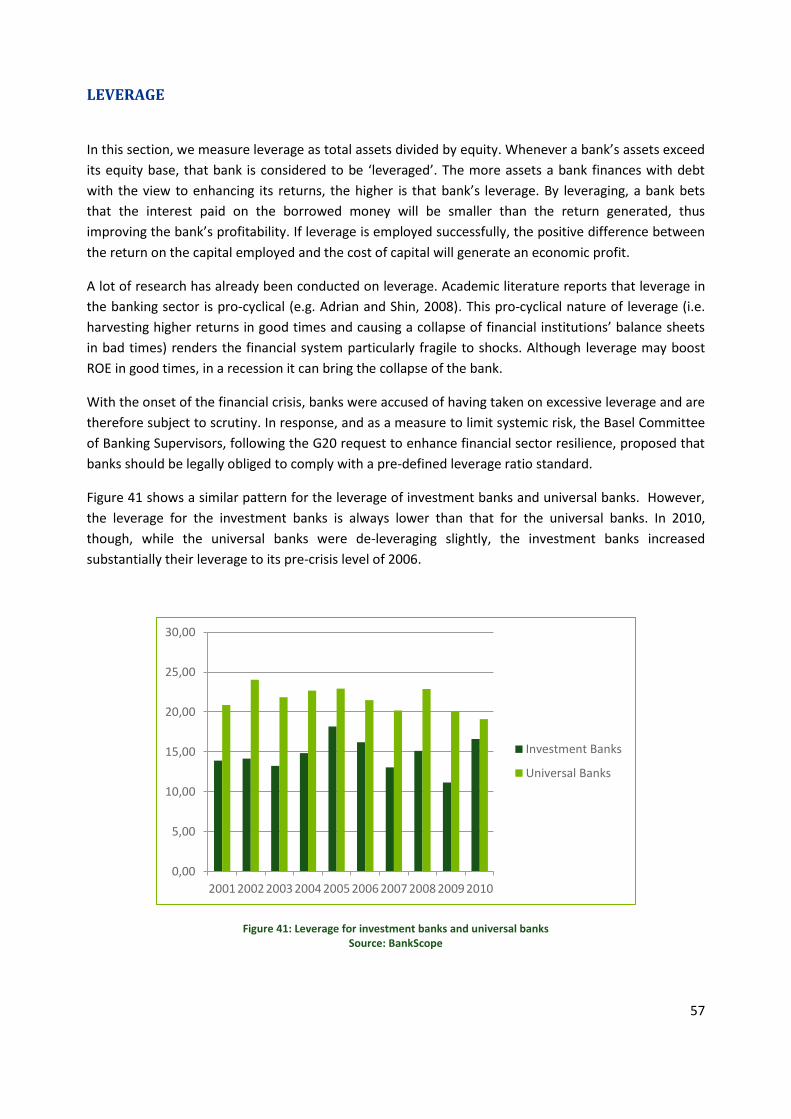
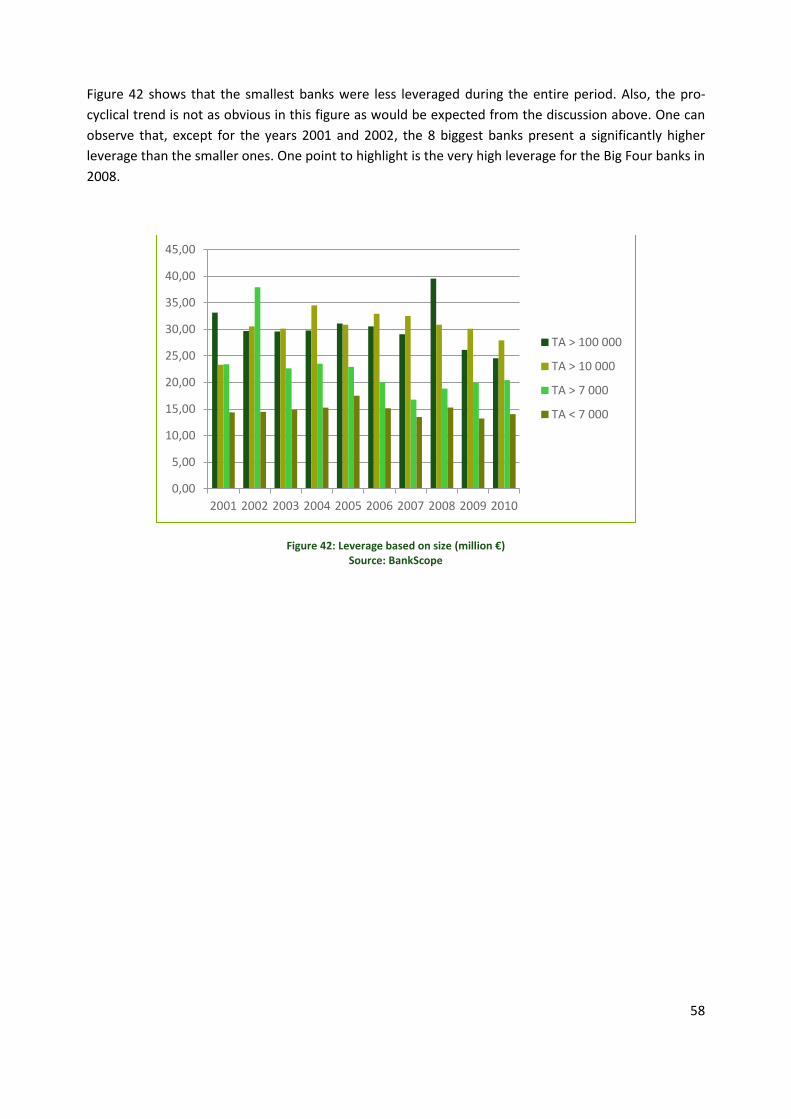
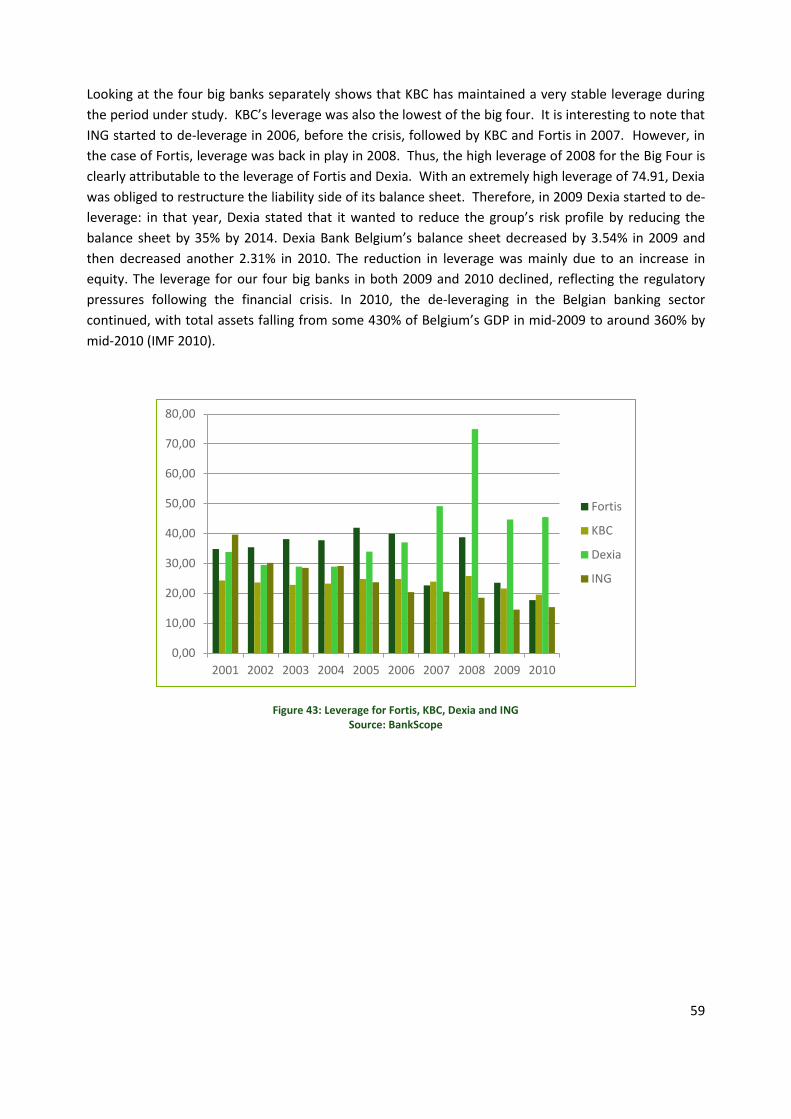
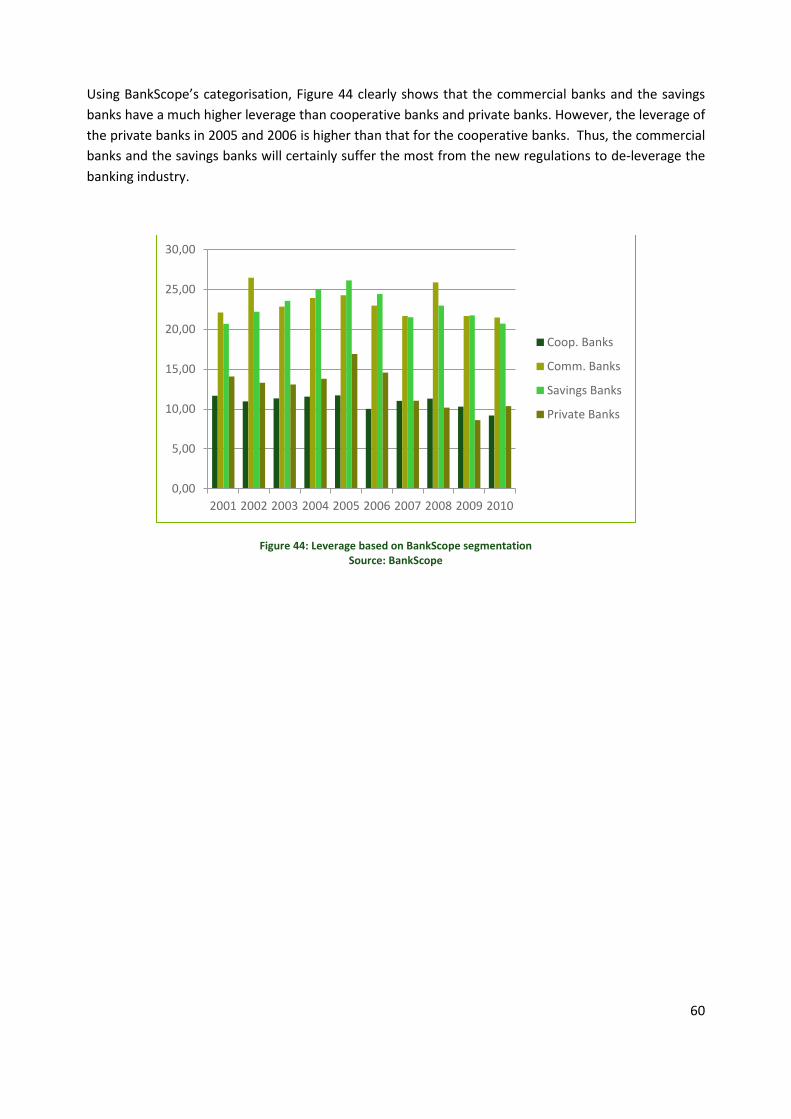
Leverage ............................................................................................................................................ 57
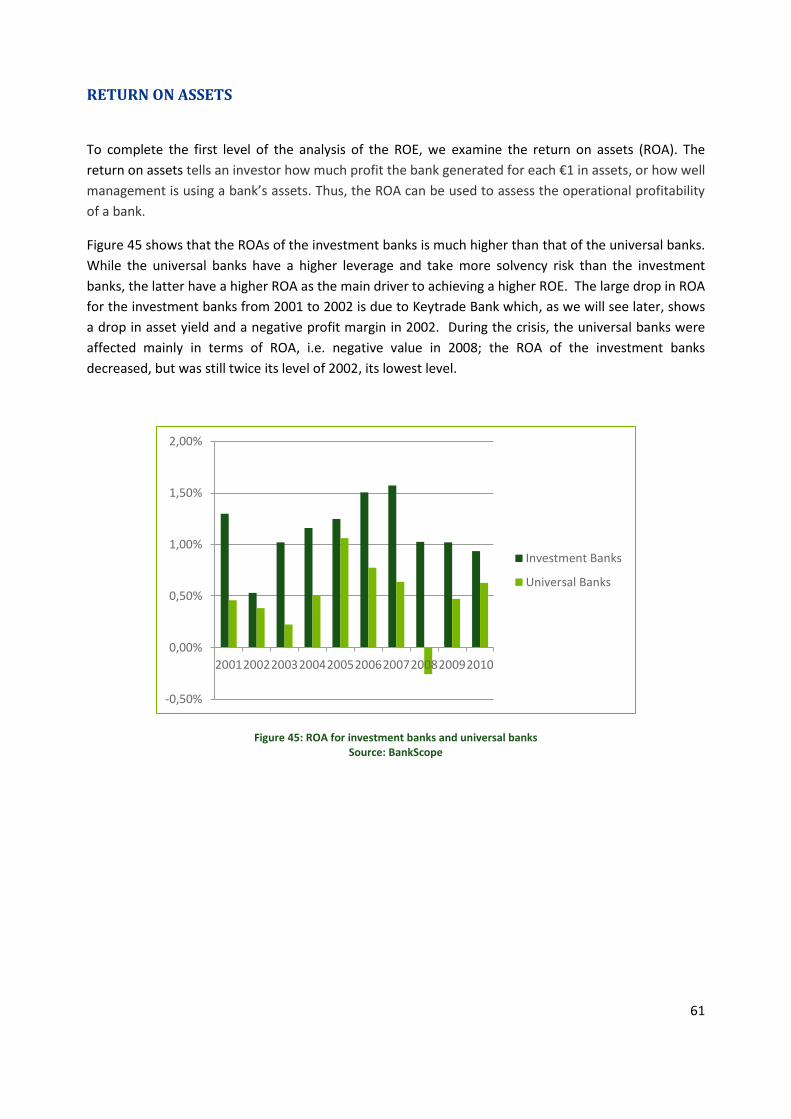
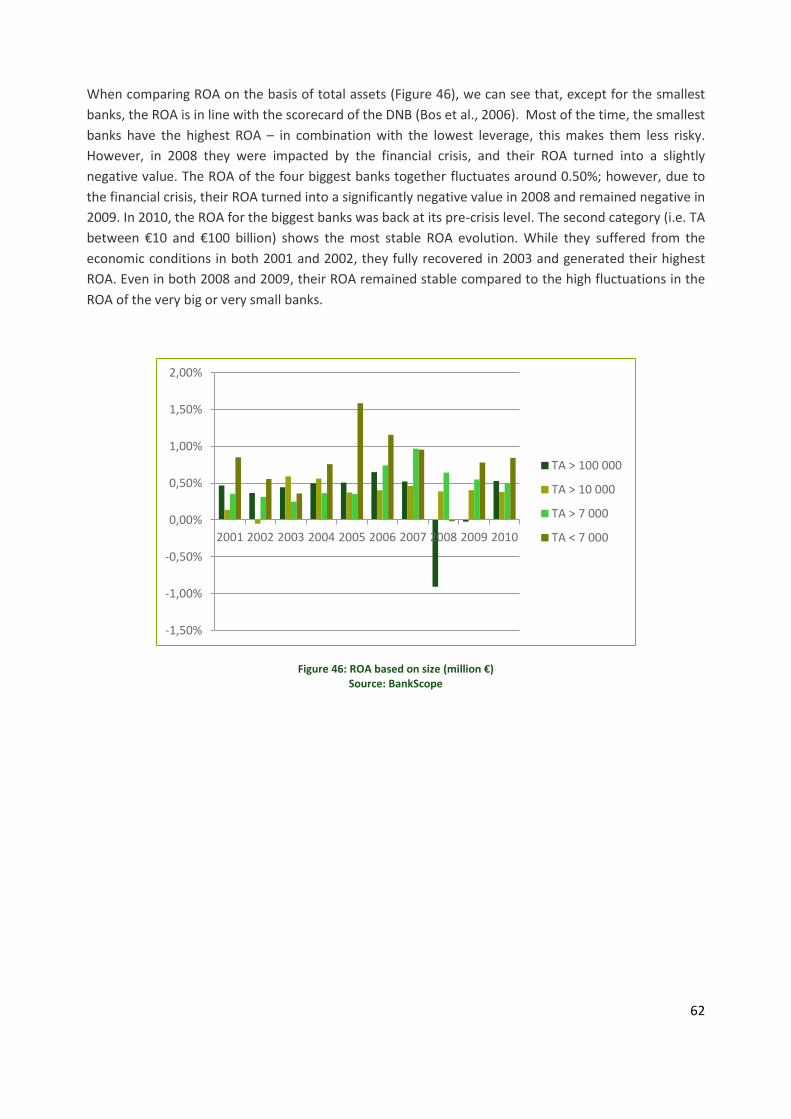
Return on assets ............................................................................................................................... 61
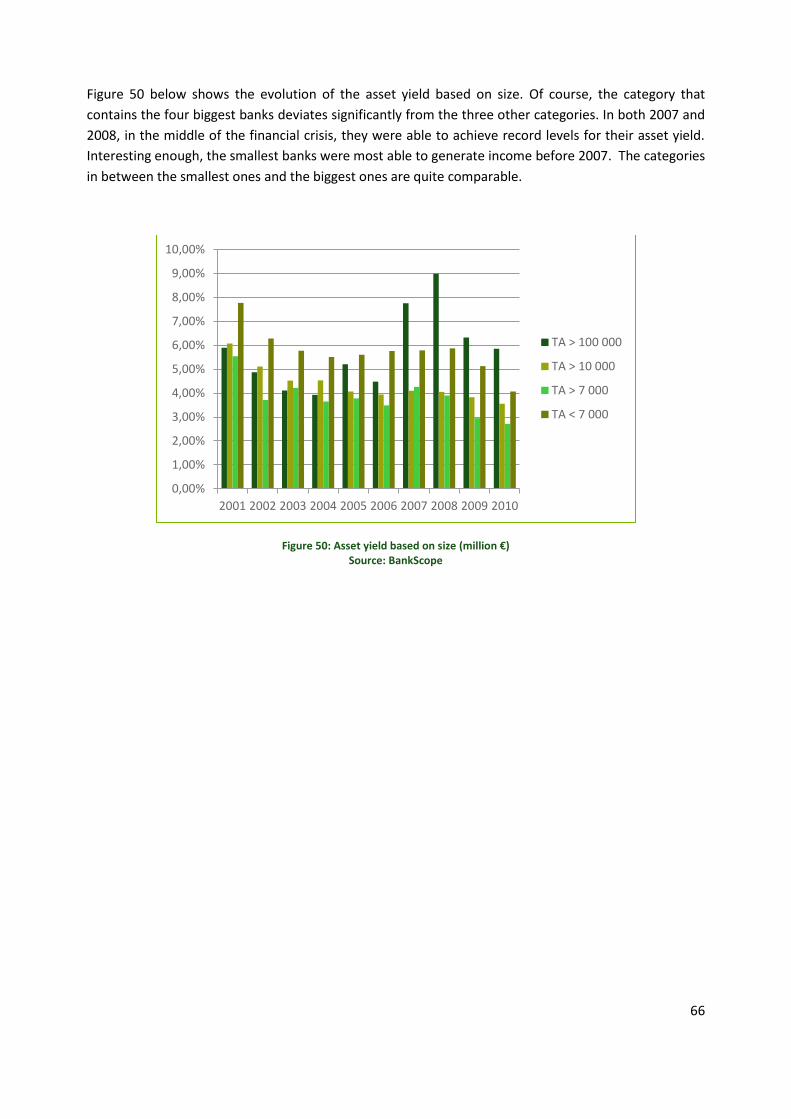
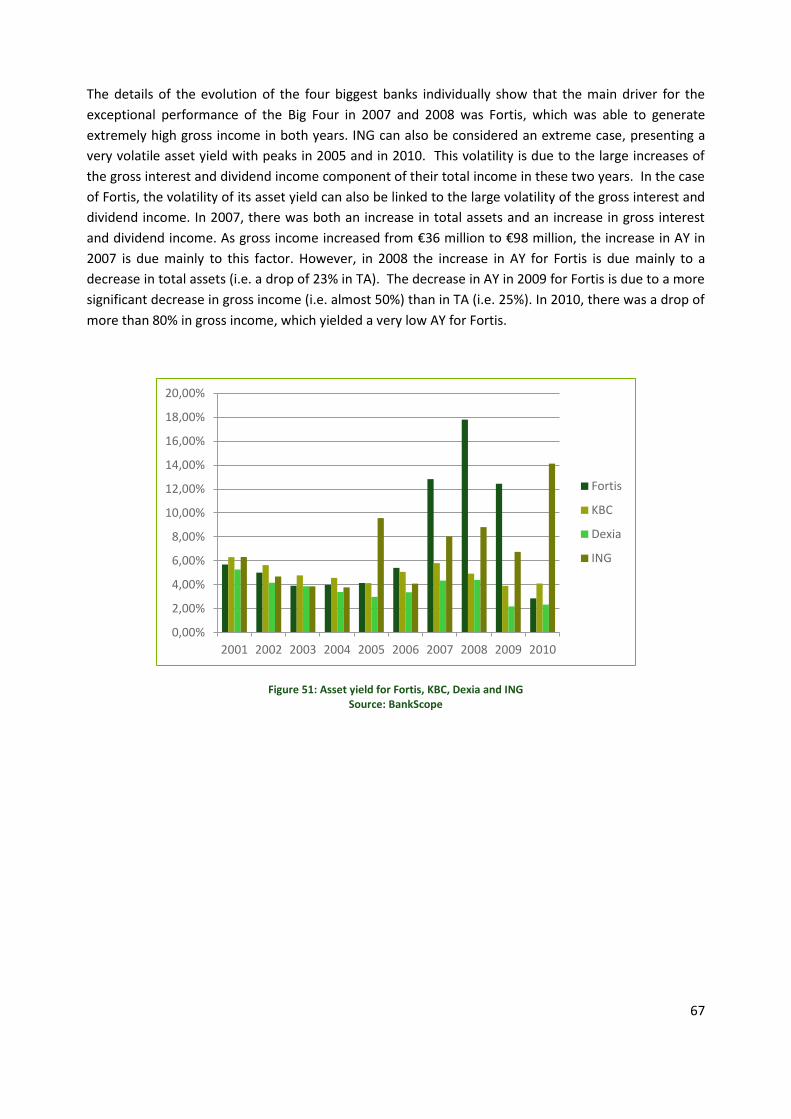
Asset yield ......................................................................................................................................... 65
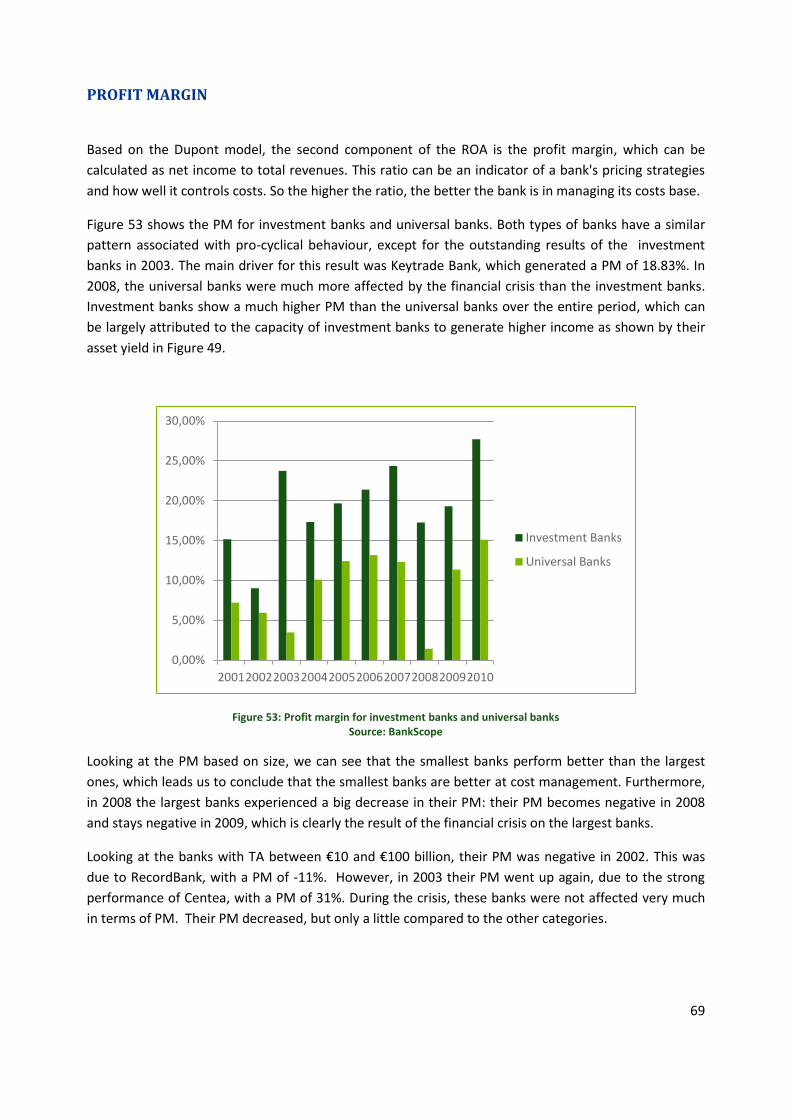
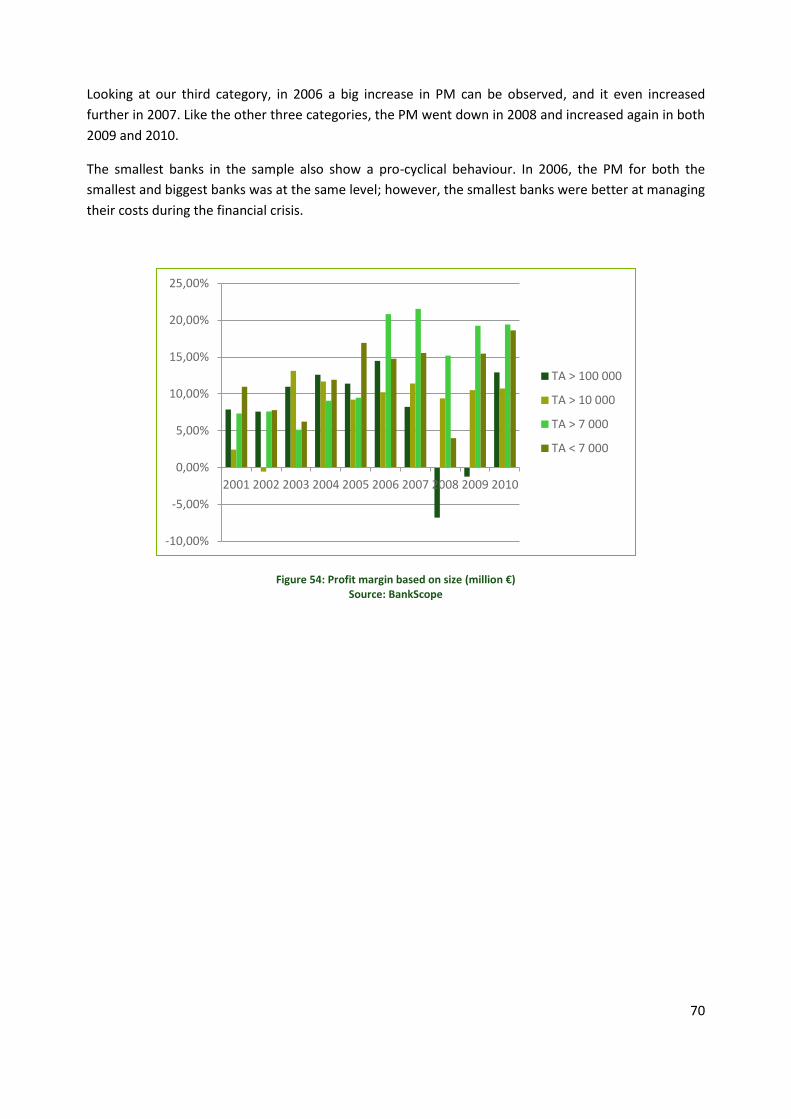
Profit margin ..................................................................................................................................... 69
Page 4
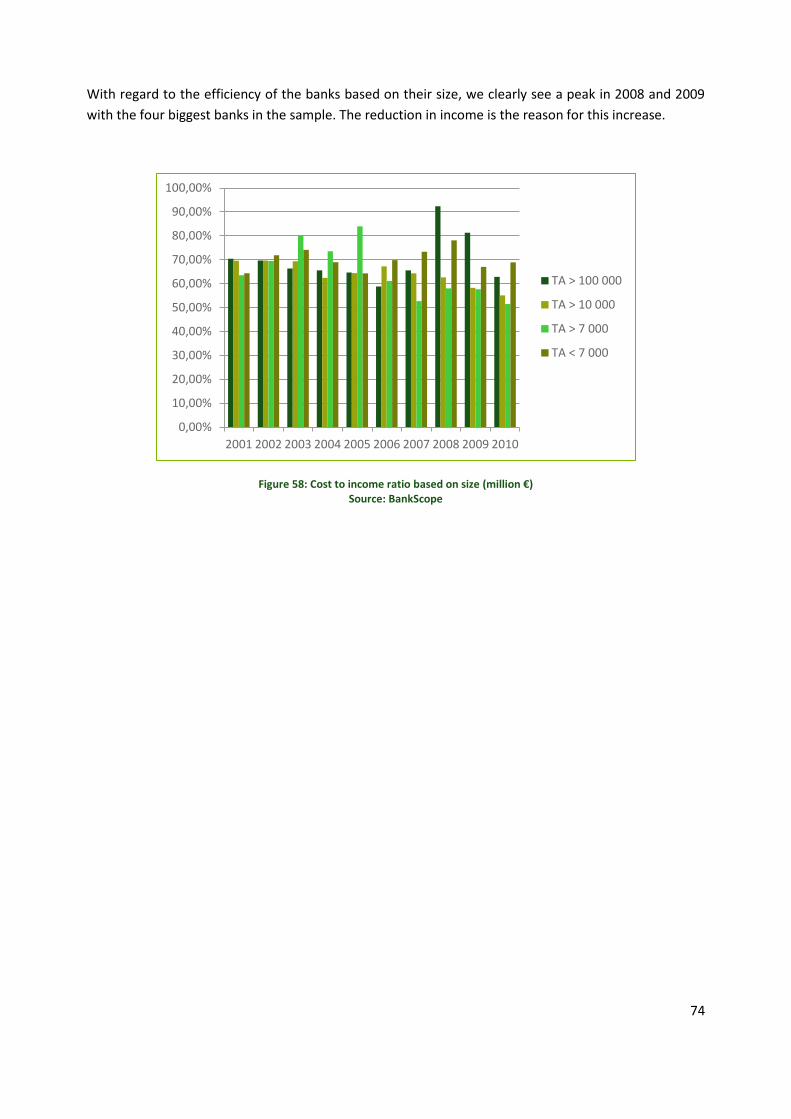
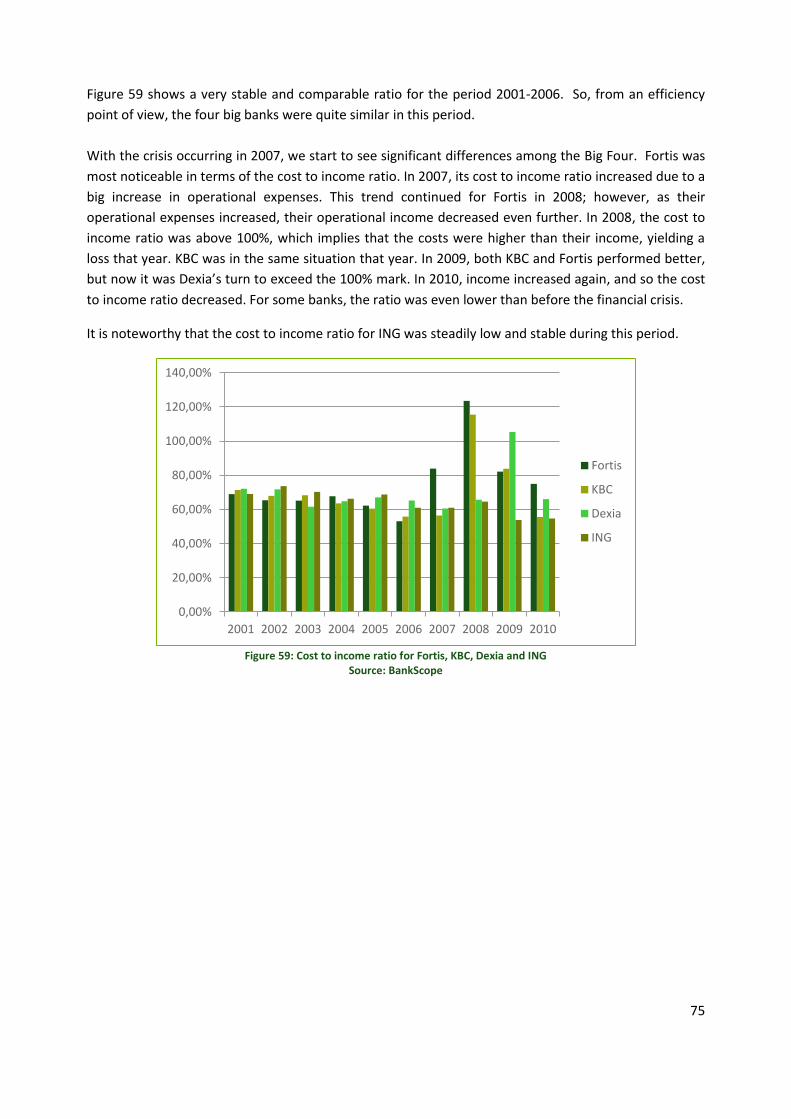
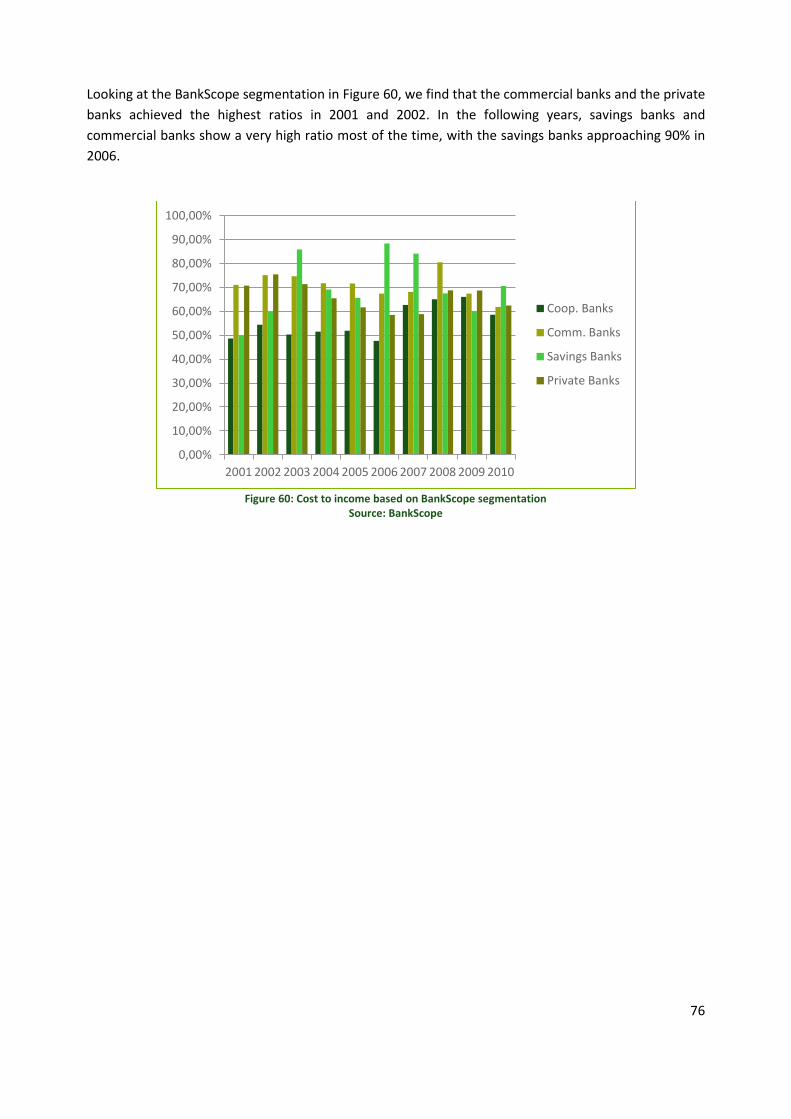
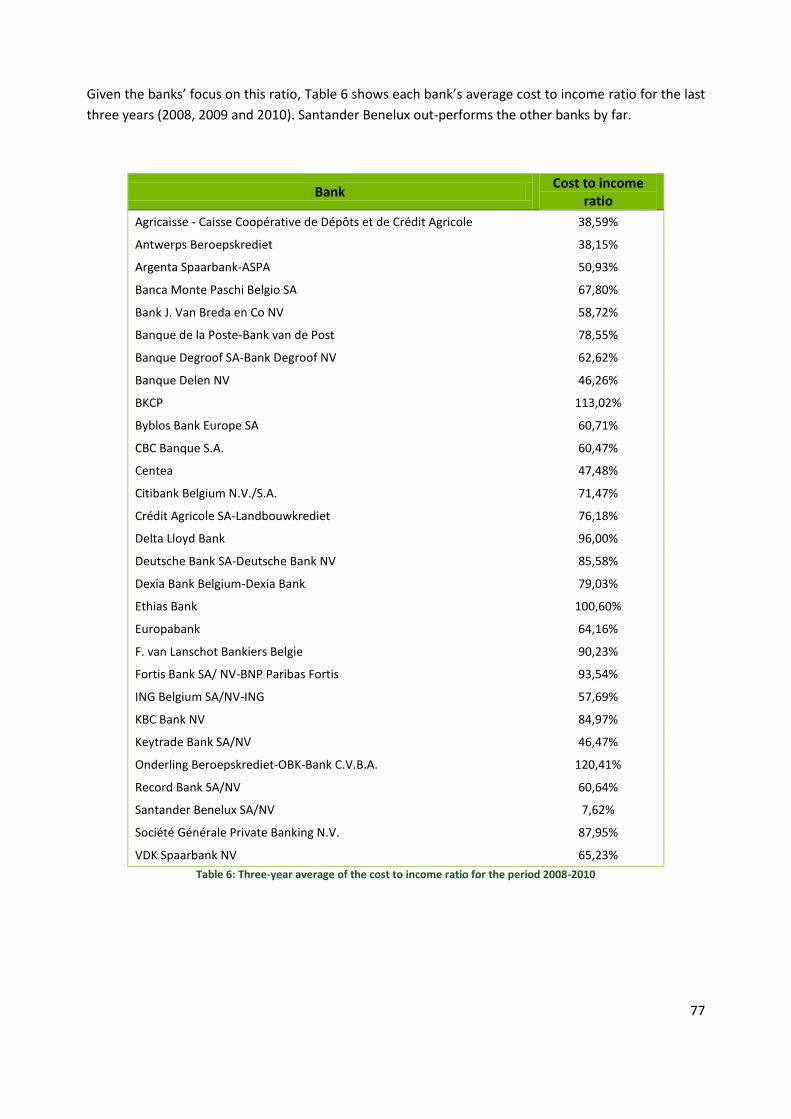
Cost to income .................................................................................................................................. 73
Conclusion ......................................................................................................................................... 78
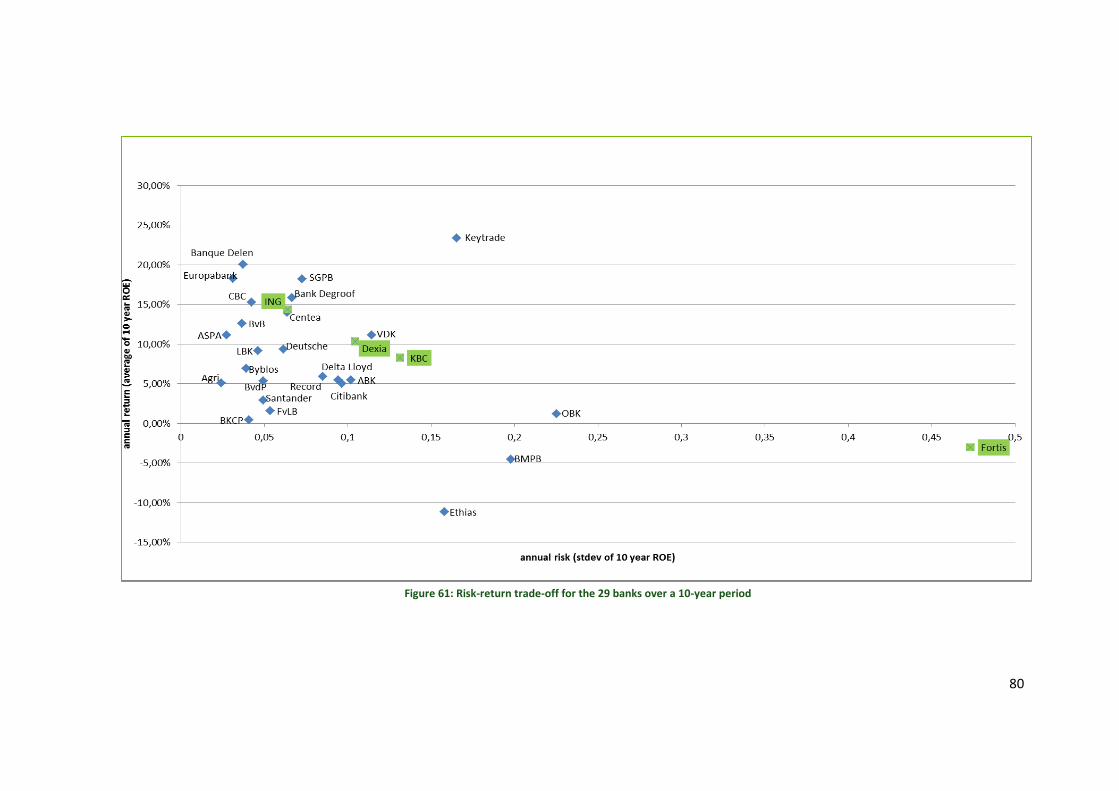
Chapter 4: The risk-return trade-off ..................................................................................................... 79
Chapter 5: What did we learn in this study? ........................................................................................ 83
References ............................................................................................................................................ 85
Appendices ............................................................................................................................................ 88
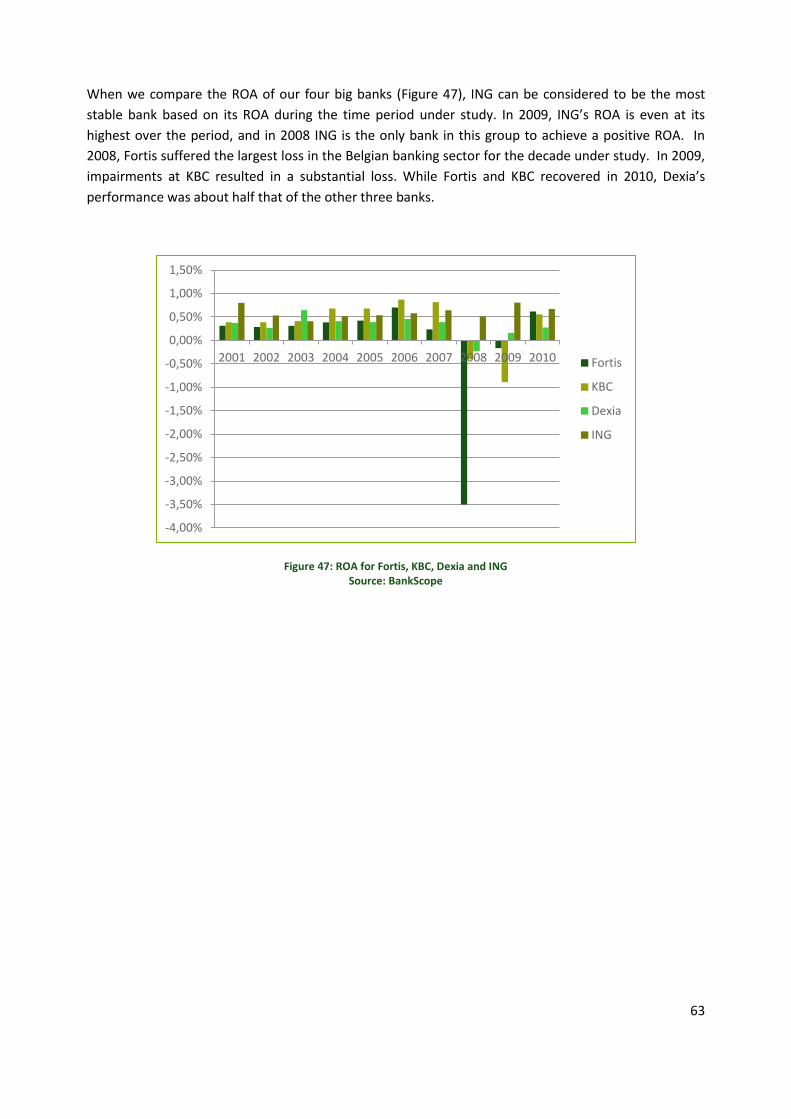
Appendix 1: The ratios ...................................................................................................................... 88
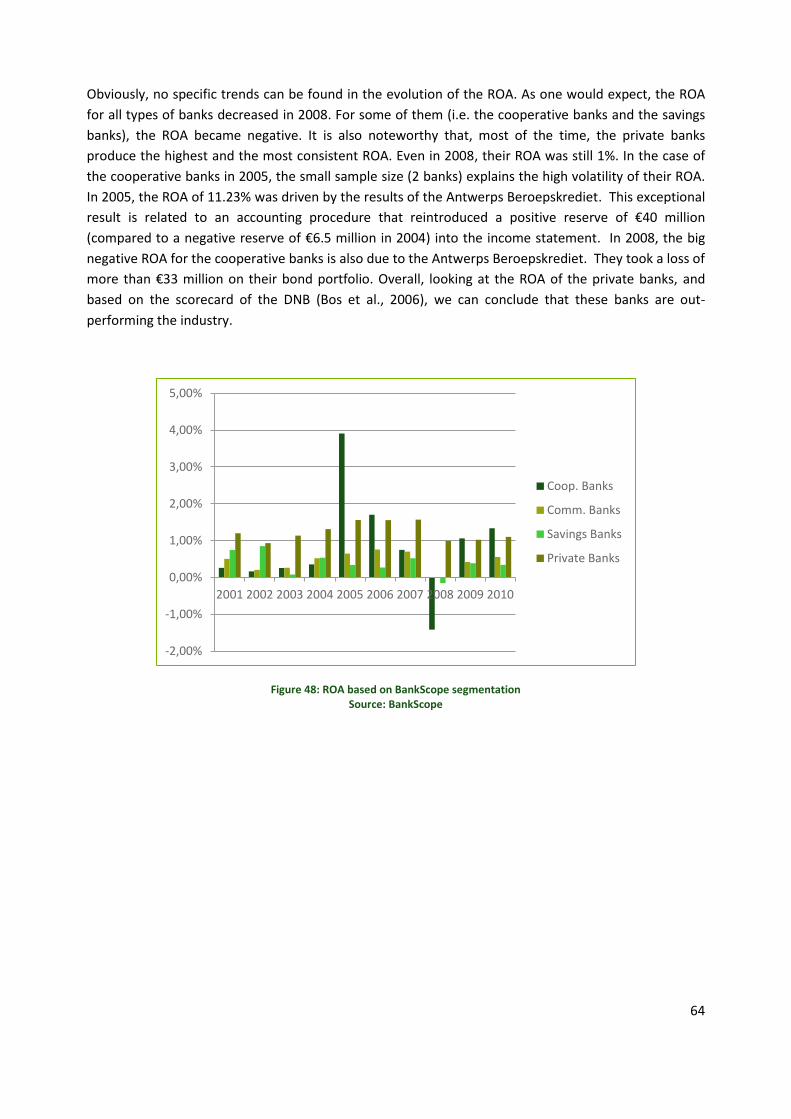
Appendix 2: The variables ................................................................................................................. 88
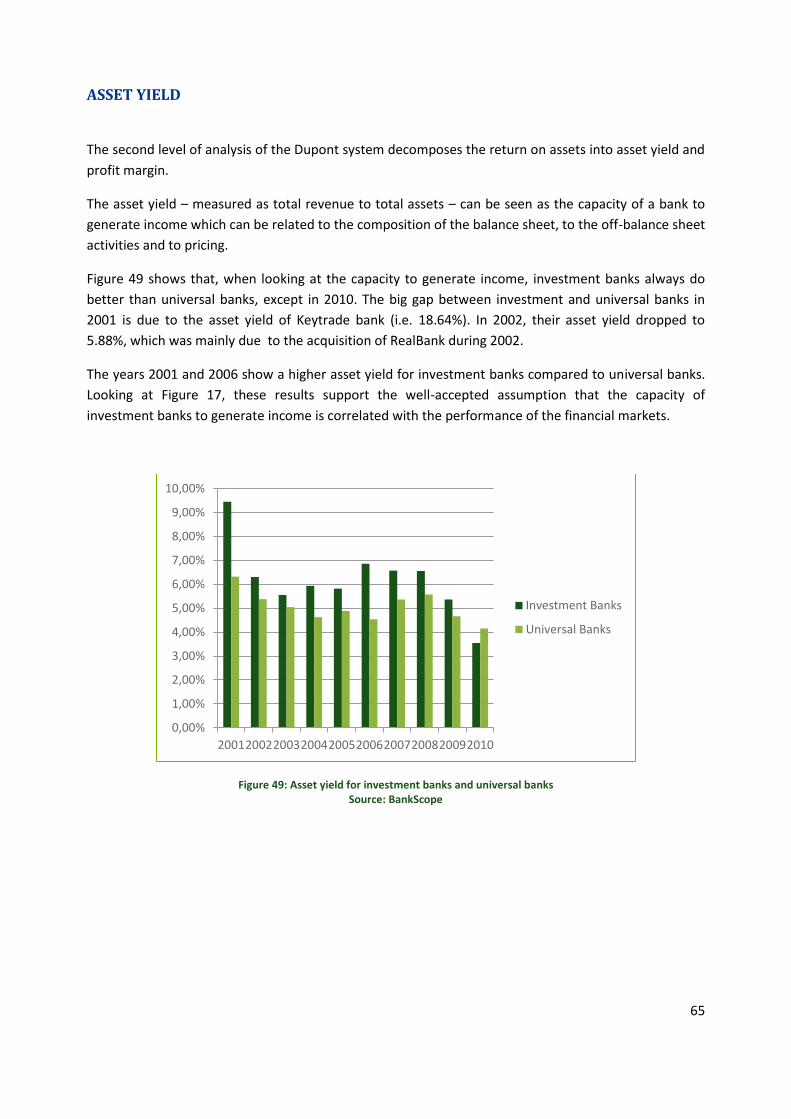
Appendix 3: A38 Code ....................................................................................................................... 89
Appendix 4: NACE BEL Code ............................................................................................................. 91
Appendix 5: List of abbreviations...................................................................................................... 92
Appendix 6: Contribution in terms of percentage of both the banks individually and per sector. .. 93
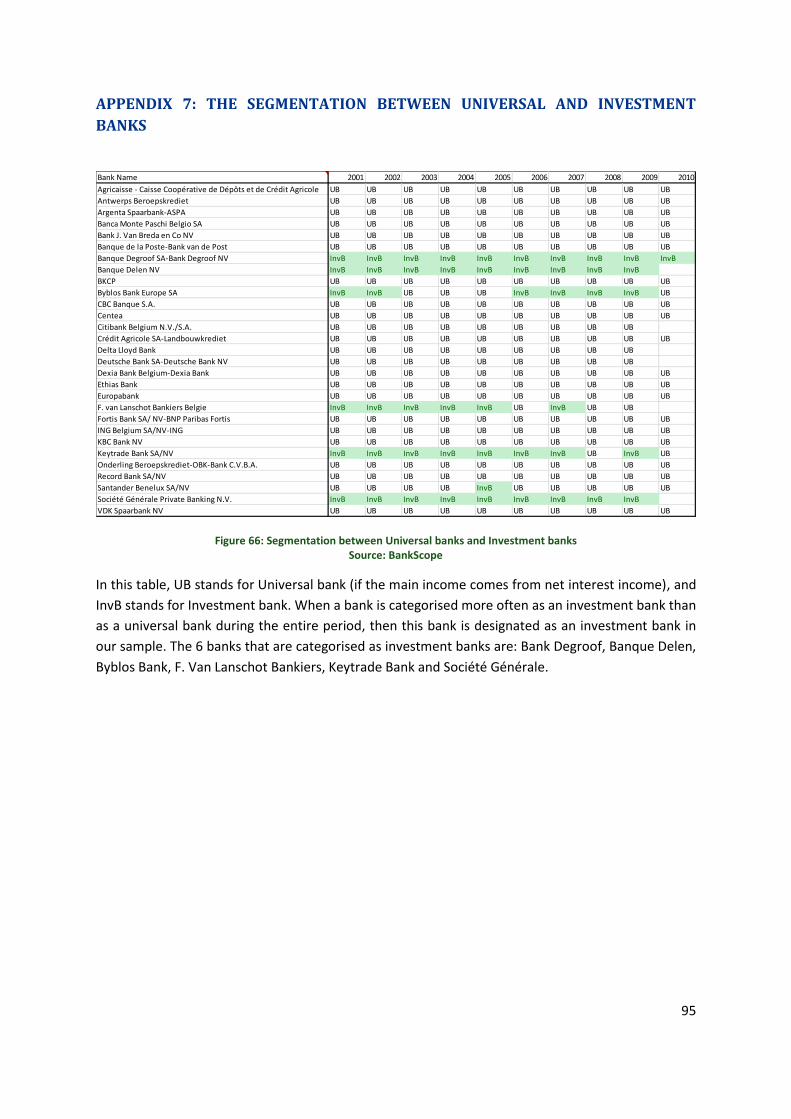
Appendix 7: The segmentation between universal and investment banks ...................................... 95
Appendix 8: The evolution of the natural logarithm of the total assets .......................................... 96
Appendix 9: Ratios for each bank individually .................................................................................. 98
Agricaisse - Caisse Coopérative de Dépôts et de Crédit Agricole ......................................................... 99
Banca Monte Paschi Belgio SA .............................................................................................................. 99
Bank J. Van Breda en Co NV .................................................................................................................. 99
Banque de la Poste-Bank van de Post ................................................................................................... 99
Deutsche Bank SA-Deutsche Bank NV .................................................................................................. 99
F. van Lanschot Bankiers Belgie .......................................................................................................... 100
Fortis Bank SA/ NV-BNP Paribas Fortis ............................................................................................... 100
ING Belgium SA/NV-ING ...................................................................................................................... 100
Onderling Beroepskrediet-OBK-Bank C.V.B.A. .................................................................................... 100
Société Générale Private Banking N.V. ............................................................................................... 100
Agricaisse - Caisse Coopérative de Dépôts et de Crédit Agricole ....................................................... 101
Banca Monte Paschi Belgio SA ............................................................................................................ 101
Bank J. Van Breda en Co NV ................................................................................................................ 101
Banque de la Poste-Bank van de Post ................................................................................................. 101
Deutsche Bank SA-Deutsche Bank NV ................................................................................................ 101
F. van Lanschot Bankiers Belgie .......................................................................................................... 102
Fortis Bank SA/ NV-BNP Paribas Fortis ............................................................................................... 102
ING Belgium SA/NV-ING ...................................................................................................................... 102
Page 5
1
THE KPMG – VLERICK PRIME FOUNDATION
PARTNERSHIP
This report on the mapping of the Belgian banking industry is part of a 3-year project conducted in
the format of a Prime Foundation Partnership between KPMG and the Vlerick Centre for Financial
Services.
The research content of the Prime Foundation Partnership will be filled in as follows:
Year 1: Helicopter View – International Scorecard. What is the performance (from many
different angles) of the participants in the banking sector and in the insurance sector in
Belgium, and how do they rank under these dimensions?
Year 2: Cluster analysis – survey – who performed the best and what drives their
performance? What differentiates these banks and these insurance companies? Look at
periods before/during/after the crisis. Make links to different dimensions like: distribution
channels, business models, asset structure, financial aspects and managerial aspects.
Year 3: Wait to see the results from years 1 & 2 and then identify interesting issues to be
investigated further. Points of specific research interests raised by KPMG could also be
investigated in the course of this part of the research project.
Page 7
3
ACKNOWLEDGMENT
This research project would not have been possible without the support of many people.
The authors would like to convey thanks to KPMG for providing the financial means and specially to
Bart Walterus, Partner Financial Services Consulting / KPMG Advisory, who has been providing
managerial support and professional advices of great help throughout the report elaboration.
Furthermore, the authors would like to thank Erik Clinck, Olivier Macq, Stijn Broekx, Jorn Deneve and
Ingrid Stoffels for their valuable feedback at various occasions throughout the duration of the study.
At the Vlerick Centre for Financial Services, Maureen O’Hare has played a major role in the
discussions leading to the Prime Foundation Partnership of KPMG and Diane von Teufenstein, as
business manager of the Vlerick Centre for Financial Services, has been coordinating this project with
a professional and dedicated approach.
The authors,
Prof. Dr. André E. Thibeault
Corneel Defrancq
Jessie Vantieghem
Page 9
5
EXECUTIVE SUMMARY
The goal of this study is to develop a scorecard for assessing bank performance in the Belgian
banking industry. The performance will be measured by using a multi-factors approach to make sure
performance is assessed under different dimensions and these performance measures will be
applied to different segments of the Belgian banking landscape.
The dimensions to be considered are: the value chain, the breakdown of the ROE and the risk-return
trade-off.
Four different segments will be defined, based on the size of the banks (defined by their total assets)
or based on their type of activities or revenues:
A first segment will compare the banks relative to the source of their income as defined by
the ECB (investment banks or universal banks).
A second segment will be based on the size of the banks. Four different categories will be
created based on total assets.
A third segment will study Belgium’s Big Four banks individually: Dexia, Fortis, ING and KBC.
The last category is based on the BankScope segmentation.
The importance of the financial sector in Belgium is substantial – but it has decreased slightly during
the period 2001 – 2010. The financial sector’s contribution to Belgian employees’ employment
compensation went from about 6% in 2001 to 5% in 2010. The same trend is observable in the
number of people employed in the financial sector. However, while the number of people employed
decreased during this period, the average salary steadily increased from €58,000 in 2001 to €70,000
in 2008. After 2008, the financial crisis caused wages to freeze at about €70,000. Another striking
feature of the Belgian economy is the savings rate, one of the highest in the world, which fluctuated
between 15% and 20% between 2001 and 2010.
When looking more specifically at the Belgian banking sector, one has to realise its international
standing. In Belgium, almost half of the total assets (held by Belgian financial institutions) are in the
hands of foreign controlled credit institutions.
When breaking down the value chain, it is interesting to note that private banks are consistently
exhibiting the highest ratio of operating income to total assets. In the investment / universal banks
segment, the investment banks have a better ratio than the universal banks; and when looking at
bank size, the smallest banks are achieving the best performance.
When we broke the total operating income into its components, we found that net interest income
was negatively correlated with the size of the bank as measured by total assets. As expected, the
private banks are dominating the other banks when net fees and commissions are used as the
benchmark. When using financial transactions as the benchmark, no conclusion can be drawn,
because this value driver is so volatile. On the costs side of the value chain, all of the banks have
been able to reduce their operating expenses during the period under study. Private banks have
experienced the highest level of operating expenses to total assets (4%), while universal banks have
been able to bring this figure down to 1%.
Page 10
6
While looking at the performance of the banking industry based on the breakdown of the ROE, the
four big banks dominate the market – not because of their good operational profitability (ROA), but
because of a bigger risk appetite, which is reflected in a higher leverage compared to the other
banks. The comparison of investment banks and universal banks shows that the investment banks
perform better in terms of ROE. However, based on their total assets in 2009, the investment banks
account for not even 1% of the sample, while the universal banks account for the rest. In the
segment based on “BankScope”, the private banks have the best ROE, due to their better
performance in operational profitability (ROA).
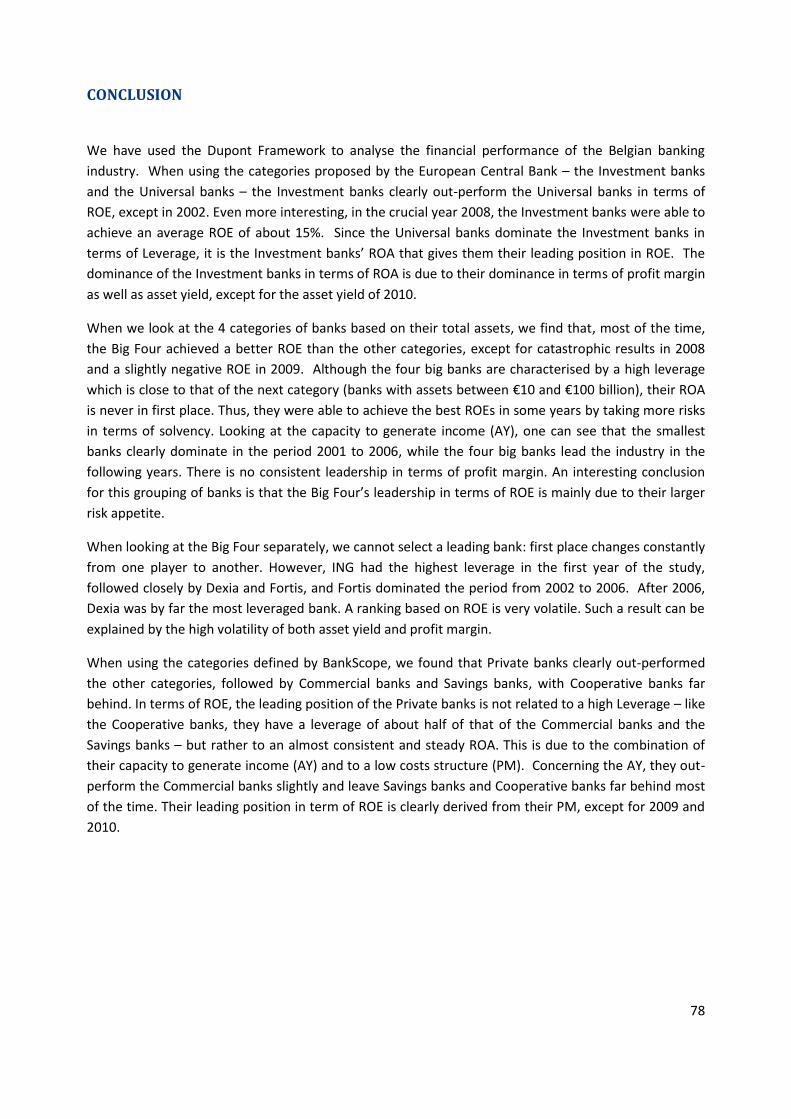
The analysis of the risk-return trade-off shows a cluster of banks in an area from low to medium risk
and from a low to a high ROE. The banks presenting the best risk-return trade-off over the period
under study are Banque Delen and Europabank. An interesting point of this risk-return analysis is
the inverse relationship for the Big Four banks. ING shows a good risk-return profile, followed by
Dexia and KBC with higher risk and lower return, and finally by Fortis with the worst risk-return
profile for the period under study.
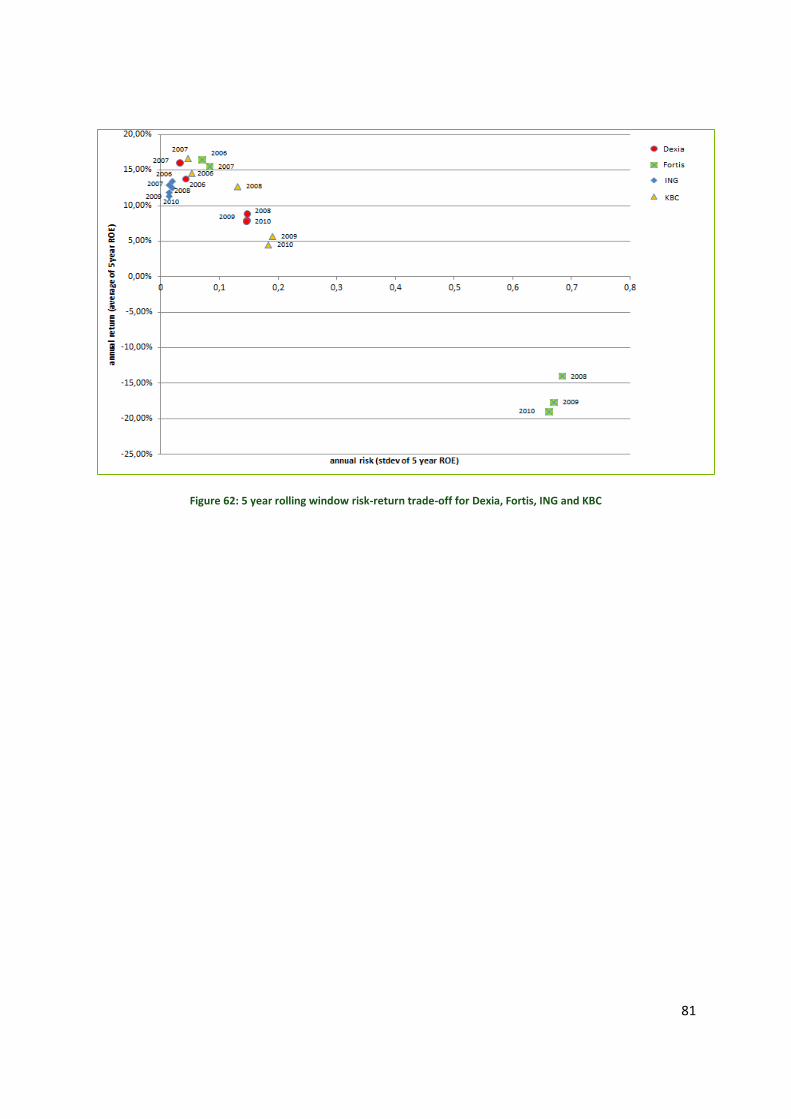
Page 11
7
INTRODUCTION
How to measure performance in the Belgian banking industry? Participants in the financial services
industry worldwide have been using many different benchmarks to assess bank performance. The
goal of this study is to develop a scorecard for assessing bank performance in the Belgian banking
industry. The performance will be measured by using a multi-factors approach to make sure
performance is assessed under different dimensions and these performance measures will be
applied to different segments of the Belgian banking landscape.
Four different segments will be defined, based on the size of the banks (defined by their total assets)
or based on their type of activities or revenues:
A first segment will compare the banks relative to the source of their income as defined by
the ECB (investment banks or universal banks).
A second segment will be based on the size of the banks. Four different categories will be
created based on total assets.
A third segment will study Belgium’s Big Four banks individually: Dexia, Fortis, ING and KBC.
The last category is based on the BankScope segmentation.
Furthermore, three dimensions will be defined on the basis of a series of variables in order to
measure performance. The report will map the Belgian banking sector with regard to these three
performance dimensions. These dimensions are:
1) The value chain
2) The financial performance
3) The risk-return trade-off
STRUCTURE OF THE REPORT
To answer the key question – “How to measure performance in the Belgian banking industry?” – we
have structured the report as follows:
In Chapter 1, we start by outlining the industry context. In this chapter, we present some well-known
figures about the position of the Belgian banking industry in the Belgian and European economies.
This chapter sets the context for the remainder of our study.
Chapter 2 details the value chain in the Belgian banking industry. We leave the global view of the
industry and move down to the segments level, comparing the value chain of the banks in Belgium
(as measured by assets) over the last 10 years. Examining the years 2001 to 2010 allows us to cover
the boom years of the early 2000s as well as the credit crunch of 2007 - 2009.
In Chapter 3, we break down each market segment’s ROE according to the Dupont analysis. Thus,
the segments are compared on the basis of their profitability – and more precisely, on their capacity
to generate income as well as their cost management.
While Chapter 3 compares performance on the basis of the return component, Chapter 4 tackles the
combination of both risk and return. The risk-return trade-off will be portrayed by means of graphs.
Chapter 5 presents the major findings of the study.
Page 13
9
CHAPTER 1: INDUSTRY OVERVIEW
In order to provide an overview of the industry, we use the two reports of Febelfin, the Belgian
Financial Sector Federation (Febelfin, 2010; Febelfin, 2009). Created in 1993, Febelfin consists of five
financial trade organisations:
1. ABB-BVB: Belgian Bankers’ and Stockbroking Firms’ Association
2. BEAMA: Belgian Asset Managers Association
3. UPC-BVK: Professional Union of Credit Providers
4. BLA: Belgian Leasing Association
5. BASEM: Belgian Association of Stock Exchange Members
In a first phase, we scrutinise the financial sector’s contribution to the economy in terms of gross
added value, employment and employee wages. Secondly, we break down the gross added value
according to four distinguishable sub-sectors: (1) insurance corporations and pension funds, (2)
financial auxiliaries, (3) other financial intermediaries except insurance corporations, and (4) the
central bank and other monetary financial institutions. As a third topic of research, we compare the
total assets on the balance sheet of the credit institutions with the GDP of the countries that are part
of the European Monetary Union. Fourth, we assess the internationalisation of the industry by
ranking the EMU countries according to their respective share of foreign-owned banks.
Page 14
10
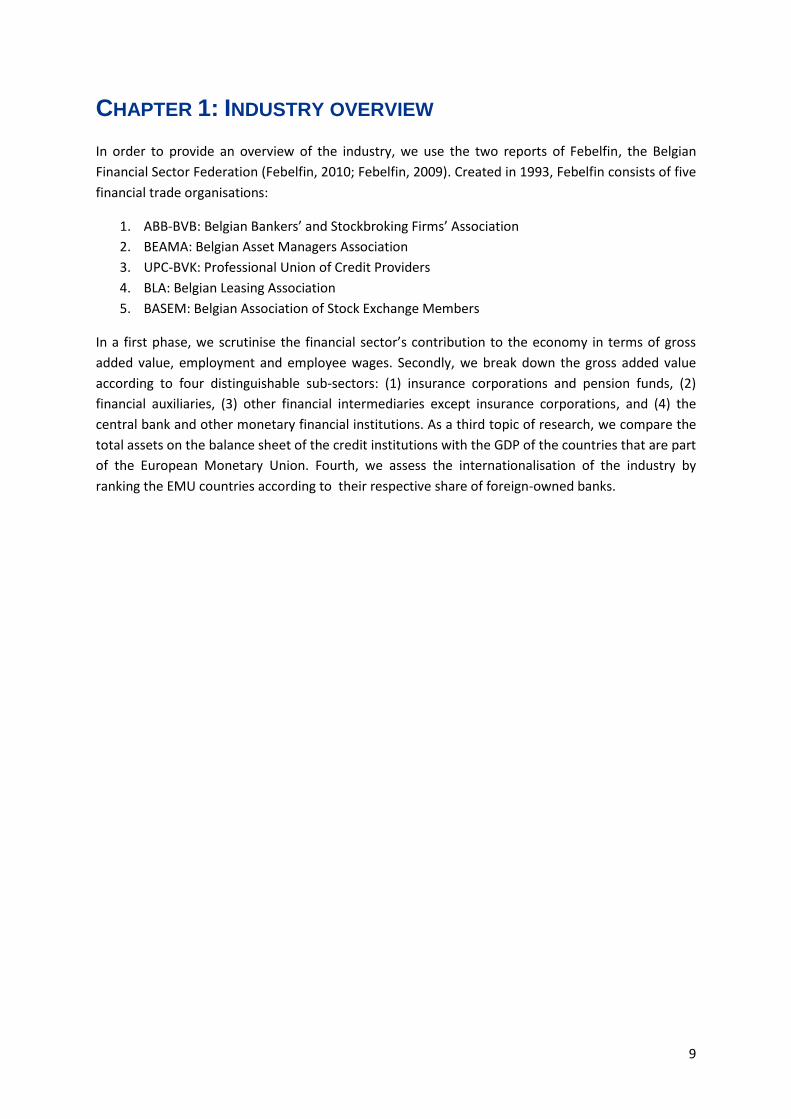
CONTRIBUTION TO THE BELGIAN ECONOMY
Trends over time
To assess the importance of the financial sector in the Belgian economy, we have calculated the
Gross Value Added (GVA) of the financial intermediation sector from 2000 up to 2010 (see Figure 1).
We clearly see the decline in added value in the years from 2005 to 2008. From 2008 to 2010, we
see the shift to previous levels of added value. In 2010, 6.14% of the Belgian economy (as measured
by GDP) was built on added value from the financial intermediation sector.
Figure 1: Gross Value Added of the financial sector (as a percentage of the Belgian economy) Source: National Bank of Belgium (Belgostat)
Gross Value Added (GVA) measures the contribution to the economy of each individual producer, industry or sector. The gross value added at basic prices is defined (according to the ESA95 standard) as the output valued at basic prices less intermediate consumption valued at purchaser prices, before deduction of consumption of fixed capital (European Central Bank).
4,90%
5,10%
5,30%
5,50%
5,70%
5,90%
1999 2001 2003 2005 2007 2009 2011
Page 15
11
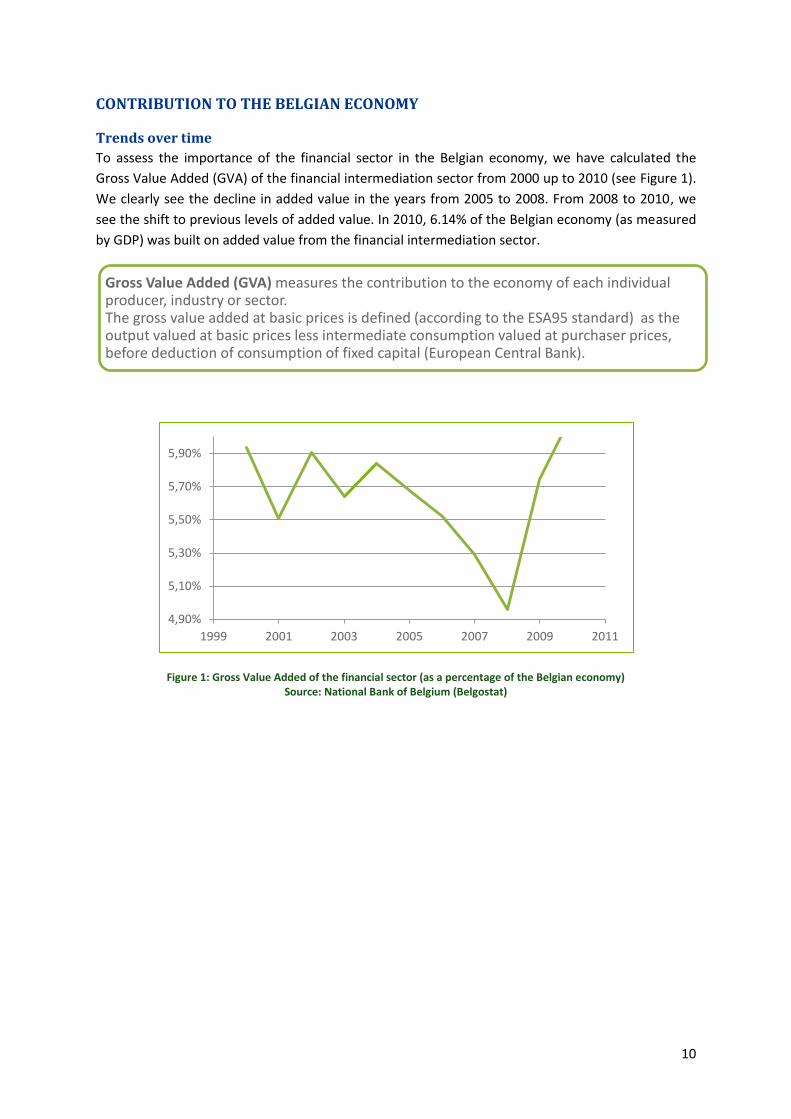
During this same period of time, the total sum of wages paid by the financial service industry (Figure
2) has been relatively in decline in the Belgian economy. In 2010, 4.97% of the total sum paid to
employees came from the financial industry.
Figure 2: Financial sector's contribution to Belgian Employees' employment compensation Source: National Bank of Belgium (Belgostat)
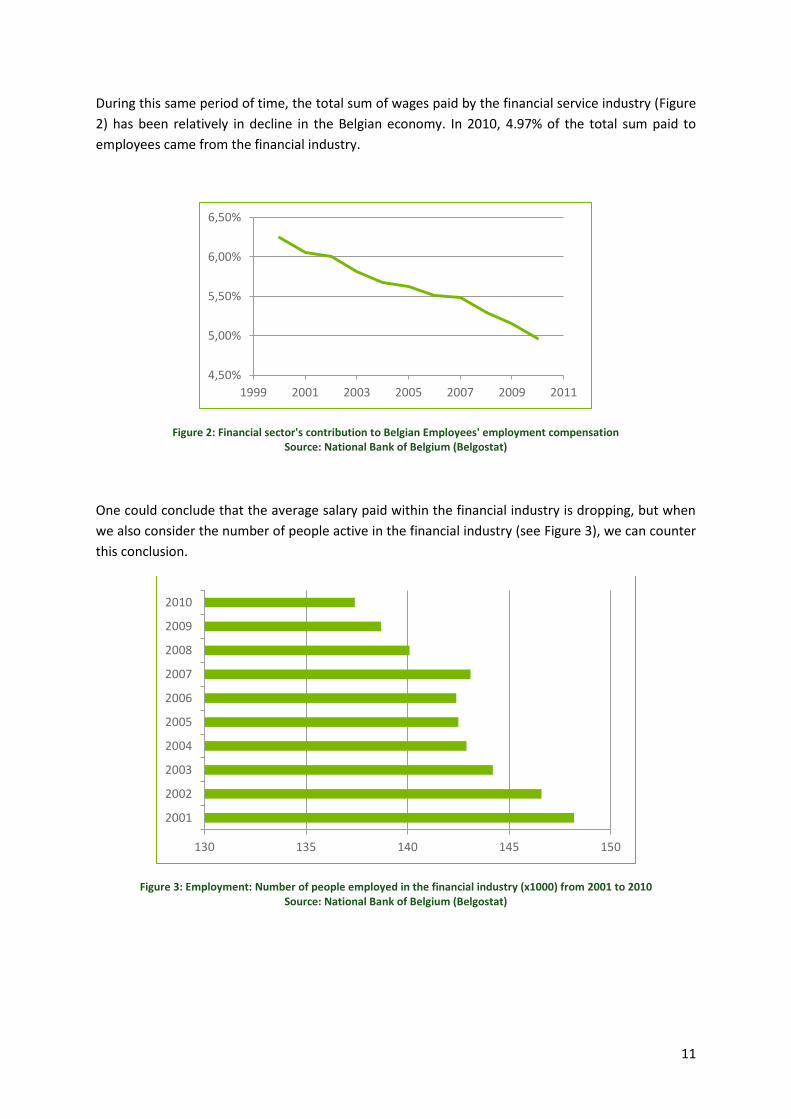
One could conclude that the average salary paid within the financial industry is dropping, but when
we also consider the number of people active in the financial industry (see Figure 3), we can counter
this conclusion.
Figure 3: Employment: Number of people employed in the financial industry (x1000) from 2001 to 2010 Source: National Bank of Belgium (Belgostat)
4,50%
5,00%
5,50%
6,00%
6,50%
1999 2001 2003 2005 2007 2009 2011
130 135 140 145 150
2001
2002
2003
2004
2005
2006
2007
2008
2009
2010
Page 16
12
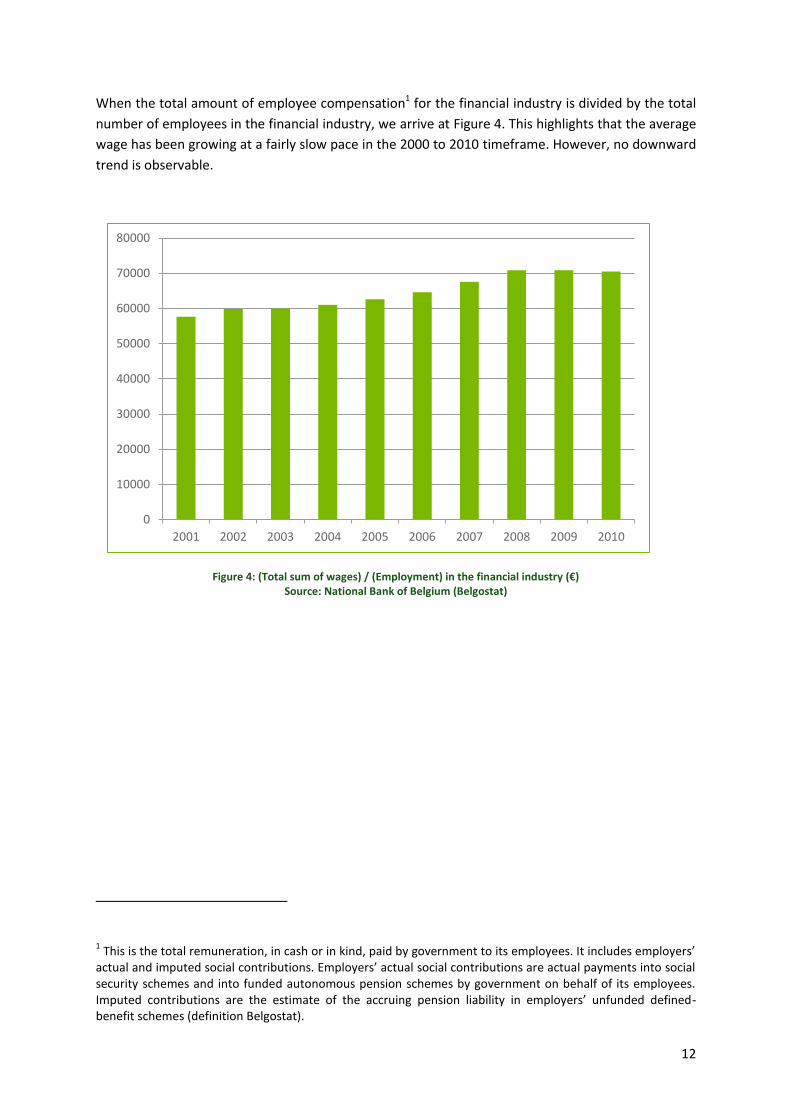
When the total amount of employee compensation1 for the financial industry is divided by the total
number of employees in the financial industry, we arrive at Figure 4. This highlights that the average
wage has been growing at a fairly slow pace in the 2000 to 2010 timeframe. However, no downward
trend is observable.
Figure 4: (Total sum of wages) / (Employment) in the financial industry (€) Source: National Bank of Belgium (Belgostat)
1 This is the total remuneration, in cash or in kind, paid by government to its employees. It includes employers’
actual and imputed social contributions. Employers’ actual social contributions are actual payments into social security schemes and into funded autonomous pension schemes by government on behalf of its employees. Imputed contributions are the estimate of the accruing pension liability in employers’ unfunded defined-benefit schemes (definition Belgostat).
0
10000
20000
30000
40000
50000
60000
70000
80000
2001 2002 2003 2004 2005 2006 2007 2008 2009 2010
Page 17
13
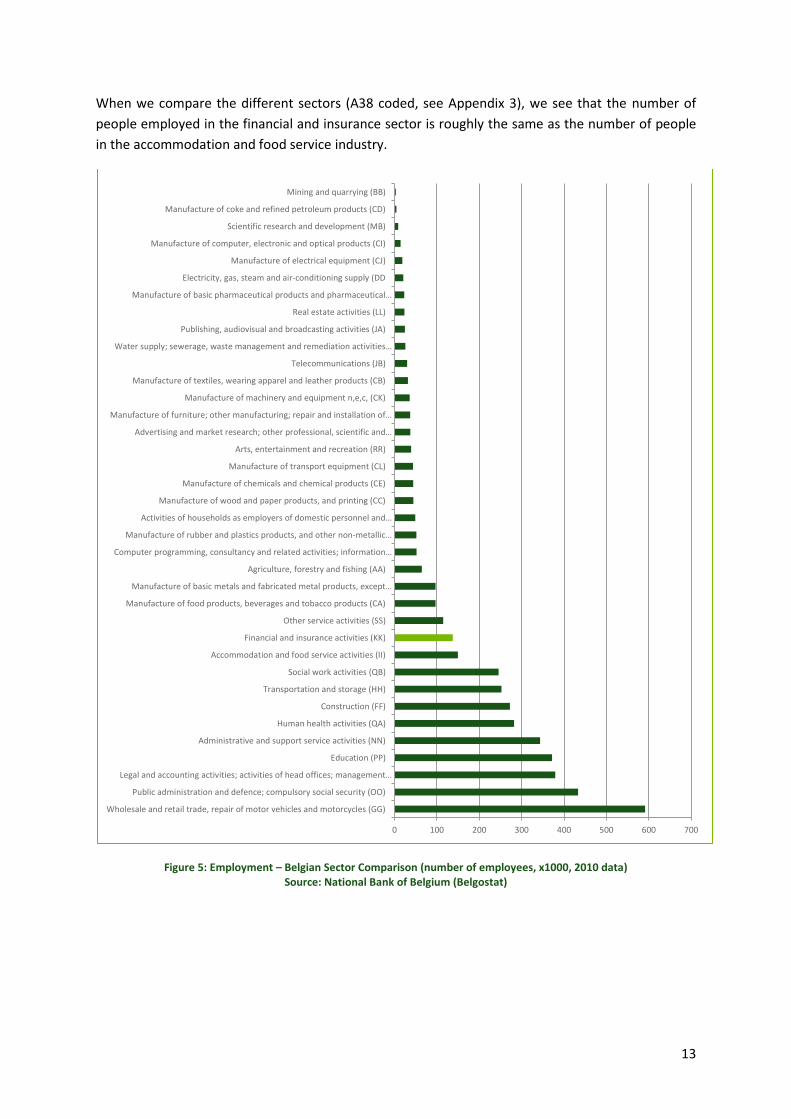
When we compare the different sectors (A38 coded, see Appendix 3), we see that the number of
people employed in the financial and insurance sector is roughly the same as the number of people
in the accommodation and food service industry.
Figure 5: Employment – Belgian Sector Comparison (number of employees, x1000, 2010 data) Source: National Bank of Belgium (Belgostat)
0 100 200 300 400 500 600 700
Wholesale and retail trade, repair of motor vehicles and motorcycles (GG)
Public administration and defence; compulsory social security (OO)
Legal and accounting activities; activities of head offices; management…
Education (PP)
Administrative and support service activities (NN)
Human health activities (QA)
Construction (FF)
Transportation and storage (HH)
Social work activities (QB)
Accommodation and food service activities (II)
Financial and insurance activities (KK)
Other service activities (SS)
Manufacture of food products, beverages and tobacco products (CA)
Manufacture of basic metals and fabricated metal products, except…
Agriculture, forestry and fishing (AA)
Computer programming, consultancy and related activities; information…
Manufacture of rubber and plastics products, and other non-metallic…
Activities of households as employers of domestic personnel and…
Manufacture of wood and paper products, and printing (CC)
Manufacture of chemicals and chemical products (CE)
Manufacture of transport equipment (CL)
Arts, entertainment and recreation (RR)
Advertising and market research; other professional, scientific and…
Manufacture of furniture; other manufacturing; repair and installation of…
Manufacture of machinery and equipment n,e,c, (CK)
Manufacture of textiles, wearing apparel and leather products (CB)
Telecommunications (JB)
Water supply; sewerage, waste management and remediation activities…
Publishing, audiovisual and broadcasting activities (JA)
Real estate activities (LL)
Manufacture of basic pharmaceutical products and pharmaceutical…
Electricity, gas, steam and air-conditioning supply (DD
Manufacture of electrical equipment (CJ)
Manufacture of computer, electronic and optical products (CI)
Scientific research and development (MB)
Manufacture of coke and refined petroleum products (CD)
Mining and quarrying (BB)
Page 18
14
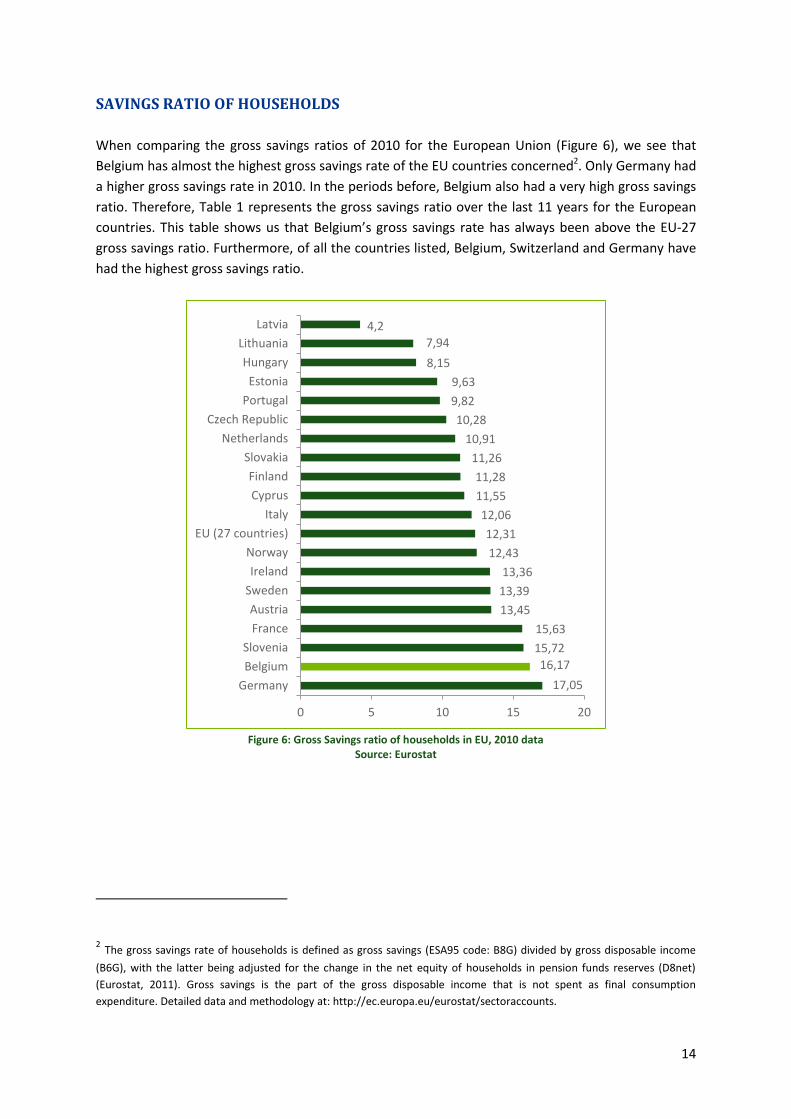
SAVINGS RATIO OF HOUSEHOLDS
When comparing the gross savings ratios of 2010 for the European Union (Figure 6), we see that
Belgium has almost the highest gross savings rate of the EU countries concerned2. Only Germany had
a higher gross savings rate in 2010. In the periods before, Belgium also had a very high gross savings
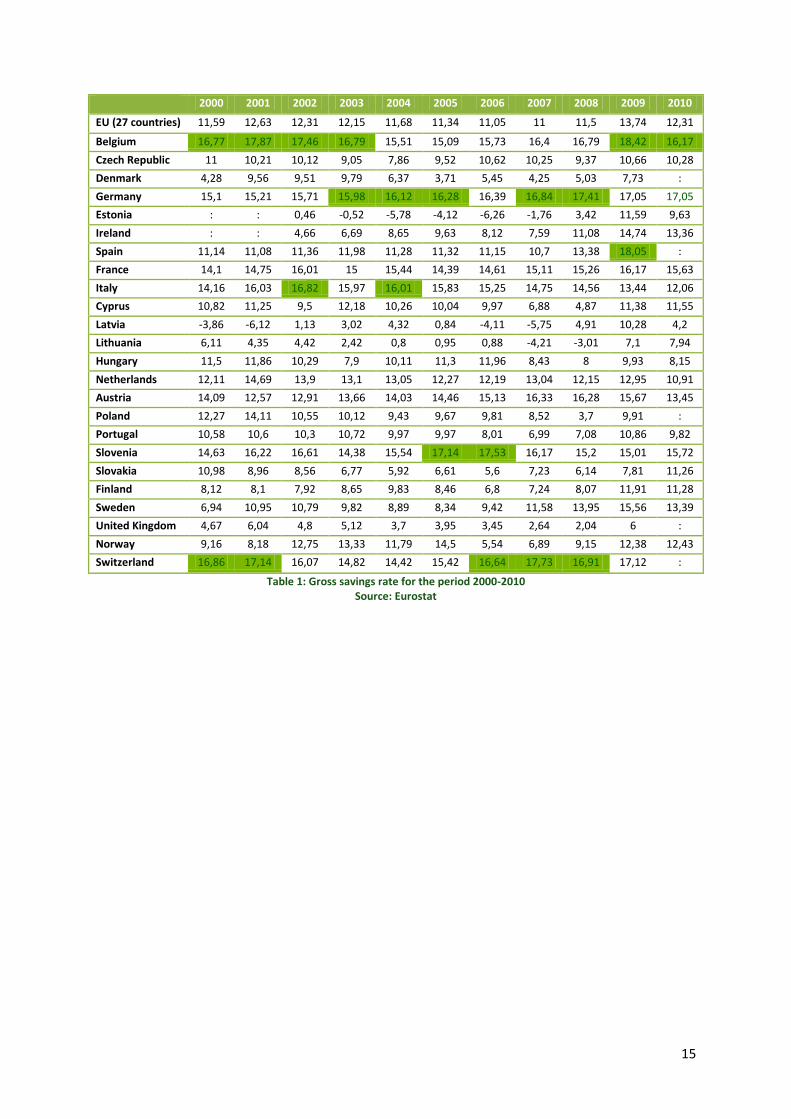
ratio. Therefore, Table 1 represents the gross savings ratio over the last 11 years for the European
countries. This table shows us that Belgium’s gross savings rate has always been above the EU-27
gross savings ratio. Furthermore, of all the countries listed, Belgium, Switzerland and Germany have
had the highest gross savings ratio.
Figure 6: Gross Savings ratio of households in EU, 2010 data
Source: Eurostat
2 The gross savings rate of households is defined as gross savings (ESA95 code: B8G) divided by gross disposable income
(B6G), with the latter being adjusted for the change in the net equity of households in pension funds reserves (D8net)
(Eurostat, 2011). Gross savings is the part of the gross disposable income that is not spent as final consumption
expenditure. Detailed data and methodology at: http://ec.europa.eu/eurostat/sectoraccounts.
17,05
16,17
15,72
15,63
13,45
13,39
13,36
12,43
12,31
12,06
11,55
11,28
11,26
10,91
10,28
9,82
9,63
8,15
7,94
4,2
0 5 10 15 20
Germany
Belgium
Slovenia
France
Austria
Sweden
Ireland
Norway
EU (27 countries)
Italy
Cyprus
Finland
Slovakia
Netherlands
Czech Republic
Portugal
Estonia
Hungary
Lithuania
Latvia
Page 19
15
2000 2001 2002 2003 2004 2005 2006 2007 2008 2009 2010
EU (27 countries) 11,59 12,63 12,31 12,15 11,68 11,34 11,05 11 11,5 13,74 12,31
Belgium 16,77 17,87 17,46 16,79 15,51 15,09 15,73 16,4 16,79 18,42 16,17
Czech Republic 11 10,21 10,12 9,05 7,86 9,52 10,62 10,25 9,37 10,66 10,28
Denmark 4,28 9,56 9,51 9,79 6,37 3,71 5,45 4,25 5,03 7,73 :
Germany 15,1 15,21 15,71 15,98 16,12 16,28 16,39 16,84 17,41 17,05 17,05
Estonia : : 0,46 -0,52 -5,78 -4,12 -6,26 -1,76 3,42 11,59 9,63
Ireland : : 4,66 6,69 8,65 9,63 8,12 7,59 11,08 14,74 13,36
Spain 11,14 11,08 11,36 11,98 11,28 11,32 11,15 10,7 13,38 18,05 :
France 14,1 14,75 16,01 15 15,44 14,39 14,61 15,11 15,26 16,17 15,63
Italy 14,16 16,03 16,82 15,97 16,01 15,83 15,25 14,75 14,56 13,44 12,06
Cyprus 10,82 11,25 9,5 12,18 10,26 10,04 9,97 6,88 4,87 11,38 11,55
Latvia -3,86 -6,12 1,13 3,02 4,32 0,84 -4,11 -5,75 4,91 10,28 4,2
Lithuania 6,11 4,35 4,42 2,42 0,8 0,95 0,88 -4,21 -3,01 7,1 7,94
Hungary 11,5 11,86 10,29 7,9 10,11 11,3 11,96 8,43 8 9,93 8,15
Netherlands 12,11 14,69 13,9 13,1 13,05 12,27 12,19 13,04 12,15 12,95 10,91
Austria 14,09 12,57 12,91 13,66 14,03 14,46 15,13 16,33 16,28 15,67 13,45
Poland 12,27 14,11 10,55 10,12 9,43 9,67 9,81 8,52 3,7 9,91 :
Portugal 10,58 10,6 10,3 10,72 9,97 9,97 8,01 6,99 7,08 10,86 9,82
Slovenia 14,63 16,22 16,61 14,38 15,54 17,14 17,53 16,17 15,2 15,01 15,72
Slovakia 10,98 8,96 8,56 6,77 5,92 6,61 5,6 7,23 6,14 7,81 11,26
Finland 8,12 8,1 7,92 8,65 9,83 8,46 6,8 7,24 8,07 11,91 11,28
Sweden 6,94 10,95 10,79 9,82 8,89 8,34 9,42 11,58 13,95 15,56 13,39
United Kingdom 4,67 6,04 4,8 5,12 3,7 3,95 3,45 2,64 2,04 6 :
Norway 9,16 8,18 12,75 13,33 11,79 14,5 5,54 6,89 9,15 12,38 12,43
Switzerland 16,86 17,14 16,07 14,82 14,42 15,42 16,64 17,73 16,91 17,12 :
Table 1: Gross savings rate for the period 2000-2010 Source: Eurostat
Page 20
16
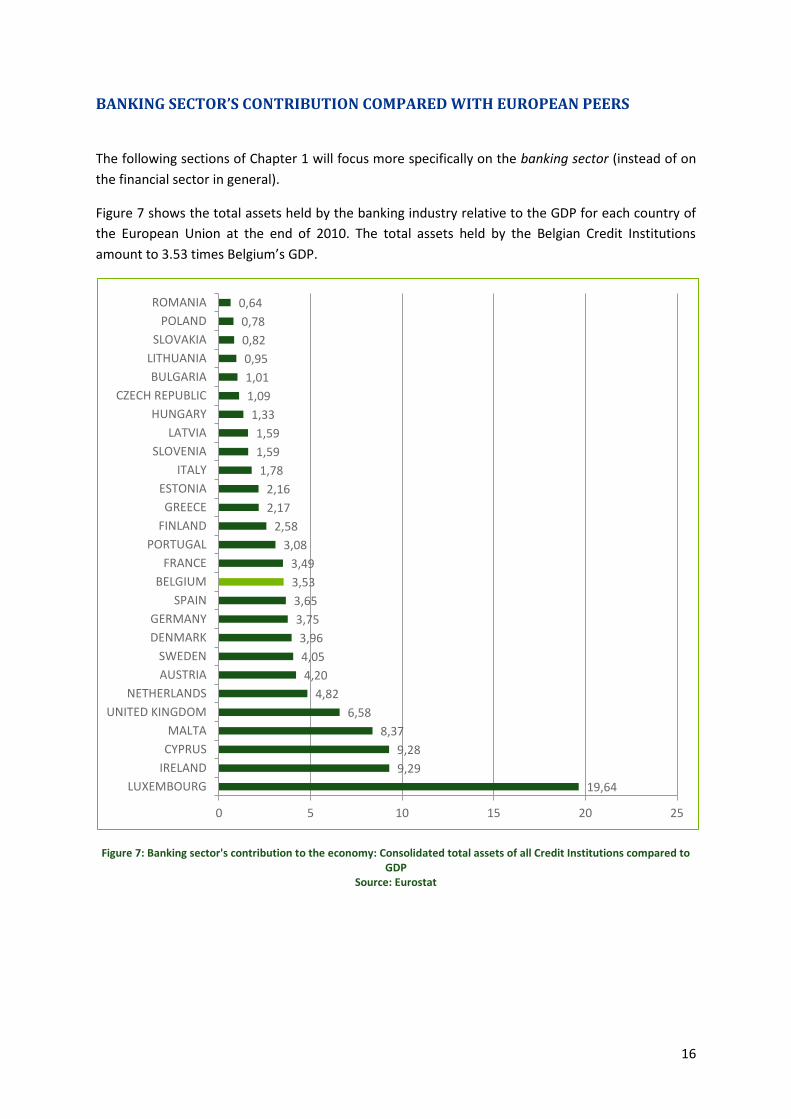
BANKING SECTOR’S CONTRIBUTION COMPARED WITH EUROPEAN PEERS
The following sections of Chapter 1 will focus more specifically on the banking sector (instead of on
the financial sector in general).
Figure 7 shows the total assets held by the banking industry relative to the GDP for each country of
the European Union at the end of 2010. The total assets held by the Belgian Credit Institutions
amount to 3.53 times Belgium’s GDP.
Figure 7: Banking sector's contribution to the economy: Consolidated total assets of all Credit Institutions compared to GDP
Source: Eurostat
19,64
9,29
9,28
8,37
6,58
4,82
4,20
4,05
3,96
3,75
3,65
3,53
3,49
3,08
2,58
2,17
2,16
1,78
1,59
1,59
1,33
1,09
1,01
0,95
0,82
0,78
0,64
0 5 10 15 20 25
LUXEMBOURG
IRELAND
CYPRUS
MALTA
UNITED KINGDOM
NETHERLANDS
AUSTRIA
SWEDEN
DENMARK
GERMANY
SPAIN
BELGIUM
FRANCE
PORTUGAL
FINLAND
GREECE
ESTONIA
ITALY
SLOVENIA
LATVIA
HUNGARY
CZECH REPUBLIC
BULGARIA
LITHUANIA
SLOVAKIA
POLAND
ROMANIA
Page 21
17
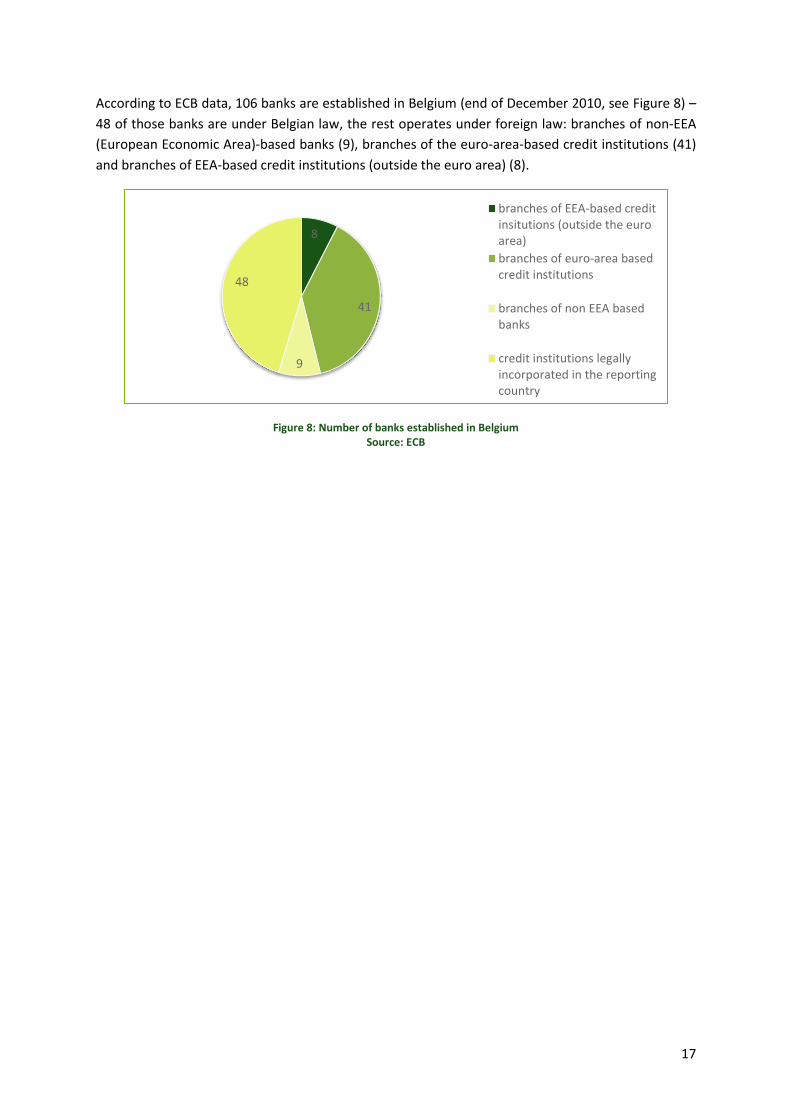
According to ECB data, 106 banks are established in Belgium (end of December 2010, see Figure 8) –
48 of those banks are under Belgian law, the rest operates under foreign law: branches of non-EEA
(European Economic Area)-based banks (9), branches of the euro-area-based credit institutions (41)
and branches of EEA-based credit institutions (outside the euro area) (8).
Figure 8: Number of banks established in Belgium Source: ECB
8
41
9
48
branches of EEA-based creditinsitutions (outside the euroarea)
branches of euro-area basedcredit institutions
branches of non EEA basedbanks
credit institutions legallyincorporated in the reportingcountry
Page 22
18
INTERNATIONALISATION OF THE BELGIAN BANKING LANDSCAPE
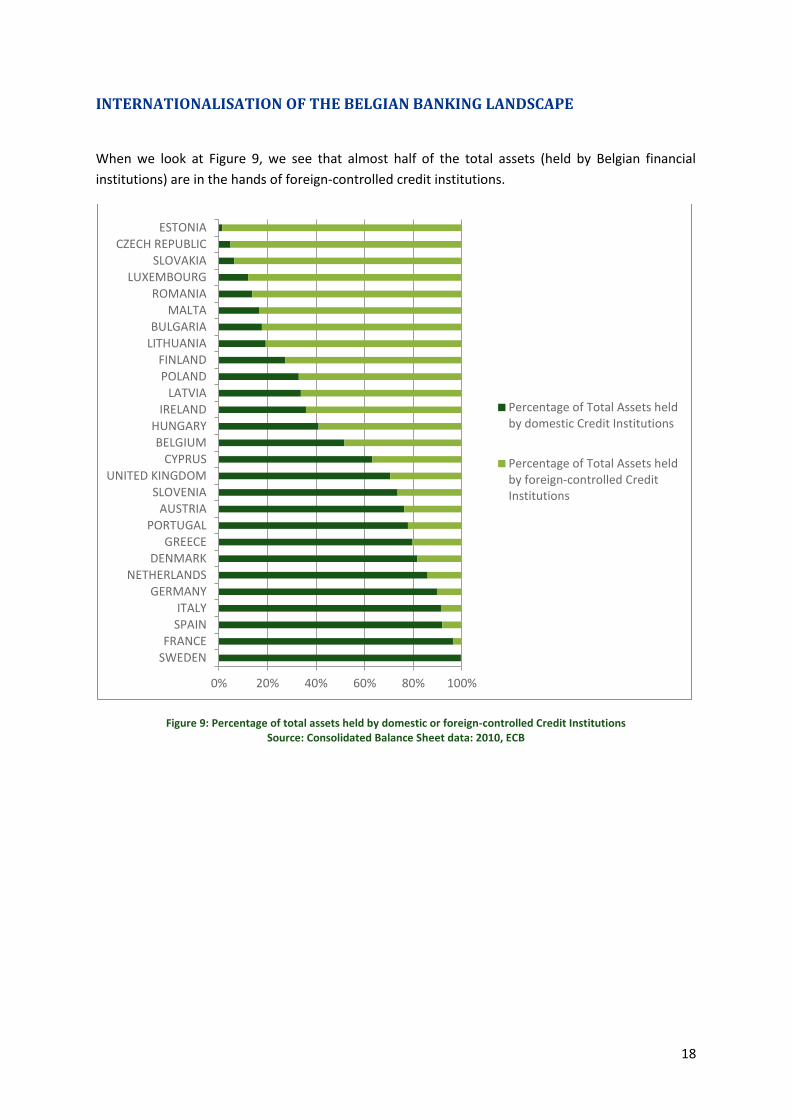
When we look at Figure 9, we see that almost half of the total assets (held by Belgian financial
institutions) are in the hands of foreign-controlled credit institutions.
Figure 9: Percentage of total assets held by domestic or foreign-controlled Credit Institutions Source: Consolidated Balance Sheet data: 2010, ECB
0% 20% 40% 60% 80% 100%
SWEDENFRANCE
SPAIN
ITALYGERMANY
NETHERLANDSDENMARK
GREECEPORTUGAL
AUSTRIASLOVENIA
UNITED KINGDOM
CYPRUSBELGIUM
HUNGARY
IRELANDLATVIA
POLAND
FINLANDLITHUANIABULGARIA
MALTAROMANIA
LUXEMBOURGSLOVAKIA
CZECH REPUBLIC
ESTONIA
Percentage of Total Assets heldby domestic Credit Institutions
Percentage of Total Assets heldby foreign-controlled CreditInstitutions
Page 23
19
CHAPTER 2: THE VALUE CHAIN
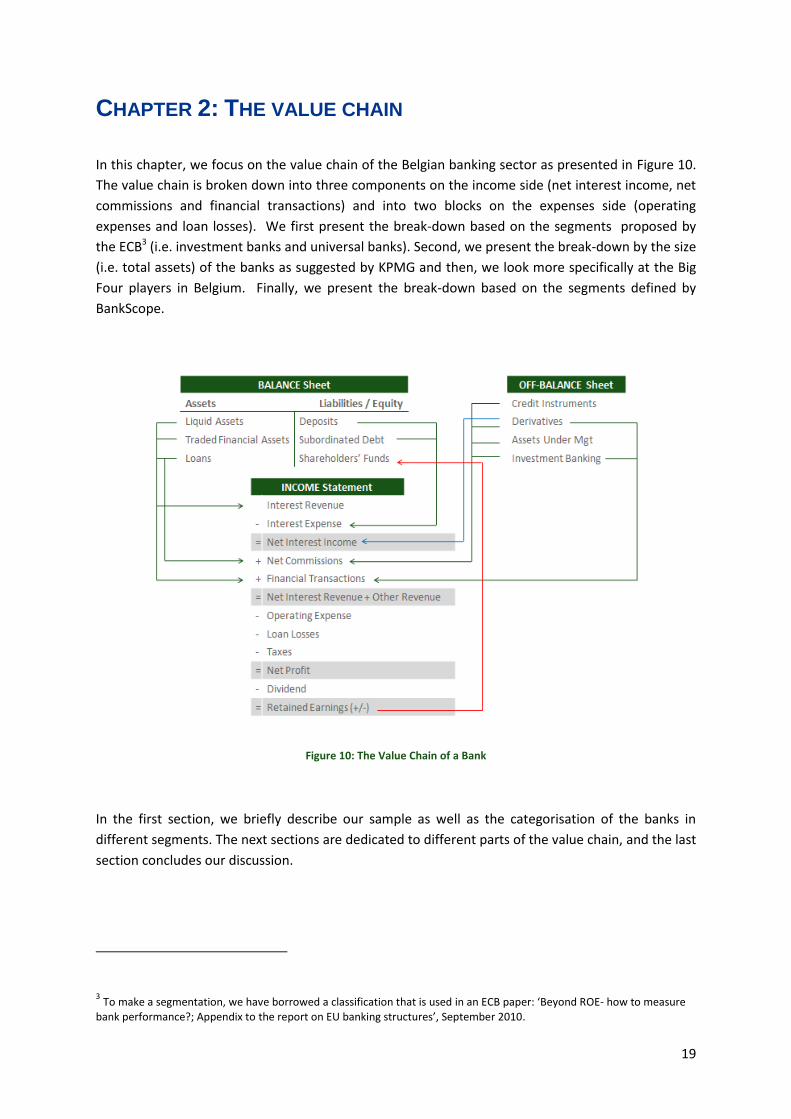
In this chapter, we focus on the value chain of the Belgian banking sector as presented in Figure 10.
The value chain is broken down into three components on the income side (net interest income, net
commissions and financial transactions) and into two blocks on the expenses side (operating
expenses and loan losses). We first present the break-down based on the segments proposed by
the ECB3 (i.e. investment banks and universal banks). Second, we present the break-down by the size
(i.e. total assets) of the banks as suggested by KPMG and then, we look more specifically at the Big
Four players in Belgium. Finally, we present the break-down based on the segments defined by
BankScope.
Figure 10: The Value Chain of a Bank
In the first section, we briefly describe our sample as well as the categorisation of the banks in
different segments. The next sections are dedicated to different parts of the value chain, and the last
section concludes our discussion.
3 To make a segmentation, we have borrowed a classification that is used in an ECB paper: ‘Beyond ROE- how to measure
bank performance?; Appendix to the report on EU banking structures’, September 2010.
Page 24
20
SAMPLE SELECTION AND SEGMENTS DESCRIPTION
Sample Selection
In the pre-processing phase of this study, we had to define our research sample. Based on both the
list of the ‘members of the BVB’ (list from Febelfin) and on BankScope (database managed by Bureau
van Dijk), we started gathering data for the banks in Belgium. Consolidated data for Dexia group and
KBC group were removed from the sample, since a major part of their business originates from
foreign activities. However, we were able to extract data from Dexia Bank Belgium and KBC Bank
Belgium, and these are included in the final sample. This resulted in an initial sample of 33 banks
which had accounting data available for 2010. As this study examines a time span of 10 years (i.e.
2001-2010), banks with too many missing values were removed from the sample. This yielded a final
sample of 23 banks. However, we must point out that the percentage of the total assets in 2010 of
our final sample was 92.12% of the total assets of the original sample.
When we limit the time span of our study to the period of 2001-2009, we are able to include six
more banks. These banks are: Banque Delen NV (private), Citibank Belgium NV/SA (commercial),
Delta Lloyd Bank (commercial), Deutsche Bank Sa (commercial), F. van Lanschot Bankiers Belgie
(private) and Société Générale Private Banking (private).
Adding these six banks to our sample means that, for the period from 2001 to 2009, we have data on
29 banks. For the full period 2001-2010, 23 banks are in the sample. Although these six banks
contribute only 1.90% of the total assets in the sample for the year 2009, we believe that adding
these banks to our sample brings added value to this research. We also need to stress that the four
major banks (i.e. BNP Paribas Fortis (former Fortis), KBC, ING and Dexia) together have a percentage
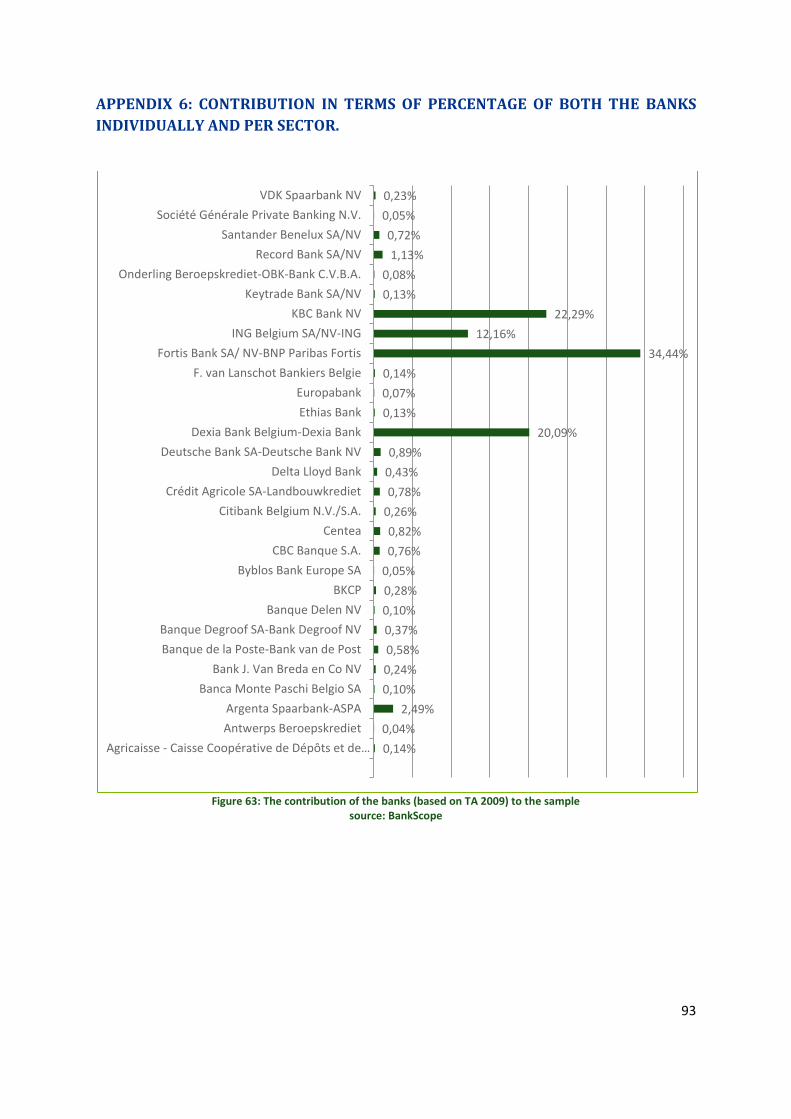
of 88.98% of the total assets in 2009. Appendix 6 shows the division of our sample based on total
assets in 2009 and per segment.
ECB segmentation
The classification of banks can be based on the sustainability of bank revenues. As suggested by a
report of the ECB4, banks can be classified on the basis of their share of core banking income, such as
net interest income and fees and commissions from on-balance sheet activities, compared to the
share of so-called non-recurring revenue activities, such as income from fees not related to balance
sheet activities as well as trading income and other one-off gains. Based on the sustainability of bank
revenues, we have created two sub-groups: universal banks and investment banks (see Table 2). As
mentioned previously, three income drivers can be distinguished in banking: (1) net interest income,
(2) net commissions and (3) financial transactions. In this exercise, banks are identified as driven by
investment activity when their share of commissions and trading income was higher than the share
of net interest income and other income in most periods, meaning that more than 50% of their total
income originates from net commissions and financial transactions.
4 ECB paper: ‘Beyond ROE- how to measure bank performance?; Appendix to the report on EU banking structures’,
September 2010.
Page 25
21
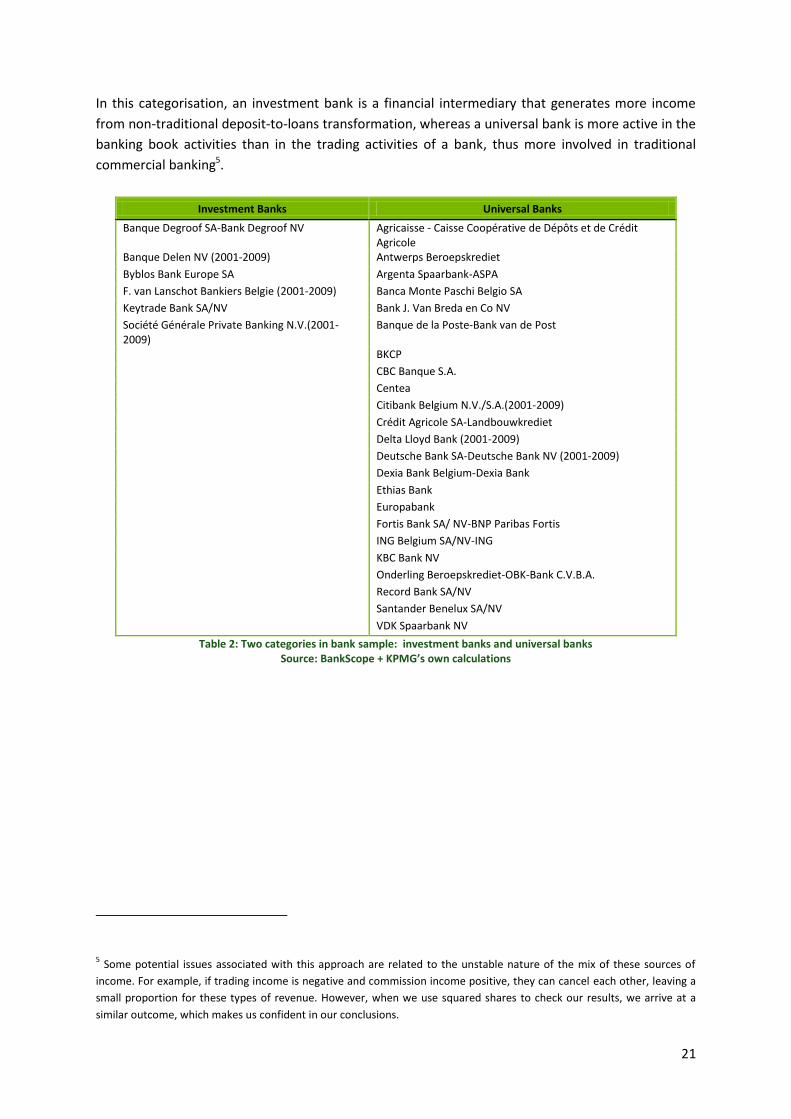
In this categorisation, an investment bank is a financial intermediary that generates more income
from non-traditional deposit-to-loans transformation, whereas a universal bank is more active in the
banking book activities than in the trading activities of a bank, thus more involved in traditional
commercial banking5.
Investment Banks Universal Banks
Banque Degroof SA-Bank Degroof NV Agricaisse - Caisse Coopérative de Dépôts et de Crédit Agricole
Banque Delen NV (2001-2009) Antwerps Beroepskrediet
Byblos Bank Europe SA Argenta Spaarbank-ASPA
F. van Lanschot Bankiers Belgie (2001-2009) Banca Monte Paschi Belgio SA
Keytrade Bank SA/NV Bank J. Van Breda en Co NV
Société Générale Private Banking N.V.(2001-2009)
Banque de la Poste-Bank van de Post
BKCP
CBC Banque S.A.
Centea
Citibank Belgium N.V./S.A.(2001-2009)
Crédit Agricole SA-Landbouwkrediet
Delta Lloyd Bank (2001-2009)
Deutsche Bank SA-Deutsche Bank NV (2001-2009)
Dexia Bank Belgium-Dexia Bank
Ethias Bank
Europabank
Fortis Bank SA/ NV-BNP Paribas Fortis
ING Belgium SA/NV-ING
KBC Bank NV
Onderling Beroepskrediet-OBK-Bank C.V.B.A.
Record Bank SA/NV
Santander Benelux SA/NV
VDK Spaarbank NV
Table 2: Two categories in bank sample: investment banks and universal banks Source: BankScope + KPMG’s own calculations
5 Some potential issues associated with this approach are related to the unstable nature of the mix of these sources of
income. For example, if trading income is negative and commission income positive, they can cancel each other, leaving a
small proportion for these types of revenue. However, when we use squared shares to check our results, we arrive at a
similar outcome, which makes us confident in our conclusions.
Page 26
22
Size segmentation
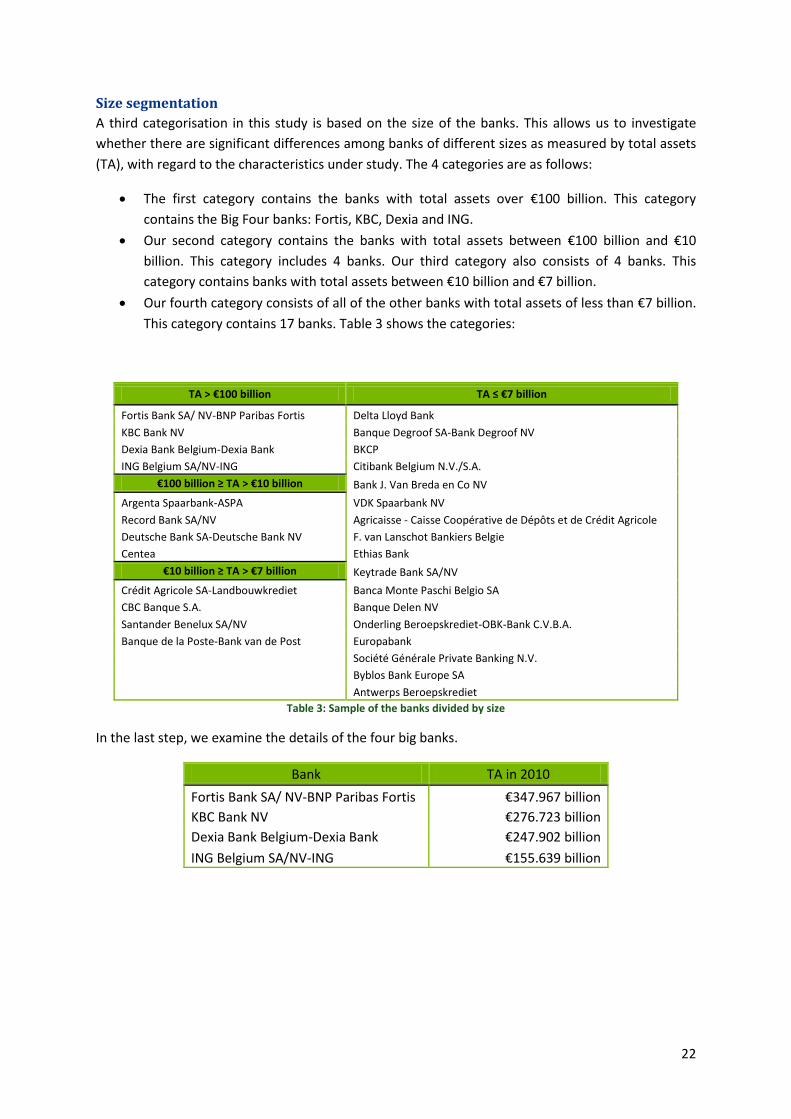
A third categorisation in this study is based on the size of the banks. This allows us to investigate
whether there are significant differences among banks of different sizes as measured by total assets
(TA), with regard to the characteristics under study. The 4 categories are as follows:
The first category contains the banks with total assets over €100 billion. This category
contains the Big Four banks: Fortis, KBC, Dexia and ING.
Our second category contains the banks with total assets between €100 billion and €10
billion. This category includes 4 banks. Our third category also consists of 4 banks. This
category contains banks with total assets between €10 billion and €7 billion.
Our fourth category consists of all of the other banks with total assets of less than €7 billion.
This category contains 17 banks. Table 3 shows the categories:
TA > €100 billion TA ≤ €7 billion
Fortis Bank SA/ NV-BNP Paribas Fortis Delta Lloyd Bank
KBC Bank NV Banque Degroof SA-Bank Degroof NV
Dexia Bank Belgium-Dexia Bank BKCP
ING Belgium SA/NV-ING Citibank Belgium N.V./S.A.
€100 billion ≥ TA > €10 billion Bank J. Van Breda en Co NV
Argenta Spaarbank-ASPA VDK Spaarbank NV
Record Bank SA/NV Agricaisse - Caisse Coopérative de Dépôts et de Crédit Agricole
Deutsche Bank SA-Deutsche Bank NV F. van Lanschot Bankiers Belgie
Centea Ethias Bank
€10 billion ≥ TA > €7 billion Keytrade Bank SA/NV
Crédit Agricole SA-Landbouwkrediet Banca Monte Paschi Belgio SA
CBC Banque S.A. Banque Delen NV
Santander Benelux SA/NV Onderling Beroepskrediet-OBK-Bank C.V.B.A.
Banque de la Poste-Bank van de Post Europabank
Société Générale Private Banking N.V.
Byblos Bank Europe SA
Antwerps Beroepskrediet
Table 3: Sample of the banks divided by size
In the last step, we examine the details of the four big banks.
Bank TA in 2010 Fortis Bank SA/ NV-BNP Paribas Fortis €347.967 billion
KBC Bank NV €276.723 billion
Dexia Bank Belgium-Dexia Bank €247.902 billion
ING Belgium SA/NV-ING €155.639 billion
Page 27
23
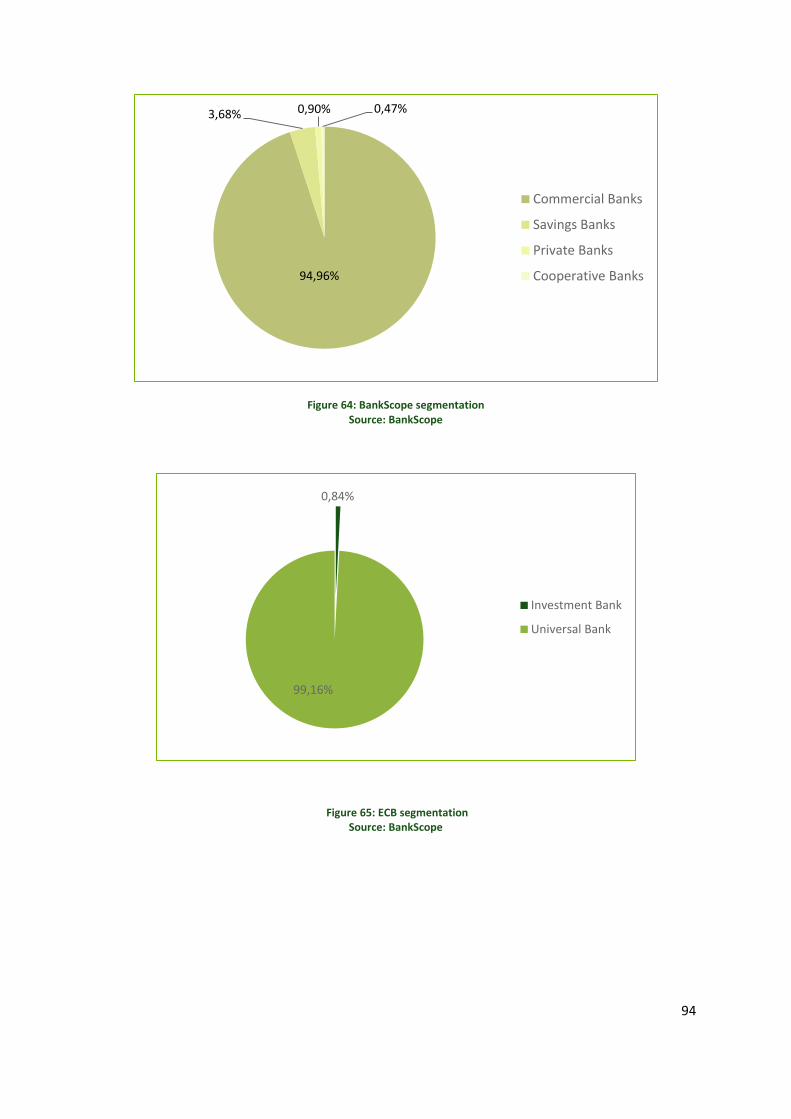
BankScope segmentation
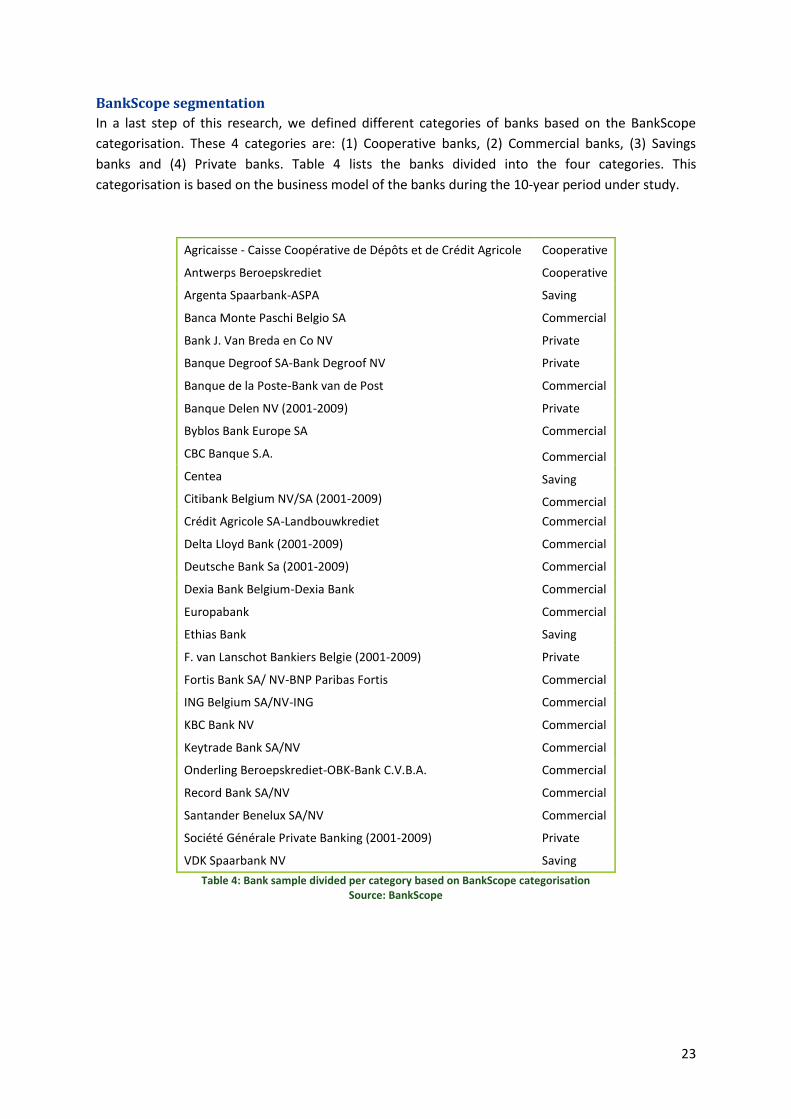
In a last step of this research, we defined different categories of banks based on the BankScope
categorisation. These 4 categories are: (1) Cooperative banks, (2) Commercial banks, (3) Savings
banks and (4) Private banks. Table 4 lists the banks divided into the four categories. This
categorisation is based on the business model of the banks during the 10-year period under study.
Agricaisse - Caisse Coopérative de Dépôts et de Crédit Agricole Cooperative
Antwerps Beroepskrediet Cooperative
Argenta Spaarbank-ASPA Saving
Banca Monte Paschi Belgio SA Commercial
Bank J. Van Breda en Co NV Private
Banque Degroof SA-Bank Degroof NV Private
Banque de la Poste-Bank van de Post Commercial
Banque Delen NV (2001-2009) Private
Byblos Bank Europe SA Commercial
CBC Banque S.A. Commercial
Centea Saving
Citibank Belgium NV/SA (2001-2009) Commercial
Crédit Agricole SA-Landbouwkrediet Commercial
Delta Lloyd Bank (2001-2009) Commercial
Deutsche Bank Sa (2001-2009) Commercial
Dexia Bank Belgium-Dexia Bank Commercial
Europabank Commercial
Ethias Bank Saving
F. van Lanschot Bankiers Belgie (2001-2009) Private
Fortis Bank SA/ NV-BNP Paribas Fortis Commercial
ING Belgium SA/NV-ING Commercial
KBC Bank NV Commercial
Keytrade Bank SA/NV Commercial
Onderling Beroepskrediet-OBK-Bank C.V.B.A. Commercial
Record Bank SA/NV Commercial
Santander Benelux SA/NV Commercial
Société Générale Private Banking (2001-2009) Private
VDK Spaarbank NV Saving
Table 4: Bank sample divided per category based on BankScope categorisation Source: BankScope
Page 28
24
OPERATIONAL INCOME TO TOTAL ASSETS
Step 1 of this research investigates the gross or total revenue (measured as the sum of net interest
income, net commissions and fees, and income from financial transactions) of the banks divided by
total assets. We see the evolution of their ability to generate revenue over the time period under study
(2001-2010). In a second step, we investigate the main drivers for the change in operational income
(i.e. net interest income, net commissions and fees, or income from financial transactions).
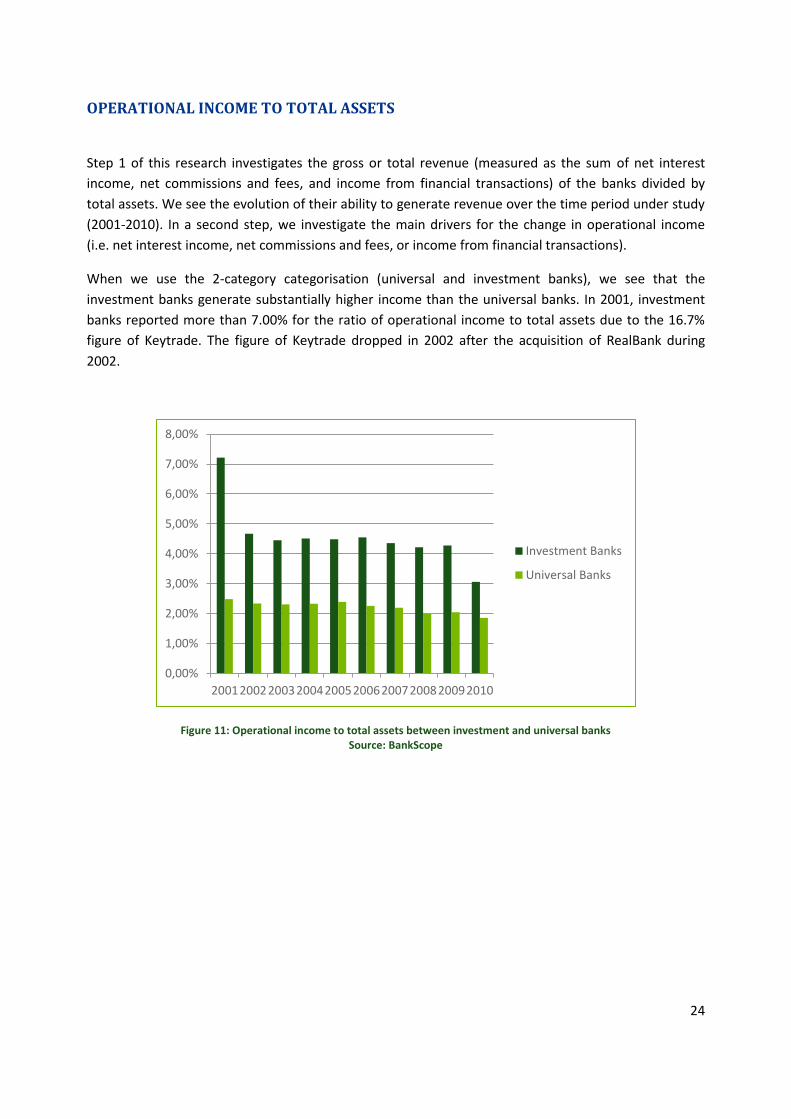
When we use the 2-category categorisation (universal and investment banks), we see that the
investment banks generate substantially higher income than the universal banks. In 2001, investment
banks reported more than 7.00% for the ratio of operational income to total assets due to the 16.7%
figure of Keytrade. The figure of Keytrade dropped in 2002 after the acquisition of RealBank during
2002.
Figure 11: Operational income to total assets between investment and universal banks Source: BankScope
0,00%
1,00%
2,00%
3,00%
4,00%
5,00%
6,00%
7,00%
8,00%
2001200220032004200520062007200820092010
Investment Banks
Universal Banks
Page 29
25
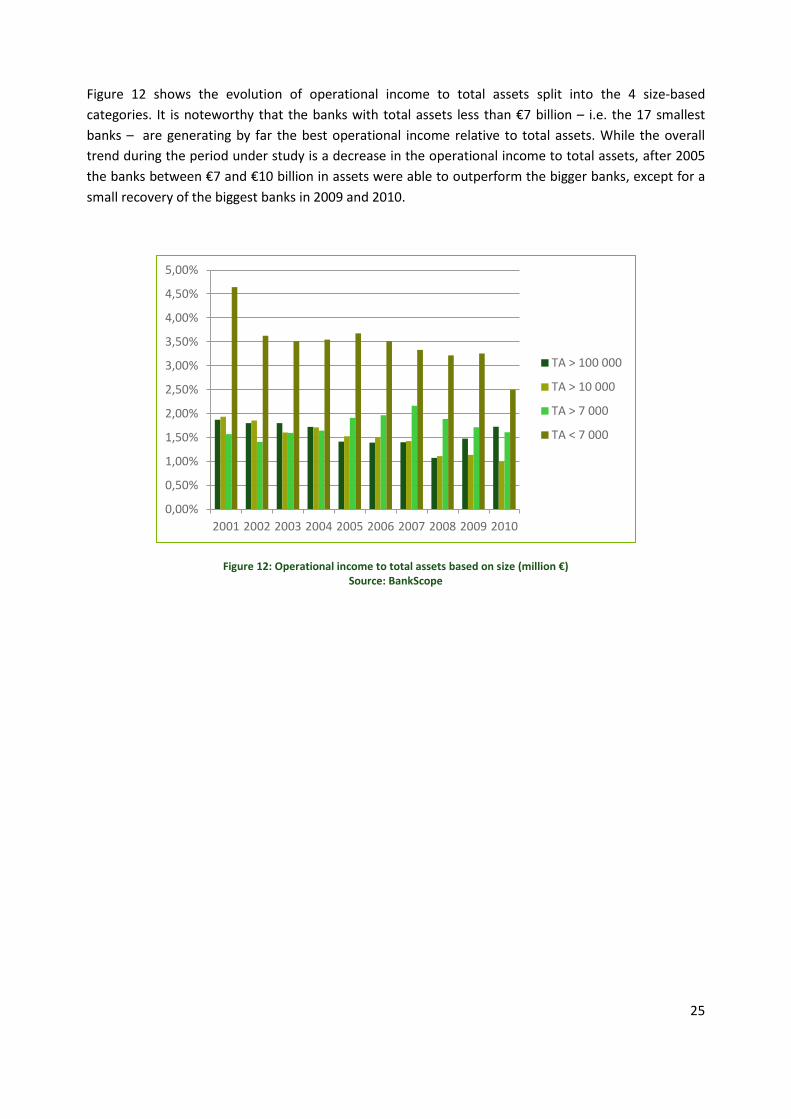
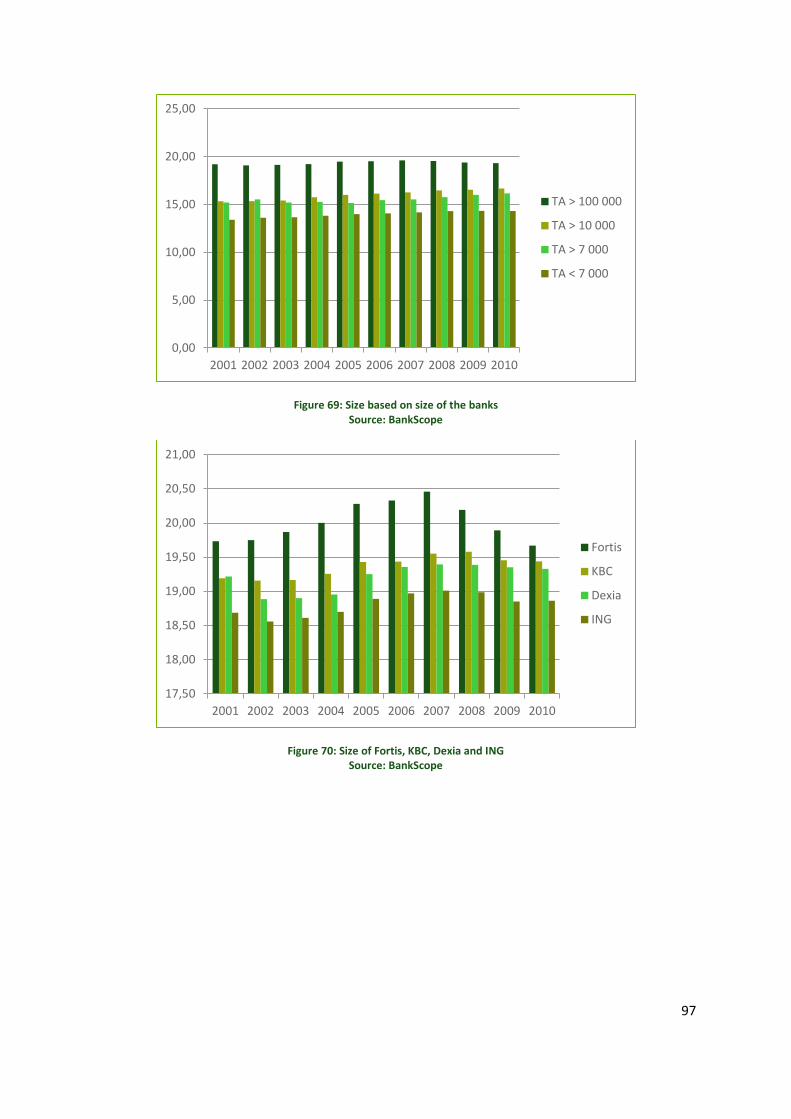
Figure 12 shows the evolution of operational income to total assets split into the 4 size-based
categories. It is noteworthy that the banks with total assets less than €7 billion – i.e. the 17 smallest
banks – are generating by far the best operational income relative to total assets. While the overall
trend during the period under study is a decrease in the operational income to total assets, after 2005
the banks between €7 and €10 billion in assets were able to outperform the bigger banks, except for a
small recovery of the biggest banks in 2009 and 2010.
Figure 12: Operational income to total assets based on size (million €) Source: BankScope
0,00%
0,50%
1,00%
1,50%
2,00%
2,50%
3,00%
3,50%
4,00%
4,50%
5,00%
2001 2002 2003 2004 2005 2006 2007 2008 2009 2010
TA > 100 000
TA > 10 000
TA > 7 000
TA < 7 000
Page 30
26
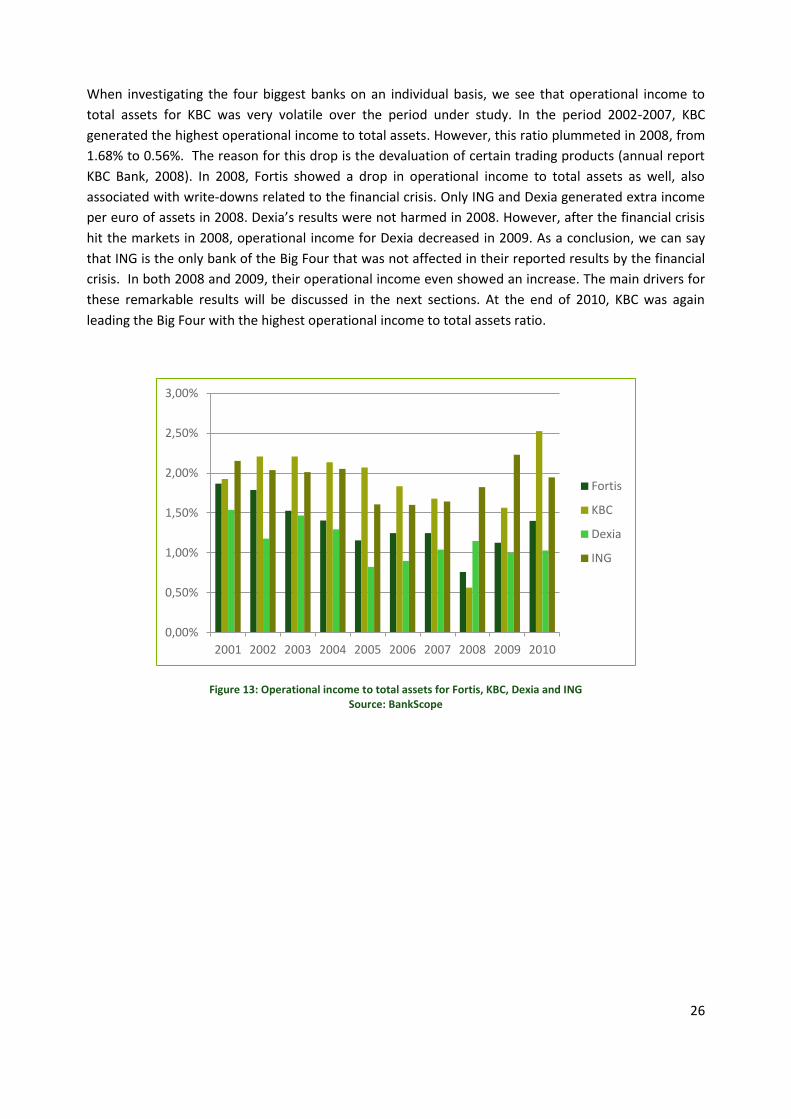
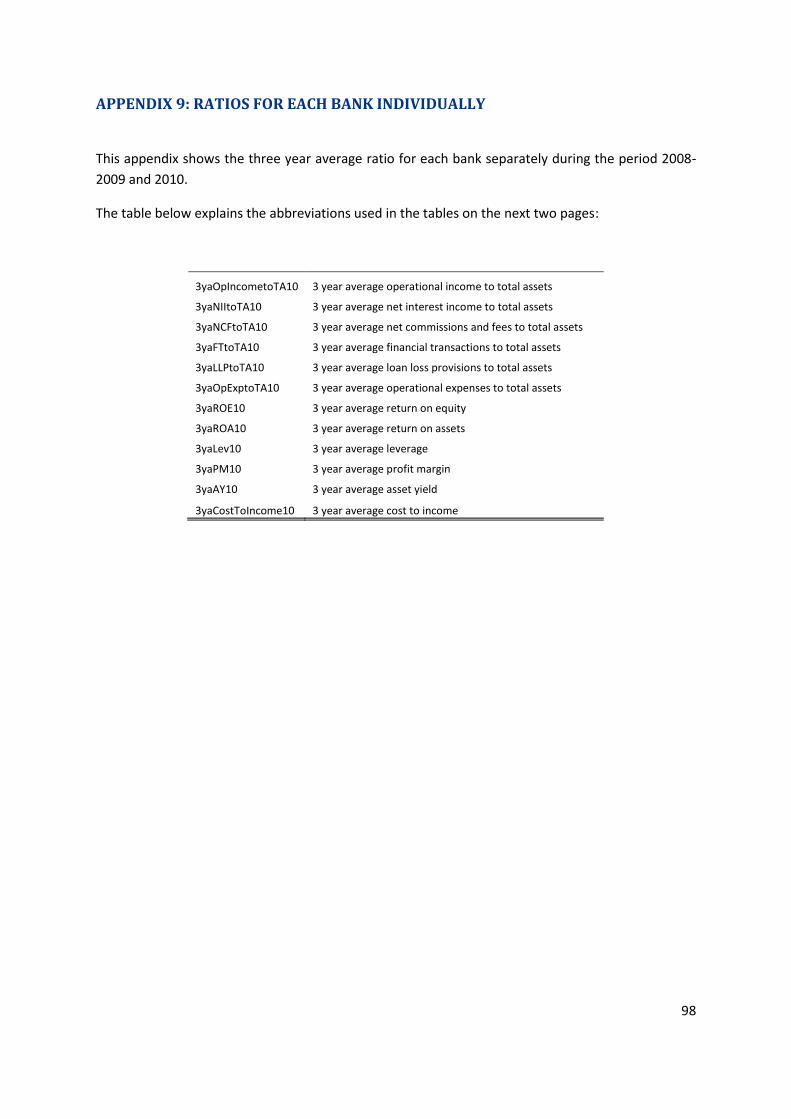
When investigating the four biggest banks on an individual basis, we see that operational income to
total assets for KBC was very volatile over the period under study. In the period 2002-2007, KBC
generated the highest operational income to total assets. However, this ratio plummeted in 2008, from
1.68% to 0.56%. The reason for this drop is the devaluation of certain trading products (annual report
KBC Bank, 2008). In 2008, Fortis showed a drop in operational income to total assets as well, also
associated with write-downs related to the financial crisis. Only ING and Dexia generated extra income
per euro of assets in 2008. Dexia’s results were not harmed in 2008. However, after the financial crisis
hit the markets in 2008, operational income for Dexia decreased in 2009. As a conclusion, we can say
that ING is the only bank of the Big Four that was not affected in their reported results by the financial
crisis. In both 2008 and 2009, their operational income even showed an increase. The main drivers for
these remarkable results will be discussed in the next sections. At the end of 2010, KBC was again
leading the Big Four with the highest operational income to total assets ratio.
Figure 13: Operational income to total assets for Fortis, KBC, Dexia and ING Source: BankScope
0,00%
0,50%
1,00%
1,50%
2,00%
2,50%
3,00%
2001 2002 2003 2004 2005 2006 2007 2008 2009 2010
Fortis
KBC
Dexia
ING
Page 31
27
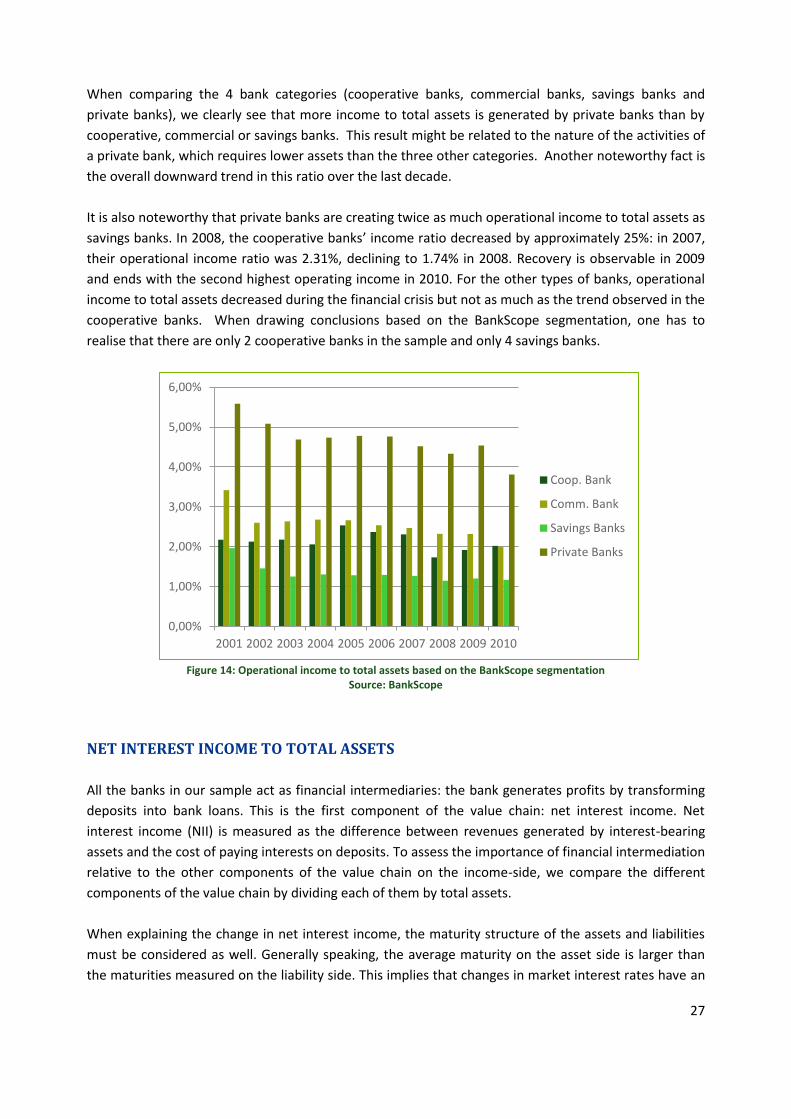
When comparing the 4 bank categories (cooperative banks, commercial banks, savings banks and
private banks), we clearly see that more income to total assets is generated by private banks than by
cooperative, commercial or savings banks. This result might be related to the nature of the activities of
a private bank, which requires lower assets than the three other categories. Another noteworthy fact is
the overall downward trend in this ratio over the last decade.
It is also noteworthy that private banks are creating twice as much operational income to total assets as
savings banks. In 2008, the cooperative banks’ income ratio decreased by approximately 25%: in 2007,
their operational income ratio was 2.31%, declining to 1.74% in 2008. Recovery is observable in 2009
and ends with the second highest operating income in 2010. For the other types of banks, operational
income to total assets decreased during the financial crisis but not as much as the trend observed in the
cooperative banks. When drawing conclusions based on the BankScope segmentation, one has to
realise that there are only 2 cooperative banks in the sample and only 4 savings banks.
Figure 14: Operational income to total assets based on the BankScope segmentation
Source: BankScope
NET INTEREST INCOME TO TOTAL ASSETS
All the banks in our sample act as financial intermediaries: the bank generates profits by transforming
deposits into bank loans. This is the first component of the value chain: net interest income. Net
interest income (NII) is measured as the difference between revenues generated by interest-bearing
assets and the cost of paying interests on deposits. To assess the importance of financial intermediation
relative to the other components of the value chain on the income-side, we compare the different
components of the value chain by dividing each of them by total assets.
When explaining the change in net interest income, the maturity structure of the assets and liabilities
must be considered as well. Generally speaking, the average maturity on the asset side is larger than
the maturities measured on the liability side. This implies that changes in market interest rates have an
0,00%
1,00%
2,00%
3,00%
4,00%
5,00%
6,00%
2001 2002 2003 2004 2005 2006 2007 2008 2009 2010
Coop. Bank
Comm. Bank
Savings Banks
Private Banks
Page 32
28
almost immediate influence on interest expenses. This could imply that, when interest rates increase,
NII decreases relatively6. In addition, recent literature (Bolt et al, 2010) suggests that bank’s lending
history should be taken into account when discussing NII in times of financial distress. Long-term
interest rates from previous years, characterised by economic growth (resulting in higher lending
activity), are found to be important determinants of Interest Income. However, the effect of long-term
interest rates on net interest income declines in time, due to repayments of loans as well as the growth
of the loan portfolio over time.
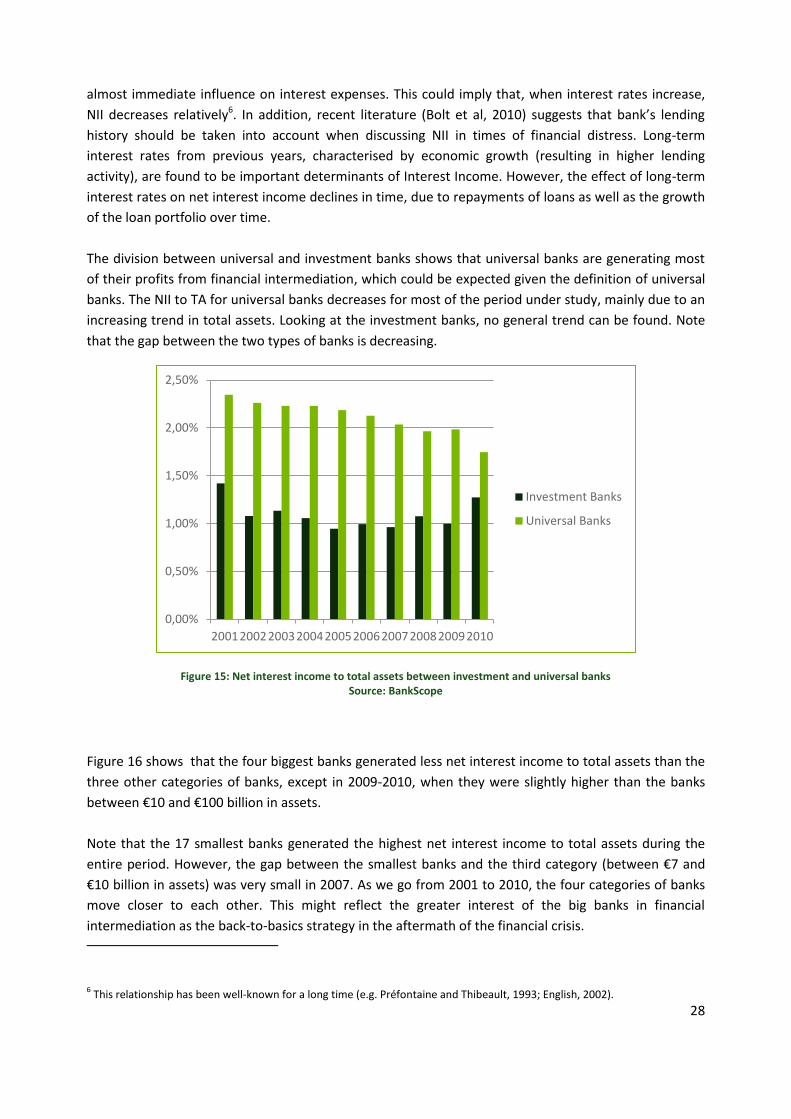
The division between universal and investment banks shows that universal banks are generating most
of their profits from financial intermediation, which could be expected given the definition of universal
banks. The NII to TA for universal banks decreases for most of the period under study, mainly due to an
increasing trend in total assets. Looking at the investment banks, no general trend can be found. Note
that the gap between the two types of banks is decreasing.
Figure 15: Net interest income to total assets between investment and universal banks Source: BankScope
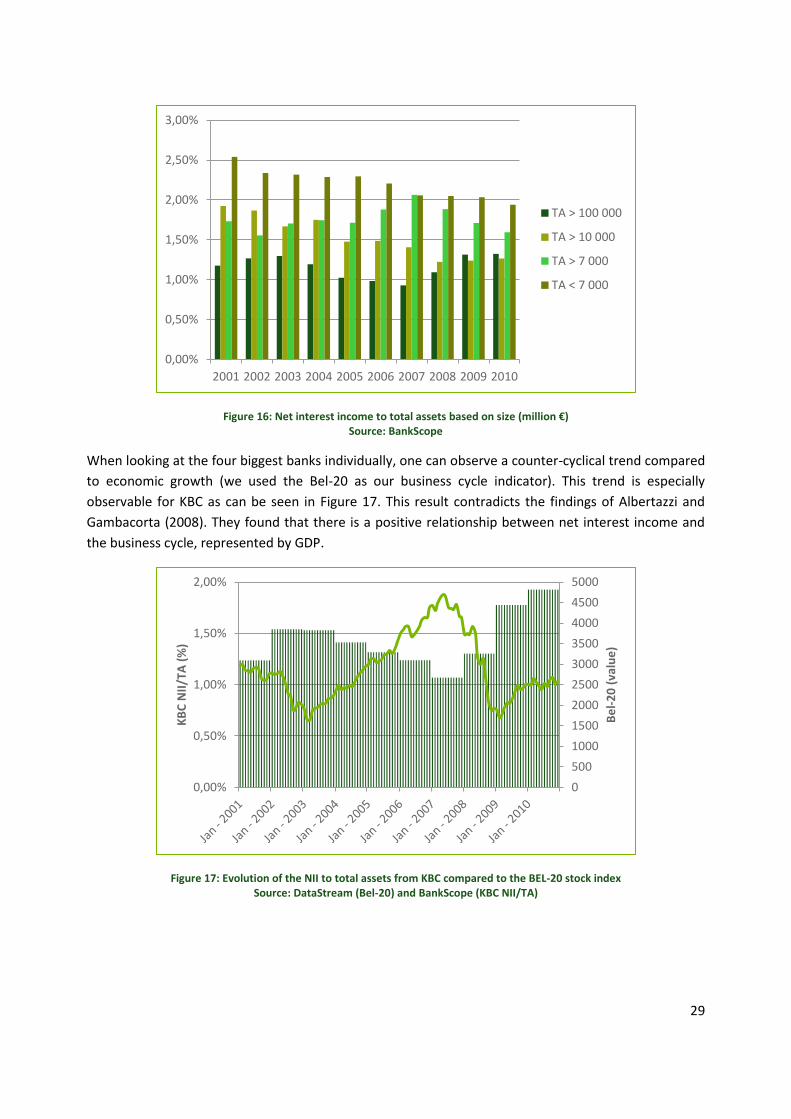
Figure 16 shows that the four biggest banks generated less net interest income to total assets than the
three other categories of banks, except in 2009-2010, when they were slightly higher than the banks
between €10 and €100 billion in assets.
Note that the 17 smallest banks generated the highest net interest income to total assets during the
entire period. However, the gap between the smallest banks and the third category (between €7 and
€10 billion in assets) was very small in 2007. As we go from 2001 to 2010, the four categories of banks
move closer to each other. This might reflect the greater interest of the big banks in financial
intermediation as the back-to-basics strategy in the aftermath of the financial crisis.
6 This relationship has been well-known for a long time (e.g. Préfontaine and Thibeault, 1993; English, 2002).
0,00%
0,50%
1,00%
1,50%
2,00%
2,50%
2001200220032004200520062007200820092010
Investment Banks
Universal Banks
Page 33
29
Figure 16: Net interest income to total assets based on size (million €) Source: BankScope
When looking at the four biggest banks individually, one can observe a counter-cyclical trend compared
to economic growth (we used the Bel-20 as our business cycle indicator). This trend is especially
observable for KBC as can be seen in Figure 17. This result contradicts the findings of Albertazzi and
Gambacorta (2008). They found that there is a positive relationship between net interest income and
the business cycle, represented by GDP.
Figure 17: Evolution of the NII to total assets from KBC compared to the BEL-20 stock index Source: DataStream (Bel-20) and BankScope (KBC NII/TA)
0,00%
0,50%
1,00%
1,50%
2,00%
2,50%
3,00%
2001 2002 2003 2004 2005 2006 2007 2008 2009 2010
TA > 100 000
TA > 10 000
TA > 7 000
TA < 7 000
0
500
1000
1500
2000
2500
3000
3500
4000
4500
5000
0,00%
0,50%
1,00%
1,50%
2,00%
Be
l-2
0 (
valu
e)
KB
C N
II/T
A (
%)
Page 34
30
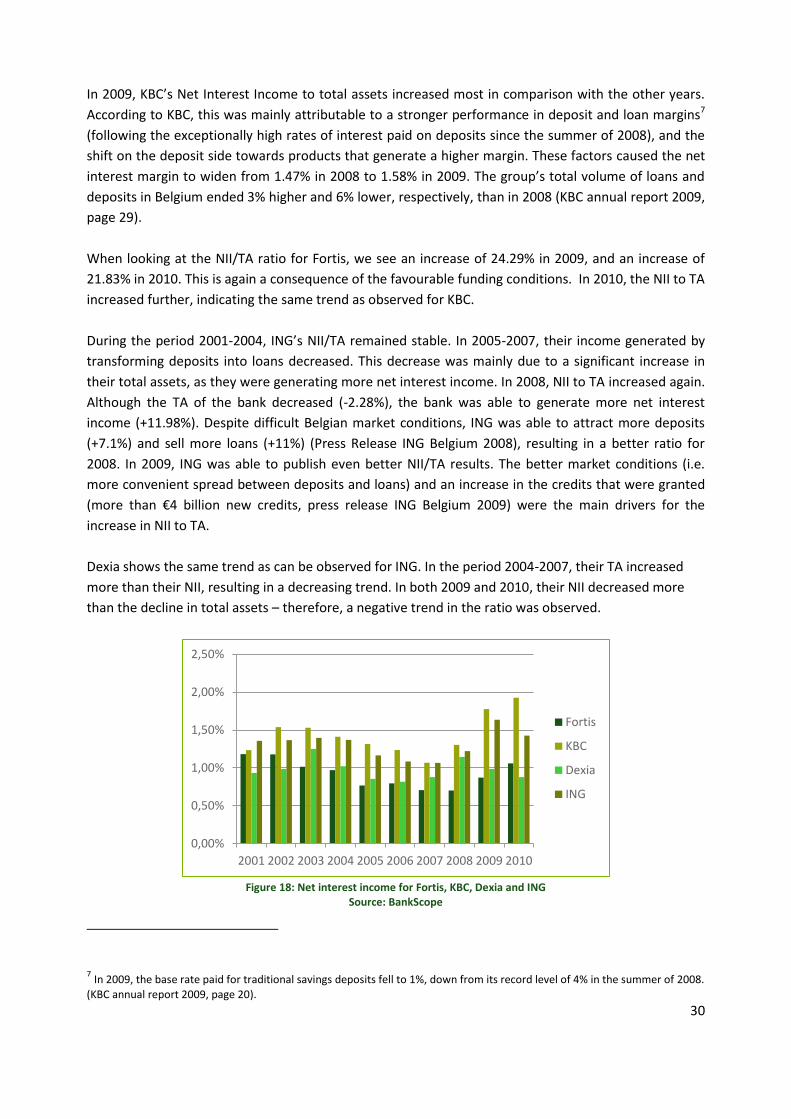
In 2009, KBC’s Net Interest Income to total assets increased most in comparison with the other years.
According to KBC, this was mainly attributable to a stronger performance in deposit and loan margins7
(following the exceptionally high rates of interest paid on deposits since the summer of 2008), and the
shift on the deposit side towards products that generate a higher margin. These factors caused the net
interest margin to widen from 1.47% in 2008 to 1.58% in 2009. The group’s total volume of loans and
deposits in Belgium ended 3% higher and 6% lower, respectively, than in 2008 (KBC annual report 2009,
page 29).
When looking at the NII/TA ratio for Fortis, we see an increase of 24.29% in 2009, and an increase of
21.83% in 2010. This is again a consequence of the favourable funding conditions. In 2010, the NII to TA
increased further, indicating the same trend as observed for KBC.
During the period 2001-2004, ING’s NII/TA remained stable. In 2005-2007, their income generated by
transforming deposits into loans decreased. This decrease was mainly due to a significant increase in
their total assets, as they were generating more net interest income. In 2008, NII to TA increased again.
Although the TA of the bank decreased (-2.28%), the bank was able to generate more net interest
income (+11.98%). Despite difficult Belgian market conditions, ING was able to attract more deposits
(+7.1%) and sell more loans (+11%) (Press Release ING Belgium 2008), resulting in a better ratio for
2008. In 2009, ING was able to publish even better NII/TA results. The better market conditions (i.e.
more convenient spread between deposits and loans) and an increase in the credits that were granted
(more than €4 billion new credits, press release ING Belgium 2009) were the main drivers for the
increase in NII to TA.
Dexia shows the same trend as can be observed for ING. In the period 2004-2007, their TA increased
more than their NII, resulting in a decreasing trend. In both 2009 and 2010, their NII decreased more
than the decline in total assets – therefore, a negative trend in the ratio was observed.
Figure 18: Net interest income for Fortis, KBC, Dexia and ING
Source: BankScope
7 In 2009, the base rate paid for traditional savings deposits fell to 1%, down from its record level of 4% in the summer of 2008.
(KBC annual report 2009, page 20).
0,00%
0,50%
1,00%
1,50%
2,00%
2,50%
2001 2002 2003 2004 2005 2006 2007 2008 2009 2010
Fortis
KBC
Dexia
ING
Page 35
31
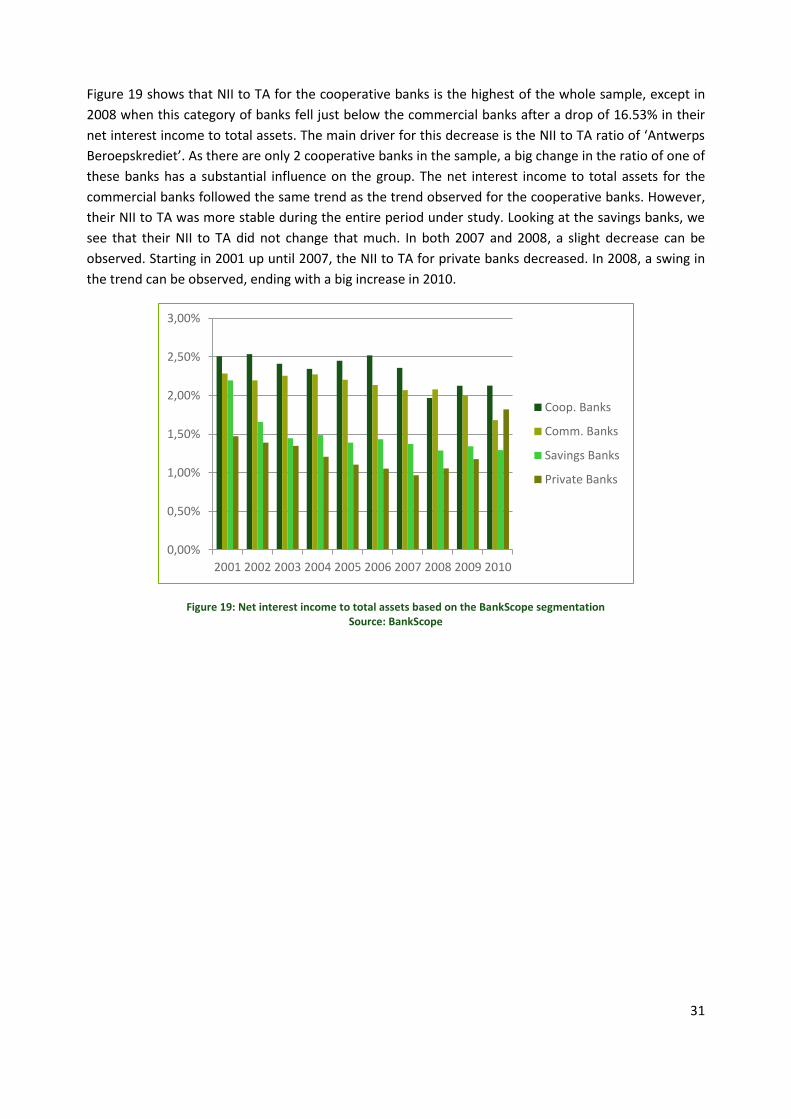
Figure 19 shows that NII to TA for the cooperative banks is the highest of the whole sample, except in
2008 when this category of banks fell just below the commercial banks after a drop of 16.53% in their
net interest income to total assets. The main driver for this decrease is the NII to TA ratio of ‘Antwerps
Beroepskrediet’. As there are only 2 cooperative banks in the sample, a big change in the ratio of one of
these banks has a substantial influence on the group. The net interest income to total assets for the
commercial banks followed the same trend as the trend observed for the cooperative banks. However,
their NII to TA was more stable during the entire period under study. Looking at the savings banks, we
see that their NII to TA did not change that much. In both 2007 and 2008, a slight decrease can be
observed. Starting in 2001 up until 2007, the NII to TA for private banks decreased. In 2008, a swing in
the trend can be observed, ending with a big increase in 2010.
Figure 19: Net interest income to total assets based on the BankScope segmentation Source: BankScope
0,00%
0,50%
1,00%
1,50%
2,00%
2,50%
3,00%
2001 2002 2003 2004 2005 2006 2007 2008 2009 2010
Coop. Banks
Comm. Banks
Savings Banks
Private Banks
Page 36
32
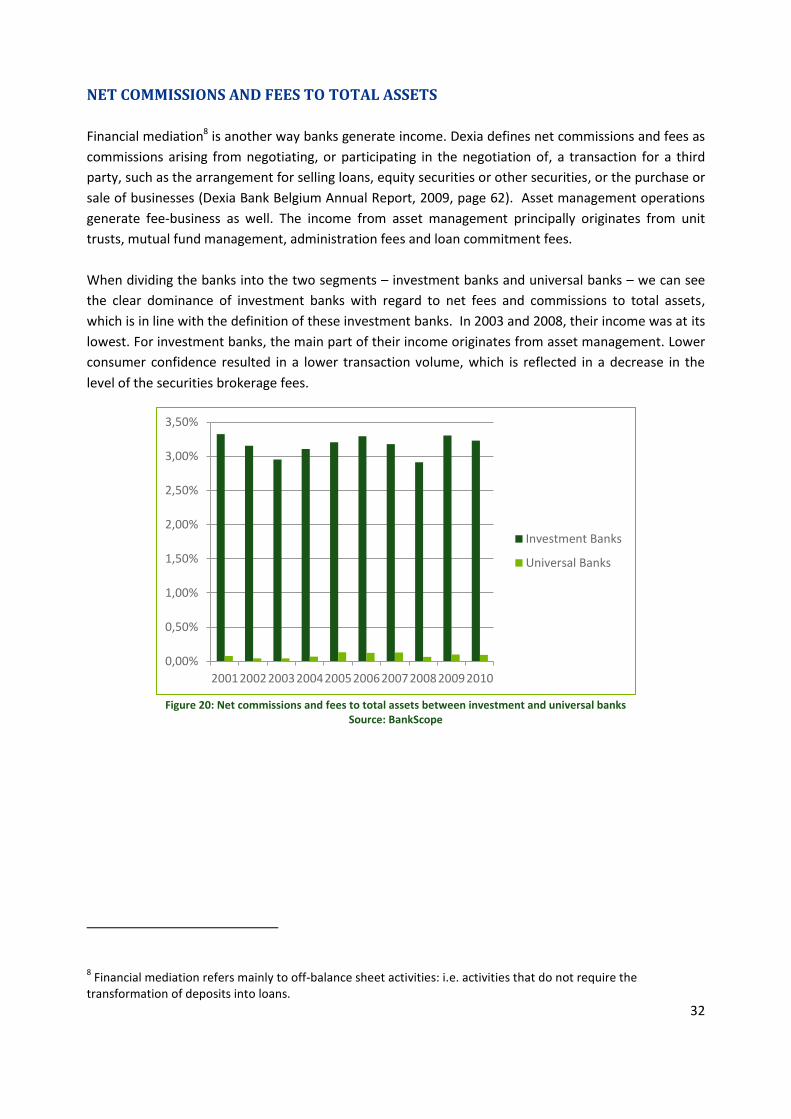
NET COMMISSIONS AND FEES TO TOTAL ASSETS
Financial mediation8 is another way banks generate income. Dexia defines net commissions and fees as
commissions arising from negotiating, or participating in the negotiation of, a transaction for a third
party, such as the arrangement for selling loans, equity securities or other securities, or the purchase or
sale of businesses (Dexia Bank Belgium Annual Report, 2009, page 62). Asset management operations
generate fee-business as well. The income from asset management principally originates from unit
trusts, mutual fund management, administration fees and loan commitment fees.
When dividing the banks into the two segments – investment banks and universal banks – we can see
the clear dominance of investment banks with regard to net fees and commissions to total assets,
which is in line with the definition of these investment banks. In 2003 and 2008, their income was at its
lowest. For investment banks, the main part of their income originates from asset management. Lower
consumer confidence resulted in a lower transaction volume, which is reflected in a decrease in the
level of the securities brokerage fees.
Figure 20: Net commissions and fees to total assets between investment and universal banks
Source: BankScope
8 Financial mediation refers mainly to off-balance sheet activities: i.e. activities that do not require the
transformation of deposits into loans.
0,00%
0,50%
1,00%
1,50%
2,00%
2,50%
3,00%
3,50%
2001200220032004200520062007200820092010
Investment Banks
Universal Banks
Page 37
33
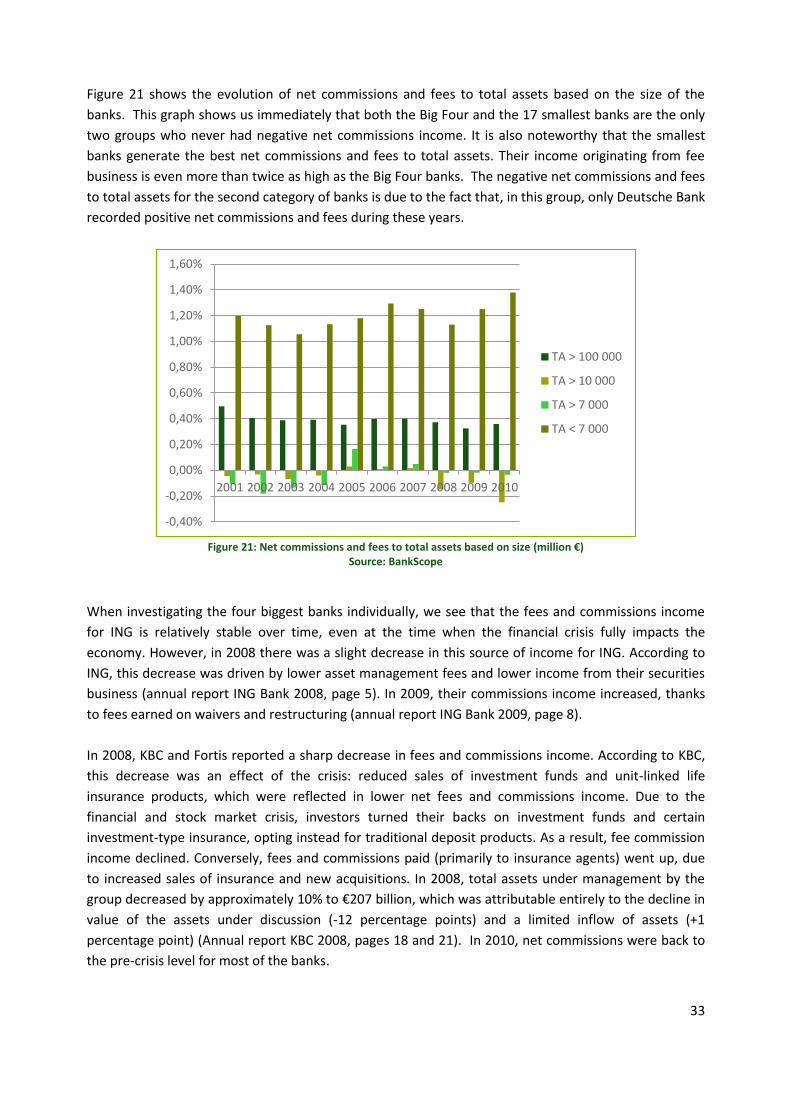
Figure 21 shows the evolution of net commissions and fees to total assets based on the size of the
banks. This graph shows us immediately that both the Big Four and the 17 smallest banks are the only
two groups who never had negative net commissions income. It is also noteworthy that the smallest
banks generate the best net commissions and fees to total assets. Their income originating from fee
business is even more than twice as high as the Big Four banks. The negative net commissions and fees
to total assets for the second category of banks is due to the fact that, in this group, only Deutsche Bank
recorded positive net commissions and fees during these years.
Figure 21: Net commissions and fees to total assets based on size (million €)
Source: BankScope
When investigating the four biggest banks individually, we see that the fees and commissions income
for ING is relatively stable over time, even at the time when the financial crisis fully impacts the
economy. However, in 2008 there was a slight decrease in this source of income for ING. According to
ING, this decrease was driven by lower asset management fees and lower income from their securities
business (annual report ING Bank 2008, page 5). In 2009, their commissions income increased, thanks
to fees earned on waivers and restructuring (annual report ING Bank 2009, page 8).
In 2008, KBC and Fortis reported a sharp decrease in fees and commissions income. According to KBC,
this decrease was an effect of the crisis: reduced sales of investment funds and unit-linked life
insurance products, which were reflected in lower net fees and commissions income. Due to the
financial and stock market crisis, investors turned their backs on investment funds and certain
investment-type insurance, opting instead for traditional deposit products. As a result, fee commission
income declined. Conversely, fees and commissions paid (primarily to insurance agents) went up, due
to increased sales of insurance and new acquisitions. In 2008, total assets under management by the
group decreased by approximately 10% to €207 billion, which was attributable entirely to the decline in
value of the assets under discussion (-12 percentage points) and a limited inflow of assets (+1
percentage point) (Annual report KBC 2008, pages 18 and 21). In 2010, net commissions were back to
the pre-crisis level for most of the banks.
-0,40%
-0,20%
0,00%
0,20%
0,40%
0,60%
0,80%
1,00%
1,20%
1,40%
1,60%
2001 2002 2003 2004 2005 2006 2007 2008 2009 2010
TA > 100 000
TA > 10 000
TA > 7 000
TA < 7 000
Page 38
34
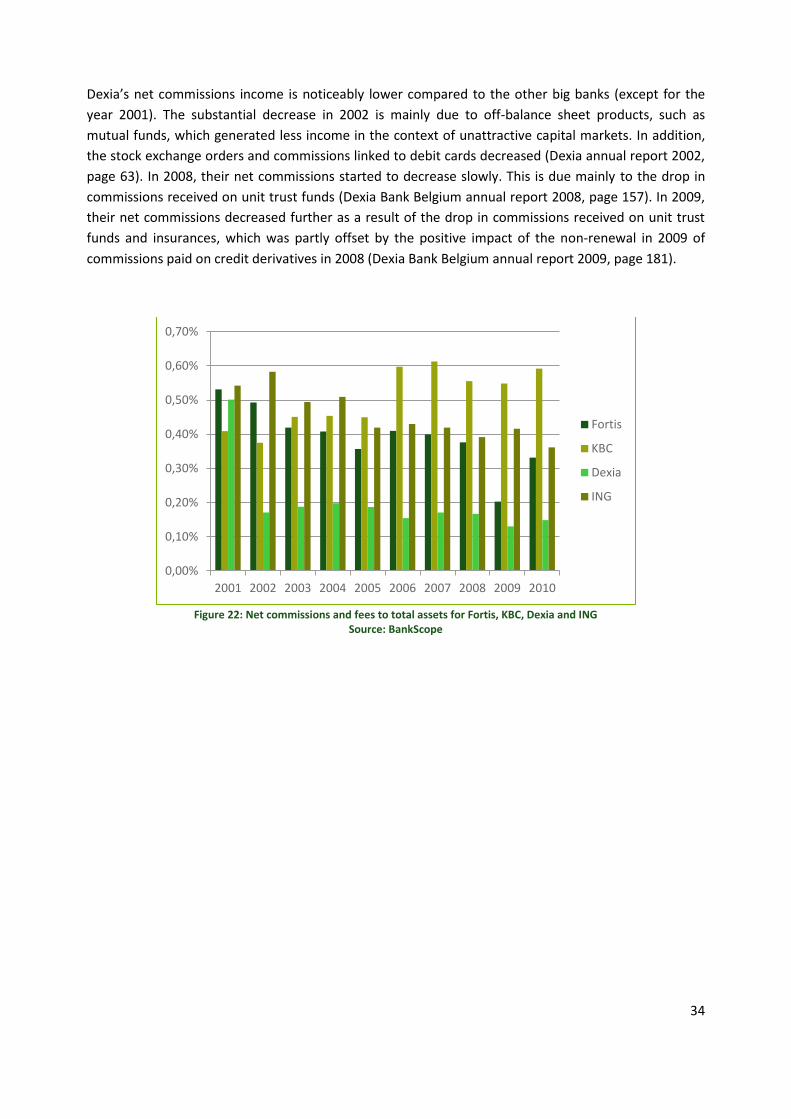
Dexia’s net commissions income is noticeably lower compared to the other big banks (except for the
year 2001). The substantial decrease in 2002 is mainly due to off-balance sheet products, such as
mutual funds, which generated less income in the context of unattractive capital markets. In addition,
the stock exchange orders and commissions linked to debit cards decreased (Dexia annual report 2002,
page 63). In 2008, their net commissions started to decrease slowly. This is due mainly to the drop in
commissions received on unit trust funds (Dexia Bank Belgium annual report 2008, page 157). In 2009,
their net commissions decreased further as a result of the drop in commissions received on unit trust
funds and insurances, which was partly offset by the positive impact of the non-renewal in 2009 of
commissions paid on credit derivatives in 2008 (Dexia Bank Belgium annual report 2009, page 181).
Figure 22: Net commissions and fees to total assets for Fortis, KBC, Dexia and ING
Source: BankScope
0,00%
0,10%
0,20%
0,30%
0,40%
0,50%
0,60%
0,70%
2001 2002 2003 2004 2005 2006 2007 2008 2009 2010
Fortis
KBC
Dexia
ING
Page 39
35
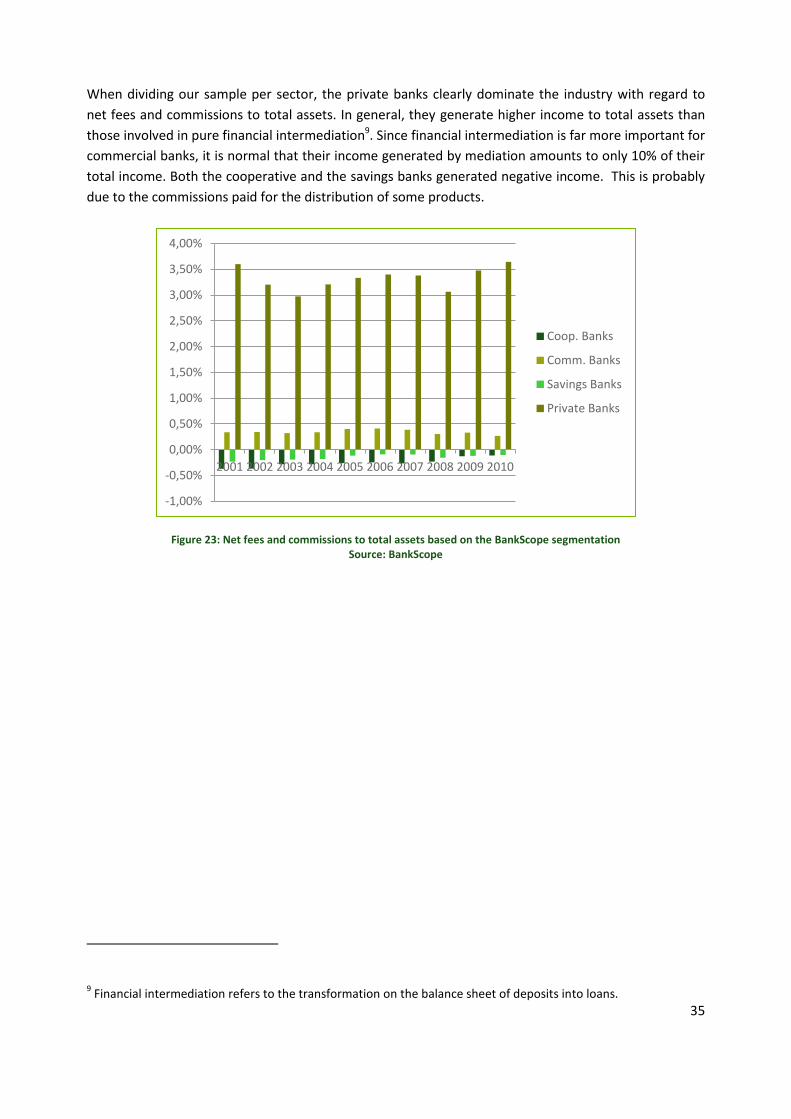
When dividing our sample per sector, the private banks clearly dominate the industry with regard to
net fees and commissions to total assets. In general, they generate higher income to total assets than
those involved in pure financial intermediation9. Since financial intermediation is far more important for
commercial banks, it is normal that their income generated by mediation amounts to only 10% of their
total income. Both the cooperative and the savings banks generated negative income. This is probably
due to the commissions paid for the distribution of some products.
Figure 23: Net fees and commissions to total assets based on the BankScope segmentation Source: BankScope
9 Financial intermediation refers to the transformation on the balance sheet of deposits into loans.
-1,00%
-0,50%
0,00%
0,50%
1,00%
1,50%
2,00%
2,50%
3,00%
3,50%
4,00%
2001 2002 2003 2004 2005 2006 2007 2008 2009 2010
Coop. Banks
Comm. Banks
Savings Banks
Private Banks
Page 40
36
FINANCIAL TRANSACTIONS TO TOTAL ASSETS
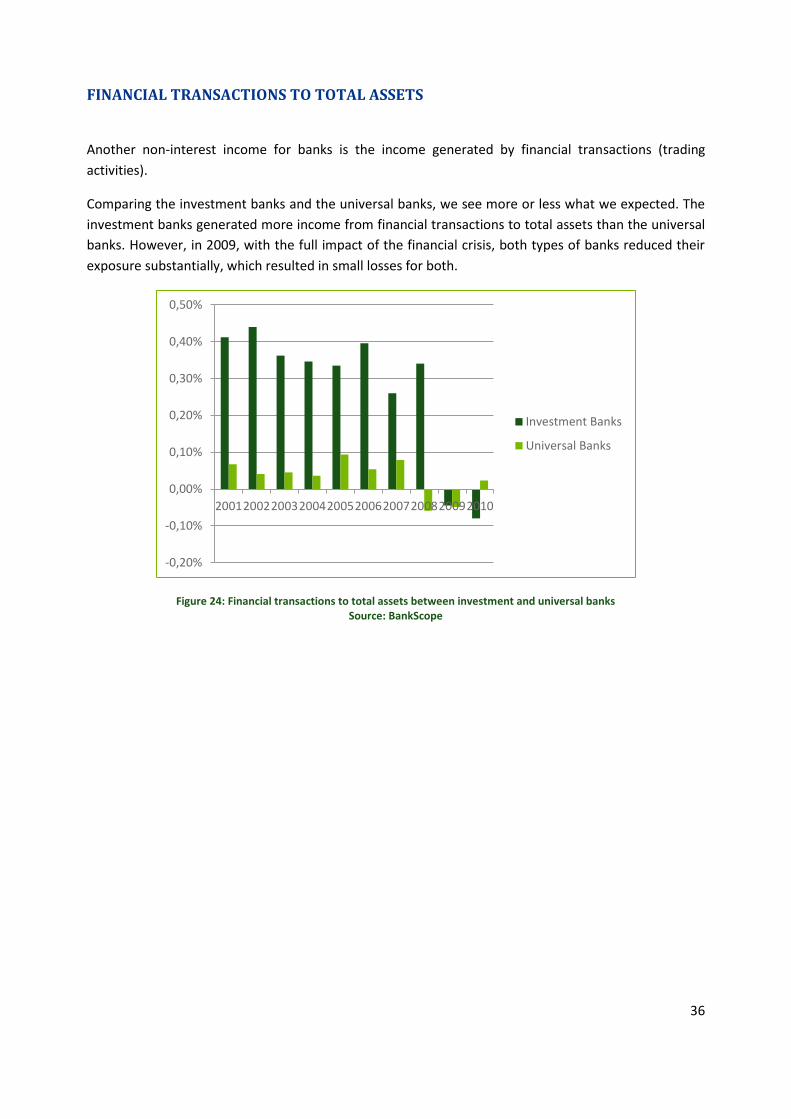
Another non-interest income for banks is the income generated by financial transactions (trading
activities).
Comparing the investment banks and the universal banks, we see more or less what we expected. The
investment banks generated more income from financial transactions to total assets than the universal
banks. However, in 2009, with the full impact of the financial crisis, both types of banks reduced their
exposure substantially, which resulted in small losses for both.
Figure 24: Financial transactions to total assets between investment and universal banks Source: BankScope
-0,20%
-0,10%
0,00%
0,10%
0,20%
0,30%
0,40%
0,50%
2001200220032004200520062007200820092010
Investment Banks
Universal Banks
Page 41
37
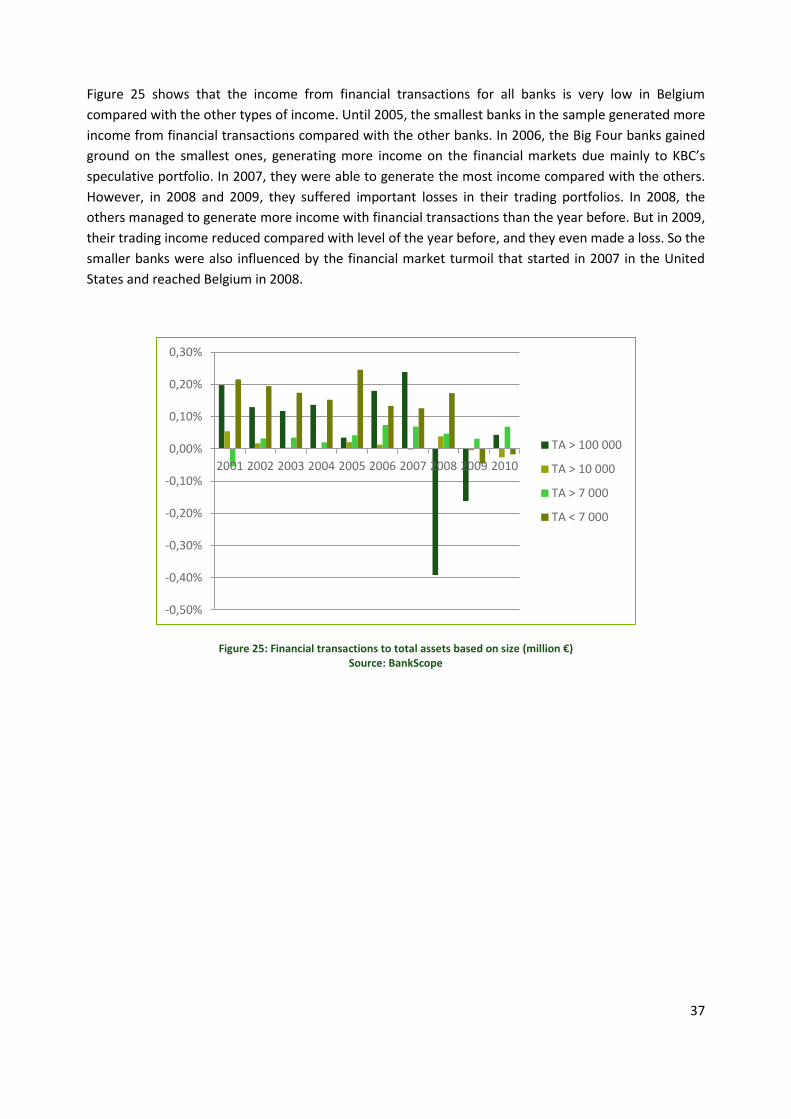
Figure 25 shows that the income from financial transactions for all banks is very low in Belgium
compared with the other types of income. Until 2005, the smallest banks in the sample generated more
income from financial transactions compared with the other banks. In 2006, the Big Four banks gained
ground on the smallest ones, generating more income on the financial markets due mainly to KBC’s
speculative portfolio. In 2007, they were able to generate the most income compared with the others.
However, in 2008 and 2009, they suffered important losses in their trading portfolios. In 2008, the
others managed to generate more income with financial transactions than the year before. But in 2009,
their trading income reduced compared with level of the year before, and they even made a loss. So the
smaller banks were also influenced by the financial market turmoil that started in 2007 in the United
States and reached Belgium in 2008.
Figure 25: Financial transactions to total assets based on size (million €) Source: BankScope
-0,50%
-0,40%
-0,30%
-0,20%
-0,10%
0,00%
0,10%
0,20%
0,30%
2001 2002 2003 2004 2005 2006 2007 2008 2009 2010
TA > 100 000
TA > 10 000
TA > 7 000
TA < 7 000
Page 42
38
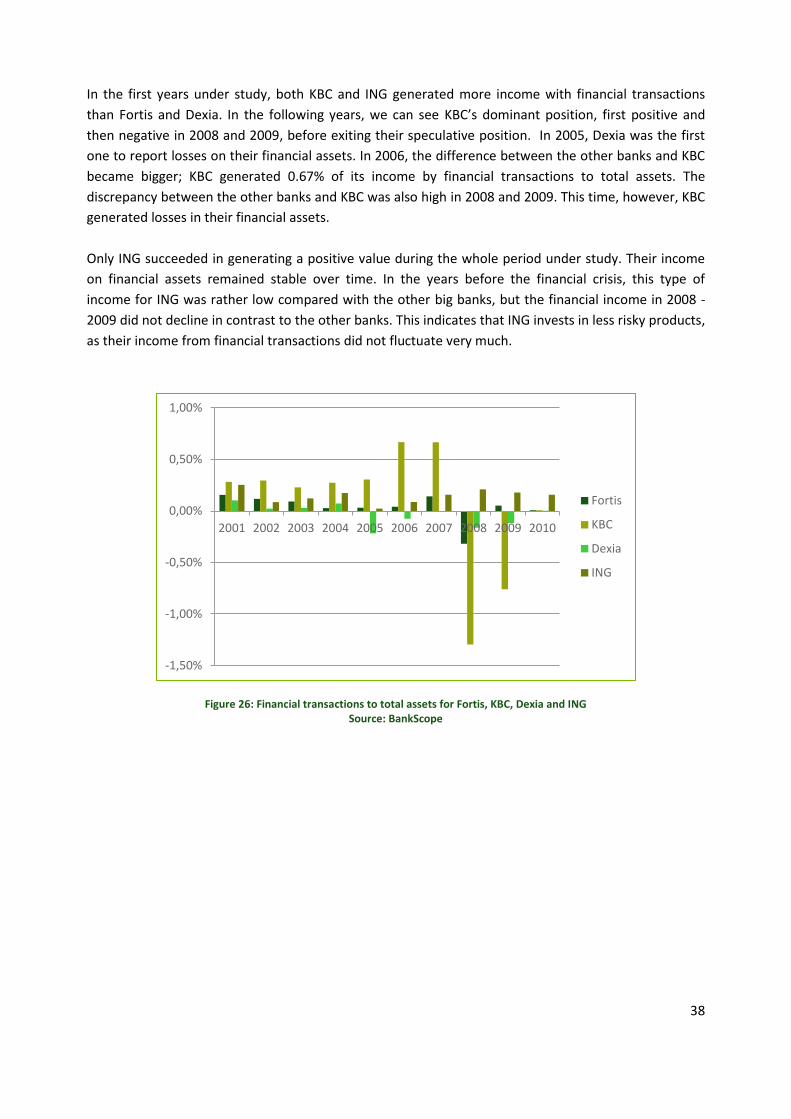
In the first years under study, both KBC and ING generated more income with financial transactions
than Fortis and Dexia. In the following years, we can see KBC’s dominant position, first positive and
then negative in 2008 and 2009, before exiting their speculative position. In 2005, Dexia was the first
one to report losses on their financial assets. In 2006, the difference between the other banks and KBC
became bigger; KBC generated 0.67% of its income by financial transactions to total assets. The
discrepancy between the other banks and KBC was also high in 2008 and 2009. This time, however, KBC
generated losses in their financial assets.
Only ING succeeded in generating a positive value during the whole period under study. Their income
on financial assets remained stable over time. In the years before the financial crisis, this type of
income for ING was rather low compared with the other big banks, but the financial income in 2008 -
2009 did not decline in contrast to the other banks. This indicates that ING invests in less risky products,
as their income from financial transactions did not fluctuate very much.
Figure 26: Financial transactions to total assets for Fortis, KBC, Dexia and ING Source: BankScope
-1,50%
-1,00%
-0,50%
0,00%
0,50%
1,00%
2001 2002 2003 2004 2005 2006 2007 2008 2009 2010
Fortis
KBC
Dexia
ING
Page 43
39
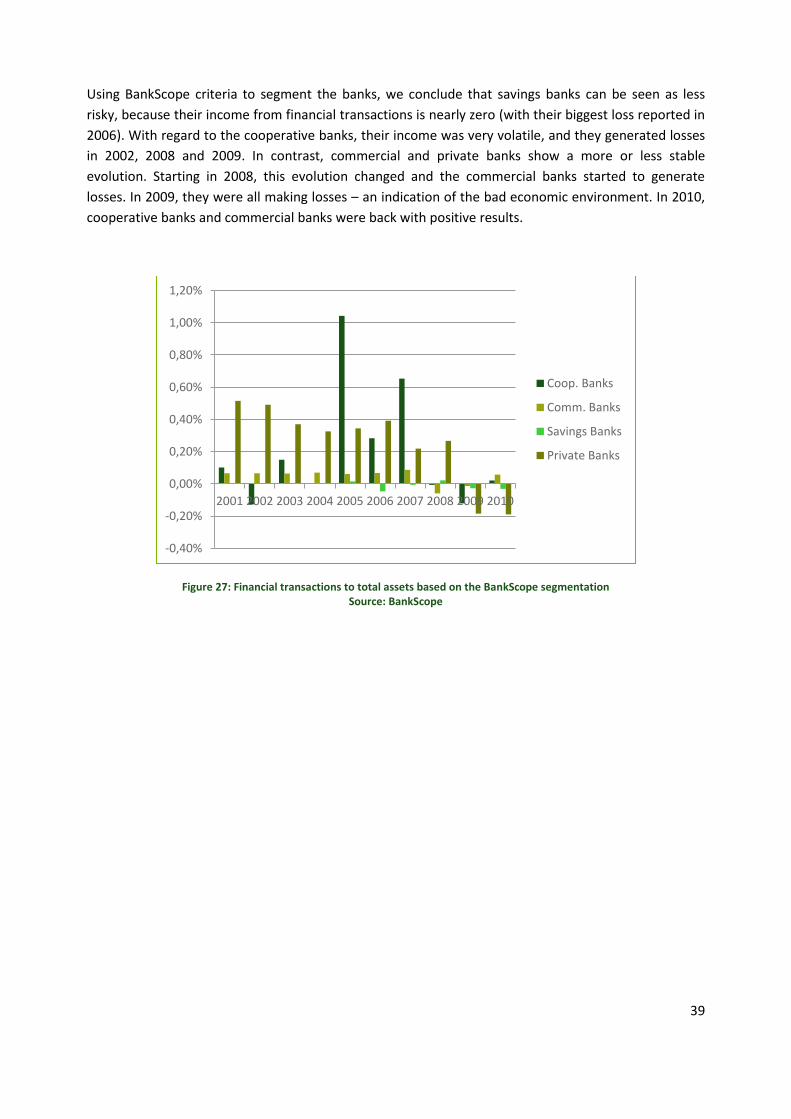
Using BankScope criteria to segment the banks, we conclude that savings banks can be seen as less
risky, because their income from financial transactions is nearly zero (with their biggest loss reported in
2006). With regard to the cooperative banks, their income was very volatile, and they generated losses
in 2002, 2008 and 2009. In contrast, commercial and private banks show a more or less stable
evolution. Starting in 2008, this evolution changed and the commercial banks started to generate
losses. In 2009, they were all making losses – an indication of the bad economic environment. In 2010,
cooperative banks and commercial banks were back with positive results.
Figure 27: Financial transactions to total assets based on the BankScope segmentation Source: BankScope
-0,40%
-0,20%
0,00%
0,20%
0,40%
0,60%
0,80%
1,00%
1,20%
2001 2002 2003 2004 2005 2006 2007 2008 2009 2010
Coop. Banks
Comm. Banks
Savings Banks
Private Banks
Page 44
40
OPERATIONAL EXPENSES TO TOTAL ASSETS
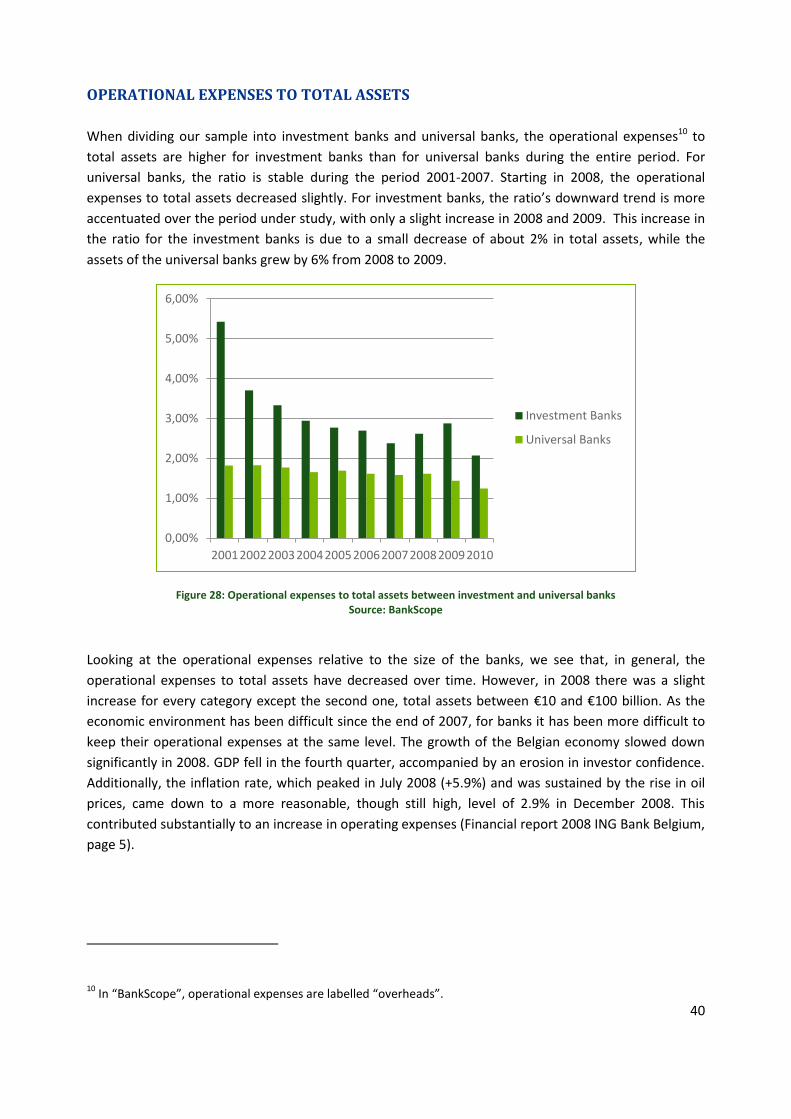
When dividing our sample into investment banks and universal banks, the operational expenses10 to
total assets are higher for investment banks than for universal banks during the entire period. For
universal banks, the ratio is stable during the period 2001-2007. Starting in 2008, the operational
expenses to total assets decreased slightly. For investment banks, the ratio’s downward trend is more
accentuated over the period under study, with only a slight increase in 2008 and 2009. This increase in
the ratio for the investment banks is due to a small decrease of about 2% in total assets, while the
assets of the universal banks grew by 6% from 2008 to 2009.
Figure 28: Operational expenses to total assets between investment and universal banks Source: BankScope
Looking at the operational expenses relative to the size of the banks, we see that, in general, the
operational expenses to total assets have decreased over time. However, in 2008 there was a slight
increase for every category except the second one, total assets between €10 and €100 billion. As the
economic environment has been difficult since the end of 2007, for banks it has been more difficult to
keep their operational expenses at the same level. The growth of the Belgian economy slowed down
significantly in 2008. GDP fell in the fourth quarter, accompanied by an erosion in investor confidence.
Additionally, the inflation rate, which peaked in July 2008 (+5.9%) and was sustained by the rise in oil
prices, came down to a more reasonable, though still high, level of 2.9% in December 2008. This
contributed substantially to an increase in operating expenses (Financial report 2008 ING Bank Belgium,
page 5).
10 In “BankScope”, operational expenses are labelled “overheads”.
0,00%
1,00%
2,00%
3,00%
4,00%
5,00%
6,00%
2001200220032004200520062007200820092010
Investment Banks
Universal Banks
Page 45
41
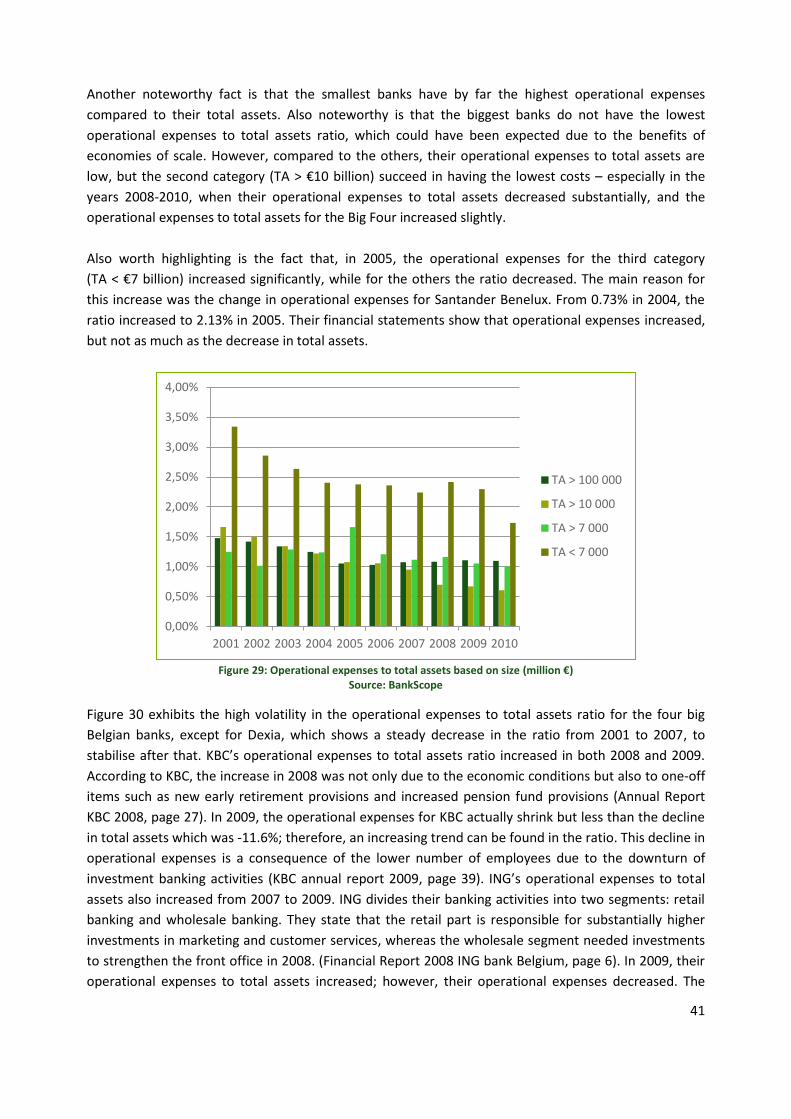
Another noteworthy fact is that the smallest banks have by far the highest operational expenses
compared to their total assets. Also noteworthy is that the biggest banks do not have the lowest
operational expenses to total assets ratio, which could have been expected due to the benefits of
economies of scale. However, compared to the others, their operational expenses to total assets are
low, but the second category (TA > €10 billion) succeed in having the lowest costs – especially in the
years 2008-2010, when their operational expenses to total assets decreased substantially, and the
operational expenses to total assets for the Big Four increased slightly.
Also worth highlighting is the fact that, in 2005, the operational expenses for the third category
(TA < €7 billion) increased significantly, while for the others the ratio decreased. The main reason for
this increase was the change in operational expenses for Santander Benelux. From 0.73% in 2004, the
ratio increased to 2.13% in 2005. Their financial statements show that operational expenses increased,
but not as much as the decrease in total assets.
Figure 29: Operational expenses to total assets based on size (million €)
Source: BankScope
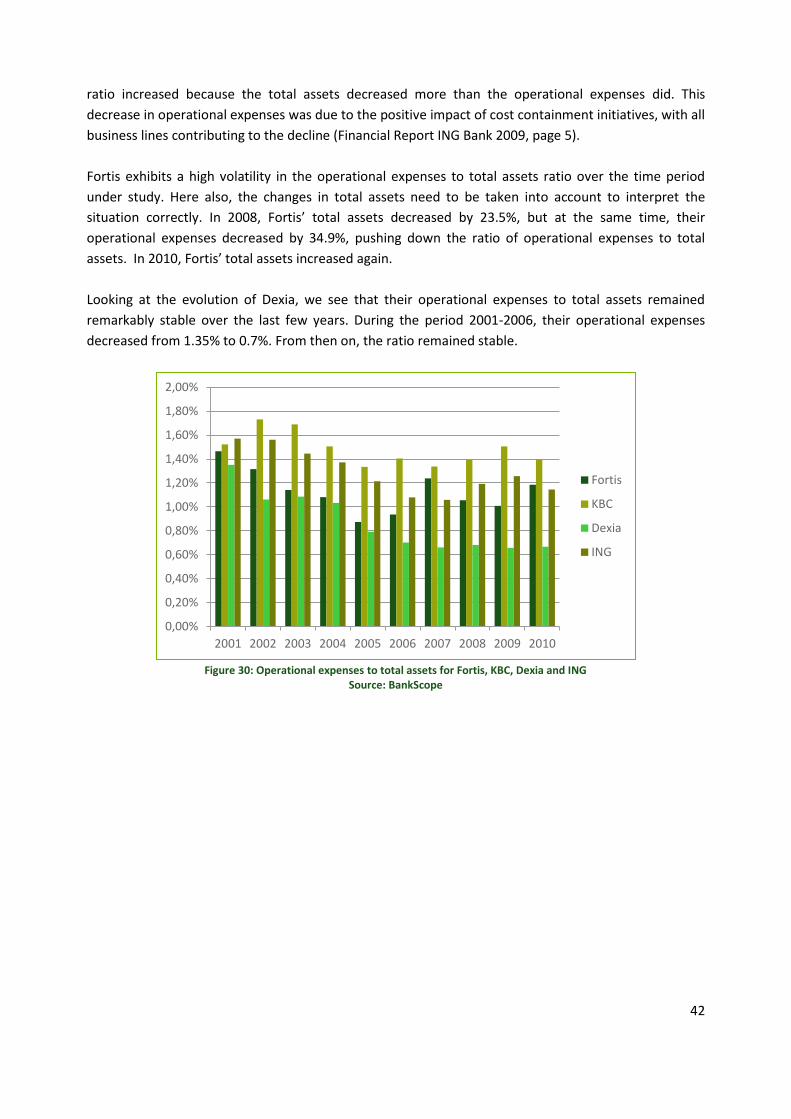
Figure 30 exhibits the high volatility in the operational expenses to total assets ratio for the four big
Belgian banks, except for Dexia, which shows a steady decrease in the ratio from 2001 to 2007, to
stabilise after that. KBC’s operational expenses to total assets ratio increased in both 2008 and 2009.
According to KBC, the increase in 2008 was not only due to the economic conditions but also to one-off
items such as new early retirement provisions and increased pension fund provisions (Annual Report
KBC 2008, page 27). In 2009, the operational expenses for KBC actually shrink but less than the decline
in total assets which was -11.6%; therefore, an increasing trend can be found in the ratio. This decline in
operational expenses is a consequence of the lower number of employees due to the downturn of
investment banking activities (KBC annual report 2009, page 39). ING’s operational expenses to total
assets also increased from 2007 to 2009. ING divides their banking activities into two segments: retail
banking and wholesale banking. They state that the retail part is responsible for substantially higher
investments in marketing and customer services, whereas the wholesale segment needed investments
to strengthen the front office in 2008. (Financial Report 2008 ING bank Belgium, page 6). In 2009, their
operational expenses to total assets increased; however, their operational expenses decreased. The
0,00%
0,50%
1,00%
1,50%
2,00%
2,50%
3,00%
3,50%
4,00%
2001 2002 2003 2004 2005 2006 2007 2008 2009 2010
TA > 100 000
TA > 10 000
TA > 7 000
TA < 7 000
Page 46
42
ratio increased because the total assets decreased more than the operational expenses did. This
decrease in operational expenses was due to the positive impact of cost containment initiatives, with all
business lines contributing to the decline (Financial Report ING Bank 2009, page 5).
Fortis exhibits a high volatility in the operational expenses to total assets ratio over the time period
under study. Here also, the changes in total assets need to be taken into account to interpret the
situation correctly. In 2008, Fortis’ total assets decreased by 23.5%, but at the same time, their
operational expenses decreased by 34.9%, pushing down the ratio of operational expenses to total
assets. In 2010, Fortis’ total assets increased again.
Looking at the evolution of Dexia, we see that their operational expenses to total assets remained
remarkably stable over the last few years. During the period 2001-2006, their operational expenses
decreased from 1.35% to 0.7%. From then on, the ratio remained stable.
Figure 30: Operational expenses to total assets for Fortis, KBC, Dexia and ING
Source: BankScope
0,00%
0,20%
0,40%
0,60%
0,80%
1,00%
1,20%
1,40%
1,60%
1,80%
2,00%
2001 2002 2003 2004 2005 2006 2007 2008 2009 2010
Fortis
KBC
Dexia
ING
Page 47
43
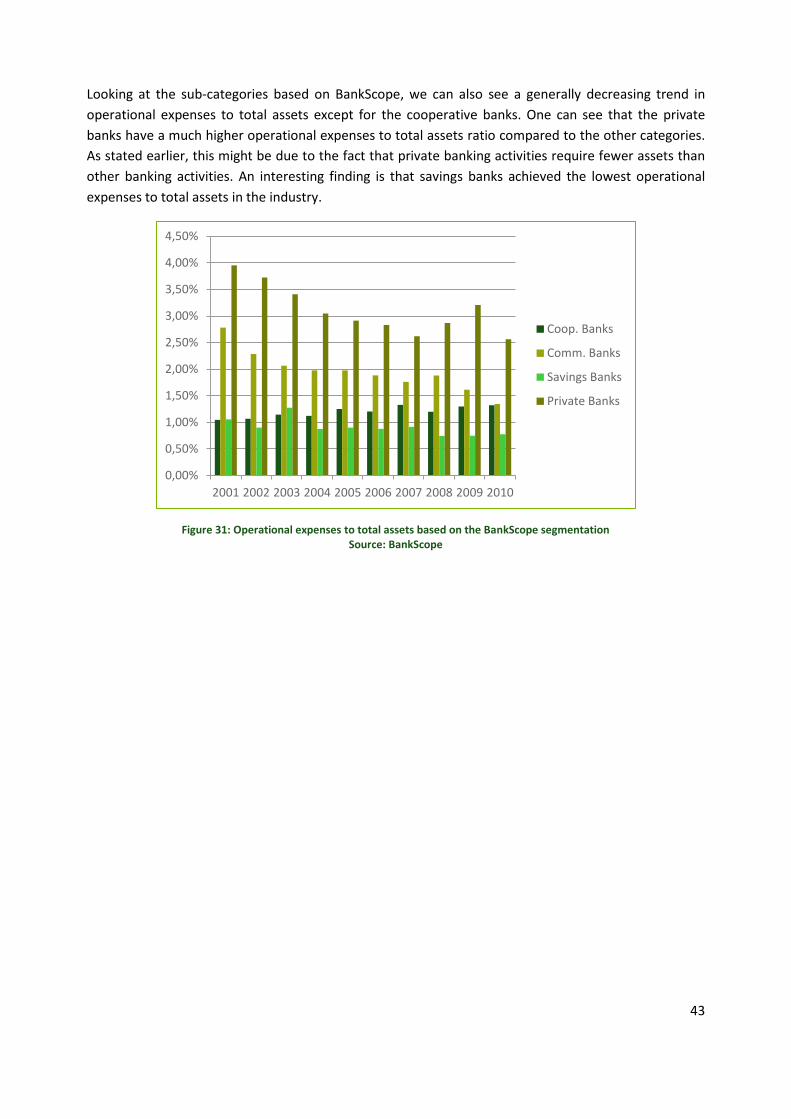
Looking at the sub-categories based on BankScope, we can also see a generally decreasing trend in
operational expenses to total assets except for the cooperative banks. One can see that the private
banks have a much higher operational expenses to total assets ratio compared to the other categories.
As stated earlier, this might be due to the fact that private banking activities require fewer assets than
other banking activities. An interesting finding is that savings banks achieved the lowest operational
expenses to total assets in the industry.
Figure 31: Operational expenses to total assets based on the BankScope segmentation Source: BankScope
0,00%
0,50%
1,00%
1,50%
2,00%
2,50%
3,00%
3,50%
4,00%
4,50%
2001 2002 2003 2004 2005 2006 2007 2008 2009 2010
Coop. Banks
Comm. Banks
Savings Banks
Private Banks
Page 48
44
As the operational expenses to total assets ratio is the focus of many banks, Table 5 shows this ratio
averaged over the period 2008-2010 for all the banks. Santander Benelux outperforms the other banks
by far.
Bank Overhead to total assets
Agricaisse - Caisse Coopérative de Dépôts et de Crédit Agricole 0,41%
Antwerps Beroepskrediet 1,45%
Argenta Spaarbank-ASPA 0,36%
Banca Monte Paschi Belgio SA 1,12%
Bank J. Van Breda en Co NV 1,65%
Banque de la Poste-Bank van de Post 0,80%
Banque Degroof SA-Bank Degroof NV 3,41%
Banque Delen NV 3,07%
BKCP 1,96%
Byblos Bank Europe SA 1,61%
CBC Banque S.A. 1,56%
Centea 0,79%
Citibank Belgium N.V./S.A. 6,43%
Crédit Agricole SA-Landbouwkrediet 1,86%
Delta Lloyd Bank 2,42%
Deutsche Bank SA-Deutsche Bank NV 0,96%
Dexia Bank Belgium-Dexia Bank 0,67%
Ethias Bank 0,77%
Europabank 4,48%
F. van Lanschot Bankiers Belgie 1,31%
Fortis Bank SA/ NV-BNP Paribas Fortis 1,08%
ING Belgium SA/NV-ING 1,20%
KBC Bank NV 1,43%
Keytrade Bank SA/NV 1,26%
Onderling Beroepskrediet-OBK-Bank C.V.B.A. 1,74%
Record Bank SA/NV 0,65%
Santander Benelux SA/NV 0,07%
Société Générale Private Banking N.V. 5,78%
VDK Spaarbank NV 1,11% Table 5: Three-year average of the operational expenses to total assets ratio for the period 2008-2010
Page 49
45
LOAN LOSS PROVISIONS TO TOTAL ASSETS
Another cost which can be categorised is provisions for loan losses. These provisions are used as a
buffer against expected losses in the bank’s loan portfolio.
A lot of research has already been conducted on the evolution of loan loss provisions and the business
cycle. All of the studies (e.g. Laeven and Majnoni, 2003; Bikker and Metzemakers, 2005; Dinamona,
2008) have come to the conclusion that, when cyclical downturns set in, banks tend to delay
provisioning for bad loans, possibly magnifying the impact of the economic cycle on the banks’ income
and capital. This implies that banks fund the losses on loans in periods of economic downturn more
than they do in periods of economic upswing – i.e. loan loss provisions display counter-cyclical
behaviour. This is consistent with the shape of Figure 32: in the period 2001-2003, loan loss provisions
to total assets are much higher than in the period 2004-2007. In 2008, the loan loss provisions are
increasing, and they peak in 2009.
Looking at the universal / investment banks sample, we can see the counter-cyclical trend. As expected
from their business segment, the universal banks have more provisions for loans than investment
banks. In 2009, the investment banks were starting to recover from the financial crisis, while the
universal banks started to be affected by the global economic crisis.
Figure 32: Loan loss provisions to total assets for investment banks and universal banks Source: BankScope
-0,10%
-0,05%
0,00%
0,05%
0,10%
0,15%
0,20%
0,25%
0,30%
0,35%
2001200220032004200520062007200820092010
Investment Banks
Universal Banks
Page 50
46
Figure 33 shows that the loan loss provisions to total assets ratio displays counter-cyclical behaviour in
every category. This counter-cyclical behaviour is more accentuated for both the Big Four and the
smallest banks in our sample.
Figure 33: Loan loss provisions to total assets ratio based on size (million €) Source: BankScope
Our four big banks individually show the same counter-cyclical behaviour to different extents. KBC and,
to a lesser extent, Fortis exhibit this counter-cyclical behaviour. An interesting point is that the LLP to
TA ratio for ING in 2005 is even negative, which means that they are taking back money from their loan
loss provisions. In 2008-2010, the LLP to TA ratio for KBC is the highest of the Big Four. In 2010, the
buffers for expected losses for both Dexia and Fortis were very low. This is somewhat understandable in
the case of Fortis, as in 2009 their provisions were very high. For both Dexia and ING, the pattern of LLP
to TA is more stable than for Fortis and KBC.
Figure 34: Loan loss provisions to total assets ratio for Fortis, KBC, Dexia and ING Source: BankScope
-0,10%
-0,05%
0,00%
0,05%
0,10%
0,15%
0,20%
0,25%
0,30%
0,35%
0,40%
2001 2002 2003 2004 2005 2006 2007 2008 2009 2010
TA > 100 000
TA > 10 000
TA > 7 000
TA < 7 000
-0,10%
0,00%
0,10%
0,20%
0,30%
0,40%
0,50%
0,60%
0,70%
0,80%
2001 2002 2003 2004 2005 2006 2007 2008 2009 2010
Fortis
KBC
Dexia
ING
Page 51
47
The BankScope segmentation (see Figure 35) shows that, in general, commercial banks have a higher
LLP to TA ratio, which makes sense given the nature of their business. Interesting to note: in the period
2003-2006, the LLP to TA ratio for the cooperative banks was negative, which was turned around
substantially in 2009 and 2010. In 2008, the LLP to TA ratio increased for all types of banks, except for
the savings banks. In 2008, the savings banks even decreased their loan loss reserves, with negative LLP.
In 2009, the LLP are increasing further, except for the private banks. In 2010, the LLP to TA ratio
decreases again, except for the private banks, whose ratio is now comparable to commercial banks and
savings banks.
Figure 35: Loan loss provisions to total assets ratio based on the BankScope segmentation Source: BankScope
-0,30%
-0,20%
-0,10%
0,00%
0,10%
0,20%
0,30%
0,40%
2001 2002 2003 2004 2005 2006 2007 2008 2009 2010
Coop. Banks
Comm. Banks
Savings Banks
Private Banks
Page 52
48
CONCLUSION
Studying the value chain of the Belgian banks during the period 2001-2010 in detail yields some
interesting findings. First, on the income side: when comparing investment banks and universal banks –
except for 2001, when investment banks attained a ratio of more than 7.0%, and in 2010 when they
reached only 3.0% – the investment banks are performing twice as well as the universal banks. When
comparing banks based on their size, the smallest banks generate an operating income to total assets
ratio twice the one of the three other categories, except for 2010. When comparing the four largest
banks, KBC stands as the leader except for 2008 and 2009. KBC also shows the largest variation in this
ratio, from just above 0.5% in 2008 to 2.5% in 2010. For the period under study, the private banks
clearly out-perform the other banks with a ratio of about 4.5% for the period under study. The
cooperative banks and the commercial banks stand just above 2%, while the savings banks reach just a
little more than 1.0%.
Breaking down the operating income into its three components – net interest income, net fees plus
commissions and financial transactions – we find that in the case of net interest income reflecting
financial intermediation activities, most of the time the universal banks generate twice as much net
interest income than the investment banks do. When looking at the size of the bank and the capacity
to generate net interest income compare to total assets, it is interesting to notice the negative
correlation between the size in assets and the ratio of net interest income to total assets. This low net
interest margin for the big banks in Belgium is reflected in an average ratio between 1.0% and 1.5 % for
the period under study, with a peak above 1.5% in 2009 and 2010 for KBC and ING. These findings are
fully consistent with the paper by Bos et al (2006) from the Dutch Central Bank. From this financial
intermediation focus, in most of the years, cooperative banks and commercial banks out-performed
savings banks and private banks.
The second value driver on the income side – net fees and commissions – shows the net dominance of
the private banks in the fees and commissions business. The private banks in our sample were able to
generate fees and commissions to total assets between 3.0% and 3.5%, while this figure fluctuates
between about plus 30 basis points to minus 30 basis points for the other banks. In our comparison of
investment banks with universal banks, the dominance of investment banks with a ratio between 3.0%
and 3.5% is very clear, compared to universal banks with a ratio close to 0.0%. When looking at the size
of the banks, only the very big ones and the very small ones generate significant income from fees and
commissions. The banks in between do not make money at all, or they lose a little. However, the net
fees and commissions to total assets ratio of the very small banks is about 3 times that of the big banks.
Among these big banks, we can observe except for 2001 a high volatility in their results, with KBC
clearly leading from 2005 to 2010, followed by Fortis and ING and, far behind by Dexia.
The last value driver on the income side exhibits a very high volatility. Surprisingly enough, the most
volatile banks are the cooperative banks, with two peaks in financial transactions to total assets in 2005
and 2007. However, the results of this category is driven by only 2 players. As expected, positive
results, mainly from the private banks, are followed by negative results in 2009 and 2010 in the
aftermath of the financial crisis. We can observe the same pattern with the investment banks and the
universal banks, with the investment banks’ share of this market being more than 3 times that of the
universal banks. When categorising banks relative to their total assets, we can observe a very high
Page 53
49
volatility in the financial transactions to total assets ratio. This volatility is mainly due to the results of
the very small banks and of the largest banks from 2001 to 2007. The big banks’ large losses in 2008
and 2009 impact significantly the volatility of financial transactions to total assets. For the big banks,
these results were mainly driven by the results of KBC during those years.
Second, on the cost side: we have looked at the evolution of operational expenses and loan loss
provisions compared to total assets. For the operational expenses to total assets ratio, in the case of
the investment banks, we can observe a significant decrease from more than 5.0% in 2001 to less than
2.5% in 2007. After 2007, their ratio fluctuates between 3.0% and 2.0%. For the universal banks, the
ratio decreases steadily from almost 2.0% in 2001 to about 1.0% in 2010. For the period under study,
all the banks have been able to reduce their operational expenses relative to their total assets. The
smallest banks show the biggest improvement, but they are still 50% above the other banks in 2010.
Except for the banks between €10 billion and €100 billion in assets, it seems that, once a bank achieves
a ratio of 1.0%, the cost reduction has reached its floor. However, among the big banks, we can
observe large fluctuations in the ratio of operational expenses to total assets except for Dexia that
stabilises after 2005. The private banks have the highest costs over the whole time period, with a ratio
fluctuating between 4.0% and 2.5% reflecting relatively smaller balance sheets than the other
categories. The commercial banks follow, with a ratio decreasing almost steadily from above 2.5% to
less than 1.5%. For the cooperative banks as well as the savings banks, the ratio is quite stable around
1.0%
Our last value driver, loan loss provisions to total assets shows large fluctuations everywhere. This can
be attributed to the banks’ different provisioning strategies and/or to different exposures.
Page 55
51
CHAPTER 3: THE FINANCIAL PERFORMANCE
In this chapter, we focus on the profitability of the Belgian banking industry during the past decade. We
look at the return on equity ROE), which is the most used benchmark to measure profitability from a
shareholder point of view. Then, in a first level of analysis, we break down the ROE into two
components: namely, the return on assets (ROA) and the leverage (L). In a second level of analysis, we
split the return on assets (ROA) into the asset yield (AY) and the profit margin (PM). This breakdown is
called the Dupont analysis (see Figure 36). Finally, we supplement the profit margin with an efficiency
measure (i.e. cost to income ratio), and we conclude the analysis of the financial performance of the
Belgian banking industry.
Figure 36: The Dupont Analysis
Figure 36 gives us the mathematical relationship between the components of the Dupont system. For
example: multiplying the ROA by the leverage, the asset component disappears, leaving us with the
ROE. While this is interesting from a mathematical point of view, we can derive much more information
by looking at the Dupont system from a managerial point of view.
The first level of analysis tells us that the return to the shareholders is composed of the ROA, which
reflects the profit derived from the bank’s overall operations, times a factor called leverage, which
reflects the structure of the bank’s balance sheet. While the ROA can be defined as the operational
profitability of the bank, the leverage, Asset / Equity, reflects the willingness to take solvency risk.
Thus, a bank can improve the return to its shareholders by leveraging itself, which means taking more
risk.
The second level of analysis links the asset yield (AY) and the profit margin (PM) to the operational
profitability, the ROA. Looking at Figure 36, one can see that multiplying AY by PM cancels out total
revenue to yield the ROA.
Page 56
52
While looking at asset yield (AY), total revenue / total asset, we are measuring the proportion of gross
revenue (as presented in a slightly different way in Chapter 2) to total assets. Notice that, in this
current definition of total revenue, we do not subtract the interest expenses and the fees and
commissions paid. Thus, AY reflects the capacity of the bank to generate income. Among other things,
this capacity to generate income is related to the type of balance sheet and off-balance sheet activities
carried out by the bank, as well as its pricing policy.
The profit margin (PM), net profit / total revenue, relates to the way net profit compares to total
revenue. The difference between these two figures is a series of various costs. Thus, PM may be
associated with the way the bank manages its costs, given a certain level of gross revenue.
Thus, in this chapter, we are addressing the profitability of the Belgian banking industry from an ROE
perspective, which encompasses: operational profitability, ROA, the bank’s willingness to take risk,
leverage (solvency risk), the capacity of the bank to generate income, and the bank’s costs
management.
Page 57
53
RETURN ON EQUITY
Return on equity – measured as net income to equity – gives an indication of how much profit the bank
is able to generate to remunerate its stockholders. In other words, the ROE shows the return for the
shareholders before the decision to give dividends or to retain earnings. The ROE can be seen as one of
the most important indicators of a bank’s profitability and potential growth.
Figure 37 looks at the evolution of the ROE for the investment banks and universal banks categories.
The graph shows the same evolution for the two types of banks; however, the ROE for the investment
banks is remarkably higher than that for the universal banks. This graph shows a higher ROE in good
economic conditions and a lower ROE during economic slowdowns (as shown by the BEL-20 in Figure
17). However, the most surprising results are the ones for the Belgian investment banks during the
financial crisis of 2008 – 2009. While their ROEs declined during these two years, they were still able to
achieve a healthy 15% and 10% in 2008 and 2009, respectively.
Figure 37: Return on equity (ROE) for investment banks and universal banks Source: BankScope
-10,00%
-5,00%
0,00%
5,00%
10,00%
15,00%
20,00%
25,00%
2001200220032004200520062007200820092010
Investment Banks
Universal Banks
Page 58
54
Looking at Figure 38, the four biggest banks are the most profitable under good economic conditions.
However, in both 2008 and 2009, they generated a negative ROE. In 2008, they even show a loss of
38.4% – which implies that, for every €100 of equity, the stockholders lost €38.40.
The ROE of the second category in the sample did not fluctuate very much. In both 2001 and 2002, their
ROE was pretty low, but in the period 2003-2010 their ROE was more or less stable. However, in 2008
their ROE declined due to a decrease in net income, but this decrease was less than that of the other
categories.
The two categories grouping the smallest banks barely reached a 10% ROE under favourable economic
conditions. While the banks with assets between €7 and €10 billion have a quite stable ROE after 2003,
the average ROE for the smallest banks in 2008 has been severely impacted by two important write-off
for Onderling Beroepskrediet-OBK-Bank C.V.B.A. and Ethias Bank.
Figure 38: Return on equity (ROE) based on size (million €) Source: BankScope
-50,00%
-40,00%
-30,00%
-20,00%
-10,00%
0,00%
10,00%
20,00%
30,00%
2001 2002 2003 2004 2005 2006 2007 2008 2009 2010
TA > 100 000
TA > 10 000
TA > 7 000
TA < 7 000
Page 59
55
The profitability of our four big banks taken separately shows some interesting results. In 2001, ING’s
ROE was very high (i.e. their ROE is 2 times higher compared to the others). Also in 2002, their ROE is
the highest among the Big Four. In 2003, Dexia shows the best ROE performance. In 2004, the four
banks achieved more or less the same results in terms of ROE. In 2006, Fortis’ ROE increases
substantially, followed by a remarkable decrease in both 2007 and 2008. In 2008, Fortis’ ROE was more
than 100% negative, which implies a negative equity. In 2008, both KBC and Dexia had negative ROEs,
but not as negative as Fortis’ ROE. In 2009, Fortis’ ROE increased, but the bank was not yet profitable.
Furthermore, KBC was still showing a negative ROE. In 2010, the ROEs for our four banks had more or
less the same value. (The sections that follow will elucidate the main driver – a high leverage or a higher
return to total assets – of the change in profitability.)
Figure 39: Return on equity (ROE) for Fortis, KBC, Dexia and ING Source: BankScope
-160,00%
-140,00%
-120,00%
-100,00%
-80,00%
-60,00%
-40,00%
-20,00%
0,00%
20,00%
40,00%
60,00%
2001 2002 2003 2004 2005 2006 2007 2008 2009 2010 Fortis
KBC
Dexia
ING
Page 60
56
To understand the evolution of the ROE, we will investigate the main drivers for it: i.e. leverage and
return on assets. The next section describes the financial leverage, and the section thereafter details
the evolution of the ROA.
Figure 40 shows that the private banks, on average, generate the highest ROE. Even in times of financial
distress, when the ROE of all the other categories is below zero (i.e. in 2008), the ROE of the private
banks is even above 10%. The ROE of the commercial banks fluctuates the most, which implies that
they are the most risky banks of the sample. However, the ROE of both the cooperative banks and the
savings banks is just about as volatile.
Figure 40: Return on equity (ROE) based on the BankScope segmentation Source: BankScope
-10,00%
-5,00%
0,00%
5,00%
10,00%
15,00%
20,00%
25,00%
2001 2002 2003 2004 2005 2006 2007 2008 2009 2010
Coop. Banks
Comm. Banks
Savings Banks
Private Banks
Page 61
57
LEVERAGE
In this section, we measure leverage as total assets divided by equity. Whenever a bank’s assets exceed
its equity base, that bank is considered to be ‘leveraged’. The more assets a bank finances with debt
with the view to enhancing its returns, the higher is that bank’s leverage. By leveraging, a bank bets
that the interest paid on the borrowed money will be smaller than the return generated, thus
improving the bank’s profitability. If leverage is employed successfully, the positive difference between
the return on the capital employed and the cost of capital will generate an economic profit.
A lot of research has already been conducted on leverage. Academic literature reports that leverage in
the banking sector is pro-cyclical (e.g. Adrian and Shin, 2008). This pro-cyclical nature of leverage (i.e.
harvesting higher returns in good times and causing a collapse of financial institutions’ balance sheets
in bad times) renders the financial system particularly fragile to shocks. Although leverage may boost
ROE in good times, in a recession it can bring the collapse of the bank.
With the onset of the financial crisis, banks were accused of having taken on excessive leverage and are
therefore subject to scrutiny. In response, and as a measure to limit systemic risk, the Basel Committee
of Banking Supervisors, following the G20 request to enhance financial sector resilience, proposed that
banks should be legally obliged to comply with a pre-defined leverage ratio standard.
Figure 41 shows a similar pattern for the leverage of investment banks and universal banks. However,
the leverage for the investment banks is always lower than that for the universal banks. In 2010,
though, while the universal banks were de-leveraging slightly, the investment banks increased
substantially their leverage to its pre-crisis level of 2006.
Figure 41: Leverage for investment banks and universal banks Source: BankScope
0,00
5,00
10,00
15,00
20,00
25,00
30,00
2001 2002 2003 2004 2005 2006 2007 2008 2009 2010
Investment Banks
Universal Banks
Page 62
58
Figure 42 shows that the smallest banks were less leveraged during the entire period. Also, the pro-
cyclical trend is not as obvious in this figure as would be expected from the discussion above. One can
observe that, except for the years 2001 and 2002, the 8 biggest banks present a significantly higher
leverage than the smaller ones. One point to highlight is the very high leverage for the Big Four banks in
2008.
Figure 42: Leverage based on size (million €) Source: BankScope
0,00
5,00
10,00
15,00
20,00
25,00
30,00
35,00
40,00
45,00
2001 2002 2003 2004 2005 2006 2007 2008 2009 2010
TA > 100 000
TA > 10 000
TA > 7 000
TA < 7 000
Page 63
59
Looking at the four big banks separately shows that KBC has maintained a very stable leverage during
the period under study. KBC’s leverage was also the lowest of the big four. It is interesting to note that
ING started to de-leverage in 2006, before the crisis, followed by KBC and Fortis in 2007. However, in
the case of Fortis, leverage was back in play in 2008. Thus, the high leverage of 2008 for the Big Four is
clearly attributable to the leverage of Fortis and Dexia. With an extremely high leverage of 74.91, Dexia
was obliged to restructure the liability side of its balance sheet. Therefore, in 2009 Dexia started to de-
leverage: in that year, Dexia stated that it wanted to reduce the group’s risk profile by reducing the
balance sheet by 35% by 2014. Dexia Bank Belgium’s balance sheet decreased by 3.54% in 2009 and
then decreased another 2.31% in 2010. The reduction in leverage was mainly due to an increase in
equity. The leverage for our four big banks in both 2009 and 2010 declined, reflecting the regulatory
pressures following the financial crisis. In 2010, the de-leveraging in the Belgian banking sector
continued, with total assets falling from some 430% of Belgium’s GDP in mid-2009 to around 360% by
mid-2010 (IMF 2010).
Figure 43: Leverage for Fortis, KBC, Dexia and ING Source: BankScope
0,00
10,00
20,00
30,00
40,00
50,00
60,00
70,00
80,00
2001 2002 2003 2004 2005 2006 2007 2008 2009 2010
Fortis
KBC
Dexia
ING
Page 64
60
Using BankScope’s categorisation, Figure 44 clearly shows that the commercial banks and the savings
banks have a much higher leverage than cooperative banks and private banks. However, the leverage of
the private banks in 2005 and 2006 is higher than that for the cooperative banks. Thus, the commercial
banks and the savings banks will certainly suffer the most from the new regulations to de-leverage the
banking industry.
Figure 44: Leverage based on BankScope segmentation Source: BankScope
0,00
5,00
10,00
15,00
20,00
25,00
30,00
2001 2002 2003 2004 2005 2006 2007 2008 2009 2010
Coop. Banks
Comm. Banks
Savings Banks
Private Banks
Page 65
61
RETURN ON ASSETS
To complete the first level of the analysis of the ROE, we examine the return on assets (ROA). The
return on assets tells an investor how much profit the bank generated for each €1 in assets, or how well
management is using a bank’s assets. Thus, the ROA can be used to assess the operational profitability
of a bank.
Figure 45 shows that the ROAs of the investment banks is much higher than that of the universal banks.
While the universal banks have a higher leverage and take more solvency risk than the investment
banks, the latter have a higher ROA as the main driver to achieving a higher ROE. The large drop in ROA
for the investment banks from 2001 to 2002 is due to Keytrade Bank which, as we will see later, shows
a drop in asset yield and a negative profit margin in 2002. During the crisis, the universal banks were
affected mainly in terms of ROA, i.e. negative value in 2008; the ROA of the investment banks
decreased, but was still twice its level of 2002, its lowest level.
Figure 45: ROA for investment banks and universal banks Source: BankScope
-0,50%
0,00%
0,50%
1,00%
1,50%
2,00%
2001200220032004200520062007200820092010
Investment Banks
Universal Banks
Page 66
62
When comparing ROA on the basis of total assets (Figure 46), we can see that, except for the smallest
banks, the ROA is in line with the scorecard of the DNB (Bos et al., 2006). Most of the time, the smallest
banks have the highest ROA – in combination with the lowest leverage, this makes them less risky.
However, in 2008 they were impacted by the financial crisis, and their ROA turned into a slightly
negative value. The ROA of the four biggest banks together fluctuates around 0.50%; however, due to
the financial crisis, their ROA turned into a significantly negative value in 2008 and remained negative in
2009. In 2010, the ROA for the biggest banks was back at its pre-crisis level. The second category (i.e. TA
between €10 and €100 billion) shows the most stable ROA evolution. While they suffered from the
economic conditions in both 2001 and 2002, they fully recovered in 2003 and generated their highest
ROA. Even in both 2008 and 2009, their ROA remained stable compared to the high fluctuations in the
ROA of the very big or very small banks.
Figure 46: ROA based on size (million €) Source: BankScope
-1,50%
-1,00%
-0,50%
0,00%
0,50%
1,00%
1,50%
2,00%
2001 2002 2003 2004 2005 2006 2007 2008 2009 2010
TA > 100 000
TA > 10 000
TA > 7 000
TA < 7 000
Page 67
63
When we compare the ROA of our four big banks (Figure 47), ING can be considered to be the most
stable bank based on its ROA during the time period under study. In 2009, ING’s ROA is even at its
highest over the period, and in 2008 ING is the only bank in this group to achieve a positive ROA. In
2008, Fortis suffered the largest loss in the Belgian banking sector for the decade under study. In 2009,
impairments at KBC resulted in a substantial loss. While Fortis and KBC recovered in 2010, Dexia’s
performance was about half that of the other three banks.
Figure 47: ROA for Fortis, KBC, Dexia and ING Source: BankScope
-4,00%
-3,50%
-3,00%
-2,50%
-2,00%
-1,50%
-1,00%
-0,50%
0,00%
0,50%
1,00%
1,50%
2001 2002 2003 2004 2005 2006 2007 2008 2009 2010 Fortis
KBC
Dexia
ING
Page 68
64
Obviously, no specific trends can be found in the evolution of the ROA. As one would expect, the ROA
for all types of banks decreased in 2008. For some of them (i.e. the cooperative banks and the savings
banks), the ROA became negative. It is also noteworthy that, most of the time, the private banks
produce the highest and the most consistent ROA. Even in 2008, their ROA was still 1%. In the case of
the cooperative banks in 2005, the small sample size (2 banks) explains the high volatility of their ROA.
In 2005, the ROA of 11.23% was driven by the results of the Antwerps Beroepskrediet. This exceptional
result is related to an accounting procedure that reintroduced a positive reserve of €40 million
(compared to a negative reserve of €6.5 million in 2004) into the income statement. In 2008, the big
negative ROA for the cooperative banks is also due to the Antwerps Beroepskrediet. They took a loss of
more than €33 million on their bond portfolio. Overall, looking at the ROA of the private banks, and
based on the scorecard of the DNB (Bos et al., 2006), we can conclude that these banks are out-
performing the industry.
Figure 48: ROA based on BankScope segmentation Source: BankScope
-2,00%
-1,00%
0,00%
1,00%
2,00%
3,00%
4,00%
5,00%
2001 2002 2003 2004 2005 2006 2007 2008 2009 2010
Coop. Banks
Comm. Banks
Savings Banks
Private Banks
Page 69
65
ASSET YIELD
The second level of analysis of the Dupont system decomposes the return on assets into asset yield and
profit margin.
The asset yield – measured as total revenue to total assets – can be seen as the capacity of a bank to
generate income which can be related to the composition of the balance sheet, to the off-balance sheet
activities and to pricing.
Figure 49 shows that, when looking at the capacity to generate income, investment banks always do
better than universal banks, except in 2010. The big gap between investment and universal banks in
2001 is due to the asset yield of Keytrade bank (i.e. 18.64%). In 2002, their asset yield dropped to
5.88%, which was mainly due to the acquisition of RealBank during 2002.
The years 2001 and 2006 show a higher asset yield for investment banks compared to universal banks.
Looking at Figure 17, these results support the well-accepted assumption that the capacity of
investment banks to generate income is correlated with the performance of the financial markets.
Figure 49: Asset yield for investment banks and universal banks Source: BankScope
0,00%
1,00%
2,00%
3,00%
4,00%
5,00%
6,00%
7,00%
8,00%
9,00%
10,00%
2001200220032004200520062007200820092010
Investment Banks
Universal Banks
Page 70
66
Figure 50 below shows the evolution of the asset yield based on size. Of course, the category that
contains the four biggest banks deviates significantly from the three other categories. In both 2007 and
2008, in the middle of the financial crisis, they were able to achieve record levels for their asset yield.
Interesting enough, the smallest banks were most able to generate income before 2007. The categories
in between the smallest ones and the biggest ones are quite comparable.
Figure 50: Asset yield based on size (million €) Source: BankScope
0,00%
1,00%
2,00%
3,00%
4,00%
5,00%
6,00%
7,00%
8,00%
9,00%
10,00%
2001 2002 2003 2004 2005 2006 2007 2008 2009 2010
TA > 100 000
TA > 10 000
TA > 7 000
TA < 7 000
Page 71
67
The details of the evolution of the four biggest banks individually show that the main driver for the
exceptional performance of the Big Four in 2007 and 2008 was Fortis, which was able to generate
extremely high gross income in both years. ING can also be considered an extreme case, presenting a
very volatile asset yield with peaks in 2005 and in 2010. This volatility is due to the large increases of
the gross interest and dividend income component of their total income in these two years. In the case
of Fortis, the volatility of its asset yield can also be linked to the large volatility of the gross interest and
dividend income. In 2007, there was both an increase in total assets and an increase in gross interest
and dividend income. As gross income increased from €36 million to €98 million, the increase in AY in
2007 is due mainly to this factor. However, in 2008 the increase in AY for Fortis is due mainly to a
decrease in total assets (i.e. a drop of 23% in TA). The decrease in AY in 2009 for Fortis is due to a more
significant decrease in gross income (i.e. almost 50%) than in TA (i.e. 25%). In 2010, there was a drop of
more than 80% in gross income, which yielded a very low AY for Fortis.
Figure 51: Asset yield for Fortis, KBC, Dexia and ING Source: BankScope
0,00%
2,00%
4,00%
6,00%
8,00%
10,00%
12,00%
14,00%
16,00%
18,00%
20,00%
2001 2002 2003 2004 2005 2006 2007 2008 2009 2010
Fortis
KBC
Dexia
ING
Page 72
68
Figure 52 shows that the cooperative banks were able to generate a steady income over time, except
for 2008. This figure also shows the dominance of the private banks in capacity to generate income.
They are closely followed by the commercial banks – at least in 2001, 2007 and 2008.
Figure 52: Asset yield based on BankScope segmentation Source: BankScope
0,00%
1,00%
2,00%
3,00%
4,00%
5,00%
6,00%
7,00%
8,00%
9,00%
2001 2002 2003 2004 2005 2006 2007 2008 2009 2010
Coop. Banks
Comm. Banks
Savings Banks
Private Banks
Page 73
69
PROFIT MARGIN
Based on the Dupont model, the second component of the ROA is the profit margin, which can be
calculated as net income to total revenues. This ratio can be an indicator of a bank's pricing strategies
and how well it controls costs. So the higher the ratio, the better the bank is in managing its costs base.
Figure 53 shows the PM for investment banks and universal banks. Both types of banks have a similar
pattern associated with pro-cyclical behaviour, except for the outstanding results of the investment
banks in 2003. The main driver for this result was Keytrade Bank, which generated a PM of 18.83%. In
2008, the universal banks were much more affected by the financial crisis than the investment banks.
Investment banks show a much higher PM than the universal banks over the entire period, which can
be largely attributed to the capacity of investment banks to generate higher income as shown by their
asset yield in Figure 49.
Figure 53: Profit margin for investment banks and universal banks Source: BankScope
Looking at the PM based on size, we can see that the smallest banks perform better than the largest
ones, which leads us to conclude that the smallest banks are better at cost management. Furthermore,
in 2008 the largest banks experienced a big decrease in their PM: their PM becomes negative in 2008
and stays negative in 2009, which is clearly the result of the financial crisis on the largest banks.
Looking at the banks with TA between €10 and €100 billion, their PM was negative in 2002. This was
due to RecordBank, with a PM of -11%. However, in 2003 their PM went up again, due to the strong
performance of Centea, with a PM of 31%. During the crisis, these banks were not affected very much
in terms of PM. Their PM decreased, but only a little compared to the other categories.
0,00%
5,00%
10,00%
15,00%
20,00%
25,00%
30,00%
2001200220032004200520062007200820092010
Investment Banks
Universal Banks
Page 74
70
Looking at our third category, in 2006 a big increase in PM can be observed, and it even increased
further in 2007. Like the other three categories, the PM went down in 2008 and increased again in both
2009 and 2010.
The smallest banks in the sample also show a pro-cyclical behaviour. In 2006, the PM for both the
smallest and biggest banks was at the same level; however, the smallest banks were better at managing
their costs during the financial crisis.
Figure 54: Profit margin based on size (million €) Source: BankScope
-10,00%
-5,00%
0,00%
5,00%
10,00%
15,00%
20,00%
25,00%
2001 2002 2003 2004 2005 2006 2007 2008 2009 2010
TA > 100 000
TA > 10 000
TA > 7 000
TA < 7 000
Page 75
71
Figure 55 shows the evolution of the profit margin of the four biggest banks. In both 2008 and 2009,
there was a negative profit margin for some of them. Fortis yielded the lowest PM in 2008. In 2009,
they started to recover and, in 2010, they were even generating the highest profit margin. KBC and
Dexia also generated a negative PM in 2008. The negative result of Dexia was of short duration: in 2009,
Dexia joined ING with a positive PM. For KBC on the other hand, 2009 was the worst year, with a
negative PM of almost 23% reflecting the write-offs decided by the bank. In 2010, the impact of the
write-offs was absorbed, and KBC was back with a positive PM. ING is the only bank of the Big Four to
show a positive PM over the whole decade. However, compared to the other banks, ING experienced a
substantial drop in its PM in 2005, but it was able to come back to the level of the three other banks in
2006. During the financial crisis (i.e. 2007-2008), ING’s PM was relatively stable. However, its PM
decreased substantially in 2010, moving in the opposite direction of the three other banks.
Figure 55: Profit margin for Fortis, KBC, Dexia and ING Source: BankScope
-30,00%
-25,00%
-20,00%
-15,00%
-10,00%
-5,00%
0,00%
5,00%
10,00%
15,00%
20,00%
25,00%
2001 2002 2003 2004 2005 2006 2007 2008 2009 2010
Fortis
KBC
Dexia
ING
Page 76
72
As for the asset yield, Figure 56 shows the clear dominance of the private banks – except for 2009 and
2010, which are dominated by the cooperative banks. Here again, the dominance of the cooperative
banks is due to the exceptional result of Antwerps Beroepskrediet. Except for 2009 and 2010, when the
cooperative banks out-perform the industry, the private banks are clearly the best from a profit margin
point of view (particularly in the good years 2003 – 2007).
Figure 56: Profit margin based on BankScope segmentation Source: BankScope
-5,00%
0,00%
5,00%
10,00%
15,00%
20,00%
25,00%
30,00%
2001 2002 2003 2004 2005 2006 2007 2008 2009 2010
Coop. Banks
Comm. Banks
Savings Banks
Private Banks
Page 77
73
COST TO INCOME
As discussed earlier in Chapter 2, the commercial, cooperative and savings banks generate most of their
income through financial intermediation. On the other hand, the private banks’ income is mainly
derived from the services they provide. The analysis of the cost to income ratio looks at how efficient
the banks were in generating their revenues. This cost to income ratio – the operational costs divided
by the operational income – gives a clear view of how efficient the bank is in its operations. The lower
the ratio, the more profitable the bank is. Changes in the ratio can also highlight potential problems: if
the ratio rises from one period to the next, costs are rising at a higher rate than income, which could
suggest that the bank lost track of the evolution of its costs perhaps in a drive to attract more business.
Figure 57 shows that, for investment banks, the operational costs to operational income was highest in
2002; whereas, for universal banks, the ratio was highest in 2008. For universal banks, the ratio was
still increasing in 2003, as the efficiency measure for investment banks was starting to come down,
bringing both types of banks very close to each other in term of efficiency. From 2005 to 2008, the
universal banks show more costs relative to their operational income compared to the investment
banks. In 2010, both types of banks ended with a cost to income ratio that was more or less the same.
Figure 57: Cost to income ratio for investment banks and universal banks
Source: BankScope
0,00%
10,00%
20,00%
30,00%
40,00%
50,00%
60,00%
70,00%
80,00%
90,00%
2001200220032004200520062007200820092010
Investment Banks
Universal Banks
Page 78
74
With regard to the efficiency of the banks based on their size, we clearly see a peak in 2008 and 2009
with the four biggest banks in the sample. The reduction in income is the reason for this increase.
Figure 58: Cost to income ratio based on size (million €) Source: BankScope
0,00%
10,00%
20,00%
30,00%
40,00%
50,00%
60,00%
70,00%
80,00%
90,00%
100,00%
2001 2002 2003 2004 2005 2006 2007 2008 2009 2010
TA > 100 000
TA > 10 000
TA > 7 000
TA < 7 000
Page 79
75
Figure 59 shows a very stable and comparable ratio for the period 2001-2006. So, from an efficiency
point of view, the four big banks were quite similar in this period.
With the crisis occurring in 2007, we start to see significant differences among the Big Four. Fortis was
most noticeable in terms of the cost to income ratio. In 2007, its cost to income ratio increased due to a
big increase in operational expenses. This trend continued for Fortis in 2008; however, as their
operational expenses increased, their operational income decreased even further. In 2008, the cost to
income ratio was above 100%, which implies that the costs were higher than their income, yielding a
loss that year. KBC was in the same situation that year. In 2009, both KBC and Fortis performed better,
but now it was Dexia’s turn to exceed the 100% mark. In 2010, income increased again, and so the cost
to income ratio decreased. For some banks, the ratio was even lower than before the financial crisis.
It is noteworthy that the cost to income ratio for ING was steadily low and stable during this period.
Figure 59: Cost to income ratio for Fortis, KBC, Dexia and ING
Source: BankScope
0,00%
20,00%
40,00%
60,00%
80,00%
100,00%
120,00%
140,00%
2001 2002 2003 2004 2005 2006 2007 2008 2009 2010
Fortis
KBC
Dexia
ING
Page 80
76
Looking at the BankScope segmentation in Figure 60, we find that the commercial banks and the private
banks achieved the highest ratios in 2001 and 2002. In the following years, savings banks and
commercial banks show a very high ratio most of the time, with the savings banks approaching 90% in
2006.
Figure 60: Cost to income based on BankScope segmentation
Source: BankScope
0,00%
10,00%
20,00%
30,00%
40,00%
50,00%
60,00%
70,00%
80,00%
90,00%
100,00%
2001 2002 2003 2004 2005 2006 2007 2008 2009 2010
Coop. Banks
Comm. Banks
Savings Banks
Private Banks
Page 81
77
Given the banks’ focus on this ratio, Table 6 shows each bank’s average cost to income ratio for the last
three years (2008, 2009 and 2010). Santander Benelux out-performs the other banks by far.
Bank Cost to income
ratio
Agricaisse - Caisse Coopérative de Dépôts et de Crédit Agricole 38,59%
Antwerps Beroepskrediet 38,15%
Argenta Spaarbank-ASPA 50,93%
Banca Monte Paschi Belgio SA 67,80%
Bank J. Van Breda en Co NV 58,72%
Banque de la Poste-Bank van de Post 78,55%
Banque Degroof SA-Bank Degroof NV 62,62%
Banque Delen NV 46,26%
BKCP 113,02%
Byblos Bank Europe SA 60,71%
CBC Banque S.A. 60,47%
Centea 47,48%
Citibank Belgium N.V./S.A. 71,47%
Crédit Agricole SA-Landbouwkrediet 76,18%
Delta Lloyd Bank 96,00%
Deutsche Bank SA-Deutsche Bank NV 85,58%
Dexia Bank Belgium-Dexia Bank 79,03%
Ethias Bank 100,60%
Europabank 64,16%
F. van Lanschot Bankiers Belgie 90,23%
Fortis Bank SA/ NV-BNP Paribas Fortis 93,54%
ING Belgium SA/NV-ING 57,69%
KBC Bank NV 84,97%
Keytrade Bank SA/NV 46,47%
Onderling Beroepskrediet-OBK-Bank C.V.B.A. 120,41%
Record Bank SA/NV 60,64%
Santander Benelux SA/NV 7,62%
Société Générale Private Banking N.V. 87,95%
VDK Spaarbank NV 65,23%
Table 6: Three-year average of the cost to income ratio for the period 2008-2010
Page 82
78
CONCLUSION
We have used the Dupont Framework to analyse the financial performance of the Belgian banking
industry. When using the categories proposed by the European Central Bank – the Investment banks
and the Universal banks – the Investment banks clearly out-perform the Universal banks in terms of
ROE, except in 2002. Even more interesting, in the crucial year 2008, the Investment banks were able to
achieve an average ROE of about 15%. Since the Universal banks dominate the Investment banks in
terms of Leverage, it is the Investment banks’ ROA that gives them their leading position in ROE. The
dominance of the Investment banks in terms of ROA is due to their dominance in terms of profit margin
as well as asset yield, except for the asset yield of 2010.
When we look at the 4 categories of banks based on their total assets, we find that, most of the time,
the Big Four achieved a better ROE than the other categories, except for catastrophic results in 2008
and a slightly negative ROE in 2009. Although the four big banks are characterised by a high leverage
which is close to that of the next category (banks with assets between €10 and €100 billion), their ROA
is never in first place. Thus, they were able to achieve the best ROEs in some years by taking more risks
in terms of solvency. Looking at the capacity to generate income (AY), one can see that the smallest
banks clearly dominate in the period 2001 to 2006, while the four big banks lead the industry in the
following years. There is no consistent leadership in terms of profit margin. An interesting conclusion
for this grouping of banks is that the Big Four’s leadership in terms of ROE is mainly due to their larger
risk appetite.
When looking at the Big Four separately, we cannot select a leading bank: first place changes constantly
from one player to another. However, ING had the highest leverage in the first year of the study,
followed closely by Dexia and Fortis, and Fortis dominated the period from 2002 to 2006. After 2006,
Dexia was by far the most leveraged bank. A ranking based on ROE is very volatile. Such a result can be
explained by the high volatility of both asset yield and profit margin.
When using the categories defined by BankScope, we found that Private banks clearly out-performed
the other categories, followed by Commercial banks and Savings banks, with Cooperative banks far
behind. In terms of ROE, the leading position of the Private banks is not related to a high Leverage – like
the Cooperative banks, they have a leverage of about half of that of the Commercial banks and the
Savings banks – but rather to an almost consistent and steady ROA. This is due to the combination of
their capacity to generate income (AY) and to a low costs structure (PM). Concerning the AY, they out-
perform the Commercial banks slightly and leave Savings banks and Cooperative banks far behind most
of the time. Their leading position in term of ROE is clearly derived from their PM, except for 2009 and
2010.
Page 83
79
CHAPTER 4: THE RISK-RETURN TRADE-OFF
In this chapter, we discuss the risk-return trade-off of our 29 banks over the period under study. As it
is impossible to obtain the stock market returns for all of the banks, we use the ROE as a measure of
return. In Figure 61 and 62, the average annual risk (i.e. the standard deviation of the ROE for the
period under study)11 is plotted along the x-axis, and the average annual ROE is on the y-axis.
Looking at Figure 61, we see that the banks are clustered in an area of low volatility with positive
returns. While the normal relationship expected in finance is ‘the higher the expected risk, the
higher the expected return’, the Big Four players on the Belgian market exhibit an inverse
relationship. Fortis yields the lowest ROE, averaged on a yearly basis over the 10 years, and this is in
combination with the highest risk. Of our four big banks, ING performs the best. ING has a higher
ROE in comparison to both Dexia and KBC and has the lowest risk. The bank that has the highest
average annual ROE over the 10-year study is Keytrade Bank; however, this high ROE is associated
with a high risk. On the other hand, the bank with the lowest risk is Agricaisse, which also had an
average annual ROE of 5%. Europabank and Banque Delen perform best in terms of their risk-return
trade-off.
It is interesting to note that, over this 10-year period, Dexia outperformed KBC in terms of its risk-
return trade-off.
To obtain a better view on the evolution of the risk-return trade-off for the Big Four players, we
examine the evolution of the risk-return trade-off over a rolling window of 5 years. Figure 62
presents a rolling window estimation for the risk-return trade-off of Dexia, Fortis, ING and KBC,
starting with the period 2002 – 2006 (labelled as 2006) until the period 2006 – 2010 (labelled as
2010). The impact of the financial crisis is clearly evident in a decreasing risk-return trade-off,
primarily for Fortis. However, the five points for ING are all located in the same area, which implies a
stable risk-return trade-off even during the financial crisis. Looking at the other three banks, we
clearly see that, for the periods 2002-2006 and 2003-2007, they were comparable to ING. However,
due to a poorer performance in 2008, their average risk-return trade-off for 2004-2008 deteriorated
substantially. For KBC, the decline was small for that period, but in both 2009 and 2010 the decline
became more significant. For Dexia, the risk-return trade-offs of 2008, 2009 and 2010 cluster
together at a better level than those for KBC for 2009 and 2010. Fortis is the big loser of this
comparison, with negative returns in 2008, 2009 and 2010.
11 In finance and in risk management, risk is associated with the volatility of results. Assuming a normal
distribution of these results, standard deviation is the method for measuring this volatility.
Page 84
80
Figure 61: Risk-return trade-off for the 29 banks over a 10-year period
Page 85
81
Figure 62: 5 year rolling window risk-return trade-off for Dexia, Fortis, ING and KBC
Page 87
83
CHAPTER 5: WHAT DID WE LEARN IN THIS STUDY?
The first point of interest in this study is the relative importance of the financial sector in Belgium’s
economy. Its importance is substantial: more than 6% of the Gross Value Added to the Belgian
economy in 2000 as well as in 2010. As one would expect, the year 2008 shows a substantial
decrease to about 5%. The financial sector’s contribution in Belgian employees’ employment
compensation went from more than 6% in 2000 to 5% in 2010. The same trend is observable in the
number of people employed in the financial sector: from 148,000 in 2001 to about 137,500 in 2010.
However, while the number of people employed decreased during this period, the average salary
steadily increased from €58,000 in 2001 to €70,000 in 2008. After 2008, the impact of the financial
crisis freezes wages at about €70,000. Another striking feature of the Belgian economy is the savings
rate: one of the highest in the world, it fluctuated between 15% and 20% between 2001 and 2010.
When looking more specifically to the Belgian banking sector, one clearly notices its international
standing. In Belgium, almost half of the total assets held by Belgian financial institutions are in the
hands of foreign-controlled credit institutions.
To study the value chain of the Belgian banking sector, and to break down its profitability, we
segmented the banking industry in several different ways. First, by dividing the banks into
Investment banks and Universal banks; second, by segmenting the banks according to their size; and
finally, by using the “BankScope” segmentation. One main conclusion of the study is that the
banking sector in Belgium is highly concentrated with regard to total assets: in 2009, the four big
banks accounted for almost 90% of the total assets of the Belgian banking sector.
When breaking down the value chain, it is interesting to note that private banks consistently exhibit
the highest operating income to total assets ratio – which makes sense, as their business model
relies on off-balance sheet activities like assets under management. In the investment / universal
banks segment, the investment banks have a better ratio than the universal banks. However, the
pool of investment banks is very small compared to that of universal banks, which includes the Big
Four banks. When examining bank size, the smallest banks perform best – but by virtue of the
selected sample, they represent a very small portion of the banking sector.
When we broke the total operating income into its components, we found that net interest income
was negatively correlated to the size of the bank as measured by total assets. As expected, the
private banks dominate the other banks when net fees and commissions are used as the benchmark;
but no conclusion can be drawn when using financial transactions as the benchmark, given the high
volatility of this value driver. On the costs side of the value chain, all of the banks were able to
reduce their operating expenses during the period under study. Private banks experienced the
highest level of operating expenses to total assets (4%), while universal banks were able to bring this
figure to a low of 1%.
Page 88
84
Looking at the performance of the banking industry based on the breakdown of the ROE, the four
big banks dominate the market, not because of their good operational profitability (ROA), but
because of a bigger risk appetite, which is reflected in a higher leverage compared to the other
banks. The comparison of investment banks and universal banks shows that the investment banks
performed better in terms of ROE. However, based on their total assets for the period under study,
the investment banks account for not even 1% of the sample, while the universal banks account for
the rest. In the “BankScope” segmentation, the Private banks have the best ROE, due to their better
performance in operational profitability (ROA). While the asset yield is dominated by the Big Four
after 2007, the investment banks achieved better profit margins over the period under study (but
again, their representation in the overall sample is very small). The cost to income ratio of the Big
Four shows a clear deterioration in 2007, 2008 and 2009.
The analysis of the risk-return trade-off shows a cluster of the banks in an area from low to medium
risk and from a low to a high ROE. The banks presenting the best risk-return trade-off over the
period under study are Banque Delen and Europabank. An interesting point of this risk-return
analysis is the inverse relationship for the Big Four banks. ING shows a good risk-return profile,
followed by Dexia and KBC with a higher risk and a lower return, and finally by Fortis Bank (BNP
Paribas Fortis) with the worst risk-return profile for the period under study.
Page 89
85
REFERENCES
Albertazzi U. and L. Gambacorta (2009), “ Bank profitability and the business cycle”, Journal of
Financial Stability Vol. 5 pages 393-409.
Allen N., N. Berger and J. Wilson (2009), “The Oxford Handbook of Banking”, Oxford University Press.
Altunbas Y., S. Carbo and E.PM. Gardener (2007), “Examining the Relationship between Capital, Risk
and Efficiency in European Banking”, European Financial Management, 13, 1, pages 49-70.
Altunbas Y., E.P.M. Gardener and B. Moore (2001), “Efficiency in European Banking”, European
Economic Review, 45, pages 1931-1955.
Balla E. and A. McKenna (2009), “Dynamic provisioning: a countercyclical tool for loan loss reserves.”
Economic Quarterly, Federal Reserve Bank of Richmond, issue fall, pages 383-418.
Bikker J.A. and P. Metzemakers (2005), “Bank provisioning behavior and procyclicality”, Journal of
International Financial Markets, Institutions and Money 15, 141–157.
Bolt W., L. de Haan, M. Hoeberichts, M. van Oord and J. Swank (2010), “Bank profitability during
recessions”, DNB Working Paper, No. 251.
Bos J.W.B., J.A.J. Draulans, D. van den Kommer and B.A. Verhoef (2006), “An international scorecard
for measuring bank performance: The case of Dutch banks”, DNB Occasional studies, Vol. 4 / Nr. 2.
Bouvatier V., and L. Lepetit (2007), “Banks’ procyclical behavior: Does provisioning matter?”, Journal
of International Financial Markets, Institutions and Money.
Casu B. (2003), “A comparative Study of Efficiency in European Banking”, Applied Economics, 35(17),
pages 1865-1876.
Casu B. and C. Girardone (2004), “Productivity in European Banking – A Comparison of Parametric
and Non-Parametric Approaches”, Journal of banking and Finance, Volume 28, Issue 10, pages 2521-
2540.
Dermine J. (2009), “Bank valuation & value-based management”, McGraw-Hill, 442 p.
Dexia (2002), “Dexia Annual Report”.
Dexia (2008), “Dexia Bank Belgium Annual Report”.
Dexia (2009), “Dexia Bank Belgium Annual Report”.
Dinamona D.D. (2008), “Bank risks, provisioning and the business cycle: a panel analysis on European
intermediaries”, Banks and Bank Systems, Volume 3, Issue 2, 2008.
English W.B. (2002), “Interest rate risk and bank net interest margins”, BIS Quarterly Review,
December 2002.
Page 90
86
European Central Bank (2010). “‘Beyond ROE- how to measure bank performance?; Appendix to the
report on EU banking structures”, September 2010
European Central Bank (1996). “Foreword ESA 95”, Retrieved June 17, 2011, from Europa.eu:
http://circa.europa.eu/irc/dsis/nfaccount/info/data/esa95/en/een00000.htm
European Central Bank (2011). “Map of euro area 1999 – 2011”, Retrieved June 4, 2011, from
European Central Bank: the Euro: http://www.ecb.int/euro/intro/html/map.en.html
European Central Bank (n.d.). “MFIs and Assets”, Retrieved June 9, 2011, from European Central
Bank: https://mfi-assets.ecb.int/user_manual.htm
European Central Bank (n.d.). “Statistics glossary”, Retrieved June 17, 2011, from European Central
Bank: http://www.ecb.int/home/glossary/html/act2v.en.html
Eurostat. (2011). “Introduction”, Retrieved June 5, 2011, from Eurostat > European Sector Accounts:
http://ec.europa.eu/eurostat/sectoraccounts
Febelfin. (2009). “Statistisch vademecum van de banksector”, Brussels: Febelfin.
Febelfin. (2010). “Banking and Finance in Belgium: facts & figures 2009-2010”, Brussels: Febelfin.
Girardone C. and E.P.M. Gardener (2004), “Analysing the Determinants of Bank Efficiency – The Case
of Italian banks”, Applied economics, 36, pages 215-227.
Goddard J. and M. Tavakoli (2007), “European Banking: An Overview”, Journal of Banking and
Finance, Volume 31, pages 1911-1935.
ING (2008), “Annual Report ING Bank”.
ING (2008), “Press Release ING Belgium”.
ING (2008), “Financial Report ING Bank Belgium”.
ING (2009), “Annual Report ING Bank”.
ING (2009), “Financial Report ING Bank”.
KBC (2008), “KBC Annual Report”.
KBC (2009), “KBC Annual Report”.
Laeven L. and G. Majnoni (2003), “Loan loss provisioning and economic slowdowns: too much, too
late?”, Journal of Financial Intermediation 12, 178–197.
National Bank of Belgium. (2011). Statistics. Retrieved 06 08, 2011, from Home > Statistics >
Macroeconomic statistics: http://www.nbb.be/pub/stats/stats.htm?l=en&tab=Figures
Saunders A. and M. M. Cornett (2006), “Financial Institutions Management, a risk management
approach”, fith edition, Mc Graw-Hill, 856 p.
Page 91
87
Préfontaine J. and A. Thibeault (1993), “Introduction to bank financial management”, financial
services studies program. The Institute of Canadian Bankers, September 1993, p. 127
Verweire K., P. Roelandt, J. De Grande and L. Van den Berghe (2006), “What drives performance in
the Belgian insurance industry?”, Vlerick Leuven, Gent Management School, 124 p.
Wilson J. (2007), “Developments in European Banking”, Journal of Banking and Finance, Volume 31,
pages 1907-1910.
Wilson J. and J. Goddard (2001), “European Banking: Efficiency, Technology and Growth”, John
Wiley.
Wilson J. and J. Goddard (2004), “The profitability of European Banks – A Cross-sectional and
Dynamic Panel Analysis”, The Manchester School, Vol 72, No. 3, pages 363-381.
Zouaoui M., G. Nouyrigat and F. Beer (2011), “How does investor sentiment affect stock market
crises? Evidence from panel data”, FARGO – Centre de recherché en Finance, Architecture et
Gouvernance des Organisations.
Page 92
88
APPENDICES
APPENDIX 1: THE RATIOS
1. Chapter 2: The value chain
a. Operational income to total assets
b. Net interest income to total assets
c. Net commissions and fees to total assets
d. Financial transactions to total assets
e. Operational expenses (Overheads) to total assets
f. Loan loss provisions to total assets
2. Chapter 3: The financial performance
a. Return on equity
b. Leverage
c. Return on assets
d. Asset yield
e. Profit margin
f. Cost to income
3. Chapter 4: The risk return trade-off
APPENDIX 2: THE VARIABLES
1. Total assets
2. Equity
3. Operational income as net interest income plus net commissions and fees plus financial
transactions
4. Net interest income
5. Net commissions and fees
6. Financial transactions
7. Operational expenses (overheads)
8. Loan loss provisions
9. Net income
10. Gross income as gross interest and dividend income plus total non-interest operating
income
Page 93
89
APPENDIX 3: A38 CODE
Code
Description
AA Agriculture, forestry and fishing
BB Mining and quarrying
CA Manufacture of food products, beverages and tobacco products
CB
CC
Manufacture of textiles, wearing apparel and leather products
Manufacture of wood and paper products, and printing
CD Manufacture of coke and refined petroleum products
CE Manufacture of chemicals and chemical products
CF Manufacture of basic pharmaceutical products and pharmaceutical preparations
CG Manufacture of rubber and plastics products, and other non-metallic mineral
products
CH Manufacture of basic metals and fabricated metal products, except machinery
and equipment
CI Manufacture of computer, electronic and optical products
CJ Manufacture of electrical equipment
CK Manufacture of machinery and equipment n.e.c.
CL Manufacture of transport equipment
CM Manufacture of furniture; other manufacturing; repair and installation of
machinery and equipment
DD Elektricity, gas, steam and air-conditioning supply
EE Water supply: sewerage, waste management and remediation activities
FF Construction
GG Wholesale and retail trade, repair of motor vehicles and motorcycles
HH Transportation and storage
II Accommodation and food service activities
JA Publishing, audiovisual and broadcasting activities
JB Telecommunications
Page 94
90
JC Computer programming, consultancy and related activities; information service
activities
KK Financial and insurance activities
LL Real estate activities
MA
Legal and accounting activities; activities of head offices; management
consultancy activities; architecture and engineering activities; technical testing
and analysis
MB Scientific research and development
MC Advertising and market research; other professional, scientific and technical
activities; veterinary activities
NN Administrative and support service activities
OO Public administration and defence; compulsory social security
PP Education
QA Human health activities
QB Social work activities
RR Arts, entertainment and recreation
SS Other service activities
TT Activities of households as employers of domestic personnel and undifferentiated
goods and services production of households for own use
Page 95
91
APPENDIX 4: NACE BEL CODE
NACE Bel Code 2008 Description
0 Agricultural, commodities production
1 Food production
2 Chemicals, steel, electronics production
3 Transport, small equipment, electricity production
4 Construction, wholesale, retail
5 Transport, catering industry, publishing
6 Communication, consulting, financial services, real estate
7 Holding, leasing, research, advertising
8 Security, cleaning, environment, government, medical
9 Entertainment, art, profession association
Page 96
92
APPENDIX 5: LIST OF ABBREVIATIONS
CIS Credit Institutions
EEA European Economic Area: an agreement establishing a zone of 4 freedoms: free
movement of (1) goods, (2) capital, (3) services and (4) persons. The agreement
establishes a system ensuring equal conditions of competition.
EMU Economic and Monetary Union (European Central Bank, 2011):
- EMU-11: Austria, Belgium, Finland, France, Germany, Ireland, Italy,
Luxembourg, the Netherlands, Portugal, and Spain
- EMU-12: Greece joins (1 January 2001)
- EMU-13: Slovenia joins (1 January 2007)
- EMU-15: Cyprus and Malta join (1 January 2008)
- EMU-16: Slovakia Joins (1 January 2009)
- EMU-17: Estonia Joins (1 January 2011)
ESA 95 The new European System of National and Regional Accounts (ESA 95) is a high-
quality statistical instrument which provides the European Community
institutions, governments and economic and social operators with a set of
harmonised and reliable statistics on which to base their decisions.
ESA95 is a major improvement on the previous version, which dates from 1979.
Progress has been achieved in the harmonisation of methodology and in the
precision and accuracy of the concepts, definitions, classifications and accounting
rules which have to be applied in order to arrive at a consistent, reliable and
comparable quantitative description of the economies of the Member States
(European Central Bank, 1996).
GVA Gross Value Added (GVA) measures the contribution to the economy of each
individual producer, industry or sector.
The gross value added at basic prices is defined in the ESA 95 as the output valued
at basic prices less intermediate consumption valued at purchaser prices, before
deduction of consumption of fixed capital (European Central Bank).
MFI Monetary Financial Institutions (MFIs) comprise resident Credit Institutions as
defined in Community Law, and other resident Financial Institutions whose
business is to receive deposits and/or close substitutes for deposits from entities
other than MFIs, and, for their own account (at least in economic terms), to grant
credits and/or make investments in securities (European Central Bank).
Page 97
93
APPENDIX 6: CONTRIBUTION IN TERMS OF PERCENTAGE OF BOTH THE BANKS
INDIVIDUALLY AND PER SECTOR.
Figure 63: The contribution of the banks (based on TA 2009) to the sample source: BankScope
0,14%
0,04%
2,49%
0,10%
0,24%
0,58%
0,37%
0,10%
0,28%
0,05%
0,76%
0,82%
0,26%
0,78%
0,43%
0,89%
20,09%
0,13%
0,07%
0,14%
34,44%
12,16%
22,29%
0,13%
0,08%
1,13%
0,72%
0,05%
0,23%
Agricaisse - Caisse Coopérative de Dépôts et de…
Antwerps Beroepskrediet
Argenta Spaarbank-ASPA
Banca Monte Paschi Belgio SA
Bank J. Van Breda en Co NV
Banque de la Poste-Bank van de Post
Banque Degroof SA-Bank Degroof NV
Banque Delen NV
BKCP
Byblos Bank Europe SA
CBC Banque S.A.
Centea
Citibank Belgium N.V./S.A.
Crédit Agricole SA-Landbouwkrediet
Delta Lloyd Bank
Deutsche Bank SA-Deutsche Bank NV
Dexia Bank Belgium-Dexia Bank
Ethias Bank
Europabank
F. van Lanschot Bankiers Belgie
Fortis Bank SA/ NV-BNP Paribas Fortis
ING Belgium SA/NV-ING
KBC Bank NV
Keytrade Bank SA/NV
Onderling Beroepskrediet-OBK-Bank C.V.B.A.
Record Bank SA/NV
Santander Benelux SA/NV
Société Générale Private Banking N.V.
VDK Spaarbank NV
Page 98
94
Figure 64: BankScope segmentation Source: BankScope
Figure 65: ECB segmentation Source: BankScope
94,96%
3,68% 0,90% 0,47%
Commercial Banks
Savings Banks
Private Banks
Cooperative Banks
0,84%
99,16%
Investment Bank
Universal Bank
Page 99
95
APPENDIX 7: THE SEGMENTATION BETWEEN UNIVERSAL AND INVESTMENT
BANKS
Figure 66: Segmentation between Universal banks and Investment banks Source: BankScope
In this table, UB stands for Universal bank (if the main income comes from net interest income), and
InvB stands for Investment bank. When a bank is categorised more often as an investment bank than
as a universal bank during the entire period, then this bank is designated as an investment bank in
our sample. The 6 banks that are categorised as investment banks are: Bank Degroof, Banque Delen,
Byblos Bank, F. Van Lanschot Bankiers, Keytrade Bank and Société Générale.
Bank Name 2001 2002 2003 2004 2005 2006 2007 2008 2009 2010
Agricaisse - Caisse Coopérative de Dépôts et de Crédit Agricole UB UB UB UB UB UB UB UB UB UB
Antwerps Beroepskrediet UB UB UB UB UB UB UB UB UB UB
Argenta Spaarbank-ASPA UB UB UB UB UB UB UB UB UB UB
Banca Monte Paschi Belgio SA UB UB UB UB UB UB UB UB UB UB
Bank J. Van Breda en Co NV UB UB UB UB UB UB UB UB UB UB
Banque de la Poste-Bank van de Post UB UB UB UB UB UB UB UB UB UB
Banque Degroof SA-Bank Degroof NV InvB InvB InvB InvB InvB InvB InvB InvB InvB InvB
Banque Delen NV InvB InvB InvB InvB InvB InvB InvB InvB InvB
BKCP UB UB UB UB UB UB UB UB UB UB
Byblos Bank Europe SA InvB InvB UB UB UB InvB InvB InvB InvB UB
CBC Banque S.A. UB UB UB UB UB UB UB UB UB UB
Centea UB UB UB UB UB UB UB UB UB UB
Citibank Belgium N.V./S.A. UB UB UB UB UB UB UB UB UB
Crédit Agricole SA-Landbouwkrediet UB UB UB UB UB UB UB UB UB UB
Delta Lloyd Bank UB UB UB UB UB UB UB UB UB
Deutsche Bank SA-Deutsche Bank NV UB UB UB UB UB UB UB UB UB
Dexia Bank Belgium-Dexia Bank UB UB UB UB UB UB UB UB UB UB
Ethias Bank UB UB UB UB UB UB UB UB UB UB
Europabank UB UB UB UB UB UB UB UB UB UB
F. van Lanschot Bankiers Belgie InvB InvB InvB InvB InvB UB InvB UB UB
Fortis Bank SA/ NV-BNP Paribas Fortis UB UB UB UB UB UB UB UB UB UB
ING Belgium SA/NV-ING UB UB UB UB UB UB UB UB UB UB
KBC Bank NV UB UB UB UB UB UB UB UB UB UB
Keytrade Bank SA/NV InvB InvB InvB InvB InvB InvB InvB UB InvB UB
Onderling Beroepskrediet-OBK-Bank C.V.B.A. UB UB UB UB UB UB UB UB UB UB
Record Bank SA/NV UB UB UB UB UB UB UB UB UB UB
Santander Benelux SA/NV UB UB UB UB InvB UB UB UB UB UB
Société Générale Private Banking N.V. InvB InvB InvB InvB InvB InvB InvB InvB InvB
VDK Spaarbank NV UB UB UB UB UB UB UB UB UB UB
Page 100
96
APPENDIX 8: THE EVOLUTION OF THE NATURAL LOGARITHM OF THE TOTAL
ASSETS
Figure 67: Size based on the BankScope segmentation Source: BankScope
Figure 68: Size for investment banks and universal banks Source: BankScope
0,00
2,00
4,00
6,00
8,00
10,00
12,00
14,00
16,00
18,00
2001 2002 2003 2004 2005 2006 2007 2008 2009 2010
Coop. Banks
Comm. Banks
Savings Banks
Private Banks
0,00
2,00
4,00
6,00
8,00
10,00
12,00
14,00
16,00
18,00
2001 2002 2003 2004 2005 2006 2007 2008 2009 2010
Investment Banks
Universal Banks
Page 101
97
Figure 69: Size based on size of the banks Source: BankScope
Figure 70: Size of Fortis, KBC, Dexia and ING Source: BankScope
0,00
5,00
10,00
15,00
20,00
25,00
2001 2002 2003 2004 2005 2006 2007 2008 2009 2010
TA > 100 000
TA > 10 000
TA > 7 000
TA < 7 000
17,50
18,00
18,50
19,00
19,50
20,00
20,50
21,00
2001 2002 2003 2004 2005 2006 2007 2008 2009 2010
Fortis
KBC
Dexia
ING
Page 102
98
APPENDIX 9: RATIOS FOR EACH BANK INDIVIDUALLY
This appendix shows the three year average ratio for each bank separately during the period 2008-
2009 and 2010.
The table below explains the abbreviations used in the tables on the next two pages:
3yaOpIncometoTA10 3 year average operational income to total assets
3yaNIItoTA10 3 year average net interest income to total assets
3yaNCFtoTA10 3 year average net commissions and fees to total assets
3yaFTtoTA10 3 year average financial transactions to total assets
3yaLLPtoTA10 3 year average loan loss provisions to total assets
3yaOpExptoTA10 3 year average operational expenses to total assets
3yaROE10 3 year average return on equity
3yaROA10 3 year average return on assets
3yaLev10 3 year average leverage
3yaPM10 3 year average profit margin
3yaAY10 3 year average asset yield
3yaCostToIncome10 3 year average cost to income
Page 103
99
Bank Name 3yaOpIncometoTA10 3yaNIItoTA10 3yaNCFtoTA10 3yaFTtoTA10 3yaLLPtoTA10 3yaOpExptoTA10
Agricaisse - Caisse Coopérative de Dépôts et de Crédit Agricole 0,92% 1,48% -0,56%
0,29% 0,41%
Antwerps Beroepskrediet 3,16% 3,26% -0,02% -0,23% 0,26% 1,45%
Argenta Spaarbank-ASPA 0,55% 0,80% -0,21% -0,03% 0,02% 0,36%
Banca Monte Paschi Belgio SA 1,59% 1,36% 0,19% 0,04% 0,51% 1,12%
Bank J. Van Breda en Co NV 2,69% 2,06% 0,74% -0,11% 0,11% 1,65%
Banque de la Poste-Bank van de Post 1,17% 2,10% -0,93%
0,02% 0,80%
Banque Degroof SA-Bank Degroof NV 4,85% 1,35% 3,67% -0,18% 0,01% 3,41%
Banque Delen NV 6,65% 0,64% 6,36%
3,07%
BKCP 1,59% 1,49% 0,11% 0,00% 0,12% 1,96%
Byblos Bank Europe SA 2,57% 1,15% 1,42%
0,03% 1,61%
CBC Banque S.A. 2,57% 1,89% 0,59% 0,10% 0,04% 1,56%
Centea 1,66% 1,90% -0,25% 0,01% 0,09% 0,79%
Citibank Belgium N.V./S.A. 7,68% 7,67% -0,04% 0,05% 1,78% 6,43%
Crédit Agricole SA-Landbouwkrediet 2,19% 2,09% 0,07% 0,03% 0,04% 1,86%
Delta Lloyd Bank 2,19% 1,53% 0,44% 0,21% 0,05% 2,42%
Deutsche Bank SA-Deutsche Bank NV 1,19% 0,77% 0,35% 0,06% 0,00% 0,96%
Dexia Bank Belgium-Dexia Bank 1,06% 1,00% 0,15% -0,09% 0,08% 0,67%
Ethias Bank 0,75% 0,79% -0,03% -0,01% 0,15% 0,77%
Europabank 6,24% 5,70% 0,81%
0,04% 4,48%
Page 104
100
F. van Lanschot Bankiers Belgie 1,46% 0,78% 0,72% 0,02% 0,08% 1,31%
Fortis Bank SA/ NV-BNP Paribas Fortis 1,09% 0,88% 0,30% -0,09% 0,23% 1,08%
ING Belgium SA/NV-ING 2,00% 1,43% 0,39% 0,18% 0,10% 1,20%
KBC Bank NV 1,55% 1,67% 0,57% -0,68% 0,48% 1,43%
Keytrade Bank SA/NV 2,83% 1,40% 1,24% 0,20% 0,15% 1,26%
Onderling Beroepskrediet-OBK-Bank C.V.B.A. 1,38% 1,48% -0,10% 0,00% 0,04% 1,74%
Record Bank SA/NV 0,99% 1,33% -0,35% 0,01% 0,04% 0,65%
Santander Benelux SA/NV 1,03% 0,85% 0,17% 0,01% 0,00% 0,07%
Société Générale Private Banking N.V. 6,58% 0,86% 5,48% 0,49% 0,00% 5,78%
VDK Spaarbank NV 1,73% 1,74% -0,01% 0,04% 1,11%
Page 105
101
Bank Name 3yaROE10 3yaROA10 3yaLev10 3yaPM10 3yaAY10 3yaCostToIncome10
Agricaisse - Caisse Coopérative de Dépôts et de Crédit Agricole 5,97% 0,37% 15,75 9,40% 3,85% 38,59%
Antwerps Beroepskrediet 1,41% 0,70% 2,49 59,12% 3,87% 38,15%
Argenta Spaarbank-ASPA 9,19% 0,25% 37,00 6,43% 3,86% 50,93%
Banca Monte Paschi Belgio SA 2,02% 0,14% 15,56 4,47% 3,98% 67,80%
Bank J. Van Breda en Co NV 9,61% 0,76% 12,67 13,97% 5,55% 58,72%
Banque de la Poste-Bank van de Post 7,25% 0,20% 36,11 8,08% 2,61% 78,55%
Banque Degroof SA-Bank Degroof NV 10,34% 1,13% 8,98 16,21% 7,20% 62,62%
Banque Delen NV 20,50% 2,55% 8,33 38,05% 6,66% 46,26%
BKCP -1,39% -0,09% 12,53 -1,39% 4,53% 113,02%
Byblos Bank Europe SA 10,23% 0,80% 12,68 19,42% 4,25% 60,71%
CBC Banque S.A. 14,05% 0,74% 19,04 15,21% 4,92% 60,47%
Centea 13,03% 0,70% 18,44 17,85% 3,96% 47,48%
Citibank Belgium N.V./S.A. -9,85% -0,93% 11,40 -8,12% 10,96% 71,47%
Crédit Agricole SA-Landbouwkrediet 6,59% 0,42% 15,59 17,41% 2,44% 76,18%
Delta Lloyd Bank 2,77% 0,16% 17,29 3,16% 5,06% 96,00%
Deutsche Bank SA-Deutsche Bank NV 6,95% 0,22% 32,06 6,05% 3,58% 85,58%
Dexia Bank Belgium-Dexia Bank 0,84% 0,07% 55,03 4,61% 2,97% 79,03%
Ethias Bank -9,91% -0,49% 19,32 -10,24% 3,57% 100,60%
Europabank 15,58% 1,70% 9,20 24,30% 6,98% 64,16%
Page 106
102
F. van Lanschot Bankiers Belgie 0,29% 0,04% 7,17 1,64% 4,25% 90,23%
Fortis Bank SA/ NV-BNP Paribas Fortis -42,85% -1,02% 26,69 0,21% 11,03% 93,54%
ING Belgium SA/NV-ING 10,54% 0,66% 16,17 7,52% 9,89% 57,69%
KBC Bank NV -6,28% -0,25% 22,34 -5,83% 4,31% 84,97%
Keytrade Bank SA/NV 27,59% 0,89% 30,93 33,26% 2,74% 46,47%
Onderling Beroepskrediet-OBK-Bank C.V.B.A. -10,07% -0,19% 29,37 -1,99% 4,24% 120,41%
Record Bank SA/NV 11,18% 0,34% 32,34 8,93% 3,84% 60,64%
Santander Benelux SA/NV 6,26% 0,89% 8,22 31,14% 2,77% 7,62%
Société Générale Private Banking N.V. 6,62% 0,71% 9,36 8,20% 8,89% 87,95%
VDK Spaarbank NV 3,71% 0,30% 12,45 7,92% 3,89% 65,23%
Page 107
© 2012 KPMG Holding (Belgium), a Belgian civil CVBA/SCRL and a member firm of the KPMG network of independent member firms affiliated with KPMG International Cooperative (“KPMG International”), a Swiss entity. All rights reserved.