“Broadband Technology Roadmap for Rural Areas in the Andes and Amazon Regions in Peru” PhD Candidate: David Espinoza Research Advisor: David Reed Interdisciplinary Telecommunications Program University of Colorado at Boulder 1
Transcript
“Broadband Technology Roadmap for RuralAreas in the Andes and Amazon Regions in
Peru”
PhD Candidate: David EspinozaResearch Advisor: David Reed
Interdisciplinary Telecommunications ProgramUniversity of Colorado at Boulder
• Research Question“What is the technology roadmap for introducing broadbandservices to underserved and unserved areas in the Andes andAmazon Regions of Peru?”
4
Research Hypotheses
• Hypothesis 1Deploying wireless access networks in the Andes and Amazonregions of Peru using the Wi-Fi technology and unlicensedspectrum has the lowest deployment and operating cost in a 10-year period.
• Hypothesis 2Wireless access networks using stratospheric platforms in theAndes and Amazon regions of Peru has the lowest deployment andoperating cost for the initial years but are not able to scale for a10-year period to serve forecasted customer and speed growth.
• Hypothesis 3Spectrum management and regulation have a quantifiabletechnology and economic impact in the deployment and operationof wireless access networks in the Andes and Amazon regions ofPeru and are important to define the best technology fit tointroduce broadband services in these regions.
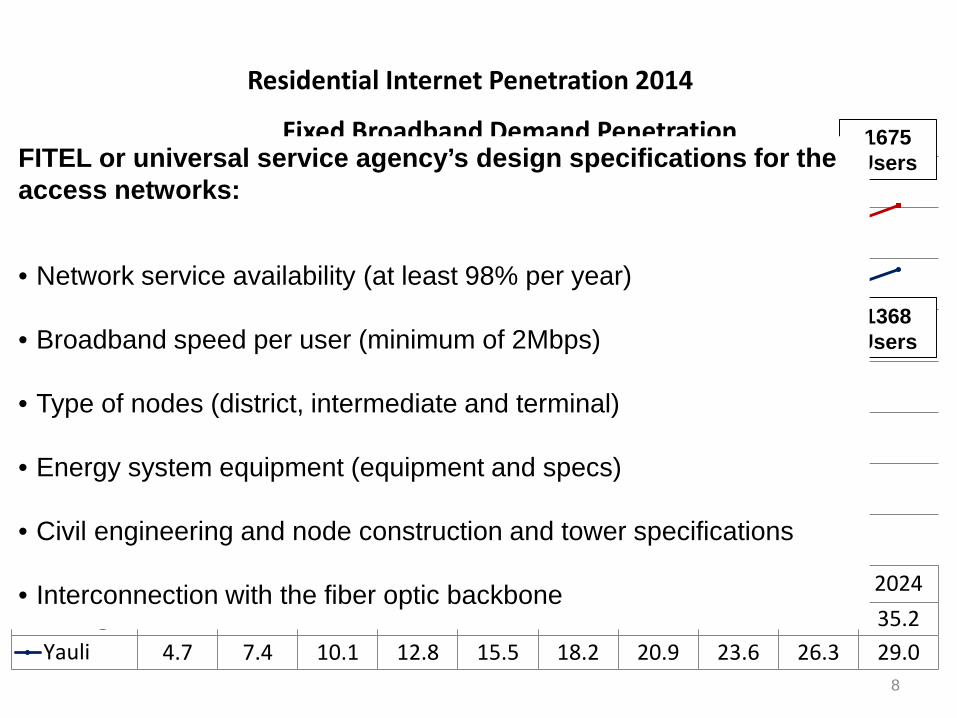
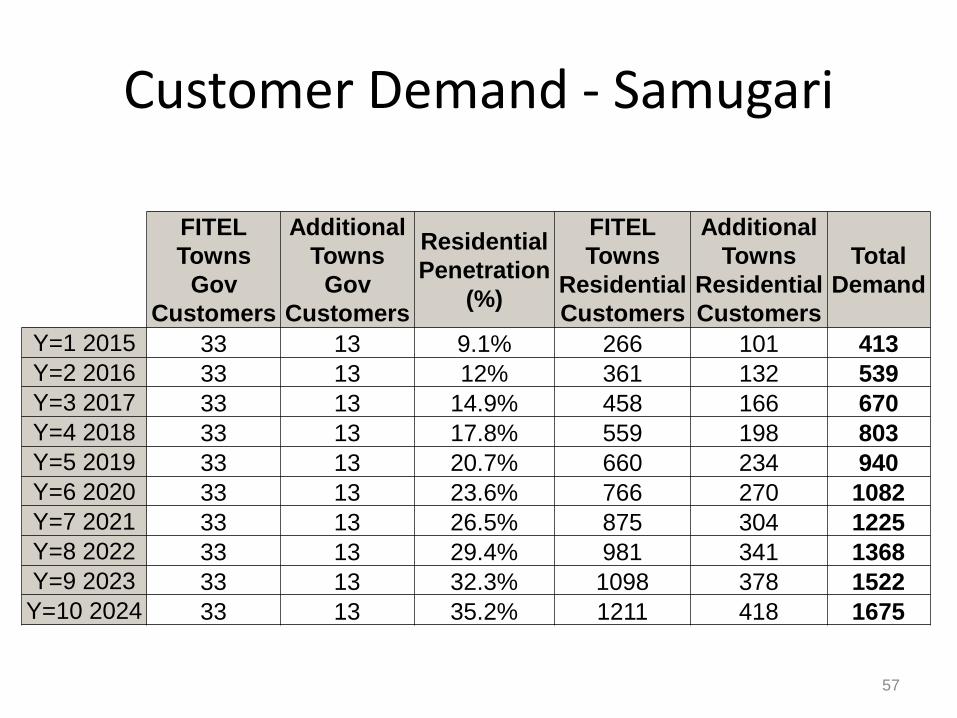
1675 UsersFITEL or universal service agency’s design specifications for the
access networks:
• Network service availability (at least 98% per year)
• Broadband speed per user (minimum of 2Mbps)
• Type of nodes (district, intermediate and terminal)
• Energy system equipment (equipment and specs)
• Civil engineering and node construction and tower specifications
• Interconnection with the fiber optic backbone
8
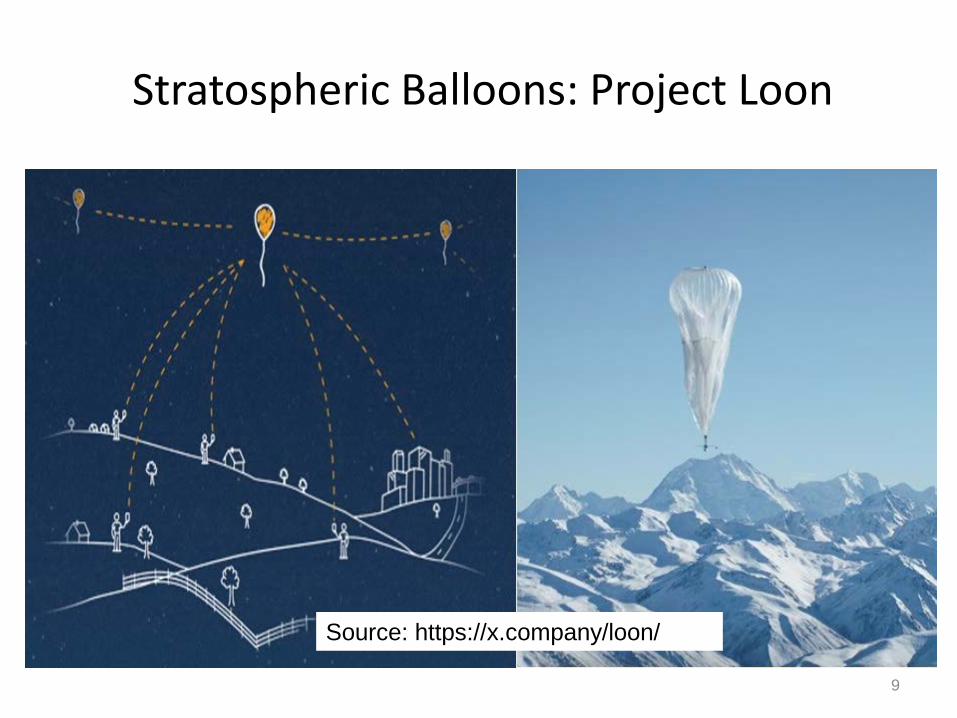
Stratospheric Balloons: Project Loon
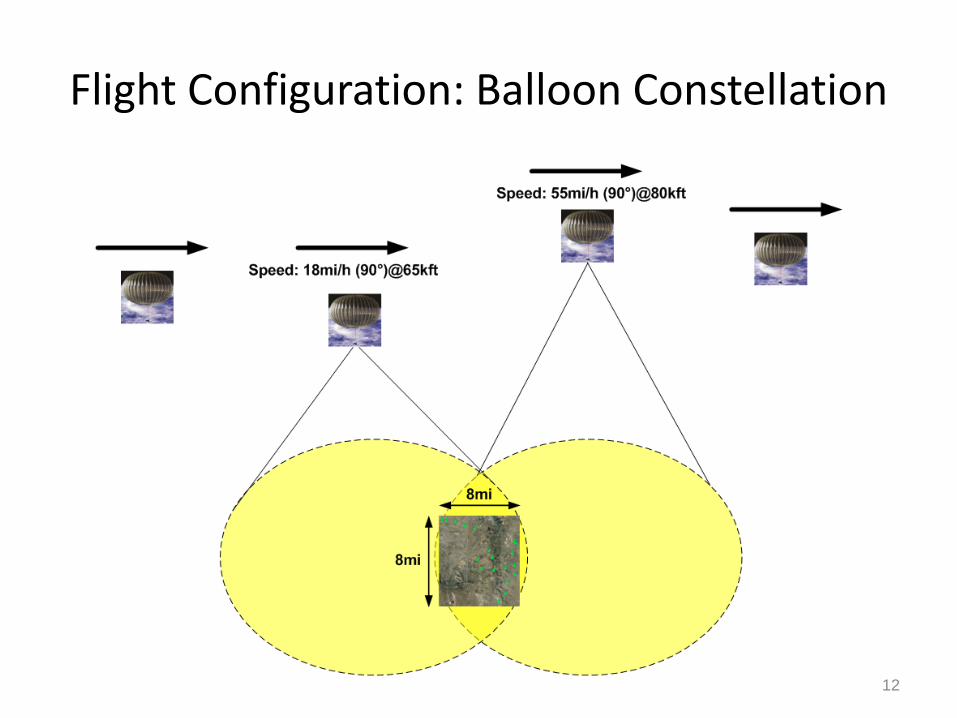
• Project Loon (Google X): Delivering wireless Internetservices using super-pressure balloons traveling in the lowerstratosphere (65,000ft to 80,000 ft).
• Super-pressure balloons: Envelope size (49ftx39ft),longevity (up to 6 months).
• Active payload systems (from U.S. Patent 8967533 BalloonPower Sources with a Buoyancy Trade-off):– Computational: Processor and on-board data storage.– Energy: Solar panels, rechargeable battery, fuel cells.– Navigation: Station-keeping or move to a position.– Telecommunications: FSO and RF (LTE for customer access).– Sensing: Video cameras, motion & environmental data sensors.– Altitude control: Components to vary the buoyancy of the vehicle.
9
Source: https://x.company/loon/
Stratospheric Balloons: Project Loon
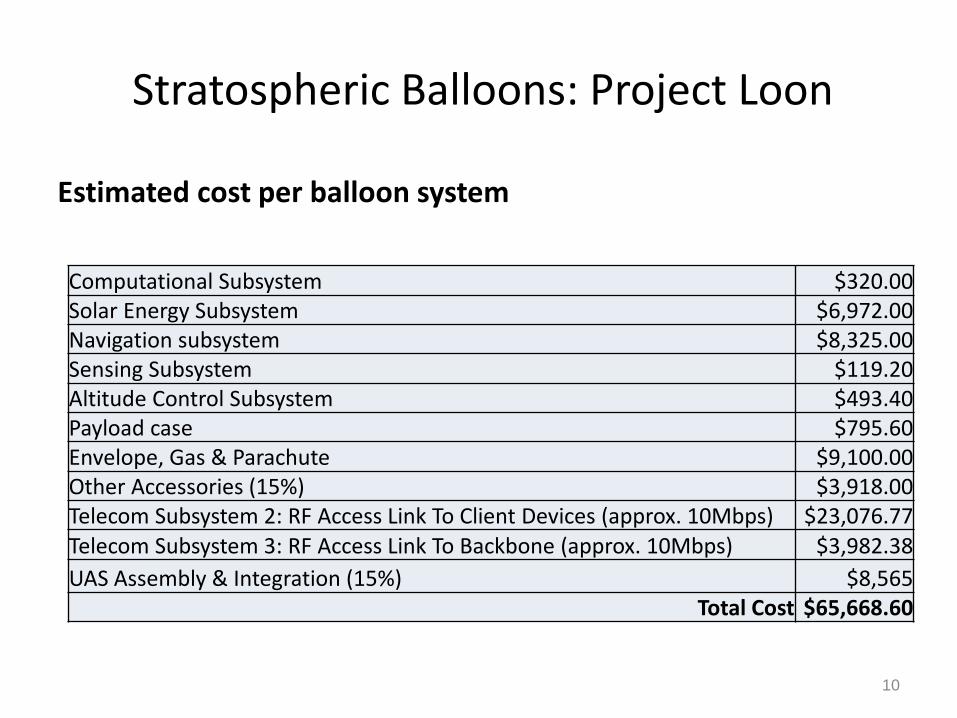
Estimated cost per balloon system
Computational Subsystem $320.00Solar Energy Subsystem $6,972.00Navigation subsystem $8,325.00Sensing Subsystem $119.20Altitude Control Subsystem $493.40Payload case $795.60Envelope, Gas & Parachute $9,100.00Other Accessories (15%) $3,918.00Telecom Subsystem 2: RF Access Link To Client Devices (approx. 10Mbps) $23,076.77Telecom Subsystem 3: RF Access Link To Backbone (approx. 10Mbps) $3,982.38UAS Assembly & Integration (15%) $8,565
Total Cost $65,668.60
10
Flight Configuration: Single Balloon
11
Flight Configuration: Balloon Constellation
12
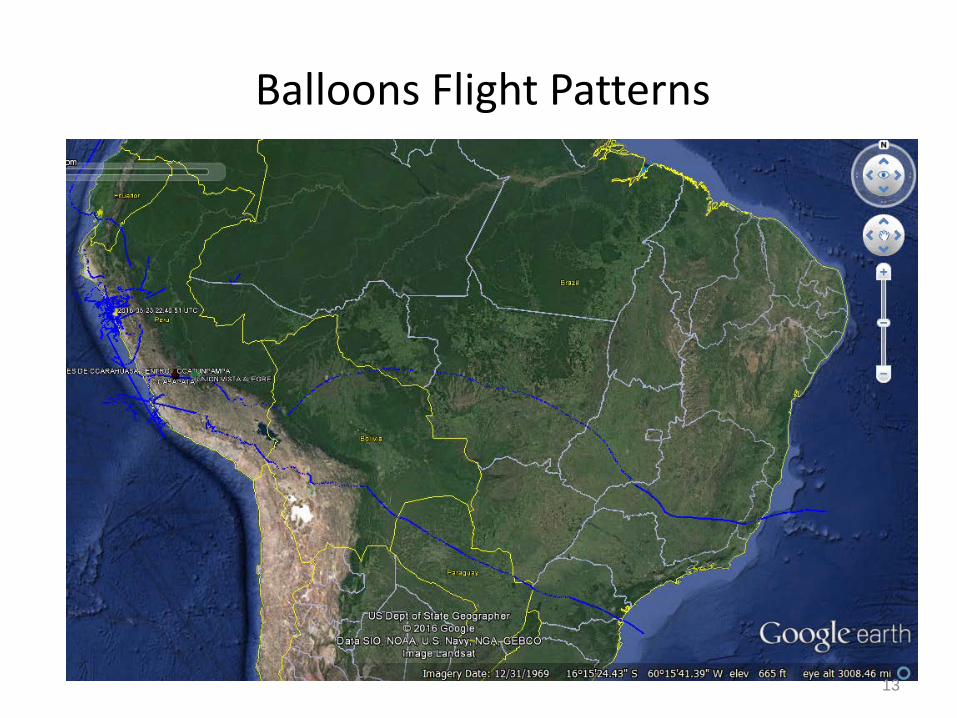
Balloons Flight Patterns
13
3. Technical Analysis Results
14
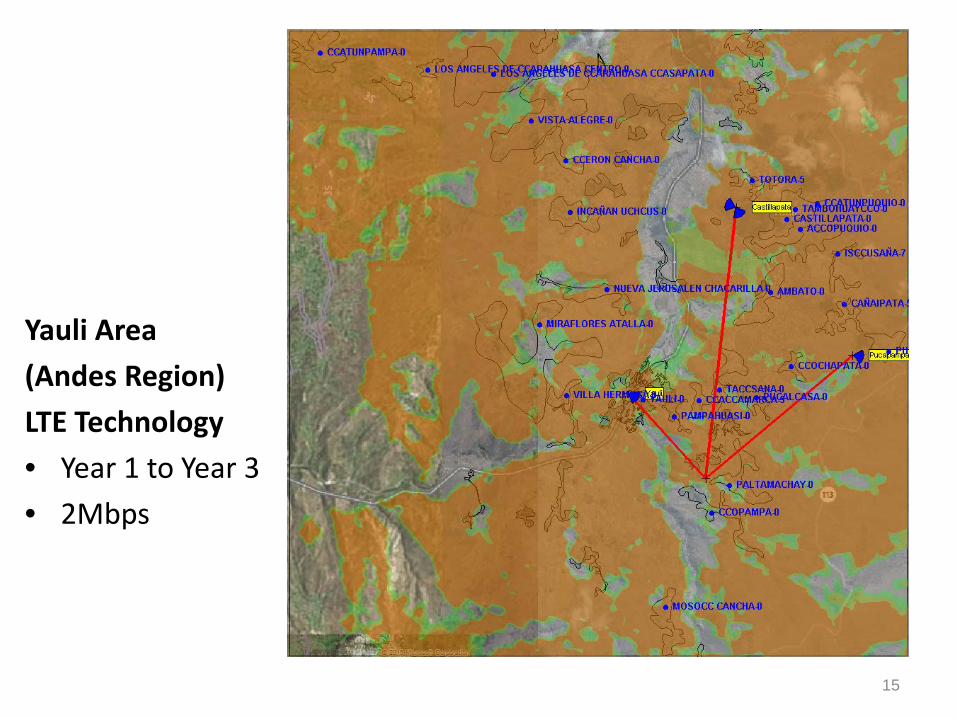
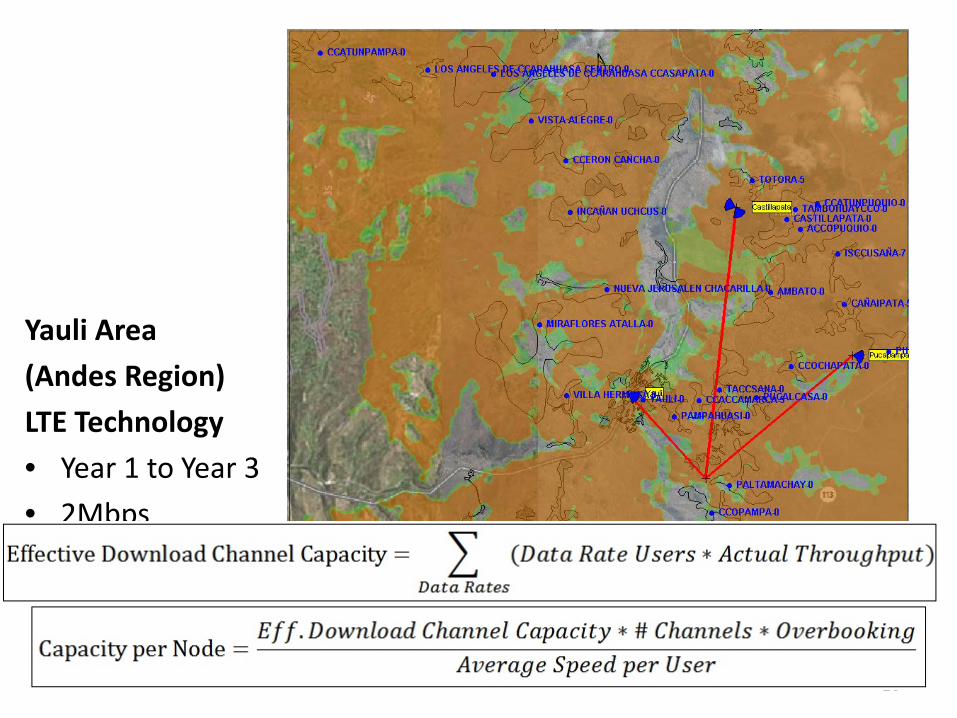
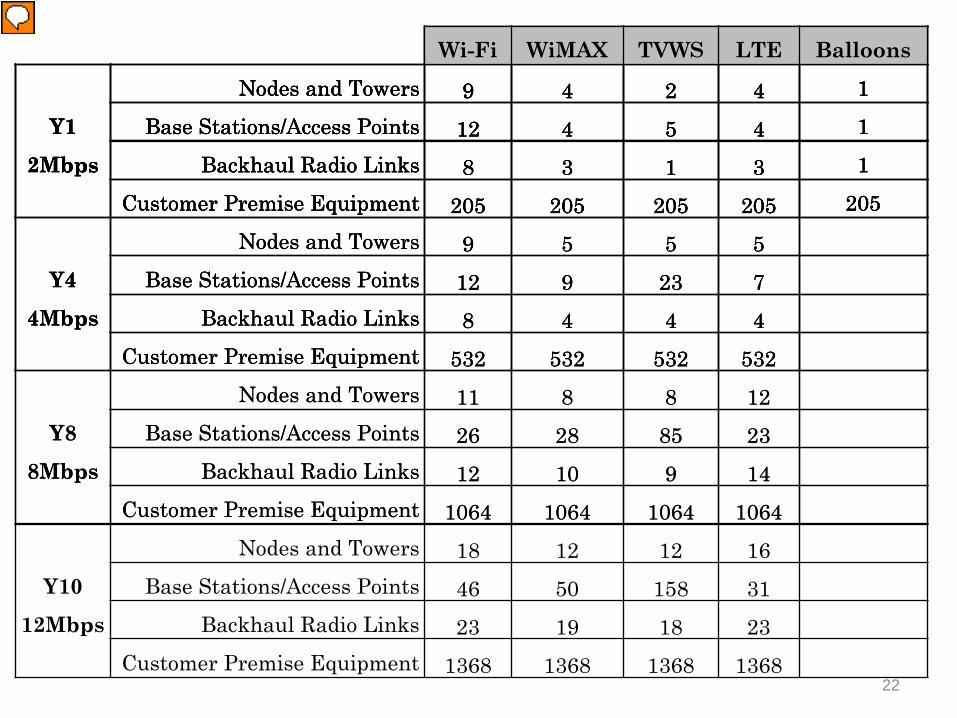
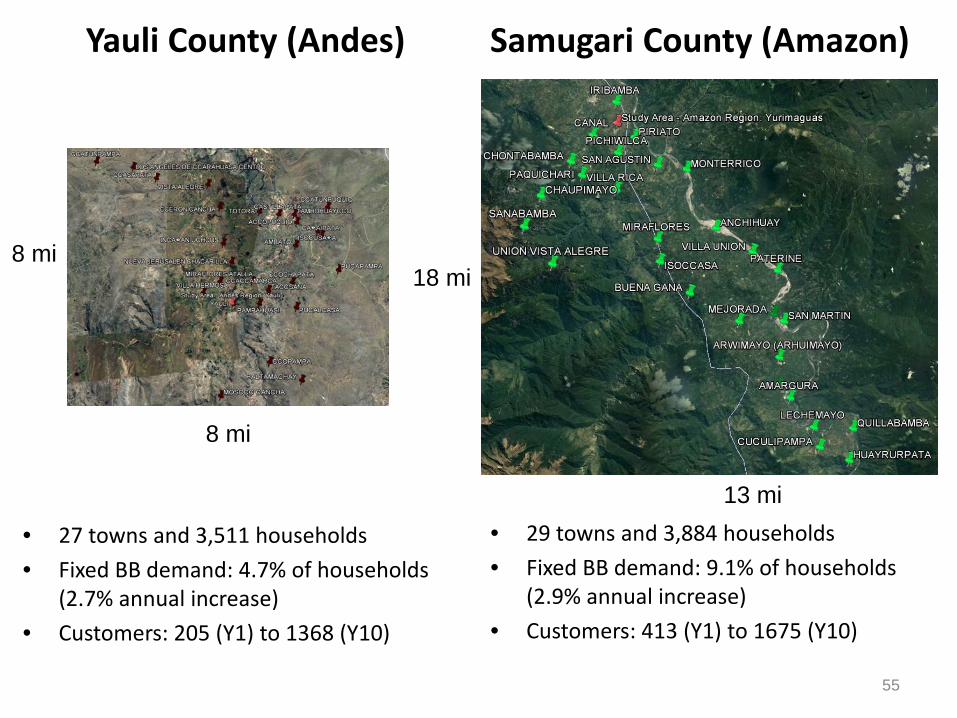
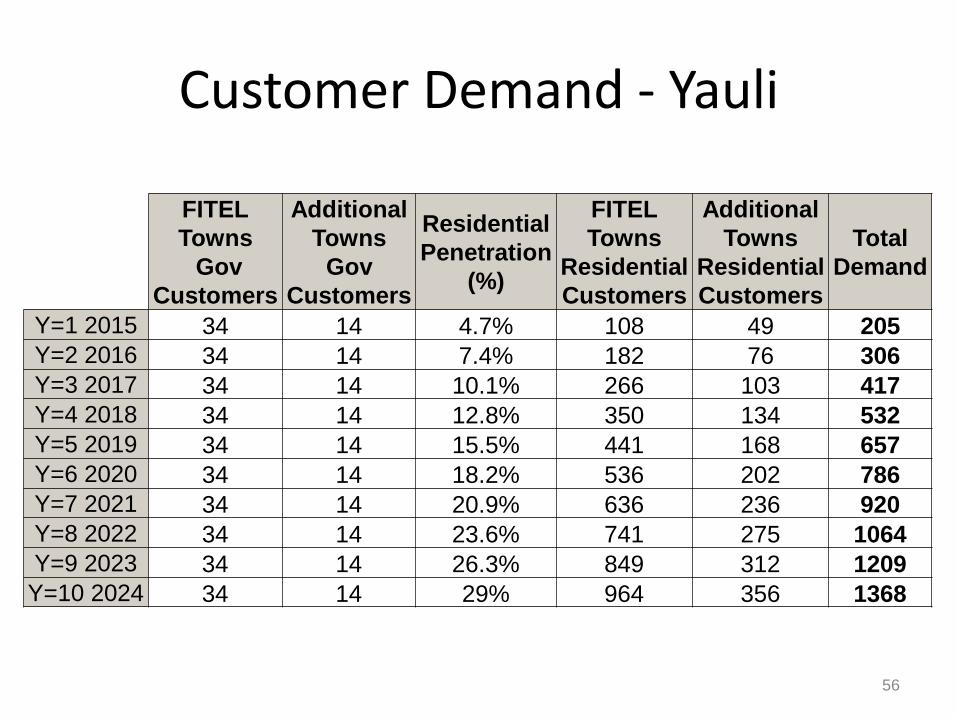
Yauli Area(Andes Region)LTE Technology• Year 1 to Year 3• 2Mbps
15
Yauli Area(Andes Region)LTE Technology• Year 1 to Year 3• 2Mbps
16
17
Yauli Area(Andes Region)LTE Technology• Year 4 to Year 7• 4Mbps
18
Yauli Area(Andes Region)LTE Technology• Year 8 to Year 9• 8Mbps
19
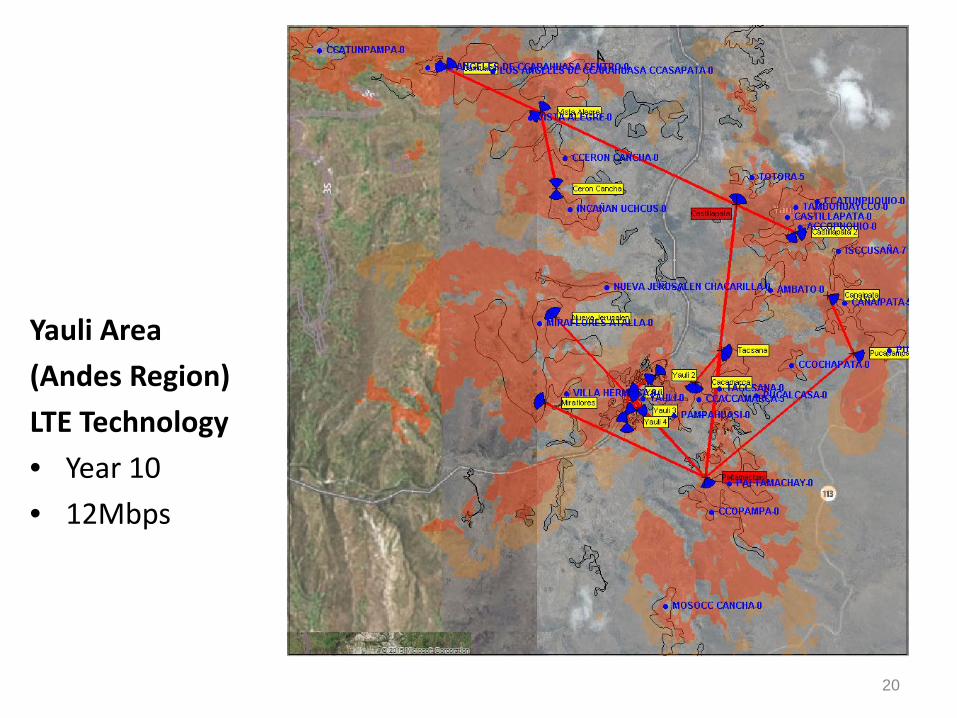
Yauli Area(Andes Region)LTE Technology• Year 10• 12Mbps
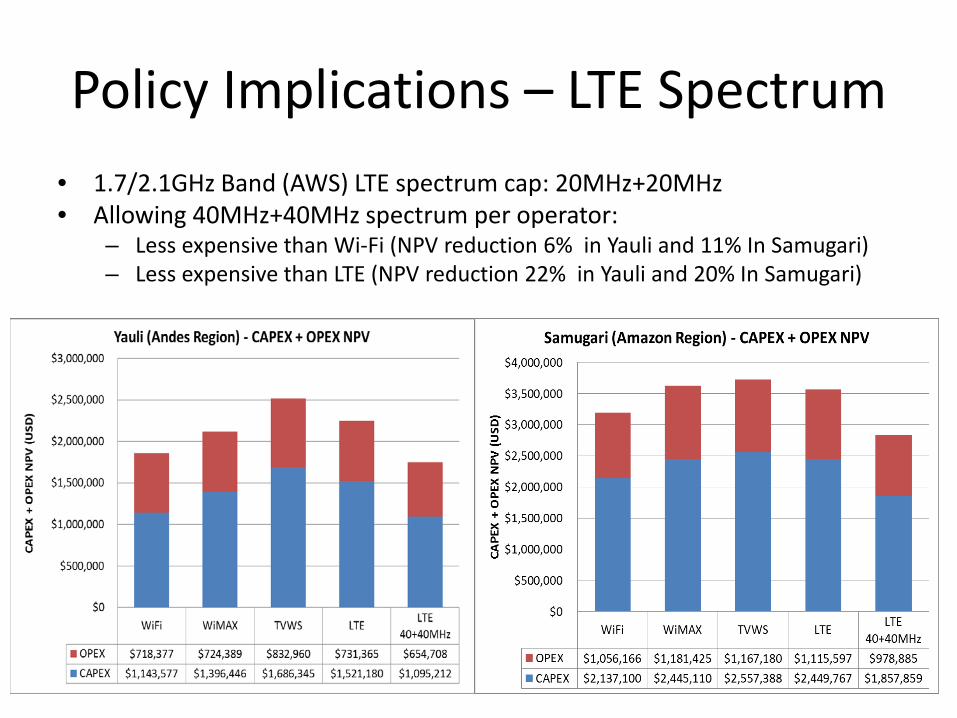
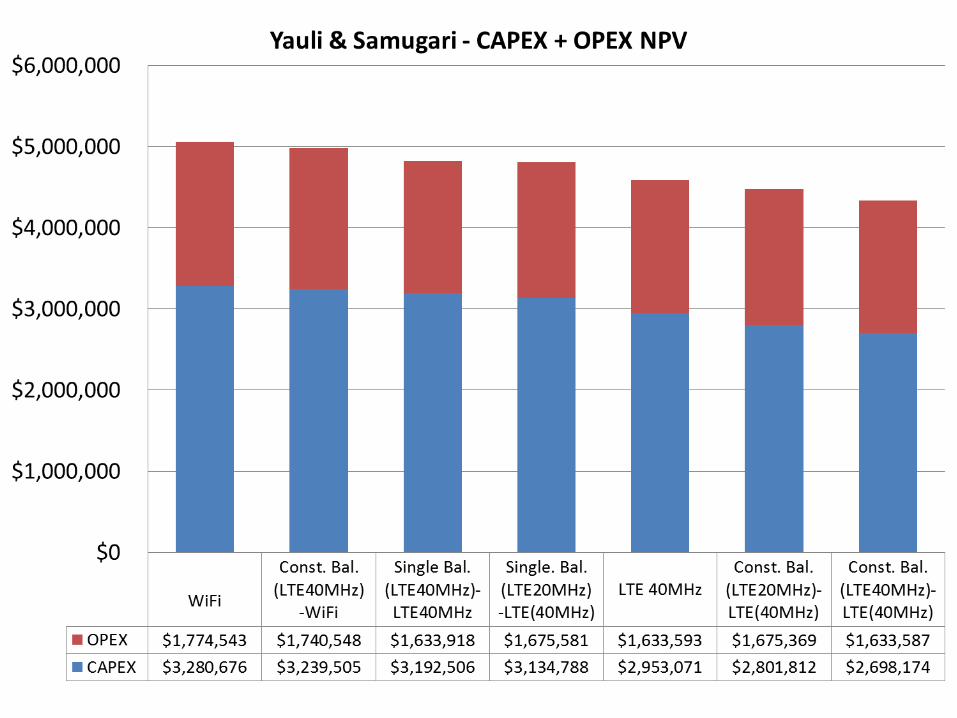
Policy Implications – LTE Spectrum• 1.7/2.1GHz Band (AWS) LTE spectrum cap: 20MHz+20MHz• Allowing 40MHz+40MHz spectrum per operator:
– Less expensive than Wi-Fi (NPV reduction 6% in Yauli and 11% In Samugari)– Less expensive than LTE (NPV reduction 22% in Yauli and 20% In Samugari)
39
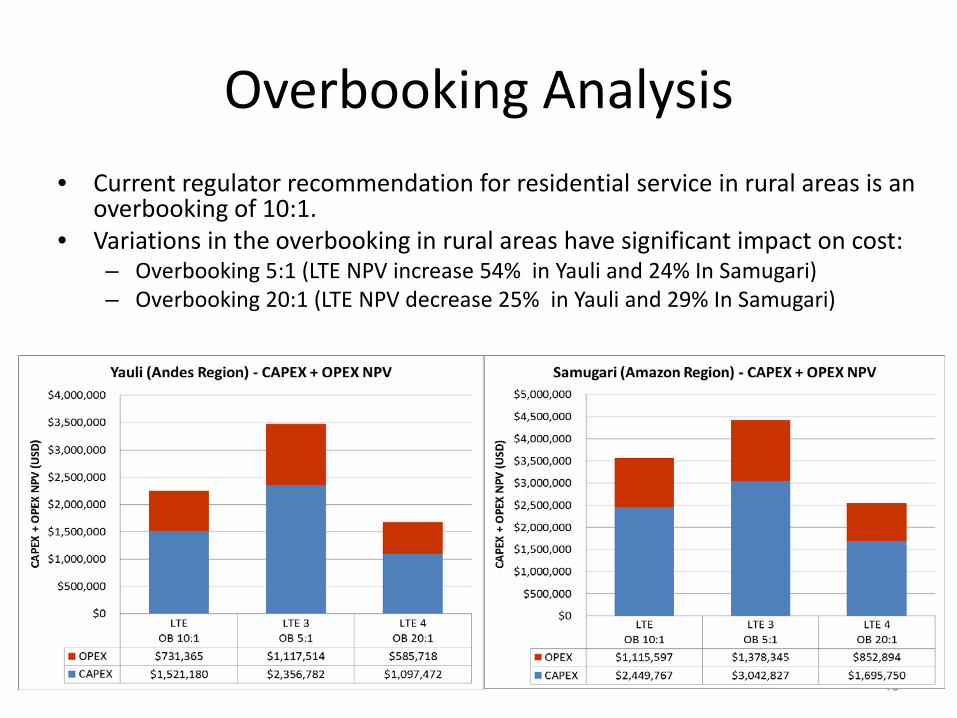
Overbooking Analysis
40
• Current regulator recommendation for residential service in rural areas is an overbooking of 10:1.
• Variations in the overbooking in rural areas have significant impact on cost:– Overbooking 5:1 (LTE NPV increase 54% in Yauli and 24% In Samugari)– Overbooking 20:1 (LTE NPV decrease 25% in Yauli and 29% In Samugari)
Broadband Technology Roadmap
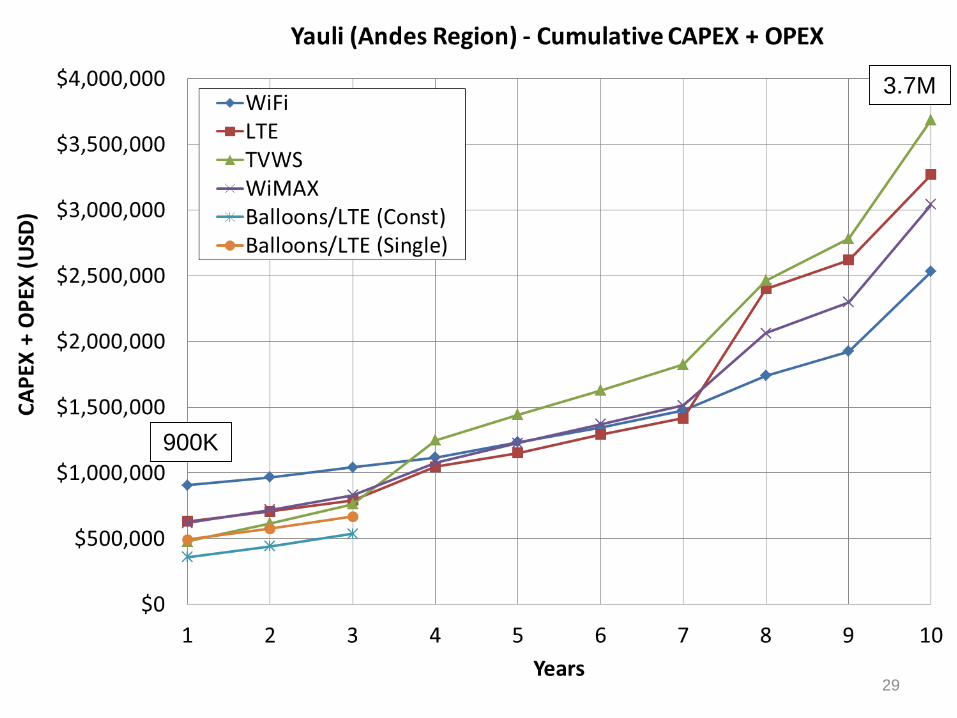
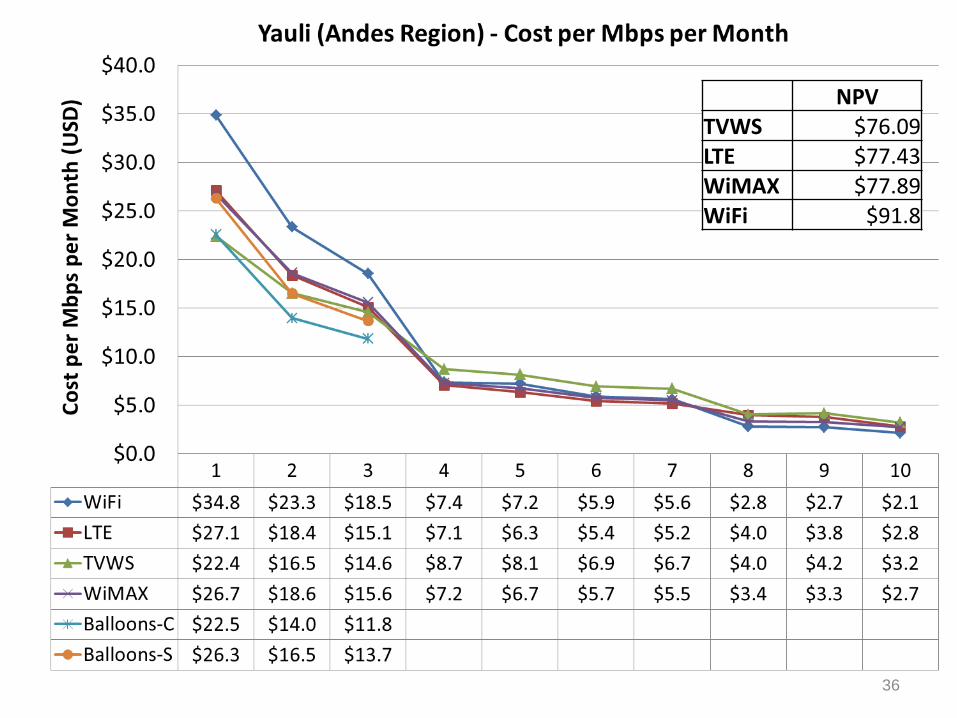
• 1st Step: Use technical and engineering cost analyses results of current wireless technologies and new stratospheric platforms.– Stratospheric balloons have lowest cost for first 3 years.– WiFi has the lowest cost among current wireless options.– LTE 40+40MHz has lower costs than WiFi.
• 2nd Step: Combine best technical features and cost efficiencies into an innovative roadmap solution.– Use stratospheric balloons for first few years.– Complementary Wi-Fi or LTE 40MHz terrestrial networks .
41
Presenter
Presentation Notes
42
43
44
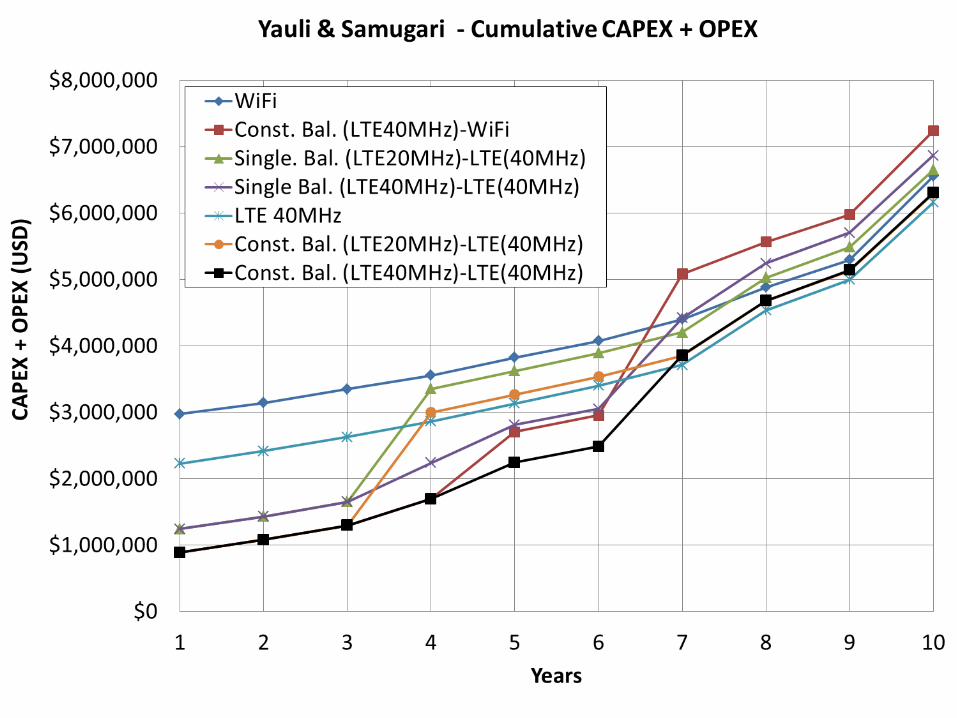
Broadband Technology Roadmap
The two selected roadmap solutions:• Stratospheric constellation balloons (LTE 20MHz)
complemented with terrestrial LTE 40MHz.• Stratospheric constellation balloons (LTE 40MHz)
complemented with terrestrial LTE 40MHz.
45
Presenter
Presentation Notes
6. Conclusions
46
Research Hypotheses
• Hypothesis 1Deploying wireless access networks in the Andes andAmazon regions of Peru using the Wi-Fi technology andunlicensed spectrum has the lowest deployment andoperating cost in a 10-year period.– This hypothesis is true
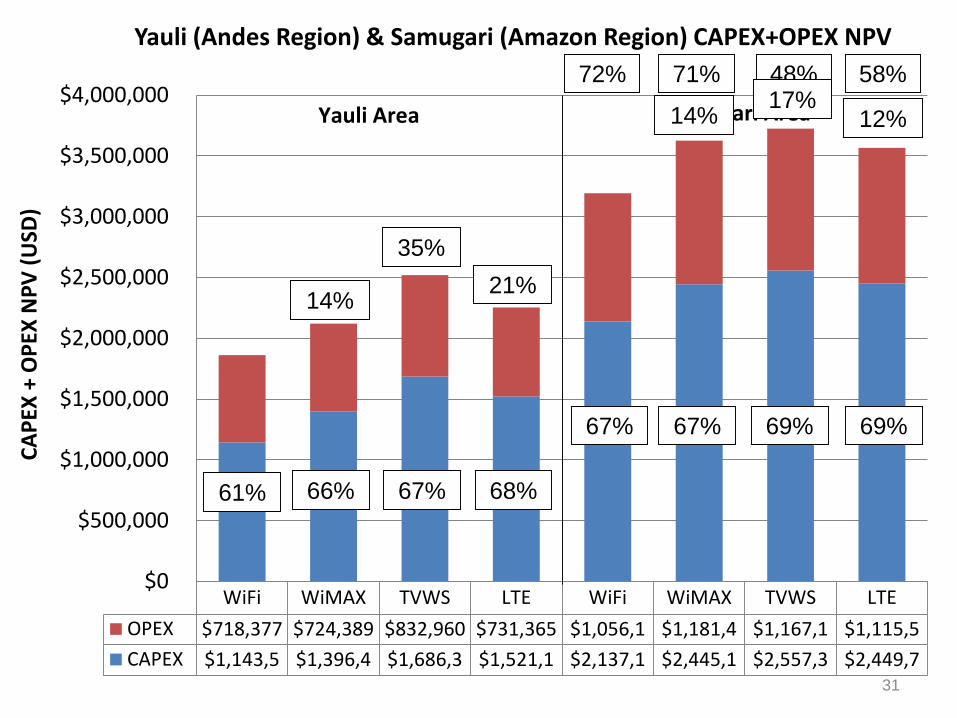
– Andes Region (Yauli): Lowest NPV (WiMAX, LTE and TVWS are 14%,21% and 35% more expensive).
– Amazon Region (Samugari): Lowest NPV (LTE, WiMAX and TVWSare 12%, 14% and 17% more expensive).
47
Research Hypotheses
• Hypothesis 2Wireless access networks using stratospheric platformsin the Andes and Amazon regions of Peru has the lowestdeployment and operating cost for the initial years butare not able to scale for a 10-year period to serveforecasted customer and speed growth.– This hypothesis is true
– Under current spectrum regulations, balloons can provide servicefor first 3 years at the lowest cost.
– Allowing LTE 40+40MHz, balloons can provide service for 4 years inYauli and for 6 years in Samugari.
48
Research Hypotheses
• Hypothesis 3Spectrum management and regulation have aquantifiable technology and economic impact in thedeployment and operation of wireless access networks inthe Andes and Amazon regions of Peru and areimportant to define the best technology fit to introducebroadband services in these regions.– This hypothesis is true
– Spectrum regulations have an impact on the available spectrumresources used in the technical analysis.
– Technical design has a direct impact of the network costs.– Lifting the LTE spectrum cap allows LTE to become the lowest cost
option.
49
Research Question
• Research Question“What is the technology roadmap for introducing broadband services to underserved and unserved areas in the Andes and Amazon Regions of Peru?”– The two broadband roadmap selected solutions: