3 rd Migration Observatory Report “Immigrant Integration in Europe” Tommaso Frattini (University of Milan and Centro Studi Luca d’Agliano) with Natalia Vigezzi (Centro Studi Luca d’Agliano) February 2019
Transcript
3rd Migration Observatory Report“Immigrant Integration in Europe”
Tommaso Frattini (University of Milan and Centro Studi Luca d’Agliano)with Natalia Vigezzi (Centro Studi Luca d’Agliano)
February 2019
3rd Migration Observatory Report“Immigrant Integration in Europe”
February 2019
This report is prepared within the Migration Observatory project,jointly carried out by Collegio Carlo Alberto and Centro Studi Lucad’Agliano and funded by Compagnia di San Paolo
TABLE OF CONTENTS
EXECUTIVE SUMMARY 7
Introduction 13
Part I: Immigrant integration in 2017 - A European overview 15
Immigrant population - size and characteristics 15
Employment 19
Occupational status 23
Income 25
Part II: Long term integration: an analysis of the last twenty years 29
Immigrant population - size and characteristics 30
Naturalisation and marriage 38
Employment 43
Income 51
Occupation 55
Conclusions 58
TABLES APPENDIX - Europe 60
TABLES APPENDIX - Long term integration 79
TECHNICAL APPENDIX 1 - Europe 133
TECHNICAL APPENDIX 2 - Long term integration 136
7
This is the third edition of the Migration Observatory annual report on immigrant integration.
As in previous years, in the first part we use data from the latest edition of the European Labour Force Survey (2017) to provide a concise, easily accessible and up-to-date source of reference regarding the size, characteristics, and relative economic performance of immigrants in EU countries.
In the second part we take a longer-term perspective, and for the first time we study the experience of six EU countries – France, Germany, Italy, Spain, Sweden and the UK – in the last twenty years (1995-2016), paying special attention to long term assimilation patterns and using data from earlier editions of the EULFS.
The key findings are summarized below.
PART I: IMMIGRANT INTEGRATION IN 2017
IMMIGRANT POPULATION: SIZE AND CHARACTERISTICS
BOTTOMLINE: One in ten residents of the European Union is an immigrant. Most immigrants live in EU15 countries and have been in their current country for more than five years. The number of immigrants in the EU has increased by about two million per year over the last two years. Non-European migrants account for less than half of the foreign population. The share of tertiary educated immigrants and natives is strongly correlated across countries.
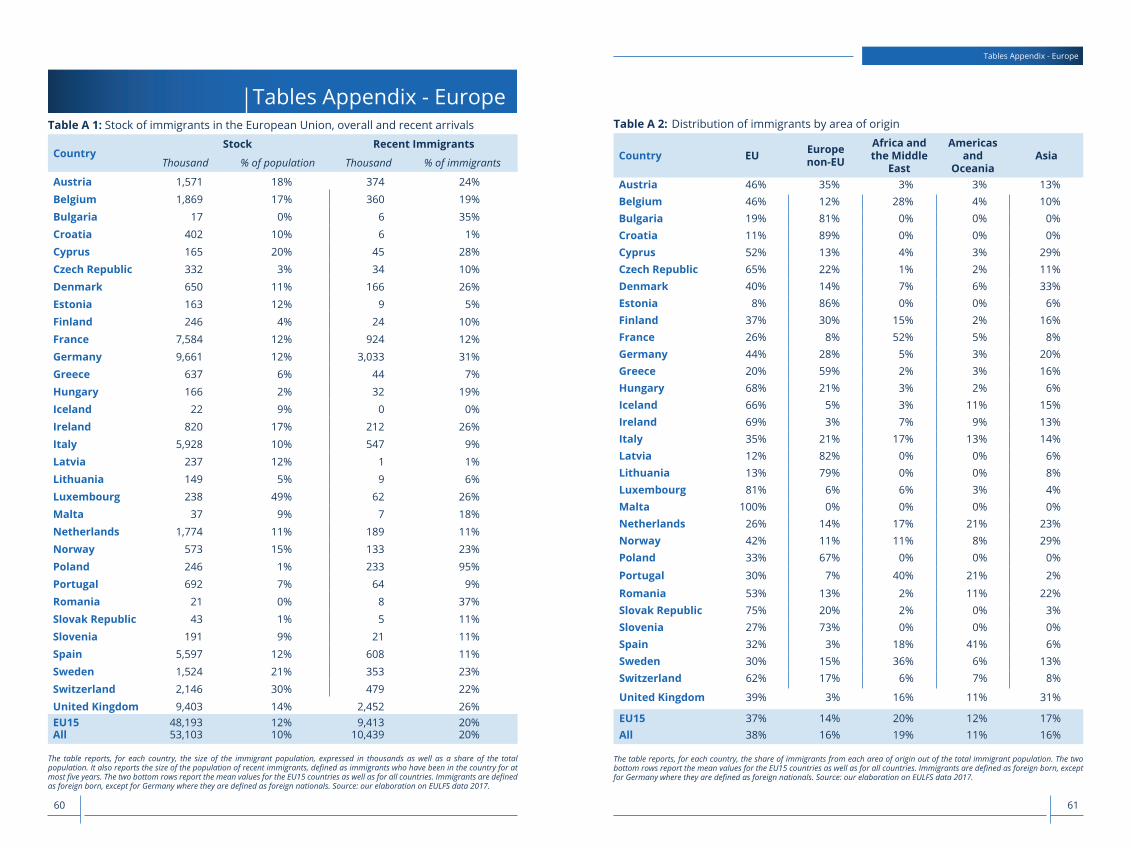
- In 2017 the number of immigrants in the European Union was 53.1 million, roughly 10% of total population. Most of them (48.2 million) live in a EU15 country, where they account for 12% of total population.
- There is significant heterogeneity in immigrant concentration across countries, which ranges from 0.1 – 0.2% in Romania and Bulgaria to around 20% in Cyprus and Sweden, 30% in Switzerland and even 50% in Luxembourg.
- Most immigrants have been in their current country of residence for a long time: only
Executive Summary
98
Executive Summary Executive Summary
composition of the native and immigrant populations in terms of age structure, gender mix and education. This result indicates that on average immigrants’ age-gender-education profiles make them very similar to natives in terms of employability.
- The probability of employment is higher for immigrants who have spent more time in the host country. The immigrant-native gap decreases by almost ten percentage points (from 16.1 to 6.4 p.p.) between immigrants with at most 5 years of residence and those who have been in the country for six years or more.
OCCUPATIONAL STATUS AND INCOME
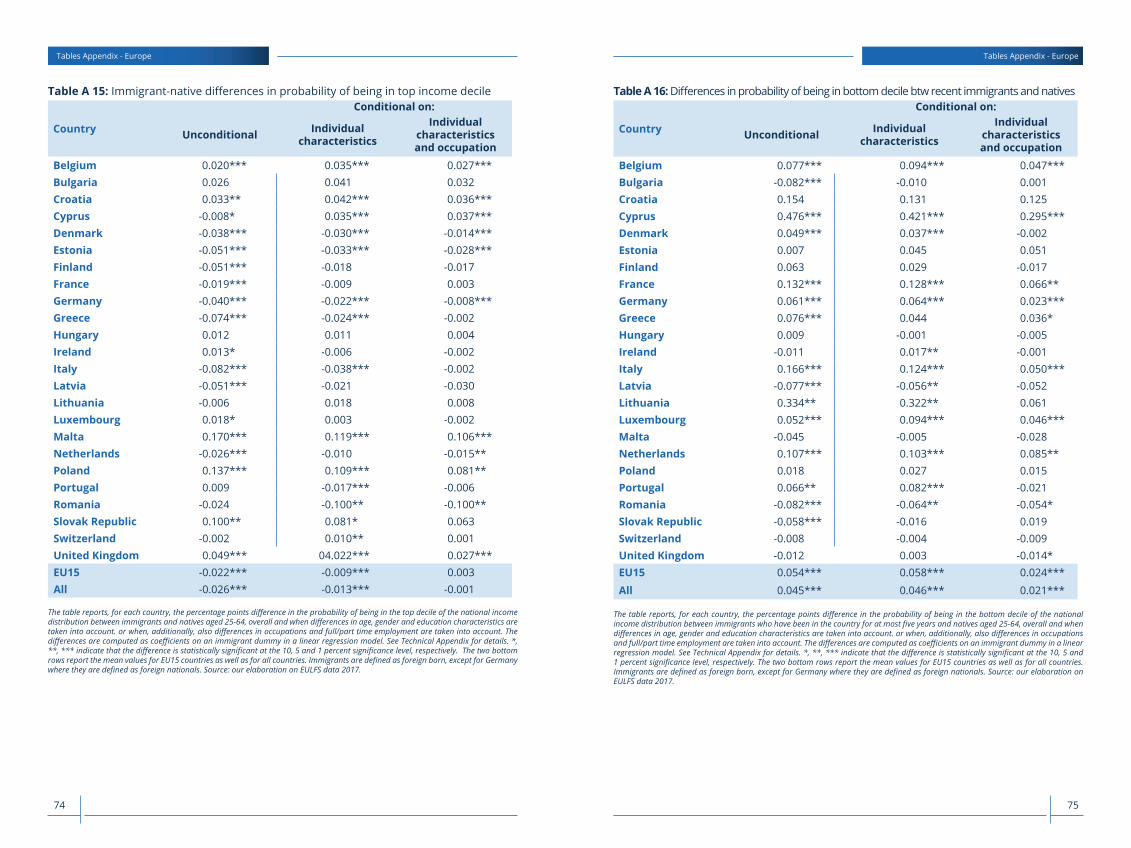
BOTTOMLINE: Immigrants are more concentrated than natives in the least prestigious occupations. They are also disproportionately more likely to be in the lowest income deciles. Differences in occupational distribution account for more than half of the immigrant-native income gap.
- Immigrants’ occupational distribution is more polarised than that of natives. Immigrants are as likely as natives to work in high-status and high-pay occupations, they are more concentrated in the least prestigious occupations, and they are missing from the middle of the occupational distribution.
- Immigrants are 70% more likely than natives to be in the bottom decile of the national income distribution and 25% less likely to be in the top decile.
- More than half of the immigrant-native difference in the probability of being in the bottom income decile can be explained by differences in occupational distribution
PART II: LONG TERM INTEGRATION: AN ANALYSIS OF THE LAST TWENTY YEARS
IMMIGRANT POPULATION: SIZE AND CHARACTERISTICS
BOTTOMLINE: The share of immigrants in the population increased everywhere in the last twenty years. Different growth rates led to a relative convergence of immigrant shares across countries. The importance of the EU15 as countries of origin decreased over time. The concentration of immigrants in working age segments of the population has increased over time. Immigrants’ educational distribution is more polarised than natives’, a feature that has increased over time especially in Germany, France and Sweden.
20% have lived in the country for five years or less. This number rises to more than 25% in Cyprus, Denmark, Ireland, Luxembourg and the UK and to 31% in Germany.
- More than half of the immigrants in EU countries are European. EU mobile citizens account for 38% of the foreign-born population in the EU. An additional 16% was born in a European country outside of the EU. Africa and the Middle East account for 19% of all immigrants, with an additional 16% coming from Asia and 11% from the Americas or Oceania.
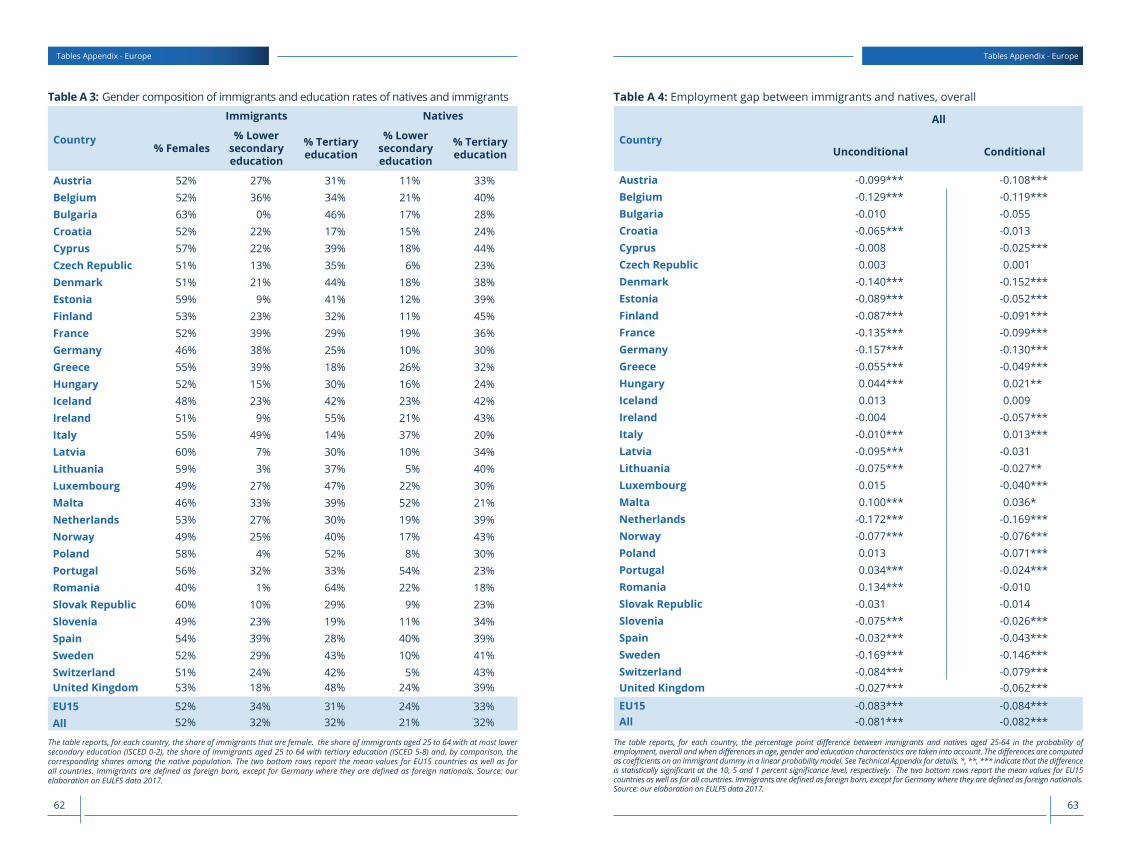
- The gender composition is on average quite balanced, with only a slight majority of women (52%).
- At the EU level, about one third of immigrants have tertiary education, one third at most upper secondary, and the remaining third has at most completed lower secondary education.
- There are significant differences in immigrants’ education across member states, which broadly reflect the educational level of natives: countries with higher shares of university-educated natives also have higher fractions of immigrants with tertiary education. Among the countries with a large share of immigrants, Denmark, Ireland, Norway, Sweden, Switzerland and the UK all have more than 38% of university-educated natives and immigrants. On the contrary, Italy has the lowest share of university-educated natives and immigrants (20 and 14% respectively).
EMPLOYMENT
BOTTOMLINE: Immigrants have lower employment probability than natives, especially in Central and Northern Europe. The UK, Italy and Ireland are among the countries with the smallest immigrant-native gap. Differently from previous editions of this report, these gaps are not due to differences in age-gender-education profiles.
- On average across Europe, immigrants are 8.1 percentage points less likely to be employed than natives, which marks a decline in employment probability with respect to 2016.
- Employment gaps relative to natives are especially large in Northern and Central European countries such as the Netherlands (-17.2 p.p.), Sweden (-16.9 p.p.), Germany (-15.7 p.p.) or France (-13.5 p.p.) and smaller in the UK (-2.7 p.p.), Italy (-1 p.p.) and Ireland (-0.4 p.p.).
- Differences in employment probabilities cannot in general be explained by a different
1110
EMPLOYMENT
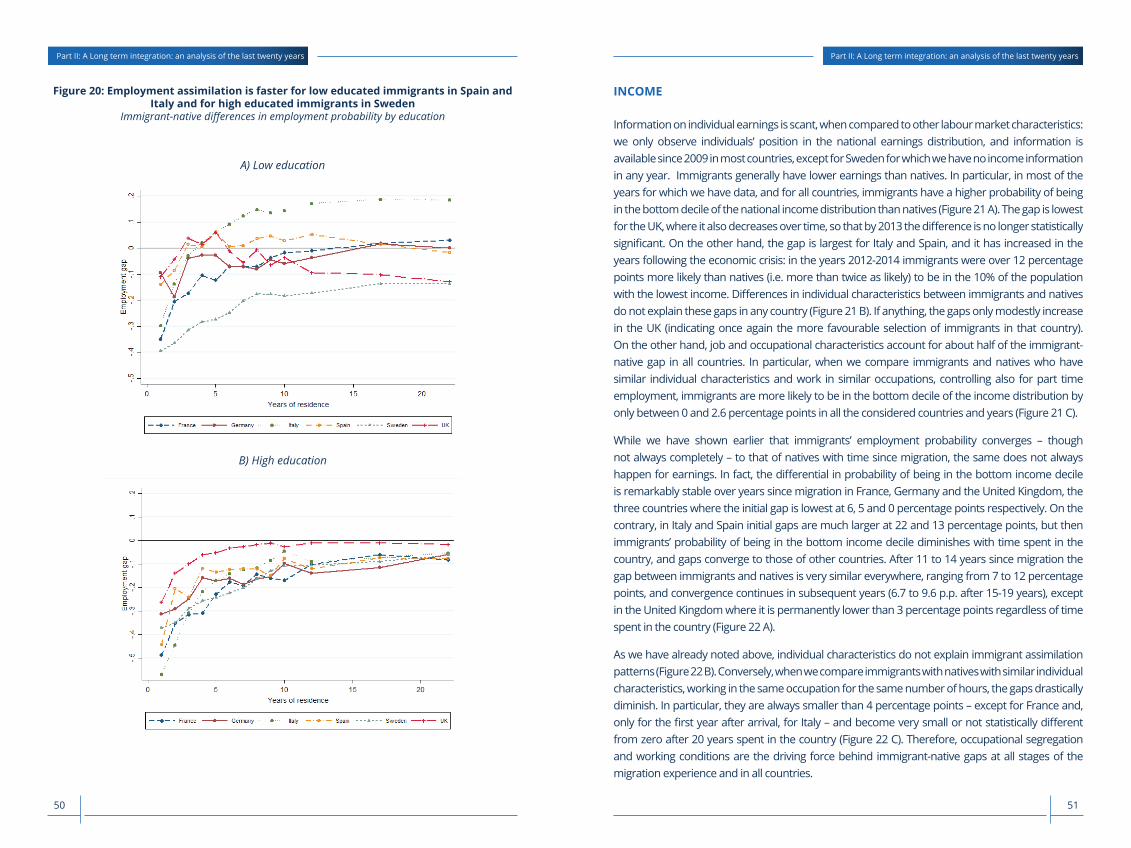
BOTTOMLINE: Employment probability gaps tend to close with time spent in the host country but they persist everywhere except for Italy. In most countries low educated immigrants have faster and more complete employment assimilation relative to similarly educated natives, except for Sweden and the UK.
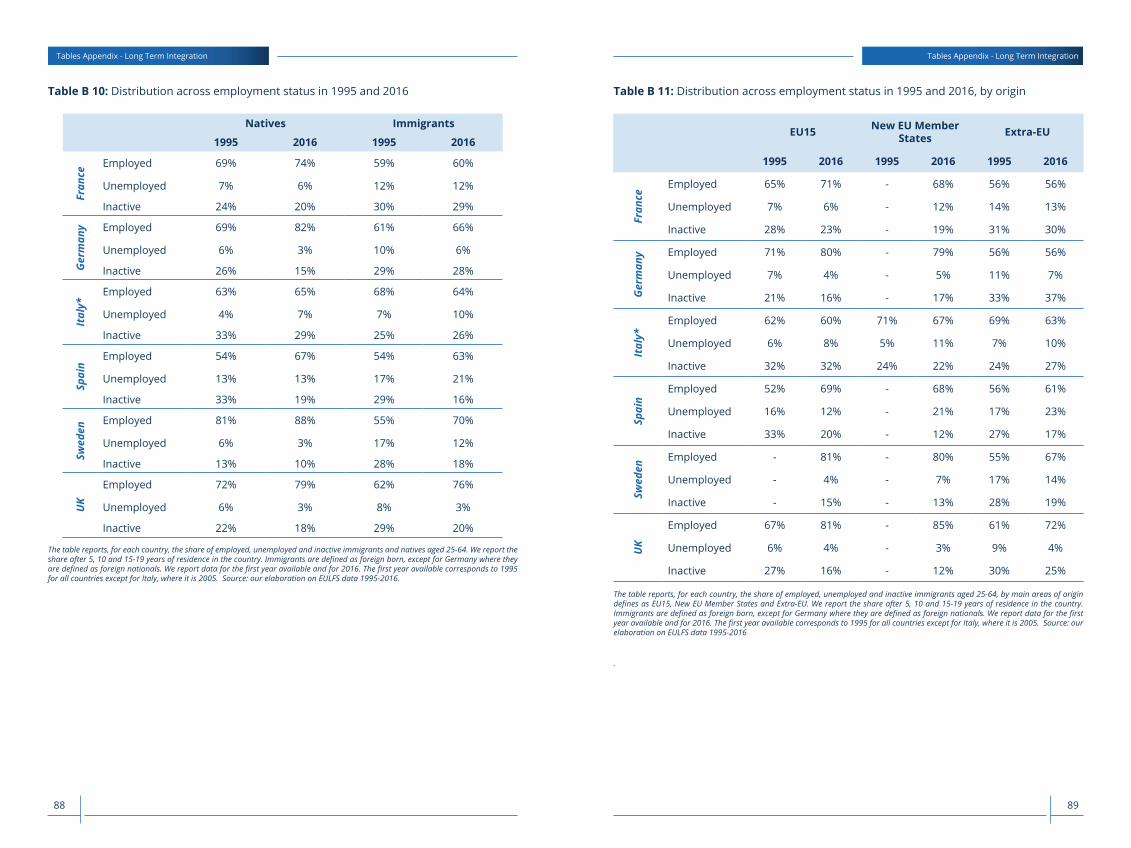
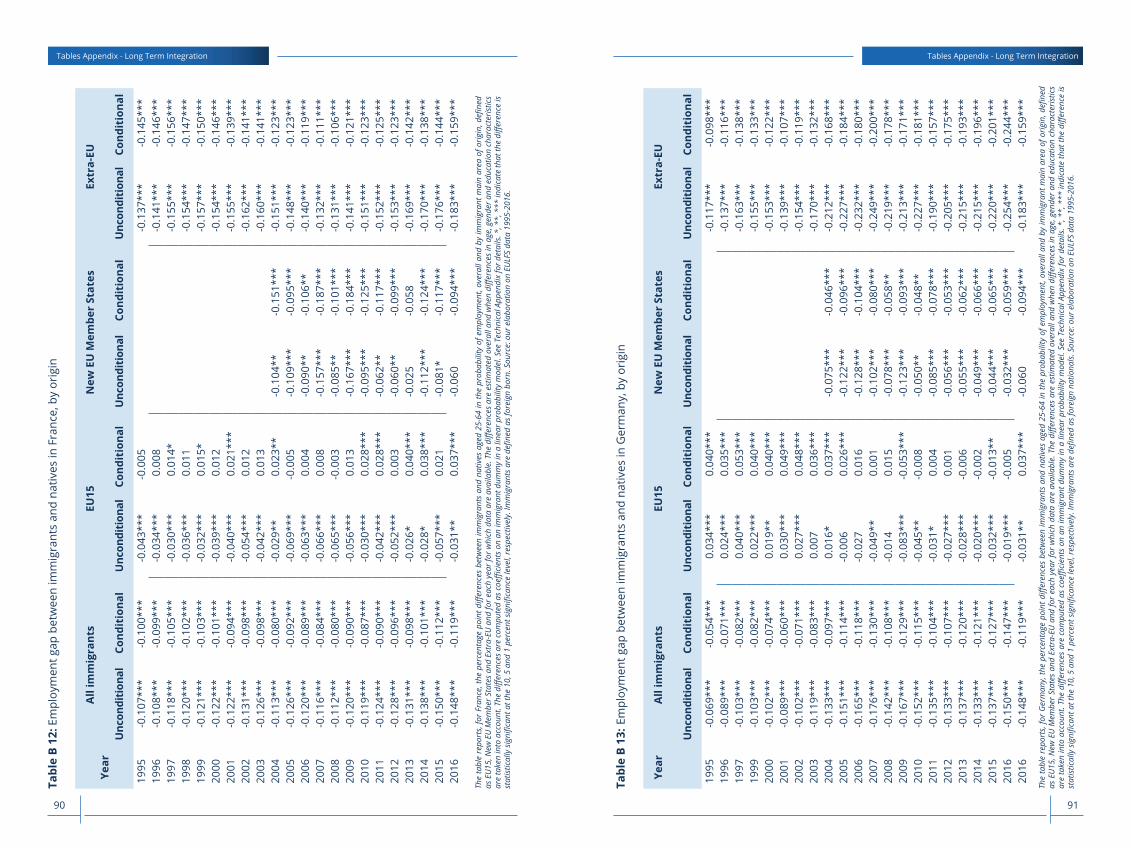
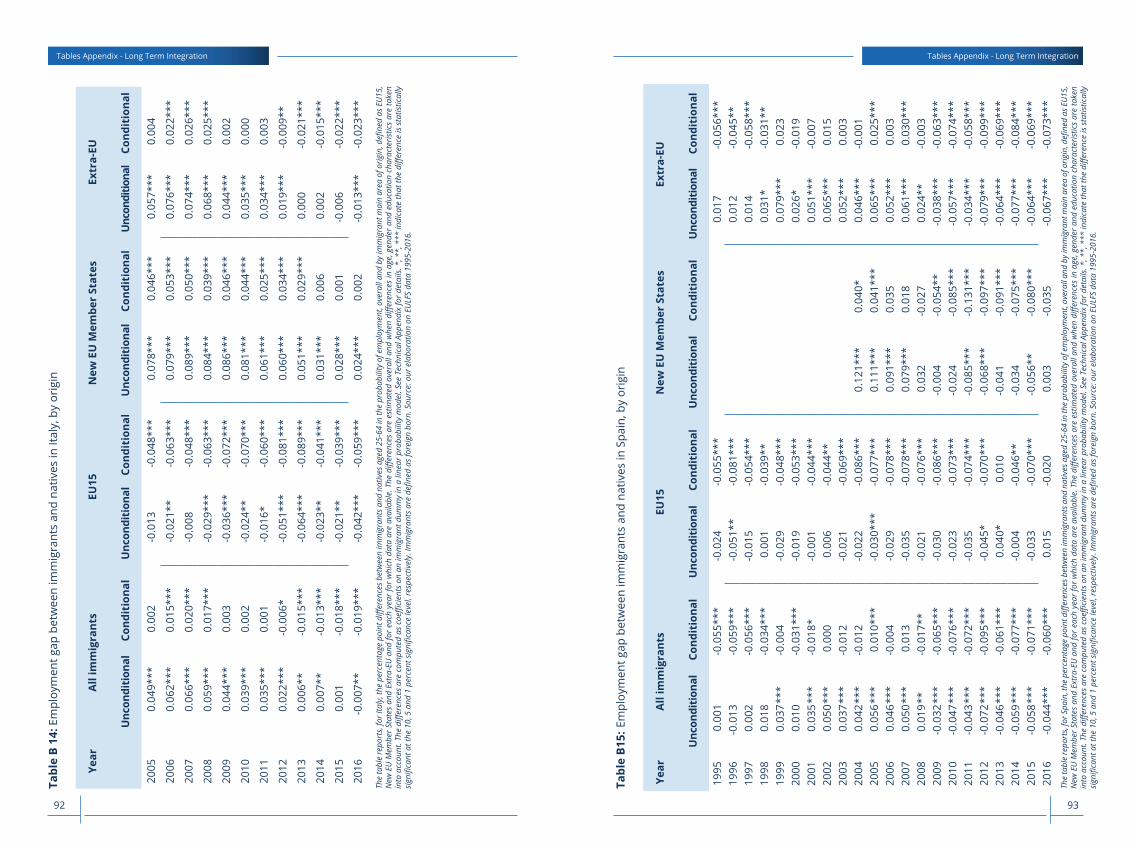
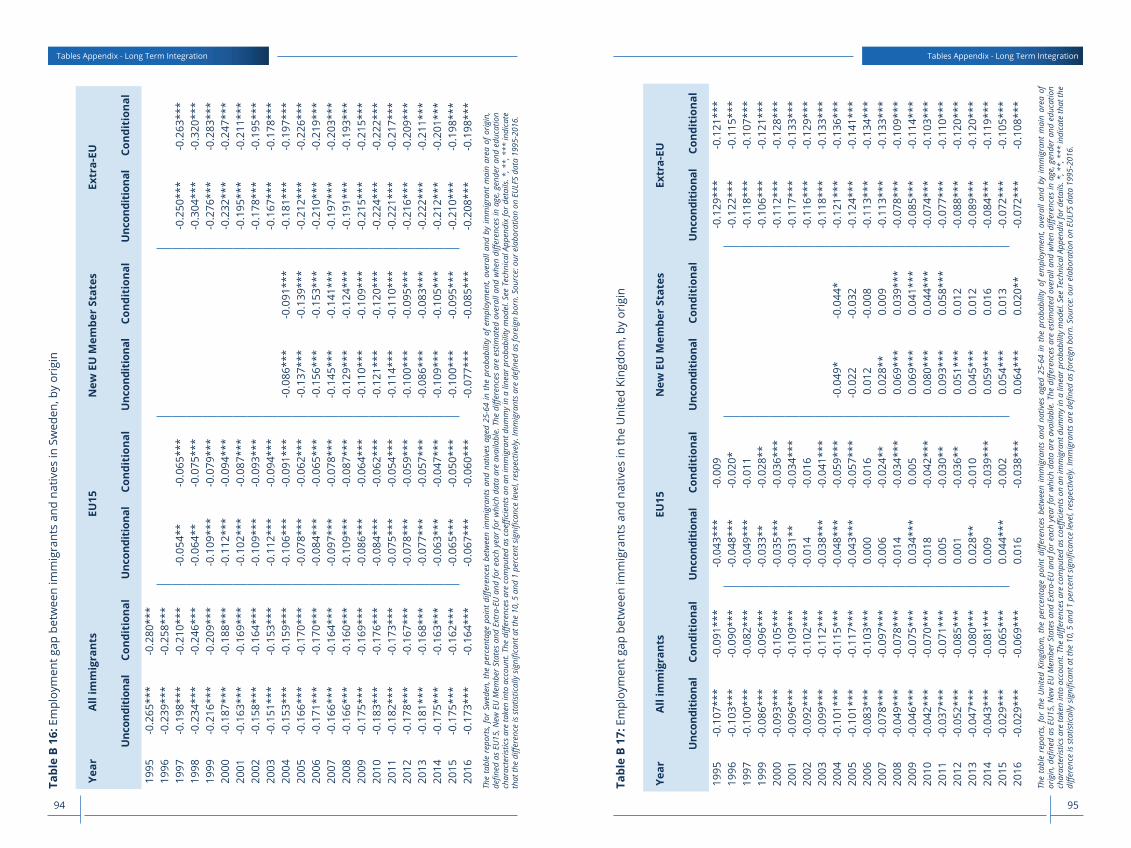
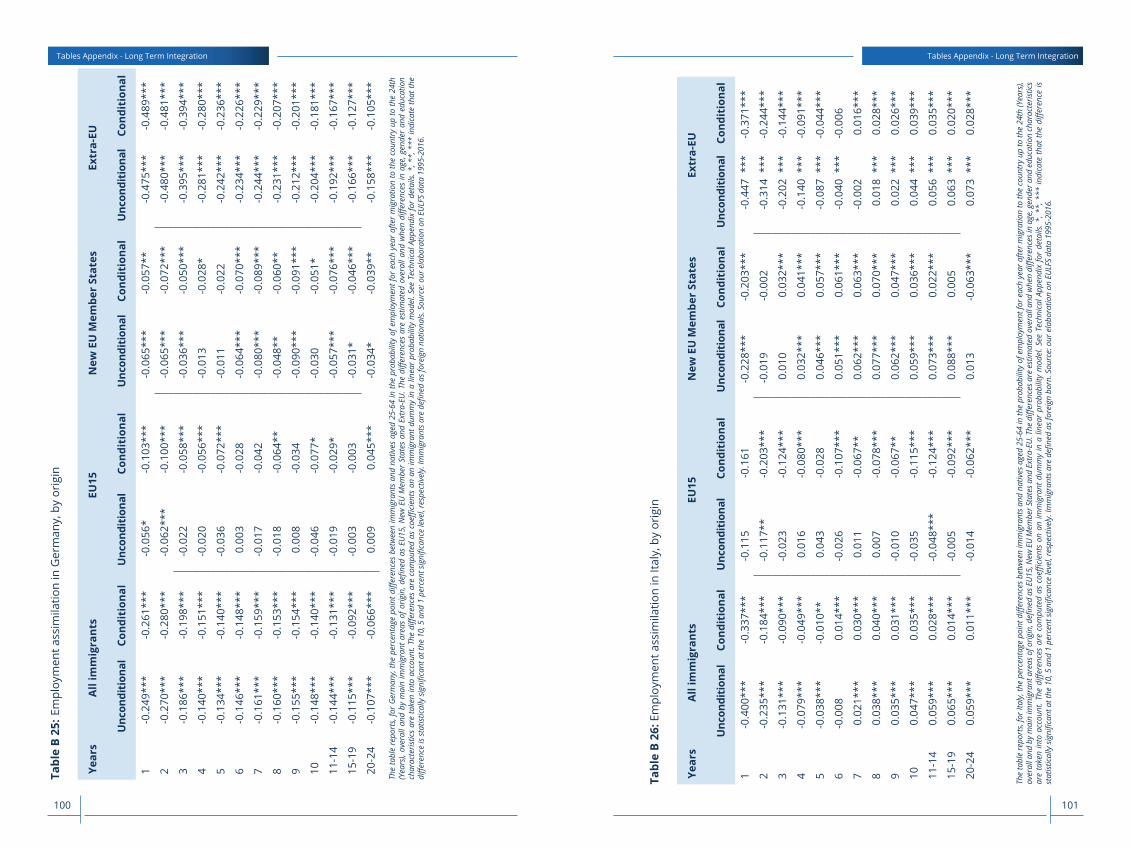
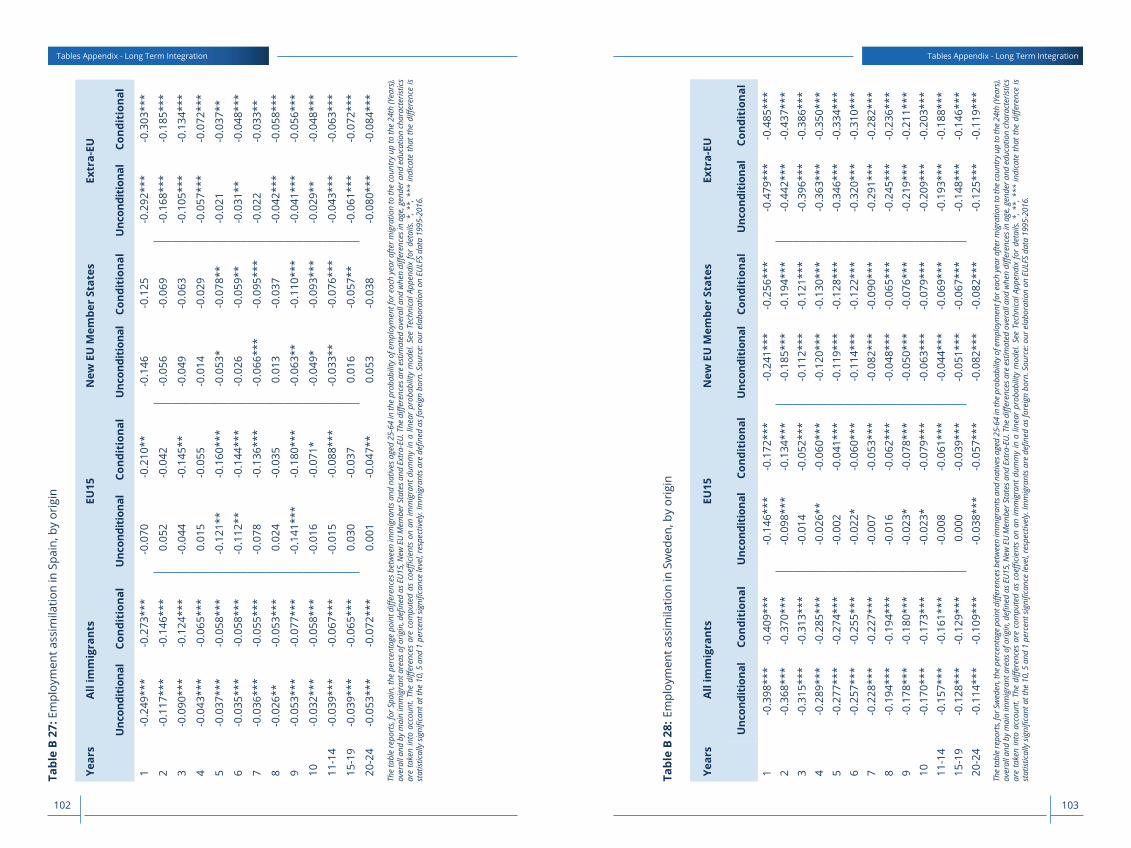
- Over the last 20 years, immigrant-native employment gaps increased in Spain and Italy, remained stable in France and Germany, and decreased in Sweden and the UK. Differences in demographic characteristics do not explain these gaps.
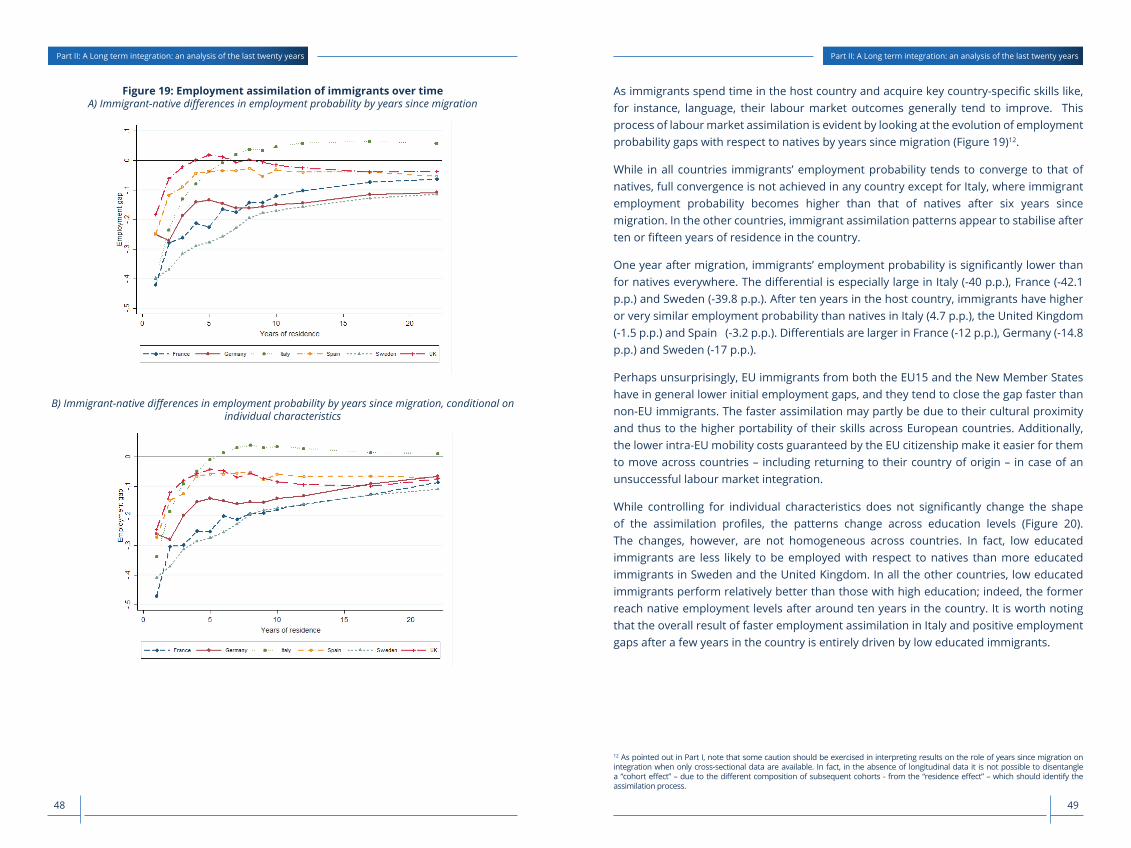
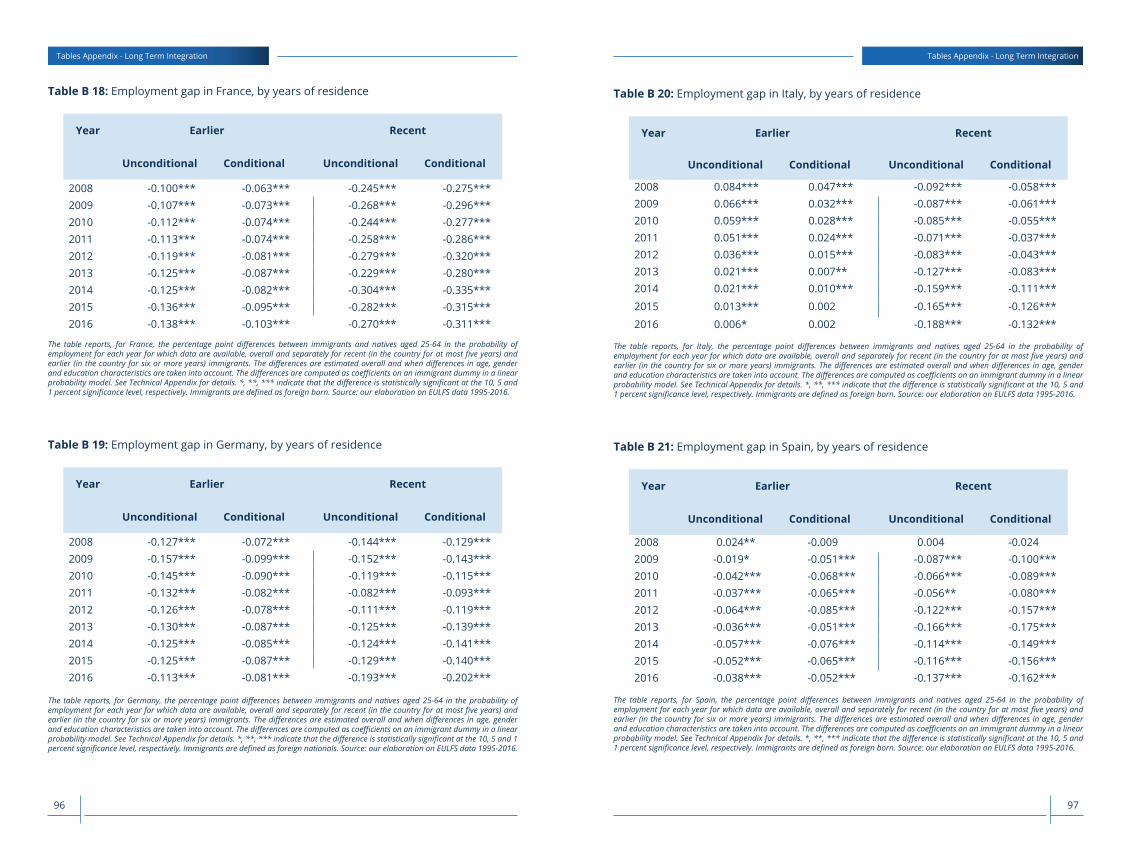
- Employment probability gaps shrink with time in the host country. Full convergence is not achieved in any country except for Italy, where it happens after six years.
- One year after migration, the immigrant-native differential is especially large in Italy (-40 p.p.), France (-42.1 p.p.) and Sweden (-39.8 p.p.). After ten years in the country, immigrants have higher or very similar employment probability than natives in Italy (4.7 p.p.), the United Kingdom (-1.5 p.p.) and Spain (-3.2 p.p.). Differentials are larger in France (-12 p.p.), Germany (-14.8 p.p.) and Sweden (-17 p.p.).
- Employment assimilation profiles do not change significantly if we compare immigrants and natives with similar individual characteristics.
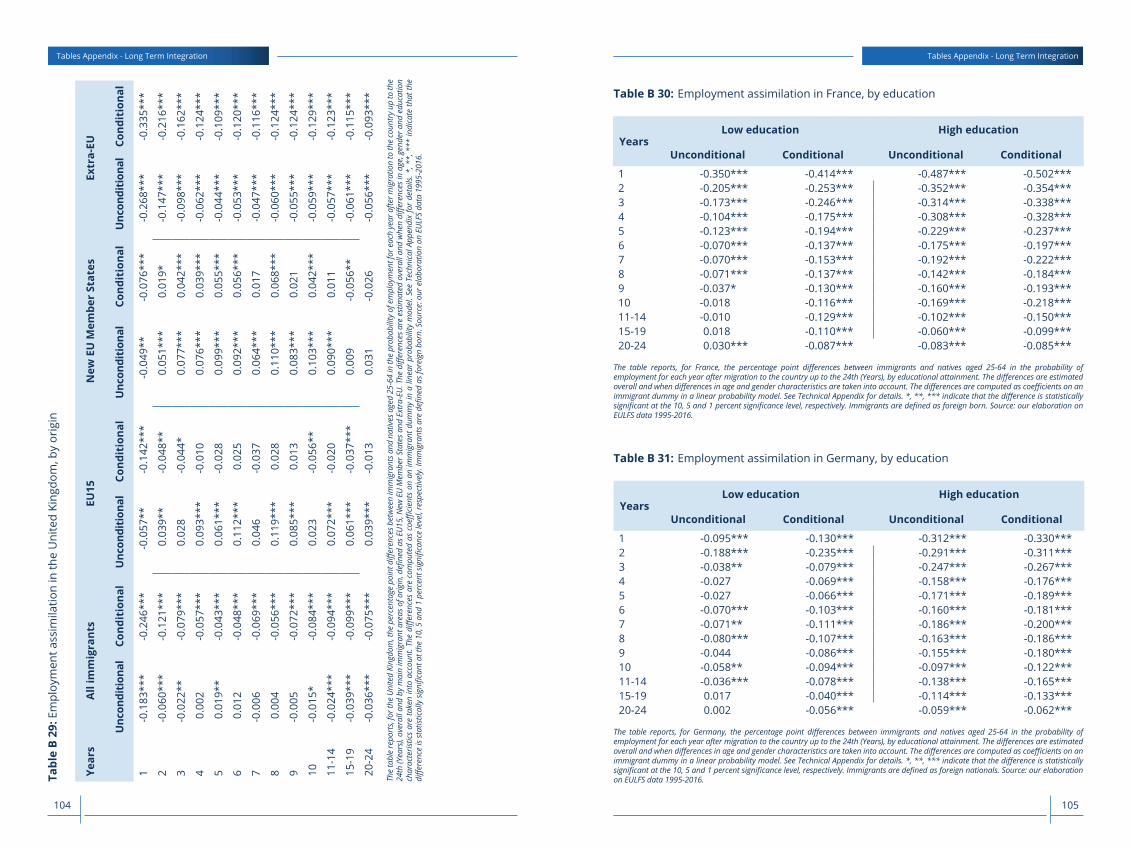
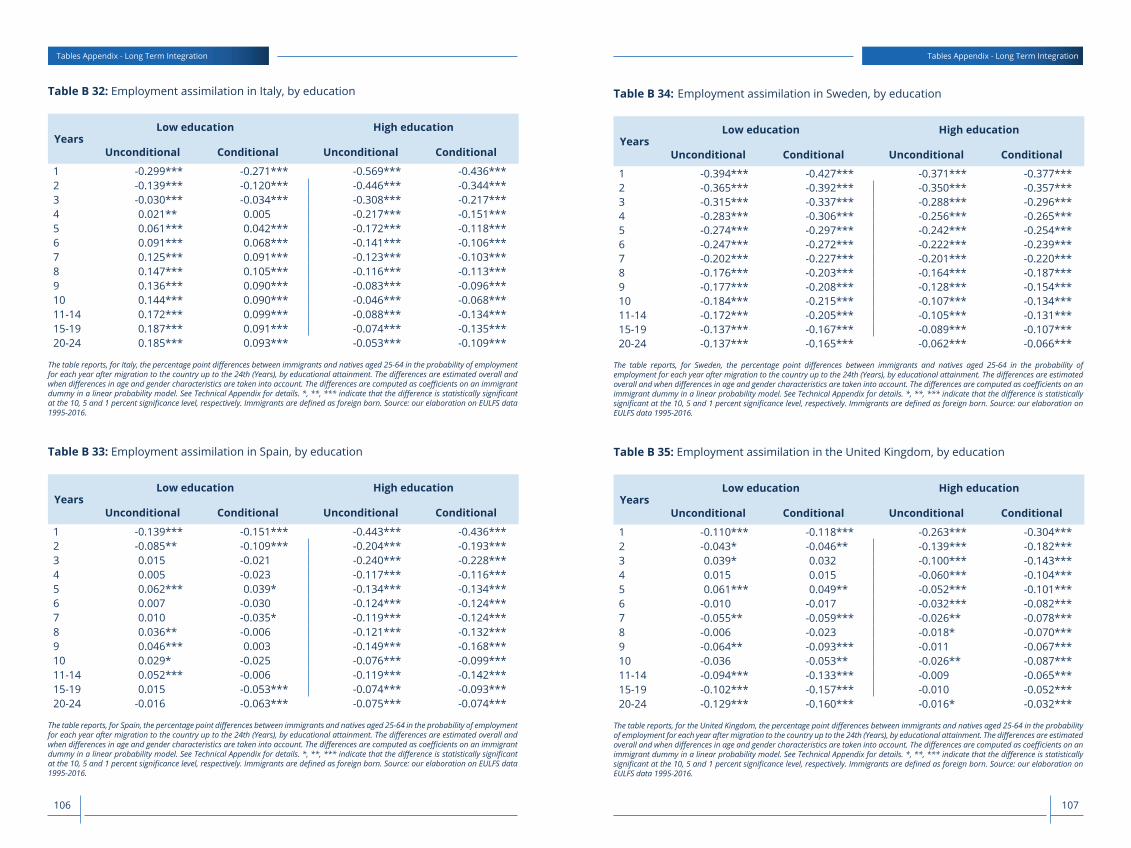
- Employment probability gaps for low educated immigrants relative to similarly educated natives are smaller than for those with high education in Sweden and the United Kingdom. In all the other countries, low educated immigrants relative perform better, in relative terms, than high educated ones.
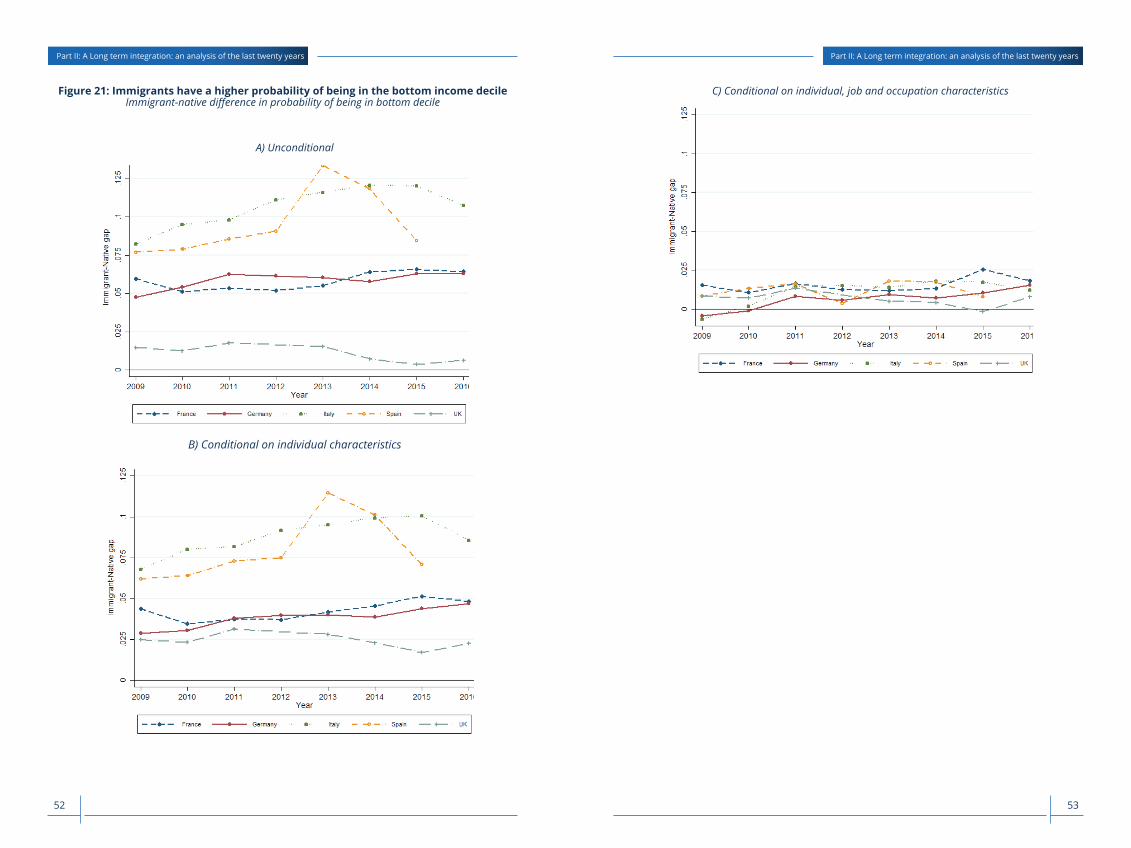
INCOME
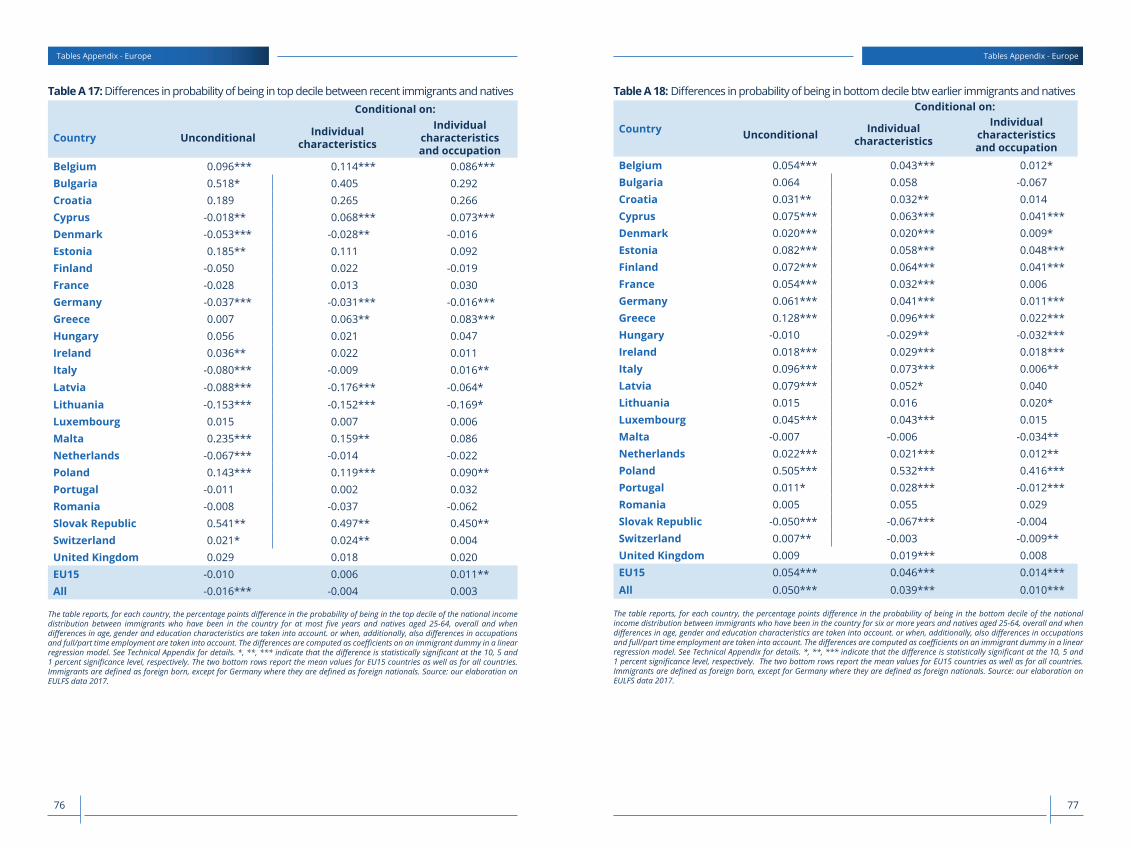
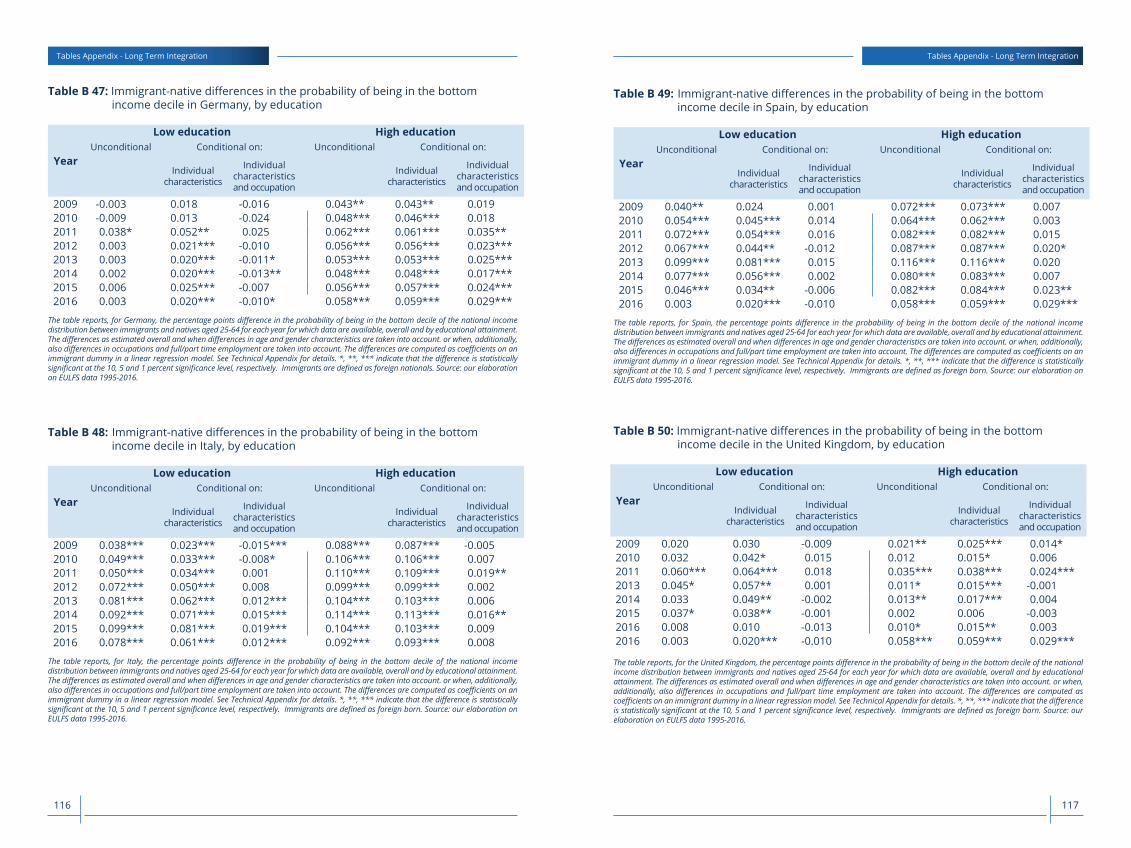
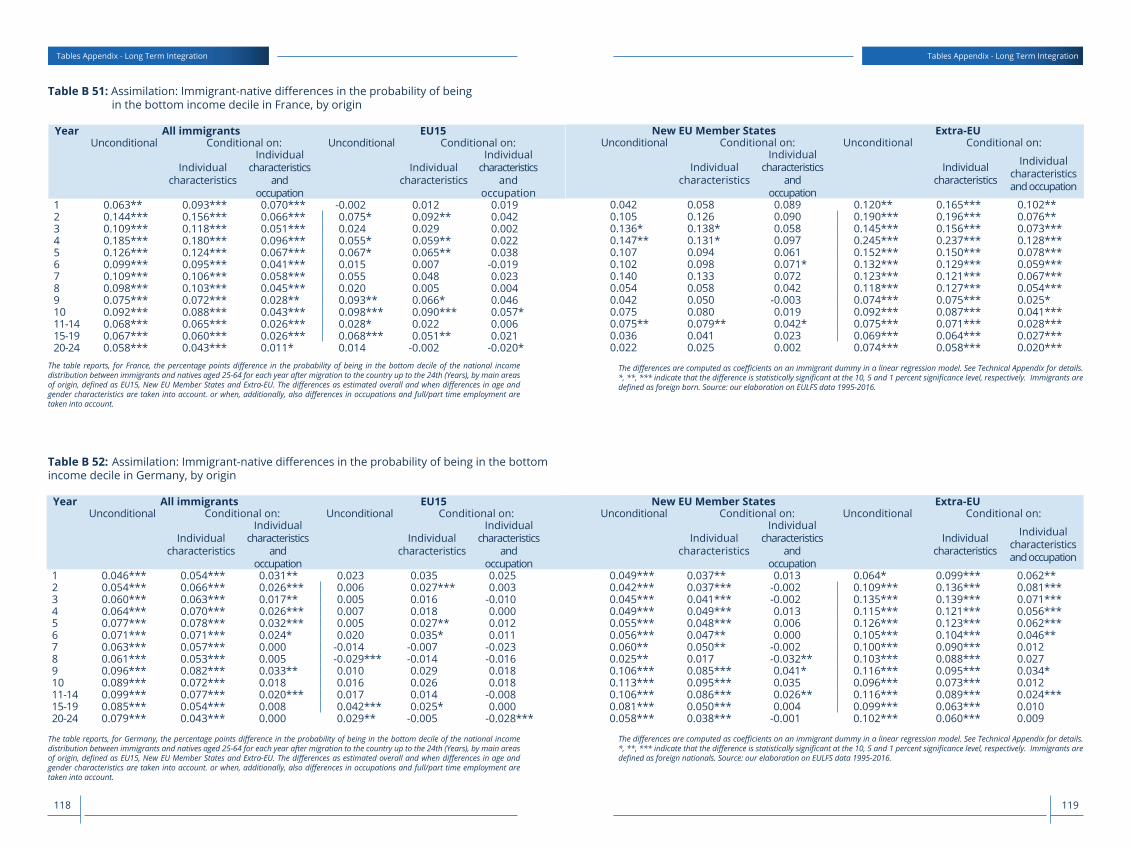
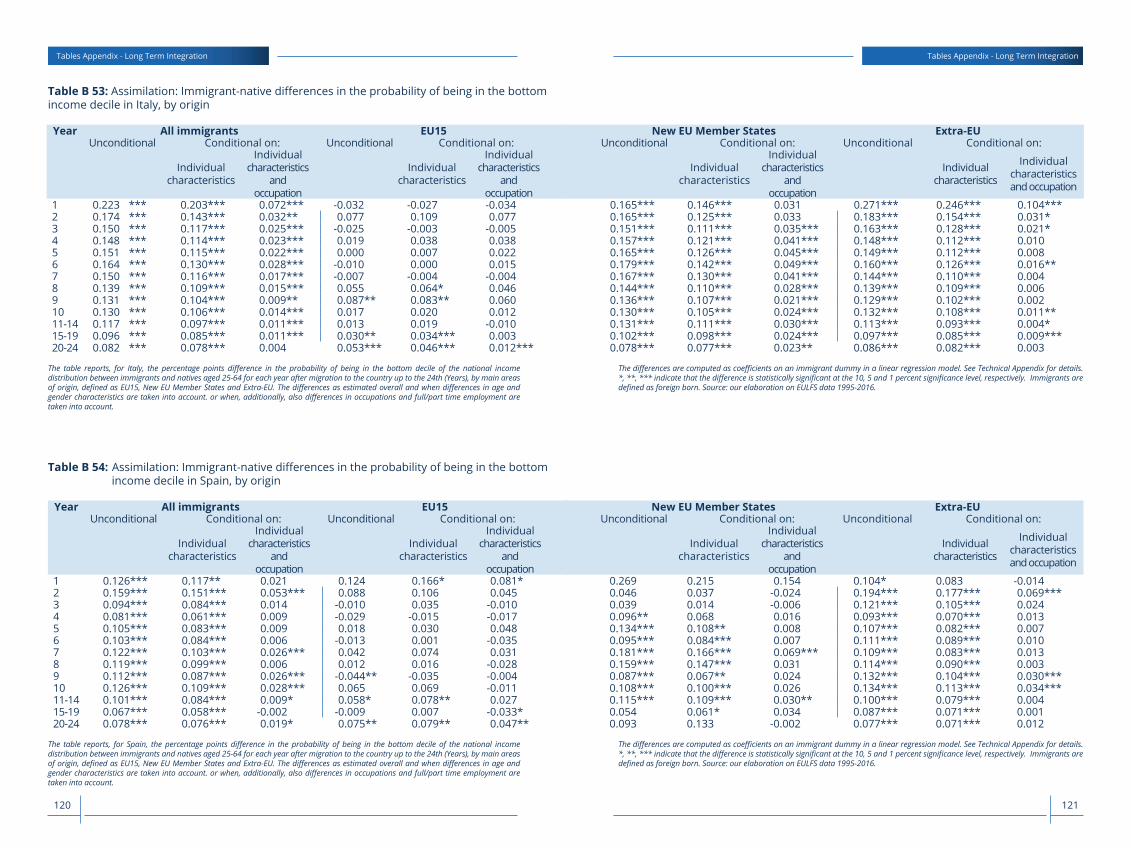
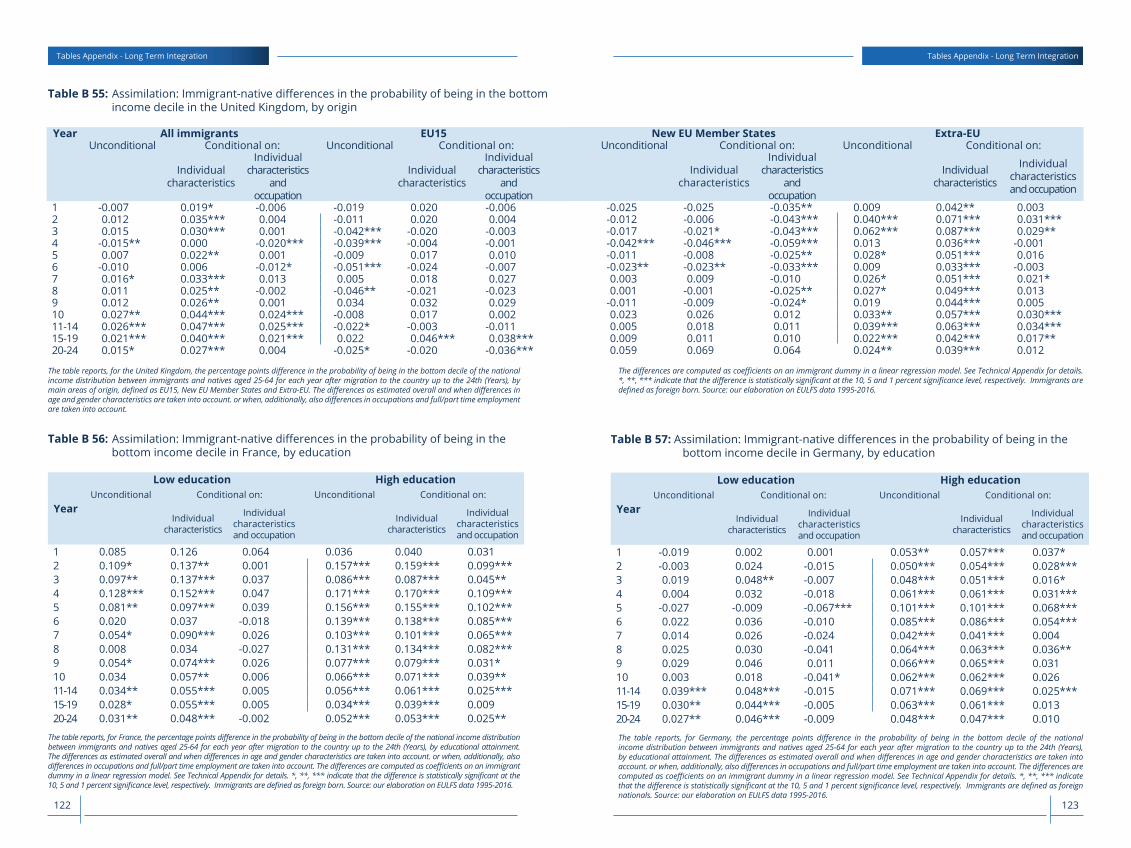
BOTTOMLINE: Immigrants’ higher likelihood of being in the bottom earnings decile does not fully disappear with time spent in the host country.
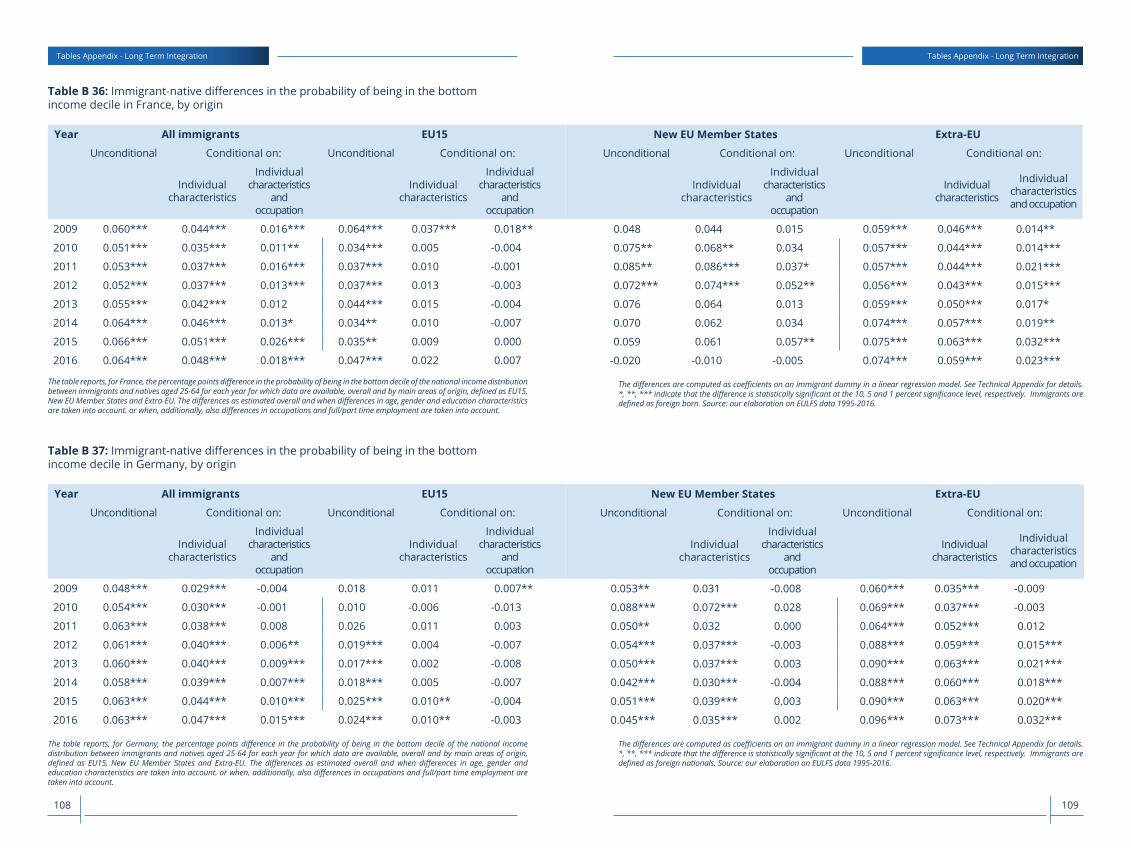
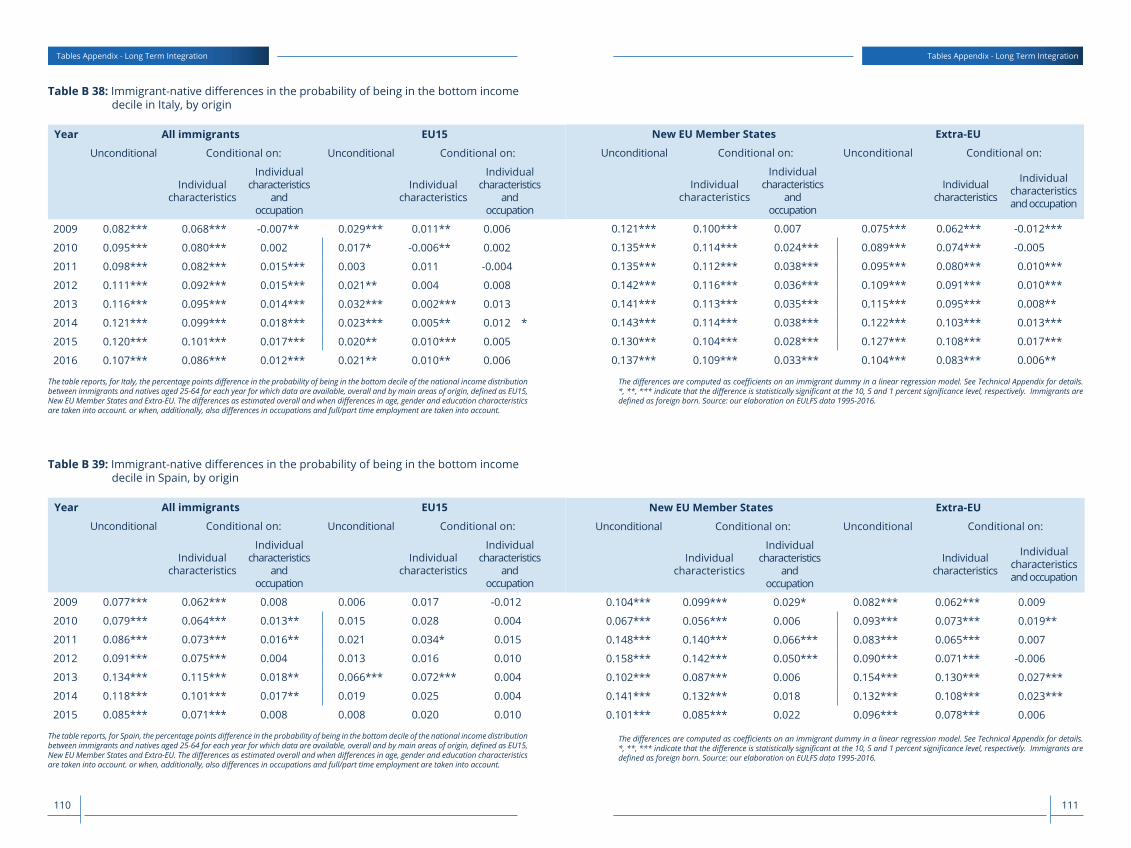
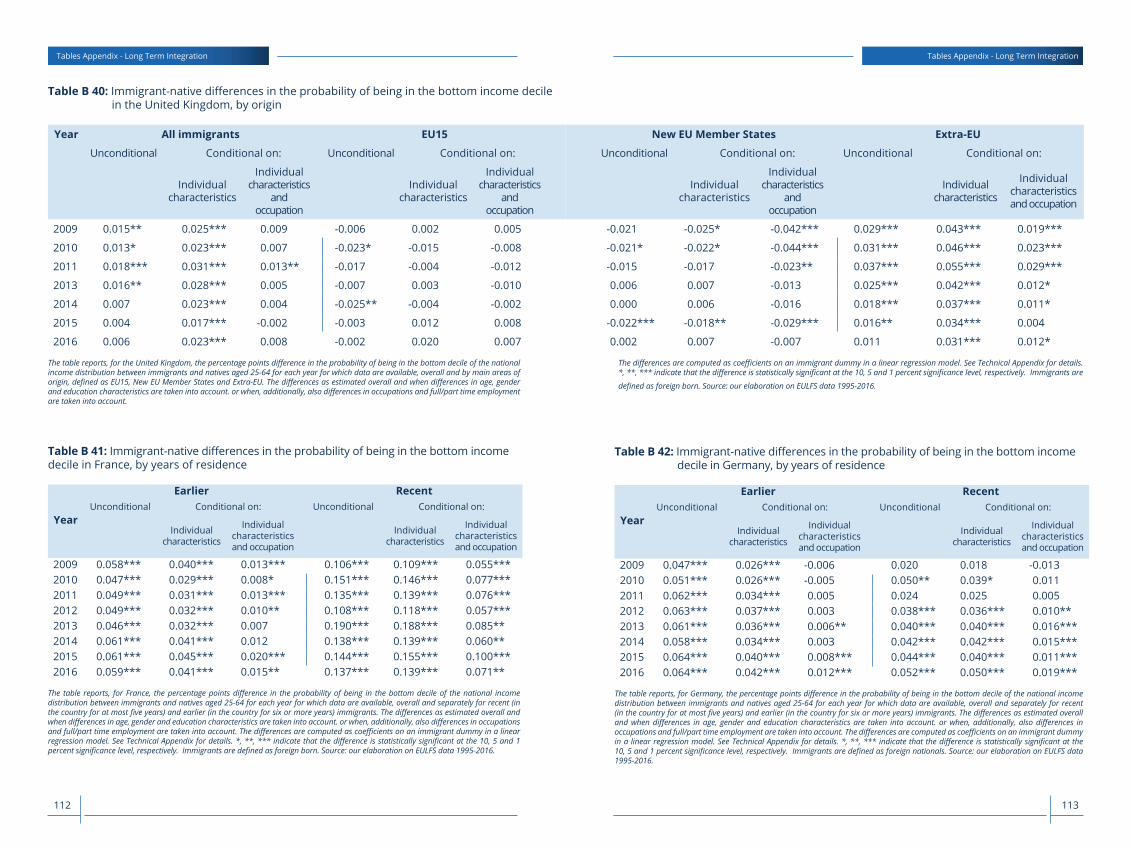
- Immigrants are more likely to be in the bottom decile of the income distribution in all years and countries, except in the United Kingdom after 2013.
- This feature is more pronounced in Italy and Spain, where immigrants are between 7.7 and 13.4 percentage points more likely to be in the 10% of the population with lowest income.
- Job and occupational characteristics account for about half of such difference in all years.
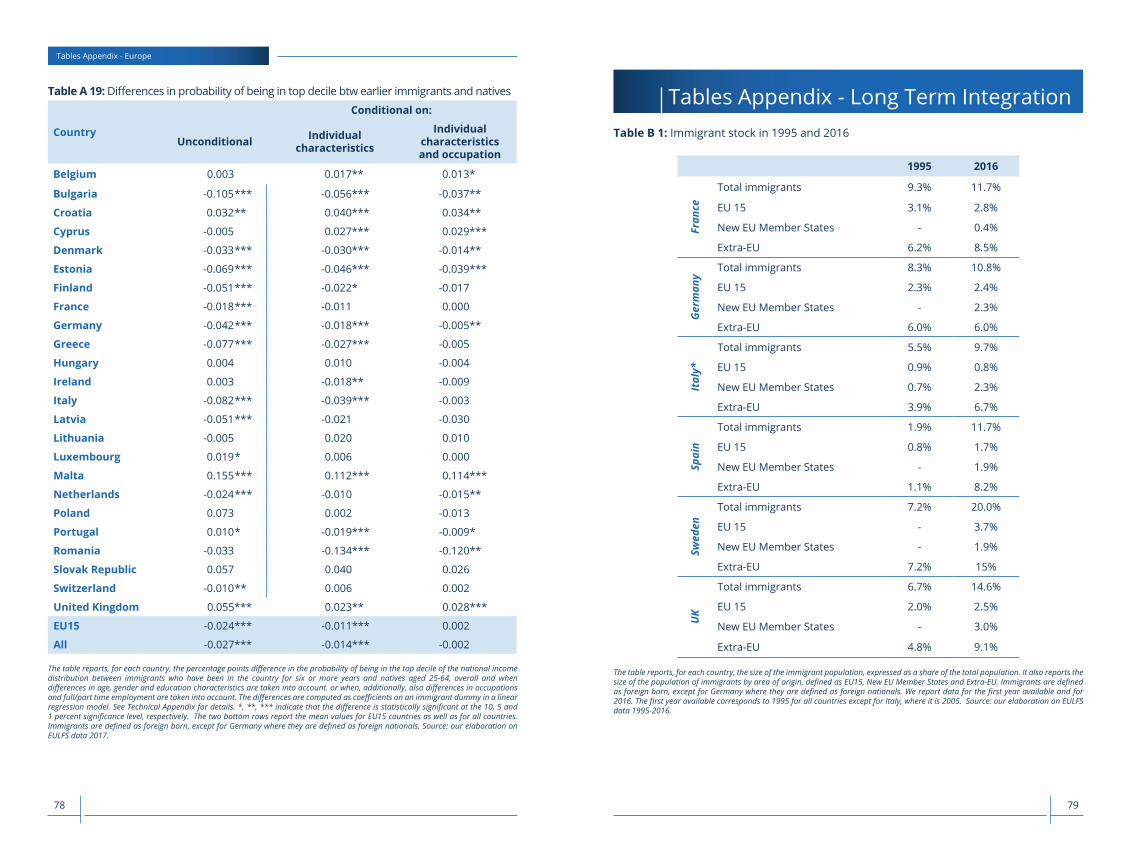
- Between 1995 and 2016, the number of immigrants has increased in all the main migration countries in the EU. In 2016, the countries with the largest share of immigrant population were the United Kingdom and Sweden with 14.6 and 20% of foreign-born population respectively.
- In 1995, around one third of immigrants were from Western EU countries. This share decreased over time and by 2016 at most one in four immigrants were from EU15 countries, while the majority came from outside the EU. In 2016, the highest shares of immigrants from the New EU Member States are in Germany (22%), Italy (23%) and the United Kingdom (21%).
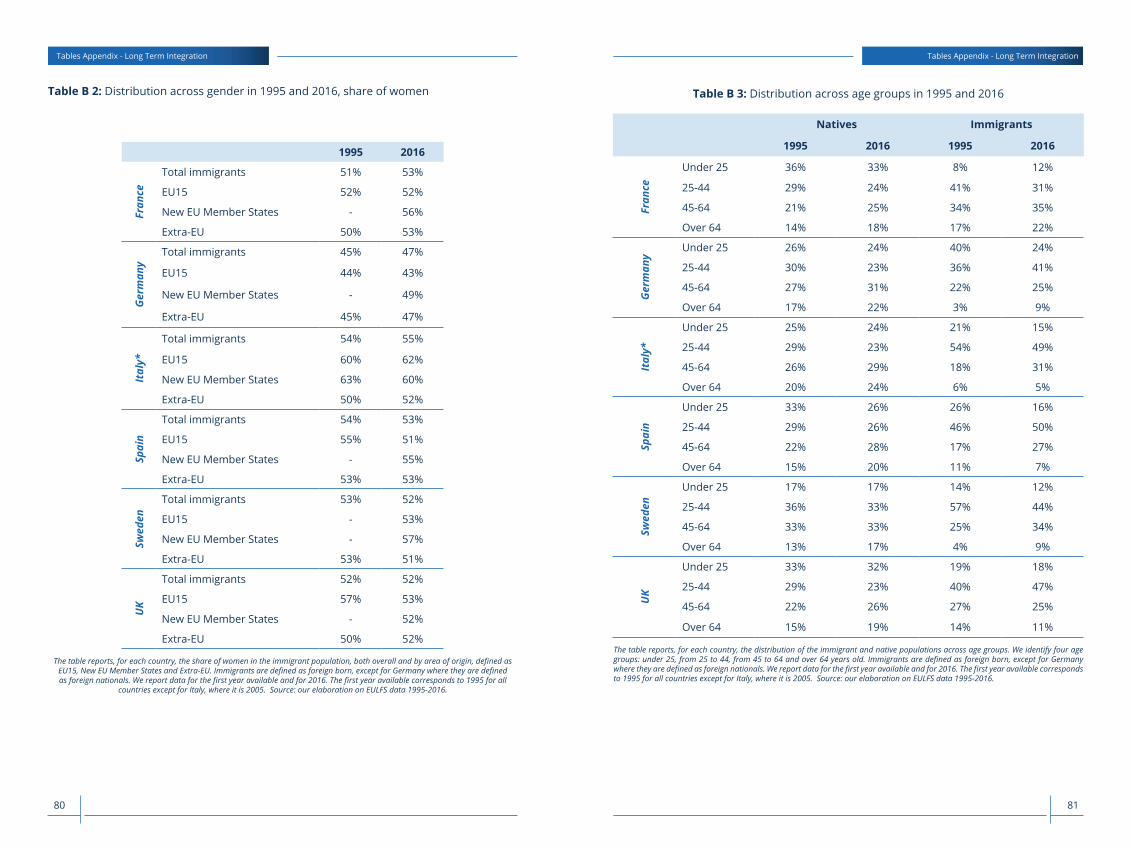
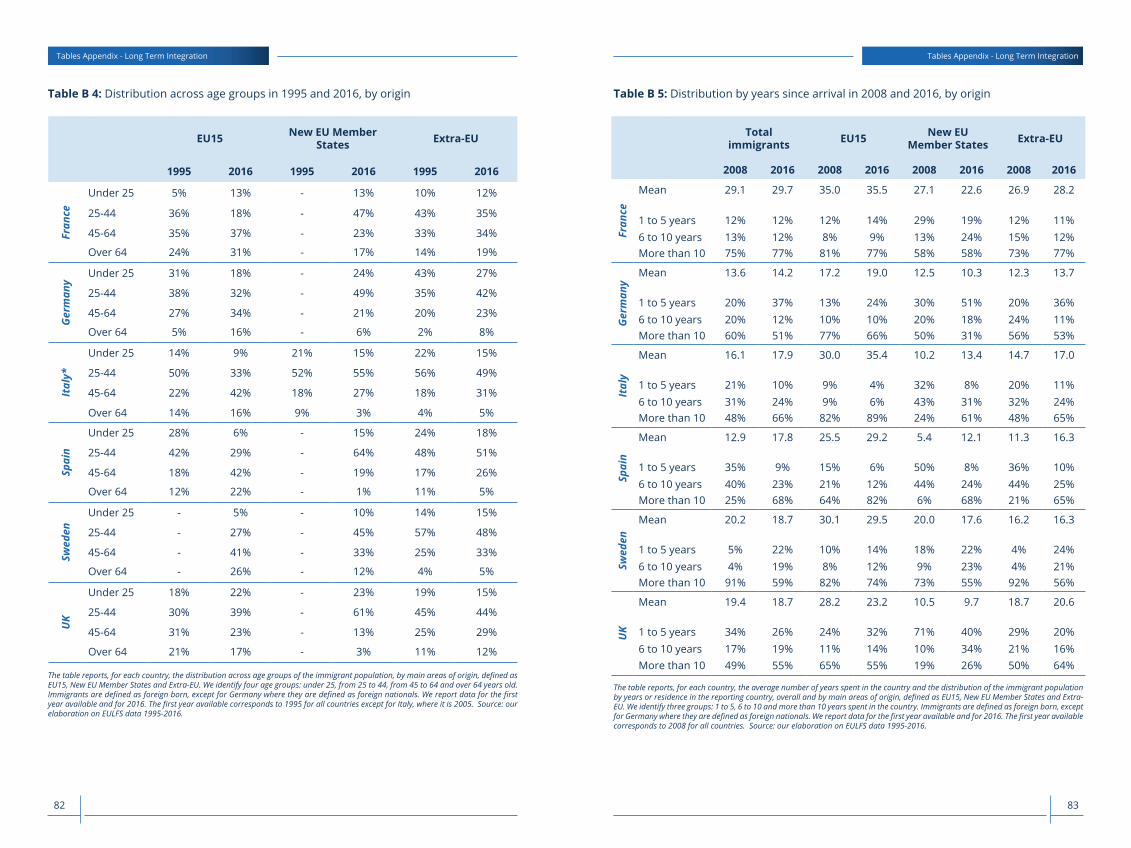
- Migration is balanced across gender. With respect to age, immigrants are concentrated in the young and working age groups of the population and this fact has become more pronounced over time.
- In the last 20 years migration seniority increased everywhere except for Germany and Sweden, where the share of immigrants residing in the country for more than 10 years declined between 1995 and 2016. The highest increases in immigrant seniority happened in Italy and especially in Spain, where the share of immigrants residing in the country for more than 10 years increased from 25 to 68%.
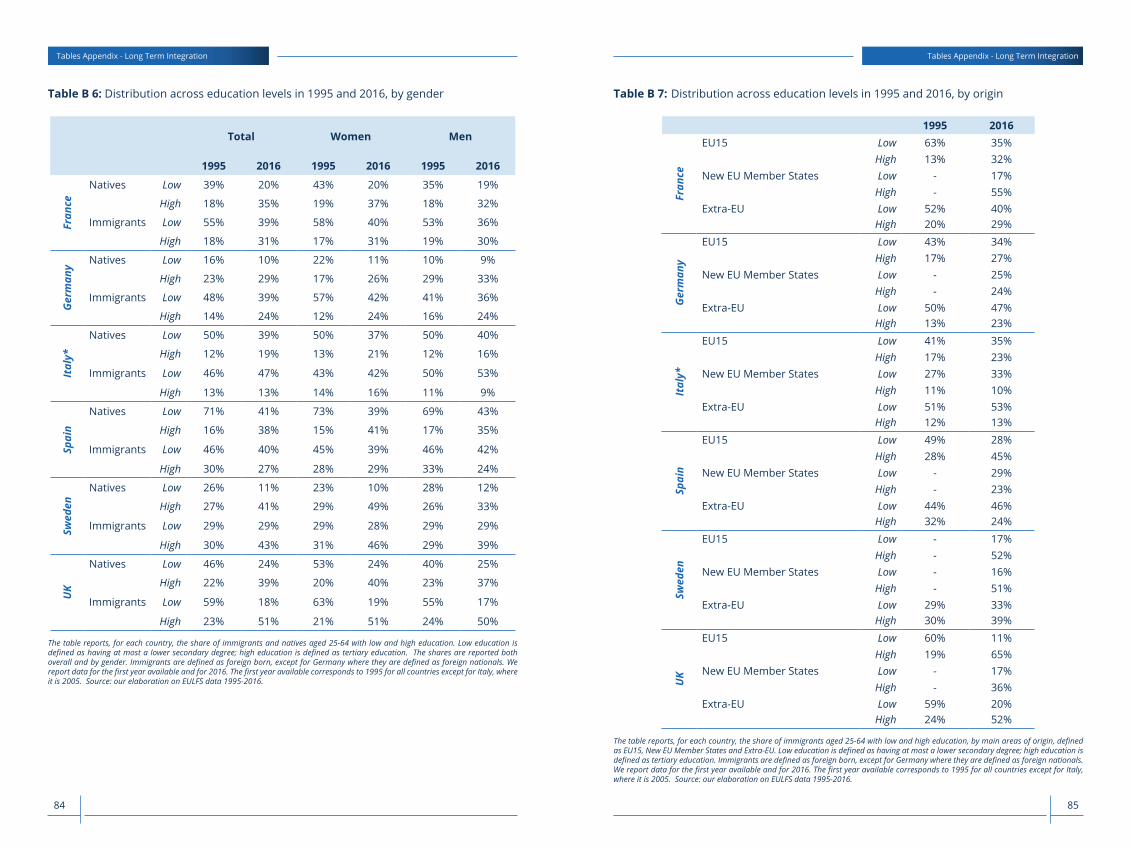
- The share of high educated immigrants reflects that of natives in all the countries and years considered. However, immigrants present a more polarised distribution across education levels with higher shares of low educated compared to natives. This feature has become more pronounced over the last 20 years, especially in Germany, France and Sweden.
NATURALISATION AND MARRIAGE
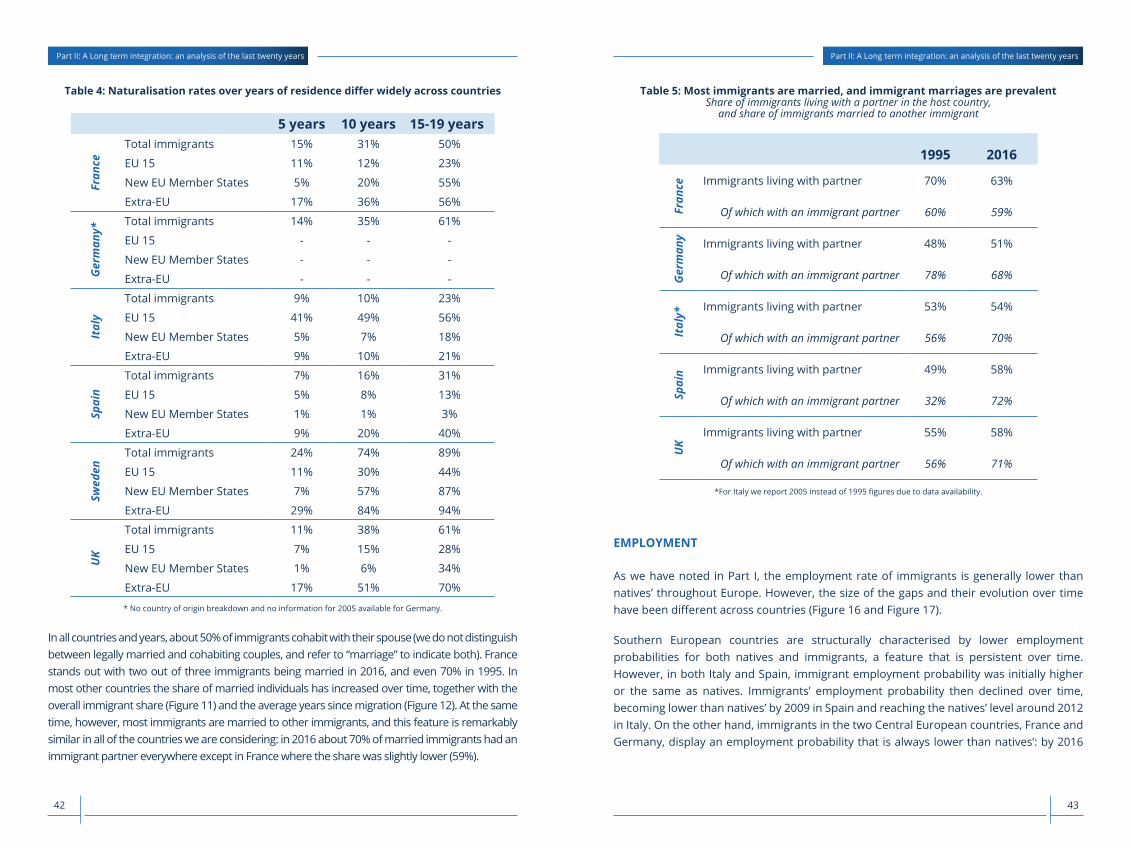
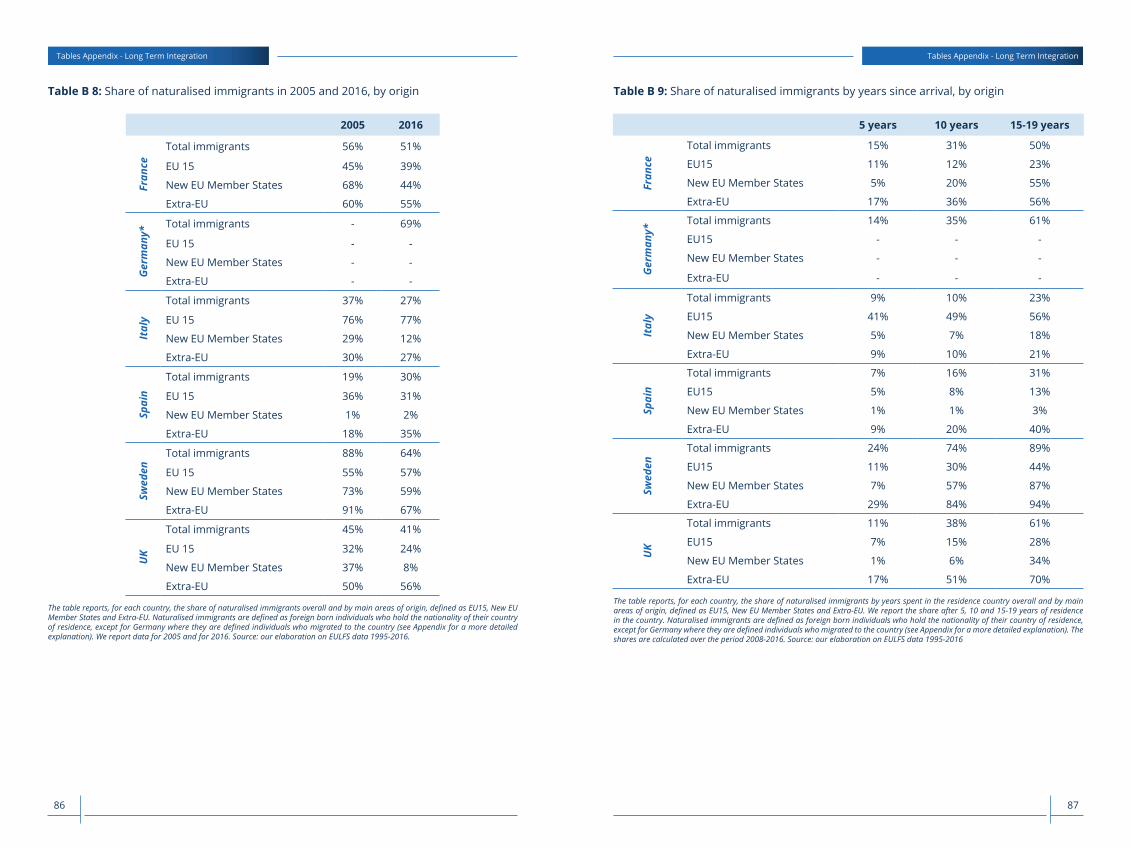
- Naturalisation rates differ widely across countries, reflecting also differences in citizenship acquisition policies. Naturalisation is the slowest in Italy and Spain, with respectively 10 and 16% of naturalised immigrants after 10 years of residence in the country. Conversely, Sweden is the country with the fastest naturalisation of foreign-born residents (74% after 10 years).
- About one in two immigrants cohabits with their spouse. In 2016, around 70% of spouses were immigrants.
Executive Summary Executive Summary
1312
Despite the decrease in the number of asylum applications in EU countries over the last couple of years, relative to the 2015-2016 peak, and the drop in irregular arrivals by sea on the Southern European shores, immigration is still seen as one of the main challenges facing the European Union by a large share of EU citizens. Indeed, while concerns about immigration may often be deliberately fed by unscrupulous politicians, it is true that immigration represents an important feature of our societies, and that its management and the smooth integration of the foreign communities in European countries should be a priority for European policymaking: one in ten residents of the European Union in 2017 is an immigrant, a share that is even higher in the Western European EU15 countries.
This third edition of the Migration Observatory annual report on immigrant integration analyses the economic integration of the foreign population across the European Union. The report is meant to provide a concise, easily accessible and up-to-date source of reference regarding the size, characteristics, and relative economic performance of immigrants in EU countries. For this reason, the text contains the minimum necessary amount of technicalities. Instead, we have prepared a Technical Appendix where we explain in detail all steps of the analysis, and a rich Tables Appendix with the complete set of results.
The report comprises of two parts. First, we present a snapshot of the economic integration of immigrants across EU countries in 2017. We analyse their employment probability, occupational distribution, and position in the national income distribution. For all outcomes, we first compare immigrants’ mean outcomes to the mean for native. This comparison allows answering the question “How does the average immigrant compare to the average native?”. Then, we compare immigrants to natives with similar characteristics, thus providing an answer to the question: “How do immigrants compare relative to natives with the same age-gender-education profile?”. Both questions are important and policy-relevant, but while answering the first requires only comparisons between means, addressing the second requires the use of regression techniques. Additionally, we analyse different dimensions of heterogeneity in the immigrant population, contrasting EU15 immigrants, nationals of New EU Member States, and non-EU nationals, as well as recent and earlier immigrants. In the second part of the report we take a longer-term perspective, and study the experience of six key EU countries – France, Germany, Italy, Spain, Sweden and the UK – in terms of immigrant integration over the last two decades (1995-2016). We show how the proportion of immigrants in the country population has converged
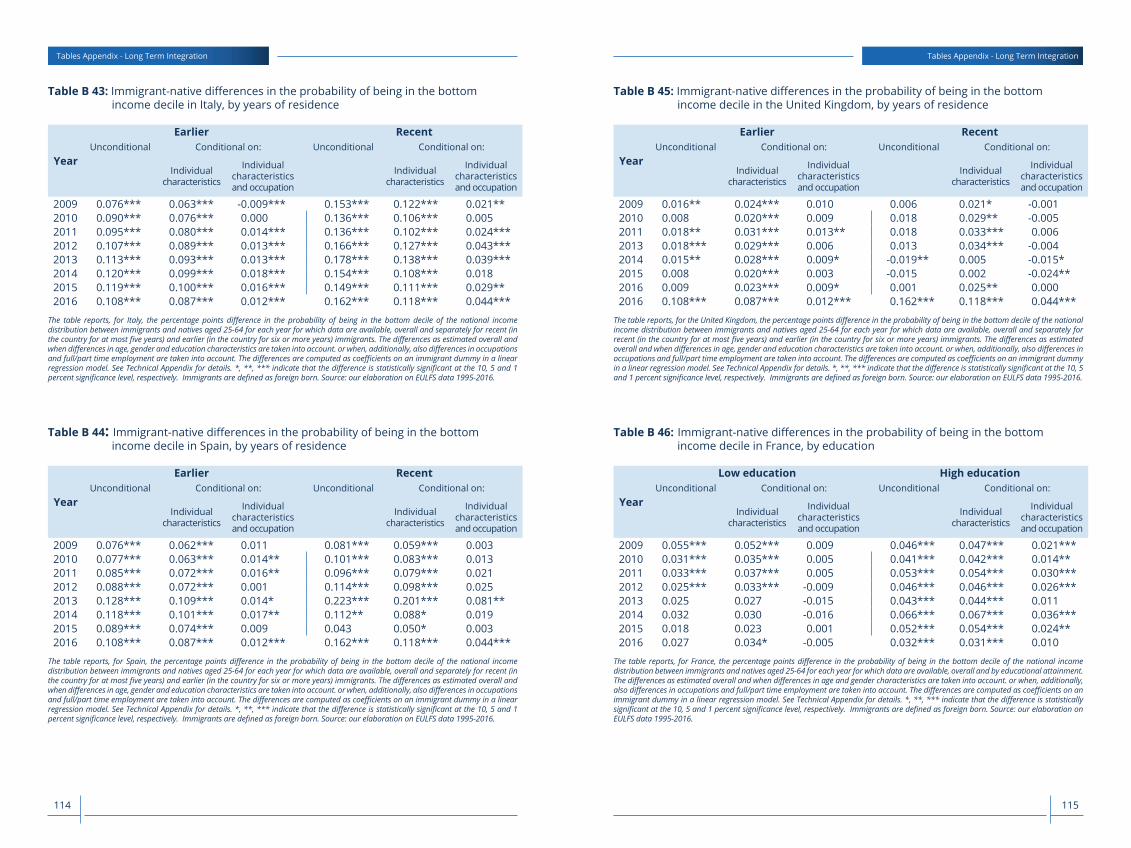
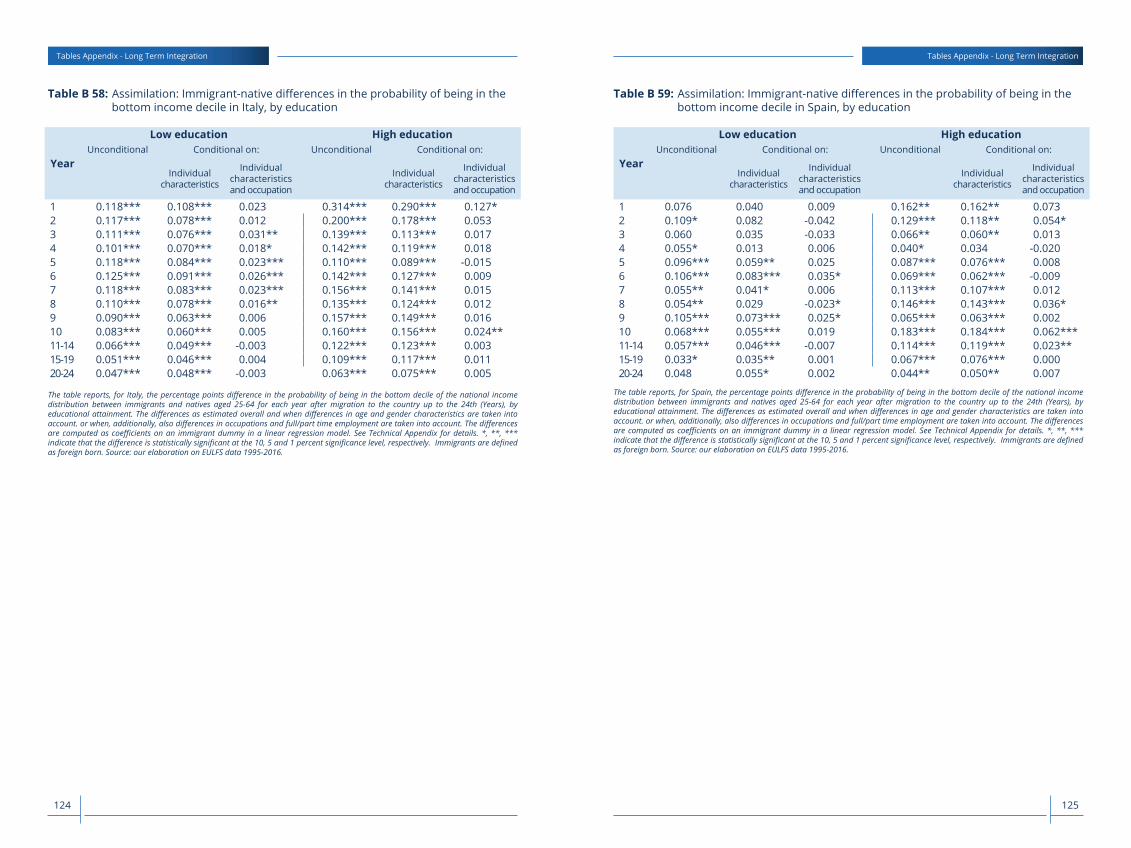
- Immigrants’ likelihood of being in the bottom income decile does not fully converge to that of natives anywhere.
- The gap is quite stable over time spent in the country in the United Kingdom, Germany and France, where the initial differential is also lower. On the contrary, in Italy and Spain, initial gaps are much larger but they decrease with time in the country converging to those of the other countries.
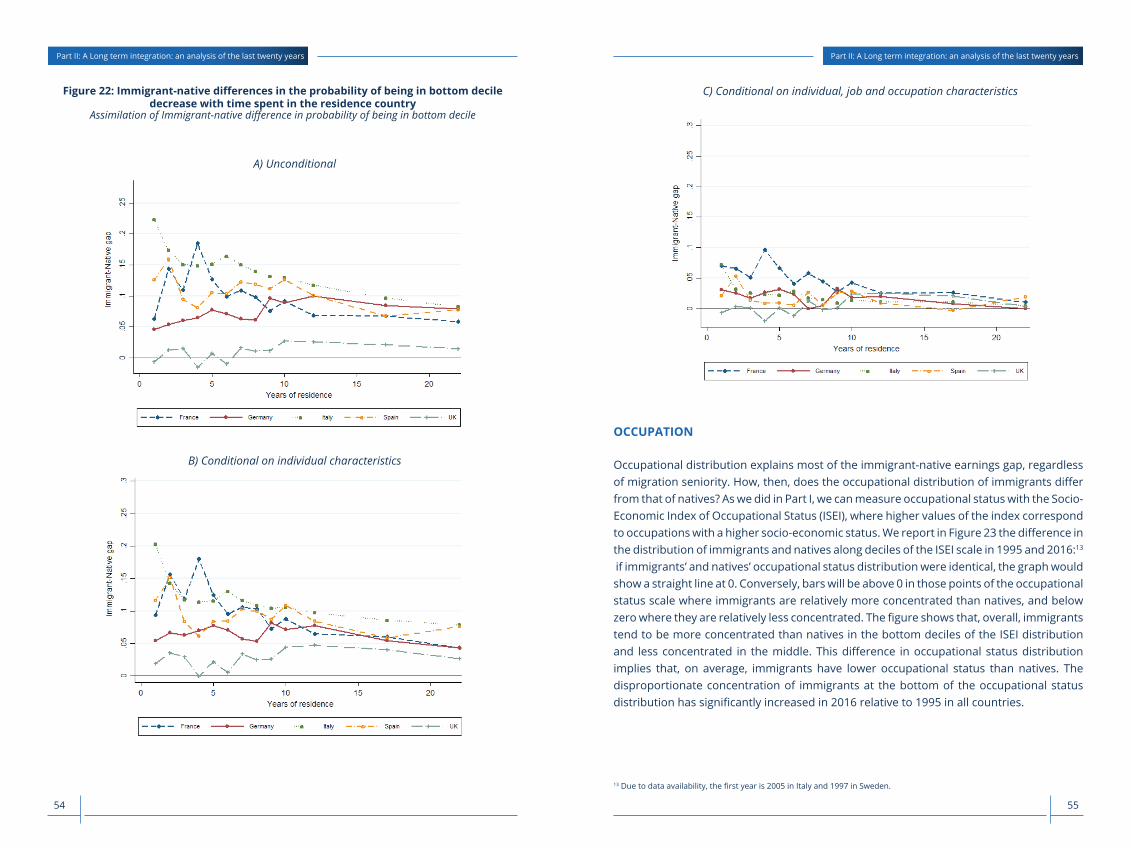
OCCUPATION
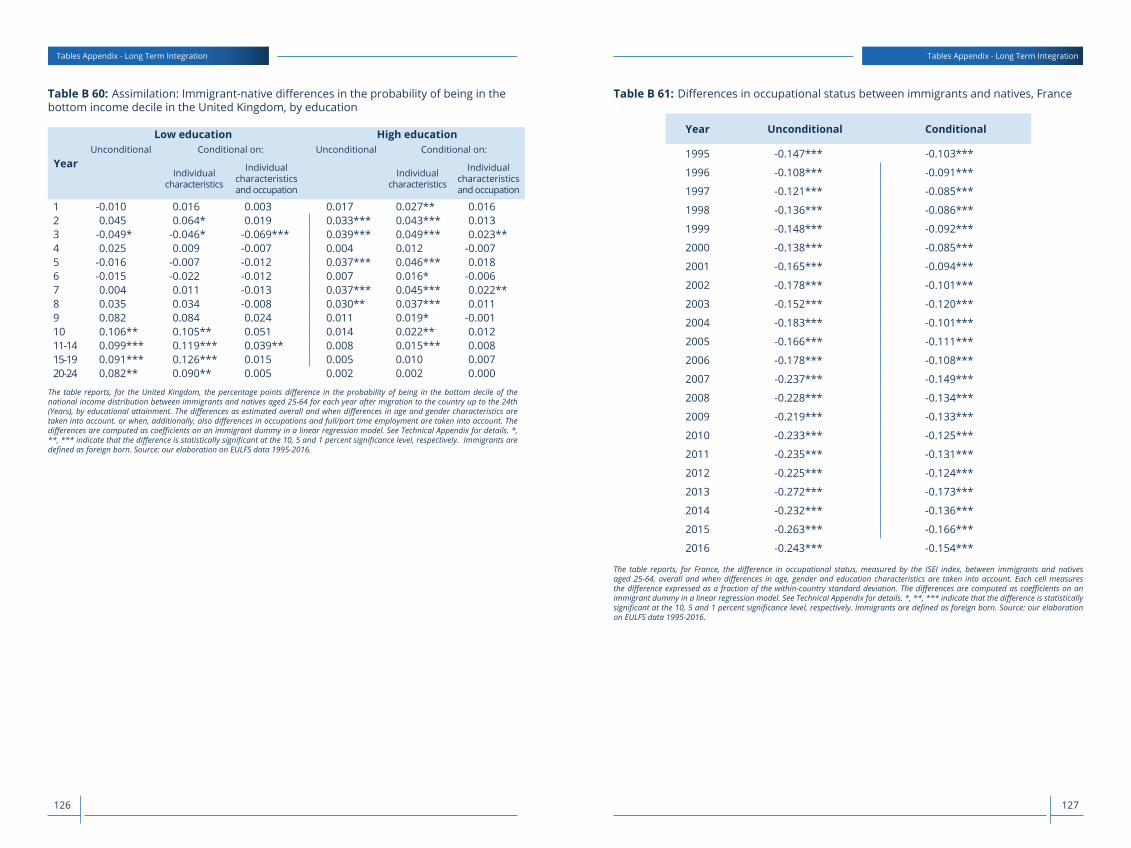
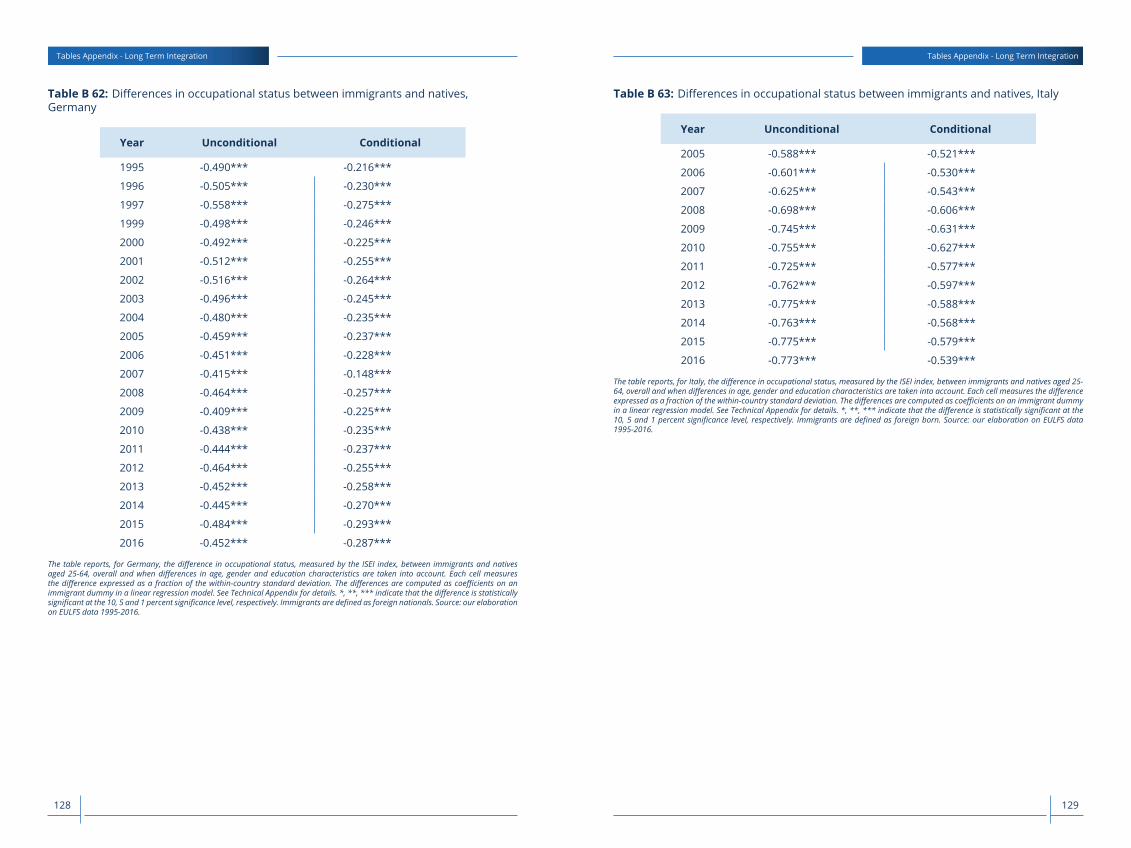
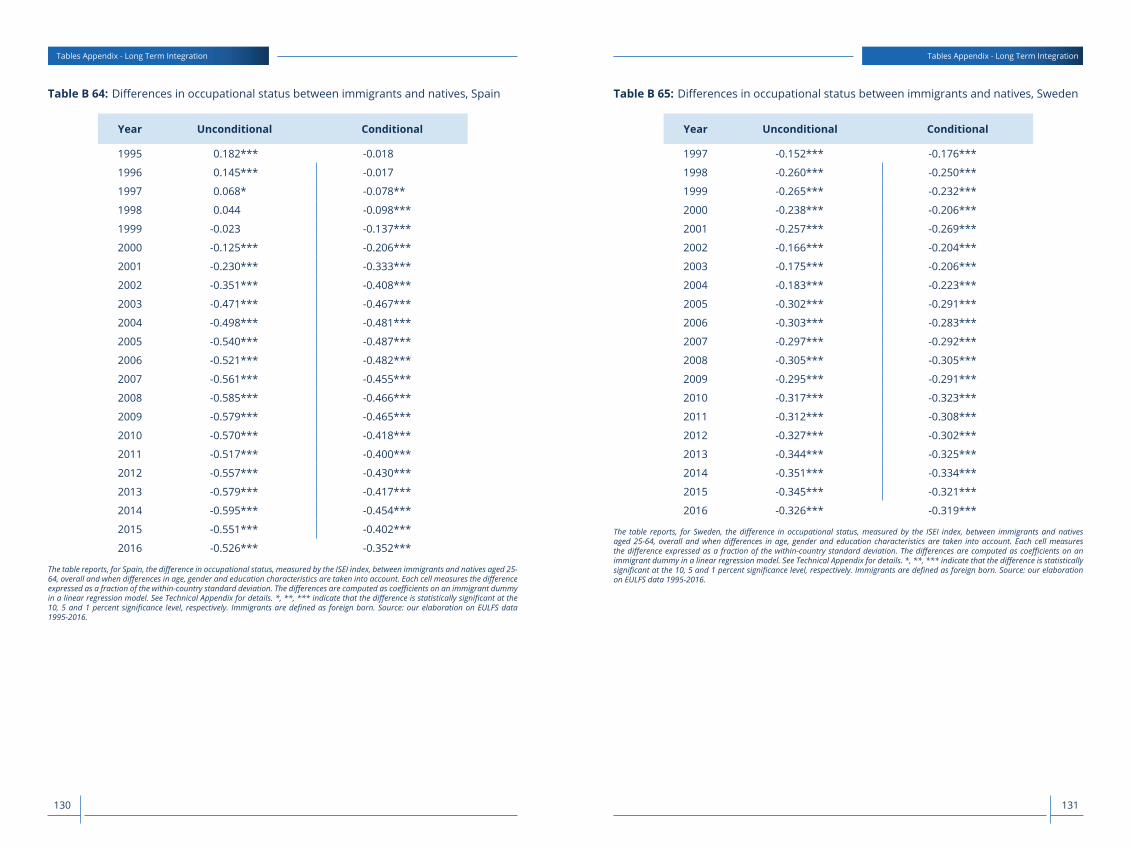
BOTTOMLINE: The occupational distribution of immigrants relative to natives worsened significantly in the last twenty years.
- Immigrants tend to be more concentrated than natives in the bottom part of the occupational distribution: this feature increased significantly in 2016 with respect to 1995 in all countries.
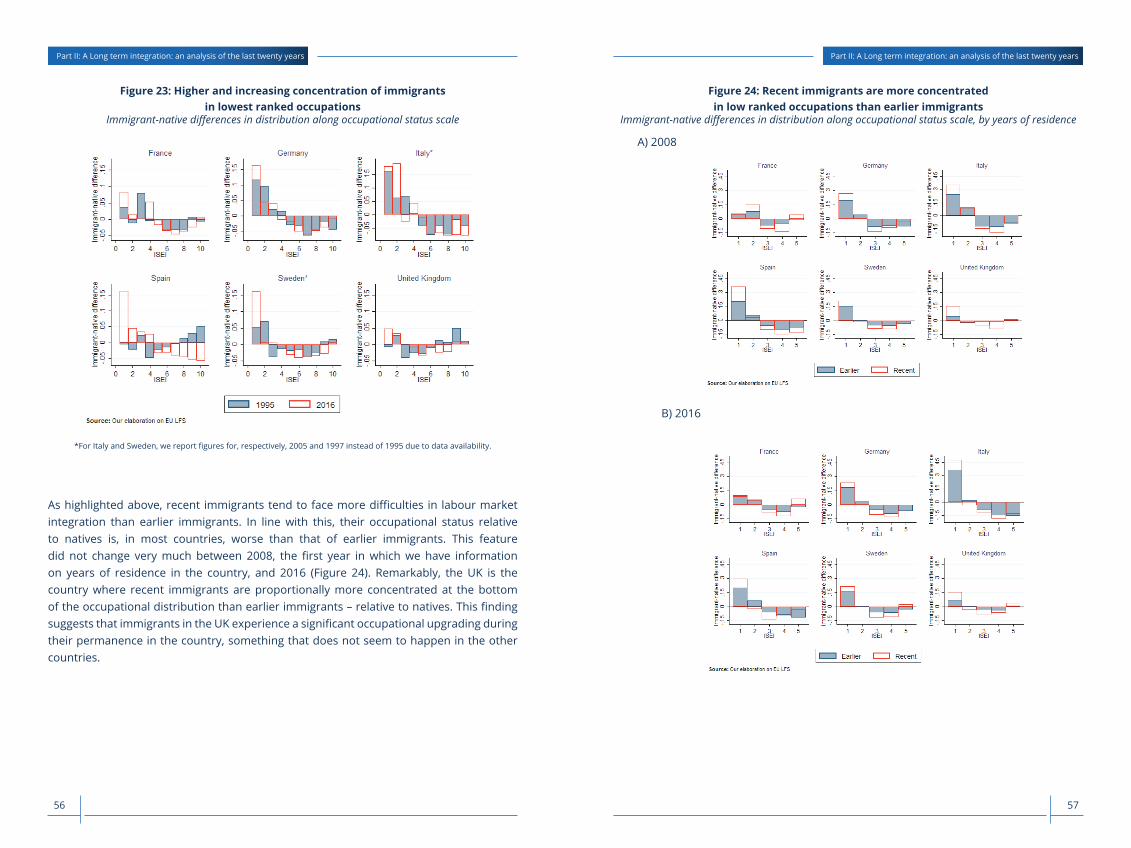
- The comparison between earlier and more recent immigrants shows that recent immigrants’ occupational distribution is more different from natives than that of earlier immigrants. The difference in their relative occupational distribution did not change very much over the last 20 years.
Introduction
1514
Introduction
1 EU15 countries: Austria, Belgium, Denmark, Finland, France, Germany, Greece, Ireland, Italy, Luxembourg, Netherlands, Portugal, Spain, Sweden, United Kingdom.
IMMIGRANT POPULATION – SIZE AND CHARACTERISTICS
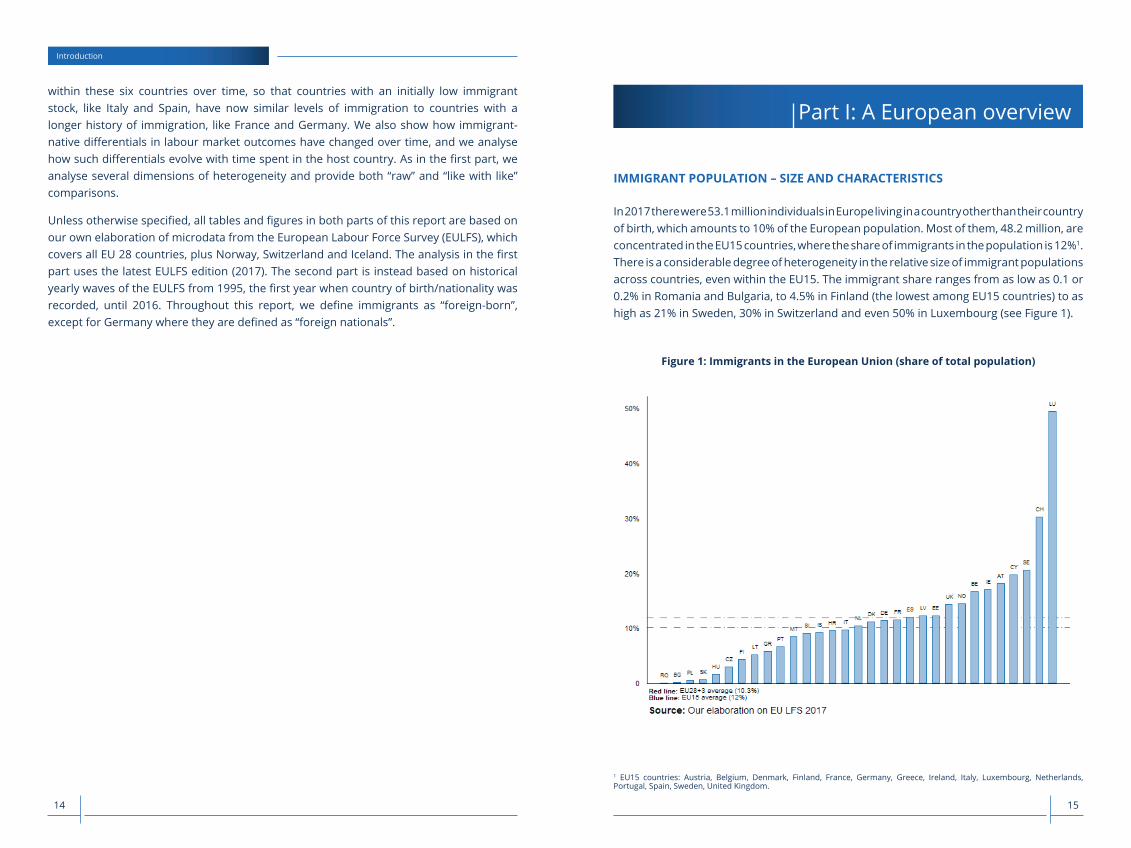
In 2017 there were 53.1 million individuals in Europe living in a country other than their country of birth, which amounts to 10% of the European population. Most of them, 48.2 million, are concentrated in the EU15 countries, where the share of immigrants in the population is 12%1.
There is a considerable degree of heterogeneity in the relative size of immigrant populations across countries, even within the EU15. The immigrant share ranges from as low as 0.1 or 0.2% in Romania and Bulgaria, to 4.5% in Finland (the lowest among EU15 countries) to as high as 21% in Sweden, 30% in Switzerland and even 50% in Luxembourg (see Figure 1).
Figure 1: Immigrants in the European Union (share of total population)
Part I: Immigrant integration in 2017 - A European overview
Immigrant population – size and characteristics
In 2017 there were 53.1 million individuals in Europe living in a country other than their country of
birth, which amounts to 10% of the European population. Most of them, 48.2 million, are
concentrated in the EU15 countries, where the share of immigrants in the population is 12%.1 There
is a considerable degree of heterogeneity in the relative size of immigrant populations across
countries, even within the EU15. The immigrant share ranges from as low as 0.1 or 0.2% in
Romania and Bulgaria, to 4.5% in Finland (the lowest among EU15 countries) to as high as 21% in
Sweden, 30% in Switzerland and even 50% in Luxembourg (see Figure 1).
Figure 1: Immigrants in the European Union (share of total population)
1 EU15 countries: Austria, Belgium, Denmark, Finland, France, Germany, Greece, Ireland, Italy, Luxembourg, Netherlands, Portugal, Spain, Sweden, United Kingdom.
within these six countries over time, so that countries with an initially low immigrant stock, like Italy and Spain, have now similar levels of immigration to countries with a longer history of immigration, like France and Germany. We also show how immigrant-native differentials in labour market outcomes have changed over time, and we analyse how such differentials evolve with time spent in the host country. As in the first part, we analyse several dimensions of heterogeneity and provide both “raw” and “like with like” comparisons.
Unless otherwise specified, all tables and figures in both parts of this report are based on our own elaboration of microdata from the European Labour Force Survey (EULFS), which covers all EU 28 countries, plus Norway, Switzerland and Iceland. The analysis in the first part uses the latest EULFS edition (2017). The second part is instead based on historical yearly waves of the EULFS from 1995, the first year when country of birth/nationality was recorded, until 2016. Throughout this report, we define immigrants as “foreign-born”, except for Germany where they are defined as “foreign nationals”.
Part I: A European overview
1716
Part I: A European overviewPart I: A European overview
3 Note that here and below we focus on the age range 25-64, in order to exclude individuals who may have not yet completed their education, and those who are not in working age.2 Immigrants are less than 1% of the overall population in Bulgaria, Poland, Romania and Slovakia.
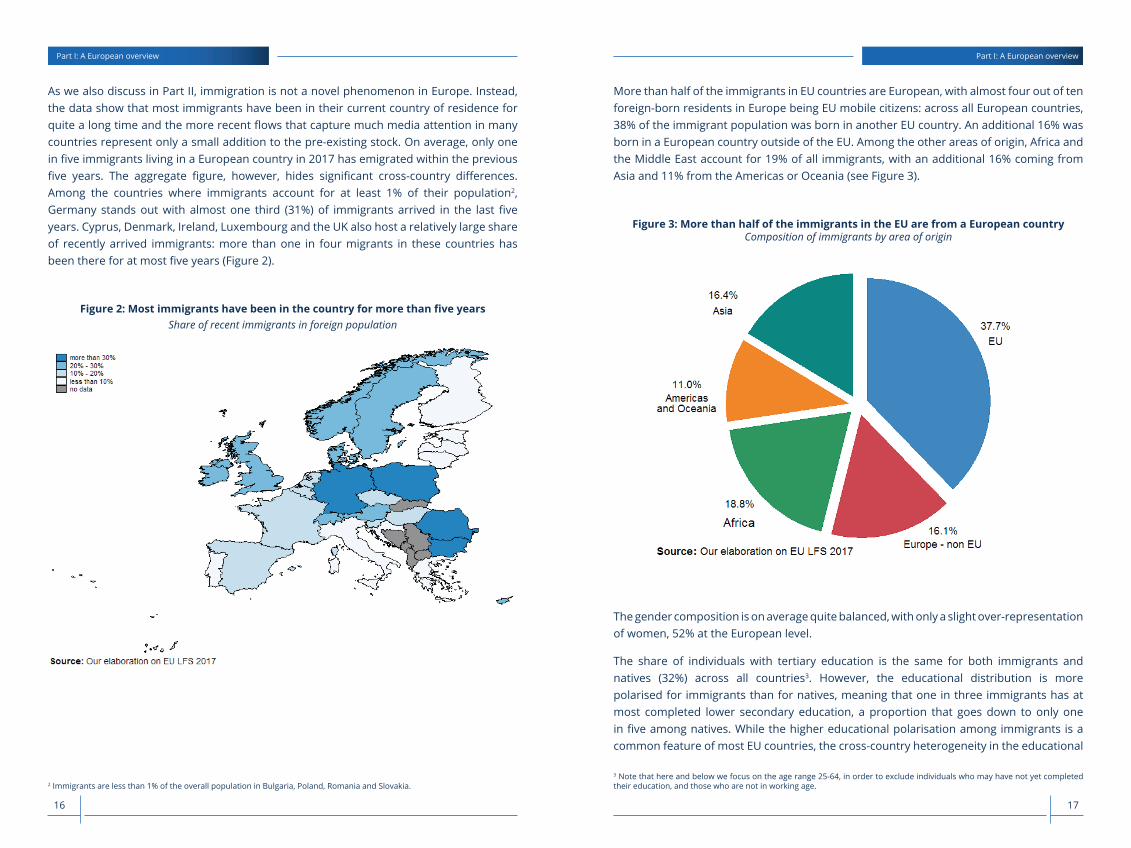
More than half of the immigrants in EU countries are European, with almost four out of ten foreign-born residents in Europe being EU mobile citizens: across all European countries, 38% of the immigrant population was born in another EU country. An additional 16% was born in a European country outside of the EU. Among the other areas of origin, Africa and the Middle East account for 19% of all immigrants, with an additional 16% coming from Asia and 11% from the Americas or Oceania (see Figure 3).
Figure 3: More than half of the immigrants in the EU are from a European countryComposition of immigrants by area of origin
More than half of the immigrants in EU countries are European, with almost four out of ten foreign-
born residents in Europe being EU mobile citizens: across all European countries, 38% of the
immigrant population was born in another EU country. An additional 16% was born in a European
country outside of the EU. Among the other areas of origin, Africa and the Middle East account for
19% of all immigrants, with an additional 16% coming from Asia and 11% from the Americas or
Oceania (see Figure 3).
Figure 3: More than half of the immigrants in the EU are from a European country Composition of immigrants by area of origin
The gender composition is on average quite balanced, with only a slight over-representation of
women, 52% at the European level.
The share of individuals with tertiary education is the same for both immigrants and natives (32%)
across all countries.3 However, the educational distribution is more polarised for immigrants than
for natives, meaning that one in three immigrants has at most completed lower secondary education,
3 Note that here and below we focus on the age range 25-64, in order to exclude individuals who may have not yet completed their education, and those who are not in working age.
The gender composition is on average quite balanced, with only a slight over-representation of women, 52% at the European level.
The share of individuals with tertiary education is the same for both immigrants and natives (32%) across all countries3. However, the educational distribution is more polarised for immigrants than for natives, meaning that one in three immigrants has at most completed lower secondary education, a proportion that goes down to only one in five among natives. While the higher educational polarisation among immigrants is a common feature of most EU countries, the cross-country heterogeneity in the educational
As we also discuss in Part II, immigration is not a novel phenomenon in Europe. Instead, the data show that most immigrants have been in their current country of residence for quite a long time and the more recent flows that capture much media attention in many countries represent only a small addition to the pre-existing stock. On average, only one in five immigrants living in a European country in 2017 has emigrated within the previous five years. The aggregate figure, however, hides significant cross-country differences. Among the countries where immigrants account for at least 1% of their population2,
Germany stands out with almost one third (31%) of immigrants arrived in the last five years. Cyprus, Denmark, Ireland, Luxembourg and the UK also host a relatively large share of recently arrived immigrants: more than one in four migrants in these countries has been there for at most five years (Figure 2).
Figure 2: Most immigrants have been in the country for more than five yearsShare of recent immigrants in foreign population
As we also discuss in Part II, immigration is not a novel phenomenon in Europe. Instead, the data
show that most immigrants have been in their current country of residence for quite a long time and
the more recent flows that capture much media attention in many countries represent only a small
addition to the pre-existing stock. On average, only one in five immigrants living in a European
country in 2017 has emigrated within the previous five years. The aggregate figure, however, hides
significant cross-country differences. Among the countries where immigrants account for at least
1% of their population,2 Germany stands out with almost one third (31%) of immigrants arrived in
the last five years. Cyprus, Denmark, Ireland, Luxembourg and the UK also host a relatively large
share of recently arrived immigrants: more than one in four migrants in these countries has been
there for at most five years (Figure 2).
Figure 2: Most immigrants have been in the country for more than five years
Share of recent immigrants in foreign population
2 Immigrants are less than 1% of the overall population in Bulgaria, Poland, Romania and Slovakia.
1918
EMPLOYMENT
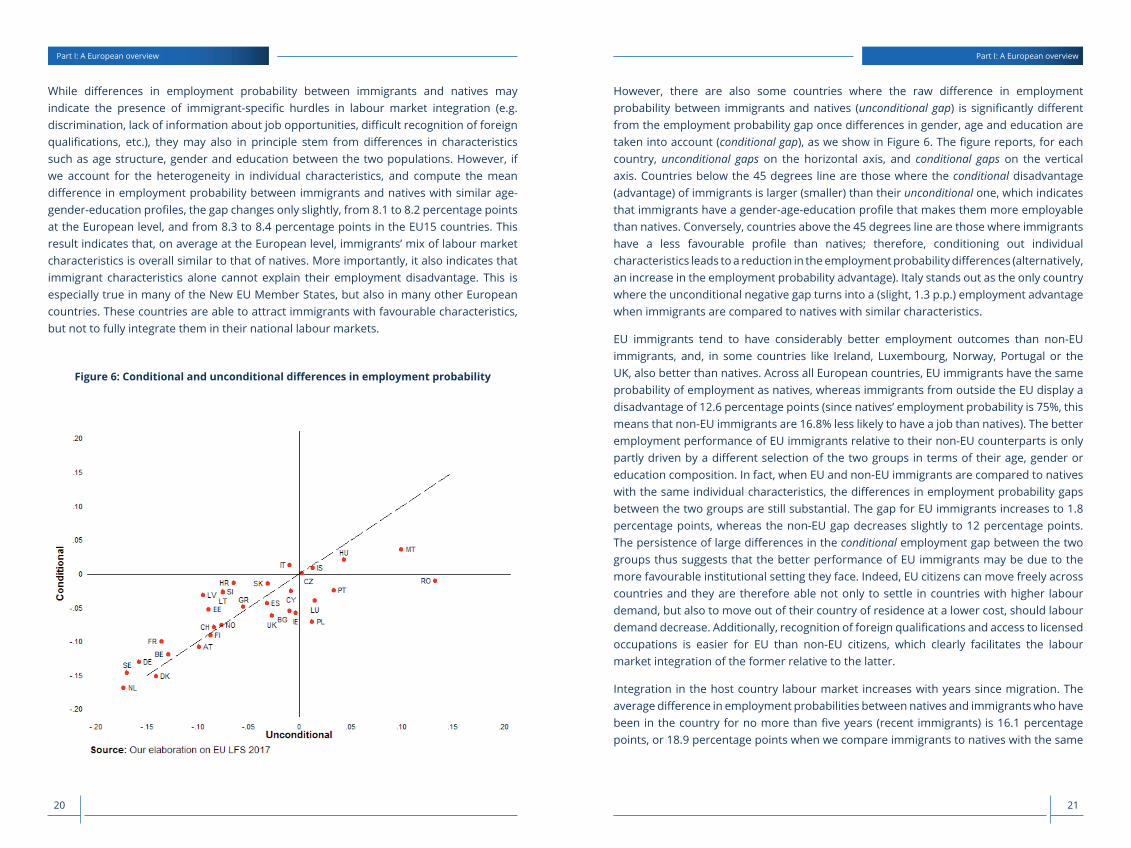
Immigrants have on average worse labour market outcomes than natives. Across Europe, they are 8.1 percentage points less likely than natives to be in employment (8.3 percentage points in EU15 countries). This represents a slight increase with respect to 2016, when the gap in employment probability between immigrants and natives was of 7.2 percentage points across Europe. Since native employment probability is on average 75% across the EU and in EU15 countries, this means that immigrants are 10.8% less likely to have a job than natives (11.1% in the EU15). Gaps are larger in Central and Northern European countries like the Netherlands (-17.2 p.p.), Sweden (-16.9 p.p.), Germany (-15.7 p.p.) or France (-13.5 p.p.) and smaller in the UK (-2.7 p.p.), in Italy (-1 p.p.) and in Ireland (-0.4 p.p.). Note however that Italy has one of the lowest native employment rates (65%), therefore immigrants do not have a high probability of employment in absolute terms, but only relative to Italian natives. Luxembourg and Portugal stand out, among the countries with a substantial share of immigrants in their population, for having a higher employment probability for immigrants than for natives, by respectively 1.5 and 3.4 percentage points. (see Figure 5).
Figure 5: Immigrant-native gaps in employment probability
Employment
Immigrants have on average worse labour market outcomes than natives. Across Europe, they are
8.1 percentage points less likely than natives to be in employment (8.3 percentage points in EU15
countries). This represents a slight increase with respect to 2016, when the gap in employment
probability between immigrants and natives was of 7.2 percentage points across Europe. Since
native employment probability is on average 75% across the EU and in EU15 countries, this means
that immigrants are 10.8% less likely to have a job than natives (11.1% in the EU15). Gaps are
larger in Central and Northern European countries like the Netherlands (-17.2 p.p.), Sweden (-16.9
p.p.), Germany (-15.7 p.p.) or France (-13.5 p.p.) and smaller in the UK (-2.7 p.p.), in Italy (-1 p.p.)
and in Ireland (-0.4 p.p.). Note however that Italy has one of the lowest native employment rates
(65%), therefore immigrants do not have a high probability of employment in absolute terms, but
only relative to Italian natives. Luxembourg and Portugal stand out, among the countries with a
substantial share of immigrants in their population, for having a higher employment probability for
immigrants than for natives, by respectively 1.5 and 3.4 percentage points. (see Figure 5).
Figure 5: Immigrant-native gaps in employment probability
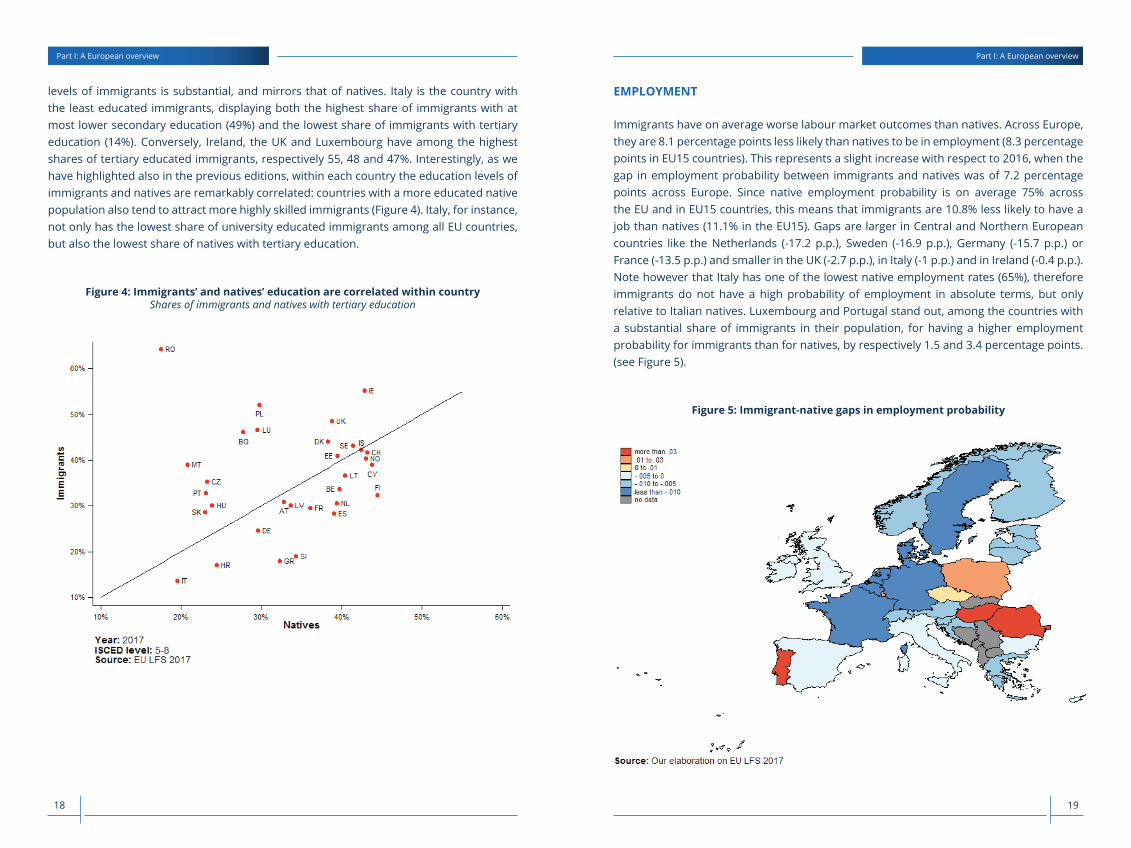
levels of immigrants is substantial, and mirrors that of natives. Italy is the country with the least educated immigrants, displaying both the highest share of immigrants with at most lower secondary education (49%) and the lowest share of immigrants with tertiary education (14%). Conversely, Ireland, the UK and Luxembourg have among the highest shares of tertiary educated immigrants, respectively 55, 48 and 47%. Interestingly, as we have highlighted also in the previous editions, within each country the education levels of immigrants and natives are remarkably correlated: countries with a more educated native population also tend to attract more highly skilled immigrants (Figure 4). Italy, for instance, not only has the lowest share of university educated immigrants among all EU countries, but also the lowest share of natives with tertiary education.
Figure 4: Immigrants’ and natives’ education are correlated within countryShares of immigrants and natives with tertiary education
a proportion that goes down to only one in five among natives. While the higher educational
polarisation among immigrants is a common feature of most EU countries, the cross-country
heterogeneity in the educational levels of immigrants is substantial, and mirrors that of natives. Italy
is the country with the least educated immigrants, displaying both the highest share of immigrants
with at most lower secondary education (49%) and the lowest share of immigrants with tertiary
education (14%). Conversely, Ireland, the UK and Luxembourg have among the highest shares of
tertiary educated immigrants, respectively 55, 48 and 47%. Interestingly, as we have highlighted
also in the previous editions, within each country the education levels of immigrants and natives are
remarkably correlated: countries with a more educated native population also tend to attract more
highly skilled immigrants (Figure 4). Italy, for instance, not only has the lowest share of university
educated immigrants among all EU countries, but also the lowest share of natives with tertiary
education.
Figure 4: Immigrants’ and natives’ education are correlated within country Shares of immigrants and natives with tertiary education
Part I: A European overviewPart I: A European overview
2120
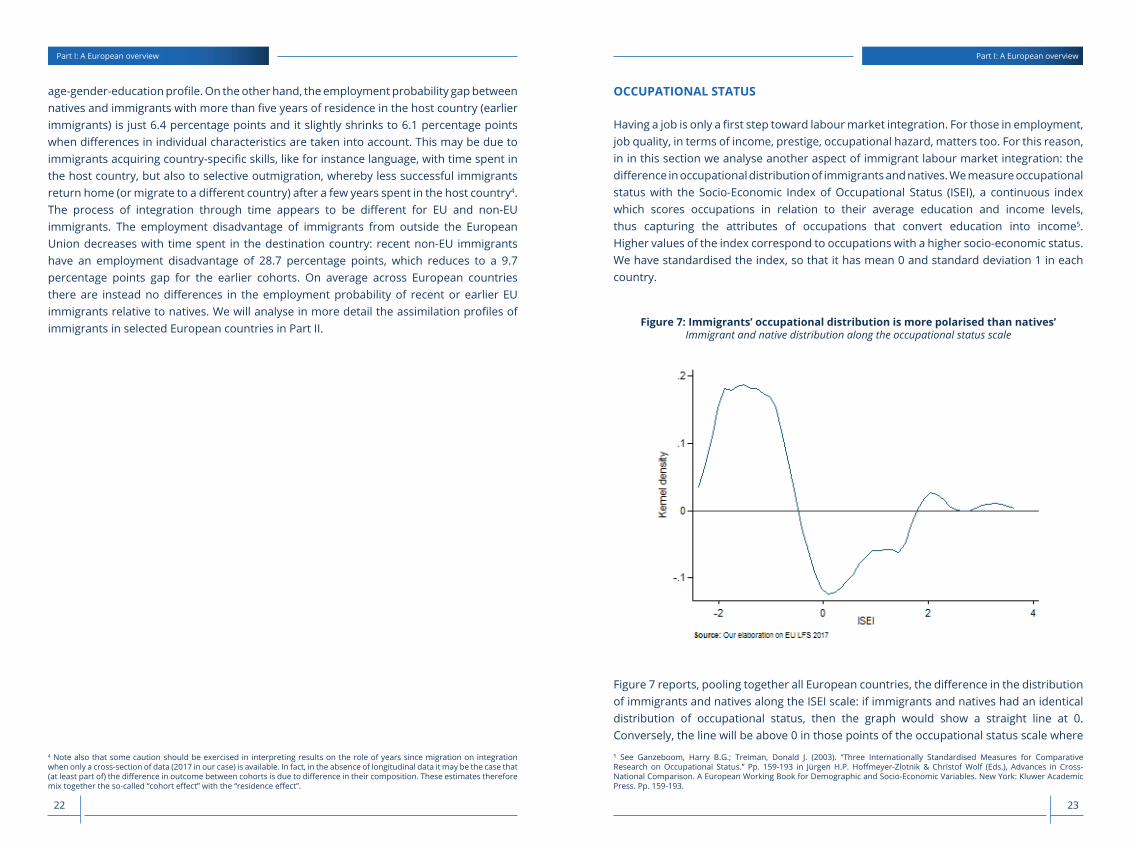
However, there are also some countries where the raw difference in employment probability between immigrants and natives (unconditional gap) is significantly different from the employment probability gap once differences in gender, age and education are taken into account (conditional gap), as we show in Figure 6. The figure reports, for each country, unconditional gaps on the horizontal axis, and conditional gaps on the vertical axis. Countries below the 45 degrees line are those where the conditional disadvantage (advantage) of immigrants is larger (smaller) than their unconditional one, which indicates that immigrants have a gender-age-education profile that makes them more employable than natives. Conversely, countries above the 45 degrees line are those where immigrants have a less favourable profile than natives; therefore, conditioning out individual characteristics leads to a reduction in the employment probability differences (alternatively, an increase in the employment probability advantage). Italy stands out as the only country where the unconditional negative gap turns into a (slight, 1.3 p.p.) employment advantage when immigrants are compared to natives with similar characteristics.
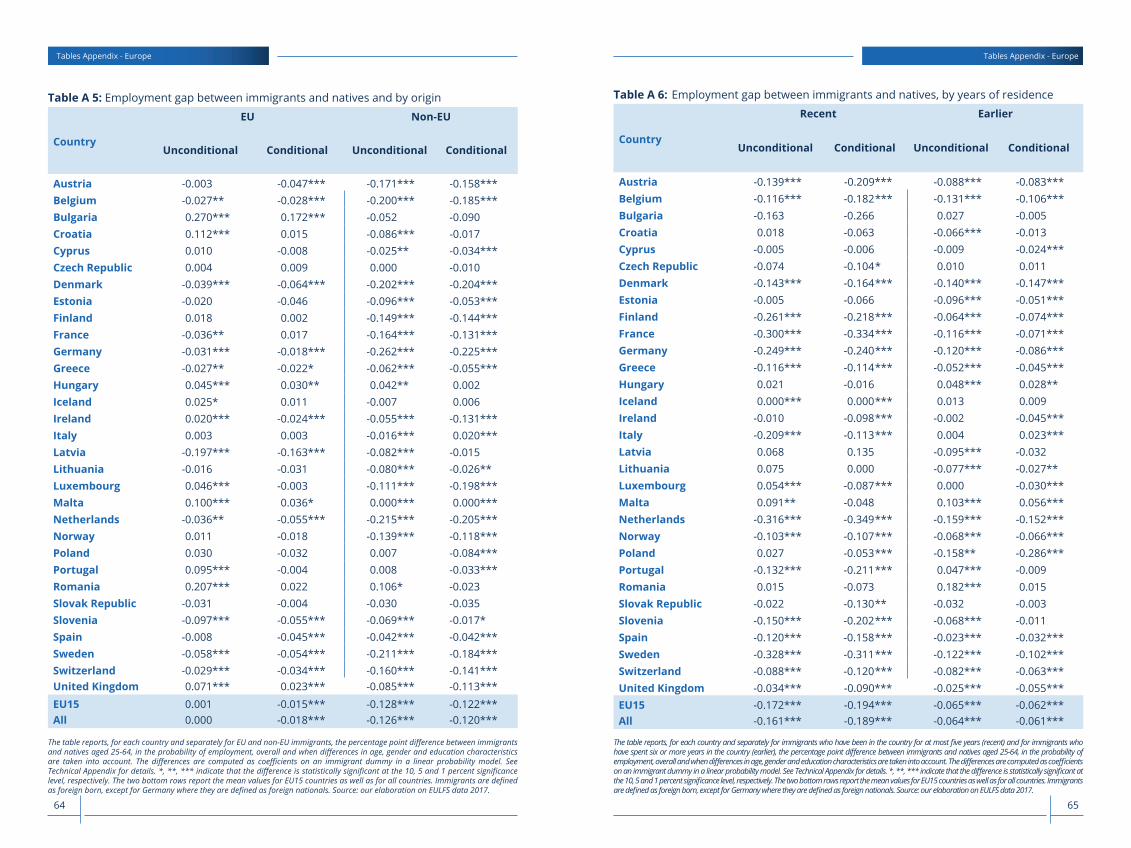
EU immigrants tend to have considerably better employment outcomes than non-EU immigrants, and, in some countries like Ireland, Luxembourg, Norway, Portugal or the UK, also better than natives. Across all European countries, EU immigrants have the same probability of employment as natives, whereas immigrants from outside the EU display a disadvantage of 12.6 percentage points (since natives’ employment probability is 75%, this means that non-EU immigrants are 16.8% less likely to have a job than natives). The better employment performance of EU immigrants relative to their non-EU counterparts is only partly driven by a different selection of the two groups in terms of their age, gender or education composition. In fact, when EU and non-EU immigrants are compared to natives with the same individual characteristics, the differences in employment probability gaps between the two groups are still substantial. The gap for EU immigrants increases to 1.8 percentage points, whereas the non-EU gap decreases slightly to 12 percentage points. The persistence of large differences in the conditional employment gap between the two groups thus suggests that the better performance of EU immigrants may be due to the more favourable institutional setting they face. Indeed, EU citizens can move freely across countries and they are therefore able not only to settle in countries with higher labour demand, but also to move out of their country of residence at a lower cost, should labour demand decrease. Additionally, recognition of foreign qualifications and access to licensed occupations is easier for EU than non-EU citizens, which clearly facilitates the labour market integration of the former relative to the latter.
Integration in the host country labour market increases with years since migration. The average difference in employment probabilities between natives and immigrants who have been in the country for no more than five years (recent immigrants) is 16.1 percentage points, or 18.9 percentage points when we compare immigrants to natives with the same
While differences in employment probability between immigrants and natives may indicate the presence of immigrant-specific hurdles in labour market integration (e.g. discrimination, lack of information about job opportunities, difficult recognition of foreign qualifications, etc.), they may also in principle stem from differences in characteristics such as age structure, gender and education between the two populations. However, if we account for the heterogeneity in individual characteristics, and compute the mean difference in employment probability between immigrants and natives with similar age-gender-education profiles, the gap changes only slightly, from 8.1 to 8.2 percentage points at the European level, and from 8.3 to 8.4 percentage points in the EU15 countries. This result indicates that, on average at the European level, immigrants’ mix of labour market characteristics is overall similar to that of natives. More importantly, it also indicates that immigrant characteristics alone cannot explain their employment disadvantage. This is especially true in many of the New EU Member States, but also in many other European countries. These countries are able to attract immigrants with favourable characteristics, but not to fully integrate them in their national labour markets.
Figure 6: Conditional and unconditional differences in employment probability
While differences in employment probability between immigrants and natives may indicate the
presence of immigrant-specific hurdles in labour market integration (e.g. discrimination, lack of
information about job opportunities, difficult recognition of foreign qualifications, etc.), they may
also in principle stem from differences in characteristics such as age structure, gender and education
between the two populations. However, if we account for the heterogeneity in individual
characteristics, and compute the mean difference in employment probability between immigrants
and natives with similar age-gender-education profiles, the gap changes only slightly, from 8.1 to
8.2 percentage points at the European level, and from 8.3 to 8.4 percentage points in the EU15
countries. This result indicates that, on average at the European level, immigrants’ mix of labour
market characteristics is overall similar to that of natives. More importantly, it also indicates that
immigrant characteristics alone cannot explain their employment disadvantage. This is especially
true in many of the New EU Member States, but also in many other European countries. These
countries are able to attract immigrants with favourable characteristics, but not to fully integrate
them in their national labour markets.
Figure 6: Conditional and unconditional differences in employment probability
Part I: A European overviewPart I: A European overview
2322
5 See Ganzeboom, Harry B.G.; Treiman, Donald J. (2003). “Three Internationally Standardised Measures for Comparative Research on Occupational Status.” Pp. 159-193 in Jürgen H.P. Hoffmeyer-Zlotnik & Christof Wolf (Eds.), Advances in Cross-National Comparison. A European Working Book for Demographic and Socio-Economic Variables. New York: Kluwer Academic Press. Pp. 159-193.
4 Note also that some caution should be exercised in interpreting results on the role of years since migration on integration when only a cross-section of data (2017 in our case) is available. In fact, in the absence of longitudinal data it may be the case that (at least part of) the difference in outcome between cohorts is due to difference in their composition. These estimates therefore mix together the so-called “cohort effect” with the “residence effect”.
OCCUPATIONAL STATUS
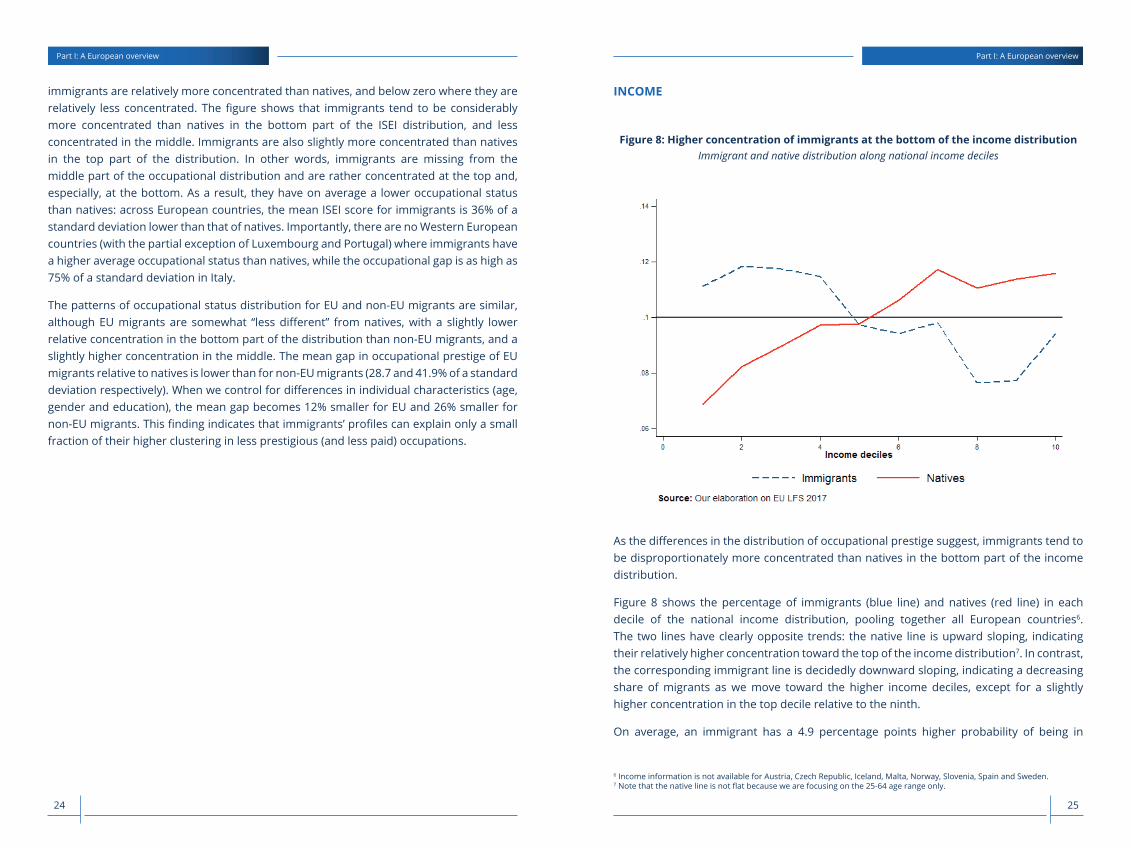
Having a job is only a first step toward labour market integration. For those in employment, job quality, in terms of income, prestige, occupational hazard, matters too. For this reason, in in this section we analyse another aspect of immigrant labour market integration: the difference in occupational distribution of immigrants and natives. We measure occupational status with the Socio-Economic Index of Occupational Status (ISEI), a continuous index which scores occupations in relation to their average education and income levels, thus capturing the attributes of occupations that convert education into income5.
Higher values of the index correspond to occupations with a higher socio-economic status. We have standardised the index, so that it has mean 0 and standard deviation 1 in each country.
Figure 7: Immigrants’ occupational distribution is more polarised than natives’Immigrant and native distribution along the occupational status scale
Figure 7: Immigrants’ occupational distribution is more polarised than natives’
Immigrant and native distribution along the occupational status scale
Figure 7 reports, pooling together all European countries, the difference in the distribution of
immigrants and natives along the ISEI scale: if immigrants and natives had an identical distribution
of occupational status, then the graph would show a straight line at 0. Conversely, the line will be
above 0 in those points of the occupational status scale where immigrants are relatively more
concentrated than natives, and below zero where they are relatively less concentrated. The figure
shows that immigrants tend to be considerably more concentrated than natives in the bottom part of
the ISEI distribution, and less concentrated in the middle. Immigrants are also slightly more
concentrated than natives in the top part of the distribution. In other words, immigrants are missing
from the middle part of the occupational distribution and are rather concentrated at the top and,
especially, at the bottom. As a result, they have on average a lower occupational status than natives:
across European countries, the mean ISEI score for immigrants is 36% of a standard deviation
lower than that of natives. Importantly, there are no Western European countries (with the partial
exception of Luxembourg and Portugal) where immigrants have a higher average occupational
status than natives, while the occupational gap is as high as 75% of a standard deviation in Italy.
The patterns of occupational status distribution for EU and non-EU migrants are similar, although
EU migrants are somewhat “less different” from natives, with a slightly lower relative concentration
in the bottom part of the distribution than non-EU migrants, and a slightly higher concentration in
Figure 7 reports, pooling together all European countries, the difference in the distribution of immigrants and natives along the ISEI scale: if immigrants and natives had an identical distribution of occupational status, then the graph would show a straight line at 0. Conversely, the line will be above 0 in those points of the occupational status scale where
age-gender-education profile. On the other hand, the employment probability gap between natives and immigrants with more than five years of residence in the host country (earlier immigrants) is just 6.4 percentage points and it slightly shrinks to 6.1 percentage points when differences in individual characteristics are taken into account. This may be due to immigrants acquiring country-specific skills, like for instance language, with time spent in the host country, but also to selective outmigration, whereby less successful immigrants return home (or migrate to a different country) after a few years spent in the host country4.
The process of integration through time appears to be different for EU and non-EU immigrants. The employment disadvantage of immigrants from outside the European Union decreases with time spent in the destination country: recent non-EU immigrants have an employment disadvantage of 28.7 percentage points, which reduces to a 9.7 percentage points gap for the earlier cohorts. On average across European countries there are instead no differences in the employment probability of recent or earlier EU immigrants relative to natives. We will analyse in more detail the assimilation profiles of immigrants in selected European countries in Part II.
Part I: A European overviewPart I: A European overview
2524
6 Income information is not available for Austria, Czech Republic, Iceland, Malta, Norway, Slovenia, Spain and Sweden. 7 Note that the native line is not flat because we are focusing on the 25-64 age range only.
INCOME
Figure 8: Higher concentration of immigrants at the bottom of the income distributionImmigrant and native distribution along national income deciles
the middle. The mean gap in occupational prestige of EU migrants relative to natives is lower than
for non-EU migrants (28.7 and 41.9% of a standard deviation respectively). When we control for
differences in individual characteristics (age, gender and education), the mean gap becomes 12%
smaller for EU and 26% smaller for non-EU migrants. This finding indicates that immigrants’
profiles can explain only a small fraction of their higher clustering in less prestigious (and less paid)
occupations.
Income
Figure 8: Higher concentration of immigrants at the bottom of the income distribution Immigrant and native distribution along national income deciles
As the differences in the distribution of occupational prestige suggest, immigrants tend to be
disproportionately more concentrated than natives in the bottom part of the income distribution.
Figure 8 shows the percentage of immigrants (blue line) and natives (red line) in each decile of the
national income distribution, pooling together all European countries.6 The two lines have clearly
6 Income information is not available for Austria, Czech Republic, Iceland, Malta, Norway, Slovenia, Spain and Sweden.
As the differences in the distribution of occupational prestige suggest, immigrants tend to be disproportionately more concentrated than natives in the bottom part of the income distribution.
Figure 8 shows the percentage of immigrants (blue line) and natives (red line) in each decile of the national income distribution, pooling together all European countries6.
The two lines have clearly opposite trends: the native line is upward sloping, indicating their relatively higher concentration toward the top of the income distribution7. In contrast, the corresponding immigrant line is decidedly downward sloping, indicating a decreasing share of migrants as we move toward the higher income deciles, except for a slightly higher concentration in the top decile relative to the ninth.
On average, an immigrant has a 4.9 percentage points higher probability of being in
immigrants are relatively more concentrated than natives, and below zero where they are relatively less concentrated. The figure shows that immigrants tend to be considerably more concentrated than natives in the bottom part of the ISEI distribution, and less concentrated in the middle. Immigrants are also slightly more concentrated than natives in the top part of the distribution. In other words, immigrants are missing from the middle part of the occupational distribution and are rather concentrated at the top and, especially, at the bottom. As a result, they have on average a lower occupational status than natives: across European countries, the mean ISEI score for immigrants is 36% of a standard deviation lower than that of natives. Importantly, there are no Western European countries (with the partial exception of Luxembourg and Portugal) where immigrants have a higher average occupational status than natives, while the occupational gap is as high as 75% of a standard deviation in Italy.
The patterns of occupational status distribution for EU and non-EU migrants are similar, although EU migrants are somewhat “less different” from natives, with a slightly lower relative concentration in the bottom part of the distribution than non-EU migrants, and a slightly higher concentration in the middle. The mean gap in occupational prestige of EU migrants relative to natives is lower than for non-EU migrants (28.7 and 41.9% of a standard deviation respectively). When we control for differences in individual characteristics (age, gender and education), the mean gap becomes 12% smaller for EU and 26% smaller for non-EU migrants. This finding indicates that immigrants’ profiles can explain only a small fraction of their higher clustering in less prestigious (and less paid) occupations.
Part I: A European overviewPart I: A European overview
2726
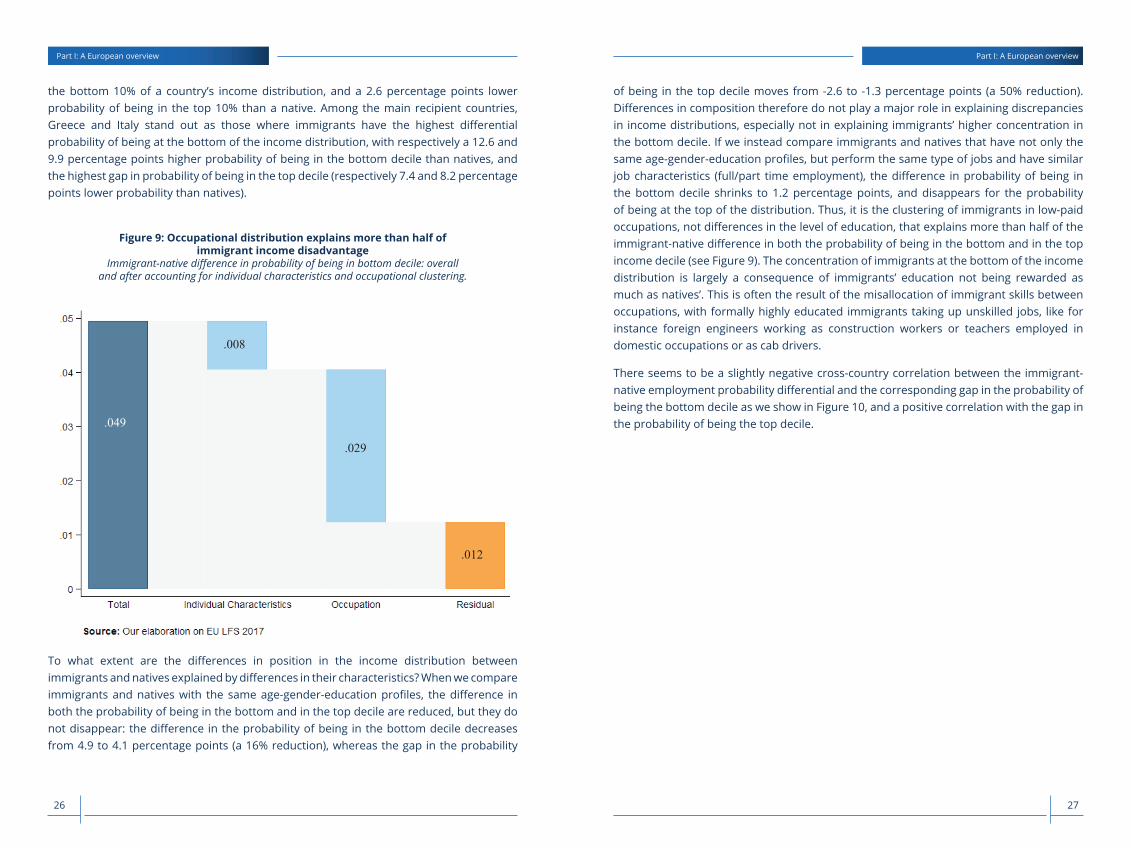
of being in the top decile moves from -2.6 to -1.3 percentage points (a 50% reduction). Differences in composition therefore do not play a major role in explaining discrepancies in income distributions, especially not in explaining immigrants’ higher concentration in the bottom decile. If we instead compare immigrants and natives that have not only the same age-gender-education profiles, but perform the same type of jobs and have similar job characteristics (full/part time employment), the difference in probability of being in the bottom decile shrinks to 1.2 percentage points, and disappears for the probability of being at the top of the distribution. Thus, it is the clustering of immigrants in low-paid occupations, not differences in the level of education, that explains more than half of the immigrant-native difference in both the probability of being in the bottom and in the top income decile (see Figure 9). The concentration of immigrants at the bottom of the income distribution is largely a consequence of immigrants’ education not being rewarded as much as natives’. This is often the result of the misallocation of immigrant skills between occupations, with formally highly educated immigrants taking up unskilled jobs, like for instance foreign engineers working as construction workers or teachers employed in domestic occupations or as cab drivers.
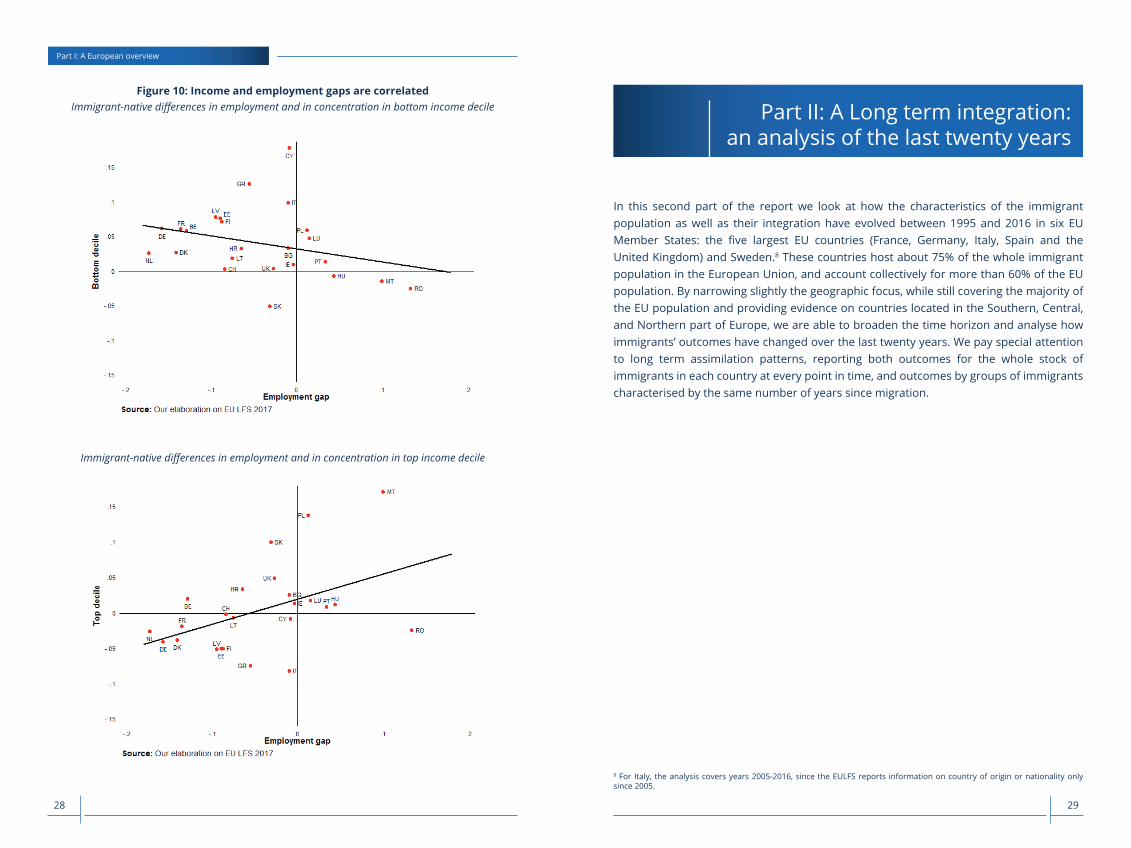
There seems to be a slightly negative cross-country correlation between the immigrant-native employment probability differential and the corresponding gap in the probability of being the bottom decile as we show in Figure 10, and a positive correlation with the gap in the probability of being the top decile.
the bottom 10% of a country’s income distribution, and a 2.6 percentage points lower probability of being in the top 10% than a native. Among the main recipient countries, Greece and Italy stand out as those where immigrants have the highest differential probability of being at the bottom of the income distribution, with respectively a 12.6 and 9.9 percentage points higher probability of being in the bottom decile than natives, and the highest gap in probability of being in the top decile (respectively 7.4 and 8.2 percentage points lower probability than natives).
Figure 9: Occupational distribution explains more than half of immigrant income disadvantage
Immigrant-native difference in probability of being in bottom decile: overall and after accounting for individual characteristics and occupational clustering.
opposite trends: the native line is upward sloping, indicating their relatively higher concentration
toward the top of the income distribution7. In contrast, the corresponding immigrant line is
decidedly downward sloping, indicating a decreasing share of migrants as we move toward the
higher income deciles, except for a slightly higher concentration in the top decile relative to the
ninth.
On average, an immigrant has a 4.9 percentage points higher probability of being in the bottom 10%
of a country’s income distribution, and a 2.6 percentage points lower probability of being in the top
10% than a native. Among the main recipient countries, Greece and Italy stand out as those where
immigrants have the highest differential probability of being at the bottom of the income
distribution, with respectively a 12.6 and 9.9 percentage points higher probability of being in the
bottom decile than natives, and the highest gap in probability of being in the top decile (respectively
7.4 and 8.2 percentage points lower probability than natives).
Figure 9: Occupational distribution explains more than half of immigrant income disadvantage
Immigrant-native difference in probability of being in bottom decile: overall and after accounting for individual characteristics and occupational clustering.
7 Note that the native line is not flat because we are focusing on the 25-64 age range only.
.049
.008
.029
.012
To what extent are the differences in position in the income distribution between immigrants and natives explained by differences in their characteristics? When we compare immigrants and natives with the same age-gender-education profiles, the difference in both the probability of being in the bottom and in the top decile are reduced, but they do not disappear: the difference in the probability of being in the bottom decile decreases from 4.9 to 4.1 percentage points (a 16% reduction), whereas the gap in the probability
Part I: A European overviewPart I: A European overview
2928
8 For Italy, the analysis covers years 2005-2016, since the EULFS reports information on country of origin or nationality only since 2005.
In this second part of the report we look at how the characteristics of the immigrant population as well as their integration have evolved between 1995 and 2016 in six EU Member States: the five largest EU countries (France, Germany, Italy, Spain and the United Kingdom) and Sweden.8 These countries host about 75% of the whole immigrant population in the European Union, and account collectively for more than 60% of the EU population. By narrowing slightly the geographic focus, while still covering the majority of the EU population and providing evidence on countries located in the Southern, Central, and Northern part of Europe, we are able to broaden the time horizon and analyse how immigrants’ outcomes have changed over the last twenty years. We pay special attention to long term assimilation patterns, reporting both outcomes for the whole stock of immigrants in each country at every point in time, and outcomes by groups of immigrants characterised by the same number of years since migration.
Figure 10: Income and employment gaps are correlatedImmigrant-native differences in employment and in concentration in bottom income decile
Figure 10: Income and employment gaps are correlated
Immigrant-native differences in employment and in concentration in bottom income decile
Immigrant-native differences in employment and in concentration in top income decile
Immigrant-native differences in employment and in concentration in top income decile
Figure 10: Income and employment gaps are correlated
Immigrant-native differences in employment and in concentration in bottom income decile
Immigrant-native differences in employment and in concentration in top income decile
Part II: A Long term integration: an analysis of the last twenty years
Part I: A European overview
3130
Part II: A Long term integration: an analysis of the last twenty yearsPart II: A Long term integration: an analysis of the last twenty years
9 New EU Member States are: Bulgaria, Croatia, Cyprus, Czech Republic, Estonia, Hungary, Latvia, Lithuania, Malta, Poland, Romania, Slovakia and Slovenia.
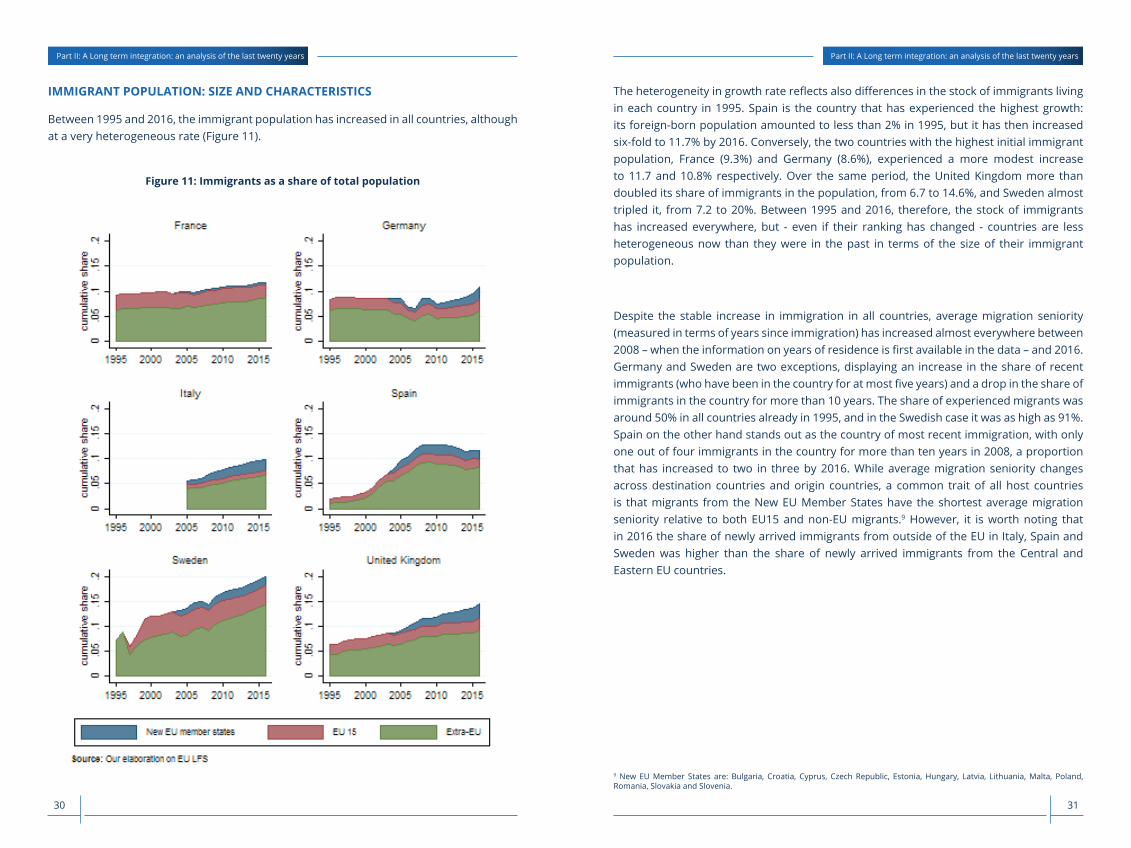
The heterogeneity in growth rate reflects also differences in the stock of immigrants living in each country in 1995. Spain is the country that has experienced the highest growth: its foreign-born population amounted to less than 2% in 1995, but it has then increased six-fold to 11.7% by 2016. Conversely, the two countries with the highest initial immigrant population, France (9.3%) and Germany (8.6%), experienced a more modest increase to 11.7 and 10.8% respectively. Over the same period, the United Kingdom more than doubled its share of immigrants in the population, from 6.7 to 14.6%, and Sweden almost tripled it, from 7.2 to 20%. Between 1995 and 2016, therefore, the stock of immigrants has increased everywhere, but - even if their ranking has changed - countries are less heterogeneous now than they were in the past in terms of the size of their immigrant population.
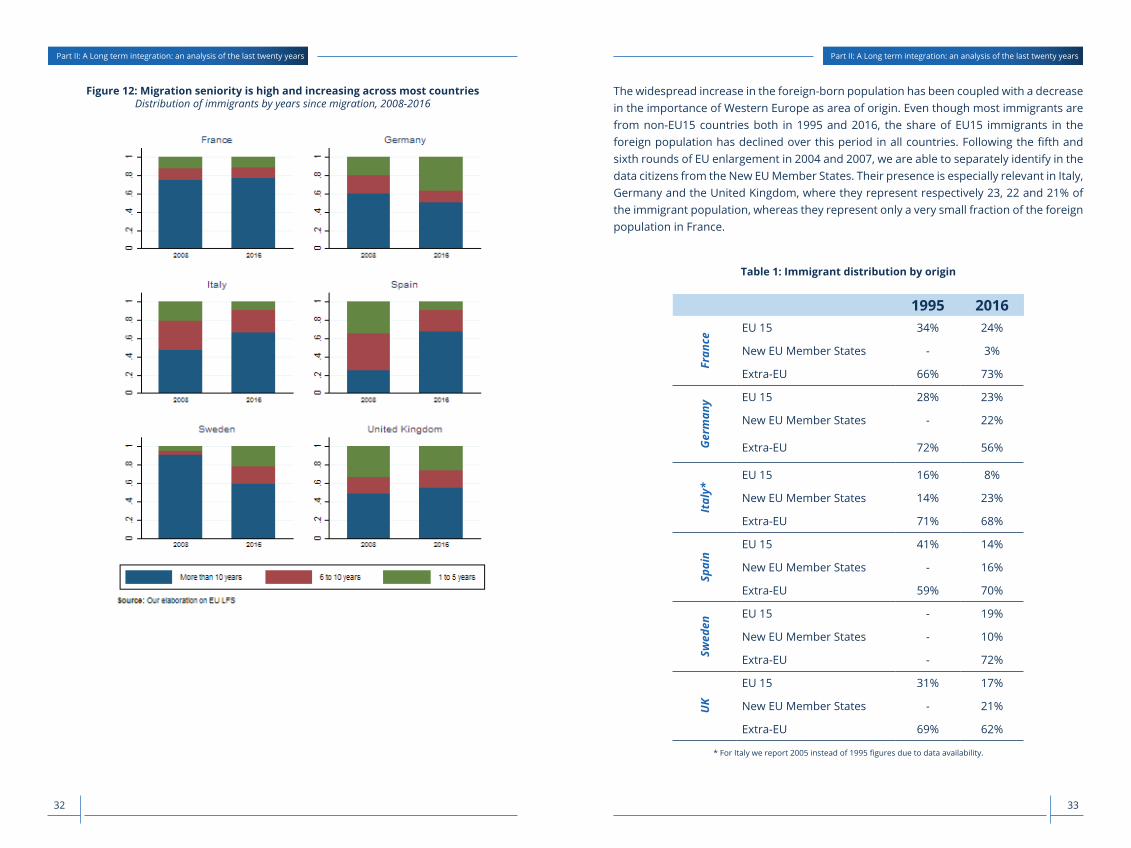
Despite the stable increase in immigration in all countries, average migration seniority (measured in terms of years since immigration) has increased almost everywhere between 2008 – when the information on years of residence is first available in the data – and 2016. Germany and Sweden are two exceptions, displaying an increase in the share of recent immigrants (who have been in the country for at most five years) and a drop in the share of immigrants in the country for more than 10 years. The share of experienced migrants was around 50% in all countries already in 1995, and in the Swedish case it was as high as 91%. Spain on the other hand stands out as the country of most recent immigration, with only one out of four immigrants in the country for more than ten years in 2008, a proportion that has increased to two in three by 2016. While average migration seniority changes across destination countries and origin countries, a common trait of all host countries is that migrants from the New EU Member States have the shortest average migration seniority relative to both EU15 and non-EU migrants.9 However, it is worth noting that in 2016 the share of newly arrived immigrants from outside of the EU in Italy, Spain and Sweden was higher than the share of newly arrived immigrants from the Central and Eastern EU countries.
IMMIGRANT POPULATION: SIZE AND CHARACTERISTICS
Between 1995 and 2016, the immigrant population has increased in all countries, although at a very heterogeneous rate (Figure 11).
Figure 11: Immigrants as a share of total population
Immigrant population: size and characteristics
Between 1995 and 2016, the immigrant population has increased in all countries, although at a very
heterogeneous rate (Figure 11).
Figure 11: Immigrants as a share of total population
3332
The widespread increase in the foreign-born population has been coupled with a decrease in the importance of Western Europe as area of origin. Even though most immigrants are from non-EU15 countries both in 1995 and 2016, the share of EU15 immigrants in the foreign population has declined over this period in all countries. Following the fifth and sixth rounds of EU enlargement in 2004 and 2007, we are able to separately identify in the data citizens from the New EU Member States. Their presence is especially relevant in Italy, Germany and the United Kingdom, where they represent respectively 23, 22 and 21% of the immigrant population, whereas they represent only a very small fraction of the foreign population in France.
Table 1: Immigrant distribution by origin
1995 2016
Fran
ce
EU 15 34% 24%
New EU Member States - 3%
Extra-EU 66% 73%
Ger
man
y EU 15 28% 23%
New EU Member States - 22%
Extra-EU 72% 56%
Ital
y*
EU 15 16% 8%
New EU Member States 14% 23%
Extra-EU 71% 68%
Spai
n
EU 15 41% 14%
New EU Member States - 16%
Extra-EU 59% 70%
Swed
en
EU 15 - 19%
New EU Member States - 10%
Extra-EU - 72%
UK
EU 15 31% 17%
New EU Member States - 21%
Extra-EU 69% 62%
* For Italy we report 2005 instead of 1995 figures due to data availability.
Figure 12: Migration seniority is high and increasing across most countriesDistribution of immigrants by years since migration, 2008-2016
Figure 12: Migration seniority is high and increasing across most countries
Distribution of immigrants by years since migration, 2008-2016
Part II: A Long term integration: an analysis of the last twenty yearsPart II: A Long term integration: an analysis of the last twenty years
3534
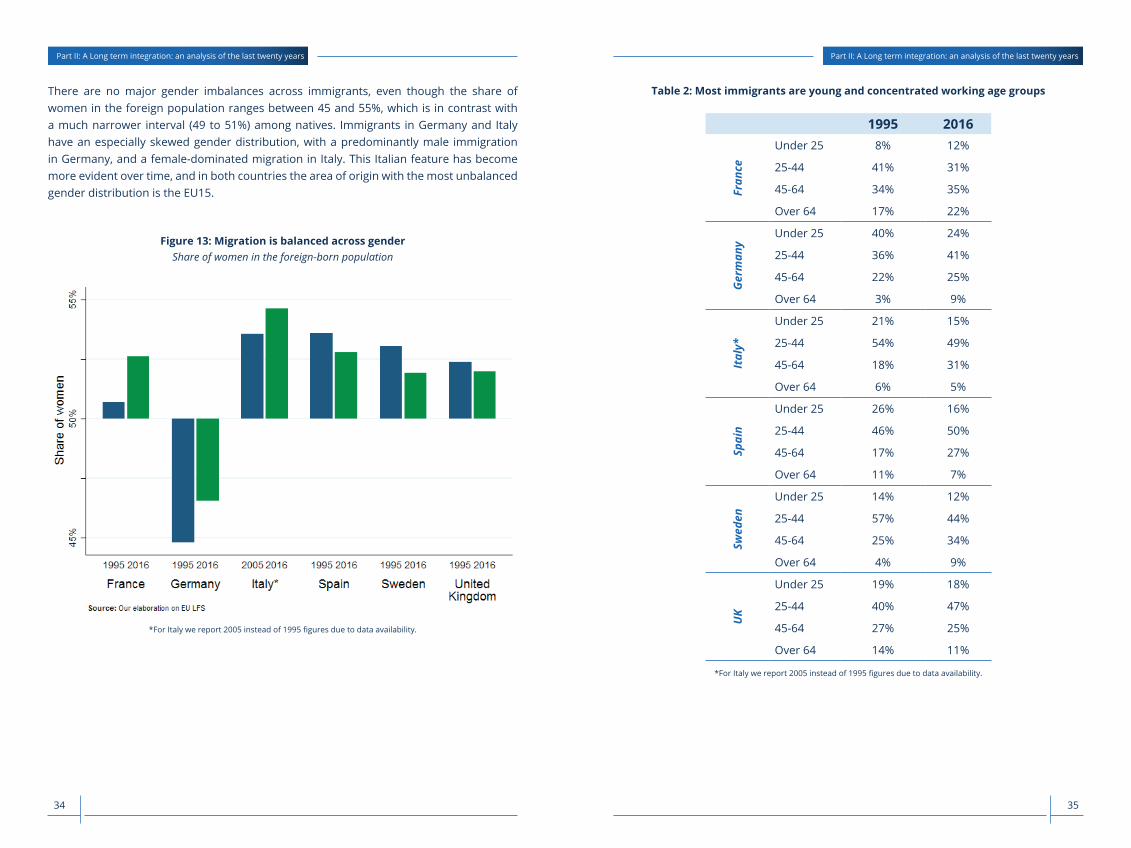
Table 2: Most immigrants are young and concentrated working age groups
1995 2016
Fran
ce
Under 25 8% 12%
25-44 41% 31%
45-64 34% 35%
Over 64 17% 22%
Ger
man
y
Under 25 40% 24%
25-44 36% 41%
45-64 22% 25%
Over 64 3% 9%
Ital
y*
Under 25 21% 15%
25-44 54% 49%
45-64 18% 31%
Over 64 6% 5%
Spai
n
Under 25 26% 16%
25-44 46% 50%
45-64 17% 27%
Over 64 11% 7%
Swed
en
Under 25 14% 12%
25-44 57% 44%
45-64 25% 34%
Over 64 4% 9%
UK
Under 25 19% 18%
25-44 40% 47%
45-64 27% 25%
Over 64 14% 11%
*For Italy we report 2005 instead of 1995 figures due to data availability.
There are no major gender imbalances across immigrants, even though the share of women in the foreign population ranges between 45 and 55%, which is in contrast with a much narrower interval (49 to 51%) among natives. Immigrants in Germany and Italy have an especially skewed gender distribution, with a predominantly male immigration in Germany, and a female-dominated migration in Italy. This Italian feature has become more evident over time, and in both countries the area of origin with the most unbalanced gender distribution is the EU15.
Figure 13: Migration is balanced across genderShare of women in the foreign-born population
There are no major gender imbalances across immigrants, even though the share of women in the
foreign population ranges between 45 and 55%, which is in contrast with a much narrower interval
(49 to 51%) among natives. Immigrants in Germany and Italy have an especially skewed gender
distribution, with a predominantly male immigration in Germany, and a female-dominated
migration in Italy. This Italian feature has become more evident over time, and in both countries the
area of origin with the most unbalanced gender distribution is the EU15.
Figure 13: Migration is balanced across gender Share of women in the foreign-born population
*For Italy we report 2005 instead of 1995 figures due to data availability *For Italy we report 2005 instead of 1995 figures due to data availability.
Part II: A Long term integration: an analysis of the last twenty yearsPart II: A Long term integration: an analysis of the last twenty years
3736
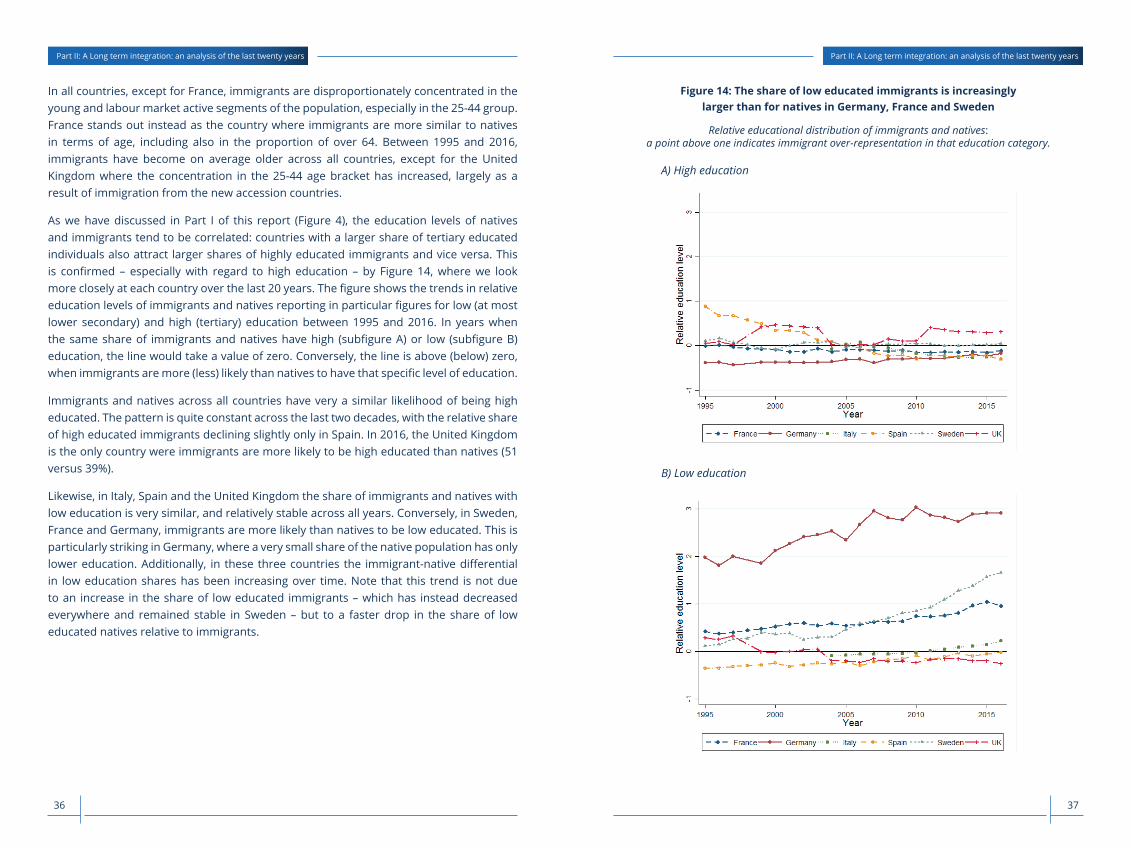
Figure 14: The share of low educated immigrants is increasingly larger than for natives in Germany, France and Sweden
Relative educational distribution of immigrants and natives: a point above one indicates immigrant over-representation in that education category.
A) High education
Figure 14: The share of low educated immigrants is increasingly larger than for natives in Germany, France and Sweden
Relative educational distribution of immigrants and natives: a point above one indicates immigrant over-representation in that education category.
A) High education
B) Low education
B) Low education
Figure 14: The share of low educated immigrants is increasingly larger than for natives in Germany, France and Sweden
Relative educational distribution of immigrants and natives: a point above one indicates immigrant over-representation in that education category.
A) High education
B) Low education
In all countries, except for France, immigrants are disproportionately concentrated in the young and labour market active segments of the population, especially in the 25-44 group. France stands out instead as the country where immigrants are more similar to natives in terms of age, including also in the proportion of over 64. Between 1995 and 2016, immigrants have become on average older across all countries, except for the United Kingdom where the concentration in the 25-44 age bracket has increased, largely as a result of immigration from the new accession countries.
As we have discussed in Part I of this report (Figure 4), the education levels of natives and immigrants tend to be correlated: countries with a larger share of tertiary educated individuals also attract larger shares of highly educated immigrants and vice versa. This is confirmed – especially with regard to high education – by Figure 14, where we look more closely at each country over the last 20 years. The figure shows the trends in relative education levels of immigrants and natives reporting in particular figures for low (at most lower secondary) and high (tertiary) education between 1995 and 2016. In years when the same share of immigrants and natives have high (subfigure A) or low (subfigure B) education, the line would take a value of zero. Conversely, the line is above (below) zero, when immigrants are more (less) likely than natives to have that specific level of education.
Immigrants and natives across all countries have very a similar likelihood of being high educated. The pattern is quite constant across the last two decades, with the relative share of high educated immigrants declining slightly only in Spain. In 2016, the United Kingdom is the only country were immigrants are more likely to be high educated than natives (51 versus 39%).
Likewise, in Italy, Spain and the United Kingdom the share of immigrants and natives with low education is very similar, and relatively stable across all years. Conversely, in Sweden, France and Germany, immigrants are more likely than natives to be low educated. This is particularly striking in Germany, where a very small share of the native population has only lower education. Additionally, in these three countries the immigrant-native differential in low education shares has been increasing over time. Note that this trend is not due to an increase in the share of low educated immigrants – which has instead decreased everywhere and remained stable in Sweden – but to a faster drop in the share of low educated natives relative to immigrants.
Part II: A Long term integration: an analysis of the last twenty yearsPart II: A Long term integration: an analysis of the last twenty years
3938
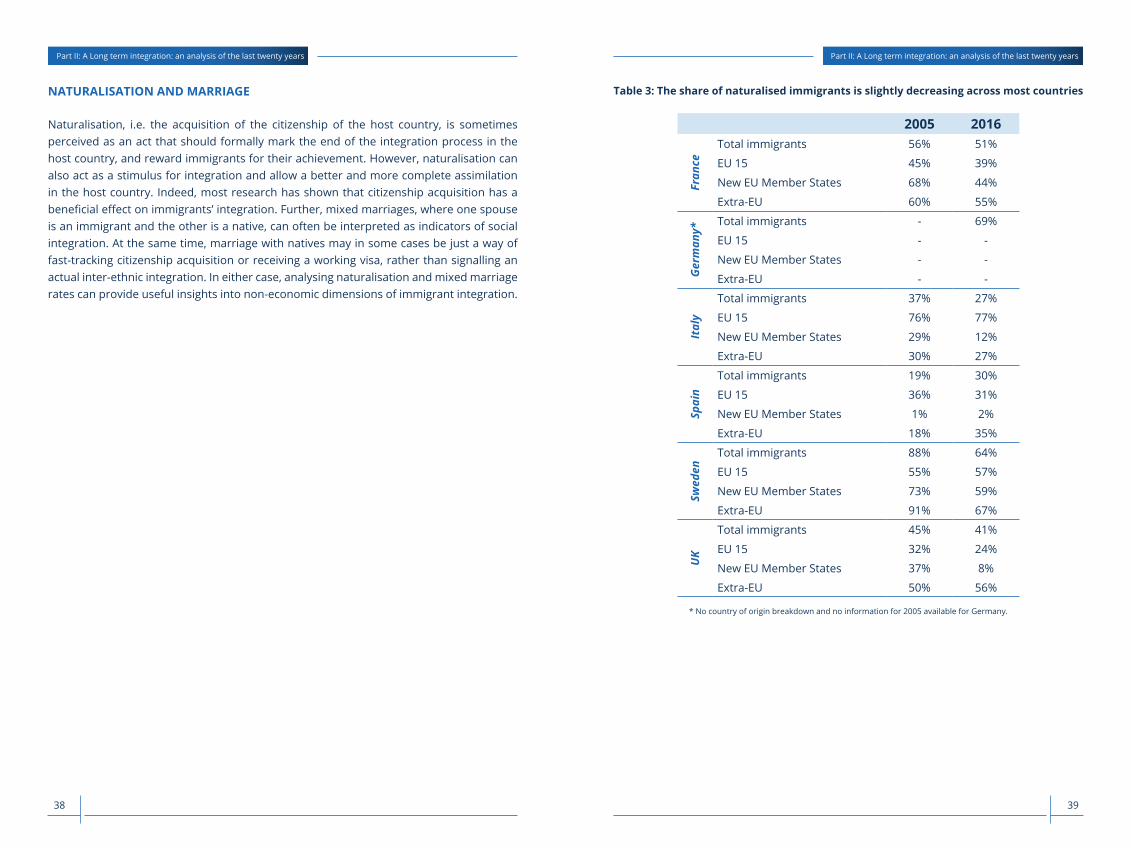
Table 3: The share of naturalised immigrants is slightly decreasing across most countries
2005 2016
Fran
ce
Total immigrants 56% 51%
EU 15 45% 39%
New EU Member States 68% 44%
Extra-EU 60% 55%
Ger
man
y*
Total immigrants - 69%
EU 15 - -
New EU Member States - -
Extra-EU - -
Ital
y
Total immigrants 37% 27%
EU 15 76% 77%
New EU Member States 29% 12%
Extra-EU 30% 27%
Spai
n
Total immigrants 19% 30%
EU 15 36% 31%
New EU Member States 1% 2%
Extra-EU 18% 35%
Swed
en
Total immigrants 88% 64%
EU 15 55% 57%
New EU Member States 73% 59%
Extra-EU 91% 67%
UK
Total immigrants 45% 41%
EU 15 32% 24%
New EU Member States 37% 8%
Extra-EU 50% 56%
* No country of origin breakdown and no information for 2005 available for Germany.
NATURALISATION AND MARRIAGE
Naturalisation, i.e. the acquisition of the citizenship of the host country, is sometimes perceived as an act that should formally mark the end of the integration process in the host country, and reward immigrants for their achievement. However, naturalisation can also act as a stimulus for integration and allow a better and more complete assimilation in the host country. Indeed, most research has shown that citizenship acquisition has a beneficial effect on immigrants’ integration. Further, mixed marriages, where one spouse is an immigrant and the other is a native, can often be interpreted as indicators of social integration. At the same time, marriage with natives may in some cases be just a way of fast-tracking citizenship acquisition or receiving a working visa, rather than signalling an actual inter-ethnic integration. In either case, analysing naturalisation and mixed marriage rates can provide useful insights into non-economic dimensions of immigrant integration.
Part II: A Long term integration: an analysis of the last twenty yearsPart II: A Long term integration: an analysis of the last twenty years
4140
10 Information on naturalisation procedures and requirements are based on the reports of the Global Citizenship Observatory (GLOBALCIT). http://globalcit.eu/country-profiles/11 These requirements apply to foreign individuals who naturalise through permanent residency. Different requirements apply to foreigners who naturalise through different channels (e.g. marriage).
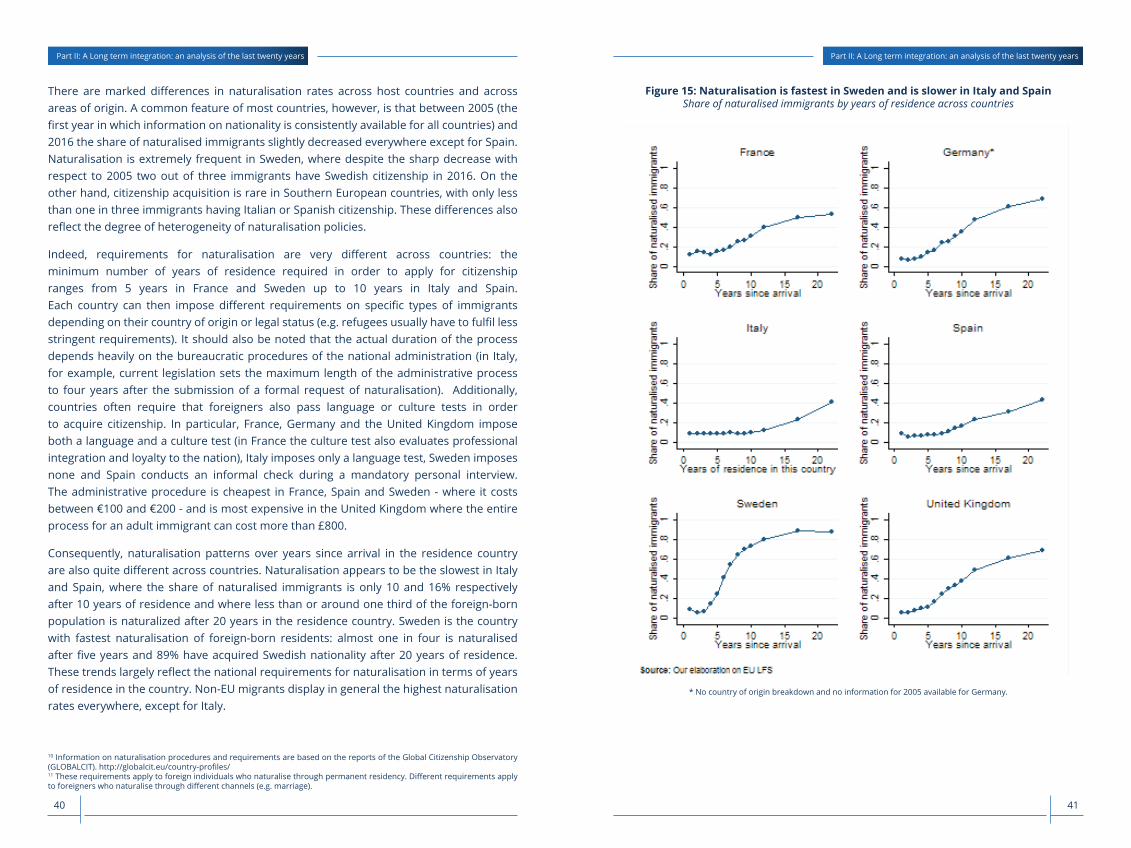
Figure 15: Naturalisation is fastest in Sweden and is slower in Italy and SpainShare of naturalised immigrants by years of residence across countries
terms of years of residence in the country. Non-EU migrants display in general the highest
naturalisation rates everywhere, except for Italy.
Figure 15: Naturalisation is fastest in Sweden and is slower in Italy and Spain Share of naturalised immigrants by years of residence across countries
* No country of origin breakdown and no information for 2005 available for Germany. * No country of origin breakdown and no information for 2005 available for Germany.
There are marked differences in naturalisation rates across host countries and across areas of origin. A common feature of most countries, however, is that between 2005 (the first year in which information on nationality is consistently available for all countries) and 2016 the share of naturalised immigrants slightly decreased everywhere except for Spain. Naturalisation is extremely frequent in Sweden, where despite the sharp decrease with respect to 2005 two out of three immigrants have Swedish citizenship in 2016. On the other hand, citizenship acquisition is rare in Southern European countries, with only less than one in three immigrants having Italian or Spanish citizenship. These differences also reflect the degree of heterogeneity of naturalisation policies.
Indeed, requirements for naturalisation are very different across countries: the minimum number of years of residence required in order to apply for citizenship ranges from 5 years in France and Sweden up to 10 years in Italy and Spain.
Each country can then impose different requirements on specific types of immigrants depending on their country of origin or legal status (e.g. refugees usually have to fulfil less stringent requirements). It should also be noted that the actual duration of the process depends heavily on the bureaucratic procedures of the national administration (in Italy, for example, current legislation sets the maximum length of the administrative process to four years after the submission of a formal request of naturalisation). Additionally, countries often require that foreigners also pass language or culture tests in order to acquire citizenship. In particular, France, Germany and the United Kingdom impose both a language and a culture test (in France the culture test also evaluates professional integration and loyalty to the nation), Italy imposes only a language test, Sweden imposes none and Spain conducts an informal check during a mandatory personal interview. The administrative procedure is cheapest in France, Spain and Sweden - where it costs between €100 and €200 - and is most expensive in the United Kingdom where the entire process for an adult immigrant can cost more than £800.
Consequently, naturalisation patterns over years since arrival in the residence country are also quite different across countries. Naturalisation appears to be the slowest in Italy and Spain, where the share of naturalised immigrants is only 10 and 16% respectively after 10 years of residence and where less than or around one third of the foreign-born population is naturalized after 20 years in the residence country. Sweden is the country with fastest naturalisation of foreign-born residents: almost one in four is naturalised after five years and 89% have acquired Swedish nationality after 20 years of residence. These trends largely reflect the national requirements for naturalisation in terms of years of residence in the country. Non-EU migrants display in general the highest naturalisation rates everywhere, except for Italy.
Part II: A Long term integration: an analysis of the last twenty yearsPart II: A Long term integration: an analysis of the last twenty years
4342
Table 5: Most immigrants are married, and immigrant marriages are prevalentShare of immigrants living with a partner in the host country,
and share of immigrants married to another immigrant
1995 2016
Fran
ce Immigrants living with partner 70% 63%
Of which with an immigrant partner 60% 59%
Ger
man
y Immigrants living with partner 48% 51%
Of which with an immigrant partner 78% 68%
Ital
y*
Immigrants living with partner 53% 54%
Of which with an immigrant partner 56% 70%
Spai
n Immigrants living with partner 49% 58%
Of which with an immigrant partner 32% 72%
UK
Immigrants living with partner 55% 58%
Of which with an immigrant partner 56% 71%
*For Italy we report 2005 instead of 1995 figures due to data availability.
EMPLOYMENT
As we have noted in Part I, the employment rate of immigrants is generally lower than natives’ throughout Europe. However, the size of the gaps and their evolution over time have been different across countries (Figure 16 and Figure 17).
Southern European countries are structurally characterised by lower employment probabilities for both natives and immigrants, a feature that is persistent over time. However, in both Italy and Spain, immigrant employment probability was initially higher or the same as natives. Immigrants’ employment probability then declined over time, becoming lower than natives’ by 2009 in Spain and reaching the natives’ level around 2012 in Italy. On the other hand, immigrants in the two Central European countries, France and Germany, display an employment probability that is always lower than natives’: by 2016
Table 4: Naturalisation rates over years of residence differ widely across countries
5 years 10 years 15-19 years
Fran
ce
Total immigrants 15% 31% 50%
EU 15 11% 12% 23%
New EU Member States 5% 20% 55%
Extra-EU 17% 36% 56%
Ger
man
y*
Total immigrants 14% 35% 61%
EU 15 - - -
New EU Member States - - -
Extra-EU - - -
Ital
y
Total immigrants 9% 10% 23%
EU 15 41% 49% 56%
New EU Member States 5% 7% 18%
Extra-EU 9% 10% 21%
Spai
n
Total immigrants 7% 16% 31%
EU 15 5% 8% 13%
New EU Member States 1% 1% 3%
Extra-EU 9% 20% 40%
Swed
en
Total immigrants 24% 74% 89%
EU 15 11% 30% 44%
New EU Member States 7% 57% 87%
Extra-EU 29% 84% 94%
UK
Total immigrants 11% 38% 61%
EU 15 7% 15% 28%
New EU Member States 1% 6% 34%
Extra-EU 17% 51% 70%
* No country of origin breakdown and no information for 2005 available for Germany.
In all countries and years, about 50% of immigrants cohabit with their spouse (we do not distinguish between legally married and cohabiting couples, and refer to “marriage” to indicate both). France stands out with two out of three immigrants being married in 2016, and even 70% in 1995. In most other countries the share of married individuals has increased over time, together with the overall immigrant share (Figure 11) and the average years since migration (Figure 12). At the same time, however, most immigrants are married to other immigrants, and this feature is remarkably similar in all of the countries we are considering: in 2016 about 70% of married immigrants had an immigrant partner everywhere except in France where the share was slightly lower (59%).
Part II: A Long term integration: an analysis of the last twenty yearsPart II: A Long term integration: an analysis of the last twenty years
4544
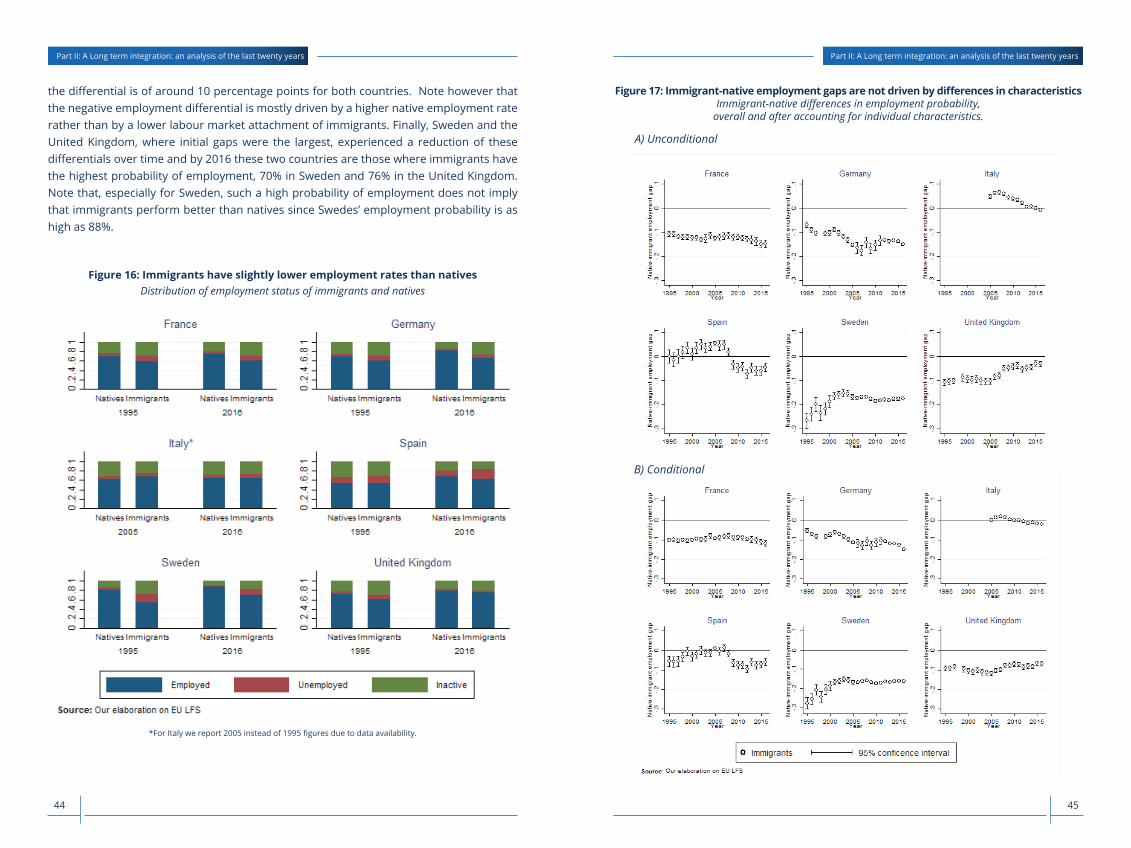
Figure 17: Immigrant-native employment gaps are not driven by differences in characteristicsImmigrant-native differences in employment probability,
overall and after accounting for individual characteristics.
A) Unconditional
Figure 17: Immigrant-native employment gaps are not driven by differences in characteristics Immigrant-native differences in employment probability, overall and after accounting for individual characteristics.
A) Unconditional
B) Conditional
the differential is of around 10 percentage points for both countries. Note however that the negative employment differential is mostly driven by a higher native employment rate rather than by a lower labour market attachment of immigrants. Finally, Sweden and the United Kingdom, where initial gaps were the largest, experienced a reduction of these differentials over time and by 2016 these two countries are those where immigrants have the highest probability of employment, 70% in Sweden and 76% in the United Kingdom. Note that, especially for Sweden, such a high probability of employment does not imply that immigrants perform better than natives since Swedes’ employment probability is as high as 88%.
Figure 16: Immigrants have slightly lower employment rates than natives Distribution of employment status of immigrants and natives
probability of employment, 70% in Sweden and 76% in the United Kingdom. Note that, especially
for Sweden, such a high probability of employment does not imply that immigrants perform better
than natives since Swedes’ employment probability is as high as 88%.
Figure 16: Immigrants have slightly lower employment rates than natives Distribution of employment status of immigrants and natives
*For Italy we report 2005 instead of 1995 figures due to data availability *For Italy we report 2005 instead of 1995 figures due to data availability.
B) Conditional
Part II: A Long term integration: an analysis of the last twenty yearsPart II: A Long term integration: an analysis of the last twenty years
4746
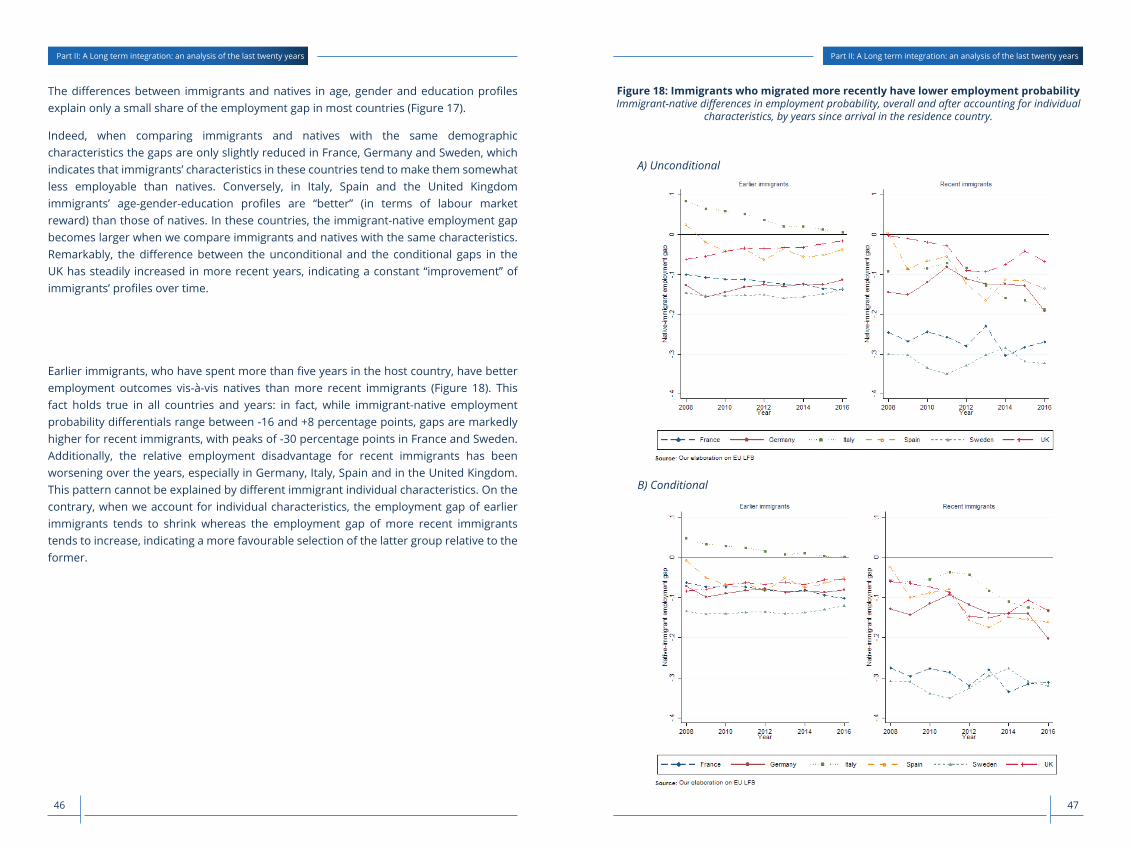
Figure 18: Immigrants who migrated more recently have lower employment probabilityImmigrant-native differences in employment probability, overall and after accounting for individual
characteristics, by years since arrival in the residence country.
A) Unconditional
Figure 18: Immigrants who migrated more recently have lower employment probability
Immigrant-native differences in employment probability, overall and after accounting for individual characteristics, by years since arrival in the residence country.
A) Unconditional
B) Conditional
As immigrants spend time in the host country and acquire key country-specific skills like, for
instance, language, their labour market outcomes generally tend to improve. This process of labour
B) Conditional
Figure 18: Immigrants who migrated more recently have lower employment probability
Immigrant-native differences in employment probability, overall and after accounting for individual characteristics, by years since arrival in the residence country.
A) Unconditional
B) Conditional
As immigrants spend time in the host country and acquire key country-specific skills like, for
instance, language, their labour market outcomes generally tend to improve. This process of labour
The differences between immigrants and natives in age, gender and education profiles explain only a small share of the employment gap in most countries (Figure 17).
Indeed, when comparing immigrants and natives with the same demographic characteristics the gaps are only slightly reduced in France, Germany and Sweden, which indicates that immigrants’ characteristics in these countries tend to make them somewhat less employable than natives. Conversely, in Italy, Spain and the United Kingdom immigrants’ age-gender-education profiles are “better” (in terms of labour market reward) than those of natives. In these countries, the immigrant-native employment gap becomes larger when we compare immigrants and natives with the same characteristics. Remarkably, the difference between the unconditional and the conditional gaps in the UK has steadily increased in more recent years, indicating a constant “improvement” of immigrants’ profiles over time.
Earlier immigrants, who have spent more than five years in the host country, have better employment outcomes vis-à-vis natives than more recent immigrants (Figure 18). This fact holds true in all countries and years: in fact, while immigrant-native employment probability differentials range between -16 and +8 percentage points, gaps are markedly higher for recent immigrants, with peaks of -30 percentage points in France and Sweden. Additionally, the relative employment disadvantage for recent immigrants has been worsening over the years, especially in Germany, Italy, Spain and in the United Kingdom. This pattern cannot be explained by different immigrant individual characteristics. On the contrary, when we account for individual characteristics, the employment gap of earlier immigrants tends to shrink whereas the employment gap of more recent immigrants tends to increase, indicating a more favourable selection of the latter group relative to the former.
Part II: A Long term integration: an analysis of the last twenty yearsPart II: A Long term integration: an analysis of the last twenty years
4948
12 As pointed out in Part I, note that some caution should be exercised in interpreting results on the role of years since migration on integration when only cross-sectional data are available. In fact, in the absence of longitudinal data it is not possible to disentangle a “cohort effect” – due to the different composition of subsequent cohorts - from the “residence effect” – which should identify the assimilation process.
As immigrants spend time in the host country and acquire key country-specific skills like, for instance, language, their labour market outcomes generally tend to improve. This process of labour market assimilation is evident by looking at the evolution of employment probability gaps with respect to natives by years since migration (Figure 19)12.
While in all countries immigrants’ employment probability tends to converge to that of natives, full convergence is not achieved in any country except for Italy, where immigrant employment probability becomes higher than that of natives after six years since migration. In the other countries, immigrant assimilation patterns appear to stabilise after ten or fifteen years of residence in the country.
One year after migration, immigrants’ employment probability is significantly lower than for natives everywhere. The differential is especially large in Italy (-40 p.p.), France (-42.1 p.p.) and Sweden (-39.8 p.p.). After ten years in the host country, immigrants have higher or very similar employment probability than natives in Italy (4.7 p.p.), the United Kingdom (-1.5 p.p.) and Spain (-3.2 p.p.). Differentials are larger in France (-12 p.p.), Germany (-14.8 p.p.) and Sweden (-17 p.p.).
Perhaps unsurprisingly, EU immigrants from both the EU15 and the New Member States have in general lower initial employment gaps, and they tend to close the gap faster than non-EU immigrants. The faster assimilation may partly be due to their cultural proximity and thus to the higher portability of their skills across European countries. Additionally, the lower intra-EU mobility costs guaranteed by the EU citizenship make it easier for them to move across countries – including returning to their country of origin – in case of an unsuccessful labour market integration.
While controlling for individual characteristics does not significantly change the shape of the assimilation profiles, the patterns change across education levels (Figure 20). The changes, however, are not homogeneous across countries. In fact, low educated immigrants are less likely to be employed with respect to natives than more educated immigrants in Sweden and the United Kingdom. In all the other countries, low educated immigrants perform relatively better than those with high education; indeed, the former reach native employment levels after around ten years in the country. It is worth noting that the overall result of faster employment assimilation in Italy and positive employment gaps after a few years in the country is entirely driven by low educated immigrants.
Figure 19: Employment assimilation of immigrants over timeA) Immigrant-native differences in employment probability by years since migration
market assimilation is evident by looking at the evolution of employment probability gaps with
respect to natives by years since migration (Figure 19)12.
Figure 19: Employment assimilation of immigrants over time Immigrant-native differences in employment probability by years since migration
Immigrant-native differences in employment probability by years since migration, conditional on individual characteristics
12 As pointed out in Part I, note that some caution should be exercised in interpreting results on the role of years since migration on integration when only cross-sectional data are available. In fact, in the absence of longitudinal data it is not possible to disentangle a “cohort effect” – due to the different composition of subsequent cohorts - from the “residence effect” – which should identify the assimilation process.
B) Immigrant-native differences in employment probability by years since migration, conditional on individual characteristics
market assimilation is evident by looking at the evolution of employment probability gaps with
respect to natives by years since migration (Figure 19)12.
Figure 19: Employment assimilation of immigrants over time Immigrant-native differences in employment probability by years since migration
Immigrant-native differences in employment probability by years since migration, conditional on individual characteristics
12 As pointed out in Part I, note that some caution should be exercised in interpreting results on the role of years since migration on integration when only cross-sectional data are available. In fact, in the absence of longitudinal data it is not possible to disentangle a “cohort effect” – due to the different composition of subsequent cohorts - from the “residence effect” – which should identify the assimilation process.
Part II: A Long term integration: an analysis of the last twenty yearsPart II: A Long term integration: an analysis of the last twenty years
5150
INCOME
Information on individual earnings is scant, when compared to other labour market characteristics: we only observe individuals’ position in the national earnings distribution, and information is available since 2009 in most countries, except for Sweden for which we have no income information in any year. Immigrants generally have lower earnings than natives. In particular, in most of the years for which we have data, and for all countries, immigrants have a higher probability of being in the bottom decile of the national income distribution than natives (Figure 21 A). The gap is lowest for the UK, where it also decreases over time, so that by 2013 the difference is no longer statistically significant. On the other hand, the gap is largest for Italy and Spain, and it has increased in the years following the economic crisis: in the years 2012-2014 immigrants were over 12 percentage points more likely than natives (i.e. more than twice as likely) to be in the 10% of the population with the lowest income. Differences in individual characteristics between immigrants and natives do not explain these gaps in any country (Figure 21 B). If anything, the gaps only modestly increase in the UK (indicating once again the more favourable selection of immigrants in that country). On the other hand, job and occupational characteristics account for about half of the immigrant-native gap in all countries. In particular, when we compare immigrants and natives who have similar individual characteristics and work in similar occupations, controlling also for part time employment, immigrants are more likely to be in the bottom decile of the income distribution by only between 0 and 2.6 percentage points in all the considered countries and years (Figure 21 C).
While we have shown earlier that immigrants’ employment probability converges – though not always completely – to that of natives with time since migration, the same does not always happen for earnings. In fact, the differential in probability of being in the bottom income decile is remarkably stable over years since migration in France, Germany and the United Kingdom, the three countries where the initial gap is lowest at 6, 5 and 0 percentage points respectively. On the contrary, in Italy and Spain initial gaps are much larger at 22 and 13 percentage points, but then immigrants’ probability of being in the bottom income decile diminishes with time spent in the country, and gaps converge to those of other countries. After 11 to 14 years since migration the gap between immigrants and natives is very similar everywhere, ranging from 7 to 12 percentage points, and convergence continues in subsequent years (6.7 to 9.6 p.p. after 15-19 years), except in the United Kingdom where it is permanently lower than 3 percentage points regardless of time spent in the country (Figure 22 A).
As we have already noted above, individual characteristics do not explain immigrant assimilation patterns (Figure 22 B). Conversely, when we compare immigrants with natives with similar individual characteristics, working in the same occupation for the same number of hours, the gaps drastically diminish. In particular, they are always smaller than 4 percentage points – except for France and, only for the first year after arrival, for Italy – and become very small or not statistically different from zero after 20 years spent in the country (Figure 22 C). Therefore, occupational segregation and working conditions are the driving force behind immigrant-native gaps at all stages of the migration experience and in all countries.
Figure 20: Employment assimilation is faster for low educated immigrants in Spain and Italy and for high educated immigrants in Sweden
Immigrant-native differences in employment probability by education
A) Low education
Figure 20: Employment assimilation is faster for low educated immigrants in Spain and Italy and for high educated immigrants in Sweden
Immigrant-native differences in employment probability by education
A) Low education
B) High education B) High education
Figure 20: Employment assimilation is faster for low educated immigrants in Spain and Italy and for high educated immigrants in Sweden
Immigrant-native differences in employment probability by education
A) Low education
B) High education
Part II: A Long term integration: an analysis of the last twenty yearsPart II: A Long term integration: an analysis of the last twenty years
5352
C) Conditional on individual, job and occupation characteristicsC) Conditional on individual, job and occupation characteristics
Information on individual earnings is scant, when compared to other labour market characteristics:
we only observe individuals’ position in the national earnings distribution, and information is
available since 2009 in most countries, except for Sweden for which we have no income
information in any year. Immigrants generally have lower earnings than natives. In particular, in
most of the years for which we have data, and for all countries, immigrants have a higher
probability of being in the bottom decile of the national income distribution than natives (Figure 21
A). The gap is lowest for the UK, where it also decreases over time, so that by 2013 the difference
is no longer statistically significant. On the other hand, the gap is largest for Italy and Spain, and it
has increased in the years following the economic crisis: in the years 2012-2014 immigrants were
over 12 percentage points more likely than natives (i.e. more than twice as likely) to be in the 10%
of the population with the lowest income. Differences in individual characteristics between
immigrants and natives do not explain these gaps in any country (Figure 21 B). If anything, the gaps
only modestly increase in the UK (indicating once again the more favourable selection of
immigrants in that country). On the other hand, job and occupational characteristics account for
about half of the immigrant-native gap in all countries. In particular, when we compare immigrants
and natives who have similar individual characteristics and work in similar occupations, controlling
also for part time employment, immigrants are more likely to be in the bottom decile of the income
Figure 21: Immigrants have a higher probability of being in the bottom income decileImmigrant-native difference in probability of being in bottom decile
A) Unconditional
Income
Figure 21: Immigrants have a higher probability of being in the bottom income decile Immigrant-native difference in probability of being in bottom decile
A) Unconditional
B) Conditional on individual characteristics
B) Conditional on individual characteristics
Income
Figure 21: Immigrants have a higher probability of being in the bottom income decile Immigrant-native difference in probability of being in bottom decile
A) Unconditional
B) Conditional on individual characteristics
Part II: A Long term integration: an analysis of the last twenty yearsPart II: A Long term integration: an analysis of the last twenty years
5554
13 Due to data availability, the first year is 2005 in Italy and 1997 in Sweden.
C) Conditional on individual, job and occupation characteristicsC) Conditional on individual, job and occupation characteristics
Occupation
Occupational distribution explains most of the immigrant-native earnings gap, regardless of
migration seniority. How, then, does the occupational distribution of immigrants differ from that of
natives? As we did in Part I, we can measure occupational status with the Socio-Economic Index of
Occupational Status (ISEI), where higher values of the index correspond to occupations with a
higher socio-economic status. We report in Figure 23 the difference in the distribution of
immigrants and natives along deciles of the ISEI scale in 1995 and 2016:13 if immigrants’ and
natives’ occupational status distribution were identical, the graph would show a straight line at 0.
Conversely, bars will be above 0 in those points of the occupational status scale where immigrants
are relatively more concentrated than natives, and below zero where they are relatively less
concentrated. The figure shows that, overall, immigrants tend to be more concentrated than natives
in the bottom deciles of the ISEI distribution and less concentrated in the middle. This difference in
occupational status distribution implies that, on average, immigrants have lower occupational status
than natives. The disproportionate concentration of immigrants at the bottom of the occupational
status distribution has significantly increased in 2016 relative to 1995 in all countries.
13 Due to data availability, the first year is 2005 in Italy and 1997 in Sweden.
OCCUPATION
Occupational distribution explains most of the immigrant-native earnings gap, regardless of migration seniority. How, then, does the occupational distribution of immigrants differ from that of natives? As we did in Part I, we can measure occupational status with the Socio-Economic Index of Occupational Status (ISEI), where higher values of the index correspond to occupations with a higher socio-economic status. We report in Figure 23 the difference in the distribution of immigrants and natives along deciles of the ISEI scale in 1995 and 2016:13
if immigrants’ and natives’ occupational status distribution were identical, the graph would show a straight line at 0. Conversely, bars will be above 0 in those points of the occupational status scale where immigrants are relatively more concentrated than natives, and below zero where they are relatively less concentrated. The figure shows that, overall, immigrants tend to be more concentrated than natives in the bottom deciles of the ISEI distribution and less concentrated in the middle. This difference in occupational status distribution implies that, on average, immigrants have lower occupational status than natives. The disproportionate concentration of immigrants at the bottom of the occupational status distribution has significantly increased in 2016 relative to 1995 in all countries.
Figure 22: Immigrant-native differences in the probability of being in bottom decile decrease with time spent in the residence country
Assimilation of Immigrant-native difference in probability of being in bottom decile
A) Unconditional
Figure 22: Immigrant-native differences in the probability of being in bottom decile decrease with time spent in the residence country
Assimilation of Immigrant-native difference in probability of being in bottom decile
A) Unconditional
B) Conditional on individual characteristics
B) Conditional on individual characteristics
Figure 22: Immigrant-native differences in the probability of being in bottom decile decrease with time spent in the residence country
Assimilation of Immigrant-native difference in probability of being in bottom decile
A) Unconditional
B) Conditional on individual characteristics
Part II: A Long term integration: an analysis of the last twenty yearsPart II: A Long term integration: an analysis of the last twenty years
5756
Figure 24: Recent immigrants are more concentrated in low ranked occupations than earlier immigrants
Immigrant-native differences in distribution along occupational status scale, by years of residence
A) 2008
Figure 24: Recent immigrants are more concentrated in low ranked occupations than earlier
immigrants Immigrant-native differences in distribution along occupational status scale, by years of residence
A) 2008
B) 2016 B) 2016
Figure 24: Recent immigrants are more concentrated in low ranked occupations than earlier
immigrants Immigrant-native differences in distribution along occupational status scale, by years of residence
A) 2008
B) 2016
Figure 23: Higher and increasing concentration of immigrants in lowest ranked occupations
Immigrant-native differences in distribution along occupational status scaleFigure 23: Higher and increasing concentration of immigrants in lowest ranked occupations
Immigrant-native differences in distribution along occupational status scale
As highlighted above, recent immigrants tend to face more difficulties in labour market integration
than earlier immigrants. In line with this, their occupational status relative to natives is, in most
countries, worse than that of earlier immigrants. This feature did not change very much between
2008, the first year in which we have information on years of residence in the country, and 2016
(Figure 24). Remarkably, the UK is the country where recent immigrants are proportionally more
concentrated at the bottom of the occupational distribution than earlier immigrants – relative to
natives. This finding suggests that immigrants in the UK experience a significant occupational
upgrading during their permanence in the country, something that does not seem to happen in the
other countries.
*For Italy and Sweden, we report figures for, respectively, 2005 and 1997 instead of 1995 due to data availability *For Italy and Sweden, we report figures for, respectively, 2005 and 1997 instead of 1995 due to data availability.
As highlighted above, recent immigrants tend to face more difficulties in labour market integration than earlier immigrants. In line with this, their occupational status relative to natives is, in most countries, worse than that of earlier immigrants. This feature did not change very much between 2008, the first year in which we have information on years of residence in the country, and 2016 (Figure 24). Remarkably, the UK is the country where recent immigrants are proportionally more concentrated at the bottom of the occupational distribution than earlier immigrants – relative to natives. This finding suggests that immigrants in the UK experience a significant occupational upgrading during their permanence in the country, something that does not seem to happen in the other countries.
Part II: A Long term integration: an analysis of the last twenty yearsPart II: A Long term integration: an analysis of the last twenty years
5958
negotiation process with the EU. The salience of immigration in the UK policy debate can be explained by the constant increase of the foreign-born population that the country has experienced over the last twenty years, which has been among the fastest in the EU. However, immigrants in the UK are among the most highly educated in the whole EU and display a higher rate of tertiary education than the British population. Likewise, they perform remarkably well in terms of employment, income, and occupational status, not only in absolute terms, but especially relative to other EU countries. These observations suggest that economic considerations may not have played a major role in forming attitudes toward immigration, or that perceptions about the state of immigrants’ economic integration are disconnected from reality.
Conclusions
Europe has been a continent of immigration for many decades now. Despite the persistent heterogeneity in the size and characteristics of foreign residents across EU countries, over the last twenty years there has been a significant convergence in the share of immigrants in the population across EU15 countries. However, there is still substantial heterogeneity across countries in features like immigrants’ education levels. In particular, the report has – once again – documented a significant country-level correlation between the share of immigrants and natives with tertiary education, indicating that countries with a higher level of education of their native workforce are also able to attract better educated immigrants. Additionally, and contrary to public perceptions that are often shaped by the characteristics of the most recent immigrant inflows, most of the immigrants in the EU are from other European countries, and have lived in their country of residence for several years.
Upon arrival in the host country immigrants tend to have substantially worse labour market outcomes than natives, but their relative economic conditions improve over time. However, we have shown that in many dimensions they never fully converge to those of natives, even after accounting for differences in individual characteristics. The presence of a persistent immigrant gap is potentially concerning as it may undermine social cohesion. Remarkably, low educated immigrants are those who generally exhibit stronger convergence toward the labour market outcomes of similarly educated natives, whereas in many countries the most highly educated lag behind, which can result in an inefficient waste of foreign human capital. Finally, the report has documented a pervasive and substantial increase in immigrants’ concentration in the lowest ranked occupations during the last twenty years. The increased clustering of immigrants at the bottom of the occupational scale may sound as an alarm bell with respect to future integration paths. Perhaps the progressive restrictions of legal entry channels for work reasons can explain this trend. Many countries over the last years have virtually halted the issuance of new work permits, so that labour immigration has been only possible for EU citizens, with non-EU migrants coming only through the humanitarian or family reunification channels. Since humanitarian and family migrants are necessarily less favourably selected in terms of labour market skills that may be relevant for the destination country, the predominance of these two non-economic entry channels might imply a more difficult economic assimilation for the most recent cohorts of migrants.
Somehow ironically, this report gets published during what should be the last phases of the Brexit process. Many observers have pointed out that aversion to immigration has been among the main drivers of the British decision to leave the EU, and indeed the end to free movement of people has been one of the main UK objectives throughout the
Part II: A Long term integration: an analysis of the last twenty yearsPart II: A Long term integration: an analysis of the last twenty years
6160
Tables Appendix - Europe
The table reports, for each country, the share of immigrants from each area of origin out of the total immigrant population. The two bottom rows report the mean values for the EU15 countries as well as for all countries. Immigrants are defined as foreign born, except for Germany where they are defined as foreign nationals. Source: our elaboration on EULFS data 2017.
The table reports, for each country, the size of the immigrant population, expressed in thousands as well as a share of the total population. It also reports the size of the population of recent immigrants, defined as immigrants who have been in the country for at most five years. The two bottom rows report the mean values for the EU15 countries as well as for all countries. Immigrants are defined as foreign born, except for Germany where they are defined as foreign nationals. Source: our elaboration on EULFS data 2017.
Tables Appendix - EuropeTable A 2: Distribution of immigrants by area of origin
The table reports, for each country, the percentage point difference between immigrants and natives aged 25-64 in the probability of employment, overall and when differences in age, gender and education characteristics are taken into account. The differences are computed as coefficients on an immigrant dummy in a linear probability model. See Technical Appendix for details. *, **, *** indicate that the difference is statistically significant at the 10, 5 and 1 percent significance level, respectively. The two bottom rows report the mean values for EU15 countries as well as for all countries. Immigrants are defined as foreign born, except for Germany where they are defined as foreign nationals. Source: our elaboration on EULFS data 2017.
The table reports, for each country, the share of immigrants that are female. the share of immigrants aged 25 to 64 with at most lower secondary education (ISCED 0-2), the share of immigrants aged 25 to 64 with tertiary education (ISCED 5-8) and, by comparison, the corresponding shares among the native population. The two bottom rows report the mean values for EU15 countries as well as for all countries. Immigrants are defined as foreign born, except for Germany where they are defined as foreign nationals. Source: our elaboration on EULFS data 2017.
Table A 4: Employment gap between immigrants and natives, overall
The table reports, for each country and separately for immigrants who have been in the country for at most five years (recent) and for immigrants who have spent six or more years in the country (earlier), the percentage point difference between immigrants and natives aged 25-64, in the probability of employment, overall and when differences in age, gender and education characteristics are taken into account. The differences are computed as coefficients on an immigrant dummy in a linear probability model. See Technical Appendix for details. *, **, *** indicate that the difference is statistically significant at the 10, 5 and 1 percent significance level, respectively. The two bottom rows report the mean values for EU15 countries as well as for all countries. Immigrants are defined as foreign born, except for Germany where they are defined as foreign nationals. Source: our elaboration on EULFS data 2017.
The table reports, for each country and separately for EU and non-EU immigrants, the percentage point difference between immigrants and natives aged 25-64, in the probability of employment, overall and when differences in age, gender and education characteristics are taken into account. The differences are computed as coefficients on an immigrant dummy in a linear probability model. See Technical Appendix for details. *, **, *** indicate that the difference is statistically significant at the 10, 5 and 1 percent significance level, respectively. The two bottom rows report the mean values for EU15 countries as well as for all countries. Immigrants are defined as foreign born, except for Germany where they are defined as foreign nationals. Source: our elaboration on EULFS data 2017.
Table A 6: Employment gap between immigrants and natives, by years of residence
The table reports, for each country and separately for non-EU immigrants who have been in the country for at most five years (recent) and for non-EU immigrants who have spent six or more years in the country (earlier), the percentage point difference between immigrants and natives aged 25-64, in the probability of employment, overall and when differences in age, gender and education characteristics are taken into account. The differences are computed as coefficients on an immigrant dummy in a linear probability model. See Technical Appendix for details. *, **, *** indicate that the difference is statistically significant at the 10, 5 and 1 percent significance level, respectively. The two bottom rows report the mean values for EU15 countries as well as for all countries. Immigrants are defined as foreign born, except for Germany where they are defined as foreign nationals. Source: our elaboration on EULFS data 2017.
The table reports, for each country and separately for EU immigrants who have been in the country for at most five years (recent) and for EU immigrants who have spent six or more years in the country (earlier), the percentage point difference between immigrants and natives aged 25-64, in the probability of employment, overall and when differences in age, gender and education characteristics are taken into account. The differences are computed as coefficients on an immigrant dummy in a linear probability model. See Technical Appendix for details. *, **, *** indicate that the difference is statistically significant at the 10, 5 and 1 percent significance level, respectively. The two bottom rows report the mean values for EU15 countries as well as for all countries. Immigrants are defined as foreign born, except for Germany where they are defined as foreign nationals. Source: our elaboration on EULFS data 2017.
Table A 8: Employment gaps between Non-EU immigrants and natives, by years of residence
The table reports, for each country, and separately for EU and non-EU immigrants, the difference in occupational status, measured by the ISEI index, between immigrants and natives aged 25-64, overall and when differences in age, gender and education characteristics are taken into account. Each cell measures the difference expressed as a fraction of the within-country standard deviation. The differences are computed as coefficients on an immigrant dummy in a linear regression model. See Technical Appendix for details. *, **, *** indicate that the difference is statistically significant at the 10, 5 and 1 percent significance level, respectively. The two bottom rows report the mean values for EU15 countries as well as for all countries. Immigrants are defined as foreign born, except for Germany where they are defined as foreign nationals. Source: our elaboration on EULFS data 2017.
The table reports, for each country, the difference in occupational status, measured by the ISEI index, between immigrants and natives aged 25-64, overall and when differences in age, gender and education characteristics are taken into account. Each cell measures the difference expressed as a fraction of the within-country standard deviation. The differences are computed as coefficients on an immigrant dummy in a linear regression model. See Technical Appendix for details. *, **, *** indicate that the difference is statistically significant at the 10, 5 and 1 percent significance level, respectively. The two bottom rows report the mean values for EU15 countries as well as for all countries. Immigrants are defined as foreign born, except for Germany where they are defined as foreign nationals. Source: our elaboration on EULFS data 2017.
Table A 10: Differences in occupational status between immigrants and natives, by origin
The table reports, for each country, and separately for recent (in the country for at most five years) and earlier (in the country for six or more years) EU immigrants, the difference in occupational status, measured by the ISEI index, between EU immigrants and natives aged 25-64, overall and when differences in age, gender and education characteristics are taken into account. Each cell measures the difference expressed as a fraction of the within-country standard deviation. The differences are computed as coefficients on an immigrant dummy in a linear regression model. See Technical Appendix for details. *, **, *** indicate that the difference is statistically significant at the 10, 5 and 1 percent significance level, respectively. The two bottom rows report the mean values for EU15 countries as well as for all countries. Immigrants are defined as foreign born, except for Germany where they are defined as foreign nationals. Source: our elaboration on EULFS data 2017.
Table A 12: Gap in occupational status between EU immigrants and natives, by years of residence
The table reports, for each country, and separately for recent (in the country for at most five years) and earlier (in the country for six or more years) immigrants, the difference in occupational status, measured by the ISEI index, between immigrants and natives aged 25-64, overall and when differences in age, gender and education characteristics are taken into account. Each cell measures the difference expressed as a fraction of the within-country standard deviation. The differences are computed as coefficients on an immigrant dummy in a linear regression model. See Technical Appendix for details. *, **, *** indicate that the difference is statistically significant at the 10, 5 and 1 percent significance level, respectively. The two bottom rows report the mean values for EU15 countries as well as for all countries. Immigrants are defined as foreign born, except for Germany where they are defined as foreign nationals. Source: our elaboration on EULFS data 2017.
Table A 11: Differences in occupational status between immigrants and natives, by years of residence
The table reports, for each country, the percentage points difference in the probability of being in the bottom decile of the national income distribution between immigrants and natives aged 25-64, overall and when differences in age, gender and education characteristics are taken into account. or when, additionally, also differences in occupations and full/part time employment are taken into account. The differences are computed as coefficients on an immigrant dummy in a linear regression model. See Technical Appendix for details. *, **, *** indicate that the difference is statistically significant at the 10, 5 and 1 percent significance level, respectively. The two bottom rows report the mean values for EU15 countries as well as for all countries. Immigrants are defined as foreign born, except for Germany where they are defined as foreign nationals. Source: our elaboration on EULFS data 2017.
The table reports, for each country, and separately for recent (in the country for at most five years) and earlier (in the country for six or more years) non-EU immigrants, the difference in occupational status, measured by the ISEI index, between non-EU immigrants and natives aged 25-64, overall and when differences in age, gender and education characteristics are taken into account. Each cell measures the difference expressed as a fraction of the within-country standard deviation. The differences are computed as coefficients on an immigrant dummy in a linear regression model. See Technical Appendix for details. *, **, *** indicate that the difference is statistically significant at the 10, 5 and 1 percent significance level, respectively. The two bottom rows report the mean values for EU15 countries as well as for all countries. Immigrants are defined as foreign born, except for Germany where they are defined as foreign nationals. Source: our elaboration on EULFS data 2017.
Table A 14: Immigrant-native differences in probability of being in bottom income decile
The table reports, for each country, the percentage points difference in the probability of being in the bottom decile of the national income distribution between immigrants who have been in the country for at most five years and natives aged 25-64, overall and when differences in age, gender and education characteristics are taken into account. or when, additionally, also differences in occupations and full/part time employment are taken into account. The differences are computed as coefficients on an immigrant dummy in a linear regression model. See Technical Appendix for details. *, **, *** indicate that the difference is statistically significant at the 10, 5 and 1 percent significance level, respectively. The two bottom rows report the mean values for EU15 countries as well as for all countries. Immigrants are defined as foreign born, except for Germany where they are defined as foreign nationals. Source: our elaboration on EULFS data 2017.
Table A 15: Immigrant-native differences in probability of being in top income decile
The table reports, for each country, the percentage points difference in the probability of being in the top decile of the national income distribution between immigrants and natives aged 25-64, overall and when differences in age, gender and education characteristics are taken into account. or when, additionally, also differences in occupations and full/part time employment are taken into account. The differences are computed as coefficients on an immigrant dummy in a linear regression model. See Technical Appendix for details. *, **, *** indicate that the difference is statistically significant at the 10, 5 and 1 percent significance level, respectively. The two bottom rows report the mean values for EU15 countries as well as for all countries. Immigrants are defined as foreign born, except for Germany where they are defined as foreign nationals. Source: our elaboration on EULFS data 2017.
Tables Appendix - EuropeTables Appendix - Europe
7776
Table A 18: Differences in probability of being in bottom decile btw earlier immigrants and natives
The table reports, for each country, the percentage points difference in the probability of being in the bottom decile of the national income distribution between immigrants who have been in the country for six or more years and natives aged 25-64, overall and when differences in age, gender and education characteristics are taken into account. or when, additionally, also differences in occupations and full/part time employment are taken into account. The differences are computed as coefficients on an immigrant dummy in a linear regression model. See Technical Appendix for details. *, **, *** indicate that the difference is statistically significant at the 10, 5 and 1 percent significance level, respectively. The two bottom rows report the mean values for EU15 countries as well as for all countries. Immigrants are defined as foreign born, except for Germany where they are defined as foreign nationals. Source: our elaboration on EULFS data 2017.
Table A 17: Differences in probability of being in top decile between recent immigrants and nativesConditional on:
The table reports, for each country, the percentage points difference in the probability of being in the top decile of the national income distribution between immigrants who have been in the country for at most five years and natives aged 25-64, overall and when differences in age, gender and education characteristics are taken into account. or when, additionally, also differences in occupations and full/part time employment are taken into account. The differences are computed as coefficients on an immigrant dummy in a linear regression model. See Technical Appendix for details. *, **, *** indicate that the difference is statistically significant at the 10, 5 and 1 percent significance level, respectively. The two bottom rows report the mean values for EU15 countries as well as for all countries. Immigrants are defined as foreign born, except for Germany where they are defined as foreign nationals. Source: our elaboration on EULFS data 2017.
Tables Appendix - EuropeTables Appendix - Europe
7978
Table B 1: Immigrant stock in 1995 and 2016
1995 2016
Fran
ce
Total immigrants 9.3% 11.7%
EU 15 3.1% 2.8%
New EU Member States - 0.4%
Extra-EU 6.2% 8.5%
Ger
man
y
Total immigrants 8.3% 10.8%
EU 15 2.3% 2.4%
New EU Member States - 2.3%
Extra-EU 6.0% 6.0%
Ital
y*
Total immigrants 5.5% 9.7%
EU 15 0.9% 0.8%
New EU Member States 0.7% 2.3%
Extra-EU 3.9% 6.7%
Spai
n
Total immigrants 1.9% 11.7%
EU 15 0.8% 1.7%
New EU Member States - 1.9%
Extra-EU 1.1% 8.2%
Swed
en
Total immigrants 7.2% 20.0%
EU 15 - 3.7%
New EU Member States - 1.9%
Extra-EU 7.2% 15%
UK
Total immigrants 6.7% 14.6%
EU 15 2.0% 2.5%
New EU Member States - 3.0%
Extra-EU 4.8% 9.1%
The table reports, for each country, the size of the immigrant population, expressed as a share of the total population. It also reports the size of the population of immigrants by area of origin, defined as EU15, New EU Member States and Extra-EU. Immigrants are defined as foreign born, except for Germany where they are defined as foreign nationals. We report data for the first year available and for 2016. The first year available corresponds to 1995 for all countries except for Italy, where it is 2005. Source: our elaboration on EULFS data 1995-2016.
Table A 19: Differences in probability of being in top decile btw earlier immigrants and natives
Country
Conditional on:
Unconditional Individual characteristics
Individual characteristics and occupation
Belgium 0.003 0.017** 0.013*
Bulgaria -0.105*** -0.056*** -0.037**
Croatia 0.032** 0.040*** 0.034**
Cyprus -0.005 0.027*** 0.029***
Denmark -0.033*** -0.030*** -0.014**
Estonia -0.069*** -0.046*** -0.039***
Finland -0.051*** -0.022* -0.017
France -0.018*** -0.011 0.000
Germany -0.042*** -0.018*** -0.005**
Greece -0.077*** -0.027*** -0.005
Hungary 0.004 0.010 -0.004
Ireland 0.003 -0.018** -0.009
Italy -0.082*** -0.039*** -0.003
Latvia -0.051*** -0.021 -0.030
Lithuania -0.005 0.020 0.010
Luxembourg 0.019* 0.006 0.000
Malta 0.155*** 0.112*** 0.114***
Netherlands -0.024*** -0.010 -0.015**
Poland 0.073 0.002 -0.013
Portugal 0.010* -0.019*** -0.009*
Romania -0.033 -0.134*** -0.120**
Slovak Republic 0.057 0.040 0.026
Switzerland -0.010** 0.006 0.002
United Kingdom 0.055*** 0.023** 0.028***
EU15 -0.024*** -0.011*** 0.002
All -0.027*** -0.014*** -0.002
The table reports, for each country, the percentage points difference in the probability of being in the top decile of the national income distribution between immigrants who have been in the country for six or more years and natives aged 25-64, overall and when differences in age, gender and education characteristics are taken into account. or when, additionally, also differences in occupations and full/part time employment are taken into account. The differences are computed as coefficients on an immigrant dummy in a linear regression model. See Technical Appendix for details. *, **, *** indicate that the difference is statistically significant at the 10, 5 and 1 percent significance level, respectively. The two bottom rows report the mean values for EU15 countries as well as for all countries. Immigrants are defined as foreign born, except for Germany where they are defined as foreign nationals. Source: our elaboration on EULFS data 2017.
Tables Appendix - Long Term Integration
Tables Appendix - Europe
8180
Tables Appendix - Long Term IntegrationTables Appendix - Long Term Integration
Table B 3: Distribution across age groups in 1995 and 2016
Natives Immigrants
1995 2016 1995 2016
Fran
ce
Under 25 36% 33% 8% 12%
25-44 29% 24% 41% 31%
45-64 21% 25% 34% 35%
Over 64 14% 18% 17% 22%
Ger
man
y
Under 25 26% 24% 40% 24%
25-44 30% 23% 36% 41%
45-64 27% 31% 22% 25%
Over 64 17% 22% 3% 9%
Ital
y*
Under 25 25% 24% 21% 15%
25-44 29% 23% 54% 49%
45-64 26% 29% 18% 31%
Over 64 20% 24% 6% 5%
Spai
n
Under 25 33% 26% 26% 16%
25-44 29% 26% 46% 50%
45-64 22% 28% 17% 27%
Over 64 15% 20% 11% 7%
Swed
en
Under 25 17% 17% 14% 12%
25-44 36% 33% 57% 44%
45-64 33% 33% 25% 34%
Over 64 13% 17% 4% 9%
UK
Under 25 33% 32% 19% 18%
25-44 29% 23% 40% 47%
45-64 22% 26% 27% 25%
Over 64 15% 19% 14% 11%
The table reports, for each country, the distribution of the immigrant and native populations across age groups. We identify four age groups: under 25, from 25 to 44, from 45 to 64 and over 64 years old. Immigrants are defined as foreign born, except for Germany where they are defined as foreign nationals. We report data for the first year available and for 2016. The first year available corresponds to 1995 for all countries except for Italy, where it is 2005. Source: our elaboration on EULFS data 1995-2016.
Table B 2: Distribution across gender in 1995 and 2016, share of women
1995 2016Fr
ance
Total immigrants 51% 53%
EU15 52% 52%
New EU Member States - 56%
Extra-EU 50% 53%
Ger
man
y
Total immigrants 45% 47%
EU15 44% 43%
New EU Member States - 49%
Extra-EU 45% 47%
Ital
y*
Total immigrants 54% 55%
EU15 60% 62%
New EU Member States 63% 60%
Extra-EU 50% 52%
Spai
n
Total immigrants 54% 53%
EU15 55% 51%
New EU Member States - 55%
Extra-EU 53% 53%
Swed
en
Total immigrants 53% 52%
EU15 - 53%
New EU Member States - 57%
Extra-EU 53% 51%
UK
Total immigrants 52% 52%
EU15 57% 53%
New EU Member States - 52%
Extra-EU 50% 52%
The table reports, for each country, the share of women in the immigrant population, both overall and by area of origin, defined as EU15, New EU Member States and Extra-EU. Immigrants are defined as foreign born, except for Germany where they are defined as foreign nationals. We report data for the first year available and for 2016. The first year available corresponds to 1995 for all
countries except for Italy, where it is 2005. Source: our elaboration on EULFS data 1995-2016.
8382
Table B 5: Distribution by years since arrival in 2008 and 2016, by origin
Total immigrants EU15 New EU
Member States Extra-EU
2008 2016 2008 2016 2008 2016 2008 2016
Fran
ce
Mean 29.1 29.7 35.0 35.5 27.1 22.6 26.9 28.2
1 to 5 years 12% 12% 12% 14% 29% 19% 12% 11%6 to 10 years 13% 12% 8% 9% 13% 24% 15% 12%More than 10 75% 77% 81% 77% 58% 58% 73% 77%
Ger
man
y
Mean 13.6 14.2 17.2 19.0 12.5 10.3 12.3 13.7
1 to 5 years 20% 37% 13% 24% 30% 51% 20% 36%6 to 10 years 20% 12% 10% 10% 20% 18% 24% 11%More than 10 60% 51% 77% 66% 50% 31% 56% 53%
Ital
y
Mean 16.1 17.9 30.0 35.4 10.2 13.4 14.7 17.0
1 to 5 years 21% 10% 9% 4% 32% 8% 20% 11%6 to 10 years 31% 24% 9% 6% 43% 31% 32% 24%More than 10 48% 66% 82% 89% 24% 61% 48% 65%
Spai
n
Mean 12.9 17.8 25.5 29.2 5.4 12.1 11.3 16.3
1 to 5 years 35% 9% 15% 6% 50% 8% 36% 10%6 to 10 years 40% 23% 21% 12% 44% 24% 44% 25%More than 10 25% 68% 64% 82% 6% 68% 21% 65%
Swed
en
Mean 20.2 18.7 30.1 29.5 20.0 17.6 16.2 16.3
1 to 5 years 5% 22% 10% 14% 18% 22% 4% 24%6 to 10 years 4% 19% 8% 12% 9% 23% 4% 21%More than 10 91% 59% 82% 74% 73% 55% 92% 56%
UK
Mean 19.4 18.7 28.2 23.2 10.5 9.7 18.7 20.6
1 to 5 years 34% 26% 24% 32% 71% 40% 29% 20%6 to 10 years 17% 19% 11% 14% 10% 34% 21% 16%More than 10 49% 55% 65% 55% 19% 26% 50% 64%
The table reports, for each country, the average number of years spent in the country and the distribution of the immigrant population by years or residence in the reporting country, overall and by main areas of origin, defined as EU15, New EU Member States and Extra-EU. We identify three groups: 1 to 5, 6 to 10 and more than 10 years spent in the country. Immigrants are defined as foreign born, except for Germany where they are defined as foreign nationals. We report data for the first year available and for 2016. The first year available corresponds to 2008 for all countries. Source: our elaboration on EULFS data 1995-2016.
Table B 4: Distribution across age groups in 1995 and 2016, by origin
EU15 New EU Member States Extra-EU
1995 2016 1995 2016 1995 2016
Fran
ce
Under 25 5% 13% - 13% 10% 12%
25-44 36% 18% - 47% 43% 35%
45-64 35% 37% - 23% 33% 34%
Over 64 24% 31% - 17% 14% 19%
Ger
man
y
Under 25 31% 18% - 24% 43% 27%
25-44 38% 32% - 49% 35% 42%
45-64 27% 34% - 21% 20% 23%
Over 64 5% 16% - 6% 2% 8%
Ital
y*
Under 25 14% 9% 21% 15% 22% 15%
25-44 50% 33% 52% 55% 56% 49%
45-64 22% 42% 18% 27% 18% 31%
Over 64 14% 16% 9% 3% 4% 5%
Spai
n
Under 25 28% 6% - 15% 24% 18%
25-44 42% 29% - 64% 48% 51%
45-64 18% 42% - 19% 17% 26%
Over 64 12% 22% - 1% 11% 5%
Swed
en
Under 25 - 5% - 10% 14% 15%
25-44 - 27% - 45% 57% 48%
45-64 - 41% - 33% 25% 33%
Over 64 - 26% - 12% 4% 5%
UK
Under 25 18% 22% - 23% 19% 15%
25-44 30% 39% - 61% 45% 44%
45-64 31% 23% - 13% 25% 29%
Over 64 21% 17% - 3% 11% 12%
The table reports, for each country, the distribution across age groups of the immigrant population, by main areas of origin, defined as EU15, New EU Member States and Extra-EU. We identify four age groups: under 25, from 25 to 44, from 45 to 64 and over 64 years old. Immigrants are defined as foreign born, except for Germany where they are defined as foreign nationals. We report data for the first year available and for 2016. The first year available corresponds to 1995 for all countries except for Italy, where it is 2005. Source: our elaboration on EULFS data 1995-2016.
Tables Appendix - Long Term IntegrationTables Appendix - Long Term Integration
8584
Table B 7: Distribution across education levels in 1995 and 2016, by origin
1995 2016
Fran
ce
EU15 Low 63% 35%High 13% 32%
New EU Member States Low - 17%High - 55%
Extra-EU Low 52% 40% High 20% 29%
Ger
man
y
EU15 Low 43% 34%High 17% 27%
New EU Member States Low - 25%High - 24%
Extra-EU Low 50% 47% High 13% 23%
Ital
y*
EU15 Low 41% 35%High 17% 23%
New EU Member States Low 27% 33%High 11% 10%
Extra-EU Low 51% 53% High 12% 13%
Spai
n
EU15 Low 49% 28%High 28% 45%
New EU Member States Low - 29%High - 23%
Extra-EU Low 44% 46% High 32% 24%
Swed
en
EU15 Low - 17%High - 52%
New EU Member States Low - 16%High - 51%
Extra-EU Low 29% 33% High 30% 39%
UK
EU15 Low 60% 11%High 19% 65%
New EU Member States Low - 17%High - 36%
Extra-EU Low 59% 20% High 24% 52%
The table reports, for each country, the share of immigrants aged 25-64 with low and high education, by main areas of origin, defined as EU15, New EU Member States and Extra-EU. Low education is defined as having at most a lower secondary degree; high education is defined as tertiary education. Immigrants are defined as foreign born, except for Germany where they are defined as foreign nationals. We report data for the first year available and for 2016. The first year available corresponds to 1995 for all countries except for Italy, where it is 2005. Source: our elaboration on EULFS data 1995-2016.
Table B 6: Distribution across education levels in 1995 and 2016, by gender
Total Women Men
1995 2016 1995 2016 1995 2016
Fran
ce
Natives Low 39% 20% 43% 20% 35% 19%
High 18% 35% 19% 37% 18% 32%
Immigrants Low 55% 39% 58% 40% 53% 36%
High 18% 31% 17% 31% 19% 30%
Ger
man
y Natives Low 16% 10% 22% 11% 10% 9%
High 23% 29% 17% 26% 29% 33%
Immigrants Low 48% 39% 57% 42% 41% 36%
High 14% 24% 12% 24% 16% 24%
Ital
y*
Natives Low 50% 39% 50% 37% 50% 40%
High 12% 19% 13% 21% 12% 16%
Immigrants Low 46% 47% 43% 42% 50% 53%
High 13% 13% 14% 16% 11% 9%
Spai
n
Natives Low 71% 41% 73% 39% 69% 43%
High 16% 38% 15% 41% 17% 35%
Immigrants Low 46% 40% 45% 39% 46% 42%
High 30% 27% 28% 29% 33% 24%
Swed
en
Natives Low 26% 11% 23% 10% 28% 12%
High 27% 41% 29% 49% 26% 33%
Immigrants Low 29% 29% 29% 28% 29% 29%
High 30% 43% 31% 46% 29% 39%
UK
Natives Low 46% 24% 53% 24% 40% 25%
High 22% 39% 20% 40% 23% 37%
Immigrants Low 59% 18% 63% 19% 55% 17%
High 23% 51% 21% 51% 24% 50%
The table reports, for each country, the share of immigrants and natives aged 25-64 with low and high education. Low education is defined as having at most a lower secondary degree; high education is defined as tertiary education. The shares are reported both overall and by gender. Immigrants are defined as foreign born, except for Germany where they are defined as foreign nationals. We report data for the first year available and for 2016. The first year available corresponds to 1995 for all countries except for Italy, where it is 2005. Source: our elaboration on EULFS data 1995-2016.
Tables Appendix - Long Term IntegrationTables Appendix - Long Term Integration
8786
Table B 9: Share of naturalised immigrants by years since arrival, by origin
5 years 10 years 15-19 years
Fran
ce
Total immigrants 15% 31% 50%
EU15 11% 12% 23%
New EU Member States 5% 20% 55%
Extra-EU 17% 36% 56%
Ger
man
y*
Total immigrants 14% 35% 61%
EU15 - - -
New EU Member States - - -
Extra-EU - - -
Ital
y
Total immigrants 9% 10% 23%
EU15 41% 49% 56%
New EU Member States 5% 7% 18%
Extra-EU 9% 10% 21%
Spai
n
Total immigrants 7% 16% 31%
EU15 5% 8% 13%
New EU Member States 1% 1% 3%
Extra-EU 9% 20% 40%
Swed
en
Total immigrants 24% 74% 89%
EU15 11% 30% 44%
New EU Member States 7% 57% 87%
Extra-EU 29% 84% 94%
UK
Total immigrants 11% 38% 61%
EU15 7% 15% 28%
New EU Member States 1% 6% 34%
Extra-EU 17% 51% 70%
The table reports, for each country, the share of naturalised immigrants by years spent in the residence country overall and by main areas of origin, defined as EU15, New EU Member States and Extra-EU. We report the share after 5, 10 and 15-19 years of residence in the country. Naturalised immigrants are defined as foreign born individuals who hold the nationality of their country of residence, except for Germany where they are defined individuals who migrated to the country (see Appendix for a more detailed explanation). The shares are calculated over the period 2008-2016. Source: our elaboration on EULFS data 1995-2016
Table B 8: Share of naturalised immigrants in 2005 and 2016, by origin
2005 2016Fr
ance
Total immigrants 56% 51%
EU 15 45% 39%
New EU Member States 68% 44%
Extra-EU 60% 55%
Ger
man
y*
Total immigrants - 69%
EU 15 - -
New EU Member States - -
Extra-EU - -
Ital
y
Total immigrants 37% 27%
EU 15 76% 77%
New EU Member States 29% 12%
Extra-EU 30% 27%
Spai
n
Total immigrants 19% 30%
EU 15 36% 31%
New EU Member States 1% 2%
Extra-EU 18% 35%
Swed
en
Total immigrants 88% 64%
EU 15 55% 57%
New EU Member States 73% 59%
Extra-EU 91% 67%
UK
Total immigrants 45% 41%
EU 15 32% 24%
New EU Member States 37% 8%
Extra-EU 50% 56%
The table reports, for each country, the share of naturalised immigrants overall and by main areas of origin, defined as EU15, New EU Member States and Extra-EU. Naturalised immigrants are defined as foreign born individuals who hold the nationality of their country of residence, except for Germany where they are defined individuals who migrated to the country (see Appendix for a more detailed explanation). We report data for 2005 and for 2016. Source: our elaboration on EULFS data 1995-2016.
Tables Appendix - Long Term IntegrationTables Appendix - Long Term Integration
8988
Table B 11: Distribution across employment status in 1995 and 2016, by origin
EU15 New EU Member States Extra-EU
1995 2016 1995 2016 1995 2016
Fran
ce
Employed 65% 71% - 68% 56% 56%
Unemployed 7% 6% - 12% 14% 13%
Inactive 28% 23% - 19% 31% 30%
Ger
man
y Employed 71% 80% - 79% 56% 56%
Unemployed 7% 4% - 5% 11% 7%
Inactive 21% 16% - 17% 33% 37%
Ital
y*
Employed 62% 60% 71% 67% 69% 63%
Unemployed 6% 8% 5% 11% 7% 10%
Inactive 32% 32% 24% 22% 24% 27%
Spai
n
Employed 52% 69% - 68% 56% 61%
Unemployed 16% 12% - 21% 17% 23%
Inactive 33% 20% - 12% 27% 17%
Swed
en
Employed - 81% - 80% 55% 67%
Unemployed - 4% - 7% 17% 14%
Inactive - 15% - 13% 28% 19%
UK
Employed 67% 81% - 85% 61% 72%
Unemployed 6% 4% - 3% 9% 4%
Inactive 27% 16% - 12% 30% 25%
The table reports, for each country, the share of employed, unemployed and inactive immigrants aged 25-64, by main areas of origin defines as EU15, New EU Member States and Extra-EU. We report the share after 5, 10 and 15-19 years of residence in the country. Immigrants are defined as foreign born, except for Germany where they are defined as foreign nationals. We report data for the first year available and for 2016. The first year available corresponds to 1995 for all countries except for Italy, where it is 2005. Source: our elaboration on EULFS data 1995-2016
.
Table B 10: Distribution across employment status in 1995 and 2016
Natives Immigrants
1995 2016 1995 2016
Fran
ce
Employed 69% 74% 59% 60%
Unemployed 7% 6% 12% 12%
Inactive 24% 20% 30% 29%
Ger
man
y Employed 69% 82% 61% 66%
Unemployed 6% 3% 10% 6%
Inactive 26% 15% 29% 28%
Ital
y*
Employed 63% 65% 68% 64%
Unemployed 4% 7% 7% 10%
Inactive 33% 29% 25% 26%
Spai
n
Employed 54% 67% 54% 63%
Unemployed 13% 13% 17% 21%
Inactive 33% 19% 29% 16%
Swed
en
Employed 81% 88% 55% 70%
Unemployed 6% 3% 17% 12%
Inactive 13% 10% 28% 18%
UK
Employed 72% 79% 62% 76%
Unemployed 6% 3% 8% 3%
Inactive 22% 18% 29% 20%
The table reports, for each country, the share of employed, unemployed and inactive immigrants and natives aged 25-64. We report the share after 5, 10 and 15-19 years of residence in the country. Immigrants are defined as foreign born, except for Germany where they are defined as foreign nationals. We report data for the first year available and for 2016. The first year available corresponds to 1995 for all countries except for Italy, where it is 2005. Source: our elaboration on EULFS data 1995-2016.
Tables Appendix - Long Term IntegrationTables Appendix - Long Term Integration
9190
The
tabl
e re
port
s, fo
r Fr
ance
, the
per
cent
age
poin
t diff
eren
ces
betw
een
imm
igra
nts
and
nativ
es a
ged
25-6
4 in
the
prob
abili
ty o
f em
ploy
men
t, ov
eral
l and
by
imm
igra
nt m
ain
area
of o
rigin
, defi
ned
as E
U15
, New
EU
Mem
ber S
tate
s an
d Ex
tra-
EU a
nd fo
r eac
h ye
ar fo
r whi
ch d
ata
are
avai
labl
e. T
he d
iffer
ence
s ar
e es
timat
ed o
vera
ll an
d w
hen
diffe
renc
es in
age
, gen
der a
nd e
duca
tion
char
acte
ristic
s ar
e ta
ken
into
acc
ount
. The
diff
eren
ces
are
com
pute
d as
coe
ffici
ents
on
an im
mig
rant
dum
my
in a
line
ar p
roba
bilit
y m
odel
. See
Tec
hnic
al A
ppen
dix
for d
etai
ls. *
, **,
***
indi
cate
that
the
diffe
renc
e is
st
atis
tical
ly s
igni
fican
t at t
he 1
0, 5
and
1 p
erce
nt s
igni
fican
ce le
vel,
resp
ectiv
ely.
Imm
igra
nts
are
defin
ed a
s fo
reig
n bo
rn. S
ourc
e: o
ur e
labo
ratio
n on
EU
LFS
data
199
5-20
16.
The
tabl
e re
port
s, fo
r G
erm
any,
the
perc
enta
ge p
oint
diff
eren
ces
betw
een
imm
igra
nts
and
nativ
es a
ged
25-6
4 in
the
prob
abili
ty o
f em
ploy
men
t, ov
eral
l and
by
imm
igra
nt m
ain
area
of o
rigin
, defi
ned
as E
U15
, New
EU
Mem
ber
Stat
es a
nd E
xtra
-EU
and
for
each
yea
r fo
r w
hich
dat
a ar
e av
aila
ble.
The
diff
eren
ces
are
estim
ated
ove
rall
and
whe
n di
ffere
nces
in a
ge, g
ende
r an
d ed
ucat
ion
char
acte
ristic
s ar
e ta
ken
into
acc
ount
. The
diff
eren
ces
are
com
pute
d as
coe
ffici
ents
on
an im
mig
rant
dum
my
in a
line
ar p
roba
bilit
y m
odel
. See
Tec
hnic
al A
ppen
dix
for
deta
ils. *
, **,
***
indi
cate
that
the
diffe
renc
e is
st
atis
tical
ly s
igni
fican
t at t
he 1
0, 5
and
1 p
erce
nt s
igni
fican
ce le
vel,
resp
ectiv
ely.
Imm
igra
nts
are
defin
ed a
s fo
reig
n na
tiona
ls. S
ourc
e: o
ur e
labo
ratio
n on
EU
LFS
data
199
5-20
16.
Tabl
e B
13: E
mpl
oym
ent g
ap b
etw
een
imm
igra
nts
and
nativ
es in
Ger
man
y, b
y or
igin
Year
All
imm
igra
nts
EU15
New
EU
Mem
ber
Stat
esEx
tra-
EU
Unc
ondi
tion
alCo
ndit
iona
lU
ncon
diti
onal
Cond
itio
nal
Unc
ondi
tion
alCo
ndit
iona
lU
ncon
diti
onal
Cond
itio
nal
1995
-0.0
69**
*-0
.054
***
0.03
4***
0.04
0***
-0.1
17**
*-0
.098
***
1996
-0.0
89**
*-0
.071
***
0.02
4***
0.03
5***
-0.1
37**
*-0
.116
***
1997
-0.1
03**
*-0
.082
***
0.04
0***
0.05
3***
-0.1
63**
*-0
.138
***
1999
-0.1
03**
*-0
.082
***
0.02
2***
0.04
0***
-0.1
55**
*-0
.133
***
2000
-0.1
02**
*-0
.074
***
0.01
9**
0.04
0***
-0.1
53**
*-0
.122
***
2001
-0.0
89**
*-0
.060
***
0.03
0***
0.04
9***
-0.1
39**
*-0
.107
***
2002
-0.1
02**
*-0
.071
***
0.02
7***
0.04
8***
-0.1
54**
*-0
.119
***
2003
-0.1
19**
*-0
.083
***
0.00
70.
036*
**-0
.170
***
-0.1
32**
*20
04-0
.133
***
-0.0
97**
*0.
016*
0.03
7***
-0.0
75**
*-0
.046
***
-0.2
12**
*-0
.168
***
2005
-0.1
51**
*-0
.114
***
-0.0
060.
026*
**-0
.122
***
-0.0
96**
*-0
.227
***
-0.1
84**
*20
06-0
.165
***
-0.1
18**
*-0
.027
0.01
6-0
.128
***
-0.1
04**
*-0
.232
***
-0.1
80**
*20
07-0
.176
***
-0.1
30**
*-0
.049
**0.
001
-0.1
02**
*-0
.080
***
-0.2
49**
*-0
.200
***
2008
-0.1
42**
*-0
.108
***
-0.0
140.
015
-0.0
78**
*-0
.058
**-0
.219
***
-0.1
78**
*20
09-0
.167
***
-0.1
29**
*-0
.083
***
-0.0
53**
*-0
.123
***
-0.0
93**
*-0
.213
***
-0.1
71**
*20
10-0
.152
***
-0.1
15**
*-0
.045
**-0
.008
-0.0
50**
-0.0
48**
-0.2
27**
*-0
.181
***
2011
-0.1
35**
*-0
.104
***
-0.0
31*
0.00
4-0
.085
***
-0.0
78**
*-0
.190
***
-0.1
57**
*20
12-0
.133
***
-0.1
07**
*-0
.027
***
0.00
1-0
.056
***
-0.0
53**
*-0
.205
***
-0.1
75**
*20
13-0
.137
***
-0.1
20**
*-0
.028
***
-0.0
06-0
.055
***
-0.0
62**
*-0
.215
***
-0.1
93**
*20
14-0
.133
***
-0.1
21**
*-0
.020
***
-0.0
02-0
.049
***
-0.0
66**
*-0
.215
***
-0.1
96**
*20
15-0
.137
***
-0.1
27**
*-0
.032
***
-0.0
13**
-0.0
44**
*-0
.065
***
-0.2
20**
*-0
.201
***
2016
-0.1
50**
*-0
.147
***
-0.0
19**
*-0
.005
-0.0
32**
*-0
.059
***
-0.2
54**
*-0
.244
***
2016
-0.1
48**
*-0
.119
***
-0.0
31**
0.03
7***
-0.0
60-0
.094
***
-0.1
83**
*-0
.159
***
Tabl
e B
12: E
mpl
oym
ent g
ap b
etw
een
imm
igra
nts
and
nativ
es in
Fra
nce,
by
orig
in
Year
All
imm
igra
nts
EU15
New
EU
Mem
ber
Stat
esEx
tra-
EU
Unc
ondi
tion
alCo
ndit
iona
lU
ncon
diti
onal
Cond
itio
nal
Unc
ondi
tion
alCo
ndit
iona
lU
ncon
diti
onal
Cond
itio
nal
1995
-0.1
07**
*-0
.100
***
-0.0
43**
*-0
.005
-0.1
37**
*-0
.145
***
1996
-0.1
08**
*-0
.099
***
-0.0
34**
*0.
008
-0.1
41**
*-0
.146
***
1997
-0.1
18**
*-0
.105
***
-0.0
30**
*0.
014*
-0.1
55**
*-0
.156
***
1998
-0.1
20**
*-0
.102
***
-0.0
36**
*0.
011
-0.1
54**
*-0
.147
***
1999
-0.1
21**
*-0
.103
***
-0.0
32**
*0.
015*
-0.1
57**
*-0
.150
***
2000
-0.1
22**
*-0
.101
***
-0.0
39**
*0.
012
-0.1
54**
*-0
.146
***
2001
-0.1
22**
*-0
.094
***
-0.0
40**
*0.
021*
**-0
.155
***
-0.1
39**
*20
02-0
.131
***
-0.0
98**
*-0
.054
***
0.01
2-0
.162
***
-0.1
41**
*20
03-0
.126
***
-0.0
98**
*-0
.042
***
0.01
3-0
.160
***
-0.1
41**
*20
04-0
.113
***
-0.0
80**
*-0
.029
**0.
023*
*-0
.104
**-0
.151
***
-0.1
51**
*-0
.123
***
2005
-0.1
26**
*-0
.092
***
-0.0
69**
*-0
.005
-0.1
09**
*-0
.095
***
-0.1
48**
*-0
.123
***
2006
-0.1
20**
*-0
.089
***
-0.0
63**
*0.
004
-0.0
90**
-0.1
06**
-0.1
40**
*-0
.119
***
2007
-0.1
16**
*-0
.084
***
-0.0
66**
*0.
008
-0.1
57**
*-0
.187
***
-0.1
32**
*-0
.111
***
2008
-0.1
12**
*-0
.080
***
-0.0
65**
*-0
.003
-0.0
85**
-0.1
01**
*-0
.131
***
-0.1
06**
*20
09-0
.120
***
-0.0
90**
*-0
.056
***
0.01
3-0
.167
***
-0.1
84**
*-0
.141
***
-0.1
21**
*20
10-0
.119
***
-0.0
87**
*-0
.030
***
0.02
8***
-0.0
95**
*-0
.125
***
-0.1
51**
*-0
.123
***
2011
-0.1
24**
*-0
.090
***
-0.0
42**
*0.
028*
**-0
.062
**-0
.117
***
-0.1
52**
*-0
.125
***
2012
-0.1
28**
*-0
.096
***
-0.0
52**
*0.
003
-0.0
60**
-0.0
99**
*-0
.153
***
-0.1
23**
*20
13-0
.131
***
-0.0
98**
*-0
.026
*0.
040*
**-0
.025
-0.0
58-0
.169
***
-0.1
42**
*20
14-0
.138
***
-0.1
01**
*-0
.028
*0.
038*
**-0
.112
***
-0.1
24**
*-0
.170
***
-0.1
38**
*20
15-0
.150
***
-0.1
12**
*-0
.057
***
0.02
1-0
.081
*-0
.117
***
-0.1
76**
*-0
.144
***
2016
-0.1
48**
*-0
.119
***
-0.0
31**
0.03
7***
-0.0
60-0
.094
***
-0.1
83**
*-0
.159
***
Tables Appendix - Long Term IntegrationTables Appendix - Long Term Integration
9392
The
tabl
e re
port
s, fo
r Spa
in, t
he p
erce
ntag
e po
int d
iffer
ence
s bet
wee
n im
mig
rant
s and
nat
ives
age
d 25
-64
in th
e pr
obab
ility
of e
mpl
oym
ent,
over
all a
nd b
y im
mig
rant
mai
n ar
ea o
f orig
in, d
efine
d as
EU
15,
New
EU
Mem
ber
Stat
es a
nd E
xtra
-EU
and
for
each
yea
r fo
r w
hich
dat
a ar
e av
aila
ble.
The
diff
eren
ces
are
estim
ated
ove
rall
and
whe
n di
ffere
nces
in a
ge, g
ende
r an
d ed
ucat
ion
char
acte
ristic
s ar
e ta
ken
into
acc
ount
. The
diff
eren
ces
are
com
pute
d as
coe
ffici
ents
on
an im
mig
rant
dum
my
in a
line
ar p
roba
bilit
y m
odel
. See
Tec
hnic
al A
ppen
dix
for
deta
ils. *
, **,
***
indi
cate
that
the
diffe
renc
e is
sta
tistic
ally
si
gnifi
cant
at t
he 1
0, 5
and
1 p
erce
nt s
igni
fican
ce le
vel,
resp
ectiv
ely.
Imm
igra
nts
are
defin
ed a
s fo
reig
n bo
rn. S
ourc
e: o
ur e
labo
ratio
n on
EU
LFS
data
199
5-20
16.
Tabl
e B1
5: E
mpl
oym
ent g
ap b
etw
een
imm
igra
nts
and
nativ
es in
Spa
in, b
y or
igin
Year
All
imm
igra
nts
EU15
New
EU
Mem
ber
Stat
esEx
tra-
EU
Unc
ondi
tion
alCo
ndit
iona
lU
ncon
diti
onal
Cond
itio
nal
Unc
ondi
tion
alCo
ndit
iona
lU
ncon
ditio
nal
Cond
itio
nal
1995
0.00
1-0
.055
***
-0.0
24-0
.055
***
0.01
7-0
.056
***
1996
-0.0
13-0
.059
***
-0.0
51**
-0.0
81**
*0.
012
-0.0
45**
1997
0.00
2-0
.056
***
-0.0
15-0
.054
***
0.01
4-0
.058
***
1998
0.01
8-0
.034
***
0.00
1-0
.039
**0.
031*
-0.0
31**
1999
0.03
7***
-0.0
04-0
.029
-0.0
48**
*0.
079*
**0.
023
2000
0.01
0-0
.031
***
-0.0
19-0
.053
***
0.02
6*-0
.019
2001
0.03
5***
-0.0
18*
-0.0
01-0
.044
***
0.05
1***
-0.0
0720
020.
050*
**0.
000
0.00
6-0
.044
**0.
065*
**0.
015
2003
0.03
7***
-0.0
12-0
.021
-0.0
69**
*0.
052*
**0.
003
2004
0.04
2***
-0.0
12-0
.022
-0.0
86**
*0.
121*
**0.
040*
0.04
6***
-0.0
0120
050.
056*
**0.
010*
**-0
.030
***
-0.0
77**
*0.
111*
**0.
041*
**0.
065*
**0.
025*
**20
060.
046*
**-0
.004
-0.0
29-0
.078
***
0.09
1***
0.03
50.
052*
**0.
003
2007
0.05
0***
0.01
3-0
.035
-0.0
78**
*0.
079*
**0.
018
0.06
1***
0.03
0***
2008
0.01
9**
-0.0
17**
-0.0
21-0
.076
***
0.03
2-0
.027
0.02
4**
-0.0
0320
09-0
.032
***
-0.0
65**
*-0
.030
-0.0
86**
*-0
.004
-0.0
54**
-0.0
38**
*-0
.063
***
2010
-0.0
47**
*-0
.076
***
-0.0
23-0
.073
***
-0.0
24-0
.085
***
-0.0
57**
*-0
.074
***
2011
-0.0
43**
*-0
.072
***
-0.0
35-0
.074
***
-0.0
85**
*-0
.131
***
-0.0
34**
*-0
.058
***
2012
-0.0
72**
*-0
.095
***
-0.0
45*
-0.0
70**
*-0
.068
***
-0.0
97**
*-0
.079
***
-0.0
99**
*20
13-0
.046
***
-0.0
61**
*0.
040*
0.01
0-0
.041
-0.0
91**
*-0
.064
***
-0.0
69**
*20
14-0
.059
***
-0.0
77**
*-0
.004
-0.0
46**
-0.0
34-0
.075
***
-0.0
77**
*-0
.084
***
2015
-0.0
58**
*-0
.071
***
-0.0
33-0
.070
***
-0.0
56**
-0.0
80**
*-0
.064
***
-0.0
69**
*20
16-0
.044
***
-0.0
60**
*0.
015
-0.0
200.
003
-0.0
35-0
.067
***
-0.0
73**
*
Tabl
e B
14: E
mpl
oym
ent g
ap b
etw
een
imm
igra
nts
and
nativ
es in
Ital
y, b
y or
igin
Year
All
imm
igra
nts
EU15
New
EU
Mem
ber
Stat
esEx
tra-
EU
Unc
ondi
tion
alCo
ndit
iona
lU
ncon
diti
onal
Cond
itio
nal
Unc
ondi
tion
alCo
ndit
iona
lU
ncon
ditio
nal
Cond
itio
nal
2005
0.04
9***
0.00
2-0
.013
-0.0
48**
*0.
078*
**0.
046*
**0.
057*
**0.
004
2006
0.06
2***
0.01
5***
-0.0
21**
-0.0
63**
*0.
079*
**0.
053*
**0.
076*
**0.
022*
**
2007
0.06
6***
0.02
0***
-0.0
08-0
.048
***
0.08
9***
0.05
0***
0.07
4***
0.02
6***
2008
0.05
9***
0.01
7***
-0.0
29**
*-0
.063
***
0.08
4***
0.03
9***
0.06
8***
0.02
5***
2009
0.04
4***
0.00
3-0
.036
***
-0.0
72**
*0.
086*
**0.
046*
**0.
044*
**0.
002
2010
0.03
9***
0.00
2-0
.024
**-0
.070
***
0.08
1***
0.04
4***
0.03
5***
0.00
0
2011
0.03
5***
0.00
1-0
.016
*-0
.060
***
0.06
1***
0.02
5***
0.03
4***
0.00
3
2012
0.02
2***
-0.0
06*
-0.0
51**
*-0
.081
***
0.06
0***
0.03
4***
0.01
9***
-0.0
09**
2013
0.00
6**
-0.0
15**
*-0
.064
***
-0.0
89**
*0.
051*
**0.
029*
**0.
000
-0.0
21**
*
2014
0.00
7**
-0.0
13**
*-0
.023
**-0
.041
***
0.03
1***
0.00
60.
002
-0.0
15**
*
2015
0.00
1-0
.018
***
-0.0
21**
-0.0
39**
*0.
028*
**0.
001
-0.0
06-0
.022
***
2016
-0.0
07**
-0.0
19**
*-0
.042
***
-0.0
59**
*0.
024*
**0.
002
-0.0
13**
*-0
.023
***
The
tabl
e re
port
s, fo
r Ita
ly, t
he p
erce
ntag
e po
int d
iffer
ence
s be
twee
n im
mig
rant
s an
d na
tives
age
d 25
-64
in th
e pr
obab
ility
of e
mpl
oym
ent,
over
all a
nd b
y im
mig
rant
mai
n ar
ea o
f orig
in, d
efine
d as
EU
15,
New
EU
Mem
ber
Stat
es a
nd E
xtra
-EU
and
for
each
yea
r fo
r w
hich
dat
a ar
e av
aila
ble.
The
diff
eren
ces
are
estim
ated
ove
rall
and
whe
n di
ffere
nces
in a
ge, g
ende
r an
d ed
ucat
ion
char
acte
ristic
s ar
e ta
ken
into
acc
ount
. The
diff
eren
ces
are
com
pute
d as
coe
ffici
ents
on
an im
mig
rant
dum
my
in a
line
ar p
roba
bilit
y m
odel
. See
Tec
hnic
al A
ppen
dix
for
deta
ils. *
, **,
***
indi
cate
that
the
diffe
renc
e is
sta
tistic
ally
si
gnifi
cant
at t
he 1
0, 5
and
1 p
erce
nt s
igni
fican
ce le
vel,
resp
ectiv
ely.
Imm
igra
nts
are
defin
ed a
s fo
reig
n bo
rn. S
ourc
e: o
ur e
labo
ratio
n on
EU
LFS
data
199
5-20
16.
Tables Appendix - Long Term IntegrationTables Appendix - Long Term Integration
9594
The
tabl
e re
port
s, f
or t
he U
nite
d Ki
ngdo
m, t
he p
erce
ntag
e po
int
diffe
renc
es b
etw
een
imm
igra
nts
and
nativ
es a
ged
25-6
4 in
the
pro
babi
lity
of e
mpl
oym
ent,
over
all a
nd b
y im
mig
rant
mai
n ar
ea o
f or
igin
, defi
ned
as E
U15
, New
EU
Mem
ber
Stat
es a
nd E
xtra
-EU
and
for
each
yea
r fo
r w
hich
dat
a ar
e av
aila
ble.
The
diff
eren
ces
are
estim
ated
ove
rall
and
whe
n di
ffere
nces
in a
ge, g
ende
r an
d ed
ucat
ion
char
acte
ristic
s ar
e ta
ken
into
acc
ount
. The
diff
eren
ces
are
com
pute
d as
coe
ffici
ents
on
an im
mig
rant
dum
my
in a
line
ar p
roba
bilit
y m
odel
. See
Tec
hnic
al A
ppen
dix
for d
etai
ls. *
, **,
***
indi
cate
that
the
diffe
renc
e is
sta
tistic
ally
sig
nific
ant a
t the
10,
5 a
nd 1
per
cent
sig
nific
ance
leve
l, re
spec
tivel
y. Im
mig
rant
s ar
e de
fined
as
fore
ign
born
. Sou
rce:
our
ela
bora
tion
on E
ULF
S da
ta 1
995-
2016
.
Tabl
e B
17: E
mpl
oym
ent g
ap b
etw
een
imm
igra
nts
and
nativ
es in
the
Uni
ted
King
dom
, by
orig
in
Year
All
imm
igra
nts
EU15
New
EU
Mem
ber
Stat
esEx
tra-
EU
Unc
ondi
tion
alCo
ndit
iona
lU
ncon
diti
onal
Cond
itio
nal
Unc
ondi
tion
alCo
ndit
iona
lU
ncon
diti
onal
Cond
itio
nal
1995
-0.1
07**
*-0
.091
***
-0.0
43**
*-0
.009
-0.1
29**
*-0
.121
***
1996
-0.1
03**
*-0
.090
***
-0.0
48**
*-0
.020
*-0
.122
***
-0.1
15**
*19
97-0
.100
***
-0.0
82**
*-0
.049
***
-0.0
11-0
.118
***
-0.1
07**
*19
99-0
.086
***
-0.0
96**
*-0
.033
**-0
.028
**-0
.106
***
-0.1
21**
*20
00-0
.093
***
-0.1
05**
*-0
.035
***
-0.0
36**
*-0
.112
***
-0.1
28**
*20
01-0
.096
***
-0.1
09**
*-0
.031
**-0
.034
***
-0.1
17**
*-0
.133
***
2002
-0.0
92**
*-0
.102
***
-0.0
14-0
.016
-0.1
16**
*-0
.129
***
2003
-0.0
99**
*-0
.112
***
-0.0
38**
*-0
.041
***
-0.1
18**
*-0
.133
***
2004
-0.1
01**
*-0
.115
***
-0.0
48**
*-0
.059
***
-0.0
49*
-0.0
44*
-0.1
21**
*-0
.136
***
2005
-0.1
01**
*-0
.117
***
-0.0
43**
*-0
.057
***
-0.0
22-0
.032
-0.1
24**
*-0
.141
***
2006
-0.0
83**
*-0
.103
***
0.00
0-0
.016
0.01
2-0
.008
-0.1
13**
*-0
.134
***
2007
-0.0
78**
*-0
.097
***
-0.0
06-0
.024
**0.
028*
*0.
009
-0.1
13**
*-0
.133
***
2008
-0.0
49**
*-0
.078
***
-0.0
14-0
.034
***
0.06
9***
0.03
9***
-0.0
78**
*-0
.109
***
2009
-0.0
46**
*-0
.075
***
0.03
4***
0.00
50.
069*
**0.
041*
**-0
.085
***
-0.1
14**
*20
10-0
.042
***
-0.0
70**
*-0
.018
-0.0
42**
*0.
080*
**0.
044*
**-0
.074
***
-0.1
03**
*20
11-0
.037
***
-0.0
71**
*0.
005
-0.0
30**
0.09
3***
0.05
8***
-0.0
77**
*-0
.110
***
2012
-0.0
52**
*-0
.085
***
0.00
1-0
.036
**0.
051*
**0.
012
-0.0
88**
*-0
.120
***
2013
-0.0
47**
*-0
.080
***
0.02
8**
-0.0
100.
045*
**0.
012
-0.0
89**
*-0
.120
***
2014
-0.0
43**
*-0
.081
***
0.00
9-0
.039
***
0.05
9***
0.01
6-0
.084
***
-0.1
19**
*20
15-0
.029
***
-0.0
65**
*0.
044*
**-0
.002
0.05
4***
0.01
3-0
.072
***
-0.1
05**
*20
16-0
.029
***
-0.0
69**
*0.
016
-0.0
38**
*0.
064*
**0.
020*
*-0
.072
***
-0.1
08**
*
The
tabl
e re
port
s, fo
r Sw
eden
, the
per
cent
age
poin
t di
ffere
nces
bet
wee
n im
mig
rant
s an
d na
tives
age
d 25
-64
in t
he p
roba
bilit
y of
em
ploy
men
t, ov
eral
l and
by
imm
igra
nt m
ain
area
of o
rigin
, de
fined
as
EU15
, New
EU
Mem
ber
Stat
es a
nd E
xtra
-EU
and
for
each
yea
r fo
r w
hich
dat
a ar
e av
aila
ble.
The
diff
eren
ces
are
estim
ated
ove
rall
and
whe
n di
ffere
nces
in a
ge, g
ende
r an
d ed
ucat
ion
char
acte
ristic
s ar
e ta
ken
into
acc
ount
. The
diff
eren
ces
are
com
pute
d as
coe
ffici
ents
on
an im
mig
rant
dum
my
in a
line
ar p
roba
bilit
y m
odel
. See
Tec
hnic
al A
ppen
dix
for
deta
ils. *
, **,
***
indi
cate
th
at th
e di
ffere
nce
is s
tatis
tical
ly s
igni
fican
t at t
he 1
0, 5
and
1 p
erce
nt s
igni
fican
ce le
vel,
resp
ectiv
ely.
Imm
igra
nts
are
defin
ed a
s fo
reig
n bo
rn. S
ourc
e: o
ur e
labo
ratio
n on
EU
LFS
data
199
5-20
16.
Tabl
e B
16: E
mpl
oym
ent g
ap b
etw
een
imm
igra
nts
and
nativ
es in
Sw
eden
, by
orig
in
Year
All
imm
igra
nts
EU15
New
EU
Mem
ber
Stat
esEx
tra-
EU
Unc
ondi
tion
alCo
ndit
iona
lU
ncon
diti
onal
Cond
itio
nal
Unc
ondi
tion
alCo
ndit
iona
lU
ncon
diti
onal
Cond
itio
nal
1995
-0.2
65**
*-0
.280
***
1996
-0.2
39**
*-0
.258
***
1997
-0.1
98**
*-0
.210
***
-0.0
54**
-0.0
65**
*-0
.250
***
-0.2
63**
*19
98-0
.234
***
-0.2
46**
*-0
.064
**-0
.075
***
-0.3
04**
*-0
.320
***
1999
-0.2
16**
*-0
.209
***
-0.1
09**
*-0
.079
***
-0.2
76**
*-0
.283
***
2000
-0.1
87**
*-0
.188
***
-0.1
12**
*-0
.094
***
-0.2
32**
*-0
.247
***
2001
-0.1
63**
*-0
.169
***
-0.1
02**
*-0
.087
***
-0.1
95**
*-0
.211
***
2002
-0.1
58**
*-0
.164
***
-0.1
09**
*-0
.093
***
-0.1
78**
*-0
.195
***
2003
-0.1
51**
*-0
.153
***
-0.1
12**
*-0
.094
***
-0.1
67**
*-0
.178
***
2004
-0.1
53**
*-0
.159
***
-0.1
06**
*-0
.091
***
-0.0
86**
*-0
.091
***
-0.1
81**
*-0
.197
***
2005
-0.1
66**
*-0
.170
***
-0.0
78**
*-0
.062
***
-0.1
37**
*-0
.139
***
-0.2
12**
*-0
.226
***
2006
-0.1
71**
*-0
.170
***
-0.0
84**
*-0
.065
***
-0.1
56**
*-0
.153
***
-0.2
10**
*-0
.219
***
2007
-0.1
66**
*-0
.164
***
-0.0
97**
*-0
.078
***
-0.1
45**
*-0
.141
***
-0.1
97**
*-0
.203
***
2008
-0.1
66**
*-0
.160
***
-0.1
09**
*-0
.087
***
-0.1
29**
*-0
.124
***
-0.1
91**
*-0
.193
***
2009
-0.1
75**
*-0
.169
***
-0.0
86**
*-0
.064
***
-0.1
10**
*-0
.109
***
-0.2
15**
*-0
.215
***
2010
-0.1
83**
*-0
.176
***
-0.0
84**
*-0
.062
***
-0.1
21**
*-0
.120
***
-0.2
24**
*-0
.222
***
2011
-0.1
82**
*-0
.173
***
-0.0
75**
*-0
.054
***
-0.1
14**
*-0
.110
***
-0.2
21**
*-0
.217
***
2012
-0.1
78**
*-0
.167
***
-0.0
78**
*-0
.059
***
-0.1
00**
*-0
.095
***
-0.2
16**
*-0
.209
***
2013
-0.1
81**
*-0
.168
***
-0.0
77**
*-0
.057
***
-0.0
86**
*-0
.083
***
-0.2
22**
*-0
.211
***
2014
-0.1
75**
*-0
.163
***
-0.0
63**
*-0
.047
***
-0.1
09**
*-0
.105
***
-0.2
12**
*-0
.201
***
2015
-0.1
75**
*-0
.162
***
-0.0
65**
*-0
.050
***
-0.1
00**
*-0
.095
***
-0.2
10**
*-0
.198
***
2016
-0.1
73**
*-0
.164
***
-0.0
67**
*-0
.060
***
-0.0
77**
*-0
.085
***
-0.2
08**
*-0
.198
***
Tables Appendix - Long Term IntegrationTables Appendix - Long Term Integration
9796
Table B 20: Employment gap in Italy, by years of residence
The table reports, for Italy, the percentage point differences between immigrants and natives aged 25-64 in the probability of employment for each year for which data are available, overall and separately for recent (in the country for at most five years) and earlier (in the country for six or more years) immigrants. The differences are estimated overall and when differences in age, gender and education characteristics are taken into account. The differences are computed as coefficients on an immigrant dummy in a linear probability model. See Technical Appendix for details. *, **, *** indicate that the difference is statistically significant at the 10, 5 and 1 percent significance level, respectively. Immigrants are defined as foreign born. Source: our elaboration on EULFS data 1995-2016.
Table B 21: Employment gap in Spain, by years of residence
The table reports, for Spain, the percentage point differences between immigrants and natives aged 25-64 in the probability of employment for each year for which data are available, overall and separately for recent (in the country for at most five years) and earlier (in the country for six or more years) immigrants. The differences are estimated overall and when differences in age, gender and education characteristics are taken into account. The differences are computed as coefficients on an immigrant dummy in a linear probability model. See Technical Appendix for details. *, **, *** indicate that the difference is statistically significant at the 10, 5 and 1 percent significance level, respectively. Immigrants are defined as foreign born. Source: our elaboration on EULFS data 1995-2016.
Table B 18: Employment gap in France, by years of residence
The table reports, for France, the percentage point differences between immigrants and natives aged 25-64 in the probability of employment for each year for which data are available, overall and separately for recent (in the country for at most five years) and earlier (in the country for six or more years) immigrants. The differences are estimated overall and when differences in age, gender and education characteristics are taken into account. The differences are computed as coefficients on an immigrant dummy in a linear probability model. See Technical Appendix for details. *, **, *** indicate that the difference is statistically significant at the 10, 5 and 1 percent significance level, respectively. Immigrants are defined as foreign born. Source: our elaboration on EULFS data 1995-2016.
Table B 19: Employment gap in Germany, by years of residence
The table reports, for Germany, the percentage point differences between immigrants and natives aged 25-64 in the probability of employment for each year for which data are available, overall and separately for recent (in the country for at most five years) and earlier (in the country for six or more years) immigrants. The differences are estimated overall and when differences in age, gender and education characteristics are taken into account. The differences are computed as coefficients on an immigrant dummy in a linear probability model. See Technical Appendix for details. *, **, *** indicate that the difference is statistically significant at the 10, 5 and 1 percent significance level, respectively. Immigrants are defined as foreign nationals. Source: our elaboration on EULFS data 1995-2016.
Tables Appendix - Long Term IntegrationTables Appendix - Long Term Integration
9998
Tabl
e B
24: E
mpl
oym
ent a
ssim
ilatio
n in
Fra
nce,
by
orig
in
Year
sA
ll im
mig
rant
sEU
15N
ew E
U M
embe
r St
ates
Extr
a-EU
Unc
ondi
tion
alCo
ndit
iona
lU
ncon
diti
onal
Cond
itio
nal
Unc
ondi
tion
alCo
ndit
iona
lU
ncon
diti
onal
Cond
itio
nal
1-0
.421
***
-0.4
71**
*-0
.228
***
-0.2
72**
*-0
.286
***
-0.3
70**
*-0
.499
***
-0.5
47**
*2
-0.2
79**
*-0
.303
***
-0.0
97**
*-0
.127
***
-0.0
39-0
.079
-0.3
64**
*-0
.385
***
3-0
.261
***
-0.2
99**
*-0
.078
**-0
.126
***
-0.3
00**
*-0
.328
***
-0.3
16**
*-0
.351
***
4-0
.212
***
-0.2
51**
*-0
.067
**-0
.112
***
-0.1
19**
-0.1
51**
*-0
.271
***
-0.3
09**
*5
-0.2
25**
*-0
.252
***
-0.0
31-0
.057
**-0
.188
***
-0.2
11**
*-0
.286
***
-0.3
13**
*6
-0.1
64**
*-0
.200
***
0.03
00.
004
-0.0
72-0
.129
***
-0.2
25**
*-0
.262
***
7-0
.175
***
-0.2
12**
*-0
.008
-0.0
34-0
.063
-0.1
25**
-0.2
24**
*-0
.261
***
8-0
.143
***
-0.1
93**
*-0
.033
-0.0
59*
-0.0
79-0
.159
***
-0.1
70**
*-0
.223
***
9-0
.142
***
-0.1
89**
*-0
.001
-0.0
120.
015
-0.0
54-0
.184
***
-0.2
38**
*10
-0.1
20**
*-0
.178
***
0.05
0*-0
.013
-0.0
72-0
.161
**-0
.154
***
-0.2
09**
*11
-14
-0.1
02**
*-0
.160
***
0.04
6***
-0.0
09-0
.058
*-0
.164
***
-0.1
27**
*-0
.184
***
15-1
9-0
.073
***
-0.1
28**
*0.
056*
**-0
.006
0.01
9-0
.086
***
-0.1
06**
*-0
.156
***
20-2
4-0
.063
***
-0.0
86**
*0.
084*
**0.
055*
**0.
000
-0.0
43-0
.101
***
-0.1
23**
*
The
tabl
e re
port
s, fo
r Fr
ance
, the
per
cent
age
poin
t diff
eren
ces
betw
een
imm
igra
nts
and
nativ
es a
ged
25-6
4 in
the
prob
abili
ty o
f em
ploy
men
t for
eac
h ye
ar a
fter
mig
ratio
n to
the
coun
try
up to
the
24th
(Y
ears
), ov
eral
l and
by
mai
n im
mig
rant
are
as o
f orig
in, d
efine
d as
EU
15, N
ew E
U M
embe
r St
ates
and
Ext
ra-E
U. T
he d
iffer
ence
s ar
e es
timat
ed o
vera
ll an
d w
hen
diffe
renc
es in
age
, gen
der
and
educ
atio
n ch
arac
teris
tics
are
take
n in
to a
ccou
nt. T
he d
iffer
ence
s ar
e co
mpu
ted
as c
oeffi
cien
ts o
n an
imm
igra
nt d
umm
y in
a li
near
pro
babi
lity
mod
el. S
ee T
echn
ical
App
endi
x fo
r det
ails
. *, *
*, *
** in
dica
te th
at th
e di
ffere
nce
is s
tatis
tical
ly s
igni
fican
t at t
he 1
0, 5
and
1 p
erce
nt s
igni
fican
ce le
vel,
resp
ectiv
ely.
Imm
igra
nts
are
defin
ed a
s fo
reig
n bo
rn. S
ourc
e: o
ur e
labo
ratio
n on
EU
LFS
data
199
5-20
16.
Table B 22: Employment gap in Sweden, by years of residence
The table reports, for Sweden, the percentage point differences between immigrants and natives aged 25-64 in the probability of employment for each year for which data are available, overall and separately for recent (in the country for at most five years) and earlier (in the country for six or more years) immigrants. The differences are estimated overall and when differences in age, gender and education characteristics are taken into account. The differences are computed as coefficients on an immigrant dummy in a linear probability model. See Technical Appendix for details. *, **, *** indicate that the difference is statistically significant at the 10, 5 and 1 percent significance level, respectively. Immigrants are defined as foreign born. Source: our elaboration on EULFS data 1995-2016.
Table B 23: Employment gap in United Kingdom, by years of residence
The table reports, for the United Kingdom, the percentage point differences between immigrants and natives aged 25-64 in the probability of employment for each year for which data are available, overall and separately for recent (in the country for at most five years) and earlier (in the country for six or more years) immigrants. The differences are estimated overall and when differences in age, gender and education characteristics are taken into account. The differences are computed as coefficients on an immigrant dummy in a linear probability model. See Technical Appendix for details. *, **, *** indicate that the difference is statistically significant at the 10, 5 and 1 percent significance level, respectively. Immigrants are defined as foreign born. Source: our elaboration on EULFS data 1995-2016.
Tables Appendix - Long Term IntegrationTables Appendix - Long Term Integration
101100
Tabl
e B
26: E
mpl
oym
ent a
ssim
ilatio
n in
Ital
y, b
y or
igin
Year
sA
ll im
mig
rant
sEU
15N
ew E
U M
embe
r St
ates
Extr
a-EU
Unc
ondi
tion
alCo
ndit
iona
lU
ncon
diti
onal
Cond
itio
nal
Unc
ondi
tion
alCo
ndit
iona
lU
ncon
diti
onal
Cond
itio
nal
1-0
.400
***
-0.3
37**
*-0
.115
-0.1
61-0
.228
***
-0.2
03**
*-0
.447
***
-0.3
71**
*
2-0
.235
***
-0.1
84**
*-0
.117
**-0
.203
***
-0.0
19-0
.002
-0.3
14**
*-0
.244
***
3-0
.131
***
-0.0
90**
*-0
.023
-0.1
24**
*0.
010
0.03
2***
-0.2
02**
*-0
.144
***
4-0
.079
***
-0.0
49**
*0.
016
-0.0
80**
*0.
032*
**0.
041*
**-0
.140
***
-0.0
91**
*
5-0
.038
***
-0.0
10**
0.04
3-0
.028
0.04
6***
0.05
7***
-0.0
87**
*-0
.044
***
6-0
.008
0.01
4***
-0.0
26-0
.107
***
0.05
1***
0.06
1***
-0.0
40**
*-0
.006
70.
021*
**0.
030*
**0.
011
-0.0
67**
0.06
2***
0.06
3***
-0.0
020.
016*
**
80.
038*
**0.
040*
**0.
007
-0.0
78**
*0.
077*
**0.
070*
**0.
018
***
0.02
8***
90.
035*
**0.
031*
**-0
.010
-0.0
67**
0.06
2***
0.04
7***
0.02
2**
*0.
026*
**
100.
047*
**0.
035*
**-0
.035
-0.1
15**
*0.
059*
**0.
036*
**0.
044
***
0.03
9***
11-1
40.
059*
**0.
028*
**-0
.048
***
-0.1
24**
*0.
073*
**0.
022*
**0.
056
***
0.03
5***
15-1
90.
065*
**0.
014*
**-0
.005
-0.0
92**
*0.
088*
**0.
005
0.06
3**
*0.
020*
**
20-2
40.
059*
**0.
011*
**-0
.014
-0.0
62**
*0.
013
-0.0
63**
*0.
073
***
0.02
8***
The
tabl
e re
port
s, fo
r Ita
ly, t
he p
erce
ntag
e po
int d
iffer
ence
s be
twee
n im
mig
rant
s an
d na
tives
age
d 25
-64
in th
e pr
obab
ility
of e
mpl
oym
ent f
or e
ach
year
afte
r mig
ratio
n to
the
coun
try
up to
the
24th
(Yea
rs),
over
all a
nd b
y m
ain
imm
igra
nt a
reas
of o
rigin
, defi
ned
as E
U15
, New
EU
Mem
ber S
tate
s and
Ext
ra-E
U. T
he d
iffer
ence
s are
est
imat
ed o
vera
ll an
d w
hen
diffe
renc
es in
age
, gen
der a
nd e
duca
tion
char
acte
ristic
s ar
e ta
ken
into
acc
ount
. The
diff
eren
ces
are
com
pute
d as
coe
ffici
ents
on
an im
mig
rant
dum
my
in a
line
ar p
roba
bilit
y m
odel
. See
Tec
hnic
al A
ppen
dix
for
deta
ils. *
, **,
***
indi
cate
that
the
diffe
renc
e is
st
atis
tical
ly s
igni
fican
t at t
he 1
0, 5
and
1 p
erce
nt s
igni
fican
ce le
vel,
resp
ectiv
ely.
Imm
igra
nts
are
defin
ed a
s fo
reig
n bo
rn. S
ourc
e: o
ur e
labo
ratio
n on
EU
LFS
data
199
5-20
16.
Tabl
e B
25: E
mpl
oym
ent a
ssim
ilatio
n in
Ger
man
y, b
y or
igin
Year
sA
ll im
mig
rant
sEU
15N
ew E
U M
embe
r St
ates
Extr
a-EU
Unc
ondi
tion
alCo
ndit
iona
lU
ncon
diti
onal
Cond
itio
nal
Unc
ondi
tion
alCo
ndit
iona
lU
ncon
diti
onal
Cond
itio
nal
1-0
.249
***
-0.2
61**
*-0
.056
*-0
.103
***
-0.0
65**
*-0
.057
**-0
.475
***
-0.4
89**
*
2-0
.270
***
-0.2
80**
*-0
.062
***
-0.1
00**
*-0
.065
***
-0.0
72**
*-0
.480
***
-0.4
81**
*
3-0
.186
***
-0.1
98**
*-0
.022
-0.0
58**
*-0
.036
***
-0.0
50**
*-0
.395
***
-0.3
94**
*
4-0
.140
***
-0.1
51**
*-0
.020
-0.0
56**
*-0
.013
-0.0
28*
-0.2
81**
*-0
.280
***
5-0
.134
***
-0.1
40**
*-0
.036
-0.0
72**
*-0
.011
-0.0
22-0
.242
***
-0.2
36**
*
6-0
.146
***
-0.1
48**
*0.
003
-0.0
28-0
.064
***
-0.0
70**
*-0
.234
***
-0.2
26**
*
7-0
.161
***
-0.1
59**
*-0
.017
-0.0
42-0
.080
***
-0.0
89**
*-0
.244
***
-0.2
29**
*
8-0
.160
***
-0.1
53**
*-0
.018
-0.0
64**
-0.0
48**
-0.0
60**
-0.2
31**
*-0
.207
***
9-0
.155
***
-0.1
54**
*0.
008
-0.0
34-0
.090
***
-0.0
91**
*-0
.212
***
-0.2
01**
*
10-0
.148
***
-0.1
40**
*-0
.046
-0.0
77*
-0.0
30-0
.051
*-0
.204
***
-0.1
81**
*
11-1
4-0
.144
***
-0.1
31**
*-0
.019
-0.0
29*
-0.0
57**
*-0
.076
***
-0.1
92**
*-0
.167
***
15-1
9-0
.115
***
-0.0
92**
*-0
.003
-0.0
03-0
.031
*-0
.046
***
-0.1
66**
*-0
.127
***
20-2
4-0
.107
***
-0.0
66**
*0.
009
0.04
5***
-0.0
34*
-0.0
39**
-0.1
58**
*-0
.105
***
The
tabl
e re
port
s, fo
r G
erm
any,
the
perc
enta
ge p
oint
diff
eren
ces
betw
een
imm
igra
nts
and
nativ
es a
ged
25-6
4 in
the
prob
abili
ty o
f em
ploy
men
t for
eac
h ye
ar a
fter
mig
ratio
n to
the
coun
try
up to
the
24th
(Y
ears
), ov
eral
l and
by
mai
n im
mig
rant
are
as o
f orig
in, d
efine
d as
EU
15, N
ew E
U M
embe
r St
ates
and
Ext
ra-E
U. T
he d
iffer
ence
s ar
e es
timat
ed o
vera
ll an
d w
hen
diffe
renc
es in
age
, gen
der
and
educ
atio
n ch
arac
teris
tics
are
take
n in
to a
ccou
nt. T
he d
iffer
ence
s ar
e co
mpu
ted
as c
oeffi
cien
ts o
n an
imm
igra
nt d
umm
y in
a li
near
pro
babi
lity
mod
el. S
ee T
echn
ical
App
endi
x fo
r de
tails
. *, *
*, *
** in
dica
te th
at th
e di
ffere
nce
is s
tatis
tical
ly s
igni
fican
t at t
he 1
0, 5
and
1 p
erce
nt s
igni
fican
ce le
vel,
resp
ectiv
ely.
Imm
igra
nts
are
defin
ed a
s fo
reig
n na
tiona
ls. S
ourc
e: o
ur e
labo
ratio
n on
EU
LFS
data
199
5-20
16.
Tables Appendix - Long Term IntegrationTables Appendix - Long Term Integration
103102
Tabl
e B
28: E
mpl
oym
ent a
ssim
ilatio
n in
Sw
eden
, by
orig
in
Year
sA
ll im
mig
rant
sEU
15N
ew E
U M
embe
r St
ates
Extr
a-EU
Unc
ondi
tion
alCo
ndit
iona
lU
ncon
diti
onal
Cond
itio
nal
Unc
ondi
tion
alCo
ndit
iona
lU
ncon
diti
onal
Cond
itio
nal
1-0
.398
***
-0.4
09**
*-0
.146
***
-0.1
72**
*-0
.241
***
-0.2
56**
*-0
.479
***
-0.4
85**
*2
-0.3
68**
*-0
.370
***
-0.0
98**
*-0
.134
***
-0.1
85**
*-0
.194
***
-0.4
42**
*-0
.437
***
3-0
.315
***
-0.3
13**
*-0
.014
-0.0
52**
*-0
.112
***
-0.1
21**
*-0
.396
***
-0.3
86**
*4
-0.2
89**
*-0
.285
***
-0.0
26**
-0.0
60**
*-0
.120
***
-0.1
30**
*-0
.363
***
-0.3
50**
*5
-0.2
77**
*-0
.274
***
-0.0
02-0
.041
***
-0.1
19**
*-0
.128
***
-0.3
46**
*-0
.334
***
6-0
.257
***
-0.2
55**
*-0
.022
*-0
.060
***
-0.1
14**
*-0
.122
***
-0.3
20**
*-0
.310
***
7-0
.228
***
-0.2
27**
*-0
.007
-0.0
53**
*-0
.082
***
-0.0
90**
*-0
.291
***
-0.2
82**
*8
-0.1
94**
*-0
.194
***
-0.0
16-0
.062
***
-0.0
48**
*-0
.065
***
-0.2
45**
*-0
.236
***
9-0
.178
***
-0.1
80**
*-0
.023
*-0
.078
***
-0.0
50**
*-0
.076
***
-0.2
19**
*-0
.211
***
10-0
.170
***
-0.1
73**
*-0
.023
*-0
.079
***
-0.0
63**
*-0
.079
***
-0.2
09**
*-0
.203
***
11-1
4-0
.157
***
-0.1
61**
*-0
.008
-0.0
61**
*-0
.044
***
-0.0
69**
*-0
.193
***
-0.1
88**
*15
-19
-0.1
28**
*-0
.129
***
0.00
0-0
.039
***
-0.0
51**
*-0
.067
***
-0.1
48**
*-0
.146
***
20-2
4-0
.114
***
-0.1
09**
*-0
.038
***
-0.0
57**
*-0
.082
***
-0.0
82**
*-0
.125
***
-0.1
19**
*
The
tabl
e re
port
s, fo
r Sw
eden
, the
per
cent
age
poin
t diff
eren
ces b
etw
een
imm
igra
nts a
nd n
ativ
es a
ged
25-6
4 in
the
prob
abili
ty o
f em
ploy
men
t for
eac
h ye
ar a
fter m
igra
tion
to th
e co
untr
y up
to th
e 24
th (Y
ears
), ov
eral
l and
by
mai
n im
mig
rant
are
as o
f orig
in, d
efine
d as
EU
15, N
ew E
U M
embe
r Sta
tes a
nd E
xtra
-EU
. The
diff
eren
ces a
re e
stim
ated
ove
rall
and
whe
n di
ffere
nces
in a
ge, g
ende
r and
edu
catio
n ch
arac
teris
tics
are
take
n in
to a
ccou
nt. T
he d
iffer
ence
s ar
e co
mpu
ted
as c
oeffi
cien
ts o
n an
imm
igra
nt d
umm
y in
a li
near
pro
babi
lity
mod
el. S
ee T
echn
ical
App
endi
x fo
r de
tails
. *, *
*, *
** in
dica
te th
at th
e di
ffere
nce
is
stat
istic
ally
sig
nific
ant a
t the
10,
5 a
nd 1
per
cent
sig
nific
ance
leve
l, re
spec
tivel
y. Im
mig
rant
s ar
e de
fined
as
fore
ign
born
. Sou
rce:
our
ela
bora
tion
on E
ULF
S da
ta 1
995-
2016
.
Tabl
e B
27: E
mpl
oym
ent a
ssim
ilatio
n in
Spa
in, b
y or
igin
Year
sA
ll im
mig
rant
sEU
15N
ew E
U M
embe
r St
ates
Extr
a-EU
Unc
ondi
tion
alCo
ndit
iona
lU
ncon
diti
onal
Cond
itio
nal
Unc
ondi
tion
alCo
ndit
iona
lU
ncon
diti
onal
Cond
itio
nal
1-0
.249
***
-0.2
73**
*-0
.070
-0.2
10**
-0.1
46-0
.125
-0.2
92**
*-0
.303
***
2-0
.117
***
-0.1
46**
*0.
052
-0.0
42-0
.056
-0.0
69-0
.168
***
-0.1
85**
*
3-0
.090
***
-0.1
24**
*-0
.044
-0.1
45**
-0.0
49-0
.063
-0.1
05**
*-0
.134
***
4-0
.043
***
-0.0
65**
*0.
015
-0.0
55-0
.014
-0.0
29-0
.057
***
-0.0
72**
*
5-0
.037
***
-0.0
58**
*-0
.121
**-0
.160
***
-0.0
53*
-0.0
78**
-0.0
21-0
.037
**
6-0
.035
***
-0.0
58**
*-0
.112
**-0
.144
***
-0.0
26-0
.059
**-0
.031
**-0
.048
***
7-0
.036
***
-0.0
55**
*-0
.078
-0.1
36**
*-0
.066
***
-0.0
95**
*-0
.022
-0.0
33**
8-0
.026
**-0
.053
***
0.02
4-0
.035
0.01
3-0
.037
-0.0
42**
*-0
.058
***
9-0
.053
***
-0.0
77**
*-0
.141
***
-0.1
80**
*-0
.063
**-0
.110
***
-0.0
41**
*-0
.056
***
10-0
.032
***
-0.0
58**
*-0
.016
-0.0
71*
-0.0
49*
-0.0
93**
*-0
.029
**-0
.048
***
11-1
4-0
.039
***
-0.0
67**
*-0
.015
-0.0
88**
*-0
.033
**-0
.076
***
-0.0
43**
*-0
.063
***
15-1
9-0
.039
***
-0.0
65**
*0.
030
-0.0
370.
016
-0.0
57**
-0.0
61**
*-0
.072
***
20-2
4-0
.053
***
-0.0
72**
*0.
001
-0.0
47**
0.05
3-0
.038
-0.0
80**
*-0
.084
***
The
tabl
e re
port
s, fo
r Spa
in, t
he p
erce
ntag
e po
int d
iffer
ence
s be
twee
n im
mig
rant
s an
d na
tives
age
d 25
-64
in th
e pr
obab
ility
of e
mpl
oym
ent f
or e
ach
year
afte
r mig
ratio
n to
the
coun
try
up to
the
24th
(Yea
rs),
over
all a
nd b
y m
ain
imm
igra
nt a
reas
of o
rigin
, defi
ned
as E
U15
, New
EU
Mem
ber S
tate
s and
Ext
ra-E
U. T
he d
iffer
ence
s are
est
imat
ed o
vera
ll an
d w
hen
diffe
renc
es in
age
, gen
der a
nd e
duca
tion
char
acte
ristic
s ar
e ta
ken
into
acc
ount
. The
diff
eren
ces
are
com
pute
d as
coe
ffici
ents
on
an im
mig
rant
dum
my
in a
line
ar p
roba
bilit
y m
odel
. See
Tec
hnic
al A
ppen
dix
for
deta
ils. *
, **,
***
indi
cate
that
the
diffe
renc
e is
st
atis
tical
ly s
igni
fican
t at t
he 1
0, 5
and
1 p
erce
nt s
igni
fican
ce le
vel,
resp
ectiv
ely.
Imm
igra
nts
are
defin
ed a
s fo
reig
n bo
rn. S
ourc
e: o
ur e
labo
ratio
n on
EU
LFS
data
199
5-20
16.
Tables Appendix - Long Term IntegrationTables Appendix - Long Term Integration
105104
Table B 30: Employment assimilation in France, by education
The table reports, for France, the percentage point differences between immigrants and natives aged 25-64 in the probability of employment for each year after migration to the country up to the 24th (Years), by educational attainment. The differences are estimated overall and when differences in age and gender characteristics are taken into account. The differences are computed as coefficients on an immigrant dummy in a linear probability model. See Technical Appendix for details. *, **, *** indicate that the difference is statistically significant at the 10, 5 and 1 percent significance level, respectively. Immigrants are defined as foreign born. Source: our elaboration on EULFS data 1995-2016.
Table B 31: Employment assimilation in Germany, by education
The table reports, for Germany, the percentage point differences between immigrants and natives aged 25-64 in the probability of employment for each year after migration to the country up to the 24th (Years), by educational attainment. The differences are estimated overall and when differences in age and gender characteristics are taken into account. The differences are computed as coefficients on an immigrant dummy in a linear probability model. See Technical Appendix for details. *, **, *** indicate that the difference is statistically significant at the 10, 5 and 1 percent significance level, respectively. Immigrants are defined as foreign nationals. Source: our elaboration on EULFS data 1995-2016.Ta
ble
B 29
: Em
ploy
men
t ass
imila
tion
in th
e U
nite
d Ki
ngdo
m, b
y or
igin
Year
sA
ll im
mig
rant
sEU
15N
ew E
U M
embe
r St
ates
Extr
a-EU
Unc
ondi
tion
alCo
ndit
iona
lU
ncon
diti
onal
Cond
itio
nal
Unc
ondi
tion
alCo
ndit
iona
lU
ncon
diti
onal
Cond
itio
nal
1-0
.183
***
-0.2
46**
*-0
.057
**-0
.142
***
-0.0
49**
-0.0
76**
*-0
.268
***
-0.3
35**
*
2-0
.060
***
-0.1
21**
*0.
039*
*-0
.048
**0.
051*
**0.
019*
-0.1
47**
*-0
.216
***
3-0
.022
**-0
.079
***
0.02
8-0
.044
*0.
077*
**0.
042*
**-0
.098
***
-0.1
62**
*
40.
002
-0.0
57**
*0.
093*
**-0
.010
0.07
6***
0.03
9***
-0.0
62**
*-0
.124
***
50.
019*
*-0
.043
***
0.06
1***
-0.0
280.
099*
**0.
055*
**-0
.044
***
-0.1
09**
*
60.
012
-0.0
48**
*0.
112*
**0.
025
0.09
2***
0.05
6***
-0.0
53**
*-0
.120
***
7-0
.006
-0.0
69**
*0.
046
-0.0
370.
064*
**0.
017
-0.0
47**
*-0
.116
***
80.
004
-0.0
56**
*0.
119*
**0.
028
0.11
0***
0.06
8***
-0.0
60**
*-0
.124
***
9-0
.005
-0.0
72**
*0.
085*
**0.
013
0.08
3***
0.02
1-0
.055
***
-0.1
24**
*
10-0
.015
*-0
.084
***
0.02
3-0
.056
**0.
103*
**0.
042*
**-0
.059
***
-0.1
29**
*
11-1
4-0
.024
***
-0.0
94**
*0.
072*
**-0
.020
0.09
0***
0.01
1-0
.057
***
-0.1
23**
*
15-1
9-0
.039
***
-0.0
99**
*0.
061*
**-0
.037
***
0.00
9-0
.056
**-0
.061
***
-0.1
15**
*
20-2
4-0
.036
***
-0.0
75**
*0.
039*
**-0
.013
0.03
1-0
.026
-0.0
56**
*-0
.093
***
The
tabl
e re
port
s, fo
r the
Uni
ted
King
dom
, the
per
cent
age
poin
t diff
eren
ces b
etw
een
imm
igra
nts a
nd n
ativ
es a
ged
25-6
4 in
the
prob
abili
ty o
f em
ploy
men
t for
eac
h ye
ar a
fter m
igra
tion
to th
e co
untr
y up
to th
e 24
th (Y
ears
), ov
eral
l and
by
mai
n im
mig
rant
are
as o
f orig
in, d
efine
d as
EU
15, N
ew E
U M
embe
r Sta
tes
and
Extr
a-EU
. The
diff
eren
ces
are
estim
ated
ove
rall
and
whe
n di
ffere
nces
in a
ge, g
ende
r and
edu
catio
n ch
arac
teris
tics
are
take
n in
to a
ccou
nt. T
he d
iffer
ence
s ar
e co
mpu
ted
as c
oeffi
cien
ts o
n an
imm
igra
nt d
umm
y in
a li
near
pro
babi
lity
mod
el. S
ee T
echn
ical
App
endi
x fo
r de
tails
. *, *
*, *
** in
dica
te th
at th
e di
ffere
nce
is s
tatis
tical
ly s
igni
fican
t at t
he 1
0, 5
and
1 p
erce
nt s
igni
fican
ce le
vel,
resp
ectiv
ely.
Imm
igra
nts
are
defin
ed a
s fo
reig
n bo
rn. S
ourc
e: o
ur e
labo
ratio
n on
EU
LFS
data
199
5-20
16.
Tables Appendix - Long Term IntegrationTables Appendix - Long Term Integration
107106
Table B 34: Employment assimilation in Sweden, by education
The table reports, for Sweden, the percentage point differences between immigrants and natives aged 25-64 in the probability of employment for each year after migration to the country up to the 24th (Years), by educational attainment. The differences are estimated overall and when differences in age and gender characteristics are taken into account. The differences are computed as coefficients on an immigrant dummy in a linear probability model. See Technical Appendix for details. *, **, *** indicate that the difference is statistically significant at the 10, 5 and 1 percent significance level, respectively. Immigrants are defined as foreign born. Source: our elaboration on EULFS data 1995-2016.
Table B 35: Employment assimilation in the United Kingdom, by education
The table reports, for the United Kingdom, the percentage point differences between immigrants and natives aged 25-64 in the probability of employment for each year after migration to the country up to the 24th (Years), by educational attainment. The differences are estimated overall and when differences in age and gender characteristics are taken into account. The differences are computed as coefficients on an immigrant dummy in a linear probability model. See Technical Appendix for details. *, **, *** indicate that the difference is statistically significant at the 10, 5 and 1 percent significance level, respectively. Immigrants are defined as foreign born. Source: our elaboration on EULFS data 1995-2016.
Table B 32: Employment assimilation in Italy, by education
The table reports, for Italy, the percentage point differences between immigrants and natives aged 25-64 in the probability of employment for each year after migration to the country up to the 24th (Years), by educational attainment. The differences are estimated overall and when differences in age and gender characteristics are taken into account. The differences are computed as coefficients on an immigrant dummy in a linear probability model. See Technical Appendix for details. *, **, *** indicate that the difference is statistically significant at the 10, 5 and 1 percent significance level, respectively. Immigrants are defined as foreign born. Source: our elaboration on EULFS data 1995-2016.
Table B 33: Employment assimilation in Spain, by education
The table reports, for Spain, the percentage point differences between immigrants and natives aged 25-64 in the probability of employment for each year after migration to the country up to the 24th (Years), by educational attainment. The differences are estimated overall and when differences in age and gender characteristics are taken into account. The differences are computed as coefficients on an immigrant dummy in a linear probability model. See Technical Appendix for details. *, **, *** indicate that the difference is statistically significant at the 10, 5 and 1 percent significance level, respectively. Immigrants are defined as foreign born. Source: our elaboration on EULFS data 1995-2016.
Tables Appendix - Long Term IntegrationTables Appendix - Long Term Integration
109108
New EU Member States Extra-EU
Unconditional Conditional on: Unconditional Conditional on:
The differences are computed as coefficients on an immigrant dummy in a linear regression model. See Technical Appendix for details. *, **, *** indicate that the difference is statistically significant at the 10, 5 and 1 percent significance level, respectively. Immigrants are defined as foreign born. Source: our elaboration on EULFS data 1995-2016.
New EU Member States Extra-EU
Unconditional Conditional on: Unconditional Conditional on:
The differences are computed as coefficients on an immigrant dummy in a linear regression model. See Technical Appendix for details. *, **, *** indicate that the difference is statistically significant at the 10, 5 and 1 percent significance level, respectively. Immigrants are defined as foreign nationals. Source: our elaboration on EULFS data 1995-2016.
Table B 36: Immigrant-native differences in the probability of being in the bottom income decile in France, by origin
Year All immigrants EU15
Unconditional Conditional on: Unconditional Conditional on:
The table reports, for France, the percentage points difference in the probability of being in the bottom decile of the national income distribution between immigrants and natives aged 25-64 for each year for which data are available, overall and by main areas of origin, defined as EU15, New EU Member States and Extra-EU. The differences as estimated overall and when differences in age, gender and education characteristics are taken into account. or when, additionally, also differences in occupations and full/part time employment are taken into account.
Table B 37: Immigrant-native differences in the probability of being in the bottom income decile in Germany, by origin
Year All immigrants EU15
Unconditional Conditional on: Unconditional Conditional on:
The table reports, for Germany, the percentage points difference in the probability of being in the bottom decile of the national income distribution between immigrants and natives aged 25-64 for each year for which data are available, overall and by main areas of origin, defined as EU15, New EU Member States and Extra-EU. The differences as estimated overall and when differences in age, gender and education characteristics are taken into account. or when, additionally, also differences in occupations and full/part time employment are taken into account.
Tables Appendix - Long Term IntegrationTables Appendix - Long Term Integration
111110
New EU Member States Extra-EU
Unconditional Conditional on: Unconditional Conditional on:
The differences are computed as coefficients on an immigrant dummy in a linear regression model. See Technical Appendix for details. *, **, *** indicate that the difference is statistically significant at the 10, 5 and 1 percent significance level, respectively. Immigrants are defined as foreign born. Source: our elaboration on EULFS data 1995-2016.
New EU Member States Extra-EU
Unconditional Conditional on: Unconditional Conditional on:
The differences are computed as coefficients on an immigrant dummy in a linear regression model. See Technical Appendix for details. *, **, *** indicate that the difference is statistically significant at the 10, 5 and 1 percent significance level, respectively. Immigrants are defined as foreign born. Source: our elaboration on EULFS data 1995-2016.
Table B 38: Immigrant-native differences in the probability of being in the bottom income decile in Italy, by origin
Year All immigrants EU15
Unconditional Conditional on: Unconditional Conditional on:
The table reports, for Italy, the percentage points difference in the probability of being in the bottom decile of the national income distribution between immigrants and natives aged 25-64 for each year for which data are available, overall and by main areas of origin, defined as EU15, New EU Member States and Extra-EU. The differences as estimated overall and when differences in age, gender and education characteristics are taken into account. or when, additionally, also differences in occupations and full/part time employment are taken into account.
Table B 39: Immigrant-native differences in the probability of being in the bottom income decile in Spain, by origin
Year All immigrants EU15
Unconditional Conditional on: Unconditional Conditional on:
The table reports, for Spain, the percentage points difference in the probability of being in the bottom decile of the national income distribution between immigrants and natives aged 25-64 for each year for which data are available, overall and by main areas of origin, defined as EU15, New EU Member States and Extra-EU. The differences as estimated overall and when differences in age, gender and education characteristics are taken into account. or when, additionally, also differences in occupations and full/part time employment are taken into account.
Tables Appendix - Long Term IntegrationTables Appendix - Long Term Integration
113112
New EU Member States Extra-EU
Unconditional Conditional on: Unconditional Conditional on:
The differences are computed as coefficients on an immigrant dummy in a linear regression model. See Technical Appendix for details. *, **, *** indicate that the difference is statistically significant at the 10, 5 and 1 percent significance level, respectively. Immigrants are
defined as foreign born. Source: our elaboration on EULFS data 1995-2016.
Table B 42: Immigrant-native differences in the probability of being in the bottom income decile in Germany, by years of residence
Year
Earlier RecentUnconditional Conditional on: Unconditional Conditional on:
The table reports, for Germany, the percentage points difference in the probability of being in the bottom decile of the national income distribution between immigrants and natives aged 25-64 for each year for which data are available, overall and separately for recent (in the country for at most five years) and earlier (in the country for six or more years) immigrants. The differences as estimated overall and when differences in age, gender and education characteristics are taken into account. or when, additionally, also differences in occupations and full/part time employment are taken into account. The differences are computed as coefficients on an immigrant dummy in a linear regression model. See Technical Appendix for details. *, **, *** indicate that the difference is statistically significant at the 10, 5 and 1 percent significance level, respectively. Immigrants are defined as foreign nationals. Source: our elaboration on EULFS data 1995-2016.
Table B 40: Immigrant-native differences in the probability of being in the bottom income decile in the United Kingdom, by origin
Year All immigrants EU15
Unconditional Conditional on: Unconditional Conditional on:
The table reports, for the United Kingdom, the percentage points difference in the probability of being in the bottom decile of the national income distribution between immigrants and natives aged 25-64 for each year for which data are available, overall and by main areas of origin, defined as EU15, New EU Member States and Extra-EU. The differences as estimated overall and when differences in age, gender and education characteristics are taken into account. or when, additionally, also differences in occupations and full/part time employment are taken into account.
Table B 41: Immigrant-native differences in the probability of being in the bottom income decile in France, by years of residence
Year
Earlier RecentUnconditional Conditional on: Unconditional Conditional on:
The table reports, for France, the percentage points difference in the probability of being in the bottom decile of the national income distribution between immigrants and natives aged 25-64 for each year for which data are available, overall and separately for recent (in the country for at most five years) and earlier (in the country for six or more years) immigrants. The differences as estimated overall and when differences in age, gender and education characteristics are taken into account. or when, additionally, also differences in occupations and full/part time employment are taken into account. The differences are computed as coefficients on an immigrant dummy in a linear regression model. See Technical Appendix for details. *, **, *** indicate that the difference is statistically significant at the 10, 5 and 1 percent significance level, respectively. Immigrants are defined as foreign born. Source: our elaboration on EULFS data 1995-2016.
Tables Appendix - Long Term IntegrationTables Appendix - Long Term Integration
115114
Table B 45: Immigrant-native differences in the probability of being in the bottom income decile in the United Kingdom, by years of residence
Year
Earlier RecentUnconditional Conditional on: Unconditional Conditional on:
The table reports, for the United Kingdom, the percentage points difference in the probability of being in the bottom decile of the national income distribution between immigrants and natives aged 25-64 for each year for which data are available, overall and separately for recent (in the country for at most five years) and earlier (in the country for six or more years) immigrants. The differences as estimated overall and when differences in age, gender and education characteristics are taken into account. or when, additionally, also differences in occupations and full/part time employment are taken into account. The differences are computed as coefficients on an immigrant dummy in a linear regression model. See Technical Appendix for details. *, **, *** indicate that the difference is statistically significant at the 10, 5 and 1 percent significance level, respectively. Immigrants are defined as foreign born. Source: our elaboration on EULFS data 1995-2016.
Table B 46: Immigrant-native differences in the probability of being in the bottom income decile in France, by education
Year
Low education High educationUnconditional Conditional on: Unconditional Conditional on:
The table reports, for France, the percentage points difference in the probability of being in the bottom decile of the national income distribution between immigrants and natives aged 25-64 for each year for which data are available, overall and by educational attainment. The differences as estimated overall and when differences in age and gender characteristics are taken into account. or when, additionally, also differences in occupations and full/part time employment are taken into account. The differences are computed as coefficients on an immigrant dummy in a linear regression model. See Technical Appendix for details. *, **, *** indicate that the difference is statistically significant at the 10, 5 and 1 percent significance level, respectively. Immigrants are defined as foreign born. Source: our elaboration on EULFS data 1995-2016.
Table B 43: Immigrant-native differences in the probability of being in the bottom income decile in Italy, by years of residence
Year
Earlier RecentUnconditional Conditional on: Unconditional Conditional on:
The table reports, for Italy, the percentage points difference in the probability of being in the bottom decile of the national income distribution between immigrants and natives aged 25-64 for each year for which data are available, overall and separately for recent (in the country for at most five years) and earlier (in the country for six or more years) immigrants. The differences as estimated overall and when differences in age, gender and education characteristics are taken into account. or when, additionally, also differences in occupations and full/part time employment are taken into account. The differences are computed as coefficients on an immigrant dummy in a linear regression model. See Technical Appendix for details. *, **, *** indicate that the difference is statistically significant at the 10, 5 and 1 percent significance level, respectively. Immigrants are defined as foreign born. Source: our elaboration on EULFS data 1995-2016.
Table B 44: Immigrant-native differences in the probability of being in the bottom income decile in Spain, by years of residence
Year
Earlier RecentUnconditional Conditional on: Unconditional Conditional on:
The table reports, for Spain, the percentage points difference in the probability of being in the bottom decile of the national income distribution between immigrants and natives aged 25-64 for each year for which data are available, overall and separately for recent (in the country for at most five years) and earlier (in the country for six or more years) immigrants. The differences as estimated overall and when differences in age, gender and education characteristics are taken into account. or when, additionally, also differences in occupations and full/part time employment are taken into account. The differences are computed as coefficients on an immigrant dummy in a linear regression model. See Technical Appendix for details. *, **, *** indicate that the difference is statistically significant at the 10, 5 and 1 percent significance level, respectively. Immigrants are defined as foreign born. Source: our elaboration on EULFS data 1995-2016.
Tables Appendix - Long Term IntegrationTables Appendix - Long Term Integration
117116
Table B 49: Immigrant-native differences in the probability of being in the bottom income decile in Spain, by education
Year
Low education High educationUnconditional Conditional on: Unconditional Conditional on:
The table reports, for Spain, the percentage points difference in the probability of being in the bottom decile of the national income distribution between immigrants and natives aged 25-64 for each year for which data are available, overall and by educational attainment. The differences as estimated overall and when differences in age and gender characteristics are taken into account. or when, additionally, also differences in occupations and full/part time employment are taken into account. The differences are computed as coefficients on an immigrant dummy in a linear regression model. See Technical Appendix for details. *, **, *** indicate that the difference is statistically significant at the 10, 5 and 1 percent significance level, respectively. Immigrants are defined as foreign born. Source: our elaboration on EULFS data 1995-2016.
Table B 50: Immigrant-native differences in the probability of being in the bottom income decile in the United Kingdom, by education
Year
Low education High educationUnconditional Conditional on: Unconditional Conditional on:
The table reports, for the United Kingdom, the percentage points difference in the probability of being in the bottom decile of the national income distribution between immigrants and natives aged 25-64 for each year for which data are available, overall and by educational attainment. The differences as estimated overall and when differences in age and gender characteristics are taken into account. or when, additionally, also differences in occupations and full/part time employment are taken into account. The differences are computed as coefficients on an immigrant dummy in a linear regression model. See Technical Appendix for details. *, **, *** indicate that the difference is statistically significant at the 10, 5 and 1 percent significance level, respectively. Immigrants are defined as foreign born. Source: our elaboration on EULFS data 1995-2016.
Table B 47: Immigrant-native differences in the probability of being in the bottom income decile in Germany, by education
Year
Low education High educationUnconditional Conditional on: Unconditional Conditional on:
The table reports, for Germany, the percentage points difference in the probability of being in the bottom decile of the national income distribution between immigrants and natives aged 25-64 for each year for which data are available, overall and by educational attainment. The differences as estimated overall and when differences in age and gender characteristics are taken into account. or when, additionally, also differences in occupations and full/part time employment are taken into account. The differences are computed as coefficients on an immigrant dummy in a linear regression model. See Technical Appendix for details. *, **, *** indicate that the difference is statistically significant at the 10, 5 and 1 percent significance level, respectively. Immigrants are defined as foreign nationals. Source: our elaboration on EULFS data 1995-2016.
Table B 48: Immigrant-native differences in the probability of being in the bottom income decile in Italy, by education
Year
Low education High educationUnconditional Conditional on: Unconditional Conditional on:
The table reports, for Italy, the percentage points difference in the probability of being in the bottom decile of the national income distribution between immigrants and natives aged 25-64 for each year for which data are available, overall and by educational attainment. The differences as estimated overall and when differences in age and gender characteristics are taken into account. or when, additionally, also differences in occupations and full/part time employment are taken into account. The differences are computed as coefficients on an immigrant dummy in a linear regression model. See Technical Appendix for details. *, **, *** indicate that the difference is statistically significant at the 10, 5 and 1 percent significance level, respectively. Immigrants are defined as foreign born. Source: our elaboration on EULFS data 1995-2016.
Tables Appendix - Long Term IntegrationTables Appendix - Long Term Integration
119118
New EU Member States Extra-EUUnconditional Conditional on: Unconditional Conditional on:
The differences are computed as coefficients on an immigrant dummy in a linear regression model. See Technical Appendix for details. *, **, *** indicate that the difference is statistically significant at the 10, 5 and 1 percent significance level, respectively. Immigrants are defined as foreign born. Source: our elaboration on EULFS data 1995-2016.
New EU Member States Extra-EUUnconditional Conditional on: Unconditional Conditional on:
The differences are computed as coefficients on an immigrant dummy in a linear regression model. See Technical Appendix for details. *, **, *** indicate that the difference is statistically significant at the 10, 5 and 1 percent significance level, respectively. Immigrants are defined as foreign nationals. Source: our elaboration on EULFS data 1995-2016.
Table B 51: Assimilation: Immigrant-native differences in the probability of being in the bottom income decile in France, by origin
Year All immigrants EU15Unconditional Conditional on: Unconditional Conditional on:
The table reports, for France, the percentage points difference in the probability of being in the bottom decile of the national income distribution between immigrants and natives aged 25-64 for each year after migration to the country up to the 24th (Years), by main areas of origin, defined as EU15, New EU Member States and Extra-EU. The differences as estimated overall and when differences in age and gender characteristics are taken into account. or when, additionally, also differences in occupations and full/part time employment are taken into account.
Table B 52: Assimilation: Immigrant-native differences in the probability of being in the bottom income decile in Germany, by origin
Year All immigrants EU15Unconditional Conditional on: Unconditional Conditional on:
The table reports, for Germany, the percentage points difference in the probability of being in the bottom decile of the national income distribution between immigrants and natives aged 25-64 for each year after migration to the country up to the 24th (Years), by main areas of origin, defined as EU15, New EU Member States and Extra-EU. The differences as estimated overall and when differences in age and gender characteristics are taken into account. or when, additionally, also differences in occupations and full/part time employment are taken into account.
Tables Appendix - Long Term IntegrationTables Appendix - Long Term Integration
121120
New EU Member States Extra-EUUnconditional Conditional on: Unconditional Conditional on:
The differences are computed as coefficients on an immigrant dummy in a linear regression model. See Technical Appendix for details. *, **, *** indicate that the difference is statistically significant at the 10, 5 and 1 percent significance level, respectively. Immigrants are defined as foreign born. Source: our elaboration on EULFS data 1995-2016.
New EU Member States Extra-EUUnconditional Conditional on: Unconditional Conditional on:
The differences are computed as coefficients on an immigrant dummy in a linear regression model. See Technical Appendix for details. *, **, *** indicate that the difference is statistically significant at the 10, 5 and 1 percent significance level, respectively. Immigrants are defined as foreign born. Source: our elaboration on EULFS data 1995-2016.
Table B 53: Assimilation: Immigrant-native differences in the probability of being in the bottom income decile in Italy, by origin
Year All immigrants EU15Unconditional Conditional on: Unconditional Conditional on:
The table reports, for Italy, the percentage points difference in the probability of being in the bottom decile of the national income distribution between immigrants and natives aged 25-64 for each year after migration to the country up to the 24th (Years), by main areas of origin, defined as EU15, New EU Member States and Extra-EU. The differences as estimated overall and when differences in age and gender characteristics are taken into account. or when, additionally, also differences in occupations and full/part time employment are taken into account.
Table B 54: Assimilation: Immigrant-native differences in the probability of being in the bottom income decile in Spain, by origin
Year All immigrants EU15Unconditional Conditional on: Unconditional Conditional on:
The table reports, for Spain, the percentage points difference in the probability of being in the bottom decile of the national income distribution between immigrants and natives aged 25-64 for each year after migration to the country up to the 24th (Years), by main areas of origin, defined as EU15, New EU Member States and Extra-EU. The differences as estimated overall and when differences in age and gender characteristics are taken into account. or when, additionally, also differences in occupations and full/part time employment are taken into account.
Tables Appendix - Long Term IntegrationTables Appendix - Long Term Integration
123122
New EU Member States Extra-EUUnconditional Conditional on: Unconditional Conditional on:
The differences are computed as coefficients on an immigrant dummy in a linear regression model. See Technical Appendix for details. *, **, *** indicate that the difference is statistically significant at the 10, 5 and 1 percent significance level, respectively. Immigrants are defined as foreign born. Source: our elaboration on EULFS data 1995-2016.
Table B 57: Assimilation: Immigrant-native differences in the probability of being in the bottom income decile in Germany, by education
Year
Low education High educationUnconditional Conditional on: Unconditional Conditional on:
The table reports, for Germany, the percentage points difference in the probability of being in the bottom decile of the national income distribution between immigrants and natives aged 25-64 for each year after migration to the country up to the 24th (Years), by educational attainment. The differences as estimated overall and when differences in age and gender characteristics are taken into account. or when, additionally, also differences in occupations and full/part time employment are taken into account. The differences are computed as coefficients on an immigrant dummy in a linear regression model. See Technical Appendix for details. *, **, *** indicate that the difference is statistically significant at the 10, 5 and 1 percent significance level, respectively. Immigrants are defined as foreign nationals. Source: our elaboration on EULFS data 1995-2016.
Table B 55: Assimilation: Immigrant-native differences in the probability of being in the bottom income decile in the United Kingdom, by origin
Year All immigrants EU15Unconditional Conditional on: Unconditional Conditional on:
The table reports, for the United Kingdom, the percentage points difference in the probability of being in the bottom decile of the national income distribution between immigrants and natives aged 25-64 for each year after migration to the country up to the 24th (Years), by main areas of origin, defined as EU15, New EU Member States and Extra-EU. The differences as estimated overall and when differences in age and gender characteristics are taken into account. or when, additionally, also differences in occupations and full/part time employment are taken into account.
Table B 56: Assimilation: Immigrant-native differences in the probability of being in the bottom income decile in France, by education
Year
Low education High educationUnconditional Conditional on: Unconditional Conditional on:
The table reports, for France, the percentage points difference in the probability of being in the bottom decile of the national income distribution between immigrants and natives aged 25-64 for each year after migration to the country up to the 24th (Years), by educational attainment. The differences as estimated overall and when differences in age and gender characteristics are taken into account. or when, additionally, also differences in occupations and full/part time employment are taken into account. The differences are computed as coefficients on an immigrant dummy in a linear regression model. See Technical Appendix for details. *, **, *** indicate that the difference is statistically significant at the 10, 5 and 1 percent significance level, respectively. Immigrants are defined as foreign born. Source: our elaboration on EULFS data 1995-2016.
Tables Appendix - Long Term IntegrationTables Appendix - Long Term Integration
125124
Table B 59: Assimilation: Immigrant-native differences in the probability of being in the bottom income decile in Spain, by education
Year
Low education High educationUnconditional Conditional on: Unconditional Conditional on:
The table reports, for Spain, the percentage points difference in the probability of being in the bottom decile of the national income distribution between immigrants and natives aged 25-64 for each year after migration to the country up to the 24th (Years), by educational attainment. The differences as estimated overall and when differences in age and gender characteristics are taken into account. or when, additionally, also differences in occupations and full/part time employment are taken into account. The differences are computed as coefficients on an immigrant dummy in a linear regression model. See Technical Appendix for details. *, **, *** indicate that the difference is statistically significant at the 10, 5 and 1 percent significance level, respectively. Immigrants are defined as foreign born. Source: our elaboration on EULFS data 1995-2016.
Table B 58: Assimilation: Immigrant-native differences in the probability of being in the bottom income decile in Italy, by education
Year
Low education High educationUnconditional Conditional on: Unconditional Conditional on:
The table reports, for Italy, the percentage points difference in the probability of being in the bottom decile of the national income distribution between immigrants and natives aged 25-64 for each year after migration to the country up to the 24th (Years), by educational attainment. The differences as estimated overall and when differences in age and gender characteristics are taken into account. or when, additionally, also differences in occupations and full/part time employment are taken into account. The differences are computed as coefficients on an immigrant dummy in a linear regression model. See Technical Appendix for details. *, **, *** indicate that the difference is statistically significant at the 10, 5 and 1 percent significance level, respectively. Immigrants are defined as foreign born. Source: our elaboration on EULFS data 1995-2016.
Tables Appendix - Long Term IntegrationTables Appendix - Long Term Integration
127126
Table B 61: Differences in occupational status between immigrants and natives, France
Year Unconditional Conditional
1995 -0.147*** -0.103***
1996 -0.108*** -0.091***
1997 -0.121*** -0.085***
1998 -0.136*** -0.086***
1999 -0.148*** -0.092***
2000 -0.138*** -0.085***
2001 -0.165*** -0.094***
2002 -0.178*** -0.101***
2003 -0.152*** -0.120***
2004 -0.183*** -0.101***
2005 -0.166*** -0.111***
2006 -0.178*** -0.108***
2007 -0.237*** -0.149***
2008 -0.228*** -0.134***
2009 -0.219*** -0.133***
2010 -0.233*** -0.125***
2011 -0.235*** -0.131***
2012 -0.225*** -0.124***
2013 -0.272*** -0.173***
2014 -0.232*** -0.136***
2015 -0.263*** -0.166***
2016 -0.243*** -0.154***
The table reports, for France, the difference in occupational status, measured by the ISEI index, between immigrants and natives aged 25-64, overall and when differences in age, gender and education characteristics are taken into account. Each cell measures the difference expressed as a fraction of the within-country standard deviation. The differences are computed as coefficients on an immigrant dummy in a linear regression model. See Technical Appendix for details. *, **, *** indicate that the difference is statistically significant at the 10, 5 and 1 percent significance level, respectively. Immigrants are defined as foreign born. Source: our elaboration on EULFS data 1995-2016.
Table B 60: Assimilation: Immigrant-native differences in the probability of being in the bottom income decile in the United Kingdom, by education
Year
Low education High educationUnconditional Conditional on: Unconditional Conditional on:
The table reports, for the United Kingdom, the percentage points difference in the probability of being in the bottom decile of the national income distribution between immigrants and natives aged 25-64 for each year after migration to the country up to the 24th (Years), by educational attainment. The differences as estimated overall and when differences in age and gender characteristics are taken into account. or when, additionally, also differences in occupations and full/part time employment are taken into account. The differences are computed as coefficients on an immigrant dummy in a linear regression model. See Technical Appendix for details. *, **, *** indicate that the difference is statistically significant at the 10, 5 and 1 percent significance level, respectively. Immigrants are defined as foreign born. Source: our elaboration on EULFS data 1995-2016.
Tables Appendix - Long Term IntegrationTables Appendix - Long Term Integration
129128
Table B 63: Differences in occupational status between immigrants and natives, Italy
Year Unconditional Conditional
2005 -0.588*** -0.521***
2006 -0.601*** -0.530***
2007 -0.625*** -0.543***
2008 -0.698*** -0.606***
2009 -0.745*** -0.631***
2010 -0.755*** -0.627***
2011 -0.725*** -0.577***
2012 -0.762*** -0.597***
2013 -0.775*** -0.588***
2014 -0.763*** -0.568***
2015 -0.775*** -0.579***
2016 -0.773*** -0.539***
The table reports, for Italy, the difference in occupational status, measured by the ISEI index, between immigrants and natives aged 25-64, overall and when differences in age, gender and education characteristics are taken into account. Each cell measures the difference expressed as a fraction of the within-country standard deviation. The differences are computed as coefficients on an immigrant dummy in a linear regression model. See Technical Appendix for details. *, **, *** indicate that the difference is statistically significant at the 10, 5 and 1 percent significance level, respectively. Immigrants are defined as foreign born. Source: our elaboration on EULFS data 1995-2016.
Table B 62: Differences in occupational status between immigrants and natives, Germany
Year Unconditional Conditional
1995 -0.490*** -0.216***
1996 -0.505*** -0.230***
1997 -0.558*** -0.275***
1999 -0.498*** -0.246***
2000 -0.492*** -0.225***
2001 -0.512*** -0.255***
2002 -0.516*** -0.264***
2003 -0.496*** -0.245***
2004 -0.480*** -0.235***
2005 -0.459*** -0.237***
2006 -0.451*** -0.228***
2007 -0.415*** -0.148***
2008 -0.464*** -0.257***
2009 -0.409*** -0.225***
2010 -0.438*** -0.235***
2011 -0.444*** -0.237***
2012 -0.464*** -0.255***
2013 -0.452*** -0.258***
2014 -0.445*** -0.270***
2015 -0.484*** -0.293***
2016 -0.452*** -0.287***
The table reports, for Germany, the difference in occupational status, measured by the ISEI index, between immigrants and natives aged 25-64, overall and when differences in age, gender and education characteristics are taken into account. Each cell measures the difference expressed as a fraction of the within-country standard deviation. The differences are computed as coefficients on an immigrant dummy in a linear regression model. See Technical Appendix for details. *, **, *** indicate that the difference is statistically significant at the 10, 5 and 1 percent significance level, respectively. Immigrants are defined as foreign nationals. Source: our elaboration on EULFS data 1995-2016.
Tables Appendix - Long Term IntegrationTables Appendix - Long Term Integration
131130
Table B 65: Differences in occupational status between immigrants and natives, Sweden
Year Unconditional Conditional
1997 -0.152*** -0.176***
1998 -0.260*** -0.250***
1999 -0.265*** -0.232***
2000 -0.238*** -0.206***
2001 -0.257*** -0.269***
2002 -0.166*** -0.204***
2003 -0.175*** -0.206***
2004 -0.183*** -0.223***
2005 -0.302*** -0.291***
2006 -0.303*** -0.283***
2007 -0.297*** -0.292***
2008 -0.305*** -0.305***
2009 -0.295*** -0.291***
2010 -0.317*** -0.323***
2011 -0.312*** -0.308***
2012 -0.327*** -0.302***
2013 -0.344*** -0.325***
2014 -0.351*** -0.334***
2015 -0.345*** -0.321***
2016 -0.326*** -0.319***
The table reports, for Sweden, the difference in occupational status, measured by the ISEI index, between immigrants and natives aged 25-64, overall and when differences in age, gender and education characteristics are taken into account. Each cell measures the difference expressed as a fraction of the within-country standard deviation. The differences are computed as coefficients on an immigrant dummy in a linear regression model. See Technical Appendix for details. *, **, *** indicate that the difference is statistically significant at the 10, 5 and 1 percent significance level, respectively. Immigrants are defined as foreign born. Source: our elaboration on EULFS data 1995-2016.
Table B 64: Differences in occupational status between immigrants and natives, Spain
Year Unconditional Conditional
1995 0.182*** -0.018
1996 0.145*** -0.017
1997 0.068* -0.078**
1998 0.044 -0.098***
1999 -0.023 -0.137***
2000 -0.125*** -0.206***
2001 -0.230*** -0.333***
2002 -0.351*** -0.408***
2003 -0.471*** -0.467***
2004 -0.498*** -0.481***
2005 -0.540*** -0.487***
2006 -0.521*** -0.482***
2007 -0.561*** -0.455***
2008 -0.585*** -0.466***
2009 -0.579*** -0.465***
2010 -0.570*** -0.418***
2011 -0.517*** -0.400***
2012 -0.557*** -0.430***
2013 -0.579*** -0.417***
2014 -0.595*** -0.454***
2015 -0.551*** -0.402***
2016 -0.526*** -0.352***
The table reports, for Spain, the difference in occupational status, measured by the ISEI index, between immigrants and natives aged 25-64, overall and when differences in age, gender and education characteristics are taken into account. Each cell measures the difference expressed as a fraction of the within-country standard deviation. The differences are computed as coefficients on an immigrant dummy in a linear regression model. See Technical Appendix for details. *, **, *** indicate that the difference is statistically significant at the 10, 5 and 1 percent significance level, respectively. Immigrants are defined as foreign born. Source: our elaboration on EULFS data 1995-2016.
Tables Appendix - Long Term IntegrationTables Appendix - Long Term Integration
133132
DATASET
Our analysis is based on the 2017 yearly wave of the European Labour Force Survey (EULFS). The EULFS is conducted in the 28 Member States of the European Union, 2 candidate countries and 3 countries of the European Free Trade Association (EFTA). At the moment, the LFS microdata for scientific purposes contain data for all Member States plus Iceland, Norway and Switzerland. These are the countries we use in our analysis. The EULFS is a large quarterly household survey of people aged 15 and over as well as of persons outside the labour force. The National Statistical Institutes of each member country are responsible for selecting the sample, preparing the questionnaires, conducting the direct interviews among households, and forwarding the results to Eurostat in accordance with the common coding scheme.
SAMPLE
We include in our sample all individuals for which either nationality or country of birth is known (see below). In the analysis of education levels and labour market outcomes we include only individuals in the 25-64 age range.
VARIABLES
We use the following variables, derived from the EULFS, in our analysis.
Immigrant: A dummy variable equal to one if individuals are born outside of their country of residence and zero otherwise, based on the original EULFS variable countryb which records individuals’ country of birth. The variable countryb is equal to one when the individual is born in the residence country (immigrant equals 0 in this case) and takes values higher than one when the individual is born abroad (immigrant equals 1 in these cases): the different codes identify the region of birth and vary across different years and countries. This definition is used in all countries with the exception of Germany, where there is no information on country of birth. In this case therefore we define immigrant status based on nationality, and immigrant takes value one when the EULFS variable national (which is coded similarly to the EULFS variable countryb described above) takes values different from one, and zero when national is equal to one.
Recent immigrant: We define as recent immigrants those with five or less years of residence in the country, as reported by the variable yearesid.
Education levels: We use the three education groups defined by the variable hatlev1d in the EULFS. Low education includes less than primary, primary and lower secondary
Table B 66: Differences in occupational status between immigrants and natives, United Kingdom
Year Unconditional Conditional
1995 0.134*** 0.132***
1996 0.145*** 0.126***
1997 0.123*** 0.131***
1999 0.152*** -0.009
2000 0.179*** -0.007
2001 0.165*** -0.002
2002 0.136*** -0.038**
2003 0.167*** -0.010
2004 0.092*** 0.042***
2005 0.067*** 0.013
2006 0.035** -0.023
2007 -0.005 -0.052***
2008 -0.083*** -0.169***
2009 -0.064*** -0.123***
2010 -0.094*** -0.154***
2011 -0.066*** -0.216***
2012 -0.079*** -0.229***
2013 -0.087*** -0.215***
2014 -0.096*** -0.233***
2015 -0.129*** -0.256***
2016 -0.114*** -0.250***
The table reports, for the United Kingdom, the difference in occupational status, measured by the ISEI index, between immigrants and natives aged 25-64, overall and when differences in age, gender and education characteristics are taken into account. Each cell measures the difference expressed as a fraction of the within-country standard deviation. The differences are computed as coefficients on an immigrant dummy in a linear regression model. See Technical Appendix for details. *, **, *** indicate that the difference is statistically significant at the 10, 5 and 1 percent significance level, respectively. Immigrants are defined as foreign born. Source: our elaboration on EULFS data 1995-2016.
Technical Appendix 1 - Europe
Tables Appendix - Long Term Integration
135134
Technical Appendix 1 - EuropeTechnical Appendix 1 - Europe
or non-EU immigrants, as well as with their pairwise combinations. Each of the figures reported in the tables corresponds to the coefficient β1 resulting in each case. We estimate equation (A.1) first separately for each country and then for all the EU15 countries pooled, and for the whole sample of countries.
We provide unconditional employment gaps estimating equation (A.1) including only the variables imm, Dc , and Dq , whereas we estimate the complete model for conditional gaps.
The sample includes natives and immigrants in working age and who are likely to have finished their full time education (25-64 years old).
We obtain estimates of differences in occupational status and of the probability of being in the bottom or top income decile by running the same regressions described above, where the dependent variable is replaced, respectively, with:
- ISEI, the standardized index of occupational status.
- Dummy for being in the bottom decile of the national income distribution.
- Dummy for being in the top decile of the national income distribution.
In the analysis on position in income distribution, besides estimating unconditional and conditional gaps as described above, we estimate a third equation by augmenting (A.1) with a set of dummies for three-digits ISCO occupations and a dummy for part time employment. The resulting equation is as follows:
Where Per is the binary indicator for the corresponding percentile (bottom decile or top decile), Docc represents the vector of occupation dummies and pt is the dummy for part time employment.
education (ISCED levels 0-2). Intermediate education corresponds to upper secondary and post-secondary non-tertiary education (ISCED levels 3 and 4). High educated individuals have short-cycle tertiary, bachelor or equivalent or doctoral or equivalent degrees (ISCED levels 5 and higher).
Employed: A binary variable which recodes the original EULFS variable ilostat to one if the individual is employed or self-employed (ilostat equal to one), and zero otherwise (ilostat equal to 2 or 3). We exclude individuals in compulsory military service (ilostat equal to 4) in our analysis of labour market outcomes.
Part time employment: We create a dummy variable, pt, for part time employment using the variable ftpt, provided in EULFS. This variable records whether the individual is employed full time (ftpt equal to one), or part time (ftpt equal to 2).
ISEI: The Socio-Economic Index of Occupational Status, a continuous index which scores occupations in relation to their average education and income levels, thus capturing the attributes of occupation that convert education into income. It is assigned to each employed individual by matching three-digit ISCO codes for occupation (isco3d) with their corresponding value of the ISEI index. We then normalize the index by subtracting the sample mean and dividing by the sample standard deviation.
Income deciles: The dummy bottom decile is equal to one for individuals whose monthly take home pay from the main job is in the bottom decile of the national distribution, and zero otherwise. Symmetrically, the binary variable top decile takes value one for individuals whose monthly take home pay from the main job is in the top decile of the national income distribution, and zero otherwise. The dummies are based on the EULFS variable incdecil, which is only recorded for employees.
WEIGHTS
We use the sampling weights provided in the EULFS (variable coeff) throughout the analysis.
REGRESSION ANALYSIS
To obtain employment differentials we estimate a regression of the type:
where Emp is the employed dummy, imm stands for the immigrant indicator, male is a dummy for male, age is the age in years and age2 is its square, Dedu are the three education dummies defined above, Dc is a set of country dummies, and Dq are quarter dummies that capture potential seasonality in employment. In some specifications we substitute the imm dummy with a set of dummies for recent and non-recent immigrants, or for EU
137136
Netherlands, Portugal, Spain, Sweden and the United Kingdom; New EU Member States include Bulgaria, Croatia, Cyprus, Czech Republic, Estonia, Hungary, Latvia, Lithuania, Malta, Poland, Romania, Slovakia and Slovenia; Extra-EU includes all other countries. Note that individuals born in New EU Member States were classified as Extra-EU immigrants until their country acceded to the EU, i.e. until 2004, or 2007 for Bulgaria and Romania.
Years since migration: EULFS records immigrants’ years of permanent residence in the host country with the variable yearesid. This variable takes value 0 for individuals who were born in the country and takes positive values for individuals born abroad. It records each year of residence until the tenth and then by groups of five years. We use this variable in our analysis of employment and income assimilation. Additionally, our analysis often breaks up immigrants in different groups corresponding to 1-5 years, 6-10 years, and more than 10 years since arrival. The variable yearesid is available only since 2008.
Education levels: We use the three education groups defined by the variable hatlev1d in the EULFS. Low education includes less than primary, primary and lower secondary education (ISCED levels 0-2). Intermediate education corresponds to upper secondary and post-secondary non-tertiary education (ISCED levels 3 and 4). High educated individuals have short-cycle tertiary, bachelor or equivalent or doctoral or equivalent degrees (ISCED levels 5 and higher).
Naturalisation: We define individuals as naturalised if they were born outside of their country of residence (EULFS variable countryb higher than 1) but they are nationals of this country (EULFS variable national equals 1). Information on nationality is consistently available for all countries since 2005. Germany does not record immigrants’ countries of birth, however the EULFS variable yearesid allows identifying native- and foreign-born individuals since it takes positive values only for the latter group.
Marriage: Individuals are classified as living with partner if their spouse or partner also appears as a respondent of the survey with the same household identifier (the reference person in the household and their partner are identified by the EULFS variable hhlink being equal to 1 or 2; each year, a household is identified by the EULFS variables hhnum and qhhnum). Among individuals living with partner, based on the country of birth reported for each spouse, we further distinguish between immigrants who live with an immigrant partner and immigrants who live with a native partner.
Employed: A binary variable which recodes the original EULFS variable ilostat to one if the individual is employed or self-employed (ilostat equal to one), and zero otherwise (ilostat equal to 2 or 3). We exclude individuals in compulsory military service (ilostat equal to 4) in our analysis of labour market outcomes.
DATASET
Our analysis is based on the 1995 to 2016 yearly waves of the European Labour Force Survey (EULFS) for six EU countries: France, Germany, Italy, Spain, Sweden, and the United Kingdom. The EULFS is a large household survey of people aged 15 and over as well as of persons outside the labour force. The National Statistical Institutes of each member country are responsible for selecting the sample, preparing the questionnaires, conducting the direct interviews among households, and forwarding the results to Eurostat in accordance with the common coding scheme.
SAMPLE
We include in our sample all individuals for which either nationality or country of birth is known (see below). In our analysis of education levels and labour market outcomes, we include only individuals aged between 25 and 64 years old.
VARIABLES
We use the following variables, derived from the EULFS, in our analysis.
Immigrant: A dummy variable equal to one if individuals are born outside of their country of residence and zero otherwise, based on the original EULFS variable countryb which records individuals’ country of birth. The variable countryb is equal to one when the individual is born in the residence country (immigrant equals 0 in this case) and takes value higher than one when the individual is born abroad (immigrant equals 1 in these cases): the codes identify the region of birth and vary across different years and countries. This definition is used in all countries with the exception of Germany, where there is no information on country of birth. In this case therefore we define immigrant status based on nationality, and immigrant takes value one when the EULFS variable national (which is coded similarly to the EULFS variable countryb described above) takes values different from one, and zero when national is equal to one. Note that for France for all years until 2002 included we have considered as natives all individuals for which the variable countryb was recorded as missing (around 20% of the French sample).
Country of birth: The classification of immigrants’ countries of birth in the EULFS varies across countries and over the years, and is recorded by the variable countryb, described above. We have reclassified countryb consistently over time and across countries in four groups: Natives, EU15, New EU Member States, and Extra-EU. EU15 countries include Austria, Belgium, Denmark, Finland, France, Germany, Greece, Ireland, Italy, Luxembourg,
Technical Appendix 2 - Long term integration
Technical Appendix 2 - Long term integration
139138
Technical Appendix 2 - Long term integrationTechnical Appendix 2 - Long term integration
We obtain estimates of differences in occupational status and of the probability of being in the bottom income decile by running the same regressions described above, where the dependent variable is replaced, respectively, with:
- ISEI, the standardized index of occupational status.
- Dummy for being in the bottom decile of the national income distribution.
In the analysis on position in income distribution, besides estimating unconditional and conditional gaps as described above, we estimate a third equation by augmenting (B.1) with a set of dummies for three-digits ISCO occupations and a dummy for part time employment. The resulting equation is as follows:
Bottom_deciy = β0+∑yβ1yimmiy x 1(year=y)y+β2maleiy+β3ageiy+ (B.2)β4age2
iy+β5Deduiy+β6Docciy+β7ptiy+β8Dy+β9Dq+εiy
Where Bottom_dec is the binary indicator for the bottom decile, Docc represents the vector of occupation dummies and pt is the dummy for part time employment.
Assimilation:
To obtain estimates of the change of employment differentials over years since migration we estimate a regression of the type:
Empit = β0+∑t β1timmit x 1(ysm=t)t+ β2maleit+ β3ageit+ (B.3)β4age2
it+ β5Deduit+ β6Dy+ β7Dq+ εit
where Emp is the employed dummy, imm stands for the immigrant indicator, 1(ysm=t)t is a set of dummies indicating whether immigrants have been in the host country for t years or not, male is a dummy for male, age is the age in years and age2 is its square, Dedu are the three education dummies defined above, are year dummies and are quarter dummies. In some specifications we substitute the imm dummy with a with separate dummies for immigrants from the EU15 countries, immigrants from the new EU member states, and immigrants from outside the EU; we also estimate equation (B.3) separately for different groups of education. Each of the figures reported in the tables corresponds to the coefficient β1 resulting in each case. We estimate equation (B.3) separately for each of the six countries of interest.
We provide unconditional employment gaps estimating equation (B.3) including only the interactions between the imm dummy and year since migration dummies, and , whereas we estimate the complete model for conditional gaps.
The sample includes natives and immigrants in working age and who are likely to have
Occupation: The index of occupational status is assigned to each employed individual using ISCO codes at the three digits level of disaggregation. The variable is constructed from the original variable is88rd for years up to 2010 and isco3d for years from 2011 onwards. We recode the earlier variable is88rd so that it matches isco3d. When a perfect matching between the two variables is not possible (i.e. when the same value in is88rd corresponds to multiple values in isco3d) we use the value of isco3d that is most frequently repeated.
ISEI: The Socio-Economic Index of Occupational Status, a continuous index which scores occupations in relation to their average education and income levels, thus capturing the attributes of occupations that convert education into income. It is assigned to each employed individual by matching three-digit ISCO codes for occupation (isco3d) with their corresponding value of the ISEI index. We then normalize the index by subtracting the sample mean and dividing by the sample standard deviation.
WEIGHTS
We use the sampling weights provided in the EULFS (variable coeff) throughout the analysis.
REGRESSION ANALYSIS
To obtain employment differentials we estimate a regression of the type:
Empiy = β0+∑yβ1yimmiy x 1(year=y)y+β2maleiy+β3ageiy+β4age2iy+β5Deduiy+β6Dy+β7Dq+εiy (B.1)
where Emp is the employed dummy, imm stands for the immigrant indicator, 1(year=y)y is a set of dummies indicating whether the survey year is equal to y or not, male is a dummy for male, age is the age in years and age2 is its square, Dedu are the three education dummies defined above, Dy are year dummies and Dq are quarter dummies. In some specifications we substitute the imm dummy with separate dummies for immigrants from the EU15 countries, immigrants from the new EU member states, and immigrants from outside the EU; we also estimate equation (B.1) separately for males and females and for different groups of immigrants by years since migration. Each of the figures reported in the tables corresponds to the coefficient β1 resulting in each case. We estimate equation (B.1) separately for each of the six countries of interest.
We provide unconditional employment gaps estimating equation (B.1) including only the interactions between the imm dummy and year dummies, Dy and Dq, whereas we estimate the complete model for conditional gaps.
The sample includes natives and immigrants in working age and who are likely to have finished their full-time education (25-64 years old).
140
finished their full-time education (25-64 years old). We estimate equation (B.3) pooling all years for which the variable years since migration (ysm) is available.
We obtain estimates of the assimilation of differences in the probability of being in the bottom income decile over years since migration by running the same regressions described above, where the dependent variable is replaced with a dummy for being in the bottom decile of the national income distribution.
In the analysis on position in income distribution, besides estimating unconditional and conditional gaps as described above, we estimate a third equation by augmenting (B.3) with a set of dummies for three-digits ISCO occupations and a dummy for part time employment.
Technical Appendix 2 - Long term integration
Migration Observatory
The Migration Observatory is a Centro Studi Luca d’Agliano - Collegio Carlo Alberto joint research initiative funded by the Compagnia di San Paolo since 2016. The main objective is to study analytically topical issues on migration, such as the economic and social impact of immigration on receiving and sending countries or the implications of different migration policies, from an international and cross-disciplinary perspective. Also, it aims to construct a critical mass of academic knowledge in order to increase the visibility of Collegio Carlo Alberto and Centro Studi Luca d’Agliano in the policy debate.
Centro Studi Luca d’Agliano
The Centro Studi Luca d’Agliano was founded in Turin in 1986 by the family of Luca d’Agliano, his friends, and some of his teachers. It is currently located at the Fondazione Luigi Einaudi in Torino and at the University of Milan. It is a non-profit research institution contributing original research in the field of international and development economics. Particular emphasis is placed on the training of young scholars and in giving them the opportunity of acquiring a truly international perspective. The activities of the Centro Studi mainly focus on academic research, but it also greatly contributes to the policy debate.
Collegio Carlo Alberto
The Collegio Carlo Alberto is a foundation created in 2004 as a joint initiative of the Compagnia di San Paolo and the University of Torino. Its mission is to foster research and high education in the social sciences, in accordance with the values and practices of the international academic community, through a threefold action plan: the production of first-rate research in Economics, Public Policy, Social Sciences and Law; the provision of top-level undergraduate and graduate education in the above disciplines; the contribution to the public policy debate.