“PHYLOGEOGRAPHY AND EVOLUTION OF BUTTERFLYFISH IN THE SUBGENUS CORALLOCHAETODON: CHAETODON LUNULATUS, CHAETODON TRIFASCIATUS, CHAETODON AUSTRIACUS, CHAETODON MELAPTERUS” A THESIS SUBMITTED TO THE GRADUATE DIVISION OF THE UNIVERSITY OF HAWAI`I IN PARTIAL FULFILLMENT OF THE REQUIREMENTS FOR THE DEGREE OF MASTER OF SCIENCE IN ZOOLOGY (MARINE BIOLOGY) MAY 2014 By Ellen Waldrop Thesis Committee: Brian Bowen, Chairperson Robert Toonen Robert Thomson
Transcript
“PHYLOGEOGRAPHY AND EVOLUTION OF BUTTERFLYFISH IN THE
LITERATURE CITED......................................................................................................50
vii
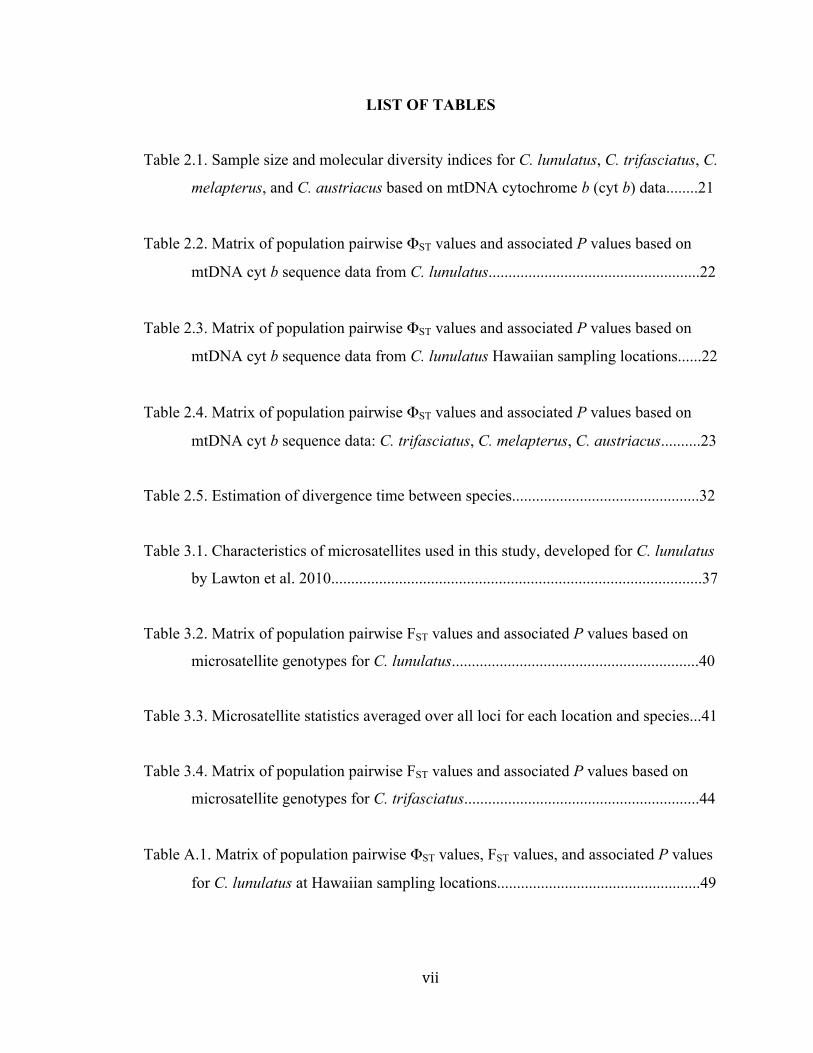
LIST OF TABLES
Table 2.1. Sample size and molecular diversity indices for C. lunulatus, C. trifasciatus, C.
melapterus, and C. austriacus based on mtDNA cytochrome b (cyt b) data........21
Table 2.2. Matrix of population pairwise ΦST values and associated P values based on
mtDNA cyt b sequence data from C. lunulatus.....................................................22
Table 2.3. Matrix of population pairwise ΦST values and associated P values based on
mtDNA cyt b sequence data from C. lunulatus Hawaiian sampling locations......22
Table 2.4. Matrix of population pairwise ΦST values and associated P values based on
mtDNA cyt b sequence data: C. trifasciatus, C. melapterus, C. austriacus..........23
Table 2.5. Estimation of divergence time between species...............................................32
Table 3.1. Characteristics of microsatellites used in this study, developed for C. lunulatus
by Lawton et al. 2010.............................................................................................37
Table 3.2. Matrix of population pairwise FST values and associated P values based on
microsatellite genotypes for C. lunulatus..............................................................40
Table 3.3. Microsatellite statistics averaged over all loci for each location and species...41
Table 3.4. Matrix of population pairwise FST values and associated P values based on
microsatellite genotypes for C. trifasciatus...........................................................44
Table A.1. Matrix of population pairwise ΦST values, FST values, and associated P values
for C. lunulatus at Hawaiian sampling locations...................................................49
viii
LIST OF FIGURES
Figure 1.1. The subgenus Corallochaetodon, including four sister species......................10
Figure 1.2 Distribution map of the Corallochaetodon subgenus.......................................13
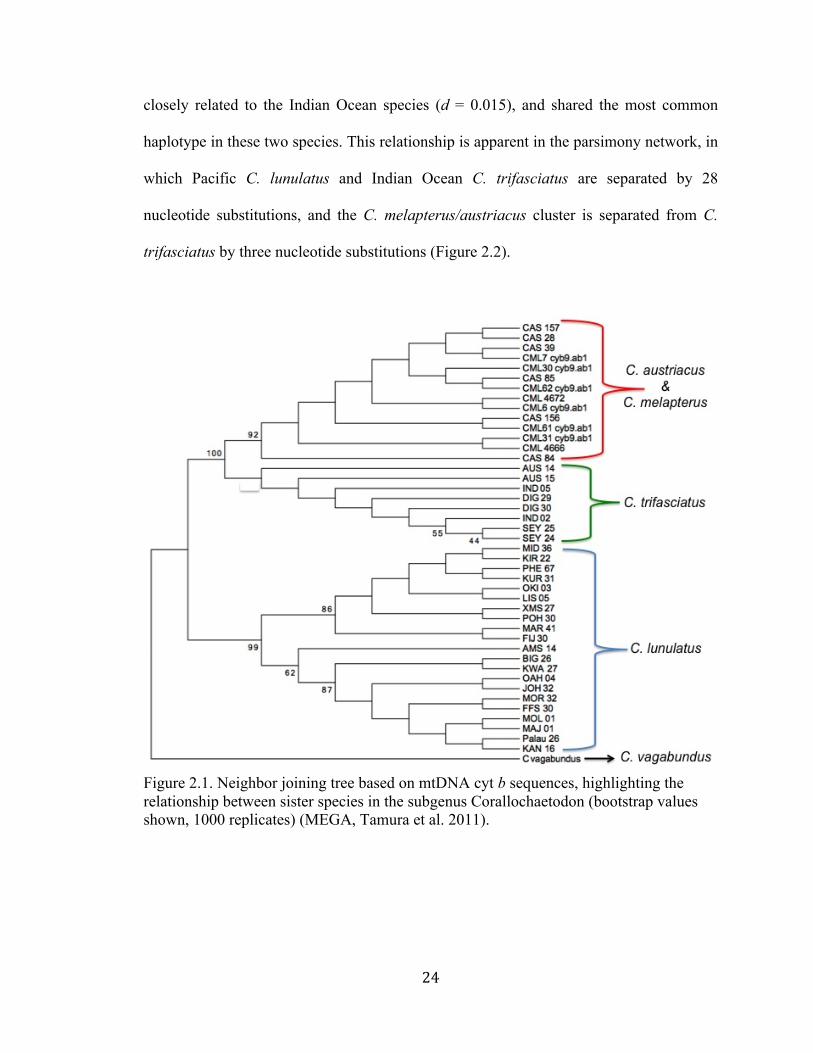
Figure 2.1. Neighbor joining tree based on mtDNA cyt b sequences, highlighting the
relationship between sister species in the subgenus Corallochaetodon................24
Figure 2.2. Statistical parsimony network for C. lunulatus, C. trifasciatus, C. melapterus,
and C. austriacus based on mtDNA cyt b sequences............................................30
Figure 2.3. Known marine biogeographic barriers and their influence on the distribution
range of Corallochaetodon....................................................................................31
Figure 3.1. STRUCTURE bar plot C. lunulatus................................................................41
Figure 3.2. Mean Ln probability of data (Ln P[D]) and Delta K for C. lunulatus as
generated by the program STRUCTURE HARVESTER......................................42
Figure 3.3. Mean Ln probability of data (Ln P[D]) and Delta K for C. trifasciatus as
generated by the program STRUCTURE HARVESTER......................................43
Figure 3.4. Prevailing currents in the north-western Indian Ocean...................................46
9
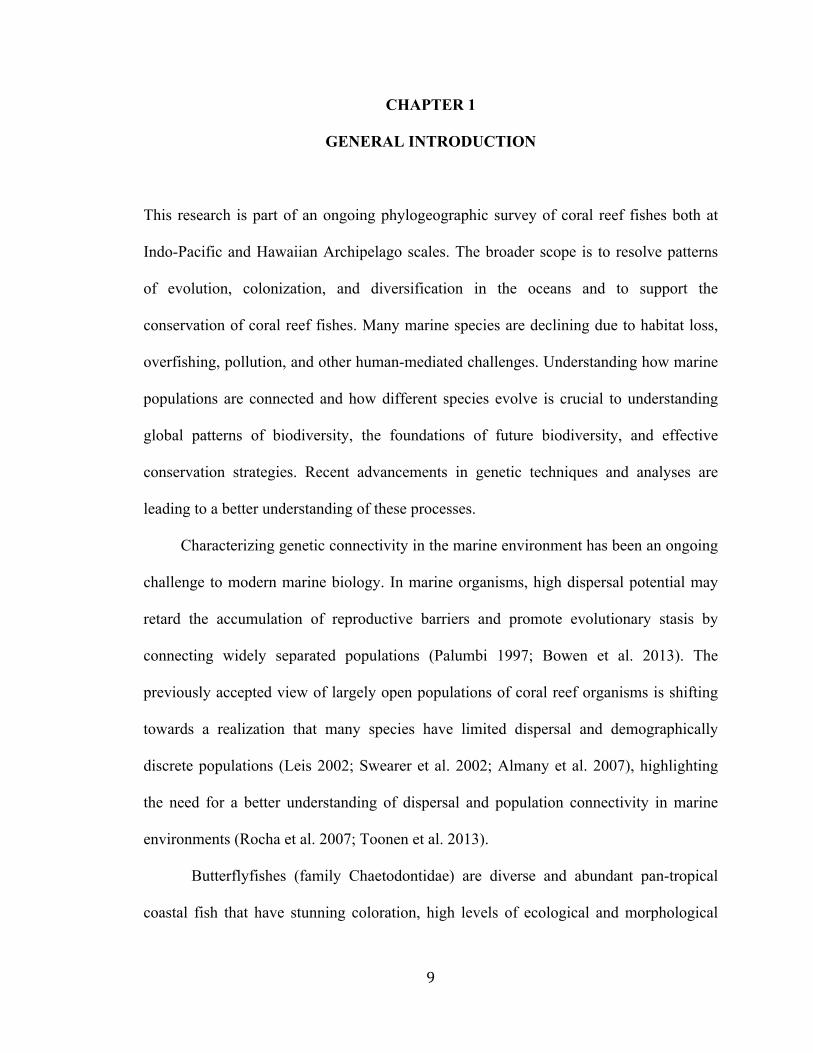
CHAPTER 1
GENERAL INTRODUCTION
This research is part of an ongoing phylogeographic survey of coral reef fishes both at
Indo-Pacific and Hawaiian Archipelago scales. The broader scope is to resolve patterns
of evolution, colonization, and diversification in the oceans and to support the
conservation of coral reef fishes. Many marine species are declining due to habitat loss,
overfishing, pollution, and other human-mediated challenges. Understanding how marine
populations are connected and how different species evolve is crucial to understanding
global patterns of biodiversity, the foundations of future biodiversity, and effective
conservation strategies. Recent advancements in genetic techniques and analyses are
leading to a better understanding of these processes.
Characterizing genetic connectivity in the marine environment has been an ongoing
challenge to modern marine biology. In marine organisms, high dispersal potential may
retard the accumulation of reproductive barriers and promote evolutionary stasis by
connecting widely separated populations (Palumbi 1997; Bowen et al. 2013). The
previously accepted view of largely open populations of coral reef organisms is shifting
towards a realization that many species have limited dispersal and demographically
discrete populations (Leis 2002; Swearer et al. 2002; Almany et al. 2007), highlighting
the need for a better understanding of dispersal and population connectivity in marine
environments (Rocha et al. 2007; Toonen et al. 2013).
Butterflyfishes (family Chaetodontidae) are diverse and abundant pan-tropical
coastal fish that have stunning coloration, high levels of ecological and morphological
10
diversity, and are important and distinctive members of coral reef communities. Many are
considered specialists in terms of diet, feeding exclusively on live coral and/or coral
polyps. This dietary specialization makes them vulnerable to habitat shifts that alter
resource availability (i.e. the declining state of coral reefs worldwide). Recent research
has shown that butterflyfishes, because of their distinct diets and geographical range, are
a useful model group for studying general questions about ecological specialization and
patterns of gene flow (Craig et al. 2010; Lawton et al. 2011a). As noted by Fessler and
Westneat (2007), “The exploration of evolutionary, ecological, and biogeographic
patterns remains limited by lack of a well-resolved molecular phylogeny involving
species of chaetodontid.”
Figure 1.1. The subgenus Corallochaetodon, including four sister species. Clockwise from top left Chaetodon lunulatus, Chaetodon trifasciatus, Chaetodon melapterus, Chaetodon austriacus.
11
The subgenus Corallochaetodon includes four sister species: Chaetodon lunulatus
(Quoy and Gaimard 1824) in the Pacific and eastern Indian Ocean, Chaetodon
trifasciatus (Park 1797) in the Indian Ocean, Chaetodon melapterus (Guichenot 1863) in
the northern Indian Ocean, and Chaetodon austriacus (Rüppell 1836) in the Red Sea
(Figure 1.1). This subgenus is also a monophyletic group (Smith et al. 2003; Fessler and
Westneat 2007) and several studies have recently shed light on the evolutionary history
of this group (Littlewood et al. 2004; Hsu et al. 2007; Bellwood et al. 2009). However, no
study has used comprehensive geographic coverage of all four species in a hierarchical
analysis of genetic partitions. Therefore, the history of the group remains unresolved.
All members of Corallochaetodon are obligate corallivores (Pratchett et al.
2013a), but each species has distinct dietary characteristics. The Pacific C. lunulatus is
considered a generalist and feeds on a broad range of hard corals from up to 52 different
genera (Pratchett 2005). The Indian Ocean C. trifasciatus is more of a specialist
preferring to feed on polyps, with some evidence of geographic variation in preferred
genera (Reese 1989; Samways 2005; Graham 2007). C. melapterus (northern Indian
Ocean) feeds exclusively on coral polyps (Lieske and Myers 1996; Shokri et al. 2005),
and has coral species-specific feeding selectivity (Pratchett et al. 2013a). C. austriacus
(Red Sea) is considered a generalist that feeds primarily on three genera of abundant hard
corals (Acropora, Porites, and Pocillopora) (Alwany et al. 2003).
The Corallochaetodon species are morphologically similar and distinguished
primarily by color pattern. All four species share a yellow to orange background overlaid
by a series of 14-16 dark (blue-black) stripes that are nearly horizontal. C. lunulatus has
narrow, posteriorly expanding, black markings along the base of the dorsal and anal fins,
12
a reddish anal fin, and a grey caudal peduncle with a vertical black bar at the end of the
caudal fin. C. trifasciatus also has narrow, posteriorly expanding, black markings along
the base of the dorsal and anal fins, but has a yellow anal fin and a yellow to orange
caudal peduncle with a vertical black bar at the end of the caudal fin. Both C. melapterus
and C. austriacus have anal and caudal fins that are completely black except for fringing
white highlights (C. melapterus also has a black dorsal fin while C. austriacus has a
white dorsal fin). This single derived feature suggest that these two species are more
closely related to each other than either is to C. lunulatus or C. trifasciatus (species
descriptions from Blum 1989).
The subgenus is found throughout the Indo-Pacific Ocean (except the eastern
Pacific) and the size of the geographical range of its members varies greatly (Figure 1.2).
C. lunulatus has by far the largest range and is distributed throughout the central and
western Pacific Ocean, from western Australia north to Japan and east to Hawaii and the
Tuamotu Islands (Allen et al. 1998). It is replaced by C. trifasciatus in the Indian Ocean,
with a range from East Africa to Bali, Indonesia, Cocos Keeling, and Christmas Islands
(Allen et al. 1998). These two sister species overlap at Christmas Island and Cocos
Keeling in the eastern Indian Ocean (Australia), where they form heterospecific pairs and
hybridize (Hobbs et al. 2009; Montenari et al. 2011). C. melapterus occurs in the Persian
Gulf, Gulf of Aden, Gulf of Oman, and off the Yemen coast at the extreme southern tip
of the Red Sea (Zekeria et al. 2005). C. austriacus has the smallest range and is endemic
to the Red Sea, particularly the central and northern areas (Zekeria et al. 2005). However
it has recently invaded the Mediterranean via the Suez Canal, raising interesting
possibilities for future range expansion (Goren et al. 2011). While the distributions of C.
13
melapterus and C. austriacus are often listed as “northern Indian Ocean and Red Sea,” in
fact the former barely gets inside the mouth of the Red Sea, while the latter is rarely seen
south of the Farasan Islands in the lower Red Sea. These distributional limits have been
recently been confirmed by personal observations (J.D. DiBattista, L.A. Rocha, and B.W.
Bowen). Hence the distribution of these two species is best characterized as parapatric,
with effectively no overlap under contemporary conditions.
Figure 1.2 Distribution map of the Corallochaetodon subgenus (redrawn from Blum 1989). Chaetodon lunulatus is distributed throughout the Central and Western Pacific Ocean, from Eastern Australia north to Japan and east to Hawaiian and the Tuamotu Islands. C. trifasciatus is distributed throughout the Indian Ocean, from East Africa to Bali, Indonesia, Cocos Keeling, and Christmas Islands. C. melapterus occurs in the Persian Gulf, Gulf of Aden, and Gulf of Oman. C. austriacus occurs in the Northern and central Red Sea, and is considered endemic.
With this thesis I hope to understand the evolutionary history of this interesting
group of fishes, specifically in terms of geography, oceanography, and ecology. The first
part of the study analyzes mitochondrial DNA (mtDNA) cytochrome b (cyt b) sequences
14
to determine the relationship among sister species. Identifying population structure within
species has important management implications, especially for the intensively-sampled
Hawaiian Archipelago and Papahanaumokuaka Marine National Monument. Therefore
the second part of this study uses microsatellite analysis to investigate genetic partitions
within the two widespread species (C. lunulatus and C. trifasciatus).
15
CHAPTER 2
PHYLOGEOGRAPHIC PATTERNS IN THE BUTTERFLYFISH SUBGENUS
CORALLOCHAETODON
INTRODUCTION
Even closely related species can have different levels of dispersal and population
structure (e.g. Atlantic surgeonfishes and wrasses, Rocha et al. 2007). Within the
subgenus Corallochaetodon, the varying diets, colorations, and distributions indicate the
likelihood of distinct population structures and unique genetic features among these four
species. Consequently I investigated how habitat requirements and geographic isolation
both influence patterns of mtDNA diversity within and among these species.
This study is motivated by four primary questions. First, what is the phylogenetic
history of this group? The widespread C. lunulatus (Quoy and Gaimard 1825) (Pacific
Ocean) and C. trifasciatus (Park 1797) (Indian Ocean) have been recognized alternately
as a single species, subspecies, or sister species (Burgess 1978; Myers 1999; Randall
2007). The relationships of the two restricted range species, C. austriacus (Ruppell 1836)
(Red Sea), and C. melapterus (Guichenot 1863) (adjacent northern Indian Ocean), are
unknown. Did they arise from the widespread C. trifasciatus, as geography would
indicate? Did the restricted range species arise independently of one another?
Phylogenetic analyses should illuminate the history of speciation in this complex.
Second, what is the geographic distribution of genetic diversity between species?
Marine biogeographic barriers have been recognized for decades (Ekman 1953; Briggs
1974; Briggs and Bowen 2012), although in tropical marine habitats, only a few barriers
16
are apparent and well studied (Rocha et al. 2007). The widespread C. lunulatus and C.
trifasciatus are divided by a well-known barrier between the Indian and Pacific Oceans
(Indo-Pacific Barrier [IPB] or Sunda Shelf Barrier). On the other hand, C. austriacus and
C. melapterus are both limited range species. The former may have been historically
isolated in the Red Sea (DiBattista et al. 2013) but the latter has no clear barriers with C.
trifasciatus to the south, and C. austriacus to the north. Here I am resolving the role of
biogeographic provinces in shaping evolutionary history.
Third, does ecological specialization drive the patterns of diversity of
butterflyfishes? Chaetodontids are among the most specialized of coral reef fishes, with
many species having an obligate dependence on scleractinian corals, however it is
currently unknown why some butterflyfishes are highly specialized and others are
generalists (Pratchett et al. 2013b). Generalist species consume a wide range of coral
species and have the ability to switch prey to cope with alterations in their environment.
On the other hand, more specialized species sacrifice the ability to withstand fluctuations
in resource ability, presumably because dietary specialization will yield greater fitness.
Based on these observations I predict species with similar dietary specializations to have
similar patterns of genetic structure. Identifying a link between diet preferences, range
size, and dispersal ability in these species can aid in their successful management.
Fourth, what is the distribution of genetic diversity within species? Since the
degree of genetic structure increases as range size decreases species with smaller
distribution range should show a higher degree of genetic structuring than widespread
species. Based on previous research (Eble et al. 2009), I hypothesize that the vast
geographic range of C. lunulatus (Pacific Ocean) and C. trifasciatus (Indian Ocean)
17
should indicate strong population connectivity, and low genetic structure. Whereas the
range-restricted C. melapterus should exhibit moderate population structure and range-
restricted endemic C. austriacus should exhibit the most pronounced population
structure. I hope to resolve population separations that are relevant to management. In
particular, are there isolated management units within the Hawaiian Archipelago?
This study analyzed DNA sequence data from all members of the subgenus
Corallochaetodon to assess evolutionary history in the Indo-Pacific. The primary goals
were to (1) resolve relationships among all four species, (2) establish how geographic
barriers have influenced speciation in this subgenus, (3) determine how specialization
might drive speciation in butterflyfishes, and (4) determine the degree of any population
connectivity within and between species. My approach here in chapter 2 is to document
levels of mtDNA diversity among individuals, populations, regions, and species. In
chapter 3, some of the same issues are evaluated with microsatellite loci.
MATERIALS AND METHODS
This study uses mitochondrial DNA (mtDNA) cytochrome b (cyt b) sequences to resolve
relationships from contemporary to evolutionary timescales. The mtDNA cyt b data
comprises a single locus but offers the advantages of haploid inheritance, lack of
recombination, potential for comparison to existing and future studies, and availability of
universal primers for efficient production of sequence data.
18
Sample Collection
To characterize the range-wide phylogeographic structure of Corallochaetodon
butterflyfishes, tissue samples (fin clips or gill filament) were collected with pole spears
while scuba diving or snorkeling between 2005 and 2013. Specimens were obtained from
24 locations across the Indo-Pacific spanning the entire range of the subgenus (C.
lunulatus N = 719, C. trifasciatus N = 160, C. melapterus N = 62, C. austriacus N = 30).
Within the Pacific range of C. lunulatus, I used a multi-scale approach consisting of
range-wide sampling plus an intensive regional evaluation across the 2600 km length of
the Hawaiian Islands, one of the largest and most isolated archipelagos in the world
(Randall 2007). Collected tissues were preserved in a saturated salt DMSO solution
(Seutin et al. 1991).
Mitochondrial DNA Sequencing
Genomic DNA was extracted using a “HotSHOT” protocol (Meeker et al. 2007), and
aliquots were stored at -20 ˚C until sequenced. A 605 basepair (bp) segment of mtDNA
cytochrome b (cyt b) gene was resolved using heavy-strand (Cyb 9) (FOR: 5’-
GTGACTTGAAAAACCACCGTTG-3’ Song et al. 1998) and light-strand primers (Cyb
7) (REV: 5’-AATAGGAAGTATCATTGCGGTTTGATG-3’ Taberlet et al. 1992).
Polymerase chain reaction (PCR) mixes contained 7.5 ul of 2x BioMix Red
solution (BioMix Red; Bioline Ltd., London, UK), 0.3 ul (10 uM) of each primer, and 5–
50 ng template DNA in 15 ul total volume. PCRs had an initial denaturing step at 95°C
for 3 min, then 35 cycles of amplification (30 s of denaturing at 94°C, 45 s of annealing
at 52°C, and 45 s of extension at 72°C), followed by a final extension at 72°C for 10 min.
19
PCR products were visualized on a 1.5% agarose gel electrophoresis and purified
by incubating with 1.1 units of ExoFAP (Fermentas) per 10 ul PCR product at 37°C for
60 min, followed by deactivation at 85°C for 15 min. DNA sequences were resolved with
an ABI 3130XL Genetic Analyzer (Applied Biosystems, Foster City, CA). All specimens
were sequenced in the forward direction and questionable haplotypes were resequenced
in the reverse direction. The sequences were aligned, edited, and trimmed to a common
length using Geneious Pro version 5.6.7 (Drummond et al. 2010); unique mtDNA cyt b
haplotypes will be deposited in GenBank.
jModelTest version 2.1.3 (Posada 2008) was used with an Akaike information
criterion (AIC) test to determine the best nucleotide substitution model in each species;
for the four species, the HKY (Hasegawa, Kishino, and Yano 1985), HKY, HKY, and
TrN+G (Tamura and Nei 1993) models were selected for C. lunulatus, C. trifasciatus, C.
austriacus, and C. melapterus, respectively. The Tamura/Nei is the only one of the
models available in analytical software (Arlequin version 3.5, see below) and was
therefore selected here for phylogeographic inferences.
Arlequin version 3.5.1.3 (Excoffier et al. 2005) was used to calculate haplotype
(h) and nucleotide diversity (π), Fu’s Fs test of neutrality (Fu 1997), as well as an
analysis of molecular variance (AMOVA; Excoffier et al. 1992) to test for range-wide
patterns of population structure. Tests were run within and between localities for each
species separately.
Demes with fewer than five individuals were excluded from all population-level
analyses and pooled into their respective larger sampling locations to provide adequate
20
statistical power (Crandall et al. 2008). In addition to population pairwise comparisons
for C. lunulatus, Hawaiian specimens were subdivided into the Main Hawaiian Islands
(high islands) and North Western Hawaiian Islands (low islands and atolls) to test for
subdivision within the archipelago. For C. trifasciatus specimens from western Australia
(Cocos Keeling and adjacent Christmas Island), were pooled to increase statistical power
since analysis using separate populations resulted in the same conclusions.
In addition to the population genetic analyses, neighbor-joining (NJ), maximum-
likelihood (ML), and maximum-parsimony (MP) trees were constructed to examine
phylogenetic relationships among cyt b haplotypes for all individuals (PAUP*
implemented in Geneious Pro, Swofford 2003, and MEGA version 5.2.2, Tamura et al.
2011). Bootstrap support values for NJ, ML, and MP trees were calculated using default
settings with 10,000 replicates. For simplicity, a subset of haplotypes was used to create
the final tree. Two Chaetodon vagabundus samples (Genbank accession numbers:
JF458006, JF458008) were used to root the tree. To further explore evolutionary
relationships NETWORK version 4.5.1.0 (Fluxus) was used to construct an unrooted
network among all haplotypes using a median-joining algorithm and default settings
(Bandelt et al. 1999; DiBattista et al. 2012a).
Estimation of divergence between species was performed using a well-
documented evolutionary rate, estimated to be 2% per million years (between lineages)
for the mtDNA cyt b gene (Johns and Avise 1998; Bowen et al. 2001; Reece et al. 2011).
MEGA (version 5.2.2, Tamura et al. 2011) was used to calculate evolutionary distances
based on the average number of nucleotide substitutions among lineages using the
21
Tamura-Nei model and 1,000 bootstrap replicates. Using this evolutionary rate, the
approximate divergence times of Chaetodon species were estimated.
RESULTS
Genetic diversity within species
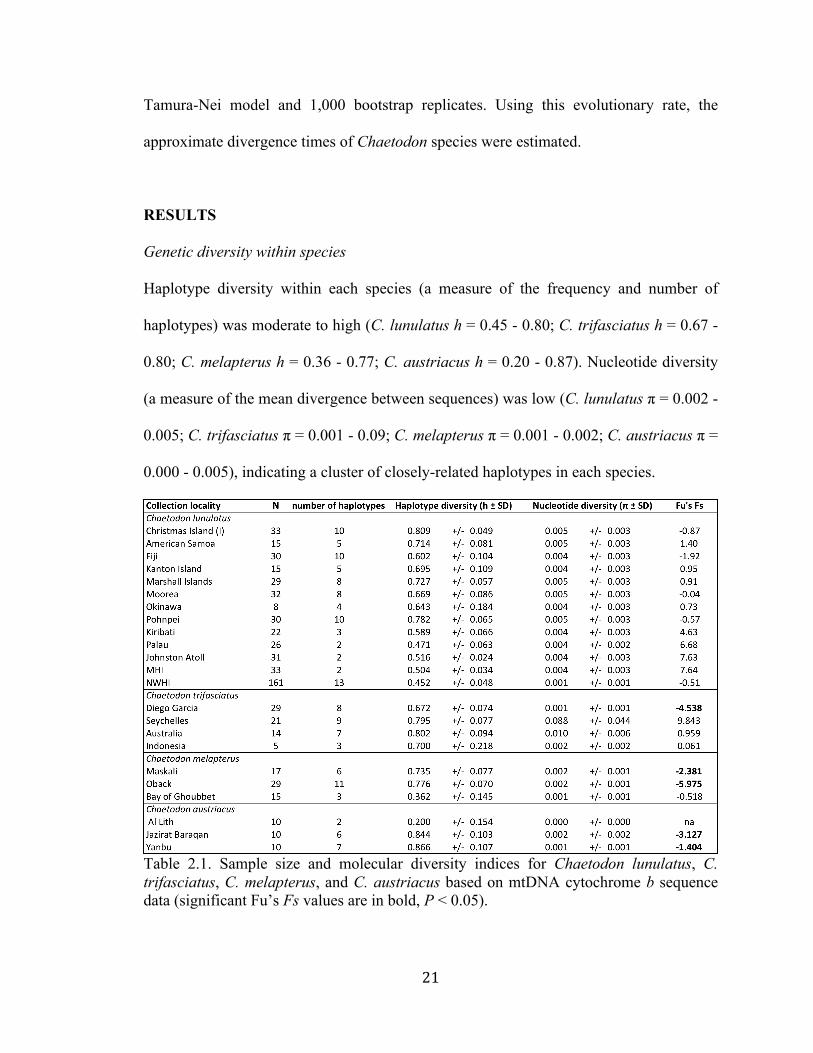
Haplotype diversity within each species (a measure of the frequency and number of
haplotypes) was moderate to high (C. lunulatus h = 0.45 - 0.80; C. trifasciatus h = 0.67 -
0.80; C. melapterus h = 0.36 - 0.77; C. austriacus h = 0.20 - 0.87). Nucleotide diversity
(a measure of the mean divergence between sequences) was low (C. lunulatus π = 0.002 -
0.005; C. trifasciatus π = 0.001 - 0.09; C. melapterus π = 0.001 - 0.002; C. austriacus π =
0.000 - 0.005), indicating a cluster of closely-related haplotypes in each species.
Table 2.1. Sample size and molecular diversity indices for Chaetodon lunulatus, C. trifasciatus, C. melapterus, and C. austriacus based on mtDNA cytochrome b sequence data (significant Fu’s Fs values are in bold, P < 0.05).
22
Tests for Fu’s Fs were significant in five locations across three species: C.
trifasciatus at Diego Garcia; C. melapterus at Maskali and Obock; C. austriacus at Jazirat
Baraqan and Yanbu (Table 2.1).
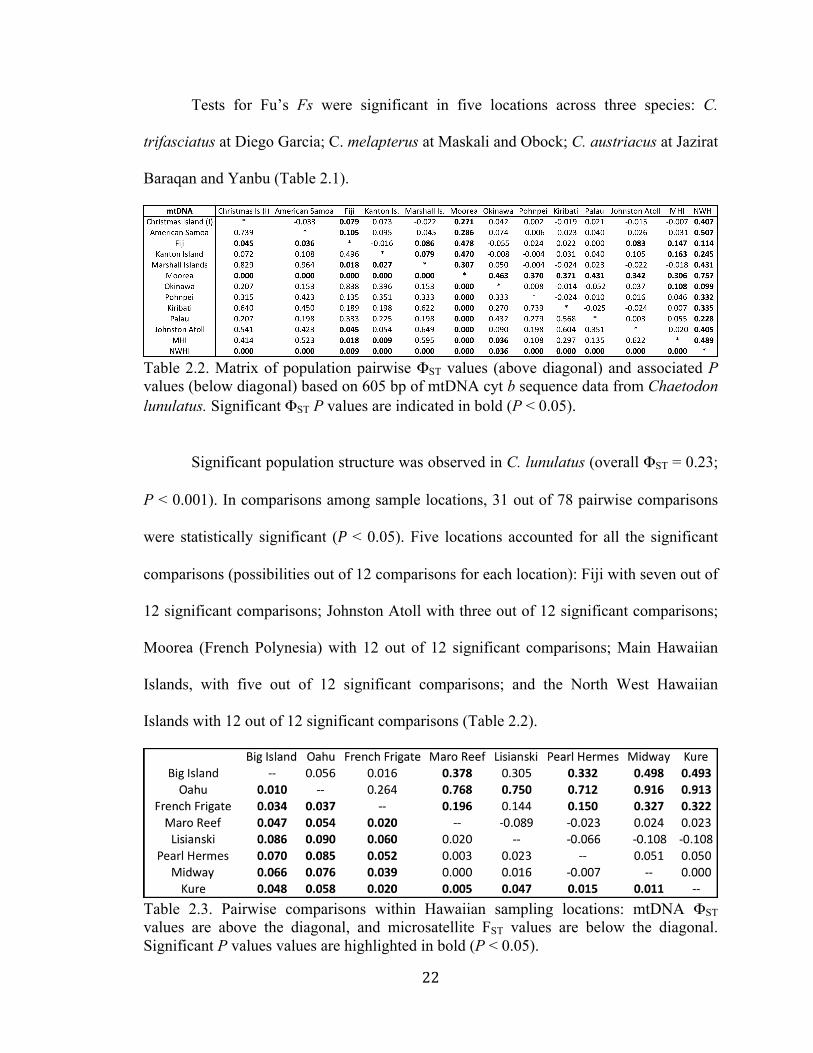
Table 2.2. Matrix of population pairwise ΦST values (above diagonal) and associated P values (below diagonal) based on 605 bp of mtDNA cyt b sequence data from Chaetodon lunulatus. Significant ΦST P values are indicated in bold (P < 0.05).
Significant population structure was observed in C. lunulatus (overall ΦST = 0.23;
P < 0.001). In comparisons among sample locations, 31 out of 78 pairwise comparisons
were statistically significant (P < 0.05). Five locations accounted for all the significant
comparisons (possibilities out of 12 comparisons for each location): Fiji with seven out of
12 significant comparisons; Johnston Atoll with three out of 12 significant comparisons;
Moorea (French Polynesia) with 12 out of 12 significant comparisons; Main Hawaiian
Islands, with five out of 12 significant comparisons; and the North West Hawaiian
Islands with 12 out of 12 significant comparisons (Table 2.2).
Table 2.3. Pairwise comparisons within Hawaiian sampling locations: mtDNA ΦST values are above the diagonal, and microsatellite FST values are below the diagonal. Significant P values values are highlighted in bold (P < 0.05).
23
Within the Hawaiian Archipelago, there were 13 out of 28 significant
comparisons among sample locations (Table 2.3).
No significant structure overall or significant pairwise comparisons were detected
among four locations in C. trifasciatus (ΦST < 0.01; P = 0.50), three locations in C.
melapterus (ΦST = 0.03; P = 0.12), or three locations in C. austriacus (ΦST = 0.04; P =
0.21) (Table 2.4).
Table 2.4. Matrix of population pairwise ΦST values (above diagonal) and associated P values (below diagonal) based on 605 bp of mtDNA cyt b sequence data from Chaetodon trifasciatus, C. melapterus, C. austriacus.
Genetic divergence between species
Neighbor joining, maximum likelihood, and maximum parsimony reconstruction all
produced nearly identical tree topologies with bootstrap support values for species level
relationships between 80 and 100% (Figure 2.1). The primary feature of this phylogeny is
a bifurcation at approximately d = 0.06 sequence divergence between Pacific C. lunulatus
compared to the Indian Ocean C. trifasciatus, while C. melapterus and C. austriacus are
24
closely related to the Indian Ocean species (d = 0.015), and shared the most common
haplotype in these two species. This relationship is apparent in the parsimony network, in
which Pacific C. lunulatus and Indian Ocean C. trifasciatus are separated by 28
nucleotide substitutions, and the C. melapterus/austriacus cluster is separated from C.
trifasciatus by three nucleotide substitutions (Figure 2.2).
Figure 2.1. Neighbor joining tree based on mtDNA cyt b sequences, highlighting the relationship between sister species in the subgenus Corallochaetodon (bootstrap values shown, 1000 replicates) (MEGA, Tamura et al. 2011).
25
DISCUSSION
Population Structure
The survey of Corallochaetodon mtDNA sequence data revealed contrasting levels of
genetic structure across the subgenus. No structure was detected for C. trifasciatus, C.
melapterus, and C. austriacus, while C. lunulatus showed significant population
structure, even within the Hawaiian Archipelago. Pairwise population comparisons were
significant between several locations (Table 2.2) the most pronounced in areas of
moderate to extreme isolation (e.g. Fiji, Moorea, Johnston Atoll, and Hawaii).
Populations that are genetically distinct arise from several features including limited
dispersal, geographic barriers, or ecological factors (e.g. Palumbi 1994; Rocha et al.
2007). In this study the genetically distinct and geographically distant populations are
clearly consistent with known distribution barriers (Blum 1989; Hsu et al. 2007).
Additionally, while the mtDNA support an “open” system of dispersal for the majority of
the C. lunulatus distribution range, which is connected by archipelagos that are separated
by no more than 800 km (Schultz et al. 2008), this unexpected genetic subdivision
suggests a degree of self-recruitment in some populations (e.g. Hourigan and Reese 1987;
Planes 1993; Jones et al. 1999; Swearer et al. 2002).
Pairwise comparisons with Fiji were statistically significant in seven out of 12
comparisons: American Samoa, Johnston Atoll, and Christmas Island (I) (P < 0.05), and
the Marshall Islands, Moorea, MHI, and NWHI (P < 0.02) (Table 2.2). A study of
cosmopolitan reef fishes showed pronounced genetic partitioning between populations in
Fiji and those from Papua New Guinea, Indonesia, and the Solomon Islands (Drew et al.
26
2008), indicating barriers to genetic exchange in this location. Strong patterns of regional
isolation may indicate limited larval dispersal capabilities that contribute to the higher
levels of genetic structure on the scale of the Fijian Archipelago (Drew and Barber 2012).
Pairwise comparisons with Moorea were all highly statistically significant (P <
0.001 in all cases) (Table 2.2). This result in consistent with a previous study of
population structure in C. lunulatus in which the authors also found Moorea samples
were significantly different from all other locations (five locations were used in this
study: Lizard Island, North Great Barrier Reef; Heron Island, South Great Barrier Reef;
Kimbe Bay, Papua New Guinea; Noumea, New Caledonia; and Moorea, French
Polynesia) (Lawton et al. 2011b). Previous studies of reef fishes in Moorea also showed
significant levels of population genetic structure in blacktail snapper (Lutjanus fulvus)
and brown surgeonfish (Acanthurus nigrofuscus) (Gaither et al. 2010; Eble et al. 2011b).
Planes (1993) showed significant genetic structure in convict surgeonfish (Acanthurus
triostegus) within French Polynesia alone with five out of 11 sampling locations
genetically distinct, including Moorea. Based on the conclusions of these authors it is
possible that oceanographic isolation, (specifically in relation to known current patterns
in the region), may also explain the concordant break between Moorea and other central
Pacific sampling sites in C. lunulatus.
Pairwise comparisons with Johnston Atoll were statistically significant between
three populations: Moorea and Hawaii (P < 0.001 in both cases), and Fiji (P < 0.05)
(Table 2.2). Johnston is a small open atoll extremely isolated from other shallow coral
reefs. It lies 800km southwest of the nearest reefs of Hawaii and over 1,500km from
other shallow reefs (Line Island and Marshall Islands). It exhibits low species diversity
27
and is primarily inhabited by species with broad geographic distributions. While it is in a
position to serve as a stepping-stone in the Pacific (Kobayashi 2006), its remoteness,
small size, lack of habitat diversity (Kosaki et al. 1991), and lack of favorable currents to
transport larvae likely inhibit gene flow of C. lunulatus between Johnston Atoll and the
Hawaiian reefs (Maragos and Jokiel 1986; Skillings et al. 2011; Timmers et al. 2011).
The PLD for C. lunulatus is estimated at ~35 days (Nakamura et al. 2012), and likely
falls short of the estimated “40–50-day PLD required to transit from Johnston Atoll to the
Hawaiian Archipelago” (Kobayashi 2006). Additionally, geological history may
contribute to isolation in that habitat area and diversity could have been drastically
reduced by temporarily lowered sea levels during Pleistocene glaciations (Kosaki et al.
1991). This effect has been observed in the hermit crab, Calcinus hazletti, where habitat
availability during sea-level fluctuations was a significant force in driving the high level
of differentiation across the Hawaiian Archipelago (Baums et al. 2014).
The Hawaiian Islands pairwise comparisons were statistically significant in 13 out
of 28 population comparisons (Table 2.3). Population differentiation between the
Hawaiian Islands and other locations in the Pacific Ocean is not surprising since they are
also one of the most isolated islands groups in the world with the highest level of
endemism in the Pacific (DeMartini and Friedlander 2004; Randall 2007; Timmers et al.
2011). The recurrent trend of genetic distinctness in this region can be attributed to three
factors: (1) the geographic isolation of the islands, and oceanographic features, especially
current patterns; (2) the life history characteristics of the fishes, such as dispersal
capabilities; and (3) the extent of adaptive differentiation to environmental conditions in
Hawaii (Hourigan and Reese 1987).
28
Within the Hawaiian archipelago, the results for C. lunulatus are consistent with a
few previous mtDNA surveys that revealed genetic differentiation across the archipelago
in reef fishes (Rivera et al. 2004; Ramon et al. 2008; Eble et al. 2011a). The pairwise
comparison between MHI and NWHI was highly significant (ΦST = 0.49; P < 0.001).
However, in most cases this population structure is observed in restricted-range Hawaiian
endemics (Eble et al. 2009). The opposite scenario is more prevalent, in which wide-
spread Indo-Pacific species exhibited genetic homogeneity across the archipelago (Craig
et al. 2007; Andrews et al. 2010; Gaither et al. 2010, 2011a; Eble et al. 2011b; Reece et
al. 2011; DiBattista et al. 2011, 2012b; Ludt et al. 2012). The results for C. lunulatus
illuminate the demographic linkages between the low islands of the NWHI and the high
volcanic islands of the MHI. In this case NWHI populations are isolated from the MHI, a
partition that is observed in other reef organisms (Toonen et al. 2011). This is pertinent to
management concerns as the NWHI is protected as the Papahanaumokuakea Marine
National Monument. In Chapter 3 I will further explore the connectivity between these
ecologically distinct zones of the Hawaiian Archipelago.
Range Size and Marine Biogeography
Counter to an initial hypothesis, there was not a general correlation between range size
and dispersal ability, supporting the premise that range size does not always predict
genetic structure (Lester et al. 2007). Data from the wide-ranging C. lunulatus indicates
strong population structure. While C. trifasciatus (widespread throughout the Indian
Ocean, and also expected to have a low level of genetic structure due to its large range)
showed no significant genetic structure.
29
Data from C. austriacus (Red Sea) and C. melapterus (Persian Gulf and Gulf of
Oman) failed to detect any significant population structure, which may indicate that each
is a single species-wide population. This can be explained by the fact that they both have
limited distributions in the Western Indian Ocean, with no apparent barriers within each
range.
In the subgenus phylogeny a clear separation is observed between the Pacific (C.
lunulatus) and Indian Ocean species (C. trifasciatus, C. melapterus, and C. austriacus)
(Figure 2.1). The statistical parsimony network indicates that geminate species, C.
lunulatus and C. trifasciatus, are separated by 28 mutational steps based on mtDNA
cytochrome b sequences (Figure 2.2), corresponding to a sequence divergence of d =
6.0%. Based on the conventional molecular clock of 2%/MY, the mtDNA distance
indicates approximately three million years of divergence. This is close to the onset of
modern glacial cycles at 2.6 – 2.8 Ma (Dwyer et al. 1995; Williams et al. 1997).
Therefore, early in the separation of Pacific C. lunulatus and Indian C. trifasciatus, they
appear to have been isolated by a glacial-era barrier between these two oceans. The
shallow Sunda shelf among Indonesian islands is exposed during low sea levels, forming
a long land bridge and restricting exchange between the tropical Indian Ocean and the
western Pacific (Randall 1998; Bay et al. 2004; Rocha et al. 2007). Therefore it seems
likely that transient allopatry had a role in the formation of these species pairs, a process
that is apparent (or strongly suspected) in other Indian/Pacific species pairs (Briggs and
Bowen 2013; Gaither and Rocha 2013). Notably there are hybrids between the two
species near the boundary of the Indian and Pacific Oceans (Hobbs et al. 2009; Montanari
et al. 2011). Several studies have examined natural hybridization between C. lunulatus
30
and C. trifasciatus at Christmas Island in the Eastern Indian Ocean, although these
occurrences are considered rare (Hobbs et al. 2009) and limited to F1 (first generation)
hybrids with no evidence of backcrossing (Montanari et al. 2011).
Figure 2.2. Statistical parsimony network for Chaetodon lunulatus, C. trifasciatus, C. melapterus, and C. austriacus based on mtDNA cytochrome b sequences. Area of circles is proportional to the abundance of the respective haplotype: small circles indicate rare or unique haplotypes and the largest circles indicate the most common haplotypes observed in sampled individuals. Black bars represent the number of mutations and colors indicate haplotype sampling location (see key).
Cases of allopatric sister species in which their ranges are strongly asymmetric in
size and separated by wide areas of inhospitable habitats are examples of “classical
founder speciation” (Paulay and Meyer 2002; Hsu et al. 2007). In this study C.
trifasciatus was shown to be monophyletic and clearly distinct from its limited range
neighboring species, C. austriacus and C. melapterus, supporting the concept of founder
31
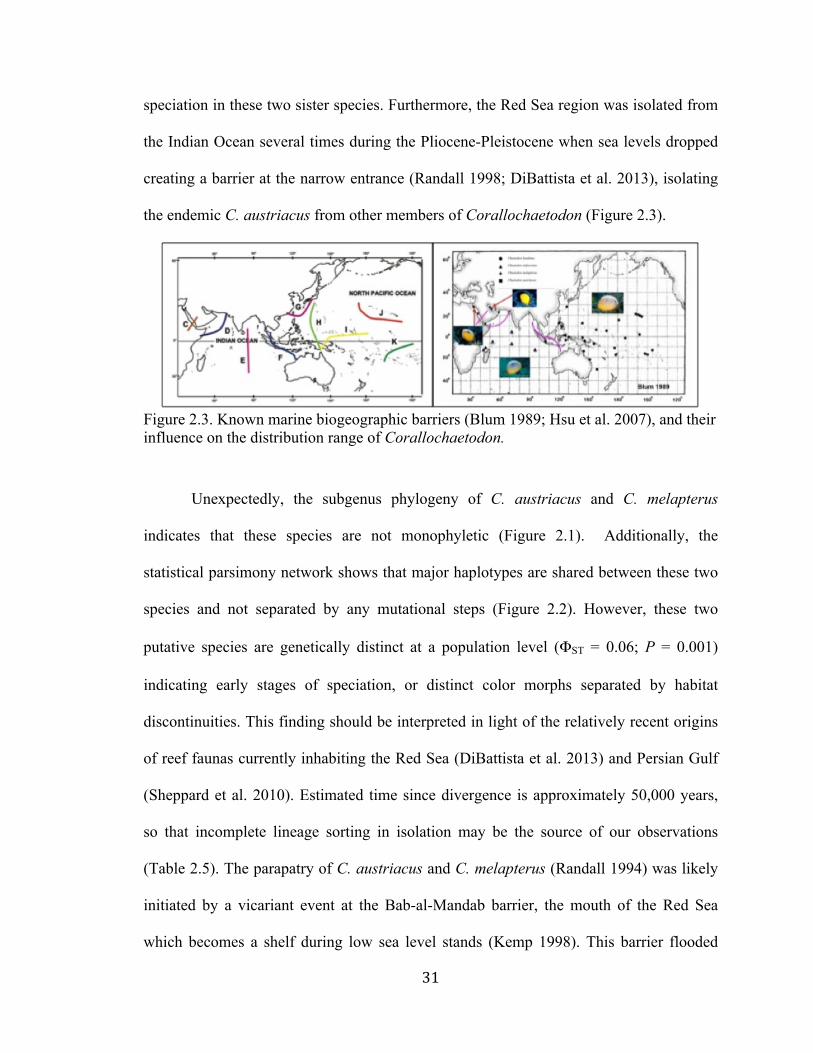
speciation in these two sister species. Furthermore, the Red Sea region was isolated from
the Indian Ocean several times during the Pliocene-Pleistocene when sea levels dropped
creating a barrier at the narrow entrance (Randall 1998; DiBattista et al. 2013), isolating
the endemic C. austriacus from other members of Corallochaetodon (Figure 2.3).
Figure 2.3. Known marine biogeographic barriers (Blum 1989; Hsu et al. 2007), and their influence on the distribution range of Corallochaetodon.
Unexpectedly, the subgenus phylogeny of C. austriacus and C. melapterus
indicates that these species are not monophyletic (Figure 2.1). Additionally, the
statistical parsimony network shows that major haplotypes are shared between these two
species and not separated by any mutational steps (Figure 2.2). However, these two
putative species are genetically distinct at a population level (ΦST = 0.06; P = 0.001)
indicating early stages of speciation, or distinct color morphs separated by habitat
discontinuities. This finding should be interpreted in light of the relatively recent origins
of reef faunas currently inhabiting the Red Sea (DiBattista et al. 2013) and Persian Gulf
(Sheppard et al. 2010). Estimated time since divergence is approximately 50,000 years,
so that incomplete lineage sorting in isolation may be the source of our observations
(Table 2.5). The parapatry of C. austriacus and C. melapterus (Randall 1994) was likely
initiated by a vicariant event at the Bab-al-Mandab barrier, the mouth of the Red Sea
which becomes a shelf during low sea level stands (Kemp 1998). This barrier flooded
32
about 20 Ka, and so contemporary species divergence may be maintained by
environmental conditions. Over time I predict these two color morphs may proceed to
reciprocal monophyly based on two main observations. First, they live in different
regions, with unique conditions including salinity and temperature (Sheppard 1998).
Second, two environmental barriers separate faunas of south Arabia and Red Sea (Kemp
1998). One is located in the western Gulf of Aden, restricting eastward colonization of
Red Sea species. A second is located in the southern third of the Red Sea, preventing
northward colonization by southern Arabian species. Roberts et al. (1992) described the
ecological discontinuity in this region based on reefs that are sparsely distributed, poorly
developed, and subject to high turbidity that appear to restrict the distribution of the
northern and central endemics (e.g. C. austriacus). The barrier does not seem to affect the
distribution of the more widely distributed species, which might have a prolonged pelagic
larval life, facilitating long-range dispersal (Zekeria et al. 2005). Finally, the striking
color differences between these two “species” may induce assortative mating if theses
two species came into secondary contact (McMillan et al. 1999).
Table 2.5. Estimation of divergence between species using a rate of 2% per million years. Mean genetic distance between species is below the diagonal, and divergence time in million of years is above the diagonal.
Implications of Specialization
There are repeated suggestions in the scientific literature that generalist feeders are more
dispersive than specialists, in part because they can persist in a broader array of habitats
33
(Rocha et al. 2002). A natural trade-off exists between a species level of specialization
and the ability of that species to cope with changes in resource availability (Mundy 2004;
Berumen and Pratchett 2008). Generalist species consume a wide range of coral species
and have the ability to switch prey in the presence of alterations in their environment.
More specialized species sacrifice the ability to withstand fluctuations in resource ability,
presumably because dietary specialization will yield greater fitness. All four species of
the subgenus Corallochaetodon are obligate corallivores but have a differing degree of
specialization. Pacific C. lunulatus has very generalized feeding preferences (Lawton et
al. 2012), the Red Sea endemic C. austriacus is a generalist, while the restricted range C.
melapterus and the widespread Indian C. trifasciatus are regarded as specialists. In the
Chagos Archipelago (central Indian Ocean), C. trifasciatus is considered highly
specialized, feeding predominantly on acroporid corals, and is the second most abundant
coral-feeding species compared to generalist counterparts (Pratchett et al. 2013b). In
cases like this where specialist fishes predominate, preferred prey are abundant,
enhancing juvenile growth, survivorship, and lifetime reproductive output (Berumen and
Pratchett 2008; Pratchett et al. 2013b). This in turn could explain the higher population
connectivity in C. trifasciatus compared to C. lunulatus; higher dispersal ability due to
greater fitness. However, field observations of two butterflyfishes (Chaetodon trifascialis
and C. plebeius) at Lizard Island (northern Great Barrier Reef, Australia) have shown
specialized species did not outperform the generalist species and dietary specialization
appears to be a questionable strategy for long-term persistence (Berumen and Pratchett
2008). The differences observed between Chagos and Lizard Island show that it is
difficult to draw general conclusions between diet specialization and population
34
connectivity, and one must carefully take into account reef conditions before doing so.
Many locations are showing substantial declines in coral cover and reef condition, and in
degraded locations, it is likely that specialist coral feeding species will be replaced by
more generalist species (Pratchett et al. 2013b). The unique environmental conditions that
C. melapterus and C. austriacus inhabit can almost certainly explain habitat
specialization for these two species.
Specialization, body size, and life-history traits help determine the likelihood that
a species will undergo local losses and population declines following disturbances,
whereas information on range size, occupancy, and rarity indicates whether declines may
lead to global extinction (Graham et al. 2011). In this case, I propose ecological
specializations do influence range size, dispersal ability, and population connectivity in
this subgenus, however additional research is needed to further evaluate this hypothesis.
CONCLUSION
There was no general correlation between range size and dispersal ability, as initially
expected. These data show that even closely related species can have different levels of
population structure, which is a proxy for realized dispersal ability (see also Bird et al.
2007). The pattern of evolutionary differentiation here is coupled with generally high
gene flow in three of the four species. Evolutionary divergence among species may have
been initiated along biogeographic boundaries such as the barrier between Indian and
Pacific Oceans, and between the Indian Ocean and Red Sea. Contemporary overlap
indicates that species integrity may be reinforced by ecological factors such mate choice,
habitat preferences, and the documented differences in coral prey base between species.
35
CHAPTER 3
INTRA-SPECIES DIFFERENTIATION IN THE BUTTERFLYFISH SUBGENUS
CORALLOCHAETODON (Chaetodon lunulatus and C. trifasciatus)
INTRODUCTION
Based on the mtDNA results in Chapter 2, population structure was observed in C.
lunulatus in the Pacific Ocean but not C. trifasciatus in the Indian Ocean. To evaluate the
robustness of this conclusion, 10 microsatellite loci were surveyed across each of these
two widespread species. In some cases, microsatellites can reveal fine-scale population
structure that is not detected with mtDNA assays, however this is not always the case
(DiBattista et al. 2012b; Karl et al. 2012). Regardless of the sensitivity of individual
classes of markers, conclusions about population structure are more robust when
evaluated across both the mitochondrial and nuclear genomes (Bowen et al. 2014).
Microsatellites are appropriate in this situation because they tend to be highly
polymorphic and combining the results from many loci provides a more precise and
statistically powerful way of comparing populations and individuals. In addition,
microsatellite analysis is particularly useful for assessing present day demography or
population connectivity patterns (Selkoe and Toonen 2006, 2011).
Studies of reef fishes in the Hawaiian Islands show that widespread Indo-Pacific
species usually exhibited genetic homogeneity across this 2600km archipelago, while
endemics can have significant population subdivision over the same range (Ramon et al.
2008; Eble et al. 2009, 2011a; Toonen et al. 2011). Additionally, previous investigation
of phylogeographic relationships, genetic connectivity, and population history for
36
Hawaii’s endemic butterflyfishes (family Chaetodontidae), revealed no evidence for
population subdivisions across the Hawaiian Archipelago (Craig et al. 2010). A
comparison of these endemic species to other more widespread chaetodontid species
occupying the same region, specifically Chaetodon lunulatus, will enhance the scientific
foundations for managing Hawaii’s coral reef ecosystems.
Is the extent of the distribution range of fishes a good predictor of dispersal
ability? A recent meta-analysis indicates that the degree of genetic structure increases as
range size decreases, with restricted-range species showing a higher degree of genetic
structuring than widespread species (Eble and Bowen unpublished).
C. melapterus and C. austriacus specimens were not used in this part of the study
because the microsatellite primers used were created specifically for C. lunulatus,
applying them to different species, even ones closely related as in this case, can be
complicated by allele dropout, homoplasy, and other problems (Selkoe and Toonen
2006).
MATERIALS AND METHODS
A microsatellite primer database designed for Chaetodon species with large geographic
ranges was developed by Lawton et al. (2010), including 16 microsatellite primers
designed for C. lunulatus. In the present study both species were genotyped at 10 of these
microsatellite loci (Table 3.1), based on the collections described in Chapter 2.
Polymerase chain reaction (PCR) mixes contained 5 ul of 2x BioMix Red solution
(BioMix Red; Bioline Ltd., London, UK), 0.15 ul (10 uM) of reverse primer and dye,
0.035 ul (10uM) of fluorescently labeled forward primer, and 5–50 ng template DNA in
37
10 ul total volume. PCRs included an initial denaturing step at 94°C for 5 min, then 35
cycles of amplification (30 s of denaturing at 94°C, 30 s of primer-specific annealing at
temperatures provided in Table 3.1, and 90 s of extension at 72°C), followed by a final
extension at 72°C for 10 min. PCR products were visualized through 1.5% agarose gel
electrophoresis and compared to Hyperladder IV (Bioline, Taunton MA), a 100 bp
standard size marker. All markers reliably amplified in both species and product sizes
were consistent with expectations (Lawton et al. 2010; Montenari et al. 2011).
Table 3.1. Characteristics of microsatellites used in this study, developed for Chaetodon lunulatus by Lawton et al. 2010. Primer sequences, repeat motifs, and annealing temperatures (Ta) are given as per the authors of the original study. Fluorescent dye labels and size ranges are from the present study.
38
PCR products labeled with different fluorescent dye colors were pooled for
genotyping and resolved using an ABI 3130XL Genetic Analyzer (Applied Biosystems)
along with a fluorescently labeled internal size standards (LIZ-500; Applied Biosystems)
following the methods outlined by DiBattista et al. (2012b). Allele sizes were assigned
using the Geneious Pro (BioMatters) version 5.6.7 microsatellite plug in.
Initially specimens from Hawaii were separated into individual sampling
locations by island. However mtDNA cyt b sequence data revealed significant structure
within the Hawaiian archipelago with a primary genetic break between the Main
Hawaiian Island (MHI) and North West Hawaiian Island (NWHI) concordant with a
comparative analysis of multispecies connectivity in the archipelago (Toonen et al.
2011). As a result, for subsequent analysis sampling sites in Hawaii were partitioned into
two groups; MHI and NWHI. However, a full comparison among Hawaiian sample sites
is provided in the appendix (Table A.1).
For each locus the mean number of alleles (NA), observed (HO), and expected
(HE) heterozygosities, departure from Hardy-Weinberg proportions (HWE), and linkage
disequilibrium (LD) were assessed with GENEPOP version 4.2 (Raymond and Rousset
1995). MICRO-CHECKER version 2.2.3 was used to identify genotyping errors
including the possible presence of null alleles, allelic dropouts, and excessive stutter
peaks (Van Oosterhout et al. 2004), and significance levels for multiple comparisons
were adjusted using the sequential Bonferonni correction. GENODIVE version 2.0b23
(Meirmans and Tienderen 2004) was used to estimate overall population structure for
each species separately and to estimate pairwise comparisons (FST calculations).
39
STRUCTURE version 2.3.4 was used to assign individuals to distinct genetic
clusters (populations) without presumption from predefined geographic locations
(Pritchard at al. 2000). STRUCTURE uses a Bayesian approach to assign individual
multilocus genotypes to one or more clusters by minimizing deviations from Hardy-
Weinberg and linkage equilibrium. The most likely number of clusters in the dataset was
identified based on the probability of K=1 to K= 12 or K=1 to K=4 for C. lunulatus and
C. trifasciatus respectively. Analyses were repeated five times and results averaged. Each
replicate run consisted of 1,000,000 MCMC repetitions, a burn-in of 10,000 iterations,
and assumed correlated allele frequencies and admixed populations (as per DiBattista et
al. 2012b). STRUCTURE HARVESTER version 0.6.93 was used to determine most
likely value of K. This program processes STRUCTURE results and uses the “Evanno”
method (Evanno et al. 2005) to provide a fast way to assess and visualize likelihood
values across multiple values of K and hundreds of iterations for easier detection of the
number of genetic groups that best fit the data (Earl and vonHoldt 2012).
RESULTS
Chaetodon lunulatus
Significant population structure was detected for C. lunulatus (FST = 0.05, P = 0.001).
Microsatellite allele frequencies (FST) were significantly different in 49 out of 91
comparisons for C. lunulatus (Table 3.2; see also Table A.1 in the appendix). Four
different locations yielded consistently significant FST values: Moorea, Johnston Atoll,
MHI, and NWHI. See Table 3.3 for Microsatellite statistics averaged over all loci for
each location and species.
40
Table 3.2. Matrix of population pairwise FST values and associated P values based on microsatellite genotypes for Chaetodon lunulatus. FST values are above the diagonal and P values are below the diagonal. Significant P values are highlighted in bold (P < 0.05).
The mean number of alleles per locus was 17.9 (range: 7 to 29 alleles), allelic
richness was 3.56 (range: 1.54 to 5.44), and observed heterozygosity ranged from 0.54
(Lun 14) to 0.95 (Lun 3). Few loci deviated from Hardy-Weinberg equilibrium for within
site comparisons (7 out of 140, P < 0.05). Linkage disequilibrium was detected in 2 out of
45 within site comparisons after correcting for multiple tests: Moorea Lun 14 and Lun 34,
Johnston Atoll Lun 8 and Lun 20 (P < 0.011 across all populations), but none of these
deviations are consistent within loci or sites.
MICROCHECKER analysis revealed no evidence for scoring error due to
stuttering, and no evidence for large allele dropout. Evidence of null alleles was detected
in only 12 out of 140 within site comparisons, although one locus was disproportionately
represented, Lun 20. Therefore analyses were run including and excluding this locus;
finding were no different between datasets and so results from all 10 loci are presented.
Overall, there was no consistent evidence for departure from HWE, linkage
disequilibrium, or null alleles across all sampled locations, supporting the decision to
retain and examine the entire data set.
41
N NA HO HE C. lunulatus Christmas Island (I) 6 6.3 0.883 0.824 Indonesia 27 11.1 0.802 0.795 American Samoa 18 8.5 0.744 0.764 Fiji 37 12.2 0.784 0.79 Kanton Island 17 9.8 0.831 0.79 Marshall Islands 54 13.6 0.785 0.795 Moorea 32 9.5 0.776 0.729 Okinawa 14 8.7 0.752 0.808 Pohnpei 30 10.7 0.793 0.787 Kiribati 40 12.7 0.779 0.783 Palau 33 12.3 0.788 0.795 Johnston Atoll 42 8.6 0.731 0.695 MHI 50 9 0.782 0.747 NWHI 203 13.3 0.688 0.671 C. trifasciatus Diego Garcia 29 11.6 0.686 0.775 Seychelles 34 14.3 0.764 0.800 Australia 58 15.0 0.757 0.811 Indonesia 17 9.9 0.765 0.800
Table 3.3. Microsatellite statistics averaged over all loci for each location and species: Number of samples (N), number of alleles (NA), observed heterozygosities (HO) and expected heterozygosities (HE).
STRUCTURE identified mean probabilities as being highest at K = 3 (Figure
3.1), and K = 3 was verified using STRUCTURE HARVESTER (Figure 3.2).
Figure 3.1. STRUCTURE bar plot for Chaetodon lunulatus, showing the highest mean probability of K = 3. Locations: 1 Christmas Island (I), 2 Indonesia, 3 Palau, 4 Okinawa, 5 Pohnpei, 6 Marshall Islands, 7 Fiji, 8 American Samoa, 9 Moorea, 10 Kanton Island, 11 Kiribati, 12 Johnston Atoll, 13 MHI, 14 NWHI.
42
Figure 3.2 STRUCTURE HARVESTER analysis used to determine that K = 3 is the most likely value for Chaetodon lunulatus.
Chaetodon trifasciatus
Low but significant population structure was detected for C. trifasciatus (FST = 0.003, P =
0.03). Microsatellite allele frequencies were significantly different in 3 out of 6
comparisons (Table 3.4).
The mean number of alleles per locus was 17.9 (range: 7 to 29 alleles), allelic
richness was 5.99 (range: 3.04 to 9.92), and observed heterozygosity ranged from 0.41
(Lun 36) to 0.91 (Lun 3). Linkage Disequilibrium was detected in only one pair of loci
(Australia, Lun 3 and Lun 9) out of 45 within site comparisons after correcting for
multiple tests (adjusted P < 0.001). The test for Hardy-Weinberg disequilibrium was
significant in 7 out of 40 within site comparisons (adjusted P < 0.005).
Table 3.4. Matrix of population pairwise FST values and associated P values based on microsatellite genotypes for Chaetodon trifasciatus. FST values are above the diagonal and P values are below the diagonal. Significant P values are highlighted in bold (P < 0.05).
43
Microchecker analysis again revealed no evidence for scoring error due to
stuttering, or large allele dropout. Evidence of null alleles was detected in only 9 out of
40 within site comparisons; again 2 loci were disproportionately represented, Lun 7 and
Lun 20. Therefore analyses were run including and excluding this locus; again findings
were no different between datasets and so results from all 10 loci are presented.
To test for the possible impact of null alleles in Lun 7 and Lun 20 on these results,
I also ran FreeNA which estimates unbiased FST (Weir 1996) following the excluding
null alleles (ENA) method described in Chapuis and Estoup (2007). This test resulted in
FST = 0.0038 not using ENA, and FST = 0.0044 using ENA.
STRUCTURE identified mean probabilities as being highest at K = 2, which is
consistent with the results from STRUCTURE HARVESTER (Figure 3.3).
Figure 3.3 STRUCTURE HARVESTER analysis used to determine that the most likely value was K = 2 for Chaetodon trifasciatus.
DISCUSSION
Chaetodon lunulatus
Microsatellite analyses for C. lunulatus were consistant with the mtDNA results in
indicating divergent populations at MHI and Johnston Atoll, NWHI, and Moorea. All
44
lines of evidence indicate that the large range of C. lunulatus is subdivided into isolated
populations at the extremes of the range. The homogenous region through the Central-
West Pacific range, the Indo-Polynesian Biogeographic Province, is speckled with atolls
and islands, so that there is no distance greater than 800 km between suitable shallow reef
habitat (Schultz et al. 2008; Briggs and Bowen 2012). However, the peripheral isolation
is not maintained by distance alone, as prevailing currents also work against colonization
of Hawaii and French Polynesia (Hourigan and Reese 1987; Gaither et al. 2010).
Furthermore, this large range encompasses spatial, temporal, and environmental
heterogeneity in coral-reef habitats.
An interesting outcome is the separation between the high islands of the MHI and
the low islands and atolls of the NWHI, indicating some kind of barrier between these
regions. This may be due to a lack of appropriate habitat between these regions,
specifically abundant coral cover and areas protected from high wave energy. The
specialist C. lunulatus prefers areas with greater than 60-70% coral cover. Notably, at the
MHI region adjacent to this break (Kauai) our own efforts and previous transect data
indicate a near-complete absence of C. lunulatus. This provides an obvious explanation
for the geographic partition on the finest scale observed in this study, although additional
fine-scale breaks may have eluded detection with our sampling design. In understanding
the population genetic partitions in this species, we return to an earlier biogeographic
appraisal of the Hawaiian Islands, which identified three factors defining the distribution
of reef fishes: “ (1) the geographic isolation of the islands, and oceanographic features,
especially current patterns; (2) the life history characteristics of the fishes, especially their
45
dispersal capabilities; and (3) the extent of adaptive differentiation to environmental
conditions after they reached Hawaii” (Hourigan and Reese 1987).
Chaetodon trifasciatus
This species shows low but significant overall structure in microsatellites (trifasciatus
(FST = 0.003, P = 0.03), but not with mtDNA (ΦST = -0.01; P = 0.50). There is a
persistent but fallacious belief in the field of population genetics that the hypervariable
microsatellites will show population structure that may be missed in mtDNA assays (Karl
et al. 2012). However, pragmatic comparisons of these two approaches show that both
can reveal population structure not detected by the other assay, depending on a variety of
conditions (DiBattista et al. 2012b). Therefore it is sufficient to conclude that these
findings demonstrate the value of using multiple loci for population assessment.
The microsatellite data for C. trifasciatus indicate that the population at Diego
Garcia (Chagos Archipelago), in the middle of the Indian Ocean, is statistically
differentiated from samples sites to the east and west. Part of this outcome may be
explained by sparse sampling, especially at Indonesia. However, Chagos is also an
unusual location in several respects. First, based on faunal composition the Chagos
aligned with the Western Indian Ocean biogeographic province, but also shares some
faunal elements with the Indo-Polynesian Province to the east (Winterbottom and
Anderson 1997; Craig 2008; Briggs and Bowen 2012). Second, the Chagos is subject to
seasonal monsoon-driven currents that switch direction between easterly and westerly,
possibly limiting larval dispersal to this location (Figure 3.4, Sheppard et al. 2012). C.
trifasciatus spawn from August-January and March-May (Vijay Anand and Pillai 2002)
46
so it is possible that larvae are exposed to unfavorable conditions by these changing
currents, which could also effect nutrients, temperatures and larval dispersal ability and
ultimately have an isolating effect. Third, the population genetic separation of Chagos has
been observed in other reef fauna (Gaither et al. 2010; Eble et al. 2011b; Vogler et al.
2012), indicating that the isolation of this mid-ocean archipelago is a general feature of
the reef fauna, akin to that observed for Hawaii (DiBattista et al. 2011; Eble et al. 2011a;
Gaither et al. 2011b).
Figure 3.4. Prevailing currents in the north-western Indian Ocean. (left) Winter: November – March. (right) Summer: April – October (figure from Kemp 1998).
CONCLUSION
Genetic data indicate that the Indian Ocean C. trifasciatus shows less structure and is
perhaps more dispersive than the Pacific sister species C. lunulatus, regardless of the
assay. This conclusion is somewhat counter-intuitive for at least three reasons. First, C.
lunulatus has a larger range, which can be associated with higher dispersal ability (Eble
and Bowen, unpublished). Second, the Pacific domain of C. lunulatus has many more
47
island groups to provide stepping stones across the species range. Third, C. trifasciatus is
a dietary specialist relative to C. lunulatus. All three factors would predict greater
dispersal in C. lunulatus, although a counterargument could be made to point three, that
specialists need greater dispersal to find appropriate habitat. While the explanation for
this pattern is not clear, there is one pertinent observation in the pattern of population
subdivisions: with the possible exception of Fiji, all the isolated populations identified
here are either at the margins of the range (French Polynesia), at an isolated mid-oceanic
archipelago (Chagos), or both (Hawaii). Recent studies indicate that such peripheral
marine habitats can be engines of biodiversity (Duda and Lee 2009; Budd and Pandolfi
2010; Bird et al. 2011; Bowen et al. 2013; Baums et al. 2014). If population genetic
separations are the starting point for speciation, then the evolutionary hotspots for
corallivore butterflyfishes may be at these isolated and peripheral habitats.
48
CHAPTER 4
FINAL SUMMARY
The value of comparative phylogeography is clearly shown here, and is supported by the
power of multiple species comparisons, where multiple species serve as independent tests
of regional environmental and geological processes (Toonen et al. 2011; Drew and
Barber 2012). While all four species are closely related and have similar life histories
they exhibit contrasting population genetic signatures emphasizing “the hazards of
making sweeping predictions about population connectivity” (Bird et al. 2007). This
study shows that patterns of differentiation can vary within a single species, and closely
related species, reinforcing the need to identify and protect unique lineages in marine
species. It also allowed us to determine populations of obligate corallivores that can and
should be defined as distinct management units. The definition of these management
units will indicate how these corallivore specialists will react to declining resource
availability. Obligate corallivores are considered good “indicator organisms” because
changes in their distribution and abundance should reflect conditions on the reef (Reese
1981). Butterflyfish can be particularly effective indicator organisms since they are
relatively large and conspicuous. Overall, determining the degree to which populations
interact is critical for understanding how species are formed, how communities are
maintained and how conservation efforts should be prioritized on Indo-Pacific coral reefs
(Eble et al. 2009).
49
APPENDIX
Table A.1. Pairwise comparisons within Hawaiian sampling locations: mtDNA ΦST values are above the diagonal, and microsatellite FST values are below the diagonal. Significant P-‐values values are highlighted in bold (P<0.05).
50
LITERATURE CITED
Allen, G.R., R.C. Steene, and M. Allen. 1998. A guide to angelfishes & butterflyfishes.
Odyssey Publishing/Tropical Reef Research, Perth.
Almany, G.R., M.L. Berumen, S.R. Thorrold, S. Planes, and G.P. Jones. 2007. Local
replenishment of coral reef fish populations in a marine reserve. Science 316: 742–744.
Alwany, M., E. Thaler, and M. Stachowitsch. 2003. Food selection in two corallivorous
butterflyfishes, Chaetodon austriacus and C. trifascialis, in the Northern Red Sea.
Marine Ecology 24: 165–177.
Andrews, K.R., L. Karczmarski, W.W.L. Au, S. Rickards, C.A. Vanderlip, B.W. Bowen,
and R.J. Toonen. 2010. Rolling stones and stable homes; Social structure, habitat
diversity, and population genetics of the Hawaiian spinner dolphin (Stenella longirostris).
Molecular Ecology 19: 732-748.
Bandelt, H.J., P. Forster, A. Röhl. 1999. Median-joining networks for inferring
intraspecific phylogenies. Molecular Biology and Evolution 16: 37–48.