Agiulua Ecnoic Reor No 7prl19 PRELIMINARY ECONOMIC FEASIBILITY OF PROCESSING A NATURAL RED FOOD COLORANT FROM PURPLE-HULL SUNFLOWER IN NORTH DAKOTA Joel T. Golz, Delmer L. Helgeson, Dale F. Zetocha, and Timothy A. Petry SB z-s7 ent of Agricultural Economics * Agricultural Experiment Station I North Dakota State University, Fargo, ND 58105-5636 273 _ __ I Aorricultural Economics Report No. 273 April 199
Transcript
Agiulua Ecnoic Reor No 7prl19
PRELIMINARY ECONOMICFEASIBILITY OF PROCESSING A
NATURAL RED FOOD COLORANTFROM PURPLE-HULL SUNFLOWER
IN NORTH DAKOTA
Joel T. Golz, Delmer L. Helgeson,Dale F. Zetocha, and Timothy A. Petry
SB
z-s7 ent of Agricultural Economics * Agricultural Experiment StationI North Dakota State University, Fargo, ND 58105-5636
273
_ __ IAorricultural Economics Report No. 273 April 1991
Acknowledgement s
Special recognition is given for financial support provided bythe Cooperative State Research Service (CSRS) of the U.S. Departmentof Agriculture and the North Dakota Agricultural Experiment Station.
The authors would like to thank those who provided reviews ofthis manuscript: Dr. Dennis Wiesenborn, Department of AgriculturalEngineering; Dr. Navam Hettiarachchy, Department of Cereal Science andFood Technology; Dr. Edna Holm, Department of Food and Nutrition;Professor Tim Petry and Dr.. Demcey Johnson, Department of AgriculturalEconomics; and Ms. Charlene Lucken, Lecturer in the College ofAgriculture, NDSU. Appreciation is given to Michele Swandal fortyping draft copies and the final copy. The authors accept soleresponsibility for any omissions or errors.
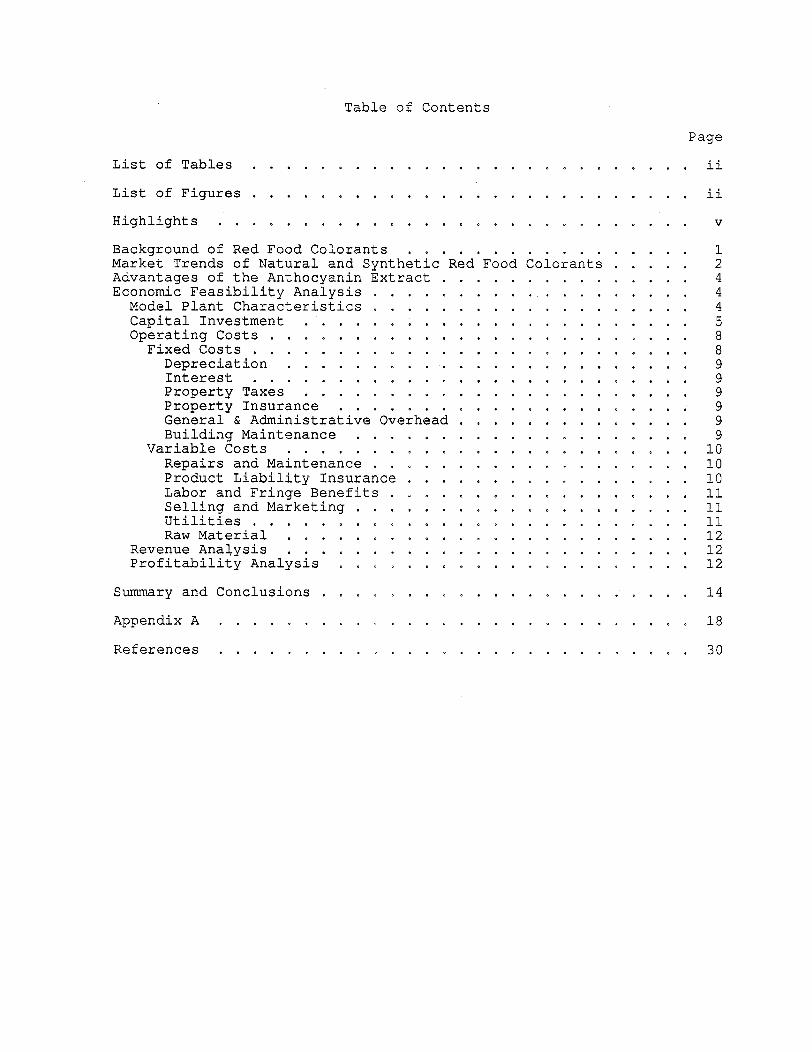
Table of Contents
Page
List of Tables .... ........... . .....
List of Figures .. . . . ..... ...........
Highlights . . ...... . . ... . .......
Background of Red Food Colorants . . . . . . ....Market Trends of Natural and Synthetic Red Food Colorants .Advantages of the Anthocyanin Extract ...........Economic Feasibility Analysis .. . . ...... . . . ..
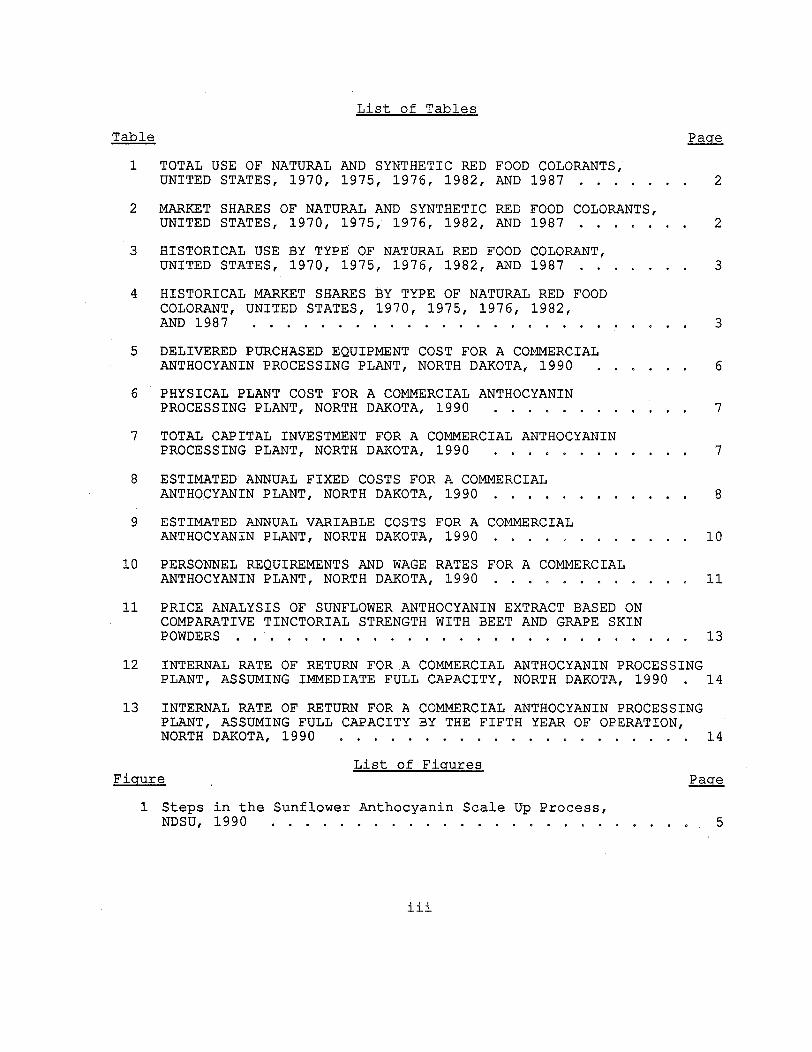
12 INTERNAL RATE OF RETURN FOR A COMMERCIAL ANTHOCYANIN PROCESSINGPLANT, ASSUMING IMMEDIATE FULL CAPACITY, NORTH DAKOTA, 1990 . 14
13 INTERNAL RATE OF RETURN FOR A COMMERCIAL ANTHOCYANIN PROCESSINGPLANT, ASSUMING FULL CAPACITY BY THE FIFTH YEAR OF OPERATION,NORTH DAKOTA, 1990 . . . . . . . . . . . . . . . . . . . .. 14
List of FiguresFigure Page
1 Steps in the Sunflower Anthocyanin Scale Up Process,NDSU, 1990 . ........... . . . .. .. . . . . . . .. 5
iii
Hiqhli hts
This study was concerned with the economic feasibility ofextracting natural red colorant (anthocyanin) from purple-hullsunflower on a commercial basis. Historical market trends of bothsynthetic and natural red food colorants indicated an increasinginterest of food processors in natural red food colorants. Detailedplant investment and operating costs were derived using economicengineering estimates for a model plant annually processing 780,000pounds of anthocyanin extract. The estimated investment for the modelplant was $5.18 million, excluding net working capital requirements.
Profitability was estimated using internal rate of return (IRR).Three levels of operating costs and prices were used in calculatingIRR under two sales approaches. Operating costs used were $2.47,$2.74, and $3.01 while prices used were $4, $5, and $6, all per poundof extract. The first sales approach assumed full plant capacity wasreached the first year of operation while the second approach assumedfull plant capacity was not reached until the fifth year of operation.IRRs ranged between 12 and 53 percent for the first sales approach and9 and 36 percent for the second sales approach. Processinganthocyanin extract was economically feasible when prices weremaintained at the medium level or higher for both sales approaches.At the low price level IRRs may not be acceptable to reward investorsfor risk in such a new business venture.
v
PRELIMINARY ECONOMIC FEASIBILITY OF PROCESSING A NATURAL REDFOOD COLORANT FROM PURPLE-HULL SUNFLOWER IN NORTH DAKOTA
Joel T. Golz, Delmer L. Helgeson,Dale F. Zetocha, and Timothy A.Petry*
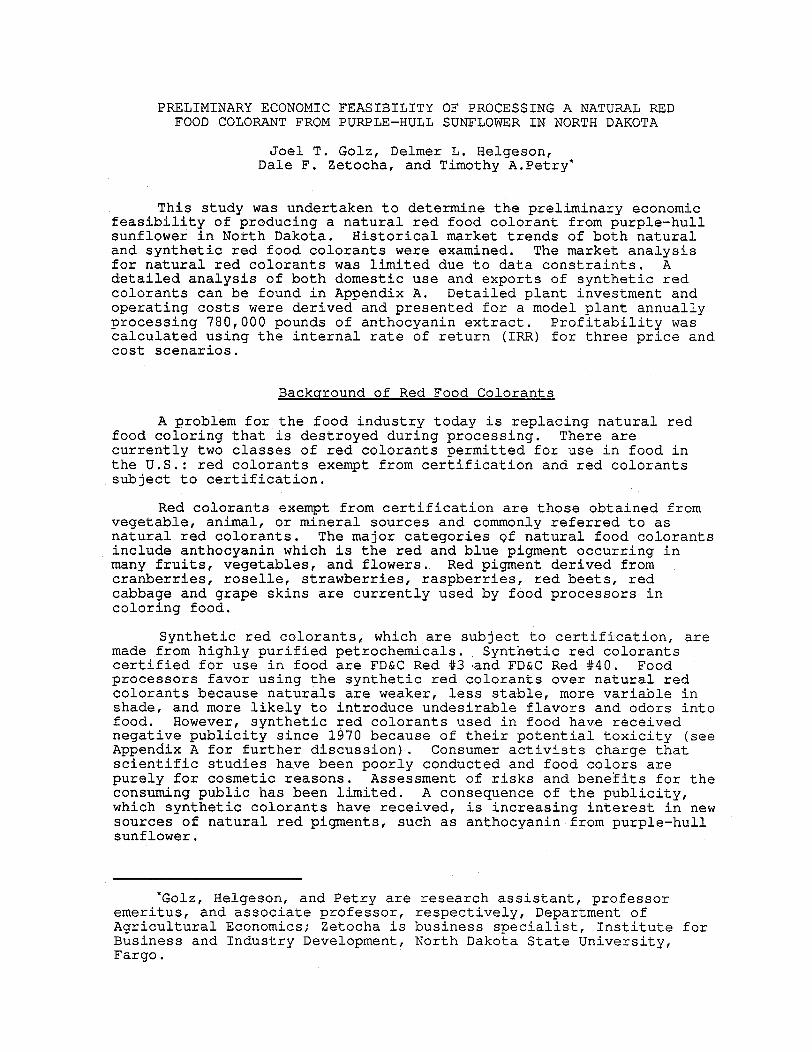
This study was undertaken to determine the preliminary economicfeasibility of producing a natural red food colorant from purple-hullsunflower in North Dakota. Historical market trends of both naturaland synthetic red food colorants were examined. The market analysisfor natural red colorants was limited due to data constraints. Adetailed analysis of both domestic use and exports of synthetic redcolorants can be found in Appendix A. Detailed plant investment andoperating costs were derived and presented for a model plant annuallyprocessing 780,000 pounds of anthocyanin extract. Profitability wascalculated using the internal rate of return (IRR) for three price andcost scenarios.
Background of Red Food Colorants
A problem for the food industry today is replacing natural redfood coloring that is destroyed during processing. There arecurrently two classes of red colorants permitted for use in food inthe U.S.: red colorants exempt from certification and red colorantssubject to certification.
Red colorants exempt from certification are those obtained fromvegetable, animal, or mineral sources and commonly referred to asnatural red colorants. The major categories Qf natural food colorantsinclude anthocyanin which is the red and blue pigment occurring inmany fruits, vegetables, and flowers. Red pigment derived fromcranberries, roselle, strawberries, raspberries, red beets, redcabbage and grape skins are currently used by food processors incoloring food.
Synthetic red colorants, which are subject to certification, aremade from highly purified petrochemicals. Synthetic red colorantscertified for use in food are FD&C Red #3 and FD&C Red #40. Foodprocessors favor using the synthetic red colorants over natural redcolorants because naturals are weaker, less stable, more variable inshade, and more likely to introduce undesirable flavors and odors intofood. However, synthetic red colorants used in food have receivednegative publicity since 1970 because of their potential toxicity (seeAppendix A for further discussion). Consumer activists charge thatscientific studies have been poorly conducted and food colors arepurely for cosmetic reasons. Assessment of risks and benefits for theconsuming public has been limited. A consequence of the publicity,which synthetic colorants have received, is increasing interest in newsources of natural red pigments, such as anthocyanin from purple-hullsunflower.
*Golz, Helgeson, and Petry are research assistant, professoremeritus, and associate professor, respectively, Department ofAgricultural Economics; Zetocha is business specialist, Institute forBusiness and Industry Development, North Dakota State University,Fargo.
2
Market Trends of Natural and Synthetic Red Food Colorants
Total use of synthetic red colorants has actually declined from2.5 million pounds in 1975 to 2.36 million pounds in 1987. At thesame time use of natural red colorants has increased from .23 millionpounds in 1975 to .7 million pounds in 1987 (Table 1).
TABLE 1. TOTAL USE OF NATURAL AND SYNTHETIC RED FOOD COLORANTS,UNITED STATES, 1970, 1975, 1976, 1982, AND 1987
Red Colorant 1970 1975 1976 1982 1987
-------------- Million pounds---------------
Natural .31 .23 .80 .61 .70
Synthetic 1.62 2.50 2.10 2.17 2.36
SOURCE: Natural Data from Poundage and Technical Effects Updateof Substances Added to Food, 1987, National Academy of Sciences.Synthetic Data from Certified Color Manufacturer's Association,Inc., 1988.
Natural red colorants accounted for 16 percent of the total(natural and synthetic) red colorants used for food in 1970. Themarket share of natural red colorants dropped to 8 percent by 1975,due to the addition of Synthetic Red #40, but increased to a high of28 percent in 1976 as a result of the delisting of Synthetic Red #2(see Appendix A for further discussion). Since, health concernsregarding synthetic red colorants have increased allowing natural redcolorants to control one-fifth of the red colorant market (Table 2).The Food & Drug Administration (FDA) banned one-fifth of the uses forRed #3 in January of 1990 because laboratory testing indicated highdoses caused cancer in laboratory animals. This could have an impacton food processors switching from synthetic to natural red colorants.
TABLE 2. MARKET SHARES OF NATURAL AND SYNTHETIC RED FOODCOLORANTS, UNITED STATES, 1970, 1975, 1976, 1982, AND 1987
Red Colorant 1970 1975 1976 1982 1987
------------------ Percent-------------
Natural 16 8 28 22 23
Synthetic 84 92 72 78 77
SOURCE: Adapted from Table 1.
3
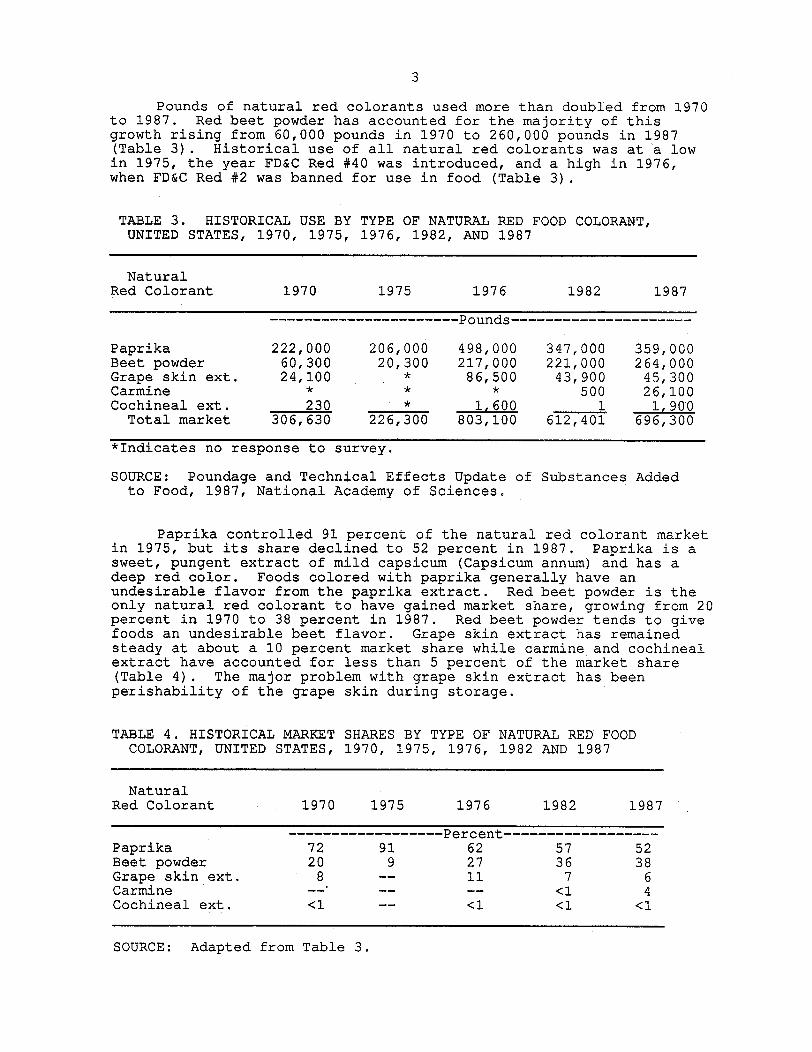
Pounds of natural red colorants used more than doubled from 1970to 1987. Red beet powder has accounted for the majority of thisgrowth rising from 60,000 pounds in 1970 to 260,000 pounds in 1987(Table 3). Historical use of all natural red colorants was at a lowin 1975, the year FD&C Red #40 was introduced, and a high in 1976,when FD&C Red #2 was banned for use in food (Table 3).
TABLE 3. HISTORICAL USE BY TYPE OF NATURAL RED FOOD COLORANT,UNITED STATES, 1970, 1975, 1976, 1982, AND 1987
SOURCE: Poundage and Technical Effects Update of Substances Addedto Food, 1987, National Academy of Sciences.
Paprika controlled 91 percent of the natural red colorant marketin 1975, but its share declined to 52 percent in 1987. Paprika is asweet, pungent extract of mild capsicum (Capsicum annum) and has adeep red color. Foods colored with paprika generally have anundesirable flavor from the paprika extract. Red beet powder is theonly natural red colorant to have gained market share, growing from 20percent in 1970 to 38 percent in 1987. Red beet powder tends to givefoods an undesirable beet flavor. Grape skin extract has remainedsteady at about a 10 percent market share while carmine and cochinealextract have accounted for less than 5 percent of the market share(Table 4). The major problem with grape skin extract has beenperishability of the grape skin during storage.
TABLE 4. HISTORICAL MARKET SHARES BY TYPE OF NATURAL RED FOODCOLORANT, UNITED STATES, 1970, 1975, 1976, 1982 AND 1987
Producing a natural red colorant from purple-hull sunflower hasseveral factors which make it both economically and scientificallyworth pursuing. First, North Dakota ranked first in both oil and non-oil sunflower production in 1989. The red colorant extracted fromhulls would add a high value by-product to processors which mayenhance returns to sunflower producers.
Also, red colorant from the purple-hull sunflower is a moreconcentrated source of pigment than red pigment derived from othernatural sources. Cranberry pumice and grape skins yield 15 and 85 mgof anthocyanin pigments per 100 grams, respectively, while theanthocyanin pigments in sunflower hulls range up to 2500 mg per 100grams.
A third factor for considering extraction of red colorant frompurple-hull sunflower is that current natural red colorants areextracted from fruits and vegetables which are highly perishable.Sunflower hulls are economically attractive because they can be storedfor long periods of time without excessive storage loss.
Finally, a major problem with natural red colorants is acceptablesolubility and stability at an acid pH. An insoluble nature resultsin precipitation, and instability decreases color intensity and evenmay change the color. Laboratory bench research indicates anthocyaninextracted from purple-hull sunflower has acceptable stability andsolubility when stored for 12 months at an acid pH and ambienttemperature.
Economic Feasibility Analysis
The economic feasibility analysis of processing natural red foodcolorant in North Dakota limited the potential market to only thenatural red colorant market. A natural red food colorant from purple-hull sunflower could penetrate only a small portion of the syntheticred market because of a higher cost to the food processor. The highercost results from tinctorial strength compared to Red #40.1 About 60pounds of anthocyanin extract is needed to match the color intensityof one pound of Red #40, which sells for $12 per pound. Red #40currently accounts for 90 percent of the synthetic red colorant usedin food. Thus, a natural red food colorant may have little success incapturing a large portion of the synthetic market unless toxicologicaltesting indicates that Red #40 is not safe for human consumption. Thepotential synthetic red market size is evaluated in Appendix A in theevent that toxicological testing would find Red #40 unsafe for humanconsumption.
Model Plant Characteristics
Annual domestic consumption of natural red food colorant for 1990was an estimated one million pounds, while the rest of the world
'Tinctorial strength refers to the amount of natural red colorantneeded to equal the color intensity of one pound of Red #40.
5
accounted for an additional one million pounds. 2 A model plant wassimulated to process 2,600 pounds of anthocyanin extract during a 24-hour daily operation. Based on an annual operation of 300 days,annual capacity would amount to 780,000 pounds. Thus, an anthocyaninplant of this scale would need to penetrate 40 percent of both thedomestic and world markets.
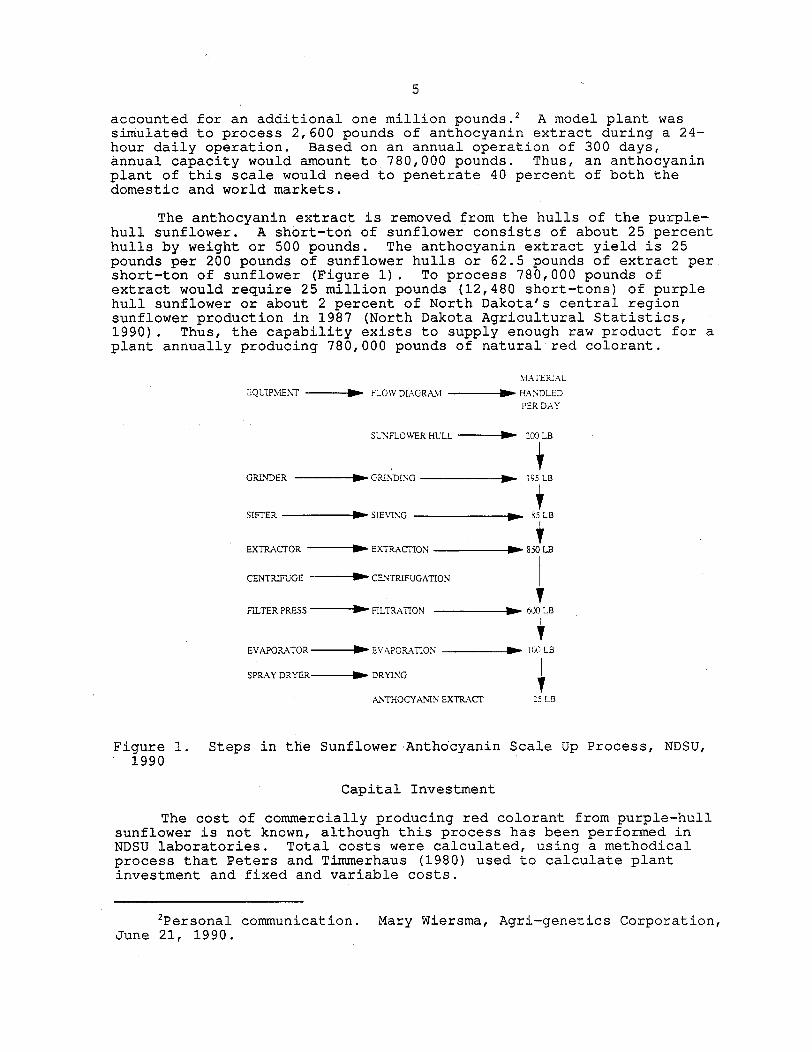
The anthocyanin extract is removed from the hulls of the purple-hull sunflower. A short-ton of sunflower consists of about 25 percenthulls by weight or 500 pounds. The anthocyanin extract yield is 25pounds per 200 pounds of sunflower hulls or 62.5 pounds of extract pershort-ton of sunflower (Figure 1). To process 780,000 pounds ofextract would require 25 million pounds (12,480 short-tons) of purplehull sunflower or about 2 percent of North Dakota's central regionsunflower production in 1987 (North Dakota Agricultural Statistics,1990). Thus, the capability exists to supply enough raw product for aplant annually producing 780,000 pounds of natural red colorant.
MATERIAL
QUIPMENT ----- FLOW DIAGRAtM - HANDLED
PER DAY
SUNFLOWER HLZL --- 0 200 LB
GRINDER - -GRINDING b 195 LB
SIFTER - SIEVING - 85 LB
EXTRACTOR ---- - EXTRACTION M 850 LB
CENTRIFUGE - CENTRIFUGATION
FILTER PRESS - FILTRATION -- 600 LB
EVAPORATOR ---- EVAPORATION 0 100 LB
SPRAY DRYER---- DRYING
ANTHOCYANIN EXTRACT 25 LB
Figure 1. Steps in the Sunflower Anthocyanin Scale Up Process, NDSU,1990
Capital Investment
The cost of commercially producing red colorant from purple-hullsunflower is not known, although this process has been performed inNDSU laboratories. Total costs were calculated, using a methodicalprocess that Peters and Timmerhaus (1980) used to calculate plantinvestment and fixed and variable costs.
2Personal communication. Mary Wiersma, Agri-genetics Corporation,June 21, 1990.
6
Purchased Equipment Cost (delivered) amounted to $1.52 million.Major equipment components included a continuous multiple stageextractor, centrifuge, and a spray dryer. Other equipment includedhull cleaning equipment, an evaporator, and a sifter. The costs forthis equipment are based on engineering estimates and could vary amongequipment suppliers and geographic locations (Table 5).
Physical plant cost totaled $3.82 million (Table 6). This amountincluded purchased equipment as well as equipment installation,buildings with services, and installed service facilities. Purchasedequipment installation involved costs for foundations, labor,construction expenses, supports and platforms. Buildings withservices included labor and supplies involved in erecting buildings.Services included in this cost were plumbing, heating, lighting, andventilation. Installed service facilities included industrial plantutilities, such as power, steam, compressed air, water, and fuel, aswell as waste disposal, shop, first aid, and cafeteria equipment andfacilities.
TABLE 5. DELIVERED PURCHASED EQUIPMENT COST FOR A COMMERCIALANTHOCYANIN PROCESSING PLANT, NORTH DAKOTA, 1990
SOURCE: Dr. Dennis Wiesenborn, personal communication,Agricultural Engineer, Department of Agricultural Engineering,NDSU, 1990.
7
TABLE 6. PHYSICAL PLANT COST FOR A COMMERCIAL ANTHOCYANIN PROCESSINGPLANT, NORTH DAKOTA, 1990
Item Estimated Cost
-$-Purchased equipment, delivered 1,519,000
Spare parts (5% of TEC) 74,000
Sales tax (4% of TEC) 59,000
Equipment installation (35% of TEC) 516,000
Instrumentation and controls
installed (10% of TEC) 148,000
Pumps, piping, conveying solids
(15% of TEC) 220,000
Electrical, installed (10% of TEC) 148,000
Buildings (25% of TEC) 369,000
Service facilities, installed (50% of TEC) 740,000
Land and special assessment (one acre) 27,000
Physical plant cost (PPC) $3,820,000
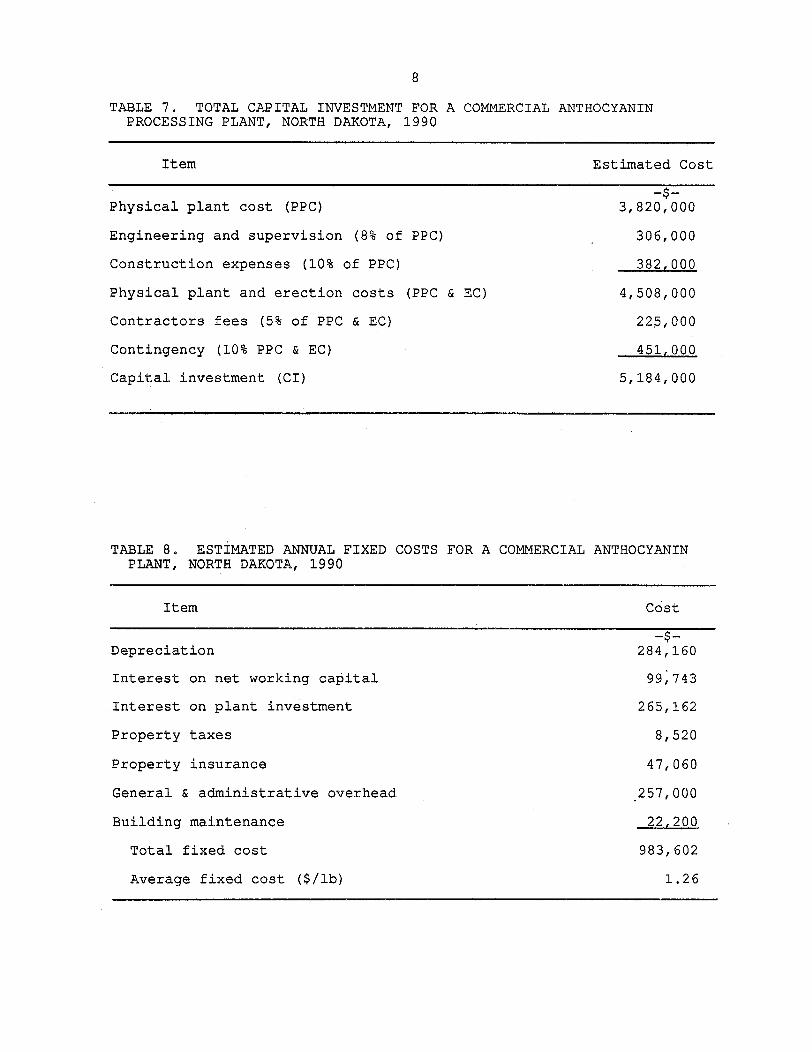
Capital investment for a commercial anthocyanin processing plantin North Dakota came to $5.18 million (Table 7). In addition toPhysical plant investment, this cost included engineering andsupervision, construction, contractor fees, and a contingency factor.Engineering and supervision included costs for travel and livingexpenses, engineering, drafting, purchasing, accounting,communications, and office expenses plus overhead. Constructionexpenses included construction tools, home office personnel at theconstruction site, rental, construction payroll, insurance, travel andliving, plus other construction overhead. Contingencies were forunforeseen expenses, such as design changes, storms, floods, andstrikes (Table 7).
Operating Costs
Operating costs are divided into fixed and variable costs. Fixedcosts are incurred whether the plant is in production or not and areat a constant level regardless of output produced. Variable costsvary with the level of production and are incurred only when the plantis in operation.
Fixed Costs
Fixed costs included depreciation, interest on both net workingcapital and plant investment, taxes, insurance, general andadministrative overhead, and building maintenance (Table 8).
8
TABLE 7. TOTAL CAPITAL INVESTMENT FOR A COMMERCIAL ANTHOCYANINPROCESSING PLANT, NORTH DAKOTA, 1990
Item
Physical plant cost (PPC)
Engineering and supervision (8% of PPC)
Construction expenses (10% of PPC)
Physical plant and erection costs (PPC & EC)
Contractors fees (5% of PPC & EC)
Contingency (10% PPC & EC)
Capital investment (CI)
Estimated Cost
-$-3,820,000
306,000
382,000
4,508,000
225,000
451,000
5,184,000
TABLE 8. ESTIMATED ANNUAL FIXED COSTS FOR A COMMERCIAL ANTHOCYANINPLANT, NORTH DAKOTA, 1990
Item Cost
Depreciation
Interest on net working capital
Interest on plant investment
Property taxes
Property insurance
General & administrative overhead
Building maintenance
Total fixed cost
Average fixed cost ($/lb)
-$-284,160
99,743
265,162
8,520
47,060
257,000
22,200
983,602
1.26
I' ' '
- -- I I
''''' -- I -- --
-- I'-- ''
9
Depreciation
Depreciation costs were calculated using the straight-line methodwith zero salvage value. Different depreciation rates were applied tovarious assets because the estimated useful life of service varies.Buildings were depreciated over a 25-year period while other propertywas depreciated over a 15-year period.
Interest
Interest is the compensation for the use of borrowed capital,which in this case, is net working capital and capital investment. Aninterest rate of 10.23 percent, which represents the 1985-1989 averagefor U.S. industrial bond rates (Survey of Current Business, U.S. Dept.of Commerce, 1990) was used. Net working capital is the amount ofcapital invested in raw materials and supplies, finished products instock, accounts receivable and cash kept on hand for monthly paymentof operating expenses. Net working capital was estimated at 25 percentof annual sales revenue. Assuming a product price of $5 and annualsales of 780,000 pounds, net working capital was estimated at$975,000. Interest on net working capital was then calculated at$99,743. The interest on plant investment was charged on average plantinvestment, which is 50 percent of capital investment. Interest onplant investment was $265,162.
Property Taxes
Property taxes were estimated at $150 per $1,000 of taxableproperty valuation. Taxable value was 10 percent of assessed value,and assessed value was calculated at 50 percent of the true and fullvalue of buildings and land (North Dakota Tax Department, 1987). Thisprocedure yielded a property tax of $8,520.
Property Insurance
Property insurance was estimated at $10 per $1,000 for structuresand their contents. Capital investment less land and the contingencyfactor yielded the amount used to calculate property insurance.
General and Administrative Overhead
General and administrative costs include salary for the chiefexecutive officer, secretarial expense, travel, auditing services,legal fees, telephone, office supplies, postage, and miscellaneousexpenses. Office expenses, either ownership or leasing costs, werealso included. These costs were estimated at 20 percent of all otheroperational expenses excluding depreciation and raw material costs.
Building Maintenance
Maintenance is required on buildings regardless of the level ofoutput. An annual cost of 2 percent of initial building cost was usedto estimate building maintenance.
Variable Costs
Variable costs include repairs and maintenance, product liabilityinsurance, labor and fringe benefits, selling and marketing costs,utilities, and raw materials (Table 9).
Repairs and Maintenance
Repairs and maintenance are necessary to keep the plant operatingefficiently. These costs, calculated as 6 percent of total equipmentcost, were $88,500.
Product Liability
Product liability insurance was estimated at $.35 per $1,000 ofannual sales and amounted to $1,365.
TABLE 9. ESTIMATED ANNUAL VARIABLE COSTS FOR A COMMERCIAL ANTHOCYANINPLANT, NORTH DAKOTA, 1990
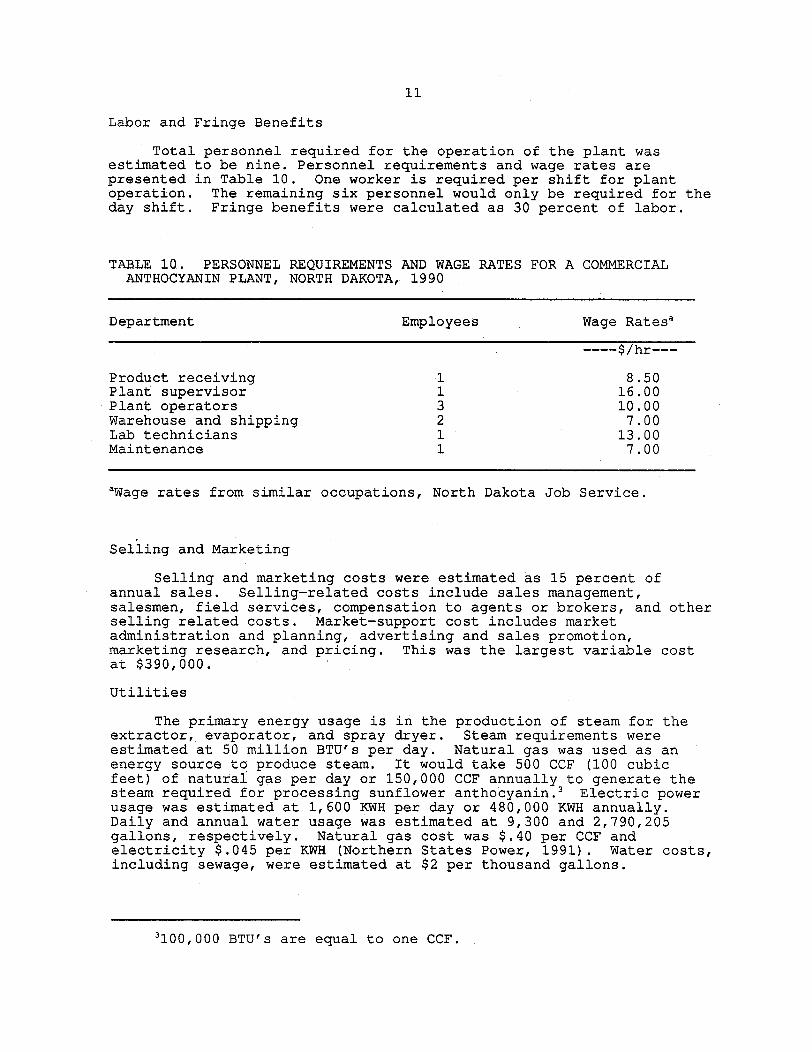
Total personnel required for the operation of the plant wasestimated to be nine. Personnel requirements and wage rates arepresented in Table 10. One worker is required per shift for plantoperation. The remaining six personnel would only be required for theday shift. Fringe benefits were calculated as 30 percent of labor.
TABLE 10. PERSONNEL REQUIREMENTS AND WAGE RATES FOR A COMMERCIALANTHOCYANIN PLANT, NORTH DAKOTA, 1990
aWage rates from similar occupations, North Dakota Job Service.
Selling and Marketing
Selling and marketing costs were estimated as 15 percent ofannual sales. Selling-related costs include sales management,salesmen, field services, compensation to agents or brokers, and otherselling related costs. Market-support cost includes marketadministration and planning, advertising and sales promotion,marketing research, and pricing. This was the largest variable costat $390,000.
Utilities
The primary energy usage is in the production of steam for theextractor, evaporator, and spray dryer. Steam requirements wereestimated at 50 million BTU's per day. Natural gas was used as anenergy source to produce steam. It would take 500 CCF (100 cubicfeet) of natural gas per day or 150,000 CCF annually to generate thesteam required for processing sunflower anthocyanin.3 Electric powerusage was estimated at 1,600 KWH per day or 480,000 KWH annually.Daily and annual water usage was estimated at 9,300 and 2,790,205gallons, respectively. Natural gas cost was $.40 per CCF andelectricity $.045 per KWH (Northern States Power, 1991). Water costs,including sewage, were estimated at $2 per thousand gallons.
3100,000 BTU's are equal to one CCF.
12
Raw Material
Raw material cost was estimated at $.40 per pound of anthocyaninextract (Hettiarchchy and Wiesenborn 1990). The materials included inthis cost are sunflower hulls, citric acid, gum arabic, cellulase, andmaltodextrin. Raw material cost was $312,000.
Revenue Analysis
To gain market share, natural red colorant derived from purple-hull sunflower will have to compete with numerous natural redcolorants derived from sources such as red beets, grape skin,cranberry, roselle, raspberry, cochineal, and red cabbage. To obtaina share of the natural red colorant market, sunflower anthocyanin mustcarry a competitive market price. Obtaining an accurate price seriesfor natural red colorants is difficult since no government or privateagencies collect this price data. Therefore, a market price forsunflower anthocyanin was estimated, using a comparative tinctorialstrength analysis.
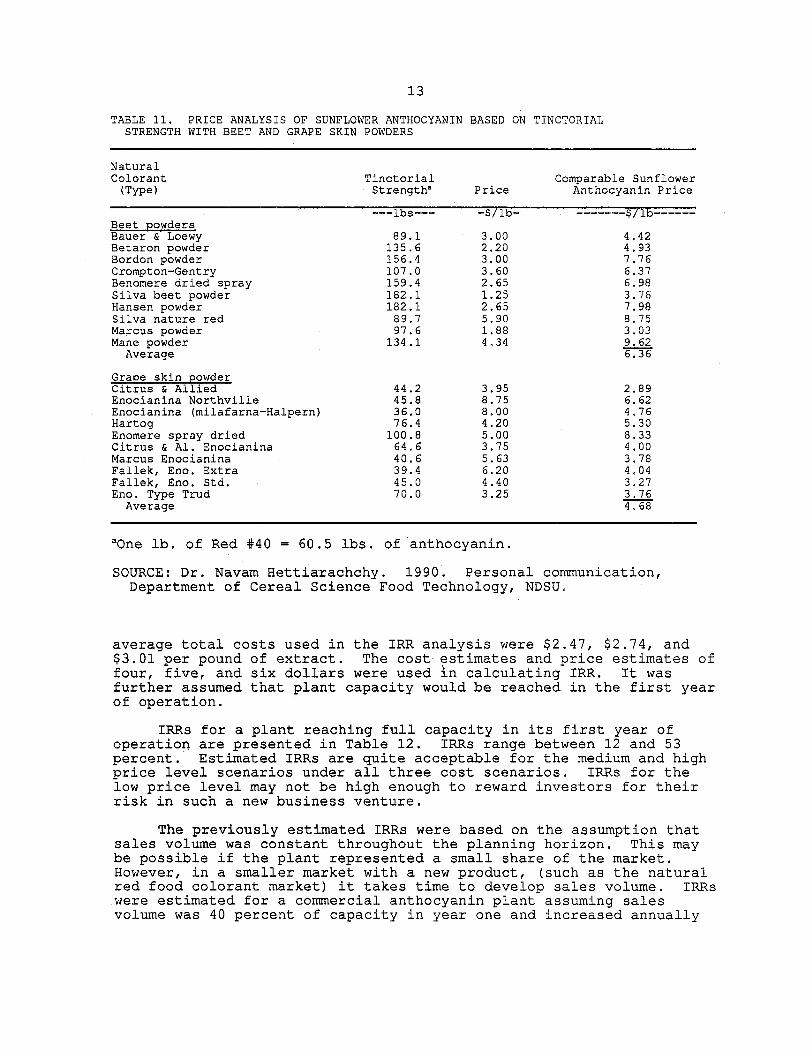
Sunflower anthocyanin seems to be most comparable with redcolorant derived from grape skin and beet powder (Table 11). Thecomparable price (Column 3, Table 11) refers to the price of sunfloweranthocyanin when comparing it with the tinctorial strength of thesenatural colorants. A simple average of the sunflower anthocyaninprice for both red beet and grape skin powders was calculated andindicates sunflower anthocyanin extract may carry a market pricebetween $4.68 and $6.36 per pound. Based on the comparable tinctorialstrength analysis market prices of four, five, and six dollars perpound were used to calculate revenue generated by the sunfloweranthocyanin extract. These price estimates represent a low, medium,and high price for the anthocyanin extract.
Profitability Analysis
The analytical method used to determine economic profitabilitywas the internal rate of return (IRR). IRR is usually thought of asthe rate of return the plant (investment) earns during theinvestment's planning horizon. The planning horizon for this plantwas assumed to be 15 years. Actual life of the plant may be longer;however, plant obsolescence due to technological changes in equipmentmay shorten the useful life of the plant. The IRR methodology issuperior to other analytical methods because it takes the time valueof money into consideration and allows incorporation of time lagsbetween initial investment and operation of the plant at fullcapacity.
Based on preliminary economic engineering estimates averagevariable costs were $1.48 per pound and average fixed costs were $1.26per pound for an average total cost of $2.74 per pound of extract.Since investment and operating costs for an anthocyanin plant werepreliminary estimates sensitivity analysis was performed to determinethe effect of varying costs on profitability. It was assumed thatcosts may have been under or over estimated by 10 percent. Thus,
13
TABLE 11. PRICE ANALYSIS OF SUNFLOWER ANTHOCYANINSTRENGTH WITH BEET AND GRAPE SKIN POWDERS
SOURCE: Dr. Navam Hettiarachchy. 1990. Personal communication,Department of Cereal Science Food Technology, NDSU.
average total costs used in the IRR analysis were $2.47, $2.74, and$3.01 per pound of extract. The cost estimates and price estimates offour, five, and six dollars were used in calculating IRR. It wasfurther assumed that plant capacity would be reached in the first yearof operation.
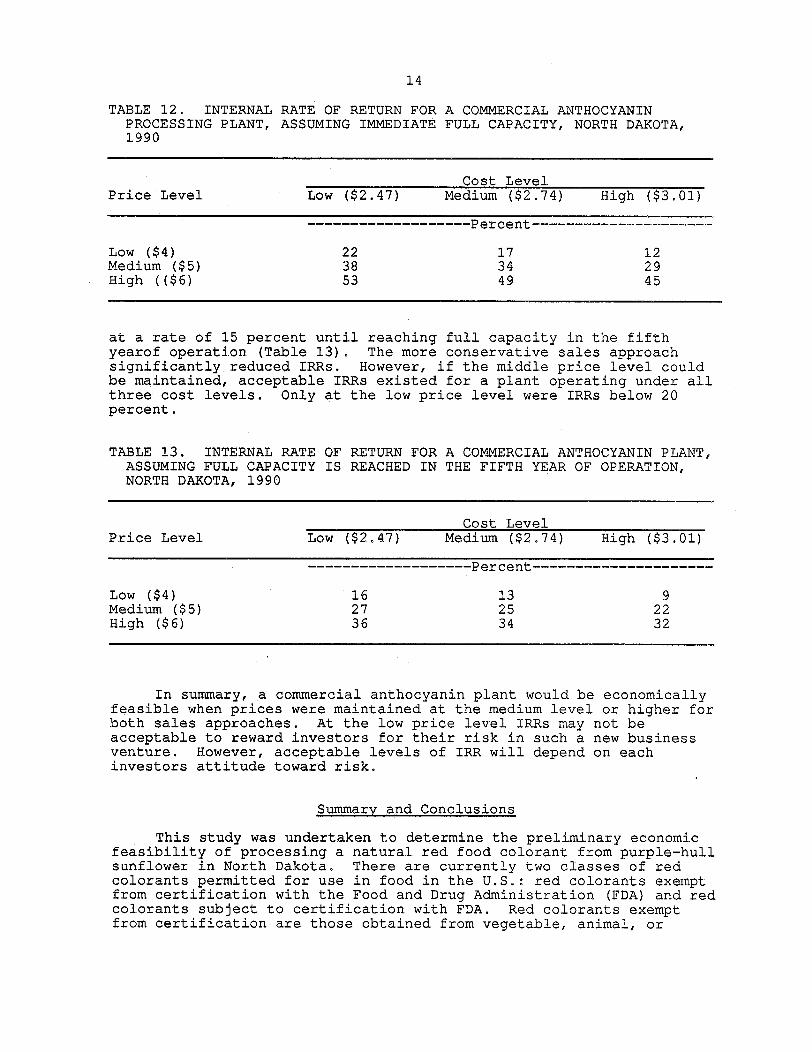
IRRs for a plant reaching full capacity in its first year ofoperation are presented in Table 12. IRRs range between 12 and 53percent. Estimated IRRs are quite acceptable for the medium and highprice level scenarios under all three cost scenarios. IRRs for thelow price level may not be high enough to reward investors for theirrisk in such a new business venture.
The previously estimated IRRs were based on the assumption thatsales volume was constant throughout the planning horizon. This maybe possible if the plant represented a small share of the market.However, in a smaller market with a new product, (such as the naturalred food colorant market) it takes time to develop sales volume. IRRswere estimated for a commercial anthocyanin plant assuming salesvolume was 40 percent of capacity in year one and increased annually
14
TABLE 12. INTERNAL RATE OF RETURN FOR A COMMERCIAL ANTHOCYANINPROCESSING PLANT, ASSUMING IMMEDIATE FULL CAPACITY, NORTH DAKOTA,1990
Cost LevelPrice Level Low ($2.47) Medium ($2.74) High ($3.01)
at a rate of 15 percent until reaching full capacity in the fifthyearof operation (Table 13). The more conservative sales approachsignificantly reduced IRRs. However, if the middle price level couldbe maintained, acceptable IRRs existed for a plant operating under allthree cost levels. Only at the low price level were IRRs below 20percent.
TABLE 13. INTERNAL RATE OF RETURN FOR A COMMERCIAL ANTHOCYANIN PLANT,ASSUMING FULL CAPACITY IS REACHED IN THE FIFTH YEAR OF OPERATION,NORTH DAKOTA, 1990
Cost LevelPrice Level Low ($2.47) Medium ($2.74) High ($3.01)
In summary, a commercial anthocyanin plant would be economicallyfeasible when prices were maintained at the medium level or higher forboth sales approaches. At the low price level IRRs may not beacceptable to reward investors for their risk in such a new businessventure. However, acceptable levels of IRR will depend on eachinvestors attitude toward risk.
Summary and Conclusions
This study was undertaken to determine the preliminary economicfeasibility of processing a natural red food colorant from purple-hullsunflower in North Dakota. There are currently two classes of redcolorants permitted for use in food in the U.S.: red colorants exemptfrom certification with the Food and Drug Administration (FDA) and redcolorants subject to certification with FDA. Red colorants exemptfrom certification are those obtained from vegetable, animal, or
15
mineral sources and commonly referred to as natural red colorants.Red colorants subject to certification are made from highly purifiedpetrochemicals and referred to as synthetic red colorants.
The potential toxicity of synthetic red colorants has increasedthe interest of food processors in natural red colorants. Total useof synthetic red colorants has actually declined from 2.5 millionpounds in 1975 to 2.36 million pounds in 1987. At the same time useof natural red colorants has increased from .23 million pounds in 1975to .7 million pounds in 1987. Currently, natural red colorantscontrol about one-fifth of the red colorant market.
Capital investment and operating costs were estimated, using amethodical economic engineering approach. A model plant was simulatedto process 2,600 pounds of anthocyanin extract per day from purple-hull sunflowers. Annual production, assuming a 300-day year, would be780,000 pounds of anthocyanin extract. Annual domestic and foreignconsumption each is an estimated one million pounds. Thus, ananthocyanin plant of this scale would need to penetrate 40 percent ofeach market.
Purchased equipment cost amounted to $1.52 million and included acontinuous multiple stage extractor, centrifuge, and spray dryer.Physical plant cost totaled $3.82 million and, in addition, topurchased equipment, included equipment installation, buildings withservices, and installation of services. Capital investment includedphysical plant cost, engineering, construction, contractor fees, and acontingency factor and amounted to $5.18 million.
Annual operating costs were $2.14 million or $2.74 per pound ofanthocyanin extract. Average fixed cost was $1.26 per pound.Depreciation, interest on plant investment, and general andadministrative overhead were major fixed costs. Average variable costwas $1.48 per pound. Major variable costs were labor, selling andmarketing, and raw material cost.
The production of anthocyanin extract can be a viable projectonly if it can carry a competitive market price and still beprofitable. An accurate price series for natural red colorants wasunavailable. A market price was derived, using a comparativetinctorial strength analysis, indicating anthocyanin extract couldcarry a market price between $4.68 and $6.36 per pound. Based on thetinctorial analysis, market prices of four, five, and six dollars perpound were used for this study.
Economic profitability was estimated using the internal rate ofreturn (IRR). IRR is usually thought of as the rate of return theplant (investment) earns during the investment's planning horizon.The planning horizon for this plant was assumed to be 15 years.Actual life of the plant may be longer; however, plant obsolescencedue to technological changes in equipment may shorten the useful lifeof the plant. The IRR methodology is superior to other analyticalmethods because it takes the time value of money into considerationand allows incorporation of time lags between initial investment andoperation of the plant at full capacity.
Based on preliminary economic engineering estimates averagevariable costs were $1.48 per pound and average fixed costs were $1.26
16
per pound for an average total cost of $2.74 per pound of extract.Since investment and operating costs for an anthocyanin plant werepreliminary estimates sensitivity analysis was performed to determinethe effect of varying costs on profitability. It was assumed thatcosts may have been under or over estimated by 10 percent. Thus,average total costs used in the IRR analysis were $2.47, $2.74, and$3.01 per pound of extract. The cost estimates and price estimates offour, five, and six dollars were used in calculating IRR. Twoscenarios for sales of anthocyanin were used during the planninghorizon of the plant. The first scenario assumed plant capacity wasreached in the first year or sales volume was constant throughout theplanning horizon, while the second scenario assumed sales volume was40 percent of capacity in the first year and annually increased 15percent until reaching full capacity in the fifth year of operation.
IRRs for a plant reaching full capacity in its first year ofoperation ranged between 12 and 53 percent. Estimated IRRs are quiteacceptable for the medium and high price level scenarios under allthree cost scenarios. IRRs for the low price level may not rewardinvestors for their risk in a new business venture such as producing anatural red food colorant from sunflower hulls.
The more conservative sales approach significantly reduced IRRs.IRRs ranged between 9 and 36 percent. However, if the middle pricelevel could be maintained, acceptable IRRs existed for a plantoperating under all three cost levels. Only at the low price levelwere IRRs below 20 percent.
In summary, a commercial anthocyanin plant would be economicallyfeasible when prices were maintained at the medium level or higher forboth sales approaches. At the low price level IRRs may not beacceptable to reward investors for their risk in such a new businessventure.
APPENDIX A
18
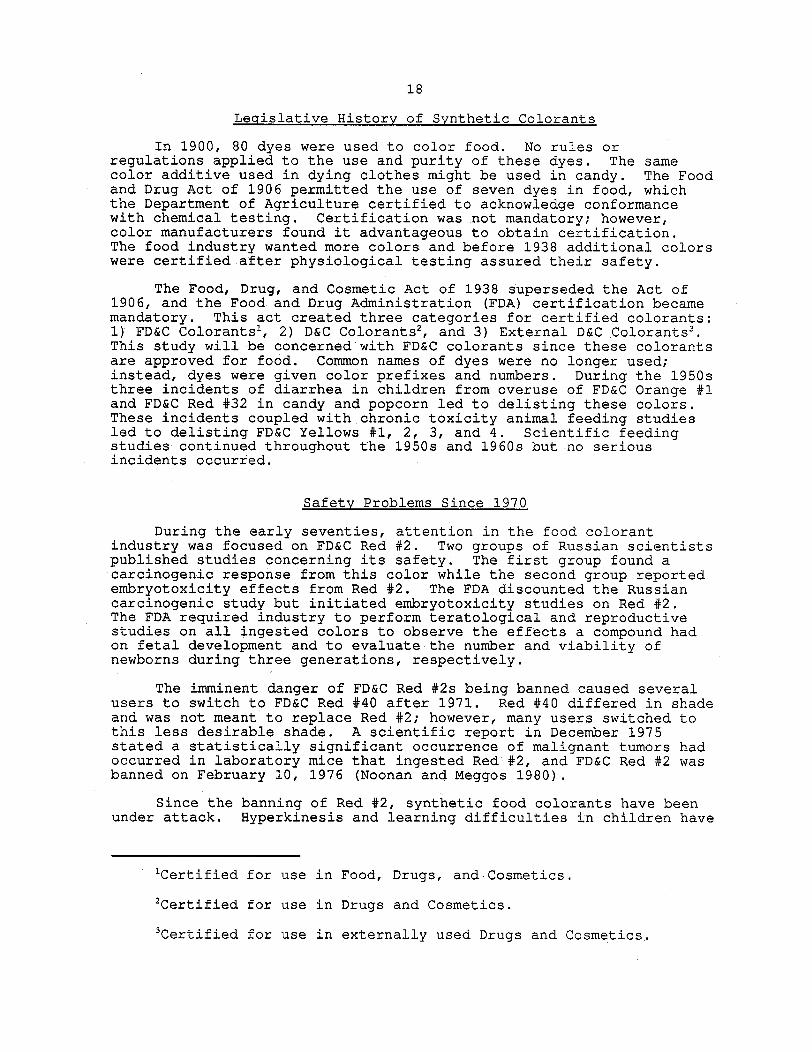
Legislative History of Synthetic Colorants
In 1900, 80 dyes were used to color food. No rules orregulations applied to the use and purity of these dyes. The samecolor additive used in dying clothes might be used in candy. The Foodand Drug Act of 1906 permitted the use of seven dyes in food, whichthe Department of Agriculture certified to acknowledge conformancewith chemical testing. Certification was not mandatory; however,color manufacturers found it advantageous to obtain certification.The food industry wanted more colors and before 1938 additional colorswere certified after physiological testing assured their safety.
The Food, Drug, and Cosmetic Act of 1938 superseded the Act of1906, and the Food and Drug Administration (FDA) certification becamemandatory. This act created three categories for certified colorants:1) FD&C Colorants1 , 2) D&C Colorants 2, and 3) External D&C Colorants3 .This study will be concerned with FD&C colorants since these colorantsare approved for food. Common names of dyes were no longer used;instead, dyes were given color prefixes and numbers. During the 1950sthree incidents of diarrhea in children from overuse of FD&C Orange #1and FD&C Red #32 in candy and popcorn led to delisting these colors.These incidents coupled with chronic toxicity animal feeding studiesled to delisting FD&C Yellows #1, 2, 3, and 4. Scientific feedingstudies continued throughout the 1950s and 1960s but no seriousincidents occurred.
Safety Problems Since 1970
During the early seventies, attention in the food colorantindustry was focused on FD&C Red #2. Two groups of Russian scientistspublished studies concerning its safety. The first group found acarcinogenic response from this color while the second group reportedembryotoxicity effects from Red #2. The FDA discounted the Russiancarcinogenic study but initiated embryotoxicity studies on Red #2.The FDA required industry to perform teratological and reproductivestudies on all ingested colors to observe the effects a compound hadon fetal development and to evaluate the number and viability ofnewborns during three generations, respectively.
The imminent danger of FD&C Red #2s being banned caused severalusers to switch to FD&C Red #40 after 1971. Red #40 differed in shadeand was not meant to replace Red #2; however, many users switched tothis less desirable shade. A scientific report in December 1975stated a statistically significant occurrence of malignant tumors hadoccurred in laboratory mice that ingested Red #2, and FD&C Red #2 wasbanned on February 10, 1976 (Noonan and Meggos 1980).
Since the banning of Red #2, synthetic food colorants have beenunder attack. Hyperkinesis and learning difficulties in children have
ICertified for use in Food, Drugs, and-Cosmetics.
2Certified for use in Drugs and Cosmetics.
3Certified for use in externally used Drugs and Cosmetics.
19
been attributed to synthetic colorants without substantive proof.Potential toxicity in synthetic colorants has renewed interest insources of natural pigments like anthocyanin. Extraction of naturalred colorant from sunflower hulls is justified if ample quantities canbe obtained cheaply.
Market Trends of FD&C Synthetic Red Colorants
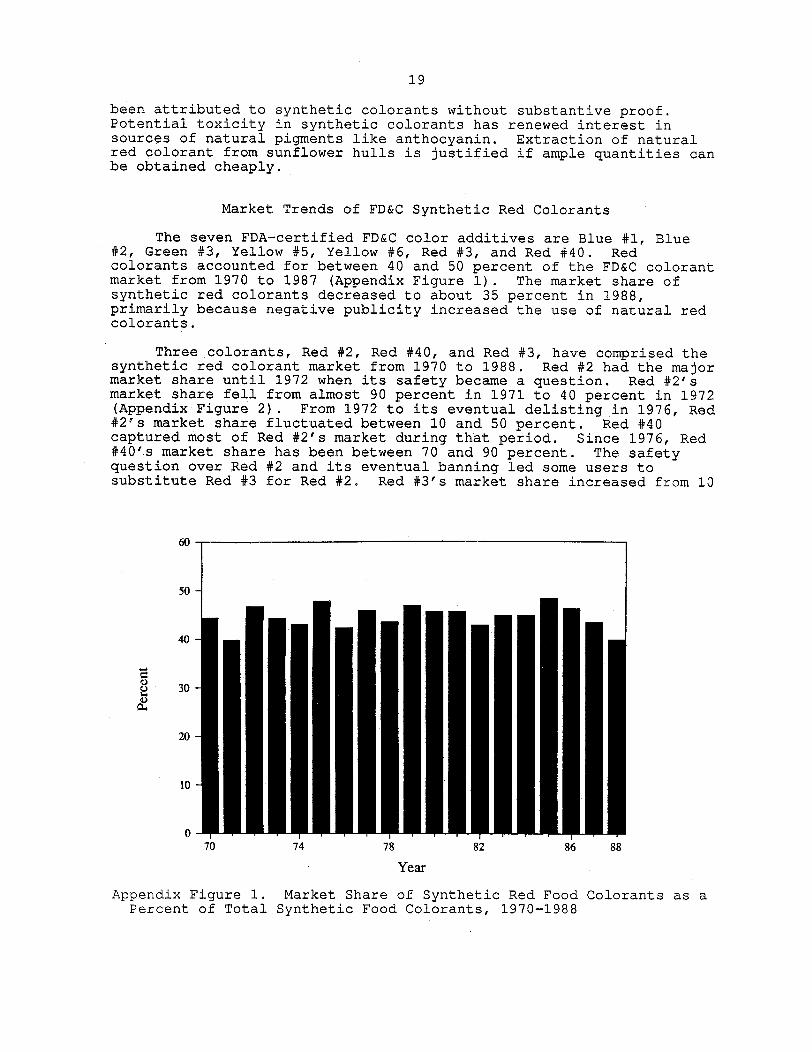
The seven FDA-certified FD&C color additives are Blue #1, Blue#2, Green #3, Yellow #5, Yellow #6, Red #3, and Red #40. Redcolorants accounted for between 40 and 50 percent of the FD&C colorantmarket from 1970 to 1987 (Appendix Figure 1). The market share ofsynthetic red colorants decreased to about 35 percent in 1988,primarily because negative publicity increased the use of natural redcolorants.
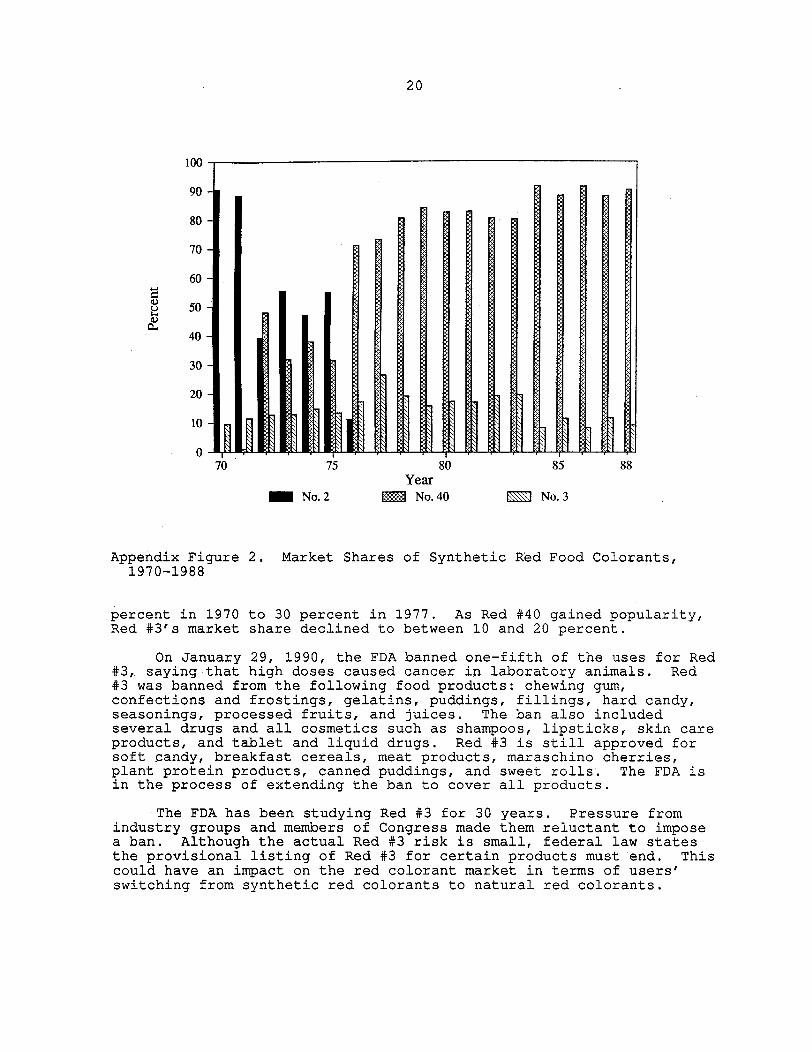
Three colorants, Red #2, Red #40, and Red #3, have comprised thesynthetic red colorant market from 1970 to 1988. Red #2 had the majormarket share until 1972 when its safety became a question. Red #2'smarket share fell from almost 90 percent in 1971 to 40 percent in 1972(Appendix Figure 2). From 1972 to its eventual delisting in 1976, Red#2's market share fluctuated between 10 and 50 percent. Red #40captured most of Red #2's market during that period. Since 1976, Red#40's market share has been between 70 and 90 percent. The safetyquestion over Red #2 and its eventual banning led some users tosubstitute Red #3 for Red #2. Red #3's market share increased from 10
60
50
40
0CI
30
20
10
0
Year
Appendix Figure 1. Market Share of Synthetic Red FoodPercent of Total Synthetic Food Colorants, 1970-1988
Colorants as a
20
100
90
80
70
60
i 50
40
30
20
10
070 75 80 85 88
YearNo. 2 • No. 40 No. 3
Appendix Figure 2. Market Shares of Synthetic Rbd Food Colorants,1970-1988
percent in 1970 to 30 percent in 1977. As Red #40 gained popularity,Red #3's market share declined to between 10 and 20 percent.
On January 29, 1990, the FDA banned one-fifth of the uses for Red#3, saying that high doses caused cancer in laboratory animals. Red#3 was banned from the following food products: chewing gum,confections and frostings, gelatins, puddings, fillings, hard candy,seasonings, processed fruits, and juices. The ban also includedseveral drugs and all cosmetics such as shampoos, lipsticks, skin careproducts, and tablet and liquid drugs. Red #3 is still approved forsoft candy, breakfast cereals, meat products, maraschino cherries,plant protein products, canned puddings, and sweet rolls. The FDA isin the process of extending the ban to cover all products.
The FDA has been studying Red #3 for 30 years. Pressure fromindustry groups and members of Congress made them reluctant to imposea ban. Although the actual Red #3 risk is small, federal law statesthe provisional listing of Red #3 for certain products must end. Thiscould have an impact on the red colorant market in terms of users'switching from synthetic red colorants to natural red colorants.
--
21
Use of Synthetic Red Colorants
Colorants are used in minute or micro quantities for food, drugs,and cosmetics. Only vitamins and flavorings approach these lowlevels. Colored foods contain 0.005 to 0.03 percent certified colorby weight. FDA-certified colors are used in such products asbeverages, dairy products, candy, bakery products, puddings andfillings, confections, cereals and pet foods. Beverages such asjuices, carbonated drinks, and powdered drinks constitute one of thelargest users of certified red colorants.
Color formulas and amounts for various flavored soft drinks arelisted in Appendix Table 1. Red #40 and Red #3 are used extensivelyto color beverages. Per capita consumption of Red #2, #3, and #40from 1950 to 1988 are provided in Appendix Table 2. Red #2 was bannedin 1976, so no consumption data appear for this colorant from 1977 to1988. Total consumption of synthetic red colorants dropped 38 percentfrom 1975 to 1988. Total per capita consumption increased from 1.26grams in 1950 to 5.27 grams in 1975, fluctuating greatly ever since.
Consumption of Red #3 has increased from 0.06 grams in 1950 to apeak of 1.13 grams in 1977 when food processors were substituting itfor Red #2. From 1977 to 1984, consumption of Red #3 decreased 60percent to 0.46 grams as Red #40 use increased. Since 1984,
FD&C Blue #1 5.0Lemon FD&C Yellow #5 100.0 20Cola Caramel color 100.0 400Root beer Caramel color 100.0 400
SOURCE: Noonan and Meggos, 1980.consumption of Red #3 hasincreased to 0.73 grams.
Since its introduction, Red #40 has increased from 1.94 grams in 1972to 5.05 grams in 1984 (Appendix Table 2). From 1984 to 1988,consumption of Red #40 has fluctuated greatly, dropping to 2.55 gramsin 1988, the lowest level since 1975 (Appendix Table 2).
The decreased consumption of synthetic red colorants is due tothe concern over their carcinogenic effects. Society has become more
22
APPENDIX TABLE 2. PER CAPITA CONSUMPTION OF SYNTHETIC REDCOLORANTS, UNITED STATES, 1950-1988
health conscious and more concerned with food safety. The news mediaand consumer activists have informed consumers about the possiblehealth risks of consuming synthetic colorants, increasing the use and
- --
23
popularity of natural colorants derived from plant or vegetablematter.
Regression Analysis
Historical per capita consumption of synthetic red colorants ispresented in Appendix Figure 3, which provides an actual andregression estimate (trend line) of per capita consumption. Totalconsumption of synthetic red colorants includes Red #40, Red #3, andRed #2 from 1950 to 1976 and Red #40 and Red #3 from 1977 to 1988.The trend line in Figure 5 was derived, using the following regressionequation:
PCAPT =ci LT (1)
where:
PCAPT =Total per capita consumption of synthetic red colorants,1950 to 1988
T =Time
LT =The natural log of T
6
5
U
0dEi3
2
0
Year
Appendix Figure 3. TotSynthetic Red Food
Colorants, 1950-1988
tal Per Capita Consumption of
SOURCE: Certified Color Manufacturer's Inc. and Equation 1.
24
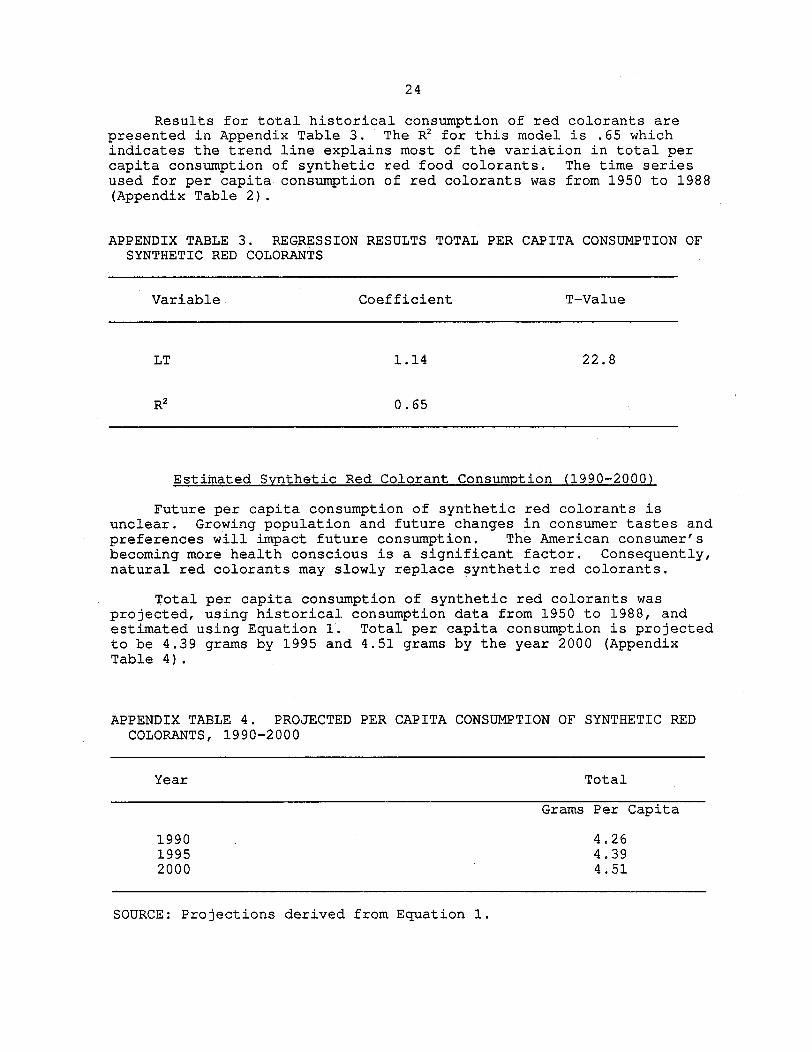
Results for total historical consumption of red colorants arepresented in Appendix Table 3. The R2 for this model is .65 whichindicates the trend line explains most of the variation in total percapita consumption of synthetic red food colorants. The time seriesused for per capita consumption of red colorants was from 1950 to 1988(Appendix Table 2).
APPENDIX TABLE 3. REGRESSION RESULTS TOTAL PER CAPITA CONSUMPTION OFSYNTHETIC RED COLORANTS
Variable Coefficient T-Value
LT 1.14 22.8
R2 0.65
Estimated Synthetic Red Colorant Consumption (1990-2000)
Future per capita consumption of synthetic red colorants isunclear. Growing population and future changes in consumer tastes andpreferences will impact future consumption. The American consumer'sbecoming more health conscious is a significant factor. Consequently,natural red colorants may slowly replace synthetic red colorants.
Total per capita consumption of synthetic red colorants wasprojected, using historical consumption data from 1950 to 1988, andestimated using Equation 1. Total per capita consumption is projectedto be 4.39 grams by 1995 and 4.51 grams by the year 2000 (AppendixTable 4).
APPENDIX TABLE 4. PROJECTED PER CAPITA CONSUMPTION OF SYNTHETIC REDCOLORANTS, 1990-2000
Year Total
Grams Per Capita
1990 4.261995 4.392000 4.51
SOURCE: Projections derived from Equation 1.
25
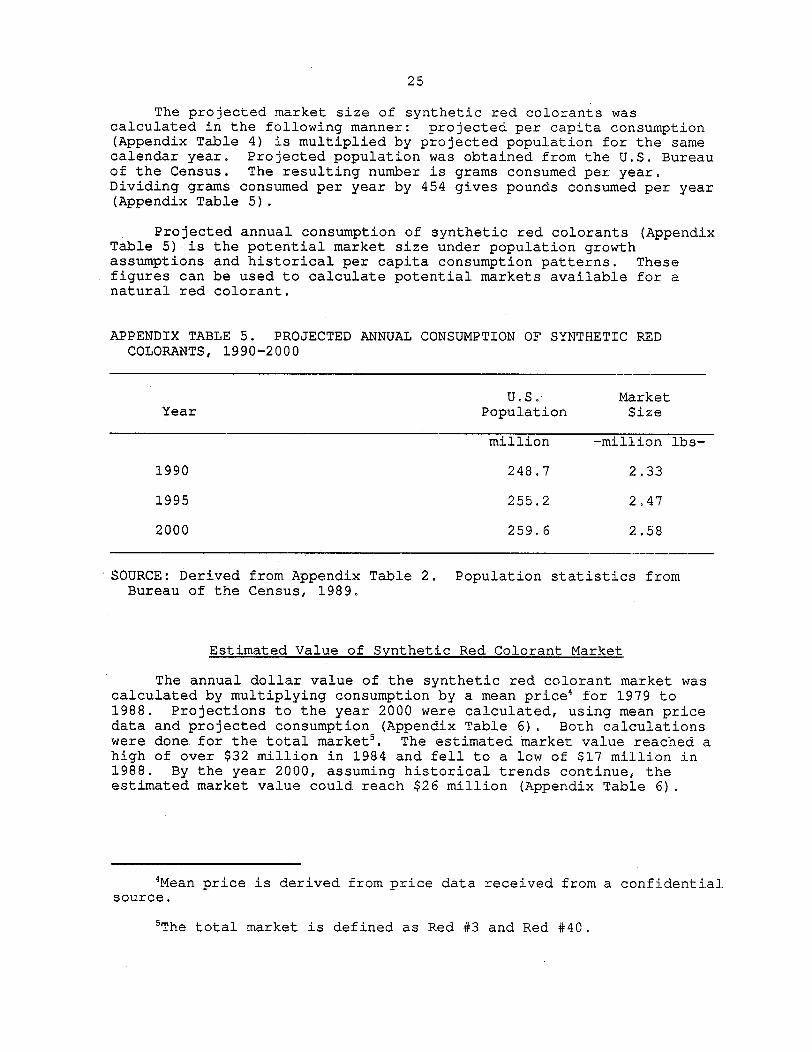
The projected market size of synthetic red colorants wascalculated in the following manner: projected per capita consumption(Appendix Table 4) is multiplied by projected population for the samecalendar year. Projected population was obtained from the U.S. Bureauof the Census. The resulting number is grams consumed per year.Dividing grams consumed per year by 454 gives pounds consumed per year(Appendix Table 5).
Projected annual consumption of synthetic red colorants (AppendixTable 5) is the potential market size under population growthassumptions and historical per capita consumption patterns. Thesefigures can be used to calculate potential markets available for anatural red colorant.
APPENDIX TABLE 5. PROJECTED ANNUAL CONSUMPTION OF SYNTHETIC REDCOLORANTS, 1990-2000
U.S. MarketYear Population Size
million -million lbs-
1990 248.7 2.33
1995 255.2 2.47
2000 259.6 2.58
SOURCE: Derived from Appendix Table 2. Population statistics fromBureau of the Census, 1989.
Estimated Value of Synthetic Red Colorant Market
The annual dollar value of the synthetic red colorant market wascalculated by multiplying consumption by a mean price4 for 1979 to1988. Projections to the year 2000 were calculated, using mean pricedata and projected consumption (Appendix Table 6). Both calculationswere done for the total market5 . The estimated market value reached ahigh of over $32 million in 1984 and fell to a low of $17 million in1988. By the year 2000, assuming historical trends continue, theestimated market value could reach $26 million (Appendix Table 6).
4Mean price is derived from price data received from a confidentialsource.
5The total market is defined as Red #3 and Red #40.
26
APPENDIX TABLE 6. VALUE OF SYNTHETIC RED COLORANT MARKET, 1979-2000
Year Value
1979 $21,527,527
1980 NA
1981 $24,150,993
1982 $24,785,449
1983 $27,728,716
1984 $32,183,524
1985 $25,562,889
1986 $29,228,704
1987 $22,329,411
1988 $17,310,041
1990a $23,577,147
1995a $25,145,457
2000a $26,257,402
aProjections: calculated by multiplying projected consumption bymean price which is derived from price data received from aconfidential source.
SOURCE: Projections from Appendix Table 5 and price data from aconfidential source.
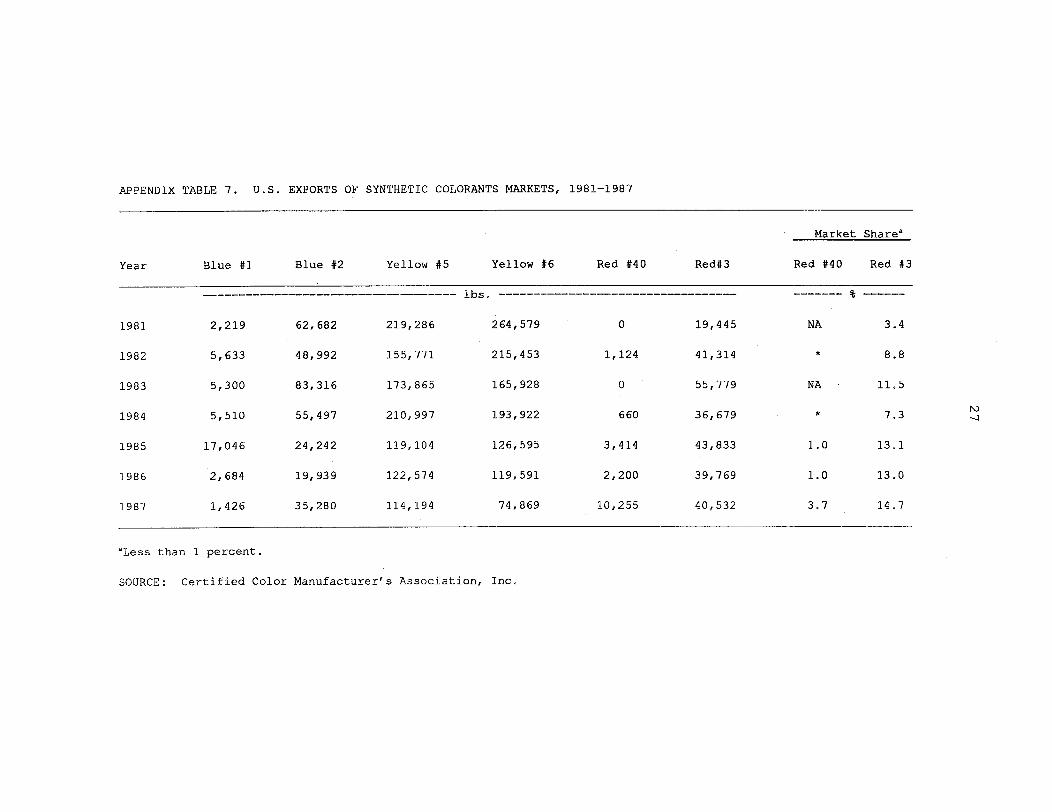
Exports of Synthetic Colorants
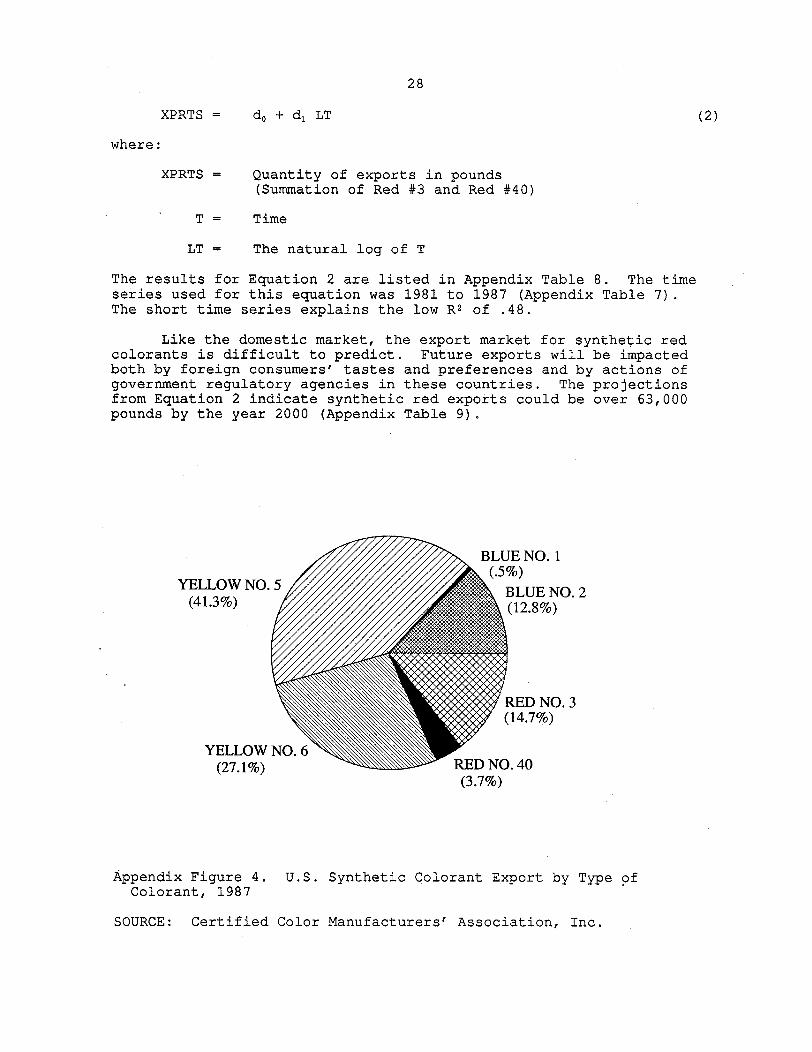
Total exports of synthetic colorants were less than 300,000pounds in 1987 (Appendix Table 7). In 1987, synthetic yellowcolorants were almost 70 percent of U.S. synthetic colorant exports(Appendix Figure 4). Synthetic red colorants were 18 percent ofsynthetic colorant exports in 1987. The export market share for Red#3 and Red #40 steadily grew from 1981 to 1987 with Red #3's being 80percent of synthetic red colorant exports in 1987.
Projections of Synthetic Red Exports
The time series for synthetic red exports is from 1981 to 1987.Due to the short time series, attaining an accurate forecast ofexports is difficult. A logarithmic time function was used to projectthe amount of exports to the year 2000. This is the same methodologyused to forecast the domestic market size. The equation is asfollows:
APPENDIX TABLE 7. U.S. EXPORTS OF SYNTHETIC COLORANTS MARKETS, 1981-1987
Market Sharea
Year Blue #1 Blue #2 Yellow #5 Yellow #6 Red #40 Red#3 Red #40 Red #3
SOURCE: Certified Color Manufacturer's Association, Inc.
N)-1
28
XPRTS = do + di LT (2)
where:
XPRTS = Quantity of exports in pounds(Summation of Red #3 and Red #40)
T = Time
LT = The natural log of T
The results for Equation 2 are listed in Appendix Table 8. The timeseries used for this equation was 1981 to 1987 (Appendix Table 7).The short time series explains the low R2 of .48.
Like the domestic market, the export market for synthetic redcolorants is difficult to predict. Future exports will be impactedboth by foreign consumers' tastes and preferences and by actions ofgovernment regulatory agencies in these countries. The projectionsfrom Equation 2 indicate synthetic red exports could be over 63,000pounds by the year 2000 (Appendix Table 9).
YELLOW NO(41.3%)
YELLOW(27 1 %
ENO. 170)
3LUE NO. 2:12.8%)
UED NO. 314.7%)
.40(3.7%)
Appendix Figure 4.Colorant, 1987
U.S. Synthetic Colorant Export by Type of
SOURCE: Certified Color Manufacturers' Association, Inc.
29
APPENDIX TABLE 8. REGRESSION RESULTS FOR THE EXPORT MODEL,1981-1987
Variable Coefficient T-Value
C 27,754 3.65
LT 11,814 2.13
R2 0.48
APPENDIX TABLE 9. PROJECTED EXPORTS OF SYNTHETIC RED COLORANTS,1990, 1995, AND 2000
Year Exports
-Ibs-
1990 54,957
1995 59,747
2000 63,146
30
References
Bureau of the Census. 1989. United States Department of Commerce.Washington, D.C.
Certified Color Manufacturer's Association, Inc. 1988. Washington,D.C.
Hettiarachchy, Navam. 1990. Personal communication. Fargo: NorthDakota State University, Department of Cereal Science and FoodTechnology.
Johnson, Roger G., Mir B. Ali, David M. Saxowsky, and Randall D.Little. 1986. "Cost of Producing Farm Commodities in NorthDakota." Agricultural Economics Miscellaneous Report No. 90.Fargo: North Dakota State University, Department of AgriculturalEconomics.
Kinnison, Jerry. 1990. Personal communication. St. Louis, MO:Warner Jenkinson Company.
National Agricultural Statistics Service. North Dakota AgriculturalStatistics Annual Bulletin, various issues.
Newsome, Rosetta L. 1990. "Natural and Synthetic Coloring Agents,"Food Additives (Chap. 9). New York: Marcel Dekker, Inc.
Noonan, James E., and Harry Meggos. 1980. "Handbook of FoodAdditives," 2nd edition, Vol. 2. The Chemical Rubber Co.,Cleveland, OH.
North Dakota Tax Department. 1987.
Northern States Power. 1991. Personal Communication. Fargo, ND.
Peters, and Timmerhaus. 1980. Plant Design and Economics forChemical Engineers. 3rd Edition, New York: McGraw-Hill BookCompany
U.S. Department of Commerce. 1990. Survey of Current Business.Washington, D.C.
Wiersma, Mary. 1990. Personal communication. Agri-geneticsCorporation.
Wiesenborn, Dennis. 1990. Personal communication. Fargo: NorthDakota State University, Department of Agricultural Engineering.