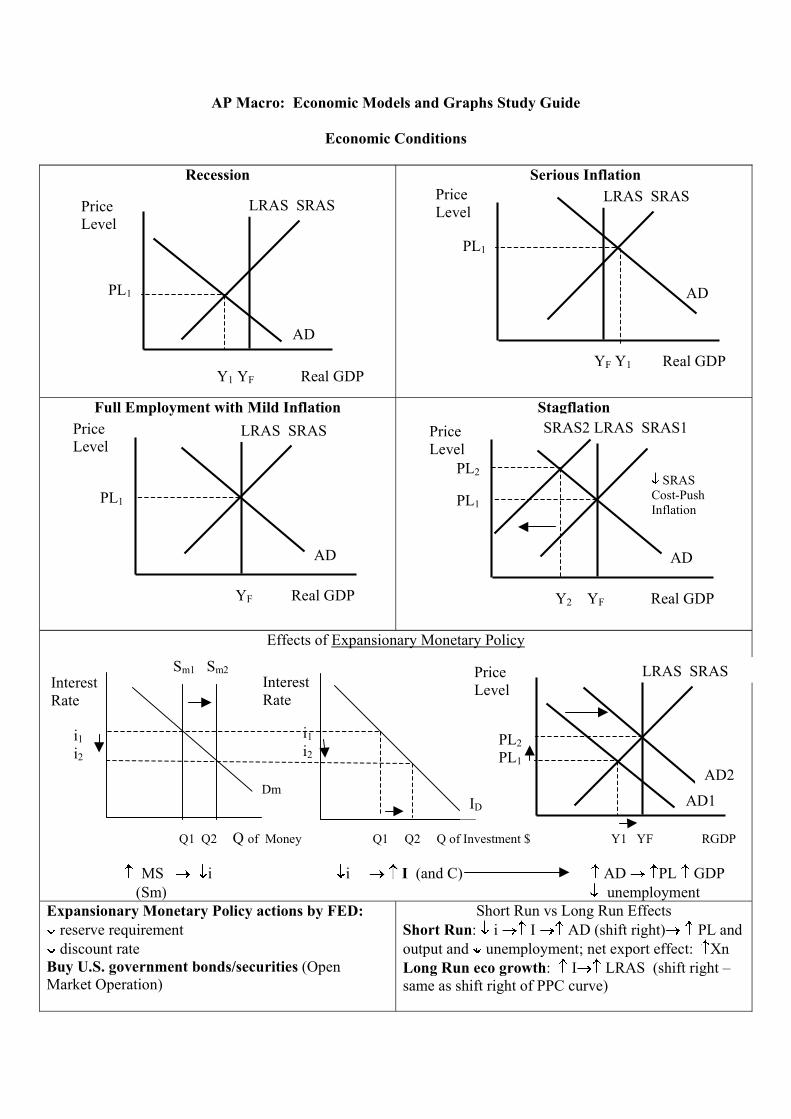
AP Macro: Economic Models and Graphs Study Guide Economic Conditions Recession Serious Inflation Full Employment with Mild Inflation Stagflation Effects of Expansionary Monetary Policy MS i i I (and C) AD PL GDP (Sm) unemployment Expansionary Monetary Policy actions by FED: reserve requirement discount rate Buy U.S. government bonds/securities (Open Market Operation) Short Run vs Long Run Effects Short Run: i I AD (shift right) PL and output and unemployment; net export effect: Xn Long Run eco growth: I LRAS (shift right same as shift right of PPC curve) AD LRAS SRAS Y F Y 1 Real GDP Price Level PL 1 LRAS SRAS AD Y 1 Y F Real GDP Price Level PL 1 PL 2 AD PL 1 SRAS2 LRAS SRAS1 SRAS Cost-Push Inflation Price Level AD PL 1 LRAS SRAS Price Level Y F Real GDP Y 2 Y F Real GDP i 1 i 2 Interest Rate Interest Rate PL 2 PL 1 Price Level AD2 AD1 LRAS SRAS Dm I D Q1 Q2 Q of Money Q1 Q2 Q of Investment $ Y1 YF RGDP i 1 i 2 S m1 S m2
Transcript
AP Macro: Economic Models and Graphs Study Guide
Economic Conditions
Recession Serious Inflation
Full Employment with Mild Inflation Stagflation
Effects of Expansionary Monetary Policy
MS i i I (and C) AD PL GDP(Sm) unemployment
Expansionary Monetary Policy actions by FED:reserve requirementdiscount rate
Buy U.S. government bonds/securities (OpenMarket Operation)
Short Run vs Long Run EffectsShort Run: i I AD (shift right) PL andoutput and unemployment; net export effect: XnLong Run eco growth: I LRAS (shift right � same as shift right of PPC curve)
AD
LRAS SRAS
YF Y1 Real GDP
PriceLevel
PL1
LRAS SRAS
AD
Y1 YF Real GDP
PriceLevel
PL1
PL2
AD
PL1
SRAS2 LRAS SRAS1
SRASCost-PushInflation
PriceLevel
AD
PL1
LRAS SRASPriceLevel
YF Real GDP Y2 YF Real GDP
i1
i2
InterestRate
InterestRate
PL2
PL1
PriceLevel
AD2
AD1
LRAS SRAS
DmID
Q1 Q2 Q of Money Q1 Q2 Q of Investment $ Y1 YF RGDP
i1
i2
Sm1 Sm2
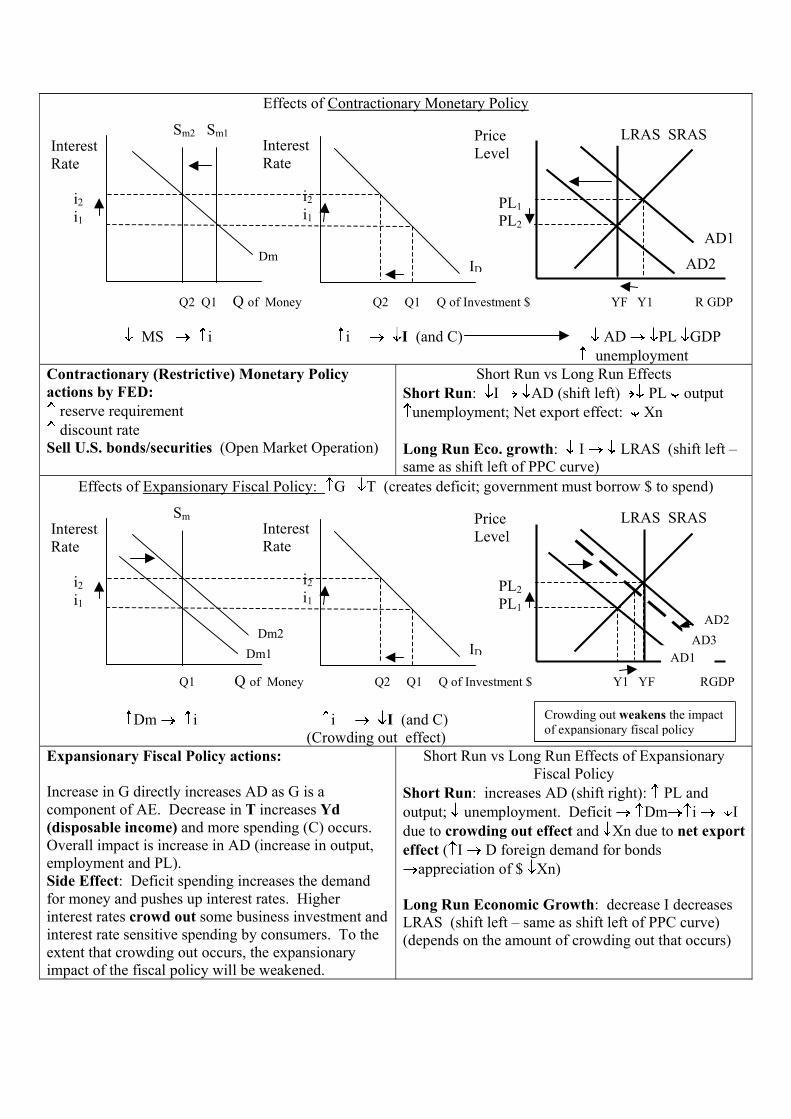
Effects of Contractionary Monetary Policy
MS i i I (and C) AD PL GDPunemployment
Contractionary (Restrictive) Monetary Policyactions by FED:
reserve requirementdiscount rate
Sell U.S. bonds/securities (Open Market Operation)
Short Run vs Long Run EffectsShort Run: I AD (shift left) PL output
unemployment; Net export effect: Xn
Long Run Eco. growth: I LRAS (shift left � same as shift left of PPC curve)
Effects of Expansionary Fiscal Policy: G T (creates deficit; government must borrow $ to spend)
Dm i i I (and C)(Crowding out effect)
Expansionary Fiscal Policy actions:
Increase in G directly increases AD as G is acomponent of AE. Decrease in T increases Yd(disposable income) and more spending (C) occurs.Overall impact is increase in AD (increase in output,employment and PL).Side Effect: Deficit spending increases the demandfor money and pushes up interest rates. Higherinterest rates crowd out some business investment andinterest rate sensitive spending by consumers. To theextent that crowding out occurs, the expansionaryimpact of the fiscal policy will be weakened.
Short Run vs Long Run Effects of ExpansionaryFiscal Policy
Short Run: increases AD (shift right): PL andoutput; unemployment. Deficit Dm i Idue to crowding out effect and Xn due to net exporteffect ( I D foreign demand for bonds
appreciation of $ Xn)
Long Run Economic Growth: decrease I decreasesLRAS (shift left � same as shift left of PPC curve)(depends on the amount of crowding out that occurs)
Dm
i2
i1
InterestRate
InterestRate
PL1
PL2
PriceLevel
AD2
LRAS SRAS
i2
i1
Q2 Q1 Q of Money Q2 Q1 Q of Investment $ YF Y1 R GDP
ID
AD1
Sm2 Sm1
Dm1
i2
i1
InterestRate
InterestRate
PL2
PL1
PriceLevel
AD1
AD2
AD3
LRAS SRAS
Dm2
ID
Q1 Q of Money Q2 Q1 Q of Investment $ Y1 YF RGDP
i2
i1
Sm
Crowding out weakens the impactof expansionary fiscal policy
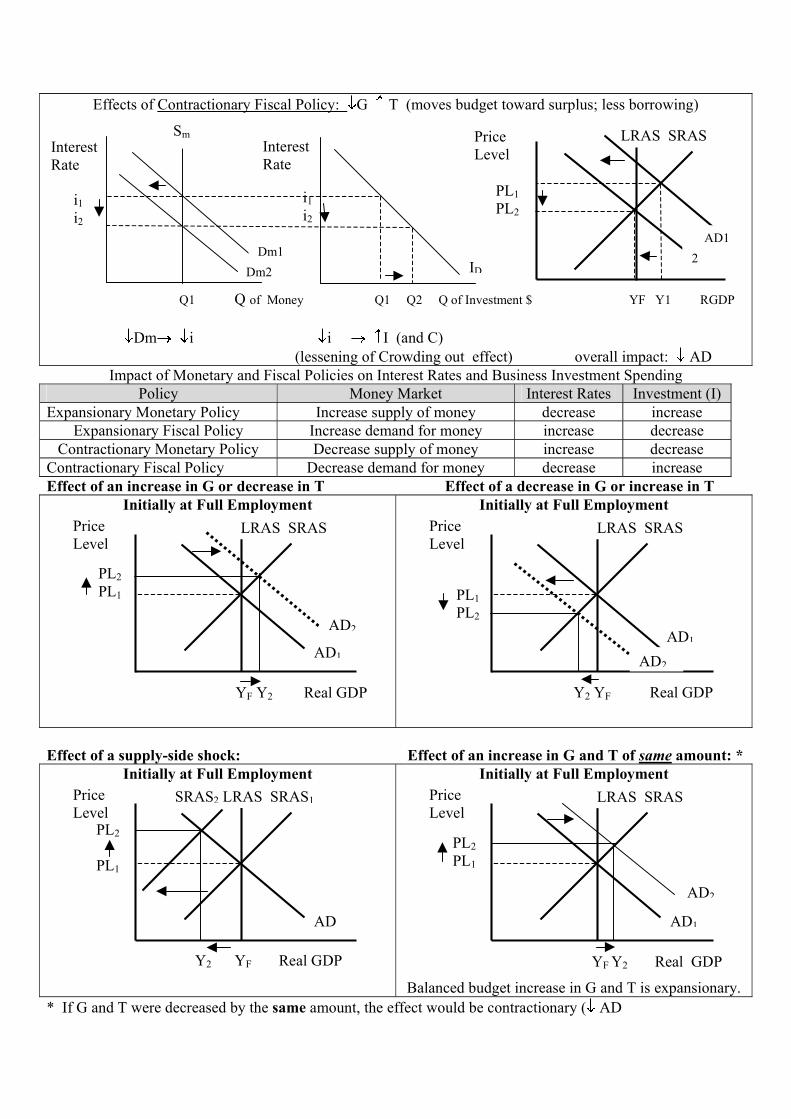
Effects of Contractionary Fiscal Policy: G T (moves budget toward surplus; less borrowing)
Dm i i I (and C)(lessening of Crowding out effect) overall impact: AD
Dm2
i1
i2
InterestRate
InterestRate
PL1
PL2
Q1 Q of Money Q1 Q2 Q of Investment $ YF Y1 RGDP
LRAS SRAS
AD1
2
PriceLevel
ID
Dm1
i1
i2
Sm
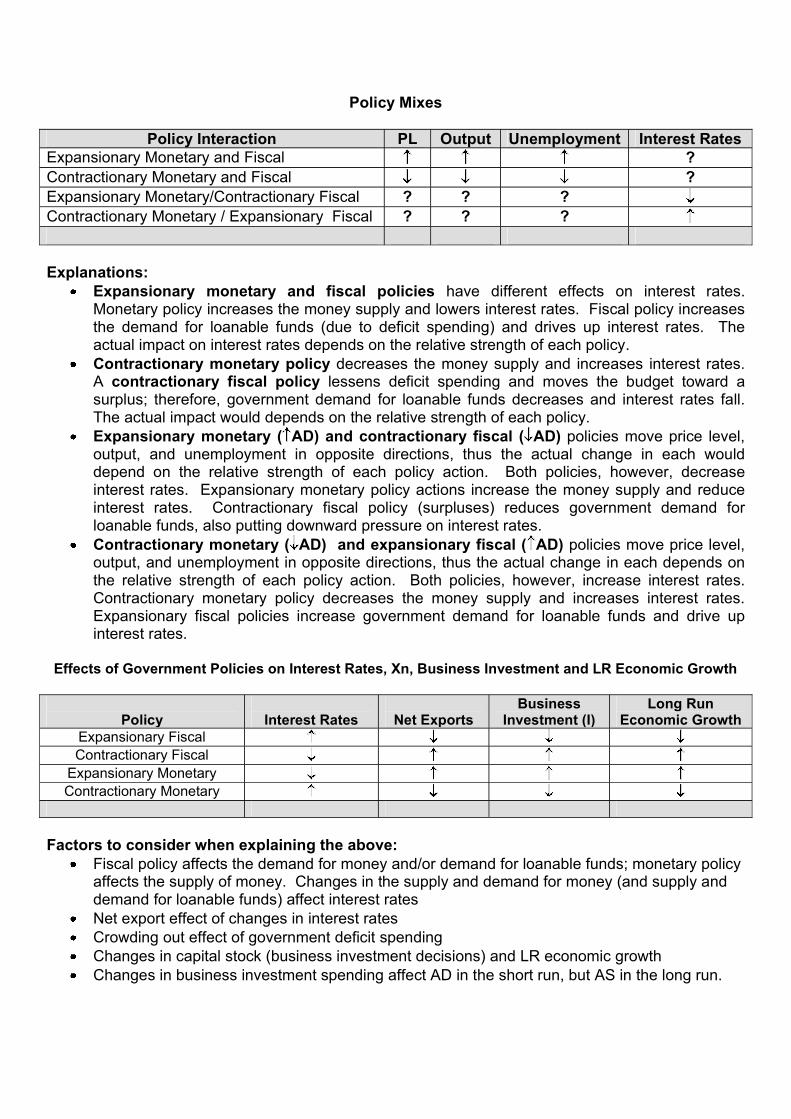
Impact of Monetary and Fiscal Policies on Interest Rates and Business Investment SpendingPolicy Money Market Interest Rates Investment (I)
Expansionary Monetary Policy Increase supply of money decrease increaseExpansionary Fiscal Policy Increase demand for money increase decrease
Contractionary Monetary Policy Decrease supply of money increase decreaseContractionary Fiscal Policy Decrease demand for money decrease increaseEffect of an increase in G or decrease in T Effect of a decrease in G or increase in T
Initially at Full Employment Initially at Full Employment
AD1
PL2
PL1
PriceLevel
YF Y2 Real GDP
LRAS SRAS
AD1
PL1
PL2
PriceLevel
Y2 YF Real GDP
LRAS SRAS
AD2
AD2
Effect of a supply-side shock: Effect of an increase in G and T of same amount: *Initially at Full Employment Initially at Full Employment
Balanced budget increase in G and T is expansionary.
AD
PL2
PL1
Y2 YF Real GDP
PriceLevel
SRAS2 LRAS SRAS1
AD1
PL2
PL1
PriceLevel
YF Y2 Real GDP
LRAS SRAS
AD2
* If G and T were decreased by the same amount, the effect would be contractionary ( AD
1
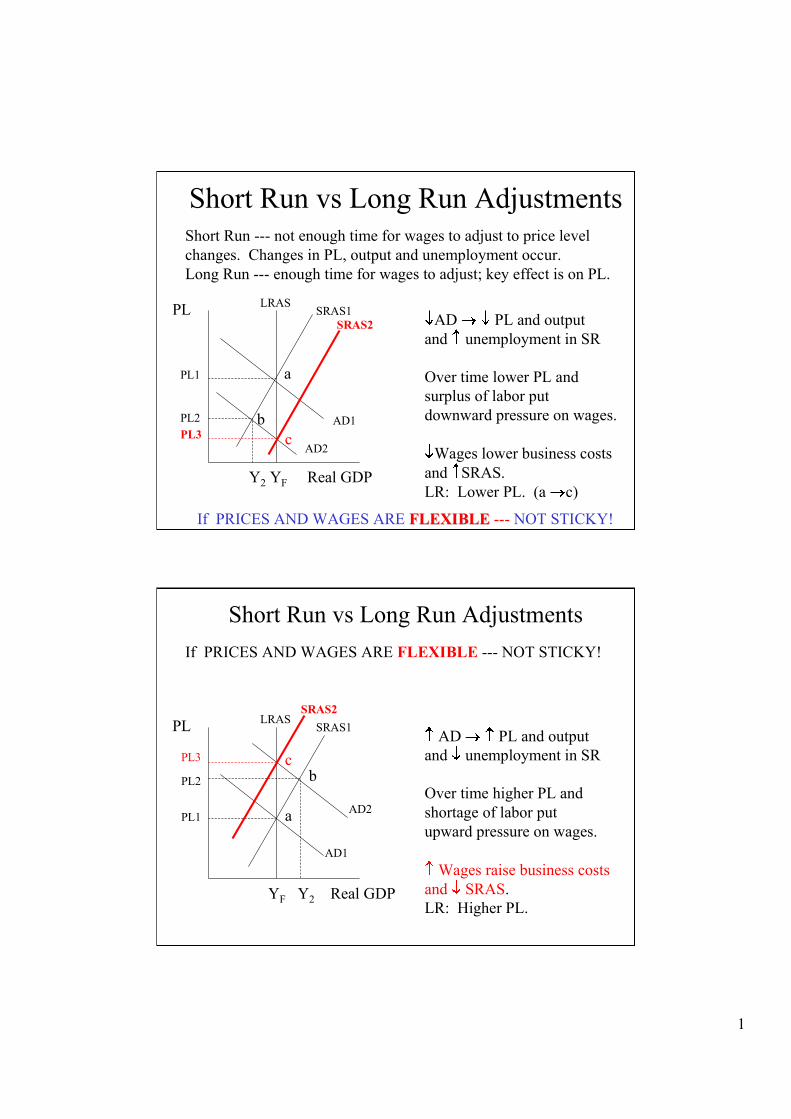
Short Run vs Long Run AdjustmentsShort Run --- not enough time for wages to adjust to price levelchanges. Changes in PL, output and unemployment occur.Long Run --- enough time for wages to adjust; key effect is on PL.
PL LRASSRAS1
AD1
Y2 YF Real GDP
PL1
PL2
AD2
AD PL and outputand unemployment in SR
Over time lower PL andsurplus of labor putdownward pressure on wages.
Wages lower business costsand SRAS.LR: Lower PL. (a c)
a
b
If PRICES AND WAGES ARE FLEXIBLEFLEXIBLE --- NOT STICKY!
c
SRAS2
PL3
Short Run vs Long Run Adjustments
If PRICES AND WAGES ARE FLEXIBLE --- NOT STICKY!
PL LRASSRAS1
AD1
YF Y2 Real GDP
PL1AD2
AD PL and outputand unemployment in SR
Over time higher PL andshortage of labor putupward pressure on wages.
Wages raise business costsand SRAS.LR: Higher PL.
a
bPL2
SRAS2
cPL3
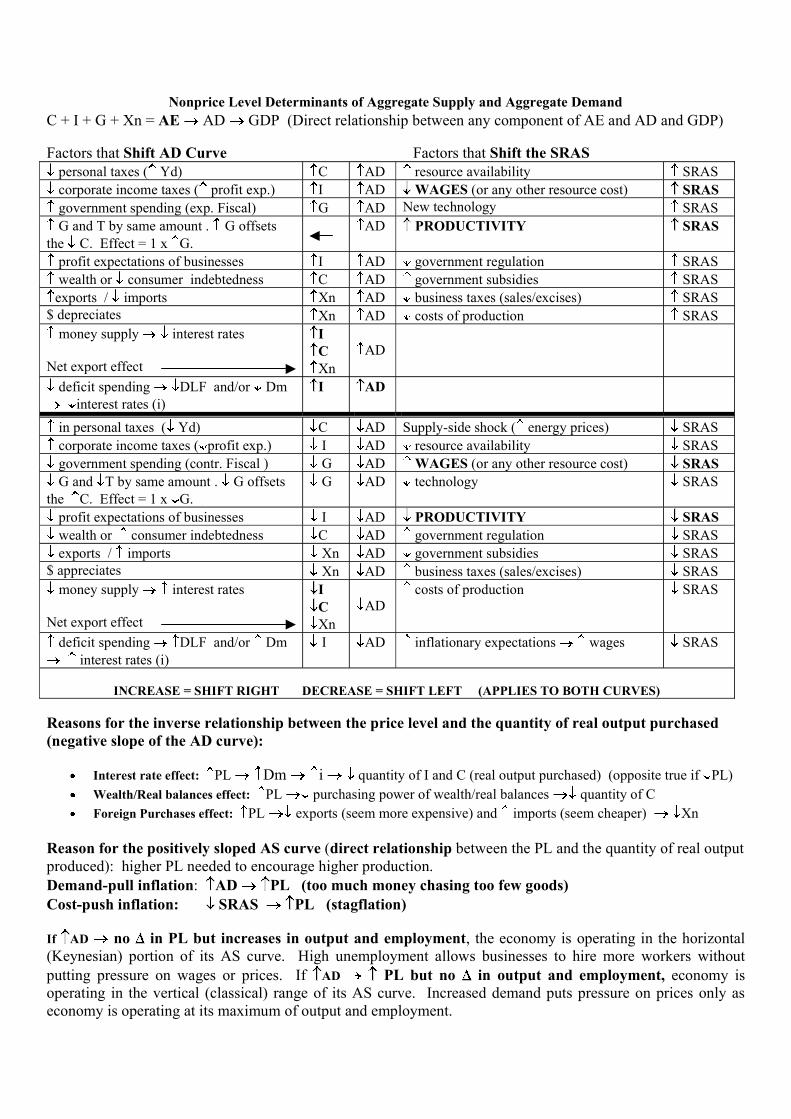
Nonprice Level Determinants of Aggregate Supply and Aggregate Demand
C + I + G + Xn = AE AD GDP (Direct relationship between any component of AE and AD and GDP)
Factors that Shift AD Curve Factors that Shift the SRASpersonal taxes ( Yd) C AD resource availability SRAS
corporate income taxes ( profit exp.) I AD WAGES (or any other resource cost) SRAS
government spending (exp. Fiscal) G AD New technology SRAS
G and T by same amount . G offsetsthe C. Effect = 1 x G.
AD PRODUCTIVITY SRAS
profit expectations of businesses I AD government regulation SRAS
wealth or consumer indebtedness C AD government subsidies SRAS
exports / imports Xn AD business taxes (sales/excises) SRAS$ depreciates Xn AD costs of production SRAS
money supply interest rates
Net export effect
ICXn
AD
deficit spending DLF and/or Dminterest rates (i)
I AD
in personal taxes ( Yd) C AD Supply-side shock ( energy prices) SRAS
corporate income taxes ( profit exp.) I AD resource availability SRAS
government spending (contr. Fiscal ) G AD WAGES (or any other resource cost) SRAS
G and T by same amount . G offsetsthe C. Effect = 1 x G.
G AD technology SRAS
profit expectations of businesses I AD PRODUCTIVITY SRAS
wealth or consumer indebtedness C AD government regulation SRAS
exports / imports Xn AD government subsidies SRAS$ appreciates Xn AD business taxes (sales/excises) SRAS
money supply interest rates
Net export effect
ICXn
ADcosts of production SRAS
deficit spending DLF and/or Dminterest rates (i)
I AD inflationary expectations wages SRAS
INCREASE = SHIFT RIGHT DECREASE = SHIFT LEFT (APPLIES TO BOTH CURVES)
Reasons for the inverse relationship between the price level and the quantity of real output purchased(negative slope of the AD curve):
Interest rate effect: PL Dm i quantity of I and C (real output purchased) (opposite true if PL)
Wealth/Real balances effect: PL purchasing power of wealth/real balances quantity of C
Foreign Purchases effect: PL exports (seem more expensive) and imports (seem cheaper) Xn
Reason for the positively sloped AS curve (direct relationship between the PL and the quantity of real outputproduced): higher PL needed to encourage higher production.Demand-pull inflation: AD PL (too much money chasing too few goods)Cost-push inflation: SRAS PL (stagflation)
If AD no in PL but increases in output and employment, the economy is operating in the horizontal(Keynesian) portion of its AS curve. High unemployment allows businesses to hire more workers withoutputting pressure on wages or prices. If AD PL but no in output and employment, economy isoperating in the vertical (classical) range of its AS curve. Increased demand puts pressure on prices only aseconomy is operating at its maximum of output and employment.
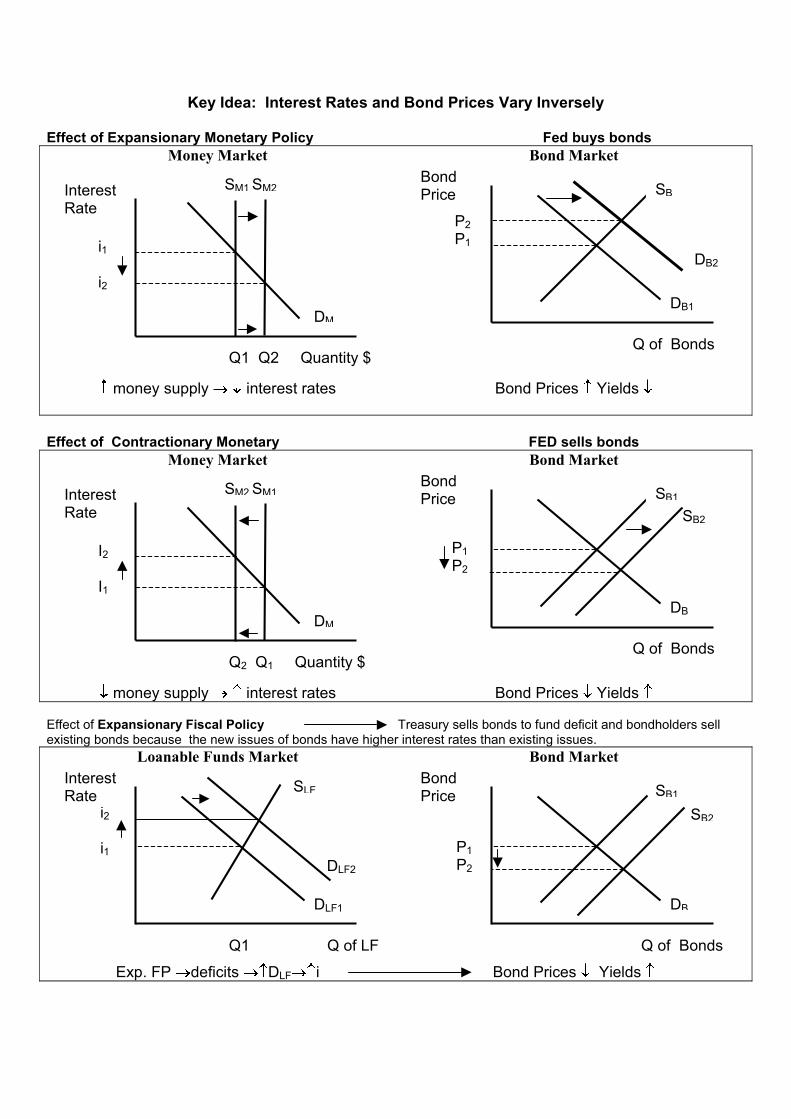
Key Idea: Interest Rates and Bond Prices Vary Inversely
Effect of Expansionary Monetary Policy Fed buys bonds
Money Market
money supply interest rates
Bond Market
Bond Prices Yields
Effect of Contractionary Monetary FED sells bonds
Money Market
money supply interest rates
Bond Market
Bond Prices Yields
SB2
DB1
P2
P1
BondPrice
Q of Bonds
SB
DB
P1
P2
SB1
DB2
BondPrice
SM1 SM2
Q1 Q2 Quantity $
InterestRate
i1
i2
DM
DM
I2
I1
SM2 SM1InterestRate
Q of BondsQ2 Q1 Quantity $
Effect of Expansionary Fiscal Policy Treasury sells bonds to fund deficit and bondholders sellexisting bonds because the new issues of bonds have higher interest rates than existing issues.
Loanable Funds Market
Exp. FP deficits DLF i
Bond Market
Bond Prices Yields
DLF2
DLF1
i2
i1
InterestRate
SLF SB1
SB2
DB
P1
P2
BondPrice
Q1 Q of LF Q of Bonds
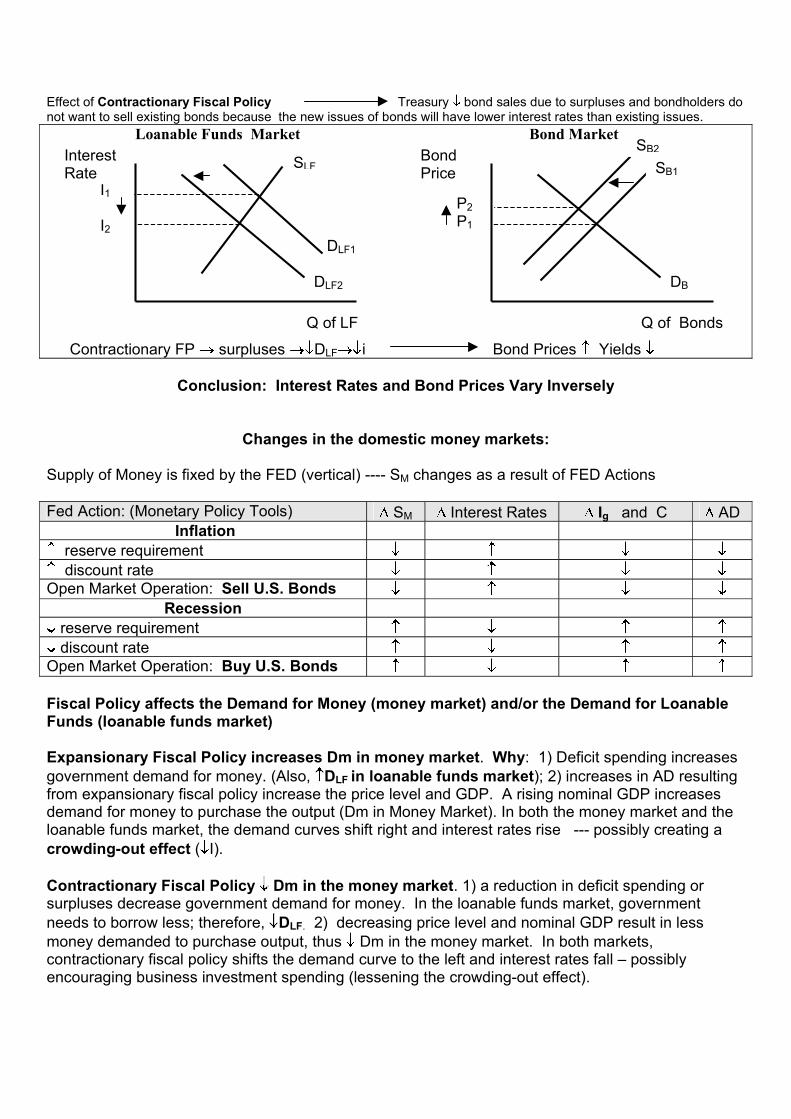
Effect of Contractionary Fiscal Policy Treasury bond sales due to surpluses and bondholders donot want to sell existing bonds because the new issues of bonds will have lower interest rates than existing issues.
Loanable Funds Market
Contractionary FP surpluses DLF i
Bond Market
Bond Prices Yields
DB
P2
P1
BondPrice SB1
DLF1
DLF2
I1
I2
SLF
SB2InterestRate
Q of LF Q of Bonds
Conclusion: Interest Rates and Bond Prices Vary Inversely
Changes in the domestic money markets:
Supply of Money is fixed by the FED (vertical) ---- SM changes as a result of FED Actions
Fed Action: (Monetary Policy Tools) SM Interest Rates Ig and C ADInflation
reserve requirement
discount rateOpen Market Operation: Sell U.S. Bonds
Recession
reserve requirement
discount rateOpen Market Operation: Buy U.S. Bonds
Fiscal Policy affects the Demand for Money (money market) and/or the Demand for LoanableFunds (loanable funds market)
Expansionary Fiscal Policy increases Dm in money market. Why: 1) Deficit spending increasesgovernment demand for money. (Also, DLF in loanable funds market); 2) increases in AD resultingfrom expansionary fiscal policy increase the price level and GDP. A rising nominal GDP increasesdemand for money to purchase the output (Dm in Money Market). In both the money market and theloanable funds market, the demand curves shift right and interest rates rise --- possibly creating acrowding-out effect ( I).
Contractionary Fiscal Policy Dm in the money market. 1) a reduction in deficit spending orsurpluses decrease government demand for money. In the loanable funds market, governmentneeds to borrow less; therefore, DLF. 2) decreasing price level and nominal GDP result in lessmoney demanded to purchase output, thus Dm in the money market. In both markets,contractionary fiscal policy shifts the demand curve to the left and interest rates fall � possibly encouraging business investment spending (lessening the crowding-out effect).
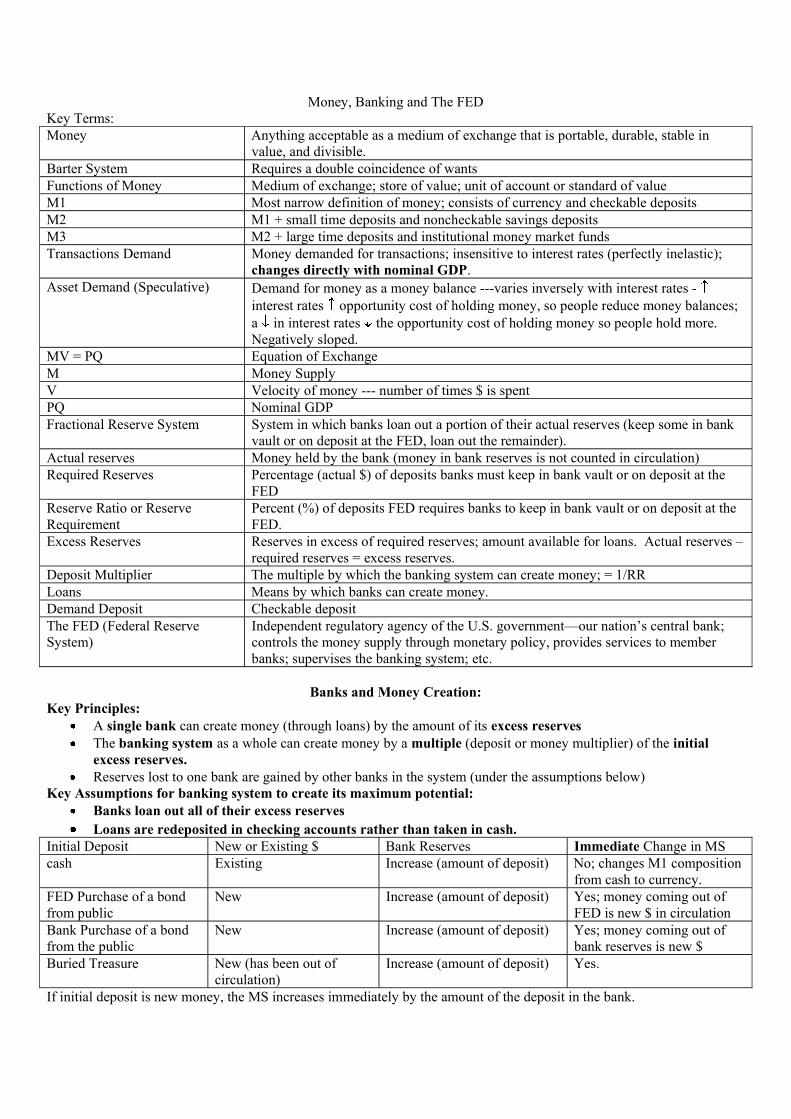
Money, Banking and The FEDKey Terms:Money Anything acceptable as a medium of exchange that is portable, durable, stable in
value, and divisible.Barter System Requires a double coincidence of wantsFunctions of Money Medium of exchange; store of value; unit of account or standard of valueM1 Most narrow definition of money; consists of currency and checkable depositsM2 M1 + small time deposits and noncheckable savings depositsM3 M2 + large time deposits and institutional money market fundsTransactions Demand Money demanded for transactions; insensitive to interest rates (perfectly inelastic);
changes directly with nominal GDP.Asset Demand (Speculative) Demand for money as a money balance ---varies inversely with interest rates -
interest rates opportunity cost of holding money, so people reduce money balances;a in interest rates the opportunity cost of holding money so people hold more.Negatively sloped.
MV = PQ Equation of ExchangeM Money SupplyV Velocity of money --- number of times $ is spentPQ Nominal GDPFractional Reserve System System in which banks loan out a portion of their actual reserves (keep some in bank
vault or on deposit at the FED, loan out the remainder).Actual reserves Money held by the bank (money in bank reserves is not counted in circulation)Required Reserves Percentage (actual $) of deposits banks must keep in bank vault or on deposit at the
FEDReserve Ratio or ReserveRequirement
Percent (%) of deposits FED requires banks to keep in bank vault or on deposit at theFED.
Excess Reserves Reserves in excess of required reserves; amount available for loans. Actual reserves � required reserves = excess reserves.
Deposit Multiplier The multiple by which the banking system can create money; = 1/RRLoans Means by which banks can create money.Demand Deposit Checkable depositThe FED (Federal ReserveSystem)
Independent regulatory agency of the U.S. government�our nation�s central bank; controls the money supply through monetary policy, provides services to memberbanks; supervises the banking system; etc.
Banks and Money Creation:Key Principles:
A single bank can create money (through loans) by the amount of its excess reservesThe banking system as a whole can create money by a multiple (deposit or money multiplier) of the initialexcess reserves.Reserves lost to one bank are gained by other banks in the system (under the assumptions below)
Key Assumptions for banking system to create its maximum potential:Banks loan out all of their excess reserves
Loans are redeposited in checking accounts rather than taken in cash.Initial Deposit New or Existing $ Bank Reserves Immediate Change in MScash Existing Increase (amount of deposit) No; changes M1 composition
from cash to currency.FED Purchase of a bondfrom public
New Increase (amount of deposit) Yes; money coming out ofFED is new $ in circulation
Bank Purchase of a bondfrom the public
New Increase (amount of deposit) Yes; money coming out ofbank reserves is new $
Buried Treasure New (has been out ofcirculation)
Increase (amount of deposit) Yes.
If initial deposit is new money, the MS increases immediately by the amount of the deposit in the bank.
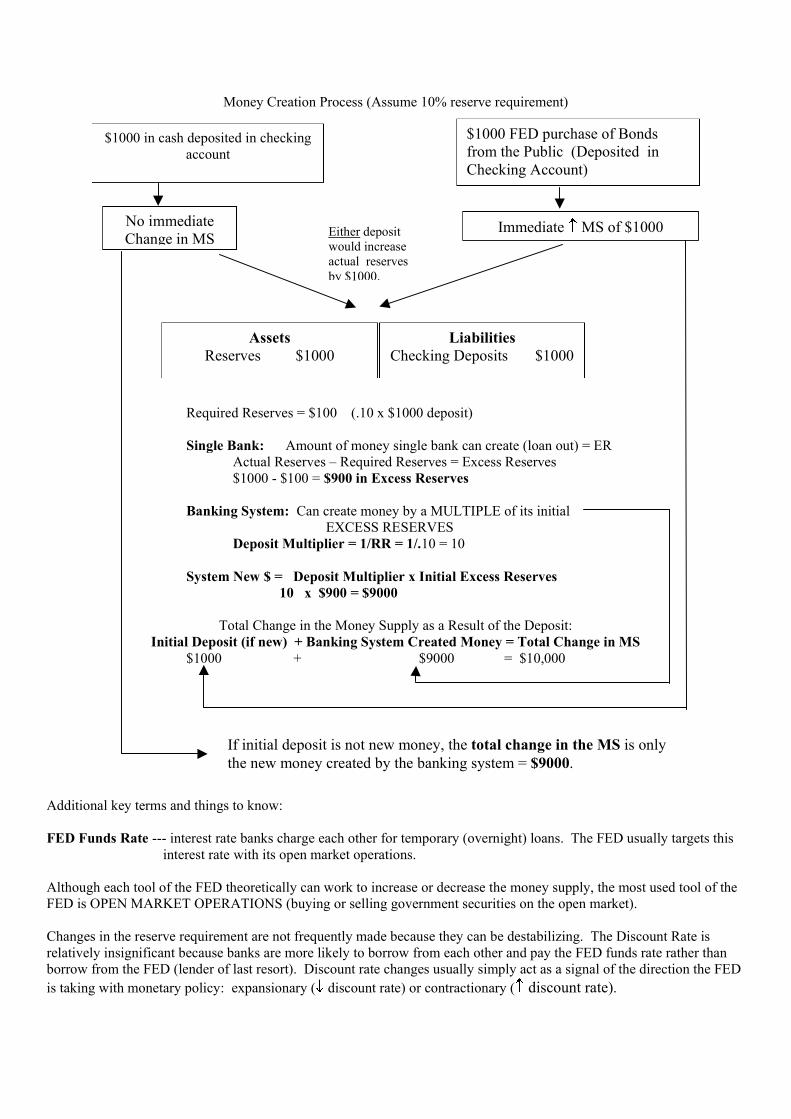
Money Creation Process (Assume 10% reserve requirement)
Required Reserves = $100 (.10 x $1000 deposit)
Single Bank: Amount of money single bank can create (loan out) = ERActual Reserves � Required Reserves = Excess Reserves$1000 - $100 = $900 in Excess Reserves
Banking System: Can create money by a MULTIPLE of its initialEXCESS RESERVES
Deposit Multiplier = 1/RR = 1/.10 = 10
System New $ = Deposit Multiplier x Initial Excess Reserves10 x $900 = $9000
Total Change in the Money Supply as a Result of the Deposit:Initial Deposit (if new) + Banking System Created Money = Total Change in MS
$1000 + $9000 = $10,000
No immediateChange in MS
Immediate MS of $1000Either depositwould increaseactual reservesby $1000.
AssetsReserves $1000
LiabilitiesChecking Deposits $1000
If initial deposit is not new money, the total change in the MS is onlythe new money created by the banking system = $9000.
$1000 FED purchase of Bondsfrom the Public (Deposited inChecking Account)
$1000 in cash deposited in checkingaccount
Additional key terms and things to know:
FED Funds Rate --- interest rate banks charge each other for temporary (overnight) loans. The FED usually targets thisinterest rate with its open market operations.
Although each tool of the FED theoretically can work to increase or decrease the money supply, the most used tool of theFED is OPEN MARKET OPERATIONS (buying or selling government securities on the open market).
Changes in the reserve requirement are not frequently made because they can be destabilizing. The Discount Rate isrelatively insignificant because banks are more likely to borrow from each other and pay the FED funds rate rather thanborrow from the FED (lender of last resort). Discount rate changes usually simply act as a signal of the direction the FED
is taking with monetary policy: expansionary ( discount rate) or contractionary ( discount rate).
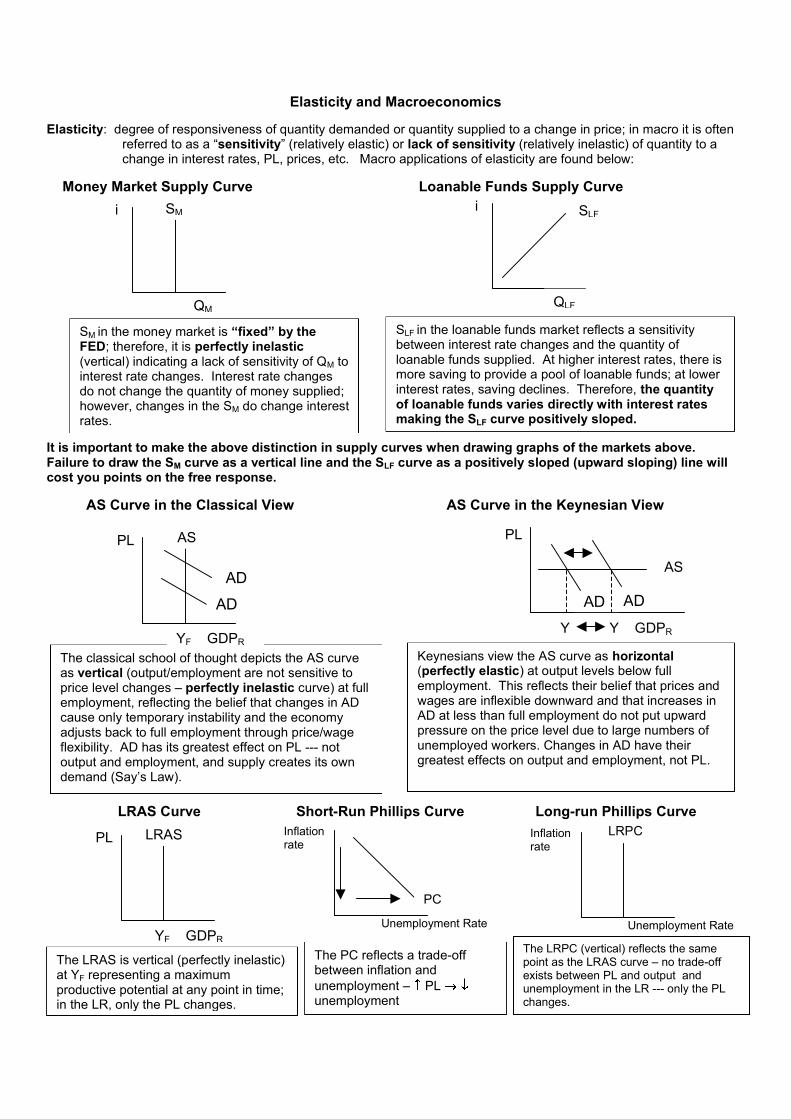
Elasticity and Macroeconomics
Elasticity: degree of responsiveness of quantity demanded or quantity supplied to a change in price; in macro it is oftenreferred to as a �sensitivity� (relatively elastic) or lack of sensitivity (relatively inelastic) of quantity to achange in interest rates, PL, prices, etc. Macro applications of elasticity are found below:
SLF in the loanable funds market reflects a sensitivitybetween interest rate changes and the quantity ofloanable funds supplied. At higher interest rates, there ismore saving to provide a pool of loanable funds; at lowerinterest rates, saving declines. Therefore, the quantityof loanable funds varies directly with interest ratesmaking the SLF curve positively sloped.
SM in the money market is �fixed� by theFED; therefore, it is perfectly inelastic(vertical) indicating a lack of sensitivity of QM tointerest rate changes. Interest rate changesdo not change the quantity of money supplied;however, changes in the SM do change interestrates.
It is important to make the above distinction in supply curves when drawing graphs of the markets above.Failure to draw the SM curve as a vertical line and the SLF curve as a positively sloped (upward sloping) line willcost you points on the free response.
AS Curve in the Classical View AS Curve in the Keynesian View
ADAD
AS
PL
AD
AD
ASPL
YF GDPR
The classical school of thought depicts the AS curveas vertical (output/employment are not sensitive toprice level changes � perfectly inelastic curve) at fullemployment, reflecting the belief that changes in ADcause only temporary instability and the economyadjusts back to full employment through price/wageflexibility. AD has its greatest effect on PL --- notoutput and employment, and supply creates its owndemand (Say�s Law).
Y Y GDPR
Keynesians view the AS curve as horizontal(perfectly elastic) at output levels below fullemployment. This reflects their belief that prices andwages are inflexible downward and that increases inAD at less than full employment do not put upwardpressure on the price level due to large numbers ofunemployed workers. Changes in AD have theirgreatest effects on output and employment, not PL.
The LRPC (vertical) reflects the samepoint as the LRAS curve � no trade-offexists between PL and output andunemployment in the LR --- only the PLchanges.
LRPCInflationrate
Unemployment RateYF GDPR
PL LRAS
PC
Inflationrate
Unemployment Rate
The PC reflects a trade-offbetween inflation andunemployment � PLunemployment
The LRAS is vertical (perfectly inelastic)at YF representing a maximumproductive potential at any point in time;in the LR, only the PL changes.
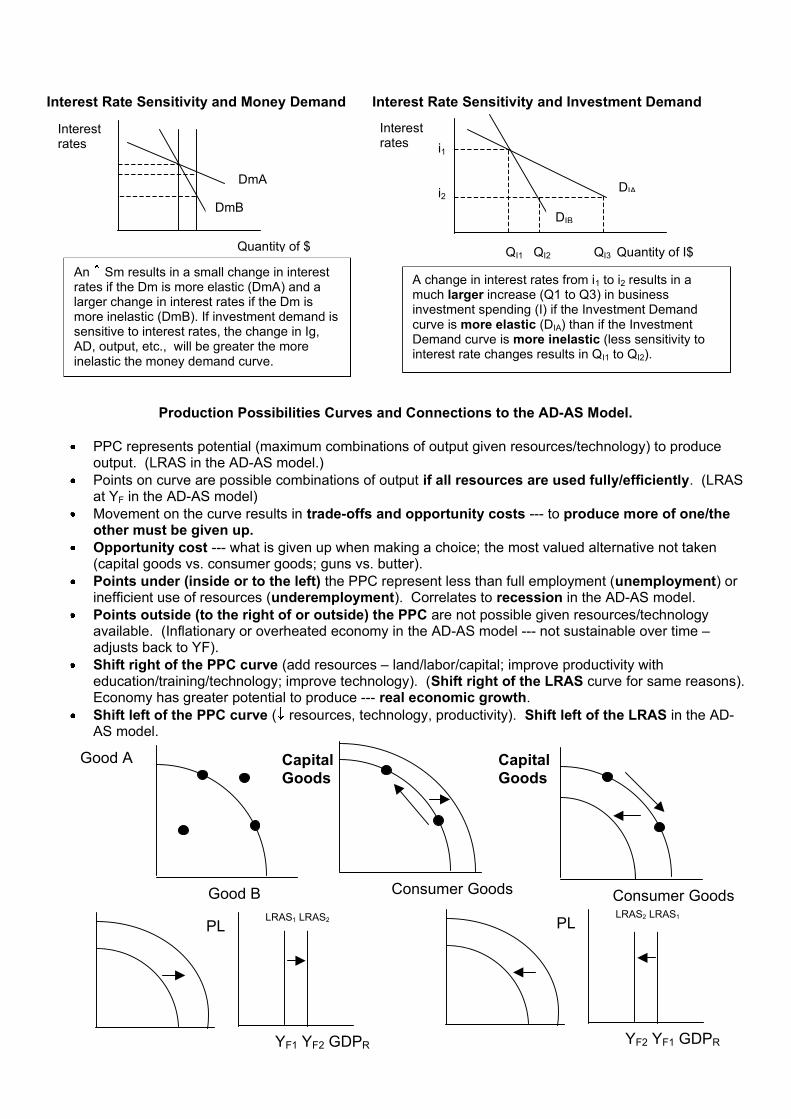
Interest Rate Sensitivity and Money Demand Interest Rate Sensitivity and Investment Demand
A change in interest rates from i1 to i2 results in amuch larger increase (Q1 to Q3) in businessinvestment spending (I) if the Investment Demandcurve is more elastic (DIA) than if the InvestmentDemand curve is more inelastic (less sensitivity tointerest rate changes results in QI1 to QI2).
DIB
DIA
QI1 QI2 QI3 Quantity of I$
Interestrates
DmB
DmA
Quantity of $
Interestrates i1
i2
An Sm results in a small change in interestrates if the Dm is more elastic (DmA) and alarger change in interest rates if the Dm ismore inelastic (DmB). If investment demand issensitive to interest rates, the change in Ig,AD, output, etc., will be greater the moreinelastic the money demand curve.
Production Possibilities Curves and Connections to the AD-AS Model.
PPC represents potential (maximum combinations of output given resources/technology) to produceoutput. (LRAS in the AD-AS model.)Points on curve are possible combinations of output if all resources are used fully/efficiently. (LRASat YF in the AD-AS model)Movement on the curve results in trade-offs and opportunity costs --- to produce more of one/theother must be given up.Opportunity cost --- what is given up when making a choice; the most valued alternative not taken(capital goods vs. consumer goods; guns vs. butter).Points under (inside or to the left) the PPC represent less than full employment (unemployment) orinefficient use of resources (underemployment). Correlates to recession in the AD-AS model.Points outside (to the right of or outside) the PPC are not possible given resources/technologyavailable. (Inflationary or overheated economy in the AD-AS model --- not sustainable over time � adjusts back to YF).Shift right of the PPC curve (add resources � land/labor/capital; improve productivity witheducation/training/technology; improve technology). (Shift right of the LRAS curve for same reasons).Economy has greater potential to produce --- real economic growth.Shift left of the PPC curve ( resources, technology, productivity). Shift left of the LRAS in the AD-AS model.
Good B Consumer GoodsLRAS2 LRAS1
YF2 YF1 GDPR
PLLRAS1 LRAS2
YF1 YF2 GDPR
PL
Consumer Goods
Good A CapitalGoods
CapitalGoods
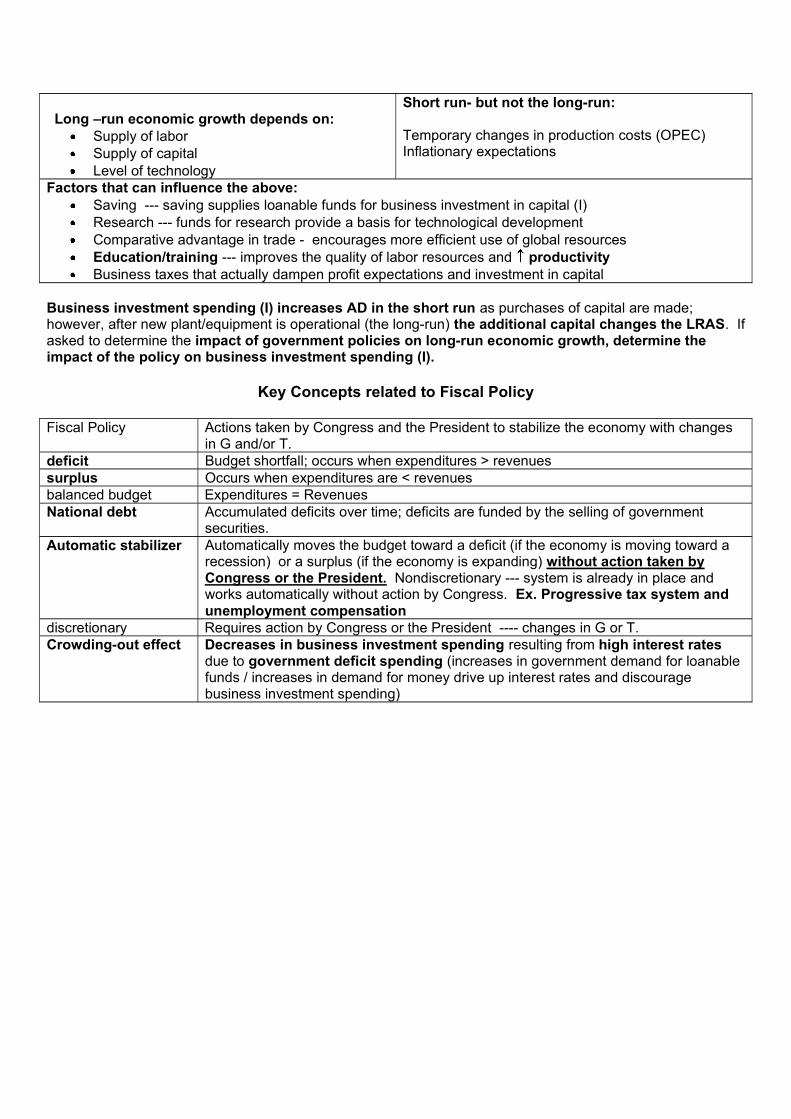
Long �run economic growth depends on: Supply of laborSupply of capitalLevel of technology
Short run- but not the long-run:
Temporary changes in production costs (OPEC)Inflationary expectations
Factors that can influence the above:Saving --- saving supplies loanable funds for business investment in capital (I)Research --- funds for research provide a basis for technological developmentComparative advantage in trade - encourages more efficient use of global resourcesEducation/training --- improves the quality of labor resources and productivityBusiness taxes that actually dampen profit expectations and investment in capital
Business investment spending (I) increases AD in the short run as purchases of capital are made;however, after new plant/equipment is operational (the long-run) the additional capital changes the LRAS. Ifasked to determine the impact of government policies on long-run economic growth, determine theimpact of the policy on business investment spending (I).
Key Concepts related to Fiscal Policy
Fiscal Policy Actions taken by Congress and the President to stabilize the economy with changesin G and/or T.
deficit Budget shortfall; occurs when expenditures > revenuessurplus Occurs when expenditures are < revenuesbalanced budget Expenditures = RevenuesNational debt Accumulated deficits over time; deficits are funded by the selling of government
securities.Automatic stabilizer Automatically moves the budget toward a deficit (if the economy is moving toward a
recession) or a surplus (if the economy is expanding) without action taken byCongress or the President. Nondiscretionary --- system is already in place andworks automatically without action by Congress. Ex. Progressive tax system andunemployment compensation
discretionary Requires action by Congress or the President ---- changes in G or T.Crowding-out effect Decreases in business investment spending resulting from high interest rates
due to government deficit spending (increases in government demand for loanablefunds / increases in demand for money drive up interest rates and discouragebusiness investment spending)
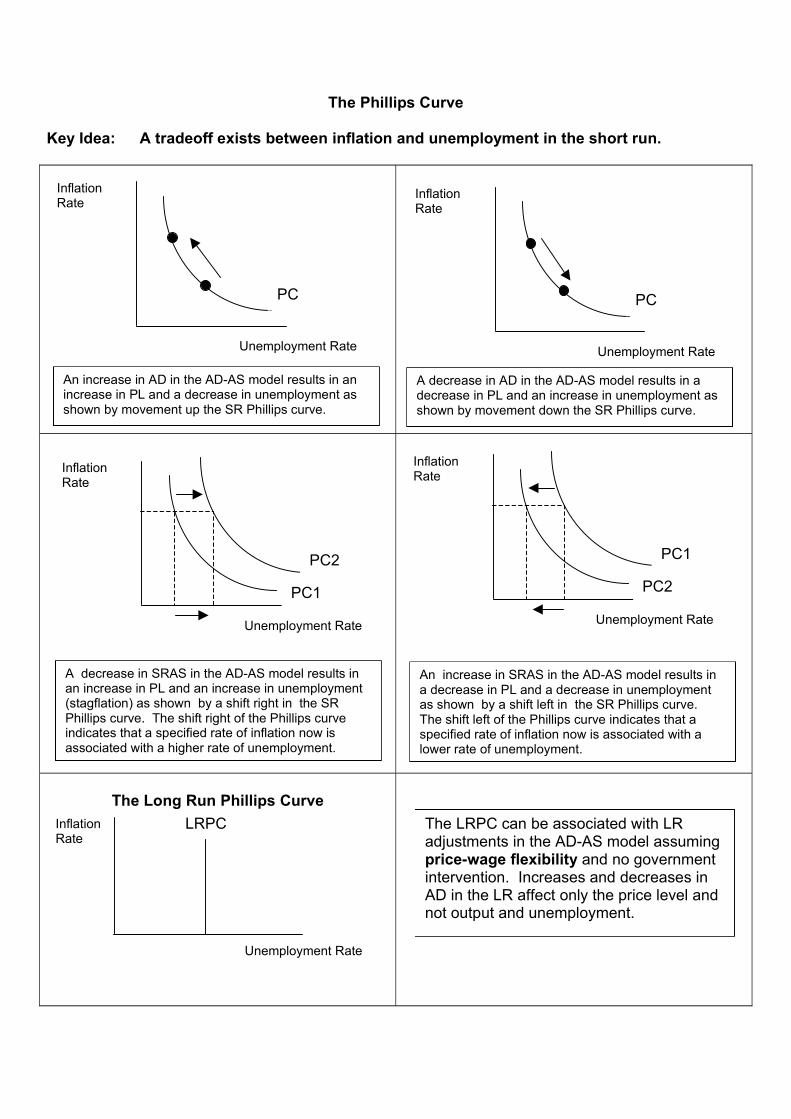
The Phillips Curve
Key Idea: A tradeoff exists between inflation and unemployment in the short run.
The Long Run Phillips Curve
An increase in AD in the AD-AS model results in anincrease in PL and a decrease in unemployment asshown by movement up the SR Phillips curve.
PC
Unemployment Rate
InflationRate
PC
InflationRate
A decrease in AD in the AD-AS model results in adecrease in PL and an increase in unemployment asshown by movement down the SR Phillips curve.
Unemployment Rate
PC1
PC2
InflationRate
PC2
PC1
Unemployment Rate
InflationRate
A decrease in SRAS in the AD-AS model results inan increase in PL and an increase in unemployment(stagflation) as shown by a shift right in the SRPhillips curve. The shift right of the Phillips curveindicates that a specified rate of inflation now isassociated with a higher rate of unemployment.
Unemployment Rate
An increase in SRAS in the AD-AS model results ina decrease in PL and a decrease in unemploymentas shown by a shift left in the SR Phillips curve.The shift left of the Phillips curve indicates that aspecified rate of inflation now is associated with alower rate of unemployment.
The LRPC can be associated with LRadjustments in the AD-AS model assumingprice-wage flexibility and no governmentintervention. Increases and decreases inAD in the LR affect only the price level andnot output and unemployment.
Explanations:Expansionary monetary and fiscal policies have different effects on interest rates.Monetary policy increases the money supply and lowers interest rates. Fiscal policy increasesthe demand for loanable funds (due to deficit spending) and drives up interest rates. Theactual impact on interest rates depends on the relative strength of each policy.Contractionary monetary policy decreases the money supply and increases interest rates.A contractionary fiscal policy lessens deficit spending and moves the budget toward asurplus; therefore, government demand for loanable funds decreases and interest rates fall.The actual impact would depends on the relative strength of each policy.Expansionary monetary ( AD) and contractionary fiscal ( AD) policies move price level,output, and unemployment in opposite directions, thus the actual change in each woulddepend on the relative strength of each policy action. Both policies, however, decreaseinterest rates. Expansionary monetary policy actions increase the money supply and reduceinterest rates. Contractionary fiscal policy (surpluses) reduces government demand forloanable funds, also putting downward pressure on interest rates.Contractionary monetary ( AD) and expansionary fiscal ( AD) policies move price level,output, and unemployment in opposite directions, thus the actual change in each depends onthe relative strength of each policy action. Both policies, however, increase interest rates.Contractionary monetary policy decreases the money supply and increases interest rates.Expansionary fiscal policies increase government demand for loanable funds and drive upinterest rates.
Effects of Government Policies on Interest Rates, Xn, Business Investment and LR Economic Growth
Policy Interest Rates Net ExportsBusiness
Investment (I)Long Run
Economic GrowthExpansionary Fiscal
Contractionary Fiscal
Expansionary Monetary
Contractionary Monetary
Factors to consider when explaining the above:Fiscal policy affects the demand for money and/or demand for loanable funds; monetary policyaffects the supply of money. Changes in the supply and demand for money (and supply anddemand for loanable funds) affect interest ratesNet export effect of changes in interest ratesCrowding out effect of government deficit spendingChanges in capital stock (business investment decisions) and LR economic growthChanges in business investment spending affect AD in the short run, but AS in the long run.
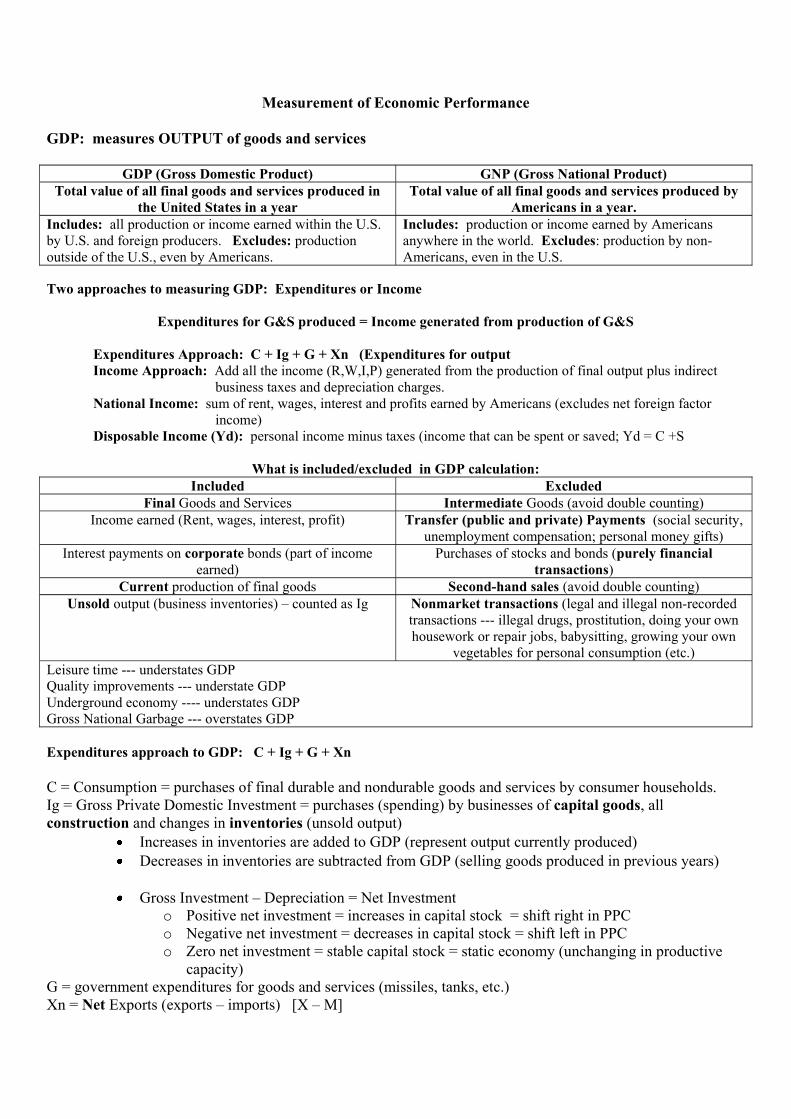
Measurement of Economic Performance
GDP: measures OUTPUT of goods and services
GDP (Gross Domestic Product) GNP (Gross National Product)Total value of all final goods and services produced in
the United States in a yearTotal value of all final goods and services produced by
Americans in a year.Includes: all production or income earned within the U.S.by U.S. and foreign producers. Excludes: productionoutside of the U.S., even by Americans.
Includes: production or income earned by Americansanywhere in the world. Excludes: production by non-Americans, even in the U.S.
Two approaches to measuring GDP: Expenditures or Income
Expenditures for G&S produced = Income generated from production of G&S
Expenditures Approach: C + Ig + G + Xn (Expenditures for outputIncome Approach: Add all the income (R,W,I,P) generated from the production of final output plus indirect
business taxes and depreciation charges.National Income: sum of rent, wages, interest and profits earned by Americans (excludes net foreign factor
income)Disposable Income (Yd): personal income minus taxes (income that can be spent or saved; Yd = C +S
What is included/excluded in GDP calculation:Included Excluded
Final Goods and Services Intermediate Goods (avoid double counting)Income earned (Rent, wages, interest, profit) Transfer (public and private) Payments (social security,
unemployment compensation; personal money gifts)Interest payments on corporate bonds (part of income
earned)Purchases of stocks and bonds (purely financial
transactions)Current production of final goods Second-hand sales (avoid double counting)
Unsold output (business inventories) � counted as Ig Nonmarket transactions (legal and illegal non-recordedtransactions --- illegal drugs, prostitution, doing your ownhousework or repair jobs, babysitting, growing your own
vegetables for personal consumption (etc.)Leisure time --- understates GDPQuality improvements --- understate GDPUnderground economy ---- understates GDPGross National Garbage --- overstates GDP
Expenditures approach to GDP: C + Ig + G + Xn
C = Consumption = purchases of final durable and nondurable goods and services by consumer households.Ig = Gross Private Domestic Investment = purchases (spending) by businesses of capital goods, allconstruction and changes in inventories (unsold output)
Increases in inventories are added to GDP (represent output currently produced)Decreases in inventories are subtracted from GDP (selling goods produced in previous years)
Gross Investment � Depreciation = Net Investment o Positive net investment = increases in capital stock = shift right in PPCo Negative net investment = decreases in capital stock = shift left in PPCo Zero net investment = stable capital stock = static economy (unchanging in productive
capacity)G = government expenditures for goods and services (missiles, tanks, etc.)Xn = Net Exports (exports � imports) [X � M]
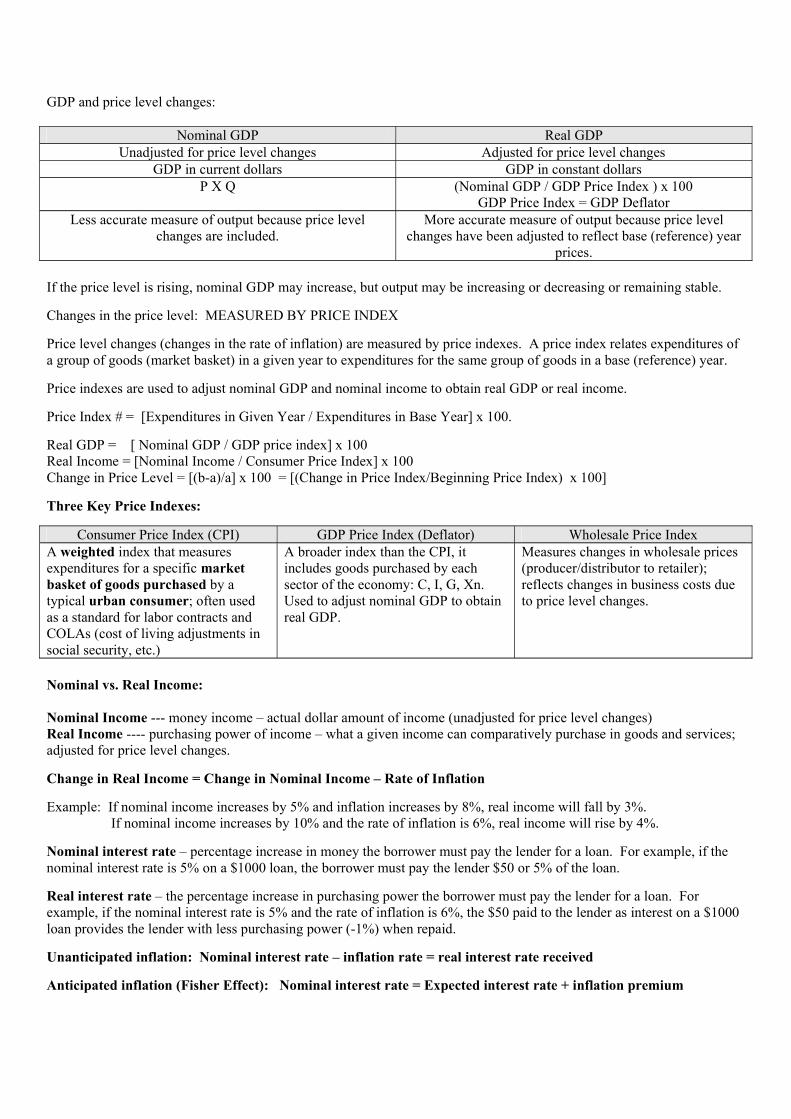
GDP and price level changes:
Nominal GDP Real GDPUnadjusted for price level changes Adjusted for price level changes
GDP in current dollars GDP in constant dollarsP X Q (Nominal GDP / GDP Price Index ) x 100
GDP Price Index = GDP DeflatorLess accurate measure of output because price level
changes are included.More accurate measure of output because price level
changes have been adjusted to reflect base (reference) yearprices.
If the price level is rising, nominal GDP may increase, but output may be increasing or decreasing or remaining stable.
Changes in the price level: MEASURED BY PRICE INDEX
Price level changes (changes in the rate of inflation) are measured by price indexes. A price index relates expenditures ofa group of goods (market basket) in a given year to expenditures for the same group of goods in a base (reference) year.
Price indexes are used to adjust nominal GDP and nominal income to obtain real GDP or real income.
Price Index # = [Expenditures in Given Year / Expenditures in Base Year] x 100.
Real GDP = [ Nominal GDP / GDP price index] x 100Real Income = [Nominal Income / Consumer Price Index] x 100Change in Price Level = [(b-a)/a] x 100 = [(Change in Price Index/Beginning Price Index) x 100]
Three Key Price Indexes:
Consumer Price Index (CPI) GDP Price Index (Deflator) Wholesale Price IndexA weighted index that measuresexpenditures for a specific marketbasket of goods purchased by atypical urban consumer; often usedas a standard for labor contracts andCOLAs (cost of living adjustments insocial security, etc.)
A broader index than the CPI, itincludes goods purchased by eachsector of the economy: C, I, G, Xn.Used to adjust nominal GDP to obtainreal GDP.
Measures changes in wholesale prices(producer/distributor to retailer);reflects changes in business costs dueto price level changes.
Nominal vs. Real Income:
Nominal Income --- money income � actual dollar amount of income (unadjusted for price level changes)Real Income ---- purchasing power of income � what a given income can comparatively purchase in goods and services;adjusted for price level changes.
Change in Real Income = Change in Nominal Income � Rate of Inflation
Example: If nominal income increases by 5% and inflation increases by 8%, real income will fall by 3%.If nominal income increases by 10% and the rate of inflation is 6%, real income will rise by 4%.
Nominal interest rate � percentage increase in money the borrower must pay the lender for a loan. For example, if the nominal interest rate is 5% on a $1000 loan, the borrower must pay the lender $50 or 5% of the loan.
Real interest rate � the percentage increase in purchasing power the borrower must pay the lender for a loan. Forexample, if the nominal interest rate is 5% and the rate of inflation is 6%, the $50 paid to the lender as interest on a $1000loan provides the lender with less purchasing power (-1%) when repaid.
Unanticipated inflation: Nominal interest rate � inflation rate = real interest rate received
Short Run vs. Long Run Changes in Nominal and Real Interest Rates
Assume an increase in the Supply of Money (Sm) by the FED:Short Run:
Sm in both nominal and real interest rates
Long Run:
Sm AD PL creditors to add an inflationpremium to expected interest rates nominalinterest rate and a return of real interest rates to the LRequilibrium.(Fisher Effect)
Sm in both nominal and real interest rates Sm AD PL nominal interest rates; realinterest rates return to the LR equilibrium
Who is hurt/helped (loses/gains) by unanticipated inflation:Fixed income recipients hurt Purchasing power falls as PL risesSavers hurt Purchasing power of saving falls as PL risesdebtors helped $ paid back is worth less in purchasing power than $
borrowedcreditors hurt $ loaned is worth less in purchasing power than $ paid
backFlexible income recipient uncertain Depends on if the nominal income exceeds the rate of
inflationA buyer who pays fixed payments helped Rising inflation will decrease the purchasing power of the
money paid; recipient of payment is hurt.
Measurement of Unemployment:Labor Force Employed + UnemployedEmployed Worked for pay in the last weekUnemployed Looking for work in the last monthDiscouraged Worker Given up looking for work (out of the labor force)Part-time workers Counted as full time; underemployed understate the unemployment rateLabor Force Participation Rate Labor Force as a percent of the population [(Labor force/population) x 100]Unemployment Rate (# of unemployed / labor force) x 100
Types of Unemployment:Frictional In-between jobs; looking for first job (temporary)Structural Workers skills are no longer in demand or obsolete: results from automation,
foreign competition, changes in demand for products; can be lengthy and mayrequire retraining or relocation to find a new job.
Cyclical Caused by insufficient AD; associated with a recession; Actualunemployment is greater than the natural rate of unemployment; associatedwith a GDP gap
Natural Rate of Unemployment Sum of frictional and structural unemployment; exists at YF (fullemployment); approximately 4-6%; associated with potential output
GDP gap gap between actual and potential GDP; lost output; occurs when the economyfalls below the full employment level of output (YF)
Okuns Law Each 1% cyclical unemployment = 2% GDP GapPotential output Output that could be produced if at full employment (YF)
Business cycle: ups and downs in business activity; 4 phases: recovery/expansion; peak/boom; contraction;and trough. Phases are not equal in duration.
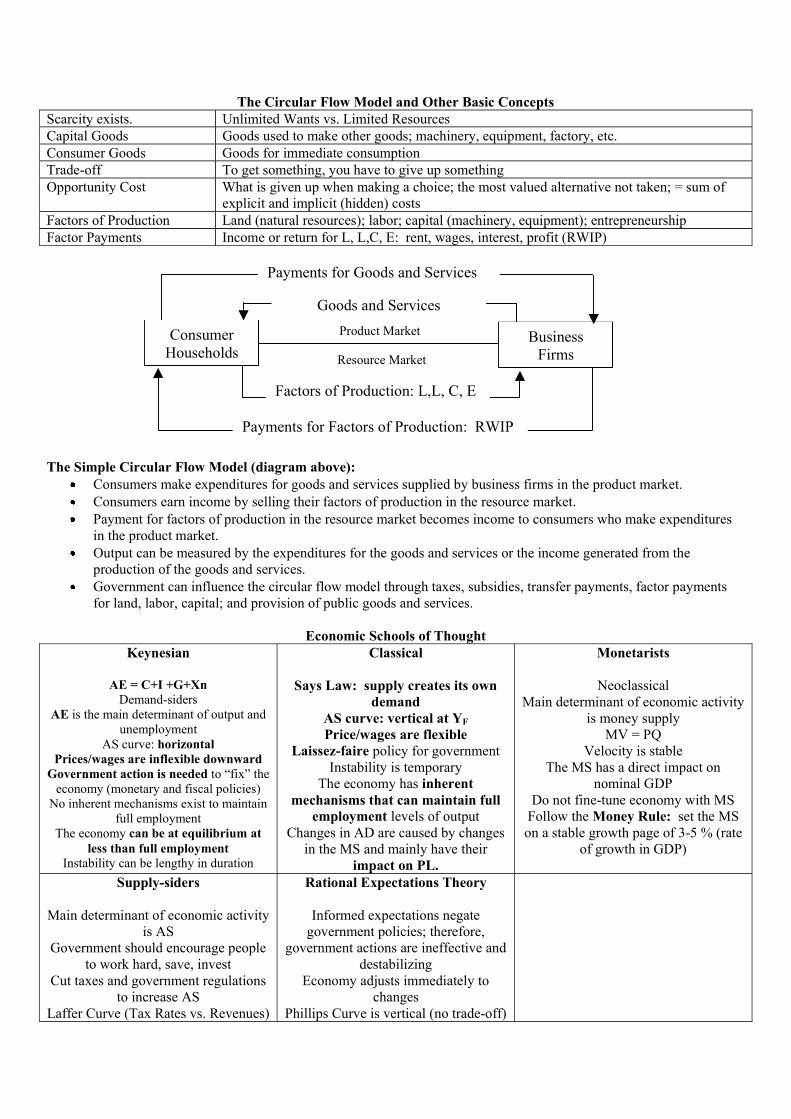
The Circular Flow Model and Other Basic ConceptsScarcity exists. Unlimited Wants vs. Limited ResourcesCapital Goods Goods used to make other goods; machinery, equipment, factory, etc.Consumer Goods Goods for immediate consumptionTrade-off To get something, you have to give up somethingOpportunity Cost What is given up when making a choice; the most valued alternative not taken; = sum of
explicit and implicit (hidden) costsFactors of Production Land (natural resources); labor; capital (machinery, equipment); entrepreneurshipFactor Payments Income or return for L, L,C, E: rent, wages, interest, profit (RWIP)
FirmsResource Market
Product Market
Payments for Factors of Production: RWIP
Factors of Production: L,L, C, E
Goods and Services
Payments for Goods and Services
BusinessConsumerHouseholds
The Simple Circular Flow Model (diagram above):Consumers make expenditures for goods and services supplied by business firms in the product market.Consumers earn income by selling their factors of production in the resource market.Payment for factors of production in the resource market becomes income to consumers who make expendituresin the product market.Output can be measured by the expenditures for the goods and services or the income generated from theproduction of the goods and services.Government can influence the circular flow model through taxes, subsidies, transfer payments, factor paymentsfor land, labor, capital; and provision of public goods and services.
Economic Schools of ThoughtKeynesian
AE = C+I +G+XnDemand-siders
AE is the main determinant of output andunemployment
AS curve: horizontalPrices/wages are inflexible downward
Government action is needed to �fix� theeconomy (monetary and fiscal policies)
No inherent mechanisms exist to maintainfull employment
The economy can be at equilibrium atless than full employment
Instability can be lengthy in duration
Classical
Says Law: supply creates its owndemand
AS curve: vertical at YF
Price/wages are flexibleLaissez-faire policy for government
Instability is temporaryThe economy has inherent
mechanisms that can maintain fullemployment levels of output
Changes in AD are caused by changesin the MS and mainly have their
impact on PL.
Monetarists
NeoclassicalMain determinant of economic activity
is money supplyMV = PQ
Velocity is stableThe MS has a direct impact on
nominal GDPDo not fine-tune economy with MS
Follow the Money Rule: set the MSon a stable growth page of 3-5 % (rate
of growth in GDP)
Supply-siders
Main determinant of economic activityis AS
Government should encourage peopleto work hard, save, invest
Cut taxes and government regulationsto increase AS
government actions are ineffective anddestabilizing
Economy adjusts immediately tochanges
Phillips Curve is vertical (no trade-off)
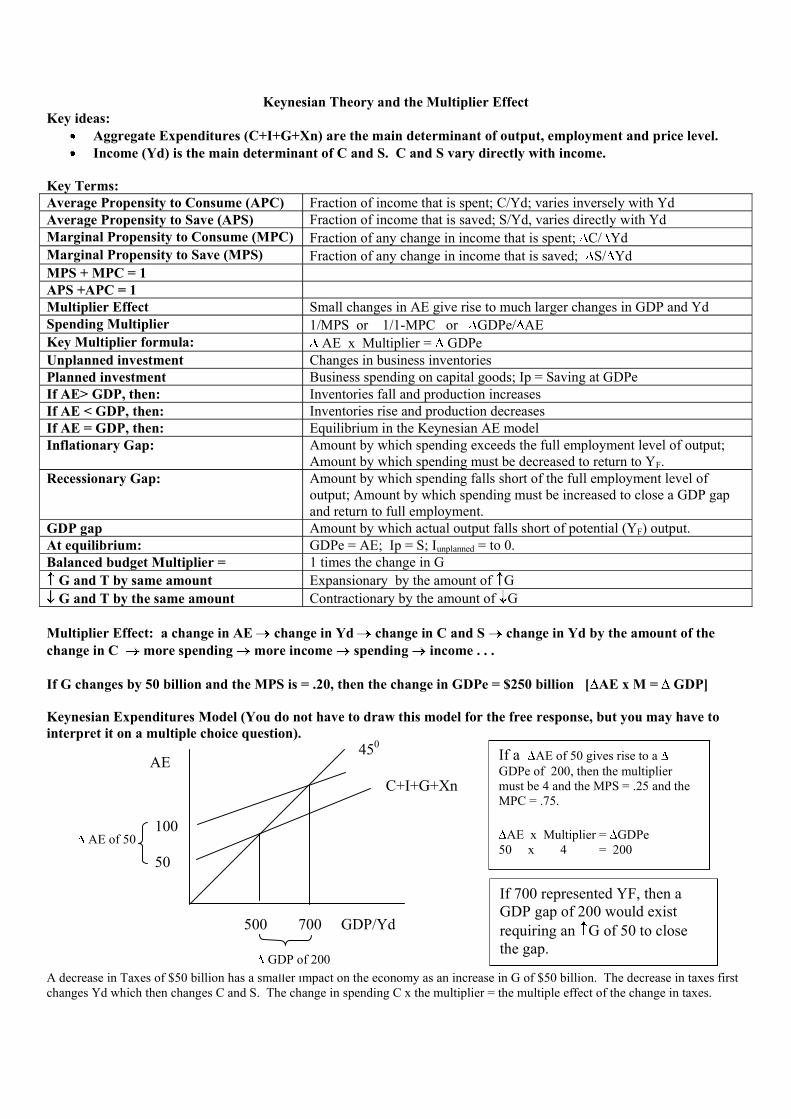
Keynesian Theory and the Multiplier EffectKey ideas:
Aggregate Expenditures (C+I+G+Xn) are the main determinant of output, employment and price level.Income (Yd) is the main determinant of C and S. C and S vary directly with income.
Key Terms:Average Propensity to Consume (APC) Fraction of income that is spent; C/Yd; varies inversely with YdAverage Propensity to Save (APS) Fraction of income that is saved; S/Yd, varies directly with YdMarginal Propensity to Consume (MPC) Fraction of any change in income that is spent; C/ YdMarginal Propensity to Save (MPS) Fraction of any change in income that is saved; S/ YdMPS + MPC = 1APS +APC = 1Multiplier Effect Small changes in AE give rise to much larger changes in GDP and YdSpending Multiplier 1/MPS or 1/1-MPC or GDPe/ AEKey Multiplier formula: AE x Multiplier = GDPeUnplanned investment Changes in business inventoriesPlanned investment Business spending on capital goods; Ip = Saving at GDPeIf AE> GDP, then: Inventories fall and production increasesIf AE < GDP, then: Inventories rise and production decreasesIf AE = GDP, then: Equilibrium in the Keynesian AE modelInflationary Gap: Amount by which spending exceeds the full employment level of output;
Amount by which spending must be decreased to return to YF.Recessionary Gap: Amount by which spending falls short of the full employment level of
output; Amount by which spending must be increased to close a GDP gapand return to full employment.
GDP gap Amount by which actual output falls short of potential (YF) output.At equilibrium: GDPe = AE; Ip = S; Iunplanned = to 0.Balanced budget Multiplier = 1 times the change in G
G and T by same amount Expansionary by the amount of G
G and T by the same amount Contractionary by the amount of G
Multiplier Effect: a change in AE change in Yd change in C and S change in Yd by the amount of thechange in C more spending more income spending income . . .
If G changes by 50 billion and the MPS is = .20, then the change in GDPe = $250 billion [ AE x M = GDP]
Keynesian Expenditures Model (You do not have to draw this model for the free response, but you may have tointerpret it on a multiple choice question).
A decrease in Taxes of $50 billion has a smaller impact on the economy as an increase in G of $50 billion. The decrease in taxes firstchanges Yd which then changes C and S. The change in spending C x the multiplier = the multiple effect of the change in taxes.
If 700 represented YF, then aGDP gap of 200 would existrequiring an G of 50 to closethe gap.
If a AE of 50 gives rise to aGDPe of 200, then the multipliermust be 4 and the MPS = .25 and theMPC = .75.
AE x Multiplier = GDPe50 x 4 = 200
GDP of 200
AE of 50
500 700 GDP/Yd
450
AE
100
50
C+I+G+Xn
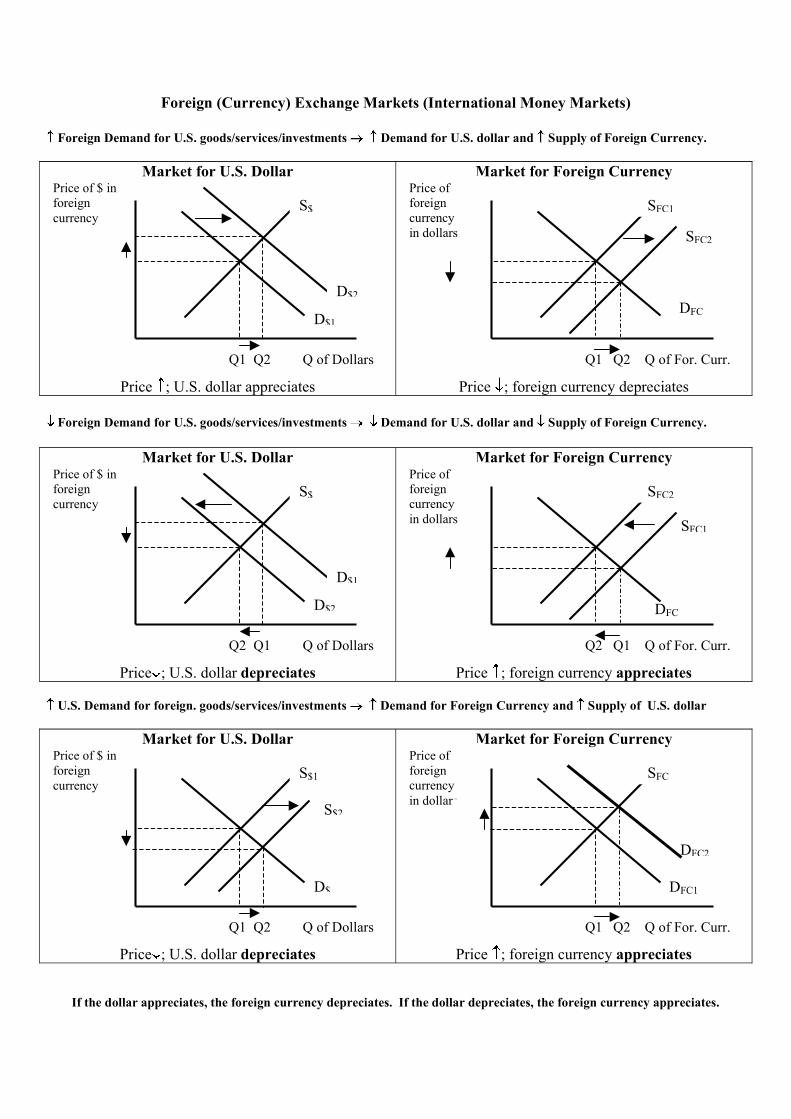
Foreign (Currency) Exchange Markets (International Money Markets)
Foreign Demand for U.S. goods/services/investments Demand for U.S. dollar and Supply of Foreign Currency.
Market for U.S. Dollar
Price ; U.S. dollar appreciates
Market for Foreign Currency
Price ; foreign currency depreciates
SFC2
D$1
P1
P2
P1
Price of $ inforeigncurrency
S$
DFC
P1P1P2
Price offoreigncurrencyin dollars
SFC1
D$2
Q1 Q2 Q of Dollars Q1 Q2 Q of For. Curr.
Foreign Demand for U.S. goods/services/investments Demand for U.S. dollar and Supply of Foreign Currency.
Market for U.S. Dollar
Price ; U.S. dollar depreciates
Market for Foreign Currency
Price ; foreign currency appreciates
SFC1
D$2
P1
P1
P2
S$
DFC
P1P2P1
Price offoreigncurrencyin dollars
SFC2
D$1
Q2 Q1 Q of Dollars
Price of $ inforeigncurrency
Q2 Q1 Q of For. Curr.
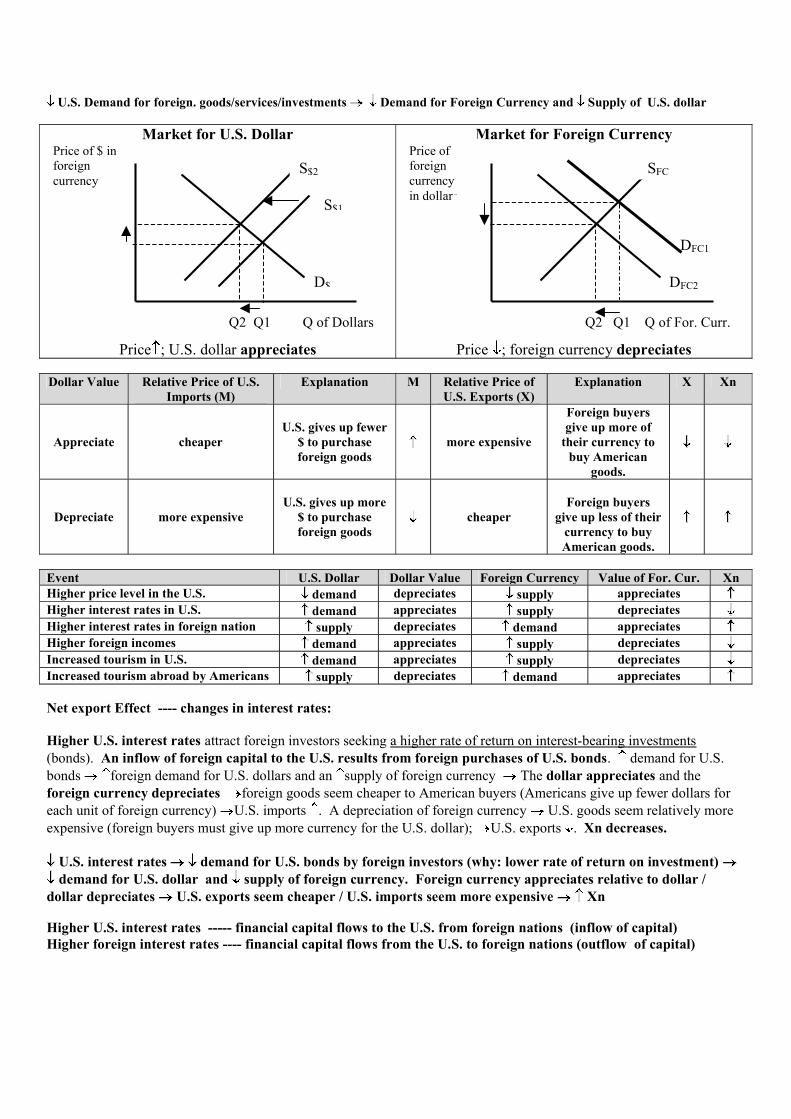
U.S. Demand for foreign. goods/services/investments Demand for Foreign Currency and Supply of U.S. dollar
Market for U.S. Dollar
Price ; U.S. dollar depreciates
Market for Foreign Currency
Price ; foreign currency appreciates
D$
P1P1
P2
Q1 Q2 Q of Dollars
Price of $ inforeigncurrency
S$1
S$2
DFC2
DFC1
P1
P2P1
Price offoreigncurrencyin dollars
SFC
Q1 Q2 Q of For. Curr.
If the dollar appreciates, the foreign currency depreciates. If the dollar depreciates, the foreign currency appreciates.
U.S. Demand for foreign. goods/services/investments Demand for Foreign Currency and Supply of U.S. dollar
Market for U.S. Dollar
Price ; U.S. dollar appreciates
Market for Foreign Currency
Price ; foreign currency depreciates
DFC1
D$
PP2
P1
1
Price of $ inforeigncurrency
Q2 Q1 Q of Dollars
S$2
DFC2
P1
P1P2
Price offoreigncurrencyin dollars
Q2 Q1 Q of For. Curr.
SFC
S$1
Dollar Value Relative Price of U.S.Imports (M)
Explanation M Relative Price ofU.S. Exports (X)
Explanation X Xn
Appreciate cheaperU.S. gives up fewer
$ to purchaseforeign goods
more expensive
Foreign buyersgive up more of
their currency tobuy American
goods.
Depreciate more expensiveU.S. gives up more
$ to purchaseforeign goods
cheaperForeign buyers
give up less of theircurrency to buyAmerican goods.
Event U.S. Dollar Dollar Value Foreign Currency Value of For. Cur. XnHigher price level in the U.S. demand depreciates supply appreciates
Higher interest rates in U.S. demand appreciates supply depreciates
Higher interest rates in foreign nation supply depreciates demand appreciates
Increased tourism in U.S. demand appreciates supply depreciates
Increased tourism abroad by Americans supply depreciates demand appreciates
Net export Effect ---- changes in interest rates:
Higher U.S. interest rates attract foreign investors seeking a higher rate of return on interest-bearing investments(bonds). An inflow of foreign capital to the U.S. results from foreign purchases of U.S. bonds. demand for U.S.bonds foreign demand for U.S. dollars and an supply of foreign currency The dollar appreciates and theforeign currency depreciates foreign goods seem cheaper to American buyers (Americans give up fewer dollars foreach unit of foreign currency) U.S. imports . A depreciation of foreign currency U.S. goods seem relatively moreexpensive (foreign buyers must give up more currency for the U.S. dollar); U.S. exports . Xn decreases.
U.S. interest rates demand for U.S. bonds by foreign investors (why: lower rate of return on investment)demand for U.S. dollar and supply of foreign currency. Foreign currency appreciates relative to dollar /
dollar depreciates U.S. exports seem cheaper / U.S. imports seem more expensive Xn
Higher U.S. interest rates ----- financial capital flows to the U.S. from foreign nations (inflow of capital)Higher foreign interest rates ---- financial capital flows from the U.S. to foreign nations (outflow of capital)
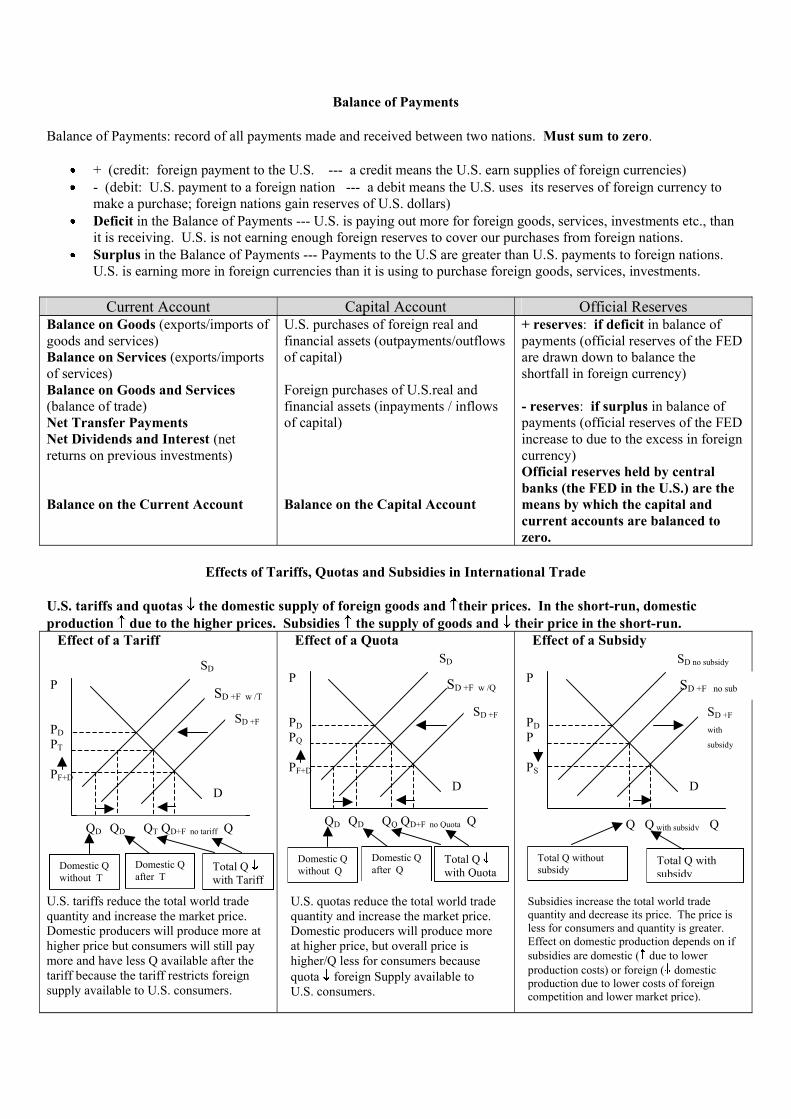
Balance of Payments
Balance of Payments: record of all payments made and received between two nations. Must sum to zero.
+ (credit: foreign payment to the U.S. --- a credit means the U.S. earn supplies of foreign currencies)- (debit: U.S. payment to a foreign nation --- a debit means the U.S. uses its reserves of foreign currency tomake a purchase; foreign nations gain reserves of U.S. dollars)Deficit in the Balance of Payments --- U.S. is paying out more for foreign goods, services, investments etc., thanit is receiving. U.S. is not earning enough foreign reserves to cover our purchases from foreign nations.Surplus in the Balance of Payments --- Payments to the U.S are greater than U.S. payments to foreign nations.U.S. is earning more in foreign currencies than it is using to purchase foreign goods, services, investments.
Current Account Capital Account Official ReservesBalance on Goods (exports/imports ofgoods and services)Balance on Services (exports/importsof services)Balance on Goods and Services(balance of trade)Net Transfer PaymentsNet Dividends and Interest (netreturns on previous investments)
Balance on the Current Account
U.S. purchases of foreign real andfinancial assets (outpayments/outflowsof capital)
Foreign purchases of U.S.real andfinancial assets (inpayments / inflowsof capital)
Balance on the Capital Account
+ reserves: if deficit in balance ofpayments (official reserves of the FEDare drawn down to balance theshortfall in foreign currency)
- reserves: if surplus in balance ofpayments (official reserves of the FEDincrease to due to the excess in foreigncurrency)Official reserves held by centralbanks (the FED in the U.S.) are themeans by which the capital andcurrent accounts are balanced tozero.
Effects of Tariffs, Quotas and Subsidies in International Trade
U.S. tariffs and quotas the domestic supply of foreign goods and their prices. In the short-run, domesticproduction due to the higher prices. Subsidies the supply of goods and their price in the short-run.
Effect of a Tariff
U.S. tariffs reduce the total world tradequantity and increase the market price.Domestic producers will produce more athigher price but consumers will still paymore and have less Q available after thetariff because the tariff restricts foreignsupply available to U.S. consumers.
Effect of a Quota Effect of a Subsidy
Total Q withsubsidy
Total Q withoutsubsidy
D
SD +F
with
subsidy
P
PD
P
PS
Q Q with subsidy Q
SD +F no sub
Total Qwith Quota
Total Qwith Tariff
Domestic Qafter Q
Domestic Qwithout Q
D
SD +F
P
PD
PQ
PF+D
Domestic Qafter T
Domestic Qwithout T
D
SD +F
SD +F w /T
QD QD QT QD+F no tariff Q
P
PD
PT
PF+D
SD
QD QD QQ QD+F no Quota Q
SD +F w /Q
Subsidies increase the total world tradequantity and decrease its price. The price isless for consumers and quantity is greater.Effect on domestic production depends on ifsubsidies are domestic ( due to lowerproduction costs) or foreign ( domesticproduction due to lower costs of foreigncompetition and lower market price).
SD no subsidy
U.S. quotas reduce the total world tradequantity and increase the market price.Domestic producers will produce moreat higher price, but overall price ishigher/Q less for consumers becausequota foreign Supply available toU.S. consumers.
SD
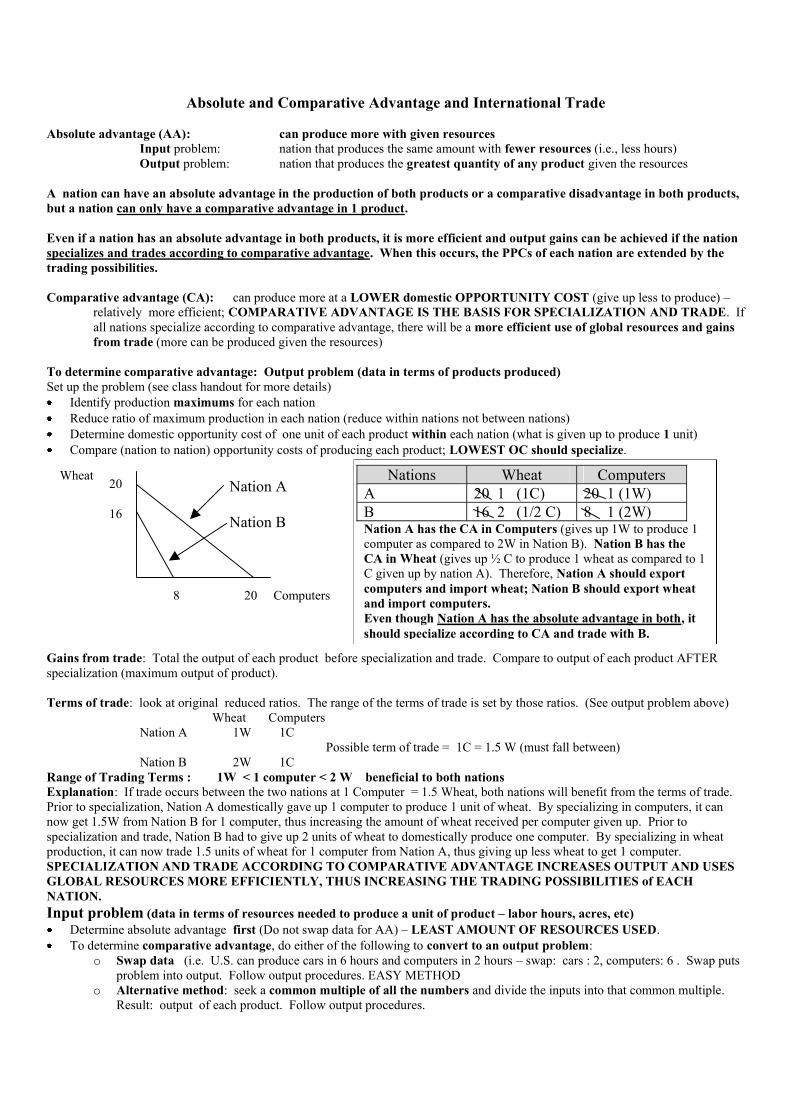
Absolute and Comparative Advantage and International Trade
Absolute advantage (AA): can produce more with given resourcesInput problem: nation that produces the same amount with fewer resources (i.e., less hours)Output problem: nation that produces the greatest quantity of any product given the resources
A nation can have an absolute advantage in the production of both products or a comparative disadvantage in both products,but a nation can only have a comparative advantage in 1 product.
Even if a nation has an absolute advantage in both products, it is more efficient and output gains can be achieved if the nationspecializes and trades according to comparative advantage. When this occurs, the PPCs of each nation are extended by thetrading possibilities.
Comparative advantage (CA): can produce more at a LOWER domestic OPPORTUNITY COST (give up less to produce) � relatively more efficient; COMPARATIVE ADVANTAGE IS THE BASIS FOR SPECIALIZATION AND TRADE. Ifall nations specialize according to comparative advantage, there will be a more efficient use of global resources and gainsfrom trade (more can be produced given the resources)
To determine comparative advantage: Output problem (data in terms of products produced)Set up the problem (see class handout for more details)
Identify production maximums for each nationReduce ratio of maximum production in each nation (reduce within nations not between nations)Determine domestic opportunity cost of one unit of each product within each nation (what is given up to produce 1 unit)Compare (nation to nation) opportunity costs of producing each product; LOWEST OC should specialize.
Nations Wheat ComputersA 20 1 (1C) 20 1 (1W)B 16 2 (1/2 C) 8 1 (2W)Nation A has the CA in Computers (gives up 1W to produce 1computer as compared to 2W in Nation B). Nation B has theCA in Wheat (gives up ½ C to produce 1 wheat as compared to 1C given up by nation A). Therefore, Nation A should exportcomputers and import wheat; Nation B should export wheatand import computers.Even though Nation A has the absolute advantage in both, itshould specialize according to CA and trade with B.
Nation A
Nation B
8 20 Computers
Wheat20
16
Gains from trade: Total the output of each product before specialization and trade. Compare to output of each product AFTERspecialization (maximum output of product).
Terms of trade: look at original reduced ratios. The range of the terms of trade is set by those ratios. (See output problem above)Wheat Computers
Nation A 1W 1CPossible term of trade = 1C = 1.5 W (must fall between)
Nation B 2W 1CRange of Trading Terms : 1W < 1 computer < 2 W beneficial to both nationsExplanation: If trade occurs between the two nations at 1 Computer = 1.5 Wheat, both nations will benefit from the terms of trade.Prior to specialization, Nation A domestically gave up 1 computer to produce 1 unit of wheat. By specializing in computers, it cannow get 1.5W from Nation B for 1 computer, thus increasing the amount of wheat received per computer given up. Prior tospecialization and trade, Nation B had to give up 2 units of wheat to domestically produce one computer. By specializing in wheatproduction, it can now trade 1.5 units of wheat for 1 computer from Nation A, thus giving up less wheat to get 1 computer.SPECIALIZATION AND TRADE ACCORDING TO COMPARATIVE ADVANTAGE INCREASES OUTPUT AND USESGLOBAL RESOURCES MORE EFFICIENTLY, THUS INCREASING THE TRADING POSSIBILITIES of EACHNATION.
Input problem (data in terms of resources needed to produce a unit of product � labor hours, acres, etc)Determine absolute advantage first (Do not swap data for AA) � LEAST AMOUNT OF RESOURCES USED.To determine comparative advantage, do either of the following to convert to an output problem:
o Swap data (i.e. U.S. can produce cars in 6 hours and computers in 2 hours � swap: cars : 2, computers: 6 . Swap putsproblem into output. Follow output procedures. EASY METHOD
o Alternative method: seek a common multiple of all the numbers and divide the inputs into that common multiple.Result: output of each product. Follow output procedures.