14
Missouri THE 10TH ANNUAL AP ® Report to the Nation STATE SUPPLEMENT FEBRUARY 11, 2014
Mis
sou
ri
THE 10TH ANNUAL
AP® Report to the NationSTATE SUPPLEMENT FEBRUARY 11, 2014
2
T H E 1 0 T H A N N U A L A P R E P O R T T O T H E N A T I O N · M I S S O U R I S U P P L E M E N T
About This Report
This report provides educators and policymakers with information
they can use to celebrate their successes, understand their unique
challenges, and set meaningful goals to increase opportunity for all
students. It’s important to note that while AP® Exams are valid
measures of students’ content mastery of college-level studies in
specific academic disciplines, AP results should never be used as
the sole measure for gauging educational excellence and equity.
Because reliable demographic data for nonpublic schools are not
available for all states, this report represents public school students
only. Additionally, this report looks at students’ entire experience
with AP — tracking exams taken by graduates throughout their high
school careers — as opposed to reporting exam results from a
particular calendar year.
Additional data are available at apreport.collegeboard.org.
Table of Contents
3 State Strategies
6 Fostering AP® Participation and Success
8 A Closer Look at Equity Gaps in AP Participation and Success
Note: Throughout this report, public high school graduates represent projections supplied in Knocking at the College Door (Western Interstate Commission for Higher Education, 2012).
The redesigned courses, Biology, Latin, and Spanish Literature and Culture, began in fall 2012, and the first AP Exam based on those redesigned courses was administered in May 2013. As a result, the data in this report reflect a blend of the old and redesigned exam results.
3
T H E 1 0 T H A N N U A L A P R E P O R T T O T H E N A T I O N · M I S S O U R I S U P P L E M E N T
STATE STRATEG IESSTATE STRATEG IES
Missouri has made progress in recent years in improving student access and supporting student performance in AP®. Just as we do in the national report, we wanted to take an opportunity to applaud your efforts and offer additional strategies for your consideration.
Current Picture
Congratulations. You are already using these strategies to build a robust AP Program. You:
Include AP in the state accountability system. • Establish AP participation and performance indicators.
Have 6 districts that have earned a spot on the AP Honor Roll through their hard work and dedication to increasing participation and success in AP, particularly for underrepresented students. See page 5 for more details.
Encourage your educators to participate in the development of the AP Program, such as by becoming AP Exam Readers or participating in course and exam development committees. See page 5 for more details.

4
T H E 1 0 T H A N N U A L A P R E P O R T T O T H E N A T I O N · M I S S O U R I S U P P L E M E N T
STATE STRATEG IESSTATE STRATEG IES
The following strategies have been proven effective. To build an even stronger AP program, you could:
¨ Create opportunities for other schools and districts to learn from your AP Honor Roll winners.
¨ Ensure that public colleges and universities develop AP Exam credit and placement policies based on institutional goals, alignment with corresponding courses, and objective outcomes research.
¨ Provide funding for teachers in underserved areas of the state to participate in professional development.
¨ Provide targeted assistance and resources to schools serving traditionally underserved populations. For example, funding for materials, supplies, outreach efforts, and tutoring programs.
¨ Clearly communicate how AP fits into state graduation requirements, and share information about funding opportunities that enable students to participate and succeed in AP.
¨ Provide resources to schools and districts to support research-based programs that build content knowledge and skills— particularly in literacy and math— to prepare students for success in AP course work, and in college and careers.
¨ Communicate the state’s AP STEM college scholarship opportunity directly to students.
Opportunities
5
T H E 1 0 T H A N N U A L A P R E P O R T T O T H E N A T I O N · M I S S O U R I S U P P L E M E N T
STATE STRATEG IESSTATE STRATEG IES
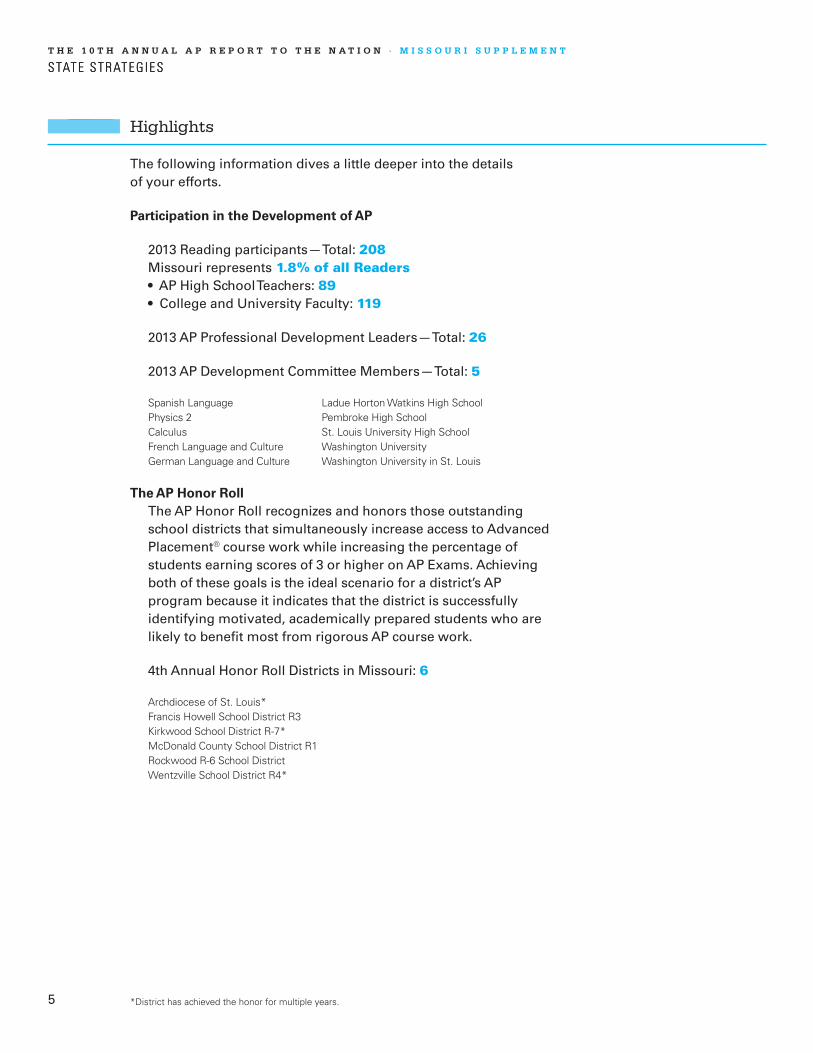
The following information dives a little deeper into the details of your efforts.
Participation in the Development of AP
2013 Reading participants — Total: 208 Missouri represents 1.8% of all Readers • AP High School Teachers: 89 • College and University Faculty: 119
2013 AP Professional Development Leaders — Total: 26
2013 AP Development Committee Members — Total: 5
Spanish Language Ladue Horton Watkins High SchoolPhysics 2 Pembroke High SchoolCalculus St. Louis University High SchoolFrench Language and Culture Washington UniversityGerman Language and Culture Washington University in St. Louis
The AP Honor RollThe AP Honor Roll recognizes and honors those outstanding school districts that simultaneously increase access to Advanced Placement® course work while increasing the percentage of students earning scores of 3 or higher on AP Exams. Achieving both of these goals is the ideal scenario for a district’s AP program because it indicates that the district is successfully identifying motivated, academically prepared students who are likely to benefit most from rigorous AP course work.
4th Annual Honor Roll Districts in Missouri: 6
Archdiocese of St. Louis*Francis Howell School District R3Kirkwood School District R-7*McDonald County School District R1Rockwood R-6 School DistrictWentzville School District R4*
Highlights
*District has achieved the honor for multiple years.
6
T H E 1 0 T H A N N U A L A P R E P O R T T O T H E N A T I O N · M I S S O U R I S U P P L E M E N T
FOSTER ING AP PART IC IPAT ION AND SUCCESS
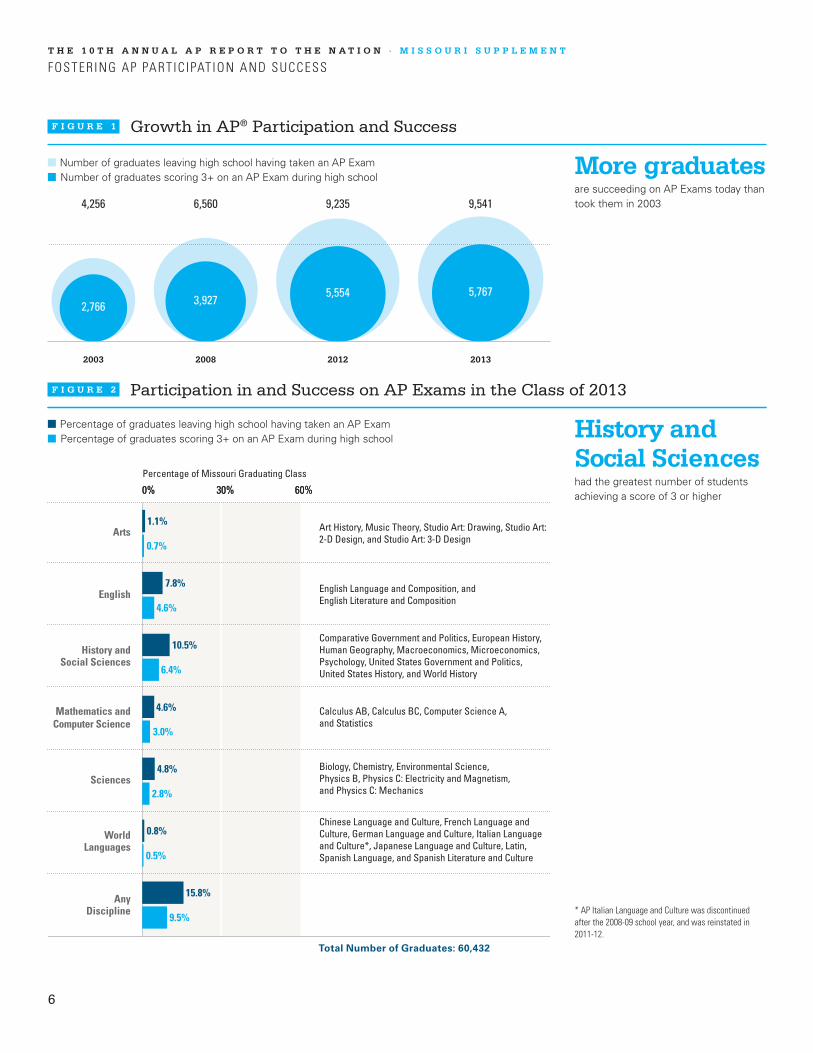
More graduatesare succeeding on AP Exams today than took them in 2003
History and Social Scienceshad the greatest number of students achieving a score of 3 or higher
F I G U R E 1 Growth in AP® Participation and Success
F I G U R E 2 Participation in and Success on AP Exams in the Class of 2013
Number of graduates leaving high school having taken an AP Exam Number of graduates scoring 3+ on an AP Exam during high school
2003 2008 2012 2013
6,5604,256 9,235 9,541
3,9272,7665,554 5,767
60%30%0%
Percentage of Missouri Graduating Class
Arts
English
WorldLanguages
Mathematics andComputer Science
Sciences
History andSocial Sciences
AnyDiscipline
Total Number of Graduates: 60,432
1.1%
7.8%
10.5%
4.6%
4.8%
0.8%
15.8%
0.7%
4.6%
6.4%
3.0%
2.8%
0.5%
9.5%
60%30%0%
Percentage of graduates leaving high school having taken an AP Exam Percentage of graduates scoring 3+ on an AP Exam during high school
* AP Italian Language and Culture was discontinued after the 2008-09 school year, and was reinstated in 2011-12.
Art History, Music Theory, Studio Art: Drawing, Studio Art: 2-D Design, and Studio Art: 3-D Design
English Language and Composition, and English Literature and Composition
Comparative Government and Politics, European History, Human Geography, Macroeconomics, Microeconomics, Psychology, United States Government and Politics, United States History, and World History
Calculus AB, Calculus BC, Computer Science A, and Statistics
Biology, Chemistry, Environmental Science, Physics B, Physics C: Electricity and Magnetism, and Physics C: Mechanics
Chinese Language and Culture, French Language and Culture, German Language and Culture, Italian Language and Culture*, Japanese Language and Culture, Latin, Spanish Language, and Spanish Literature and Culture
7
T H E 1 0 T H A N N U A L A P R E P O R T T O T H E N A T I O N · M I S S O U R I S U P P L E M E N T
FOSTER ING AP PART IC IPAT ION AND SUCCESS
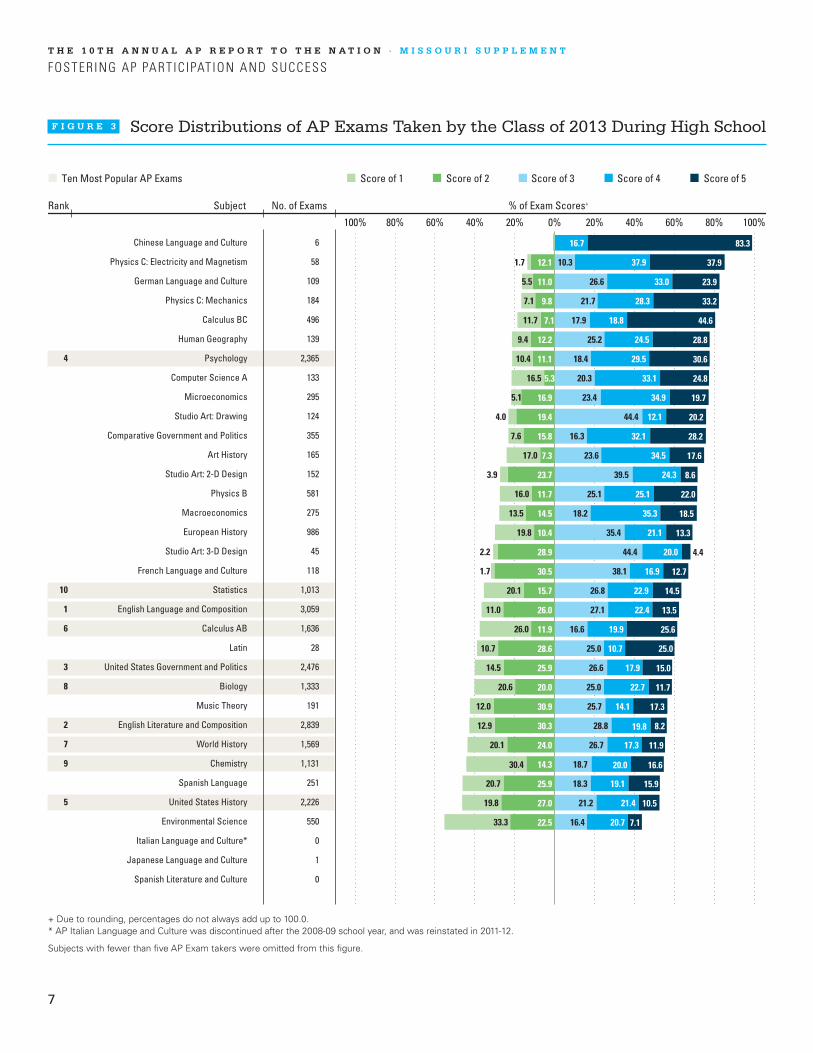
+ Due to rounding, percentages do not always add up to 100.0.* AP Italian Language and Culture was discontinued after the 2008-09 school year, and was reinstated in 2011-12.
Subjects with fewer than five AP Exam takers were omitted from this figure.
F I G U R E 3 Score Distributions of AP Exams Taken by the Class of 2013 During High School
Rank
100% 80% 60% 40% 20% 0% 20% 40% 60% 80% 100%
Subject No. of Exams % of Exam Scores+
Chinese Language and Culture 6
Physics C: Electricity and Magnetism 58
German Language and Culture 109
Physics C: Mechanics 184
Calculus BC 496
Human Geography 139
4 Psychology 2,365
Computer Science A 133
Microeconomics 295
Studio Art: Drawing 124
Comparative Government and Politics 355
Art History 165
Studio Art: 2-D Design 152
Physics B 581
Macroeconomics 275
European History 986
Studio Art: 3-D Design 45
French Language and Culture 118
10 Statistics 1,013
1 English Language and Composition 3,059
6 Calculus AB 1,636
Latin 28
3 United States Government and Politics 2,476
8 Biology 1,333
Music Theory 191
2 English Literature and Composition 2,839
7 World History 1,569
9 Chemistry 1,131
Spanish Language 251
5 United States History 2,226
Environmental Science 550
Italian Language and Culture* 0
Japanese Language and Culture 1
Spanish Literature and Culture 0
1.7
5.5
7.1
11.7
9.4
10.4
16.5
5.1
4.0
7.6
17.0
3.9
16.0
13.5
19.8
2.2
1.7
20.1
11.0
26.0
10.7
14.5
20.6
12.0
12.9
20.1
30.4
20.7
19.8
33.3
10.3
26.6
21.7
17.9
25.2
18.4
20.3
23.4
44.4
16.3
23.6
39.5
25.1
18.2
35.4
44.4
38.1
26.8
27.1
16.6
25.0
26.6
25.0
25.7
28.8
26.7
18.7
18.3
21.2
16.4
16.7
37.9
33.0
28.3
18.8
24.5
29.5
33.1
34.9
12.1
32.1
34.5
24.3
25.1
35.3
21.1
20.0
16.9
22.9
22.4
19.9
10.7
17.9
22.7
14.1
19.8
17.3
20.0
19.1
21.4
20.7
-
0.0
12.1
11.0
9.8
7.1
12.2
11.1
5.3
16.9
19.4
15.8
7.3
23.7
11.7
14.5
10.4
28.9
30.5
15.7
26.0
11.9
28.6
25.9
20.0
30.9
30.3
24.0
14.3
25.9
27.0
22.5
83.3
37.9
23.9
33.2
44.6
28.8
30.6
24.8
19.7
20.2
28.2
17.6
8.6
22.0
18.5
13.3
4.4
12.7
14.5
13.5
25.6
25.0
15.0
11.7
17.3
8.2
11.9
16.6
15.9
10.5
7.1

8
T H E 1 0 T H A N N U A L A P R E P O R T T O T H E N A T I O N · M I S S O U R I S U P P L E M E N T
A CLOSER LOOK AT EQUITY GAPS IN AP PART IC IPAT ION AND SUCCESS
Low IncomeF I G U R E 4 Trends in AP Exam Participation and Success
3,709AP Exams were taken by low-income graduates in the class of 2013
The percentage or number of ...
• K–12 students eligible for free or reduced-price lunch*
• graduates leaving high school having taken an AP Exam who are from low-income backgrounds
• graduates scoring 3+ on an AP Exam during high school who are from low-income backgrounds
2003 2008 2012 2013
** ** ** **
129 470 1,550 1,575
60 131 511 543
2003 2005 2008 20122011 2013
PE
RC
EN
TA
GE
OF
SP
EC
IF
IC
PO
PU
LA
TI
ON
G R A D U A T I N G C L A S S
10%
20%
0%
30%
40%
50%
60%
70%
80%
90%
100%
39.1%
39.5%
45.0%
3.0% 3.1%7.2%
14.3%16.8% 16.5%
2.2% 2.2% 3.3%
7.1%9.2% 9.4%
* Estimates reflect the percentage of K–12 public school students eligible for free or reduced-price lunch. SOURCE: U.S. Department of Education, National Center for Education Statistics, Digest of Education Statistics: 2008 (Table 42), 2009 (Table 42), 2010 (Table 44), 2011 (Table 45), and 2012 (Table 46).
** The numbers of students in the graduating classes who are eligible for free or reduced-price lunch are not available.
9
T H E 1 0 T H A N N U A L A P R E P O R T T O T H E N A T I O N · M I S S O U R I S U P P L E M E N T
A CLOSER LOOK AT EQUITY GAPS IN AP PART IC IPAT ION AND SUCCESS
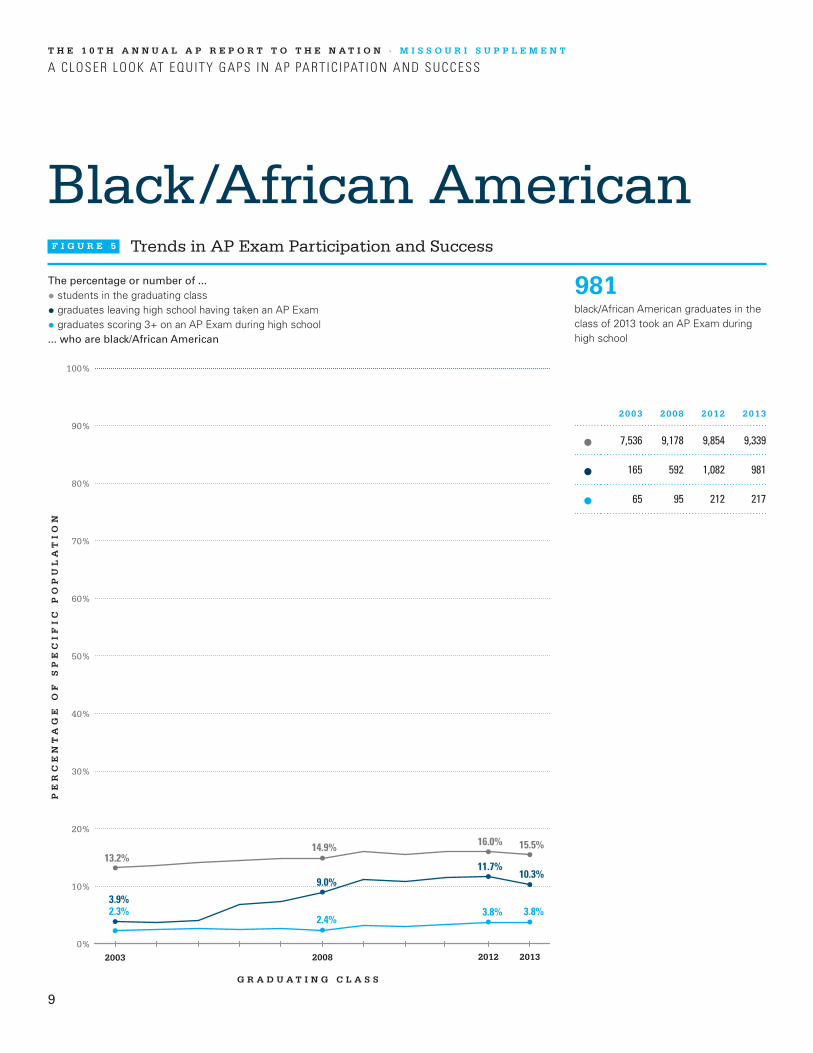
Black/African AmericanF I G U R E 5 Trends in AP Exam Participation and Success
981black/African American graduates in the class of 2013 took an AP Exam during high school
The percentage or number of ...
• students in the graduating class
• graduates leaving high school having taken an AP Exam
• graduates scoring 3+ on an AP Exam during high school... who are black/African American
2003 2008 2012 2013
7,536 9,178 9,854 9,339
165 592 1,082 981
65 95 212 217
2003 2008 2012 2013
PE
RC
EN
TA
GE
OF
SP
EC
IF
IC
PO
PU
LA
TI
ON
G R A D U A T I N G C L A S S
10%
20%
0%
30%
40%
50%
60%
70%
80%
90%
100%
13.2%14.9% 16.0% 15.5%
3.9%
9.0%11.7%
10.3%
2.3%2.4%
3.8% 3.8%

10
T H E 1 0 T H A N N U A L A P R E P O R T T O T H E N A T I O N · M I S S O U R I S U P P L E M E N T
A CLOSER LOOK AT EQUITY GAPS IN AP PART IC IPAT ION AND SUCCESS
Hispanic/LatinoF I G U R E 6 Trends in AP Exam Participation and Success
343Hispanic/Latino graduates in the class of 2013 took an AP Exam during high school
The percentage or number of ...
• students in the graduating class
• graduates leaving high school having taken an AP Exam
• graduates scoring 3+ on an AP Exam during high school... who are Hispanic/Latino
2003 2008 2012 2013
867 1,498 2,116 2,193
69 214 310 343
48 112 160 183
2003 2008 2012 2013
PE
RC
EN
TA
GE
OF
SP
EC
IF
IC
PO
PU
LA
TI
ON
G R A D U A T I N G C L A S S
10%
20%
0%
30%
40%
50%
60%
70%
80%
90%
100%
1.5%2.4%
3.4% 3.6%
1.6%
3.3%3.4% 3.6%1.7% 2.9%2.9% 3.2%
11
T H E 1 0 T H A N N U A L A P R E P O R T T O T H E N A T I O N · M I S S O U R I S U P P L E M E N T
A CLOSER LOOK AT EQUITY GAPS IN AP PART IC IPAT ION AND SUCCESS
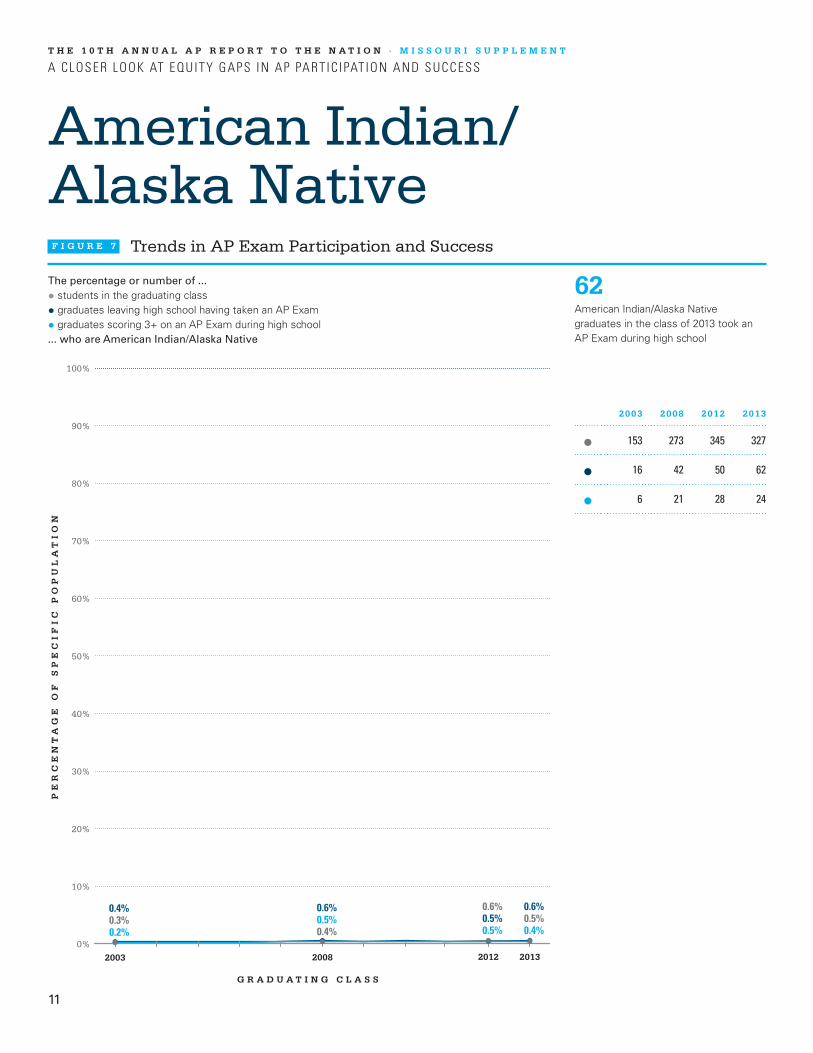
American Indian/ Alaska NativeF I G U R E 7 Trends in AP Exam Participation and Success
62American Indian/Alaska Native graduates in the class of 2013 took an AP Exam during high school
The percentage or number of ...
• students in the graduating class
• graduates leaving high school having taken an AP Exam
• graduates scoring 3+ on an AP Exam during high school... who are American Indian/Alaska Native
2003 2008 2012 2013
153 273 345 327
16 42 50 62
6 21 28 24
2003 2008 2012 2013
PE
RC
EN
TA
GE
OF
SP
EC
IF
IC
PO
PU
LA
TI
ON
G R A D U A T I N G C L A S S
10%
20%
0%
30%
40%
50%
60%
70%
80%
90%
100%
0.3%0.4%
0.5%0.4%
0.4% 0.6% 0.6% 0.6%
0.2%0.5%
0.5%0.5%
12
T H E 1 0 T H A N N U A L A P R E P O R T T O T H E N A T I O N · M I S S O U R I S U P P L E M E N T
A CLOSER LOOK AT EQUITY GAPS IN AP PART IC IPAT ION AND SUCCESS
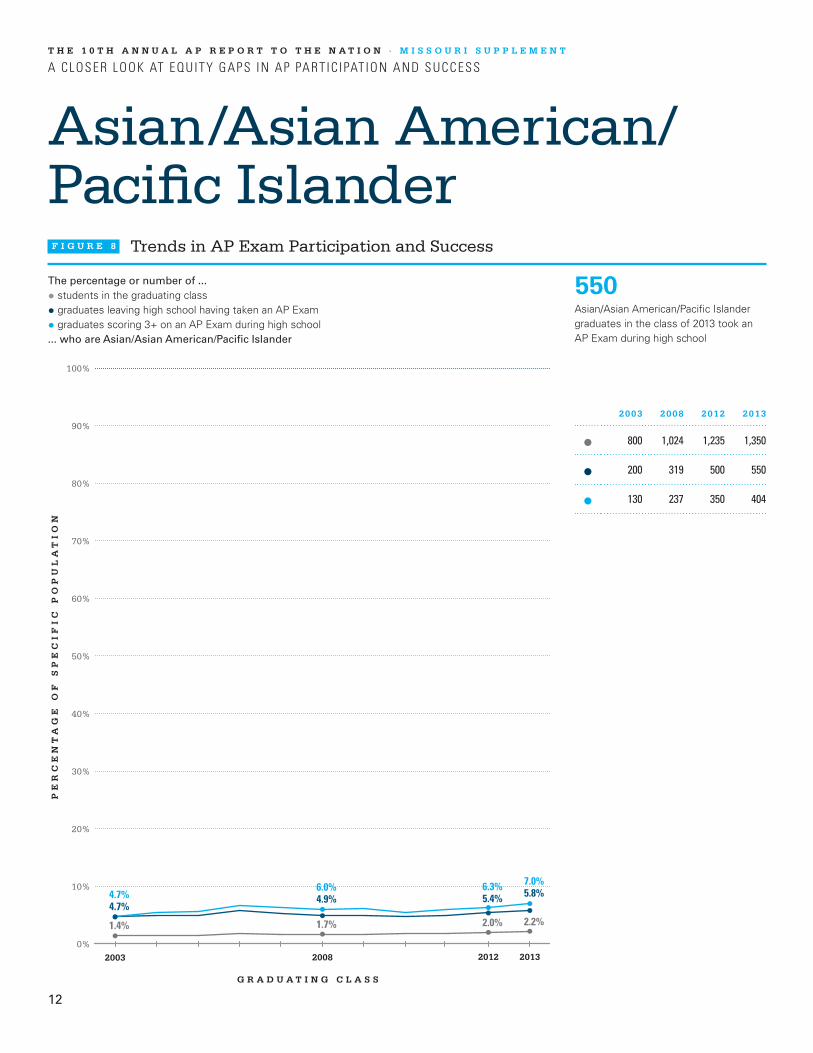
Asian/Asian American/ Pacific IslanderF I G U R E 8 Trends in AP Exam Participation and Success
550Asian/Asian American/Pacific Islander graduates in the class of 2013 took an AP Exam during high school
The percentage or number of ...
• students in the graduating class
• graduates leaving high school having taken an AP Exam
• graduates scoring 3+ on an AP Exam during high school... who are Asian/Asian American/Pacific Islander
2003 2008 2012 2013
800 1,024 1,235 1,350
200 319 500 550
130 237 350 404
2003 2008 2012 2013
PE
RC
EN
TA
GE
OF
SP
EC
IF
IC
PO
PU
LA
TI
ON
G R A D U A T I N G C L A S S
10%
20%
0%
30%
40%
50%
60%
70%
80%
90%
100%
1.4% 1.7% 2.0% 2.2%4.7%
4.9% 5.4% 5.8%4.7%6.0% 6.3% 7.0%
13
T H E 1 0 T H A N N U A L A P R E P O R T T O T H E N A T I O N · M I S S O U R I S U P P L E M E N T
A CLOSER LOOK AT EQUITY GAPS IN AP PART IC IPAT ION AND SUCCESS
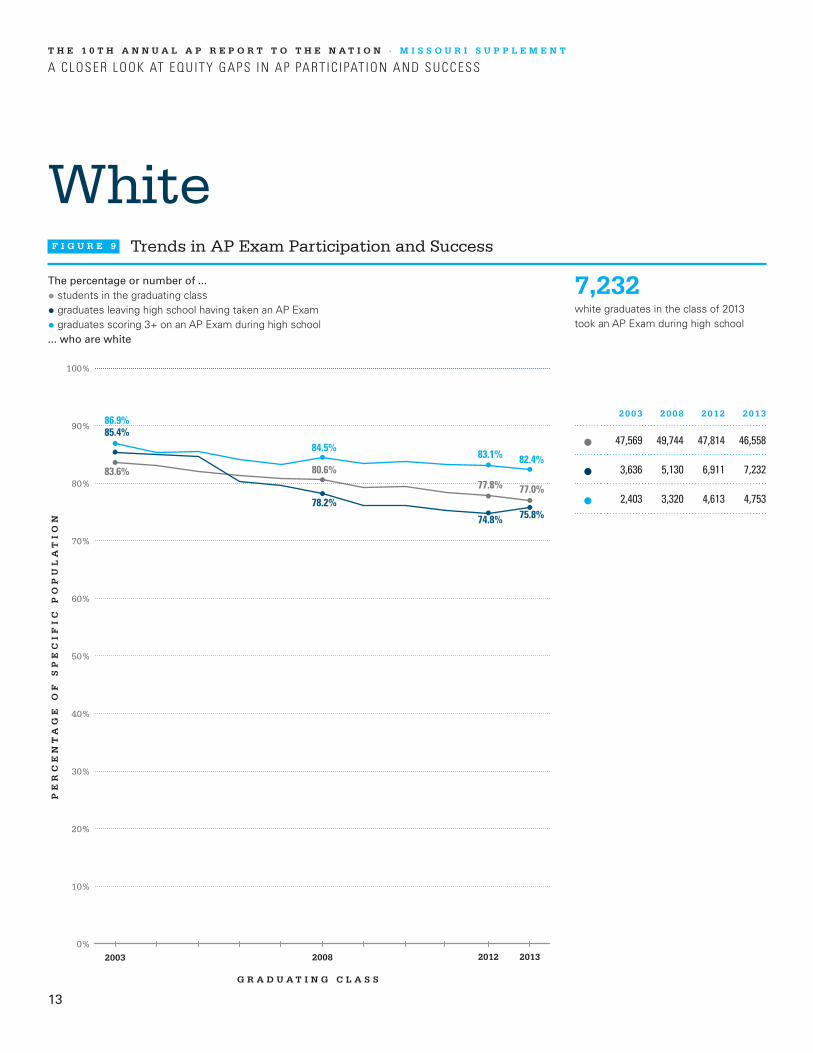
WhiteF I G U R E 9 Trends in AP Exam Participation and Success
7,232white graduates in the class of 2013 took an AP Exam during high school
The percentage or number of ...
• students in the graduating class
• graduates leaving high school having taken an AP Exam
• graduates scoring 3+ on an AP Exam during high school... who are white
2003 2008 2012 2013
47,569 49,744 47,814 46,558
3,636 5,130 6,911 7,232
2,403 3,320 4,613 4,753
2003 2008 2012 2013
PE
RC
EN
TA
GE
OF
SP
EC
IF
IC
PO
PU
LA
TI
ON
G R A D U A T I N G C L A S S
10%
20%
0%
30%
40%
50%
60%
70%
80%
90%
100%
83.6% 80.6%77.8% 77.0%
85.4%
78.2%
74.8% 75.8%
86.9%
84.5%83.1% 82.4%

14
ABOUT THE COLLEGE BOARD
The College Board is a mission-driven not-for-profit
organization that connects students to college success
and opportunity. Founded in 1900, the College Board
was created to expand access to higher education.
Today, the membership association is made up of over
6,000 of the world’s leading educational institutions
and is dedicated to promoting excellence and equity in
education. Each year, the College Board helps more
than seven million students prepare for a successful
transition to college through programs and services in
college readiness and college success — including
the SAT®, and the Advanced Placement Program®. The
organization also serves the education community through
research and advocacy on behalf of students, educators,
and schools.
For further information, visit www.collegeboard.org.
© 2014 The College Board. College Board, Advanced Placement, Advanced Placement Program, AP, SAT and the acorn logo are registered trademarks of the College Board. All other products and services may be trademarks of their respective owners. Visit the College Board on the Web: www.collegeboard.org.
apreport.collegeboard.org


