AP42 Section: 2.2 Background chapter: 4 Reference Number: 23 Title: Emissions Testing of Incinerator No. 2. Green Bay Metropolitan Sewer District, Green Bay, Wisconsin, [STAPPNALAPCOIO6/12/86-No. 191 Author: Engineering Science, McLean, VA October 1981
Transcript
AP42 Section: 2.2
Background chapter: 4
Reference Number: 23
Title: Emissions Testing of Incinerator No. 2. Green Bay Metropolitan Sewer District, Green Bay, Wisconsin,
[STAPPNALAPCOIO6/12/86-No. 191
Author: Engineering Science, McLean, VA
October 1981
EPA
Text Box
Note: This material is related to a section in AP42, Compilation of Air Pollutant Emission Factors, Volume I Stationary Point and Area Sources. AP42 is located on the EPA web site at www.epa.gov/ttn/chief/ap42/ The file name refers to the file number, the AP42 chapter and then the section. The file name "rel01_c01s02.pdf" would mean the file relates to AP42 chapter 1 section 2. The document may be out of date and related to a previous version of the section. The document has been saved for archival and historical purposes. The primary source should always be checked. If current related information is available, it will be posted on the AP42 webpage with the current version of the section.
.(I
I I,
'L
TABLE OF CONTElpS
CHAPPER 1 INTRODUCTION
CHAPTER 2 PROCESS DESCRIPTION
CHAPTER 3 SUMMARY OF RESULTS
CBAPPER 4 SAMPLING LOCATIONS & PROCEDURES
CHAPTER 5 ANALYTICAL PRCCEDUReS
APPENDIX A FIELD DATA
APPENDIX B EiAMPLE CALCULATION FOR PARTICULATE MATTER BURN 1, TEST 2 (RUN GBM-2) & COMPUTER CALCULATIONS FOR ALL RUNS
APPENDIX C EQUIPMENT CALIBRATION DATA
APPEND= D LRBORATORY DATA
APPENDIX E INCINERATOR PROCESS DATA
,
1- 1
2-1
3-1
4- 1
5-1
LIST OF FIG^
'I 1
2.2
4.1 4.2 4.3
4.4 4.5
4.6
2.1
3.1
3.2 3.3
3.4 3.5
3.6
Process Flow of Sludge Incinerators
Test Locations for Incinerator NO. 2 Diagram of Scrubber Inlet Sampling Location Cross Sectional Diagram Showing the Scrubber
Diagram of Scrubber Outlet Sampling Location Cross Sectional Diagram Showing the Scrubber
Particulate Sampling Train
Inlet Sampling Locations
Outlet Sampling Point Locations
LIST OF TABLES
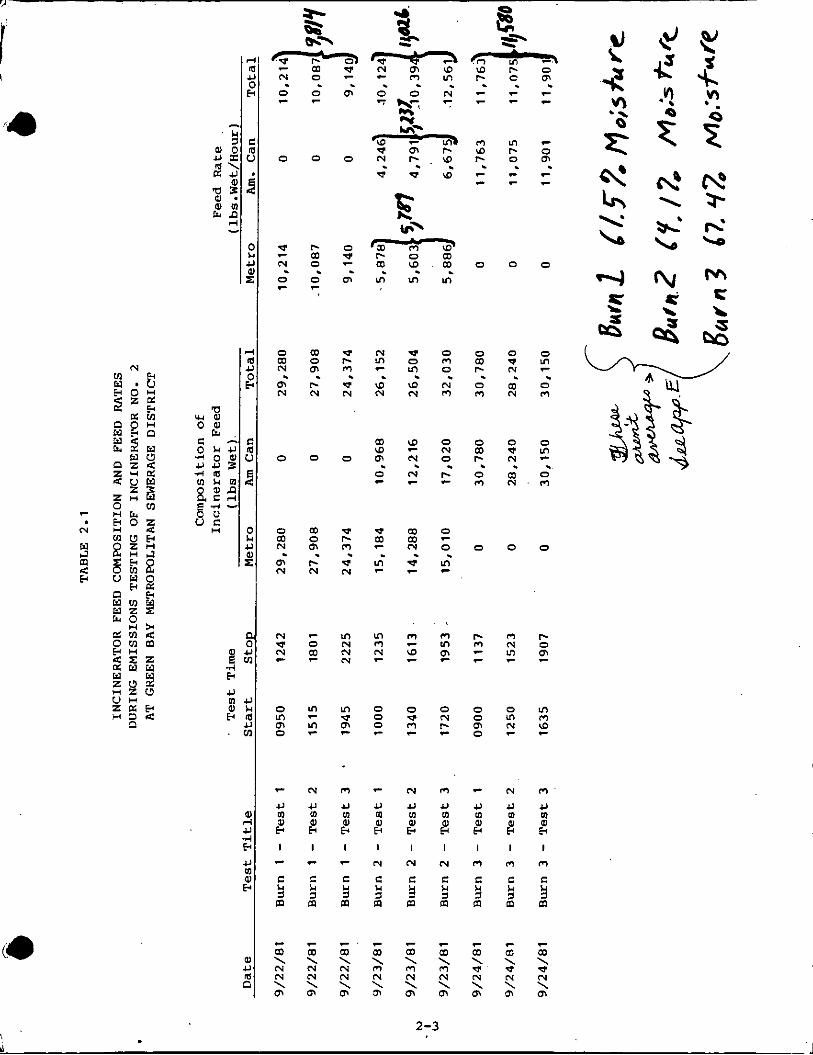
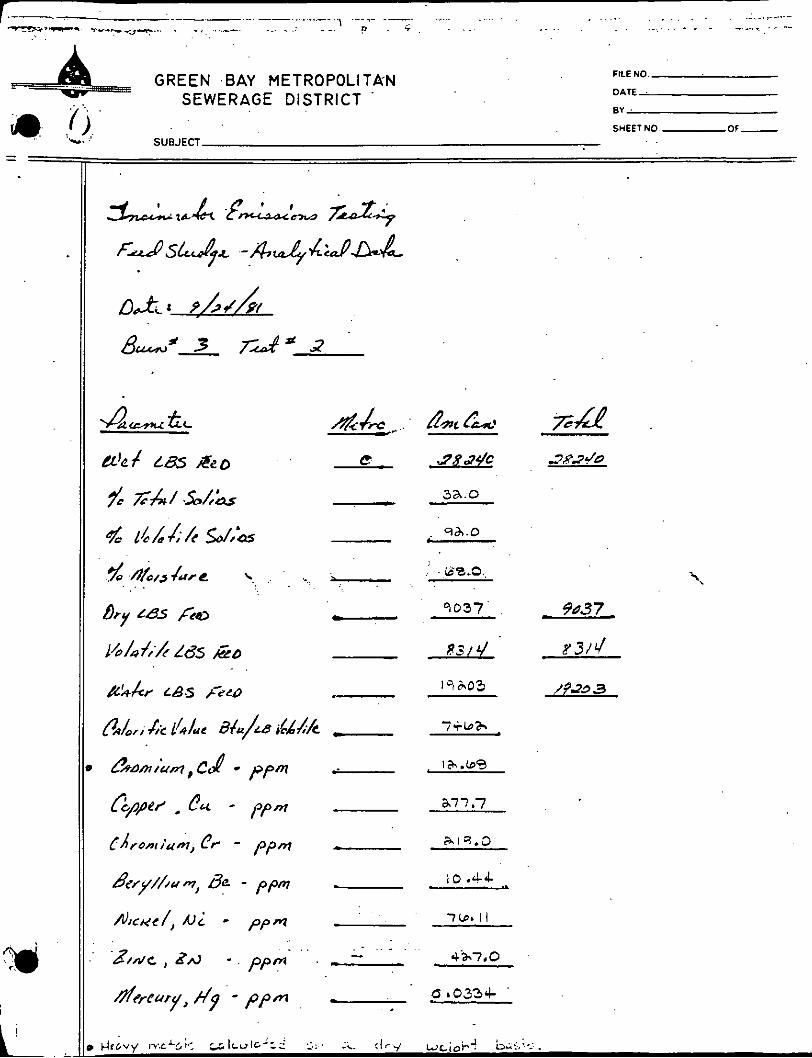
Incinerator Feed Composition and Feed Rates Dur- ing Emissions Testing of Incinerator No. 2
Emissions From Incinerator NO. 2 During Burn
Test Data Summary for Burn 1 Emissions from Incinerator NO. 2 During Burn
Test Data Summary for Burn 2 Emissions from Incinerator NO. 2 During Burn
Test Data Summary for Burn 3
Number 2
Number 2
Number 3
ii
2-2
4-2 4-3
4-4 4-5
4-7 4-8
2-3
3-2 3-3
3-4 3-5 3-6
3-7
1 -
C I I I r I I
I I I
i I I 8. 1.
c
I I
CHAPTER 1 ;Y
INTRODUCTION
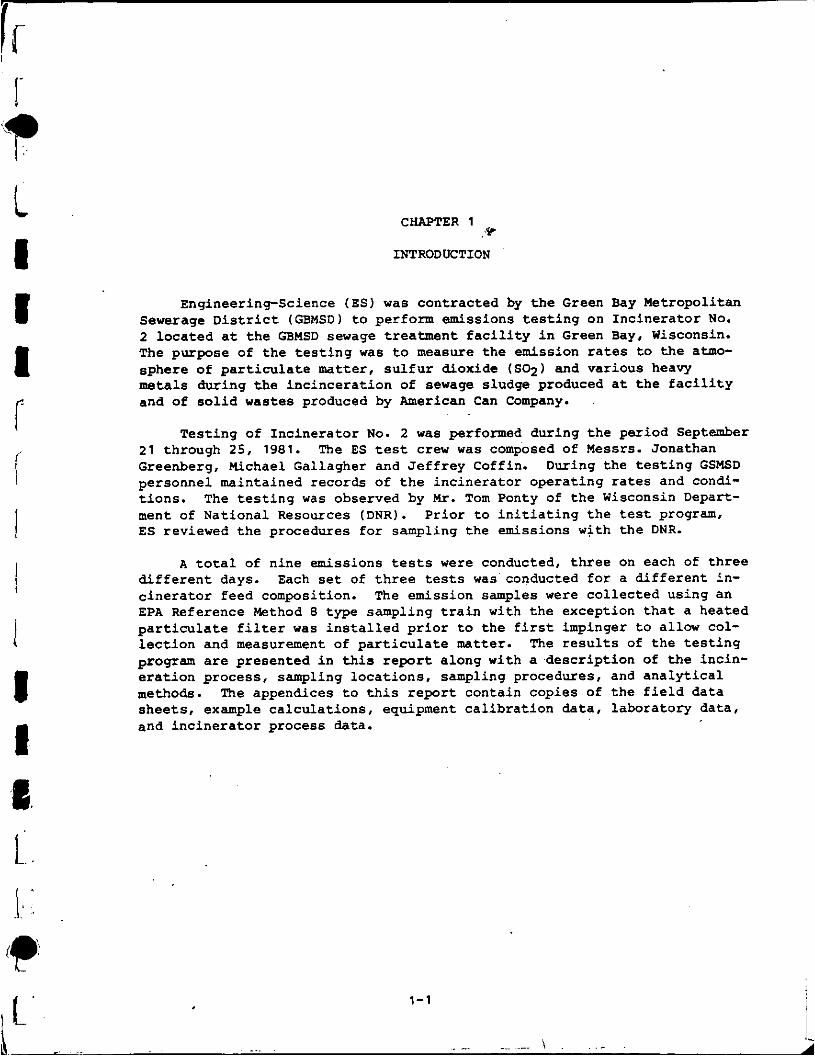
Engineering-Science (ES) was contracted by t h e Green Bay Metropolitan Sewerage D i s t r i c t (GBMSD) t o perform emissions t e s t i n g on Incinerator NO.
2 located a t t he GBMSD sewage t reatment f a c i l i t y in G r e e n Bay, Wisconsin. The purpose of t he t e s t i n g was t o measure the emission ra tes t o the atmo- sphere of p a r t i c u l a t e matter, s u l f u r dioxide (SO*) and various heavy metals during t h e inc incera t ion of sewage sludge produced a t t h e f a c i l i t y and of s o l i d wastes produced by American Can Company.
Test ing of Incinerator N o . 2 w a s performed during t h e period September 21 through 25, 1981. The ES test crew w a s composed of Messrs. Jonathan Greenberg, Michael Gallagher and J e f f r e y Coffin. During the t e s t i n g GSMSD personnel maintained records of t h e inc inera tor operat ing r a t e s and condi- t i ons . The t e s t i n g was observed by Mr. Tom Ponty of t he Wisconsin Depart- ment of National Resources ( D N R ) . P r ior t o i n i t i a t i n g the tes t program, E S reviewed the procedures f o r sampling the emissions with the DNR.
A t o t a l of nine emissions t e s t s were conducted, t h r e e on each of t h ree d i f f e r e n t days. c ine ra to r feed composition. EPA Reference Method 8 type sampling t r a i n w i t h t h e exception t h a t a heated particulate f i l t e r w a s i n s t a l l e d p r i o r t o t h e f i r s t impinger t o allow col- l ec t ion and measurement of p a r t i c u l a t e matter. The r e s u l t s of t he t e s t i n g program are presented i n this report along with a descr ipt ion of the incin- e ra t ion process, sampling loca t ions , sampling procedures, and ana ly t i ca l methods. The appendices t o t h i s r epor t contain copies of t he f i e l d data shee ts , example ca lcu la t ions , equipment ca l ib ra t ion data, laboratory data , and inc ine ra to r process data.
Each set of t h r e e tests was conducted f o r a d i f f e ren t in- The emission samples were co l lec ted using an
A
! I
PROCESS DESCRIPTION
The Green Bay Metropolitan Sewerage District operates tandem seven hearth incinerators that have been on line since 1975. During normal operations, only. one of the two incinerators is operated at a time. W i s - sions from each incinerator are controlled by a wet scrubbler. Figure 2.1 is a diagram showing the incineration process.
Basic to the incineration of sludge in an efficient and cost effec- tive manner is its preparation for combustion. Incoming raw sludge is thickexfknd. then subjected to a pressure and heat conditioning process which breaks down the sludge solids producing smaller particles that are more easily dewatered. The sludge is then fed onto drunrtype vacuum filters where a sludge cake is produced. This cake is then moved by con- veyor belt and deposited into the top of the incinerator chamber on a continuous basis. The burning sludge is then moved downward through each hearth by an intermittently rotating rake assembly. The rakes move the sludge from inner to outer areas of one hearth then back toward the center of the next hearth as it passes downward insuring more complete burning. Combustion air is supplied to the unit via induced draft and controlled by dampers around the chamber perimeter. Ash is removed to a landfill by truck.
Exhaust gases from the incinerator are split into two streams, one flowing through a precooler, and the other passing to a waste heat recovery boiler. Steam from the waste heat recovery boiler is utilized in the sludge thermal conditioning process. These tw@ gas streams enter the scrubber from separate ducts. Scrubber exhausts then pass through an I . D . fan and on to the stack. shell cooling air enters the breeching just upstream of the smoke stack.
Prior to entry into the stack, center shaft and
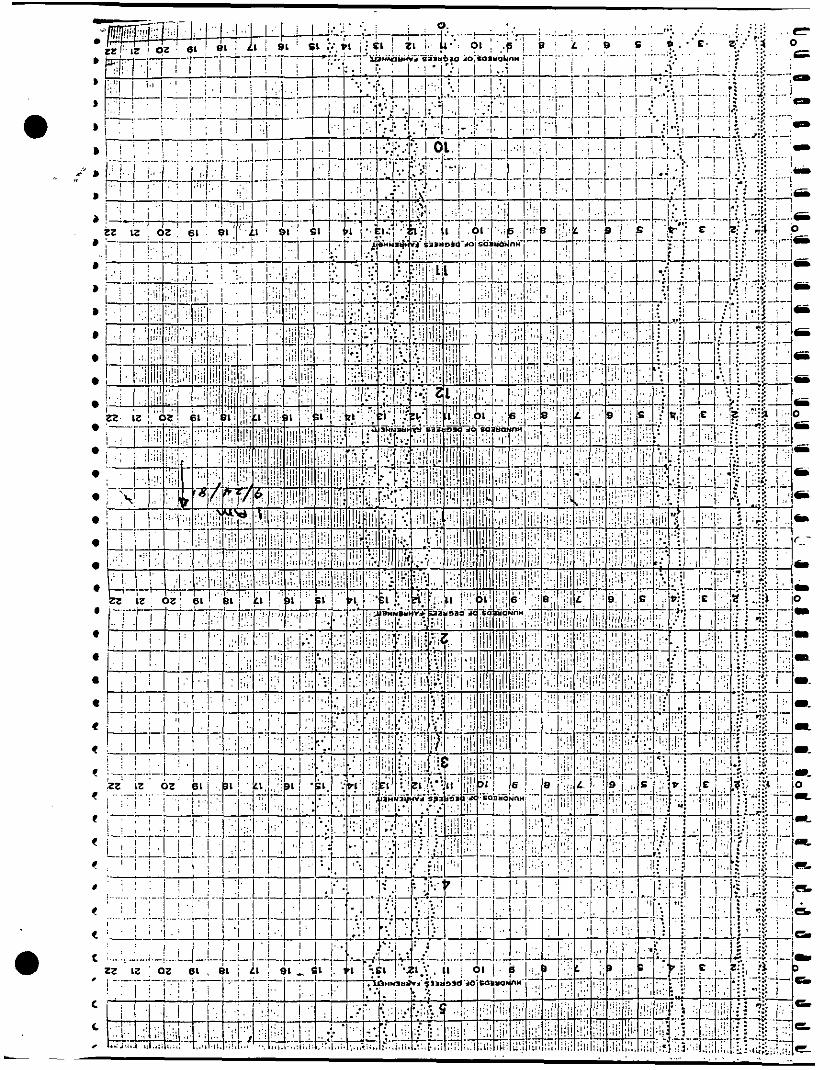
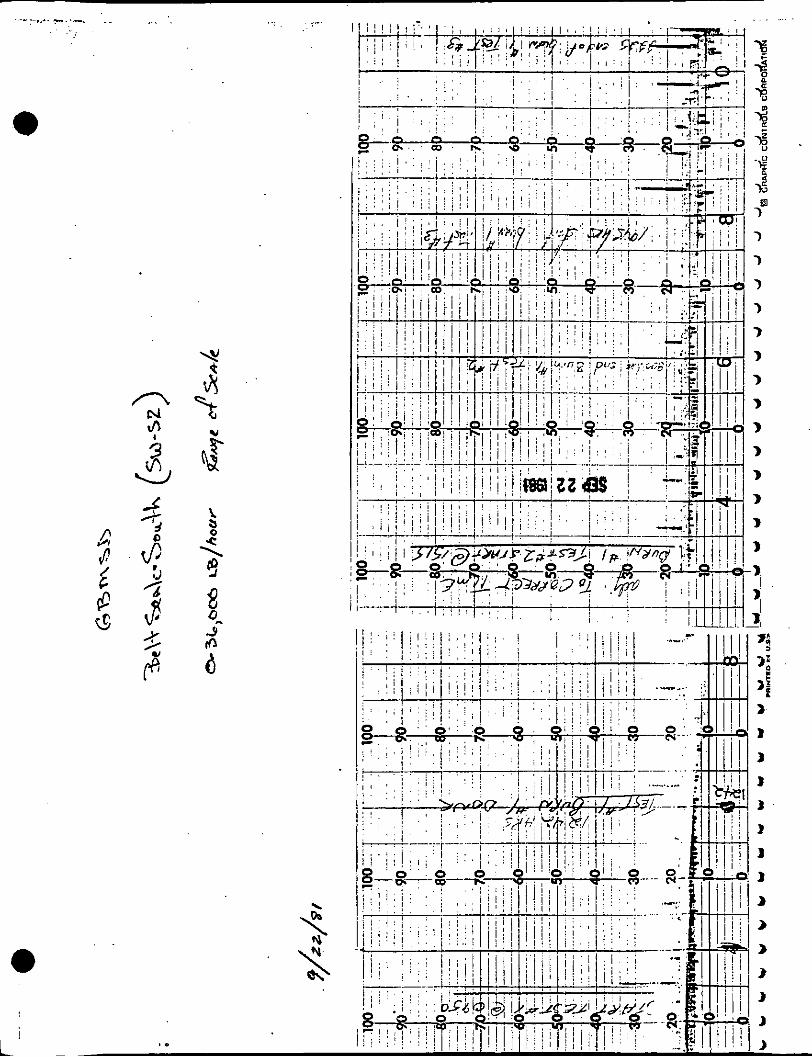
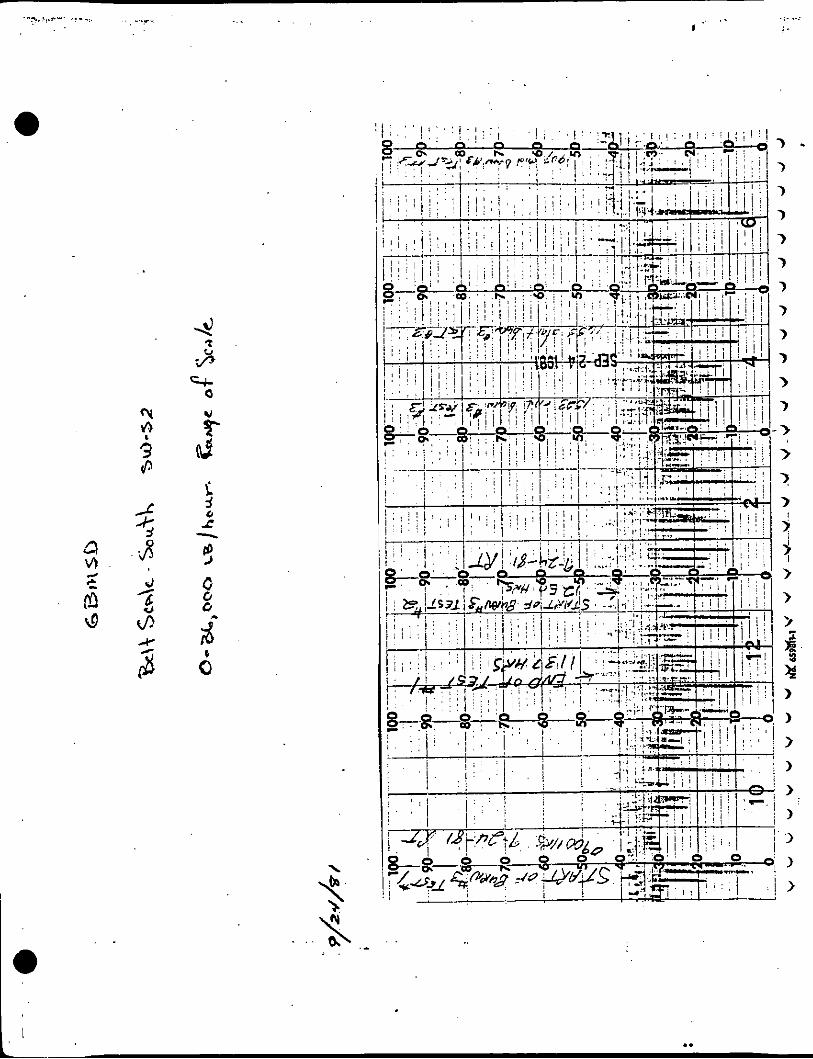
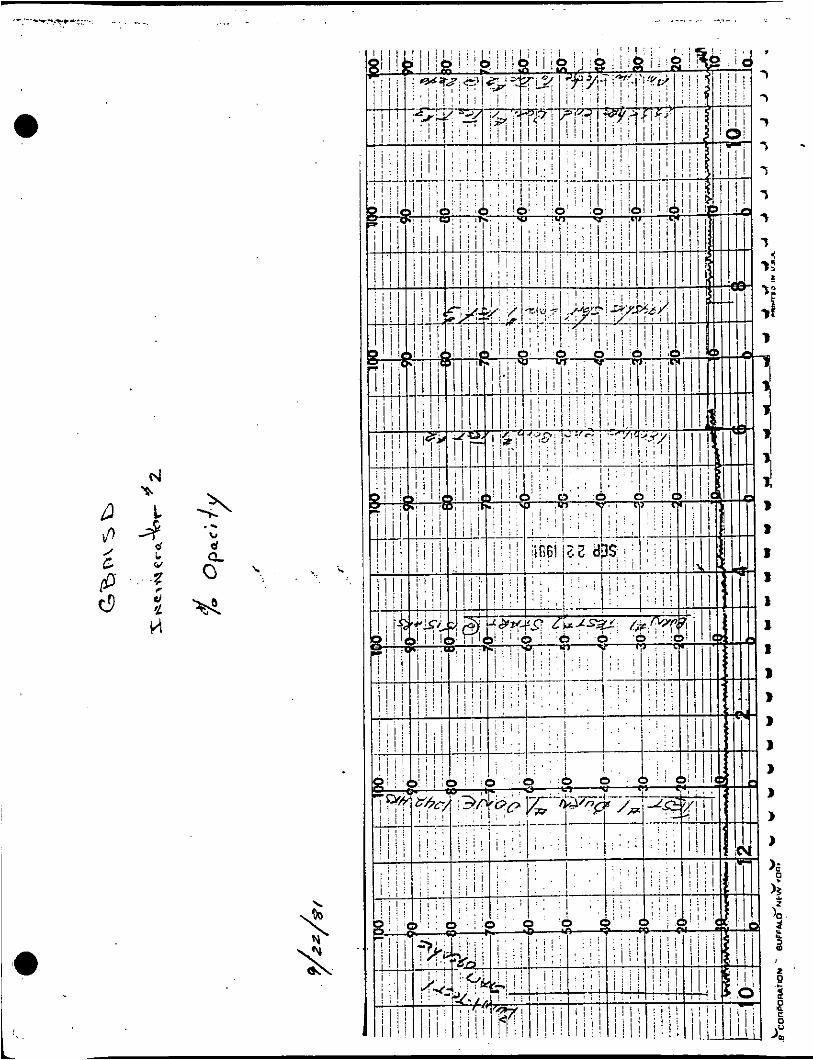
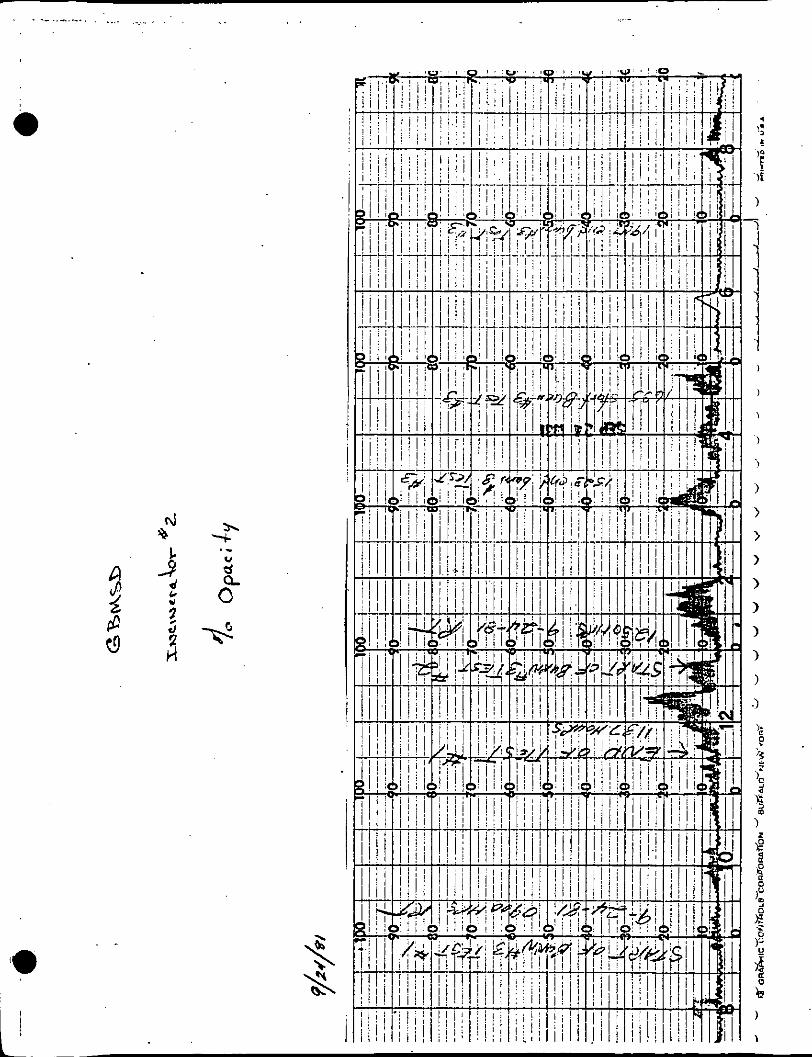
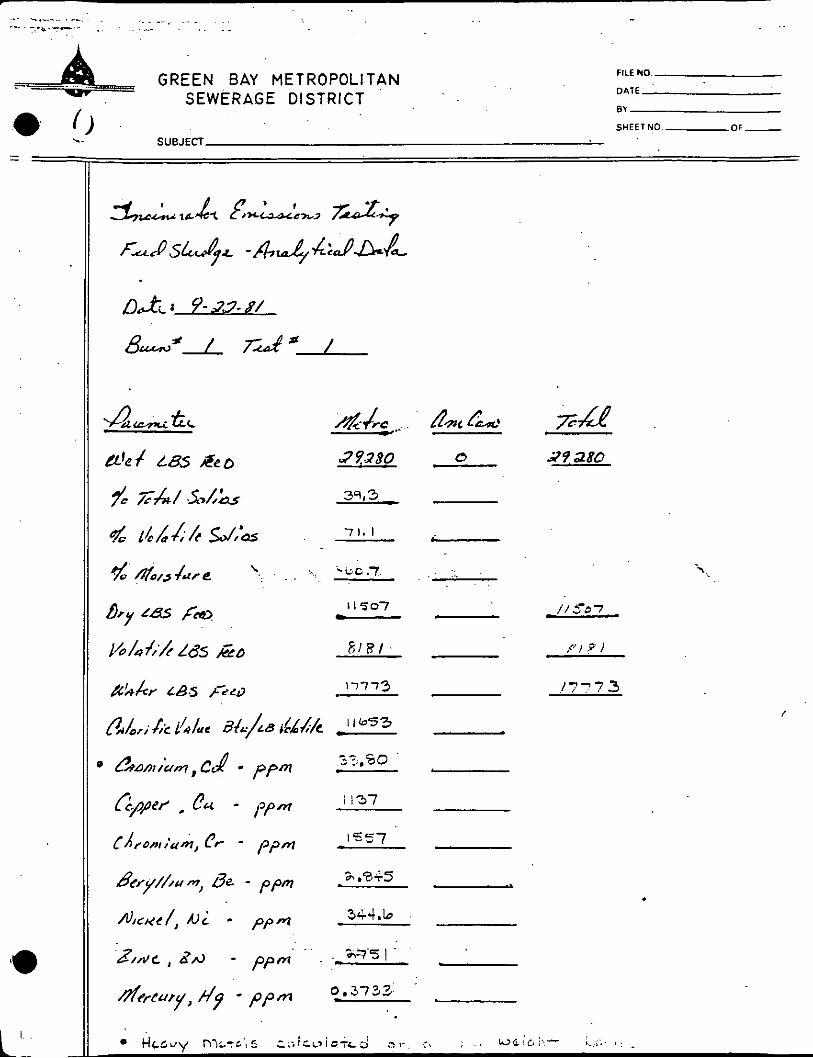
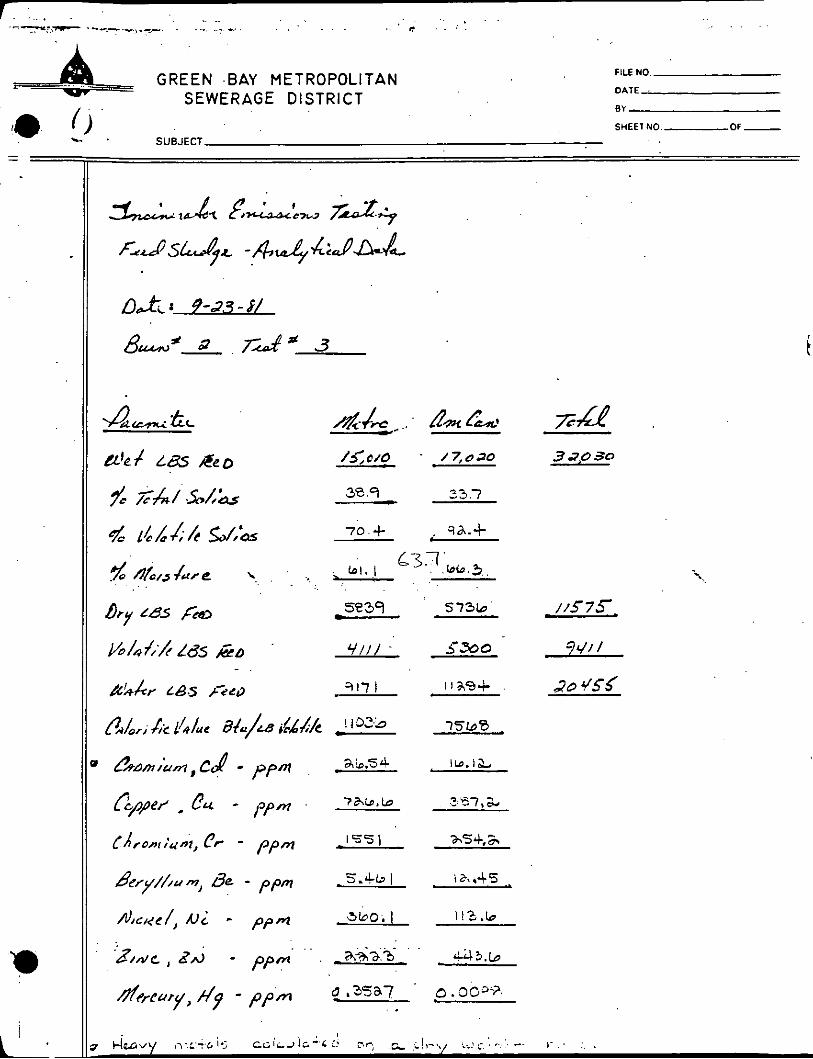
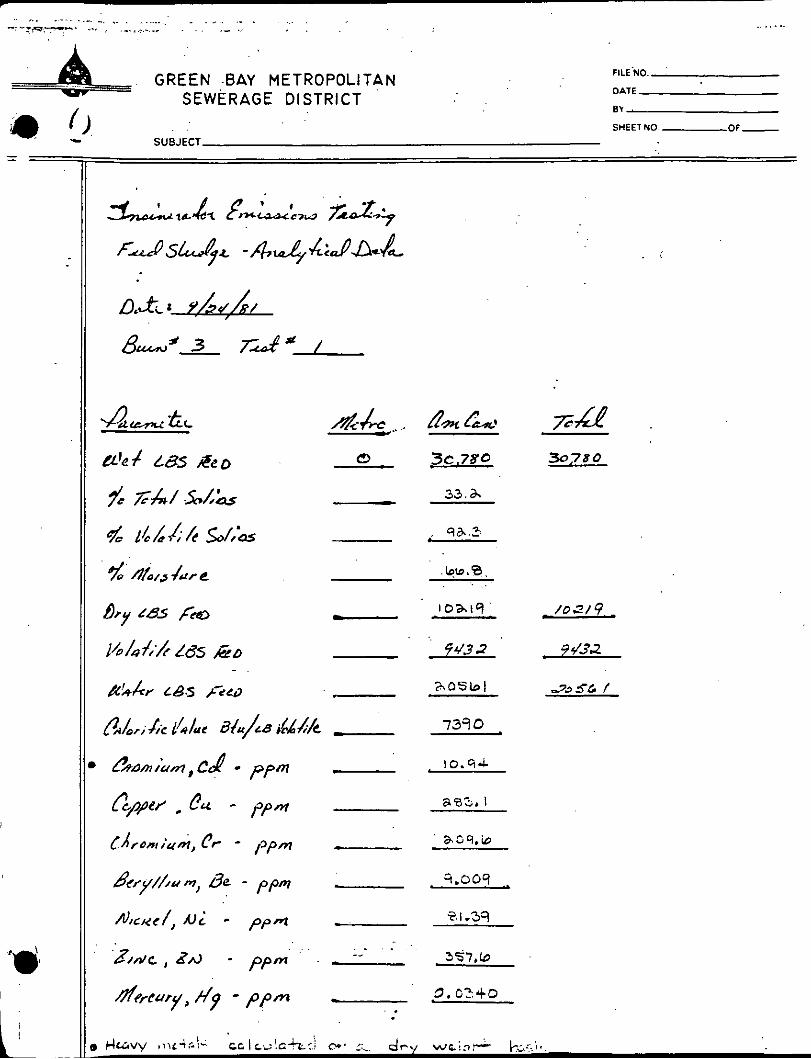
The normal wet sludge incineration feed rate ranges from 7 , 0 0 0 lbs/hr during summer operations to 1 2 , 0 0 0 lb/hr during winter operations. During the testing, the facility attempted to maintain the wet feed rate in the range of 1 0 , 0 0 0 to 12,000 pounds per hour. Feed rates were measured using belt scales. Three different incinerator feed compositions were used. Table 2 . 1 lists for each of the tests: the data, time period, feed composi- tion and feed rates to the incinerator. tion logs, and strip chart records indicating percent 02 in stack gas, incinerator operating temperatures, belt scale readings, and percent opacity are contained in Appendix E along with feed sludge analytical data
Copies of the incinerator opera-
- data for the tests.
2- 1
B _ .
FIGURE 2 . 1
r L I I Q ,.
2-2 ENGINEERING-SCIENCI
c
N
W il
E
m a
0 -
0
0
N
0
c . c
0
N
m N
m .
0
0
N m
m . N
N P N c
0 v)
0 m
r
JJ m e l r
r’ m c m \ N N \ ar
0
r m 0
0 . c
m 0 0,
I- N
.
0
m m 0
r- N
.
r 0 m c
VI r
2
N U m r” I c
C LI a m
c m 3 N \ m
- . m
0
0 P - . m
0 I- o P N
.
0
P I- n P N
.
v) N N N
v) P
?!
o JJ m 8 I c
C
Y m
c m \ N N \ ar
. .
. In
N VI c . a N
m ID m 0 . c
P m c . m c
v) o N r
0 0 0 r
c
JJ m $
I N C
al 2
r m ;=. N \ 0
~ . v)
P 0
(D N
2
z N, N c
m m N
P . r
o (D - - 0 P o r
N JJ m r” I
N
: m
c m \ o ct m
- rem m a m .
m
0 n 0
N o .
0 N 0 . r
0
0
YI
- . c
0 fn z
0 N I- c
o Y m 8 I
N C !-I ¶ m
- m ;=. ct m
2-3
. - - n ID P- - -
0
0
I-
0 n
m .
0 m P, n 0
0
r. n - c
0 0 m 0
c
U m r” I
o
r‘ m c m \ P N \ m
c - m 0 r . c c
0
0 * N . m N
0 * N
N
. m
0
n N m c
0 VI N r
N Y
; I
n C 5 m
c m \ * N \ n
r c
c 0 m . c c
0
0 VI
0 0
c .
0
2 . 0 c1
0
I- 0
c
In
ID n c
o Y m 8 I
0
6 m
r m \ P
ct m
During the three tests, i d e n t i f i e d a s Burn 1 , t h e incinerator was operated on GBMSD sludge only. During Burn 2 , approximately equal amounts of GBMSD sludge and American Can s o l i d waste were fed t o the incinqerator. During Burn 3 , only American Car. s o l i d waste was burned.
2-4
TABLE 3 .1
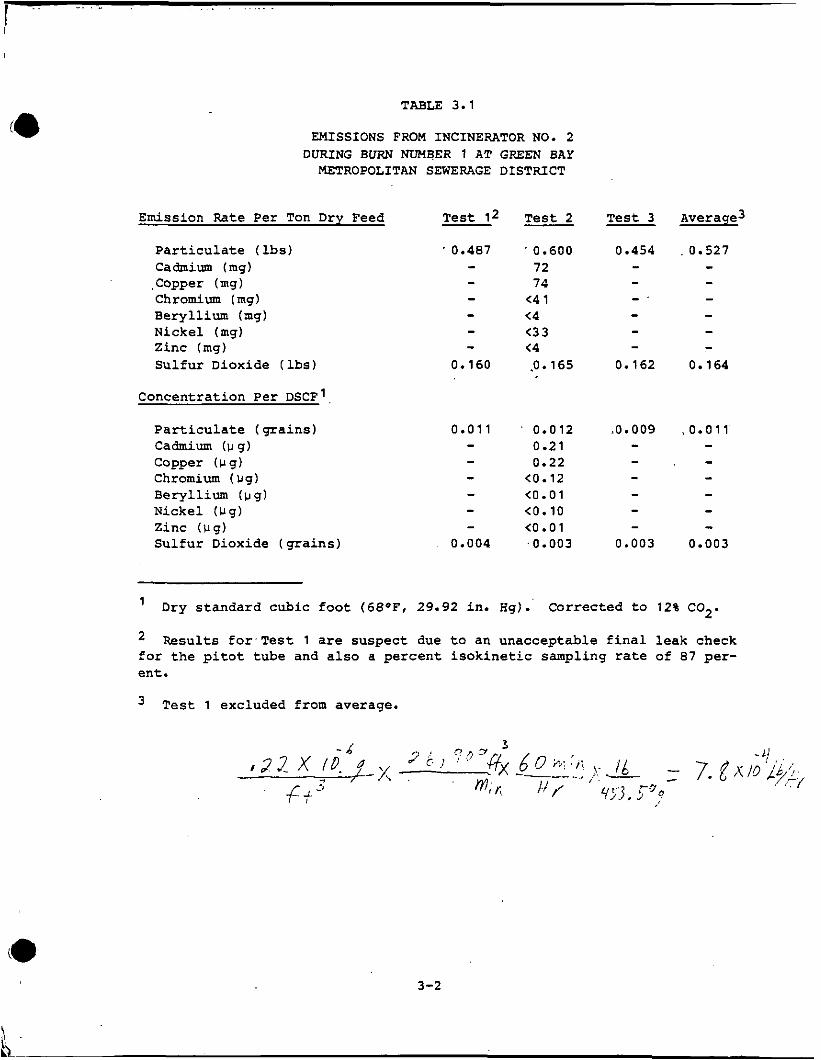
EMISSIONS FROM INCINERATOR NO. 2 DURING BURN NUMBER 1 AT GREEh’ BAY
P a r t i c u l a t e (g ra ins ) Cadmium ( u g ) Copper (u y) Chromium (uq) Beryllium (vg) Nickel (Ug) Z i n c (ug) Sul fur Dioxide (g ra ins )
Test l 2
. 0 . 4 8 7 - - - - - - 0 .160
0 . 0 1 1 - - - - - -
0 . 0 0 4
T e s t 2
’ 0.600 7 2 74
<4 1 <4 <3 3 <4 .O. 16.
0 . 0 1 2 0 .21 0 . 2 2
< 0 . 1 2 <0.01 <0 .10 <0 .01 .0.003
Average3
. 0 . 5 2 7 - - - - - -
0 .164
. 0 . 0 1 1 ’ - - - - - - 0 . 0 0 3
’ Dry standard cubic foo t (68*F, 2 9 . 9 2 in. Hg):
Results f o r . T e s t 1 a r e suspect due t o an unacceptable f i n a l leak check f o r the p i t o t tube and a l so a percent i sok ine t i c sampling r a t e of 8 7 per- e n t .
Corrected t o 12% C 0 2 .
Test 1 excluded from average.
3-2
TABLE 3.5
EMISSIONS FROM INCINERATOR NO. 2 DURING BURN NUMBER 3 AT GREEN BAY
METROPOLITAN SEWERAGE DISTRICT
Emiss ion Fate P e r Ton Dry Feed
P a r t i c u l a t e (lbs) C a d m i u m ( m g ) Copper ( m g ) Chromium ( m g ) B e r y l l i u m ( m g ) N i c k e l (iig) Z i n c ( m g ) Sulfur D i o x i d e (lbs)
C o n c e n t r a t i o n P e r D S C F ~
P a r t i c u l a t e ( g r a i n s ) Cadmium ( u g ) Copper (u g) Chromium (ug) B e r y l l i u m (ug) N i c k e l ( u g ) Z i n c (Yg) Sulfur Diox ide (gra ins)
T e s t 2
0.160 6
<17 (4 3 <4 <3 4 <4
0.300
0.003 <0.02 (0.05 <0.13 <0.01 <0.10 <0.01
0.007
T e s t 3 Average
Dry s t a n d a r d cubic foot (68OF. 29.92 in . Hg). C o r r e c t e d t o 120 C 0 2 .
3-6
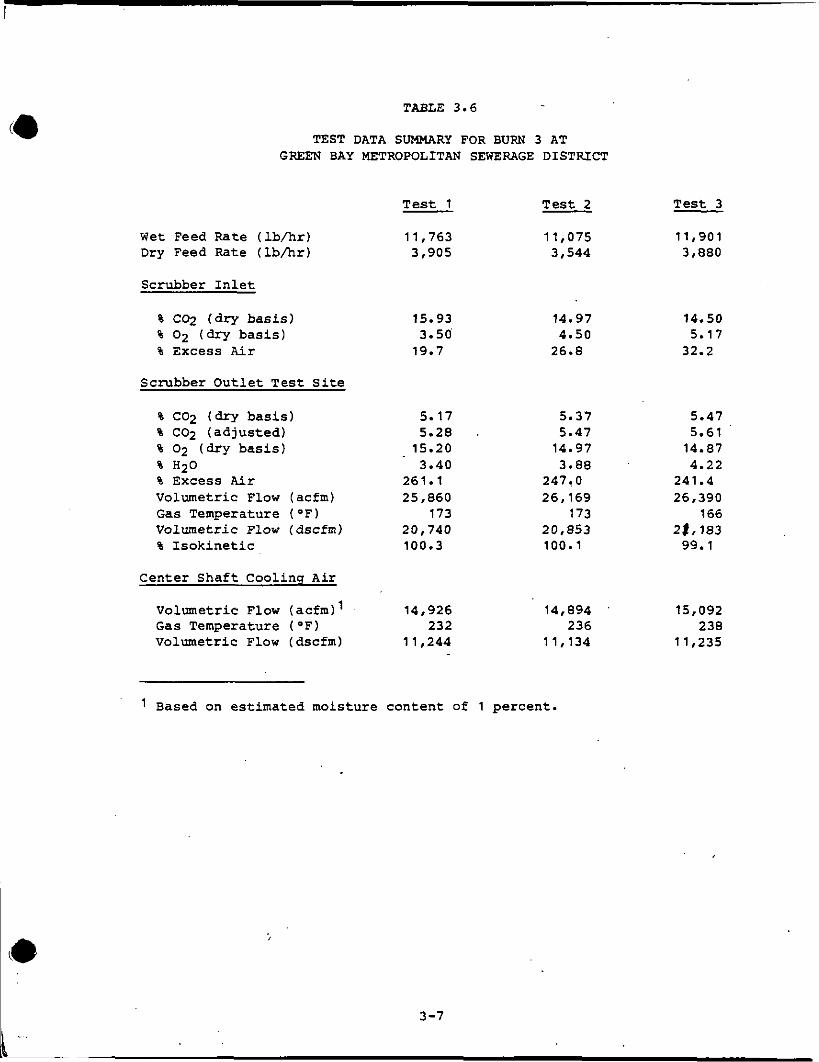
TABLE 3.6
TEST DATA SUMMARY FOR BURN 3 AT GREEN BAY METROPOLITAN SEWERAGE DISTRICT
% Excess Air Volumetric Flow (acfm) Gas Temperature (OF) Volumetric Flow (dscfm) % Isokinetic
% H20
Center Shaft Cooling Air
volumetric Flow (acfm)l Gas Temperature (OF) Volumetric Flow (dscfm)
Test 1
11,763 3,905
15.93 3.50' 19.7
5.17 5.28 15.20 3.40
261.1 25,860
173 20,740 100.3
14,926 232
11,244
Test 2
11,075 3,544
14.97 4.50 26.8
5.37 5.47 14.97 3.88
247.0 26,169
173 20,853 100.1
Test 3
11,901 3,880
14.50 5.17
32.2
5.47 5.61 14.87 4.22
241.4 26,390
166 2!,183 99.1
Based on estimated moisture content of 1 percent.
14,894 15,092 236 238
11,134 11,235
I 3-7
CHAPTER 4
SAMPLING LOCATIONS & PROCEDURES
Measurements were conducted at three locations during the sampling program. Figures 4.1 is a diagram showing the location. Emission sampling for particulate matter, SO2 and heavy metals was conducted at the outlet of the wet scrubbler downstream of the center shaft cooling air duct. Velo- city traverses of the center shaft cooling air duct were performed upstream of its junction with the outlet duct. Integrated gas sanples for deter- mination of 02, C02 and excess air were collected upstream of the scrubber prior to the point where the duct splits to the precooler and waste heat recovery boiler. Each sampling location is described in more detail below.
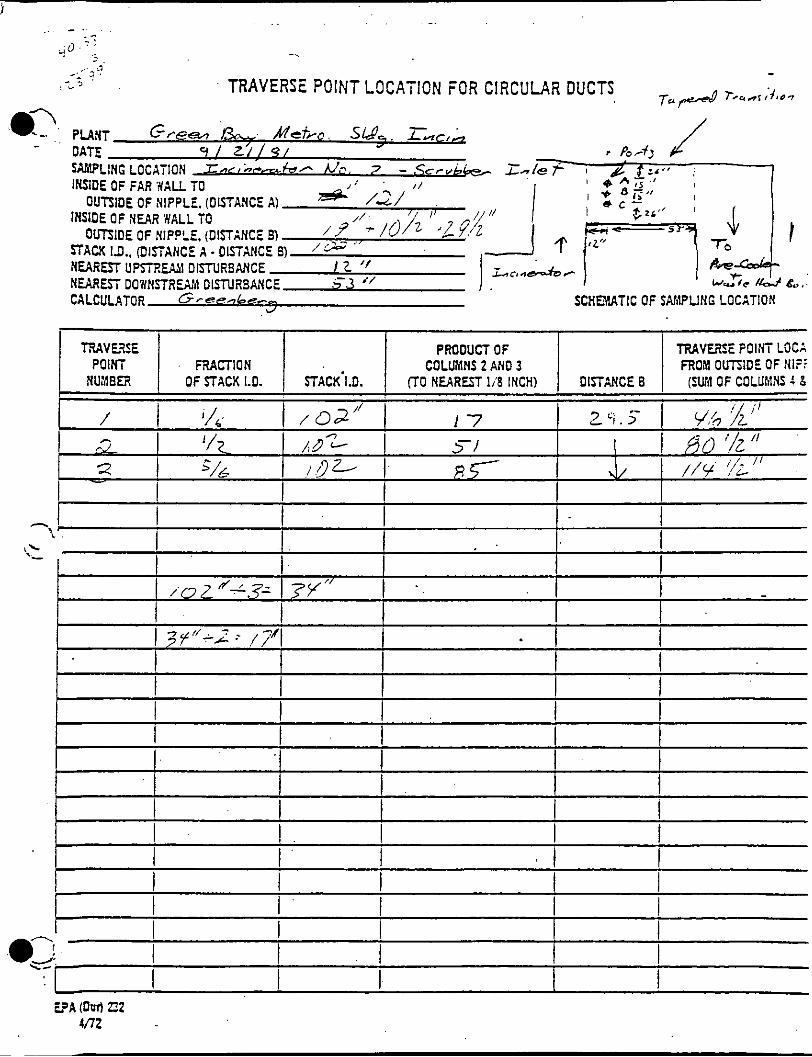
tht'ough a 102" x 85.75" refractory lined steel duct approximately 5 feet to a vertically descending duct. The duct is then divided into two ducts. One carries the gases to a pre-cooler and the other carries gases to a waste heat recovery boiler. As illustrated in Figure 4.2 three 4 " ports are located 12" downstream and 53" upstream from,the nearest flow distur- bance. These port locations do not meet the minimum EPA Method 1 require- ments, however for the purpose of collecting the integrated gas samples the Wisconsin DNR approved the locations. Figure 4.3 is a diagram showing the sampling points used for the collection of integrated gas samples.
Sampling Location - Scrubber Outlet As the scrubber exhaust gases leave the I.D. fan they pass through a
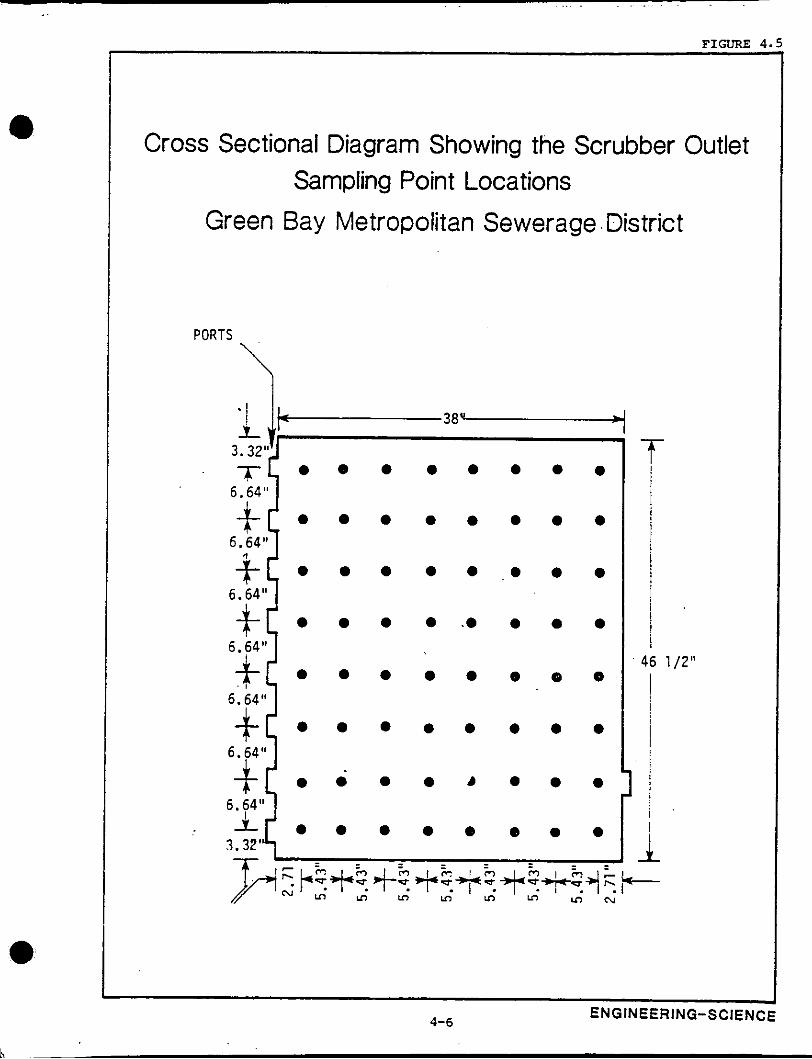
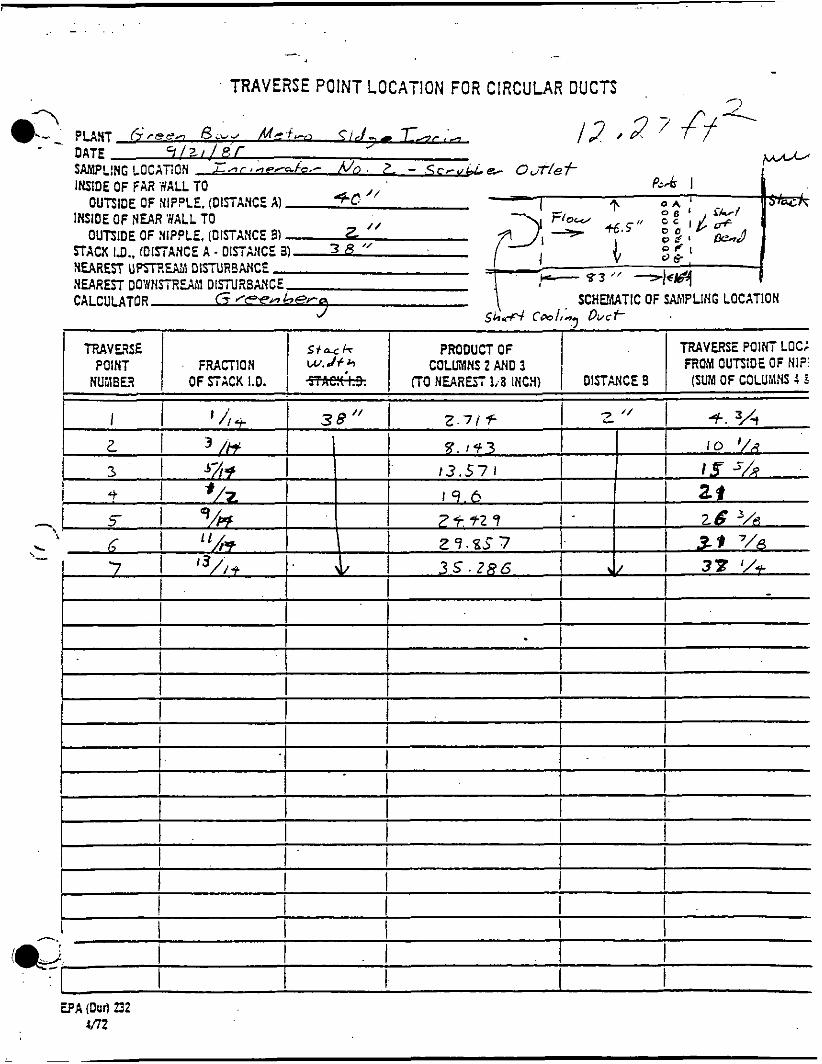
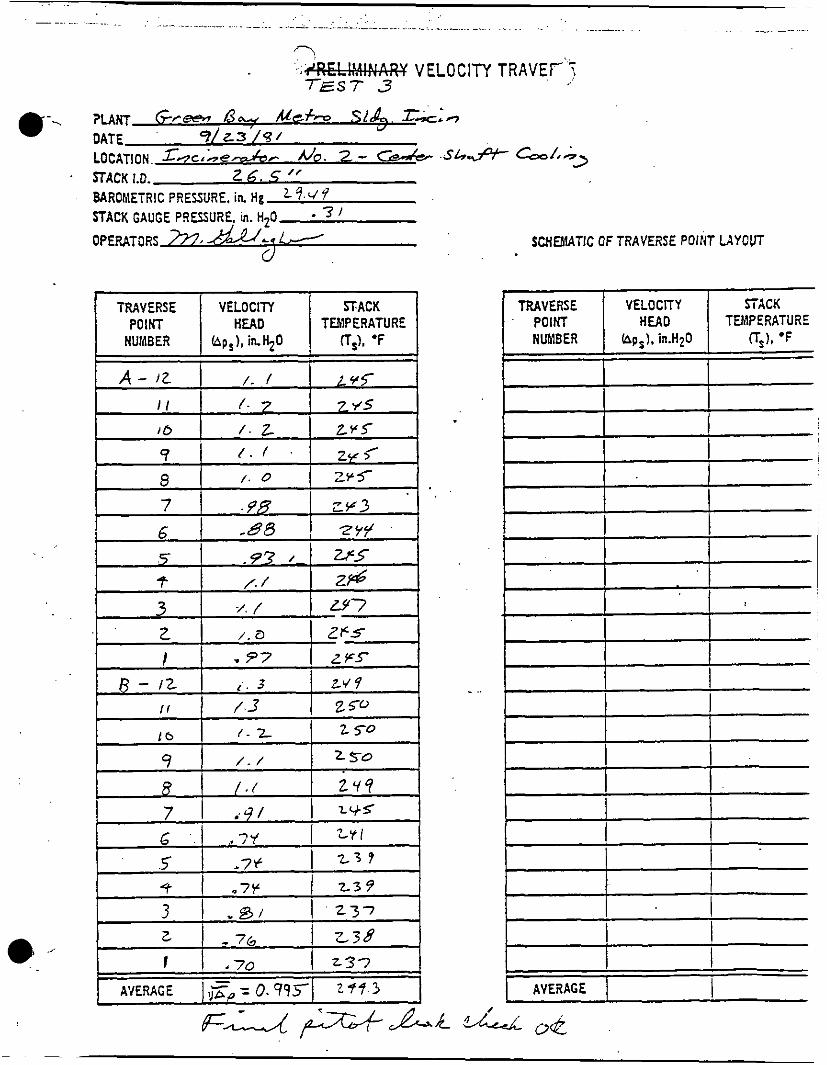
38" x 46-1/2" horizontal breeching to the stack. Seven 4" ports were located 83" (approximately 2 equivalent duct diameters) from the nearest upstream flow disturbance and 16" (approximately 0.4 equivalent duct dia- meters) from the nearest downstream flow disturbance. Figure 4.4 shows the location of the sampling ports. The sampling site did not meet EPA Method 1 requirements, however, the ports were installed at a location selected by the Wisconsin DNR and were approved for the purpose of this test program. Figure 4.5 is a diagram showing the location of the forty- nine traverse points used during sampling.
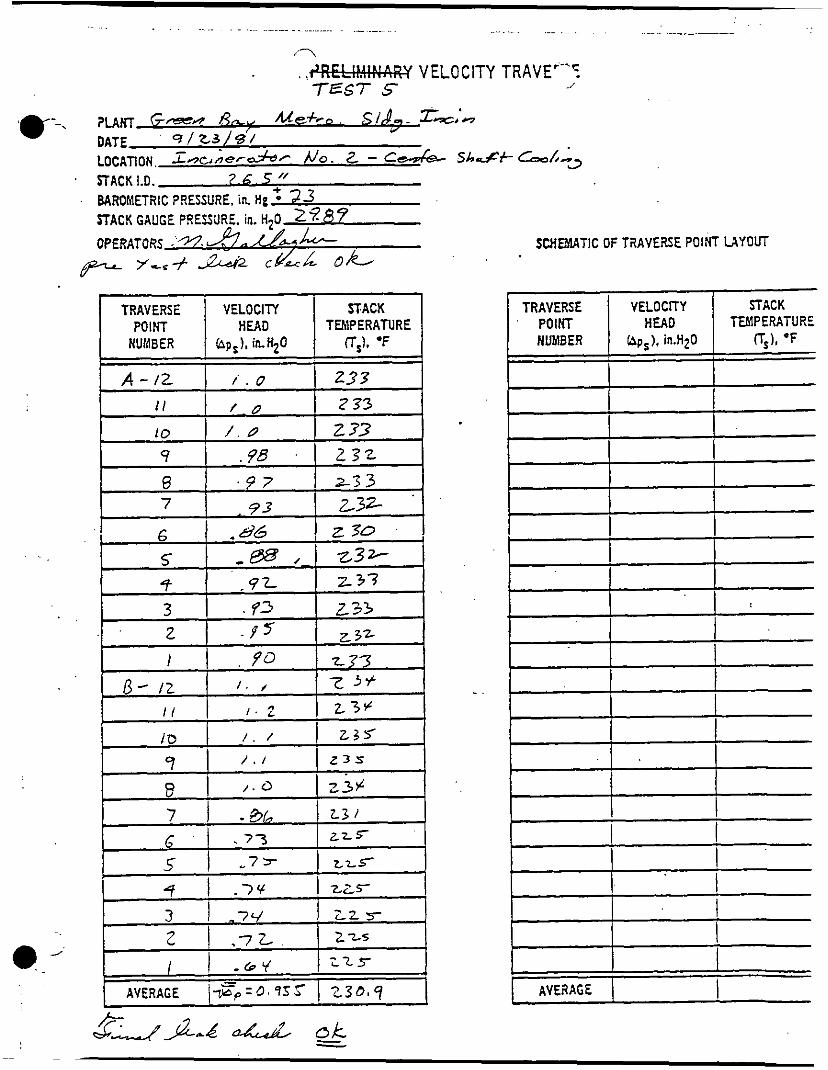
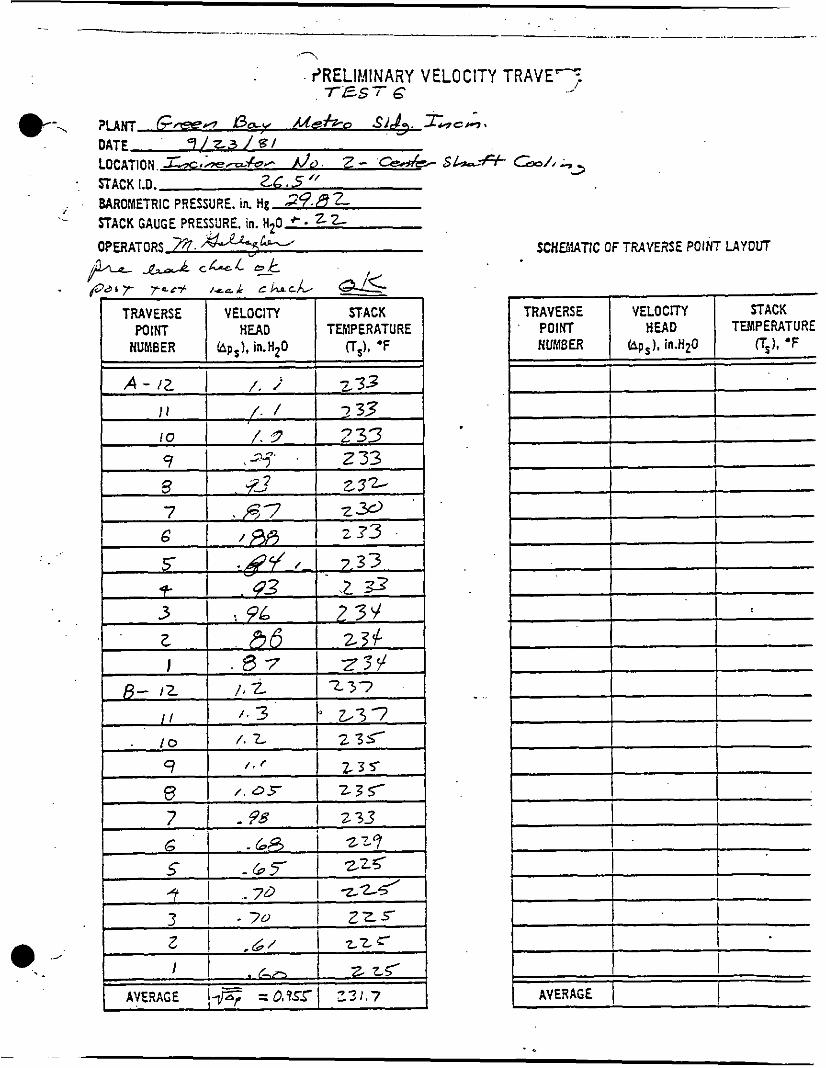
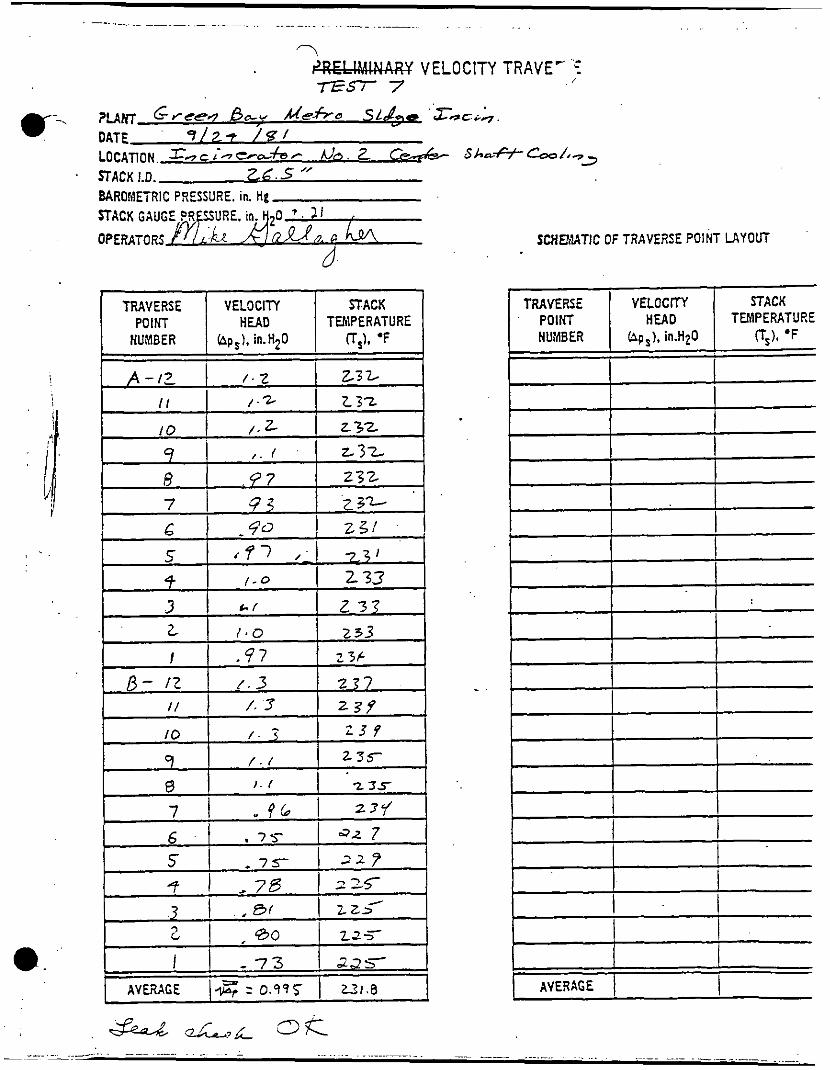
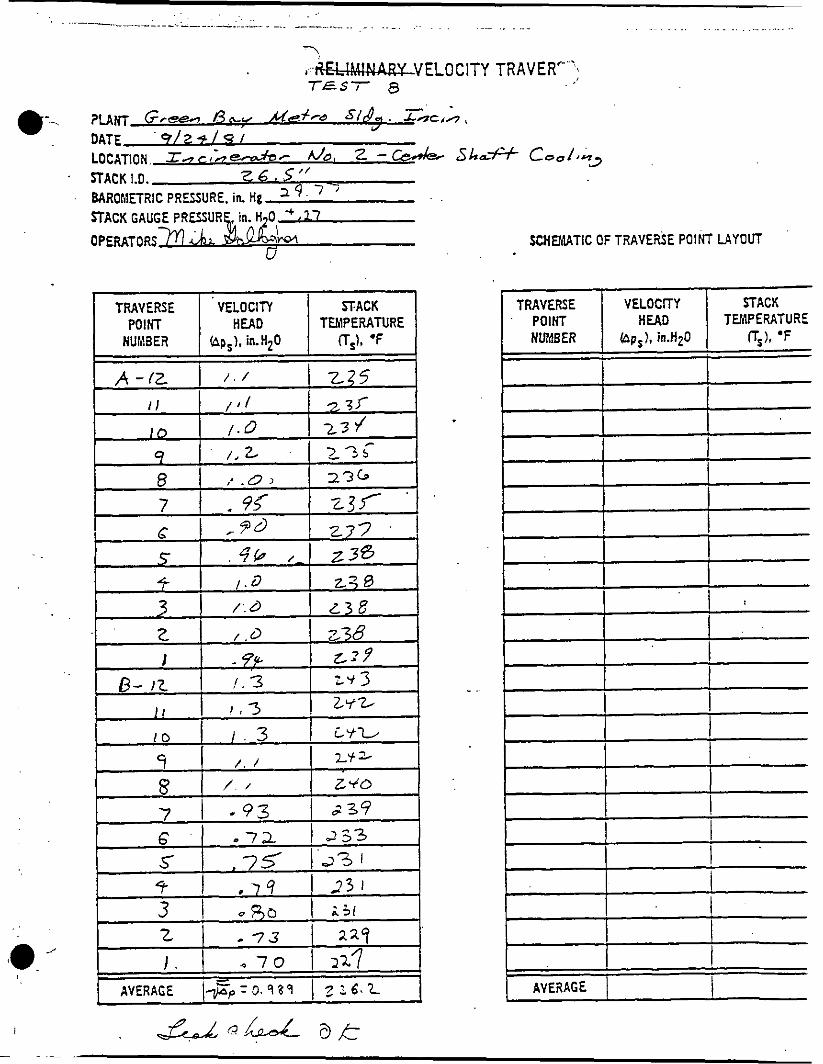
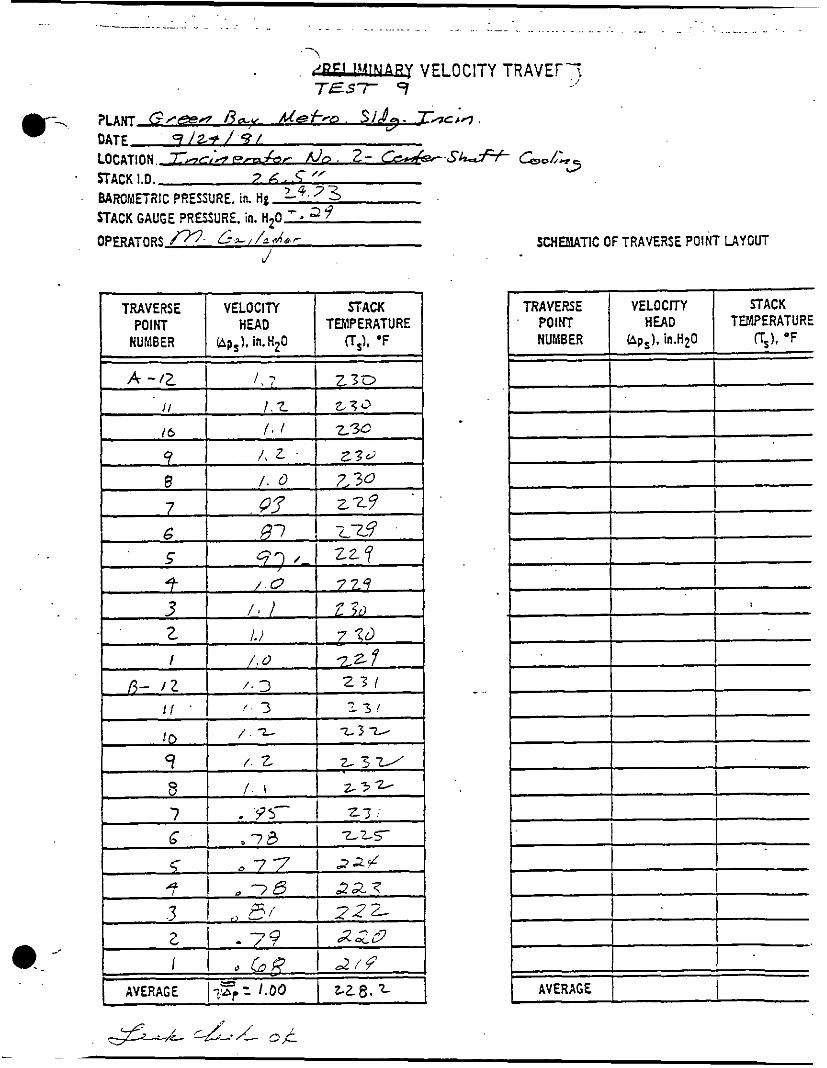
Center Shaft cooling Air
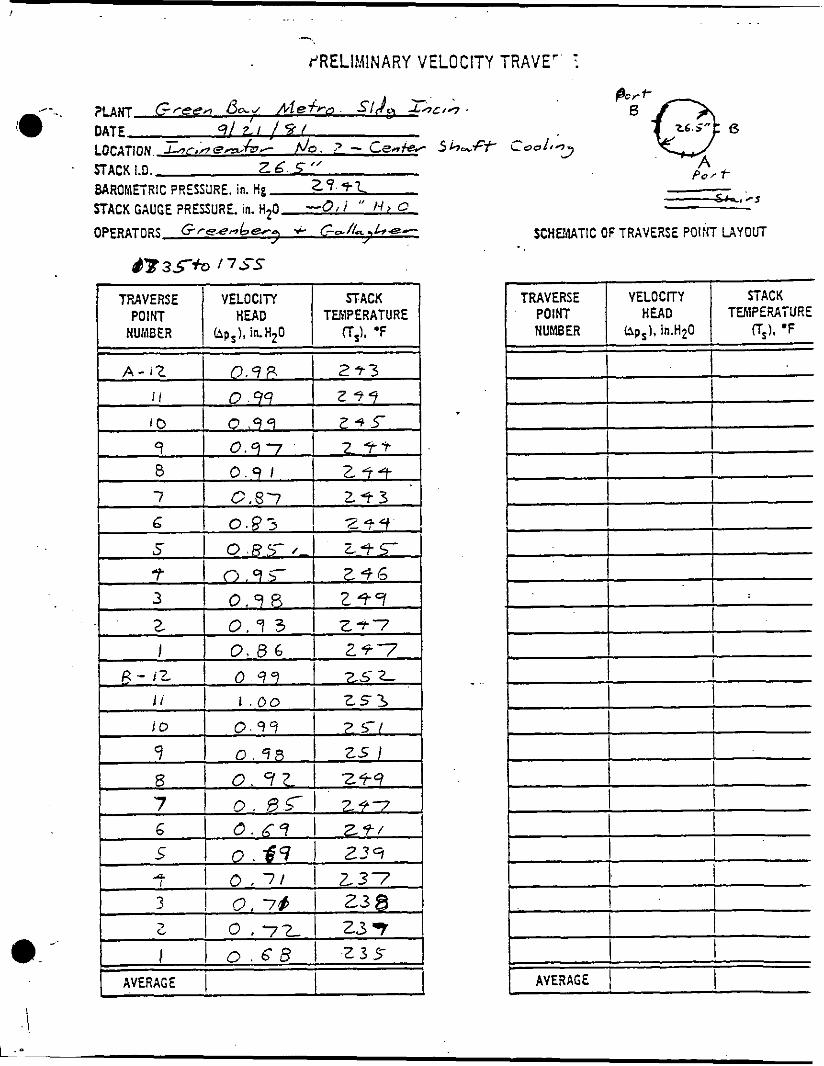
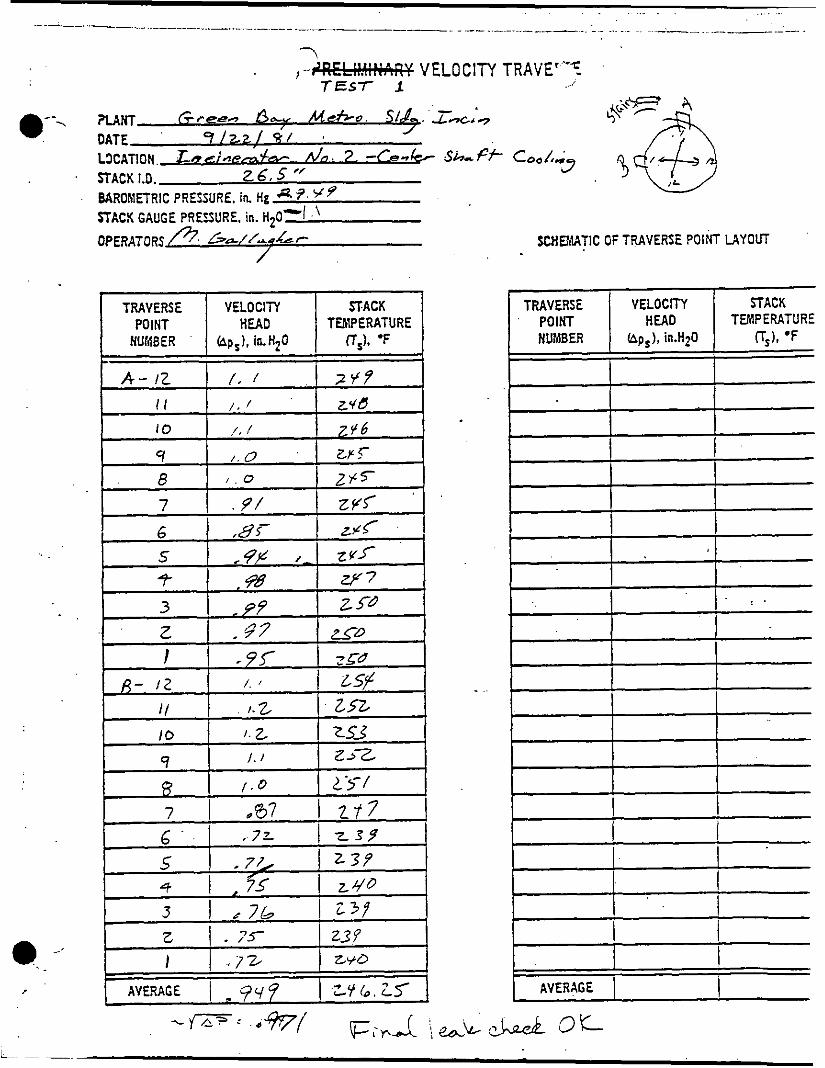
A 26.5" diameter duct carries the center shaft cooling air to the scrubber outlet breeching. Velocity traverses were performed through two
,...
4-1
Test Locations for Incinerator No. 2 Green Bay Metropolitan Sewerage District
SLUDGE INCINERATOR
t
I WASTE I HEAT I . RECOVERY
P a r t i c u l a t e & SO2 Emission Tests
I I l
a Shel l & Center Shaf t Cool ing A i r 1 +--------------_I + In teg ra ted I
Gas Samples I I I I Exhaust Gases I
I -I
I I
I 3 = - 4 - l - - - - - - - I c r l I I I"I I I
n I I i I
I 1
SCRUBBER
I I I I @----I I
I I PPECOOLERS
4-2 ENGINEERING-SCIENCE
v, I- - 0 Lv,
W
ENGINEERING-SCIENCE 4-3
* I FIGURE 4
v) c 0 m .- CI
.-
.I.-
0 a> m v) v) 0 6
0
U
I- C 2
V
c p:
2
~
4 -4 ENGINEERING-SCIENCE
- t u O m
U
W CT W I m 0 x c 4 0 c x u
m J W W + m CT 4 -1 3 V oc u
n.
2
-
~
b
+ V a 3 L 2 W. W c m
~ - N 1
W e +--
.......
0 Cross Sectional Diagram Showing the Scrubber Outlet
Green Bay Metropolitan Sewerage ~ District Sampling Point Locations
PORTS
\ 3.32'g
0
0
0
0
0
0
0
0
0
0
0
0
0
0
0
0
0
0
0
0
0
0
0
0
0
0
0
0
0
0
0
0
0
0
0
0
4
0
0
0
0
0
0
0
0
0
0
0
0
0
8
0
0
0
0
0
0
0
0
0
0
0
T I
46 1 /2"
ENGINEERING-SCIENCE 4-6
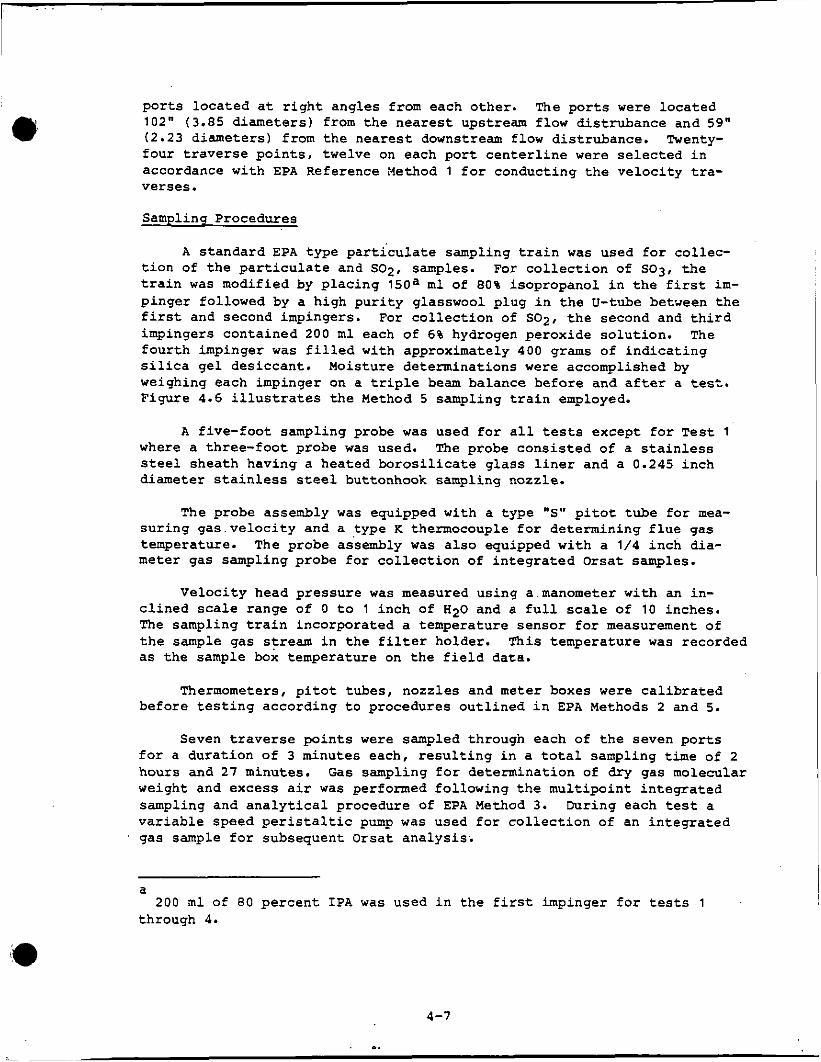
ports located at right angles from each other. The ports were located 102" ( 3 . 8 5 diameters) from the nearest upstream flow distrubance and 5 9 " ( 2 . 2 3 diameters) from the nearest downstream flow distrubance. Twenty- four traverse points, twelve on each port centerline were selected in accordance with EPA Reference Nethod 1 for conducting the velocity tra- verses.
Sampling Procedures
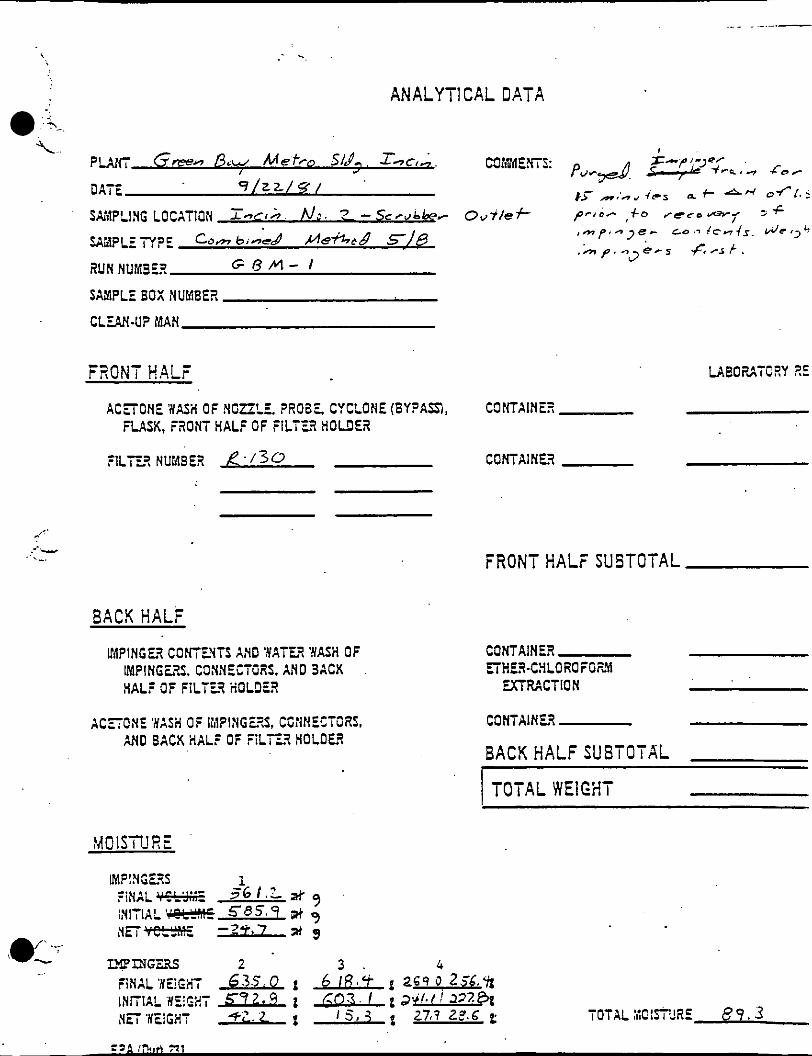
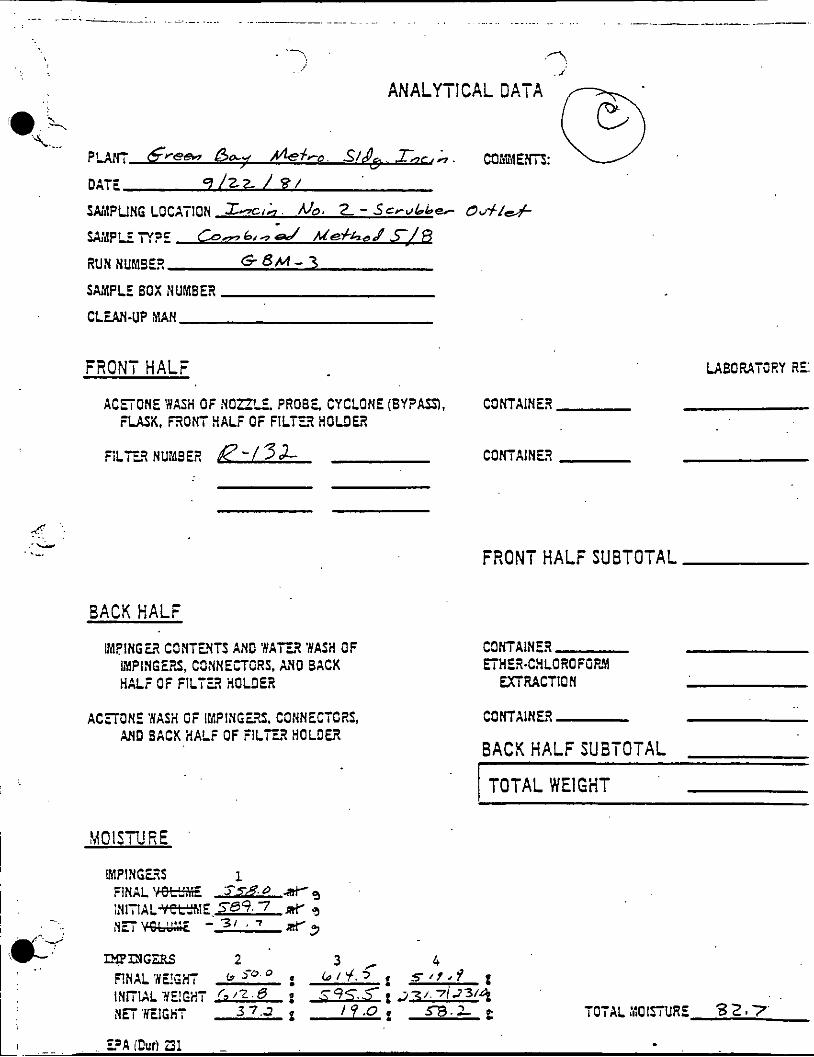
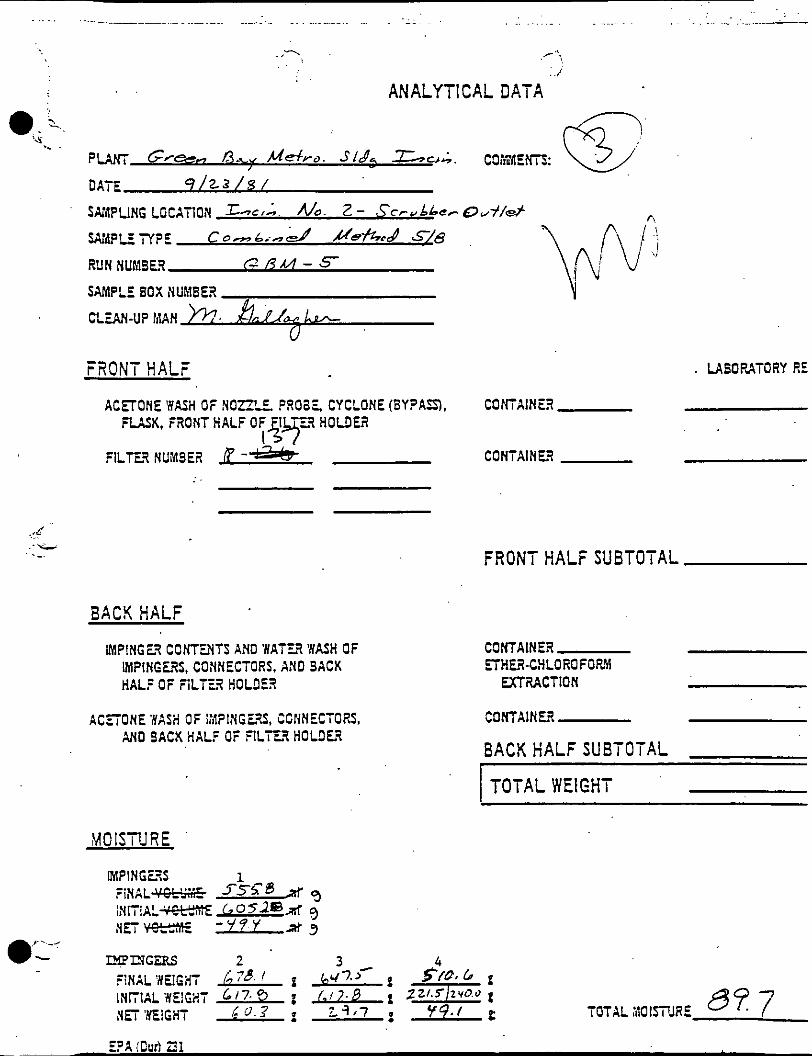
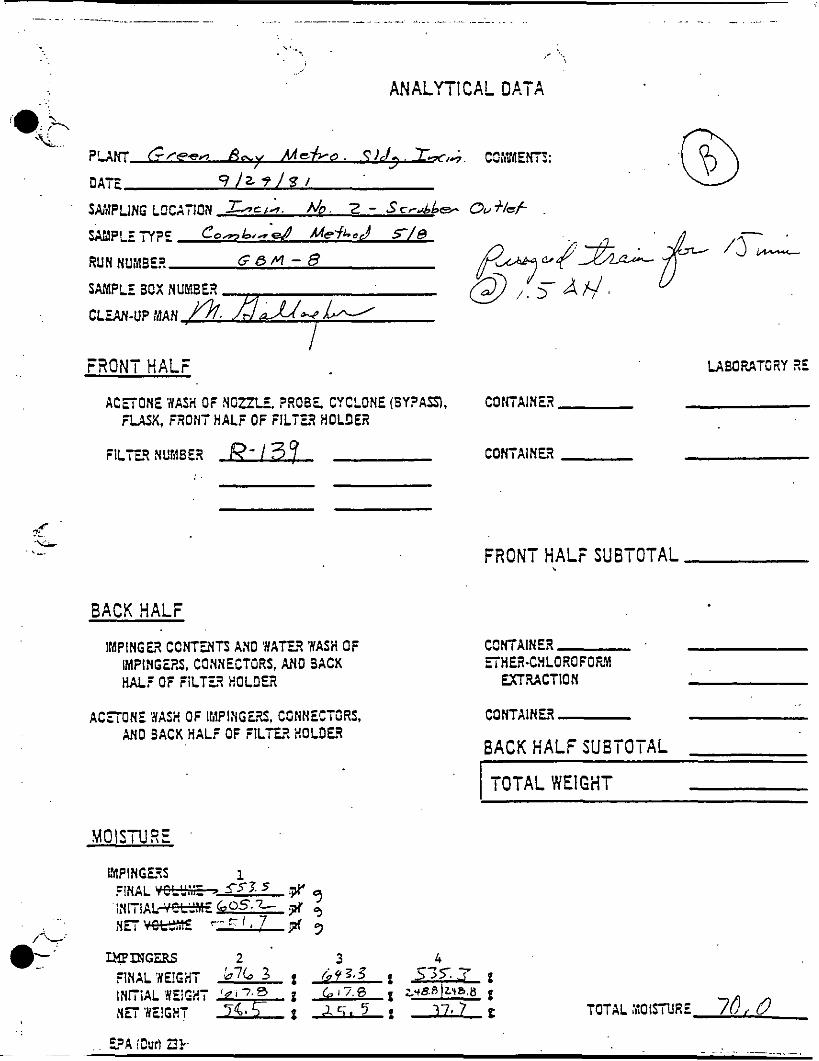
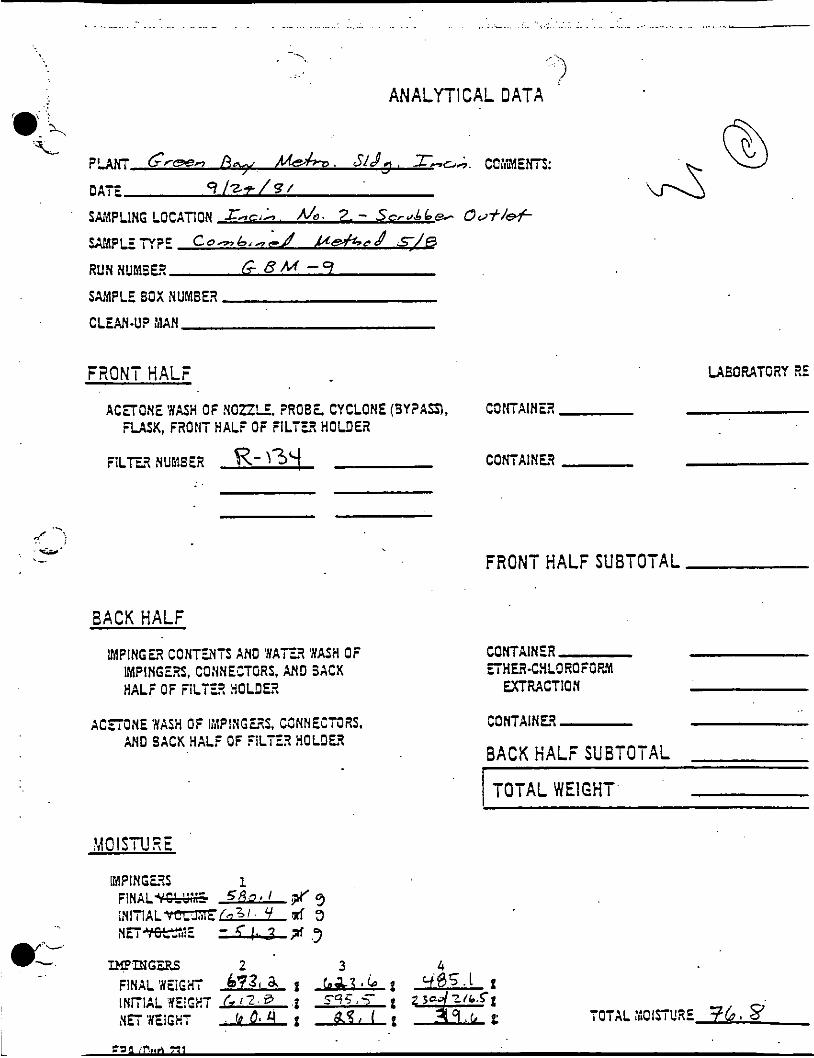
A standard EPA type particulate sampling train was used for collec- tion of the particulate and SO2, samples. For collection of SO3. the train was modified by placing 150a ml of 80% isopropanol in the first im- pinger followed by a high purity glasswool plug in the U-tube between the first and second impingers. impingers contained 2 0 0 ml each of 6 % hydrogen peroxide solution. fourth impinger was filled with approximately 4 0 0 grams of indicating silica gel desiccant. Moisture determinations were accomplished by weighing each impinger on a triple beam balance before and after a test. Figure 4.6 illustrates the Method 5 sampling train employed.
For collection of S02, the second and third The
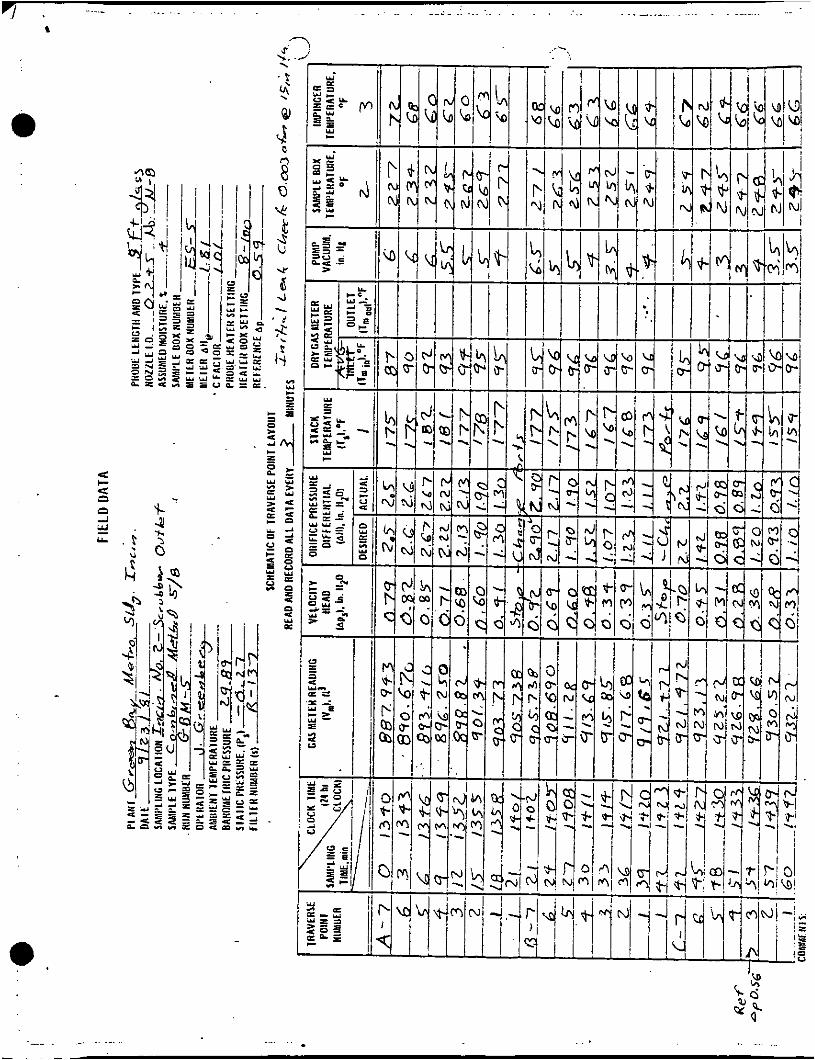
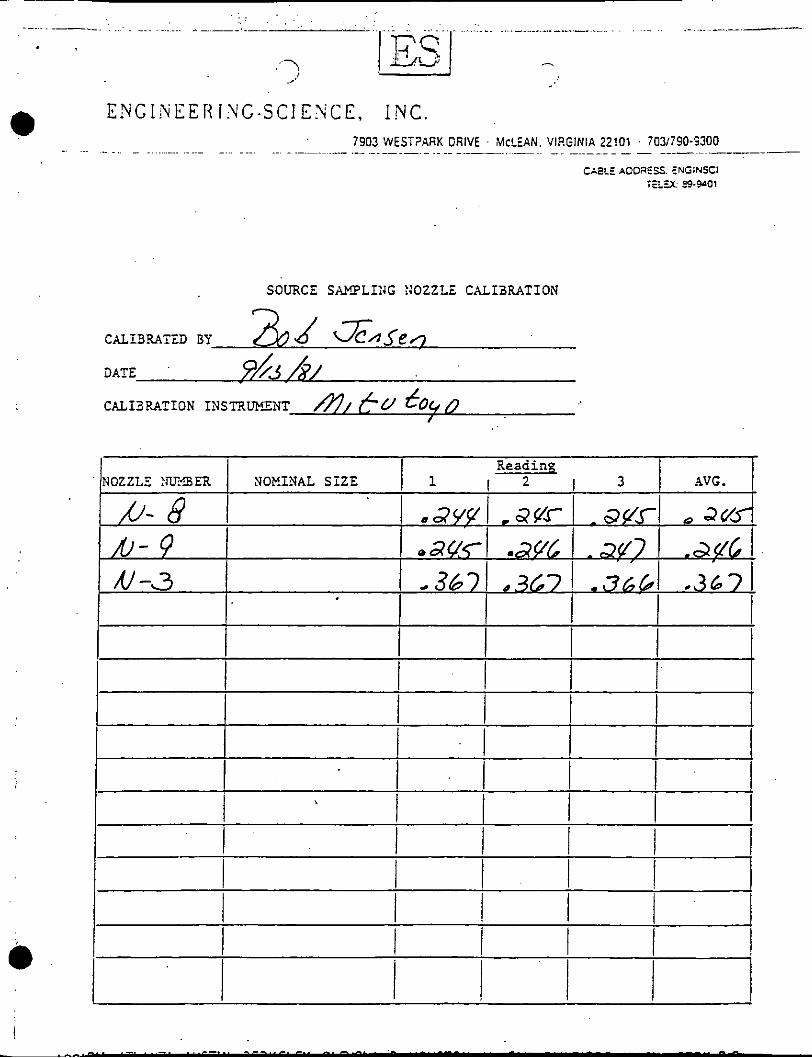
A five-foot sampling probe was used for all tests except for Test 1 where a three-foot probe was used. The probe consisted of a stainless steel sheath having a heated borosilicate glass liner and a 0 . 2 4 5 inch diameter stainless steel buttonhook sampling nozzle.
The probe assembly was equipped with a type "S" pitot tube for mea- suring gas velocity and a type K thermocouple for determining flue gas temperature. The probe assembly was also equipped with a 1/4 inch dia- meter gas sampling probe for collection of integrated Orsat samples.
Velocity head pressure was measured using a manometer with an in- clined scale range of 0 to 1 inch of H20 and a full scale of 10 inches. The sampling train incorporated a temperature sensor for measurement of the sample gas stream in the filter holder. This temperature was recorded as the sample box temperature on the field data.
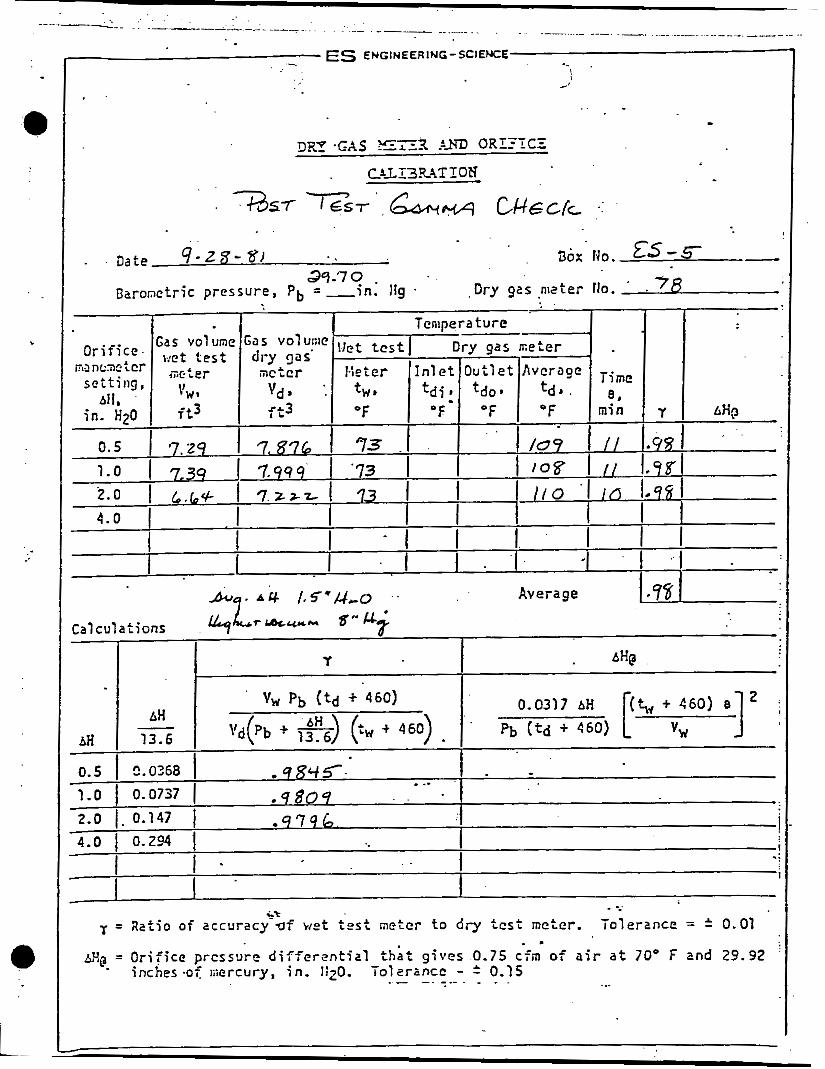
Thermometers, pitot tubes, nozzles and meter boxes were calibrated before testing according to procedures outlined in EPA Methods 2 and 5.
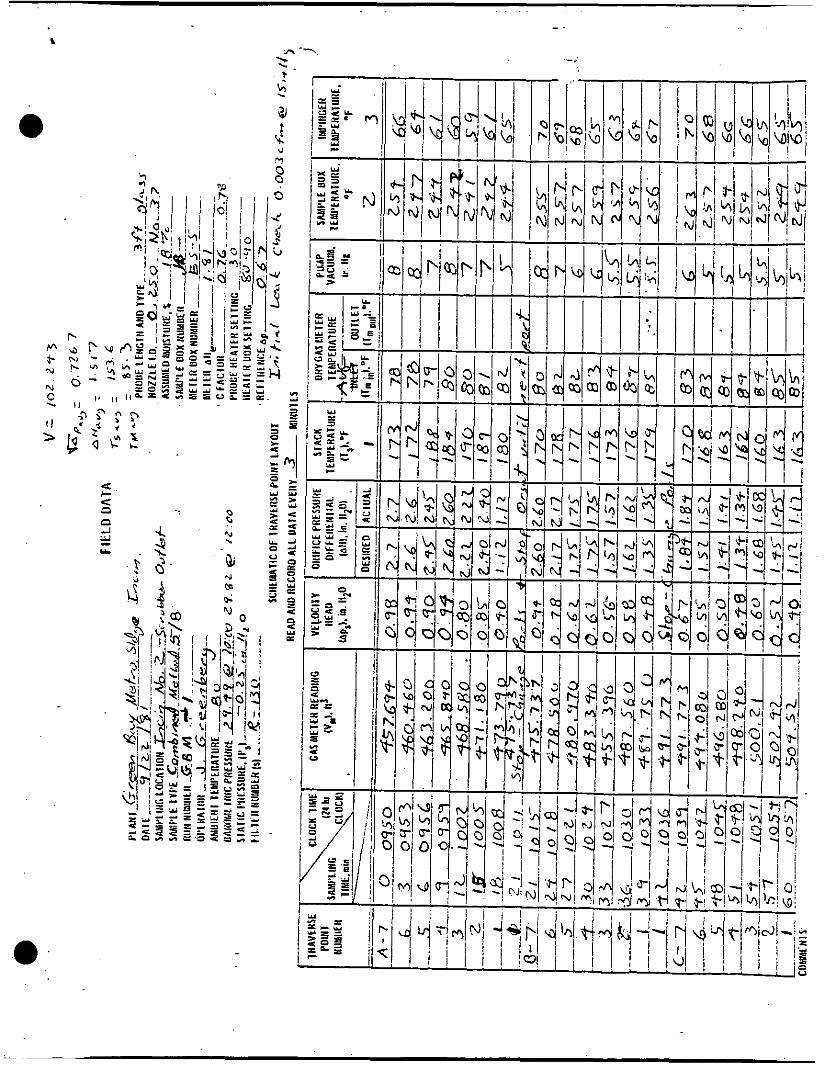
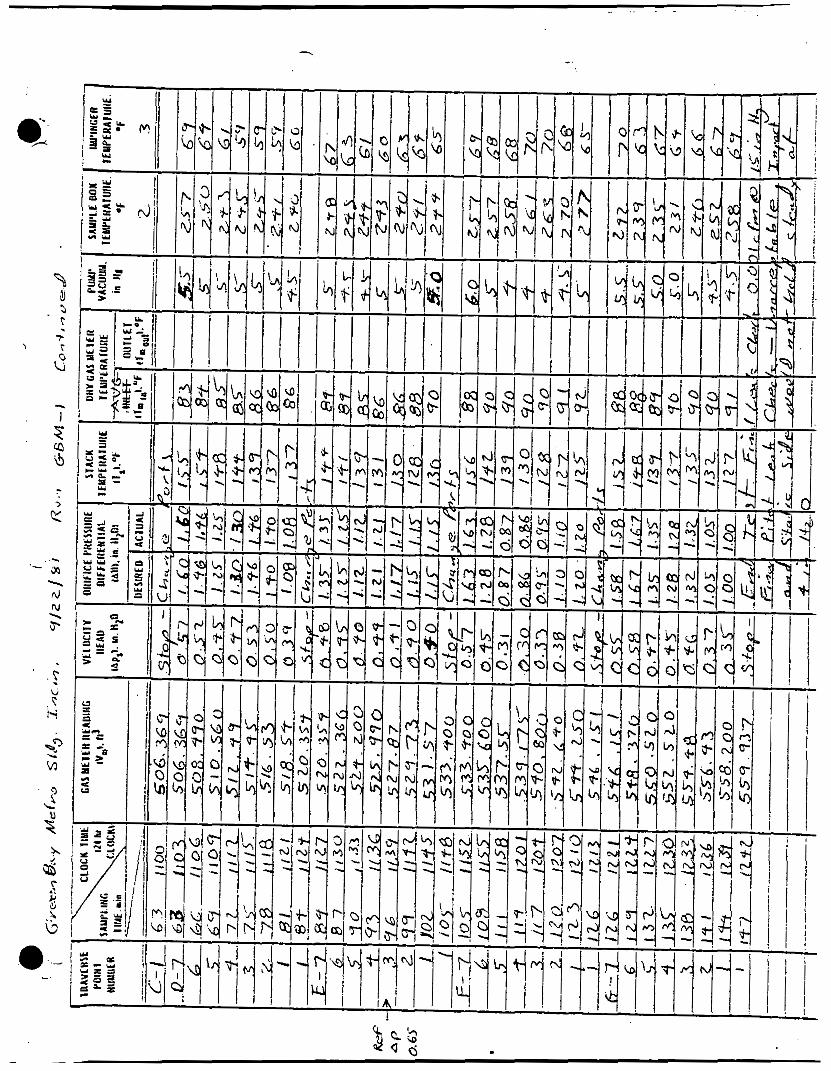
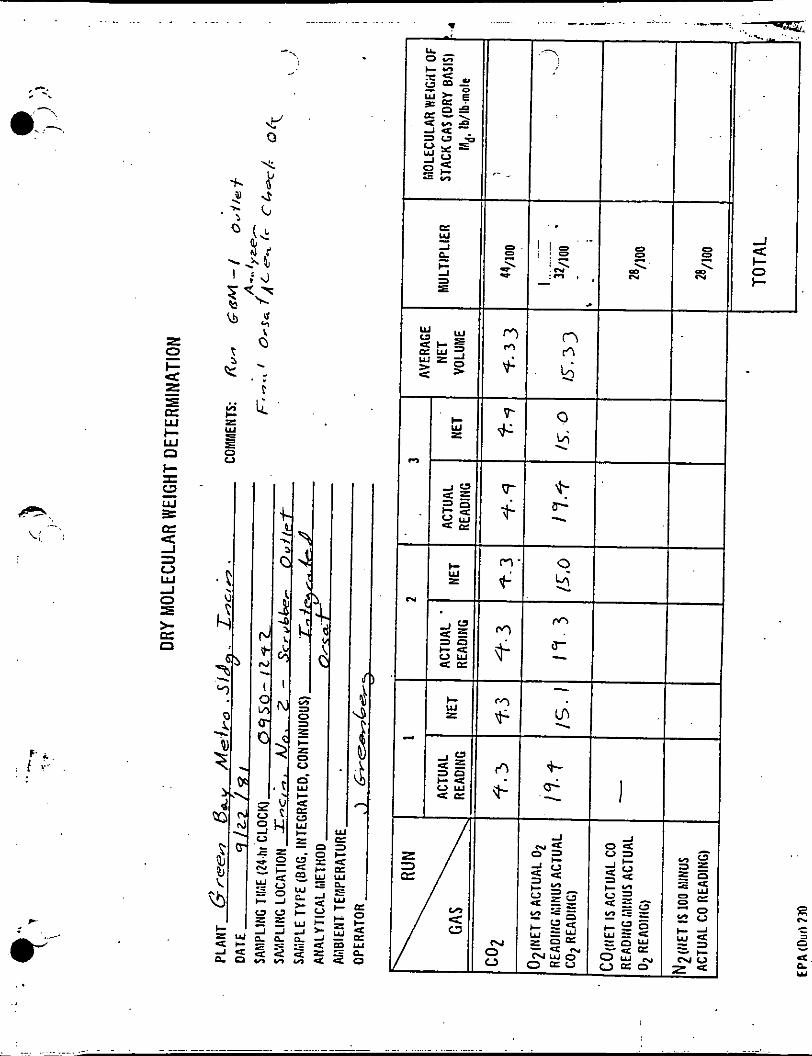
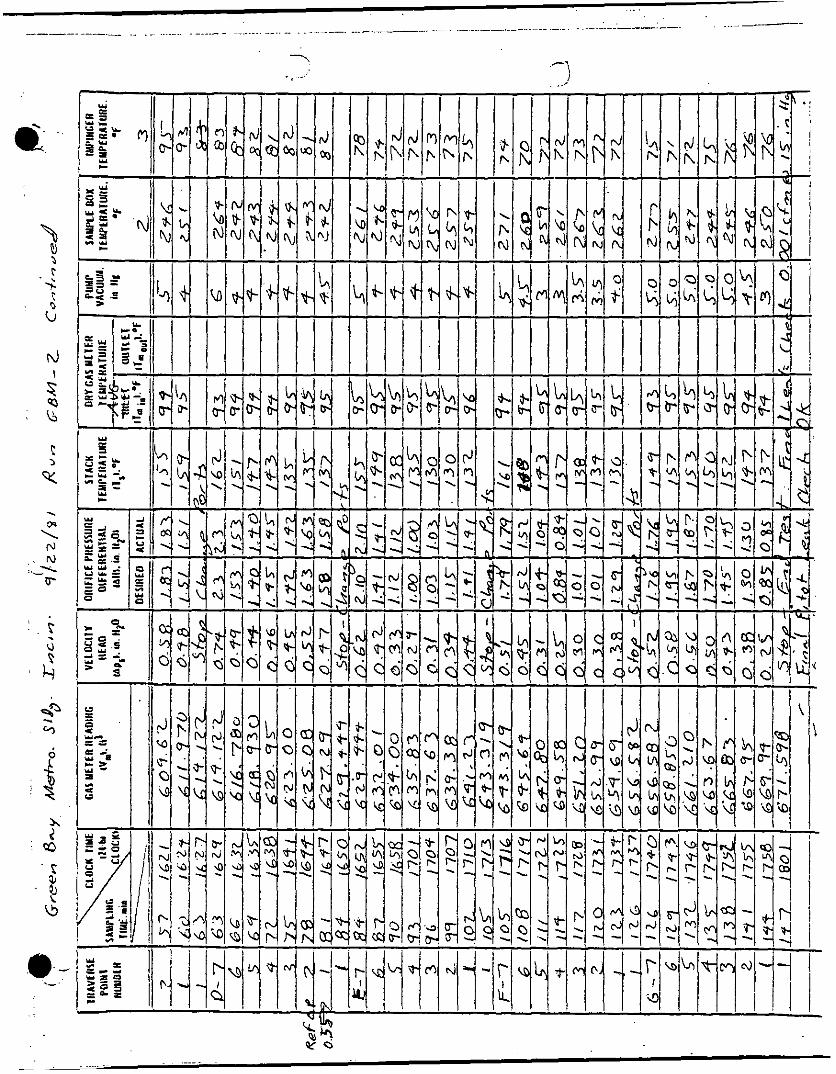
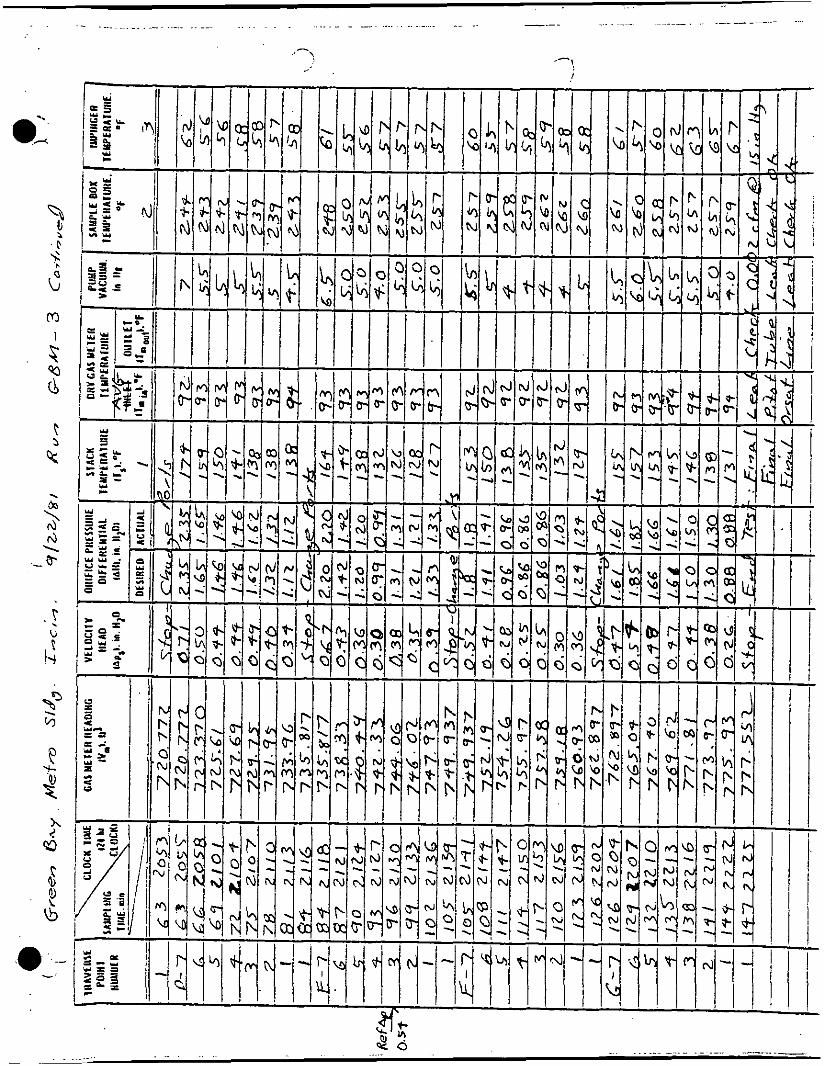
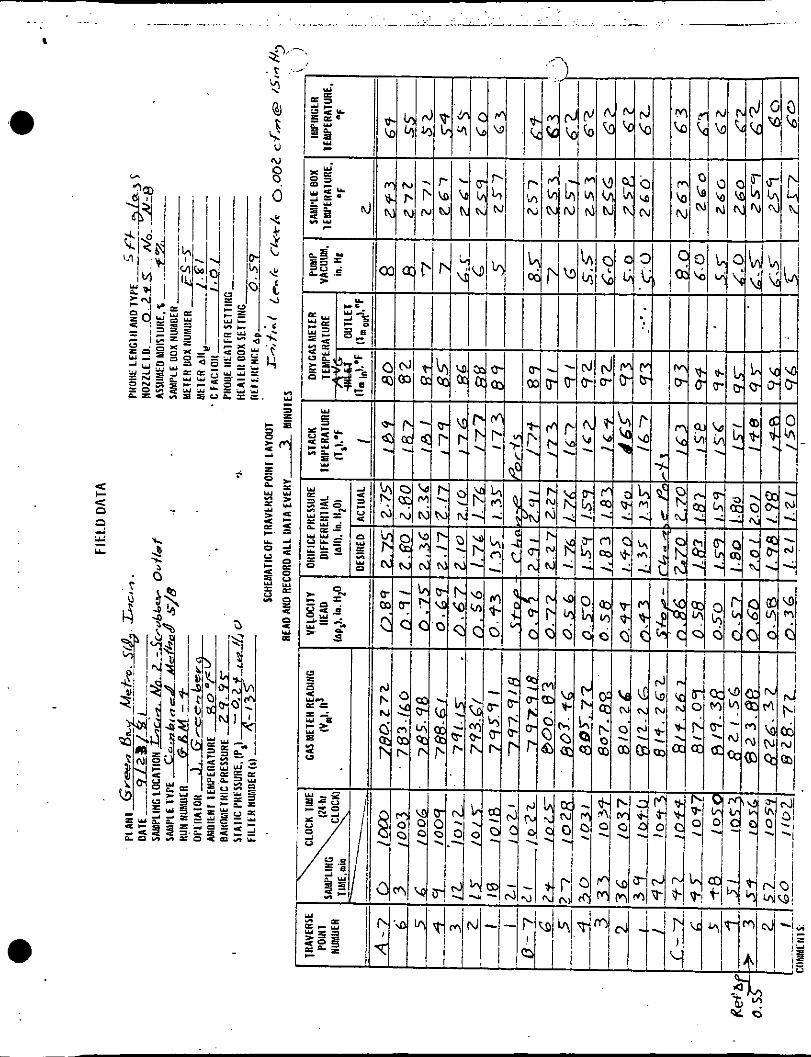
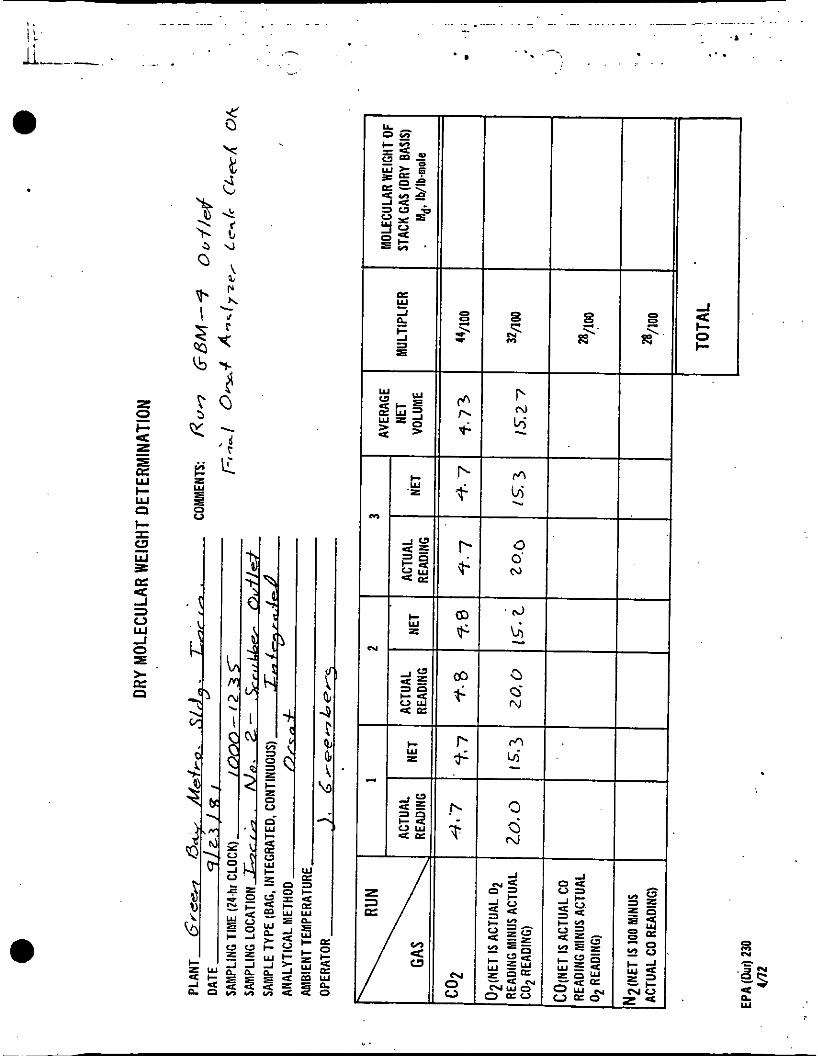
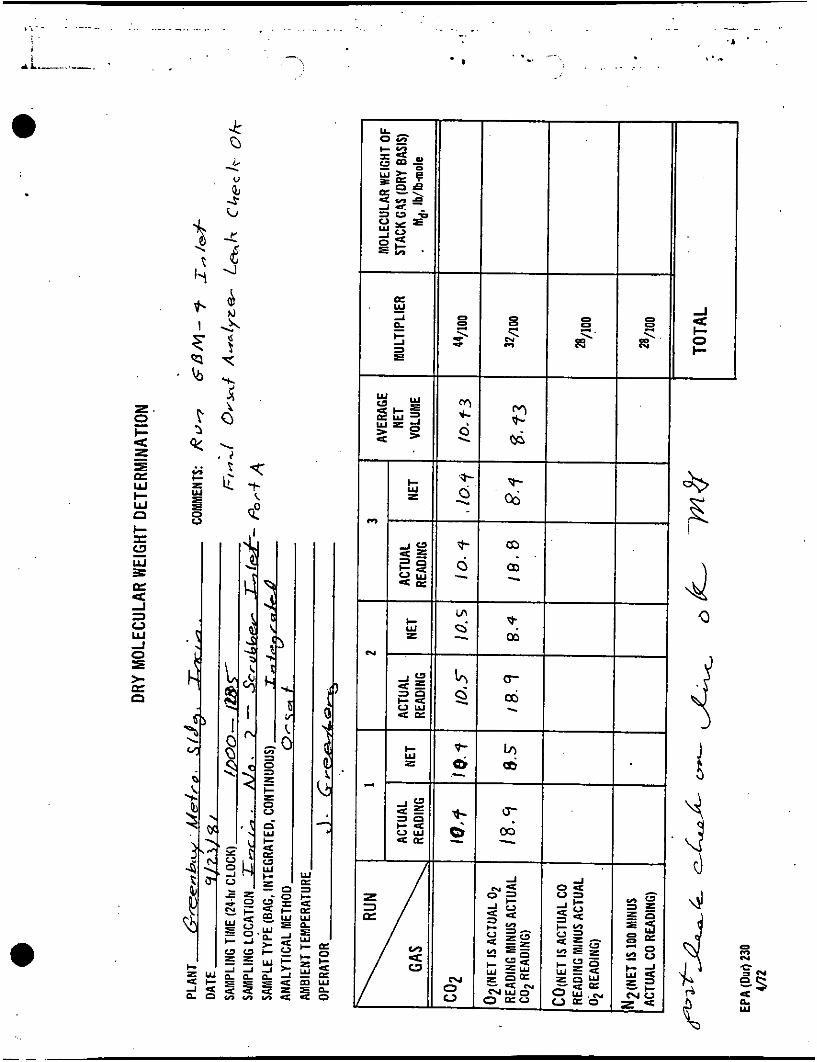
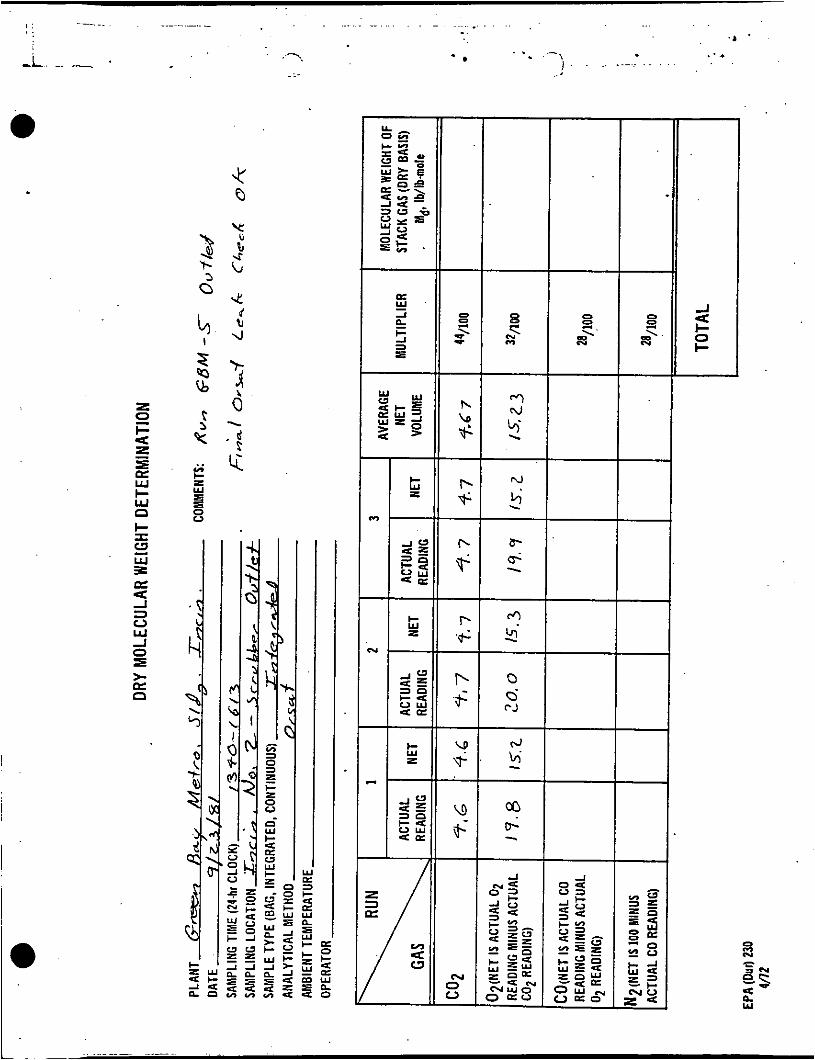
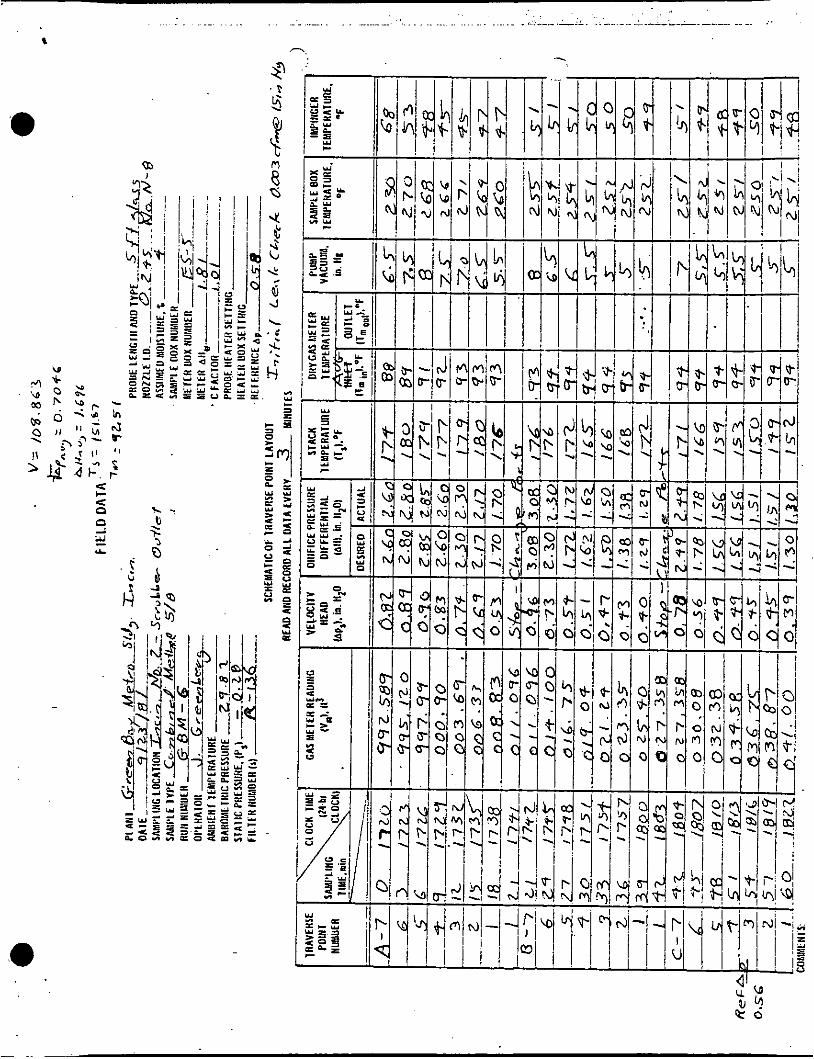
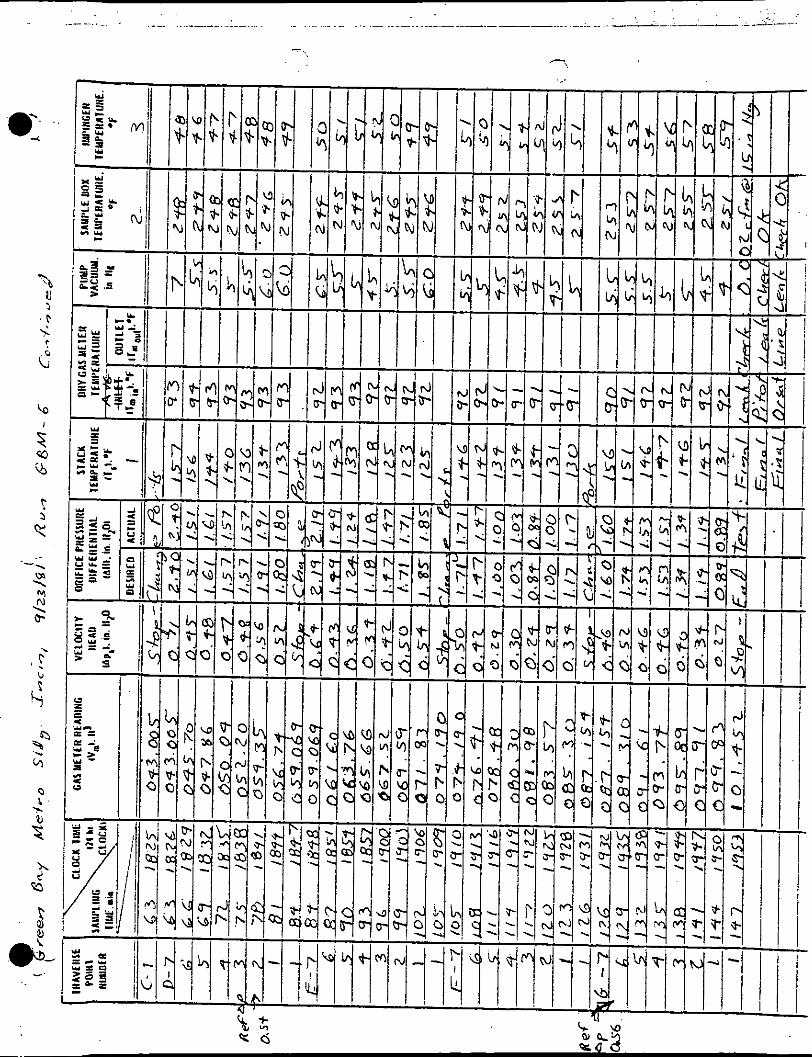
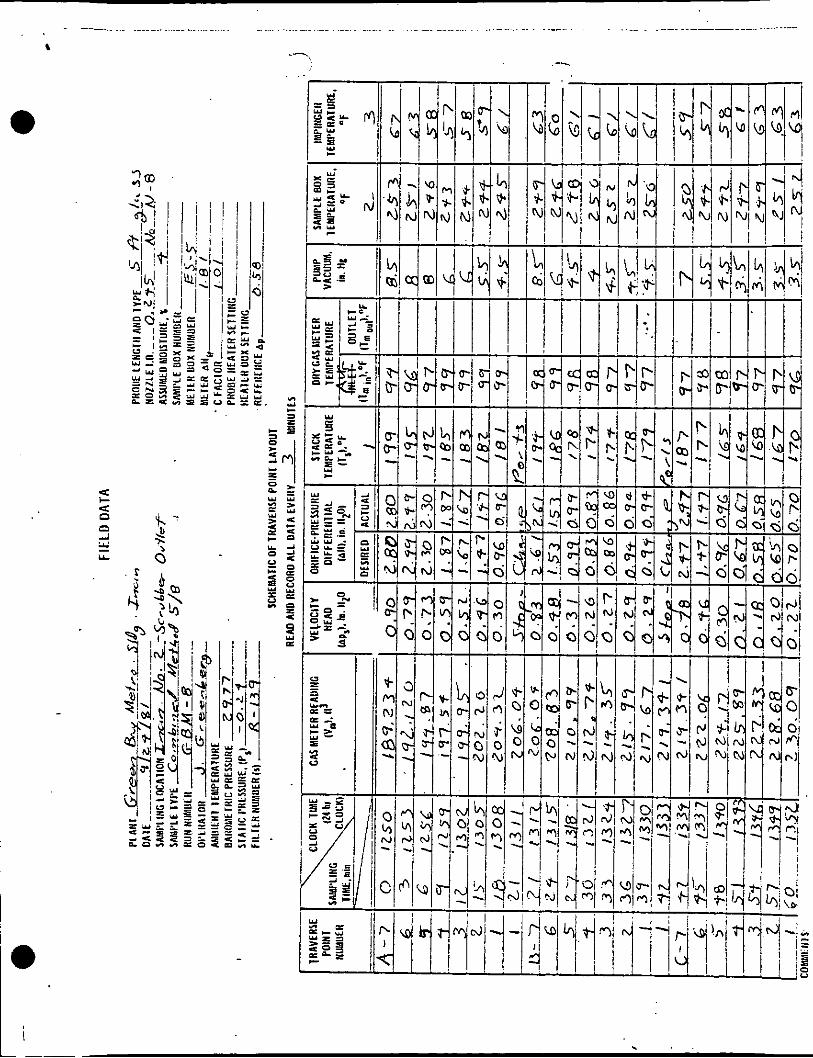
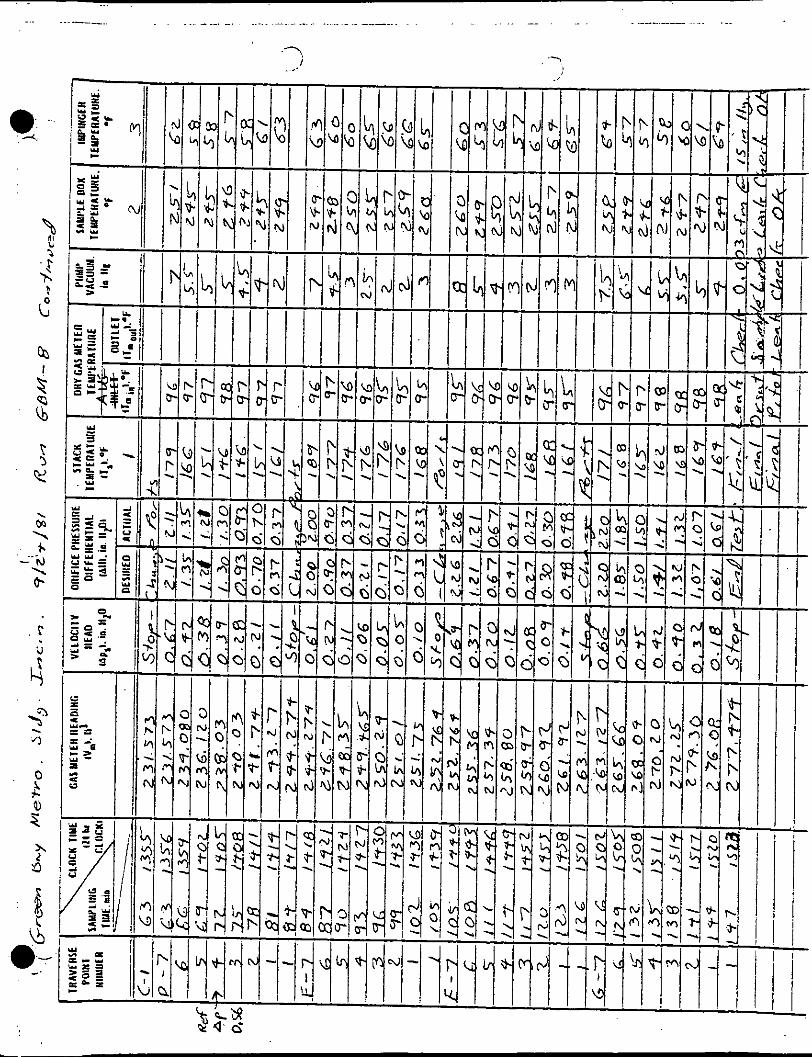
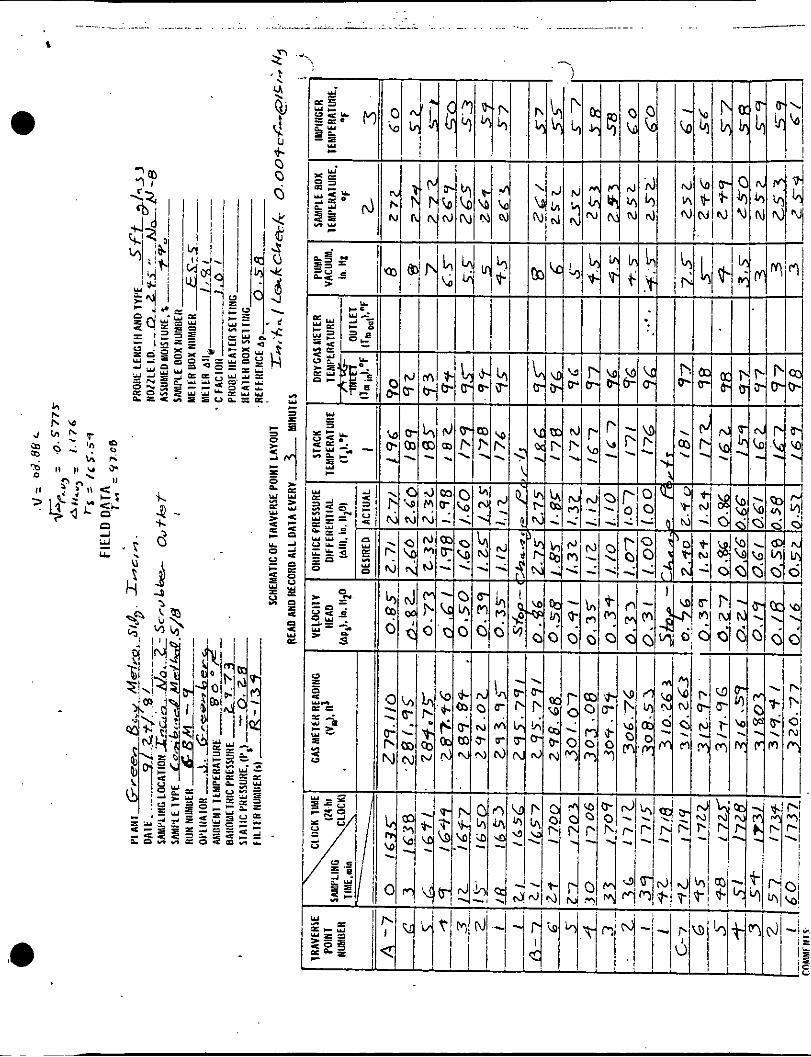
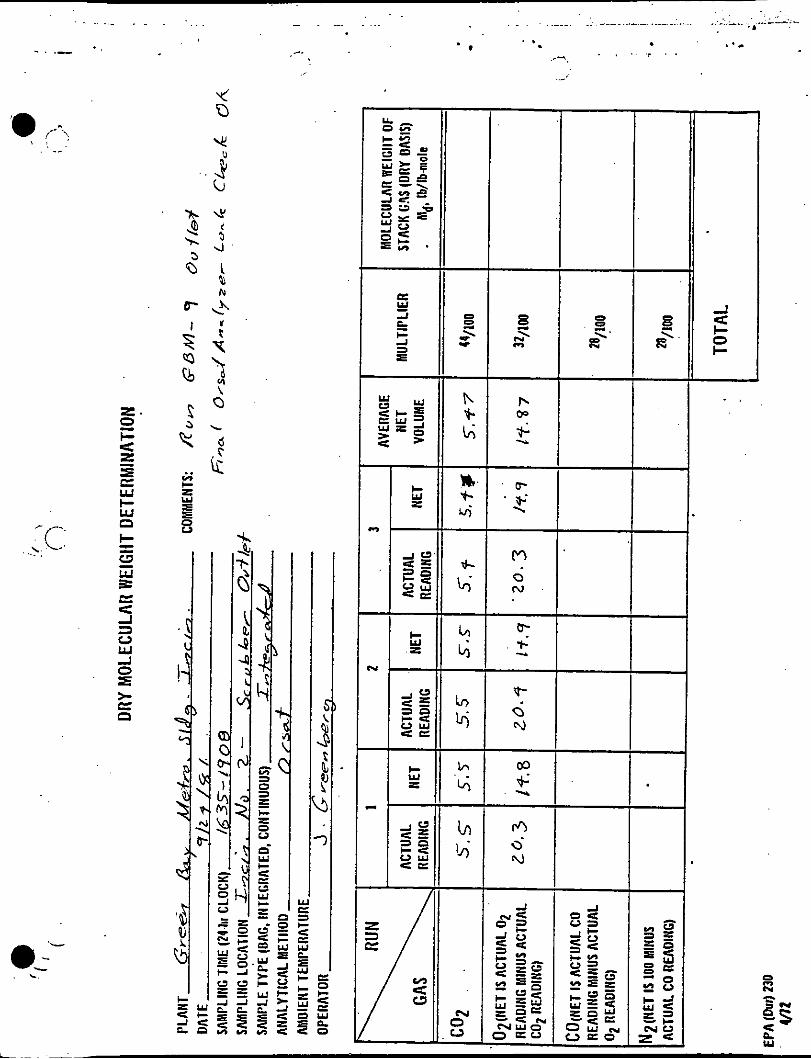
Seven traverse points were sampled through each of the seven ports for a duration of 3 minutes each, resulting in a total sampling time of 2 hours and 2 1 minutes. Gas sampling for determination of dry gas molecular weight and excess air was performed following the multipoint integrated sampling and analytical procedure of EPA Method 3. During each test a variable speed peristaltic pump was used for collection of an integrated gas sample for subsequent Orsat analysis.
a
through 4. 2 0 0 ml of 80 percent IPA was used in the first impinger for tests 1
ENGINEERING-SCIENCI 4-8
, -
e, Leak checks were conducted in accordance with procedures described in EPA Methods 2, 3 and 5 . The pitot tube, pitot lines, and Orsat lines were leak checked prior to and at the conclusion of each test. train was leak checked prior to and at the conclusion of each test. All leak checks except the final leak check of the pitot tube for test 1 were acceptable. The impact and static sides of the pitot tube on the 3 foot probe would not hold a steady vacuum of 3 inches H20 at the conclusion of the test. appear to be significantly different than for tests 2 or 3.
The sample
The velocity measurements made during test 1 however did not
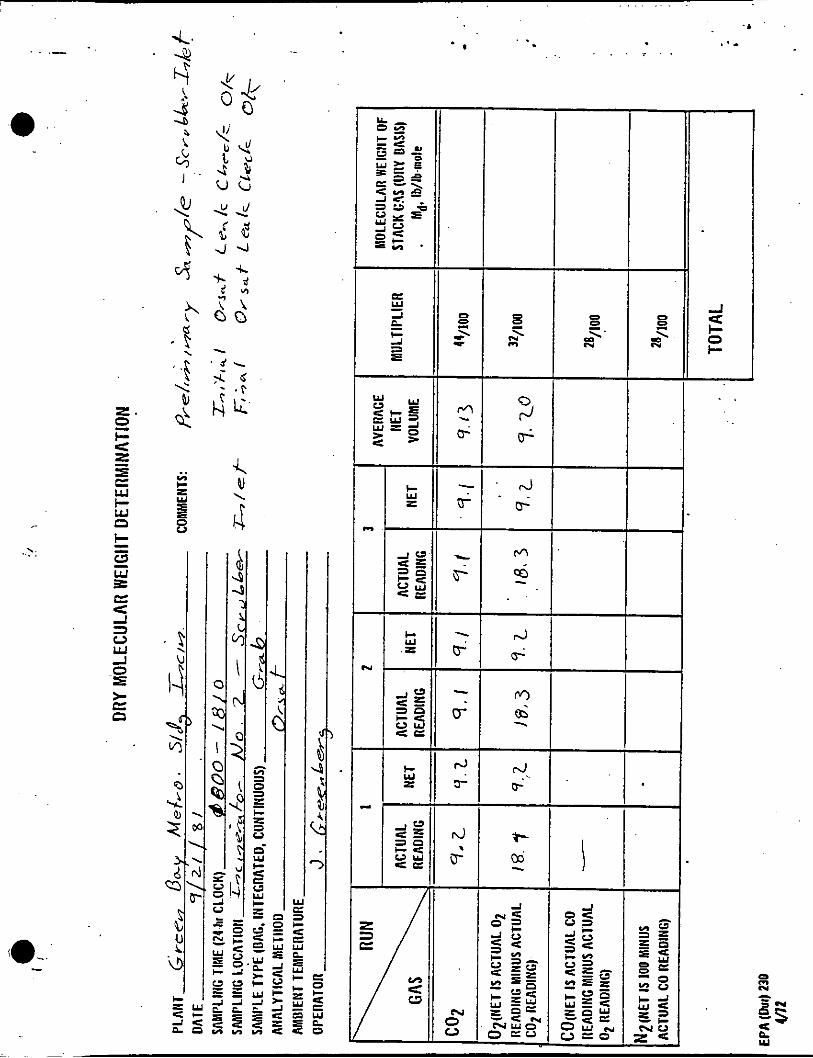
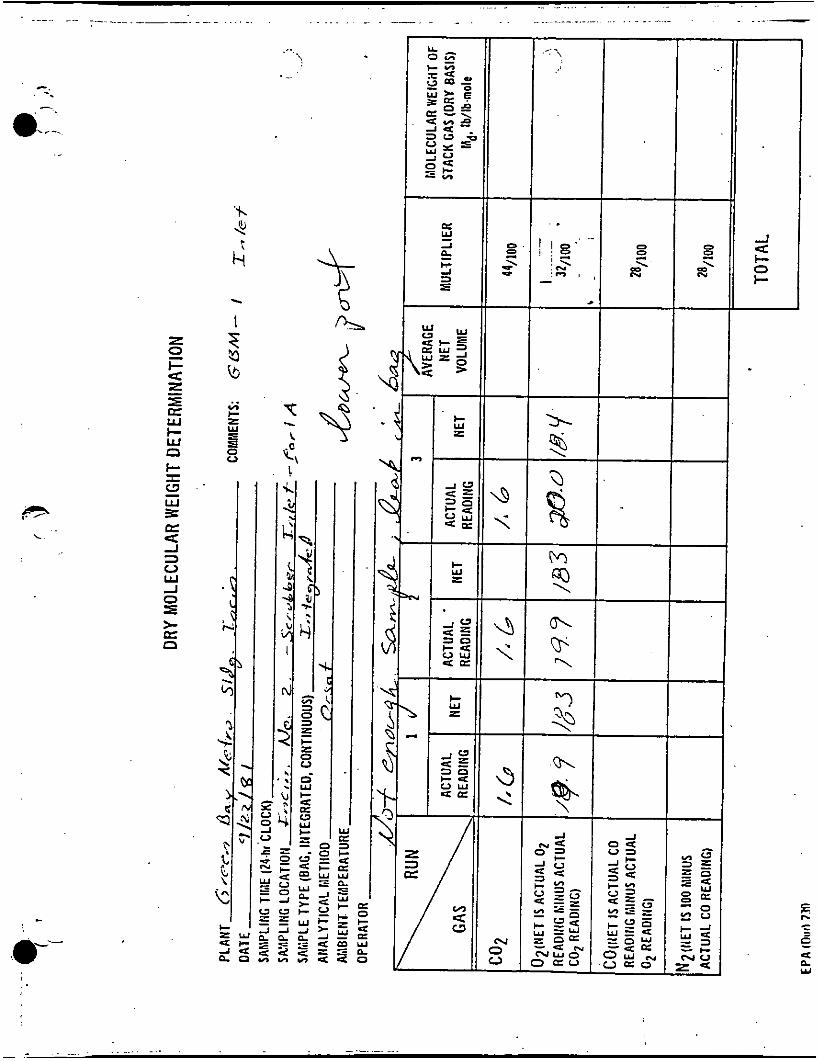
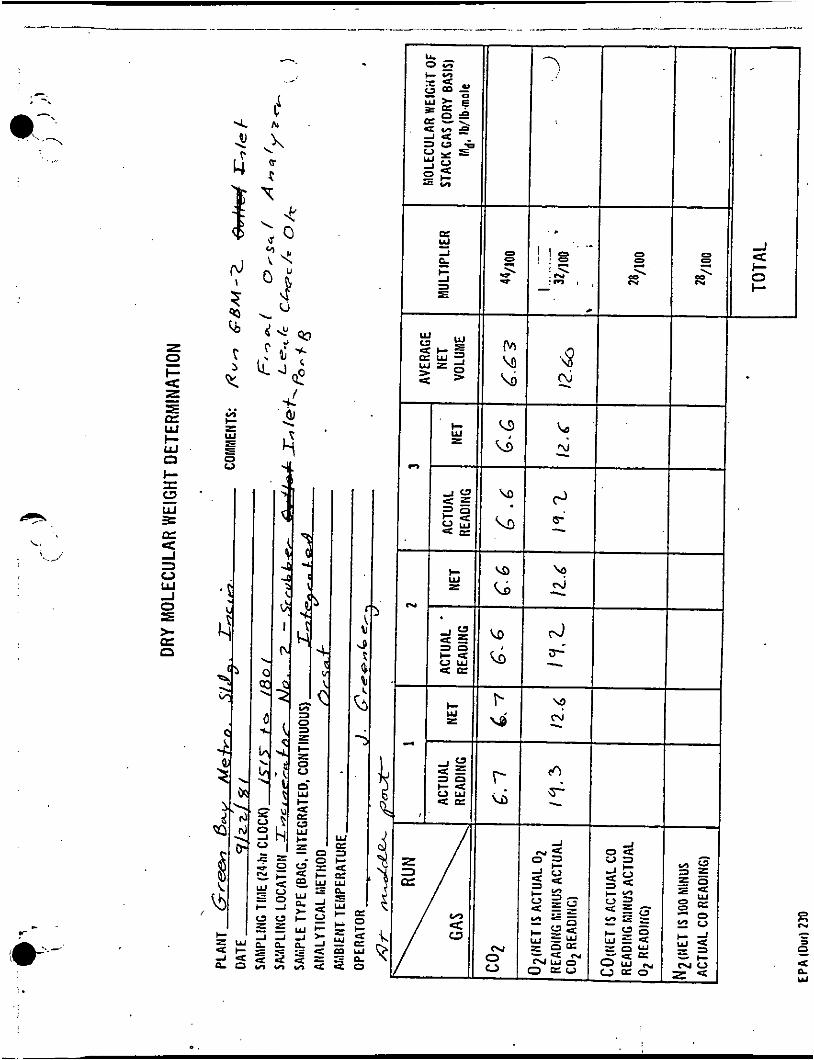
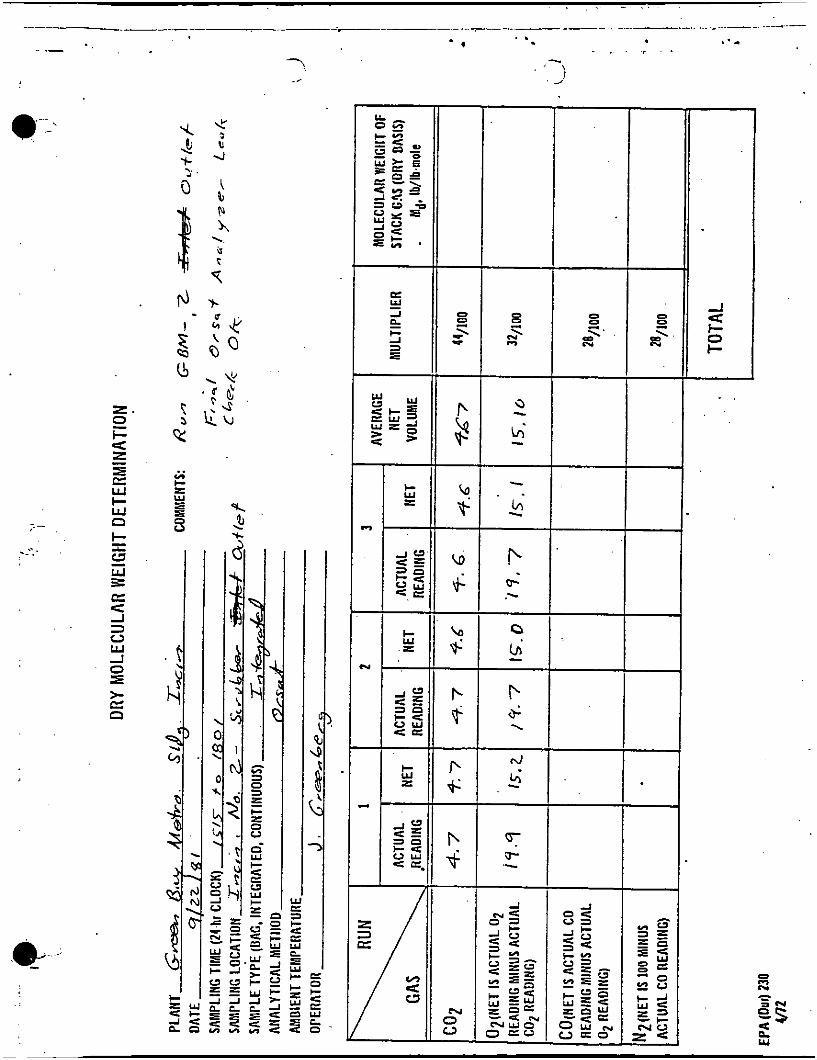
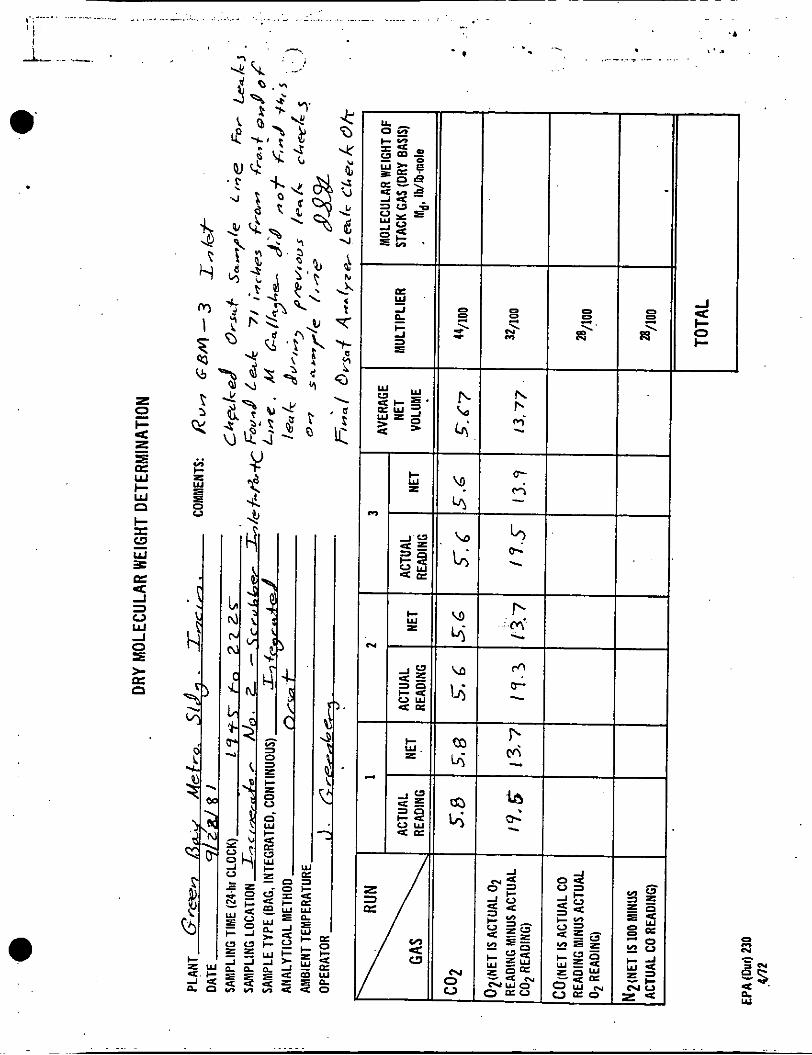
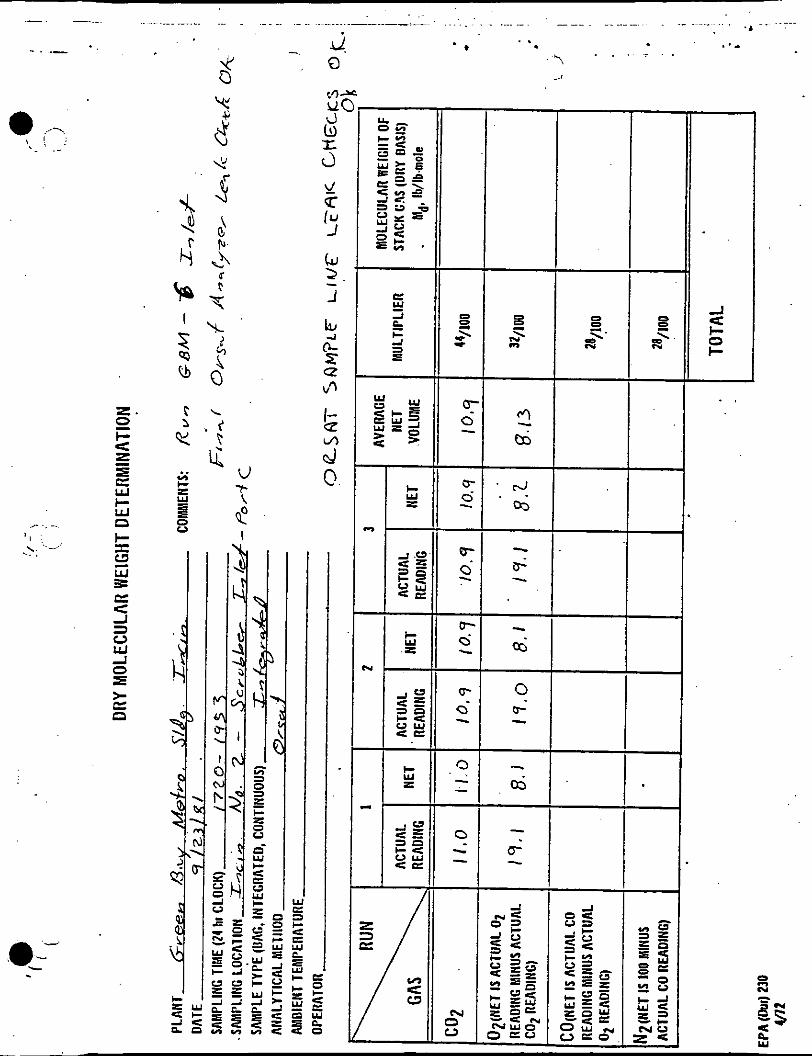
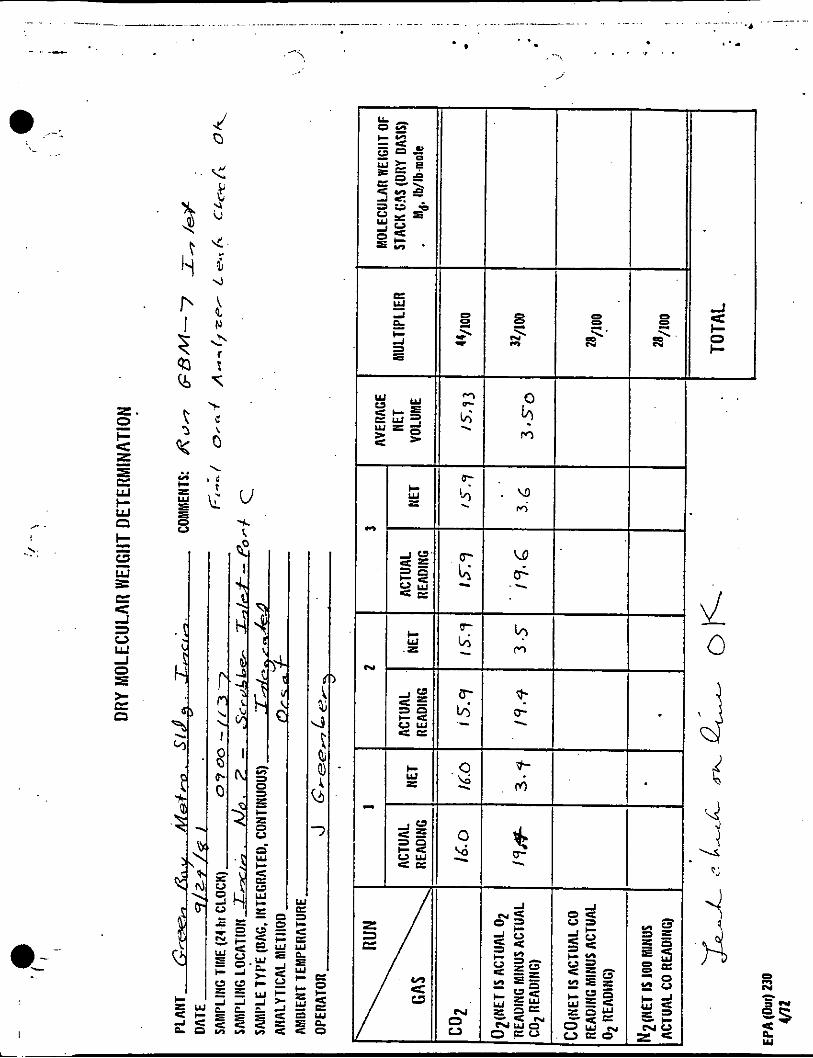
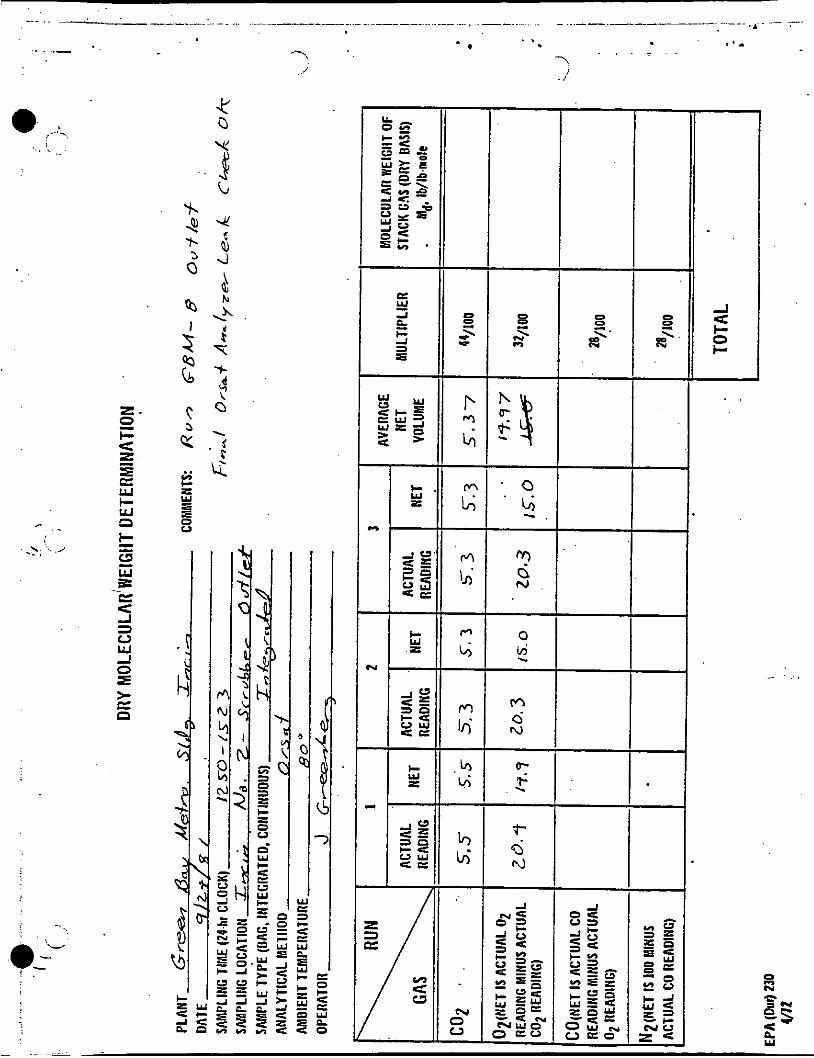
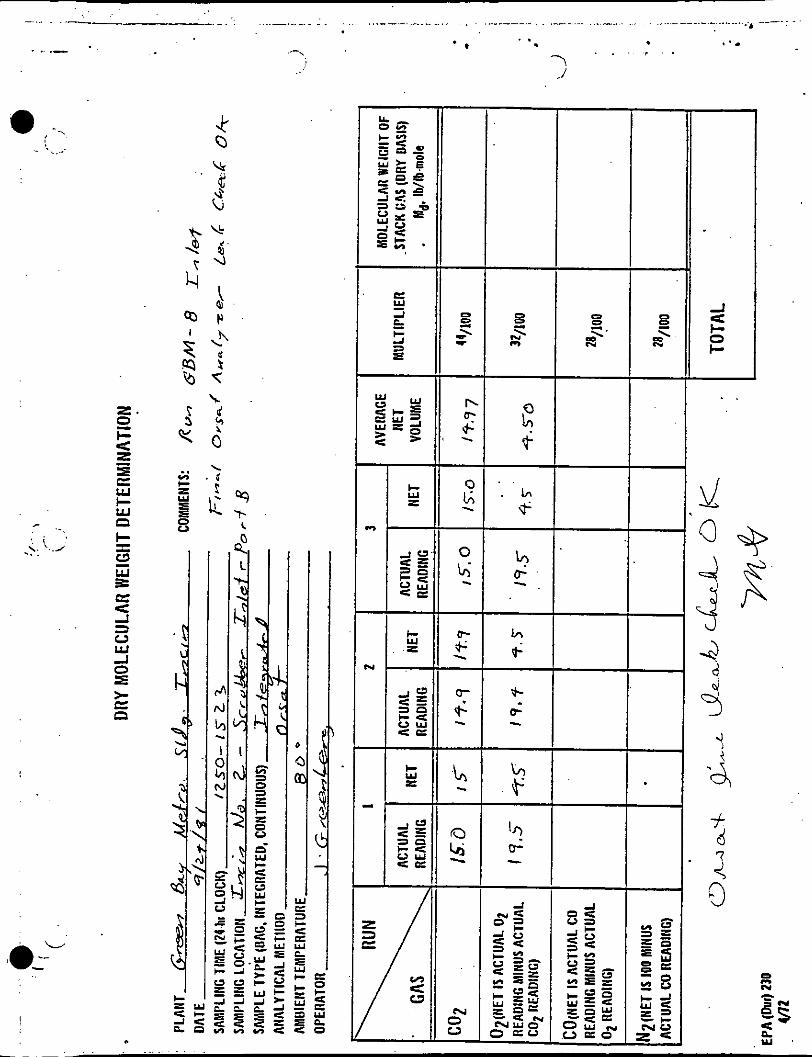
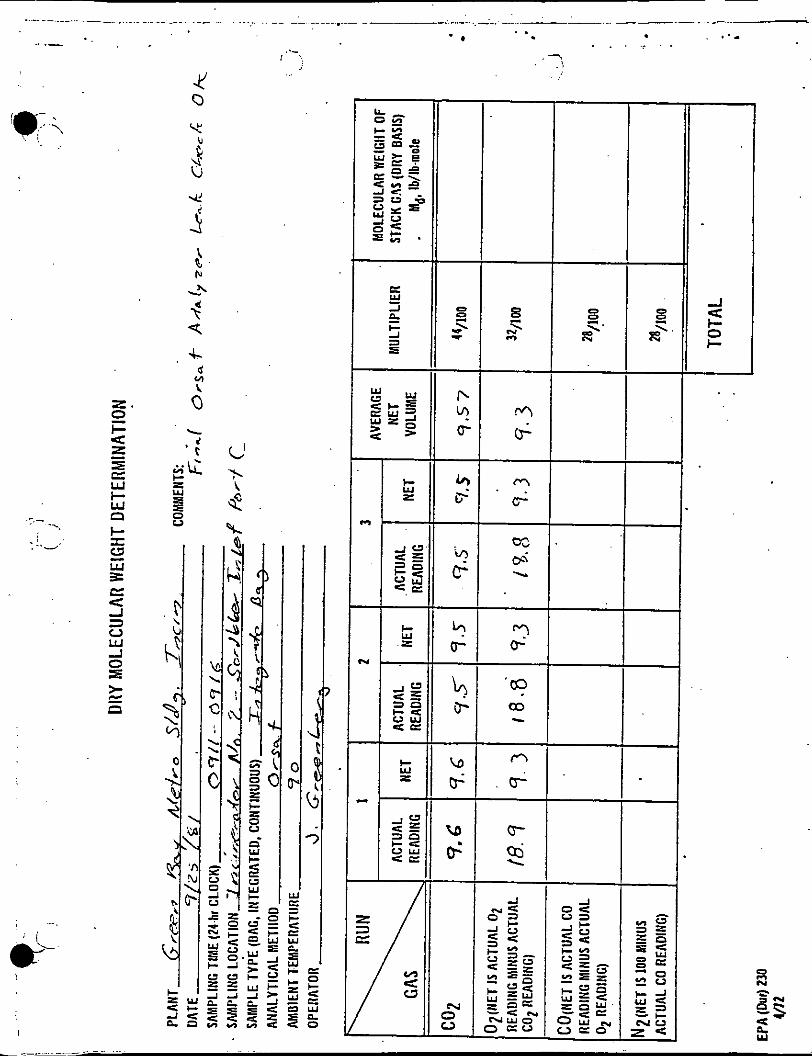
Concurrent with each test at the scrubber outlet sampling site, an integrated gas sample for determination of 02, C02 and excess air was col- lected at the scrubber inlet sampling site. The integrated gas sample was collected for an equal amount of time at each of the three sampling points within a port. A different port was sampled for each test during an incincerator Burn.
Due to a leak that developed in the stainless steel probe used for collecting the gas samples at the scrubber inlet site during the first 3 tests (Burn 1 1 , the gas samples were invalid. The Wisconsin DNR agreed that it would be acceptable to repeat the samples while the incinerator was operated under the same conditons. Three integrated samples, one through each port were collected on 9/25/81. centration for the three samples was used in calculating the excess air at the scrubber inlet for Burn 1.
Only one of the three ports was sampled during each test.
The average C02 and 02 con-
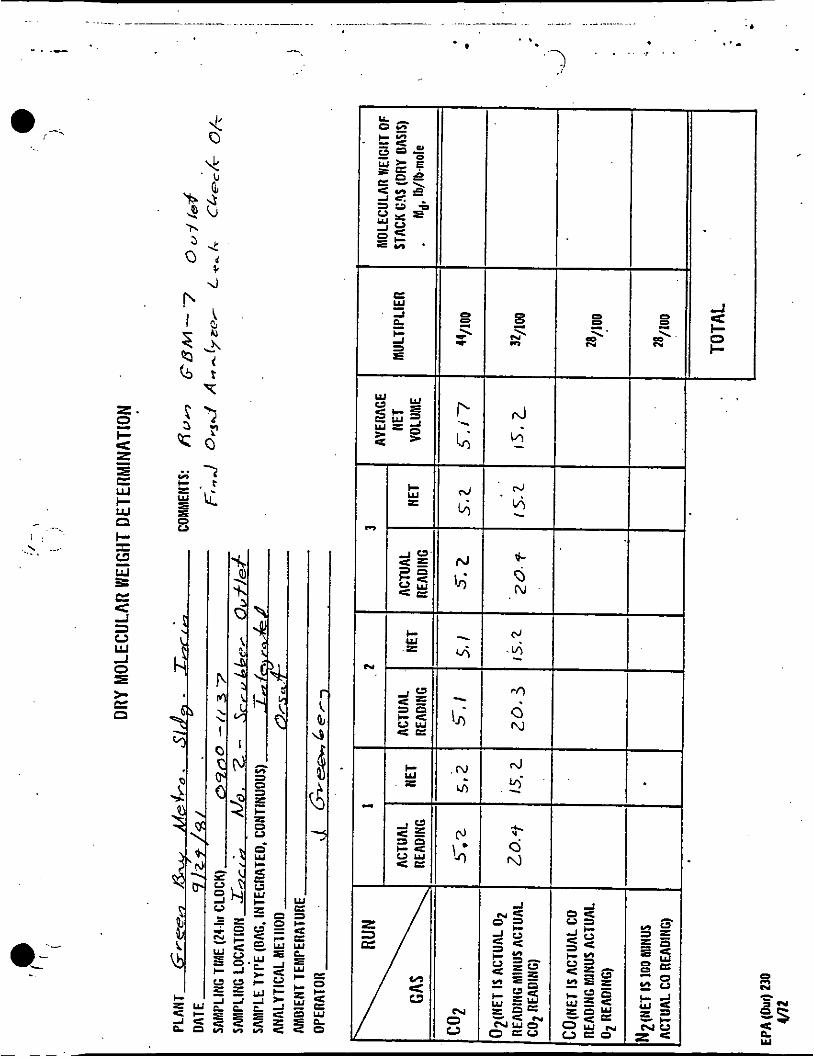
A velocity traverse of the center shaft coling air duct was performed A single grab sample of the once during each test of the scrubber outlet.
center shaft cooling air was collected for determination of 02, C02 and dry gas molecular weight. The center shaft cooling air was found to con- tain no C02.
4-9
.
CHAPTER 5
ANALYTICAL PROCEDURES
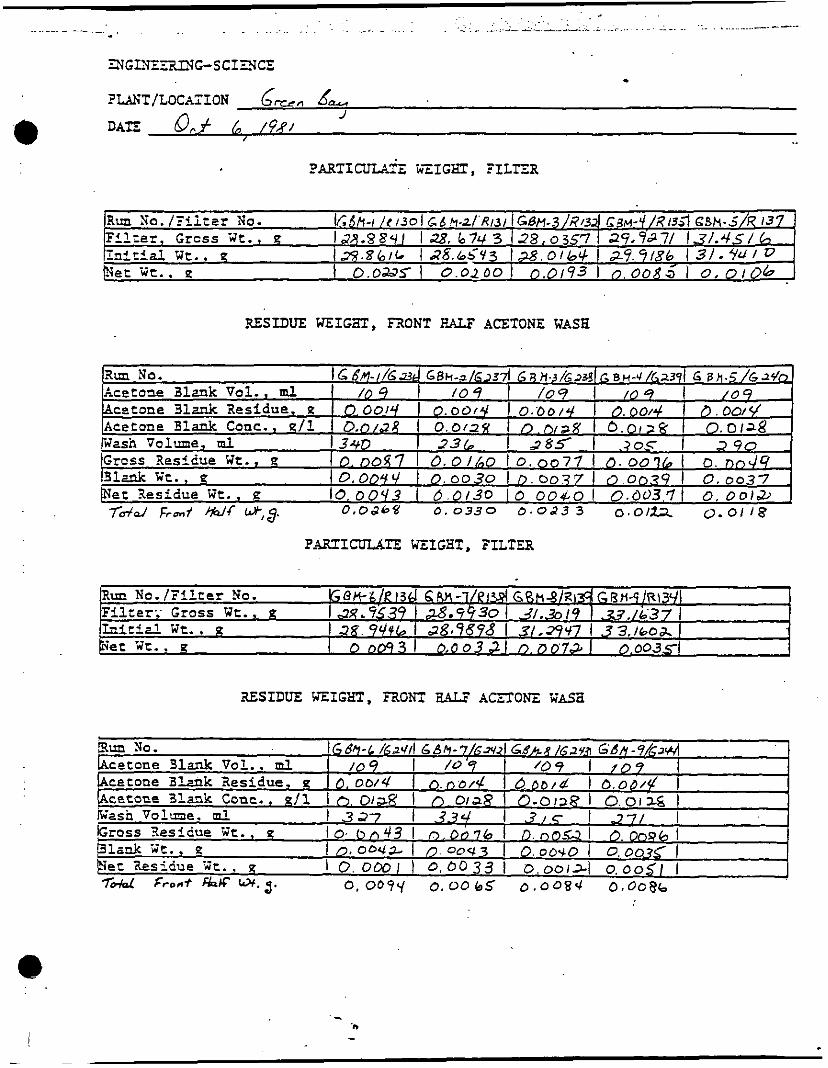
All analytical procedures for determining mass emission rates are identical to those specified in EPA Method 5 . A discussion of the procedures for the filters and acetone rinses used is presented below. The following general items apply to the discussion:
1.
2.
3.
4.
Filters
The term constant weight used in conjunction with tare weight refers to a weight change not greater than 0.5 mg from the previous weighing, with no less than six hours desiccation time between consecutive weighings.
The term constant weight used in conjv.nction with the exposed filters or acetone residue means a difference of no more than 0.5 my or one percent of the total weight less the tare weight, whichever is greater, between two consecutive weighinqs, with no less than six hours of desiccation time between weighings.
A l l glassware used for evaporation and residue determinations are purchased new for this 'purpose. and rinsed with deionized distilled water followed by oven
The new glassware is washed
drying.
Anhydrous calcium sulfate is used for all desiccations.
Filters are checked visually against light for irregularities, flaws, or pinhole leaks. Filters and petri dishes are numbered so that each filter petri dish set has its own number, i.e., the numbered filters are placed in their respective petri dishes, thus giving each filter-petri dish set its own identification number. Each filter-petri dish set is then desiccated, tare weighed, etc., as one unit.
The filters are desiccated in their respective petri dishes at 68OF 2 10°F and ambient pressure for at least 24 hours and weighed at intervals of at least six hours to a constant weight. During each weighing, the filter is not exposed to the laboratory atmosphere for a period greater than two minutes or a relative humidity above 50 percent. After tare weighing, the filter-petri dish sets are placed. in plastic bags and stored in the original petri d i s h cartons.
5- 1
0 Rubber bands, approximately 1-inch wide a re used t o secure the p e t r i dish l i d s . Handling of the f i l t e r s o r p e t r i dishes i s done only with l a t e x gloves or forceps.
After t h e samples a r e co l lec ted , t h e exposed f i l t e r s i n t h e i r respec- t i v e p e t r i dishes a r e desiccated f o r a t l e a s t 2 4 hours. The f i l t e r - p e t r i dish sets a r e weighed t o a constant weight and t h e r e s u l t s reported t o the nearest 0 .1 mg.
Acetone Rinse
Only reagent-grade acetone i s used. P r io r t o use, a blank is run on t h e acetone t o determine t h e blank residue. A measured amount of acetone i s evaporated t o dryness i n a t a r ed 250 m l beaker on a steam bath. The residue concentration i s t h e n calculated. A t no time i s acetone t h a t has a blank value grea te r than 0 . 0 0 1 percent used.
Numbered 2 5 0 m l beakers, prepared a s noted i n i t e m 3 above, a re desic- ca ted f o r a minimum of 2 4 hours and weighed t o a constant weight. Beakers a r e s tored i n a desiccator p r i o r t o use.
The volume of each acetone r i n s e is determined gravimetr ical ly , using a t r i p l e beam balance and the following equation:
'i - - wr = volume of Acetone D
Where:
W i = Weight of sample b o t t l e and r i n s e , ( 9 ) ;
wf = Weight of sample b o t t l e empty ( a f t e r acetone r i n s e has been t r ans fe r r ed t o beaker, (g) i
Wr = Weight of sample residue a f t e r evaporation of the acetone, ( g ) ; D = Density of acetone, (g/ml).
The contents of each acetone r i n s e b o t t l e a r e t r ans fe r r ed t o a pre- viously t a r ed and numbered 250 m l beaker and evaporated t o dryness on a steam bath. Each b o t t l e is r insed w i t h a known quant i ty of acetone, i f poss ib le from the same l o t as t h e sample. I f acetone from another l o t is used, t h i s necess i t a t e s t h e determination of another blank residue value. The dry beakers a r e desiccated f o r a t l e a s t 2 4 hours and weighed t o a constant weight. Results a r e reported t o the nearest 0 . 1 mg.
Samples of acetone were co l l ec t ed a t t h e t e s t s i t e from each l o t used during sampling. These a r e labeled acetone blank and were handled i n the same manner a s t h e acetone rinses. Acetone blank values a r e reported t o t h e neares t 0 .1 mg.
5-2
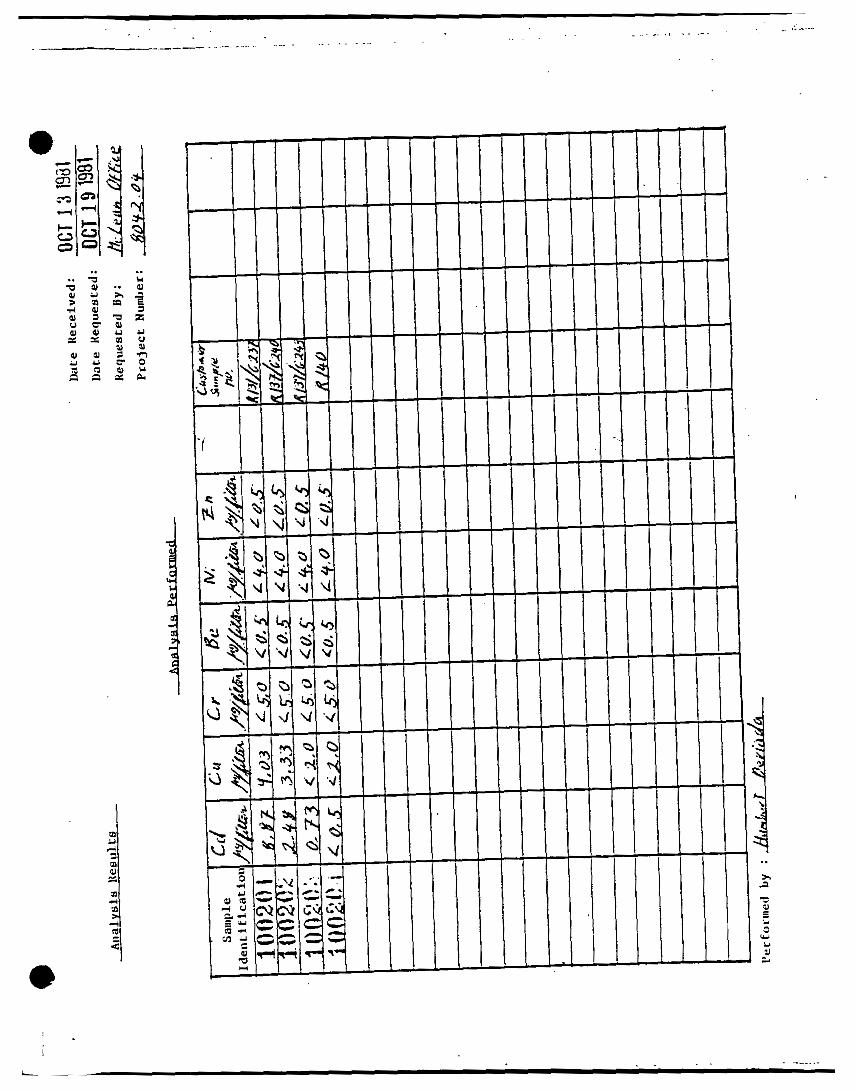
Heaw Metals (Cd, Cu, Cr, Be, Ni, zn)
The analyses for heavy metals were performed using a modified method for determination of lead in suspended particulate matter as published in Federal Register, Vol. 43, No. 194 - Thursday, October 5, 1978, pp. 46258 - 46261. The modifications were that the entire Method 5 filter and front half washings were digested using 3 M "03 and then brought to 100 m l . This was directly aspirated into a Varian model AA-5 atomic absorption spectorphotometer fitted with the appropriate hollow cathode lamps for each element. Minimum detection limits are taken from Table 1 as published by EPA in Methods for Chemical Analysis of Water and Wastes, March 1979, pp. Metals - 3. Sulfur Dioxide (SO2)
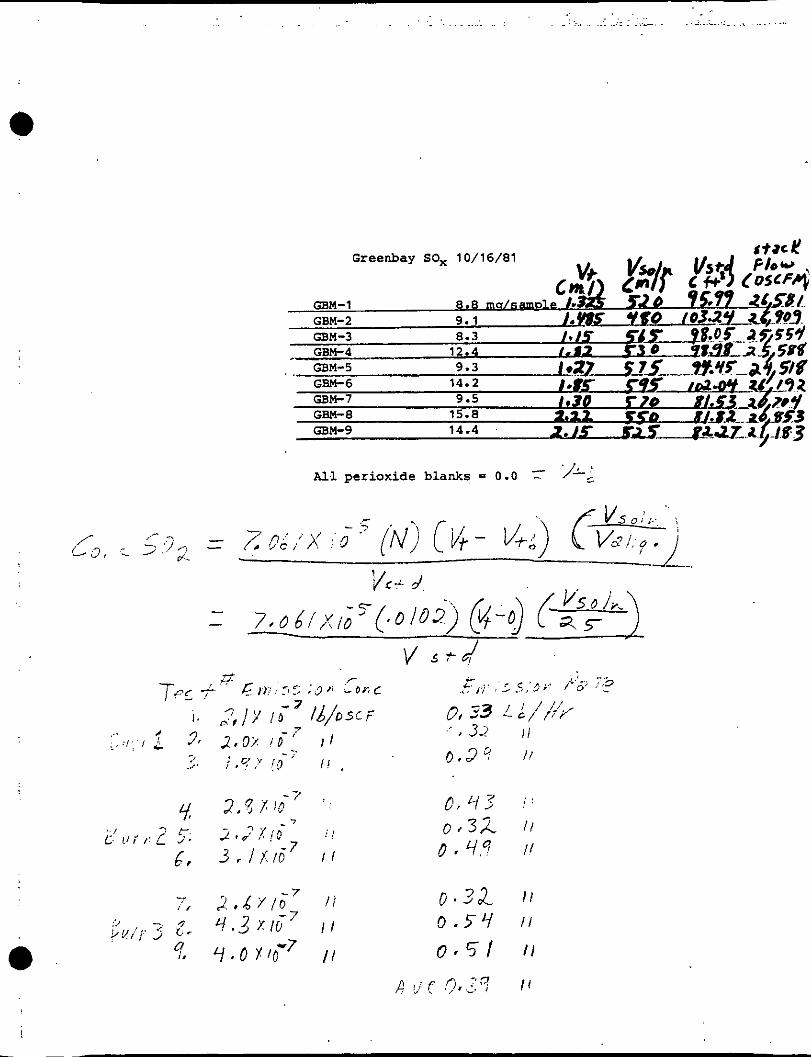
Titrations for determination of SO2 were performed on the combined contents of the peroxide impingers and glasswool plug. cedure detailed in EPA Reference Method 8 was followed.
The analysis pro-
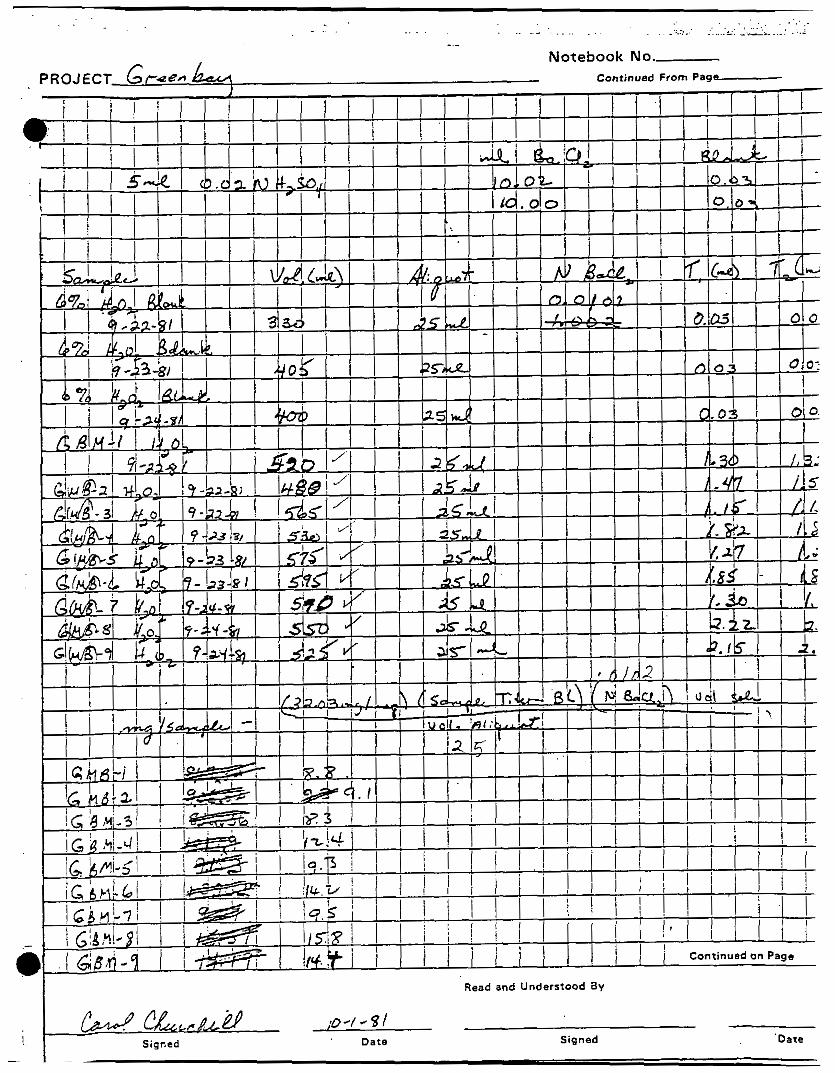
A summary of this procedure follows:
1. 0.0100N BaC12 is standardized using 0.0100N 82504.
2. An I P A blank is titrated with 0.0100 N BaC12 . 3. The volume of the peroxide sample (H202) sample is noted.
An aliquot of the H202 sample is diluted with 100 percent isopropyl alcohol to make an 80 percent solution. solution is titrated with standardized 0.0100N BaCl2 using a thorin indication. Duplicate samples are titrated. The duplicates must arqree within 1 percent.0~ 0.2 ml which ever is greater.
This
The mg 1 sample is calculated as follows:
mg/sample = (32.03 mg/meq)(Sample titer-Blank)(N BaCl:,)(Sample vol.) aliquot volume
5-3
. . . ... - .. .. .. .~ .. ~~
APPENDIX A
FIFZD DATA
. . . . - . . .
TRdVUSE POINT
NUOBU
TRAVERSE P O I N T LOCATION FOR CIRCULAR DUCTS
S t u h PRODUCT OF r n V E R S E P O l K L O G FRACTION 1 W J f ? COLUVNS 2 AND 3 FROM OUTSIDE OF NIP!
(SUM OF COLUhliNS 4 5 DISTANCE 9 OFSTACK 1.0. I +BWl-B- . . . (TO NEAREST l i8 INCW
943!)!4ETiiI C PQESSIJRE P ( S ) ........... x c y 31 '!EVSI ous E ( s ) ............... S.GiPLINL: NOZZLE DI4.!4ET'ER 3(N) ...... ST4CK G A S PeESSURE P ( S ) ............. 'J1TI)T TUSC COEFFICIENT C ( P ) ........ DLiY GAS MFTEli COH!ECiIr)Fi FACTO2 GOA)
OPERATIONAL CATA
VOLUME OF 'JRY GAS SAMPLED. HETER QIND. (!!NCOWECTFD) v ..............
V 0 L L J . E OF D R Y GAS SAMPLED, METER COND. ( C O R R ? . Z E D ) V( M ) ..............
dCT T M E OF TEST T ( T ) ............... '/OLUh(E OF WATE'! COLLECTED V( N ) ...... . ~~
P A a i I C U L A T F S -COLLECTF3;
PAP TI CULATCS COLLECTED, F?(!NT F; ALF **!(F) ..................... TOT P I
P F P E N T PERCENT
A.4 c. R AGE
M(T) .......................... C4RBON DIOXIDE % C 0 2 ........ C4!?qON MONOXIDE % CO .........
2 9 . P 3 IN. YG 38.0 IN . R V 46.5 ItJ.
n.245 IN. 29.81 I N . HG
0.550 0.980
110.511 CU. FT.
i o~ i .301 cu. FT. 1 4 7 . X I V . 58.6 MI-.
33.0 MG.
NOT 4PPI.I C 4BLE 4.67 % 0.0 % ~
OYYGEN. % 0 2 ................. 15.11) % G A S HETER TEMDERATURE T ( H ) .. 5 5 A . 6 3EG. 2 O R I F I C E PRESSURE PROP P ( q 0 .. 1 .733 I N . H20 STACK G A S TCMDCRATURE T ( S ) .. 617.20 DEG. R
I / I I 0.580 I 176. I I 12 I 0.030 I 174. I I 13 I 0.600 I 174. I I I A I 0.510 I 178. I I 15 I 0.000 I 169. I I 16 I 0.810 I I 65. I I 1 7 I 0.530 I 162. I I I3 I 0.580 I 158. I I 19 I 0.640 I 156. I I 20 I 0.5~0 I I 55. I I 21 I 0.480 I 159. I I 22 I 0 .740 I 162. 1 I 23 I 0.490 I 151. I I 2 4 I 0.440 I 147. I I 25 I 0.460 I 143. I I 26 I 0.450 I 135. I I 27 I 0.520 I 135. I I 2Q I 0.470 I 137. I
I 30 I 0.420 I 140. I I I I I I------------------------------------------------------------- I
T(!40 P(ST) x ------ V(!AST) = G ( % O X V X -I---
T( ST)
;WEHE T(ST) I S THE iEMPER4TlJRE AT STAFIDARD CONDITIONS ( 5 2 8 DEG. R ) . P(ST) IS THE PRESSURE AT STANDARD CONDITIONS (29 .02 I N . q G ) . 4 N D G ( Y ) IS THE VALUE FOP THE D R Y GAS METER GANAA.
29.957 x ------- = V(;AST) =0.950 X.IlO.511 X ------- 520
554.0 29.92
103.241 CU. FT.
VOLP.15 OF WATER VAPOR COUFCTED. STANDARD CONDITIONS
V(WLST) = ( 0.04707 ) X ( V ( W ) )
WHE2E 0.04707 I S THE VOLIJVE. MEASURED I N CU. FT. 4T
M l i l L 9 OCCIJPY UPON C V PPOA ATION. STANI)ARD C O N D I T I O N S . THAT I .n ML. OF L I O U I D WATER
V(Wv5T) = ( O.OA707 ) X ( 58.6) = 4.182 CIJ. FT.
PERCEYT MOISTURE IY ST4CK G4S
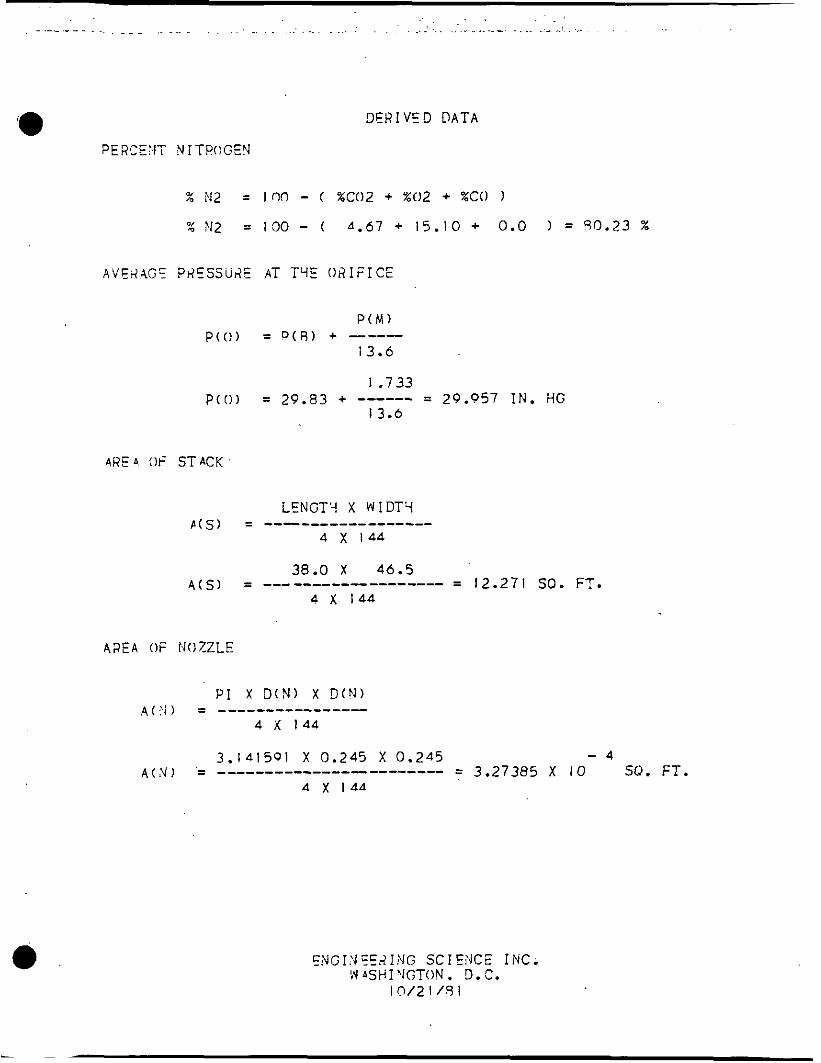
PERCEYT D R Y G F S I N ST.4CK G G
L
. . . . . . . . .. .~ . .. . .. ..: . . 2.
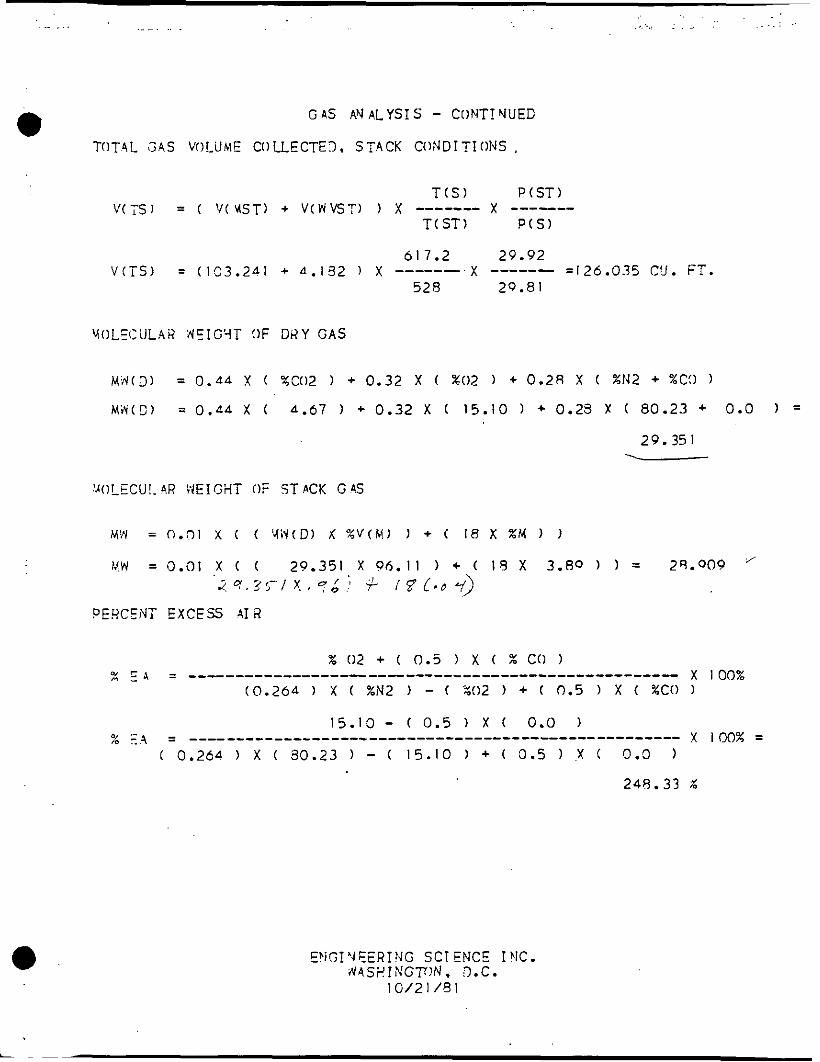
G AS AN ALYSI S - CONT! NUED
TOT4L G A S VOLUME COLLECTE3, STACK CONDITIOIJS ,
T ( S ) P(ST) V(iS) = ( V ( H S T ) + V(WVST) 1 X ------- x
T( ST) P(S)
61 7.2 29.92
528 29.81 V ( T S ) (103.241 + A.132 ) X ------X ------ =126.035 CU. FT.
YOLECilL.42 NICIGYT !)F DRY GAS
M H ( 3 ) = 0.44 X ( ZC02 + 0.32 X ( %02 ) + 0.28 X ( XN2 + %C!) )
MiV(5) = 0.44 X ( A.67 1 + 0.32 X ( 15.10 1 + 0.29 X ( 80.23 + 0.0 1 =
29.35 I - W!.ECU!.4R V4EIG4T OF STACK G 45
E?iGIUEERING S C I E N C E IEJC. iV4SVINGTr)N. 3.C.
10/21/91
~
. . . . .,. . . .. . . . . . . ~
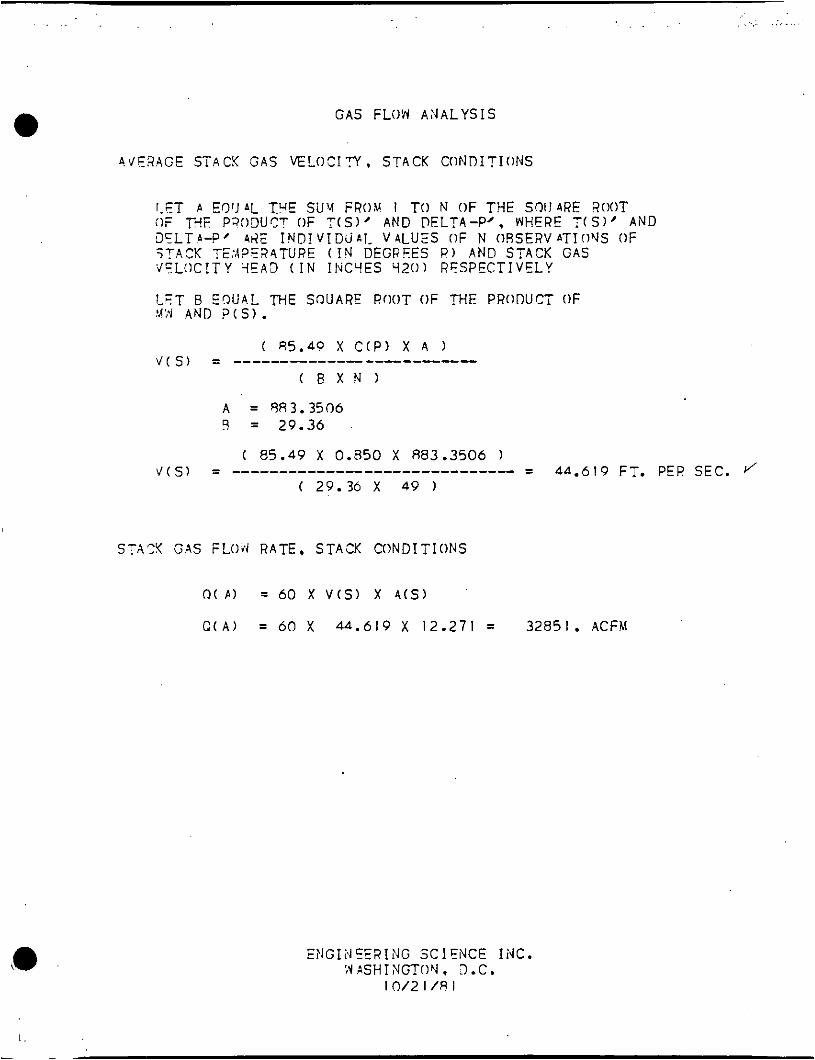
GAS FLOW ANALYSIS
At1/E2.AGE STACK GAS VELOCITY, STACK CONDITI(1NS
[ -ET A EOlJ AL T!-E SU'4 F R O V 1 TO N OF THE S0IJ 4RE ROOT OF MF P3ODUCF OF T ( S ) ' AND DELTA-P', WHERE T ( S ) ' AND CELTA-P' P G I N D D ! V I D U d l ~ VkLUES OF N OFISERVATIOYS OF < ? A 3 TE,'A?E24TURE ( I N DEGREES P) AND STACK GAS YCLOCITY YEA3 ( I N I!JCYES ' I Z O ) R F S P E C T I V E L Y
!-ET @ EQUAL THE SOUARE ROOT OF ?HE PRODUCT OF !h>q AND ? ( S ) .
( % CO2)adj is the adjusted outlet CO2 percentage,
( % CO2)a is the percentage of CO2, measured before the scrubber, dry basis.
( % EA)i is the percentage of excess air at the inlet, and
( % EAIo is the percentage of excess air at the outlet
CONCENTRATION PER DSCF CORRECTED TO 12% CO2
( 1 2 % ) . = (0.0049 grldscf) (4.73%)
= 0.012 gr/dscf
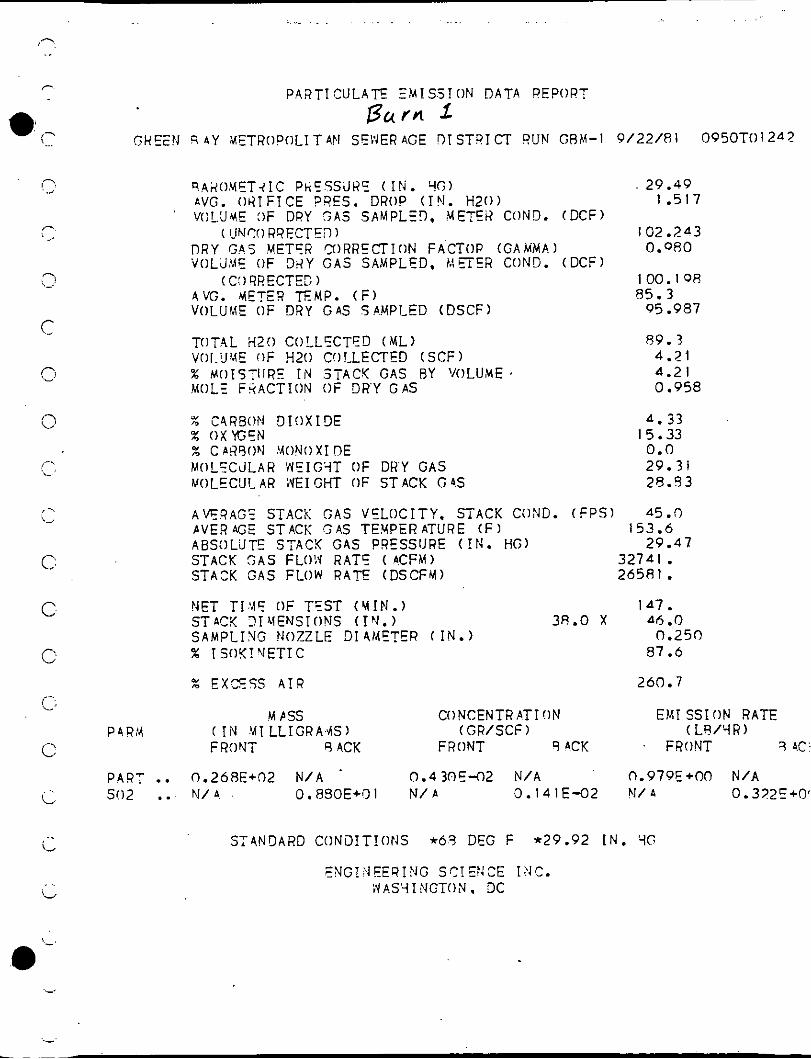
P A R T I C U L A E EMISSION DATA ?EPOPT B u r n 1
GREEN 9 A Y METROPOL1 T 4Fl SENER AGE 91 STDI CT R U N GRM-I 9/22/81 0950TOl242
RAitOr(FT4IC PkCSSdRE ( I N . %) . 29.49 b V G . O Q I F I C E ?SES. DROP (IFI. H20) 1.517 VOLLJHC :IF DRY 5AS SAMPLED. METER COND. ( D C F )
( ? I N S 0 R?ECTE? 1 102.243 D R Y G A . ~ METCR ~ ) R R E C T I O N F A C T O R ( G A M M A ) 0.080
4VG. HETER E M P . ( F ) R5.3
VOLJVE OF 3 i l Y GAS SAMPLED. t d F i E R COND. ( D C F ) (C:) RRECTE3 ) 100. I 08
VOLUME OF DRY GAS SA.YPLED (DSCF) 05.987
~~ .. ~ ~
% MOISTIIRK IN STACY GAS BY VOLUME '
htOLE F3ACTION OF DRY G A S
X C4R3ON D I O X I D E 4: O X K E N X C bR9ON !4ONO XI DE M(lL5CclLAR WEIGYT OF DRY GAS MOLECLII-A4 ;EIGHT OF STACK G 4s
89.3 4 . 2 i 4.2 I 0.958
4 . 33 15.33 0.0 29.31 28.53
A E R A G Z STACK GAS VSLOCITY. STACK COND. (FPS) 45.0 AVERAGE STPCK GAS TEMPERATURE ( F ) 153.6 ABSOLUT5 STACK GAS PRESSIJRE ( I N . H G ) 29.47 STACK SA5 FLO'A RAT5 ( A.CFM) 32741. STACK GAS FLOW RATE (DSCFM) 265831.
NET TI!*lS OF TEST ( H I N . ) I A7. STACK 3IVENSIOWS ( IN . ) 38.0 X 44 .,O SAMPLING NOZZLE D I 4METER ( I N . ) 0.250 % I SOK<!YETIC 87.6
% EXCESS AIR 260.7
M PSS CONCENTRPTI !IN EM1 SSI O N RATE P A. 4 :4 ( I N !dl LLIGRA.dS) (GR/SCF) (LR/qR)
PAR': .. 0.268€+02 N / A . 0.430E-02 N / A 0.979E+00 N/A 502 .. N / 4 0.890E+33 I N/ b 0.141E-02 N / A 0.3?2E+O
FRONT 9 4CK FRONT '3 bCK ' FRONT 3 sc
ST4NDARD CONDITIOHS *63 DEG F *29.92 I N . YC
ENGI ' 4 E E 4 I YG S TI Ell CE I >J C. ;VP.SYINGTON. 3 C
. .
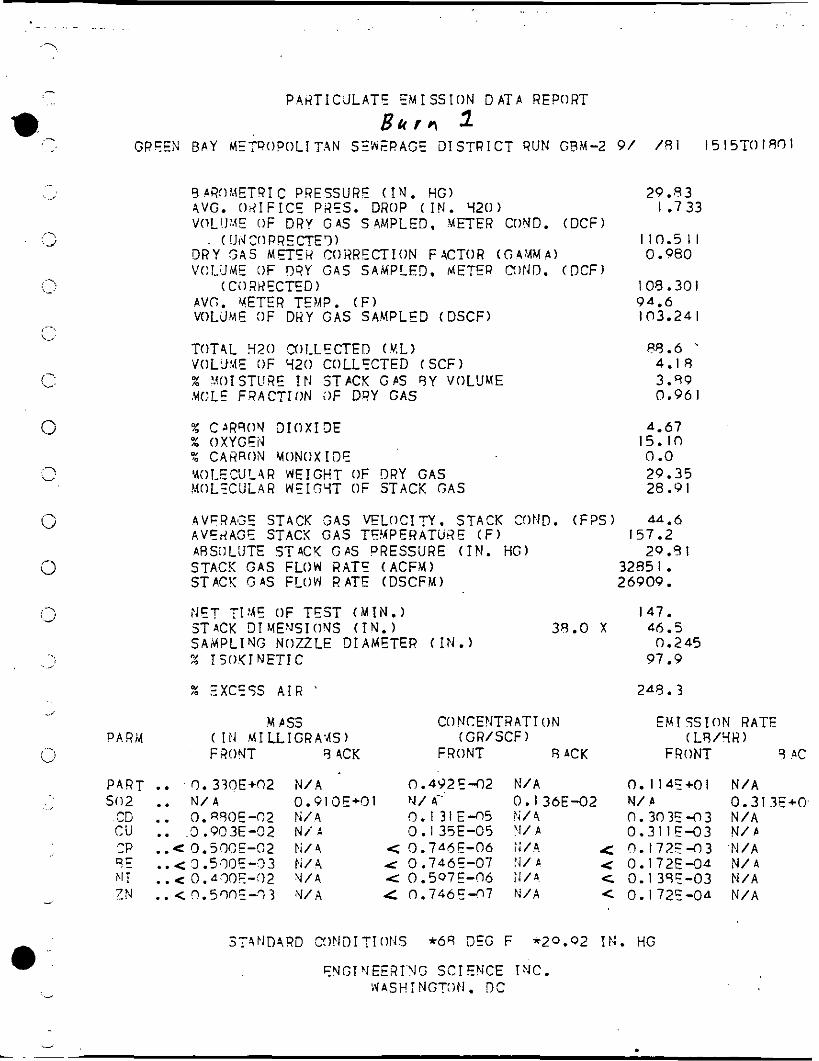
P 4 R T I C a L A T F E M I S S I O N DATA REPORT B l i f l \ 1
GPCEN BAY METDOPOLITAN S f k F R A G E D I S T R I C T R U N GRM-2 91 / e l
9 AR!)!*\ET!?I C PRESSURC ( I N . HG)
VOLi.JXE OF DRY GAS S 4 M P L E D . METER COVD. ( D C F ) 4VG. O d I F I C E PWES. DROP ( I N . 9 2 0 )
. ( ! J d C O P R 5 C T E 7 ) D R Y SA5 M E f F H CORRECTION FACTOR ( G 4 V M A ) VOLdME OF O?Y GAS SAMPLED. dETEW COND. ( D C F )
(C i lRRECTED) __ ._~
AVC;. METER TEMP. ( F ) VOLilME :IF DRY G A S SAMPLCD ( D S C F )
% '.WISTL!RE IN STACK GAS 9Y VOLLIME .W(:LC F 9 A C T I O N OF DRY G A S
% CARSOY 3 I O X I D E % 0XYGFi.I '% CARROX MONOXIDE U O I E C U L 4 R WEIGHT OF DRY GAS MOL5CUL4R W E I W T OF STACK GAS
4VFRAc3;C ST4CK 3AS K L O C I T Y . STACK COIJD. ( F P S ) AVEdAGE STACK G A S TFNPERATURE ( F ) ARS:)L:JTE S T 4 C Y GAS DRESSURE ( IN . HG) 29.3 I STACK GAS FLOW RAT5 ( A C F M ) 3285 I . STACK GAS FLOW RATE ( D S C F M ) 26909.
29.53 I .733
110.5 I I 0.980
I OB .30 I 9 A . 6 103.24 I
88.6 ' 4.1 8 3.99 0.96 I
A . 6 7
0 .O 29.35 28 . V I
A A . 6
15. in
157.2
5 l5TO I 80 I
?IC? TItAE OF T E S T ( M I N . ) 147. 3T ACK DT W E X I OYS ( IN. ) 38.0 X 46.5 SAtHPLIrJG NOZZLE DIAMETER ( I N . ) 0.245 % I S O < I N E T I C 97.9
% Z X C f S S P . IR ~ 2AB. 3
M PSS CONCENTRAT1 O N EM I SS I O N RATE PARM ( I P J MILLIGRA'4S) ( G R I S C F ) ( L R / 9 R )
FWNT 9 4CK F?ONT R ACK FRONT 7 AC
N / A 0.492E-02 N / A 0. I145+01
Pi/ 4 0 . I 31 E 4 5 Pi/\ n.303E-o3 N i d 0 . I 35E-05 ? I / I\ 0.3 I I E-03 Pi/ 4 < 0 . 7 A 6 E - 0 6 i i /4. < n . 1 7 2 5 4 3 Pi/ 4 .= 0.7465-07 : J / P 0.172E-04
0.910E+0I '4/4- 0. I 3 6 E - 0 2 N / A
Y / 4 4 0.507E-06 TI/$ < 0.1356-03 N/ A 4 0.146E-07 N / A .Z 0 . 1 7 2 C - O A
N / A 0.3 1 N / A PI/ P
. N / A N / A N / A N / A
. . . . ~..
PA2TICUL4TE EM I SS!ON DATA REPORT
1
9 A R O V E T ~ I C PRESSURE ( I N - . VG) 29.49 AVG. OG'IFICE ?RES. DROP (1!4. H20) I .6D4 VOLJME OF DRY GAS SAMPLED. UETER COND. (DCF)
105.670 DRY GAS M5TE9 CORRFCTION FACTOR (G4W 6 ) 0.980 VOLUVF OF DRY GAS 54MPLED. METER COND. ( D C F )
AVG. XETE2 TEMP. ( F ) 91 .R
( Lli4 30 RQ ECTE 3 )
(CW?RECTED) 103.557
VOLUME OF DRY GAS SAMPLED (DSCF) 95.050
TOT4L 420 COSLFCTE'I (ML)
X W)IST1lRE IY STPCY GAS BY VOLU'JE MOL? F2ACnON OF DQY GAS
"L Cbi?SOY QIOXIDE % OXYGFEI % CAWON M O N O X I D E Y O L E C X AR NE1 GdT OF I;RY GAS MOLECULAR WEISYT (IF STACK GAS
VOLUIS OF 420 COLLECTED (SCF) 82.7
3.90 3.83 0.962
A .43 14.73 0 .o 29.33 28.90
AVERAGE ST4CX GAS VELOCITY. STACK COND. (FPS) 42.3 AVF2AGC STACK SAS TEMPCRATURE ( F ) 156.9 PRS0Ll.JTE STACK GAS PRESSURE ( I N . HG) . 29.47 STA2K GAS FLOW RATE (ACFM) 31521. ST4CK G A S FLOW RPTE (DSCFM) 2 5554.
:IET TIME OF TEST ( M I N . ) 147. STAC:< !IIMENSIONS ( I N . ) 38.0 X 46.5 S A W L 1 VG VOZZLE DI 4METER ( I N . ) 0.245 % I SOX I NET1 C 97.9
X EXCESS AIR 22A.6
MASS CONCENTR AT I O N EM! SSI O N 2 ATE P 4 R M ( I V '.!I L L I G R A G ) (GRISCF) ( L B / H R )
F~RONT 3ACK FRONT SACK FHONT 9AC'
DnPT .. 0.233E+02 W A 0.366E-02 EI/A 0.8015+00 N / A SO2 .. %/ .A n.83oc+ni N / A Q . I ~ E + Y N / A 0.285E*C
. .
PARTICULATE EM I SSION D ATb REPORT Brcfn 2
GRFEEJ B A Y c(ET90POl-I T4PI SENFRAGE DISTRICT 9UN GEM-4 9/23/RI I OOOTOl235
. - AVG. LETER TEMP. ( F ) '/OLJMC OF D e Y GAS SA)APLED (DSCF)
7: VOISTIJRE IN STACK G4S S Y V(:LUI.(E MC1-E F74CTION OF D R Y GAS
% CAWON rJIOXI3E :: OXYGEN 4: CAXQGN M O N O X I I J E MOLE?!JSAR WEIGHT OF n R Y GAS N(OL5CULAR WEIGYT OF STACK GAS
93.2 98.975
00.5 4.27 4.14 0.959
4.73 15.27 0 .o 29.37 28.90
A V E ~ A E STACK GAS VELOCITY. STACK COND. ( F P S ) 42.0 A V F R A G Z STACK GAS TEMPERATURE ( F ) 151 .7 PESOLUTE STACK G P S PRESSJRE ( I N . H G ) 20 .0 3 STA2K G4S FLOW RAT5 (ACFM) 30912. STACK G AS FLOW R ATE (DSCFM) 25588.
3ET TIME OF TEST (MIN.) STACX DIMENSIONS ( I N . ) S AMPLI YG VOZZLE DI 4LfETER ( I N . ) ?: ISOXINETIC
147. 38.0 X 46.5
0.245 98.7
% EXCE<S AIR 261 .o
MASS CONCENTHAT I ON EM I SS I O N R ATE PAR?.( ' ( 1 N MI LL I GRAMS 1 ( GR/ S CF ) ( L B / H R )
F%NT SACK FRONT SACK FWNT 9 A.C
PART .. 0.1225+02 N / A . 0. I QOE-02 N / A 0 . 4 1 6 E + O O N / A SO2 .. " I A 0.134E+n2 N / A 0 . l93E-02 N / A 0.423F+C
ST4bIDARD C)EfDITIOf.IS *5P DEG F *29.92 I N . HG
ENGI)IEERIYG SCIENCE 1°C. WASHINGTON, D C
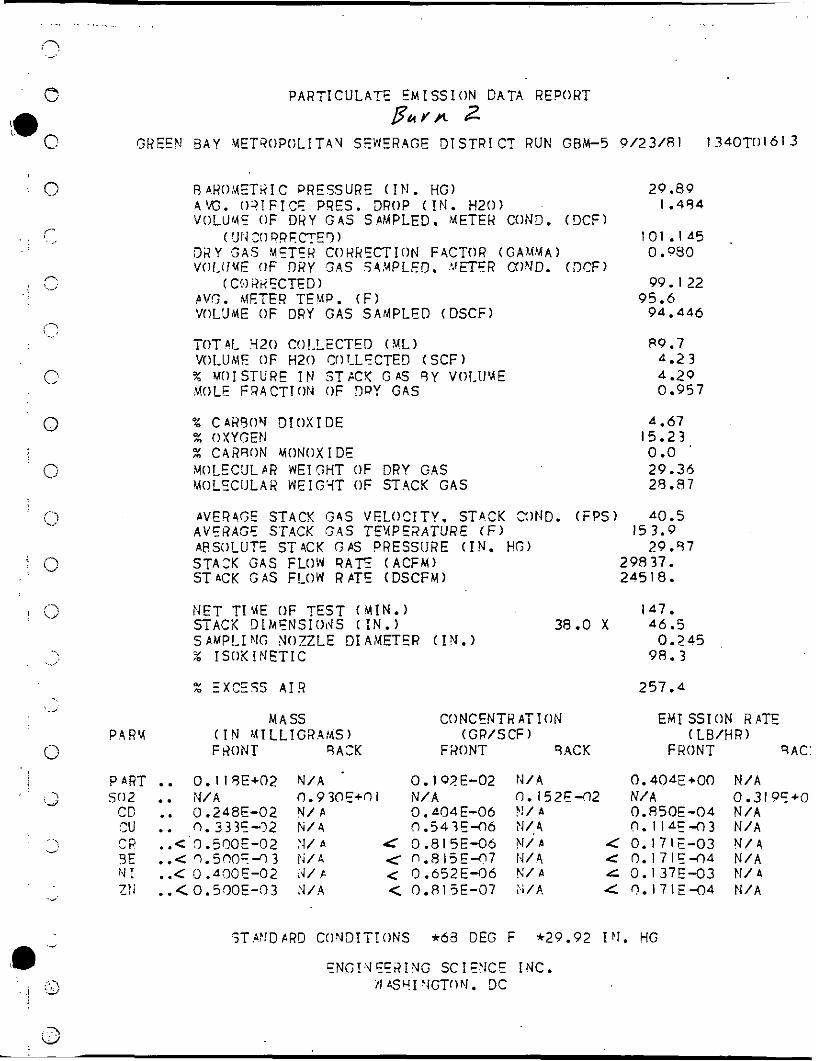
PARTICULATE EMISSION DATA RE?ORT F & Y f i 2
GREEN 3 A Y MET?OPOLITAU SEWFRAGE DISTRICT R U N GBM-5 9/23/81 134OTO16~ 3
RARO:~ET?IC PRESSURE ( I N . H G ) 29 .89 4'G. O?!FICE PQES. DROP ( I N . H20) I .A54 VOLUMC OF D R Y G4S SAMPLED. METER COND. (DCF)
101 . I 45 3 2 Y (;AS MCTER COHRFCTION FACTOR ( G A M M A ) 0.930 VOI.Ift(E OF D R Y 5 4 5 $4VPLED. 'JETER COVD. (DCF)
PVT;. K T E Q TEMP. ( F ) 95.6
( UN 30 QRFICTE9)
( C!.) RriclCTED) 99. I22
VOLUME OF D R Y GAS SAMPLED (DSCF) 94 .a46
TOTAL 420 CO!.LECTED ( U L ) '/OLUME OF H20 C0I-LcCTED (SCF)
X MOISTURE IN STCCY GAS 9Y V O L I J U E WOLF FRACTION OF DRY GAS
'% CAH90N DIOXIDE % OXYGEN X C A R R O N M O N O X I D E MOLEC'JLAR WEIGHT OF DRY GAS MOLCCIJLAH WEIG'iT OF STACK GAS
AVER4T;F STACK G4S VELOCITY. STA.CK 3 ) N D . (FPS) AVERAGE STACK G 4 S TMPE2ATURE (F) I ARSOLUTE STACK GAS PRESSIJRE ( I N . HC;) ~~ ~
STA2K GAS FLOW R A E (ACFM) 29837. STACK GAS FLOW RPTE (DSCFM) 24518.
P9.7 4.23 4.2Q 0.957
4.67 5.23 0.0 '
29.36 25.87
40.5 3.9 39.ri7
NET TI'AE OF TEST ( M I N . ) 147. STACK DIMENSIOdS ( I N . ) 38.0 X 46.5 SAMPLING XOZZLE DIAMETER ( I N . ) 0.245 Z ISOKINETIC
% EXCESS AIR
MASS
98.3
257.4
CONCENTRATION EM1 SSION RATE (GR/S CF 1 ( L B / H R )
FXONT SACK FRONT 9 A C '
PART . . 0. I 1 SE+02 N / A 0. 02E-02 tJ/9 0 . 4 0 A E + 0 0 N / A SO2 .. N / A 0 . 9 m ~ + n i N / 0.152E-02 N/A 0.3 I 9C+O
CC .. 0.248E-02 V / P 0. OAE-06 ? ! / A 0.850E-04 N / A CU .. 0.333cl-32 i i / 4 0 . 5 4 3 E 4 6 N/,4 O . I l d E - 0 3 N / A CR ..<'El .500E-02 :1/ A 4 0.815E-06 ? / / A 4 0.171:-03 N / 4 9E . . < q . 5 n o F 4 3 P i / A -= n . 8 1 5 E 4 7 i~1/4 < 0.171cl-04 N / A N I . .C 0.490E-02 Id/ F c 0.652E-06 h ' / A L 3. I37E-03 El / A
Z l i . . < 0.5r)OE-g3 :I/A < 0.815E-07 X / A . 4 n . I 7 1 E 4 4 N / A
iTPI.!DPRD CoN3IT?ONS *63 DEG F *29.92 Ib l . HG
fNGI;qclEAI?JG SCIENCE INC.
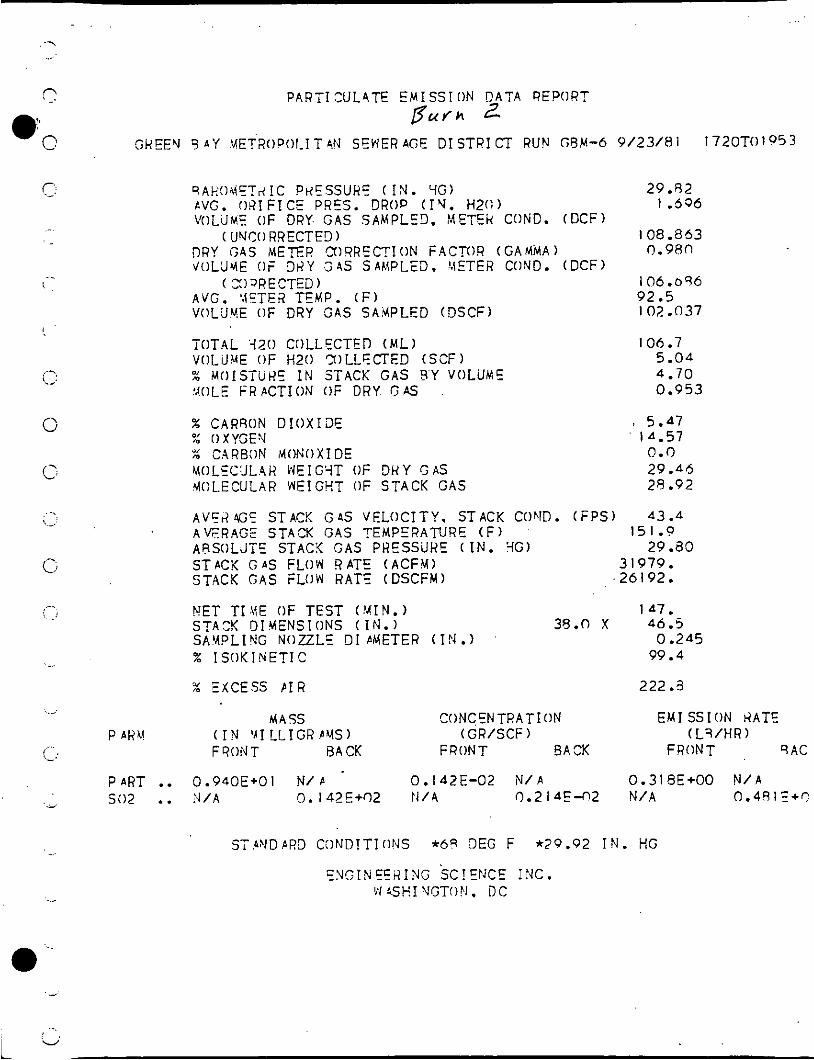
PARTI 3UL4TE EM1 SSI ON DATA REPORT F U t J b ? 2
Gk'EEY 9 A Y YETROPOI-I T AN SEWER AGE D I STRI CT R U N GBM-6 9/23/8 I l720TO 195 3
9AkOh4ETdIC PHESSUHE ( 1 % . VG) 29.82 CVG. 04IFICE PRES. DROP (1'4. H20) I .606 VOLiJMS OF DRY. GAS SAMPLET). METEk COND. ( D C F )
( UNCO RRECTED) I oa .a63 D R Y GAS METER CoWECTION FACTOR ( G A M M A ) 0 . 9 ~ 1 JOLLJME OF Di4Y ,245 SAMPLE;). UETER COND. ( D C F )
( C:)WECTED) 106.056 A V G . 'JCTE2 TEMP. ( F ) 92.5 V0L;IME OF D R Y GAS SAMPLED (DSCF) 102.037
TOTAL 320 COLLECTED (ML) V O 1 iJUE OF H30 TILLFCTED (SCF) _. - - . __ % MOISibi4C I N STACK GAS Q Y V O L U M E 'AOLE FRACTION OF D R Y G AS
9: C A R R O N D I O X I 3 E % OXYGEY Z CARBON h ( 0 N O X I D E MOLCC:JL4R WEIGqT OF D H Y GAS WLECULAR WEIGHT OF STACK GAS
106.7 5.04 4.70 0.953
I 5.41 1 A . 5 7 0.0 29.44 29.92
AVSrlGC STACK G4S VELOCITY. STACK COVD. (FPS) 43.4 AKR.4G5 STA.CK GAS TEMPERATUQE ( F ) 151.0 ARSOLJTE STACK GAS PRESSllHE ( I N . qG) 29 .ao STACK G A S FLOW RATE (ACFU) STACK GAS FLOW HAT: (DSCFM)
31979. . 2 6 192.
NET TI LfE OF TEST (!4I!J. ) 1 A7.
SANPLIVG NOZZLE D I PMETER (IP4.) 0 -245 STACK DIMENSIONS ( IN . ) 35.0 x 46.5
% ISOKINETIC 99.4
% EXCESS F I R 222.3
MASS CONCCN TRATION EM I SS I O N i4ATE P 4HU ( IN 'AI L L I G R P M S ) ( GRISCF) ( L7/HR )
F Q0i.I T BACK FRONT BACK FRONT SAC
PART .. 0.940E+OI N / P 0 . I42E-02 N / A 0.319E+00 N / A 502 .. :I/A 0 . I42E+O2 P i / A 0 . 2 1 4 E 4 2 N / A 0.49 I :+e
5TNDPR9 CONDITIWS *65 DEG F *29.92 I N . HG
ENGI N C E R I NS SC! "CE I NC. W 4SHI VGTO!4. i)C
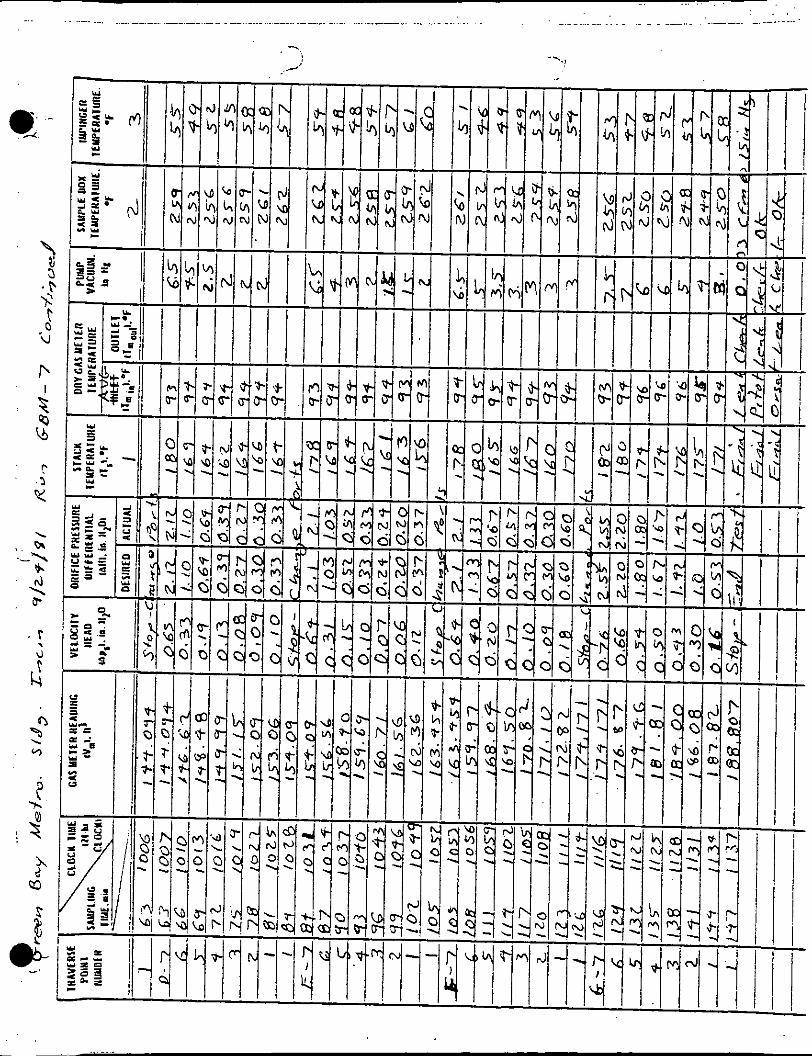
P ART1 CUL4TE EM1 SSI ON DATA REPORT B e r * t 3
G d E C N SAY METROPOLITAN SENE2 AGE DTSTRI CT 9UN GBM-7 9/24/91 0900TOl 137
BAQOMET?IC PEfSSURE ( I N . Y G ) 29.8 I P V G . OrlIFICE ?RES. DWP (1". H20) I . I67 V0LU:VE OF DRY 3.4s SAMPLED, METER COND. (DCF)
( iJNC0 IiRECTE3 1 87.140 DRY SAS ,MEEn C0RRECTIOI.i FACTOR ( G A ; 4 M A ) 0.980 VOLUM: OF D Q Y SA5 SAHPLCD. METE2 CO!lD. ( D C F )
( CoWECTEQ) R5.406 AVG. :h(CTER TEM?. ( F ) 92.6 VOLUfAE OF D R Y GAS SAMPLED (DSCF) 81.534
TOT4L 920 COLLECTED (ML) VOLLIME OF F20 COLLECTED (SCF) % MOISTIJRE I?l 3T4CK GAS BY VOLUME MOLE Fi?ACT:I(ltJ OF D R Y G A S
% CARBON D l ( l X I 3 E 4;: OXYGFN % C ARRON V O N O X I 3 E MOLECULAR N E I G Y T OF W Y GAS VOLECLJI. AR WE1 GHT OF STACK GAS
60.8 2.57 3.4r) 0.966
5 . 1 7 15.23 0.0 29.44 29.05
A V E D A S C STACK GAS VCLOCITY. STACK COgD. ( F P S ) 35.1 AVERAGE STACK $AS TEMPERATURE ( F ) 173.2 ABSOLUTE STACK GAS PRESSURE ( I N . H G ) 29.79 STACK G A S FLOW R PTE ( ACFM) 25860. STAZK GAS FLOW RATE (DSCFM) 20740.
MASS C O N CEN TR A TI ON EM1 SSION ?!ATE (GR/SCF ) ( L R / H R ) P.4R:M ( I N MILLIGHAAS)
FRONT BACK FRONT BACK FRONT SAC
PART .. 0.650E+OI N/A . 0'. I23E-02 P I / A 0.218E+00 N/A 502 .. N / A O.O50E+OI N / A 0. I7OE-02 N / A 0.3 I oE+r
S'TANDPRD C:lMI)ITIONS *63 DEG F *29.92 1'4. HG
ENS I S 5C.9 I NG sc I E K E I NC . :'4 GHI YGTOM. C C
P ART1 CUL4TE E!JI SSION DATA REPORT 4 h Y Y 3
,S.V5SN 9AY .?4fTHOPOLIT4N SENEH 4GE DTSTRICT RUN GRM-R 9/24/81 I250T01523
A VG. .!I ET VOLIJ'4E : I I
E R T E M P . ( F ) F DRY G4S SAMPLED (DSCF)
MOLECJLAR WCISYT OF DRY GAS :WLECULPR irlEIGHT OF ST4CK G 4 S
4VERAGF STACK GAS VELOCITY. STACK COND. (FPS) P V E R 4 G E STACK GAS TEMPERpTJRE ( F ) ABSOLUTE STACK GAS PRESSURE ( I N . HG) STACK GAS FLOW RATE ( ACFM) STACK GAS FLOW RATE (DSCFM)
29.'77 1 . I 70
88.240 0.090
P6.475
R I .?I8
70.0
96.9
3.30 3.88 0.961
5.37 1 4 .97 0.0 29.46 29 .O I
35.5
29.75 173.3
261 69. 2085 3.
NET TI !A€ OF TEST ( '41 N. 1 147. STAZK DIMENSIONS ( I N . ) 39.0 x 46.5 S.4'4PLING NOZZLE D I METER (I i J .1 0 -245 'X ISOKIFIETIC 100.1
% EXCESS P I 2 247 .o
H4SS CONCENTRA?lOfi EM1 SSION RAT5 ~ 4 a ~ ( I N MILLIGrlAUS) (GR/SCF ) ( L R / H R )
FRONT BA ?K FPONT BACK FRONT 94c
PART so2 CD TU
.. 0 . 3 W C + O I N / A 0.158E-02 ?I/ A 0 .283€+00 . . ' r1/~4 0.15F?'E+02 E I / A O.207E-02 N / A .. q.730E-C3 N / A 0. I 37E-06 N / A 0.246E -04 . .< .0.200E-02 N / 4 < 0.376E-06 N / 4 C 0.673E-04 CR ..<0.5WIE-l2 N / A < 0.941 E 4 6 N / A < 0.1695-03 3E . . < 0.500E-03 ?I/ P < 0.941 E-07 V / A < 0.16RE-04
z x . . < 0.50O:-93 !I/ n < 0.941 E-07 ?'/ A C 0.168E-04 % I . .C n.A005-,22 i 1 / 4 C C . 7 5 3 5 4 6 ?1/4 ,= n . i m - 0 3
STAND4R3 CONDITIONS *69 DEG F *29.92 I N . 3C
E N G I ? J E E R l t i G SCIENCE I N C . NAS'!INGTON. DC
N / A 0.53 I :+r ?I/ A ?I / A