Page 1
AAPPCCAA
Maize and Ethanol: Maize and Ethanol: Are Are the Current High Prices the Current High Prices
Sustainable?Sustainable?
Harwood D. SchafferUniversity of Tennessee
Agricultural Policy Analysis Center
FENALCEBogotá, Colombia
June 21, 2007
Page 2
AAPPCCAA
Recent Corn PricesRecent Corn Prices
Page 3
AAPPCCAA
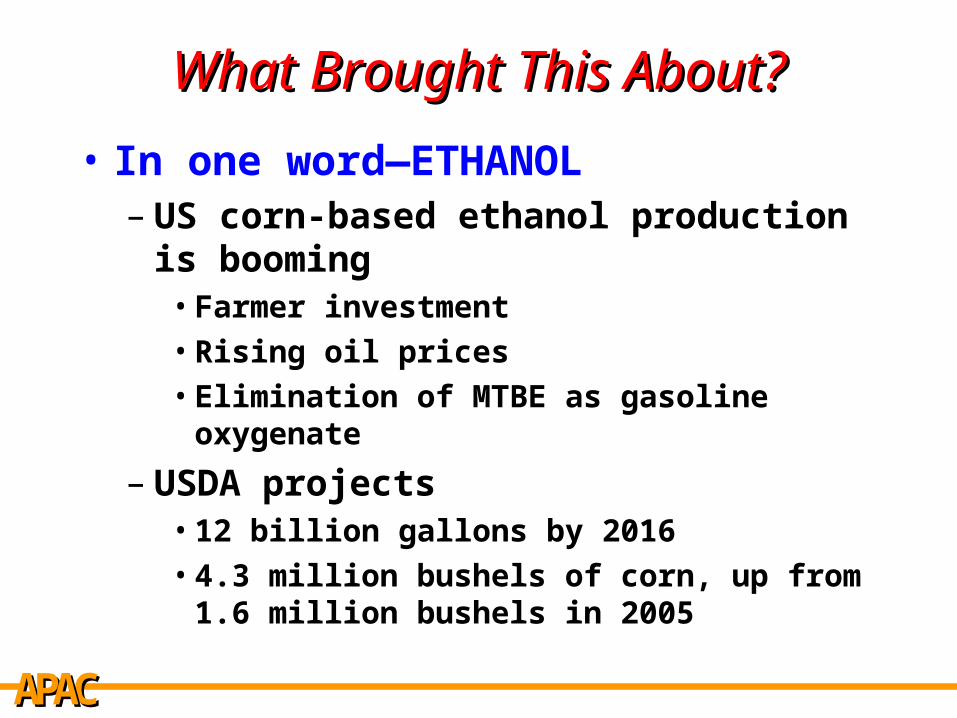
What Brought This About?What Brought This About?
• In one word—ETHANOL– US corn-based ethanol production is
booming• Farmer investment• Rising oil prices• Elimination of MTBE as gasoline oxygenate
– USDA projects• 12 billion gallons by 2016• 4.3 million bushels of corn, up from 1.6
million bushels in 2005
Page 4
AAPPCCAA
Projected Ethanol DemandProjected Ethanol Demand
Source: UDSA 2007-2016 Projections
Page 5
AAPPCCAA
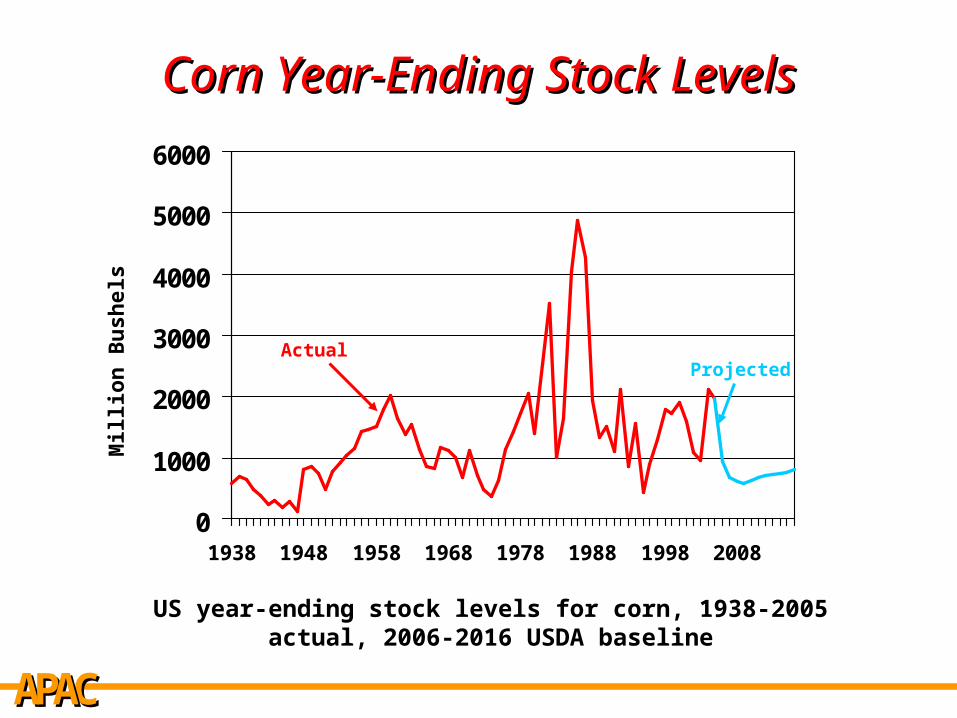
Corn Year-Ending Stock LevelsCorn Year-Ending Stock Levels
0
1000
2000
3000
4000
5000
6000
1938 1948 1958 1968 1978 1988 1998 2008
Mill
ion
Bu
shel
s
US year-ending stock levels for corn, 1938-2005 actual, 2006-2016 USDA baseline
ActualProjected
Page 6
AAPPCCAA
1995 (4.6%)
Uncharted TerritoryUncharted Territory
0%
5%
10%
15%
20%
25%
30%
35%
40%
45%
1938 1947 1958 1968 1978 1988 1998 2008
Year ending commercial stocks-to-use ratio for US corn1938-2005 (actual), 2006-2016 (2007 USDA Baseline)
1947 (4.9%) 1983 (5.4%) 2009 (4.5%)
Page 7
AAPPCCAA
Projected Corn PriceProjected Corn Price
Source: UDSA 2007-2016 Projections
Page 8
AAPPCCAA
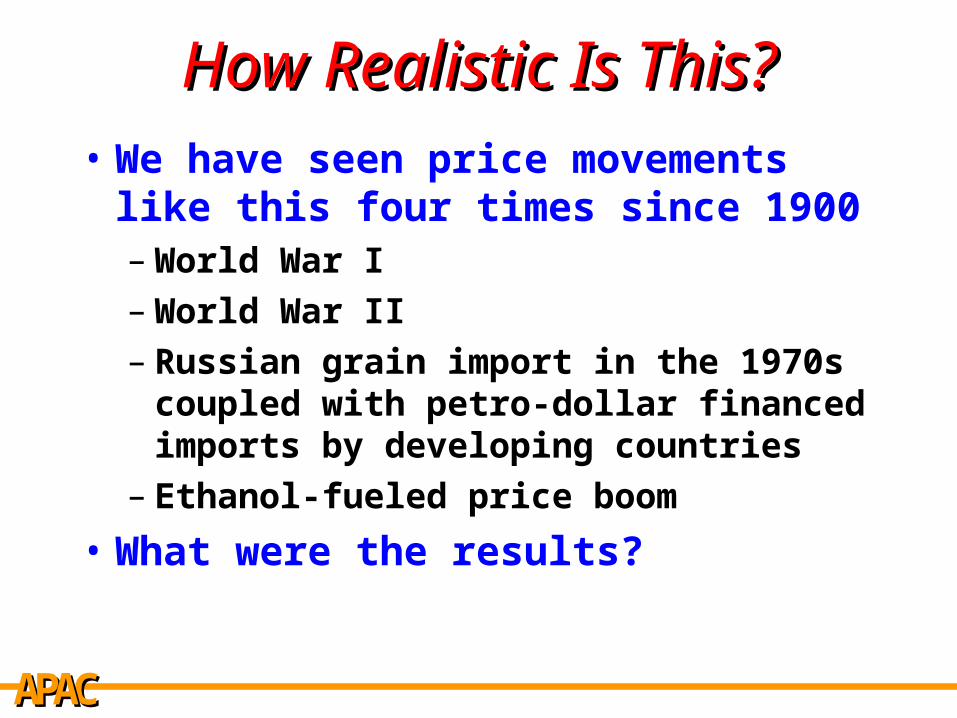
How Realistic Is This?How Realistic Is This?• We have seen price movements like
this four times since 1900– World War I– World War II– Russian grain import in the 1970s
coupled with petro-dollar financed imports by developing countries
– Ethanol-fueled price boom
• What were the results?
Page 9
AAPPCCAA
Characteristics of Ag SectorCharacteristics of Ag Sector
• Agriculture is different from other
economic sectors.
On the demand side:
– With low food prices—
• People don’t eat more meals a day
• They may change mix of foods
• Aggregate intake remains relatively stable
Page 10
AAPPCCAA
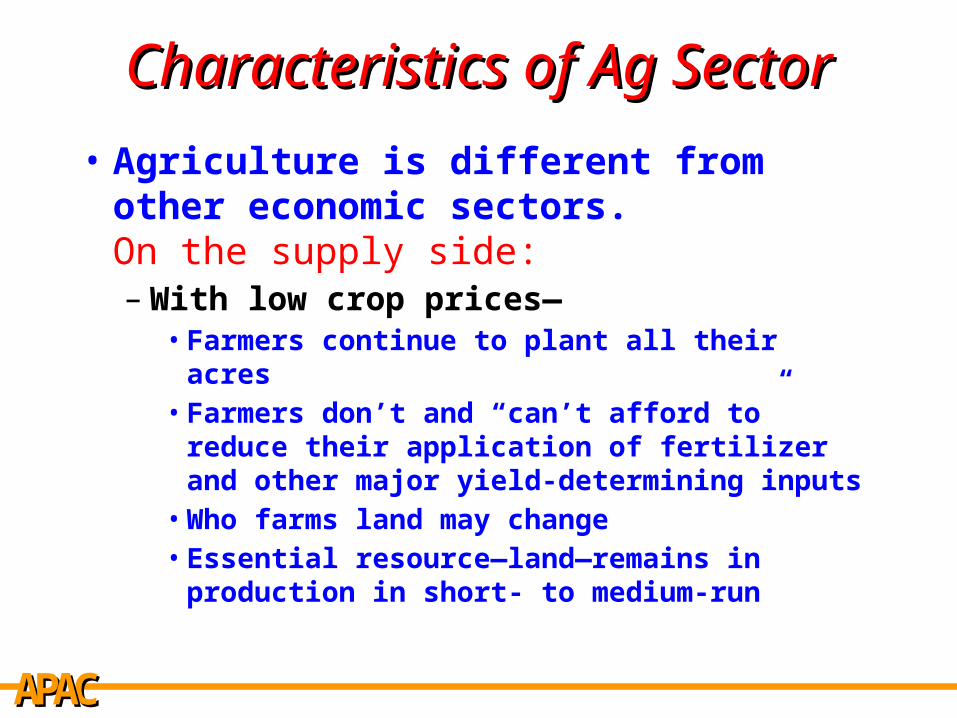
Characteristics of Ag SectorCharacteristics of Ag Sector
• Agriculture is different from other economic sectors.On the supply side:– With low crop prices—
• Farmers continue to plant all their acres• Farmers don’t and “can’t afford to” reduce
their application of fertilizer and other major yield-determining inputs
• Who farms land may change• Essential resource—land—remains in
production in short- to medium-run
Page 11
AAPPCCAA
Why Chronic Problems In Ag? Why Chronic Problems In Ag?
• Technology typically expands output faster than population and exports expand demand– Historically, much of this technology
has been paid for by US taxpayers
• The growth in supply now is being additionally fueled by– increased acreages in Brazil, etc.– technological advance worldwide
Page 12
AAPPCCAA
Change in Non-US Crop AcreageChange in Non-US Crop Acreage
-60
-40
-20
0
20
40
60
1995 1996 1997 1998 1999 2000
Page 13
AAPPCCAA
Why Chronic Problems In Ag?Why Chronic Problems In Ag?
• Lower prices should automatically correct itself—Econ 101 says so– Consumers buy more– Producers produce less– Prices recover—problem solved!
• But in agriculture lower prices do not solve the problem– Little self-correction on the demand side
• People do consume significantly more food
– Little self-correction on the supply side• Farmers do not produce significantly less output
Page 14
AAPPCCAA
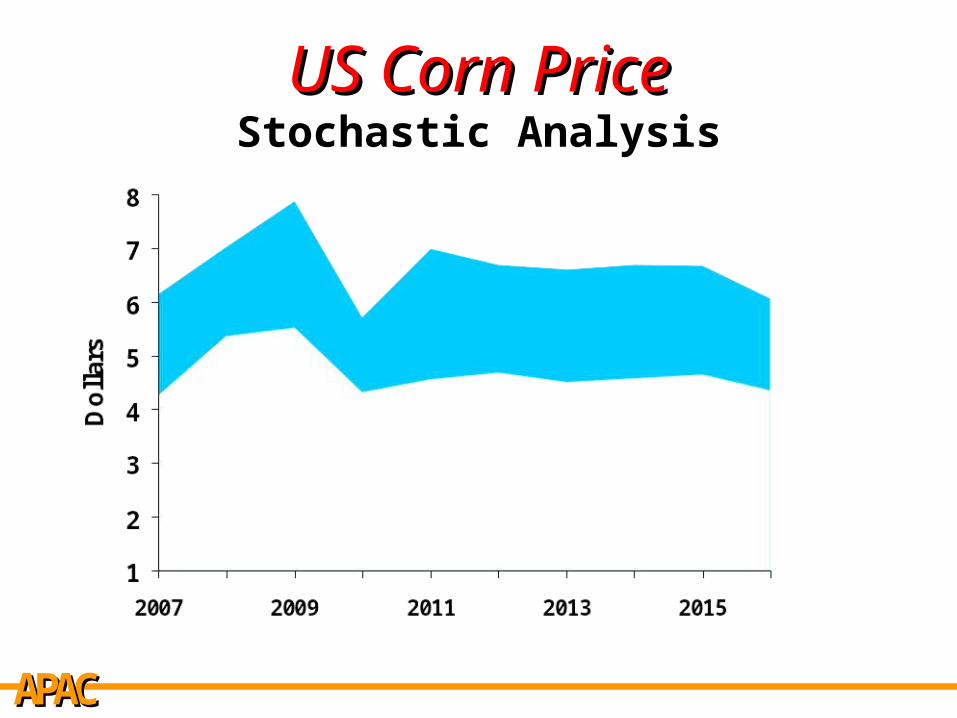
US Corn PriceUS Corn PriceStochastic Analysis
Baseline MeanUSDA Deterministic Baseline
Page 15
AAPPCCAA
US Corn PriceUS Corn PriceStochastic Analysis
Baseline Mean
50%
Page 16
AAPPCCAA
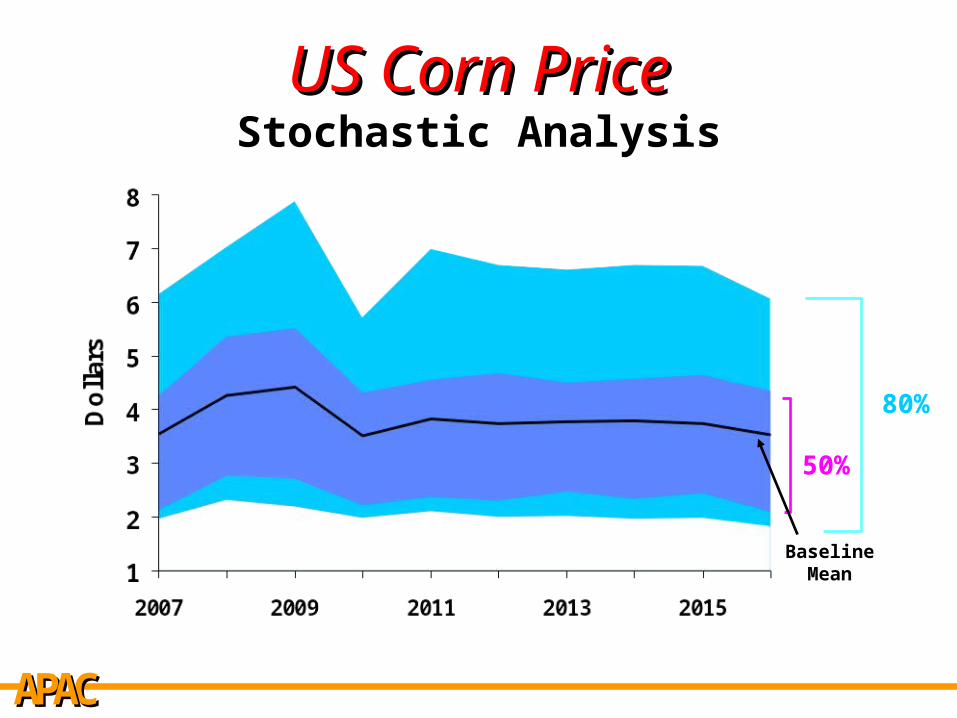
US Corn PriceUS Corn PriceStochastic Analysis
Baseline Mean
50%
80%
Page 17
AAPPCCAA
US Ethanol Corn DemandUS Ethanol Corn Demand Stochastic Analysis
50%80%
Baseline Mean
USDA Deterministic Baseline
Page 18
AAPPCCAA
Causes of High PricesCauses of High Prices• Shortfall in US production
– 50% of last ten years production fell by over 300 million bushels from previous year
• Cushioned by stocks over 1 billion bushels
– In baseline stocks remain below 800 million bushels
• Shortfall in non-US production
Page 19
AAPPCCAA
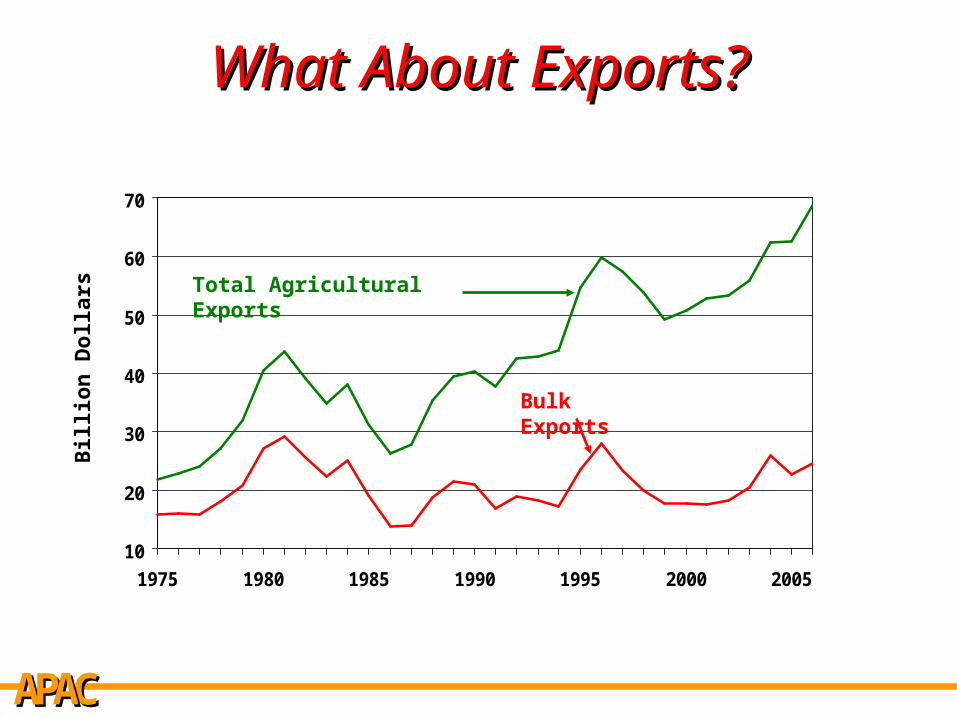
Exports, Exports, ExportsExports, Exports, Exports• For the last quarter century, exports
have been heralded—and continue to be by some—as crop agriculture’s salvation– Exports is the production safety valve that
can rebalance agricultural markets– Exports will grow at accelerating rates
• US policymakers have misunderstood role of US in bulk agricultural export markets
Page 20
AAPPCCAA
What About Exports?What About Exports?
10
20
30
40
50
60
70
1975 1980 1985 1990 1995 2000 2005
Bill
ion
Do
llars
Bulk Exports
Total Agricultural Exports
Page 21
AAPPCCAA
What About ExportsWhat About Exports
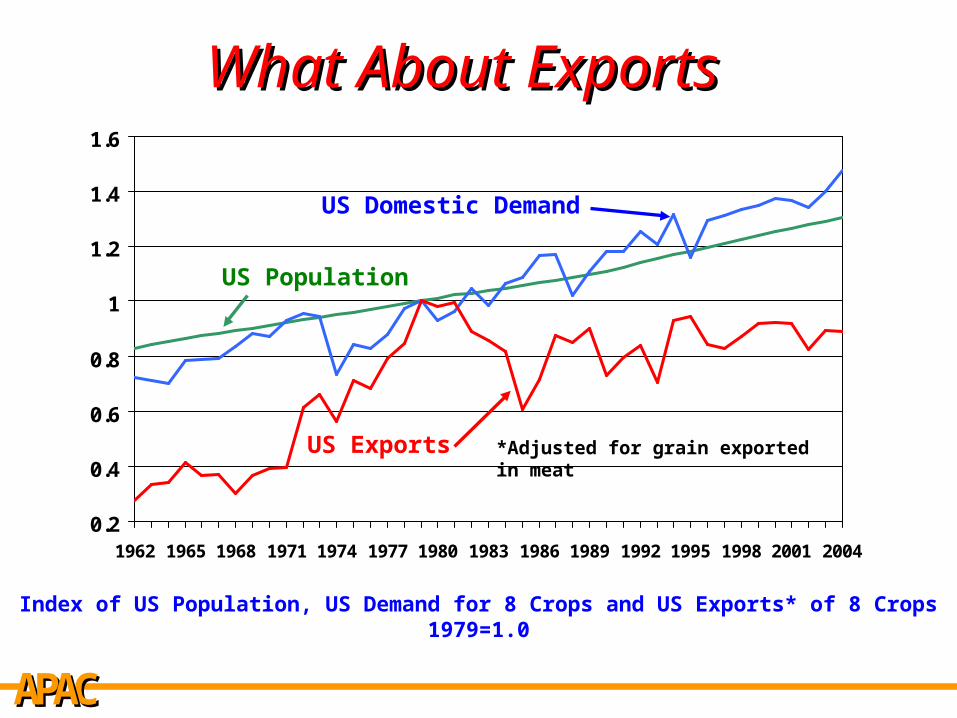
Index of US Population, US Demand for 8 Crops and US Exports* of 8 Crops1979=1.0
0.2
0.4
0.6
0.8
1
1.2
1.4
1.6
1962 1965 1968 1971 1974 1977 1980 1983 1986 1989 1992 1995 1998 2001 2004
US Population
US Exports
US Domestic Demand
*Adjusted for grain exported in meat
Page 22
AAPPCCAA
US Exported AcresUS Exported Acres
Percentage of US acres used to produce crops for export have declined from a high of 43 percent in 1980 and 1980 to 33 percent for 2006
0%
10%
20%
30%
40%
50%
1980 1982 1984 1986 1988 1990 1992 1994 1996 1998 2000 2002 2004 2006
% of US Acres Producing Crops for Export
Page 23
AAPPCCAA
Net Export AcreageNet Export Acreage for 8 Major Crops for 8 Major Crops
0
20
40
60
80
100
120
140
1976 1978 1980 1982 1984 1986 1988 1990 1992 1994 1996 1998 2000 2002
Million
Acres
103.6
76-85 Average86.8
86-95 Average77.0
96-02 Average
Page 24
AAPPCCAA
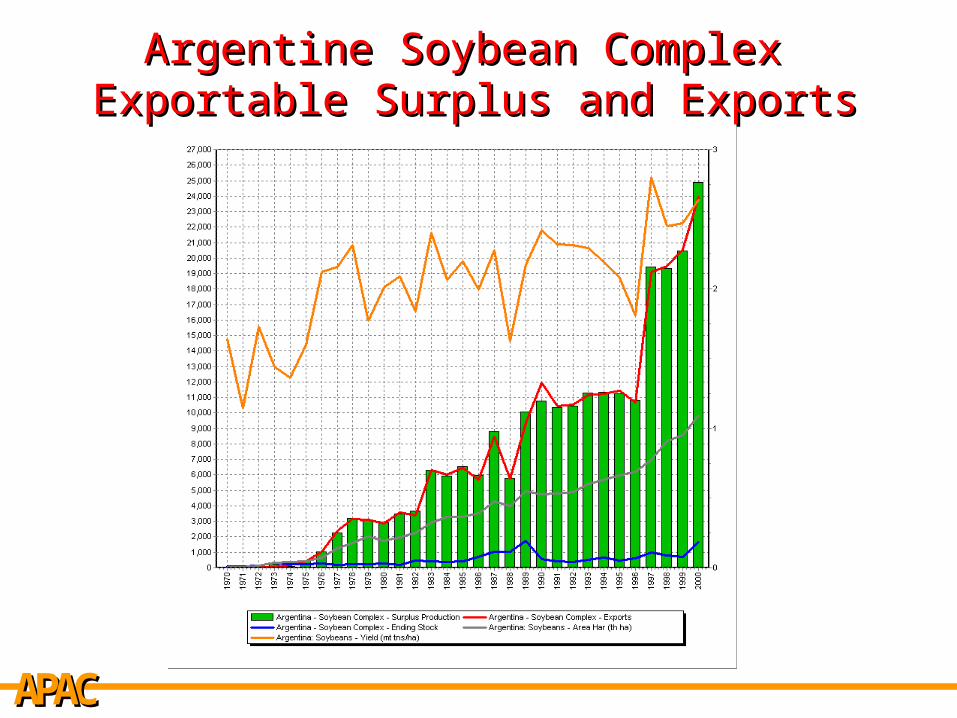
Argentine Soybean Complex Argentine Soybean Complex Exportable Surplus and ExportsExportable Surplus and Exports
Page 25
AAPPCCAA
Brazilian Soybean Complex Brazilian Soybean Complex Exportable Surplus and Exports Exportable Surplus and Exports
Page 26
AAPPCCAA
What About Exports?What About Exports?
0
20,000
40,000
60,000
80,000
100,000
120,000
140,000
160,000
1960 1965 1970 1975 1980 1985 1990 1995 2000 2005
Developing competitors: Argentina, Brazil, China, India, Pakistan, Thailand, Vietnam15 Crops: Wheat, Corn, Rice, Sorghum, Oats, Rye, Barley, Millet, Soybeans, Peanuts, Cottonseed, Rapeseed, Sunflower, Copra, and Palm Kernel
Th
ou
san
d M
etri
c T
on
s
US Exports
Developing Competitors’ Exports
Page 27
AAPPCCAA
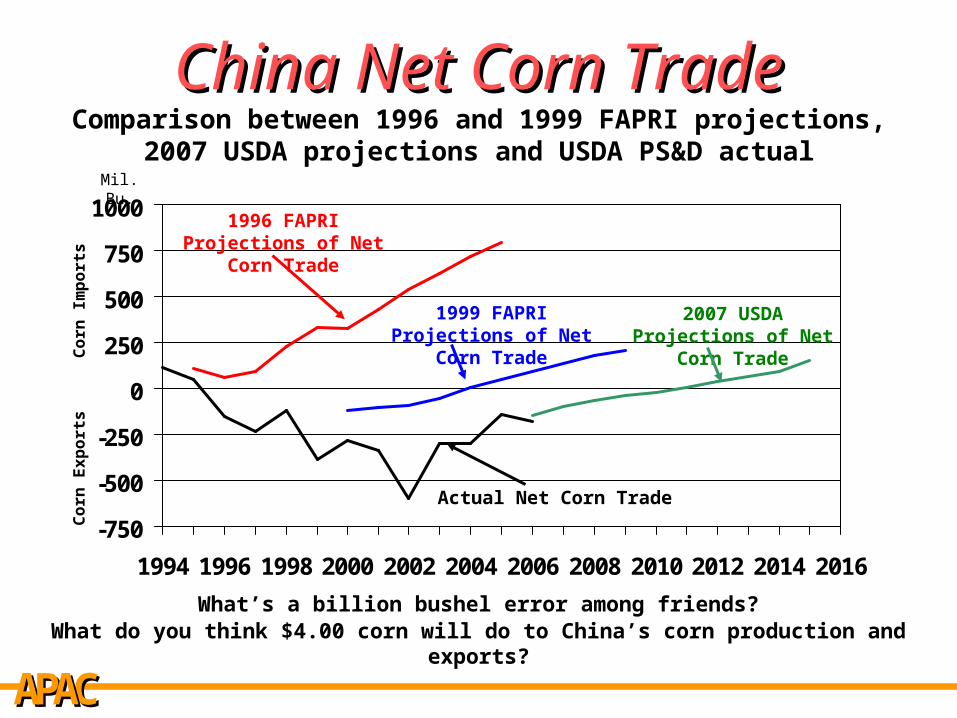
China Net Corn TradeChina Net Corn TradeComparison between 1996 and 1999 FAPRI projections, 2007
USDA projections and USDA PS&D actual
-750
-500
-250
0
250
500
750
1000
1994 1996 1998 2000 2002 2004 2006 2008 2010 2012 2014 2016
1996 FAPRI Projections of Net Corn Trade
Actual Net Corn Trade
1999 FAPRI Projections of Net Corn Trade
Co
rn E
xp
ort
sC
orn
Im
po
rts
Mil. Bu.
What’s a billion bushel error among friends?What do you think $4.00 corn will do to China’s corn production and exports?
2007 USDA Projections of Net Corn Trade
Page 28
AAPPCCAA
What About Exports?What About Exports?
• Why have exports not fulfilled US hopes?– Export demand is braked by issues of food
security/food sovereignty– International crop production is impacted by:
• Increased acreage: Stage of development• Yield advances: World-wide distribution of
technology• US role as the leading nation in the world
– Politically, economically, technologically, and militarily– And in prices too: Others price off US prices
Page 29
AAPPCCAA
US Role in ExportsUS Role in Exports
• US is the oligopoly price leader– 20+ years of US policies to reduce US
prices to “World Price” are futile– US price is the “World Price”– US has been playing limbo with itself
• US is the residual supplier
• US is the world’s “Ever-Normal Granary”
Page 30
AAPPCCAA
Causes of Low PricesCauses of Low Prices• Random high US production
– Prices are very sensitive– Any increase in year-ending stocks
could send prices plummeting
• Predictable increases in non-US production– Acreage in Brazil, India, Colombia– Increases in yields due to technology
adoption
Page 31
AAPPCCAA
Causes of Low PricesCauses of Low Prices• Low crude oil prices
– Puts pressure on ethanol prices– Reduce incentives to bring on new
plants– Existing plants may reduce production
or go off-line for periods of time
Page 32
AAPPCCAA
US Corn PriceUS Corn PriceStochastic Analysis
Page 33
AAPPCCAA
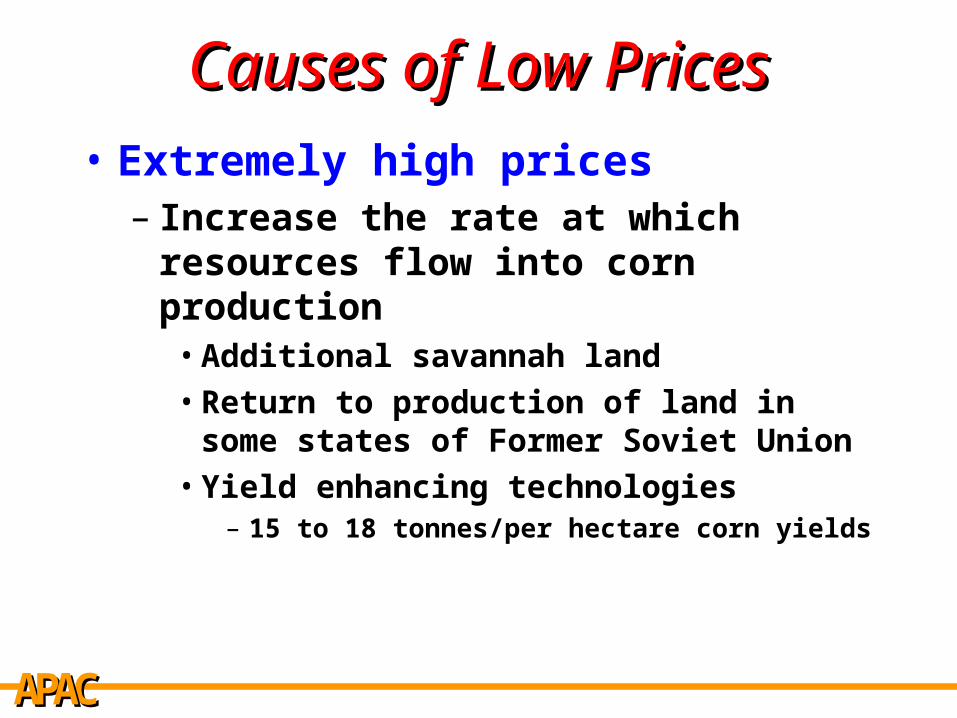
Causes of Low PricesCauses of Low Prices• Extremely high prices
– Increase the rate at which resources flow into corn production
• Additional savannah land• Return to production of land in some states
of Former Soviet Union• Yield enhancing technologies
– 15 to 18 tonnes/per hectare corn yields
Page 34
AAPPCCAA
Causes of Low PricesCauses of Low Prices• Cellulosic ethanol production
– More cost efficient than corn-to-ethanol production
– Conversion of front end of current corn-to-ethanol plants
• Sources of cellulose– Forest waste products– Corn stover– Switchgrass, hybrid poplars and willows – Urban waste
Page 35
AAPPCCAA
Feedstock for EnergyFeedstock for Energy**
0
200
400
600
800
2006 2011 2016
Mil
lio
n T
on
s
Corn Grain Corn Stover Wheat Straw Energy Crop Wood Residue Soybeans
* Does not include forest harvest
Page 36
AAPPCCAA
Worldwide Excess Capacity Will Again Be a Worldwide Excess Capacity Will Again Be a Long-run Problem (Despite Ethanol)Long-run Problem (Despite Ethanol)
• Dramatic yield increases in other countries (and in this country)– Cargill, Monsanto, John Deere, etc., etc., etc.
• Acreage once in production will be brought back in– Russia, Ukraine and others
• New Acreage– Brazil– China
Page 37
AAPPCCAA
What Do You Think?What Do You Think?• Given the history:
– World War I– World War II– Russian grain import in the 1970s
coupled with petro-dollar financed imports by developing countries
• Given the analysis I have presented
• Will the ethanol-fueled price boom be different?
Page 38
AAPPCCAA
Policy for All SeasonsPolicy for All Seasons• Realistic about the way aggregate
agricultural markets work
• Takes into account consumer behavior
• Takes into account producer behavior
• Recognizes limited ability of exports to rebalance aggregate agricultural markets
• Recognizes demand growth seldom outstrips supply growth for long
Page 39
AAPPCCAA
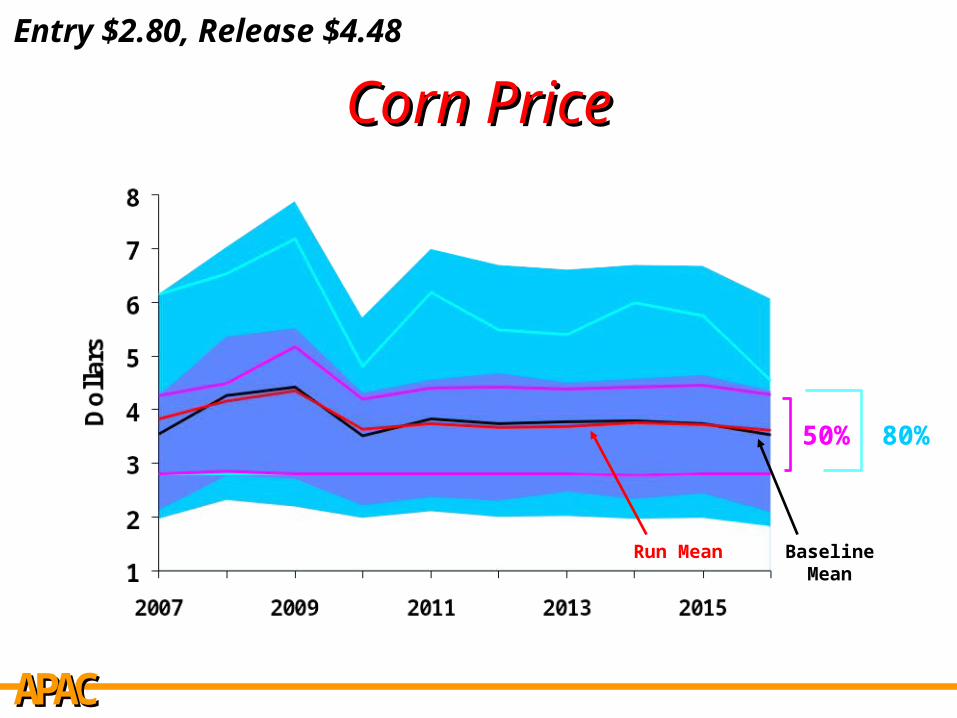
Corn PriceCorn PriceEntry $2.80, Release $4.48
Baseline Mean
50% 80%
Run Mean
Page 40
AAPPCCAA
Agricultural Policy Analysis Center The University of Tennessee 310 Morgan Hall 2621 Morgan Circle Knoxville, TN 37996-4519
www.agpolicy.org
Thank YouThank You
Page 41
AAPPCCAA
To receive an electronic version of our weekly ag policy column send an email to: [email protected] to be added to APAC’s Policy Pennings listserv
Weekly Policy ColumnWeekly Policy Column
Page 42
AAPPCCAA
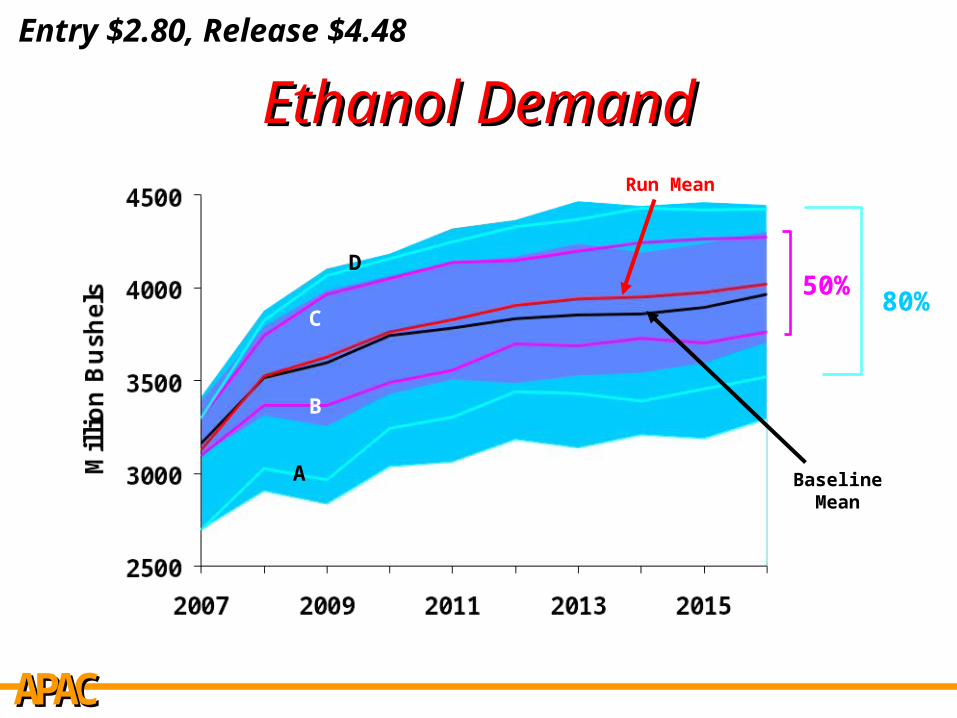
Ethanol DemandEthanol DemandEntry $2.80, Release $4.48
50%80%
Baseline MeanA
B
C
D
Run Mean
Page 43
AAPPCCAA
Uncharted TerritoryUncharted Territory
0%
5%
10%
15%
20%
25%
30%
35%
40%
45%
1960 1965 1970 1975 1980 1985 1990 1995 2000 2005 2010 2015
Year ending commercial stocks-to-use ratio for US corn1960-2005 (actual), 2006-2016 (2007 USDA Baseline)
1974 (7.4%) 1983 (5.4%) 1995 (4.6%) 2009 (4.5%)