38
Moving forward Q4 FY’16 Earnings Conference Call October 27 2016 Create Shareholder Value
| Date post: | 15-Apr-2017 |
| Category: |
Investor Relations |
| Upload: | pranav-rao |
| View: | 255 times |
| Download: | 0 times |

Moving forward
Q4 FY’16Earnings Conference Call
October 27 2016
Create Shareholder Value

Moving forward
2
Forward-looking statements
This presentation contains “forward-looking statements” within the safe harbor provisions of the Private Securities Litigation Reform Act of 1995, including statements about earnings guidance and business outlook. These forward-looking statements are based on management’s reasonable expectations and assumptions as of the date this report is filed. Actual performance and financial results may differ materially from projections and estimates expressed in the forward-looking statements because of many factors not anticipated by management, including, without limitation, global or regional economic conditions (including, as to the United Kingdom and Europe, the impact of the recent “Brexit” referendum) and supply and demand dynamics in market segments into which the Company sells; the inability to eliminate stranded costs previously allocated to the Company’s Electronic Materials division after the Company’s spin-off of the division and other unexpected impacts of the spin-off; significant fluctuations in interest rates and foreign currencies from that currently anticipated; future financial and operating performance of major customers; unanticipated contract terminations or customer cancellations or postponement of projects and sales; asset impairments due to economic conditions or specific events; ability to protect and enforce the Company's intellectual property rights; unexpected changes in raw material supply and markets; the impact of price fluctuations in natural gas and disruptions in markets and the economy due to oil price volatility; the ability to recover increased energy and raw material costs from customers; costs and outcomes of litigation or regulatory investigations; the success of productivity and operational improvement programs; the timing, impact, and other uncertainties of future acquisitions or divestitures; political risks, including the risks of unanticipated government actions; acts of war or terrorism; the impact of changes in environmental, tax or other legislation and regulatory activities in jurisdictions in which the Company and its affiliates operate; and other risk factors described in the Company’s Form 10-K for its fiscal year ended September 30, 2015. The Company disclaims any obligation or undertaking to disseminate any updates or revisions to any forward-looking statements contained in this report to reflect any change in the Company’s assumptions, beliefs or expectations or any change in events, conditions, or circumstances upon which any such forward-looking statements are based.

Moving forward
3
Safety results
FY15 FY16 Change
Employee Lost Time Injury Rate 0.20 0.16 20% Better
Employee Recordable Injury Rate 0.49 0.43 12% Better

Moving forward
Air Products will be the safest and
the most profitable industrial gas
company in the world, providing
excellent service to our customers
4
Our Goal

Moving forward
Creating shareholder valueManagement philosophy
Shareholder Value
Cash is king; cash flow drives long-term value.
What counts in the long term is the increase inper share value of our stock, not size or growth.
CEOFocus
Capital allocation is the most important job ofthe CEO.
Operating Model
Decentralized organization releasesentrepreneurial energy and keeps both costsand politics (“bureaucracy”) down.
5

Moving forward
Our Plan5 point plan summary
6
Change culture
Safety
Simplicity
Speed
Self-confidence
Focus on the core
Industrial gases
Key geographies
Align rewards
Reward performance
EBITDA/value creation target
Restructure organization
Decentralize
Geographic alignment
Controlcapital/costs
Capex
Hurdle rates
Corporate cost
Ops./Dist. efficiency
Moving forward
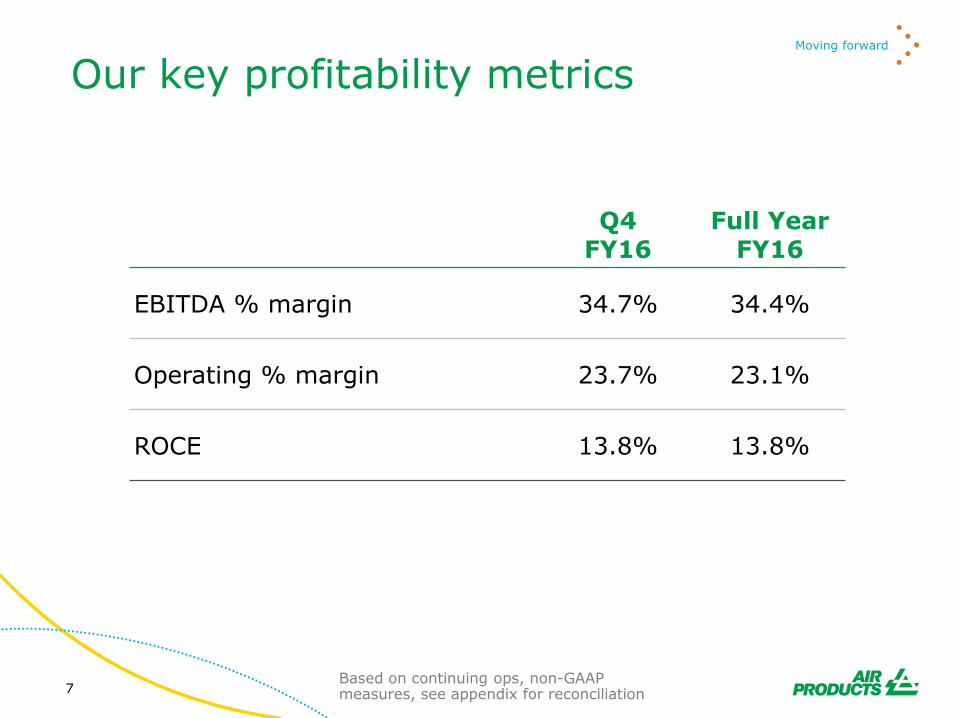
Our key profitability metrics
7
Q4FY16
Full Year FY16
EBITDA % margin 34.7% 34.4%
Operating % margin 23.7% 23.1%
ROCE 13.8% 13.8%
Based on continuing ops, non-GAAP measures, see appendix for reconciliation

Moving forward
Full Fiscal Year Summary
8
FY15 FY16 Change
Sales $billions $9.9 $9.5 (4%)
EBITDA $billions $3.0 $3.3 +10%
EBITDA % margin 30.2% 34.4% +420bp
Free Cash Flow $millions $411 $913 +$502
EPS $/share $6.60 $7.55 +14%
ROCE 12.0% 13.8% +180bp
Based on continuing ops, non-GAAP measures, see appendix for reconciliation

Moving forward
EBITDA Margin Trend
9
25.1%
26.5%
28.7%28.3%
29.5%
30.8%
32.2%
33.5%
35.1%
34.2%
34.7%
24%
26%
28%
30%
32%
34%
36%
Q214 Q314 Q414 Q115 Q215 Q315 Q415 Q116 Q216 Q316 Q416
Based on continuing ops, non-GAAP measures, see appendix for reconciliationFY14 information not audited

Moving forward
• Focus on the core Industrial Gases- Completed spin-off of Versum Materials- Announced sale of PMD to Evonik
• Major projects onstream- Yulin China oxygen- Scotford Canada hydrogen- Big River Steel Arkansas ASU/liquid
• Significant progress on Jazan project
• Major project wins- PKEDZ Nanjing China ASU- Chemours Tennessee ASU- Ulsan, Korea ASU- Other projects not disclosed at
customers’ requests
10
FY16

Moving forward
Fiscal Year Results
11
($ million) FY15 FY16 Change
Sales $9,895 $9,524 (4%)
- Volume 2%
- Price -%
- Energy/Raw Mat’l pass-thru (3%)
- Currency (3%)
EBITDA 2,984 3,273 10%
- EBITDA Margin 30.2% 34.4% 420bp
Operating Income 1,893 2,199 16%
- Operating Margin 19.1% 23.1% 400bp
Net Income 1,434 1,648 15%
GAAP EPS ($/share) $5.91 $6.94 17%
Diluted EPS ($/share) $6.60 $7.55 14%
ROCE 12.0% 13.8% 180bp
• Productivity drives significant profit growth despite weak volumes and currency headwinds
• Operating Margin up 350bp excluding the impact of lower energy pass-thru
Based on continuing ops, non-GAAP measures, see appendix for reconciliation

Moving forward
12
Fiscal Year Cash Flow Focus
($ million) FY15 FY16 Change
EBITDA $2,984 $3,273 $289
Interest (104) (116) (12)
Cash Tax (393) (441) (48)
Maintenance Capex (250) (271) (21)
Distributable Cash Flow $2,238 $2,445 $207
DCF ($/share) $10.30 $11.20
Growth Capex (1,149) (811) 338
Dividends (678) (721) (43)
Free Cash Flow $411 $913 $502
• Improved Distributable Cash Flow and positive Free Cash Flow
• Higher EBITDA and reduced capex, partially offset by higher cash taxes and dividends
Based on continuing ops, excluding Indura buy-up, non-GAAP measures, see appendix for reconciliation

Moving forward
Fiscal Year EPS Analysis
13
FY15 FY16 Change
As reported cont ops EPS $5.91 $6.94
less non-GAAP items (0.69) (0.61)
Non-GAAP cont ops EPS $6.60 $7.55 $0.95
Volume (0.01)
Price / raw materials 0.29 $1.22
Cost 0.94
Currency/FX (0.16)
Equity affiliate income (0.02)
Interest expense (0.04)
Tax rate (0.06) ($0.11)
Non-controlling interest 0.04
Shares outstanding (0.03)
Change $0.95
Based on continuing ops, non-GAAP measures, see appendix for reconciliation
Moving forward
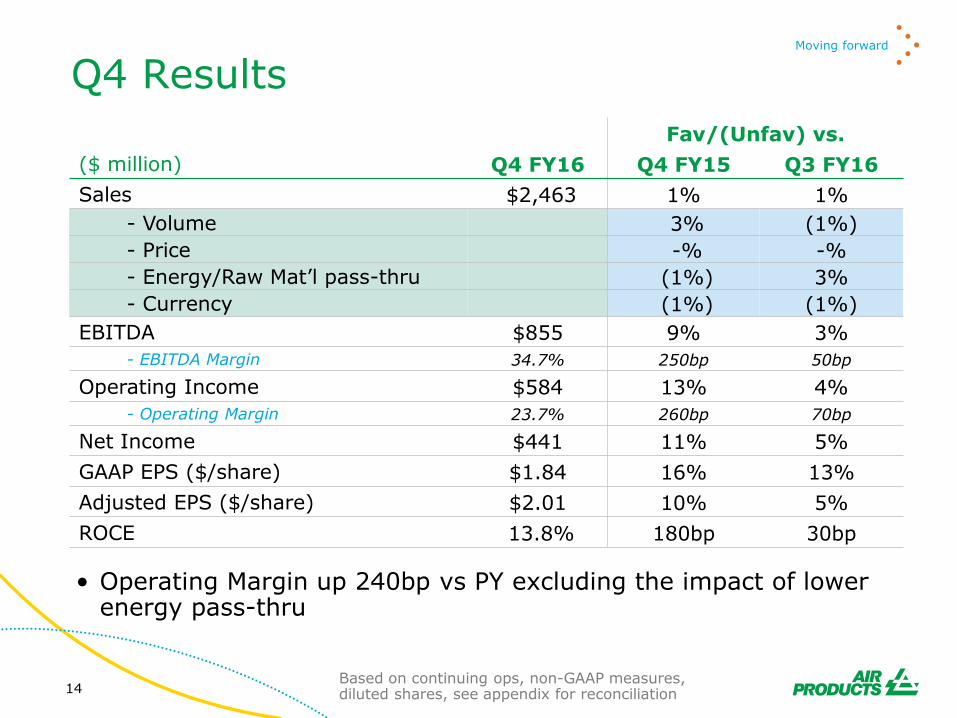
Q4 Results
14
Fav/(Unfav) vs.
($ million) Q4 FY16 Q4 FY15 Q3 FY16
Sales $2,463 1% 1%
- Volume 3% (1%)
- Price -% -%
- Energy/Raw Mat’l pass-thru (1%) 3%
- Currency (1%) (1%)
EBITDA $855 9% 3%
- EBITDA Margin 34.7% 250bp 50bp
Operating Income $584 13% 4%
- Operating Margin 23.7% 260bp 70bp
Net Income $441 11% 5%
GAAP EPS ($/share) $1.84 16% 13%
Adjusted EPS ($/share) $2.01 10% 5%
ROCE 13.8% 180bp 30bp
• Operating Margin up 240bp vs PY excluding the impact of lower energy pass-thru
Based on continuing ops, non-GAAP measures, diluted shares, see appendix for reconciliation

Moving forward
15
Q4 Cash Flow Focus
($ million) Q4 FY15 Q4 FY16 Change
EBITDA $788 $855 $67
Interest (23) (33) (10)
Cash Tax (131) (111) 20
Maintenance Capex (62) (79) (17)
Distributable Cash Flow $572 $632 $60
Growth Capex (272) (182) 90
Dividends (174) (186) (12)
Free Cash Flow $126 $264 $138
• Increase in Free Cash Flow driven by higher EBITDA and lower growth capex
Based on continuing ops, non-GAAP measures, see appendix for reconciliation

Moving forward
Q4 EPS Analysis
16
Q4 FY15 Q4 FY16 Change
GAAP EPS $1.59 $1.84
less non-GAAP items (0.24) (0.17)
Adjusted EPS $1.83 $2.01 $0.18
Volume 0.06
Price / raw materials 0.03 $0.22
Cost 0.13
Currency/FX 0.02
Equity affiliate income 0.01
Interest expense (0.03)
Tax rate (0.02) ($0.06)
Non-controlling interest (0.01)
Shares outstanding (0.01)
Change $0.18
Based on continuing ops, non-GAAP measures, diluted shares, see appendix for reconciliation

Moving forward
• Taking the Lead productivity programs drive margin improvement
Regional Industrial GasesEBITDA Margin
17
FY15 FY16 Delta
Gases Americas 34.9% 41.6% 670bp
Gases EMEA 30.4% 35.6% 520bp
Gases Asia 38.4% 41.0% 260bp
Based on continuing ops, non-GAAP measures, see appendix for reconciliation

Moving forward
• Productivity actions drive profit and margin improvement
• Latin America trading conditions remain weak
Gases Americas
18
Fav/(Unfav) vs.
Q4 FY16 Q4 FY15 Q3 FY16
Sales $877 (3%) 5%
- Volume (3%) (2%)- North America impact (1%)
- Latin America impact (2%)
- Price -% -%
- Energy/Raw Mat’l pass-thru -% 7%
- Currency -% -%
EBITDA $352 7% (3%)
- EBITDA Margin 40.1% 350bp (340bp)
Operating Income $225 8% (4%)
- Operating Margin 25.6% 250bp (260bp)
Based on continuing ops, non-GAAP measures, see appendix for reconciliation

Moving forward
Gases EMEA
19
Fav/(Unfav) vs.
Q4 FY16 Q4 FY15 Q3 FY16
Sales $414 (10%) (3%)
- Volume (4%) (2%)
- Price -% -%
- Energy/Raw Mat’l pass-thru (3%) 2%
- Currency (3%) (3%)
EBITDA $154 2% (3%)
- EBITDA Margin 37.2% 430bp (20bp)
Operating Income $98 8% (5%)
- Operating Margin 23.7% 400bp (50bp)
• Productivity actions drive operating margin up 330bp vs PY excluding the impact of lower energy pass-thru
Based on continuing ops, non-GAAP measures, see appendix for reconciliation

Moving forward
Gases Asia
20
Fav/(Unfav) vs.
Q4 FY16 Q4 FY15 Q3 FY16
Sales $449 5% -%
- Volume 7% -%
- Price -% -%
- Energy/Raw Mat’l pass-thru -% -%
- Currency (2%) -%
EBITDA $172 4% (6%)
- EBITDA Margin 38.2% (30bp) (250bp)
Operating Income $110 5% (7%)
- Operating Margin 24.5% 10bp (190bp)
• Volume growth from new plants and base business
• Higher retail sales improves the quality of the business
• Benefits from productivity actions
Based on continuing ops, non-GAAP measures, see appendix for reconciliation
Moving forward
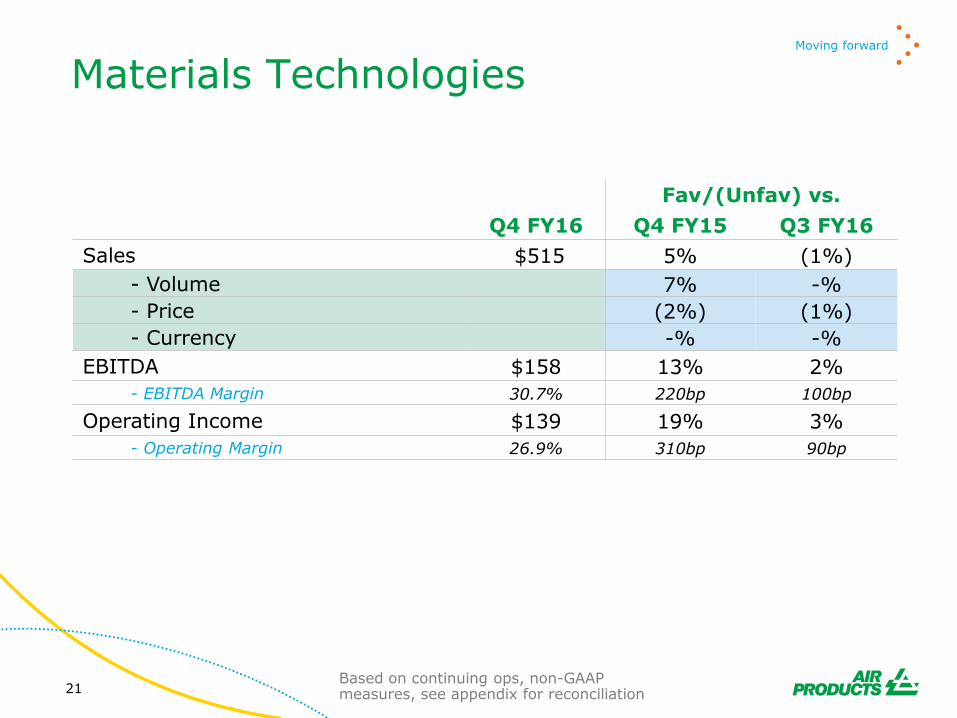
Materials Technologies
21
Fav/(Unfav) vs.
Q4 FY16 Q4 FY15 Q3 FY16
Sales $515 5% (1%)
- Volume 7% -%
- Price (2%) (1%)
- Currency -% -%
EBITDA $158 13% 2%
- EBITDA Margin 30.7% 220bp 100bp
Operating Income $139 19% 3%
- Operating Margin 26.9% 310bp 90bp
Based on continuing ops, non-GAAP measures, see appendix for reconciliation

Moving forward
Materials TechnologiesElectronic Materials
22
Fav/(Unfav) vs.
Q4 FY16 Q4 FY15
Sales $248 7%
- Volume 7%
- Price -%
- Currency -%
EBITDA $83 5%
- EBITDA Margin 33.4% (70bp)
Operating Income $70 11%
- Operating Margin 28.1% 100bp
• Positive volumes driven by Advanced Materials and Delivery Systems
Note that this slide is provided for informational purposes only and does not represent an Air Products reportable segment

Moving forward
Materials TechnologiesPerformance Materials
23
Fav/(Unfav) vs.
Q4 FY16 Q4 FY15
Sales $267 4%
- Volume 8%
- Price (4%)
- Currency -%
EBITDA $74 29%
- EBITDA Margin 27.8% 550bp
Operating Income $68 35%
- Operating Margin 25.3% 580bp
• Polyurethane Additives & Epoxy drive positive volume
• Positive margin driven by cost performance and favorable price vs raw materials
Note that this slide is provided for informational purposes only and does not represent an Air Products reportable segment

Moving forward
24
Outlook
FY16 Q1 EPS
FY17 Q1 EPS Delta
FY16 EPS
FY17 EPS Delta
Excludes PMD
$1.36$1.40 to
$1.50Up 3% to 10%
$5.74$6.25 to
$6.50Up 9% to 13%
Includes PMD
$1.50$1.60 to
$1.70Up 7% to 13%
$6.53$7.10 to
$7.35Up 9% to 13%
FY17 Capital Spending = Approx. $1.2 billion
FY 16 based on estimate of EMD & PMD discontinued operationsFY 17 guidance;• No EMD/Versum business included• Capex does not include any significant acquisitionsNon-GAAP measures, see appendix for reconciliation

Moving forward
• Major restructuring of Air Products is behind us
• Our focus is now on profitable growth
• We now have the balance sheet to pursue growth opportunities for;
- Acquisitions
- Energy projects
- Environmental projects
- Emerging market growth
• In addition, we are committed to growing our dividend while maintaining our current A credit rating
• We will consider share repurchases if market conditions create a compelling opportunity
25
Moving forward

Appendix Slides

Moving forward
Global Gases
27
• Sales and profits up on Jazan project
Fav/(Unfav) vs.
Q4 FY16 Q4 FY15 Q3 FY16
Sales $157 $68 $6
EBITDA $25 $26 $37
Operating Income $23 $25 $37
Based on continuing ops, non-GAAP measures, see appendix for reconciliation

Moving forward
Corporate and other
28
• LNG activity down significantly
Fav/(Unfav) vs.
Q4 FY16 Q4 FY15 Q3 FY16
Sales $50 ($29) ($6)
EBITDA ($6) ($8) $7
Operating Income ($10) ($8) $8
Based on continuing ops, non-GAAP measures, see appendix for reconciliation

Moving forwardMajor ProjectsPlant Location Capacity Timing Market
ONSTREAM (last five quarters)
ASU Yankuang, Yulin, China 12,000 TPD O2 Onstream Gasif to CTL
H2 Scotford, Canada 150 MMSCFD H2 Onstream Refinery (Pipeline)
ASU/Liquid Big River Steel, Arkansas World Scale Onstream Steel
IG BACKLOG - $2.1 billion - over 85% secure onsite/pipeline business model
H2/ASU BPCL, India 165 MMSCFD H2 Q1FY17* Refinery / Chems
ASU Lu’An, Changzhi City, China 10,000 TPD O2 FY18* Gasif to CTL
ASU/H2/Liq. Pyeongtaek, Korea World Scale FY17 Electronics
H2/CO Baytown, Texas 125 MMSCFD H2 plus CO
2018 Pipeline
ASU PKEDZ, Nanjing, China World Scale Not disclosed
Electronics
ASU/LAR Chemours, Tennessee Not disclosed Late 2018 Chemicals
ASU/Liquid Ulsan, South Korea 1750 TPD 2018 Pipeline
JAZAN
ASU = SOE+ 25% EAJV
Saudi Aramco, Jazan 75,000 TPD O2/N2 2018 / 2019
Refinery
29* Multiple Phases

Moving forward
Capital Expenditure
30
FY $MM
2017 Forecast Approx $1.2 billion
2016 $1,083
2015 $1,749
2014 $1,885
2013 $1,997
2012 $2,088
2011 $1,539
2010 $1,298
2009 $1,475
2008 $1,355
2007 $1,635
Non-GAAP - includes Capital Expenditures - GAAP basis, plus Capital Lease expenditures and Purchase of non-controlling interests.EfW included: FY13 $207, FY14 $301, FY15 $350, FY16 $97
2016 and before includes EMD2015 excludes $0.3B for Indura equity2012 excludes $0.7B for Indura equity
2007 - 2010 includes European Homecare Services

Moving forward
Air Products EPS
31
FY13 FY14 FY15 FY16
Q1 $1.55 $1.79
Q2 $1.56 $1.82
Q3 $1.66 $1.92
Q4 $1.83 $2.01
FY $5.53 $5.81 FY $6.60 $7.55
EfW Disc Ops Impact
$0.03 $0.03 FY $0.03
Previously reported
$5.50 $5.78 FY $6.57
Based on continuing ops, non-GAAP measures, see appendix for reconciliation
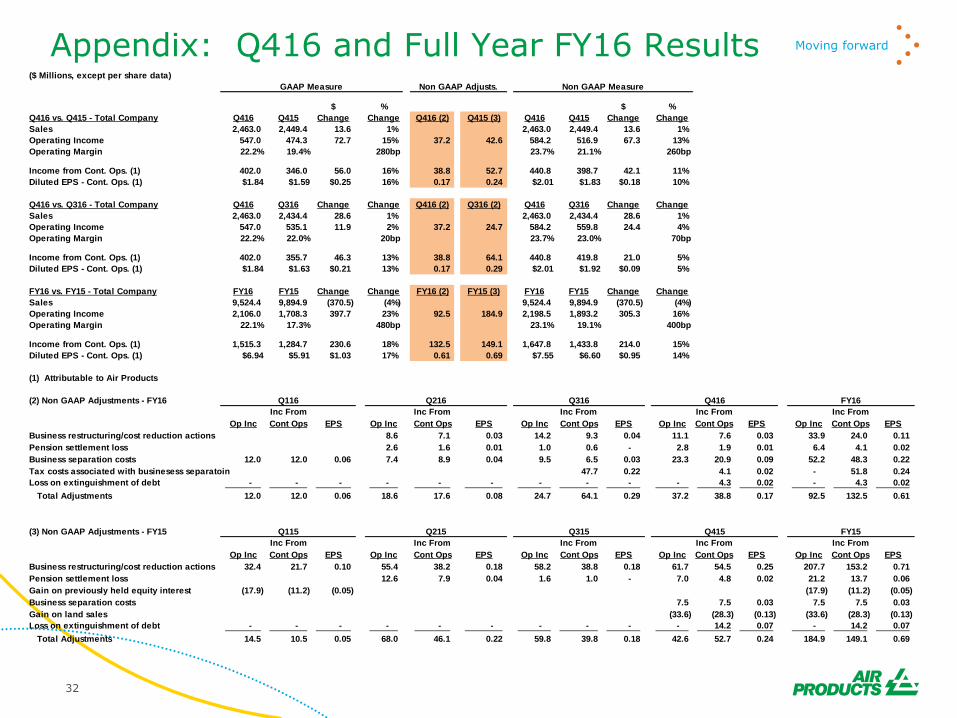
Moving forwardAppendix: Q416 and Full Year FY16 Results
32
($ Millions, except per share data)
$ % $ %
Q416 vs. Q415 - Total Company Q416 Q415 Change Change Q416 (2) Q415 (3) Q416 Q415 Change Change
Sales 2,463.0 2,449.4 13.6 1% 2,463.0 2,449.4 13.6 1%
Operating Income 547.0 474.3 72.7 15% 37.2 42.6 584.2 516.9 67.3 13%
Operating Margin 22.2% 19.4% 280bp 23.7% 21.1% 260bp
Income from Cont. Ops. (1) 402.0 346.0 56.0 16% 38.8 52.7 440.8 398.7 42.1 11%
Diluted EPS - Cont. Ops. (1) $1.84 $1.59 $0.25 16% 0.17 0.24 $2.01 $1.83 $0.18 10%
Q416 vs. Q316 - Total Company Q416 Q316 Change Change Q416 (2) Q316 (2) Q416 Q316 Change Change
Sales 2,463.0 2,434.4 28.6 1% 2,463.0 2,434.4 28.6 1%
Operating Income 547.0 535.1 11.9 2% 37.2 24.7 584.2 559.8 24.4 4%
Operating Margin 22.2% 22.0% 20bp 23.7% 23.0% 70bp
Income from Cont. Ops. (1) 402.0 355.7 46.3 13% 38.8 64.1 440.8 419.8 21.0 5%
Diluted EPS - Cont. Ops. (1) $1.84 $1.63 $0.21 13% 0.17 0.29 $2.01 $1.92 $0.09 5%
FY16 vs. FY15 - Total Company FY16 FY15 Change Change FY16 (2) FY15 (3) FY16 FY15 Change Change
Sales 9,524.4 9,894.9 (370.5) (4%) 9,524.4 9,894.9 (370.5) (4%)
Operating Income 2,106.0 1,708.3 397.7 23% 92.5 184.9 2,198.5 1,893.2 305.3 16%
Operating Margin 22.1% 17.3% 480bp 23.1% 19.1% 400bp
Income from Cont. Ops. (1) 1,515.3 1,284.7 230.6 18% 132.5 149.1 1,647.8 1,433.8 214.0 15%
Diluted EPS - Cont. Ops. (1) $6.94 $5.91 $1.03 17% 0.61 0.69 $7.55 $6.60 $0.95 14%
(1) Attributable to Air Products
(2) Non GAAP Adjustments - FY16
Inc From Inc From Inc From Inc From Inc From
Op Inc Cont Ops EPS Op Inc Cont Ops EPS Op Inc Cont Ops EPS Op Inc Cont Ops EPS Op Inc Cont Ops EPS
Business restructuring/cost reduction actions 8.6 7.1 0.03 14.2 9.3 0.04 11.1 7.6 0.03 33.9 24.0 0.11
Pension settlement loss 2.6 1.6 0.01 1.0 0.6 - 2.8 1.9 0.01 6.4 4.1 0.02
Business separation costs 12.0 12.0 0.06 7.4 8.9 0.04 9.5 6.5 0.03 23.3 20.9 0.09 52.2 48.3 0.22
Tax costs associated with businesess separatoin 47.7 0.22 4.1 0.02 - 51.8 0.24
Loss on extinguishment of debt - - - - - - - - - - 4.3 0.02 - 4.3 0.02
Total Adjustments 12.0 12.0 0.06 18.6 17.6 0.08 24.7 64.1 0.29 37.2 38.8 0.17 92.5 132.5 0.61
(3) Non GAAP Adjustments - FY15
Inc From Inc From Inc From Inc From Inc From
Op Inc Cont Ops EPS Op Inc Cont Ops EPS Op Inc Cont Ops EPS Op Inc Cont Ops EPS Op Inc Cont Ops EPS
Business restructuring/cost reduction actions 32.4 21.7 0.10 55.4 38.2 0.18 58.2 38.8 0.18 61.7 54.5 0.25 207.7 153.2 0.71
Pension settlement loss 12.6 7.9 0.04 1.6 1.0 - 7.0 4.8 0.02 21.2 13.7 0.06
Gain on previously held equity interest (17.9) (11.2) (0.05) (17.9) (11.2) (0.05)
Business separation costs 7.5 7.5 0.03 7.5 7.5 0.03
Gain on land sales (33.6) (28.3) (0.13) (33.6) (28.3) (0.13)
Loss on extinguishment of debt - - - - - - - - - - 14.2 0.07 - 14.2 0.07
Total Adjustments 14.5 10.5 0.05 68.0 46.1 0.22 59.8 39.8 0.18 42.6 52.7 0.24 184.9 149.1 0.69
Non GAAP Adjusts.GAAP Measure Non GAAP Measure
Q216Q116 Q416 FY16
Q115 Q215 Q315 Q415 FY15
Q316

Moving forward
Appendix: Adjusted EBITDA Trend
33
$ Millions Q115 Q215 Q315 Q415 FY15 Q116 Q216 Q316 Q416 FY16 $ % $ % $ %
Income From Continuing Operations 339.2 298.8 334.9 351.5 1,324.4 386.2 387.6 363.0 408.9 1,545.7
Add: Interest expense 29.1 23.4 28.2 22.8 103.5 22.2 25.7 35.0 32.6 115.5
Add: Income tax provision 107.1 87.7 104.1 119.4 418.3 135.9 132.5 179.5 138.6 586.5
Add: Depreciation and amortization 235.5 233.3 233.0 234.6 936.4 232.7 232.1 230.6 230.5 925.9
Add Non GAAP pre-tax adjustments (1) 14.5 68.0 59.8 59.2 201.5 12.0 18.6 24.7 44.1 99.4
Adjusted EBITDA 725.4 711.2 760.0 787.5 2,984.1 789.0 796.5 832.8 854.7 3,273.0 67.2 9% 21.9 3% 288.9 10%
Sales 2,560.8 2,414.5 2,470.2 2,449.4 9,894.9 2,355.8 2,271.2 2,434.4 2,463.0 9,524.4
Adjusted EBITDA Margin 28.3% 29.5% 30.8% 32.2% 30.2% 33.5% 35.1% 34.2% 34.7% 34.4% 250bp 50bp 420bp
(1) Non GAAP Pre-Tax Adjustments
Q115 Q215 Q315 Q415 FY15 Q116 Q216 Q316 Q416 FY16
Business restructuring/cost reduction actions 32.4 55.4 58.2 61.7 207.7 0.0 8.6 14.2 11.1 33.9
Pension Settlement Loss 0.0 12.6 1.6 7.0 21.2 0.0 2.6 1.0 2.8 6.4
Gain on previously held equity investment (17.9) 0.0 0.0 0.0 (17.9) 0.0 0.0 0.0 0.0 0.0
Business separation costs 0.0 0.0 0.0 7.5 7.5 12.0 7.4 9.5 23.3 52.2
Gain on land sales 0.0 0.0 0.0 (33.6) (33.6) 0.0 0.0 0.0 0.0 0.0
Loss on extinguishment of debt 0.0 0.0 0.0 16.6 16.6 0.0 0.0 0.0 6.9 6.9
Non GAAP pre-tax adjustments 14.5 68.0 59.8 59.2 201.5 12.0 18.6 24.7 44.1 99.4
Q416 vs PY Q416 vs PQ FY16 vs FY15
Moving forward
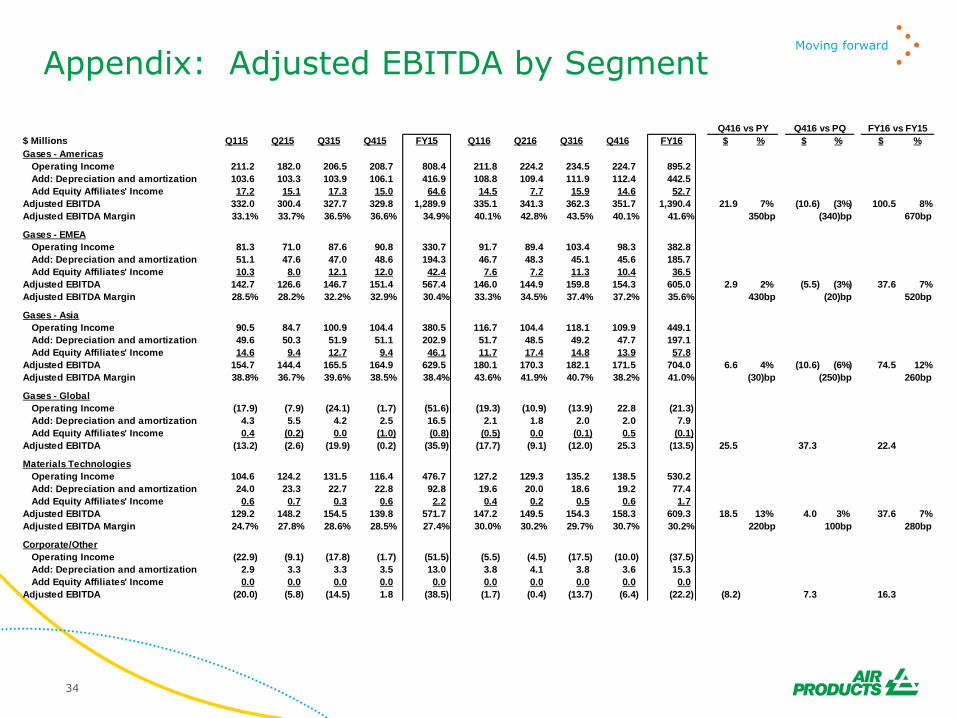
Appendix: Adjusted EBITDA by Segment
34
$ Millions Q115 Q215 Q315 Q415 FY15 Q116 Q216 Q316 Q416 FY16 $ % $ % $ %
Gases - Americas
Operating Income 211.2 182.0 206.5 208.7 808.4 211.8 224.2 234.5 224.7 895.2
Add: Depreciation and amortization 103.6 103.3 103.9 106.1 416.9 108.8 109.4 111.9 112.4 442.5
Add Equity Affiliates' Income 17.2 15.1 17.3 15.0 64.6 14.5 7.7 15.9 14.6 52.7
Adjusted EBITDA 332.0 300.4 327.7 329.8 1,289.9 335.1 341.3 362.3 351.7 1,390.4 21.9 7% (10.6) (3%) 100.5 8%
Adjusted EBITDA Margin 33.1% 33.7% 36.5% 36.6% 34.9% 40.1% 42.8% 43.5% 40.1% 41.6% 350bp (340)bp 670bp
Gases - EMEA
Operating Income 81.3 71.0 87.6 90.8 330.7 91.7 89.4 103.4 98.3 382.8
Add: Depreciation and amortization 51.1 47.6 47.0 48.6 194.3 46.7 48.3 45.1 45.6 185.7
Add Equity Affiliates' Income 10.3 8.0 12.1 12.0 42.4 7.6 7.2 11.3 10.4 36.5
Adjusted EBITDA 142.7 126.6 146.7 151.4 567.4 146.0 144.9 159.8 154.3 605.0 2.9 2% (5.5) (3%) 37.6 7%
Adjusted EBITDA Margin 28.5% 28.2% 32.2% 32.9% 30.4% 33.3% 34.5% 37.4% 37.2% 35.6% 430bp (20)bp 520bp
Gases - Asia
Operating Income 90.5 84.7 100.9 104.4 380.5 116.7 104.4 118.1 109.9 449.1
Add: Depreciation and amortization 49.6 50.3 51.9 51.1 202.9 51.7 48.5 49.2 47.7 197.1
Add Equity Affiliates' Income 14.6 9.4 12.7 9.4 46.1 11.7 17.4 14.8 13.9 57.8
Adjusted EBITDA 154.7 144.4 165.5 164.9 629.5 180.1 170.3 182.1 171.5 704.0 6.6 4% (10.6) (6%) 74.5 12%
Adjusted EBITDA Margin 38.8% 36.7% 39.6% 38.5% 38.4% 43.6% 41.9% 40.7% 38.2% 41.0% (30)bp (250)bp 260bp
Gases - Global
Operating Income (17.9) (7.9) (24.1) (1.7) (51.6) (19.3) (10.9) (13.9) 22.8 (21.3)
Add: Depreciation and amortization 4.3 5.5 4.2 2.5 16.5 2.1 1.8 2.0 2.0 7.9
Add Equity Affiliates' Income 0.4 (0.2) 0.0 (1.0) (0.8) (0.5) 0.0 (0.1) 0.5 (0.1)
Adjusted EBITDA (13.2) (2.6) (19.9) (0.2) (35.9) (17.7) (9.1) (12.0) 25.3 (13.5) 25.5 37.3 22.4
Materials Technologies
Operating Income 104.6 124.2 131.5 116.4 476.7 127.2 129.3 135.2 138.5 530.2
Add: Depreciation and amortization 24.0 23.3 22.7 22.8 92.8 19.6 20.0 18.6 19.2 77.4
Add Equity Affiliates' Income 0.6 0.7 0.3 0.6 2.2 0.4 0.2 0.5 0.6 1.7
Adjusted EBITDA 129.2 148.2 154.5 139.8 571.7 147.2 149.5 154.3 158.3 609.3 18.5 13% 4.0 3% 37.6 7%
Adjusted EBITDA Margin 24.7% 27.8% 28.6% 28.5% 27.4% 30.0% 30.2% 29.7% 30.7% 30.2% 220bp 100bp 280bp
Corporate/Other
Operating Income (22.9) (9.1) (17.8) (1.7) (51.5) (5.5) (4.5) (17.5) (10.0) (37.5)
Add: Depreciation and amortization 2.9 3.3 3.3 3.5 13.0 3.8 4.1 3.8 3.6 15.3
Add Equity Affiliates' Income 0.0 0.0 0.0 0.0 0.0 0.0 0.0 0.0 0.0 0.0
Adjusted EBITDA (20.0) (5.8) (14.5) 1.8 (38.5) (1.7) (0.4) (13.7) (6.4) (22.2) (8.2) 7.3 16.3
Q416 vs PY Q416 vs PQ FY16 vs FY15

Moving forward
Materials TechnologiesElectronic Materials and Performance Materials EBITDA
35
$ Millions Q415 Q416 vs. Q4 FY15
Electronic Materials
Operating Income 63.0 69.7 11%
Add: Depreciation and amortization 15.9 13.3
Add Equity Affiliates' Income 0.3 0.0
Adjusted EBITDA 79.2 83.0 5%
Sales 232.5 248.4 7%
Adjusted EBITDA Margin 34.1% 33.4% (70)bp
Op Margin 27.1% 28.1% 100bp
Performance Materials
Operating Income 50.3 67.6 34%
Add: Depreciation and amortization 6.9 5.9
Add Equity Affiliates' Income 0.3 0.6
Adjusted EBITDA 57.5 74.1 28.9%
Sales 257.5 266.8 4%
Adjusted EBITDA Margin 22.3% 27.8% 550bp
Op Margin 19.5% 25.3% 580bp
Note: Operating Income /Adjusted EBITDA exclude certain costs that are not allocated
to the businesses within Materials Technologies
Fav/(Unfav)

Moving forwardAppendix: ROCE
36
Q114 Q214 Q314 Q414 Q115 Q215 Q315 Q415 Q116 Q216 Q316 Q416
Numerator
GAAP Net Income from continuing operations
attributable to Air Products 285.7 315.9 104.2 326.3 291.9 320.5 346.0 377.8 379.8 355.7 402.0
Add Interest Expense Impact
Before tax interest expense 31.5 31.3 29.0 29.1 23.4 28.2 22.8 22.2 25.7 35.0 32.6
Interest expense tax impact (7.6) (7.5) (14.4) (7.0) (5.3) (6.7) (5.8) (5.8) (6.6) (11.6) (8.2)
Add net interest expense Impact 23.9 23.8 14.6 22.1 18.1 21.5 17.0 16.4 19.1 23.4 24.4
Add Net income attributable to non controlling interests 8.0 9.5 (25.0) 12.9 6.9 14.4 5.5 8.4 7.8 7.3 6.9
GAAP Earnings After Tax 317.6 349.2 93.8 361.3 316.9 356.4 368.5 402.6 406.7 386.4 433.3
Items, after-tax
Business restructuring/cost reduction actions 8.2 21.7 38.2 38.8 54.5 7.1 9.3 7.6
Pension settlement loss 3.6 7.9 1.0 4.8 1.6 0.6 1.9
Gain on previously held equity interest (11.2)
Goodwill and intangible impairment 308.8
Business separation costs 7.5 12.0 8.9 6.5 20.9
Tax costs associated with business separation 47.7 4.1
Income tax items (31.0)
Gain on land sales (28.3)
Loss on extinguishment of debt - - - - - - 14.2 - - - 4.3
Subtotal Items 0.0 0.0 289.6 10.5 46.1 39.8 52.7 12.0 17.6 64.1 38.8
NON GAAP Earnings After-Tax 317.6 349.2 383.4 371.8 363.0 396.2 421.2 414.6 424.3 450.5 472.1
Denominator
Total Debt 6,168.3 6,167.1 6,136.0 6,118.5 6,089.0 5,930.2 5,863.2 5,879.0 5,817.8 5,818.0 5,683.7 6,225.2
Air Products Shareholders' Equity 7,264.0 7,370.9 7,696.7 7,365.8 7,351.5 7,332.5 7,586.0 7,249.0 7,367.1 6,916.6 7,045.4 7,079.6
Redeemable Noncontrolling Interest 358.7 343.6 341.4 287.2 288.7 280.0 277.9 0.0 0.0 0.0 0.0 0.0
Noncontrolling Interest 158.7 156.9 159.5 155.6 151.8 143.8 145.3 132.1 131.9 136.5 134.8 133.8
Less assets of discontinued operations (362.5) (411.9) (475.3) (591.4) (688.6) (724.3) (845.1) (893.6) (938.2) (20.4) (18.8) (19.4)
Total Capital 13,587.2 13,626.6 13,858.3 13,335.7 13,192.4 12,962.2 13,027.3 12,366.5 12,378.6 12,850.7 12,845.1 13,419.2
Calculation
GAAP earnings after-tax - 4 qtr trailing 1,121.9 1,121.2 1,128.4 1,403.1 1,444.4 1,534.2 1,564.2 1,629.0
Five-quarter average total capital 13,520.0 13,395.0 13,275.2 12,976.8 12,785.4 12,717.1 12,693.6 12,772.0
GAAP ROCE 8.3% 8.4% 8.5% 10.8% 11.3% 12.1% 12.3% 12.8%
Non GAAP earnings after-tax - 4 qtr trailing 1,422.0 1,467.4 1,514.4 1,552.2 1,595.0 1,656.3 1,710.6 1,761.5
Five-quarter average total capital 13,520.0 13,395.0 13,275.2 12,976.8 12,785.4 12,717.1 12,693.6 12,772.0
Non GAAP ROCE 10.5% 11.0% 11.4% 12.0% 12.5% 13.0% 13.5% 13.8%

Moving forwardAppendix: FY17 Guidance
37
Historical Air Products (As Reported) Q1 Full Year
2016 GAAP $1.73 $6.94
Business separation costs 0.06 0.22
Tax costs associated with business separation - 0.24
Business restructuring and cost reduction actions - 0.11
Pension settlement loss - 0.02
Loss on extinguishment of debt - 0.02
2016 Non-GAAP Measure $1.79 $7.55
Excluding Electronic Materials Q1 Full Year
2016 Non-GAAP Measure $1.79 $7.55
Adjusted Continuing Operations(A)(0.29) (1.02)
2016 Restated Non-GAAP Measure $1.50 $6.53
2017 Non-GAAP Outlook 1.60-1.70 7.10-7.35
Change Non-GAAP $.10-.20 $.57-.82
% Change Non-GAAP 7%-13% 9%-13%
Excluding Electronic Materials and Performance Materials Q1 Full Year
2016 Non-GAAP Measure $1.79 $7.55
Adjusted Continuing Operations(A)(0.43) (1.81)
2016 Restated Non-GAAP Measure $1.36 $5.74
2017 Non-GAAP Outlook 1.40-1.50 6.25-6.50
Change Non-GAAP $.04-.14 $.51-.76
% Change Non-GAAP 3%-10% 9%-13%
(A)Air Products’ current estimates are preliminary and could change as the Company finalizes the accounting for the discontinued operations,
which will be reported in future filings.
Diluted EPS

Moving forward
Thank you tell me more


![Q4 FY16 Industry Update & Key Performance Highlights [Company Update]](https://static.documents.pub/doc/80x56/577c7f491a28abe054a3ead7/q4-fy16-industry-update-key-performance-highlights-company-update.jpg)

![Q4 FY16 - Results Updates [Company Update]](https://static.documents.pub/doc/80x56/577c7f031a28abe054a2dc17/q4-fy16-results-updates-company-update.jpg)
![Transcript of Q4 & FY16 Earnings Conference Call [Company Update]](https://static.documents.pub/doc/80x56/577c78401a28abe0548f4661/transcript-of-q4-fy16-earnings-conference-call-company-update.jpg)


![Q4 & FY16 Investor Update [Company Update]](https://static.documents.pub/doc/80x56/577c7fc91a28abe054a60c7a/q4-fy16-investor-update-company-update.jpg)


