Asia Pacific Economic Cooperation High Value End-Use Applications Analysis ASIA PACIFIC ECONOMIC COOPERATION EXPERT GROUP ON NEW AND RENEWABLE ENERGY TECHNOLOGIES Prepared by Sustainable Energy Solutions in association with Preferred Energy Incorporated Yayasan Bina Usaha Lingkungan U.S. Export Council for Renewable Energy -December 1997-
Transcript
Asia Pacific Economic Cooperation High Value End-Use Applications Analysis
ASIA PACIFIC ECONOMIC COOPERATION
EXPERT GROUP ON NEW AND RENEWABLE ENERGY TECHNOLOGIES
Prepared by
Sustainable Energy Solutions in association with
Preferred Energy Incorporated Yayasan Bina Usaha Lingkungan
U.S. Export Council for Renewable Energy
-December 1997-
Asia Pacific Economic Cooperation High Value End-Use Applications Analysis
ASIA PACIFIC ECONOMIC COOPERATION
EXPERT GROUP ON NEW AND RENEWABLE ENERGY
TECHNOLOGIES
Prepared by
Sustainable Energy Solutions
in association with Preferred Energy Incorporated Yayasan Bina Usaha Lingkungan
U.S. Export Council for Renewable Energy
-December 1997-
Prepared for the Asia Pacific Economic Cooperation (APEC) Expert Group on New and Renewable Energy Technologies by: Sustainable Energy Solutions in association with: Preferred Energy Incorporated Yayasan Bina Usaha Lingkungan U.S. Export Council for Renewable Energy 100 Reade Street, Suite 5D New York, NY 10013 USA Tel: 1-212-587-7871 Fax: 1-212-566-5477 Email: [email protected] December 1997 1997 APEC Secretariat APEC Publication Number 97-RE-01.7
Table of Contents
List of Acronyms iii Chapter 1 Introduction 1-1 Chapter 2 China Introduction 2-1 Energy Sector Overview 2-2 Policy and Legal Framework 2-3 Six Provinces Gansu Province 2-7 Xinjiang Province 2-13 Qinghai Province 2-19 Inner Mongolia 2-25 Shandong Province 2-29 Zhejiang Province 2-33 Chapter 3 Indonesia Introduction 3-1 Energy Sector Overview 3-3 Policy and Legal Framework 3-6 Renewable Resources in Indonesia 3-8 End-Use Sector Analysis 3-12 Chapter 4 Philippines Introduction 4-1 Energy Sector Overview 4-3 Policy and Legal Framework 4-5 Renewable Resources in Philippines 4-10 End-Use Sector Analysis 4-16 Chapter 5 United States Introduction 5-1 Energy Sector Overview 5-1 Policy and Legal Framework 5-3 End-Use Sector Analysis 5-6 Chapter 6 Comparison of APEC Member Economies Economic Indicators 6-1 Energy Demand and the Economy 6-2 End-Use Sector Comparisons 6-4
References 7-1
ABBREVIATIONS AND ACRONYMS AFV alternative fuel vehicle Btu British thermal unit CNG compressed natural gas CO2 carbon dioxide DSM demand side management GDP gross domestic product GW gigawatt (109 watts) IPP independent power producer kg kilogram kW kilowatt of electricity kWh kilowatt-hour of electricity LNG liquefied natural gas MDB multilateral development bank MMBFOE million barrels of fuel oil equivalent MW megawatt (106 watts) MWp peak megawatts of electricity NGO non-governmental organization NOx nitrogen oxides PPA power purchase agreement PV photovoltaics Quad quadrillion Btu (1015 Btu) SHS solar home system SOx sulfur dioxides SWH solar water heater tce ton of coal equivalent toe ton of oil equivalent Twh terawatt-hour (1012 watt-hours) W watt Wp peak watt of electricity CURRENCY EXCHANGE RATES China: 8.3 RMB = 1 U.S. Dollar Indonesia: 2342 Rp = 1 U.S. Dollar Philippines: 32 PhP = 1 U.S. Dollar
iii
Chapter 1.
1-1
INTRODUCTION The APEC region is one of the largest markets in the world for renewable energy utilization. The combination of the region’s steady growth rates, increasing energy demands, and diverse renewable resource base, make renewable energy applications very promising. However, given limited financial resources and demands for economic growth patterns that are socially, technically, and environmentally sustainable, more attention needs to be placed in selecting those application which posses the highest value for the investments made. This study offers a qualitative assessment of renewable energy applications which have the highest opportunity value, and which offer the greatest economic and social benefit to the Member Economies of China, Indonesia, Philippines, and the United States. These Member Economies have been selected because they represent a cross-section of the Asia Pacific region and the issues to consider when moving toward a sustainable energy future. By looking in depth at these four Member Economies, comparisons can be drawn with the other Member Economies in APEC and these findings can be used to develop new models for energy supply based on renewable technologies. The increasing cost of conventional fossil fuels and their potentially decreasing availability in the future has heightened the focus on renewable energy the world over. A significant amount of time and money is being invested in diffusing renewable energy technologies throughout the Asia-Pacific region, and these efforts are based on the premise that renewables provide wide-sweeping economic and social benefits by satisfying basic needs, spurring economic development and commercial growth, and promoting social development. This attention is also borne out of the understanding that renewable energy technologies can contribute positively to the global concern for the environment. However, though much time and resources have been devoted to the development and dissemination of these technologies, benefits of these efforts have not been fully determined nor shown to be as significant as expected. By and large, these benefits are conjectures because there has been no significant analyses of these claims made on behalf of renewable energy systems. The constraints to the wide-spread application of these technologies are such that each specific application must be considered in light of its particular advantages and disadvantages depending on the circumstances and the environment that pertain to its use. It is therefore important that this study address specific sectors and sub-sectors of a particular Member Economy in order to help identify the benefits as well as constraints to the application of each technology. This study is designed to assist in the identification and enumeration of the economic and social benefits of high value applications for renewable energy and assist in the planning and development of future renewable energy projects. This study is an initiative of the Asia Pacific Economic Cooperation (APEC) Expert Group on Technology Cooperation under the Energy Working Group. The objective of the Energy Working Group is to maximize the energy sector’s contribution to the region’s economic and social well being through activities in four areas of strategic importance:
APEC High Value End-Use Analysis Chapter 1: Introduction
1-2
• Energy supply and demand • Energy and the environment • Energy efficiency and conservation • Energy research, development and technology transfer (Technology Cooperation)
The APEC Technology Cooperation Expert Group was established by the Energy Working Group to promote and facilitate the expanded use of renewable energy where it is cost effective. As of May 1997, the Technology Cooperation Expert Group was renamed the Expert Group on New and Renewable Energy Technologies. The theme of this group is that increased use of renewable resources of energy can contribute, both economically and socially, to the well being of the APEC region. Continued economic growth within the region will require meeting the increasing demand for energy services including electricity both in urban and rural areas, and renewable energy technologies can offset the use of conventional fuels. Included in this study is a summary of the renewable resource potential and consumer demand for each Member Economy that is the focus of this work: China, Indonesia, Philippines, and United States. An overall characterization of each Member Economy including the types, locales, and size of renewable resource base; the amount of electricity produced from renewables as compared to conventional sources; current and forecasted electricity demands by sector; trends in consumer demands and economic growth; and amount and costs of fuel imports are provided. Renewable energy in the context of this report includes solar, biomass, wind, geothermal, and mini-hydropower technologies. The key sectors are defined for each Member Economy (e.g., industrial, agriculture, transportation, residential, health, commercial, and others), and if possible specific sub-sectors were identified and served as the basis for the High Value End-Use analysis. Renewable energy applications were evaluated in light of their match with the energy demand and the appropriate end-use application. Critical areas that require more attention were identified along with regions within a country that have a high probability of success in getting systems installed and barriers to increased deployment of renewable energy systems in the particular Member Economy. This study was a collaborative effort among the four Member Economies. The principal authors on this work were Dr. Ellen Morris (Sustainable Energy Solutions, United States), Ms. Grace Yeneza (Preferred Energy Incorporated, Philippines), Ms. Yani Witjaksono (Yayasan Bina Usaha Lingkungan, Indonesia), and Mr. Scott Vaupen and Mr. Zhiyong Wang (US Export Council for Renewable Energy, China).
Chapter 2.
2-1
CHINA Introduction A variety of transformations have occurred in the People’s Republic of China over the past decade which have made this Member Economy experience new growth and has created opportunities for many industries including renewable energy technologies. Throughout the 1990s, China has consistently been one of the fastest growing economies in Asia expanding an average of 11% between 1978 to 1993. This trend is expected to continue to 2020 at an average of 8 to 9.5% annually. This change has happened as a direct result of the transition from a centrally-planned to market-oriented economy increasingly open to domestic private enterprise and foreign investment. The energy structure, relying on coal, has caused very serious environmental problems including air pollution, acid rain, greenhouse gas emissions, and chronic pulmonary disease. The other challenge faced by the Government of China is related to the alleviation of poverty and the need to balance the benefits of economic growth among the different parts of China. The Government is committed to providing better social services to the 80 to 100 million people living in poverty in the remote areas of the Northwest. China has extensive renewable energy resources in areas without conventional energy. To realize its long-term social and developmental goals, the Government has plans to develop renewable energy technologies for electric power. The Government of China plans to make the transition from demonstration projects to commercial-scale projects in order to provide the least expensive electricity to remote areas, diversify their energy sources, and reduce pollution from coal- fired powered plants. New economic reforms have spurred private investment and resulted in a reduction of trade barriers. This in turn, has created a more favorable investment environment. Both private and multi- lateral organizations consider this Member Economy a good financial risk, and more banks and multi- lateral development banks (MDBs) operating in these countries have accepted renewable energy technologies as a good financial risk as well. While there are vast opportunities for renewable energy development in China, there still is a bias towards coal and other conventional sources of power since the initial capital costs and financing to build conventional power plants which utilize conventional products are relatively low. Financing for renewable energy projects still remains a big challenge in China as well as in most Member Economies in the APEC region. Institutional barriers to investments in renewable energy projects such as capital risk, lack of power purchase agreements for IPPs, long approval processes, lack of access to credit and financing, and subsidies for conventional fuels still need to be addressed. In recent years, China has implemented new laws designed to foster a renewable energy industry, including important provisions for the protection of intellectual property. However, China’s legal system is still evolving and more policies will need to be developed which include financial incentives to support market development and to increase market size for renewable energy.
APEC High Value End-Use Analysis Chapter 2: China
2-2
The High-Value End-Use study of China provides information on the current status of renewable energy, identifies the high-value end use sectors and sub-sectors of the economy and corresponding opportunities for renewable energy, discusses the legal and policy framework, and provides an assessment of the market environment. Six provinces are the focus of this study: Gansu, Xinjiang, Qinghai, Inner Mongolia, Shandong, and Zhejiang. These six provinces were selected, with input from the Chinese Energy Research Institute (CERI) of the State Planning Commission, since they are considered by the Government of China to be excellent markets for renewable energy technologies. These provinces represent a wide cross-section of the diverse environments throughout China. For example, Zhejiang and Shandong are very developed provinces with much industrial activity while Inner Mongolia and Xinjiang are developing rapidly and Gansu and Qinghai are agrarian economies. Each one of these regions or provinces offers a different type of market for renewable energy technologies with different types of demands and challenges. All of the information in this report was the direct result of interviews with various local government officials, local power bureau officials and local industry personnel. There are excellent opportunities in these regions or provinces, however, these provinces are by no means, the only ones within China that show promise for renewable energy. Energy Sector Overview China has the world’s largest population and spans a vast territory in which topography, weather, and other natural conditions vary greatly from region to region. More than one billion people inhabit this Member Economy, and more than 900 million Chinese live in rural regions. Eighty percent of these rural households rely on firewood for their major cooking fuel. China relies primarily on coal, which is the principal energy source. Traditional energy is also important. In rural areas, biomass accounts for 80% of energy consumption in the household sector. The industrial sector accounts for the largest share of energy consumption, accounting for over 60% of the energy consumed in China. The primary industries are steel and iron, non-metallic minerals, and chemicals. The transportation sector accounts for only 9% of the total energy consumption, primarily related to the road and railway sub-sectors. Although car ownership is fairly low in China, this is changing dramatically because demand for cars is high and the rate of motorization is rapid. The household sector accounts for about 40% of final energy demand (including biomass) in China. Household energy consumption is dominated by coal and biomass and the primary end-uses are cooking and space heating. Biomass dominates the rural household energy market whereas coal dominates the urban residential energy markets. With the rapid economic growth that is underway in China, the household electricity demand has increased significantly over the past 15 years. The quality of energy services in urban and rural areas of China differs significantly. Urban areas usually have adequate fuel supplies and access to electricity whereas rural areas experience fuel shortages and some have no access to electricity (Ishiguro and Akiyama, 1995, Tunnah et. al., 1994). Concurrent with the economic expansion that China is experiencing is a need for new electric generation capacity to meet the needs of industry, commerce, and residential consumers. At least 10% of China’s population does not have access to electricity, mostly in rural areas. In these rural areas, one half of the energy use is for commercial energy and the other half is
APEC High Value End-Use Analysis Chapter 2: China
2-3
non-commercial biomass. The Chinese power industry is growing by 9% while the economy is growing by 12-13%. The China Ministry of Electric Power (MEP) estimates that the current electric power supply should be expanded by 20% to keep pace with economic growth and infrastructure requirements. China’s electric generation capacity was 180 Gigawatts (GW) in 1993 and is expected to increase to 310 GW by 2000. Electricity consumption was 926,037 million kilowatt-hours (kWh), with per capita consumption of 780 kwH. The primary source of power is from coal, which represents 61% of its total energy consumption. Although conventional fuels represent the majority of the energy supply mix, China is one of the world’s largest user of renewables, mainly biomass and hydroelectric power. In addition, their manufacturing capability for renewable energy is expanding; it includes solar, wind, and other advanced technologies. Policy and Legal Framework The government energy agencies in China have prepared a joint New and Renewable Energy Development Program which outlines the Chinese government’s new commitment towards the development of clean energy sources. The objectives of the program are to raise the conversion efficiency of renewable energy and strengthen the contribution renewables offer to the total energy scheme. Government Agencies The central government agencies in charge of renewable energy include the three commissions of the State Planning Commission (SPC), the State Economic and Trade Commission (SETC), the State Science and Technology Commission (SSTC) and also some related ministries such as the Ministry of Electric Power (MOEP), the Ministry of Agriculture (MOA) and the Ministry of Machinery (MOM). The Central government has set policies which affect all provinces and autonomous regions throughout China. The State Planning Commission (SPC) is a comprehensive economic management commission which is in charge of formulating the National Economic Development Plan, Five Year Plan and National Long-Term Program as well as approving large-scale projects. The Energy Conservation and Renewable Energy Division of the Communication and Energy Department in the SPC is responsible for formulating the Renewable Energy Yearly Plan, its Five Year Plan and Long-Term Program. In addition, the organization approves all project investment. Other departments within the agency are important to the renewable energy industry. For example, the Science and Technology Department is responsible for arranging and regulating investment on key scientific and technological research projects. The Foreign Capital Utilization Department is responsible for approving joint-ventures and foreign-funded projects in China. It is also responsible for allowing Chinese currency to be converted into hard currency. The State Economic and Trade Commission (SETC) is a comprehensive economic management commission mainly in charge of national economic operations. The SETC is responsible for regulating enterprise operations and for approving projects involving technology transfer. The Renewable Energy Division of the Energy Conservation and
APEC High Value End-Use Analysis Chapter 2: China
2-4
Comprehensive Utilization Department is in charge of organizing and regulating the renewable energy industry and the transfer of technology. This division controls 120 million RMB (US$14.4 million) to be used for loans towards renewable energy project development. In 1996, the SETC authorized a 900 million RMB (US$108.4 million) loan to support 80 MW of wind energy to be installed in Xinjiang, Inner Mongolia and Zhejiang provinces. In addition, this money also went into the development of domestically-manufactured wind turbines. The SETC also supports research and development and renewable energy demonstration projects. The State Science and Technology Commission (SSTC) is a comprehensive management organization on significant national science and technology research projects. The Energy Division of Industry and Technology Department is in charge of regulating and organizing significant science and technology projects concerning renewable energy technology. The SSTC and SPC jointly formulate the Five Year Plan regarding science and technology as well as implement renewable energy research projects. The Ministry of Electric Power (MOEP) is a government agency responsible for regulating the electricity industry. The main responsibilities for this organization deal with grid-connected power production. However, the MOEP is also in charge of formulating policy on rural electrification. The Renewable Energy Division of the Rural Electrification Department is responsible for regulating and formulating the medium-term and long-term plans for renewable energy utilization. The MOEP has set very ambitious goals for wind power. Currently there are about 80 MW of wind turbines installed in China. By 2000, the MOEP wants 1000 MW and 3000 MW of wind to be installed by 2000 and 2010 respectively. In addition, the MOEP has set a goal of electrifying every village and 95 percent of the rural residents in China by 2000. The Environmental Protection and Energy Department in the Ministry of Agriculture (MOA) is mainly in charge of rural environmental and electrification issues. The Energy Division grants 10 million RMB (US$1.2 million) each year to support renewable energy technology dissemination and demonstration projects. These projects emphasize biomass and solar thermal technologies. The MOA, in conjunction with the SETC and the SPC, is responsible for implementing the One Hundred Counties rural energy program. The main goal of this project is to electrify 100 counties using the various technologies available to them. However, renewable energy and energy efficient products are strongly emphasized since these technologies are often the least expensive option. Policies and Regulations China has established a sustainable development strategy, in which renewable energy is a major part. There are many central government policies and regulations that affect renewable energy development throughout the entire Member Economy. Some provinces do have their own incentives and laws in addition to these regulations. However, many provinces use Central government policies as their sole guidelines. The policies involve laws governing the investment and ownership in energy infrastructure, tax incentives, foreign exchange provisions, and others. The SSTC has set specific criteria for the development of new high- technology enterprises. It should be noted that renewable energy technologies are considered to be “new high-
APEC High Value End-Use Analysis Chapter 2: China
2-5
technology enterprises.” This criteria relate to revenue allocation, employment standards, and export and/or market potential. There are also numerous state incentives to promote new high-technology enterprises. These measures include incentives for taxes, tariffs, loans, power purchase, foreign exchange, and foreign ownership. In addition measures have been put in place to ensure the rights, obligations and recourse for secured parties and creditors in order to enhance the business environment in China. Perhaps the most significant policy that supports renewable energy development in China is the Renewable Energy Development Program, 1996-2010. The SPC, SETC, and SSTC have prepared a joint New and Renewable Energy Development Program which outlines the Chinese government’s new commitment towards the development of clean energy sources. The program will be implemented in two stages. From now until 2000, the emphasis will focus on creating the modern industrial base and infrastructure necessary for the production of mature technologies such as wind generators and solar photovoltaic systems for homes and small communities. Research and demonstration projects will be done in order to expedite the maturity of other renewable technologies. From the year 2001 to 2010, new techniques of new energy resources will be popularized throughout China. Industrial and research facilities which abide by internationally recognized standards will be established. The utilization and development of new and renewable energy will reach to 390 million tce. Under this plan, the objectives for each renewable energy technology are as follows: • Small hydropower: Continue development so that installed capacity increases to 20 GW
by 2000 and 28 GW by 2010. • Wind: Market small-scale wind generators, improve the performance of wind turbines,
develop local production capacity for wind turbines above 200 kW, develop wind power control and management systems, strengthen the capacity for wind measurement, planning, siting, and designing, and finally, construct 1000 MW of large-scale windfarms by 2000 and 3000 MW by 2010.
• Solar Photovoltaic (PV) power: Efficiency will be improved and system costs will be reduced through the development of low-cost solar cells and associated equipment. Photovoltaic power stations in nine counties in Tibet will be built by 2000. Small photovoltaic systems should be promoted so that the electricity needs of 28 counties, 10,000 townships and 1,000 islands will be met. Distributed and centralized MW-scale photovoltaic power stations connected to the grids should be demonstrated.
• Geothermal energy: Regions with high temperature resources will be exploited, while solving the problem of geothermal corrosion and water recharge. The use of heat pumps will be encouraged.
• Biomass: Plans for capacity power stations using rice husks, wood scraps, and bagasse to be 50 MW or more by the year 2000. 300 MW will be installed by 2010. Biogas for power plants are not included in this scheme.
A potential obstacle to implementation of this plan is that the Government of China has not made any specific budget allocations to support the New and Renewable Energy Development Program, the capital investment of renewable energy is a great challenge in China.
APEC High Value End-Use Analysis Chapter 2: China
2-6
There are numerous challenges to implementing renewable energy programs in China. Financing and access to credit is critical to the increased adoption of renewable energy technologies. To address this issue, the State Planning Commission, the State Science and Technology Commission (SSTC), and the State Economic and Trade Commission (SETC) are underway on a joint study on financial incentives for renewable energy in China. The average lengthy time for project approval can be a disincentive for project development. This barrier occurs because of the requirement to get a project approved by all related agencies. In China, there has been some relaxation of the foreign exchange policy and foreign companies are now allowed to freely convert some of their money into hard currency. China has relaxed controls on foreign exchange under the current account with regard to trade, labor, and tourism. However, there still is tight control on all foreign investments. The Government of China has set environmental standards which apply to all provinces throughout China. However, according to the situation, each province can create their own standards as long as the central regulations are upheld. According to this environmental law, an environmental impact report must be made before anyone can build a project. As mentioned previously, the establishment and enforcement of laws and regulations will be critical to the improvement of the market economy and the investment in the energy infrastructure of China. The legal system is still evolving in this area, and laws that protect both the foreign and domestic entities will be essential. The protection of intellectual property is one area of concern in establishing joint ventures with Chinese manufacturers.
APEC High Value End-Use Analysis Chapter 2: China
2-7
High Value End-Use Analysis for Six Provinces in China Gansu Province General Overview The Gansu province is located upstream of the Yellow River and is surrounded by the Qinghai-Tibet Plateau (which is mountainous), Inner Mongolia Plateau (mostly desert), and the Yellow-soil Plateau (arable land consisting mainly of farmland). The climatic condition of the majority of Gansu is harsh and dry since there is a lack of rain. In the western part of Gansu, there is very little foliage and therefore, the terrain is not suitable for agriculture, This province is a rural agricultural province inhabited mainly by farmers. Economic development in Gansu province is relatively slow compared to that of the eastern provinces so that Gansu is considered to be one of the poorest provinces in China. The GDP of the province in 1994 was 45 billion RMB (US$5.4 billion) which was 1.14% of China’s total GDP. Like much of China, the provincial economy has been growing at a rapid rate of 10.4%. Officially, the unemployment rate is 3.57%; however, many believe that it is higher. There are a few heavy industries located in and around Gansu’s major capitol city, Lanzhou and other large cities in the province. Below, the table outlines the general economic situation of the province. Table 2.1 Average Income and Cost of Living Per Capita in Gansu in 1995 Location Average salary
(US$/year) Average Net Income
(US$/year) Average Cost of Living
(US$/year) Town and City 578 296 254 Rural Area 87 81
Despite the province’s low economic growth, the area is rich in several renewable energy resources. The provincial government has put a large emphasis on the development of power generation (both conventional and renewable) to offset the 14.5% gap between current capacity and current demand. Even by the year 2000, this situation is not expected to improve. Gansu has 4.6 GW of installed capacity generated by 12 different power plants. This power is generated by 8 coal- fired plants with a total installed capacity of 2229 MW and by 4 hydropower plants with a total capacity of 2323 MW. Hydropower is the main renewable energy source which has been exploited to date. The largest of the hydropower plants is Liu Jiaxia power plant with 100 MW of generating capacity. Gansu’s infrastructure is relatively good considering the economic status of the province. Lanzhou, Gansu’s capital and major city, is accessible by air, rail, and road. Many of the more remote areas are connected by dirt roads; however, when winter sets in, these roads are poorly maintained and travel to these areas is slow at best. Gansu, as well as the rest of China, is connected by a reliable telephone system, so communication, both international and domestic is adequate.
APEC High Value End-Use Analysis Chapter 2: China
2-8
Policy and Legal Framework Under the Gansu Province 9th Five Year Plan and Long-Term Plan 2010, there is an interest in large-scale development of renewable energy and the Province has been actively seeking support from both the Central government and from foreign entities, usually in the form of subsidies and grants. The provincial government has developed two plans which include the development of both renewable energy and conventional energy. Both of these plans focus on the development of the province’s rich solar resources and wind resources. The plan also includes biomass development, but has no plans to implement that technology on a large-scale level. Government Agencies The major government agencies that are involved with renewable energy development are: Energy Division of the Local Economic and Trade Commission; Rural Energy Management Office (under the administration of the provincial Ministry of Agriculture); and the local State Planning Commission. Most counties in Gansu Province have established rural energy offices which are in charge of the dissemination and service of rural energy technologies, especially renewable energy technologies. The local government supplies the working expenditures to these institutions. Furthermore, private companies of photovoltaic power generation have been set up to disseminate photovoltaic power systems in Gansu Province. The Gansu Natural Energy Resource Institute (GNERI) is funded largely by the local government but also including funds from the central government. GNERI is primarily involved in research and demonstration of solar energy technologies. For example, solar/photovoltaics and solar thermal technologies are their primary focus. Products which this institution focuses on include solar hot water heaters, stoves and home systems. The companies under GNERI have been in charge of the majority of the technical support for the dissemination of photovoltaic power systems in Gansu Province. Several companies are semi-private entities involved in renewable energy in the Gansu Province. For example the Gansu Solar Electric Lighting Fund is considered a private company, but is administered under government agencies such as the provincial branch of the State Economic and Trade Commission (SETC), the provincial Ministry of Agriculture (MOA), and the power utilities (which are also a government agencies). The Solar PV Company is funded primarily by the United Nations Development Programme to address marketing issues for renewable energy. Polices and Regulations Gansu province’s legal framework, with regards to renewable energy development and foreign investment, appears to be very unstructured. Since there has yet to be any significant interest in investment within the province, the government has not yet set policies to facilitate investments. However, the provincial government is very willing to negotiate, on a project by project basis, certain incentives and favorable policies with those companies willing to invest in priority projects. The Energy Divisions of the local Planning Commission and Economic and Trade Commission are the main entities with which a potential developer can negotiate project incentives.
APEC High Value End-Use Analysis Chapter 2: China
2-9
The local government has relied mainly on Central government incentives to promote renewable energy. For example, the market for solar/photovoltaic systems in the northwest part of China consists mainly of poor farmers. Therefore, the Central government provides low-interest loans to those households which buy photovoltaic systems. Another incentive to promote foreign investment in power plants is specified in China’s Electric Power Law, which includes all power sources (conventional and renewable). Under this law, private ownership of power plants is strongly encouraged and utilities are told that they must purchase power from these power plants. Gansu has extended a favorable pricing policy towards renewable energy projects. For example, wind projects receive about 1 RMB/kWh (approximately US$0.12) or more. The Gansu Power Bureau is one of the more important bureaus in the province with regards to electricity development, pricing, and transmission. The bureau has given the development of hydropower more priority over other forms of renewable energy since that power source is more cost effective in the initial phase of development. However, the bureau has set a goal of 100 MW of installed wind power by 2020. To help meet this goal, the bureau established a Wind Power Development Office within the agency. All power purchase contracts are negotiated with the Gansu Power Bureau. The Power Bureau also signs contracts with the large purchasers of power. Individual households are charged a set price for power which has been previously approved by the Local Price Bureau. The funds are collected by individuals, hired by the Power Bureau, who personally take meter readings and receive the money owed by clients. Complete foreign ownership of power projects is allowed; however, the transmission or distribution is under state control and closed to private ownership. Joint ventures are strongly encouraged and the Central government has provided special incentives to facilitate these types of partnerships. The Central government has initiated certain environmental regulations by which all industry must adhere to regarding CO2 emissions. However, Gansu province has much less stringent regulations regarding Sox emissions. End-Use Analysis and Market Potential of Renewable Energy In 1995, the total energy consumption in Gansu was 2.4 million tons of coal equivalent (tce). In 1997, the lack of power will be 7.26 TWh. The total cost of electricity for industry, is 40 fen/kWh (0.048 US$/kWh) and for residential users it is 27 fen/kWh (0.032 US$/kWh) , however most residents cannot afford this price. At present, there are 400,000 farmers and herdsmen households without electricity in Gansu. One third of these households can use photovoltaic power system to solve their power supply problem. The province aims to install photovoltaic system for 100,000 households during the Ninth Five Years Period, and 140,000 by 2010 The following table represents a general breakdown of the power sectors in the province: Table 2.2 Breakdown of Power Sectors in Gansu Sector Power Consumption (TWh) Power Price (US$/kWh)
APEC High Value End-Use Analysis Chapter 2: China
2-10
Industry 17.9 0.030 Institutional 4.4 0.033 Residential 13.8 0.033
The main industry sector in Gansu is heavy industry, which accounts for three quarters of the total industry production, predominantly from mining and nonferrous metal production. Other important industry sub-sectors are cigarette production, aluminum production, sugar production and alcohol production. Industry is the only sector with the ability to pay higher rates for electricity. Apparently, industry would be willing to pay up to 0.0602 US$/kWh. The main purpose of renewable energy development in Gansu is rural electrification using primarily solar photovoltaic systems. These systems will indeed, improve the quality of life for people and promote economic development in this province. In Gansu, dissemination of solar photovoltaic power system is mainly dependent on the Rural Electrification Program and Poverty Alleviation Program. According to these programs, customers get a subsidy of US$36.14 per unit when they install household photovoltaic power systems. Up to now, 5,000 units of household photovoltaic systems ranging between 10 to 20 Wp have been installed. Solar photovoltaics has great promise in the Gansu Province for a variety of applications. The majority of the household photovoltaic systems used in Gansu are 20 Wp systems. Besides household photovoltaic systems for farmers and herdsmen, Gansu also provides photovoltaic power station systems from 1 to 5 kW and offers services for other commercial customers. For solar home systems, the potential market size is about 400,000 20 Wp units and about 5000, 20 Wp units have been installed. The goal of the provincial government is that by 2010, the 240,000, 20 Wp units will be installed. The market potential for village-scale photovoltaic units is estimated to be about 300, 2000 Wp units. By 2010, it is expected that 200 of these units will be installed in Gansu. Prices of household photovoltaic systems installed in Gansu range between 85 to 120 RMB Yuan/Wp (10 to 14.5 US$/Wp). In China, Gansu is the only area where bank credit has been used for financing household photovoltaic systems. The county government offers guarantees for customers while at the same time, customers can use a low low-interest loan of 4% interest from the Bank of Agriculture. In Gansu the local government is very interested in the development of renewable power. The primary markets for renewable energy technologies (with the exception of government subsidized solar photovoltaic home systems) would be mainly agricultural applications. Small wind and/or photovoltaic-powered water pumping systems could be used. Solar crop drying technologies to dry rice, tea and other crops could be another very desirable application for renewable energy technology. In the urban areas of the Gansu Province, there are no hot water supply systems for household use, and therefore, solar hot water systems have a large market potential. The demand for solar hot water systems is 2 million m2, and already 200,000 m2 have been installed. By 2010, 1.6 million m2 are expected to be installed. Winters and summers can be very extreme in this region. Air conditions and heating systems are beyond most Gansu residents’ means. However, there has been a significant effort to retrofit many rural homes with passive solar technology. New building supplies such as solar walls, roofs, etc. could have potential in many urban and rural homes. However, once again,
APEC High Value End-Use Analysis Chapter 2: China
2-11
these materials would have to be heavily subsidized to make them more affordable to the average consumer. The potential for passive solar is on the order of 800,000 m2 with 480,000 m2 expected to be installed by 2010. Gansu also has rich wind resources near the power load centers. However, the preparation work for windfarm siting has not been done. As one of the options of power generation, the local government and electricity power bureau are very interested in wind power development since they are more and more concerned with environmental problems in the major cities. The wind energy potential is estimated to be about 66 MW, and already, there have been over 500 kW of small systems installed for household uses. By 2010, 50 MW of small-scale wind capacity is expected to be installed and by 2000, 50 MW of large-scale wind is expected to be installed. The only viable site that has been identified for a commercial wind farm is near Dunhuang, far from any populated area. The biomass potential in Gansu is greatest in the southeastern part of Gansu due to its milder climate. In the government’s 9th Five Year Plan it only calls for 50,000 biogas digesters to be used in Gansu. The total current capacity is 10 million m3/ year. Another interesting technology that is being used in Gansu are solar cookers. Market demand is estimated to be around 500,000 units, and about 80,000 units have been sold. By 2010, it is expected that 400,000 solar cookers will be in use. The development of markets for solar technologies has been the main objective for the various governmental agencies involved with renewable energy. However, there are currently no companies in Gansu which produce or market wind energy equipment. There are, however, several solar photovoltaic companies which manufacture and distribute various products and components associated with that technology. In addition to large-scale wind and the various solar technologies, biomass has good potential because the Gansu province has large amounts of agricultural waste and by-products. However, biomass has not yet been the focus of any domestic company.
APEC High Value End-Use Analysis Chapter 2: China
2-12
APEC High Value End-Use Analysis Chapter 2: China
2-13
Xinjiang Province General Overview Xinjiang Urgar Autonomous Region is located in the north-west border of China and is the largest region in China. The region occupies one sixth of the total area of China comprising 1.66 million km2 and connect with Mongolia, Russia, Kazakstan, Kirghizstan. One third of the province mainly in the central is desert consisting of flat, dry terrain with low population density. However, the north and south part is also China’s largest agricultural base. The province is very rich in mineral, natural gas and oil resources. Xingjiang also has very rich solar energy because of its dry climate. In addition the province contains 35% of China’s coal resources. Over the past few years, development in Xinjiang province has been very rapid. In 1994, the GDP was 62.2 billion RMB (US$7.4 billion) which is 1.4% of the total national GDP. The economic growth rate is estimated to be about 11%. More and more money is being spent on infrastructure in this province to enhance the region’s economic development. Xinjiang is considered to be the next major developmental area in China. The following table summarizes the average incomes and cost of living in Xinjiang in 1995. Table 2.3 Average Income and Cost of Living Per Capita in Xinjiang in 1995 Location Average Salary
(US$/year) Average Net Income
(US$/year) Average Cost of Living
(US$/year) Town and City 512 348 298 Rural Areas 112 100
Xinjiang province has been the new focus of the Central government, who wants to make Xinjiang the new economic center of western China. Therefore, more investment has been put into the development of the province’s infrastructure. Xinjiang currently has ten airports dispersed throughout the province and many of the prime areas with rich renewable energy resources are accessible by relatively good roads. However, since the province is far from the main economic center of the east coast, transporting products into Xinjiang can be time consuming and expensive. Due to the interest in Xinjiang, development in many sectors has been taking place and the need for power is ever increasing. With eighty-four cities and over one million households, the market for a variety of products, including renewable energy products, has great potential. Currently, there are 600,000 people without electricity in Xinjiang. Because a majority of these people are widely dispersed throughout the province, the Xinjiang government has set some very ambitious goals to utilize its most abundant renewable energy resources (solar and wind). Because Xinjiang is comprised mostly of desert, the province has very few significant water resources, limiting the use of hydropower. Geothermal resources are difficult to extract, making that resource less cost-effective than other, more attainable renewable resources. Therefore, solar and wind technologies receive the most interest. Policy and Legal Framework
APEC High Value End-Use Analysis Chapter 2: China
2-14
The Xinjiang government has developed a Renewable Energy Plan for 2010 to utilize and expand the province’s renewable energy resources. It includes plans to build large-scale hydropower plants where appropriate; develop much more large-scale wind power (1000 MW of wind by 2020); and develop solar energy for power, agriculture, etc. In Xinjiang, the provincial government has developed several broad goals designed to alleviate the environmental impact of infrastructure projects. They include using natural gas to replace coal; centralizing space heating; and modifying existing power plants to make them more efficient and cleaner. Government Agencies There are four main agencies in charge of rural energy development in Xinjiang province. The local SETC is in charge of energy and industry affairs. The local SETC was responsible for making arrangements with the central SETC for a 40 MW wind farm to be developed by the utility. The Local State Science and Technology Commission (SSTC) is primarily involved with research and development issues, specifically solar/photovoltaic technology, solar collectors for hot water systems, and solar home systems. The Local Rural Energy Management Agency deals with biomass technologies, including small biogas digesters and stoves. The Xinjiang Electric Power Company is the main power utility in charge of all issues involved with electricity. Responsibilities include wind farm development, rural electrification, etc.. Policies and Regulations Xinjiang is very progressive in terms of polices related to renewable energy development. This has partly to do with the fact that the Central government is specifically targeting Xinjiang as the next major industrialized area and also its resource potential. The Xinjiang government has recognized that renewable energy sources can have a significant impact on the future development of the region. Therefore, there are new laws and incentives which encourage the development of renewable energy. Innovative price incentives for renewable energy have been put in place by the government. A higher price for energy produced by renewables (particularly wind) is available to the power producer. The costs of the higher price paid to the developer is spread throughout the entire grid and to the other provincial branches of the electric bureau. The price paid to wind and other renewable power producers is at least twice that of coal (for example, coal receives about 0.04 US$/kWh; wind receives 0.108 to 0.12 US$/kWh). In addition, all renewable energy projects are exempt from the investment tax and the Xinjiang government provides subsidies for solar homes systems and other renewable energy systems. Attractive loan packages for renewable energy are also available. There are a multitude of laws which encourage foreign companies to establish joint ventures with Chinese firms. While it is completely legal for a foreign entity to have a wholly-owned venture, establishing joint ventures is much more common. The reason for this is that the private Chinese companies that are involved in renewable energy and power production have actually been established under the direction of the local power bureau. The local power
APEC High Value End-Use Analysis Chapter 2: China
2-15
bureau is responsible for the transmission of the energy and provides all access to the grid. An outside company, therefore, may find it difficult to sell power to the utility. Foreign entities may own and operate power plants of any technology. However, the Xinjiang Electric Power Bureau has the responsibility for transmission of energy. The price of power must be negotiated with the Provincial Price Bureau. The department responsible for negotiating these prices is the Highway Industry Division of the Price Bureau. End-Use Analysis and Market Potential of Renewable Energy In 1994, the total energy consumption was 24.41 million tce. The power consumption for that year was 11.8 TWh. Xinjiang has been experiencing a 20% shortage of power and realizes the need to address this issue as soon as possible. Therefore, the local government has emphasized in its 9th Five Year Plan the expansion of the electric power sector. Xinjiang has the potential of being one of the major energy bases in all of China. Although the network does not extend throughout the province, the electricity power bureau has plans to sell power to neighboring countries such as Mongolia and Kirghizstan. These plans show that there is huge market potential for wind power. The following table summarizes the breakdown of the individual power sectors. Table 2.4 Breakdown of Power Sectors in Xinjiang Sector Power Generation (TWh) Power Price (US$/kWh) Industry 10.4 0.036 - 0.12 Institutional 0.6 0.054 Residential 0.8 0.054 Oil and natural gas production are the major components of the industrial sector in Xinjiang. Other important sub-sectors are petrochemical processing, textile industry, and chemicals. At present, the total capacity of the major electricity grid in Xinjiang (Wulumuqi electricity grid) is 1,000 MW. The estimated cost to extend the grid would be 26,506 US$/km (not including the power plant). If a cluster of uncertified households are within 10 kilometers of the existing grid, then the Xinjiang government would consider extending it. However, if the unelectrified households are beyond 10 km from the network, the solar home system is one of the most cost-effective methods of electrification. The cost of electricity ranges from 0.033 US$/kWh to more than 0.12 US$/kWh. Transportation costs and exporting energy from other provinces are some of the main reasons for these price differences. For example, there are some places in Xinjiang, by the border of Qinghai province, which purchase power from a coal- fired plant in Qinghai. The power bureau must pay 0.14 US$/kWh. The power bureau believes that they can reduce costs by building their own plant and paying an equivalent of 0.084 US$/kWh. This fact shows that the power bureau wants to be self sufficient with its power needs and is willing to develop new plants in areas which may already have power generation nearby. The main commercial activity for renewable energy in Xinjiang is grid-connected wind and off-grid solar technologies. The reason for this is that the government sees both wind and
APEC High Value End-Use Analysis Chapter 2: China
2-16
solar to be the best options for meeting the unique energy demands of the province and their resource base. Xinjiang province has some of the most lucrative wind resources in all of China. Currently, there are about 20 MW of installed windpower in the province, representing about one-quarter of the total installed wind capacity in the entire Member Economy. There are nine different wind areas which have the potential to be exploited. Of those nine, only four of them can be easily reached by road or other convenient mode of transportation. The Xinjiang Power Bureau has been looking into several sites near the Kazakstan border to develop grid-connected wind power. One MW has been developed there, and more is expected to be installed in the future. So far, only two of nine wind sites are close to the center of load. The relatively small electricity grid and small power load are the major factors restraining power development in Xinjiang. However, as more industrialization becomes more prevalent, large-scale grid-connected power will be required. Xinjiang currently has no capability to produce large-scale wind turbines, however, they will likely develop their own capacity to manufacture reliable large-scale wind turbines in the future. Other urban renewable energy applications may consist of solar hot water heaters and individual photovoltaic panels for various building materials. The Xinjiang government has been supporting the building of more sustainable cities in the region. Various contracts have been signed with architects of large developments for thousands of solar hot water heaters and solar photovoltaic systems in order to make this happen. The solar resource is average (the annual duration of sunshine ranges between 2550 - 3550 hours/year) and has a potential to produce an estimated 260 kWh/m2/year. In addition, as the communications and broadcast industries are expected to show very rapid growth in this region, sustainable power systems will be required to keep these communication systems operational. There are hydropower resources which can be exploited, but to date, only small-scale hydropower has been developed. There are three main mountains in the province which spawn about 570 different rivers. It is estimated that these rivers, if exploited, can produce more than 33 GW of electricity. Currently, only 700 MW of mini-hydropower power plants have been developed. However, the Xinjiang government has indicated in its ninth five-year plan, that an additional 400 MW of mini-hydropower will be installed. The largest hydropower project is 80 MW. Despite this, no provincial companies are involved in hydropower development. Accessible geothermal resources are not very abundant in Xinjiang and therefore are not exploited to their full potential. No companies are actively involved in products related to geothermal energy. Most biomass resources Xinjiang are used for burning straw. Some remote areas use small digesters for their limited energy needs. However, most of the products come from Gansu, Beijing and other provinces in China. Xinjiang’s minority community lives in the very remote sectors of the province. These areas have no access to electricity or running water. Currently, there are still 490,000 households without electricity making photovoltaic systems, small wind systems and solar water heating systems a feasible option for improving the people’s living conditions. Besides the urban and rural energy demand, there is also a portion of the population that is relatively nomadic. There is little arable land for farming and therefore, a significant portion of their economy is
APEC High Value End-Use Analysis Chapter 2: China
2-17
dependent upon shepherding and livestock. Appropriate renewable technologies would consist of portable, small hybrid systems consisting of small photovoltaic panels and a small wind turbine (enough to power a black and white television, a light, and perhaps a small radio).
APEC High Value End-Use Analysis Chapter 2: China
2-18
APEC High Value End-Use Analysis Chapter 2: China
2-19
Qinghai Province General Overview Qinghai province is located in the Qinghai-Tibet plateau. Over 85% of the province at an altitude of 3000 - 5000 meters. The province is mostly mountainous in the western region especially near the Tibetan border. The north western part, near the Xinjiang border, is mainly desert area. The topography is very complex due to the high mountains and harsh climate. Only 5% of the land is suitable for agriculture, hence the prevalence of herdsmen. Qinghai is much less developed than most of the other provinces in China (especially, the eastern coastal provinces, Inner Mongolia and Xinjiang). At present, there are 107,000 farmer and herdsman households without electricity in Qinghai. The economy has been constrained by the harsh geographic conditions within the province. GDP, in 1994, of Qinghai was reported to be about US$1.66 billion which is 0.3% of the total national GDP. Despite these economic constraints, the province has been reportedly growing at the fairly brisk rate of 8.2%. Unemployment has been officially reported at 1.4%, but realistically lies between 5 - 10%. The following table shows the official statistics for the cost of living and the average income of the Qinghai residents. Table 2.5 Average income and cost of living per capita in Qinghai in 1995 Location Average Salary
(US$/year) Average Net Income
(US$/year) Average Cost of Living
(US$/year) Town and City 599 310 291 Rural Area NA 105 90
Like most of the western region of China, Qinghai is experiencing a severe power shortage. Currently, there is a shortage of electricity of about 40%. In 1995, the total energy consumption was 6.25 million tce. The power consumption was 6.6 Twh. Much of the province’s power comes from coal- fired power plants or hydropower power plants. Total installed capacity is around 1700 MW (mostly comprised of hydropower and the rest is coal- fired). Qinghai’s power price is the lowest in China. While there are ample solar and wind resources throughout the province, very little has been exploited since the main emphasis is the development of large-scale power. Both solar and wind are viewed primarily as rural electrification technologies. Wind, to some extent, is seen by the local government as a way to add to the large-scale power production capacity of the province; but no plans have been made to develop wind power in the near future. In Qinghai the local population and government are interested in rapid development and expansion of their economy. The local government considers hydropower as a priority for large-scale renewable energy power development. There is a high level of interest to manufacture renewable energy products for both the provincial market and the domestic market. The high altitudes of this province do not bode well for agricultural development. Therefore, many of the local people are herdsmen. At present, there are 180,000 households without electricity and most of the herdsmen are not educated. Renewable energy would allow for improvement of the education system because remote schools could continue to operate in
APEC High Value End-Use Analysis Chapter 2: China
2-20
the harsh, winter conditions. Eighty percent of the unelectrified households will rely on solar home systems to get electricity. Despite the fact that these herdsmen are extremely poor, many would be willing to spend an entire year’s wages to buy a 20 Wp -40 Wp solar home system. The reason for this is that it would allow them to improve the quality of life in rural areas. Policy and Legal Framework The Qinghai 9th Five Year Plan include several objectives for power development which will bring Qinghai into the next century. Their goals (in order of importance) are to develop hydropower resources; expand the development of coal- fired power plants; and develop solar and wind resources. Non-conventional renewable energy resources are given very little priority for power in this province. The Qinghai government is especially interested in small and large scale hydropower. Although small power stations and photovoltaic station were developed very fast during China’s 8th Five Year Plan and will continue, the provincial government will put more emphasis on the development of hydropower power. The long-term goals (2000-2010) are that by 2010, the total capacity will be 10 GW, of which 8900 MW will be hydropower. In addition development of a large-scale natural gas power plant will be completed by 2010. Government Agencies There are three main governmental agencies involved with renewable energy: the local SETC, the Qinghai Rural Energy Office, and the Qinghai Power Company. The Qinghai Company is a utility/government agency that has recently allotted 2 to 3 million RMB (US$240,963 to US$361,445) allocated for subsidies towards photovoltaic systems. There are other agencies that are involved with renewable energy which are similar to those in Xinjiang province. One entity in particular, the Qinghai Energy Research Institute, is involved in the distribution of solar technologies throughout the province. Other divisions that specifically manage rural electrification are the Water Resources Bureau and the Local Science and Technology Commission. Polices and Regulations The local government has not initiated many incentives or laws other than the ones mandated by the State. The local government has developed policies which highlight power development, but they are still developing the means for implementation. The local power bureau and other Qinghai government agencies have started thinking about special incentives to promote foreign investment for developing renewable energy power plants in the province. However, there are no written incentives. The government officials have indicated that they might be willing to consider providing incentives for wind and solar power development, but only after the grid has been extended to the best resource areas. The only existing incentives are for hydropower development. The environmental regulations are the same as the ones implemented by the Central government.
APEC High Value End-Use Analysis Chapter 2: China
2-21
End-Use Analysis and Market Potential of Renewable Energy Qinghai province is experiencing severe power shortages. The price for electricity in Qinghai is lower than anywhere else in China, but that is expected to rise In Table 2.6 is a breakdown of the individual power sectors and the prices paid for electricity in each sector. Table 2.6 Breakdown of Individual Power Sectors Sector Power
Consumption(TWh) Power Price (US$/kWh)
Industry 5.2 0.017-0.045 Institutional 1.3 0.03 Residential 0.2 0.025 Qinghai has fairly limited heavy industries with the exception of the minerals and the metal processing industries as well as food processing and general machinery manufacturing. In addition, Qinghai produces various textile products such as carpet and rug manufacturing and the production of various woolen clothing. Appropriate renewable energy technologies for these types of industries could include medium-scale power systems to operate factory machinery, solar heating systems to improve working conditions and water pumping systems to provide water for various processing activities. Small, stand alone power systems would be useful for powering small, black and white televisions, radios, and light bulbs. These systems would allow for the development of small cottage industries. These new sources of power would make the businesses more productive by allowing them to stay open longer hours and therefore, increase the remote population’s incomes. Hydropower development is the main priority for the Qinghai Electric Power Bureau. Already, the province has a 1280 MW hydropower plant in operation and have plans to build another 1600 MW plant called the Lijiaxia Power Plant. Hydropower seems to be a priority for the local government since there are many rivers to exploit. However, large power plants are expensive to build so that smaller run-of-the-river systems may be more affordable and more appropriate relative to the load demands. Qinghai, like all the other provinces, has one main power bureau responsible for transmission and distribution. Under the bureau, there are 22 supplying divisions throughout the province, however only 58% of the villages, 50% of the households and 95% of the towns in this province are electrified. 106 towns and 878 villages are without electricity. Many of these people who are living in poverty burn oil for lighting. A competitive market is not well established at this point in Qinghai. Solar and wind power has been considered mainly for rural applications. Large-scale applications of these technologies will most likely be implemented in five or ten years. The biomass and geothermal technologies are virtually non existent and there are no plans, either in the short-term or long-term, to exploit what resources there are for these technologies. Wind energy has already been used quite extensively throughout the province. Already over 2600 small wind turbines with capacities less than 300 W have been installed. The major consumers of these small wind systems are the herdsmen who use these turbines as part of a small hybrid wind/photovoltaic system. No medium or large-scale turbines (10 kW to 1000 kW) have been installed in Qinghai.
APEC High Value End-Use Analysis Chapter 2: China
2-22
In 1990, the Ministry of Water Resources and Electricity considered building a large-scale windfarm in the province, however the project is not yet started. The only location in the province with good resources for large-scale power production are in the western part of the province (Haixi) near the border of Xinjiang or around Qinghai Lake. However, the Haixi area has no access to the grid. The Qinghai government plans to extend the grid to that area, but this will not happen for another five years. Qinghai Lake is a better near-term option for the development of grid-connected wind power because the transmission line runs very close to the lake and can easily be accessed. Both of these areas have wind speeds ranging from 5 to 15 m/s. The Qinghai government has discussed several options to electrify rural areas. The government will not extend the grid to the remote areas of the province due to the prohibitive costs and the lack of demand for electricity. Therefore they are investigating the possibilities for small hydropower, diesel, wind, and solar/photovoltaic. The climate and geographic location provide some unique challenges for Qinghai. Because winter in some places in Qinghai can last up to eight months, the extreme cold limits the use of free-flowing rivers in those areas, and thus limits the possibilities for hydropower. In addition, diesel cannot be used since the high altitude of Qinghai causes a lack of oxygen above 3800 meters creating very low efficiency of the generators (sometimes lower than 30% efficiency). Also, transporting the fuel to some of these areas is very difficult, if not impossible, and therefore very expensive. Wind can be used, but in many places, wind generators can operate optimally since the wind densities are low due to high altitudes. However, it should be noted that if the wind speeds are high enough, the condition of lower densities at high altitudes will have less of an impact on the operation of wind generators. Solar photovoltaics therefore is the most promising technology for rural energy supply in Qinghai. However, the main drawback is the high first costs of the units. The solar resources throughout Qinghai are very good. This abundant solar resource has caused the Qinghai government to put great emphasis on its exploitation and therefore, solar photovoltaics will play a very important role in rural electrification. Qinghai has developed a group, lead by the Vice-Governor of the province, to electrify rural villages which provides funding for the purchase of small photovoltaic systems. Last year alone, subsidies of 300 RMB/system (US$36/system) were provided to about 3000 households. This year, the group plans to subsidize an additional 3000 households. Small hybrid systems combing both wind and photovoltaic technologies are another option. The Qinghai government has set a goal of installing 1 MW of hybrid systems by 2000. Unfortunately, the majority of Qinghai residents cannot afford these systems and are therefore very dependent upon World Bank and Central government subsidies. The use of renewable energy technologies for rural areas include village power using photvoltaics, solar water pumping, and solar water heaters. Since 1991, there have been six village power stations built to electrify the school and households of the village. These power stations amount to 14 kW installed capacity and produce 20 MWh /year. Currently, there are two solar water pumping stations. The solar water heater market in Qinghai is much smaller than that of other provinces. The reason for this is that the priorities for the general population are such that hot water for bathing is considered a luxury which they cannot afford. The main market for these water
APEC High Value End-Use Analysis Chapter 2: China
2-23
heaters is for communal baths. Currently, they have two projects in Tibet which will be using their water heaters. In addition, other applications could include photovoltaic power systems for remote communication posts, stand-alone systems for the rural populations.
APEC High Value End-Use Analysis Chapter 2: China
2-24
APEC High Value End-Use Analysis Chapter 2: China
2-25
Inner Mongolia General Overview Inner Mongolia is the third largest region in China comprising 12.3% of China’s total land mass. The climate can be particularly harsh with temperatures ranging between -10 C to 100 C throughout the year. Most of the Inner Mongolian terrain consists of plateaus at 1000 - 2000 m elevation. The general terrain consists of flat, desert or grassland areas. However, there are some hilly and mountainous (Yen Shan Mountain) areas. Inner Mongolia, like other western areas of China, is experiencing relatively low economic development, as compared to coastal provinces. Agriculture and livestock are the main economic functions in this society, with some heavy industry. 71.5% of the total population in Inner Mongolia are farmers or herdsmen. In 1995, its GDP was 10.03 billion RMB (US$1.2 billion), ranking 24th in China with only 1.45% of the total national figure. The unemployment rate officially is recognized to be 3.17% in the region, but is realistically closer to 6 - 8%. The following table exemplifies the individual incomes and cost of living in Inner Mongolia: Table 2.7 Average Income and Cost of Living Per Capita in Inner Mongolia in 1995 Population Average Wage
Most people who live in the urban areas have at least a high school education while the rural residents’ educational level is typically lower. Half of the rural residents consist of farmers who generally live in one area, while the other half consists of nomadic herdsmen. With each passing year, these nomadic herdsmen are choosing to settle in one area which is resulting in a better standard of living for them. This new settlement trend is allowing these people to think more about electrification and education. Total installed capacity for the region is 5.6 GW, powered almost entirely from coal- fired plants. The Inner Mongolian region has the most plentiful renewable energy resources in China. The exploitable wind power totals 101 GW, which is 40 percent of the total amount of exploitable wind energy throughout all of China. Inner Mongolia has the second best solar resource in China with the prime solar resources lying within the Bayanjiner and Alashan areas. There are very little hydropower or geothermal resources available in Inner Mongolia. The region does have some biomass resources, but these resources have not been exploited to their full potential. Inner Mongolia’s infrastructure is relatively good considering the amount of economic development in the area. Huhhot, the capital of the region and Baotou, a major heavy industrial city, are accessible by air, rail and road. The province does have a significant amount of heavy industry in Huhhot and Baotou City. Therefore, appropriate renewable energy technologies could include water pumping systems, crop drying technology, communications power systems, stand alone wind/photovoltaic hybrid systems, solar hot water heaters, etc. Huhhot is connected with Beijing by air, rail, and highway. Both roads
APEC High Value End-Use Analysis Chapter 2: China
2-26
and rail connect Huhhot and Baotou. Many of the remote areas in Inner Mongolia are connected by dirt roads. Most roads are poorly maintained with the exception of the two main national highways. Inner Mongolia has a very good telephone system where both domestic and international calls can be made without any problems. New computer equipment and software are available in research centers, universities, some manufacturers, and some luxury hotels. Because the region has a dispersed population consisting mainly of herdsmen and farmers, electricity is not readily available to them by conventiona l means. Therefore, there is a large demand for photovoltaic and small, wind/photovoltaic hybrid systems in remote areas. This large demand has prompted many local companies within the region to manufacture solar energy and small wind equipment. These regional companies have very little competition from companies outside its borders. Policy and Legal Framework The Inner Mongolia 9th Five Year Plan supports the development of renewable energy on a large scale, especially with wind energy. It has been actively seeking support from the Central Government (such as the “Double Strengthening” Program1 established by the State Economic and Trade Commission), and also from foreign entities. There are several key targets for renewable energy development in Inner Mongolia’s 9th Five Year Plan. The local government has plans to install 200-380 MW of large-scale wind power. In addition, there are plans to electrify the 470,000 herdsmen and rural households with small wind systems, ranging between 100 W to 5 kW. These wind power turbines would be marketed directly to the nomadic herdsmen and rural households. Government Agencies The major local government agencies that are involved with renewable energy development are: the Transportation & Energy Division of The Local Planning Commission, Energy Division of The Local Economic and Trade Commission, the Inner Mongolia Natural Energy Institute, and the Inner Mongolia New Energy Research Center. The center studies the theory of wind & solar/photovoltaic, and investigates the wind and solar resources in Inner Mongolia. The center also transfers the research output to some manufacturers. Policies and Regulations The Inner Mongolian government has been very aggressive about developing renewable energy resources throughout the region. The local authorities have instituted many incentives designed to stimulate the growth of renewable energy industry. Local government subsidies provide incentives for renewable energy development. For example, US$24 per 100 W wind turbine, US$24 per 16 W solar/photovoltaic system, and US$5.42 per 60 Ah of batteries for
1 “Double Strengthen” Program is initiated by the State Economic and Trade Commission (SETC) from the beginning of 1996 (the first year of the 9th Five Year Plan). “Double Strengthen” means strengthen the investment on technical innovation, strengthen the speed of technical innovation. In this program, SETC will spend 1 billion Yuan RMB (US$120 million) as a loan nationwide to support the development of renewable energy each year during 1996-2000. In 1996, the program spent 800 million Yuan RMB (US$96.4 million) to support Xinjiang, Inner Mongolia, and Zhejiang provinces to purchase 80 MW wind power turbine from Micon Company, Denmark.
APEC High Value End-Use Analysis Chapter 2: China
2-27
individual households are paid to the manufacturer who, in turn, reduce the prices to the end user. Favorable pricing policies to support the development of renewable energy in Inner Mongolia have also been implemented. For example, the average electricity price is 0.036 US$/kWh. However, the Inner Mongolian local price bureau approved a 0.086 US$/kWh for Zhurihe, Shangdu, and Huitengxile Wind Farms. In addition to the incentives provided by the Central Government, Inner Mongolia has established incentives related to taxes, land-use, and infrastructure support. Complete foreign ownership of power projects (conventional or renewable energy) is allowed, but the transmission and distribution grid must be controlled by the state owned electric power company. Joint ventures are strongly encouraged and the local and central governments have provided special incentives to facilitate these types of partnerships. The Central government has initiated certain environmental regulations by which all industry and other businesses must adhere. The target of the regulations are aimed at reducing SOx, CO2, particulate, and other pollutant emissions. In Inner Mongolia, the implementation of the environment regulations is not very strict because of its vast area and relatively sparse inhabitants. However, wind power and solar energy are still welcomed by local government and residents, partly because the electric power grid can not reach the remote areas, and partly because renewable energy equipment is modular and mobile. End-Use Analysis and Market Potential of Renewable Energy In 1995, the total electricity consumption was 13.98 TWh. Inner Mongolia electricity grid is an important part of North-China electricity grid and it transmits the electricity quantity of 5 TWh with the capacity of 900 MW to north-China regions at present. The table below describes the current prices individual sectors pay for electricity. It is estimated that industrial customers would be willing to pay a maximum of 0.0445 US$/kWh. Residential users are unwilling to pay more. Table 2.8 Breakdown of Power Sectors in Inner Mongolia in 1995 Sector Electricity Consumption
(TWh) Electricity Price
(US$/kWh) Industry 13.292 0.029 Residential 0.738 0.026 The economy of Inner-Mongolia is mainly dependent on livestock, and industry is developing slowly. The primary industry sub-sectors are textile, plastic, and food processing. However, these large-scale enterprises only account for 10% of the economy in Inner Mongolia. The people who live in Inner Mongolia are very aware of the benefits renewable energy products and systems provide. Inner Mongolians have had more experience with renewable systems than most provinces throughout China. Small wind turbines and photovoltaic systems are abundant amongst the population since the local government offers incentives
APEC High Value End-Use Analysis Chapter 2: China
2-28
beyond what the Central government offers. The local government also has very aggressive plans written in their 9th Five Year Plan to expand their wind power capacity. However, the most common problem, existent in many other regions in China, is the lack of capital, modern production equipment and modern technology. The Inner Mongolia Electric Power Company is in charge of electric power project development, pricing, electricity generation, transmission, and distribution. Because there is almost no hydropower resource in Inner Mongolia, the company has decided to develop wind power. Wind power has received the most attention for large-scale development from the local government. There are three wind farms with an installed capacity of 9,075 kW, and one is under construction for 1.5 MW. The wind farms in Inner Mongolia are near to the center of power load. Village scale wind turbines are also being pursued in order to provide electricity for the 1,100 village- level administrations in Inner Mongolia and 1200 town-level (large than village) administrations also have no electricity. A wind power generation company has been established within the utility to develop wind resources (estimated to be 101 GW potential). The goal of the company is to install 200 - 380 MW of wind power capacity in Inner Mongolia by 2000. Because the company controls the transmission and distribution grid, all power purchase contracts must be negotiated with the company. The company also signs contracts with larger power purchasers. The Inner Mongolian Electric Power Company is the only electric power utility in the Inner Mongolian Autonomous Region. Inner Mongolia is not much different than other provinces with regards to manufacturing large-scale wind turbines. Currently, China does not have the capability to produce turbines of 250 kW or larger. However, joint ventures are now being formed and it will not be too long before the Chinese start manufacturing their own turbines. In addition small wind power turbines are also very important in Inner Mongolia. So far, there are about 150,000 small wind turbines. The primary use for these small turbines is for lighting, TV, refrigeration, etc. But there are still 470,000 households which have no electricity. Wind is seen as essential for filling this void. Photovoltaics have also been installed for solar home systems. To date, 80,000 sets of small, 20W photovoltaic systems have been installed in Inner Mongolia. It is estimated that 470,000 households still need hybrid wind/photovoltaic systems.
APEC High Value End-Use Analysis Chapter 2: China
2-29
Shandong Province General Overview Shandong Province is located on the eastern coast of China at the lower reaches of the Yellow River and consists of two parts: the Jiaodong Peninsula, and the interior areas. Two thirds of the land in Shandong consists of flat plains suitable for agriculture, so there is rich biomass resource in Shandong province. The remaining area is fairly hilly. Yimeng Mountain is the only mountain of any significance in the province with an altitude of about 500 meters. Shandong lies in the temperate monsoon climate zone with annual precipitation ranging from 400 to 900 mm. The annual average temperature in its main cities varies from 120 C to 150 C. The province has been a very key component for China’s economic development and has been experiencing very rapid economic growth. GDP increased by 17.34% to US$46.65 billion in 1994. The province is one of the most densely populated regions in China with 555 people/square kilometer (4.42 times of the national average). In 1995, Shandong’s GDP was US$60 billion, 8.68% of the national total. The economy of the province has grown at an enormous rate reaching 29.2 percent in 1995. Officially, unemployment is virtually non-existent at 0.7%, but most believe it is higher than that. The following table shows the average income and cost of living throughout the province: Table 2.9 Average Income and Cost of Living Per Capita in Shandong in 1995 Location Average Income
(US$/year) Average Net Income
(US$/year) Cost of Living
(US$/year) Urban 620 476 234 Rural 316 206 161
Shandong is one of China’s major energy production bases since it has abundant coal and oil resources. Renewable energy resources are not as plentiful as they are in Inner Mongolia or Xinjiang; however, some resources as well as a demand for renewables does exist. Most areas (both urban and rural) within the province are electrified. Unfortunately, despite its renewable energy resources, the province produces its 140 GW of energy almost entirely from coal and oil (coal, 75%; oil, 23%; and natural gas, 2%). Only about 0.1% of the installed capacity is hydropower. This has resulted in a very serious air pollution problem and has caused the provincial government to look at its renewable energy resources as a means of mitigation. Shandong’s infrastructure is very well developed compared to most provinces in China. There are six sea ports in the eastern part of Shandong (Qingdao, Yantai, Weihai, Shijiu, Longkou, and Rongcheng). Various parts of Shandong are also connected by three airports (Jinan Airport, Qindao Airport, and Yantai Airport). The province also has the best road system in China connecting every city and village with paved, asphalt roads. Shandong’s communication system is extremely modern. Since Shandong is one of China’s major industrialized centers, its manufactur ing facilities are probably the most modern throughout all of China.
APEC High Value End-Use Analysis Chapter 2: China
2-30
Policy and Legal Framework Government Agencies The major government agencies that are involved with renewable energy development are: the Division of Resource Conservation and Utilization, Shandong Economic and Trade Commission, the Provincial Rural Energy Management Office, and Shandong Provincial Electric Power Company. The Provincial Rural Energy Management Office is under the administration of the provincial Department of Agriculture. The agency has a large network of offices spread throughout the province to promote the production of rural energy equipment. The Shandong Provincial Electric Power Company. is a state-owned business in charge of all electric power issues including generation, transmission and distribution. It is in charge of the operation and management of the Shandong Electric Power Grid. A unique feature of this grid is that it is independent from other provincial power grids. Usually, each provincial grid is part of a larger power network. The company has established a wind power generation company to develop the available resources on the province’s coastal areas, however they have not installed new wind turbines due to a lack of finances. Policies and Regulations The legal framework in Shandong province is well established. However, there are no specific local incentives provided by the provincial government to promote the development of renewable energy beyond those provided by the Central government. Shandong Provincial Government does not issue any environmental regulations beyond those issued by the National Environmental Protection Agency (NEPA). A specific environmental impact report must be submitted before a project can be built. Complete foreign ownership of any power project is allowed. The grid, however, is not open to foreign ownership. Foreign investors are encouraged to own any percentage of a joint venture or to establish any kind of totally foreign-funded business. End-Use Analysis and Market Potential of Renewable Energy Shandong province, being a fairly well developed area, has most of its interest concentrated on the expansion of its economy. In Shandong there is both light and heavy industrial activity, including chemicals, petrochemicals, electronic appliance, textile and alcohol production. Shandong also has several large-scale national level companies such as Haier Electronic appliance enterprises for refrigerator and television manufacturing, Qingdao beer and others. As one of the most developed provinces in China, Shandong offers many opportunities for several types of renewable energy technologies. Incomes are relatively high for both rural and urban populations. Therefore, smaller subsidies and less reliance upon the government are needed. Rural people could use renewable energy for water pumping, crop drying, solar hot water, passive solar homes, building materials, etc..
APEC High Value End-Use Analysis Chapter 2: China
2-31
In urban areas where there are more high-technology industries, renewable technologies could be used for distributed power systems to power factories, communication systems for mobile phones, large-scale grid connected power plants, etc.. Shandong industries include television manufacturing, computer manufacturing and software development, household appliances and a variety of other durable goods. The average cost of electricity in 1996 was between 0.049 to 0.053 US$/kWh. The price to rural households was more than 0.12 US$/kWh. This disparity in price for rural users, according to the Ministry of Electric Power, is justified because rural households need to pay for the cost of the power equipment. Another reason given for such a high cost is that there are heavy transmission and distribution losses in rural areas. These losses are eventually calculated into the electricity price paid by the consumers. Solar water heating and biogas technologies are the primary commercial renewable energy activities in the province. The main interest is to gain new technology and manufacturing facilities to expand its markets beyond the provincial borders and possibly beyond China’s borders. There are some wind power resources in the coastal areas which could be exploited for large-scale energy production, but investment in wind power has tapered off due to inexpensive power that is being produced from conventional coal- fired power plants. The potential amount of power available in these coastal areas is about 110 Twh/year. Shandong was one of the first areas to exploit its wind resources. Other small units were set up throughout the province totaling 1737 wind power generators with an installed capacity of 453 kW. These small generators produce 57 MWh annually. There are plans to develop the province’s wind resources. It is estimated that by the year 2000, the total installed capacity of wind will reach 55 MW. More specifically, Shandong will establish another 21 MW of wind power in Weihai city, and 32.5 MW in Yantai city in the near future. However, without any specific incentives or policies encouraging renewable energy development, it is unknown whether or not Shandong will move forward with its plans. Biogas is utilized for cooking in rural areas. Biogas generators have a total capacity of 865 kW and provide 370 MWh of electricity annually. The province has 328,000 biogas ponds which produce 6795 cubic meters of biogas annually. Shandong also has one of the largest solar water heater manufacturing capacities in China. Currently there are 13 solar vacuum tube production lines in Shandong. Since Shandong is also one of the more industrialized provinces, the urban population has more opportunity for increasing their incomes. With these new incomes comes the demand for new luxuries such as hot water. This new market has created a huge demand for high quality solar hot water heaters. Much of Shandong is agricultural, therefore, there are abundant resources for biomass energy. Currently, this resource is used extremely inefficiently by burning it directly. There has been a push towards the use of more efficient, energy-saving stoves using biomass residues. These stoves have been designed and demonstrated with both local and Central government support. Rural women have reaped the benefits of these more efficient stoves since the stoves save them much time and labor. Development of hydropower and geothermal power have not been considered by the power authorities since they consider the resources to be extremely limited throughout the province.
APEC High Value End-Use Analysis Chapter 2: China
2-32
Zhejiang Province General Overview Zhejiang Province lies on the south eastern coast of China. Its terrain is extremely mountainous with more than 70% of its area consisting of mountains over 1000 meters tall. 54.6% of this terrain is covered with forests making it the most abundant resource for wood in China. The remaining area consists mainly of plains. The climate in Zhejiang is humid and warm with a mean annual temperature of about 17 degrees centigrade. In 1995, Zhejiang’s GDP was US$42.6 billion, accounting for 6.1 percent of the entire Member Economy’s GDP. Its economic growth rate was a staggering 32.2%. This economic condition, makes this province one of the best opportunities for renewable energy technologies. New high-technology industries are rapidly expanding in this region. As new companies emerge, new building and new infrastructure must also be built. The following table outlines the average income and cost of living for Zhejiang’s residents. Table 2.10 Average Income and Cost of Living Per Capita in Zhejiang in 1995 Location Average Wage
(US$/year) Average Net Income
(US$/year) Average Cost of Living
(US$/year) Urban 797 689 394 Rural 479 357 286
As one of the well-developed regions, the education level in Zhejiang is one of the highest in China. Along with the rapid economic development, people are becoming more and more concerned with the environment. Therefore, renewable energy products and other green marketing techniques will be successful in this region. Zhejiang has 77 GW of installed power capacity, of which 18 percent (13.7 GW ) is hydropower and 62 percent is thermal power. 15.2 GW of this power is produced by small, thermal plants built by local entities. These small plants mainly utilize coal or diesel. The area is relatively rich in hydropower, wind, solar, biomass, and tidal energy resources, but these resources have not been exploited to their full potential. Zhejiang is one of the most developed provinces in China yet there is still a large problem with inadequate energy supplies. Coal is the major source for electricity production and most of it is imported from other provinces. This importation of coal has caused electricity prices to be higher than those of other provinces. This higher price has not deterred industry or residential users from us ing electricity and therefore, exemplifies the ability and willingness of the provincial population to pay more for electricity. Zhejiang’s infrastructure is very well developed. Each city and county is connected by a vast network of roads and rail. This network is based on two national highways (320, which goes east to west, and 104, which goes north to south). There are three large airports (Hangzhou, Binbo, and Wenzhou). The province is also accessible by sea via its three ports (Ningbo, Wenzhou, and Shujiang). Most cities and some counties are well connected with domestic and international telephone lines. In addition, access to advanced computer and software is available.
APEC High Value End-Use Analysis Chapter 2: China
2-33
While Zhejiang is fairly well developed with regards to much of its infrastructure, many manufacturing facilities lack modern production lines to produce much of the high technology equipment necessary to make renewable energy equipment suitable for the international market. Policy and Legal Framework Government Agencies There are several agencies involved in some aspect of energy development in Zhejiang. Some of these include: the Energy Division of Zhejiang Provincial Planning and Economic & Trade Commission, the Zhejiang Energy Conservation Center, and the Zhejiang Provincial Rural Energy Management Office. Other Important Organizations include the Zhejiang Institute of Mechanical & Electrical Engineering Design, the Hangzhou Rural Energy Management Office, and China National Photovoltaic Technology Development Center, the Zhejiang Provincial Electric Power Company, and the Zhejiang Wind Power Generation Company of Zhejiang Provincial Electric Power Company. The Hangzhou Rural Energy Management Office mainly concentrates its work on production and marketing of solar hot water heaters and biomass gasification. The China National Photovoltaic Technology Development Center assists the government to formulate the photovoltaic development plan as well as carrying out R&D and disseminating information for photovoltaic and solar battery technology. Zhejiang Provincial Electric Power Company is responsible for transmission and distribution of all power generated in the province. The Zhejiang Wind Power Generation Company of Zhejiang Provincial Electric Power Company develops Zhejiang’s large-scale wind resources as one of this company’s major objectives. In October 1996, the company obtained US$24.09 million from the SETC’s “Double Strengthen” Program to purchase 20 MW of wind turbines. Policies and Regulations Despite the province’s lack of resources for conventional power (i.e. coal, oil, and natural gas), there are no significant incentives offered for the development of renewable energy projects or joint ventures besides provisions made by the Central government. However, the Zhejiang government is willing to negotiate higher energy prices for certain wind power projects. The Zhejiang Provincial Electric Power Company has placed development of renewable energy projects (mainly wind power) as its top priority. This priority status is backed by the company’s willingness to negotiate higher prices for wind power produced by Zhejiang Wind Power Generation Company. End-Use Analysis and Market Potential of Renewable Energy In Zhejiang, foreign trade, tourism and light industry are the basis of the economy. In the industrial sector, the textile, garment and the electronics production capacity are growing
APEC High Value End-Use Analysis Chapter 2: China
2-34
rapidly. Most of these products are produced by town and village enterprises and exported. The petrochemical industry also is very important in Zhejiang. The government and the local people are very interested in developing renewable energy such as wind power, solar water heating and biogas systems. There is a large level of interest to pursue wind power development along some of the province’s coastal islands. The rapid economic development taking place in Zhejiang will require more infrastructure development which will lead to more opportunities for various renewable energy technologies. This could include solar photovoltaic systems for distributed power, solar walls for heat, and photovoltaic-powered communication systems. In 1996, the average price of electricity was 0.076 US$/kWh. This price could be enough for foreign power plant developers to develop large-scale grid connected wind farms and other large-scale renewable power plants. However, the cost of electricity in Zhejiang depends on the State-set-price and surcharges. Much of the commercial activity for renewable energy is in the areas of solar hot water heaters and solar photovoltaic, biomass, hydropower, and wind power technologies. For example, the rural energy management offices established companies to produce solar water heaters for household use. Companies were also set up to produce biogas from urban industrial organic waste water and other sources found in rural areas. Biomass energy (crop stock, organic industrial waste water, fuel wood, and livestock excrement) shows great promise in Zhejiang, however less than 6 percent has been developed. Zhejiang has excellent wind power resources in the Zhoushan Islands. However, these resources have yet to be fully developed. Wind resources in Zhejiang province could provide up to 473 TWh per year. According to a survey made by the Provincial Electric Power Bureau in 1991, there are 15 known sites along the coast which are suitable for up to 600 MW of wind power development. There is an existing 10 MW wind farm, however the Government has an ambitious plan for wind power generating capacity of 100 MW by 2000. Two new wind farms are expected to come on line in 1997: Cangnan, with 12 sets of 600 kW units, and a 21 MW windfarm in Linhai.
APEC High Value End-Use Analysis Chapter 2: China
2-35
Chapter 3.
3-1
INDONESIA Introduction Indonesia is a large archipelagic Member Economy, comprised of 17,000 islands spanning 5,000 km. The population of Indonesia is 196 million people, with 66% of the people living in Java and 77% of the population living in rural areas. Indonesia has been experiencing an exceptional growth rate, reaching 7.8% in 1996 and a GDP of US$220.1 million. Indonesia has shown steady economic growth and holds a strategic position in Southeast Asia. Indonesia’s real GDP growth during the period 1992--96 averaged about 7.5 percent annually. The structure of the economy, like that of other Asian nations, has changed dramatically in the past twenty years. In 1970, agriculture accounted for 35 percent of GDP; in 1996, it made up only 16.3 percent. Industry’s share of GDP increased from 27 percent to 33.2 percent during the same period. The industrial sector comprised of primarily the manufacturing sector (25.2 %) and the construction sector (8.0%). The transition from a predominantly agricultural economy to one based on manufacturing and services has been accompanied by rising per-capita GDP to US$1,103 in 1996. Indonesia’s currency is the rupiah (Rp), (and US$1 ~ Rp2,400 in 1996). The inflation rate was 8.2 percent in 1995 and 6.7 percent in 1996, but in 1997 the inflation rate has been higher. Since 1990, there has been upward pressure on wages and overall prices. This has been reflected in the higher inflation rates seen over the years. Indonesia’s primary imports are machinery, steel and other metals, chemicals, transport equipment, and woven yarn. In the past three years local production of components for many manufactured goods has started. Therefore, despite 7.5 percent yearly average of rupiah inflation, the price of consumer electronics, appliances, have not shown significant increase. This also indicates that as Indonesia continues its rapid industrialization, local sourcing of components is expected to become more feasible. Because the economy is growing at such a great rate, demand for energy and energy-driven technologies is also growing. The state-owned electric utility, Perusahaan Umum Listrik Negara (PLN) has estimated that demand for electricity will grow to 192,080 Gwh by 2003. The current electricity generation mix in Indonesia is combined cycle gas turbines (22%), hydropower (17%), oil (16%), coal (16%), diesel (16%), gas (10%), geothermal (1.5%), and natural gas steam (1%). PLN estimates that Indonesian people consume 287 kWh of electricity per capita per year1. However, energy statistics indicate a trend that in the last five years electricity demand has grown at the rate of 15% to 17% per year. Approximately 42% of the villages and 26% of the rural households have access to electric services.
1 PLN Management Report 4th quarter 1996
APEC High Value End-Use Analysis Chapter 3: Indonesia
3-2
Although petroleum and natural gas are still important sources of export revenue for Indonesia, their share of export earnings has declined from 80 percent in 1981 to about 23 percent in 1996 (EIU, 1996). Indonesia, which is an OPEC Member Economy, is projected to become a net importer of oil shortly after the turn of the century. Revenue from non-oil exports -- which include plywood, garments, woven fabric, processed rubber, footwear, and electronics – contributed to a total export of US$9 billion. Indonesian exports were valued at about US$45.418 billion in 1996; most are destined for primarily Japan and Singapore. Recent energy consumption statistics in Indonesia and their need to conserve oil and gas have triggered the need to develop more renewable energy resources. Indonesia is shifting its consumption away from petroleum-based products in order to mitigate local and regional environmental impacts related to the rapid electricity development in the Member Economy. Furthermore, high potential for saving energy in all sectors of Indonesia’s economy, along with recent policy developments that encourage greater energy efficiency and the use of renewable energy resources, signal opportunities in renewable energy development as well as energy-efficiency products and services.
Table 3.1 INDONESIA - MEMBER ECONOMY DATA 1997
Member Economy Profile Population in 1996: 198 million Population growth: 1.66 percent Religions: Islam, Christianity, Hinduism, Buddhism, Animism Government System: Presidential Democracy Languages: Bahasa Indonesia, and regional languages
Economic Indicators 1992 1993 1994 1995 1996a
GDP at current market prices US$ billions
128.32 158.02b 174.64 198.04 218.23
Real GDP growth % 6.5 7.3 7.5 8.2 7.8 GDP per capita in US$ 695 842 916 1,017 1,103 Consumer price inflation % 7.6 9.2 9.6 9.4 6.7d Population m 184.5 187.6 190.7 194.8 198.0g
Exchange rate (av) Rp : $ 2,030 2,087 2,161 2,249c 2,342 c a. Official estimates, b. Break in series, c. Customs basis, d. Actual, e. EIU estimate f. U.S.-ASEAN Council estimate, g. IIEC estimate
APEC High Value End-Use Analysis Chapter 3: Indonesia
3-3
Sources: EIU, Indonesia Country Report 3rd quarter 1997, and US-ASEAN Council
Indonesia has a very diverse natural resource base with plentiful energy resources, mineral deposits, timber resources, and agriculture. Since President Suharto took office in 1968, Indonesia’s economy has been mostly dominated by state-owned or heavily regulated enterprises. State-owned enterprises in the petroleum, mining, and forestry sectors have been the primary engines of economic growth and development. Until the early 1990s, the economy was quite closed to foreign trade and private investment in the primary sectors, with protective tariffs and strict rules concerning local ownership. This situation has since changed dramatically. Indonesia also has a great variety of energy resources, including oil, natural gas, coal, hydropower, geothermal, solar, and wind. While the rest of the world started their renewable energy development when the oil prices were increasing in the late seventies, Indonesia officially began to exploit the renewable energy sources in early 1980s. Renewable energy projects are given higher priority in the national energy development plan. However, the implementation of this plan is dependent on: the energy supply and demand situation on each PLN region; the feasibility of the project given the latest energy prices; comparison of price and capacity of renewable energy resources with other sources of energy; and Indonesia’s economic and monetary situation. If Indonesia could promote renewable energy in a larger scale, it will help not only to create cleaner environment, but also to save exportable fossil fuel that will earn more foreign exchange for Indonesia.
Economic growth in Indonesia has been uneven geographically. While the island of Java comprises only seven percent of the total land area, it produces 75 percent of the Indonesia’s GDP, and is home to 60 percent of the population. The city of Jakarta alone, with a population of nine million, generates 36 percent of total GDP. The Indonesian government is encouraging investment outside of Java by establishing special economic zones, including Batam Island near Singapore. Since it was established as a bonded zone in 1978, Batam has attracted investments of over US$5 billion.
Energy Sector Overview Electrical generating capacity in Indonesia grew from 900 MW in the mid-1970s to 15,935 MW in 1996. An additional 8,420 MW are provided by self generation (also called “captive generation”) in private industries. Until 1996, the government supported by the private sector had been able to generate excess supply of generation capacity, and managed to electrify 51.3 percent of all Indonesian households. To further electrify the rest of Indonesian households, transmission and distribution expansions have become the next top priorities. Until the end of the sixth five-year national development plan (REPELITA), electricity demand in Indonesia is projected to grow by 15 to 17 percent annually. This
APEC High Value End-Use Analysis Chapter 3: Indonesia
3-4
growth calls for a doubling of capacity about every five years. At an average cost of US$1,600 per kW for new generation, the cost of this new capacity is expected to be about US$21 billion during the sixth national plan and US$35 billion during the seventh -- or more than US$5 billion per year through 2002. The government is planning to have a total of more than 22,000 MW of installed capacity by the year 2000. Plans for capacity expansion include construction of up to twelve nuclear power plants on Java by the year 2030, to generate 7,200 MW. Construction of the first plant is scheduled to begin in 1998. However, in the last government review of mega-projects on 20 September 1997, this nuclear project no longer appeared on the list.
Table 3.2 PLN Statistics Power Generation Statistics
Source: Statistical Pocketbook of Indonesia 1995. Central Bureau of Statistics (BPS). 1 Based on PLN’s Management Report 4th quarter 1996 There are also numerous projects being planned to develop or expand fossil fuel-fired power plants and to upgrade transmission and distribution systems. The World Bank recently committed US$300 million in credit to the national, state-owned electric utility PLN2 for power sector development. This funding will be used to build coal-fired power plants in Sumatra, Riau, and Kalimantan. A separate US$350 million financing package from the World Bank will help PLN to upgrade its transmission and distribution systems and power system controls. PLN’s Management Report said that in 1996 PLN has increased its power generation by 953.8 MW, while other 5,207 MW power stations still under construction (including private power producers). As a result, PLN’s excess power is getting greater. The unsold power in 1996 is growing to 8,378 GWh from 4,968 GWh in 1995. This situation is common in the early period of power generation expansion. Indonesia is still maintaining low energy prices in order to attract business investment and to allow for low energy prices fro consumers. The positive results of this policy are that business investment competitiveness of Indonesia has increased considerably and secondly, that in the last ten years considerable number energy intensive industries have come Indonesia. 2 Perusahaan Listrik Negara—PLN, Management Report 4th quarter 1996.
APEC High Value End-Use Analysis Chapter 3: Indonesia
3-5
In the beginning of 1969, the oil-fueled power stations accounted for 58% of the capacity generated. This share has declined to 32% of capacity in 1994. The balance has been taken over by natural gas and coal-fired power plants. Hydropower generation capacity has increased 12-fold in 25 years, from 184.8 MW 1969 to 2215 MW in 1994. Geothermal energy was introduced in 1982 and in 1997, the total geothermal power generation capacity is 310 MW. Utilized capacity of PLN’s power stations in the period ended 1996 was 71.7%, in other words they are 28.3% over capacity. This rate of over capacity is normally acceptable in anticipating the growth of future demand.
Table 3.3 PLN’s Capacity, Sources of Electricity Generation,
Production, and Electricity Sold
Generation Beginning Repelita I
(1969)
Beginning Repelita
III
Beginning Repelita V
End of PJP I
(March, 1994)
End of 1996
Power Generation (MW) PLN Generation Total (MW): 541.5 2,536.2 9,082.2 13,128.0 16,605.0
ex PLN 1,638.0 5,343.4 23,491.6 41,674.0 55,183.5 ex Non PLN n.a. n.a. n.a. n.a. 1.748.5
Utilized Capacity n.a. n.a. n.a. n.a. 71.7%
Sources: RUKN-1996, Ministry of Mines and Energy PLN Management Report 4th quarter 1996
APEC High Value End-Use Analysis Chapter 3: Indonesia
3-6
In satisfying the growing demand of electricity in Indonesia, there are three options available to PLN. The first is to maintain the current energy supply and production patterns, the second is to use the best available resources including renewable energy to increase generation capacity, and the third is to combine energy-saving measures with capacity development with cleaner energy resources, such as renewable energy. The third option offers lower operating costs, a cleaner more sustainable development path, and the opportunity to export excess fossil fuel production to improve Indonesia’s balance of payments. This challenge is demonstrated by the fact that the electrification in 1996 in Indonesia had reached 51.3%, and by the end of 1996 PLN had 20,402,017 household consumers, of which 1,293,600 were new rural household consumers. The average consumption of these household consumers is 287 kWh per capita per year. To meet these needs PLN is committed to purchasing power from private independent power producers until the year 2003. Another issue is that the supply growth is far exceeding the rate of expansion of transmission and distribution systems to reach non grid areas. Policy and Legal Framework The Government has been fully aware of the importance of renewable energy development to provide electricity, as well as to reduce oil consumption. The primary means for the renewable energy to make contributions to the energy provision scenario in Indonesia is through the Small Power Producer Scheme (SPP). The Scheme is well known in bahasa Indonesia as Pembangkit listrik Skala Kecil untuk Swasta dan Koperasi (PSKSK), which was instituted by the government and implemented by PLN. Currently, there are over 25 preliminary approvals under PSKSK given by the Directorate General of Electricity and Energy Development (DGEED) – Department of Mines and Energy (DME). The beneficiaries are small companies that will develop small power plant based on renewable sources (geothermal, micro-hydropower and biomass). No approvals have been given to photovoltaics and wind energy thus far. Out of the 25 approvals, there are only two which have signed a Power Purchase Agreement (PPA), and both of these are for biomass-based projects (bagasse and palm oil waste). Among the potential for renewable energy resources being considered (hydropower, geothermal and biomass), there are specific cutoffs defined for eligibility in the PSKSK program. For example, greater than 30 MW for the Java -- Bali grid will be considered as a large IPP, less than 30 MW will fall under PSKSK category. For outside of the Java -- Bali grid , the cut off for PSKSK is under 15 MW. Also in the PSKSK, the government gives higher energy prices for renewable energy power than for conventional fuels. However, since the PSKSK is a new concept, it will take some time for the local private enterprises and cooperatives to be able to take advantage of this incentive. Difficulties for the small companies have been due to:
1. Limited technical capabilities to develop bankable project proposals and to attract equity
2. Inadequate amount of capital
APEC High Value End-Use Analysis Chapter 3: Indonesia
3-7
3. Weak management and negotiation capabilities
Some specific handicaps for renewable energy development are:
1. High price of photovoltaic modules
2. High cost of exploration for geothermal energy
3. Lack of data on local rainfall and water flow of a river for mini-hydropower project
4. Size of individual projects are too small to be considered profitable (e.g., economies of
scale).
In 1994, in order to boost foreign capital investment, the government announced PP 20/1994, which allows foreigners to invest with 100 percent equity ownership in all sectors except for infrastructure and agribusiness. This regulation also minimizes restrictions on foreign takeovers of domestic companies and gives overseas firms more liberty to purchase shares of joint-venture companies. The regulatory changes of 1994 also removed the previous US$1 million minimum for foreign investment. There is currently no fixed minimum investment requirement. Instead, it is determined on a case by case basis. The largest sources of foreign investment in Indonesia are Japan, Hong Kong, the U.S., and the United Kingdom. This has resulted in the increase of approvals for foreign investment in Indonesia, as indicated in the following statistics:
Table 3.4 Approval of Foreign Investment in Indonesia
US$ million
Year 1993 1994 1995 1996 1997*
Foreign Investment Approval (US$ million)
8,142.9 27,353.3 39,944.7 29,928.5 16,426.0
* January – July 1997 only Import duties range from zero percent on raw materials to 200 percent for some motor vehicles. Indonesia imposes an import surcharge ranging from 5 to 30 percent on selected items, including food, chemicals, and pharmaceuticals. Most import items face duties in the range of 10 to 30 percent; less essential goods encounter duties in the range of 50 to 60 percent. There are certain exemptions from duties, administered on a case-by-case, government-sanctioned basis. Indonesia’s foreign investment law restricts foreign investors to the limited liability form of company, designated PT (perseroan terbatas). When a foreign company enters into a joint venture with an Indonesian firm, the result is further known as a PMA company. Licensing is another means that the government has used to promote investment in Indonesia. Once the partner for a joint venture or licensing agreement has been identified, the companies work together to develop their business plan and
APEC High Value End-Use Analysis Chapter 3: Indonesia
3-8
application to the Capital Investment Coordinating Board (BKPM). This agency is very important because it must approve all foreign investments.
Indonesia has bilateral agreements protecting copyrights with some European Union countries (1988), the U.S. (1989), and Australia (1993). Trademarks are valid for ten years from the time of registration in Indonesia and may be renewed for the same amount of time. Patents are issued for 14 years from the time of application and can be extended once for two years. All foreign investments must be approved by the Capital Investment Coordinating Board (BKPM). Exceptions are in the oil, gas, mining, forest products, and financial services/banking industries, where foreign investment must also be approved by the relevant government ministry. Investment projects approved by the BKPM are entitled to certain tax concessions. These may include reduction or elimination of import duties on capital items, such as machinery and spare parts; a tax holiday on imported raw materials; or deferments on the value-added tax, sales tax and income tax.
Tax incentives have been set up for electric power supply by the Minister of Finance in Indonesia. The tax incentives are in the form of exemptions from import duties and/or import surcharges, suspension of taxes related to capital goods, and facilities. These tax incentives have attracted large Independent Power Producers (IPPs) to build electric power projects under power purchase agreements (PPA) with PLN. Indonesia imposes no foreign exchange restrictions, and investors are free to transfer funds abroad. Repatriation of profits, costs related to expatriate employment expenses, loan principal and interest, royalties, technical fees, and capital transfers are allowed without prior permission. Renewable Resources in Indonesia Large Hydropower and Mini-Hydropower Generation In Indonesia, hydropower generation was started in the end of the 19th century when Dutch companies built tea plantations and processing factories in West Java. In the beginning of 20th century, the colonial utility company built two hydropower stations in the Southern part of Bandung. The first large hydropower project was the Jatiluhur Dam built in the 1960s in West Java, followed by numerous other hydropower projects in East Java and North Sumatera. These dams can serve dual purposes of storing irrigation water and generating electricity. The latest contract for a large hydropower project was signed in July 1997, for the 180 MW Asahan I project in North Sumatera. The energy is priced at 0.0739 US$/kWh (for 1-15th year), and .0345 US$/kWh (for 16-30th year), which is among the lowest prices for PLN. Small hydropower development in Indonesia has shown growth over the last 30 years as well. In 1945, 27 units were in place with a total capacity of 33,285 kW. Between 1945-1966 there were 4 units added with a total capacity of 4,440 kW, and between 1969-1994, 42 units were added with a
APEC High Value End-Use Analysis Chapter 3: Indonesia
3-9
capacity of 14,790 kW. Currently there are 10 small hydropower projects fir 24,000 kW of total capacity that are under construction or in preparation. In areas where there are no conflicting interests concerning water use for irrigation vs. electricity, mini-hydropower projects are included in the national energy plan. In the PSKSK (small power developer for private companies and cooperatives) program, mini-hydropower development is given high priority for development. Potential sources of hydropower in Indonesia that have been identified by the Minister of Mines and Energy, and PLN are shown in Tables 3.5 and 3.6.
Table 3.5 Potential Hydropower Resources in Indonesia
Island Number of Locations
Potential Capacity
(MW)
Energy per Year (GWh)
%
Sumatera 447 15,587 84,110 20.9
Java 120 4,200 18,042 4.5
Kalimantan 160 21,581 107,202 26.7
Sulawesi 105 10,183 52,952 13.2
Irian Jaya 205 22,371 133,759 33.3
Bali, and Nusa Tenggara 120 624 3,287 0.8
Maluku 53 430 2,292 0.6
TOTAL 1,210 74,976 401,644 100.0 Source: DGEED – Ministry of Mines and Energy, 1997
Table 3.6 Mini-Hydropower Development Plan
Existing REPELITA VI REPELITA VII
Island Up to July
1995 (MW)
Number of Project
Capacity (MW)
% Number of Project
Capacity (MW)
%
Sumatera 124.25 4 6.02 4.84 22 31.51 25.36
Java - - - - - - -
Kalimantan 11.40 2 0.43 3.77 7 4.33 37.97
Sulawesi 58.81 16 22.65 38.51 15 23.62 40.16
APEC High Value End-Use Analysis Chapter 3: Indonesia
3-10
Irian Jaya 17.31 2 2.40 14.01 5 6.36 37.13
Bali, NTB, NTT
19.98 6 2.53 12.66 9 9.39 48.49
Maluku 2.11 - - - 4 1.89 87.86
Total 233.68 30 34.03 14.56 62 77.10 32.99 Source: DGEED – Ministry of Mines and Energy, 1997
Micro-hydropower development (below 500 kW) is not considered a priority by PLN for grid connection. Therefore, no regulation has been announced for the use of micro-hydropower development. Some non-governmental organizations (NGOs) have been developing micro-hydropower resources, to be sold for small or cottage industry operations, or village lighting with very small revenues. Table 3.6 indicates that mini-hydropower project development in Java is not considered a high priority. The reasons are the fact that the Java – Bali grid has been over supplied until the year 2003, and there is potential conflicting interest on demand for both water between power generation and irrigation. Another barrier for mini-hydropower development is the requirement from PLN that the small power producer should supply PLN continuously for 10 months in one year at above 50% of the agreed capacity to be eligible to get firm capacity price. Some rivers in some islands cannot meet those stringent requirements.
Biomass The first economic use of biomass in Indonesia was in sugar mills in Java, in the beginning of the 20th century. At that time, the biomass was used to fire boilers just to produce heat and steam needed by the sugar industry. In the beginning of the 1960’s the palm oil plantation and industry was following in the footsteps of the sugar mills. Starting in the 1980’s co-generation technology was introduced in Indonesia, in the palm oil and new sugar mills. Until today, all of the sugar mills and palm oil industries are using the biomass power they generate for their own captive power requirements. Biomass in Indonesia (primarily rice straw and husk, or coconut husk and shells) has limitations due to its low heat content and the long distances from the production sites to the power plants. Waste from the timber industry has also disappeared from the list of potential of biomass, due to its higher value-added in the production of particle boards. Currently, there are no large IPPs that use biomass fuel that sell electricity to PLN. Until recently, two sugar mills are reported as having signed a PPA with PLN under the PSKSK program, one in North Sumatera, and another in East Java. Only three industries are still planning to use biomass conversion: sugar mills, palm oil, and integrated pulp and paper production. Geothermal Energy Geothermal energy received higher priority for development by the Minister of Mines and Energy, as indicated by the number of geothermal sites that will be developed. Among the reasons are: each unit of geothermal project can produce a minimum of 10 MW to 55 MW and geothermal power can be developed in stages. Because of the large potential for geothermal power stations, they can offset the
APEC High Value End-Use Analysis Chapter 3: Indonesia
3-11
use of substantial amounts of coal. This coal can then be exported to earn foreign exchange for Indonesia. Total geothermal resource potential is estimated to be around 16 GW of which 310 MW have been developed and are being produced. Work is being done at Gunung Salak (220 MW) and Daradjat (110 MW), West Java, Dieng (95 MW), Central Java, Lahendong (20 MW), North Sulawesi, Sibayak (22 MW), North Sumatra, for a total of 467 MW, and certainly more are planned for the future. Most geothermal power plants are owned and managed by PLN. Private sector participation is invited for investors, contractors, and operators for a period as long as 30 years. The investors apply for a geothermal concession in certain potential area in order to do exploration tests of the potential resources. Based on the findings, the investor will negotiate with PERTAMINA, the state oil company, on the steam price and with PLN on the electricity price, and with Department of Forestry to compensate the forest area that is used by the project. For example, PT Karaha Bodas has signed a 30-year power-purchase agreement with PLN and PERTAMINA. Under this agreement, Karaha Bodas will sell power to PLN at 7.597 cents/kWh for the first 14 years of the agreement, 5.75 cents/kWh for the following 8 years and 5.028 cents/kWh for the last eight years. In many cases, the energy prices agreed had put into consideration the steam cost to be paid to PERTAMINA and the project development cost, both of which were site specific. Until now, most of the geothermal projects in Indonesia are just releasing the waste steam after the turbine generators. Economic use of this waste steam for industrial processing is still under study. Solar Energy Solar thermal energy and solar photovoltaic (PV) technologies have been introduced in Indonesia primarily through BPPT (The Agency for the Assessment and Application of Technology). Solar thermal energy utilization is mostly for the development of solar collectors suitable for solar water heaters and solar thermal pumps, the latter being a mechanical vertical pump driven by a steam engine with organic fluid as working fluid. Through license agreements with foreign companies, local assemblers and manufacturers of solar water heaters will produce more than 35,000 units of equipment per year. However, no study has been done on the marketing aspect of solar water heaters in Indonesia. Household solar water heaters produced by PT Wijaya Karya with 300 liter capacity is sold at retail price at Rp 4,950,000 (or US$2113) before installation cost. The standard 140 liter water heater has retail price of Rp 2,400,000 (or US$1025). The manufacturer provides a 5 years warranty. Solar thermal pumps were successfully tested in the 1980’s. However, due to high cost of the solar collector, the technology did not do well in the markets. Photovoltaic-Solar Home System (PV-SHS) to energize stand alone home lighting, TV and radio sets, or street lighting present a great opportunity for Indonesia. In the last twenty years, photovoltaic technology has been developed to become a suitable power alternative in rural and other isolated areas. Imports of photovoltaic modules and solar cells in 1996 reached approximately US$2 million. In
APEC High Value End-Use Analysis Chapter 3: Indonesia
3-12
Indonesia, after 17 years of experimentation and through various systematic developments, the Government is now implementing a program, called: “one million roofs”. Under this program, each roof will be supplied with one photovoltaic module of 50 Wp , amounting to 50 MWp of solar photovoltaic power generation. This project will be implemented with assistance from the World Bank, the government of Australia, and the government of Germany. Loans will be provided to BPPT for the manufacture, supply, installation, commissioning, warranty, and maintenance of 36,400 PV-SHS. The project is managed under a consortium agreement where the PV modules will be manufactured by Solarex Australia Pty Ltd, PT LEN Industri (Bandung), and PT Altari Energi Surya (Jakarta). The PV-SHS will be installed in nine provinces within East Indonesia. An ambitious World Bank project to install 200,000 PV SHS of 50 Wp each has also recently been initiated. Plans are to install roof top systems on remote village houses in three provinces, namely West Java, Lampung, and South Sulawesi. Wind Energy Wind energy resources are the least developed renewable energy resources in Indonesia. The reason for this is the lack of reliable data to characterize the wind resources. Although people have been familiar with wind turbines for water pumping for quite a long time, wind turbines for electricity are new to Indonesia. Potential sites are found in the eastern part of Indonesia, where some locations have measured mean annual wind speeds in excess of 6 m/s. Indonesian imports of wind generators in 1996 had reached 1,157 units with total value of US$8.9 million. Most of the wind generators came from Japan, Denmark, and Germany. End-Use Sector Analysis and Market Potential of Renewable Energy In 1996, the industrial sector accounted for the majority of electricity consumption, representing 49% of PLN’s sales. The residential sector (houses and apartments) accounted for 34% and the commercial sector (offices, hotels, retail shops) accounted for 11%. Public lighting made up the remaining 6%. The chart below shows the breakdown of PLN’s sales by tariff class in 1996.
Figure 3.1 PLN Electricity Sales by End Users Class in 1996
PLN's Sales in 1996 of 56,932 GWh
Industry49%Public
6%
Residential34%
Commercial11%
APEC High Value End-Use Analysis Chapter 3: Indonesia
3-13
Source: PLN Management Report, 4th quarter 1996 Industrial Sector The industrial sector contributes about 33.2 percent of Indonesia’s total GDP. The largest and most energy-intensive industries are iron and steel, fertilizer, cement, mining, pulp and paper, textiles, and food processing. PLN historically has not been able to meet the demand for electricity from the industrial sector. In response, industries generate their own power, typically using diesel-fired generators. This so-called “captive generation” now amounts to more than 8,420 MW and provides more than 25,000 GWh to industrial facilities annually.3 Electricity End Uses in the Industrial Sector Because motors and compressors are present in most types of industrial equipment, they are by far the largest consumers of electricity in the industrial sector, accounting for roughly 70 percent of consumption. In addition, electricity is used for melting in the basic metals industries, and this accounts for nearly 20 percent of total electric consumption for the industrial sector as a whole.
Figure 3.2 Electricity End-Uses in Industry
Source: “Power Demand Analysis for Java.” Hyundai Engineering Co. 1993.
Lighting and miscellaneous process equipment account for the remaining 10 percent of industrial electricity use (Hyundai Engineering Co. Ltd., 1993). Opportunities for Renewable Energy in the Industrial Sector
3 RUKN, Ministry of Mines and Energy, 1996.
Other Process
3%
Motor Compressor
70%
Lighting7%
Smelting20%
APEC High Value End-Use Analysis Chapter 3: Indonesia
3-14
The biggest opportunities for renewable energy in the industrial sector are in biomass co-generation related to the sugar plantation and mills, palm oil plantations and pulp and paper industries. Because cogeneration plants utilize heat from combustion (which is normally exhausted out the smokestack of a power plant), they are typically 20 to 30 percent more efficient than conventional thermal power plants. A recent study by PT KONEBA identified a technical potential of at least 1,700 MW of cogeneration projects that could be developed for Indonesia by the year 2000. Currently five large industries in East Java have converted their power supply into co-generation and they are offsetting their electricity usage by 529,647 MWh per year. Specific opportunities for the high potential industries are outlined below. Sugar plantations and mills. Sugar mills have been known to produce large quantities of biomass, and hence are suitable sites for conversion of biomass into electricity and/or steam. Sugar plantations and mills in Indonesia are mostly located in the islands of Java and Sumatera. In the last twenty years, sugar plantation areas in Java have been decreasing rapidly due to the rapid population growth in this island and other economic reasons. This has reduced the supply of sugar cane volume to the mills. Most of the sugar mills do not operate more that seven months per year, and this has become a barrier to sell power to PLN on a firm capacity basis. PLN requires a continuous supply of electricity for at least ten months in a year to qualify for firm capacity contract. Despite this, there are plans for eight new large sugar mills outside Java with capacities of 6,000 to 8,000 ton cane per day, and plantation areas of about 20,000 hectares. These mills have good potential to use biomass co-generators to produce excess power for PLN grid connections. For these mills, owners will need to formulate more profitable proposals by including the revenues from PPA with PLN. More important there is a possibility to locate the new mills at optimal locations by taking into consideration co-location and connection to the PLN grid. Palm oil plantations and mills. Palm oil plantations are growing rapidly in Sumatera, Kalimantan and Sulawesi. Some studies on palm oil mills have indicated that a power plant of 7 to 10 MW capacity will supply enough electricity and steam for their own use and they will be able to export electricity. Most important is that many palm oil factories are operating 24 hours per day for 10 months per year. However, there are site specific technical barriers for electricity generation by palm oil factories such as variations in the quality of the fuel supply, distance from the grid, and economies of scale. Therefore, in planing a co-generation project for this type of biomass production, it should be remembered that each plantation area will have different characteristics, and will need to be designed accordingly. Wood based industries. The world’s major pulp and paper producers are located in the US, Canada, Scandinavia, and Japan. In 1994 the total combined output from these countries accounted for nearly 78% of the world pulp. In 1994, Indonesia produced 3% of the world’s pulp supply, at the same time Brazil shared 4% of the total production. The Indonesian pulp and paper industry is growing on the order of 20% per year. It has 65 pulp and paper mills, including non-integrated paper mills that recycle wastepaper with 2.7 million tons of pulp production, and 4.6 million tons paper production. In addition to that, 15 large pulp and paper mills with total capacity of 5,200,000 tons per year are under construction (2 mills will be operational in 1997). Indonesia is in the process of becoming number five among pulp and paper producing countries. The driving force of this high growth rate, is Indonesia’s
APEC High Value End-Use Analysis Chapter 3: Indonesia
3-15
rich tropical forest with heavy rainfall. Most pulp and paper investors believe that the climate is excellent to grow industrial forests that supply pulp materials. Wood-based industries such as saw mills, plywood, particle boards, pulp and paper, have been using wood waste material for the operation of their boilers. Many of the pulp and paper mills could extract pulp material of about 20% to 25% by weight of the timber used in the process. The balance amounting to about 75% to 80%, by weight, will become moisture and other waste materials. Among the waste materials there is some black liquor that can generate power. In the new integrated pulp and paper mills, the use of separated black liquor for energy and steam generation has become a standard practice. From some integrated paper mills that have used this technology, the power generated is almost wholly consumed by the industry itself. However, the decreasing supply of domestic timber, has triggered price increase of construction timber. Wood waste materials are now becoming valuable input for particle board and block board production. In recent developments, the pulp and paper industry in Indonesia has used the most recent or modern technology in their production system. Present energy-saving technologies are not only limited to electricity, but have also put into their target to cover all types of energy available. The pulp and paper industry needs relatively large demand of electricity for 24 hours/day. This, is very important issue to be met by any energy system. In the case of a captive power station, back up of the system is also becoming the responsibility of the industry. Textiles. The textile industry is one of the most developed industries in Indonesia and represents a large opportunity in energy supply changes. In 1994 there are integrated and independent textile industries with a total of 7,000,000 spindles that produce 743,710 tons of spun yarn per year, or equivalent to 3,500 million meters of fabric per year. In this industry, 144 spinning mills are classified as medium and large mills that have potential for energy savings from renewable energy or energy efficiency Many of the textile factories that were built in less than 10 years ago, have the best energy saving technology in their production facilities. However, about 40% of Indonesian textile industries are older than 20 years, some are even worse since they use second hand machinery and production systems that no longer are cost competitive for this industry. In Indonesia’s industrial code there is no special requirement about energy use for textile industry. However, many textile industries are operating in 24 hours per day. Other Industries. There are also numerous opportunities for photovoltaics in the industrial sector in Indonesia. The consumers in this classification pay the purchase on cash, or on installment basis. Industrial applications for photovoltaics include:
(1) telecommunication services and industries (for remote area repeaters) (2) remote logging posts (3) industrial forest plantation (4) palm oil plantation projects (for the plasma farmers) (5) fresh water fisheries (floating nets on big lake)
APEC High Value End-Use Analysis Chapter 3: Indonesia
3-16
Several Indonesian and foreign-funded programs have focused on energy use in the industrial sector, and they have conducted many detailed energy audits and made recommendations on how to save energy in a variety of industries. Based on experience to date, the energy-saving potential in Indonesian industry has been conservatively estimated at 20 percent. But, in spite of the large amount of data that has been collected during the past ten years, only a small percentage of energy conservation measures have been implemented. The delivery mechanisms currently available to help improve energy efficiency in Indonesian industry are predominantly government-sponsored programs. These include the Energy Laboratory of the Ministry for the Assessment and Application of Technology (BPPT-LSDE) and the state energy conservation company, KONEBA. The experience of KONEBA over the past eight years indicates that many industrial companies are reluctant or unable to implement recommendations involving investment in high-efficiency equipment. On the other hand experience of LSDE in the last three years, observes that many profitable business ventures are eager to test and follows their recommendations, provided that each investment has a payback period of less than three years. Some of the barriers to implementing renewable energy projects and improving energy efficiency in Indonesian industry could be addressed through policy measures and government-sponsored programs. There is excellent near-term market potential for the introduction of products and services that increase industrial energy efficiency and enhance overall performance. Co-generation for industrial sector has the potential to address waste reduction issues and on-site energy needs. Residential Sector The residential sector consumes about one-third of all electricity sold in Indonesia. As of December 1996, PLN had a total of about 20 million residential customers throughout Indonesia, 60 percent of whom live on Java. Only two percent of all residential electric customers are in PLN’s top two rate categories (R3 and R4). The other 98 percent of the customers are in the lower rate categories (S1, R1 and R2), which means they have less than 2,200 Watts capacity service.4 Table 3.7 shows data on PLN’s residential customers. Electricity End Uses in the Residential Sector Electricity consumption of low-income households differs significantly from that of high-income households. For low-income households, the most important end uses of electricity are lighting, refrigeration, television, and water pumping. As incomes rise, demand for housing and home appliances will continue to grow. For higher-income consumers, air conditioning is the largest end-use, accounting for 30 percent or more of total consumption. Estimates based on a survey of 1,207 households (in the report “Power Demand Analysis for Java” 1993) suggest that refrigerators account for 23 percent of
4PLN’s Tariff Schedule, October 1994.
APEC High Value End-Use Analysis Chapter 3: Indonesia
3-17
the average home energy bill, followed by air conditioners at 20 percent and lighting at 16 percent. A smaller sample of 652 homes undertaken by PT Arkonin for PLN, which excluded customers from the highest rate class (R4), found that:
• lamps accounted for 33 percent of home energy use • refrigerators accounted for 26 percent • air conditioners, water pumps, color TVs, and electric irons each used 8 to 11 percent.
Table 3.7 Profile of Indonesia’s Residential Customers
residential rate class S1 R1 R2 R3 R4 Total/Ave
Capacity (watts or kilowatts)
< 250 W 250-500 W 0.5-2.2 kW 2.2-6.6 kW >6.6 kW
Revenue yield ($/kWh) $0.03 $0.05 $0.06 $0.12 $0.16 $0.07 Number of customers in Java
147,959 (1.5%)
7,826,387 (82%)
1,463,180 (15%)
93,018 (1%)
28,951 (0.5%)
9,559,495 (100%)
Average use in rate class (kWh/month)
78 59 168 514 1,497 85
Number of customers outside Java
11,893 3,724,894 897,260 23,389 3,294 4,648,837
Average use in rate class (kWh/month)
93 43 124 456 2,052 62
Largest end use in rate class
lighting lighting, refrigerator
refrigerator, lighting
air conditioner
air conditioner
Source: PLN sales data. April 1993 - March 1994. In 1996, PLN has been able to electrify 2,368,473 new residential customers, including 2,017,608 rural residential customers, which means that 85% of the new consumers belong to the residential sector. With progress in 1996, PLN has electrified a total of 20,402,017 residential customers. By the end of 1996, PLN had been able to electrify 51.35 percent of Indonesian homes. However, there are also important distinctions between Indonesia’s urban and rural populations with respect to electricity use. For electrified rural households, lighting, TV, and water pumping are the most important end uses. In urban areas, most electricity is used for lighting and refrigeration. Higher-income urban households also use a large portion of their total electricity for air conditioning. Opportunities for Renewable Energy in the Residential Sector
Increasing Electricity Rates
APEC High Value End-Use Analysis Chapter 3: Indonesia
3-18
The best potential for renewable energy in the residential sector are photovoltaic solar home systems and solar hot water heaters. In addition, large opportunities for saving electricity in the residential sector lies in promoting the use of high-efficiency lighting technologies such as compact fluorescent lamps, and improving the efficiency of refrigerators and air conditioners.
The biggest opportunity in the residential sector for renewable energy is demand for photovoltaic modules and systems for photovoltaic-Solar Home Systems (PV-SHS). Solar home systems to energize stand-alone home lighting, TV and radio sets, or street lighting present a great opportunity for rural areas of Indonesia. Photovoltaic Solar Home Systems were first introduced on a large-scale in 1988, when BPPT installed 80 units of PV SHS at the Sukatani village, with the assistance of PT R & S, a Shell subsidiary. Now this program is being expanded to install one million 50Wp photovoltaic solar home systems, providing for 50 MW of additional photovoltaic power. The impact on the residential sector from this program will be substantial.
Figure 3.3 Electricity End Uses in the Residential Sector
Lighting16%
Refrigerator23%
AC20%
TV9%
Pump8%
Oven7%
Other17%
Source: “Power Demand Analysis for Java.” By Hyundai Engineering Co. for Asian Development Bank. June 1993. A key component of the off-grid renewable energy systems is access to financing and credit mechanisms. Solar home systems cost more than Rp 1 million (about US$426), and the average independent farmers in remote rural areas can only afford to spend Rp 25,000 or about US$10 on monthly energy payments. Anther issue for PV solar home systems is the working capital that the dealer will need to make a viable business. For example a dealer that sells 5,000 units per year at a price US$450 per unit, on four years credit will need US$2 million working capital in the first year or about US$6 million until the fourth year. This is beyond the capacity of a small PV SHS dealer. Strong financial backing from a bank or other lending institution is required. An agent, such as a rural credit bank, a rural cooperative (or KUD), etc. is required to collect on the loans. When the monthly sum of interest and installment is quite large, then a scheme to increase the villager’s
APEC High Value End-Use Analysis Chapter 3: Indonesia
3-19
income will be preferred. In this case, cooperation with a rural credit institution will help the villager to finance working capital that may be needed to improve his rural farming, or small cottage industries. To avoid over-supply of similar products in the local market, thorough sub-district business and marketing coordination is needed. Without proper coordination, the villagers are prone to experience poor business results due to price wars, or demand volume below break even levels because of over-supply of the product to the market. In the World Bank solar home system program, loans are provided to villagers through their small grant program. These loans are typically US$125 per PV-SHS in the areas outside Java, and US$75 per PV-SHS installed in West Java. At the villagers’ level, the loan becomes a rupiah loan of Rp 1,000,000 (US$426) for a period of 48 months with 24% interest rate per annum. Under the scheme, each villager has a monthly obligation to pay Rp 22,820 (US$10) for each installment plus interest to his distributor. The project will be financed by a two step loan channeled through the Bank BNI, Bank Ekspor Impor Indonesia, and Bank Niaga. Direct selling to end users on retail basis is also available through companies such as PT Sudimara, CV Kyocindo Multi Prakarsa, and others who have had considerable financial success. However, under this approach, credit sales will only be done with bank support as much as possible. Solar water heaters were introduced in the 1970s, and since then they have been well accepted as an alternative to produce warm water for household and resort hotel needs. The target consumers are middle to high income households, resorts, hotels, etc. In large cities this equipment has increased its popularity as a household convenience, which is advertised in magazine, newspaper, TV and the yellow pages. Another promising area in the residential sector is potential for future energy savings from improvements in the efficiency of refrigerators and air conditioners. These are the fastest-growing residential appliances, and they also consume the most electricity. There are a range of import duties and taxes applied to imported household appliances, including the largest energy users, refrigerators and air conditioners. It seems that as per 1996, the government has been reducing the import tariff of the energy efficient equipment as well as residential appliances. Under this policy many domestic appliance manufacturers are challenged to compete more intensively even by considering exporting their goods to overseas market. Commercial Sector The commercial sector includes hotels, shopping facilities, office buildings, hospitals, and government buildings. This sector is growing rapidly in Jakarta and in other parts of Indonesia as well (e.g., hotels in Bali, and office buildings in Surabaya, Medan, and on the island of Batam). The newest buildings are inherently more energy-efficient than those built five or ten years ago, simply due to the inclusion of more modern, advanced equipment such as automated controls, central air conditioning, and fluorescent lighting. But many opportunities to save energy are still being missed
APEC High Value End-Use Analysis Chapter 3: Indonesia
3-20
because contracts are won primarily on a least cost basis. Building designers and contractors do not emphasize energy efficiency or reduction of building operating costs. Electricity End-Uses in the Commercial Sector Overall, the commercial sector consumes about 20 percent of the electricity sold in Indonesia. Commercial buildings account for the majority of this consumption, with a small remainder (about one percent of total electricity sales) being consumed for public lighting. Among electricity end-uses in the commercial sector, air conditioning is the largest consumer, accounting for 50-65 percent of total electricity consumption. Lighting is the next largest consumer for the commercial sector, accounting for roughly 20 percent of the total electricity consumed.
In 1992, the national utility PLN sponsored a survey of more than 700 commercial buildings in Jakarta in order to design its pilot demand-side management (DSM) program. This survey confirmed that air conditioning consumes a significant portion (greater than 25 percent) of total electricity in hotels, restaurants, supermarkets, and public buildings. Opportunities for Renewable Energy in the Commercial Sector Electricity prices for commercial customers have risen over the past several years in Indonesia, causing increased interest in energy efficiency and renewable energy. Demand of hotels, resorts and other commercial entities for renewable energy equipment (except for solar water heater) is still small, because most of the guests and visitors are still expecting energy intensive services – beyond the capacity of stand-alone renewable energy systems. Some buildings have changed to higher-efficiency lighting equipment and have taken action to reduce the operating costs of their air-conditioning systems. Most large, new buildings in Jakarta now install building automation systems (BAS). In addition, the trend in new office construction is to use a high amount of exterior glazing. For such buildings, the availability of low-emissivity glass, which allows light but not heat to enter the building would greatly reduce the amount of air conditioning needed to cool the building. There is a demand for photovoltaic systems from several of the Government offices in Indonesia. These include the Ministry Transmigration and Clear Forest Resettlement, Ministry of Cooperative and Small Industry Guidance, Ministry of Health, Ministry of Home Affair and Ministry of Defense. These Government offices. Photovoltaic systems could be used to offset the energy loads from these facilities. Three key commercial sector areas in terms of their energy usage are hospitals, hotels, and commercial buildings, and thus represent large opportunities for renewable energy and energy efficiency. Hospitals. In 1991 to 1994, the number of hospitals increased from 994 to 1039 (i.e., growing by 2.24% per year), and capacity grew from 112,779 beds to 116,847 beds (i.e. growing by 1.79% per year). Among these numbers, 48 hospitals have 300 beds or more, this size of hospital is supported by 200 kW to 1000 kW electricity. The biggest opportunities are for new advanced energy systems and energy efficiency products in the areas of lighting and air conditioning
APEC High Value End-Use Analysis Chapter 3: Indonesia
3-21
Hotels. Hotels represent one of the faster-growing sectors for commercial buildings. According to Central Bureau of Statistics, hotel services in Indonesia are growing significantly with an average growth rate of 4.35% per year in number of hotels, and 7.16% annual growth in the number of hotel rooms. Most hotels are supported by 500 kW or more electricity, and are therefore potential users of renewable power systems or energy efficiency improvements. Figure 3.4 shows end-use electricity consumption for a sample of small hotels (PLN rate classifications H1 and H2) as compared to large hotels (H3).
Figure 3.4 Electricity End Uses in Small and Large Hotels
0% 10% 20% 30% 40% 50% 60%
Other
Elevator
Telecomm
Hot Water
Light
Refrigerator
AC
En
d-U
ses
Small Hotels Large Hotels
Source: “Power Demand Analysis for Java.” Hyundai Engineering. 1993. Adapted by IIEC. Commercial Buildings. Commercial building services in Indonesia includes the services of office buildings, apartments, and shopping centers. In the last four years, office building service in Jakarta area has grown at 17 percent per year, apartment service is growing at 95 percent per year, and shopping centers are growing at 31 percent per year. Commercial building development is expanding at high rates and thus represents large opportunities for renewable energy and efficiency.
Table 3.8 Commercial Building Development at Jakarta Area
Type of Properties 1994 1995 1996 1997 1998
APEC High Value End-Use Analysis Chapter 3: Indonesia
3-22
Office buildings (‘000 sqm.)a 2,550 3,027 3,499 4,095 4,815 Apartments (unit) a 5,236 9,137 19,821 38,821 40,762 b Shopping centers (‘000 sqm.) a 1,002 1,399 1,780 2,260 2,373 b Total a ) For 1996 and 1997 the figures are PT Colliers Jardine’s estimate as written on Kompas
newspaper, 20 November 1996. b ) IIEC estimate based on 5% growth rate per year, due to tight money policy in 1997. With architectural emphasis of various Indonesia’s building designs, the energy consumption may vary widely. Estimates of Indonesia’s commercial building energy services demands are 10 watts to 25 watts per square meter for lighting, and 30 watt to 60 watt per square meter of the building floor space for air conditioning. Much of the potential for improved building efficiency remains untapped for several reasons. First, the developers of buildings have little incentive to reduce operating costs, since they typically do not occupy the buildings. Second, certain types of high-efficiency equipment are not produced locally in Indonesia. Third, even if the equipment is available, it may be prohibitively expensive or difficult to find. And finally, there is a lack of enforceable standards for building construction and equipment performance. The Ministry of Public Works has issued guidelines for new building construction, which encourage the use of high-efficiency equipment, but there is no enforcement mechanism to ensure they are implemented.
Chapter 4.
4-1
PHILIPPINES Introduction The Philippines is comprised of more than 7,100 islands inhabited by 66 million people. These islands span more than 1,851 km north to south and 1,107 km east to west, making this Member Economy one of the largest island groups in the world. 95% of the population resides on eleven of the islands. The topography is extremely varied, with two mountain ranges in Luzon and volcanoes, 21 of them active, throughout the Philippines. The climate is tropical, with some variation in the extent and duration of the dry season. The Philippines had a GDP of US$83.5 billion in 1996, and a growth rate of 5.5%. The region around Manila, accounts for 14% of the population and produces almost one-third of GDP. Income per capita in this region was almost seven times the level in the poorest regions, the four provinces of the Muslim autonomous region in Mindanao. Those living at or below the poverty line were estimated at 41% of the population in 1994, an improvement on the 59% registered at the height of the economic crisis in 1985 (EIU, 1997). The Philippine economy is undergoing profound restructuring and liberalization. Components of this growth include: the elimination of monopolies; the opening to foreign investment; the privatization, wholly or in part, of all government corporate holdings and core services; the easing or lifting of tariff and non-tariff barriers; and the enhancement of tax receipts through simplifying the tax system and widening its reach. Major structural reforms have been introduced or are in the process of legislation or debate. To achieve rapid improvements in their infrastructure the Philippines has used the build-operate-transfer (BOT) contract mechanism extensively. It allows for private sector investment for infrastructure development including road, rail, and electric power generation.
Table 4.1 Key Economic Indicators for the Philippines in 1996
GDP ($ bn) 83.5 GDP growth, at constant 1990 prices (%)
APEC High Value End-Use Analysis Chapter 4: Philippines
4-2
Likewise, the interest rates moved favorably for the increasing economic activities in the Philippines. The Treasury bill (T-bill) rates, which are the principal reference levels for lending declined to record lows. The 91-day T-bill decreased from an annual average of 21.4% in 1991 to 16.1% in 1992. This level further declined to 12.3% in 1993. This year, monthly average rates were as low as 10% as some auctions resulted in single-digit interest rates. With these favorable economic trends, the banking sector and the financial markets in general experienced considerable growth. Liberalization of the banking industry paved the way for the entry of many foreign banks. This resulted in stiffer competition, making available to the consumers better and cheaper financial services. Average bank lending rates declined from 23.5% in 1991 to 19.4% in 1992 and 14.6% in 1993. These levels were even seen at 12.9% early this year as the T-bill rates continued to decline. Reflecting the wide range of resources available in the Philippines, its economy is dive rsified, with manufacturing running just ahead of agriculture, fishing and forestry in its contribution to GDP, at 25-26% compared with 22-23% in recent years, and the services sector contributing around one-third. Although manufacturing contributes more to GDP, and is the source of the current economic recovery, the agricultural sector is of greater importance in terms of employment and ranks higher as a net earner of foreign exchange. While the Philippines produces a wide range of crops and exports a diversity in significant quantities, the agricultural sector is dominated by two crops: rice and coconuts They accounted for 16% and 8% respectively of GDP in the agriculture sector in 1994 The transport and communications infrastructure is inadequate for the Philippines’ requirements, but these areas are a high priority and will be addressed in the current liberalized investment environment. The Philippines continued reliance on imported oil and coal as its primary source of energy puts it in a vulnerable position both in terms of security of supply and prices of fuel. In the early 1990s, the island of Luzon experienced severe energy supply shortages, causing crippling brownouts that lasted 6-8 hours per day. As a stop-gap measure, decisions were made to put up gas turbine systems as well as encourage the use of gasoline and diesel generators by small establishments. While these measures provided relief in the short term, it however only increased further the Philippines’ dependence on imported oil. In the meantime, a new power development program was aggressively pursued, via build -operate-transfer schemes which enabled the government to bring into operation new capacity additions by 1992-93. As the energy situation substantially improved, these new additions to capacity were brought about by either bunker- or coal- fired plants. Projections for continued growth in the coming years, still indicate a dependence on imported fuels. However, the development of indigenous energy resources, particularly renewable energy, is important in achieving energy self-sufficiency. In the Philippines, the need to develop new sources of energy other than the conventional fuel oil has long been recognized. For example, the initial efforts of the government to develop geothermal energy predated the energy crisis of 1973. Biomass cogeneration has been widely used by the sugar industry since the turn of the century. The National Power Corporation (NPC) has been tasked with hydropower development, particularly the large storage hydropower in Northern Luzon and Mindanao. When the energy crisis struck as a result of the Gulf War, the government had indigenous energy alternatives in the wings that became the basis for launching a program toward energy self sufficiency for the Philippines.
APEC High Value End-Use Analysis Chapter 4: Philippines
4-3
Energy Sector Overview The Philippine Energy Plan 1996-2025 projects that over the Plan period, total energy requirement of the Philippines will increase at an annual average of 6.6%, slightly lower that expected average GDP growth rate of 6.9% annually. Historically, energy growth rate has always been higher than economic growth rate. This is true for most developing countries as they extend grid service to rural households in the more remote areas. Energy demand is expected to increase from 219 million barrels of fuel oil equivalent (MMBFOE) in 1996 to 552.4 MMBFOE in 2010 and reaching 1, 392.6 MMBFOE by the year 2025. Renewable energy contributed about 30.9% of the indigenous energy consumption comprised mainly of wood and woodwaste products which were widely used for non-power purposes such as cooking and heating. This demand is driven primarily by substantial increases in fuel requirement for power generation, from 28.3 % in 1996 to over half of total energy requirements or 55% by 2025 ( Table 4.2 ). Future efforts of the DOE will be geared towards the development of untapped indigenous resources in order to further enhance the nation’s energy supply self-sufficiency. The DOE projections indicate that however over half of the nation’s energy for power generation will still come from imported coal (52%) and oil (17%) by the year 2025. The Energy Plan targets to sustain self-sufficiency levels of at least 40% over the planning period, however, this level of self-sufficiency is expected to come mainly in the form of natural gas (9.8%), geothermal (9.5%) local coal (9.2%), and hydropower (8.4%) resources. Renewable energy sources are expected to contribute only 15.4% of total energy mix by the end of the planning period. (Table 4.2) Comparatively, therefore, between 1995 and 2025, self-sufficiency level is not expected to improve over the years but is in fact declining from 44% in 1995 to 41.2% in 2025. Demand for electricity is projected to increase by 12% between 1996-2000, 8.9% between 2005-2015 and 6.9% between 2015-2025. This declining rate of increase could be due to the impact of energy efficiency and DSM programs, and decreased demand from the grid due to the self-generation of electricity by industries. Efforts to utilize more indigenous energy resources in the Philippines will lead to a higher usage of new and renewable energy sources. The Philippines Department of Energy (DOE) projects that demand for renewable energy will increase from 61.9 MMBFOE in 1996 to 214.4 MMBFOE in 2025, accounting for about 15% of the total energy supply mix. A significant portion of this demand is projected to come from woodwaste, accounting for 44.2 %. 33.1 MMBFOE (15% of the demand) will be from wind, solar and ocean energy and 7.3 MMBFOE from municipal waste.
Table 4.2 Projected Energy Mix (In Million Barrels of Fuel Oil Equivalent, MMBFOE)
APEC High Value End-Use Analysis Chapter 4: Philippines
Power Use 62.00 100.87 173.64 265.31 412.47 585.43 765.68 Oil Share In Power Use, % 41.57 30.96 18.41 17.95 16.46 16.47 17.01 Self Sufficiency, % 43.72 41.87 47.40 42.75 41.25 40.55 41.25 Policy and Legal Framework Policies and Regulations
APEC High Value End-Use Analysis Chapter 4: Philippines
4-5
The Philippine Energy Plan of the DOE (1996-2025) provides the long-term perspective of the Member Economy’s needs in the context of on-going economic and structural reforms. The Energy Plan aims to attain the three-pronged goal of availability of energy supply; competitive, affordable, and reasonable energy prices; and socially and environmentally compatible energy infrastructures. The following policies are to be pursued:
• Enhance energy self-sufficiency through continuous exploration, development and exploitation of indigenous energy resources;
• Diversify sources of both local and imported energy while ensuring balance between cost and security;
• Pursue large-scale utilization of new and renewable energy sources; • Provide reliable and efficient supply of electricity and petroleum products, both being the
major forms of energy more widely used by the different sectors; • Promote the judicious conservation and efficient utilization of energy; • Encourage greater private sector investment and participation in all energy activities; • Promote the adoption of environment- friendly energy systems; • Integrate social and environmental concerns in the planning and implementation of
energy programs and projects; and • Develop energy information system for planning and decision-making processes.
Major strategies and programs to accomplish these go als include:
• Intensified exploration and development of indigenous energy resources; • Utilization of natural gas for power generation; • Privatization of energy companies/agencies to rationalize and improve operational
efficiency; • Full deregulation of the downstream oil industry; • Implementation of demand-side management (DSM); and • Rationalization of electricity prices.
The Power Development Program is designed to meet the future energy requirements based on the national economic growth targets for the Philippines. Within the Plan period (1996-2025) therefore, projects totaling 92,138 MW are targeted to be onstream. Firmed commitments for projects between 1996-2005 total 12,978 MW while additional capacity additions for the ensuing years are expected to come from: coal (8,660 MW); gas (6,500 MW); geothermal (5,115 MW); large and small hydropower (4,732 MW); and renewable energy (3,947 MW). In the area of rural electrification, improvement of access to electricity services in the rural areas, particularly those in isolated and low- income provinces identified in the President’s Social Reform Agenda remains a major focus. Energy supply targets set forth in the Plan include: 100% municipalities by 1996; 100% barangays or villages by 2010 and (hopefully) 100% of potential households by 2018. Figures from the National Electrification Administration (NEA), the national agency mandated to pursue rural electrification, shows that as of 1996, 98% of municipalities, 69% barangays and 59% of potential households have been energized. The strategy for implementing electrification will continue to focus on extension of the grid for areas
APEC High Value End-Use Analysis Chapter 4: Philippines
4-6
in the mainland and providing diesel generators for island grids and island provinces. This goal will require substantial government subsidies in order to be achieved. The latest Philippine Energy Plan, as in the past, manifests a strong support for the development and use of indigenous energy resources including renewable energy. Despite favorable policy statements, the utilization of renewable energy is hindered by technical, structural, policy and market constraints. Specifically, these include lack of a strategic development plan targeted at renewable energy technologies; lack of information on success stories on the use of renewable energy technologies for specific applications; price distortions due to subsidies for conventional fuels; continued emphasis on large-scale projects; unclear rules and regulations; immature markets for independent power produced from renewable energy; and uncertainties related to changes from the deregulation of the power markets. An important piece of legislation in the Philippines is the “Omnibus Power Industry Act of 1997” which is currently being deliberated in Congress. This Act is expected to mandate the deregulation and privatization of the energy and electric power sector as well as expand the roles and opportunities of the private sector in the supply of energy services. It is not clear if the Bill will encourage private sector investments in renewable energy. Certain provisions of the bill, such as the requirement for distribution utilities to enter into 10-year power supply contracts with NPC, are seen as having a limiting effect on the future market for renewable energy projects. This Bill refocuses the executive branch’s attention into the renewable energy sector by establishing new entities dedicated to renewable energy development. As the government restructures the energy sector to be more market-based, “subsidies” to renewable energy projects are not mentioned. The DOE’s current approach appears to be focused on localizing technology with a view to reducing costs, with promotion of ocean, solar and wind energy. The Board of Investments (BOI) is a government agency responsible for the promotion and facilitation of foreign/local investments into the Philippines. In this role, BOI provides incentives for private sector participation in energy infrastructure. It has provided incentives for all large-scale Independent Power Producers (IPPs) under the program of the National Power Corporation. These incentives are in the form of tax exemptions (e.g., income tax holidays, no duties on certain imports, and no taxes on certain exports), tax credits (e.g., on domestic capital equipment and raw materials), and additional tax deductions. Other non- fiscal incentives related to the terms of employment of foreign nationals, simplified customs procedures and other measures have been important in spurring development of local industries. One demonstration of the government’s commitment to developments in the energy sector lies in its efforts to improve the business climate and provisions regarding investment in the Philippines. Priority business activities (such as fossil fuel power plants) are given fiscal incentives The same incentives are applicable to renewable energy projects, however no significant renewable energy project has been granted fiscal incentives in recent years. The National Power Corporation (NPC) remains to be the largest power market in the Philippines, and therefore independent power producers (IPPs) must compete with NPC for power purchase contracts, making it somewhat difficult for renewable energy power because they tend to be much smaller projects. Another hindrance is that there are no standard terms and
APEC High Value End-Use Analysis Chapter 4: Philippines
4-7
conditions for power contracts. Hence project opportunities are unclear and appear to be high risk. Early in 1997 NPC put forth an “Invitation to Buy Power from Energy Power Producers” that would allow NPC to buy 50 MWs of power from renewable energy projects provided they meet the prices set for each technology. This window of opportunity was seen as a positive development that would encourage project developers to do more renewable energy projects, however the solicitation was withdrawn. Projects are required to seek accreditation by the DOE before they can be eligible for incentives under the Investment Priority Program of the Board of Investments. Before any accreditation is given, DOE requires that a power purchase agreement be agreed upon. On the other hand, NPC, likewise requires that one should first have a DOE accreditation before it can grant a power purchase agreement to a project. This process may also impede the development of renewable energy projects. Mini-hydropower projects have the advantage of having its fiscal incentives specifically defined by law, Republic Act 7156 (“RA 7156” or the “mini-hydro law”). This law provides tax incentives related to capital equipment (domestic and imported), land-use, electric power sales, etc. Despite these incentives, mini-hydropower development in the Philippines has been extremely slow. Only two Operating Contracts have been issued in the last six years. Through the Special Economic Zone Act of 1995, the Philippine Economic Zone Authority (PEZA) was empowered to promote industrial development by carving out areas (with a minimum size of twenty-five hectares) for industrial development. Such areas are eventually developed by private parties which take responsibility for putting in place all infrastructure according to a development plan approved by PEZA. The PEZA Board has full franchising authority for all infrastructure facilities within its economic zones (“ecozones”). The PEZA provides the following fiscal incentives (Section 23 of the Peza law): PEZA-registered enterprises are given similar incentives to those enjoyed by BOI-registered enterprises; tax credits for exporters using local materials; and no taxes (local and national) shall be imposed on business establishments operating within the ecozone. Renewable energy projects, if feasible, may locate within ecozones and take advantage of the above incentives. These incentives also apply to manufacturing plants for renewable energy products. The DOE is initiating the establishment of a solar photovoltaic manufacturing facility within the Philippines. A logical site for such facility should be one of the existing or proposed ecozones. Government Agencies Aside from DOE, the NEA and PNOC also have their own renewable energy units. NEA does hydropower and solar projects through its Alternative Energy Development Department while PNOC implements research and development on renewable energy and project financing through its Energy Research and Development Corporation subsidiary. Department of Energy
APEC High Value End-Use Analysis Chapter 4: Philippines
4-8
In the Philippines, the DOE is the central point of the institutional framework charged with the planning and coordination functions for the whole energy sector. The DOE is charge of the overall mandate to prepare, integrate, coordinate, supervise, and control all plans, programs, projects and activities of the Government relative to energy exploration, development, utilization, distribution and conservation. The DOE is responsible for the Philippine’s long-term energy plan. The promotion of renewable energy is a function of the DOE under its Energy Utilization and Management Bureau (EUMB) which also takes care of energy efficiency and environmental management. The EUMB is one of DOE’s 3 Service Bureaus. National Power Corporation (NPC) The NPC is a non-stock corporation wholly owned by the Republic of the Philippines. The power generation function is still currently controlled by the NPC though there are already IPPs generating power and selling their outputs to NPC. The NPC owns and operates all transmission facilities and is also responsible for the dispatch of power to 3 power grids and non- integrated island grid systems. NPC sells power to power distribution companies composed of 17 private operators, 119 electric cooperatives and 9 municipal/provincial systems. Aside from these, NPC also serves some 150 customers who are directly connected to NPC’s power 69 kV transmission lines. The NPC is an attached agency of the DOE and up until 1986, it operated the Philippines’ power generation and transmission grids as a virtual monopoly. In 1986 opened up the power generation sector was opened up to independent power producers (IPPs) which were allowed to develop projects under the build-operate-transfer (BOT), rehabilitate-operate-maintain (ROM) and other variant schemes. By 1994, IPPs accounted for almost a third of the total generating capacity of the NPC. As a continuing drive to improve the efficiency of the energy sector, a move to privatize the operations of the NPC is now being deliberated in Congress. As the NPC moves towards privatization, it is envisioned that a new government institution to take charge of NPC’s “missionary” electrification activities will be created. This agency, currently known as the Small Power Utility Group (SPUG) will carryout the task of providing power to various small islands and remote provinces. While the current trend is for the SPUG to put up diesel power generating plants, there is now a move by SPUG management to encourage IPPs that would go into the development power projects using indigenous energy sources, such as renewable energy. Energy Regulatory Board The ERB is a quasi- judicial body that performs regulatory control functions over the upstream and downstream industries within the energy sector. Power distribution function is regulated by the ERB, including rate setting for power and petroleum products. Philippine National Oil Company (PNOC) The PNOC is another government-owned and controlled agencies t hat is attached to the DOE. It is in-charge of the exploration and development of energy resources, particularly geothermal resources.
APEC High Value End-Use Analysis Chapter 4: Philippines
4-9
The Development Bank of the Philippines (DBP). The DBP is a government-owned development bank has special divisions dedicated to financing and catalyzing projects. The DBP can support economically disadvantaged groups whose projects have distinct social benefits, show management competence and financial viability. There is also the Special Financing Program For Solar Power Projects in the Countryside. This is in support of the government’s rural electrification programs in sparsely-populated, remote rural areas which still remain unelectrified. Interest rates for the solar facility is 15% per year with 3% rebate on prompt payment. National Electrification Administration (NEA) The NEA was created in 1969 as a government corporation charged with the task of pursuing rural electrification through the establishment and supervision of rural electric cooperatives. Today the NEA has supervisorial control over 119 electric cooperatives throughout the Philippines which distributes power to some 4.3 million rural households. It provides both technical and financial assistance to these cooperatives for the erection and operatio n of power distribution lines within the cooperatives’ franchise areas. Like NPC, the NEA is an attached agency to the DOE. National Economic and Development Authority The highest planning body which coordinates the preparation and implementation of the national economic and development plans. All projects requiring government investments require the approval of NEDA. Department of Environment and Natural Resources (DENR) The DENR regulates and monitors the use of the Philippines’ natural resources. It is charged with the function of evaluating projects relative to their environmental impact and has the authority to approve environmental clearance certificates for energy projects. Philippine Council for Industry and Energy Research and Development (PCIERD) The PCIERD is a government research planning and policy-making body attached to the Department of Science and Technology. It is mandated to serve as the central agency in the planning, monitoring and promotion of scientific and technological research for applications in the industry, energy, utilities and infrastructure sectors. It has the authority to specify national research and development goals, draw corresponding plans and policies, and set priorities in its delineated sectors. Renewable Resources in the Philippines The Philippines is richly endowed with vast resources that can be harnessed to provide for the Philippines’ growing energy requirements. Among these are renewable resources such as solar, wind, hydropower, geothermal and biomass. Despite the effort to utilize these resources, none of these resources are at the moment being exploited to anywhere near there full potential. Hydropower
APEC High Value End-Use Analysis Chapter 4: Philippines
4-10
The Philippines has considerable experience in the use of hydropower for electricity genera tion, and it is among the most used renewable energy technology in the Philippines. Hydropower projects are classified into three categories, based on their capacities namely; i) micro-hydropower systems are those with capacity ranging from 100 kilowatts and below; ii) mini-hydropower systems are systems with capacity of 101 kW to 10 MW; and iii) small and large hydropower are classified as having capacity of 11 MW and greater. Small and large hydropower systems are considered conventional energy systems, thus, only mini- and micro-hydropower systems are included in this study. As of 1996, the total installed capacity of hydropower was 2,304 MW. Large hydropower has the biggest contribution accounting for 2,062 MW followed by small hydropower at 109 MW and mini-hydropower with 133 MW. Based on the National Energy Plan, this contribution to the national energy mix is expected to increase further to 7,065 MW by the year 2025. There are vast numbers of potential mini-hydropower sites in the Philippines. The DOE inventory of potential sites list some 60 sites with approximate potential capacity of 112 MW. Preliminary investigation and pre- feasibility studies have already been completed for each site. An additional 1,145 MW are also potentially availab le from sites identified by the NEA. On the other hand the potential for micro-hydropower systems is estimated at 27.8 MW from about 436 sites. These systems are good for application in decentralized agro-processing activities, such as grinding and rice milling, and for electricity generation. The national policy focusing on large-scale renewable energy has to some extent limited the development of mini-hydropower in spite of its vast resource potential. The Philippine Energy Plan for 1996-2025 includes the development of 3,283 MW from small and large hydropower whereas only 1608 MW is planned from mini-hydropower. However, mini-hydropower systems are well-suited for rural power applications. In fact, because of the growing concern for the environment, most host communities prefer the development of mini-hydropower and micro-hydropower systems as opposed to small and large hydropower systems which require the construction of large dams. Mini-hydropower which uses run-of-the river systems are therefore the most acceptable for most local communities. Mini-grids for smaller islands and remote communities using mini-hydropower by distribution utilities is very promising. At the moment, the Cagayan Electric Power and Light Company (CEPALCO) is developing a 7 MW mini-hydropower plant harnessing the potential of the Bubunawan River located within its franchise area. At least three more mini-hydropower plants are also being planned by the same company in partnership with other investors. A number of electric cooperatives have also identified hydropower sites in their franchise areas which they are interested in developing. For hydropower development, water use permits are issued only to companies with 60% Filipino ownership. As many foreign companies require majority ownership before they invest, this requirement then becomes a limiting factor. On the other hand, a number of non-governmental organizations (NGOs) are now active in the development of micro-hydropower projects for communities. The leading ne twork of NGOs in this endeavor is Sibat (Sibol ng Agham at Teknolohiya) which has implemented a number of micro-hydropower projects located mostly in the Mountain Province of the Northern Philippines. Currently, efforts to expand the capacity of Sibat to undertake more projects are being pursued
APEC High Value End-Use Analysis Chapter 4: Philippines
4-11
through a request for financing support from such agencies as the Global Environment Facility (GEF) through the United Nations Development Programme(UNDP). Other NGOs working with DOE’s Affiliated Non-Conventional Energy Centers (ANECs) are also into micro-hydropower development efforts with small communities. Solar Photovoltaics The use of photovoltaic technology in the Philippines was initiated in the mid 1980’s beginning with a demonstration project in Bulacan implemented by the Office of Energy Affairs and supported by the German Technical Assistance Agency (GTZ). The project’s objective was to demonstrate the technical viability of using photovoltaic systems for electrification. Based on lessons learned from that project, the first attempt to disseminate the technology was started in Burias Island in June 1987. The first phase of the project was a demonstration of the various application of the technology, including solar home systems (SHS), solar refrigeration, video cine, radio, battery charging station (BCS), and solar photovoltaics for an electronic repair shop. The commercialization phase followed soon after in 1988 wherein some 100 photovoltaic solar home systems were distributed to members of the San Pascual Masbate Solar Power Corporation with financing from the Development Bank of the Philippines (DBP) at 13% interest rate per annum. In 1991, NEA in cooperation with the GTZ, pilot tested the dissemination of SHS through the electric cooperatives using the concept of pre-grid electrification, whereby the systems were treated as an alternative means of delivering electric services to remote communities until such time that a grid extension can be put up. Each household provided with a SHS is charged a monthly service fee on a flat rate basis. From this pilot project, the Photovoltaic Rural Electrification Project of NEA was established. As of 30 June 1997, NEA has recorded the total of 1,770 SHS installed all over the Philippines equivalent to 109,690 Wp. A number of local firms in the Philippines are involved in systems integration, design, installation and distribution of photovoltaic systems and products. Most of the products, especially photovoltaic panels are imported from countries such as the US, Australia, Germany and Japan. There is some local capability in the manufacturing of balance of systems (BOS) and solar batteries. As of June 1997, the DOE has inventoried some 3,462 photovoltaic and solar thermal installations. SHS equipped with 1 module (between 50 and 75 Wp), a 100 Ah Battery, a 10 A control unit and e PL lamps (11 W, including inverter), complete with cables, switches, panel support, transport and installation may cost PhP18,000 to PhP26,000, or US$563 to US$812. A typ ical solar pump using 18 modules to pump water at a suction head of 3 meters would cost approximately US$10,490. Solar Thermal. Another type of solar application is the domestic solar water heaters (SWH) which have been commercially available in the Philippines for several years now. The domestic type of SWH is used primarily to provide hot shower and bath in individual households. A SWH with one panel of about 20 square feet (1.85 sq. m.) of collector area is able to supply enough hot water (approximately 25 gallons/day at 135o F).
APEC High Value End-Use Analysis Chapter 4: Philippines
4-12
DOE inventory of SWHs show that of the 434 applications inventoried, 313 are found in Metro Manila, and 74 are in Cebu City. For SWH, cost per unit is US$3,032/300 liters. A study conducted in 1995 using SWH for a 34 room hotel would require an investment cost of approximately US$6,240. Payback period was computed at about 2.9 years. Wind The application of wind energy systems for power generation in the Philippines is now in the advanced pilot stage. Wind turbine generators have been considered as immediate options for electricity generation. With new innovations, the technology is now considered more durable and efficient. As such, the government is initiating a program to commercialize the technology. Possible applications include power/battery charging stations and water pumping. Wind mapping surveys are currently underway to determine the wind energy potential in the Philippines. Based on a DOE-ANEC 1997 report on monitoring of renewable energy systems that have been installed by provinces/municipalities there are 448 wind installations throughout the Philippines which in total, contributed 243,000 cubic meters of wind energy. Most of these projects are for water pumping for irrigation and potable water supply and some battery charging stations. Various wind pump manufacturers located in Central Luzon and the Visayas region are supplying this equipment. A local manufacturer distributes three types of wind pumping systems, one designed for drip irrigation, small size poultry or piggery farms, or communal water systems; another is suited for medium size poultry or piggery farms, fishpond, village water supply or golf courses; and another is designed for municipal water system, commercial piggery or poultry operations, rice farm irrigation or cattle farming. The National Power Corporation (NPC) in cooperation with PCIERD has completed wind monitoring at 6 sites in Ilocos Norte, Cuyo Island, Basco Batanes, Catanduanes and in Guimaras Island. A 10 kW wind turbine pilot plant has also been installed in Pagudpud, Ilocos Norte. This pilot plant is providing electricity for 20 households in that area. The NCED-DOE has conducted pre-feasibility studies for wind potential in Masbate Island, Mountain Province, Panay Island, Masinloc, Palawig and Iba, Zambales, Burgos and Pagudpud, Ilocos Norte. Of the sites investigated, priority locations were identified in Malinta Masbate, for 10 windmills at 50 meters height which can harness 3.7 kW of power and generate 30 MWh of energy per year and San Salvador Island, Zambales for 5 windmills at 30 meters height which is estimated to generate as much as 4.1 MWh of power per year on a continuous daily operation. With the baseline information soon to be in place, it is expected that medium- to large-scale projects could be developed in the Philippines which can directly contribute supply to the grid. Besides this, some private sector entities have also been developing small wind projects on their own using local technology. For remote area application, especially for use in small villages, these types of systems may work well to bring basic energy services to these areas. Wind/diesel hybrid systems are also an option especially for small remote islands where diesel generators are available but are operating with heavy government subsidies.
APEC High Value End-Use Analysis Chapter 4: Philippines
4-13
Biomass Utilization of biomass involves the direct burning and thermal conversion of agri-waste materials such as rice hull, bagasse, wood wastes, coffee hull, coconut husk, coconut shell for power generation and drying. Energy from biomass resources constitutes the largest contribution of renewable energy to the total energy mix in the Philippines. Technologies range from the use of bagasse for cogeneration, rice/coconut husk dryers for palay drying, gasifiers, to use fuelwood and agri-waste for oven/kiln furnace and cookstoves for cooking/heating purposes. As of 1996, the DOE estimates that biomass, particularly bagasse, coconut residue, ricehull, fuelwood and charcoal contributed some 72.366 MMBFOE to the total energy mix. The increasing cost of conventional fuels for industrial and other petroleum products and their potentially decreasing availability in the future, has led to the possibility of using indigenous resources like rice hull, bagasse, coffee hull, coconut shell and other biodegradable materials as source of heat energy to produce power. In the Philippines, these resources are also used as fuel for grain drying. Utilization of these resources will significantly reduce dependence on imported oil as well as secure a continuous supply of energy. Data and statistics from various government agencies gave an optimistic picture of biomass supply in the future. Using these statistics the DOE projects that aggregate supply of biomass will grow from 132.8 MMBFOE in 1996 to 288.4 MMBFOE in 2025 (Table 4.3) Contributors to this aggregate biomass supply potential are woodwastes, bagasse, coconut and rice residues, animal wastes and municipal wastes.
Table 4.3
Supply of Biomass Energy Sources (In Million Barrels of Fuel Oil Equivalent)
APEC High Value End-Use Analysis Chapter 4: Philippines
4-14
Municipal Wastes 3.89 4.38 5.03 5.69 6.39 7.11 7.85 Total
132.78
146.24
165.84
189.04
216.61
249.39
288.44
Source: Department of Energy A joint report of UNDP and World Bank Energy Sector Management Assistance Program (ESMAP) also estimated that agricultural residues in the Philippines from sugar, rice and coconut could produce as much as 90 MW, 40 MW and 20 MW respectively, of excess power for export to the grid. However, the drawback to these types of communal plants is that the resource is highly dispersed thereby resulting in high logistical costs involved in gathering and transporting the hull from their source to the plant site. Fuel supply availability therefore becomes a critical factor in the selection of site and overall packaging of the project. Aside from simple household applications, there is the opportunity to produce electric power form rice hulls, use rice hulls for crop drying, and bagasse for cogeneration. Communal rice hull power plants may be used to convert the waste to energy. One large project (35 MW) is planned for Bulacan, and 13 other potential areas in the Philippines have been identified. In addition, on-site power production for large rice millers is also a possibility. The utilization of rice husk can displace conventional fuel for drying and at the same time solve the waste disposal problem of rice millers. The use of bagasse by sugar millers as fuel for their power and process requirements provides great opportunities for biomass power. Cogeneration projects offer the sugar mills the opportunity to reduce costs for power and dispose of the waste. However, the cost for retrofitting the sugar centrals with state of the art equipment will be substantial. Costs for boilers and turbine generators for 17 plants have been estimated to range from US$75 million to about US$105 million. But, it is also expected that the sugar mills will be able to recover their capital costs from savings on waste disposal as well as revenue generated by the sale of power to the grid. Biogas Biogas technology is already in the commercial stage in the Philippines. It is most suitable for areas where highly biodegradable wastes are in abundant supply, such as in piggeries and cattle-fattening farms. These systems minimize the odor and pollution hazards posed on the environment while at the same time present a good opportunity for electricity savings when used for power generation. Likewise, liquid wastes from alcohol distilleries have also been treated using biogas systems to a very important by-product, the methane gas. The commercial use of biogas technology in the Philippines began in the early 1970’s when the Maya Farms, an agro- industrial division of the Liberty Flour Mills, Inc. developed the technology for use in its livestock farm. The farm covers 40 hectares of land with a population of about 60,000 heads of hogs and several hundred heads of cattle. It has successfully operated for many years recycling farm waste to energy for lighting, refrigeration, running generators and
APEC High Value End-Use Analysis Chapter 4: Philippines
4-15
various other equipment, breeding piglets, water pumping, running its feedmill as well as for use in its heat scalding tanks and cooking vats. Another farm that has successfully implemented the biogas technology for power generation is the Jhon and Jhon Farm, Inc. located in Binangonan Rizal with a capacity of 3,000-5,000 sow level. At the cost of Php 2.2 Million, the farm invested in a biogas digester to treat pig waste and generate gas to fuel the farm’s water pump motor and electric generator for air conditioners at their boar house and farrowers’ building. Savings from fuel cost per month amounted to Php 25,000. As of June 1997, DOE has monitored the existence of 459 units of biogas systems nationwide. Most of these installations are located in Regions III and IV where one finds the concentration of hog and poultry farms. Based on the Departme nt of Agriculture estimates for 1996, potential energy from animal waste is 11.86 MMBFOE. On the other hand, municipal waste is also expected to contribute some 3.89 MMBFOE for the same year. Over 70 swine breeders/importers comprise the hog raising industry alone. These farms, and particularly those located along the Laguna Lake (near Metro Manila) are considered to be the best potential market for biogas technology. Commercialization of medium-to large-scale biogas technology, including sales and installation of turn-key plants plus the provision of after-sales monitoring, operation and maintenance services is being pursued by a private sector entity. Hog farmers will use the biogas technology for complimentary purposes of waste treatment and energy production. This fits well with the requirements of the hog-raising industry which is required to comply with environmental standards. The cost of developing biogas technology would definitely vary depending on the type of technology applied and the specific circumstance of a particular farm. Typical costs would range from US$99,590 for a 5,000 sow level pig farm to US$430,000 to a much larger farm of say, 25,000 sow level. Similarly, payback periods will vary depending on the use for the outputs of the biogas project. It is always encouraged that the system should be used as a pollution-mitigation device as well as energy production system. Geothermal The development of geothermal resources for power in the Philippines started in 1979 with the development of the Tiwi (330 MW) and Makban (330 MW) Geothermal Projects. To date there are 12 geothermal plants in the Philippines. The steam produced from these plants are sold to NPC for conversion to electricity. Total capacity of these plants is 1,783.23 MW, making the Philippines the second largest geothermal power producer in the world. Compared to other countries harnessing geothermal energy, the Philippines has by far the highest share of geothermal energy in the power generation mix. Local geothermal power plants have the best record of availability (at around 70% compared to the next best which is coal at around 60%) in the NPC power system. Together with hydropower, geothermal is the Philippines top source of indigenous fuel. According to the energy plan, some 4,895 MW of geothermal capacity is expected to be installed within the next 30 years. It may be noted , however, that because of the high cost of developing
APEC High Value End-Use Analysis Chapter 4: Philippines
4-16
these resources, the majority of developers have concentrated on the large-scale (20 MW and higher) power generation systems. To date, DOE has identified 41 sites, of which PNOC-EDC is currently developing 8 sites under a service contract agreement. While large-scale geothermal energy development is considered cost effective, there is good potential for developing small geothermal projects as decentralized source of power or for non-power applications. Developers have identified a number of areas where low enthalpy geothermal projects may be developed. These areas are well-suited for small-scale geothermal projects for crop drying purposes, refrigeration, salt making, and similar economic activities to support the government’s rural development objectives. Technological breakthroughs have also paved the way for use of excess heat from separated fluids of large plants which can be utilized for the same purpose before they are injected back into the ground. Taking advantage of these possibilities will pave the way towards the development and use of low temperature and marginal geothermal resources and increase the use of geothermal energy. The geothermal development policies define a 60/40 sharing of net proceeds between the government and steamfield developers beginning on the first year of commercial operation. The developer is allowed full cost recovery of pre-operating and operating expenses to the extent of 90% of gross receipts. This production sharing regime is modeled after the oil and coal development schemes and has proven to be a major barrier to the entry of other developers and further development of local geothermal resources. End-Use Sector Analysis and Market Potential of Renewable Energy Industrial Sector The manufacturing sub-sector is of considerable importance to the economy, ranking slightly above agriculture in its contribution to GDP. The sector developed rapidly during the 1950s and 1960s. There was marked growth in industries assembling consumer goods, which were initially heavily dependent on imported components, although many components are now produced locally. The government launched a programme in the early 1980s to develop the Philippines’ intermediate and heavy industrial base through a number of industrial projects in which it was prepared to participate. A copper smelter, a chemicals complex, a phosphate fertilizer plant and a low- range diesel engine factory were set up and the cement industry was expanded. Despite the development of the intermediate goods sector, the structure of manufacturing is still heavily weighted towards the production of consumer goods. The industrial and commercial sectors are projected to increase its level of renewable consumption by an average of 6.7% annually. The use of bagasse by sugar centrals shall increase from 5.9 MMBFOE in 1996 to 29.1 MMBFOE in 2025. Likewise, there will be expanded utilization of biogas systems in livestock facilities such that the use of this resource is expected to increase to 5.5 MMBFOE by 2025 from .3 MMBFOE in 1996. ( Table 4.4)
APEC High Value End-Use Analysis Chapter 4: Philippines
4-17
Table 4.4 SECTORAL DEMAND FOR RENEWABLE ENERGY
(In Million Barrels of Fuel Oil Equivalent, MMBFOE)
1996
2000
2005
2010
2015
2020
2025
Household 50.75 55.84 62.99 70.95 80.02 90.86 105.16 Industrial/Commercial 11.20 13.94 20.00 28.14 39.08 53.73 73.65 Grid Electricity 0.00 0.37 1.10 4.456 6.94 17.89 35.55 TOTAL 61.95 70.14 84.08 103.55 126.04 162.48 214.36 1To be mixed with conventional generation Opportunities for Renewable Energy in the Industrial Sector The biggest opportunities for renewable energy in the industrial sector is biomass co-generation related to the sugar and rice hull industries and rice hull drying. Because co-generation plants utilize heat from combustion (which is normally exhausted out the smokestack of a power plant), they are typically 20 to 30 percent more efficient. Bagasse Cogeneration. Most sugar mills are already using bagasse cogeneration. However, the process is mainly done for waste disposal purposes, rather than electricity production. There is therefore a need to encourage more sugar millers to consider cogeneration for supply of electricity to the grid. As of December 1996, national production of bagasse by-product was about 6.4 million tonnes. These products are being utilized by sugar millers as fuel for their power and process requirements. Cogeneration projects offer the sugar mills the opportunity to save costs in terms of its power requirements as well as disposal of bagasse waste. In 1994, a study conducted in 17 sugars mills, funded by PCIERD and European Economic Communities (ECC) for the DOE and the Philippine Sugar Millers Association, Inc. (PSMAI), revealed that some 81 to 101 MW of power can be generated by sugar mills upon improvement of their current operations toward the use of more efficient technologies. Hence, the need for increased efficiency in the current operations, including installation of new, more efficient equipment will be a positive factor for implementing cogeneration for export of power to the grid. While the projections appear very substantial, there are however some constraints to the successful implementation of bagasse co-generation projects. One constraint is that there is intermittent production from these plants because sugar mills only operate for half the year, which could be a problem if the plants were to rely only on bagasse as fuel. However, it is
APEC High Value End-Use Analysis Chapter 4: Philippines
4-18
believed that these constraints are not impossible to overcome. The possibility of using local coal during the off- season has been proposed to the DOE and may be considered. The coal-bagasse hybrids use bagasse for a large portion of the year and maybe coal or bunker fuel to supplement fuel supply during off-milling season. Most of the mills are willing to consider the projects for as long as they do not shoulder any of the pre- investment costs of the projects. Thus, despite the above constraints, it is felt that bagasse cogeneration is a big area of opportunity that will prove profitable in the long-run. Ricehull-fired Power Plants. Rice hull, a major by-product of rice millers which causes disposal problems has a big potential for waste fuel for energy conversion. Based on National Food Authority data, about 12,150 rice millers all over the Philippines annually produce roughly 2.5 million of rice hull. Large -scale (35 MW) are being planned in Bulacan, and it has a standing power purchase agreement for the power that will be produced. Also it is possible to develop communal plants (3-5 MWs) wherein fuel supply will come from rice mills within a local area. Aside from communa l power plants, large rice millers may also opt to establish their plants for self -generation purposes. According to a DOE survey conducted in 1991, there are some 46 rice millers producing an average of 500 kgs to 1 MT of ricehull per hour. That level of output would be able to support between 200-800 kW ricehull power plants. The last option of self-generation is appealing because of the minimal risk associated with the fuel supply and through the power purchase agreement either the miller uses the power for its facility or the plant will sell power to the grid. Rice Hull for Crop Drying. Small and medium size rice millers all over the Philippines require mechanical dryers. These dryers are either diesel- fed, kerosene- fed or ricehull- fed. With a heating value of about 3,000 kcal/kg, ricehull makes for a satisfactory heat source for drying. Equipment for ricehull dryer are available locally through a number of fabricators. Biogas. The growing concern for the environment and the increasing cost of electricity are factors that would lead to faster adoption of biogas technology by the hog and cattle raising industry. The covered lagoon-type of digester which is cheaper and more flexible than the overhead digester is more well-suited to local conditions. The only setback is that more land is required for the lagoon type system, and as land value in the Philippines is increasing some areas are considered more valuable if converted for real estate property development. The entry into the market of companies such as Philbio which can provide both the technical expertise and financing for projects would allow biogas technologies to penetrate the market. Replication of projects may be expected as soon as one or two plants are actually set up and operating successfully. Solar for Telecommunication. Photovoltaics are already being used in the telecommunications industry and there is more opportunity on the horizon. The Philippines is a growing economy and telecommunication is one of its top priority infrastructure requirements. Local telecommunication companies are expanding by installing relay stations all over the Philippines in order to provide strong signals in the remote areas which requires sufficient and reliable power to operate their equipment. They are planning to use solar photovoltaics for their relay stations located in the remote areas. They are obliged to utilize other sources of energy because of
APEC High Value End-Use Analysis Chapter 4: Philippines
4-19
increasing fuel prices and its difficulty to transport fuel supply especially to the remote mountainous areas. Potential for this end-use application are large because at present there are 157 telecommunication facilities, 10 public repeater system operator, 12 public coastal stations, 70 radio telephone operators and 3 Very Small Aperture Terminal (VSAT) operators nationwide. Photovoltaics would be the most attractive and economical alternative source of energy for these facilities. Moreover, photovoltaic systems provide an advantage in that it does not need the constant presence of a technician to operate. The Department of Health is looking to expand the use of photovoltaics for their repeater stations in various remote villages in the Philippines. Residential Sector The largest demand for renewable energy will come mainly from the residential sector which is projected to increase its demand from 50.75 MMBFOE in 1996 to 105.16 MMBFOE in year 2025. This sector is expected to consume 90% of total woodwaste demand for cooking, heating, lighting and other household purposes. Biogas utilization by the household sector is also expected to increase as more biogas systems are installed. The use of ricehull and coconut residue is however expected to decline in the residential sector because of its preferred use for power generation purposes. Opportunities for Renewable Energy in the Residential Sector Solar Home Systems. The use of solar home systems and battery charging stations, especially for remote area applications are gaining increasing acceptance both by end -users and electric cooperatives. Currently almost 41% of the Philippines rural population remains without access to the power grid and are not able to enjoy the benefits of electrification. These people are located in 11,164 remote barangays with an estimated 3.05 million households, characterized as widely dispersed and having low load density. Such characteristics render the high investment cost for line extension to these areas as basically uneconomic. Hence, it is unlikely that these areas would be serviced by the grid in the near future. The only hope for electrification therefore is through off-grid power systems such as solar home systems or solar battery charging stations. NEA has identified potential targets for rural electrification using solar photovoltaics. From 1998 to 2035, the total potential capacity to be installed is 67,900 units which is equivalent to 5,092 kWp, which will require a sizable investment. In addition, a Village Power Fund is currently being conceived to provide financing assistance to village/community organizations which may want to undertake renewable energy power projects such as solar projects for their communities. The NEA plans to achieve 100% electrification of the potential 10.2 million households by 2018 and an additional 889,912 households by 2025. A study conducted by GTZ in 1995 estimated that there is a potential of 50,000 households which can be successfully electrified with solar home systems (Stryk, 1995). This is based on the conservative assumption that electric cooperatives which are to implement this program will stick to the standard of requiring a cluster of 20 households per site prior to photovoltaic electrification. An additional demand of 75,000 households is possible with better information dissemination among the neighboring villages and
APEC High Value End-Use Analysis Chapter 4: Philippines
4-20
replication within the electrified site itself. Compared with grid extension, the cost of electrification for these areas using solar is estimated to be far below the investment requirement for grid extension. The DOE-NCED has formulated plans to realize 30,000 SHS by the year 2000. Together with the DOE, Cooperative Development Authority and the Development Bank of the Philippines, the Philips company together with Shell Solar plan to install 15,000 solar home systems in Northern Luzon (Region 1-4). Under this project, beneficiaries would enjoy a 60% subsidy on the imported hardware costs of their system, funded by the Dutch government. There is some concern with the practice of extending subsidies to the end-user because it will directly compete with private sector activities and eventually destroy the market for solar home systems.
Aside from NEA and the electric cooperatives, a number of other projects are also currently being implemented for solar systems in the residential sector. These include the Belance Solar Project, a DOE initiated project with subsidy support from the Dutch government and loan from the DBP. It aims to provide 200 solar home systems to residents of Belance, a remote village in Nueva Viscaya through the St. Joseph Multi-Purpose Cooperative. Moreover, photovoltaic system integrators and distributors are likewise implementing photovoltaic projects in many parts of the Philippines as part of their regular sales programs. Solar hot water. Solar water heating for domestic household use can be an important end-use in the residential sector. Solar water pumping. Photovoltaic power for pumping for irrigation and potable water purposes is not yet a widely-used application however it has some potential in the Philippines. The Office of the President, using its special fund for social development has ordered 25 units of photovoltaic water pumping systems for installation in remote communities. The DOE-NCED was supported by the GTZ in a project that installed some 15 water pumping systems with a total capacity of 21 kWp. However, the economic feasibility of potable water projects in general is not clear and depends on local conditions e.g. presence and depth of the subsurface water table. Commercial Sector The commercial sector includes hotels, shopping facilities, office buildings, hospitals, and government facilities. This sector is growing rapidly in the Philippines and thus represents great opportunities for renewable energy. Opportunities for Renewable Energy in the Commercial Sector Solar power. Photovoltaic power can be very important in this sector in rural areas. For example, through the Municipal Solar Infrastructure Project, there will be approximately 1,000 photovoltaic systems cons isting of photovoltaic water supply systems, photovoltaics for refrigeration and lighting for health centers and photovoltaics for public school building and other educational facilities installed. Beneficiaries of this project are 387 barangays located in seven of the poorest provinces of the Philippines. Using this project as a model, other regions of
APEC High Value End-Use Analysis Chapter 4: Philippines
4-21
the Philippines could be provided with sustainable energy systems for their basic public sector services. Remote district hospitals, rural health units, community centers and communal water supplies are the biggest potential for communal solar power applications. There are altogether 631 government hospitals nationwide. Moreover, about 11,000 of government-run health centers are located in off-grid communities. The Office of the President which is currently implementing its solar pumping project plans to expand and increase dissemination of solar systems. It is planning to allocate PhP 20 million (US$625,000) in additional funds for this purpose. Other photovoltaic applications include communal battery charging stations, photovoltaic powered vaccine refrigerators, photovoltaic-powered incubators (for hatcheries), photovoltaic powered streetlights and photovoltaic -powered fishpond aeration systems. Other applications in these areas include solar to power distillers for potable water supply, and refrigeration for the fishing industry. Solar water heaters. Commercial solar thermal water heaters can be used by hotels, resorts, restaurants and some industrial establishments. Hotels, resorts and housing condominiums, to name a few, use hot water for bathing, washing and laundry. Several commercial solar water heaters have been installed since the 1980s. Most of these applications are found in urban centers, such as those installed in Magellan International Hotel, Cebu; Cresta Ola Resort, La Union; Magnolia Dairy Plant, Quezon City, Valle Verde Country Club, Celebrity Sports Plaza, & Alabang Country Club. Large restaurants can also be potential markets for these products. Laundromats and laundry service centers may also require solar water heaters for their hot water requirements. The Hotel and Restaurant Association of the Philippines lists about 328 members. Moreover many laundry service centers within the Metro Manila area which could all be potential users of solar water heaters. Solar for Navigation. In order to improve the safety of navigation at sea, the Philippine Coast Guard plans to increase the number of photovoltaic-powered lighthouses. Current lighthouses have each approximately 50Wp installed on a pole which its intermittent light signals at night (e.g. port/harbor entries). Likewise, the Philippine Air Force is looking at the possibility of using solar to power the runway lights of their airstrip in the Pag-asa or Freedom Island in the Spratlys group of islands where the Philippines keeps a military outpost. Electricity Supply Sector For large impact in the electricity supply sector in the Philippines, most of the contribution will be from geothermal, biomass, and hydropower. As mentioned previously, most of these systems will be large-scale in order to make large contributions to baseload power generation. However, there is also opportunities for smaller-scale applications that would have potential for commercial implementation in the near-term. This include mini-hydropower, wind, and small-scale geothermal.
APEC High Value End-Use Analysis Chapter 4: Philippines
4-22
Mini-hydropower. In terms of commercial applications, mini-hydropower is the most cost-effective. There are an extensive number of potential sites for development. Paybacks are well within the range of hurdle rates set by the banks. Moreover, there is a growing market especially as the Philippines gears toward privatization of the power generation. Be they connected directly to NPC or as a decentralized plant connected with a distribution utility, the prospects of are good for mini-hydropower plants. Laws and regulations to encourage the development of mini-hydropower would need be established. These could include developing new guidelines for environmental clearance for smaller systems; simplified permitting processes; standard contracts and appropriate rate structures for mini-hydropower systems; and improved information dissemination among developers and financing community Wind. Wind energy is considered a good business opportunity in the medium term. With a number of site monitoring just completed, possibilities for wind farms have been discovered. Aside from wind farms, it is also possible to work on smaller wind projects either for self-generation or as decentralized energy systems for remote areas. Another possibility is the use of wind for water pumping purposes as well as wind/diesel hybrid systems for the small islands. Small-Scale Geothermal. On a much longer-term, small-scale geothermal for power as well as non-power use is seen to have good potential. Identification of resource potential is still needed. along with use of technological advances that have been made in other countries to foster development.
Chapter 5.
5-1
UNITED STATES Introduction The United States occupies the central region of North America and has a total area of 9.37 million square kilometers. The United States has a population of 265 million people. Gross domestic product was $7576 billion in 1996. In terms of contribution to the GDP, the services sector dominates the U.S. economy accounting for 66% of the GDP in the U.S. This is followed by the industrial sector, which contributes 23% and the transportation sector at 8.7% and agriculture at 2%. The U.S. economy has been performing very well in recent years according to all conventional economic indicators, and it is suggested that this trend will continue. Unemployment has dropped to below 5%, and income growth remains rapid. Consumption is also being boosted by strong growth in personal wealth, mainly through the buoyant stock market. The momentum will likely be tempered by the modest rise in interest rates that is occurring, which will gradually impact the economy. In 1996 real wages rose by only 0.4% and unemployment averaged 5.4% of the labor force. In 1997 it is expected real wage growth to be about 1.4% in the manufacturing sector and about 1.5% across non-farm industries.
Table 5.1 Key Economic Indicators in the U.S. 1992 1994 1996 GDP, $ billion 6,244 6,936 7,576 GDP growth % 2.7 3.5 2.4 Consumer price inflation % 3.0 2.6 2.9 Population, million 255.0 260.4 265.3 Current account $ billion -61.4 -148.2 -165.9 Exports, $ billion 440.4 504.6 612.8 Imports, $ billion 536.5 669.2 799.2
Source: Economist Intelligence Unit, 1997 Energy Sector Overview As of 1995, the U.S. energy consumption was 90.465 Quadrillion Btu (Quads) of which renewable energy comprised 6.832 Quads, or 7.5 %. More than half of the renewable energy consumed is from hydropower, and the remaining from wind, geothermal, biomass, and solar resources. Although the contribution of renewable energy is relatively small, it is projected to grow because of the declining
APEC High Value End-Use Analysis Chapter 5: United States
5-2
costs, increased awareness of the benefits to the environment of clean energy and the interest in diversifying the energy portfolio. The United States renewable energy program was initiated in 1973 as a result of the quadrupling of energy prices and the need to investigate alternatives for meeting the growing energy demand. During the 1970s, an extensive number of measures were put in place to expand the federally-supported renewable energy program of the U.S. Department of Energy including basic and applied research and development, demonstration projects, commercialization, and information dissemination. Market incentives such as business and residential tax credits, and legislative statutes were put in place to create new markets and support the development and utilization of the technologies. However, from the early 1980s until 1990, spending on renewable energy steadily declined and since then support has generally increased over the years to a level of $216 million for research and development in 1997. Recent energy projections predict that annual growth of energy consumption will be on the order of 1% per year, leading to total energy consumption of 108 Quads by the year 2010 of which 7.25 Quads is the projected consumption from renewable energy sources (EIA, 1997). If a more innovative approach to energy consumption were taken for instance by increasing the use of renewable energy resources and energy efficiency measures, it would lead to more energy savings, pollution reduction, and decreased consumption of conventional fuels. In this scenario, overall energy consumption would be reduced to 89 Quads and the contribution from renewables would be 13 Quads, double the more conservative estimates (Energy Innovations, 1997). Demand for energy for electricity generation is expected to grow relatively slowly from current levels of 33 Quads to 39 Quads by the year 2010, of which 4.4 Quads (about 12.2%) is expected to be produced from renewable resources. This is not significantly different from the current level of 11.9% of electricity generation from renewable energy, and thus demonstrating that it is expected that there will be only modest increases in electricity generation from renewable energy in the U.S. As expected, the largest increases will most likely be in generation from fossil fuels (natural gas, coal, and oil). Although the contribution of renewables will remain fairly constant, the distribution of the types of renewable energy resources used will change. As mentioned previously, hydropower dominates the renewable energy supply portfolio in the U.S. however the U.S. Department of Energy predicts that hydroelectric capacity is expected to grow very little over the next ten years, losing some of its relative share, while electricity generation using other renewable resources, particularly municipal solid waste and geothermal, will grow more rapidly (EIA, 1993). Although consumption of renewable resources in the U.S. is primarily for electricity production (3.44 Quads), other key sectors play a role as well. The demand for renewable energy in 1995 in the residential, industrial, and transportation sectors were .705 Quads, 2.578 Quads, and 0.105 Quads, respectively (EIA, 1996). In the most recent Department of Energy projections, the use of renewable energy in the transportation sector is projected to grow significantly in the coming years--doubling by the year 2015, whereas the residential sector is expected to see a decline in the use of renewables. The reason for the increased use of renewable energy in the transportation sector is because of environmental and energy legislation to spur the use of alternative fuels and discourage the use of
APEC High Value End-Use Analysis Chapter 5: United States
5-3
gasoline and oil. Advanced technologies for transportation include vehicles powered by electricity, fuel cells, and natural gas. The industrial sector (mainly related to manufacturing activities) is expected to grow by a moderate amount, a 38% increase from 1995 consumption levels. Petroleum refining, chemicals, and pulp and paper are the largest end-use consumers of energy for heat and power in the manufacturing sector. Of course, it is important to note that these projections do not reflect changes in technology that cannot be foreseen. Policy and Legal Framework There are four key statutes that relate to renewable energy and their role in energy supply, distribution, transmission, and the environment. Public Utilities Regulatory Policies Act (Public Law 96-917) Possibly the single most important event in the 1970's creating a market for renewable resources in electric power was the passage of the Public Utility Regulatory Policies Act of 1978. This law requires electric utilities to purchase power from “qualifying” non-utility producers, specifically including small facilities using renewable resources. PURPA exempted qualifying facilities from some Federal and State regulations imposed on electric utilities that produced power from renewable resources. Under PURPA, the Federal Energy Regulatory Commission (FERC) established rules requiring that electric utilities purchase power from windfarms and other small power producers at an "avoided cost" price based on energy and capacity costs that the utility would otherwise incur by generating the power itself or purchasing it elsewhere. However, to receive avoided cost payments, each facility must file for, and obtain, qualifying status from FERC. Coupled with public expectations of generally rising electricity costs and other interests in renewable energy for security and environmental reasons, the PURPA requirements encouraged the more rapid entry of renewable resources into the electric power market. The Energy Policy Act of 1992 (Public Law 102-485) This comprehensive law passed in 1992 affects virtually every part of the U.S. energy markets. As a result, the law has both direct and indirect effects on the Nation's use of renewable resources for electric power supply. Provisions related to renewable energy include the establishment of a permanent 10 percent investment tax credit for solar and geothermal projects and the establishment of a 1.5 cent per kilowatt-hour production tax credit or payment for electricity produced from the use of wind or biomass (from crops dedicated to energy use) in plants brought on line before July 1, 1999. A facility may earn the credit or payment for 10 years. The Department of Energy is authorized to assist demonstration and commercialization projects using renewable resources, and authorizes a range of actions to encourage growth in exports of technologies using renewable resources. The net effect of these provisions should be to encourage expanded use of renewable resources.
APEC High Value End-Use Analysis Chapter 5: United States
5-4
Other parts of the legislation, while designed to improve the efficiency of energy markets overall, may or may not result in increased use of renewable energy resources. The law sets higher energy efficiency standards for some classes of buildings, motors, lights, and commercial and industrial equipment. These standards will reduce the growth in energy demands, also including demand for renewable resources. The law also encourages alternatives to renewable energy. It reforms the nuclear power plant licensing process and promotes the development of advanced nuclear power plants. It encourages environmentally-sound uses of coal, streamlines the regulation of oil pipelines, and promotes the use of natural gas. In addition, this law exempts some classes of electricity generating firms from regulation as public utilities and increases access to electricity transmission networks by electricity producers other than electric utilities. These exemptions are generally viewed as favorable to renewable energy sources, but as favorable to their fossil fuel competitors as well. The Clean Air Act Amendments of 1990 (Public Law 101-549) The Clean Air Act comprises a series of related programs designed to protect health and the public welfare from emissions polluting the ambient (outdoor) air. Comprehensive amendments to the Clean Air Act (CAAA), enacted on November 15, 1990 (P.L.101-549), included a new program to control acid rain, new standards for emissions of hazardous air pollutants, new requirements for motor vehicles, and stringent new requirements for improving urban air quality. The amendments also require State and local air quality agencies to help implement the Act. Air pollution sources are also required to respond to new and more stringent requirements. Polluting facilities must obtain permits, conduct monitoring, and add pollution controls or change production processes to further reduce emissions. One of the important provisions of the CAAA was the establishment of nationwide limits for SO2 and Nox. The SO2 reduction policy involved a market-based approach whereby there were unrestricted emissions allowance trading under a nationwide cap. The goal is to reduce SO2 emission by 50% of 1980 levels by 2000, to an annual cap of 8.954 million tons of SO2 beyond 2000. Thus far this program is quite successful with costs of SO2 allowances much less than predicted. The mechanism for reducing emission of Nox has yet to be implemented by the U.S. Environmental Protection Agency. The goal outlined in this law is overall emission reduction of 2 million tons by 2000. The reformulated gasoline (RFG) program has been one of the most contentious parts of the CAA. The Act requires that cleaner-burning reformulated gasoline be sold in the nine areas that have the worst ozone pollution. Another controversial aspect of the RFG program is a rule that was issued requiring that 30 percent of the oxygen used in reformulated gasoline comes from renewable sources, such as ethanol. The rulemaking was intended to increase ethanol's share of the RFG market relative to other oxygenates such as MTBE, a methanol-derived ether oxygen used in RFG. The Intermodal Surface Transportation Efficiency Act of 1991 (ISTEA, P.L. 102-240) This law authorizes funding for several transportation options. ISTEA empowers states and metropolitan planning organizations to decide how options and funding should be selected in order to comply with EPA's Clean Air Act provisions and with regulations of the Federal Highway
APEC High Value End-Use Analysis Chapter 5: United States
5-5
Administration. Several of ISTEA's provisions allow spending on renewable energy and energy conservation in transportation system design and use. The goals for the national transportation system include energy conservation and reduced air pollution. ISTEA creates options to use renewable energy through programs that help reduce air pollution and traffic congestion through alternative fuels, mass transit, and other measures including support for bicycle and pedestrian infrastructure. New technologies such as fuel cells and alternative fuels are promoted through this legislation. ISTEA provisions for better planning and more flexible funding to the states can help with land-use issues and infrastructure investments. This law is currently being considered for re-authorization in the U.S. Congress. Government Agencies The Department of Energy (DOE) was created in 1977 as part of the nation's attempt to deal with the oil price shocks of the 1970s. It is the primary government agency that supports research, development, and demonstration of energy technologies, including renewable energy, energy efficiency, fossil energy, clean coal technology, nuclear energy, and fusion energy sciences. The renewable energy and energy efficiency programs at DOE focus on developing sustainable energy supply options, reducing energy requirements, improving energy services, and enhancing environmental quality. The sectors included in their programs are the utility sector, buildings sector, transportation sector, and industry sector. The Administration places priority on renewable energy and energy efficiency as the flagship of the nation's effort to establish a sustainable energy economy. It cites continuing oil import vulnerability and environmental problems of air and water pollution and climate change as a rationale for sustainable energy. The mission of the Office of Energy Efficiency and Renewable Energy (EERE) is to "work with our customers to lead the nation to a stronger economy, a cleaner environment, and a more secure future by developing and deploying sustainable energy technologies that meet the needs of the public and marketplace.". To fulfill its mission, EERE pursues several renewable energy technology programs, including buildings, photovoltaics (PV), solar thermal, biopower/biofuels, wind, geothermal, small hydropower and supporting system technologies such as hydrogen and energy storage. By the year 2000, DOE's hopes to: (1) reach 700 MW installed photovoltaic capacity and reduce cost from 20 cents/kWh to 10-15 cents/kWh, (2) reach 530 MW installed solar thermal capacity and reduce cost from 17 cents/kWh to 8 cents/kWh, (3) reach 9,200 MW installed biopower capacity, (4) reach 6,700 MW installed wind capacity and reduce cost from 4-5 cents/kWh to 2.5 cents/kWh, (5) reach 3,000 MW installed geothermal capacity and reduce cost from 5-8 cents/kWh to 3.5 cents/kWh. DOE also aims to reduce biofuels production costs from $1.22/gallon to 90 cents/gallon.
APEC High Value End-Use Analysis Chapter 5: United States
5-6
End-Use Sector Analysis and Market Potential of Renewable Energy Transportation Sector The transportation sector accounted for 27% of the total energy consumption in the U.S. in 1995 and is projected to increase by 33% between 1995 and 2015 (EIA, 1996). The largest contribution to the growth in total energy use is in the increased energy use for air transport, which is projected to grow by 57% by the year 2015. In terms of fuel usage in the transportation sector, it is dominated by petroleum fuels (distillates, jet fuel, gasoline, liquefied petroleum gas, and residual fuels), accounting for over 96% of the fuel consumed in the U.S. This high rate of consumption of petroleum fuels contributes to 77% of the carbon monoxide, 45% of Nox, 38 % of volatile organic compounds, 27% of fine particles, and 32% of CO2 nationwide (Energy Innovations, 1997). Gasoline is the largest sub-sector, consuming 14.7 Quads in 1995 and the Department of Energy projections for 2015 is 17.1 Quads of consumption in 2015. The high level of consumption for gasoline in the Department of Energy projection is due to the assumption of continued low fuel prices and slower pace fuel efficiency gains for the vehicles. Although alternative fuels such as compressed natural gas, ethanol, and methanol are all projected to show significant growth over the next 20 years (19-23% per year), their overall contribution will remain relatively small unless more aggressive policies and market incentives are adopted. With more innovative approaches to development of alternative fuel vehicles and efficiency, their share in the fuel supply mix will be increased.
Table 5.2 Transportation Sector--Energy Use by Mode (Quadrillion BTU per year)
Source: Appendix A, Energy Information Administration, Annual Energy Outlook, 1997 Economic growth is closely tied to increases in transport because of the need for reliable and efficient transportation for goods and services that are produced. This correlates directly with increases in freight transport and trucking, which consumed approximately 25% of the total transport energy. However, passenger travel was much larger--accounting for about 70% of the total energy consumed in the transportation sector (EIA, 1996). The primary end-use mode in the transport sector is light duty
APEC High Value End-Use Analysis Chapter 5: United States
5-7
vehicles, which includes passenger cars and small trucks. Table 5.2 gives the basic indicators of end-use in the transportation sector. Passenger travel has increased over the past twenty years due to changes in economics, demographics, and land-use patterns. Lack of incentives for developing new infrastructure for mass transit and fostering markets for smaller, energy efficient vehicles is spurring the increased consumption. The increases in air travel have been due to lower costs of air travel and corresponding increases in personal incomes. In addition the declining price of jet fuel will drive the increases. Despite improvements in efficiency and increased awareness of the environmental effects of vehicle emissions, the U.S. still consumes over 36% of the world’s share of energy for transportation (OTA, 1991). In addition oil production figures in the U.S., indicate that the economy is becoming increasingly dependent on imports. The Department of Energy estimates that supply of domestic petroleum will decline from the current level of 9.83 million barrels per day to 8.63 million barrels per day in 2015. Whereas imports of petroleum will continue to contribute a larger share of the total petroleum supply, growing from 46% (7.89 million barrels per day) to 61% (13.46 million barrels per day). These figures not only indicate the increasing vulnerability of the U.S. economy to price and supply volatility but also the increasing threat to the environment from growing demand for fossil fuels. Opportunities for Renewable Energy in the Transportation Sector There is great promise for the increased use of renewable fuels in the transport sector. The current options for alternative fuels that are renewable include ethanol, methanol, electricity, and hydrogen. It is important to note that the current low gasoline prices and the lack of an infrastructure to support AFVs are important issues that will restrain the growth of alternative fuel vehicle industry. Although not renewable, the largest subsector for alternative fuels usage in vehicles are gaseous fuels, such as compressed natural gas vehicles (CNG) and liquefied natural gas (LNG). These are important because they use natural gas, which is a cleaner fuel. Federal and State legislative mandates have helped to spur development and sales of alternative-fuel vehicles (AFVs). Sales of these types of vehicles have dominated the market, however the Department of Energy projects that after 2005 there will be much larger sales of electric and alcohol fueled vehicles due to more stringent emissions standards that are expected to be enacted at the state level. The Department of Energy projects that total AFV sales will reach approximately 1.6 million units, or 8.9 percent of all vehicle sales, by 2015. Of the total sales of AFVs, 42% will be from gaseous fuels (CNG and LNG), 32% from electric vehicles, and 26% from alcohol fueled vehicles. A brief description of the various renewable fuel options will be discussed below. This material is from a recent much more comprehensive report on the status of renewable energy technologies in the U.S. (OTA, 1995). Methanol. Methanol is an attractive alternative because of the ease with which vehicles could be adapted for its use or it could be used in advanced propulsion vehicles (e.g., fuel cells). Biomass is converted into methanol using a high temperature process to gasify, clean, and compress the cellulosic biomass. Feedstocks for this process could be wood residues or municipal solid waste. Costs for
APEC High Value End-Use Analysis Chapter 5: United States
5-8
methanol produced from biomass has been estimated at $14 per gigajoule or $1.85 per gallon of gasoline. The benefits offered by using methanol from biomass are lower emissions, higher fuel efficiency, and because of the biomass usage it will provide a significant CO2 benefit. Ethanol. Ethanol is similar to methanol in that it can be produced from biomass and can be used in conventional internal combustion engines. In the U.S. the primary feedstock is corn, however cellulosic feedstock is now also being used. The emissions related to ethanol use are similar to methanol with the exception that it can give rise to slightly higher levels of ozone. Usually ethanol is mixed with gasoline in order to reduce emission of carbon monoxide. The cost of ethanol is approximately $16.5/gigajoule, which is equivalent to $2.15 per gallon, considerably higher than methanol. Hydrogen. One of the most promising fuels in the transportation sector is hydrogen for use in internal combustion engines or in fuel cells. Producing hydrogen by electrolyzing water using electricity generated from renewable resources or through gasification of biomass can result in elimination of carbon monoxide, hydrocarbons, and particulates. Recent advances in fuel cell technology and hydrogen production have led to significant developments by U.S. auto manufacturers of fuel cell vehicles. Costs to produce hydrogen from renewable energy electricity are still very high, twice to three times more expensive than methanol or ethanol, however biomass-derived hydrogen is comparable in cost. The infrastructure required for large-scale development of hydrogen-fueled vehicles is a significant barrier to fuel cell vehicles. Electricity. Battery-powered electric vehicles are currently being developed by several automobile manufacturers in the U.S. and overseas, and sales of electric vehicles are projected to increase dramatically over the next 20 years, from almost zero currently to more than 500,000 units by 2015. Electric vehicles have the potential to make significant impacts on the transportation sector because of their zero emissions and the ability to use existing infrastructure. Although the vehicles themselves produce no emissions, a key factor to consider is the source of the electricity. If the electricity is produced in a coal fired power plant, then the emissions will be substantial, whereas if renewable energy is used to produce the electricity the net emissions will remain at zero. The characteristics of the battery are a key factor in the vehicle performance. Areas of technology improvements in batteries include energy density, power density, longevity, recharging time, and weight. Other key issues with electric vehicle market penetration is their high initial cost and operating costs. A breakthrough for electric vehicles was recently announced in the U.S. related to the use of fuel cells that are driven by gasoline. As mentioned above, a fuel cell is powered by hydrogen to produce electricity, however the barriers have been how to produce hydrogen cheaply and how to develop the new infrastructure required. Using this new method to produce hydrogen, it is extracted from gasoline to produce clean, efficient fuel that will drive the fuel cell. Using gasoline, a new generation of electric vehicles could be produced that have twice the fuel economy without solely relying on batteries and not requiring new fuel production and delivery infrastructure. Hybrid electric vehicles offer an attractive alternative to battery powered electric vehicles. Using a combination of power systems, hybrid electric vehicles provide energy efficiency and emissions benefits along with the range and performance improvements. A small gasoline-powered engine can be used to
APEC High Value End-Use Analysis Chapter 5: United States
5-9
recharge the batteries, doubling the gas mileage. These hybrid vehicles are already ready for mass production in the U.S. and represent the most promising short-term solution for vehicular emissions. Electricity Production Sector The generation of electricity by electric utilities in 1995 was 33.1 Quads, representing a 36% share of the total energy consumption (EIA, 1996). The consumption of petroleum products was approximately equivalent to electricity consumption. The share of the electricity generation sector is expected to grow by an average of 1% per year, resulting in a projected consumption of 40 Quads by 2015. The U.S. electricity sector is responsible for 8% of the total global CO2 emissions (Energy Innovations, 1997). Table 5.3 U.S. Electricity Generation (billion kwH): Fuel type Generation Mix 19951 Projection for 2010-
Reference Case2
Projection for 2010-Incorporating incentives for renewable energy3
Net imports 38 31 34 TOTAL 2595 4056 3642 1Source: Energy Information Administration, Annual Energy Outlook, 1997 2Results from National Energy Modeling System developed by the Energy Information Administration of the U.S. Department of Energy. Assumes current policies and regulations are in place. The total energy system is examined, including all energy consuming and producing sectors and the most significant macroeconomic indicators that affect or are affected by the energy system. Source: Energy Information Administration, Annual Energy Outlook, 1997 3Assumes innovative policy measures are instituted including System Benefits Charge, Renewable Portfolio Standards, establishing caps and/or reducing emissions of carbon, SO2, and Nox. Source: Energy Innovations, 1997
APEC High Value End-Use Analysis Chapter 5: United States
5-10
Electricity generation is dominated by coal-fired power plants followed by nuclear and natural gas. Renewable energy technologies (including hydropower) accounted for 13% of the electricity generation and the non-hydropower portion (primarily biomass, wind, and geothermal) accounted for only 2% of the total electricity generation (Table 5.3). With ongoing deregulation of the electricity supply industry and the onset of competition, more efficient and cleaner generation technologies may more easily enter the markets but on the other hand coal and other fossil fuels may be the preferred option because of its low price and existing dominance in the market. Despite their small contribution to the generation mix, renewable energy technologies have the potential to make substantial contributions to the electricity supply portfolio in the U.S. Opportunities for Renewable Energy in the Electricity Production Sector Table 5.3 demonstrates two different scenarios for future developments in the electric supply industry. Projections are made for the year 2010 based on two different sets of assumptions. Conservative estimates, made by the U.S. Department of Energy, are presented along with estimates based on more innovative approaches to energy supply, done by a consortium of several leading environmental organizations in the U.S. The more innovative approach entails examining implications of supply-side policies to increase the development and use of renewable energy technologies, and to reduce emissions (Energy Innovations, 1997). The policies that are specifically targeted at increasing the use of renewable energy systems are renewable energy portfolio standards (RPS) and a Systems Benefit Charges (SBC). The RPS requires utilities to include a minimum level of renewable power in its electricity supply. Individual obligations would be tradeable through a system of renewable energy credits (Rader and Norgaard, 1996). The SBC uses a different approach which involves imposing a small surcharge on electricity sold at the retail level to generate funds for research and development (Wiser et al., 1996). These funds would be administered such that new sustainable energy technologies could be developed and commercialized. Both of these policies ensure that renewable energy is given a fair opportunity to compete with conventional generation, and they are being considered by several states and at the national level in the development of restructuring plans for the electric utilities. In addition, the other policies incorporated into the Energy Innovations (1997) model is a cap on SO2, reductions in Nox and particulates and a cap on carbon production in the electricity sector. It is evident in Table 5.3 that if higher priority is given to renewable energy and advanced fossil fuel technologies (e.g., combined cycle gas turbines) that the generation mix can be significantly changed to one that is better for the environment and the U.S. economy. Because the underlying assumptions of the two projections are fundamentally different, it is not surprising that with the DOE projections, coal-fired generation increases by 16% whereas in the alternative projection coal use decreases by 38%. Both projections reflect a significant increase in the use of natural gas for electricity generation, ranging from 177% to 188% increase. This is due to low prices for natural gas and the fact that natural gas-fired combined cycle plants have become inexpensive and highly efficient. Natural gas is one of the major competitors to renewable energy because it is often the least-cost option and has relatively low emissions compared to the other fossil fuels. One of the major differences in the two projections is in the role that renewable energy will play. In the DOE projection, the increase expected is on the order of 53% whereas the innovative option projects an increase of 800%. This dramatic difference is due to
APEC High Value End-Use Analysis Chapter 5: United States
5-11
the fact that the DOE projection assumes that only existing policies and regulations will be in place, and the alternative reflects the use of five very aggressive policy measures (e.g., renewable portfolio standards, system benefits charges, and emissions standards, as discussed above). Table 5.3 clearly serves to illustrate two different ends of the spectrum for the future of the electricity generation in the U.S.--one is an extension of current thinking and thus more modest projections for renewable energy and the second places more emphasis on renewable energy and environmental effects of energy production. It is most likely that the future energy supply mix in the U.S. will be somewhere between the two estimates, given the various impacts of legislation, regulations, energy markets, price, technology developments, and other factors affecting electricity generation.. Regardless of the exact figures for growth of renewable energy electricity industry, it is clear that the role that renewable energy can play in the electric generation sector has improved over the last 10-20 years due to technical improvements, legislative mandates, and market forces. Improved technologies have reduced the cost of generating electricity, improved their performance, and created a market for small, modular systems. Electric generation is moving from large-scale power plants (typically coal-fired or nuclear) to much smaller-scale more efficient production facilities that can be brought on-line more quickly and cheaply. This trend suits renewable energy power production because they tend to be smaller and can either be stand-alone or can serve to expand base-load capacity of smaller plants. Secondly, through legislative measures, non-utility generation has been able to enter the market. Because non-utility generators are typically more efficient and lower cost they have expanded the electricity market in the U.S. The Public Utilities Regulatory Policies Act (PURPA) was an important statute that required utilities to purchase fuels from independent power producers, including renewable energy systems. In addition over the last 20 years the increased experience with renewable energy systems and awareness of their environmental benefits has served to expand the markets in the U.S. and internationally. Tables 5.4 and 5.5 illustrate the different types of renewable energy power that are produced in the U.S. and projections by the Department of Energy for the years 2010 and 2015. Note that the alternative model (Energy Innovations, 1997) that was discussed above did not include a breakdown of the various renewable energy technologies so a comparison with that model for the various renewable energy technologies was not possible. Table 5.4 Renewable Energy Electric Generation Capacity (Gigawatts) Resource 1995 2010 2015
Conventional Hydropower
78.48 80.38 80.38
Geothermal 2.97 3.19 3.46 Municipal Solid Waste 2.43 3.89 4.19 Biomass/Other Waste 1.86 2.21 3.92 Solar Photovoltaics 0.36 0.19 3.92 Solar Thermal 0.36 0.5 0.63 Wind 1.83 3.78 5.39 Total Capacity from Non-hydro 6.72 13.76 17.94
APEC High Value End-Use Analysis Chapter 5: United States
Geothermal 14.66 19.46 22.04 Municipal Solid Waste 18.69 26.12 28.18 Biomass/Other Waste 7.12 10.73 22.72 Solar 0 0.48 0.87 Solar Thermal 0.82 1.38 1.78 Wind 3.17 9.15 13.8 Total Generation from Non-Hydro Renewables
44.46 67.32 89.41
Source: Energy Information Administration, Annual Energy Outlook 1997, DOE/EIA-0383(97), page 108. The largest contribution to electricity generation is municipal solid waste, which accounted for 42% of the electricity generated from renewable energy. Solar was virtually zero in 1995, and wind accounted for 7% and geothermal 33%. Projections by DOE for 2015 reflect greater penetration by solar and wind technologies: solar photovoltaics is at 1%, solar thermal at 2% and wind at 15% of the renewable energy electricity generation. Although all renewable energy electricity supplies are expected to grow over the next 20 years, these figures are still very small in terms of the overall electricity supply in the U.S., representing only 1.6% of the total electricity generation. In order to make significant strides into the use of renewable energy for power generation, it will be necessary to modify the energy supply paradigm that is being assumed by DOE to include much more progressive policies and market incentives. These could include some of the supply-side policies that were presented in the Energy Innovations (1997) model such as renewable energy portfolio standards, systems benefits charges and aggressive targets for emissions reductions. Table 5.6 Cost of Electricity from Renewable Energy Resources
Technology Current cost of electricity (cents/kilowatt-hour)
Projected Price (cents/kilowatt-hour)
Wind 5 2.5 Photovoltaics1 20 10-15 Solar thermal 17 8 Geothermal 5-8 3.5 Biomass power 4-5 4-5 Hydropower 4-6 n/a For Comparison: Natural gas combined-cycle
5
3.5
1Utility Grade applications
APEC High Value End-Use Analysis Chapter 5: United States
5-13
Source: Congressional Research Service, Issue Brief 97031: “Renewable Energy: Key to Sustainable Energy Supply?”, 1997. As costs declined significantly over the last 10 years, renewable energy technologies have become competitive with conventional technologies in many locations and applications. Costs are expected to continue to decline as technologies are further developed and the number of installation increases (Table 5.6). These prices are affected by resource availability, cost of capital, economies of scale, transmission distance, and other factors (Hamrin and Rader, 1993). Residential Sector The residential energy sector in the United States includes space heating and cooling, water heating, lighting, cooking, refrigeration, and other appliances for all private residences, such as single and multi- family homes, apartments, and mobile homes. Of the total energy consumption in the U.S., 20% was consumed by the residential sector in 1995, with a projected increase of 17 percent overall between 1995 and 2015 (EIA, 1996). The largest contribution to the growth in total energy use is from increased use of electricity, mainly for air conditioning, consumer electronics and appliances. However, the contribution from renewable energy to the residential sector is projected to remain relatively constant although a relatively small contribution, given the current state of the technologies and market conditions. Of course, with further advancements of the technologies, declining prices of renewable energy systems and other incentives for renewable energy, this projection would likely be more favorable.
Table 5.7 Residential Sector--Total Energy Consumption by End-Use Sector (Quadrillion BTU per year)
1Other refers to smaller appliances such as personal computers, dishwashers, clothes washers, televisions, microwaves, and pool heaters Source: Appendix A, Energy Information Administration, Annual Energy Outlook, 1997
APEC High Value End-Use Analysis Chapter 5: United States
5-14
Electricity accounted for 19% of the residential energy consumption in 1995 (EIA, 1996). With increased mandates related to minimum efficiency standards for heat pumps, air conditioners, furnaces, refrigerators, and water heaters, manufacturers are making great strides in reducing energy consumption of their units and other, less efficient models are replaced with the newer, more efficient models. The U.S. Environmental Protection Agency has assisted in this effort through the development of several innovative programs to encourage the manufacture and consumption of more energy efficient products, including lighting, refrigeration, personal computers, etc. Natural gas is the largest supplier to the residential sector, contributing 27% to the overall consumption in this sector. The natural gas is primarily used for space heating and a smaller amount for water heating. With continually low natural gas prices, the number of homes that are heated by natural gas is expected to increase more than homes heated by electricity or oil. Space heating is the most energy-intensive end-use application in the residential sector, accounting for over 36% of the total energy consumed and the second largest use is water heating. The breakdown of the end-uses for energy in the residential sector can be seen in Table 5.7. Between 1995 and 2015, space heating consumption is expected to grow more slowly than it has over the last ten years, only by about 0.3% vs. 2 % a year, respectively. The Department of Energy suggests that this decline will be attributed to improvements in building shell and equipment efficiencies and tighter standards incorporated into local building codes (e.g., insulation standards, energy efficient windows, and tighter building shells). As noted above, the last category in Table 5.7 includes personal computers, dishwashers, clothes washers, televisions, microwave ovens, and pool heaters. This sub-sector is expected to see the largest growth--doubling by the year 2015. This could be due to the continuing rise in the use of personal computers as well as the increase in the number of small electric appliances. Throughout all of the end-use sectors listed above, there is room for making gains through the use of energy efficiency and renewable energy technologies. Opportunities for Renewable Energy in the Residential Sector Although adoption of energy efficiency measures play a key role in reducing energy consumption in the residential sector, renewable energy technologies can be important to this sector as well. For example, the biggest opportunities are in the use of renewable energy for space heating and for hot water heaters. Heating and Cooling. Space heating is one of the largest end-uses for energy in the residential sector. The primary fuel for space heating in residences is natural gas used to fire warm air furnaces. Over 68% of the energy consumption for space heating in households uses natural gas, followed by 15% using oil and 8% using electricity, either for resistance heating or heat pumps. Space heating with an air source electric heat pump uses a refrigeration cycle to heat or cool the air from outside. Heat pumps are becoming more popular because of their energy savings potential and efficiency. However, because natural gas prices are relatively low and natural gas-fired furnaces can be very efficient (up to 97%), in the near term natural gas heating systems will dominate the U.S. markets in the residential sector.
APEC High Value End-Use Analysis Chapter 5: United States
5-15
An attractive economic alternative to the air source heat pump traditional gas furnaces is the geothermal heat pump, which works more efficiently since it uses the groundwater as a heat source or sink, to provide heating or cooling. In the heating mode, it removes heat from the liquid and in the cooling mode the geothermal heat pump removes heat from the building and transfers it back to the earth. On either cycle, household water can be heated and stored, efficiently replacing or reducing the requirement for a separate hot water heater. Because the groundwater is a relatively constant temperature throughout the year the heat exchange is much more efficient and the heating capacity is greater. Geothermal heat pumps use 30% less energy than conventional air-source heat pumps and extracts three to four times more energy than it consumes. Although the first-cost of geothermal heat pumps is higher and the payback period on the order of five years, the life-cycle cost of these systems are much lower than air-source heat pumps. Average annual energy savings ranges from $300 to $800 for a household (GAO, 1994). Although estimates of the number of geothermal heat pumps in the U.S. range from only 0.1% and 0.3% of the total number of residences, utilities are interested in promoting this technology because they are effective load management tools. By better managing their load, utilities can defer the need for new generation facilities, use existing resources more efficiently, and keep utility rates low. To help address the first-cost issue, many utilities and state energy offices offer rebate programs or attractive financing to the residential customer. Water heating. The second largest end-use application in the residential sector is hot water heating. Electric water heating accounts for about 9% of the total residential electricity consumption, predominately from electric resistance water heaters. A very small percentage (less than 0.5 %) of the U.S. energy consumption in the residential sector is derived from low and medium temperature solar thermal hot water systems. The primary uses are for domestic hot water heating or swimming pool heating in the U.S. The Department of Energy reports that solar thermal collectors for heating swimming pools was the largest end-use sector in 1995 (representing 88% of the collectors produced) followed by domestic hot water systems (representing 10% of the collectors produced). Solar thermal systems are in widest use in southern and western U.S. markets of Florida and California. Although the first cost for solar thermal systems are higher than conventional electric resistance heaters the savings realized by the consumer can be on the order of 50-85 % on their utility bills. Commercial Sector The commercial sector consist of all businesses that are not engaged in transportation or industrial activity and therefore includes offices, retail stores, religious institutions, social institutions, educational facilities,. healthcare institutions, and federal, state and local governments (OTA, 1993). Of the total energy consumption in the U.S., 16% was consumed by the commercial sector in 1995, with a projected overall increase of 14 percent from 1995 to 2015 (EIA, 1996). This represents a decline in the steep rate of increase seen from the mid-1970s until now. The Department of Energy suggests that the slowing of energy consumption in the commercial sector may be due to decreases in leased space for commercial activities and decreases in energy consumption. Efficiency standards, voluntary
APEC High Value End-Use Analysis Chapter 5: United States
5-16
government programs aimed at improving efficiency, and other technology improvements all contribute to a decline in commercial energy intensity.
Table 5.8 Commercial Sector--Total Energy Consumption of Energy by End-Use Sector (Quadrillion BTU per year)
1Includes personal computers and other office equipment (e.g., copy and fax machines) 2Other refers to service station equipment, district services, automated banking machines, telecommunications equipment, medical equipment, pumps, emergency generators, manufacturing in commercial buildings, miscellaneous uses for fuel.
Source: Appendix A, Energy Information Administration, Annual Energy Outlook, 1997
According to the Department of Energy figures, lighting is the largest end-use sector within the commercial sector, that is roughly double the consumption levels for space heating and cooling. However, the projected growth in energy consumption for commercial lighting is very low. This low growth projection takes into account the increased use of energy efficient lighting and conservation of lighting. Space heating and cooling are the second largest end-uses in the commercial sector, each approximately 13% of total consumption in 1995. As in lighting, the growth rates over the next 20 years are relatively flat or are declining for the heating and cooling sub-sectors, respectively. These projections reflect increased use of energy efficient building materials, installation of more insulating windows, and the use of more efficient heating and cooling equipment. Another significant finding in the Department of Energy data is the dramatic increase in “other” category in Table 5.8, which encompasses numerous emerging technologies related to telecommunications, medical services, banking, fuels, and manufacturing. In total, the sub-sectors represented by the “other” category is projected to grow by 58% from current levels, however the estimated growth could be much larger with future development of new technologies that have not yet entered the marketplace. Clearly, the greatest gains to be made in the energy consumption in the commercial sector are in lighting and “other” end-use sectors.
APEC High Value End-Use Analysis Chapter 5: United States
5-17
Electricity consumption in the commercial sector dominates the energy supply portfolio, representing 72% of the total energy consumed followed by natural gas at 22%. In the Department of Energy projections, this breakdown is expected to remain relatively constant over the next 20 years. Electricity usage is dominated by the overwhelming contribution to the commercial sector from lighting and the increased use of office equipment and new technologies. Although energy efficiency will be an important aspect of future development of equipment being used in the commercial sector, the increasing types and applications of equipment will result in increased consumption of energy, although it is important to note that these consumption figures would be much greater if energy efficiency were not considered. A potential barrier to the adoption of sustainable energy systems in the commercial sector is due to split incentives. The owner of the building may not necessarily have any incentive to invest in renewable energy or energy efficiency measures because the tenant will be paying the fuel bills. However, building owners could use the sustainable energy systems as a comparative advantages, in terms of lower energy bills, improved quality of the interior, and demonstrated commitment to protecting the environment. Opportunities for Renewable Energy in the Commercial Sector Lighting. Lighting represents the single largest end-use sector in the commercial sector. Therefore, the most opportunity for having an impact in this sector will be in the use of energy efficient lighting and/or increased use of passive solar, or daylighting in buildings. In order to reduce energy consumption in existing buildings, the replacement of fluorescent lights with more efficient fluorescent lamps and ballasts can result in energy savings of 40 to 80%. Although this is not a renewable energy technology, more efficient lighting is an important element to addressing the integrated energy consumption profile in the commercial sector. On the other hand, passive solar such as daylighting involves letting natural light in from the outside and integrating it with the electric lights to reduce energy consumption and improve the quality of lighting. Incorporating daylighting into architectural designs for new buildings is the biggest opportunity for passive solar. The potential savings in electricity with effective use of daylighting can be on the order of 70% (OTA, 1992). Space Heating and Cooling. Space heating and cooling are the second largest uses of energy in the commercial sector in the U.S. Although the commercial sector generally has larger buildings and more complex heating and cooling systems than in the residential sector, improvements can be made in terms of energy efficiency and the use of renewable energy systems. With the installation of more energy efficient furnaces and boilers, which are the current means of heating most commercial spaces, efficiency gains of 20% can be realized (OTA, 1992). Geothermal heat pumps that were discussed in reference to use in the residential sector. To date these have been used primarily in the residential sector, however the commercial sector may represent an even bigger market because they require more energy for heating and cooling and therefore have a much greater energy savings potential. The main differences in systems used in the commercial sector are the requirement to scale up of the capacity of the pumps and the need for a larger heat exchange loops. Geothermal heat pumps can benefit the consumer, the utilities and the environment because they
APEC High Value End-Use Analysis Chapter 5: United States
5-18
can lower energy consumption and reduce air pollution while ate the same time reduce the gas and electricity bills. The energy savings realized in the commercial sector for geothermal heat pumps is 22% over a conventional air source hump and 40 to 68% savings over electric heat and air conditioning (Lienau, 1994). In the commercial sector, utilities are very interested in geothermal heat pumps as a means of energy savings and reducing their peak demand. Through innovative rebate, financing, and energy pricing programs utilities have been able to create incentives for this renewable energy technology. Industrial Sector Industry accounts for over a 37% of the energy consumed in the United States. The industrial sector in the United States includes the agriculture, mining, and construction industries in addition to traditional manufacturing. Industrial production continued to increase rapidly in 1996 and capacity utilization remained broadly stable, at about 83.5% of fully utilized plant. Within this sector, five industry groups account for 82 percent of the energy used in manufacturing: pulp and paper; steel, aluminum and metal casting; chemicals; petroleum refining; and stone, clay and glass. Energy consumption is expected to increase overall by 20% by the year 2015 (EIA, 1996). The largest contribution to the growth in total energy consumption is from increased use of electricity and renewable energy; these are expected to grow from 1995 to 2015 by 20% and 37%, respectively, although the total contribution from renewables is still relatively small. Consumption of renewable energy in the industrial sector was 1.74 Quads in 1995, and it was primarily in the biomass area. However, it is projected to be 2.4 Quads by 2015. The move toward more electricity intensive processes in the industrial sector was driven by the uncertainty in natural gas supply and prices as well as pressures to move toward cleaner energy sources. Consumption of coal has declined markedly over the last 25 years, falling from a 16% share of consumption to current levels of 7% of the energy supply mix. Because of projected growth in the industrial sector, consumption of energy is expected to increase on average 1% per year over the next 20 years. The heat and power required in manufacturing is the largest end-use consumer of energy in the industrial sector (23 Quads), as compared to the energy consumed for nonmanufacturing heat and power (6 Quads), and energy consumed as feedstocks (raw materials) and in other miscellaneous uses (5 Quads) (EIA, 1996). Shown in Table 5.9 is the distribution of energy consumption in the manufacturing sector, which includes industries that use mechanical or chemical processes to transform raw materials into intermediate or final products. It includes energy consumed to produce heat and power and to generate electricity, as well as sources of energy consumed as petrochemical feedstocks and raw material inputs, but it excludes byproduct fuels produced from other energy sources. The Department of Energy notes that the predominant trend in the manufacturing sector over the next twenty years will be higher industrial outputs with relatively constant energy consumption. They state that this is due to the adoption of more energy efficient technologies and relatively low growth in the energy intensive industries, such as primary metals. The DOE forecast that the share of total
APEC High Value End-Use Analysis Chapter 5: United States
5-19
manufacturing output attributed to the energy-intensive industries falls from 32 percent to 26 percent by 2015. Table 5.9 Manufacturing Sector Energy Consumption Measures, 1994 (Quadrillion Btu) Type of Consumption
Electricity Fuel Oil Natural Gas
Coal Other 1 Shipments of Energy2
Total Percent
Total Primary Energy Consumption 3.
2.656 0.648 6.835 2.105 10.006 0.587 21.663 100
Paper and Allied Products
0.223 0.182 0.575 0.307 1.378 0.000 2.665 12
Chemicals and Allied Products
0.520 0.124 2.569 0.293 1.988 0.166 5.328 25
Petroleum and Coal Products
0.121 0.093 0.811 not available
not available
0.087 6.339 29
Primary Metal Industries
0.493 0.056 0.811 0.922 0.514 0.334 2.462 11
All Other Manufacturing Industries
1.299 0.193 2.069 not available
not available
0.000 4.869 22
1 Includes all other types of energy that respondents indicated were consumed. 2 Shipments are energy sources produced onsite but sold to another entity. 3 The estimates are for the primary consumption of energy for heat and power and as feedstocks or raw material inputs. Primary consumption is defined as the consumption of the energy that was originally produced offsite or was produced onsite from input materials not classified as energy. Source: Energy Information Administration, Annual Energy Review 1996, DOE/EIA-0384(96) (Washington DC, July 1997). Natural gas was the primary source of energy for the manufacturing sector (6.8 Quads or 31% of total energy consumption) followed by electricity (2.7 Quads or 12% share, and coal (2.1 Quads or 9% share). However a large portion of the energy consumed was provided by other sources such as petroleum coke and wood residues (10 Quads, or 46% share). As shown in Table 5.9, the three largest end-use consumers of energy for heat and power are petroleum refining, chemicals, and pulp and paper industries. These three energy-intensive industries accounted for 14.3 Quads in 1995. Petroleum refining consumed 6.3 Quads; chemicals consumed 5.3 Quads, and the paper industry consumed 2.7 Quads. Renewable energy had the most impact in the paper industry, responsible for more than half of the energy consumed--mainly from wood and spent liquor. The remainder of the industrial sector includes construction, mining, agriculture, fishing, and forestry, and electric utilities, falling into the categories of nonmanufacturing industries and feedstocks. The nonmanufacturing industries’ consumption of energy was 6 Quads in 1995 (17% of the total energy
APEC High Value End-Use Analysis Chapter 5: United States
5-20
consumed in the industrial sector). Included in this category are power for off-road equipment, such as mine excavation equipment, farm tractors, and bulldozers and the construction industry which uses asphalt and road oil for paving and roofing. In 2015, nonmanufacturing output is expected to be 34.3 percent and energy consumption 29 percent higher than their 1995 levels. The third major category within the industrial sector is feedstock use, which accounted for 15% of the total energy consumption in this sector, or 5 Quads in 1995. Liquid petroleum gas and petrochemicals are the fastest growing feedstocks, increasing by 18.0 percent and 20.2 percent, respectively, between 1995 and 2015. (EIA, 1996). Opportunities for Renewable Energy in the Industrial Sector The potential for renewable energy resource to replace fossil fuels in the industrial sector is less clear than the energy savings that could be realized with energy efficiency improvements. Through technological innovation in the area of equipment and production processes, energy savings have been made in the industrial sector. In addition, attention to waste reduction and pollution prevention have significant impact on energy usage in the industrial sector. However, the combination of low prices for conventional energy and potential for energy efficiency improvements will likely discourage the use of renewable fuels in the near term. The exception to this in the are for biomass utilization. Biomass. The forestry, agricultural, and manufacturing industries generate plant and animal wastes in large quantities, and the leftover waste can be used to generate biomass power. As shown in Table 5.9, the pulp and paper industry is a large component of the manufacturing sector and this industry represents the largest consumer of biomass among independent power producers. A significant portion of the biomass power industry is comprised of cogenerators in the pulp and paper industry. The wood and wood by-products that pulp and paper mills burn for power and steam are largely forestry waste materials that can be used as fuels. The primary fuels are wood waste which include unused portion of trees after logging, sawdust and bark from sawmills, shavings produced during the manufacture of furniture, and organic sludge, or " black liquor," from pulp and paper mills. The forest products industry is the largest self-generator of electricity of energy in American manufacturing, despite being the third largest consumer. The impact on the energy consumption rates of the paper and forest product industry can be substantially reduced due to increased use and efficiency of biomass for power generation, both primary and through co-generation. In the agriculture sector, a significant fuel for biomass power is crop residues left in the field. The large amount of animal waste produced on farms can also be an important biomass source. It has been estimated by the Union of Concerned Scientists that contributions to the U.S. electricity supply from energy crops and waste biomass from the Midwest could be much greater than current levels. They suggest that biomass from these sources could provide 16 % of the U.S. electric capacity, and if other regions of the U.S. were included the potential impact on the countries energy supply mix could be even greater. (Union of Concerned Scientists, 1996)
Chapter 6.
6-1
COMPARISON OF APEC MEMBER ECONOMIES It is useful to make comparisons among the different Member Economies to illustrate the key points regarding the consumption and production of energy. The overriding premise of energy development in the four Member Economies that were the subject of this study is that they are all experiencing growth in their energy demand and there is a need to consider alternative technologies such as renewable energy systems in order to achieve their economic and environmental goals. The Member Economies in Asia (China, Indonesia, and the Philippines) are experiencing large growth in their energy demand compared to the United States. In fact, the growth that these three Member Economies are experiencing is considerably higher than any other region in the world. These dramatic increases have been attributed to high rates of economic growth, increasing energy intensities, the rapid pace of industrialization, growth in the energy-intensive industries, electrification of industries and households, and increases in the number of motor vehicles. The expected increases in energy demand will have impacts on the Member Economies’ environment, infrastructure, financial markets, and the global energy economy. The parameters that define the energy supply and demand framework of the four Member Economies will be compared. A critical look at the economic indicators, the energy demand, and the role of renewable energy will be given in the following sections. Economic Indicators Economic development and growth is the primary goal of the Member Economies and this development is integrally linked to the provision of energy services. The Member Economies in Asia are in the process of dramatic changes in the structure of their economies and industrialization. As a whole the Member Economies of China, Indonesia, and the Philippines have seen a growth in their GDP on average of 7.7%. For comparison, the United States’ GDP rose only 2.4% in 1996 (Table 6.1). To a greater or lesser extent the Asian Member Economies have taken steps to liberalize their economies, reduce subsidies, privatize state enterprises, and control inflation. This has resulted increased competition and efficiency. Much of this growth in China, Indonesia, and the Philippines has been fueled by a move toward the development of an export-oriented industrial sector and a move away from the agriculture sector. In terms of contribution to the GDP, the agriculture sector has declined from 1991 to 1995, with the largest change seen in the economy of China. In 1991 agriculture accounted for 26% of the GDP whereas in 1995 it accounted for 21%. This change was offset by a 5% increase in the industrial sector’s contribution. Although growth in the industrial sector is expected to continue, its contribution is likely to decline as the Member Economies become more service oriented. In addition, the Member Economies in Asia will move toward less energy-intensive industries such as higher value-added industries.
APEC High Value End-Use Analysis Chapter 6: Summary
6-2
The factors that have contributed the most to the region’s economic success have been the modification of government policies to spur investments, the liberalization of trade and foreign investment policies, structural changes in the economy, and the increased emphasis on development. Table 6.1 Comparison of Economic Indicators for Member Economies
CHINA INDONESIA PHILIPPINES UNITED STATES
GDP (US$ billions, 1996)
836.4 220.1 83.5 7576
GDP growth rate, 1996
9.7 7.8 5.5 2.4
Origins of GDP (% of GDP, 1995) Agriculture Industry Services
21
47
32
17
41
42
22
33
45
2
32
66
Inflation Rate (%, 1994)
12.3 19.3 6.8 2.0
Population (millions, 1996)
1222 196.5 69.8 265.3
Source: Human Development Report, 1997, United Nations Development Programme Energy Demand and the Economy Along with rapid economic growth and diversification of the industrial and manufacturing base, energy demand in the APEC Member Economies has grown rapidly in the last five years. The growth rates of energy consumption among the three Member Economies of China, Indonesia, and the Philippines are on the order of 6-15% per year, however the United States is much lower. Indonesia is experiencing the largest growth in energy demand at 7.2% per year followed by the Philippines at 6.5%, China at 6.5%- per year, and the United States at 1% per year. The rapid rise in the energy consumption is
APEC High Value End-Use Analysis Chapter 6: Summary
6-3
driven primarily by the acceleration in industrialization and motorization as well as the need for electrification in the residential sector and the increasing levels of urbanization. In order to meet these needs, the electric generating capacity is also being expanded, mainly using conventional fuels rather than renewable energy. The electricity generating capacity for the Member Economies is shown in Table 6.2. The United States has by far the largest amount of electrical capacity which is consistent with its much greater consumption rates. Trends in the per capita electricity consumption in China, Indonesia, and the Philippines are strongly upward, but they are still much lower than the U.S. which is many orders of magnitude greater than the other Member Economies. Although per capita consumption in the Member Economies in Asia is well below that of the U.S., most likely there will be substantial increases, especially in the residential sector. Increases in electricity consumption in the residential sector would be related to increased use of appliances and air conditioning as well as rural electrification. The overall trend will most likely be driven by increases in per capita income and more rapid substitution of commercial fuels for traditional fuels. Table 6.2 Electricity Demand, Capacity and Consumption China Indonesia Philippines United States
Commercial Energy Use (1000 metric tons of oil equivalent)5
770,000 74,794 24,428 2,060,400
Net Commercial Energy Imports (as % of energy consumption)5
-1 -101 70 19
APEC High Value End-Use Analysis Chapter 6: Summary
6-4
1 1993 figure, from Compendium of Renewable Energy Programs and Projects in APEC, US/ECRE 2 1996 figure from PLN Management Report 3 1996 figure from 1996 Energy Sector Annual Report, Philippines DOE 4 1995 figure from Annual Energy Outlook, 1997, U.S. DOE 5 Human Development Report, 1997, United Nations Development Programme For power generation, the current capacity in the APEC region (as well as throughout the world) is met by fossil fuels. For example, in China, coal accounts for 90% of the power production. In the Philippines oil-based production dominates electricity production, accounting for 47% and the rest of the generation fairly evenly divided between geothermal, hydropower, and coal. In Indonesia, electricity generation is based primarily on coal, oil, diesel, and natural gas, with natural gas accounting for a slightly larger percentage than the others. In the United States, electricity generation is dominated by coal, accounting for over 50%, followed by nuclear and natural gas production. End Use Applications and Opportunities for Renewable Energy The outlook for the Member Economies implies that there will be substantial increases in the power generation capacity. It is expected that this capacity will continue to be dominated by fossil fuels, most likely coal and natural gas. However, due to environmental and financial considerations, renewable energy will be a more viable and practical option, especially in rural areas. All of the Member Economies recognize the importance of modifying their energy supply portfolio to include renewable energy technologies, however the importance that is placed on these technologies is variable. Since the issues relevant to electrification of rural areas present some of the biggest challenges and the best opportunities for renewable energy, they will be the focus of this section. The Member Economies of China, Indonesia, and the Philippines are all faced with the issue of lack of access to modern energy services for large portions of their population, mainly in rural areas. With grid extension being too costly and not practical, they are all undertaking serious efforts for rural electrification using renewable energy systems. Since this situation is most critical for the Member Economies in Asia, Table 6.3 does not include the United States
APEC High Value End-Use Analysis Chapter 6: Summary
6-5
Table 6.3 Rural Electrification Parameters
China Indonesia Philippines Rural Population (as a % of total, 1994)1
70 66 47
Percentage of population without electricity2
10 40 32
Traditional fuel consumption (as a % of total consumption, 1993)1
6 36 33
Household energy from fuelwood (%, 1990)1,3
80 86 81
1Source: Human Development Report, 1997, United Nations Development Programme 2Sources: China: Compendium of Renewable Energy Programs and Projects in APEC, US/ECRE. 1995 Indonesia: PLN Estimate, Proceedings from The Asia Pacific Initiative, Jakarta, 1997 Philippines: Energy Sector Annual Report, Philippines DOE, 1996 3Includes fuelwood, charcoal, bagasse, and animal and vegetable wastes To varying degrees, all of the Member Economies have programs in place that address the issue of decentralized power systems in places where total and/or partial grid connections are not economically feasible. It is recognized that rural energy is the key to rural development and therefore small-scale power generation, small grids, or individual stand-alone systems based on sustainable energy technologies may be the preferred options because they are cost-effective, sustainable, and good for the environment. In addition, government policies and regulations are being put in place in these Member Economies to facilitate investment of the private sector and allow for access to appropriate credit and financing mechanisms. Given the large number of people living in rural areas and the inadequate energy services, the potential to impact development in these Member Economies is substantial. The most common programs that are being instituted in China, Indonesia, and the Philippines are for deployment of photovoltaic solar home systems, biogas, small hydropower, wind, and hybrid systems. Typically these systems have been introduced through demonstration projects, government grants, or government-private sector partnerships. Photovoltaics for individual homes has been proven to be quite
APEC High Value End-Use Analysis Chapter 6: Summary
6-6
effective for providing electricity for lighting, televisions, and other household appliances in rural areas. The solar home systems are advantageous because they are easy to operate and maintain, they require no additional fuels to operate and they create no pollution or noise. In addition to the improvement of rural communities by providing light and other energy services, there are new opportunities for economic growth related to the development of new industries for local manufacture and assembly of systems. For photvoltaics, this could include developing capacity in the production of batteries and controllers and in system assembly and maintenance. In addition to the solar home systems that have already been installed in recent years, all of the Member Economies have plans for future development that will encourage the use of solar home systems. For example, in Indonesia, the government has just announced an ambitious program to install 50 MWp of photovoltaics to provide electricity to one million households in rural areas over the next ten years. In China they have plans to install 200,000 solar home systems in northwest China, and they will set up photovoltaic power stations in nine counties. In the Philippines. over 500 solar home systems were installed in 1996 making for a total number of 1,800 installations for 2000 households. From 1998 to 2035 the Philippines is planning to install 67,900 units which is equivalent to 5.092 MWp. In addition, a Village Power Fund is currently being conceived to provide financing assistance to village/community organizations which may want to undertake renewable energy power projects such as solar projects for their communities. Indonesia has the most ambitious program for the installation of solar home systems, and in addition they have some successful private sector entities that are also selling and installing solar home systems in rural areas with no government funding. One of the biggest barriers that the Member Economies have cited is the difficulty faced by customers in paying the high up-front costs for the energy systems. This is being addressed through the use of innovative financing mechanism to convert the initial capital costs into operating costs so that payments could be aligned with the stream of benefits received. In addition micro-financing has been used effectively to provide households and small business with loans for purchase of solar systems under flexible and often times non-traditional terms. It has been shown that in rural areas. the local community is willing to pay for the systems and the key issue is the design of a credit or financing scheme that fits the needs and ability to pay for that community. Although governmental programs can play an important catalytic role, the success of the development strategies in the Member Economies depends on the creation and development of self-sustaining energy markets. Governments will be instrumental in putting measures in place that will level the playing field to allow for investment in sustainable energy systems by a wide range of investors, including utilities, independent power producers, equipment manufacturers, and consumers. Market reforms and liberalization of markets have increased consumption of energy and have allowed for the adoption of sustainable energy systems in rural and urban areas. The elimination of subsidies for conventional fuel, adjusting import duties for renewable energy technologies, and revising the tax structure will be important in facilitating the deployment of these cleaner energy systems. In addition, the ongoing changes in the Member Economies toward competition and choice will also benefit the markets for sustainable energy.
7-1
REFERENCES Congressional Research Service, “Electricity: The Road Toward Restructuring”, Issue Brief Number 96003, U.S. Congress, 1997. Congressional Research Service, “Renewable Energy: Key to Sustainable Energy Supply?”, Issue Brief Number 97031, U.S. Congress, 1997. Dutt, G. and N.H. Ravindranath, Energy End Use: An Environmentally Sound Development Pathway, Asian Development Bank, 1994. Economic Development Institute of the World Bank, Energy Investments and the Environment: Selected Topics, The World Bank, 1993. The Economist Intelligence Unit, “Investing, Licensing, and Trading Conditions Abroad”, March 1994. Energy Innovations, Energy Innovations: A Prosperous Path to a Clean Environment, Collaboration of Alliance to Save Energy, the American Council for an Energy-Efficient Economy, the Natural Resources Defense Council, the Tellus Institute, and the Union of Concerned Scientists, 1997. Hamrin, J. and N. Rader, Investing in the Future: A Regulator’s Guide to Renewables, The National Association of Regulatory Utility Commissioners, 1993. Hyundai Engineering Co. Ltd., “Power Demand Analysis for Java”, Asian Development Bank. June 1993. International Energy Agency, World Energy Outlook, 1994. Ishiguro M. and T. Akiyama, Energy Demand in Five Major Asian Developing Countries: Structure and Prospects, World Bank Discussion Paper 277, 1995. Lienau P.J., “Geothermal Heat Pump Performance and Utility Programs”, U.S. Department of Energy Geothermal Program Review XII,. DOE/GO10094-005:173-177, 1994. Office of Technology Assessment, Changing by Degrees: Steps to Reduce Greenhouse Gases, U.S. Congress, OTA-O-482, 1991. Office of Technology Assessment, Renewing our Energy Future, U.S. Congress, OTA-ETI-614, 1995.
7-2
Rader, N.A. and R.A. Norgaard, “Efficiency and Sustainability in restructured electricity markets: the renewables portfolio standard”, The Electricity Journal, 9: 37-49, 1996. Reddy A.K.N., R.H. Williams, and T.B. Johansson, Energy after Rio: Prospects and Challenges, United Nations Development Programme, 1997. Republic of the Philippines, 1996 Energy Sector Annual Report, 1996. Stryk R., “Development of Demand Forecast Models for PV Electrification”, Philippine-German Special Energy Programme. 1995. Tunnah B.G., W. Shumao, and Liu Feng, Energy Efficiency in China: Technical and Sectoral Analysis, China: Issues and Options in Greenhouse Gas Emissions Control, Report Number 3, Global Environment Facility, 1994. Union of Concerned Scientists, America’s Energy Choices: Investing in a Strong Economy and a Clean Environment, 1991. United Nations Development Programme, Human Development Report, 1994. United Nations Development Programme, Human Development Report, 1997. United States Department of Energy, Energy Information Administration, Annual Energy Outlook , DOE/EIA-0383(97), 1997. United States Department of Energy, Energy Information Administration, Renewable Energy Annual 1995 , DOE/EIA-0603(95), 1995. United States Department of Energy, Energy Information Administration, Renewable Energy Annual 1996 , DOE/EIA-0603(96), 1997. U.S. Export Council for Renewable Energy, Compendium of Renewable Energy Programs and Projects in APEC, Asia Pacific Economic Cooperation, 1995. Winrock International and Preferred Energy Incorporated, Trade Guide on Renewable Energy in the Philippines, 1996. U.S. General Accounting Office, “Geothermal Energy: Outlook limited for some uses but promising for geothermal heat pumps”, GAO/RCED-94-84, June 1994, p. 49-58. Wiser, R., S. Pickle, and C. Goldman, “California Renewable Energy Policy and Implementation Issues: an Overview of Recent Regulatory and Legislative Action”, LBL-39247, Lawrence Berkeley Laboratory, 1996.


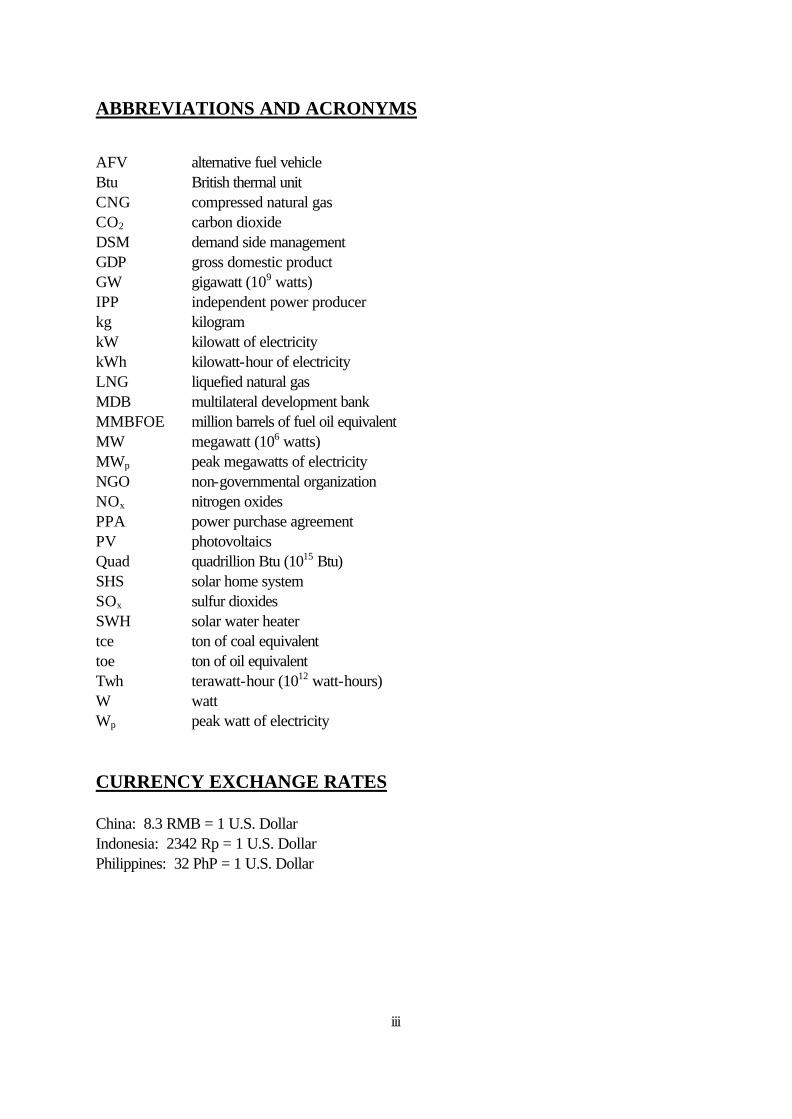


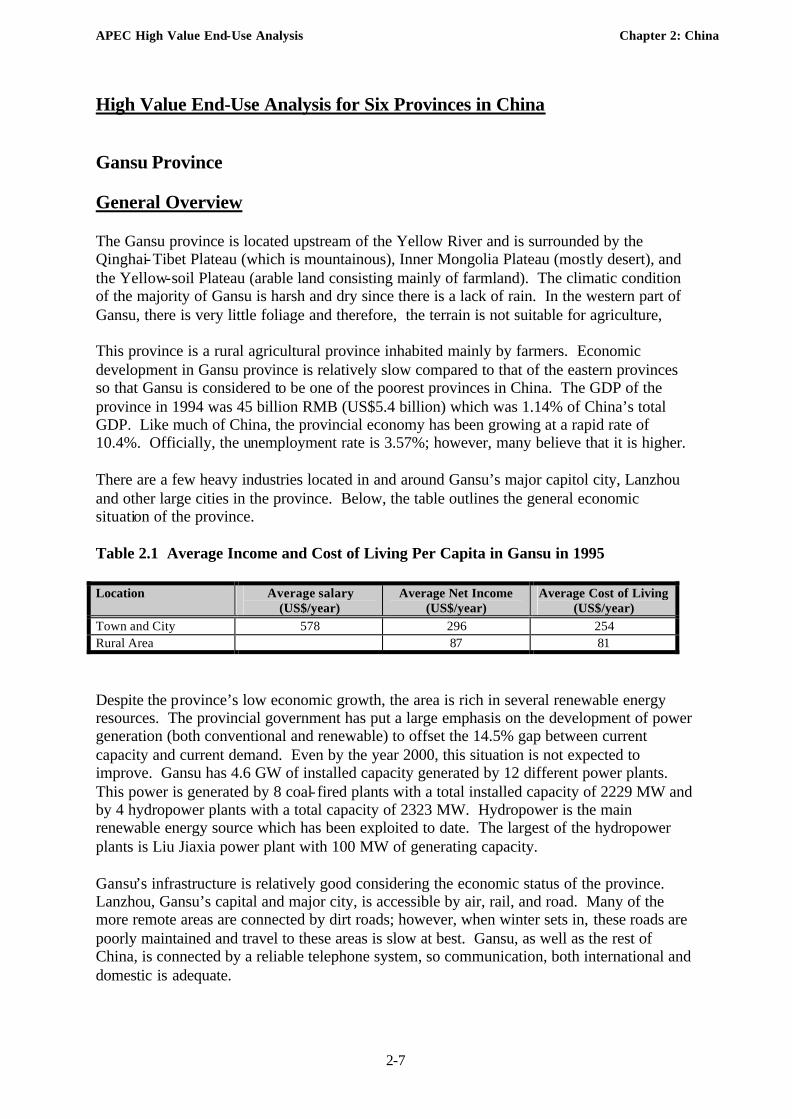


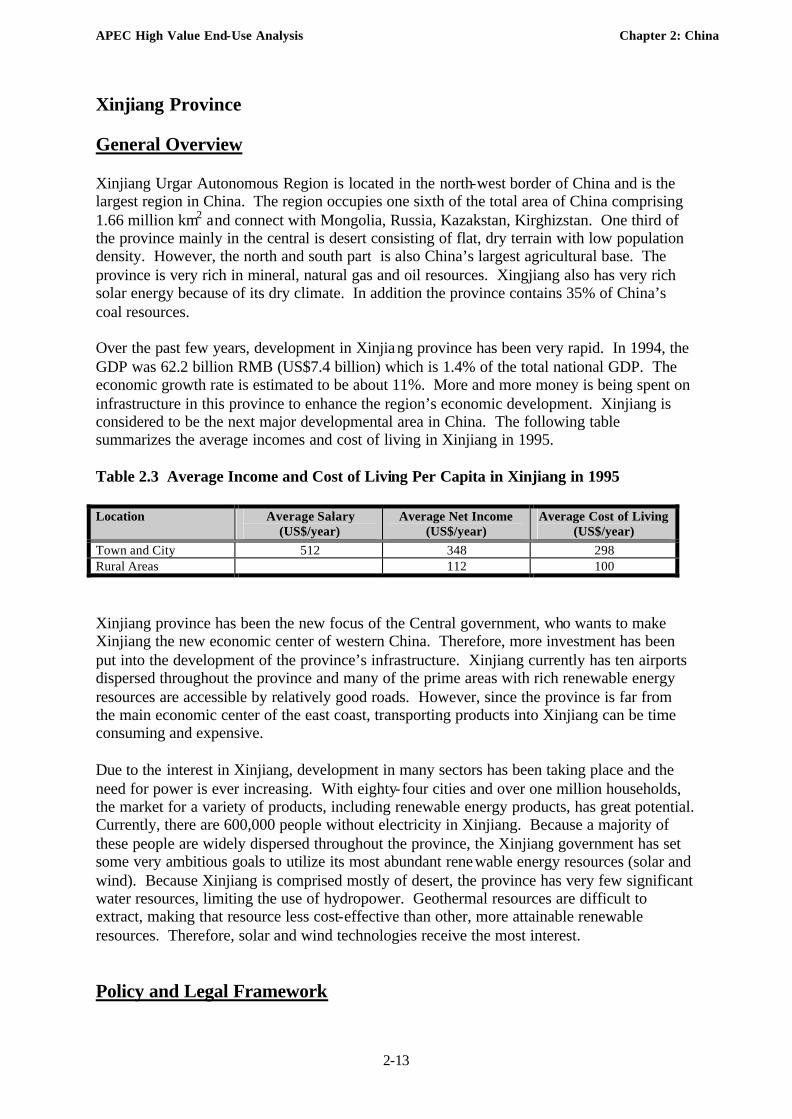

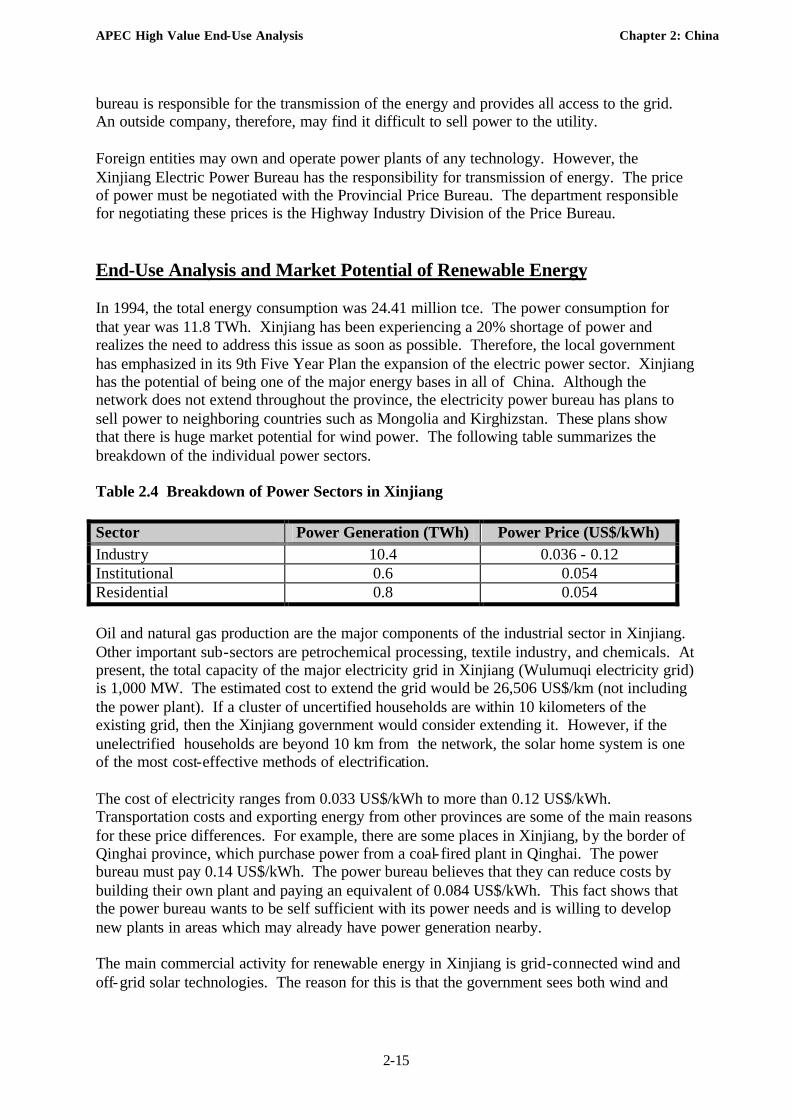


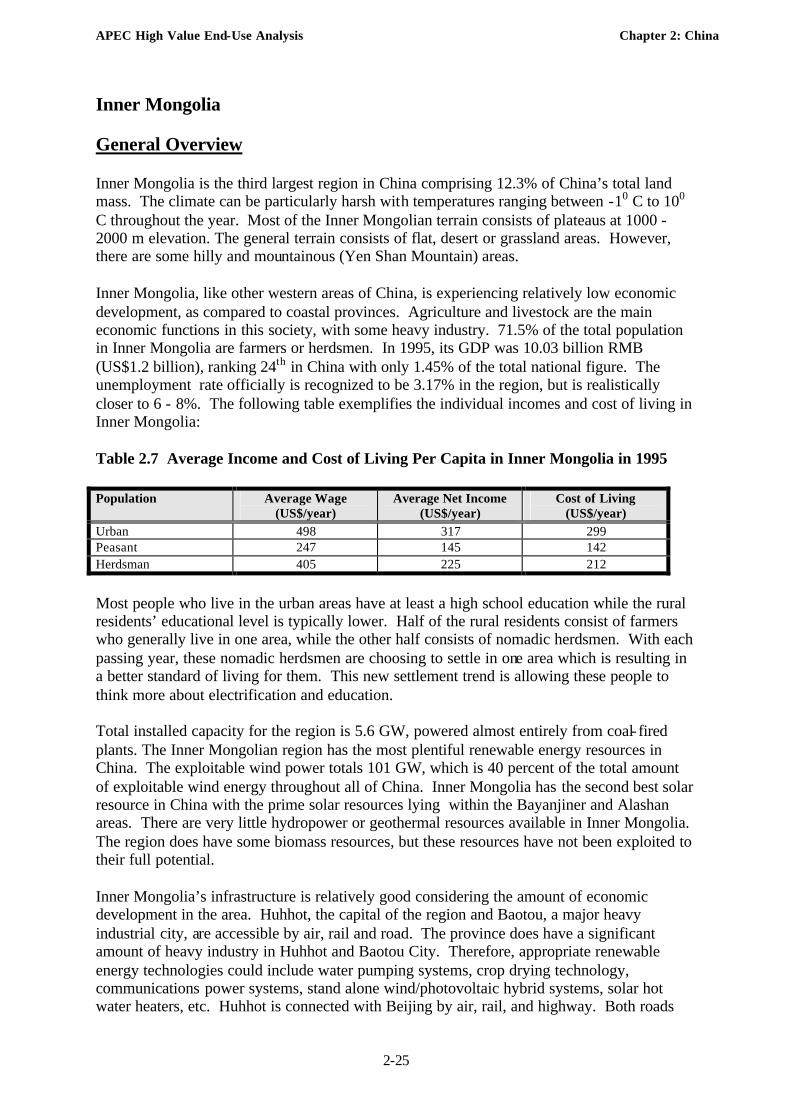

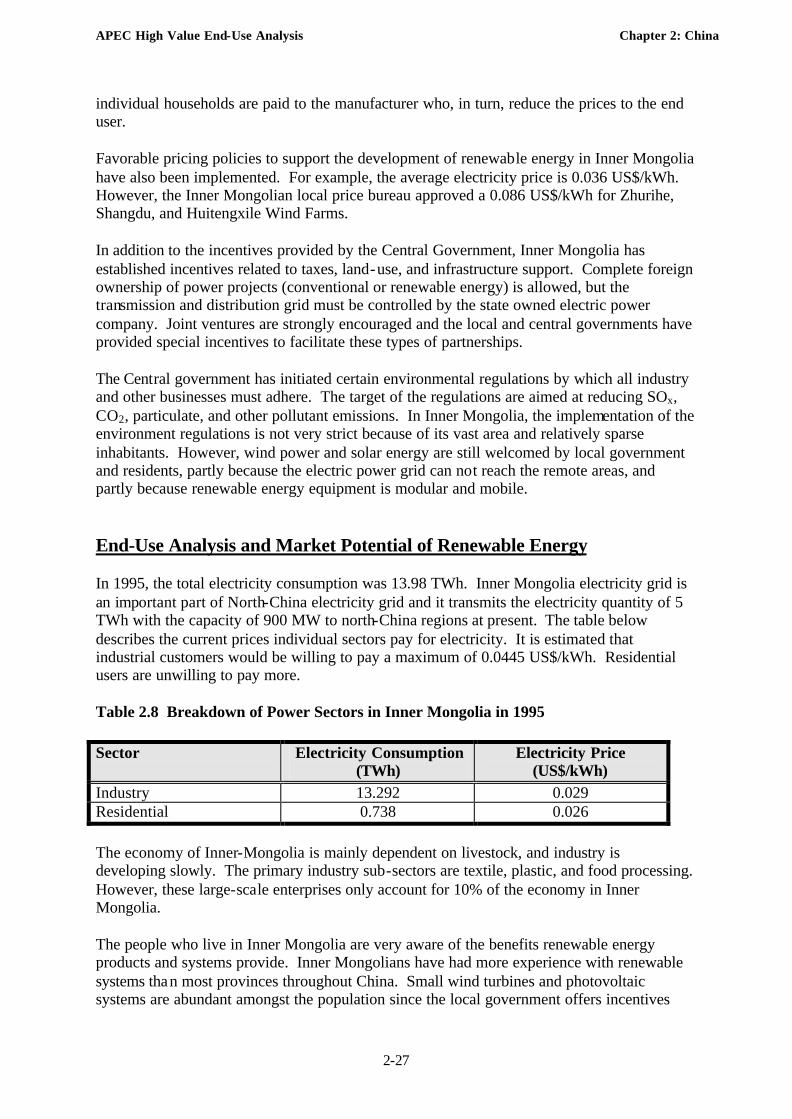


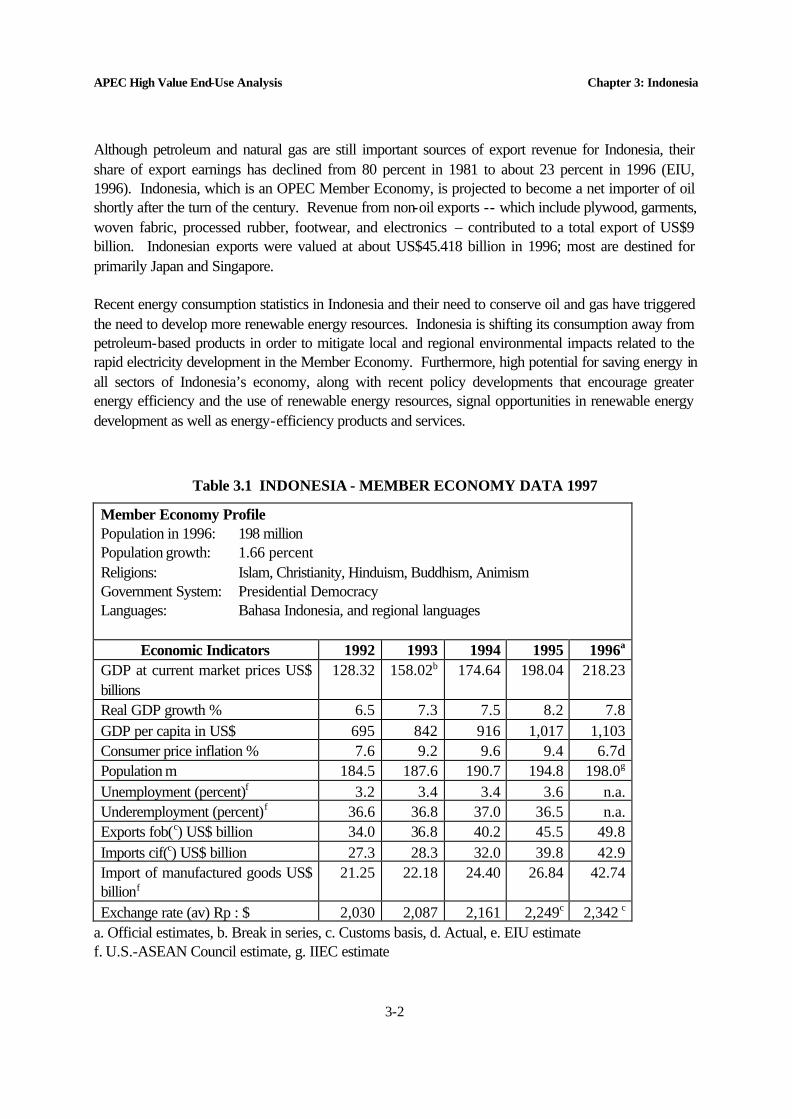
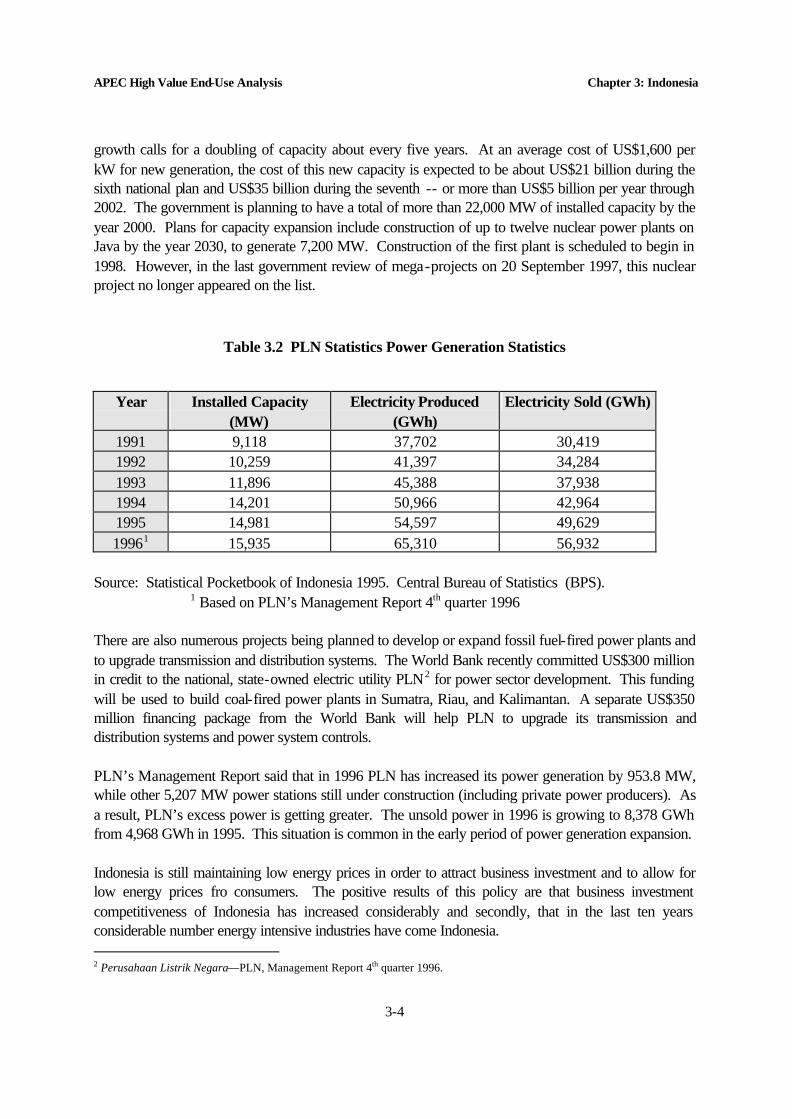

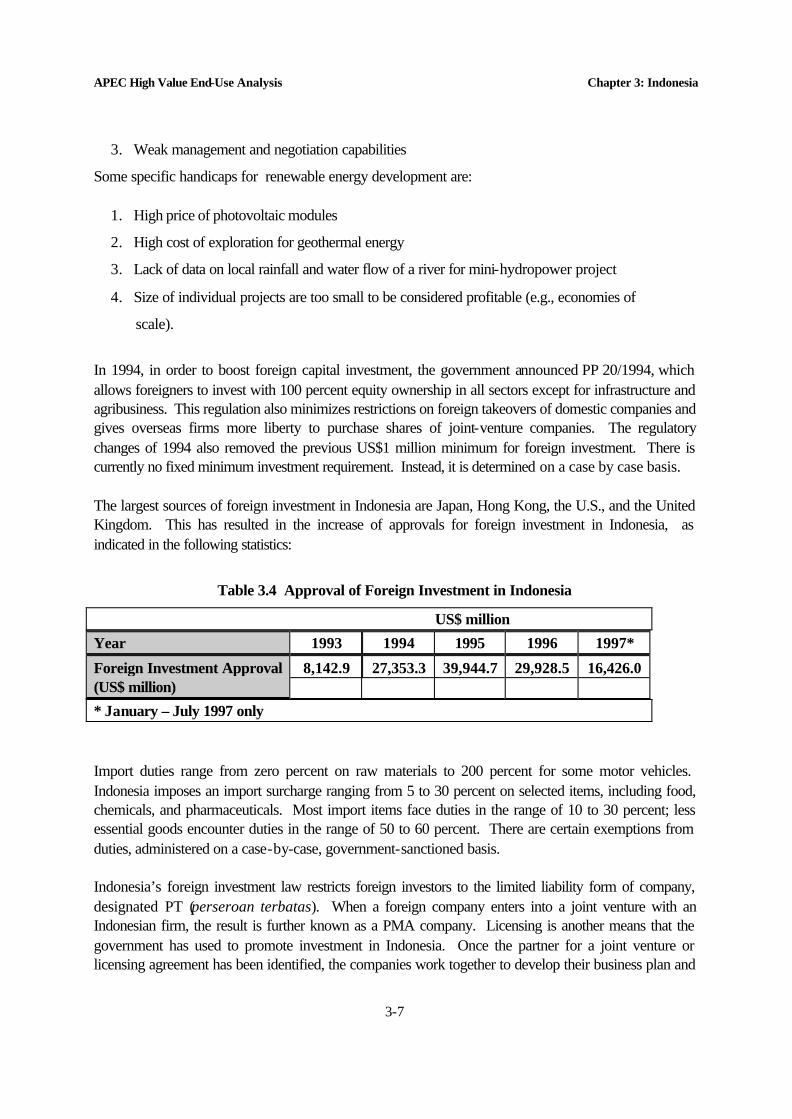

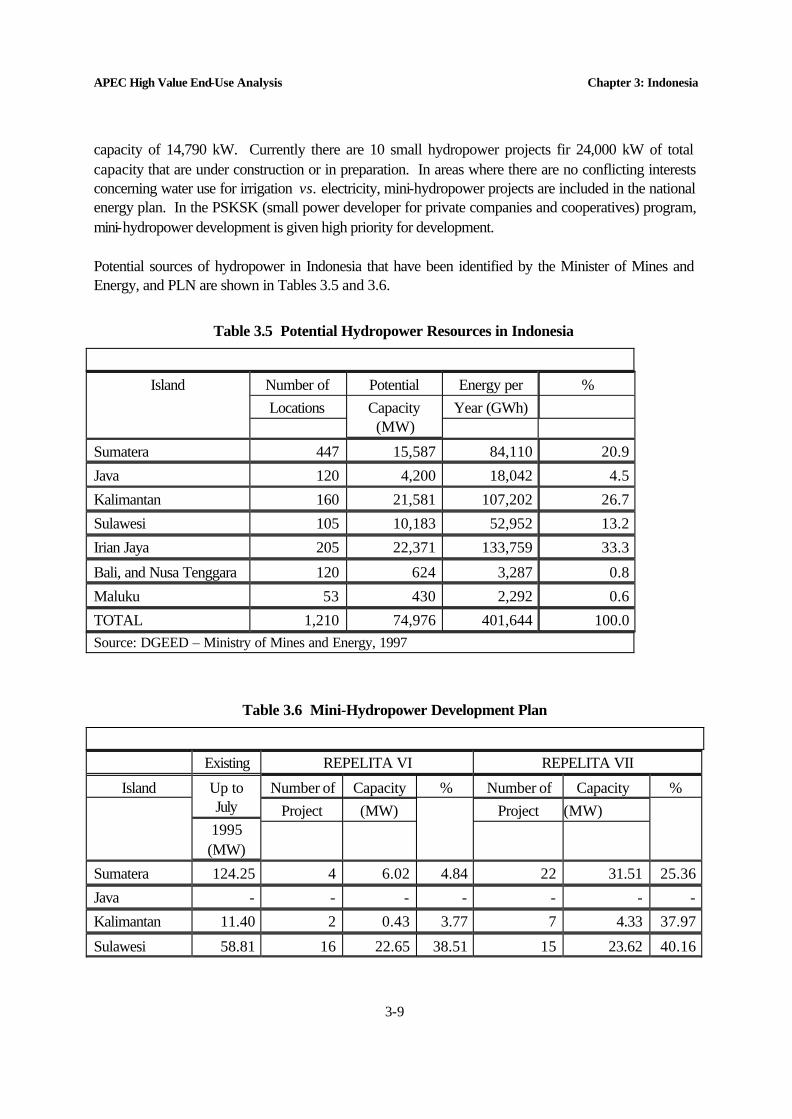


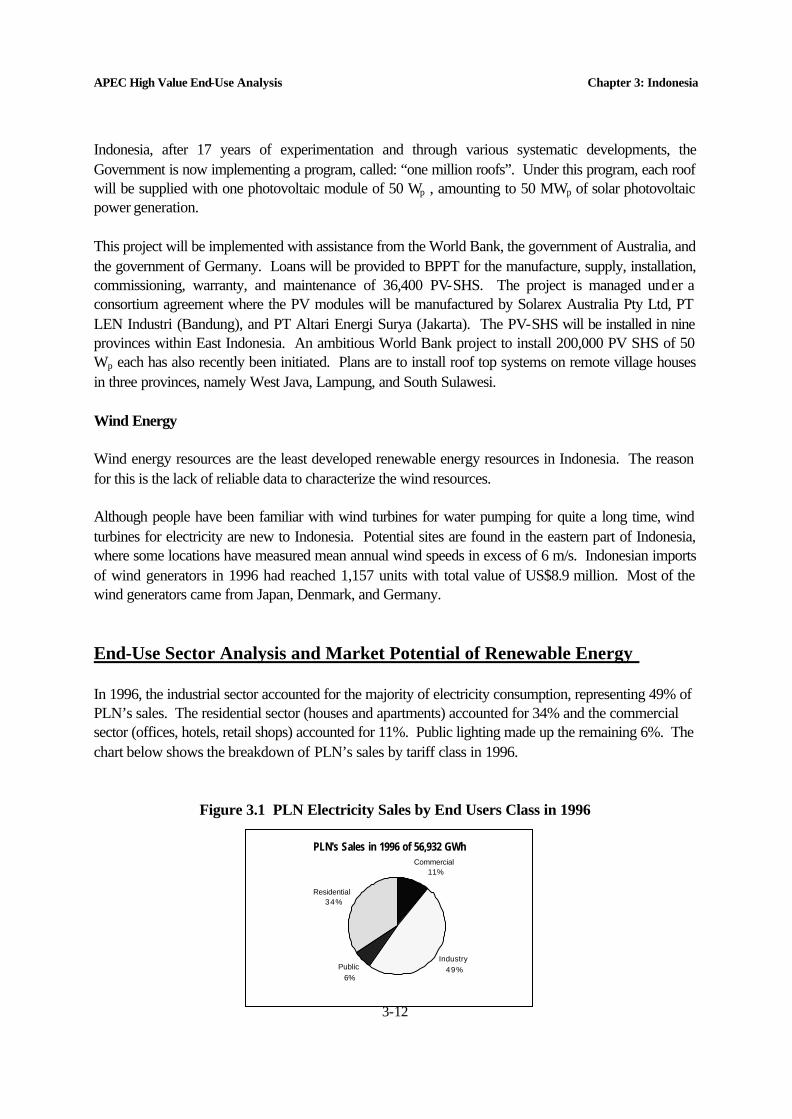

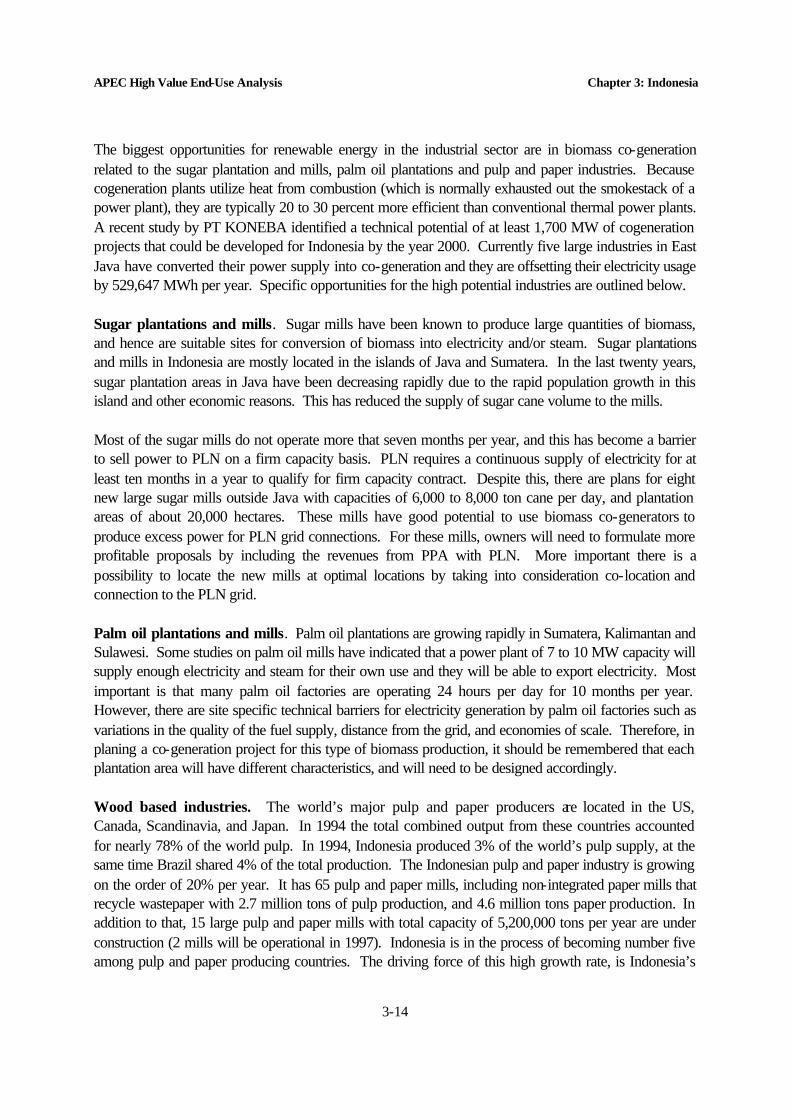


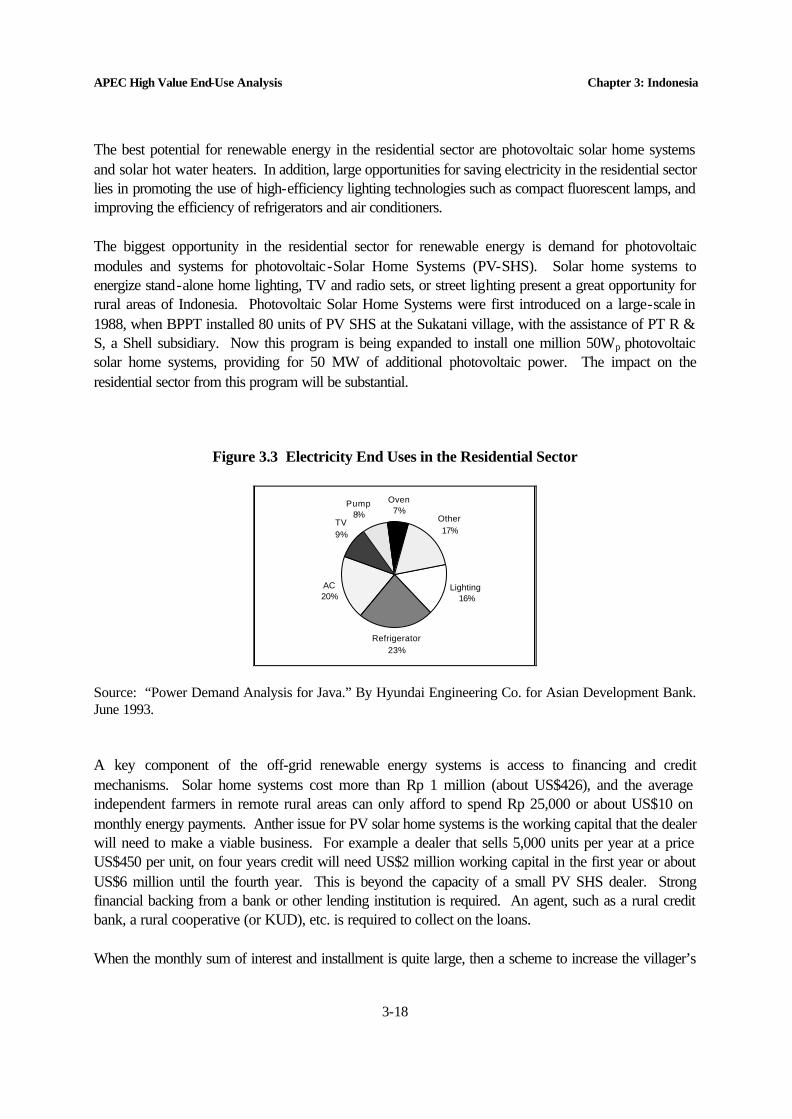


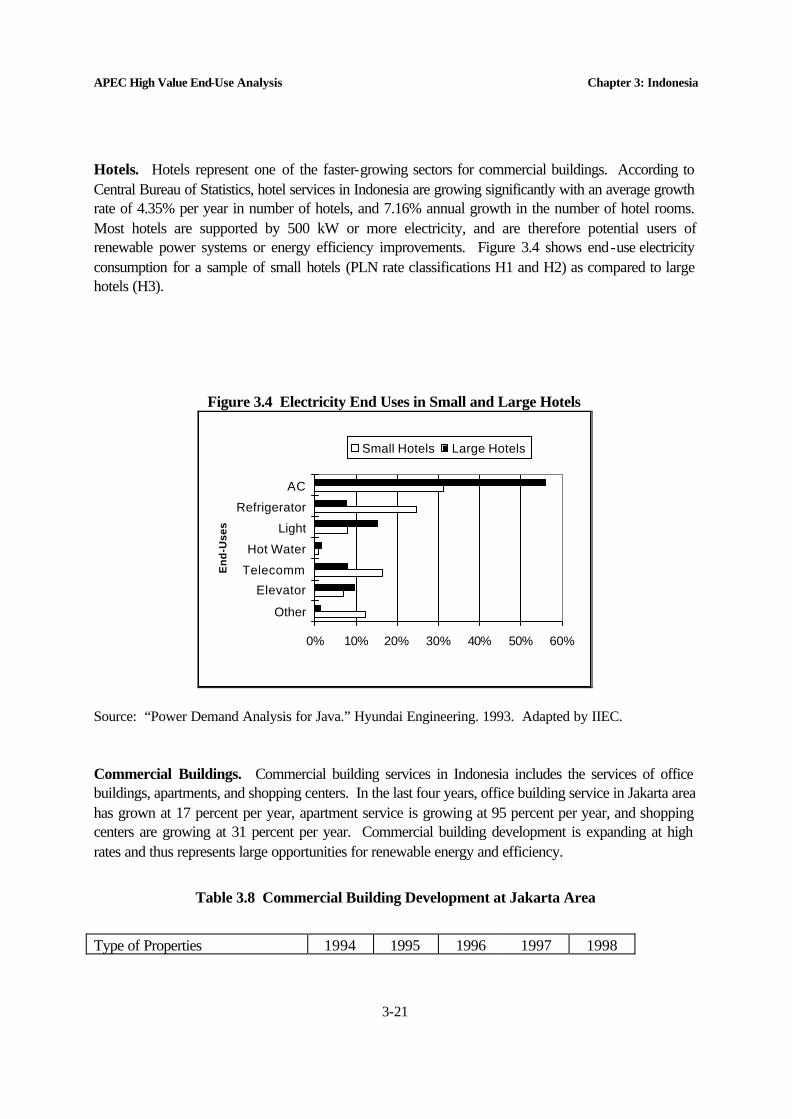


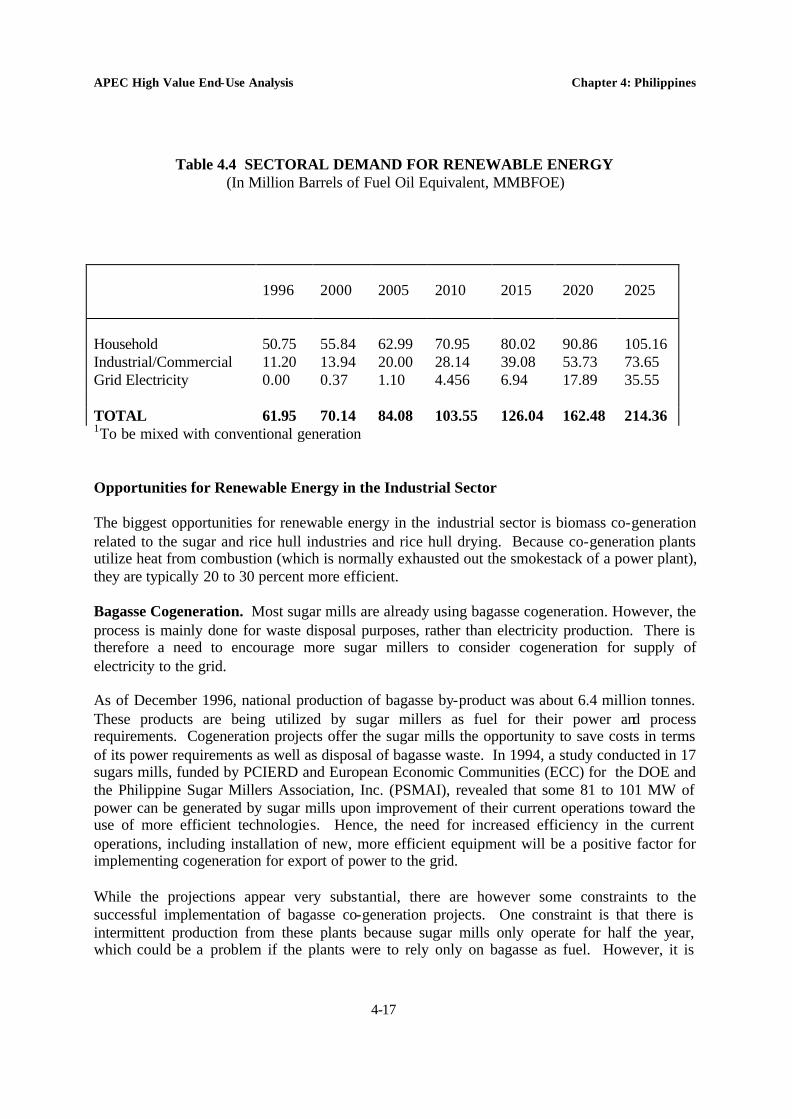


![APEC Connectivity Blueprint[2] - espas.euespas.eu/orbis/sites/default/files/generated/document/en/APEC... · APEC CONNECTIVITY BLUEPRINT FOR 2015-2025 ... Engagement with APEC Business](https://static.documents.pub/doc/80x56/5affac897f8b9a54578b773e/apec-connectivity-blueprint2-espas-connectivity-blueprint-for-2015-2025-.jpg)


