137
2012 Value of Professional Services Page 0 of 136
2012 Value of Professional Services Page 0 of 136

2012 Value of Professional Services Page 1 of 136
2012 SALARY SURVEY FOREWORD
The Value of Professional Services is one of APEGA’s most highly sought after documents distributed by Member Services. It provides APEGA members, both individual and corporations, with an unbiased salary and benefits comparison across a wide range of industries in Alberta. This year, 87 employers participated to give 9,500 APEGA member data points, representing APEGA’s 10 regional branches and 10 industry sectors. The purpose of this salary survey and the Value of Professional Services report is to encourage fair compensation for individual practitioners while helping corporations remain competitive in an aggressive labour market. APEGA encourages you to use this, along with any other resources you may have at your disposal, to ensure and/or to provide compensation that reflects the appropriate value, keeping in mind current labour-market conditions. We appreciate the effort required by the companies who participate in this survey. Without your help, this service would not be possible. If the over 13,000 hits by individual IP addresses this past year provides any indication, your efforts are appreciated by everyone. APEGA will continue to respond to requests to provide new information in new formats that you may find valuable. Any comments on the document are welcome and can be addressed to myself: Jessica Vandenberghe at (780) 426-3990 or (800) 661-7020 or [email protected]. Highlights of this report are also in the September 2012 PEG magazine. Thank you for your continued support and a special thanks to Laricina Energy Ltd. for supplying the cover photo for this year’s edition. Sincerely,
Jessica Vandenberghe, P.Eng., M.Sc. APEGA Director, Outreach and Member Services

2012 Value of Professional Services Page 2 of 136
2012 Value of Professional Services Page 3 of 136
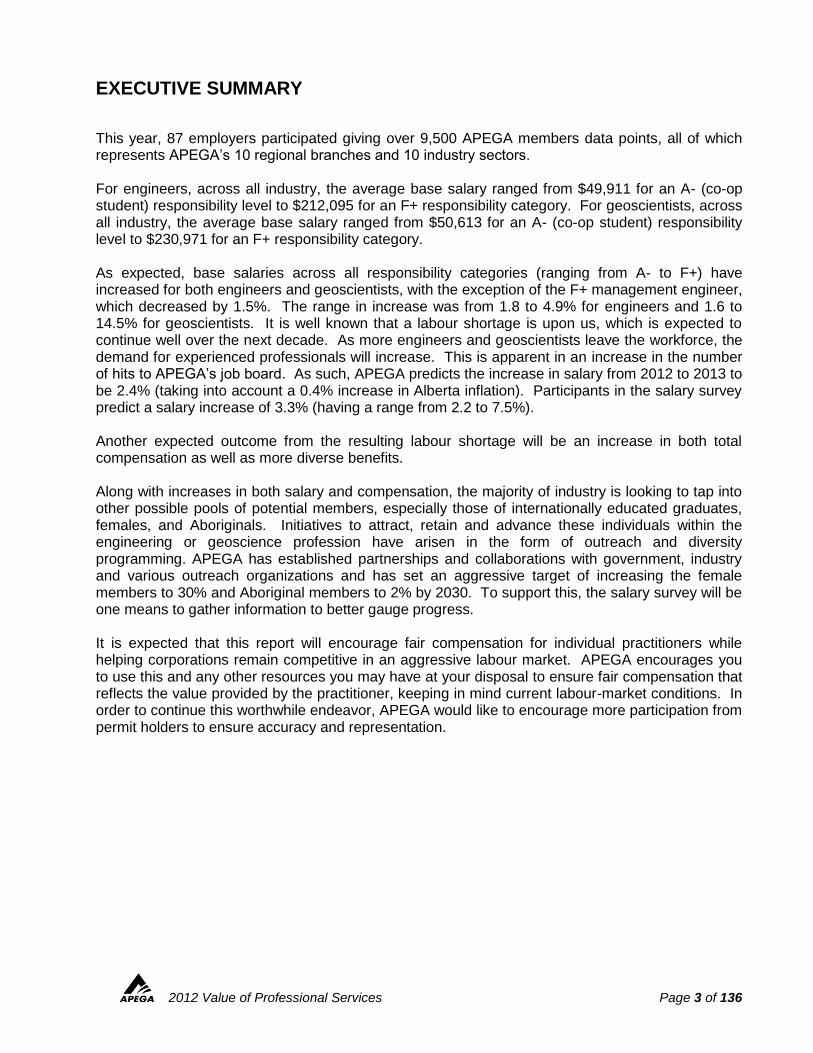
EXECUTIVE SUMMARY
This year, 87 employers participated giving over 9,500 APEGA members data points, all of which represents APEGA’s 10 regional branches and 10 industry sectors. For engineers, across all industry, the average base salary ranged from $49,911 for an A- (co-op student) responsibility level to $212,095 for an F+ responsibility category. For geoscientists, across all industry, the average base salary ranged from $50,613 for an A- (co-op student) responsibility level to $230,971 for an F+ responsibility category. As expected, base salaries across all responsibility categories (ranging from A- to F+) have increased for both engineers and geoscientists, with the exception of the F+ management engineer, which decreased by 1.5%. The range in increase was from 1.8 to 4.9% for engineers and 1.6 to 14.5% for geoscientists. It is well known that a labour shortage is upon us, which is expected to continue well over the next decade. As more engineers and geoscientists leave the workforce, the demand for experienced professionals will increase. This is apparent in an increase in the number of hits to APEGA’s job board. As such, APEGA predicts the increase in salary from 2012 to 2013 to be 2.4% (taking into account a 0.4% increase in Alberta inflation). Participants in the salary survey predict a salary increase of 3.3% (having a range from 2.2 to 7.5%). Another expected outcome from the resulting labour shortage will be an increase in both total compensation as well as more diverse benefits. Along with increases in both salary and compensation, the majority of industry is looking to tap into other possible pools of potential members, especially those of internationally educated graduates, females, and Aboriginals. Initiatives to attract, retain and advance these individuals within the engineering or geoscience profession have arisen in the form of outreach and diversity programming. APEGA has established partnerships and collaborations with government, industry and various outreach organizations and has set an aggressive target of increasing the female members to 30% and Aboriginal members to 2% by 2030. To support this, the salary survey will be one means to gather information to better gauge progress. It is expected that this report will encourage fair compensation for individual practitioners while helping corporations remain competitive in an aggressive labour market. APEGA encourages you to use this and any other resources you may have at your disposal to ensure fair compensation that reflects the value provided by the practitioner, keeping in mind current labour-market conditions. In order to continue this worthwhile endeavor, APEGA would like to encourage more participation from permit holders to ensure accuracy and representation.
2012 Value of Professional Services Page 4 of 136
TABLE OF CONTENTS EXECUTIVE SUMMARY 3 TABLE OF CONTENTS 4 LIST OF TABLES 6 LIST OF FIGURES 10 SALARY SURVEY OVERVIEW 12 APEGA Overview 12 Background and Purpose 13 Salary Survey Data Collection Method 13 Statistics of the 2012 Participants 14 HOW TO USE THE SALARY SURVEY 17 Overview 17 Definition and Terminology 17 STEP 1: Determine your Responsibility Category 21
STEP 2: Determine your 2012 Base Salary Results for your Responsibility Category 28 2012 Base Salary RESULTS 29 Data Outliers for Industry Data Set 29 All Industry Base Salary for Engineers 29 Base Salary by Industry Category for Engineers 30 All Industry Base Salary for Geoscientists 42 Base Salary by Industry Category for Geoscientists 43
STEP 3: Determine your Estimated Salary Adjustment 48 Inflation Factor 48 Demand Factor 48 Level of Performance Factor 49 STEP 4: Determine your 2012 Total Compensation Results for your Responsibility Category 50 2012 Total Compensation RESULTS 50 All Industry Total Compensation for Engineers 51 Total Compensation by Industry Category for Engineers 52 All Industry Total Compensation for Geoscientists 57 Total Compensation by Industry Category for Geoscientists 58 FULL SALARY SURVEY RESULTS 62 Overview 62 Gender Data by Responsibility Category for Engineers 62 Gender Data by Responsibility Category for Geoscientists 65 Gender Data by Industry Category for Engineers 68 Gender Data by Industry Category for Geoscientists 69 Location Data by Responsibility Category for Engineers 70 Location Data by Responsibility Category for Geoscientists 73 Years of Experience Data for Engineers 76 Years of Experience Data for Geoscientists 80 Company Size Data for Engineers 84 Company Size Data for Geoscientists 88 All Survey Data for Benefits 91 Salary Survey Results Relevant to University Students 92
2012 Value of Professional Services Page 5 of 136
TABLE OF CONTENTS REFERENCES 93 APPENDIX A: Salary Survey Questionnaire 94 APPENDIX B: List of 2012 Participating Companies 97 APPENDIX C: Advanced Method of Determining Responsibility Category 99 APPENDIX D: Sample Benchmark Job Descriptions and Corresponding Ratings 112 APPENDIX E: Outlier Data for Filtering 119 APPENDIX F: Raw Engineering Data Prior to Filtering 121 APPENDIX G: Raw Geoscientist Data Prior to Filtering 130
2012 Value of Professional Services Page 6 of 136
LIST OF TABLES Table 1: Number of APEGA’s Permit holders and Members per Location (as of June 30, 2012). 12 Table 2: Number of Participating Companies by Company Size. 14 Table 3: Number of Participating Employees Counted per Region, Designation, and Gender. 14 Table 4: Summary of Participating Companies by Industry Sector. 16 Table 5: Definitions of the Statistical Numbers Reported. 20 Table 6: Annual Engineer Base Salary for All Industries. 29 Table 7: Annual Engineer Base Salary Percentage Increase. 29 Table 8: Annual Engineer Base Salary Comparison between the Industry Categories. 30 Table 9: Annual Engineer Base Salary for within CONSULTING SERVICES. 32 Table 10: Annual Engineer Base Salary within ENGINEERING, PROCUREMENT, and CONSTRUCTION. 33 Table 11: Annual Engineer Base Salary within RESOURCE EXPLOITATION (except oil and gas). 34 Table 12: Annual Engineer Base Salary within RESOURCE EXPLOITATION (only oil and gas). 35 Table 13: Annual Engineer Base Salary within MANUFACTURING (durables). 36 Table 14: Annual Engineer Base Salary within MANUFACTURING (non-durables). 37 Table 15: Annual Engineer Base Salary within SERVICE AND CONTROL (not for profit). 38 Table 16: Annual Engineer Base Salary within SERVICE (for profit). 39 Table 17: Annual Engineer Base Salary within UTILITY (rate controlled). 40 Table 18: Annual Engineer Base Salary within ADVANCED TECHNOLOGIES. 41 Table 19: Annual Geoscientist Base Salary for All Industries. 42 Table 20: Annual Geoscientist Base Salary Percentage Increase. 42 Table 21: Annual Geoscientist Base Salary Comparison between the Industry Categories. 43 Table 22: Annual Geoscientist Base Salary within CONSULTING SERVICES. 45 Table 23: Annual Geoscientist Base Salary within RESOURCE EXPLOITATION (except oil and gas). 45 Table 24: Annual Geoscientist Base Salary within RESOURCE EXPLOITATION (only oil and gas). 46 Table 25: Annual Geoscientist Base Salary within SERVICE AND CONTROL (not for profit). 47 Table 26: Annual Geoscientist Base Salary within SERVICE (for profit). 47 Table 27: Benefits Overview from Participants. 51 Table 28: Annual Engineer Total Compensation for All Industries. 51 Table 29: Annual Engineer Total Compensation Comparison between Industry Categories. 52 Table 30: Annual Engineer Total Compensation within ENGINEERING CONSULTING SERVICES. 54 Table 31: Annual Engineer Total Compensation within ENGINEERING, PROCUREMENT, AND CONSTRUCTION. 54 Table 32: Annual Engineer Total Compensation within RESOURCE EXPLOITATION (except oil and gas). 54 Table 33: Annual Engineer Total Compensation within RESOURCE EXPLOITATION (only oil and gas). 54 Table 34: Annual Engineer Total Compensation within MANUFACTURING (durables). 55 Table 35: Annual Engineer Total Compensation within MANUFACTURING (non-durables). 55 Table 36: Annual Engineer Total Compensation within SERVICE (not for profit). 55 Table 37: Annual Engineer Total Compensation within SERVICE (for profit). 55 Table 38: Annual Engineer Total Compensation within UTILITY (rate controlled). 56 Table 39: Annual Engineer Total Compensation within ADVANCED TECHNOLOGIES. 56 Table 40: Annual Geoscientist Total Compensation for All Industries. 57 Table 41: Annual Geoscientist Total Compensation Comparison between Industry Categories. 58 Table 42: Annual Geoscientist Total Compensation within CONSULTING SERVICES. 60 Table 43: Annual Geoscientist Total Compensation within RESOURCE EXPLOITATION (except oil and gas). 60 Table 44: Annual Geoscientist Total Compensation within RESOURCE EXPLOITATION (only oil and gas).60 Table 45: Annual Geoscientist Total Compensation within SERVICE AND CONTROL (not for profit). 60 Table 46: Annual Geoscientist Total Compensation within SERVICE (for profit). 61 Table 47: Gender Distribution for Responsibility Category for Engineers. 62 Table 48: Salary Comparison by Gender for Responsibility Category for Engineers. 63 Table 49: Male Engineer Annual Base Salary Data for All Industries. 64 Table 50: Female Engineer Annual Base Salary Data for All Industries. 64
2012 Value of Professional Services Page 7 of 136
LIST OF TABLES Table 51: Undeclared Gender Engineer Annual Base Salary Data for All Industries. 64 Table 52: Gender Distribution for Responsibility Category for Geoscientists. 65 Table 53: Salary Comparison by Gender for Responsibility Category for Geoscientists. 66
Table 54: Male Geoscientist Annual Base Salary Data for All Industries. 66 Table 55: Female Geoscientist Annual Base Salary Data for All Industries. 67
Table 56: Undeclared Gender Geoscientist Annual Base Salary Data for All Industries. 67 Table 57: Gender Data by Industry Category for Engineers. 68 Table 58: Gender Data by Industry Category for Geoscientists. 69 Table 59: Participants by Location and Gender for Engineers. 70 Table 60: Impact of Location by Responsibility Category on Base Salary for Engineers. 71 Table 61: Impact of Location by Responsibility Category on Base Salary for Male Engineers. 71 Table 62: Impact of Location by Responsibility Category on Base Salary for Female Engineers. 71 Table 63: Impact of Location by Responsibility Category on Base Salary for Undeclared Gender Engineers. 71 Table 64: Participants by Location and Gender for Geoscientists. 73 Table 65: Impact of Location by Responsibility Category on Base Salary for Geoscientists. 75 Table 66: Impact of Location by Responsibility Category on Base Salary for Male Geoscientists. 75 Table 67: Impact of Location by Responsibility Category on Base Salary for Female Geoscientists. 75 Table 68: Impact of Location by Responsibility Category on Base Salary for Undeclared Gender Geoscientists. 75 Table 69: Participants by Gender for Years of Experience Since Graduation for Engineers. 77 Table 70: Base Salary by Years of Experience Since Graduation for Engineers. 78 Table 71: Base Salary by Years of Experience and Responsibility Category for Engineers. 78 Table 72: Participants by Gender for Years of Experience Since Graduation for Geoscientists. 81 Table 73: Base Salary by Years of Experience Since Graduation for Geoscientists. 82 Table 74: Base Salary by Years of Experience and Responsibility Category for Geoscientists. 82 Table 75: Company Size Annual Engineer Base Salary for All Industries. 84 Table 76: Annual Engineer Base Salary for Company Size 1 to 10 Employees. 86 Table 77: Annual Engineer Base Salary for Company Size 11 to 20 Employees. 86 Table 78: Annual Engineer Base Salary for Company Size 21 to 50 Employees. 86 Table 79: Annual Engineer Base Salary for Company Size 51 to 100 Employees. 86 Table 80: Annual Engineer Base Salary for Company Size 101 to 250 Employees. 87 Table 81: Annual Engineer Base Salary for Company Size 251 to 500 Employees. 87 Table 82: Annual Engineer Base Salary for Company Size over 500 Employees. 87 Table 83: Company Size Annual Geoscientist Base Salary for All Industries. 88 Table 84: Annual Geoscientist Base Salary for Company Size 11 to 20 Employees. 88 Table 85: Annual Geoscientist Base Salary for Company Size 51 to 100 Employees. 88 Table 86: Annual Geoscientist Base Salary for Company Size 101 to 250 Employees. 88 Table 87: Annual Geoscientist Base Salary for Company Size 251 to 500 Employees. 89 Table 88: Annual Geoscientist Base Salary for Company Size over 500 Employees. 89 Table 89: Number of Work Hours for the Participant Companies. 91 Table 90: Data for Vacation Entitlement by Years of Service. 91 Table 91: Gender Data for Participating Engineer Co-op Students. 92 Table 92: Annual Base Salary for Engineering Co-op Students. 92 Table 93: Gender Data by Graduate Degree for Engineers. 92 Table 94: Annual Base Salary by Graduate Degree for Engineers. 92 Table C1: Blank Form to Determine your Job Factor Rating. 99 Table C2: Determining your Responsibility Category and Job Title. 99 Table C3: Description and Points for Duties Job Factor. 100 Table C4: Description and Points for Education Required Job Factor. 102 Table C5: Description and Points for Experience Required Job Factor. 102 Table C6: Description and Points for Decision Making Job Factor. 103 Table C7: Description and Points for Supervision Received Job Factor. 104 Table C8: Description and Points for your Supervisory Authority Job Factor. 105
Table C9: Description and Points for your Supervisory Extent Job Factor. 106
2012 Value of Professional Services Page 8 of 136
LIST OF TABLES Table C10: Description and Points for Physical Demands Job Factor. 107 Table C11: Description and Points for Job Environment Job Factor. 108 Table C12: Description and Points for Job Related Travel Job Factor. 109 Table C13: Description and Points for Job Safety Job Factor. 110 Table E1: All Industry Outlier Data. 119 Table E2: Outlier Data for each Industry Category. 119 Table E3: Outlier Data for Years of Experience Data Set. 120 Table E4: Company Size Data Set Outliers. 120 Table F1: Annual Engineer Base Salary for All Industries (Raw Data). 121 Table F2: Annual Engineer Base Salary for All Industries over the Past 10 Years (Filtered Data for Figure). 121 Table F3: Annual Engineer Base Salary for within CONSULTING SERVICES (Raw Data). 121 Table F4: 10 Year Trend for Annual Engineer Base Salary for within CONSULTING SERVICES (Filtered Data for Figure). 122 Table F5: Annual Engineer Base Salary within ENGINEERING, PROCUREMENT, and CONSTRUCTION (Raw Data). 122 Table F6: 10 Year Trend for Annual Engineer Base Salary for within ENGINEERING, PROCUREMENT, and CONSTRUCTION (Filtered Data for Figure). 122 Table F7: Annual Engineer Base Salary within RESOURCE EXPLOITATION (except oil and gas) (Raw Data). 123 Table F8: 10 Year Trend for Annual Engineer Base Salary within RESOURCE EXPLOITATION (except oil and gas) (Filtered Data for Figure). 123 Table F9: Annual Engineer Base Salary within RESOURCE EXPLOITATION (only oil and gas) (Raw Data). 123 Table F10: 10 Year Trend for Annual Engineer Base Salary within RESOURCE EXPLOITATION (only oil and gas) (Filtered Data for Figure). 124 Table F11: Annual Engineer Base Salary within MANUFACTURING (durables) (Raw Data). 124 Table F12: 10 Year Trend for Annual Engineer Base Salary within MANUFACTURING (durables) (Filtered Data for Figure). 124 Table F13: Annual Engineer Base Salary within MANUFACTURING (non-durables) (Raw Data). 125 Table F14: 10 Year Trend for Annual Engineer Base Salary within MANUFACTURING (non-durables) (Filtered Data for Figure). 125 Table F15: Annual Engineer Base Salary within SERVICE AND CONTROL (not for profit) (Raw Data). 125 Table F16: 10 Year Trend for Annual Engineer Base Salary within SERVICE AND CONTROL (not for profit) (Filtered Data for Figure). 126 Table F17: Annual Engineer Base Salary within SERVICE (for profit) (Raw Data). 126 Table F18: 10 Year Trend for Annual Engineer Base Salary within SERVICE (for profit) (Filtered Data for Figure). 126 Table F19: Annual Engineer Base Salary within UTILITY (rate controlled) (Raw Data). 127 Table F20: 10 Year Trend for Annual Engineer Base Salary within UTILITY (rate controlled) (Filtered Data for Figure). 127 Table F21: Annual Engineer Base Salary within ADVANCED TECHNOLOGIES (Raw Data). 127 Table F22: 10 Year Trend for Annual Engineer Base Salary within ADVANCED TECHNOLOGIES (Filtered Data for Figure). 128 Table F23: 10 Year Trend for Annual Engineer Total Compensation for All Industries (Filtered Data for Figure) 128 Table F24: Base Salary by Years of Experience Since Graduation for Engineers (Raw Data). 128 Table F25: Annual Engineer Base Salary for Company Size 51 to 100 Employees (Raw Data). 129 Table F26: Annual Engineer Base Salary for Company Size 251 to 500 Employees (Raw Data). 129 Table F27: Annual Engineer Base Salary for Company Size over 500 Employees (Raw Data). 129 Table G1: Annual Geoscientists Base Salary for All Industries (Raw Data). 130 Table G2: Annual Geoscientist Base Salary for All Industries over the Past 10 Years (Filtered Data for Figure). 130
2012 Value of Professional Services Page 9 of 136
LIST OF TABLES Table G3: Annual Geoscientist Base Salary within CONSULTING SERVICES (Raw Data). 130 Table G4: 10 Year Trend for Annual Geoscientist Base Salary within CONSULTING SERVICES (Filtered Data for Figure). 131 Table G5: 10 Year Trend for Annual Geoscientist Base Salary within ENGINEERING, PROCUREMENT, and CONSTRUCTION (Filtered Data). 131 Table G6: 10 Year Trend for Annual Geoscientist Base Salary within RESOURCE EXPLOITATION (except oil and gas) (Filtered Data). 132 Table G7: 10 Year Trend for Annual Geoscientist Base Salary within RESOURCE EXPLOITATION (only oil and gas) (Filtered Data for Figure). 132 Table G8: 10 Year Trend for Annual Geoscientist Base Salary within MANUFACTURING (durables) (Filtered Data). 133 Table G9: 10 Year Trend for Annual Geoscientist Base Salary within MANUFACTURING (non-durables) (Filtered Data). 133 Table G10: 10 Year Trend for Annual Geoscientist Base Salary within SERVICE (not for profit) (Filtered Data for Figure). 134 Table G11: 10 Year Trend for Annual Geoscientist Base Salary within SERVICE (for profit) (Filtered Data). 134 Table G12: 10 Year Trend for Annual Geoscientist Base Salary within UTILITY (rate controlled) (Filtered Data). 135 Table G13: 10 Year Trend for Annual Geoscientist Base Salary within ADVANCED TECHNOLOGIES (Filtered Data). 135 Table G14: 10 Year Trend for Annual Geoscientist Total Compensation for All Industries (Filtered Data for Figure). 136 Table G15: Base Salary by Years of Experience Since Graduation for Geoscientists (Raw Data). 136 Table G16: Annual Geoscientist Base Salary for Company Size over 500 Employees (Raw Data). 136
2012 Value of Professional Services Page 10 of 136
LIST OF FIGURES Figure 1: APEGA’s Regional Branches throughout Alberta. 13 Figure 2: The Components of Salary used within this Report. 17 Figure 3: The Components of Benefits used within this Report. 18 Figure 4: A Pictorial Definition of the Statistical Numbers Reported. 20 Figure 5: Overview of Generic Titles based on Responsibility Categories. 22 Figure 6: Annual Engineer Base Salary for All Industries over the Past 10 Years. 30 Figure 7: Annual Engineer Base Salary Comparison between the Industry Categories. 31 Figure 8: 10 Year Trend for Annual Engineer Base Salary for within CONSULTING SERVICES. 32 Figure 9: 10 Year Trend for Annual Engineer Base Salary for within ENGINEERING, PROCUREMENT, and CONSTRUCTION. 33 Figure 10: 10 Year Trend for Annual Engineer Base Salary within RESOURCE EXPLOITATION (except oil and gas). 34 Figure 11: 10 Year Trend for Annual Engineer Base Salary within RESOURCE EXPLOITATION (only oil and gas). 35 Figure 12: 10 Year Trend for Annual Engineer Base Salary within MANUFACTURING (durables). 36 Figure 13: 10 Year Trend for Annual Engineer Base Salary within MANUFACTURING (non-durables). 37 Figure 14: 10 Year Trend for Annual Engineer Base Salary within SERVICE AND CONTROL (not for profit). 38 Figure 15: 10 Year Trend for Annual Engineer Base Salary within SERVICE (for profit). 39 Figure 16: 10 Year Trend for Annual Engineer Base Salary within UTILITY (rate controlled). 40 Figure 17: 10 Year Trend for Annual Engineer Base Salary within ADVANCED TECHNOLOGIES. 41 Figure 18: Annual Geoscientist Base Salary for All Industries over the Past 10 Years. 42 Figure 19: Annual Geoscientist Base Salary Comparison between the Industry Categories. 44 Figure 20: 10 Year Trend for Annual Geoscientist Base Salary within CONSULTING SERVICES. 45 Figure 21: 10 Year Trend for Annual Geoscientist Base Salary within RESOURCE EXPLOITATION (only oil and gas). 46 Figure 22: 10 Year Trend for Annual Geoscientist Base Salary within SERVICE AND CONTROL (not for profit). 47 Figure 23: Trend of Consumer Price Index. 48 Figure 24: 10 Year Trend for Annual Engineer Total Compensation for All Industries. 52 Figure 25: Annual Engineer Total Compensation Comparison between Industry Categories. 53 Figure 26: 10 Year Trend for Annual Geoscientist Total Compensation for All Industries. 57 Figure 27: Annual Geoscientist Total Compensation Comparison between Industry Categories. 59 Figure 28: Gender Distribution based on Responsibility Category for Engineers. 62 Figure 29: Salary Comparison by Gender across the Responsibility Categories for Engineers. 63 Figure 30: Gender Distribution based on Responsibility Category for Geoscientists. 65 Figure 31: Salary Comparison by Gender across the Responsibility Categories for Geoscientists. 66 Figure 32: Gender Comparison across Industry Categories for Engineers. 68 Figure 33: Gender Comparison across Industry Categories for Geoscientists. 69 Figure 34: Participants by Location and Gender for Engineers. 70 Figure 35: Comparison of Base Salary by Location and Responsibility Category for Engineers. 72 Figure 36: Participants by Location and Gender for Geoscientists. 73 Figure 37: Comparison of Base Salary by Location and Responsibility Category for Geoscientists. 74 Figure 38: Participants by Years of Experience Since Graduation for Engineers. 76 Figure 39: Participants by Gender for Years of Experience Since Graduation for Engineers. 77 Figure 40: Trend for Base Salary by Years of Experience Since Graduation for Engineers. 78 Figure 41: Base Salary Comparison by Years of Experience and Responsibility Category for Engineers. 79 Figure 42: Participants by Years of Experience Since Graduation for Geoscientists. 80 Figure 43: Participants by Gender for Years of Experience Since Graduation for Geoscientists. 81 Figure 44: Trend for Base Salary by Years of Experience Since Graduation for Geoscientists. 82 Figure 45: Base Salary by Years of Experience and Responsibility Category for Geoscientists. 83 Figure 46: Comparison of Base Salary across Company Size Categories for Engineers. 85 Figure 47: Comparison of Base Salary across Company Size Categories for Geoscientists. 90 Figure 48: Number of Work Hours for the Participant Companies. 91

2012 Value of Professional Services Page 11 of 136
2012 Value of Professional Services Page 12 of 136
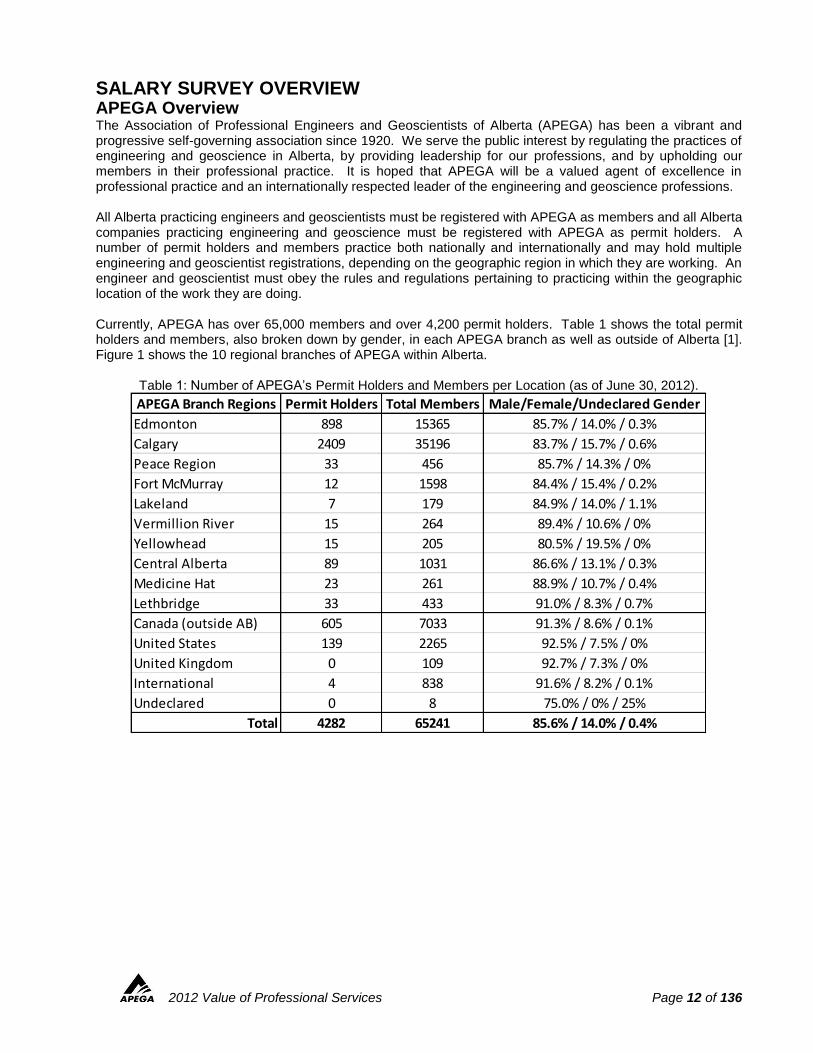
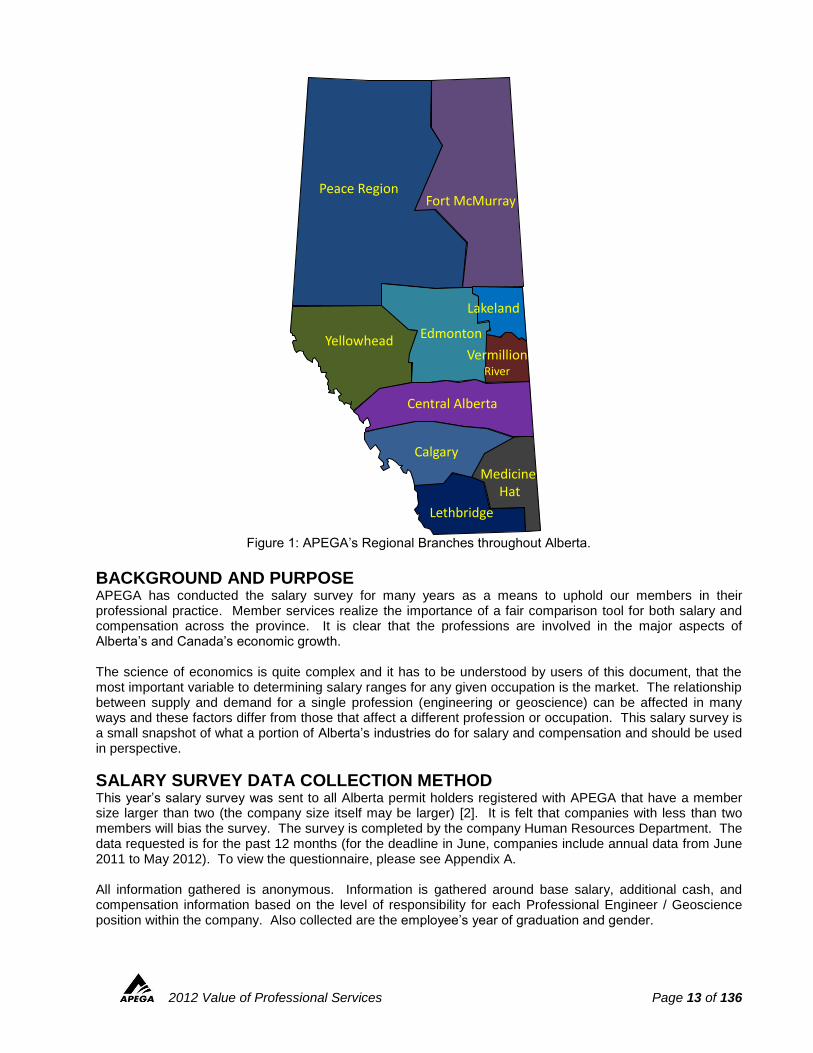
SALARY SURVEY OVERVIEW APEGA Overview The Association of Professional Engineers and Geoscientists of Alberta (APEGA) has been a vibrant and progressive self-governing association since 1920. We serve the public interest by regulating the practices of engineering and geoscience in Alberta, by providing leadership for our professions, and by upholding our members in their professional practice. It is hoped that APEGA will be a valued agent of excellence in professional practice and an internationally respected leader of the engineering and geoscience professions. All Alberta practicing engineers and geoscientists must be registered with APEGA as members and all Alberta companies practicing engineering and geoscience must be registered with APEGA as permit holders. A number of permit holders and members practice both nationally and internationally and may hold multiple engineering and geoscientist registrations, depending on the geographic region in which they are working. An engineer and geoscientist must obey the rules and regulations pertaining to practicing within the geographic location of the work they are doing. Currently, APEGA has over 65,000 members and over 4,200 permit holders. Table 1 shows the total permit holders and members, also broken down by gender, in each APEGA branch as well as outside of Alberta [1]. Figure 1 shows the 10 regional branches of APEGA within Alberta.
Table 1: Number of APEGA’s Permit Holders and Members per Location (as of June 30, 2012).
APEGA Branch Regions Permit Holders Total Members Male/Female/Undeclared Gender
Edmonton 898 15365 85.7% / 14.0% / 0.3%
Calgary 2409 35196 83.7% / 15.7% / 0.6%
Peace Region 33 456 85.7% / 14.3% / 0%
Fort McMurray 12 1598 84.4% / 15.4% / 0.2%
Lakeland 7 179 84.9% / 14.0% / 1.1%
Vermillion River 15 264 89.4% / 10.6% / 0%
Yellowhead 15 205 80.5% / 19.5% / 0%
Central Alberta 89 1031 86.6% / 13.1% / 0.3%
Medicine Hat 23 261 88.9% / 10.7% / 0.4%
Lethbridge 33 433 91.0% / 8.3% / 0.7%
Canada (outside AB) 605 7033 91.3% / 8.6% / 0.1%
United States 139 2265 92.5% / 7.5% / 0%
United Kingdom 0 109 92.7% / 7.3% / 0%
International 4 838 91.6% / 8.2% / 0.1%
Undeclared 0 8 75.0% / 0% / 25%
Total 4282 65241 85.6% / 14.0% / 0.4%
2012 Value of Professional Services Page 13 of 136
Figure 1: APEGA’s Regional Branches throughout Alberta.
BACKGROUND AND PURPOSE APEGA has conducted the salary survey for many years as a means to uphold our members in their professional practice. Member services realize the importance of a fair comparison tool for both salary and compensation across the province. It is clear that the professions are involved in the major aspects of Alberta’s and Canada’s economic growth. The science of economics is quite complex and it has to be understood by users of this document, that the most important variable to determining salary ranges for any given occupation is the market. The relationship between supply and demand for a single profession (engineering or geoscience) can be affected in many ways and these factors differ from those that affect a different profession or occupation. This salary survey is a small snapshot of what a portion of Alberta’s industries do for salary and compensation and should be used in perspective.
SALARY SURVEY DATA COLLECTION METHOD This year’s salary survey was sent to all Alberta permit holders registered with APEGA that have a member size larger than two (the company size itself may be larger) [2]. It is felt that companies with less than two members will bias the survey. The survey is completed by the company Human Resources Department. The data requested is for the past 12 months (for the deadline in June, companies include annual data from June 2011 to May 2012). To view the questionnaire, please see Appendix A. All information gathered is anonymous. Information is gathered around base salary, additional cash, and compensation information based on the level of responsibility for each Professional Engineer / Geoscience position within the company. Also collected are the employee’s year of graduation and gender.
Peace RegionFort McMurray
EdmontonYellowhead
Lakeland
VermillionRiver
Central Alberta
Calgary
Medicine Hat
Lethbridge
2012 Value of Professional Services Page 14 of 136
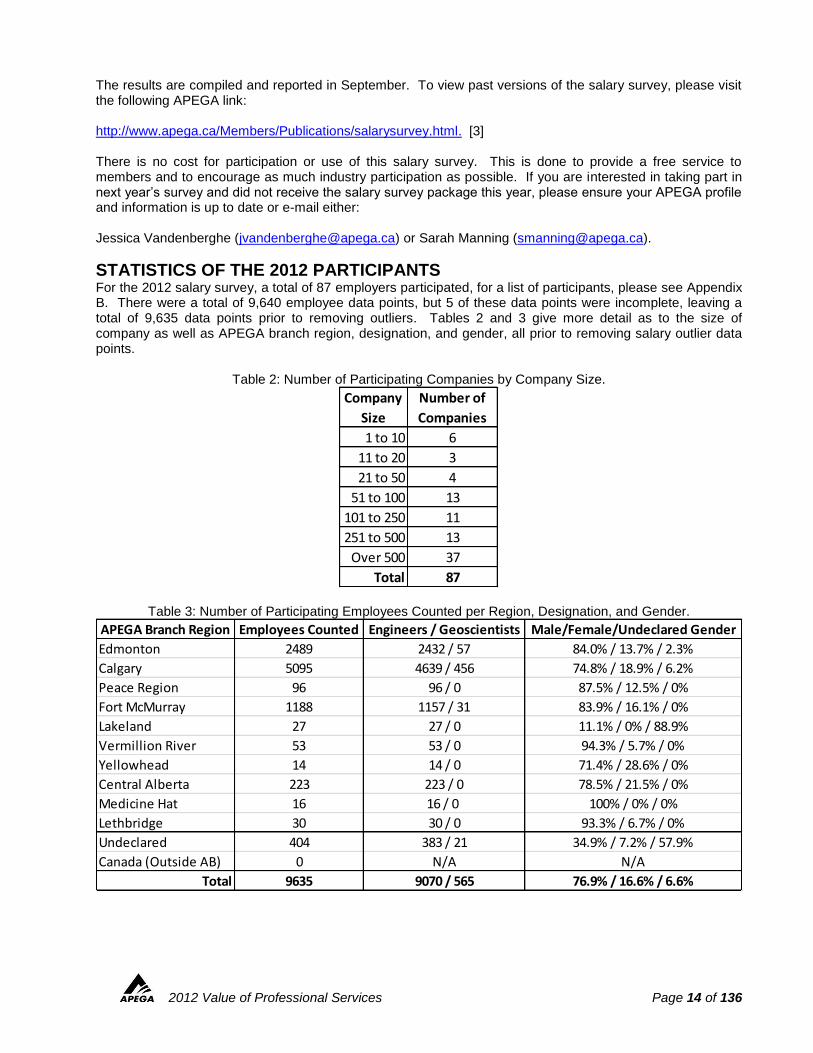
The results are compiled and reported in September. To view past versions of the salary survey, please visit the following APEGA link: http://www.apega.ca/Members/Publications/salarysurvey.html. [3] There is no cost for participation or use of this salary survey. This is done to provide a free service to members and to encourage as much industry participation as possible. If you are interested in taking part in next year’s survey and did not receive the salary survey package this year, please ensure your APEGA profile and information is up to date or e-mail either: Jessica Vandenberghe ([email protected]) or Sarah Manning ([email protected]).
STATISTICS OF THE 2012 PARTICIPANTS For the 2012 salary survey, a total of 87 employers participated, for a list of participants, please see Appendix B. There were a total of 9,640 employee data points, but 5 of these data points were incomplete, leaving a total of 9,635 data points prior to removing outliers. Tables 2 and 3 give more detail as to the size of company as well as APEGA branch region, designation, and gender, all prior to removing salary outlier data points.
Table 2: Number of Participating Companies by Company Size.
Table 3: Number of Participating Employees Counted per Region, Designation, and Gender.
Company
Size
Number of
Companies
1 to 10 6
11 to 20 3
21 to 50 4
51 to 100 13
101 to 250 11
251 to 500 13
Over 500 37
Total 87
APEGA Branch Region Employees Counted Engineers / Geoscientists Male/Female/Undeclared Gender
Edmonton 2489 2432 / 57 84.0% / 13.7% / 2.3%
Calgary 5095 4639 / 456 74.8% / 18.9% / 6.2%
Peace Region 96 96 / 0 87.5% / 12.5% / 0%
Fort McMurray 1188 1157 / 31 83.9% / 16.1% / 0%
Lakeland 27 27 / 0 11.1% / 0% / 88.9%
Vermillion River 53 53 / 0 94.3% / 5.7% / 0%
Yellowhead 14 14 / 0 71.4% / 28.6% / 0%
Central Alberta 223 223 / 0 78.5% / 21.5% / 0%
Medicine Hat 16 16 / 0 100% / 0% / 0%
Lethbridge 30 30 / 0 93.3% / 6.7% / 0%
Undeclared 404 383 / 21 34.9% / 7.2% / 57.9%
Canada (Outside AB) 0 N/A N/A
Total 9635 9070 / 565 76.9% / 16.6% / 6.6%
2012 Value of Professional Services Page 15 of 136
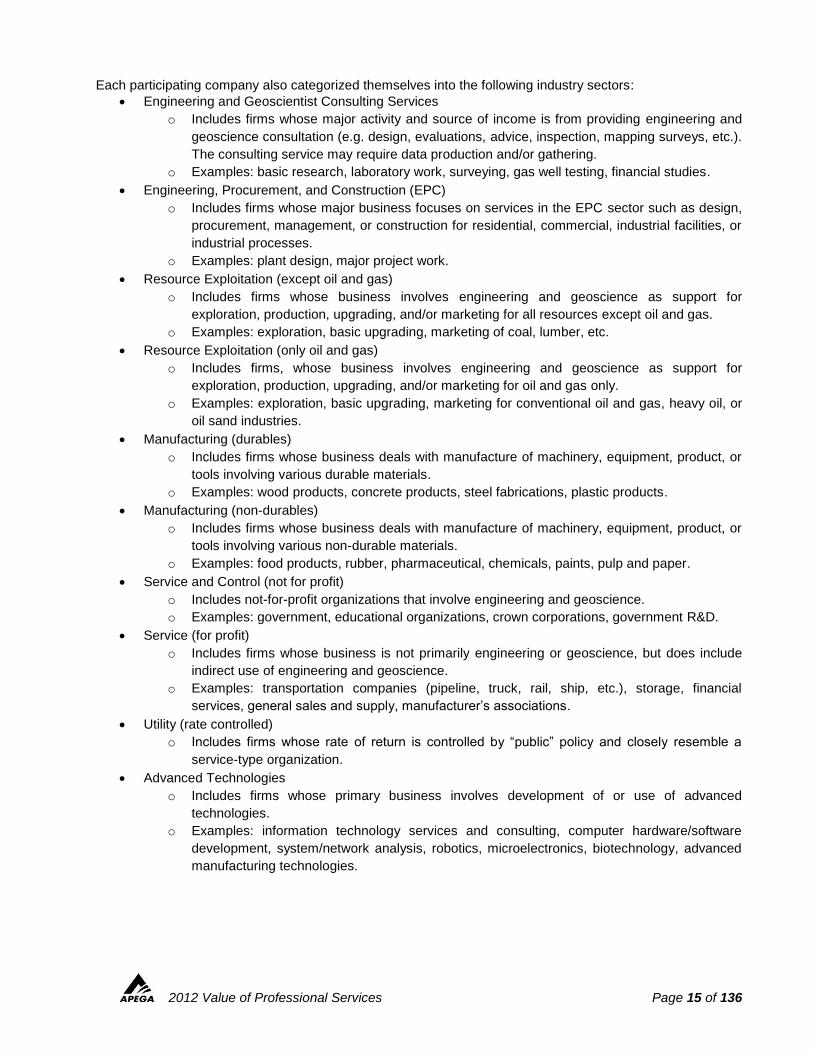
Each participating company also categorized themselves into the following industry sectors:
Engineering and Geoscientist Consulting Services
o Includes firms whose major activity and source of income is from providing engineering and
geoscience consultation (e.g. design, evaluations, advice, inspection, mapping surveys, etc.).
The consulting service may require data production and/or gathering.
o Examples: basic research, laboratory work, surveying, gas well testing, financial studies.
Engineering, Procurement, and Construction (EPC)
o Includes firms whose major business focuses on services in the EPC sector such as design,
procurement, management, or construction for residential, commercial, industrial facilities, or
industrial processes.
o Examples: plant design, major project work.
Resource Exploitation (except oil and gas)
o Includes firms whose business involves engineering and geoscience as support for
exploration, production, upgrading, and/or marketing for all resources except oil and gas.
o Examples: exploration, basic upgrading, marketing of coal, lumber, etc.
Resource Exploitation (only oil and gas)
o Includes firms, whose business involves engineering and geoscience as support for
exploration, production, upgrading, and/or marketing for oil and gas only.
o Examples: exploration, basic upgrading, marketing for conventional oil and gas, heavy oil, or
oil sand industries.
Manufacturing (durables)
o Includes firms whose business deals with manufacture of machinery, equipment, product, or
tools involving various durable materials.
o Examples: wood products, concrete products, steel fabrications, plastic products.
Manufacturing (non-durables)
o Includes firms whose business deals with manufacture of machinery, equipment, product, or
tools involving various non-durable materials.
o Examples: food products, rubber, pharmaceutical, chemicals, paints, pulp and paper.
Service and Control (not for profit)
o Includes not-for-profit organizations that involve engineering and geoscience.
o Examples: government, educational organizations, crown corporations, government R&D.
Service (for profit)
o Includes firms whose business is not primarily engineering or geoscience, but does include
indirect use of engineering and geoscience.
o Examples: transportation companies (pipeline, truck, rail, ship, etc.), storage, financial
services, general sales and supply, manufacturer’s associations.
Utility (rate controlled)
o Includes firms whose rate of return is controlled by “public” policy and closely resemble a
service-type organization.
Advanced Technologies
o Includes firms whose primary business involves development of or use of advanced
technologies.
o Examples: information technology services and consulting, computer hardware/software
development, system/network analysis, robotics, microelectronics, biotechnology, advanced
manufacturing technologies.
2012 Value of Professional Services Page 16 of 136
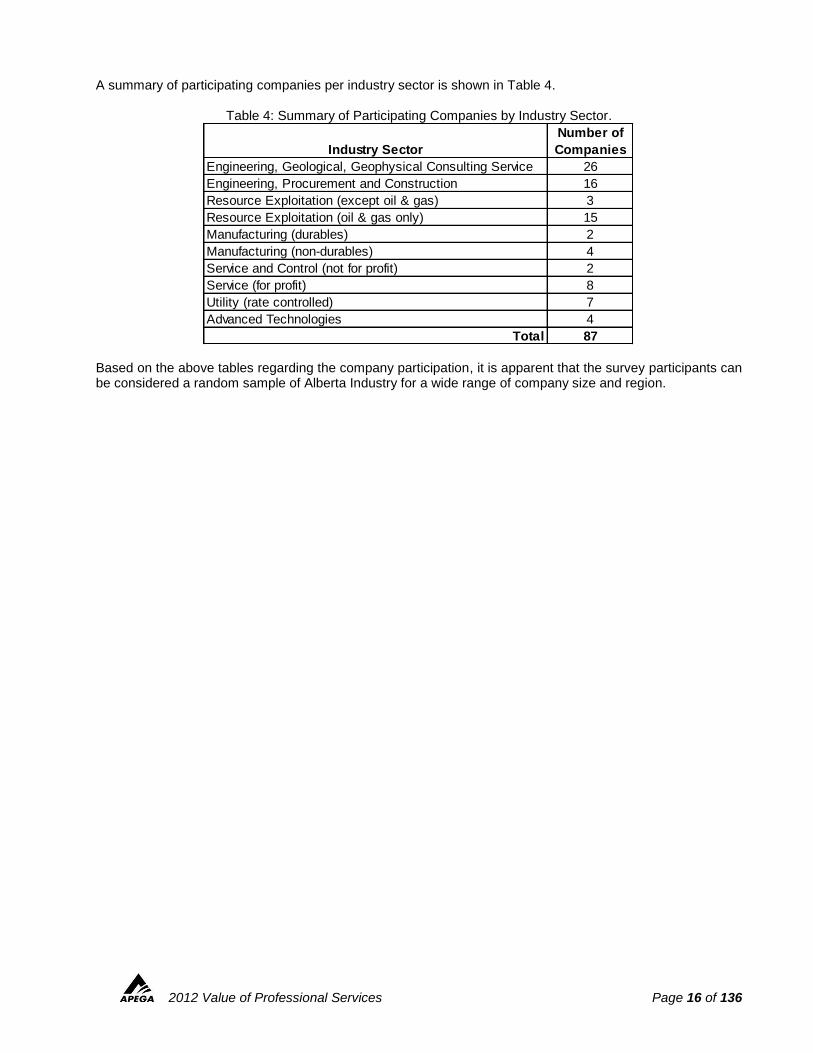
A summary of participating companies per industry sector is shown in Table 4.
Table 4: Summary of Participating Companies by Industry Sector.
Based on the above tables regarding the company participation, it is apparent that the survey participants can be considered a random sample of Alberta Industry for a wide range of company size and region.
Industry Sector
Number of
Companies
Engineering, Geological, Geophysical Consulting Service 26
Engineering, Procurement and Construction 16
Resource Exploitation (except oil & gas) 3
Resource Exploitation (oil & gas only) 15
Manufacturing (durables) 2
Manufacturing (non-durables) 4
Service and Control (not for profit) 2
Service (for profit) 8
Utility (rate controlled) 7
Advanced Technologies 4
Total 87
2012 Value of Professional Services Page 17 of 136
HOW TO USE THE SALARY SURVEY OVERVIEW The intention of this survey is to provide a fair and unbiased comparison tool for both salary and compensation across the province for employee and employer reference. The use of this guide, along with any other salary and compensation data, to justify changes to a member’s current compensation is the sole responsibility of the member to take forward to their employer. This guide can also be used by companies to ensure that they are remaining competitive in the engineering and geoscience market and providing fair compensation to their employees. The following section will outline the steps that will allow you to accurately use the salary survey information. The steps include:
1. Determine your Responsibility Category;
2. Determine your 2012 Base Salary Results for your Responsibility Category;
3. Determine your Estimated Salary Adjustment;
4. Determine your 2012 Total Compensation Results for your Responsibility Category.
It is vital that you accurately determine your responsibility category, as interpretation of the salary survey results depends on this. If you are unsure of your category, please work with your employer and/or Human Resources representative.
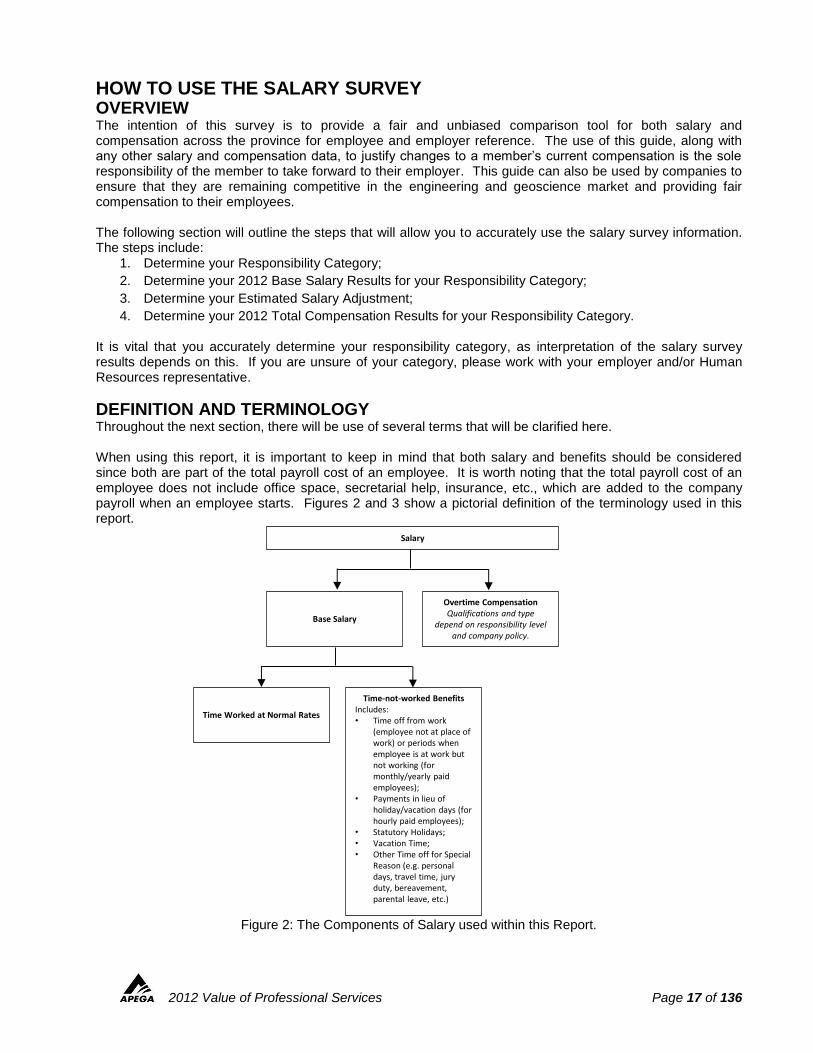
DEFINITION AND TERMINOLOGY Throughout the next section, there will be use of several terms that will be clarified here. When using this report, it is important to keep in mind that both salary and benefits should be considered since both are part of the total payroll cost of an employee. It is worth noting that the total payroll cost of an employee does not include office space, secretarial help, insurance, etc., which are added to the company payroll when an employee starts. Figures 2 and 3 show a pictorial definition of the terminology used in this report.
Figure 2: The Components of Salary used within this Report.
Salary
Base Salary
Overtime CompensationQualifications and type
depend on responsibility level and company policy.
Time-not-worked BenefitsIncludes:• Time off from work
(employee not at place of work) or periods when employee is at work but not working (for monthly/yearly paid employees);
• Payments in lieu of holiday/vacation days (for hourly paid employees);
• Statutory Holidays;• Vacation Time;• Other Time off for Special
Reason (e.g. personal days, travel time, jury duty, bereavement, parental leave, etc.)
Time Worked at Normal Rates
2012 Value of Professional Services Page 18 of 136
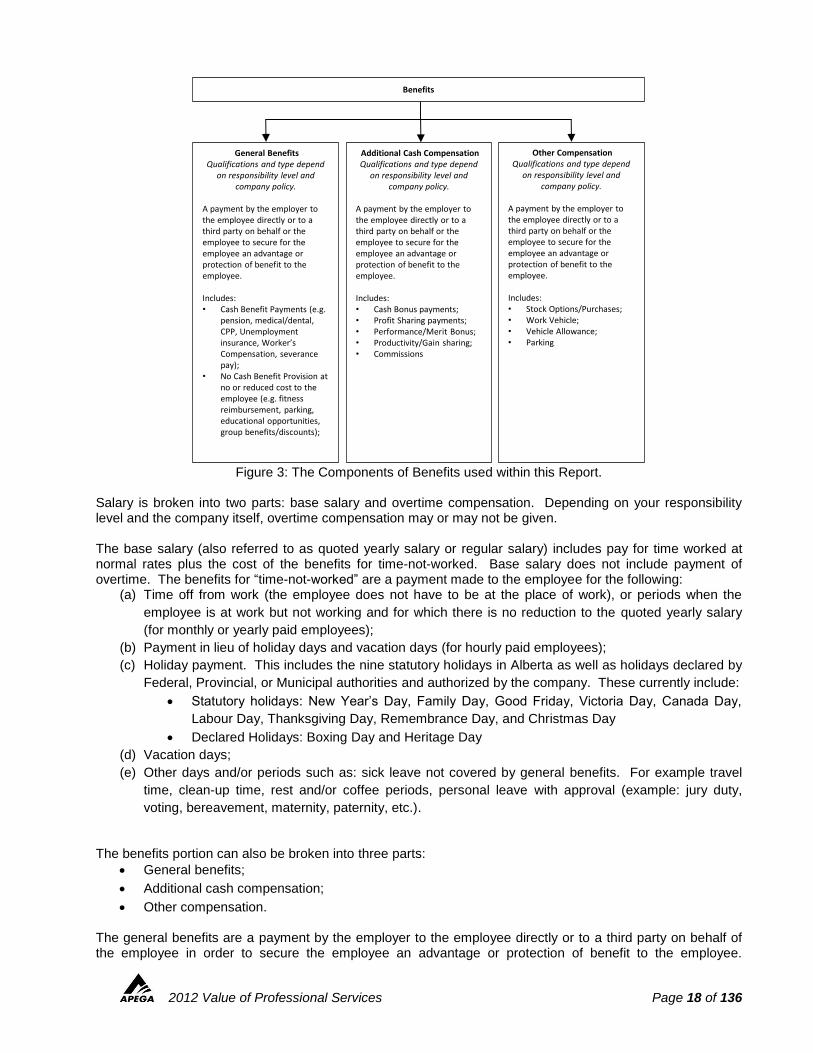
Figure 3: The Components of Benefits used within this Report.
Salary is broken into two parts: base salary and overtime compensation. Depending on your responsibility level and the company itself, overtime compensation may or may not be given. The base salary (also referred to as quoted yearly salary or regular salary) includes pay for time worked at normal rates plus the cost of the benefits for time-not-worked. Base salary does not include payment of overtime. The benefits for “time-not-worked” are a payment made to the employee for the following:
(a) Time off from work (the employee does not have to be at the place of work), or periods when the
employee is at work but not working and for which there is no reduction to the quoted yearly salary
(for monthly or yearly paid employees);
(b) Payment in lieu of holiday days and vacation days (for hourly paid employees);
(c) Holiday payment. This includes the nine statutory holidays in Alberta as well as holidays declared by
Federal, Provincial, or Municipal authorities and authorized by the company. These currently include:
Statutory holidays: New Year’s Day, Family Day, Good Friday, Victoria Day, Canada Day,
Labour Day, Thanksgiving Day, Remembrance Day, and Christmas Day
Declared Holidays: Boxing Day and Heritage Day
(d) Vacation days;
(e) Other days and/or periods such as: sick leave not covered by general benefits. For example travel
time, clean-up time, rest and/or coffee periods, personal leave with approval (example: jury duty,
voting, bereavement, maternity, paternity, etc.).
The benefits portion can also be broken into three parts:
General benefits;
Additional cash compensation;
Other compensation.
The general benefits are a payment by the employer to the employee directly or to a third party on behalf of the employee in order to secure the employee an advantage or protection of benefit to the employee.
General BenefitsQualifications and type depend
on responsibility level and company policy.
A payment by the employer to the employee directly or to a third party on behalf or the employee to secure for the employee an advantage or protection of benefit to the employee.
Includes:• Cash Benefit Payments (e.g.
pension, medical/dental, CPP, Unemployment insurance, Worker’s Compensation, severance pay);
• No Cash Benefit Provision at no or reduced cost to the employee (e.g. fitness reimbursement, parking, educational opportunities, group benefits/discounts);
Additional Cash CompensationQualifications and type depend
on responsibility level and company policy.
A payment by the employer to the employee directly or to a third party on behalf or the employee to secure for the employee an advantage or protection of benefit to the employee.
Includes:• Cash Bonus payments;• Profit Sharing payments;• Performance/Merit Bonus;• Productivity/Gain sharing;• Commissions
Other CompensationQualifications and type depend
on responsibility level and company policy.
A payment by the employer to the employee directly or to a third party on behalf or the employee to secure for the employee an advantage or protection of benefit to the employee.
Includes:• Stock Options/Purchases;• Work Vehicle;• Vehicle Allowance;• Parking
Benefits
2012 Value of Professional Services Page 19 of 136
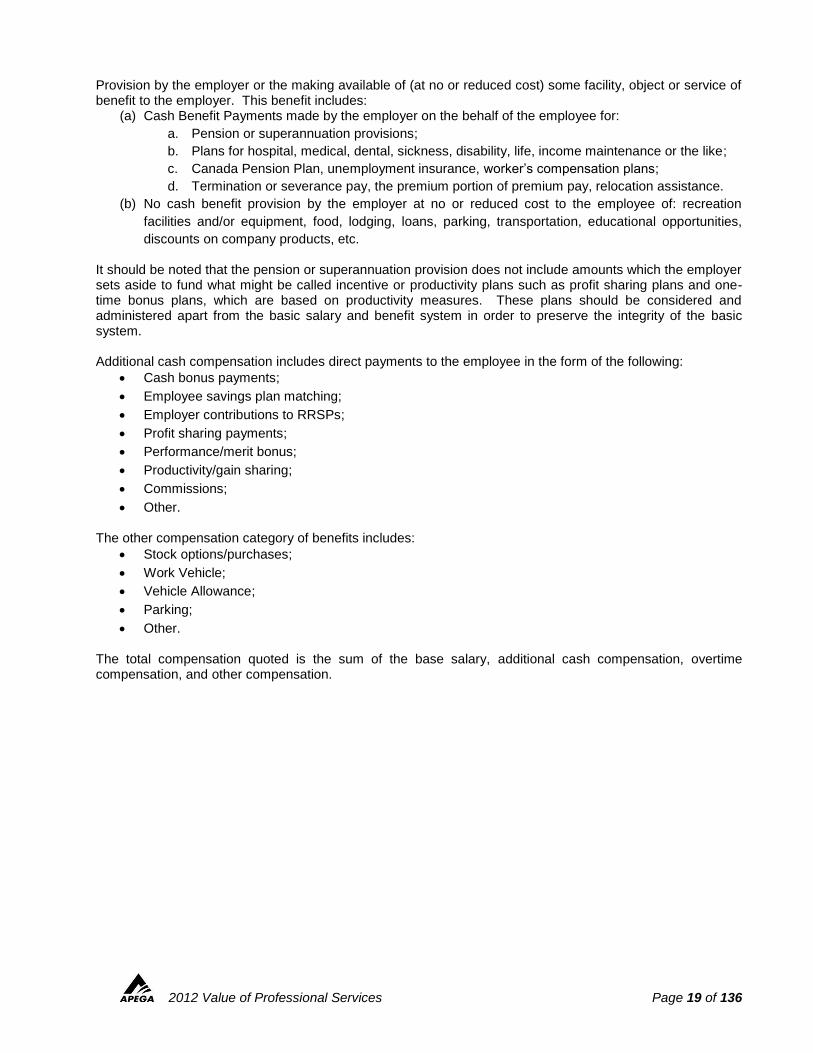
Provision by the employer or the making available of (at no or reduced cost) some facility, object or service of benefit to the employer. This benefit includes:
(a) Cash Benefit Payments made by the employer on the behalf of the employee for:
a. Pension or superannuation provisions;
b. Plans for hospital, medical, dental, sickness, disability, life, income maintenance or the like;
c. Canada Pension Plan, unemployment insurance, worker’s compensation plans;
d. Termination or severance pay, the premium portion of premium pay, relocation assistance.
(b) No cash benefit provision by the employer at no or reduced cost to the employee of: recreation
facilities and/or equipment, food, lodging, loans, parking, transportation, educational opportunities,
discounts on company products, etc.
It should be noted that the pension or superannuation provision does not include amounts which the employer sets aside to fund what might be called incentive or productivity plans such as profit sharing plans and one-time bonus plans, which are based on productivity measures. These plans should be considered and administered apart from the basic salary and benefit system in order to preserve the integrity of the basic system. Additional cash compensation includes direct payments to the employee in the form of the following:
Cash bonus payments;
Employee savings plan matching;
Employer contributions to RRSPs;
Profit sharing payments;
Performance/merit bonus;
Productivity/gain sharing;
Commissions;
Other.
The other compensation category of benefits includes:
Stock options/purchases;
Work Vehicle;
Vehicle Allowance;
Parking;
Other.
The total compensation quoted is the sum of the base salary, additional cash compensation, overtime compensation, and other compensation.
2012 Value of Professional Services Page 20 of 136
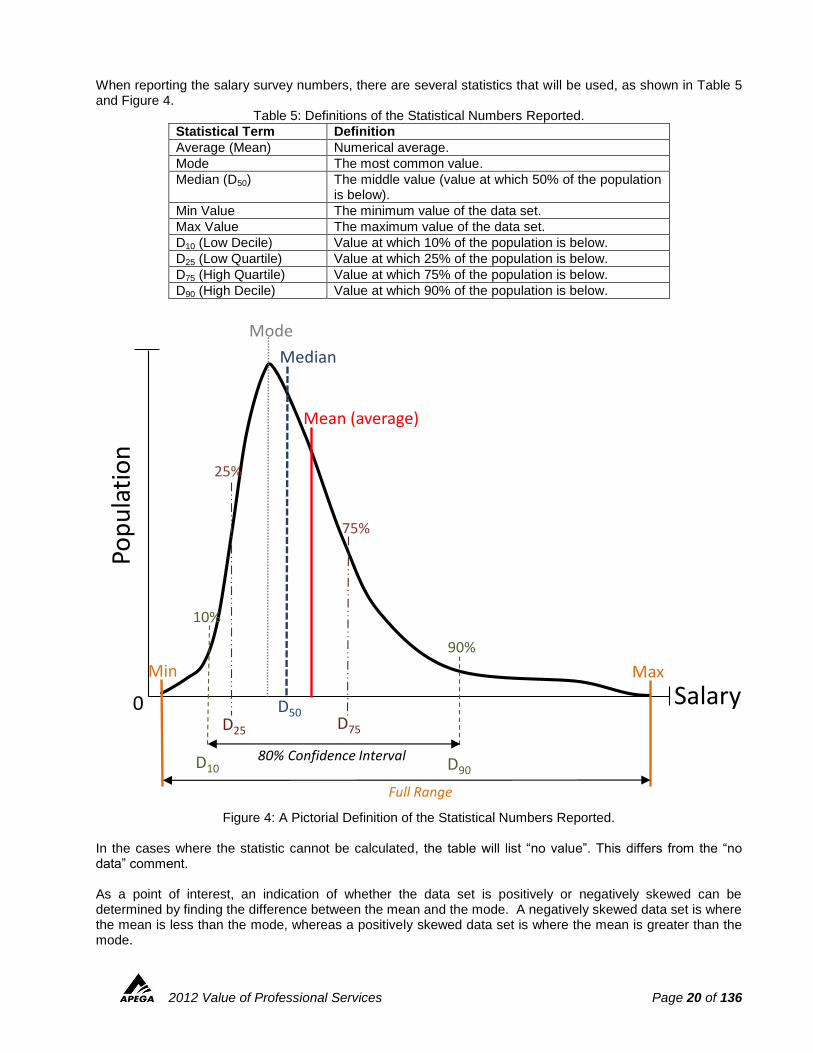
When reporting the salary survey numbers, there are several statistics that will be used, as shown in Table 5 and Figure 4.
Table 5: Definitions of the Statistical Numbers Reported.
Statistical Term Definition
Average (Mean) Numerical average.
Mode The most common value.
Median (D50) The middle value (value at which 50% of the population is below).
Min Value The minimum value of the data set.
Max Value The maximum value of the data set.
D10 (Low Decile) Value at which 10% of the population is below.
D25 (Low Quartile) Value at which 25% of the population is below.
D75 (High Quartile) Value at which 75% of the population is below.
D90 (High Decile) Value at which 90% of the population is below.
Figure 4: A Pictorial Definition of the Statistical Numbers Reported.
In the cases where the statistic cannot be calculated, the table will list “no value”. This differs from the “no data” comment. As a point of interest, an indication of whether the data set is positively or negatively skewed can be determined by finding the difference between the mean and the mode. A negatively skewed data set is where the mean is less than the mode, whereas a positively skewed data set is where the mean is greater than the mode.
Salary
Pop
ula
tio
n
0
Mean (average)
Median
75%
25%
10%
90%
D10 D90
D25 D75
80% Confidence Interval
D50
Mode
MaxMin
Full Range
2012 Value of Professional Services Page 21 of 136
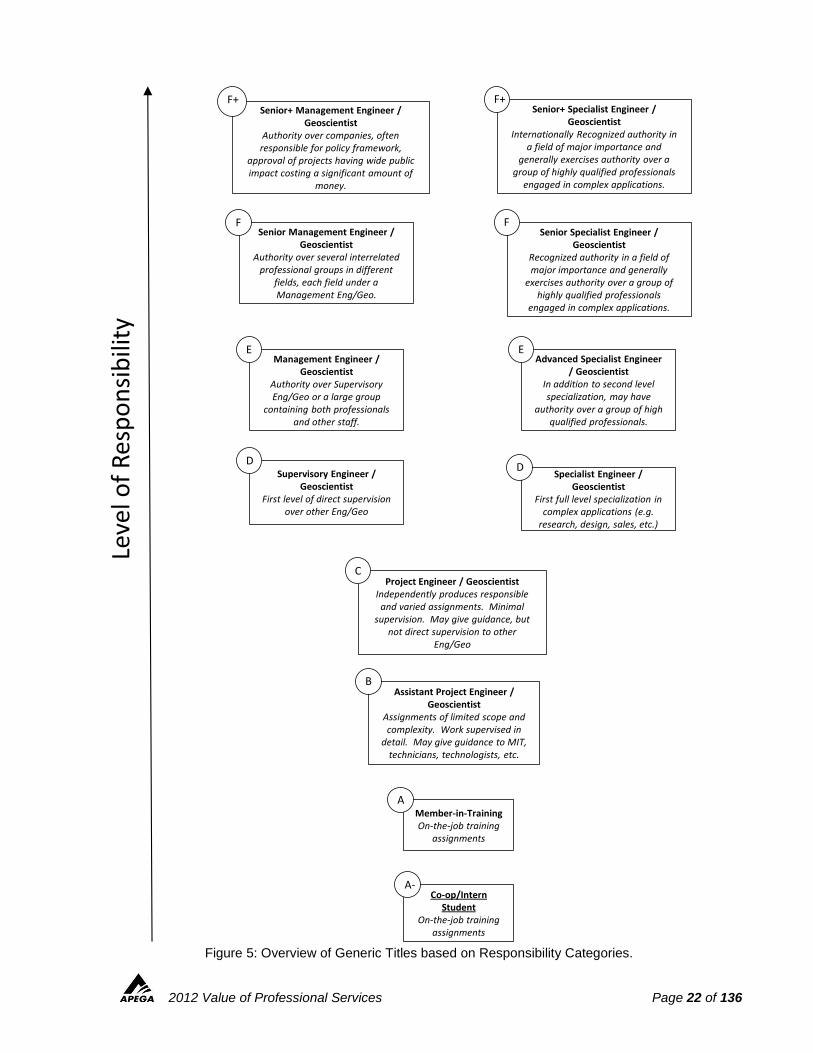
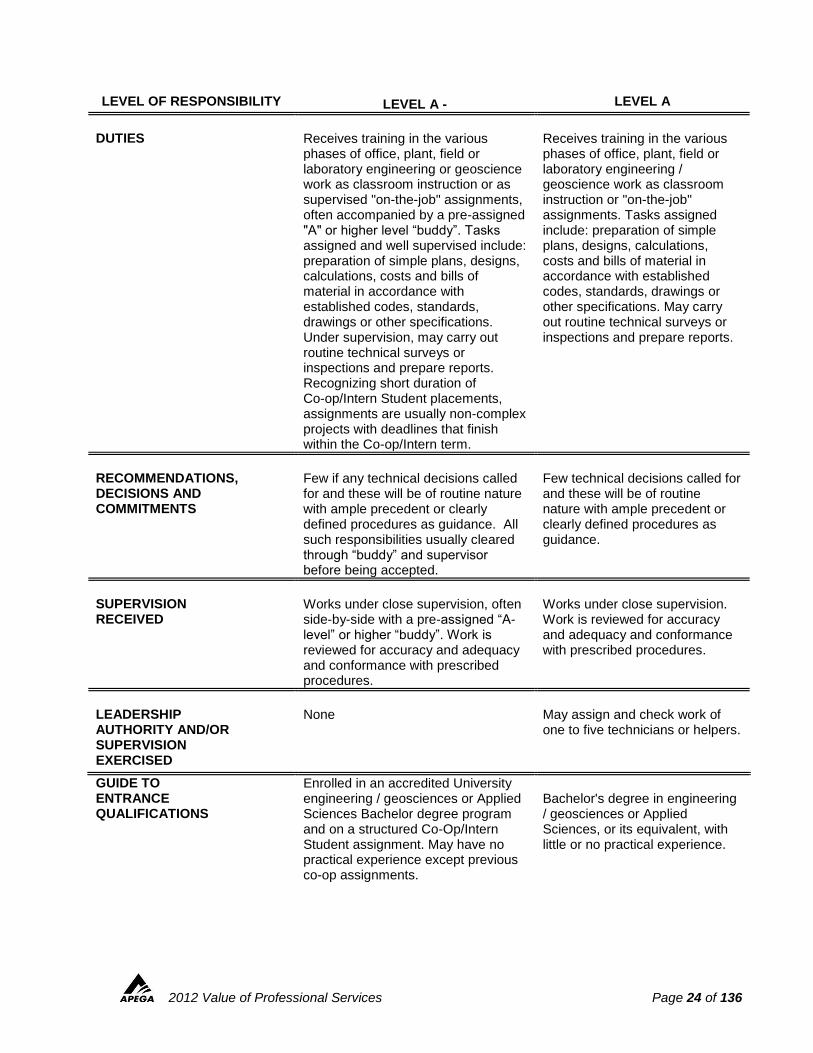
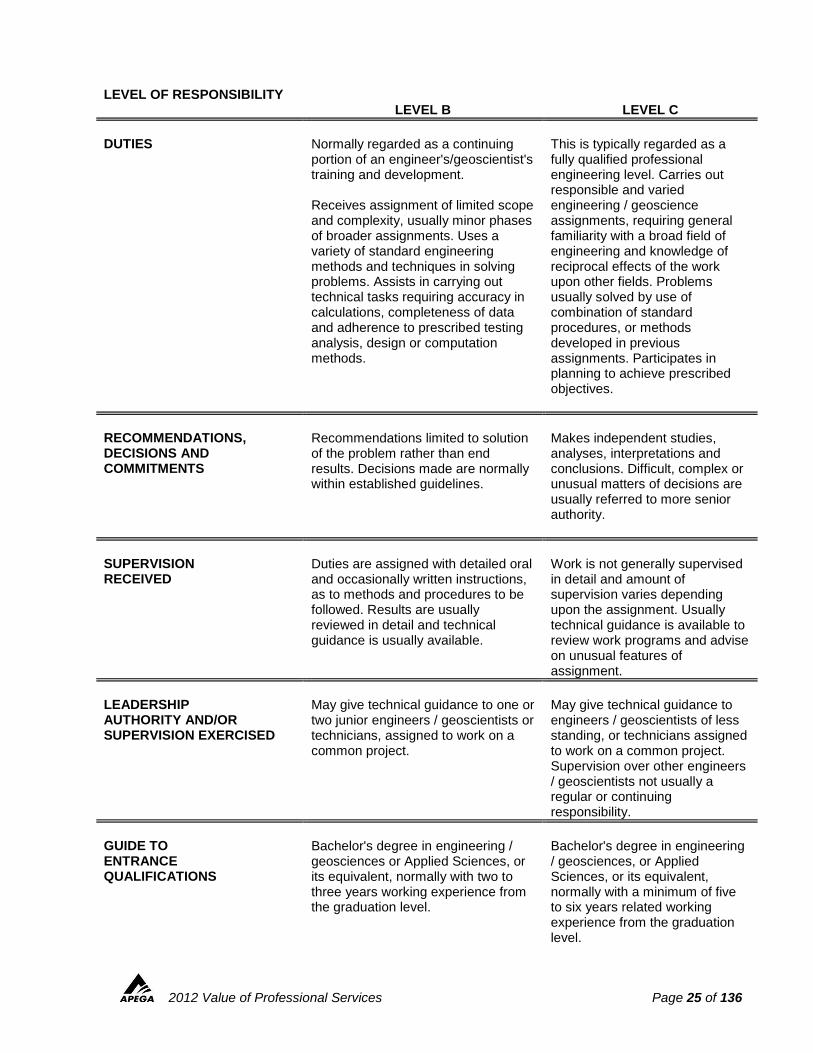
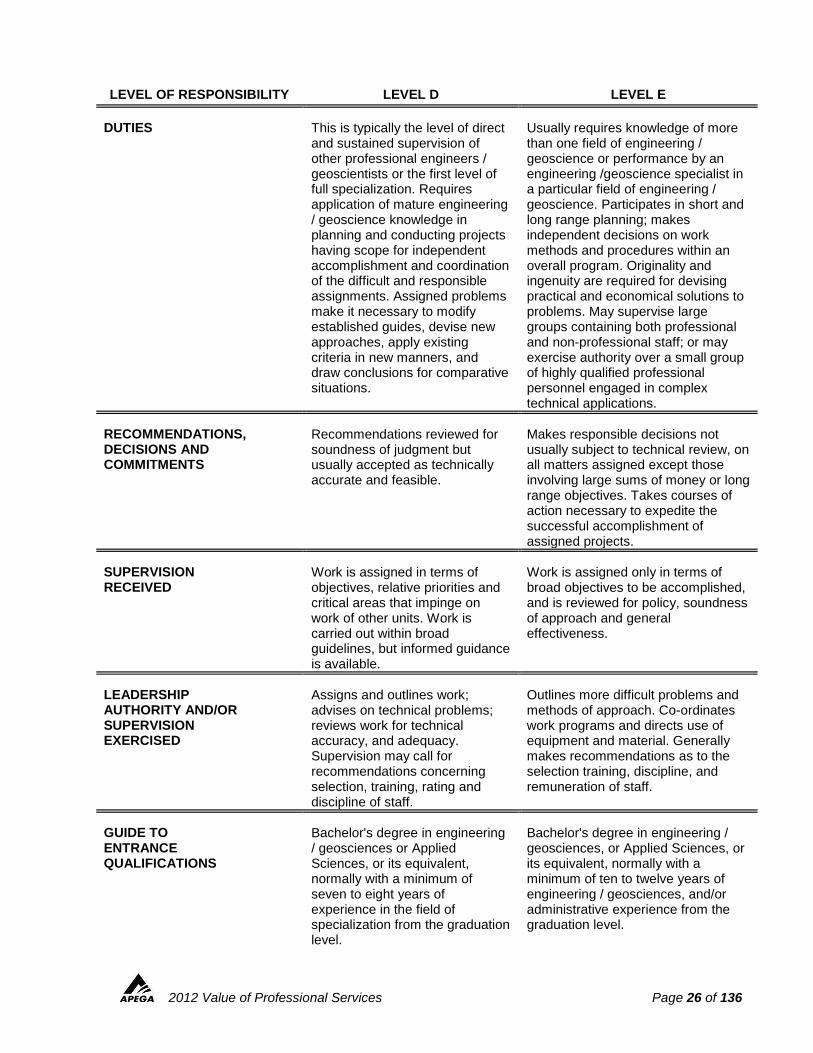
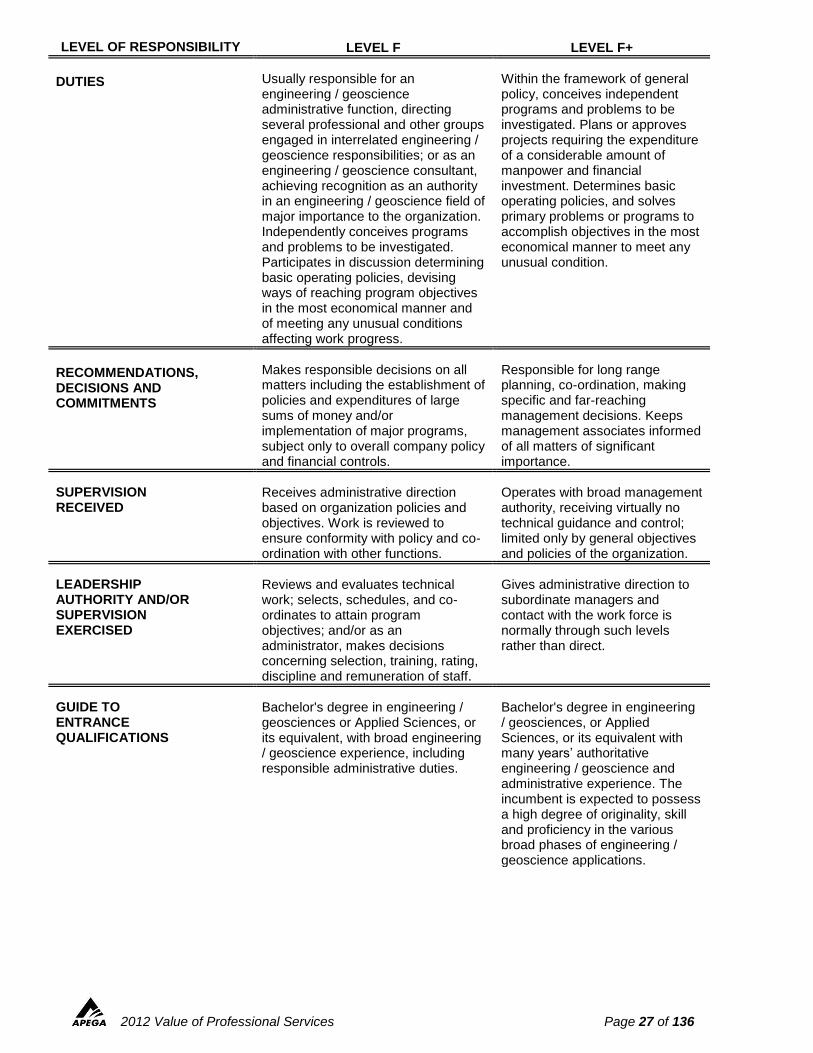
STEP 1: DETERMINE YOUR RESPONSIBILITY CATEGORY The first step is to determine your responsibility category. It is vital that you accurately determine your responsibility category, as interpretation of the salary survey results depends on this. If you are unsure of your category, please work with your employer and/or Human Resources representative. Figure 5 gives a high level overview of each responsibility category (A- through F+), including a generic title and description. The tables following give a more detailed description for the Responsibility Levels based on:
Duties;
Recommendations, Decisions, and Commitments;
Supervision Received;
Leadership Authority and/or Supervision Exercised;
Guide to Entrance Qualifications.
To more accurately determine your Responsibility Category (A- through F+), please refer to Appendix C, which gives a more detailed survey based on job duties, education required for your position, experience required for your position, decisions, supervision received, leadership authority, supervision extent, physical demands, job environment, job related travel, and safety hazards. Appendix D gives an overview of bench mark job descriptions that can aid you in determining your category rating. These job descriptions range from the Member-In-Training level to Senior Management and will not necessary exactly match your job, but is given as examples. It is recommended that you complete the detailed survey in Appendix C.
2012 Value of Professional Services Page 22 of 136
Figure 5: Overview of Generic Titles based on Responsibility Categories.
Co-op/Intern Student
On-the-job training assignments
A-
Member-in-TrainingOn-the-job training
assignments
A
Assistant Project Engineer / Geoscientist
Assignments of limited scope and complexity. Work supervised in
detail. May give guidance to MIT, technicians, technologists, etc.
B
Project Engineer / GeoscientistIndependently produces responsible and varied assignments. Minimal
supervision. May give guidance, but not direct supervision to other
Eng/Geo
C
Supervisory Engineer / Geoscientist
First level of direct supervision over other Eng/Geo
DSpecialist Engineer /
GeoscientistFirst full level specialization in
complex applications (e.g. research, design, sales, etc.)
D
Management Engineer / Geoscientist
Authority over Supervisory Eng/Geo or a large group
containing both professionals and other staff.
EAdvanced Specialist Engineer
/ GeoscientistIn addition to second level specialization, may have
authority over a group of high qualified professionals.
E
Senior Management Engineer / Geoscientist
Authority over several interrelated professional groups in different
fields, each field under a Management Eng/Geo.
FSenior Specialist Engineer /
GeoscientistRecognized authority in a field of major importance and generally
exercises authority over a group of highly qualified professionals
engaged in complex applications.
F
Leve
l of
Res
po
nsi
bili
tySenior+ Management Engineer /
GeoscientistAuthority over companies, often responsible for policy framework,
approval of projects having wide public impact costing a significant amount of
money.
F+Senior+ Specialist Engineer /
GeoscientistInternationally Recognized authority in
a field of major importance and generally exercises authority over a
group of highly qualified professionals engaged in complex applications.
F+

2012 Value of Professional Services Page 23 of 136
2012 Value of Professional Services Page 24 of 136
LEVEL OF RESPONSIBILITY
LEVEL A -
LEVEL A
DUTIES
Receives training in the various phases of office, plant, field or laboratory engineering or geoscience work as classroom instruction or as supervised "on-the-job" assignments, often accompanied by a pre-assigned "A" or higher level “buddy”. Tasks assigned and well supervised include: preparation of simple plans, designs, calculations, costs and bills of material in accordance with established codes, standards, drawings or other specifications. Under supervision, may carry out routine technical surveys or inspections and prepare reports. Recognizing short duration of Co-op/Intern Student placements, assignments are usually non-complex projects with deadlines that finish within the Co-op/Intern term.
Receives training in the various phases of office, plant, field or laboratory engineering / geoscience work as classroom instruction or "on-the-job" assignments. Tasks assigned include: preparation of simple plans, designs, calculations, costs and bills of material in accordance with established codes, standards, drawings or other specifications. May carry out routine technical surveys or inspections and prepare reports.
RECOMMENDATIONS, DECISIONS AND COMMITMENTS
Few if any technical decisions called for and these will be of routine nature with ample precedent or clearly defined procedures as guidance. All such responsibilities usually cleared through “buddy” and supervisor before being accepted.
Few technical decisions called for and these will be of routine nature with ample precedent or clearly defined procedures as guidance.
SUPERVISION RECEIVED
Works under close supervision, often side-by-side with a pre-assigned “A-level” or higher “buddy”. Work is reviewed for accuracy and adequacy and conformance with prescribed procedures.
Works under close supervision. Work is reviewed for accuracy and adequacy and conformance with prescribed procedures.
LEADERSHIP AUTHORITY AND/OR SUPERVISION EXERCISED
None
May assign and check work of one to five technicians or helpers.
GUIDE TO ENTRANCE QUALIFICATIONS
Enrolled in an accredited University engineering / geosciences or Applied Sciences Bachelor degree program and on a structured Co-Op/Intern Student assignment. May have no practical experience except previous co-op assignments.
Bachelor's degree in engineering / geosciences or Applied Sciences, or its equivalent, with little or no practical experience.
2012 Value of Professional Services Page 25 of 136
LEVEL OF RESPONSIBILITY LEVEL B
LEVEL C
DUTIES
Normally regarded as a continuing portion of an engineer's/geoscientist's training and development. Receives assignment of limited scope and complexity, usually minor phases of broader assignments. Uses a variety of standard engineering methods and techniques in solving problems. Assists in carrying out technical tasks requiring accuracy in calculations, completeness of data and adherence to prescribed testing analysis, design or computation methods.
This is typically regarded as a fully qualified professional engineering level. Carries out responsible and varied engineering / geoscience assignments, requiring general familiarity with a broad field of engineering and knowledge of reciprocal effects of the work upon other fields. Problems usually solved by use of combination of standard procedures, or methods developed in previous assignments. Participates in planning to achieve prescribed objectives.
RECOMMENDATIONS, DECISIONS AND COMMITMENTS
Recommendations limited to solution of the problem rather than end results. Decisions made are normally within established guidelines.
Makes independent studies, analyses, interpretations and conclusions. Difficult, complex or unusual matters of decisions are usually referred to more senior authority.
SUPERVISION RECEIVED
Duties are assigned with detailed oral and occasionally written instructions, as to methods and procedures to be followed. Results are usually reviewed in detail and technical guidance is usually available.
Work is not generally supervised in detail and amount of supervision varies depending upon the assignment. Usually technical guidance is available to review work programs and advise on unusual features of assignment.
LEADERSHIP AUTHORITY AND/OR SUPERVISION EXERCISED
May give technical guidance to one or two junior engineers / geoscientists or technicians, assigned to work on a common project.
May give technical guidance to engineers / geoscientists of less standing, or technicians assigned to work on a common project. Supervision over other engineers / geoscientists not usually a regular or continuing responsibility.
GUIDE TO ENTRANCE QUALIFICATIONS
Bachelor's degree in engineering / geosciences or Applied Sciences, or its equivalent, normally with two to three years working experience from the graduation level.
Bachelor's degree in engineering / geosciences, or Applied Sciences, or its equivalent, normally with a minimum of five to six years related working experience from the graduation level.
2012 Value of Professional Services Page 26 of 136
LEVEL OF RESPONSIBILITY LEVEL D LEVEL E
DUTIES
This is typically the level of direct and sustained supervision of other professional engineers / geoscientists or the first level of full specialization. Requires application of mature engineering / geoscience knowledge in planning and conducting projects having scope for independent accomplishment and coordination of the difficult and responsible assignments. Assigned problems make it necessary to modify established guides, devise new approaches, apply existing criteria in new manners, and draw conclusions for comparative situations.
Usually requires knowledge of more than one field of engineering / geoscience or performance by an engineering /geoscience specialist in a particular field of engineering / geoscience. Participates in short and long range planning; makes independent decisions on work methods and procedures within an overall program. Originality and ingenuity are required for devising practical and economical solutions to problems. May supervise large groups containing both professional and non-professional staff; or may exercise authority over a small group of highly qualified professional personnel engaged in complex technical applications.
RECOMMENDATIONS, DECISIONS AND COMMITMENTS
Recommendations reviewed for soundness of judgment but usually accepted as technically accurate and feasible.
Makes responsible decisions not usually subject to technical review, on all matters assigned except those involving large sums of money or long range objectives. Takes courses of action necessary to expedite the successful accomplishment of assigned projects.
SUPERVISION RECEIVED
Work is assigned in terms of objectives, relative priorities and critical areas that impinge on work of other units. Work is carried out within broad guidelines, but informed guidance is available.
Work is assigned only in terms of broad objectives to be accomplished, and is reviewed for policy, soundness of approach and general effectiveness.
LEADERSHIP AUTHORITY AND/OR SUPERVISION EXERCISED
Assigns and outlines work; advises on technical problems; reviews work for technical accuracy, and adequacy. Supervision may call for recommendations concerning selection, training, rating and discipline of staff.
Outlines more difficult problems and methods of approach. Co-ordinates work programs and directs use of equipment and material. Generally makes recommendations as to the selection training, discipline, and remuneration of staff.
GUIDE TO ENTRANCE QUALIFICATIONS
Bachelor's degree in engineering / geosciences or Applied Sciences, or its equivalent, normally with a minimum of seven to eight years of experience in the field of specialization from the graduation level.
Bachelor's degree in engineering / geosciences, or Applied Sciences, or its equivalent, normally with a minimum of ten to twelve years of engineering / geosciences, and/or administrative experience from the graduation level.
2012 Value of Professional Services Page 27 of 136
LEVEL OF RESPONSIBILITY
LEVEL F
LEVEL F+
DUTIES
Usually responsible for an engineering / geoscience administrative function, directing several professional and other groups engaged in interrelated engineering / geoscience responsibilities; or as an engineering / geoscience consultant, achieving recognition as an authority in an engineering / geoscience field of major importance to the organization. Independently conceives programs and problems to be investigated. Participates in discussion determining basic operating policies, devising ways of reaching program objectives in the most economical manner and of meeting any unusual conditions affecting work progress.
Within the framework of general policy, conceives independent programs and problems to be investigated. Plans or approves projects requiring the expenditure of a considerable amount of manpower and financial investment. Determines basic operating policies, and solves primary problems or programs to accomplish objectives in the most economical manner to meet any unusual condition.
RECOMMENDATIONS, DECISIONS AND COMMITMENTS
Makes responsible decisions on all matters including the establishment of policies and expenditures of large sums of money and/or implementation of major programs, subject only to overall company policy and financial controls.
Responsible for long range planning, co-ordination, making specific and far-reaching management decisions. Keeps management associates informed of all matters of significant importance.
SUPERVISION RECEIVED
Receives administrative direction based on organization policies and objectives. Work is reviewed to ensure conformity with policy and co-ordination with other functions.
Operates with broad management authority, receiving virtually no technical guidance and control; limited only by general objectives and policies of the organization.
LEADERSHIP AUTHORITY AND/OR SUPERVISION EXERCISED
Reviews and evaluates technical work; selects, schedules, and co-ordinates to attain program objectives; and/or as an administrator, makes decisions concerning selection, training, rating, discipline and remuneration of staff.
Gives administrative direction to subordinate managers and contact with the work force is normally through such levels rather than direct.
GUIDE TO ENTRANCE QUALIFICATIONS
Bachelor's degree in engineering / geosciences or Applied Sciences, or its equivalent, with broad engineering / geoscience experience, including responsible administrative duties.
Bachelor's degree in engineering / geosciences, or Applied Sciences, or its equivalent with many years’ authoritative engineering / geoscience and administrative experience. The incumbent is expected to possess a high degree of originality, skill and proficiency in the various broad phases of engineering / geoscience applications.
2012 Value of Professional Services Page 28 of 136
STEP 2: DETERMINE YOUR 2012 BASE SALARY RESULTS FOR YOUR RESPONSIBILITY CATEGORY Once you have determined your responsibility category, you can determine the range of salaries for your responsibility
category per industry category. Additional results from the salary survey by gender, location, years of experience,
company size, and around co-op student and degree can be found in the “Full Salary Survey Results” section.
As mentioned previously, the industrial sectors considered for the 2012 salary survey include:
Engineering and Geoscientist Consulting Services;
Engineering, Procurement, and Construction (EPC);
Resource Exploitation (except oil and gas);
Resource Exploitation (only oil and gas);
Manufacturing (durables);
Manufacturing (non-durables);
Service and Control (not for profit);
Service (for profit);
Utility (rate controlled);
Advanced Technologies.
A summary across all industries is also given, although it is recommended that you use the value for your industrial
sector, as it is more relevant. The data shown is for base salary. The total compensation (sum of base salary, additional
compensation, overtime compensation, and other compensation) will appear in the “Step 4: Determine your 2012 Total
Compensation Results for your Responsibility Category” section.
For clarity purposes, please note the following:
Base salary does not include any type of bonuses, profit sharing, northern/isolation allowances, overtime, or pay
out of unused vacation. Base salary is reported as an annual value.
Total compensation is the sum of base salary, additional compensation, overtime compensation, and other
compensation, where:
o Additional cash compensation is all lump sum or re-earnable payments. This is not the same as merit,
which is earnable each year. Additional cash compensations include commissions, cash bonus
payments, profit sharing payments, performance/merit bonus (lump sum), and productivity/gain sharing
payments. This is over a full year. This does not include overtime/shift premiums, stock
options/purchase plans, car allowances, awards, consulting fees, club memberships, or fringe benefits;
o Overtime compensation is considered only when the payment is made beyond the base salary;
o Other compensation, including stock options/purchase plans, consulting fees, and other payments easily
convertible to cash. This does not include car allowance, club memberships, parking, or other fringe
benefits that cannot be converted to cash.
2012 Value of Professional Services Page 29 of 136
2012 BASE SALARY RESULTS DATA OUTLIERS FOR INDUSTRY DATA SET From the original data set of all 87 participating companies, there were 9,075 engineering data points and 565 geoscientist data points considered. There were 5 data points dismissed due to incomplete data, leaving 9,070 engineering data points and 565 geoscientist data points considered prior to data filtering. The data was then filtered to ensure that all data points used were within three stand deviations of the average. This was done for the all industry data set and then completed separately for each industry category as well. Details around the outlier data can be found in Appendix E.
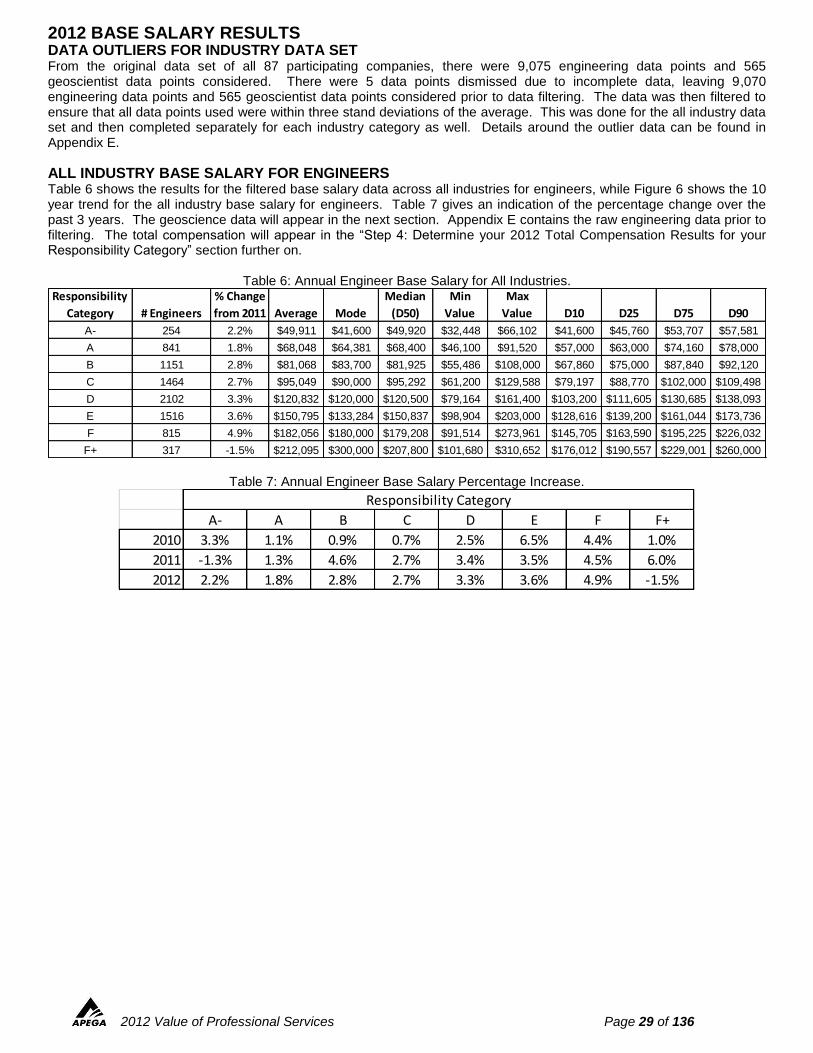
ALL INDUSTRY BASE SALARY FOR ENGINEERS Table 6 shows the results for the filtered base salary data across all industries for engineers, while Figure 6 shows the 10 year trend for the all industry base salary for engineers. Table 7 gives an indication of the percentage change over the past 3 years. The geoscience data will appear in the next section. Appendix E contains the raw engineering data prior to filtering. The total compensation will appear in the “Step 4: Determine your 2012 Total Compensation Results for your Responsibility Category” section further on.
Table 6: Annual Engineer Base Salary for All Industries.
Table 7: Annual Engineer Base Salary Percentage Increase.
Responsibility
Category # Engineers
% Change
from 2011 Average Mode
Median
(D50)
Min
Value
Max
Value D10 D25 D75 D90
A- 254 2.2% $49,911 $41,600 $49,920 $32,448 $66,102 $41,600 $45,760 $53,707 $57,581
A 841 1.8% $68,048 $64,381 $68,400 $46,100 $91,520 $57,000 $63,000 $74,160 $78,000
B 1151 2.8% $81,068 $83,700 $81,925 $55,486 $108,000 $67,860 $75,000 $87,840 $92,120
C 1464 2.7% $95,049 $90,000 $95,292 $61,200 $129,588 $79,197 $88,770 $102,000 $109,498
D 2102 3.3% $120,832 $120,000 $120,500 $79,164 $161,400 $103,200 $111,605 $130,685 $138,093
E 1516 3.6% $150,795 $133,284 $150,837 $98,904 $203,000 $128,616 $139,200 $161,044 $173,736
F 815 4.9% $182,056 $180,000 $179,208 $91,514 $273,961 $145,705 $163,590 $195,225 $226,032
F+ 317 -1.5% $212,095 $300,000 $207,800 $101,680 $310,652 $176,012 $190,557 $229,001 $260,000
A- A B C D E F F+
2010 3.3% 1.1% 0.9% 0.7% 2.5% 6.5% 4.4% 1.0%
2011 -1.3% 1.3% 4.6% 2.7% 3.4% 3.5% 4.5% 6.0%
2012 2.2% 1.8% 2.8% 2.7% 3.3% 3.6% 4.9% -1.5%
Responsibility Category
2012 Value of Professional Services Page 30 of 136
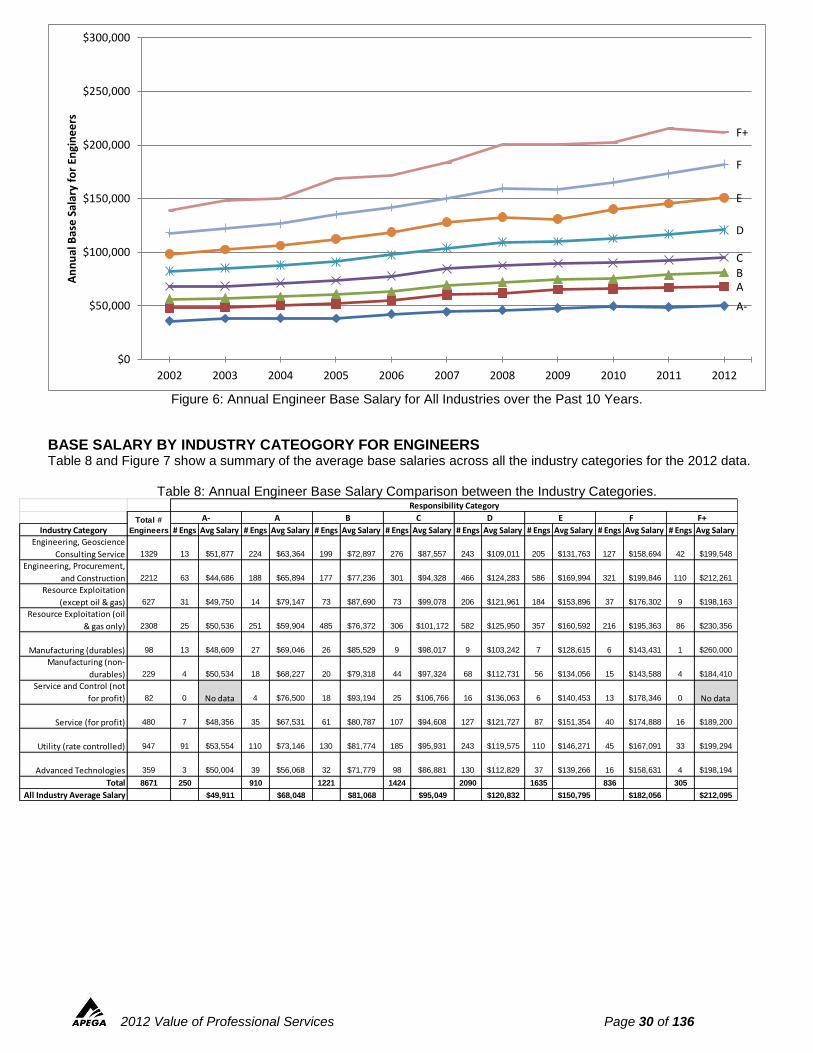
Figure 6: Annual Engineer Base Salary for All Industries over the Past 10 Years.
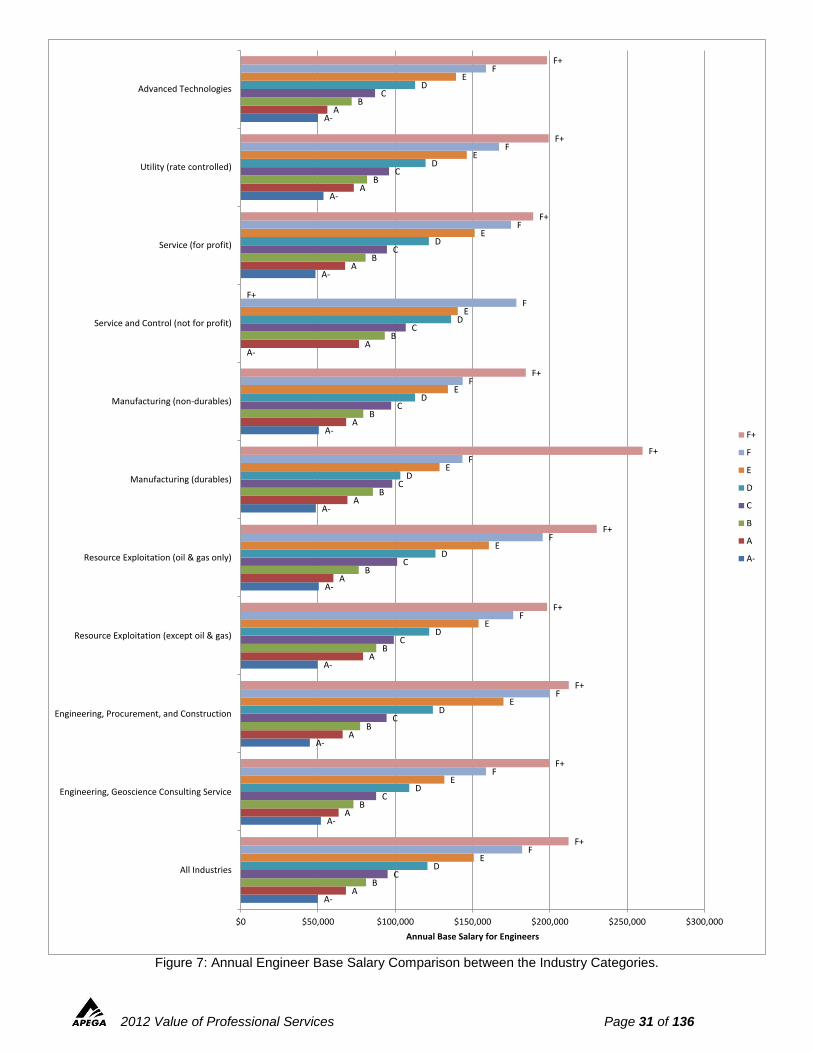
BASE SALARY BY INDUSTRY CATEOGORY FOR ENGINEERS Table 8 and Figure 7 show a summary of the average base salaries across all the industry categories for the 2012 data.
Table 8: Annual Engineer Base Salary Comparison between the Industry Categories.
A-
ABC
D
E
F
F+
$0
$50,000
$100,000
$150,000
$200,000
$250,000
$300,000
2002 2003 2004 2005 2006 2007 2008 2009 2010 2011 2012
An
nu
al B
ase
Sal
ary
for
Engi
ne
ers
Industry Category # Engs Avg Salary # Engs Avg Salary # Engs Avg Salary # Engs Avg Salary # Engs Avg Salary # Engs Avg Salary # Engs Avg Salary # Engs Avg Salary
Engineering, Geoscience
Consulting Service 1329 13 $51,877 224 $63,364 199 $72,897 276 $87,557 243 $109,011 205 $131,763 127 $158,694 42 $199,548
Engineering, Procurement,
and Construction 2212 63 $44,686 188 $65,894 177 $77,236 301 $94,328 466 $124,283 586 $169,994 321 $199,846 110 $212,261
Resource Exploitation
(except oil & gas) 627 31 $49,750 14 $79,147 73 $87,690 73 $99,078 206 $121,961 184 $153,896 37 $176,302 9 $198,163
Resource Exploitation (oil
& gas only) 2308 25 $50,536 251 $59,904 485 $76,372 306 $101,172 582 $125,950 357 $160,592 216 $195,363 86 $230,356
Manufacturing (durables) 98 13 $48,609 27 $69,046 26 $85,529 9 $98,017 9 $103,242 7 $128,615 6 $143,431 1 $260,000
Manufacturing (non-
durables) 229 4 $50,534 18 $68,227 20 $79,318 44 $97,324 68 $112,731 56 $134,056 15 $143,588 4 $184,410
Service and Control (not
for profit) 82 0 No data 4 $76,500 18 $93,194 25 $106,766 16 $136,063 6 $140,453 13 $178,346 0 No data
Service (for profit) 480 7 $48,356 35 $67,531 61 $80,787 107 $94,608 127 $121,727 87 $151,354 40 $174,888 16 $189,200
Utility (rate controlled) 947 91 $53,554 110 $73,146 130 $81,774 185 $95,931 243 $119,575 110 $146,271 45 $167,091 33 $199,294
Advanced Technologies 359 3 $50,004 39 $56,068 32 $71,779 98 $86,881 130 $112,829 37 $139,266 16 $158,631 4 $198,194
Total 8671 250 910 1221 1424 2090 1635 836 305
All Industry Average Salary $49,911 $68,048 $81,068 $95,049 $120,832 $150,795 $182,056 $212,095
Responsibility Category
Total #
Engineers
A- A B C D E F F+
2012 Value of Professional Services Page 31 of 136
Figure 7: Annual Engineer Base Salary Comparison between the Industry Categories.
A-
A-
A-
A-
A-
A-
A-
A-
A-
A-
A-
A
A
A
A
A
A
A
A
A
A
A
B
B
B
B
B
B
B
B
B
B
B
C
C
C
C
C
C
C
C
C
C
C
D
D
D
D
D
D
D
D
D
D
D
E
E
E
E
E
E
E
E
E
E
E
F
F
F
F
F
F
F
F
F
F
F
F+
F+
F+
F+
F+
F+
F+
F+
F+
F+
F+
$0 $50,000 $100,000 $150,000 $200,000 $250,000 $300,000
All Industries
Engineering, Geoscience Consulting Service
Engineering, Procurement, and Construction
Resource Exploitation (except oil & gas)
Resource Exploitation (oil & gas only)
Manufacturing (durables)
Manufacturing (non-durables)
Service and Control (not for profit)
Service (for profit)
Utility (rate controlled)
Advanced Technologies
Annual Base Salary for Engineers
F+
F
E
D
C
B
A
A-
2012 Value of Professional Services Page 32 of 136
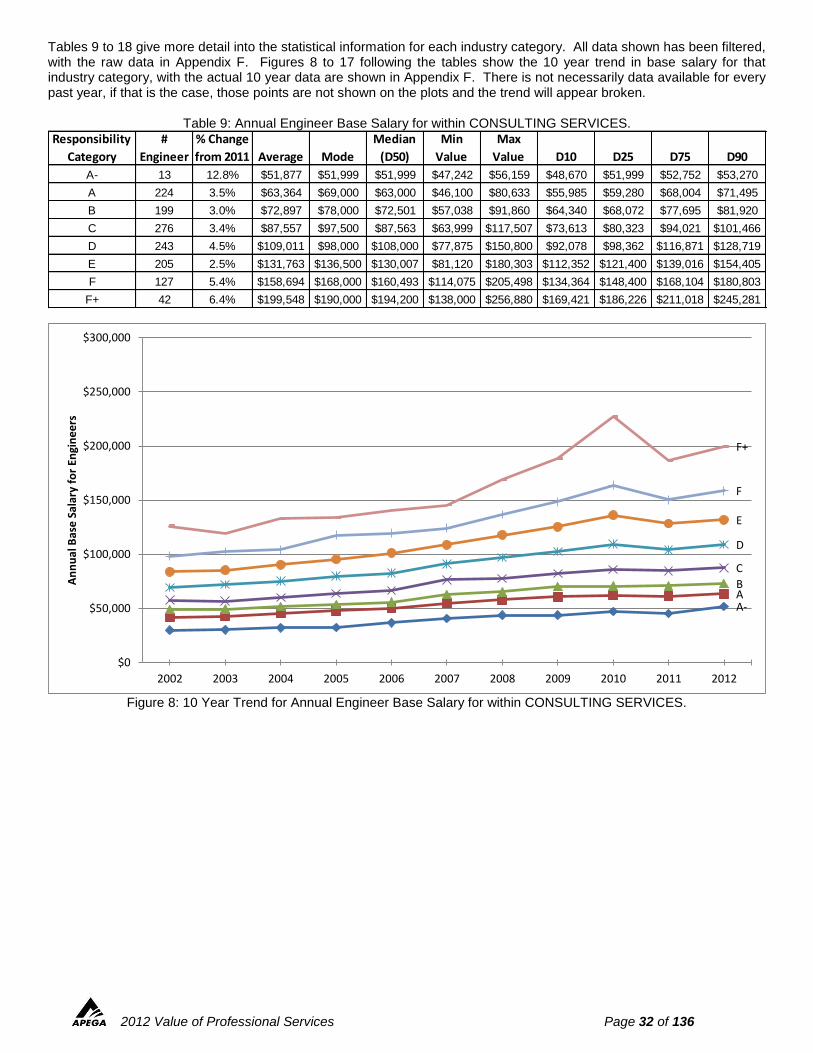
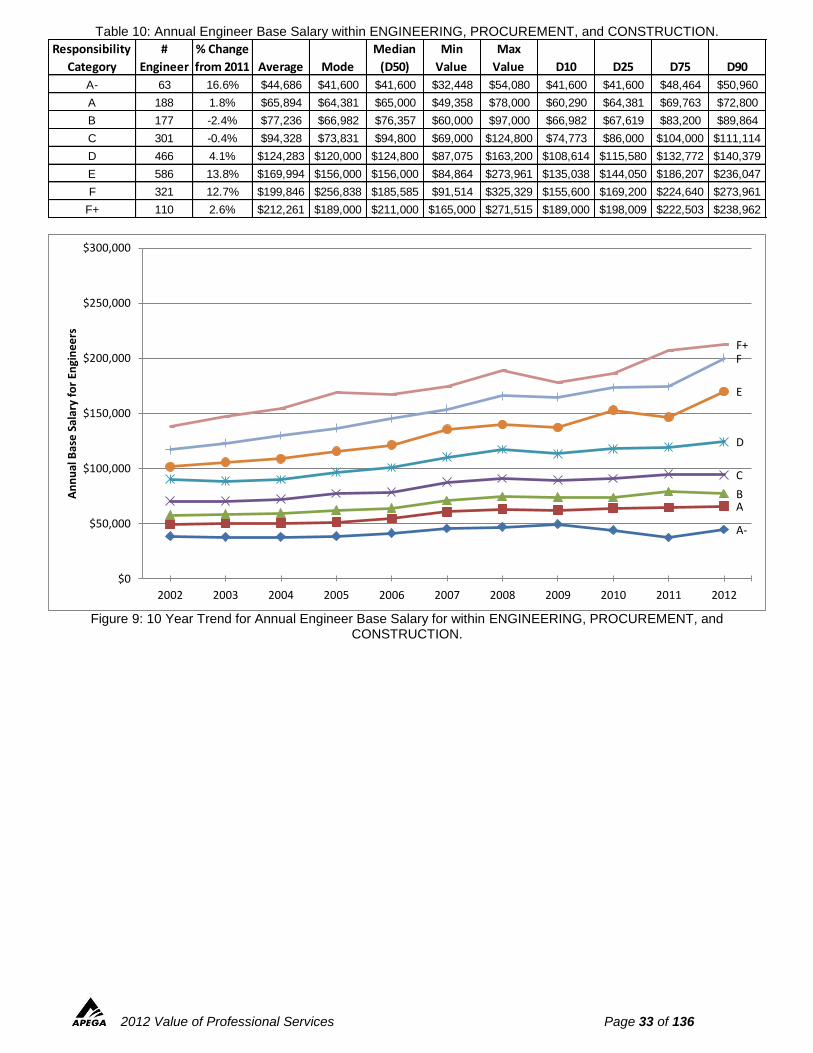
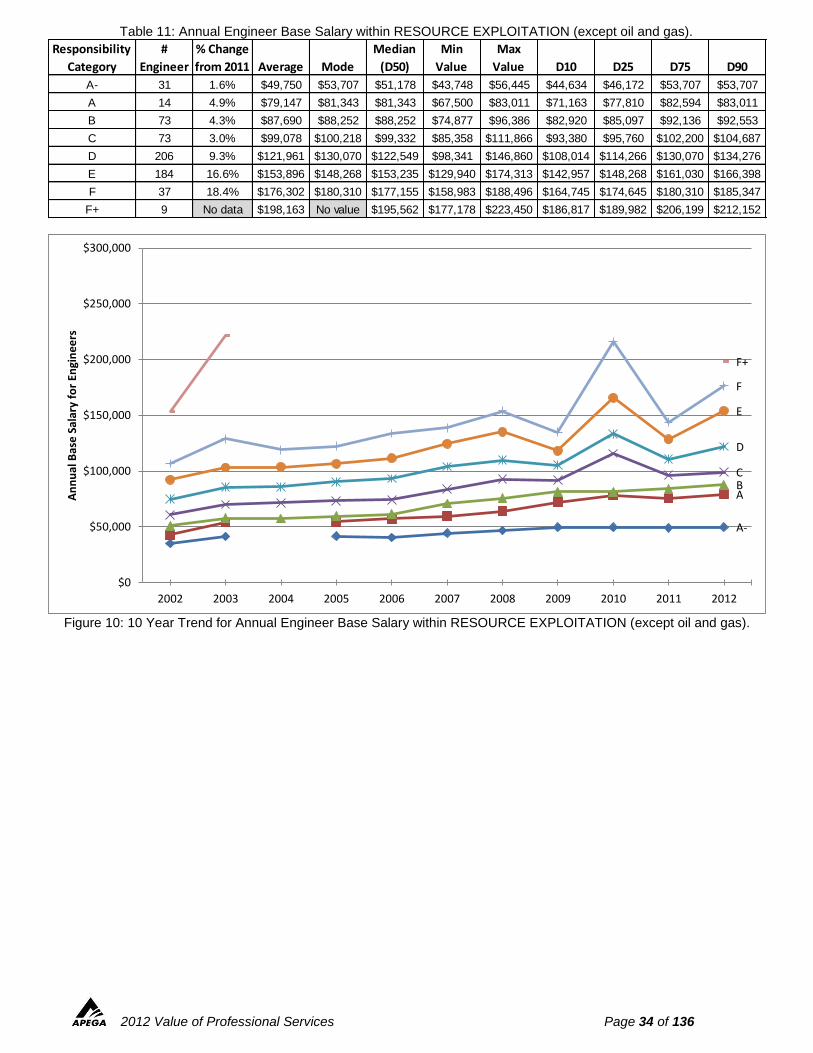
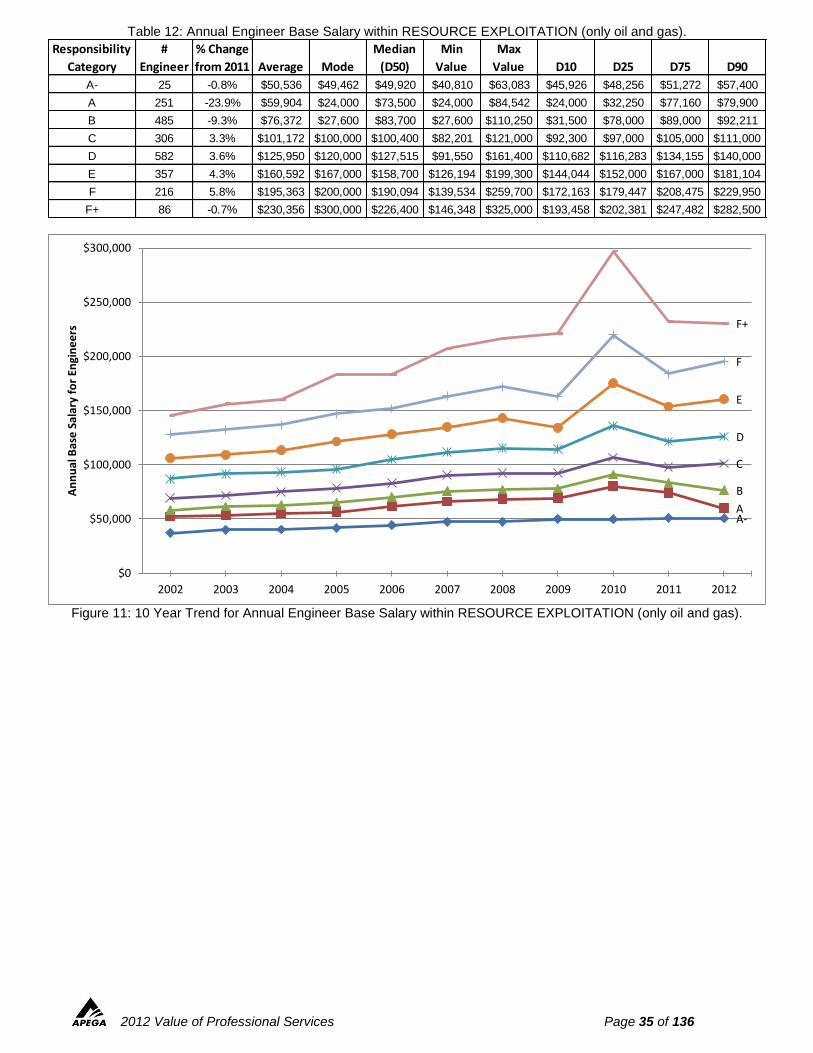
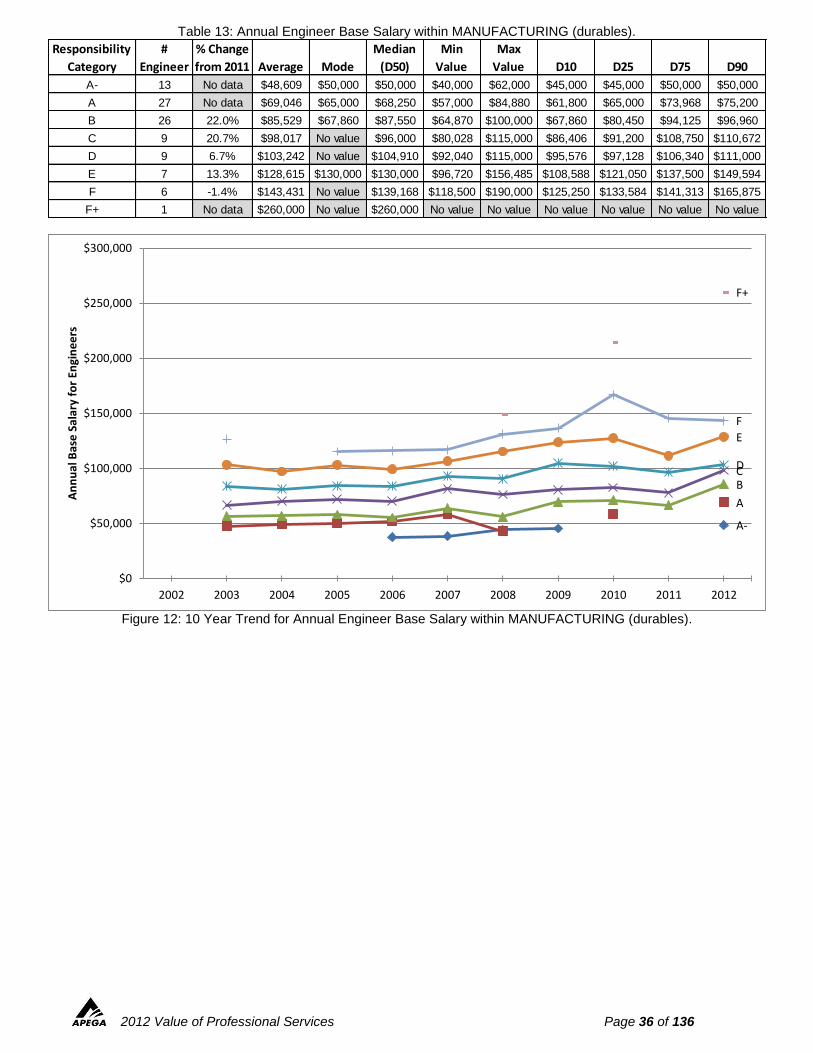
Tables 9 to 18 give more detail into the statistical information for each industry category. All data shown has been filtered, with the raw data in Appendix F. Figures 8 to 17 following the tables show the 10 year trend in base salary for that industry category, with the actual 10 year data are shown in Appendix F. There is not necessarily data available for every past year, if that is the case, those points are not shown on the plots and the trend will appear broken.
Table 9: Annual Engineer Base Salary for within CONSULTING SERVICES.
Figure 8: 10 Year Trend for Annual Engineer Base Salary for within CONSULTING SERVICES.
Responsibility
Category
#
Engineer
% Change
from 2011 Average Mode
Median
(D50)
Min
Value
Max
Value D10 D25 D75 D90
A- 13 12.8% $51,877 $51,999 $51,999 $47,242 $56,159 $48,670 $51,999 $52,752 $53,270
A 224 3.5% $63,364 $69,000 $63,000 $46,100 $80,633 $55,985 $59,280 $68,004 $71,495
B 199 3.0% $72,897 $78,000 $72,501 $57,038 $91,860 $64,340 $68,072 $77,695 $81,920
C 276 3.4% $87,557 $97,500 $87,563 $63,999 $117,507 $73,613 $80,323 $94,021 $101,466
D 243 4.5% $109,011 $98,000 $108,000 $77,875 $150,800 $92,078 $98,362 $116,871 $128,719
E 205 2.5% $131,763 $136,500 $130,007 $81,120 $180,303 $112,352 $121,400 $139,016 $154,405
F 127 5.4% $158,694 $168,000 $160,493 $114,075 $205,498 $134,364 $148,400 $168,104 $180,803
F+ 42 6.4% $199,548 $190,000 $194,200 $138,000 $256,880 $169,421 $186,226 $211,018 $245,281
A-AB
C
D
E
F
F+
$0
$50,000
$100,000
$150,000
$200,000
$250,000
$300,000
2002 2003 2004 2005 2006 2007 2008 2009 2010 2011 2012
An
nu
al B
ase
Sal
ary
for
Engi
ne
ers
2012 Value of Professional Services Page 33 of 136
Table 10: Annual Engineer Base Salary within ENGINEERING, PROCUREMENT, and CONSTRUCTION.
Figure 9: 10 Year Trend for Annual Engineer Base Salary for within ENGINEERING, PROCUREMENT, and
CONSTRUCTION.
Responsibility
Category
#
Engineer
% Change
from 2011 Average Mode
Median
(D50)
Min
Value
Max
Value D10 D25 D75 D90
A- 63 16.6% $44,686 $41,600 $41,600 $32,448 $54,080 $41,600 $41,600 $48,464 $50,960
A 188 1.8% $65,894 $64,381 $65,000 $49,358 $78,000 $60,290 $64,381 $69,763 $72,800
B 177 -2.4% $77,236 $66,982 $76,357 $60,000 $97,000 $66,982 $67,619 $83,200 $89,864
C 301 -0.4% $94,328 $73,831 $94,800 $69,000 $124,800 $74,773 $86,000 $104,000 $111,114
D 466 4.1% $124,283 $120,000 $124,800 $87,075 $163,200 $108,614 $115,580 $132,772 $140,379
E 586 13.8% $169,994 $156,000 $156,000 $84,864 $273,961 $135,038 $144,050 $186,207 $236,047
F 321 12.7% $199,846 $256,838 $185,585 $91,514 $325,329 $155,600 $169,200 $224,640 $273,961
F+ 110 2.6% $212,261 $189,000 $211,000 $165,000 $271,515 $189,000 $198,009 $222,503 $238,962
A-
AB
C
D
E
FF+
$0
$50,000
$100,000
$150,000
$200,000
$250,000
$300,000
2002 2003 2004 2005 2006 2007 2008 2009 2010 2011 2012
An
nu
al B
ase
Sal
ary
for
Engi
ne
ers
2012 Value of Professional Services Page 34 of 136
Table 11: Annual Engineer Base Salary within RESOURCE EXPLOITATION (except oil and gas).
Figure 10: 10 Year Trend for Annual Engineer Base Salary within RESOURCE EXPLOITATION (except oil and gas).
Responsibility
Category
#
Engineer
% Change
from 2011 Average Mode
Median
(D50)
Min
Value
Max
Value D10 D25 D75 D90
A- 31 1.6% $49,750 $53,707 $51,178 $43,748 $56,445 $44,634 $46,172 $53,707 $53,707
A 14 4.9% $79,147 $81,343 $81,343 $67,500 $83,011 $71,163 $77,810 $82,594 $83,011
B 73 4.3% $87,690 $88,252 $88,252 $74,877 $96,386 $82,920 $85,097 $92,136 $92,553
C 73 3.0% $99,078 $100,218 $99,332 $85,358 $111,866 $93,380 $95,760 $102,200 $104,687
D 206 9.3% $121,961 $130,070 $122,549 $98,341 $146,860 $108,014 $114,266 $130,070 $134,276
E 184 16.6% $153,896 $148,268 $153,235 $129,940 $174,313 $142,957 $148,268 $161,030 $166,398
F 37 18.4% $176,302 $180,310 $177,155 $158,983 $188,496 $164,745 $174,645 $180,310 $185,347
F+ 9 No data $198,163 No value $195,562 $177,178 $223,450 $186,817 $189,982 $206,199 $212,152
A-
ABC
D
E
F
F+
$0
$50,000
$100,000
$150,000
$200,000
$250,000
$300,000
2002 2003 2004 2005 2006 2007 2008 2009 2010 2011 2012
An
nu
al B
ase
Sal
ary
for
Engi
ne
ers
2012 Value of Professional Services Page 35 of 136
Table 12: Annual Engineer Base Salary within RESOURCE EXPLOITATION (only oil and gas).
Figure 11: 10 Year Trend for Annual Engineer Base Salary within RESOURCE EXPLOITATION (only oil and gas).
Responsibility
Category
#
Engineer
% Change
from 2011 Average Mode
Median
(D50)
Min
Value
Max
Value D10 D25 D75 D90
A- 25 -0.8% $50,536 $49,462 $49,920 $40,810 $63,083 $45,926 $48,256 $51,272 $57,400
A 251 -23.9% $59,904 $24,000 $73,500 $24,000 $84,542 $24,000 $32,250 $77,160 $79,900
B 485 -9.3% $76,372 $27,600 $83,700 $27,600 $110,250 $31,500 $78,000 $89,000 $92,211
C 306 3.3% $101,172 $100,000 $100,400 $82,201 $121,000 $92,300 $97,000 $105,000 $111,000
D 582 3.6% $125,950 $120,000 $127,515 $91,550 $161,400 $110,682 $116,283 $134,155 $140,000
E 357 4.3% $160,592 $167,000 $158,700 $126,194 $199,300 $144,044 $152,000 $167,000 $181,104
F 216 5.8% $195,363 $200,000 $190,094 $139,534 $259,700 $172,163 $179,447 $208,475 $229,950
F+ 86 -0.7% $230,356 $300,000 $226,400 $146,348 $325,000 $193,458 $202,381 $247,482 $282,500
A-A
B
C
D
E
F
F+
$0
$50,000
$100,000
$150,000
$200,000
$250,000
$300,000
2002 2003 2004 2005 2006 2007 2008 2009 2010 2011 2012
An
nu
al B
ase
Sal
ary
for
Engi
ne
ers
2012 Value of Professional Services Page 36 of 136
Table 13: Annual Engineer Base Salary within MANUFACTURING (durables).
Figure 12: 10 Year Trend for Annual Engineer Base Salary within MANUFACTURING (durables).
Responsibility
Category
#
Engineer
% Change
from 2011 Average Mode
Median
(D50)
Min
Value
Max
Value D10 D25 D75 D90
A- 13 No data $48,609 $50,000 $50,000 $40,000 $62,000 $45,000 $45,000 $50,000 $50,000
A 27 No data $69,046 $65,000 $68,250 $57,000 $84,880 $61,800 $65,000 $73,968 $75,200
B 26 22.0% $85,529 $67,860 $87,550 $64,870 $100,000 $67,860 $80,450 $94,125 $96,960
C 9 20.7% $98,017 No value $96,000 $80,028 $115,000 $86,406 $91,200 $108,750 $110,672
D 9 6.7% $103,242 No value $104,910 $92,040 $115,000 $95,576 $97,128 $106,340 $111,000
E 7 13.3% $128,615 $130,000 $130,000 $96,720 $156,485 $108,588 $121,050 $137,500 $149,594
F 6 -1.4% $143,431 No value $139,168 $118,500 $190,000 $125,250 $133,584 $141,313 $165,875
F+ 1 No data $260,000 No value $260,000 No value No value No value No value No value No value
A-
A
BCD
E
F
F+
$0
$50,000
$100,000
$150,000
$200,000
$250,000
$300,000
2002 2003 2004 2005 2006 2007 2008 2009 2010 2011 2012
An
nu
al B
ase
Sal
ary
for
Engi
ne
ers
2012 Value of Professional Services Page 37 of 136
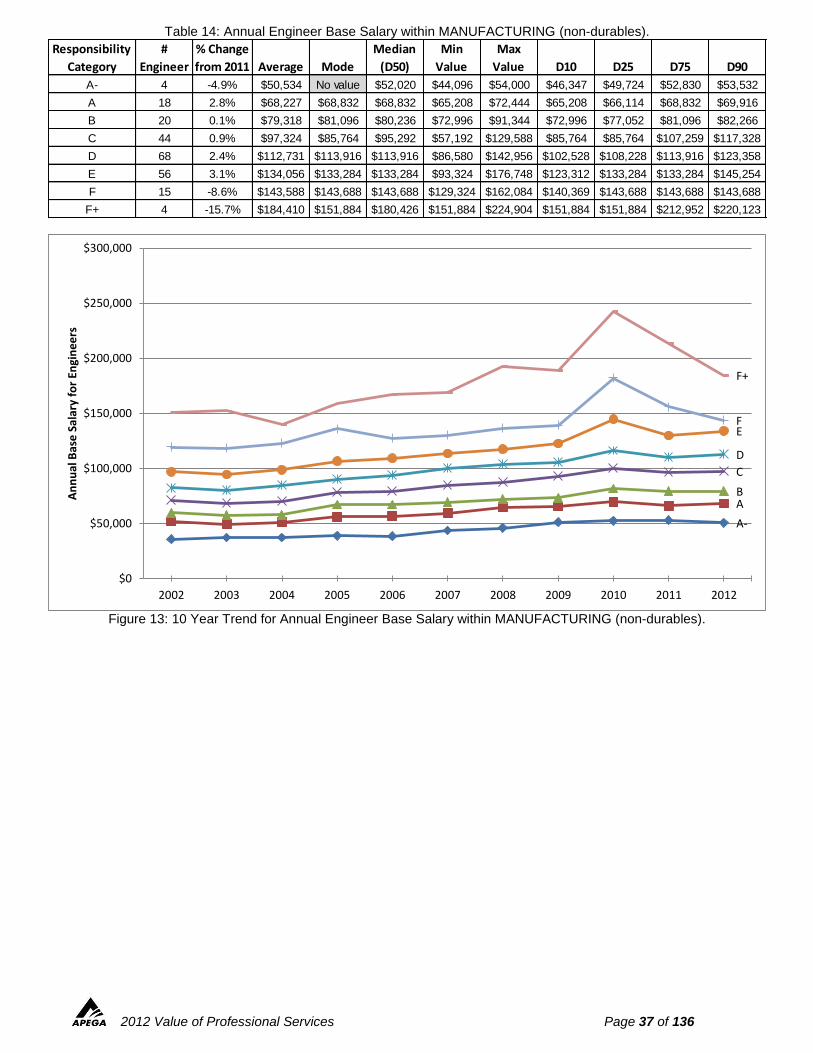
Table 14: Annual Engineer Base Salary within MANUFACTURING (non-durables).
Figure 13: 10 Year Trend for Annual Engineer Base Salary within MANUFACTURING (non-durables).
Responsibility
Category
#
Engineer
% Change
from 2011 Average Mode
Median
(D50)
Min
Value
Max
Value D10 D25 D75 D90
A- 4 -4.9% $50,534 No value $52,020 $44,096 $54,000 $46,347 $49,724 $52,830 $53,532
A 18 2.8% $68,227 $68,832 $68,832 $65,208 $72,444 $65,208 $66,114 $68,832 $69,916
B 20 0.1% $79,318 $81,096 $80,236 $72,996 $91,344 $72,996 $77,052 $81,096 $82,266
C 44 0.9% $97,324 $85,764 $95,292 $57,192 $129,588 $85,764 $85,764 $107,259 $117,328
D 68 2.4% $112,731 $113,916 $113,916 $86,580 $142,956 $102,528 $108,228 $113,916 $123,358
E 56 3.1% $134,056 $133,284 $133,284 $93,324 $176,748 $123,312 $133,284 $133,284 $145,254
F 15 -8.6% $143,588 $143,688 $143,688 $129,324 $162,084 $140,369 $143,688 $143,688 $143,688
F+ 4 -15.7% $184,410 $151,884 $180,426 $151,884 $224,904 $151,884 $151,884 $212,952 $220,123
A-
AB
C
D
EF
F+
$0
$50,000
$100,000
$150,000
$200,000
$250,000
$300,000
2002 2003 2004 2005 2006 2007 2008 2009 2010 2011 2012
An
nu
al B
ase
Sal
ary
for
Engi
ne
ers
2012 Value of Professional Services Page 38 of 136
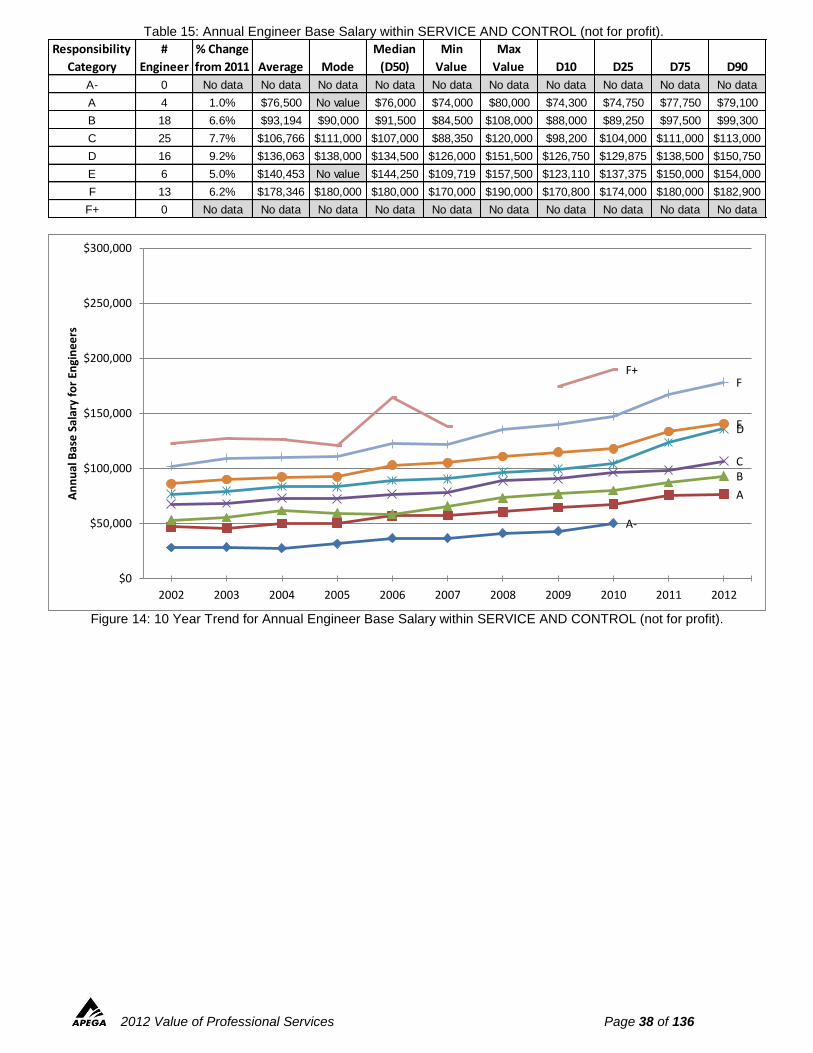
Table 15: Annual Engineer Base Salary within SERVICE AND CONTROL (not for profit).
Figure 14: 10 Year Trend for Annual Engineer Base Salary within SERVICE AND CONTROL (not for profit).
Responsibility
Category
#
Engineer
% Change
from 2011 Average Mode
Median
(D50)
Min
Value
Max
Value D10 D25 D75 D90
A- 0 No data No data No data No data No data No data No data No data No data No data
A 4 1.0% $76,500 No value $76,000 $74,000 $80,000 $74,300 $74,750 $77,750 $79,100
B 18 6.6% $93,194 $90,000 $91,500 $84,500 $108,000 $88,000 $89,250 $97,500 $99,300
C 25 7.7% $106,766 $111,000 $107,000 $88,350 $120,000 $98,200 $104,000 $111,000 $113,000
D 16 9.2% $136,063 $138,000 $134,500 $126,000 $151,500 $126,750 $129,875 $138,500 $150,750
E 6 5.0% $140,453 No value $144,250 $109,719 $157,500 $123,110 $137,375 $150,000 $154,000
F 13 6.2% $178,346 $180,000 $180,000 $170,000 $190,000 $170,800 $174,000 $180,000 $182,900
F+ 0 No data No data No data No data No data No data No data No data No data No data
A-
A
BC
DE
FF+
$0
$50,000
$100,000
$150,000
$200,000
$250,000
$300,000
2002 2003 2004 2005 2006 2007 2008 2009 2010 2011 2012
An
nu
al B
ase
Sal
ary
for
Engi
ne
ers
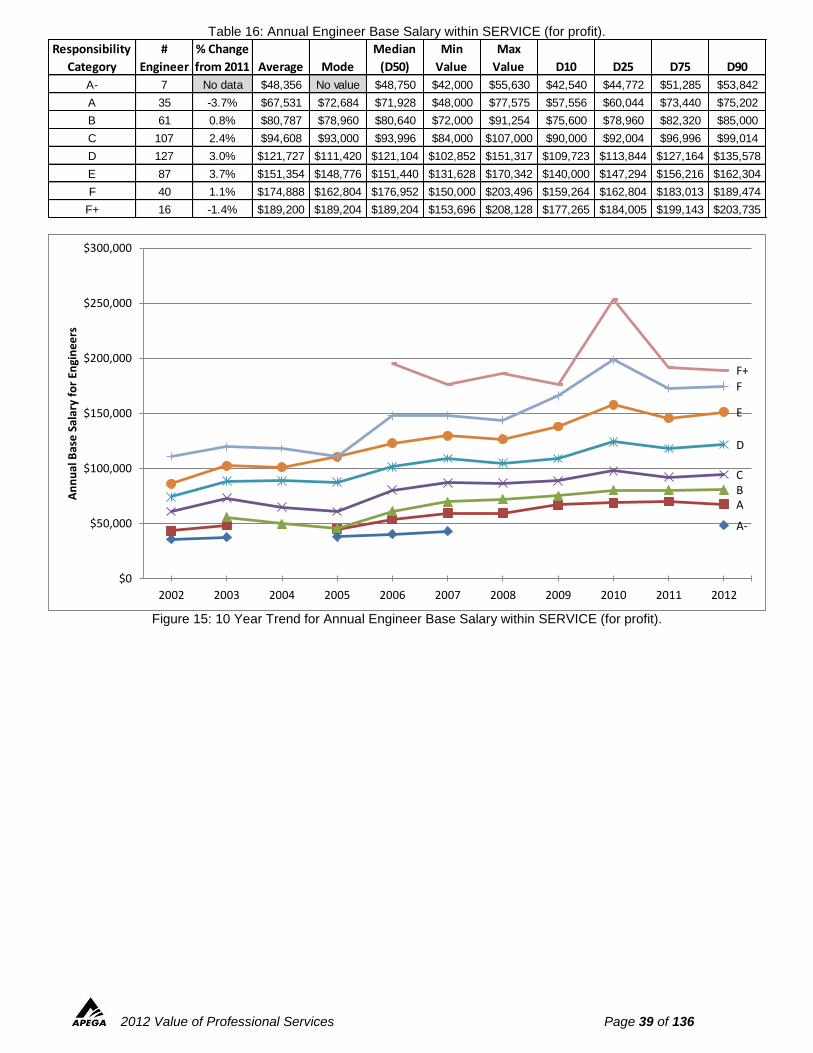
2012 Value of Professional Services Page 39 of 136
Table 16: Annual Engineer Base Salary within SERVICE (for profit).
Figure 15: 10 Year Trend for Annual Engineer Base Salary within SERVICE (for profit).
Responsibility
Category
#
Engineer
% Change
from 2011 Average Mode
Median
(D50)
Min
Value
Max
Value D10 D25 D75 D90
A- 7 No data $48,356 No value $48,750 $42,000 $55,630 $42,540 $44,772 $51,285 $53,842
A 35 -3.7% $67,531 $72,684 $71,928 $48,000 $77,575 $57,556 $60,044 $73,440 $75,202
B 61 0.8% $80,787 $78,960 $80,640 $72,000 $91,254 $75,600 $78,960 $82,320 $85,000
C 107 2.4% $94,608 $93,000 $93,996 $84,000 $107,000 $90,000 $92,004 $96,996 $99,014
D 127 3.0% $121,727 $111,420 $121,104 $102,852 $151,317 $109,723 $113,844 $127,164 $135,578
E 87 3.7% $151,354 $148,776 $151,440 $131,628 $170,342 $140,000 $147,294 $156,216 $162,304
F 40 1.1% $174,888 $162,804 $176,952 $150,000 $203,496 $159,264 $162,804 $183,013 $189,474
F+ 16 -1.4% $189,200 $189,204 $189,204 $153,696 $208,128 $177,265 $184,005 $199,143 $203,735
A-
ABC
D
E
FF+
$0
$50,000
$100,000
$150,000
$200,000
$250,000
$300,000
2002 2003 2004 2005 2006 2007 2008 2009 2010 2011 2012
An
nu
al B
ase
Sal
ary
for
Engi
ne
ers
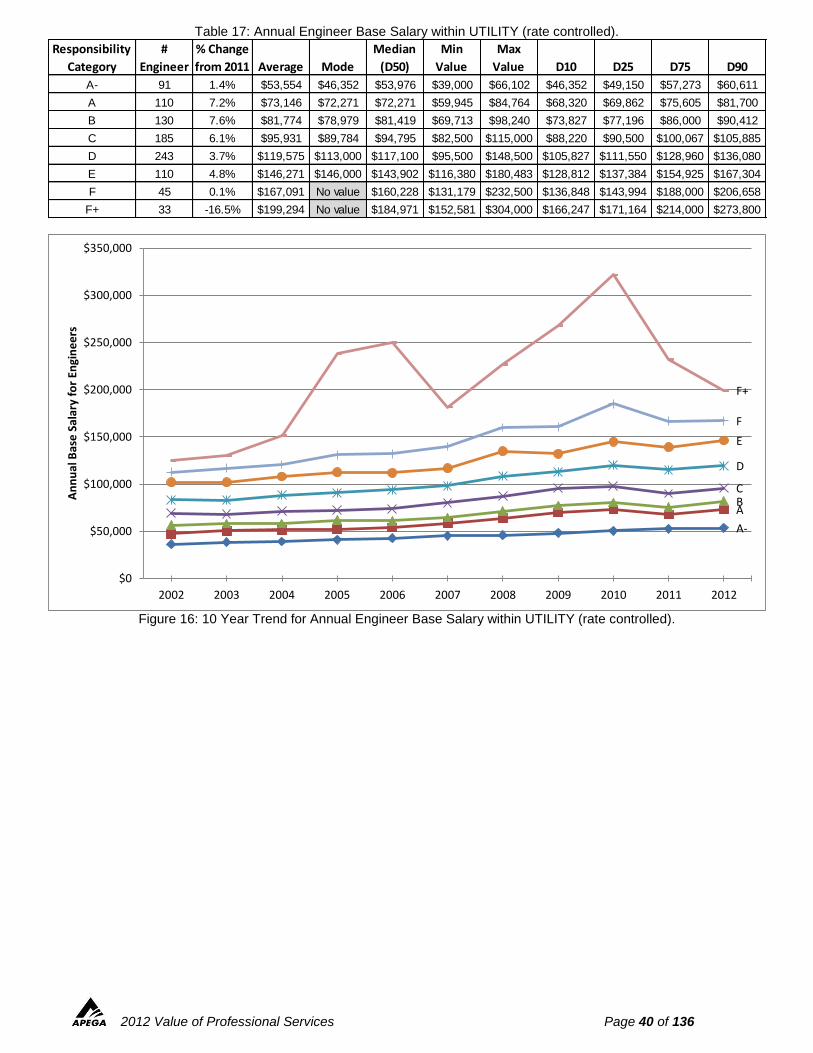
2012 Value of Professional Services Page 40 of 136
Table 17: Annual Engineer Base Salary within UTILITY (rate controlled).
Figure 16: 10 Year Trend for Annual Engineer Base Salary within UTILITY (rate controlled).
Responsibility
Category
#
Engineer
% Change
from 2011 Average Mode
Median
(D50)
Min
Value
Max
Value D10 D25 D75 D90
A- 91 1.4% $53,554 $46,352 $53,976 $39,000 $66,102 $46,352 $49,150 $57,273 $60,611
A 110 7.2% $73,146 $72,271 $72,271 $59,945 $84,764 $68,320 $69,862 $75,605 $81,700
B 130 7.6% $81,774 $78,979 $81,419 $69,713 $98,240 $73,827 $77,196 $86,000 $90,412
C 185 6.1% $95,931 $89,784 $94,795 $82,500 $115,000 $88,220 $90,500 $100,067 $105,885
D 243 3.7% $119,575 $113,000 $117,100 $95,500 $148,500 $105,827 $111,550 $128,960 $136,080
E 110 4.8% $146,271 $146,000 $143,902 $116,380 $180,483 $128,812 $137,384 $154,925 $167,304
F 45 0.1% $167,091 No value $160,228 $131,179 $232,500 $136,848 $143,994 $188,000 $206,658
F+ 33 -16.5% $199,294 No value $184,971 $152,581 $304,000 $166,247 $171,164 $214,000 $273,800
A-
ABC
D
E
F
F+
$0
$50,000
$100,000
$150,000
$200,000
$250,000
$300,000
$350,000
2002 2003 2004 2005 2006 2007 2008 2009 2010 2011 2012
An
nu
al B
ase
Sal
ary
for
Engi
ne
ers
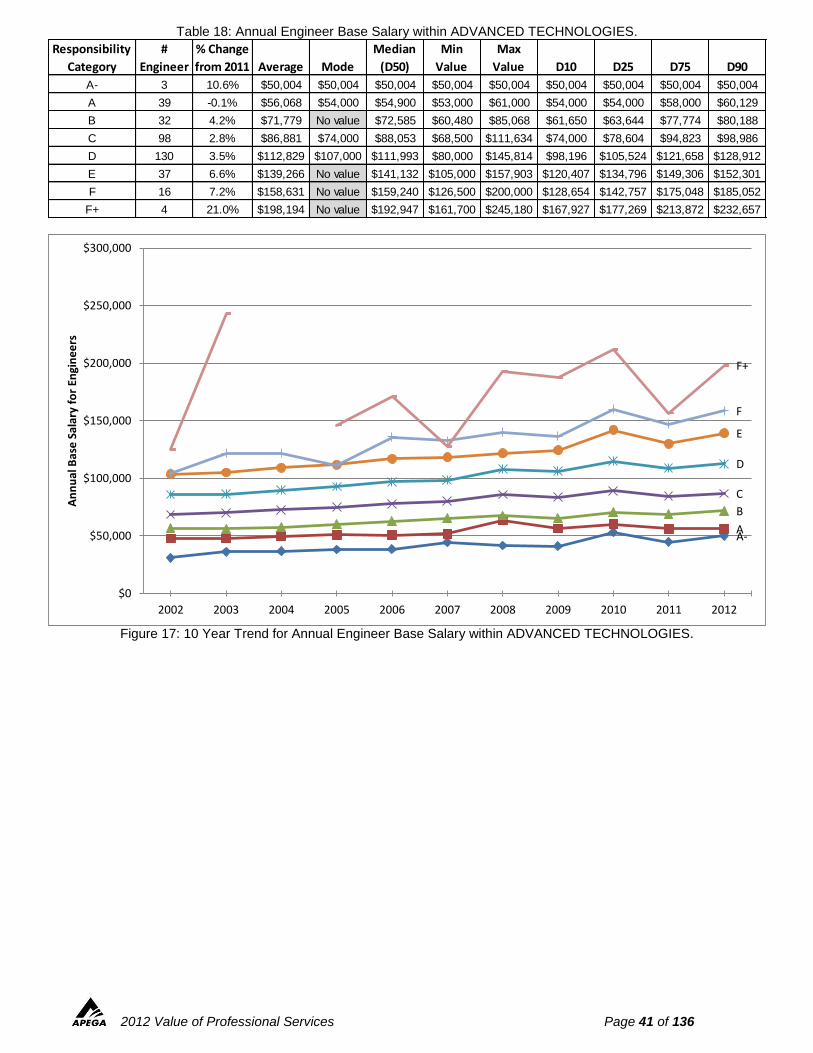
2012 Value of Professional Services Page 41 of 136
Table 18: Annual Engineer Base Salary within ADVANCED TECHNOLOGIES.
Figure 17: 10 Year Trend for Annual Engineer Base Salary within ADVANCED TECHNOLOGIES.
Responsibility
Category
#
Engineer
% Change
from 2011 Average Mode
Median
(D50)
Min
Value
Max
Value D10 D25 D75 D90
A- 3 10.6% $50,004 $50,004 $50,004 $50,004 $50,004 $50,004 $50,004 $50,004 $50,004
A 39 -0.1% $56,068 $54,000 $54,900 $53,000 $61,000 $54,000 $54,000 $58,000 $60,129
B 32 4.2% $71,779 No value $72,585 $60,480 $85,068 $61,650 $63,644 $77,774 $80,188
C 98 2.8% $86,881 $74,000 $88,053 $68,500 $111,634 $74,000 $78,604 $94,823 $98,986
D 130 3.5% $112,829 $107,000 $111,993 $80,000 $145,814 $98,196 $105,524 $121,658 $128,912
E 37 6.6% $139,266 No value $141,132 $105,000 $157,903 $120,407 $134,796 $149,306 $152,301
F 16 7.2% $158,631 No value $159,240 $126,500 $200,000 $128,654 $142,757 $175,048 $185,052
F+ 4 21.0% $198,194 No value $192,947 $161,700 $245,180 $167,927 $177,269 $213,872 $232,657
A-A
B
C
D
E
F
F+
$0
$50,000
$100,000
$150,000
$200,000
$250,000
$300,000
2002 2003 2004 2005 2006 2007 2008 2009 2010 2011 2012
An
nu
al B
ase
Sal
ary
for
Engi
ne
ers
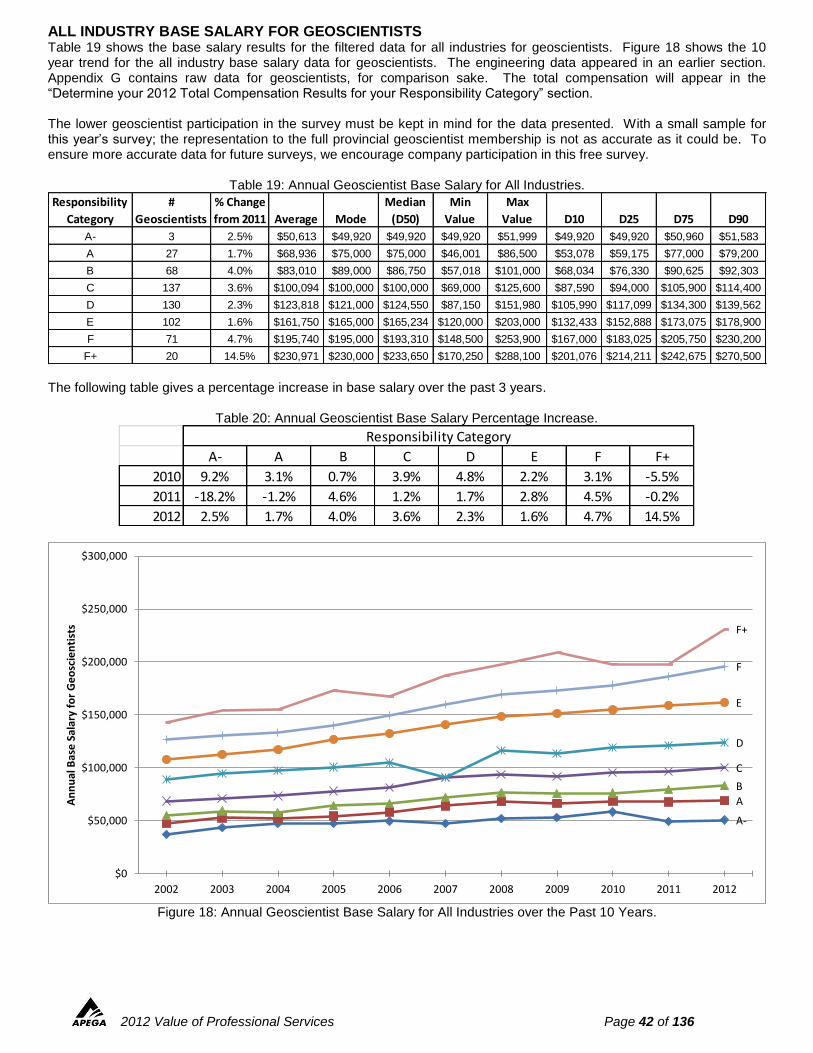
2012 Value of Professional Services Page 42 of 136
ALL INDUSTRY BASE SALARY FOR GEOSCIENTISTS Table 19 shows the base salary results for the filtered data for all industries for geoscientists. Figure 18 shows the 10 year trend for the all industry base salary data for geoscientists. The engineering data appeared in an earlier section. Appendix G contains raw data for geoscientists, for comparison sake. The total compensation will appear in the “Determine your 2012 Total Compensation Results for your Responsibility Category” section. The lower geoscientist participation in the survey must be kept in mind for the data presented. With a small sample for this year’s survey; the representation to the full provincial geoscientist membership is not as accurate as it could be. To ensure more accurate data for future surveys, we encourage company participation in this free survey.
Table 19: Annual Geoscientist Base Salary for All Industries.
The following table gives a percentage increase in base salary over the past 3 years.
Table 20: Annual Geoscientist Base Salary Percentage Increase.
Figure 18: Annual Geoscientist Base Salary for All Industries over the Past 10 Years.
Responsibility
Category
#
Geoscientists
% Change
from 2011 Average Mode
Median
(D50)
Min
Value
Max
Value D10 D25 D75 D90
A- 3 2.5% $50,613 $49,920 $49,920 $49,920 $51,999 $49,920 $49,920 $50,960 $51,583
A 27 1.7% $68,936 $75,000 $75,000 $46,001 $86,500 $53,078 $59,175 $77,000 $79,200
B 68 4.0% $83,010 $89,000 $86,750 $57,018 $101,000 $68,034 $76,330 $90,625 $92,303
C 137 3.6% $100,094 $100,000 $100,000 $69,000 $125,600 $87,590 $94,000 $105,900 $114,400
D 130 2.3% $123,818 $121,000 $124,550 $87,150 $151,980 $105,990 $117,099 $134,300 $139,562
E 102 1.6% $161,750 $165,000 $165,234 $120,000 $203,000 $132,433 $152,888 $173,075 $178,900
F 71 4.7% $195,740 $195,000 $193,310 $148,500 $253,900 $167,000 $183,025 $205,750 $230,200
F+ 20 14.5% $230,971 $230,000 $233,650 $170,250 $288,100 $201,076 $214,211 $242,675 $270,500
A- A B C D E F F+
2010 9.2% 3.1% 0.7% 3.9% 4.8% 2.2% 3.1% -5.5%
2011 -18.2% -1.2% 4.6% 1.2% 1.7% 2.8% 4.5% -0.2%
2012 2.5% 1.7% 4.0% 3.6% 2.3% 1.6% 4.7% 14.5%
Responsibility Category
A-
AB
C
D
E
F
F+
$0
$50,000
$100,000
$150,000
$200,000
$250,000
$300,000
2002 2003 2004 2005 2006 2007 2008 2009 2010 2011 2012
An
nu
al B
ase
Sal
ary
for
Ge
osc
ien
tist
s
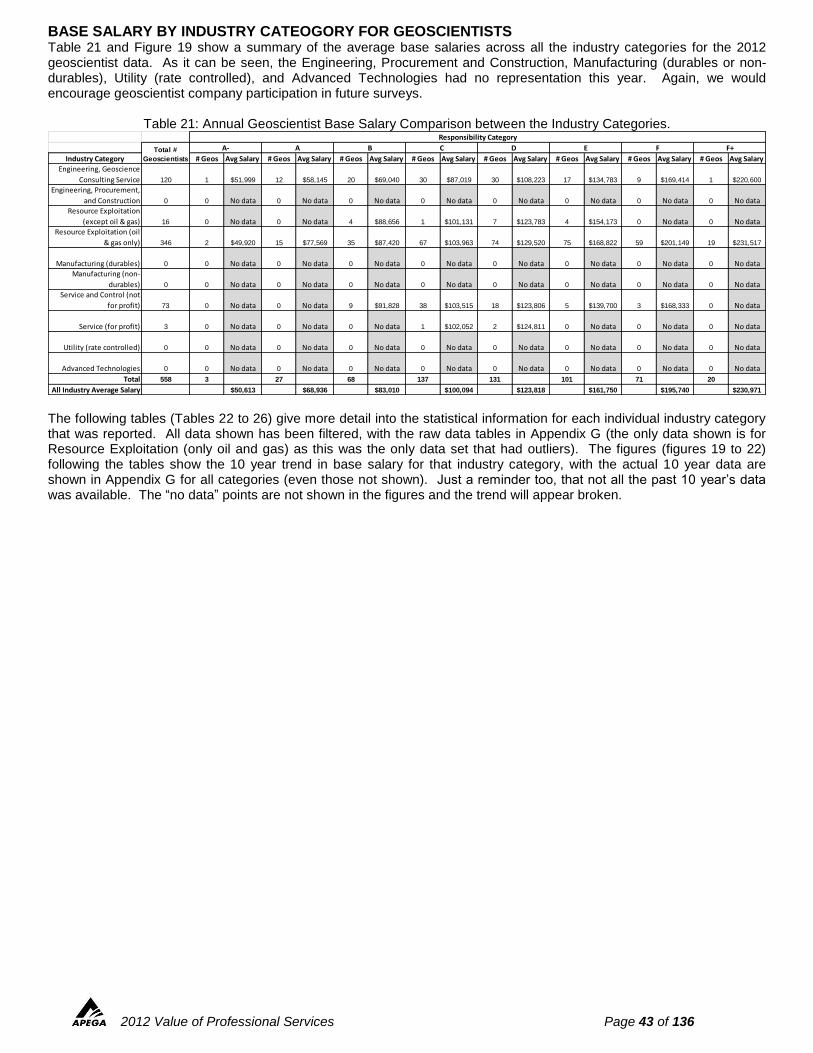
2012 Value of Professional Services Page 43 of 136
BASE SALARY BY INDUSTRY CATEOGORY FOR GEOSCIENTISTS Table 21 and Figure 19 show a summary of the average base salaries across all the industry categories for the 2012 geoscientist data. As it can be seen, the Engineering, Procurement and Construction, Manufacturing (durables or non-durables), Utility (rate controlled), and Advanced Technologies had no representation this year. Again, we would encourage geoscientist company participation in future surveys.
Table 21: Annual Geoscientist Base Salary Comparison between the Industry Categories.
The following tables (Tables 22 to 26) give more detail into the statistical information for each individual industry category that was reported. All data shown has been filtered, with the raw data tables in Appendix G (the only data shown is for Resource Exploitation (only oil and gas) as this was the only data set that had outliers). The figures (figures 19 to 22) following the tables show the 10 year trend in base salary for that industry category, with the actual 10 year data are shown in Appendix G for all categories (even those not shown). Just a reminder too, that not all the past 10 year’s data was available. The “no data” points are not shown in the figures and the trend will appear broken.
Industry Category # Geos Avg Salary # Geos Avg Salary # Geos Avg Salary # Geos Avg Salary # Geos Avg Salary # Geos Avg Salary # Geos Avg Salary # Geos Avg Salary
Engineering, Geoscience
Consulting Service 120 1 $51,999 12 $58,145 20 $69,040 30 $87,019 30 $108,223 17 $134,783 9 $169,414 1 $220,600
Engineering, Procurement,
and Construction 0 0 No data 0 No data 0 No data 0 No data 0 No data 0 No data 0 No data 0 No data
Resource Exploitation
(except oil & gas) 16 0 No data 0 No data 4 $88,656 1 $101,131 7 $123,783 4 $154,173 0 No data 0 No data
Resource Exploitation (oil
& gas only) 346 2 $49,920 15 $77,569 35 $87,420 67 $103,963 74 $129,520 75 $168,822 59 $201,149 19 $231,517
Manufacturing (durables) 0 0 No data 0 No data 0 No data 0 No data 0 No data 0 No data 0 No data 0 No data
Manufacturing (non-
durables) 0 0 No data 0 No data 0 No data 0 No data 0 No data 0 No data 0 No data 0 No data
Service and Control (not
for profit) 73 0 No data 0 No data 9 $91,828 38 $103,515 18 $123,806 5 $139,700 3 $168,333 0 No data
Service (for profit) 3 0 No data 0 No data 0 No data 1 $102,052 2 $124,811 0 No data 0 No data 0 No data
Utility (rate controlled) 0 0 No data 0 No data 0 No data 0 No data 0 No data 0 No data 0 No data 0 No data
Advanced Technologies 0 0 No data 0 No data 0 No data 0 No data 0 No data 0 No data 0 No data 0 No data
Total 558 3 27 68 137 131 101 71 20
All Industry Average Salary $50,613 $68,936 $83,010 $100,094 $123,818 $161,750 $195,740 $230,971
Responsibility Category
Total #
Geoscientists
A- A B C D E F F+
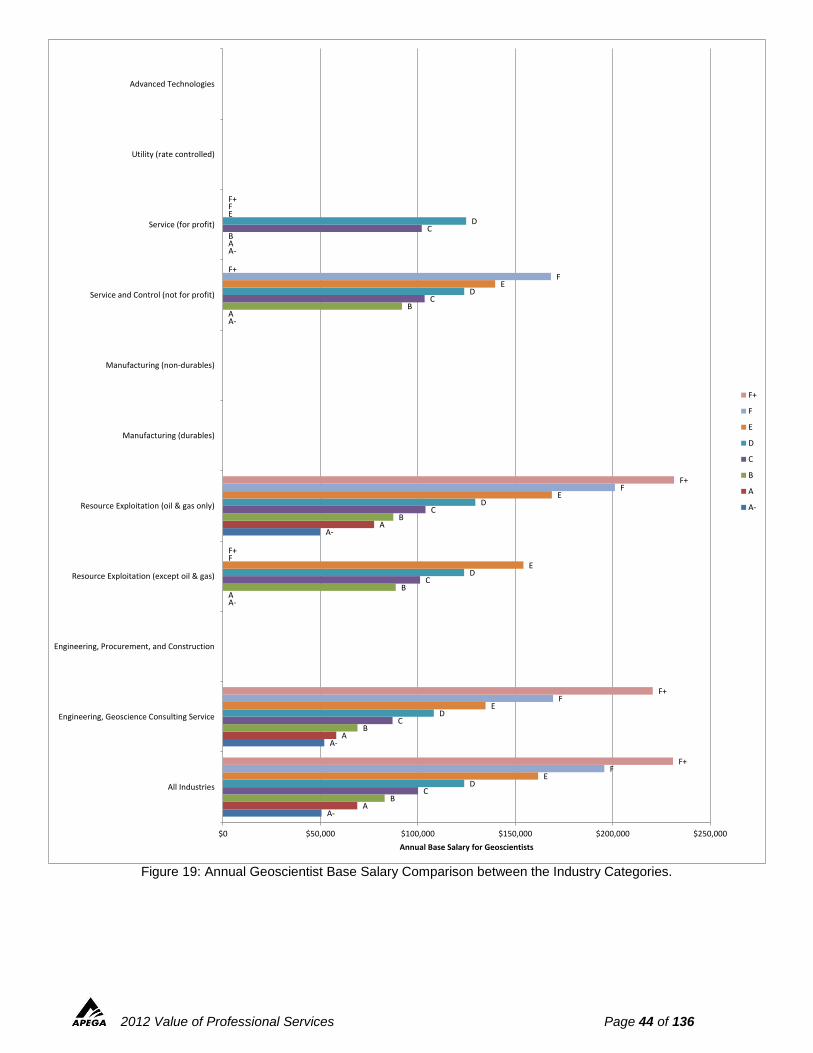
2012 Value of Professional Services Page 44 of 136
Figure 19: Annual Geoscientist Base Salary Comparison between the Industry Categories.
A-
A-
A-
A-
A-
A-
A
A
A
A
A
A
B
B
B
B
B
B
C
C
C
C
C
C
D
D
D
D
D
D
E
E
E
E
E
E
F
F
F
F
F
F
F+
F+
F+
F+
F+
F+
$0 $50,000 $100,000 $150,000 $200,000 $250,000
All Industries
Engineering, Geoscience Consulting Service
Engineering, Procurement, and Construction
Resource Exploitation (except oil & gas)
Resource Exploitation (oil & gas only)
Manufacturing (durables)
Manufacturing (non-durables)
Service and Control (not for profit)
Service (for profit)
Utility (rate controlled)
Advanced Technologies
Annual Base Salary for Geoscientists
F+
F
E
D
C
B
A
A-
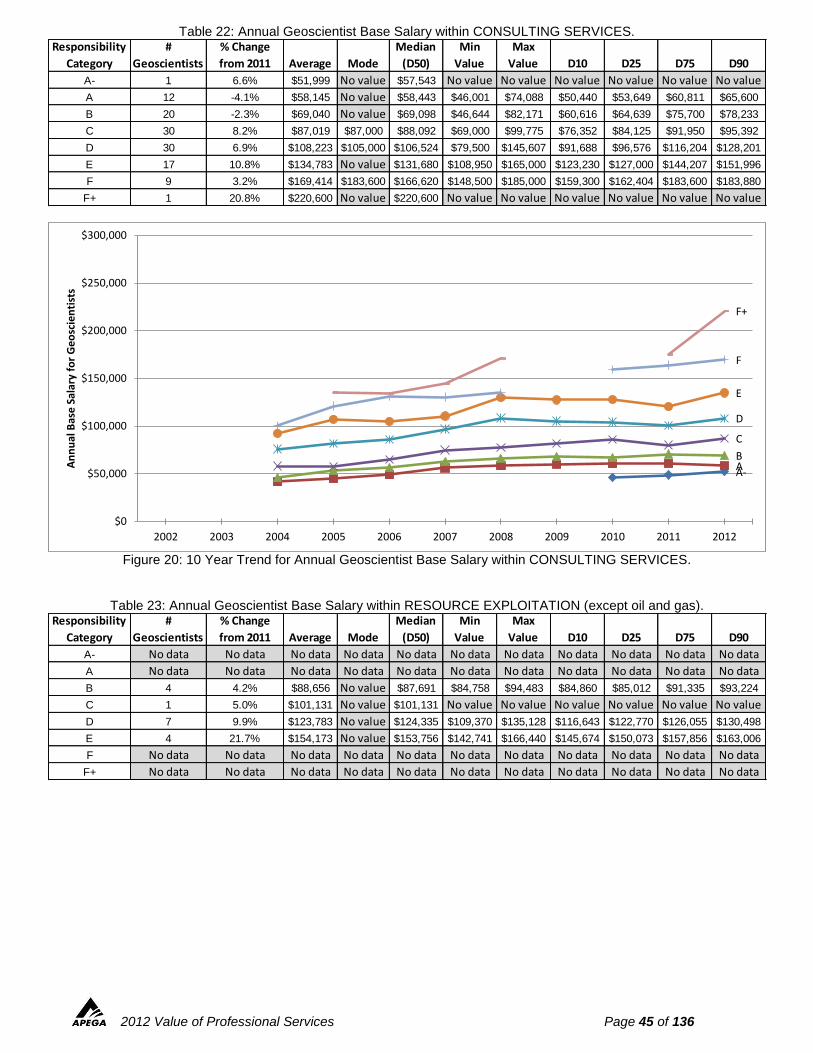
2012 Value of Professional Services Page 45 of 136
Table 22: Annual Geoscientist Base Salary within CONSULTING SERVICES.
Figure 20: 10 Year Trend for Annual Geoscientist Base Salary within CONSULTING SERVICES.
Table 23: Annual Geoscientist Base Salary within RESOURCE EXPLOITATION (except oil and gas).
Responsibility
Category
#
Geoscientists
% Change
from 2011 Average Mode
Median
(D50)
Min
Value
Max
Value D10 D25 D75 D90
A- 1 6.6% $51,999 No value $57,543 No value No value No value No value No value No value
A 12 -4.1% $58,145 No value $58,443 $46,001 $74,088 $50,440 $53,649 $60,811 $65,600
B 20 -2.3% $69,040 No value $69,098 $46,644 $82,171 $60,616 $64,639 $75,700 $78,233
C 30 8.2% $87,019 $87,000 $88,092 $69,000 $99,775 $76,352 $84,125 $91,950 $95,392
D 30 6.9% $108,223 $105,000 $106,524 $79,500 $145,607 $91,688 $96,576 $116,204 $128,201
E 17 10.8% $134,783 No value $131,680 $108,950 $165,000 $123,230 $127,000 $144,207 $151,996
F 9 3.2% $169,414 $183,600 $166,620 $148,500 $185,000 $159,300 $162,404 $183,600 $183,880
F+ 1 20.8% $220,600 No value $220,600 No value No value No value No value No value No value
A-AB
C
D
E
F
F+
$0
$50,000
$100,000
$150,000
$200,000
$250,000
$300,000
2002 2003 2004 2005 2006 2007 2008 2009 2010 2011 2012
An
nu
al B
ase
Sal
ary
for
Ge
osc
ien
tist
s
Responsibility
Category
#
Geoscientists
% Change
from 2011 Average Mode
Median
(D50)
Min
Value
Max
Value D10 D25 D75 D90
A- No data No data No data No data No data No data No data No data No data No data No data
A No data No data No data No data No data No data No data No data No data No data No data
B 4 4.2% $88,656 No value $87,691 $84,758 $94,483 $84,860 $85,012 $91,335 $93,224
C 1 5.0% $101,131 No value $101,131 No value No value No value No value No value No value
D 7 9.9% $123,783 No value $124,335 $109,370 $135,128 $116,643 $122,770 $126,055 $130,498
E 4 21.7% $154,173 No value $153,756 $142,741 $166,440 $145,674 $150,073 $157,856 $163,006
F No data No data No data No data No data No data No data No data No data No data No data
F+ No data No data No data No data No data No data No data No data No data No data No data
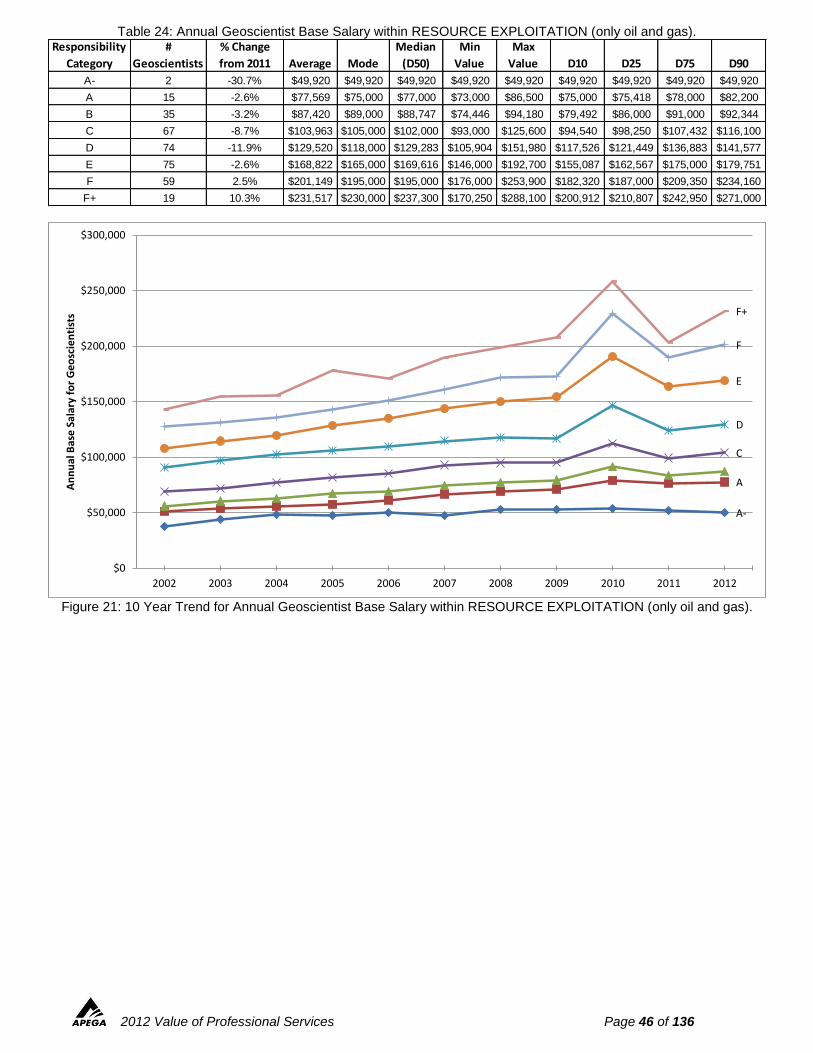
2012 Value of Professional Services Page 46 of 136
Table 24: Annual Geoscientist Base Salary within RESOURCE EXPLOITATION (only oil and gas).
Figure 21: 10 Year Trend for Annual Geoscientist Base Salary within RESOURCE EXPLOITATION (only oil and gas).
Responsibility
Category
#
Geoscientists
% Change
from 2011 Average Mode
Median
(D50)
Min
Value
Max
Value D10 D25 D75 D90
A- 2 -30.7% $49,920 $49,920 $49,920 $49,920 $49,920 $49,920 $49,920 $49,920 $49,920
A 15 -2.6% $77,569 $75,000 $77,000 $73,000 $86,500 $75,000 $75,418 $78,000 $82,200
B 35 -3.2% $87,420 $89,000 $88,747 $74,446 $94,180 $79,492 $86,000 $91,000 $92,344
C 67 -8.7% $103,963 $105,000 $102,000 $93,000 $125,600 $94,540 $98,250 $107,432 $116,100
D 74 -11.9% $129,520 $118,000 $129,283 $105,904 $151,980 $117,526 $121,449 $136,883 $141,577
E 75 -2.6% $168,822 $165,000 $169,616 $146,000 $192,700 $155,087 $162,567 $175,000 $179,751
F 59 2.5% $201,149 $195,000 $195,000 $176,000 $253,900 $182,320 $187,000 $209,350 $234,160
F+ 19 10.3% $231,517 $230,000 $237,300 $170,250 $288,100 $200,912 $210,807 $242,950 $271,000
A-
A
C
D
E
F
F+
$0
$50,000
$100,000
$150,000
$200,000
$250,000
$300,000
2002 2003 2004 2005 2006 2007 2008 2009 2010 2011 2012
An
nu
al B
ase
Sal
ary
for
Ge
osc
ien
tist
s
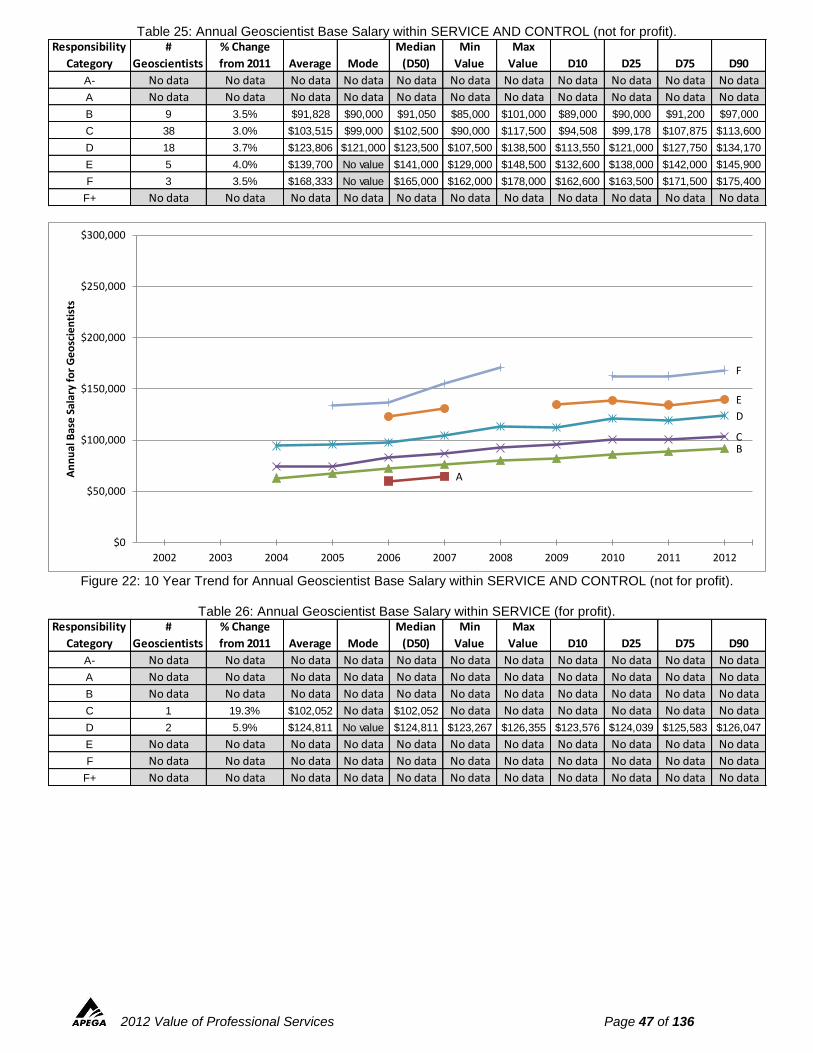
2012 Value of Professional Services Page 47 of 136
Table 25: Annual Geoscientist Base Salary within SERVICE AND CONTROL (not for profit).
Figure 22: 10 Year Trend for Annual Geoscientist Base Salary within SERVICE AND CONTROL (not for profit).
Table 26: Annual Geoscientist Base Salary within SERVICE (for profit).
Responsibility
Category
#
Geoscientists
% Change
from 2011 Average Mode
Median
(D50)
Min
Value
Max
Value D10 D25 D75 D90
A- No data No data No data No data No data No data No data No data No data No data No data
A No data No data No data No data No data No data No data No data No data No data No data
B 9 3.5% $91,828 $90,000 $91,050 $85,000 $101,000 $89,000 $90,000 $91,200 $97,000
C 38 3.0% $103,515 $99,000 $102,500 $90,000 $117,500 $94,508 $99,178 $107,875 $113,600
D 18 3.7% $123,806 $121,000 $123,500 $107,500 $138,500 $113,550 $121,000 $127,750 $134,170
E 5 4.0% $139,700 No value $141,000 $129,000 $148,500 $132,600 $138,000 $142,000 $145,900
F 3 3.5% $168,333 No value $165,000 $162,000 $178,000 $162,600 $163,500 $171,500 $175,400
F+ No data No data No data No data No data No data No data No data No data No data No data
A
BC
D
E
F
$0
$50,000
$100,000
$150,000
$200,000
$250,000
$300,000
2002 2003 2004 2005 2006 2007 2008 2009 2010 2011 2012
An
nu
al B
ase
Sal
ary
for
Ge
osc
ien
tist
s
Responsibility
Category
#
Geoscientists
% Change
from 2011 Average Mode
Median
(D50)
Min
Value
Max
Value D10 D25 D75 D90
A- No data No data No data No data No data No data No data No data No data No data No data
A No data No data No data No data No data No data No data No data No data No data No data
B No data No data No data No data No data No data No data No data No data No data No data
C 1 19.3% $102,052 No data $102,052 No data No data No data No data No data No data
D 2 5.9% $124,811 No value $124,811 $123,267 $126,355 $123,576 $124,039 $125,583 $126,047
E No data No data No data No data No data No data No data No data No data No data No data
F No data No data No data No data No data No data No data No data No data No data No data
F+ No data No data No data No data No data No data No data No data No data No data No data
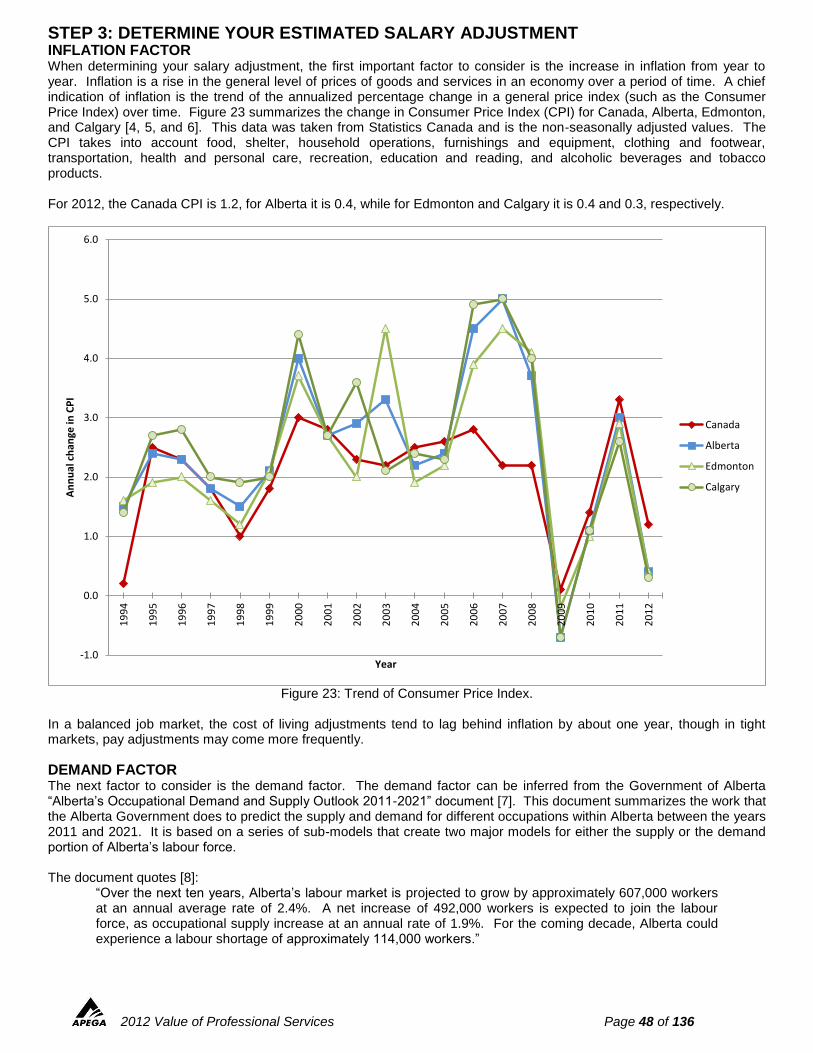
2012 Value of Professional Services Page 48 of 136
STEP 3: DETERMINE YOUR ESTIMATED SALARY ADJUSTMENT INFLATION FACTOR When determining your salary adjustment, the first important factor to consider is the increase in inflation from year to year. Inflation is a rise in the general level of prices of goods and services in an economy over a period of time. A chief indication of inflation is the trend of the annualized percentage change in a general price index (such as the Consumer Price Index) over time. Figure 23 summarizes the change in Consumer Price Index (CPI) for Canada, Alberta, Edmonton, and Calgary [4, 5, and 6]. This data was taken from Statistics Canada and is the non-seasonally adjusted values. The CPI takes into account food, shelter, household operations, furnishings and equipment, clothing and footwear, transportation, health and personal care, recreation, education and reading, and alcoholic beverages and tobacco products. For 2012, the Canada CPI is 1.2, for Alberta it is 0.4, while for Edmonton and Calgary it is 0.4 and 0.3, respectively.
Figure 23: Trend of Consumer Price Index.
In a balanced job market, the cost of living adjustments tend to lag behind inflation by about one year, though in tight markets, pay adjustments may come more frequently.
DEMAND FACTOR The next factor to consider is the demand factor. The demand factor can be inferred from the Government of Alberta “Alberta’s Occupational Demand and Supply Outlook 2011-2021” document [7]. This document summarizes the work that the Alberta Government does to predict the supply and demand for different occupations within Alberta between the years 2011 and 2021. It is based on a series of sub-models that create two major models for either the supply or the demand portion of Alberta’s labour force. The document quotes [8]:
“Over the next ten years, Alberta’s labour market is projected to grow by approximately 607,000 workers at an annual average rate of 2.4%. A net increase of 492,000 workers is expected to join the labour force, as occupational supply increase at an annual rate of 1.9%. For the coming decade, Alberta could experience a labour shortage of approximately 114,000 workers.”
-1.0
0.0
1.0
2.0
3.0
4.0
5.0
6.0
19
94
19
95
19
96
19
97
19
98
19
99
20
00
20
01
20
02
20
03
20
04
20
05
20
06
20
07
20
08
20
09
20
10
20
11
20
12
An
nu
al c
han
ge in
CP
I
Year
Canada
Alberta
Edmonton
Calgary
2012 Value of Professional Services Page 49 of 136
This document goes to break down the projections into occupational groups. In most categories for engineers and geoscientists, there is a predicted shortage that Alberta is currently experiencing, which is shown to escalate up to the year 2021 (this is the upper limit of the document). The only exception is engineering management, which is shown to have a surplus until 2014 and then it continues to have a shortage up until 2021. According to our survey respondents, 73% indicate that they are expecting to add to their professional staff over the next year, while 23% indicate that they would be maintaining current staffing levels. No one expects to reduce their staffing numbers in the upcoming year. Based on these factors, it is expected that the demand for APEGA members will continue to grow, particularly in the resource sector. Based on this, APEGA is predicting a higher demand factor of 2.0%. This is generalized across the broad range of disciplines and industry types within Alberta. Your Human Resources representative may feel that the demand factor should be adjusted based on specific expertise and field of practice. Based on these two factors, you can predict your salary increase to be approximately the sum of the CPI index and the demand factor. The following is an illustrative example as to how to calculate your expected salary adjustment.
If you are a Level C Engineer: Inflation Factor (CPI Index) 0.4% for Alberta Demand factor 2.0% Estimated Salary Adjustment: 2.4%
It is cautioned though that these factors are for consideration, and may be used on top of other external factors such as the effect of new hires, attrition rates, internal promotions, etc. on the salary pool behaviour. From our salary survey, 88% of our employers planned to increase salaries for the next 12 months, while 12% planned to keep salaries stable. No employers plan to decrease salaries. On average, the salary increase from the employers who participated was 3.3% (with a range of 2.2 to 7.5%).
LEVEL OF PERFORMANCE FACTOR A third factor in determining your salary adjustment is your level of performance. Most companies have a performance evaluation process that is often tied to performance ratings and/or salary increases. Performance often ranges from Needs Improvement to Adequate to Star Performer. As to how to apply this to your salary adjustment, consider the following illustration:
If a Level C Engineer has a few years’ experience on the job, but has brought little direct relevant experience, or perhaps has come from outside the company and still needs guidance in decision making, the Level C Engineer could expect base pay in the range of the D25 to D50 range ($78,728 to $85,451). Whereas, if a Level C Engineer makes fast, reliable decisions, presents recommendations that are generally accepted, and is considered a strong member of the team, his/her salary range would be in the D50 to D90 range ($98,706 to $106,080) per year.
2012 Value of Professional Services Page 50 of 136
STEP 4: DETERMINE YOUR 2012 TOTAL COMPENSATION RESULTS FOR YOUR RESPONSIBILITY CATEGORY 2012 TOTAL COMPENSATION RESULTS Now that you have a good idea of your base salary and adjustment, you can compare your current total compensation to those across the province in your industry category. The data points included are the same ones that were included in the filtered base salary data reporting, to provide consistency in reporting and because the benefits reported vary quite significantly. The first part of this section will include the total compensation tables for engineers and the second part for geoscientists. For further information on benefits, see the “Full Salary Survey Results” section. As mentioned in the “Definition and Terminology” section, the annual total compensation is reported as the sum of the annual base salary, additional cash compensation, overtime compensation, and other compensation. Keep in mind that the base salary does not include any kind of bonuses, profit sharing, northern/isolation allowances, overtime, or pay for unused vacation. For clarity purposes, please note the following:
Additional cash compensation is all lump sum or re-earnable payments. This is not the same as merit, which is
earnable each year. Additional cash compensations include commissions, cash bonus payments, profit sharing
payments, performance/merit bonus (lump sum), and productivity/gain sharing payments. This is over a full year.
This does not include overtime/shift premiums, stock options/purchase plans, car allowances, awards, consulting
fees, club memberships, or fringe benefits;
Overtime compensation is considered only when the payment is made beyond the base salary;
Other compensation, including stock options/purchase plans, consulting fees, and other payments easily
convertible to cash. This does not include car allowance, club memberships, parking, or other fringe benefits that
cannot be converted to cash.
For further information, please refer to the “Definition and Terminology” section.
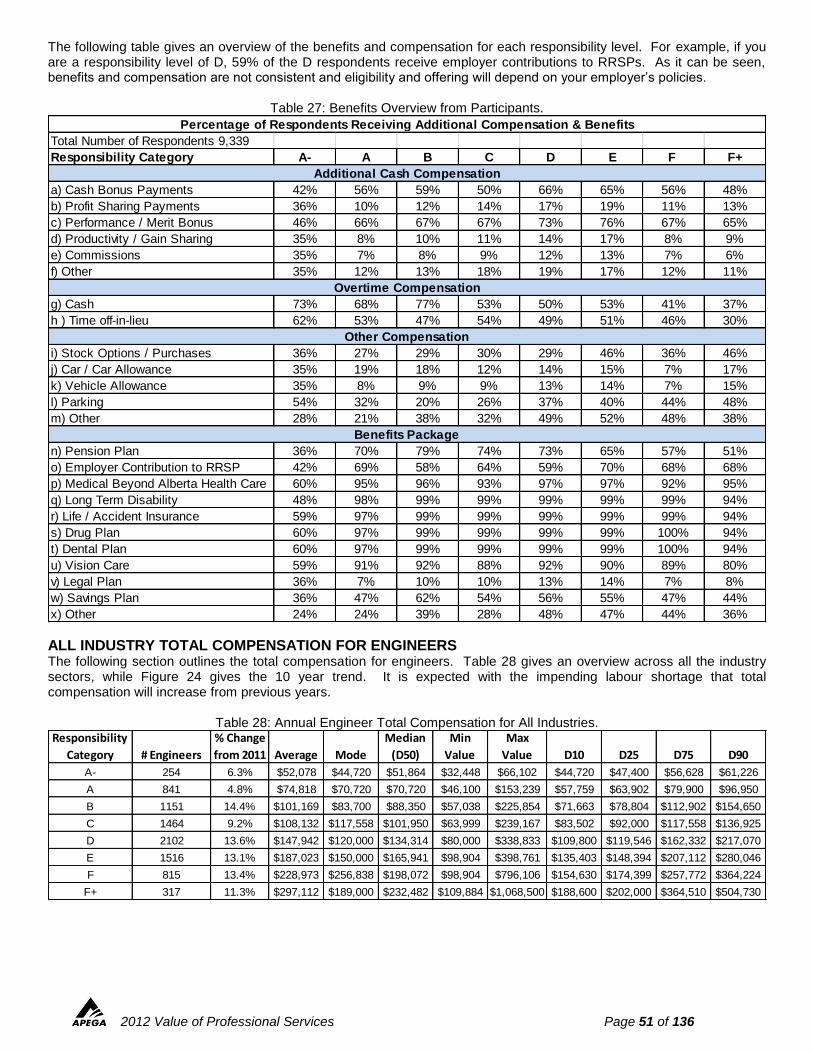
2012 Value of Professional Services Page 51 of 136
The following table gives an overview of the benefits and compensation for each responsibility level. For example, if you are a responsibility level of D, 59% of the D respondents receive employer contributions to RRSPs. As it can be seen, benefits and compensation are not consistent and eligibility and offering will depend on your employer’s policies.
Table 27: Benefits Overview from Participants.
ALL INDUSTRY TOTAL COMPENSATION FOR ENGINEERS The following section outlines the total compensation for engineers. Table 28 gives an overview across all the industry sectors, while Figure 24 gives the 10 year trend. It is expected with the impending labour shortage that total compensation will increase from previous years.
Table 28: Annual Engineer Total Compensation for All Industries.
Total Number of Respondents 9,339
Responsibility Category A- A B C D E F F+
a) Cash Bonus Payments 42% 56% 59% 50% 66% 65% 56% 48%
b) Profit Sharing Payments 36% 10% 12% 14% 17% 19% 11% 13%
c) Performance / Merit Bonus 46% 66% 67% 67% 73% 76% 67% 65%
d) Productivity / Gain Sharing 35% 8% 10% 11% 14% 17% 8% 9%
e) Commissions 35% 7% 8% 9% 12% 13% 7% 6%
f) Other 35% 12% 13% 18% 19% 17% 12% 11%
g) Cash 73% 68% 77% 53% 50% 53% 41% 37%
h ) Time off-in-lieu 62% 53% 47% 54% 49% 51% 46% 30%
i) Stock Options / Purchases 36% 27% 29% 30% 29% 46% 36% 46%
j) Car / Car Allowance 35% 19% 18% 12% 14% 15% 7% 17%
k) Vehicle Allowance 35% 8% 9% 9% 13% 14% 7% 15%
l) Parking 54% 32% 20% 26% 37% 40% 44% 48%
m) Other 28% 21% 38% 32% 49% 52% 48% 38%
n) Pension Plan 36% 70% 79% 74% 73% 65% 57% 51%
o) Employer Contribution to RRSP 42% 69% 58% 64% 59% 70% 68% 68%
p) Medical Beyond Alberta Health Care 60% 95% 96% 93% 97% 97% 92% 95%
q) Long Term Disability 48% 98% 99% 99% 99% 99% 99% 94%
r) Life / Accident Insurance 59% 97% 99% 99% 99% 99% 99% 94%
s) Drug Plan 60% 97% 99% 99% 99% 99% 100% 94%
t) Dental Plan 60% 97% 99% 99% 99% 99% 100% 94%
u) Vision Care 59% 91% 92% 88% 92% 90% 89% 80%
v) Legal Plan 36% 7% 10% 10% 13% 14% 7% 8%
w) Savings Plan 36% 47% 62% 54% 56% 55% 47% 44%
x) Other 24% 24% 39% 28% 48% 47% 44% 36%
Overtime Compensation
Benefits Package
Percentage of Respondents Receiving Additional Compensation & Benefits
Additional Cash Compensation
Other Compensation
Responsibility
Category # Engineers
% Change
from 2011 Average Mode
Median
(D50)
Min
Value
Max
Value D10 D25 D75 D90
A- 254 6.3% $52,078 $44,720 $51,864 $32,448 $66,102 $44,720 $47,400 $56,628 $61,226
A 841 4.8% $74,818 $70,720 $70,720 $46,100 $153,239 $57,759 $63,902 $79,900 $96,950
B 1151 14.4% $101,169 $83,700 $88,350 $57,038 $225,854 $71,663 $78,804 $112,902 $154,650
C 1464 9.2% $108,132 $117,558 $101,950 $63,999 $239,167 $83,502 $92,000 $117,558 $136,925
D 2102 13.6% $147,942 $120,000 $134,314 $80,000 $338,833 $109,800 $119,546 $162,332 $217,070
E 1516 13.1% $187,023 $150,000 $165,941 $98,904 $398,761 $135,403 $148,394 $207,112 $280,046
F 815 13.4% $228,973 $256,838 $198,072 $98,904 $796,106 $154,630 $174,399 $257,772 $364,224
F+ 317 11.3% $297,112 $189,000 $232,482 $109,884 $1,068,500 $188,600 $202,000 $364,510 $504,730
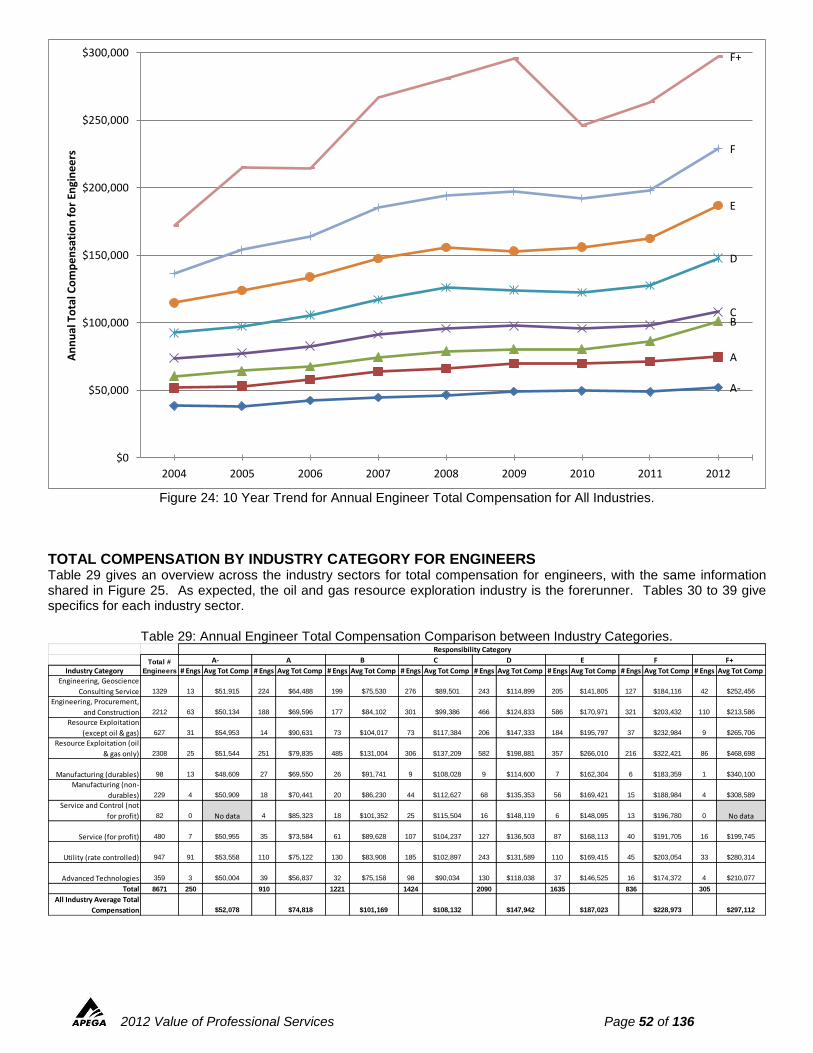
2012 Value of Professional Services Page 52 of 136
Figure 24: 10 Year Trend for Annual Engineer Total Compensation for All Industries.
TOTAL COMPENSATION BY INDUSTRY CATEGORY FOR ENGINEERS Table 29 gives an overview across the industry sectors for total compensation for engineers, with the same information shared in Figure 25. As expected, the oil and gas resource exploration industry is the forerunner. Tables 30 to 39 give specifics for each industry sector.
Table 29: Annual Engineer Total Compensation Comparison between Industry Categories.
A-
A
BC
D
E
F
F+
$0
$50,000
$100,000
$150,000
$200,000
$250,000
$300,000
2004 2005 2006 2007 2008 2009 2010 2011 2012
An
nu
al T
ota
l Co
mp
en
sati
on
fo
r En
gin
ee
rs
Industry Category # Engs Avg Tot Comp # Engs Avg Tot Comp # Engs Avg Tot Comp # Engs Avg Tot Comp # Engs Avg Tot Comp # Engs Avg Tot Comp # Engs Avg Tot Comp # Engs Avg Tot Comp
Engineering, Geoscience
Consulting Service 1329 13 $51,915 224 $64,488 199 $75,530 276 $89,501 243 $114,899 205 $141,805 127 $184,116 42 $252,456
Engineering, Procurement,
and Construction 2212 63 $50,134 188 $69,596 177 $84,102 301 $99,386 466 $124,833 586 $170,971 321 $203,432 110 $213,586
Resource Exploitation
(except oil & gas) 627 31 $54,953 14 $90,631 73 $104,017 73 $117,384 206 $147,333 184 $195,797 37 $232,984 9 $265,706
Resource Exploitation (oil
& gas only) 2308 25 $51,544 251 $79,835 485 $131,004 306 $137,209 582 $198,881 357 $266,010 216 $322,421 86 $468,698
Manufacturing (durables) 98 13 $48,609 27 $69,550 26 $91,741 9 $108,028 9 $114,600 7 $162,304 6 $183,359 1 $340,100
Manufacturing (non-
durables) 229 4 $50,909 18 $70,441 20 $86,230 44 $112,627 68 $135,353 56 $169,421 15 $188,984 4 $308,589
Service and Control (not
for profit) 82 0 No data 4 $85,323 18 $101,352 25 $115,504 16 $148,119 6 $148,095 13 $196,780 0 No data
Service (for profit) 480 7 $50,955 35 $73,584 61 $89,628 107 $104,237 127 $136,503 87 $168,113 40 $191,705 16 $199,745
Utility (rate controlled) 947 91 $53,558 110 $75,122 130 $83,908 185 $102,897 243 $131,589 110 $169,415 45 $203,054 33 $280,314
Advanced Technologies 359 3 $50,004 39 $56,837 32 $75,158 98 $90,034 130 $118,038 37 $146,525 16 $174,372 4 $210,077
Total 8671 250 910 1221 1424 2090 1635 836 305
All Industry Average Total
Compensation $52,078 $74,818 $101,169 $108,132 $147,942 $187,023 $228,973 $297,112
Responsibility Category
Total #
Engineers
A- A B C D E F F+
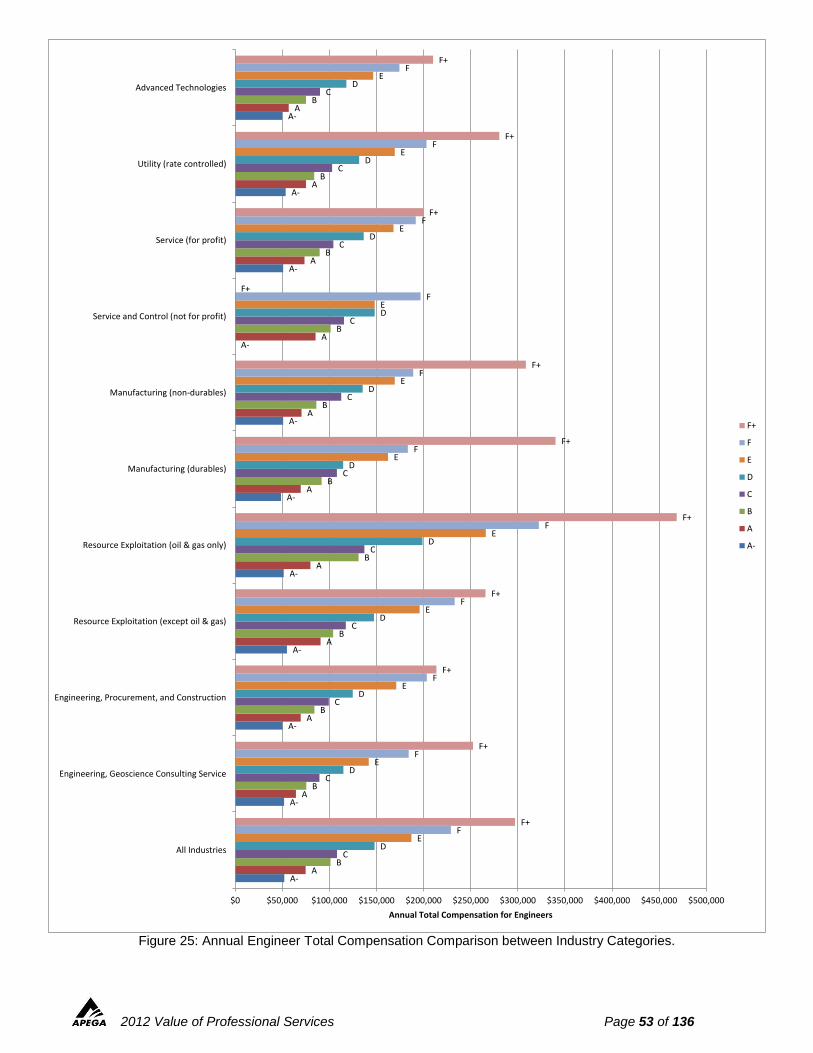
2012 Value of Professional Services Page 53 of 136
Figure 25: Annual Engineer Total Compensation Comparison between Industry Categories.
A-
A-
A-
A-
A-
A-
A-
A-
A-
A-
A-
A
A
A
A
A
A
A
A
A
A
A
B
B
B
B
B
B
B
B
B
B
B
C
C
C
C
C
C
C
C
C
C
C
D
D
D
D
D
D
D
D
D
D
D
E
E
E
E
E
E
E
E
E
E
E
F
F
F
F
F
F
F
F
F
F
F
F+
F+
F+
F+
F+
F+
F+
F+
F+
F+
F+
$0 $50,000 $100,000 $150,000 $200,000 $250,000 $300,000 $350,000 $400,000 $450,000 $500,000
All Industries
Engineering, Geoscience Consulting Service
Engineering, Procurement, and Construction
Resource Exploitation (except oil & gas)
Resource Exploitation (oil & gas only)
Manufacturing (durables)
Manufacturing (non-durables)
Service and Control (not for profit)
Service (for profit)
Utility (rate controlled)
Advanced Technologies
Annual Total Compensation for Engineers
F+
F
E
D
C
B
A
A-
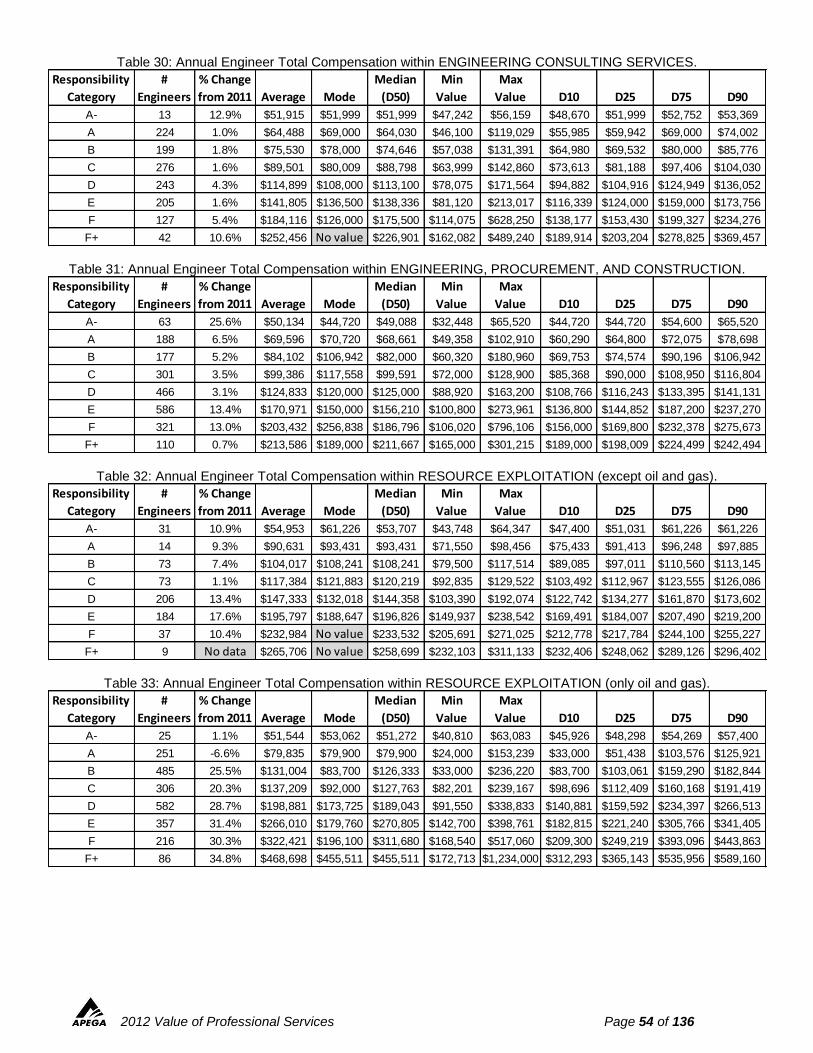
2012 Value of Professional Services Page 54 of 136
Table 30: Annual Engineer Total Compensation within ENGINEERING CONSULTING SERVICES.
Table 31: Annual Engineer Total Compensation within ENGINEERING, PROCUREMENT, AND CONSTRUCTION.
Table 32: Annual Engineer Total Compensation within RESOURCE EXPLOITATION (except oil and gas).
Table 33: Annual Engineer Total Compensation within RESOURCE EXPLOITATION (only oil and gas).
Responsibility
Category
#
Engineers
% Change
from 2011 Average Mode
Median
(D50)
Min
Value
Max
Value D10 D25 D75 D90
A- 13 12.9% $51,915 $51,999 $51,999 $47,242 $56,159 $48,670 $51,999 $52,752 $53,369
A 224 1.0% $64,488 $69,000 $64,030 $46,100 $119,029 $55,985 $59,942 $69,000 $74,002
B 199 1.8% $75,530 $78,000 $74,646 $57,038 $131,391 $64,980 $69,532 $80,000 $85,776
C 276 1.6% $89,501 $80,009 $88,798 $63,999 $142,860 $73,613 $81,188 $97,406 $104,030
D 243 4.3% $114,899 $108,000 $113,100 $78,075 $171,564 $94,882 $104,916 $124,949 $136,052
E 205 1.6% $141,805 $136,500 $138,336 $81,120 $213,017 $116,339 $124,000 $159,000 $173,756
F 127 5.4% $184,116 $126,000 $175,500 $114,075 $628,250 $138,177 $153,430 $199,327 $234,276
F+ 42 10.6% $252,456 No value $226,901 $162,082 $489,240 $189,914 $203,204 $278,825 $369,457
Responsibility
Category
#
Engineers
% Change
from 2011 Average Mode
Median
(D50)
Min
Value
Max
Value D10 D25 D75 D90
A- 63 25.6% $50,134 $44,720 $49,088 $32,448 $65,520 $44,720 $44,720 $54,600 $65,520
A 188 6.5% $69,596 $70,720 $68,661 $49,358 $102,910 $60,290 $64,800 $72,075 $78,698
B 177 5.2% $84,102 $106,942 $82,000 $60,320 $180,960 $69,753 $74,574 $90,196 $106,942
C 301 3.5% $99,386 $117,558 $99,591 $72,000 $128,900 $85,368 $90,000 $108,950 $116,804
D 466 3.1% $124,833 $120,000 $125,000 $88,920 $163,200 $108,766 $116,243 $133,395 $141,131
E 586 13.4% $170,971 $150,000 $156,210 $100,800 $273,961 $136,800 $144,852 $187,200 $237,270
F 321 13.0% $203,432 $256,838 $186,796 $106,020 $796,106 $156,000 $169,800 $232,378 $275,673
F+ 110 0.7% $213,586 $189,000 $211,667 $165,000 $301,215 $189,000 $198,009 $224,499 $242,494
Responsibility
Category
#
Engineers
% Change
from 2011 Average Mode
Median
(D50)
Min
Value
Max
Value D10 D25 D75 D90
A- 31 10.9% $54,953 $61,226 $53,707 $43,748 $64,347 $47,400 $51,031 $61,226 $61,226
A 14 9.3% $90,631 $93,431 $93,431 $71,550 $98,456 $75,433 $91,413 $96,248 $97,885
B 73 7.4% $104,017 $108,241 $108,241 $79,500 $117,514 $89,085 $97,011 $110,560 $113,145
C 73 1.1% $117,384 $121,883 $120,219 $92,835 $129,522 $103,492 $112,967 $123,555 $126,086
D 206 13.4% $147,333 $132,018 $144,358 $103,390 $192,074 $122,742 $134,277 $161,870 $173,602
E 184 17.6% $195,797 $188,647 $196,826 $149,937 $238,542 $169,491 $184,007 $207,490 $219,200
F 37 10.4% $232,984 No value $233,532 $205,691 $271,025 $212,778 $217,784 $244,100 $255,227
F+ 9 No data $265,706 No value $258,699 $232,103 $311,133 $232,406 $248,062 $289,126 $296,402
Responsibility
Category
#
Engineers
% Change
from 2011 Average Mode
Median
(D50)
Min
Value
Max
Value D10 D25 D75 D90
A- 25 1.1% $51,544 $53,062 $51,272 $40,810 $63,083 $45,926 $48,298 $54,269 $57,400
A 251 -6.6% $79,835 $79,900 $79,900 $24,000 $153,239 $33,000 $51,438 $103,576 $125,921
B 485 25.5% $131,004 $83,700 $126,333 $33,000 $236,220 $83,700 $103,061 $159,290 $182,844
C 306 20.3% $137,209 $92,000 $127,763 $82,201 $239,167 $98,696 $112,409 $160,168 $191,419
D 582 28.7% $198,881 $173,725 $189,043 $91,550 $338,833 $140,881 $159,592 $234,397 $266,513
E 357 31.4% $266,010 $179,760 $270,805 $142,700 $398,761 $182,815 $221,240 $305,766 $341,405
F 216 30.3% $322,421 $196,100 $311,680 $168,540 $517,060 $209,300 $249,219 $393,096 $443,863
F+ 86 34.8% $468,698 $455,511 $455,511 $172,713 $1,234,000 $312,293 $365,143 $535,956 $589,160
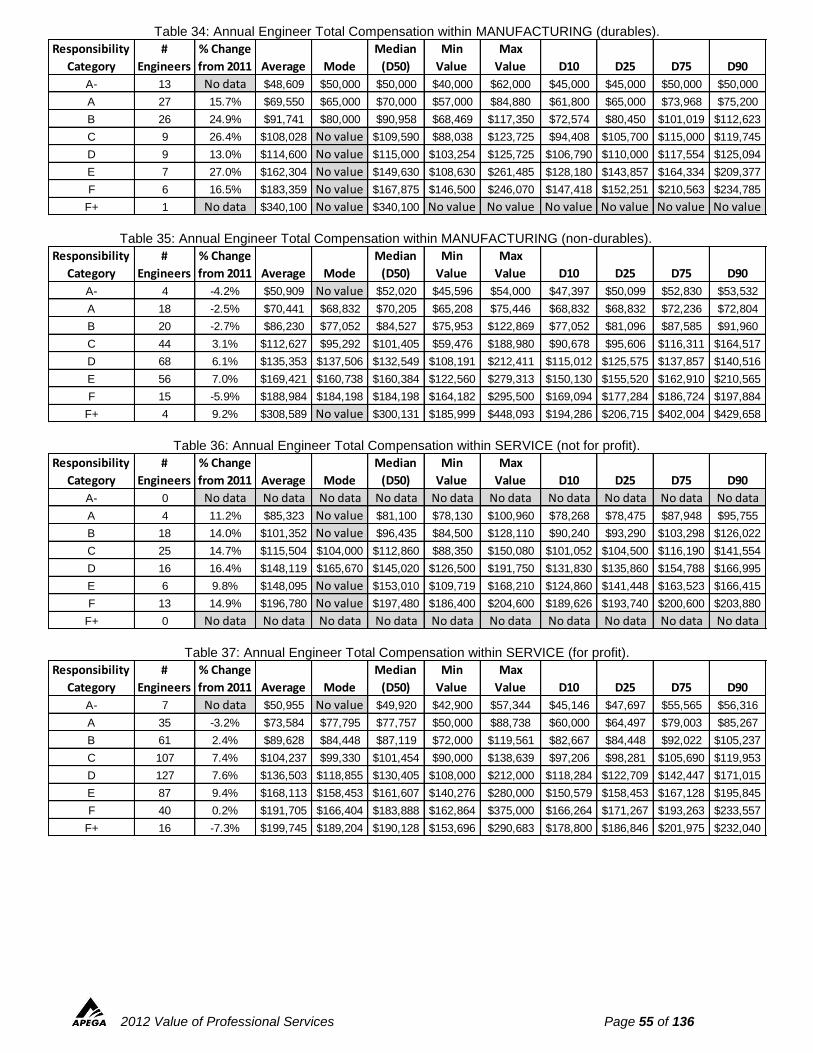
2012 Value of Professional Services Page 55 of 136
Table 34: Annual Engineer Total Compensation within MANUFACTURING (durables).
Table 35: Annual Engineer Total Compensation within MANUFACTURING (non-durables).
Table 36: Annual Engineer Total Compensation within SERVICE (not for profit).
Table 37: Annual Engineer Total Compensation within SERVICE (for profit).
Responsibility
Category
#
Engineers
% Change
from 2011 Average Mode
Median
(D50)
Min
Value
Max
Value D10 D25 D75 D90
A- 13 No data $48,609 $50,000 $50,000 $40,000 $62,000 $45,000 $45,000 $50,000 $50,000
A 27 15.7% $69,550 $65,000 $70,000 $57,000 $84,880 $61,800 $65,000 $73,968 $75,200
B 26 24.9% $91,741 $80,000 $90,958 $68,469 $117,350 $72,574 $80,450 $101,019 $112,623
C 9 26.4% $108,028 No value $109,590 $88,038 $123,725 $94,408 $105,700 $115,000 $119,745
D 9 13.0% $114,600 No value $115,000 $103,254 $125,725 $106,790 $110,000 $117,554 $125,094
E 7 27.0% $162,304 No value $149,630 $108,630 $261,485 $128,180 $143,857 $164,334 $209,377
F 6 16.5% $183,359 No value $167,875 $146,500 $246,070 $147,418 $152,251 $210,563 $234,785
F+ 1 No data $340,100 No value $340,100 No value No value No value No value No value No value
Responsibility
Category
#
Engineers
% Change
from 2011 Average Mode
Median
(D50)
Min
Value
Max
Value D10 D25 D75 D90
A- 4 -4.2% $50,909 No value $52,020 $45,596 $54,000 $47,397 $50,099 $52,830 $53,532
A 18 -2.5% $70,441 $68,832 $70,205 $65,208 $75,446 $68,832 $68,832 $72,236 $72,804
B 20 -2.7% $86,230 $77,052 $84,527 $75,953 $122,869 $77,052 $81,096 $87,585 $91,960
C 44 3.1% $112,627 $95,292 $101,405 $59,476 $188,980 $90,678 $95,606 $116,311 $164,517
D 68 6.1% $135,353 $137,506 $132,549 $108,191 $212,411 $115,012 $125,575 $137,857 $140,516
E 56 7.0% $169,421 $160,738 $160,384 $122,560 $279,313 $150,130 $155,520 $162,910 $210,565
F 15 -5.9% $188,984 $184,198 $184,198 $164,182 $295,500 $169,094 $177,284 $186,724 $197,884
F+ 4 9.2% $308,589 No value $300,131 $185,999 $448,093 $194,286 $206,715 $402,004 $429,658
Responsibility
Category
#
Engineers
% Change
from 2011 Average Mode
Median
(D50)
Min
Value
Max
Value D10 D25 D75 D90
A- 0 No data No data No data No data No data No data No data No data No data No data
A 4 11.2% $85,323 No value $81,100 $78,130 $100,960 $78,268 $78,475 $87,948 $95,755
B 18 14.0% $101,352 No value $96,435 $84,500 $128,110 $90,240 $93,290 $103,298 $126,022
C 25 14.7% $115,504 $104,000 $112,860 $88,350 $150,080 $101,052 $104,500 $116,190 $141,554
D 16 16.4% $148,119 $165,670 $145,020 $126,500 $191,750 $131,830 $135,860 $154,788 $166,995
E 6 9.8% $148,095 No value $153,010 $109,719 $168,210 $124,860 $141,448 $163,523 $166,415
F 13 14.9% $196,780 No value $197,480 $186,400 $204,600 $189,626 $193,740 $200,600 $203,880
F+ 0 No data No data No data No data No data No data No data No data No data No data
Responsibility
Category
#
Engineers
% Change
from 2011 Average Mode
Median
(D50)
Min
Value
Max
Value D10 D25 D75 D90
A- 7 No data $50,955 No value $49,920 $42,900 $57,344 $45,146 $47,697 $55,565 $56,316
A 35 -3.2% $73,584 $77,795 $77,757 $50,000 $88,738 $60,000 $64,497 $79,003 $85,267
B 61 2.4% $89,628 $84,448 $87,119 $72,000 $119,561 $82,667 $84,448 $92,022 $105,237
C 107 7.4% $104,237 $99,330 $101,454 $90,000 $138,639 $97,206 $98,281 $105,690 $119,953
D 127 7.6% $136,503 $118,855 $130,405 $108,000 $212,000 $118,284 $122,709 $142,447 $171,015
E 87 9.4% $168,113 $158,453 $161,607 $140,276 $280,000 $150,579 $158,453 $167,128 $195,845
F 40 0.2% $191,705 $166,404 $183,888 $162,864 $375,000 $166,264 $171,267 $193,263 $233,557
F+ 16 -7.3% $199,745 $189,204 $190,128 $153,696 $290,683 $178,800 $186,846 $201,975 $232,040
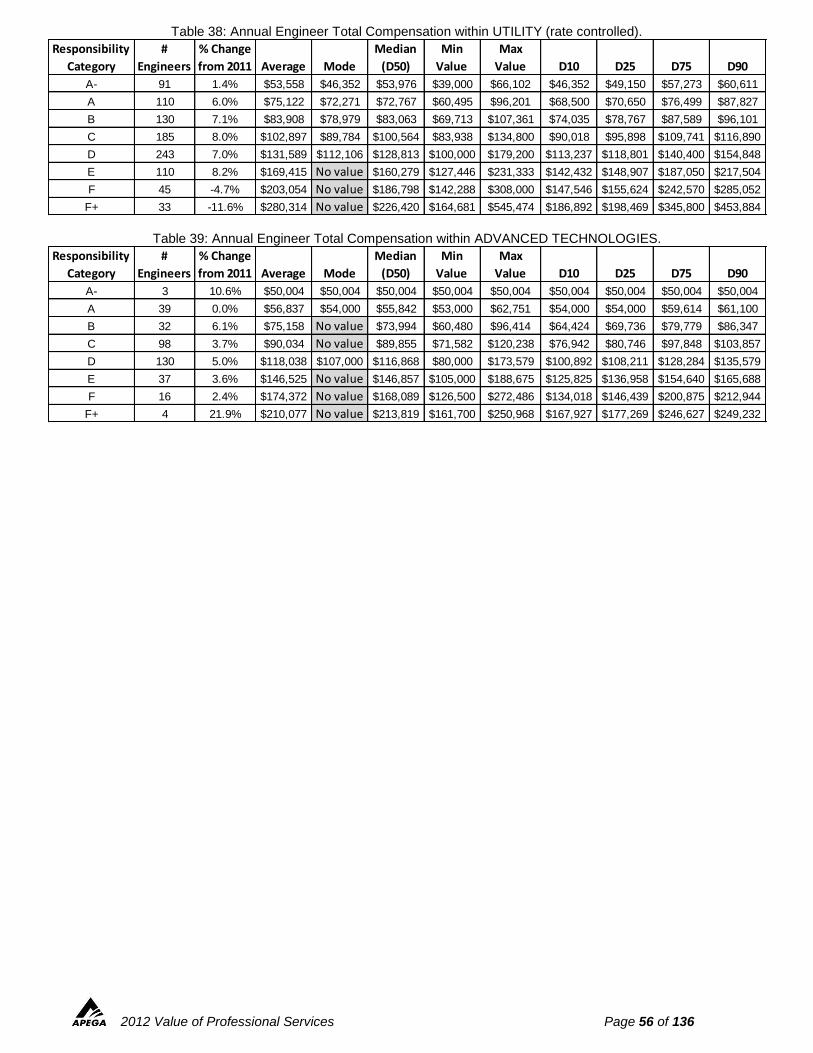
2012 Value of Professional Services Page 56 of 136
Table 38: Annual Engineer Total Compensation within UTILITY (rate controlled).
Table 39: Annual Engineer Total Compensation within ADVANCED TECHNOLOGIES.
Responsibility
Category
#
Engineers
% Change
from 2011 Average Mode
Median
(D50)
Min
Value
Max
Value D10 D25 D75 D90
A- 91 1.4% $53,558 $46,352 $53,976 $39,000 $66,102 $46,352 $49,150 $57,273 $60,611
A 110 6.0% $75,122 $72,271 $72,767 $60,495 $96,201 $68,500 $70,650 $76,499 $87,827
B 130 7.1% $83,908 $78,979 $83,063 $69,713 $107,361 $74,035 $78,767 $87,589 $96,101
C 185 8.0% $102,897 $89,784 $100,564 $83,938 $134,800 $90,018 $95,898 $109,741 $116,890
D 243 7.0% $131,589 $112,106 $128,813 $100,000 $179,200 $113,237 $118,801 $140,400 $154,848
E 110 8.2% $169,415 No value $160,279 $127,446 $231,333 $142,432 $148,907 $187,050 $217,504
F 45 -4.7% $203,054 No value $186,798 $142,288 $308,000 $147,546 $155,624 $242,570 $285,052
F+ 33 -11.6% $280,314 No value $226,420 $164,681 $545,474 $186,892 $198,469 $345,800 $453,884
Responsibility
Category
#
Engineers
% Change
from 2011 Average Mode
Median
(D50)
Min
Value
Max
Value D10 D25 D75 D90
A- 3 10.6% $50,004 $50,004 $50,004 $50,004 $50,004 $50,004 $50,004 $50,004 $50,004
A 39 0.0% $56,837 $54,000 $55,842 $53,000 $62,751 $54,000 $54,000 $59,614 $61,100
B 32 6.1% $75,158 No value $73,994 $60,480 $96,414 $64,424 $69,736 $79,779 $86,347
C 98 3.7% $90,034 No value $89,855 $71,582 $120,238 $76,942 $80,746 $97,848 $103,857
D 130 5.0% $118,038 $107,000 $116,868 $80,000 $173,579 $100,892 $108,211 $128,284 $135,579
E 37 3.6% $146,525 No value $146,857 $105,000 $188,675 $125,825 $136,958 $154,640 $165,688
F 16 2.4% $174,372 No value $168,089 $126,500 $272,486 $134,018 $146,439 $200,875 $212,944
F+ 4 21.9% $210,077 No value $213,819 $161,700 $250,968 $167,927 $177,269 $246,627 $249,232
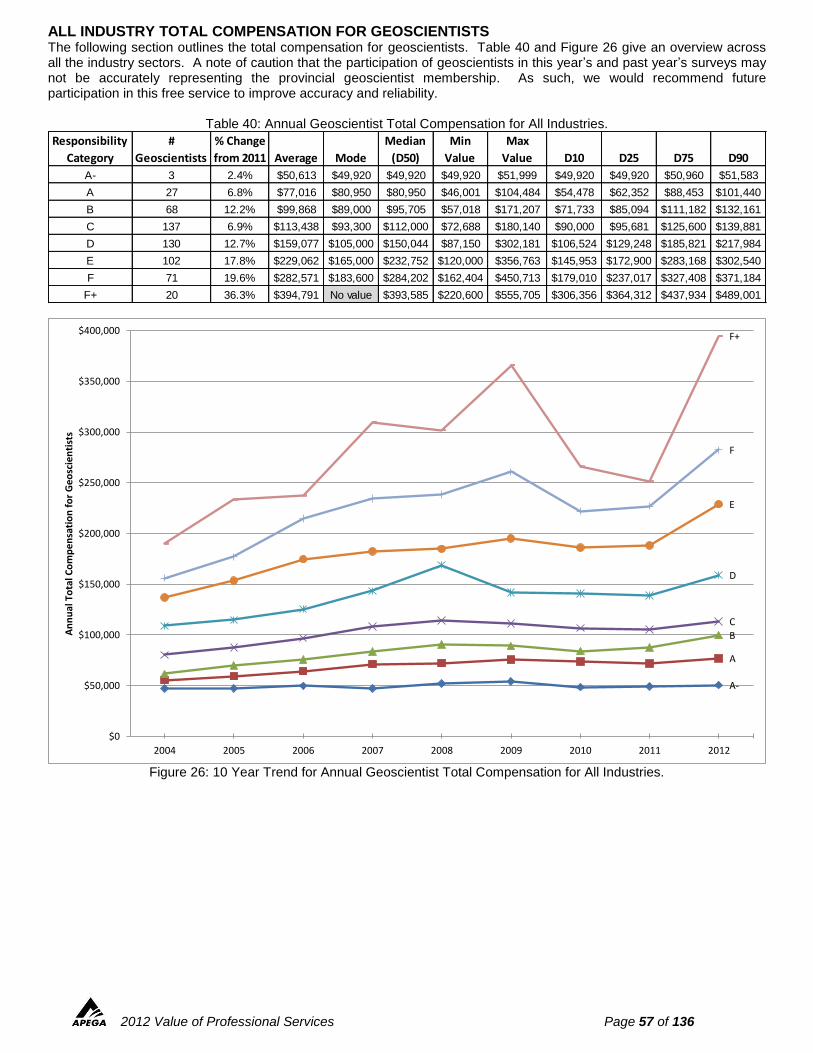
2012 Value of Professional Services Page 57 of 136
ALL INDUSTRY TOTAL COMPENSATION FOR GEOSCIENTISTS The following section outlines the total compensation for geoscientists. Table 40 and Figure 26 give an overview across all the industry sectors. A note of caution that the participation of geoscientists in this year’s and past year’s surveys may not be accurately representing the provincial geoscientist membership. As such, we would recommend future participation in this free service to improve accuracy and reliability.
Table 40: Annual Geoscientist Total Compensation for All Industries.
Figure 26: 10 Year Trend for Annual Geoscientist Total Compensation for All Industries.
Responsibility
Category
#
Geoscientists
% Change
from 2011 Average Mode
Median
(D50)
Min
Value
Max
Value D10 D25 D75 D90
A- 3 2.4% $50,613 $49,920 $49,920 $49,920 $51,999 $49,920 $49,920 $50,960 $51,583
A 27 6.8% $77,016 $80,950 $80,950 $46,001 $104,484 $54,478 $62,352 $88,453 $101,440
B 68 12.2% $99,868 $89,000 $95,705 $57,018 $171,207 $71,733 $85,094 $111,182 $132,161
C 137 6.9% $113,438 $93,300 $112,000 $72,688 $180,140 $90,000 $95,681 $125,600 $139,881
D 130 12.7% $159,077 $105,000 $150,044 $87,150 $302,181 $106,524 $129,248 $185,821 $217,984
E 102 17.8% $229,062 $165,000 $232,752 $120,000 $356,763 $145,953 $172,900 $283,168 $302,540
F 71 19.6% $282,571 $183,600 $284,202 $162,404 $450,713 $179,010 $237,017 $327,408 $371,184
F+ 20 36.3% $394,791 No value $393,585 $220,600 $555,705 $306,356 $364,312 $437,934 $489,001
A-
A
B
C
D
E
F
F+
$0
$50,000
$100,000
$150,000
$200,000
$250,000
$300,000
$350,000
$400,000
2004 2005 2006 2007 2008 2009 2010 2011 2012
An
nu
al T
ota
l Co
mp
en
sati
on
fo
r G
eo
scie
nti
sts
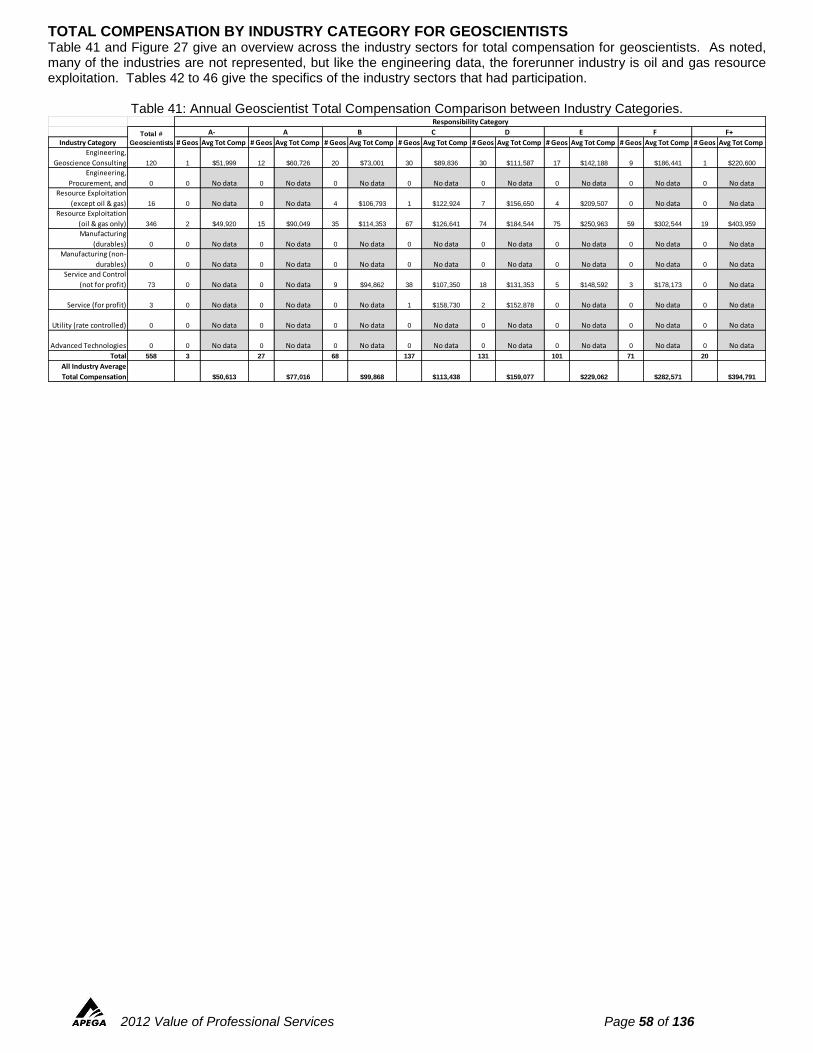
2012 Value of Professional Services Page 58 of 136
TOTAL COMPENSATION BY INDUSTRY CATEGORY FOR GEOSCIENTISTS Table 41 and Figure 27 give an overview across the industry sectors for total compensation for geoscientists. As noted, many of the industries are not represented, but like the engineering data, the forerunner industry is oil and gas resource exploitation. Tables 42 to 46 give the specifics of the industry sectors that had participation.
Table 41: Annual Geoscientist Total Compensation Comparison between Industry Categories.
Industry Category # Geos Avg Tot Comp # Geos Avg Tot Comp # Geos Avg Tot Comp # Geos Avg Tot Comp # Geos Avg Tot Comp # Geos Avg Tot Comp # Geos Avg Tot Comp # Geos Avg Tot Comp
Engineering,
Geoscience Consulting 120 1 $51,999 12 $60,726 20 $73,001 30 $89,836 30 $111,587 17 $142,188 9 $186,441 1 $220,600
Engineering,
Procurement, and 0 0 No data 0 No data 0 No data 0 No data 0 No data 0 No data 0 No data 0 No data
Resource Exploitation
(except oil & gas) 16 0 No data 0 No data 4 $106,793 1 $122,924 7 $156,650 4 $209,507 0 No data 0 No data
Resource Exploitation
(oil & gas only) 346 2 $49,920 15 $90,049 35 $114,353 67 $126,641 74 $184,544 75 $250,963 59 $302,544 19 $403,959
Manufacturing
(durables) 0 0 No data 0 No data 0 No data 0 No data 0 No data 0 No data 0 No data 0 No data
Manufacturing (non-
durables) 0 0 No data 0 No data 0 No data 0 No data 0 No data 0 No data 0 No data 0 No data
Service and Control
(not for profit) 73 0 No data 0 No data 9 $94,862 38 $107,350 18 $131,353 5 $148,592 3 $178,173 0 No data
Service (for profit) 3 0 No data 0 No data 0 No data 1 $158,730 2 $152,878 0 No data 0 No data 0 No data
Utility (rate controlled) 0 0 No data 0 No data 0 No data 0 No data 0 No data 0 No data 0 No data 0 No data
Advanced Technologies 0 0 No data 0 No data 0 No data 0 No data 0 No data 0 No data 0 No data 0 No data
Total 558 3 27 68 137 131 101 71 20
All Industry Average
Total Compensation $50,613 $77,016 $99,868 $113,438 $159,077 $229,062 $282,571 $394,791
Responsibility Category
Total #
Geoscientists
A- A B C D E F F+
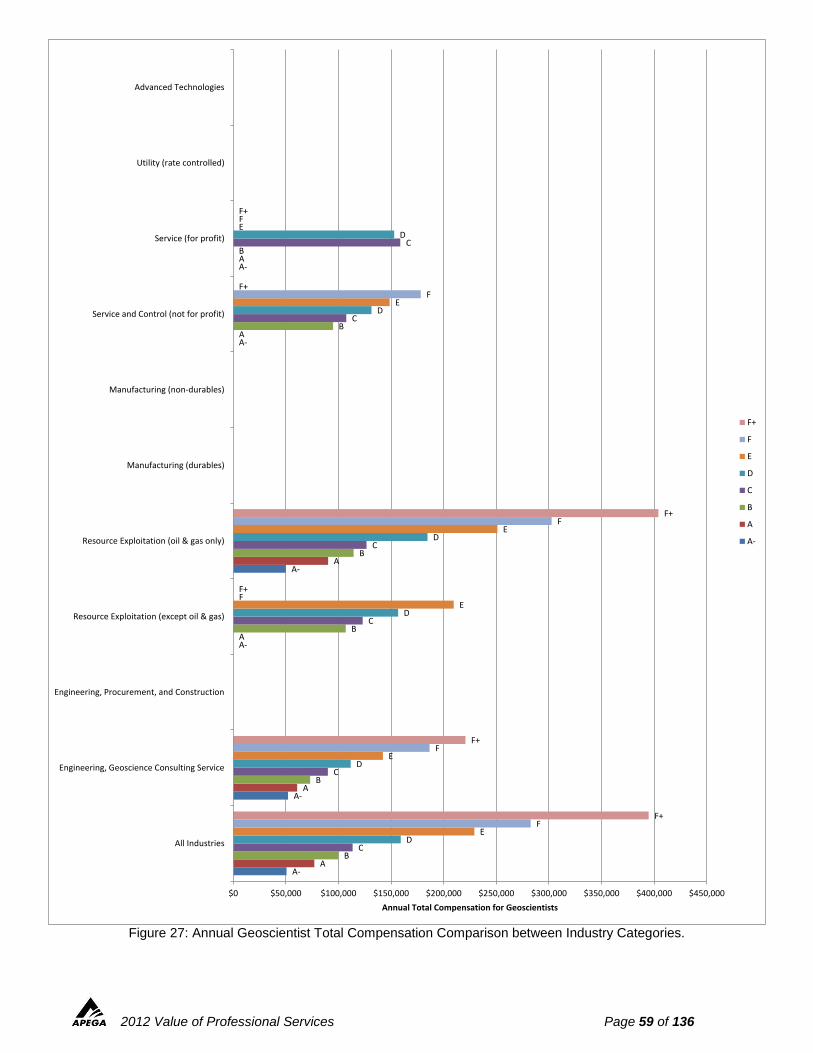
2012 Value of Professional Services Page 59 of 136
Figure 27: Annual Geoscientist Total Compensation Comparison between Industry Categories.
A-
A-
A-
A-
A-
A-
A
A
A
A
A
A
B
B
B
B
B
B
C
C
C
C
C
C
D
D
D
D
D
D
E
E
E
E
E
E
F
F
F
F
F
F
F+
F+
F+
F+
F+
F+
$0 $50,000 $100,000 $150,000 $200,000 $250,000 $300,000 $350,000 $400,000 $450,000
All Industries
Engineering, Geoscience Consulting Service
Engineering, Procurement, and Construction
Resource Exploitation (except oil & gas)
Resource Exploitation (oil & gas only)
Manufacturing (durables)
Manufacturing (non-durables)
Service and Control (not for profit)
Service (for profit)
Utility (rate controlled)
Advanced Technologies
Annual Total Compensation for Geoscientists
F+
F
E
D
C
B
A
A-
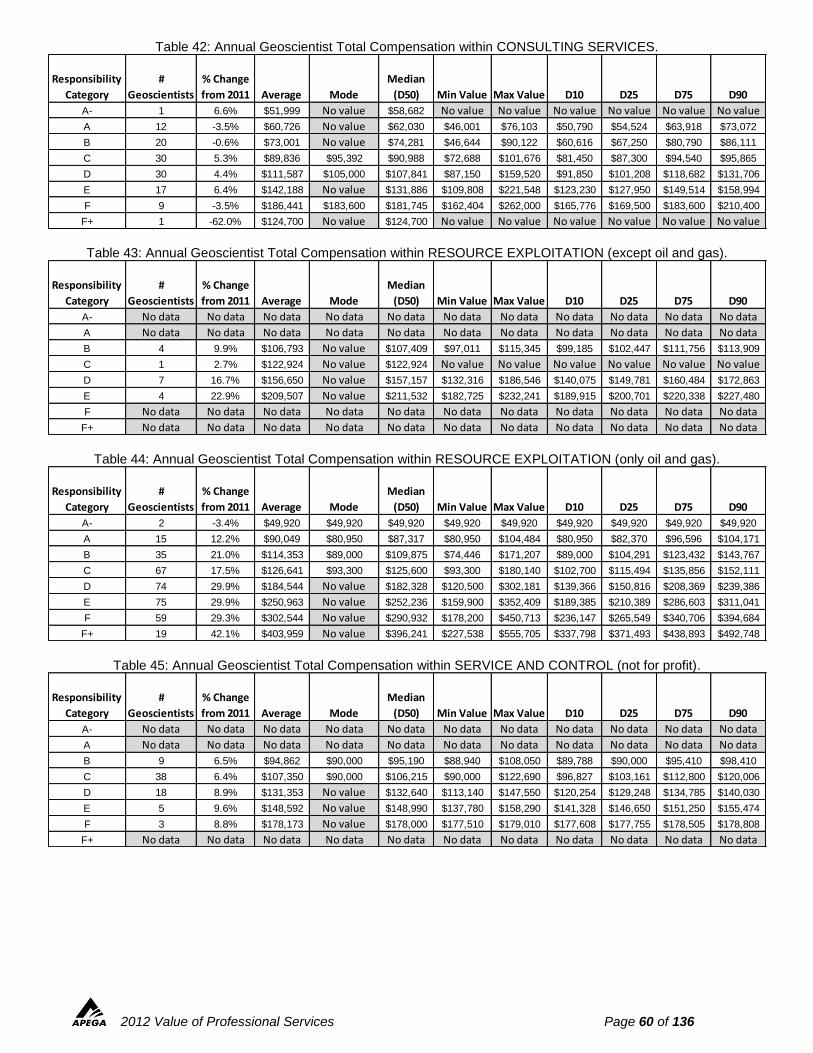
2012 Value of Professional Services Page 60 of 136
Table 42: Annual Geoscientist Total Compensation within CONSULTING SERVICES.
Table 43: Annual Geoscientist Total Compensation within RESOURCE EXPLOITATION (except oil and gas).
Table 44: Annual Geoscientist Total Compensation within RESOURCE EXPLOITATION (only oil and gas).
Table 45: Annual Geoscientist Total Compensation within SERVICE AND CONTROL (not for profit).
Responsibility
Category
#
Geoscientists
% Change
from 2011 Average Mode
Median
(D50) Min Value Max Value D10 D25 D75 D90
A- 1 6.6% $51,999 No value $58,682 No value No value No value No value No value No value
A 12 -3.5% $60,726 No value $62,030 $46,001 $76,103 $50,790 $54,524 $63,918 $73,072
B 20 -0.6% $73,001 No value $74,281 $46,644 $90,122 $60,616 $67,250 $80,790 $86,111
C 30 5.3% $89,836 $95,392 $90,988 $72,688 $101,676 $81,450 $87,300 $94,540 $95,865
D 30 4.4% $111,587 $105,000 $107,841 $87,150 $159,520 $91,850 $101,208 $118,682 $131,706
E 17 6.4% $142,188 No value $131,886 $109,808 $221,548 $123,230 $127,950 $149,514 $158,994
F 9 -3.5% $186,441 $183,600 $181,745 $162,404 $262,000 $165,776 $169,500 $183,600 $210,400
F+ 1 -62.0% $124,700 No value $124,700 No value No value No value No value No value No value
Responsibility
Category
#
Geoscientists
% Change
from 2011 Average Mode
Median
(D50) Min Value Max Value D10 D25 D75 D90
A- No data No data No data No data No data No data No data No data No data No data No data
A No data No data No data No data No data No data No data No data No data No data No data
B 4 9.9% $106,793 No value $107,409 $97,011 $115,345 $99,185 $102,447 $111,756 $113,909
C 1 2.7% $122,924 No value $122,924 No value No value No value No value No value No value
D 7 16.7% $156,650 No value $157,157 $132,316 $186,546 $140,075 $149,781 $160,484 $172,863
E 4 22.9% $209,507 No value $211,532 $182,725 $232,241 $189,915 $200,701 $220,338 $227,480
F No data No data No data No data No data No data No data No data No data No data No data
F+ No data No data No data No data No data No data No data No data No data No data No data
Responsibility
Category
#
Geoscientists
% Change
from 2011 Average Mode
Median
(D50) Min Value Max Value D10 D25 D75 D90
A- 2 -3.4% $49,920 $49,920 $49,920 $49,920 $49,920 $49,920 $49,920 $49,920 $49,920
A 15 12.2% $90,049 $80,950 $87,317 $80,950 $104,484 $80,950 $82,370 $96,596 $104,171
B 35 21.0% $114,353 $89,000 $109,875 $74,446 $171,207 $89,000 $104,291 $123,432 $143,767
C 67 17.5% $126,641 $93,300 $125,600 $93,300 $180,140 $102,700 $115,494 $135,856 $152,111
D 74 29.9% $184,544 No value $182,328 $120,500 $302,181 $139,366 $150,816 $208,369 $239,386
E 75 29.9% $250,963 No value $252,236 $159,900 $352,409 $189,385 $210,389 $286,603 $311,041
F 59 29.3% $302,544 No value $290,932 $178,200 $450,713 $236,147 $265,549 $340,706 $394,684
F+ 19 42.1% $403,959 No value $396,241 $227,538 $555,705 $337,798 $371,493 $438,893 $492,748
Responsibility
Category
#
Geoscientists
% Change
from 2011 Average Mode
Median
(D50) Min Value Max Value D10 D25 D75 D90
A- No data No data No data No data No data No data No data No data No data No data No data
A No data No data No data No data No data No data No data No data No data No data No data
B 9 6.5% $94,862 $90,000 $95,190 $88,940 $108,050 $89,788 $90,000 $95,410 $98,410
C 38 6.4% $107,350 $90,000 $106,215 $90,000 $122,690 $96,827 $103,161 $112,800 $120,006
D 18 8.9% $131,353 No value $132,640 $113,140 $147,550 $120,254 $129,248 $134,785 $140,030
E 5 9.6% $148,592 No value $148,990 $137,780 $158,290 $141,328 $146,650 $151,250 $155,474
F 3 8.8% $178,173 No value $178,000 $177,510 $179,010 $177,608 $177,755 $178,505 $178,808
F+ No data No data No data No data No data No data No data No data No data No data No data
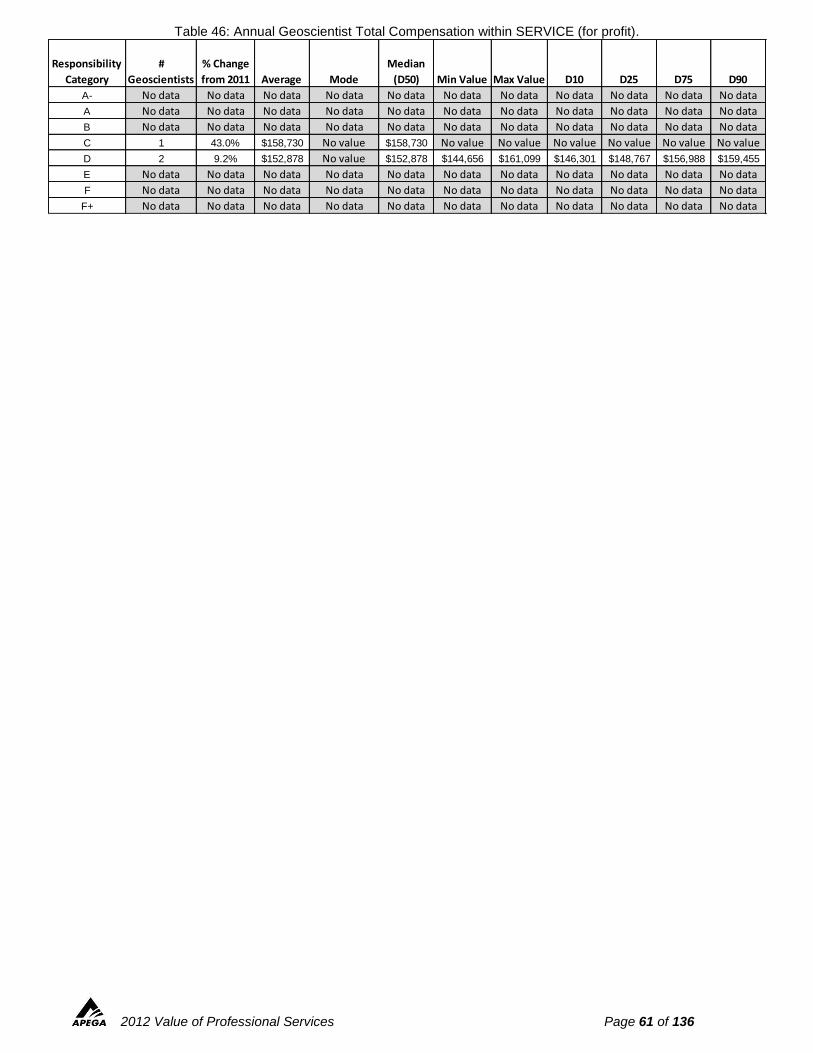
2012 Value of Professional Services Page 61 of 136
Table 46: Annual Geoscientist Total Compensation within SERVICE (for profit).
Responsibility
Category
#
Geoscientists
% Change
from 2011 Average Mode
Median
(D50) Min Value Max Value D10 D25 D75 D90
A- No data No data No data No data No data No data No data No data No data No data No data
A No data No data No data No data No data No data No data No data No data No data No data
B No data No data No data No data No data No data No data No data No data No data No data
C 1 43.0% $158,730 No value $158,730 No value No value No value No value No value No value
D 2 9.2% $152,878 No value $152,878 $144,656 $161,099 $146,301 $148,767 $156,988 $159,455
E No data No data No data No data No data No data No data No data No data No data No data
F No data No data No data No data No data No data No data No data No data No data No data
F+ No data No data No data No data No data No data No data No data No data No data No data
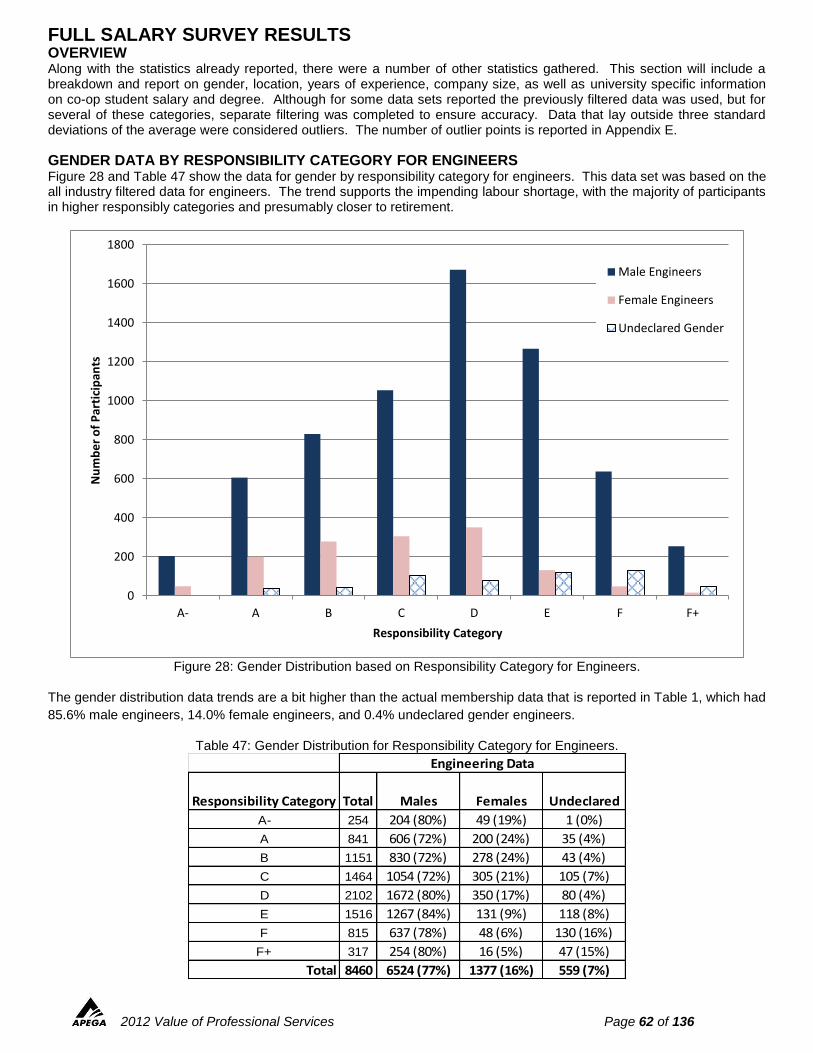
2012 Value of Professional Services Page 62 of 136
FULL SALARY SURVEY RESULTS OVERVIEW Along with the statistics already reported, there were a number of other statistics gathered. This section will include a breakdown and report on gender, location, years of experience, company size, as well as university specific information on co-op student salary and degree. Although for some data sets reported the previously filtered data was used, but for several of these categories, separate filtering was completed to ensure accuracy. Data that lay outside three standard deviations of the average were considered outliers. The number of outlier points is reported in Appendix E. GENDER DATA BY RESPONSIBILITY CATEGORY FOR ENGINEERS Figure 28 and Table 47 show the data for gender by responsibility category for engineers. This data set was based on the all industry filtered data for engineers. The trend supports the impending labour shortage, with the majority of participants in higher responsibly categories and presumably closer to retirement.
Figure 28: Gender Distribution based on Responsibility Category for Engineers.
The gender distribution data trends are a bit higher than the actual membership data that is reported in Table 1, which had
85.6% male engineers, 14.0% female engineers, and 0.4% undeclared gender engineers.
Table 47: Gender Distribution for Responsibility Category for Engineers.
0
200
400
600
800
1000
1200
1400
1600
1800
A- A B C D E F F+
Nu
mb
er
of
Par
tici
pan
ts
Responsibility Category
Male Engineers
Female Engineers
Undeclared Gender
Responsibility Category Total Males Females Undeclared
A- 254 204 (80%) 49 (19%) 1 (0%)
A 841 606 (72%) 200 (24%) 35 (4%)
B 1151 830 (72%) 278 (24%) 43 (4%)
C 1464 1054 (72%) 305 (21%) 105 (7%)
D 2102 1672 (80%) 350 (17%) 80 (4%)
E 1516 1267 (84%) 131 (9%) 118 (8%)
F 815 637 (78%) 48 (6%) 130 (16%)
F+ 317 254 (80%) 16 (5%) 47 (15%)
Total 8460 6524 (77%) 1377 (16%) 559 (7%)
Engineering Data
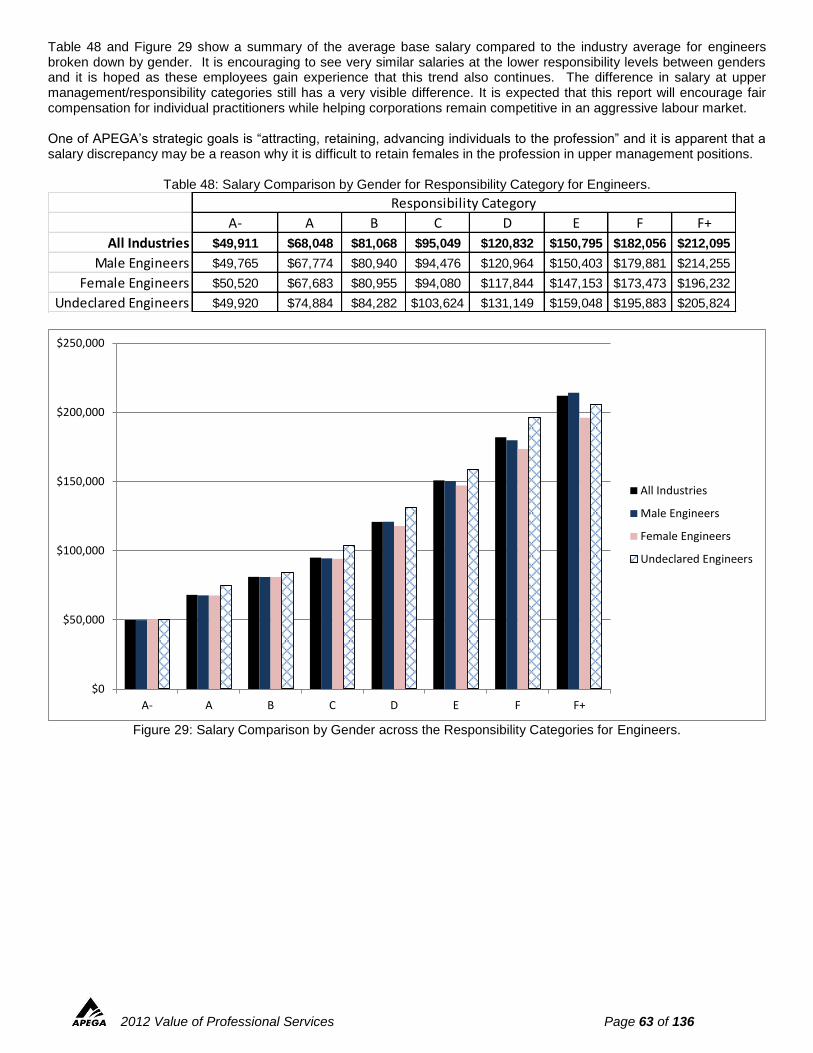
2012 Value of Professional Services Page 63 of 136
Table 48 and Figure 29 show a summary of the average base salary compared to the industry average for engineers broken down by gender. It is encouraging to see very similar salaries at the lower responsibility levels between genders and it is hoped as these employees gain experience that this trend also continues. The difference in salary at upper management/responsibility categories still has a very visible difference. It is expected that this report will encourage fair compensation for individual practitioners while helping corporations remain competitive in an aggressive labour market. One of APEGA’s strategic goals is “attracting, retaining, advancing individuals to the profession” and it is apparent that a salary discrepancy may be a reason why it is difficult to retain females in the profession in upper management positions.
Table 48: Salary Comparison by Gender for Responsibility Category for Engineers.
Figure 29: Salary Comparison by Gender across the Responsibility Categories for Engineers.
A- A B C D E F F+
All Industries $49,911 $68,048 $81,068 $95,049 $120,832 $150,795 $182,056 $212,095
Male Engineers $49,765 $67,774 $80,940 $94,476 $120,964 $150,403 $179,881 $214,255
Female Engineers $50,520 $67,683 $80,955 $94,080 $117,844 $147,153 $173,473 $196,232
Undeclared Engineers $49,920 $74,884 $84,282 $103,624 $131,149 $159,048 $195,883 $205,824
Responsibility Category
$0
$50,000
$100,000
$150,000
$200,000
$250,000
A- A B C D E F F+
All Industries
Male Engineers
Female Engineers
Undeclared Engineers
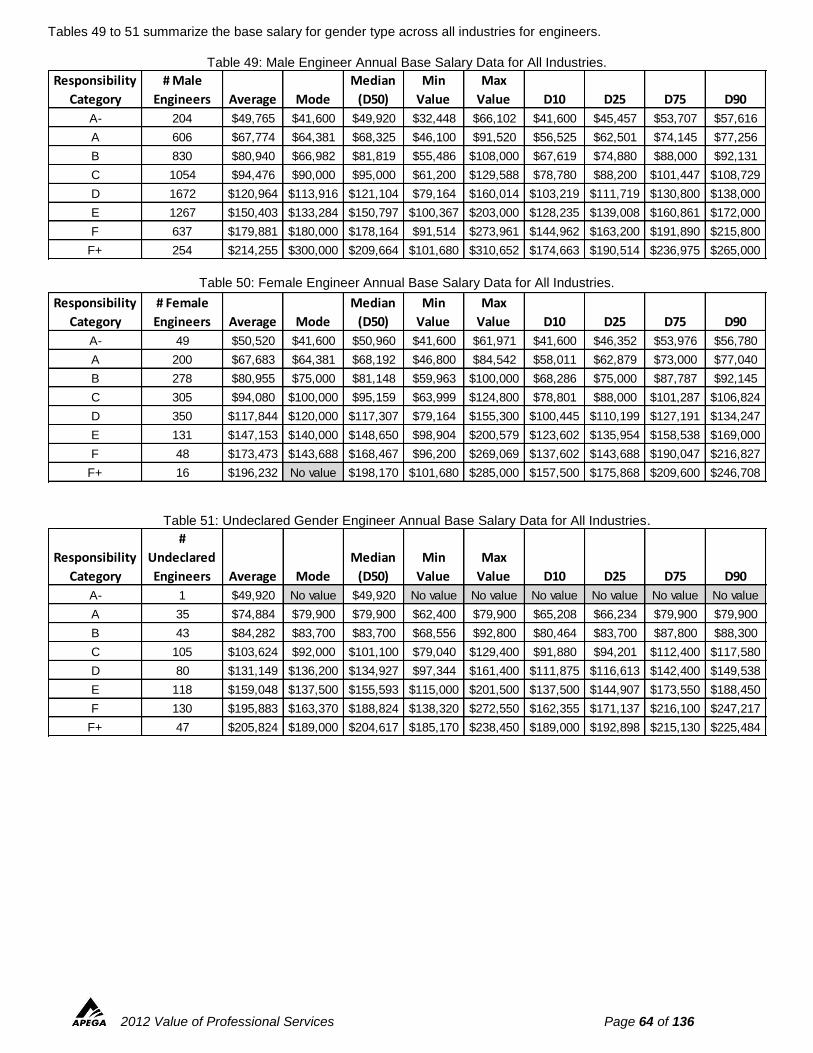
2012 Value of Professional Services Page 64 of 136
Tables 49 to 51 summarize the base salary for gender type across all industries for engineers.
Table 49: Male Engineer Annual Base Salary Data for All Industries.
Table 50: Female Engineer Annual Base Salary Data for All Industries.
Table 51: Undeclared Gender Engineer Annual Base Salary Data for All Industries.
Responsibility
Category
# Male
Engineers Average Mode
Median
(D50)
Min
Value
Max
Value D10 D25 D75 D90
A- 204 $49,765 $41,600 $49,920 $32,448 $66,102 $41,600 $45,457 $53,707 $57,616
A 606 $67,774 $64,381 $68,325 $46,100 $91,520 $56,525 $62,501 $74,145 $77,256
B 830 $80,940 $66,982 $81,819 $55,486 $108,000 $67,619 $74,880 $88,000 $92,131
C 1054 $94,476 $90,000 $95,000 $61,200 $129,588 $78,780 $88,200 $101,447 $108,729
D 1672 $120,964 $113,916 $121,104 $79,164 $160,014 $103,219 $111,719 $130,800 $138,000
E 1267 $150,403 $133,284 $150,797 $100,367 $203,000 $128,235 $139,008 $160,861 $172,000
F 637 $179,881 $180,000 $178,164 $91,514 $273,961 $144,962 $163,200 $191,890 $215,800
F+ 254 $214,255 $300,000 $209,664 $101,680 $310,652 $174,663 $190,514 $236,975 $265,000
Responsibility
Category
# Female
Engineers Average Mode
Median
(D50)
Min
Value
Max
Value D10 D25 D75 D90
A- 49 $50,520 $41,600 $50,960 $41,600 $61,971 $41,600 $46,352 $53,976 $56,780
A 200 $67,683 $64,381 $68,192 $46,800 $84,542 $58,011 $62,879 $73,000 $77,040
B 278 $80,955 $75,000 $81,148 $59,963 $100,000 $68,286 $75,000 $87,787 $92,145
C 305 $94,080 $100,000 $95,159 $63,999 $124,800 $78,801 $88,000 $101,287 $106,824
D 350 $117,844 $120,000 $117,307 $79,164 $155,300 $100,445 $110,199 $127,191 $134,247
E 131 $147,153 $140,000 $148,650 $98,904 $200,579 $123,602 $135,954 $158,538 $169,000
F 48 $173,473 $143,688 $168,467 $96,200 $269,069 $137,602 $143,688 $190,047 $216,827
F+ 16 $196,232 No value $198,170 $101,680 $285,000 $157,500 $175,868 $209,600 $246,708
Responsibility
Category
#
Undeclared
Engineers Average Mode
Median
(D50)
Min
Value
Max
Value D10 D25 D75 D90
A- 1 $49,920 No value $49,920 No value No value No value No value No value No value
A 35 $74,884 $79,900 $79,900 $62,400 $79,900 $65,208 $66,234 $79,900 $79,900
B 43 $84,282 $83,700 $83,700 $68,556 $92,800 $80,464 $83,700 $87,800 $88,300
C 105 $103,624 $92,000 $101,100 $79,040 $129,400 $91,880 $94,201 $112,400 $117,580
D 80 $131,149 $136,200 $134,927 $97,344 $161,400 $111,875 $116,613 $142,400 $149,538
E 118 $159,048 $137,500 $155,593 $115,000 $201,500 $137,500 $144,907 $173,550 $188,450
F 130 $195,883 $163,370 $188,824 $138,320 $272,550 $162,355 $171,137 $216,100 $247,217
F+ 47 $205,824 $189,000 $204,617 $185,170 $238,450 $189,000 $192,898 $215,130 $225,484
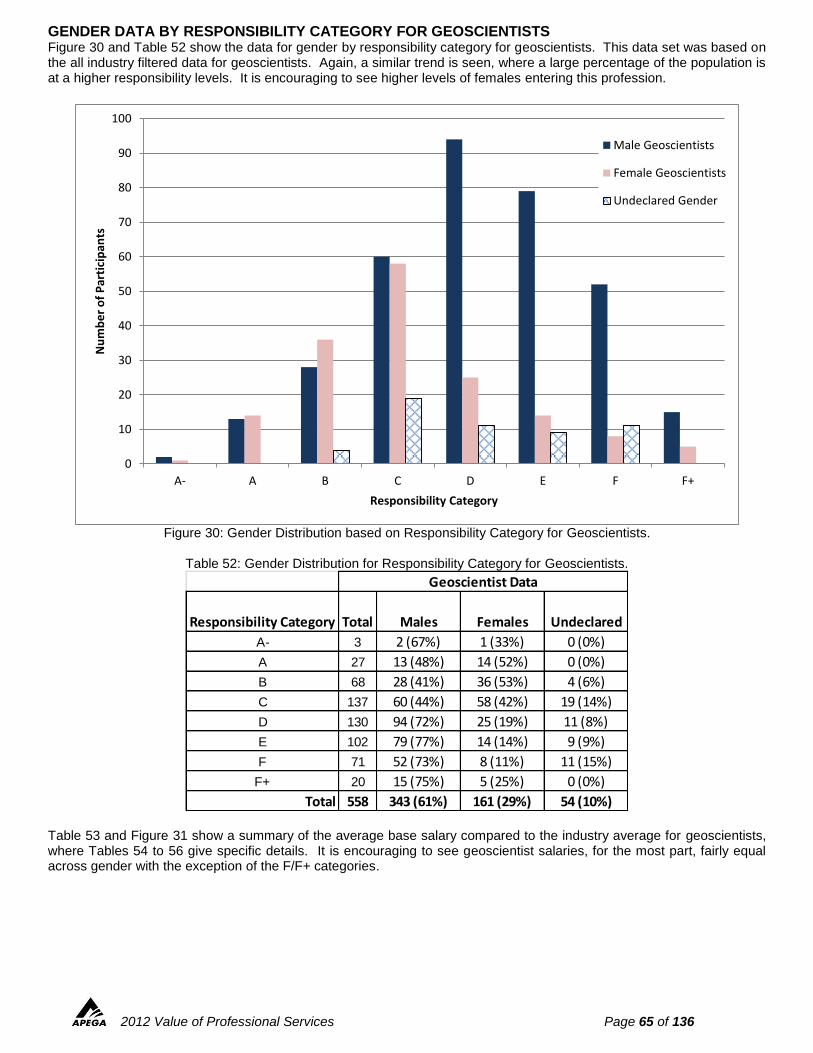
2012 Value of Professional Services Page 65 of 136
GENDER DATA BY RESPONSIBILITY CATEGORY FOR GEOSCIENTISTS Figure 30 and Table 52 show the data for gender by responsibility category for geoscientists. This data set was based on the all industry filtered data for geoscientists. Again, a similar trend is seen, where a large percentage of the population is at a higher responsibility levels. It is encouraging to see higher levels of females entering this profession.
Figure 30: Gender Distribution based on Responsibility Category for Geoscientists.
Table 52: Gender Distribution for Responsibility Category for Geoscientists.
Table 53 and Figure 31 show a summary of the average base salary compared to the industry average for geoscientists, where Tables 54 to 56 give specific details. It is encouraging to see geoscientist salaries, for the most part, fairly equal across gender with the exception of the F/F+ categories.
0
10
20
30
40
50
60
70
80
90
100
A- A B C D E F F+
Nu
mb
er
of
Par
tici
pan
ts
Responsibility Category
Male Geoscientists
Female Geoscientists
Undeclared Gender
Responsibility Category Total Males Females Undeclared
A- 3 2 (67%) 1 (33%) 0 (0%)
A 27 13 (48%) 14 (52%) 0 (0%)
B 68 28 (41%) 36 (53%) 4 (6%)
C 137 60 (44%) 58 (42%) 19 (14%)
D 130 94 (72%) 25 (19%) 11 (8%)
E 102 79 (77%) 14 (14%) 9 (9%)
F 71 52 (73%) 8 (11%) 11 (15%)
F+ 20 15 (75%) 5 (25%) 0 (0%)
Total 558 343 (61%) 161 (29%) 54 (10%)
Geoscientist Data
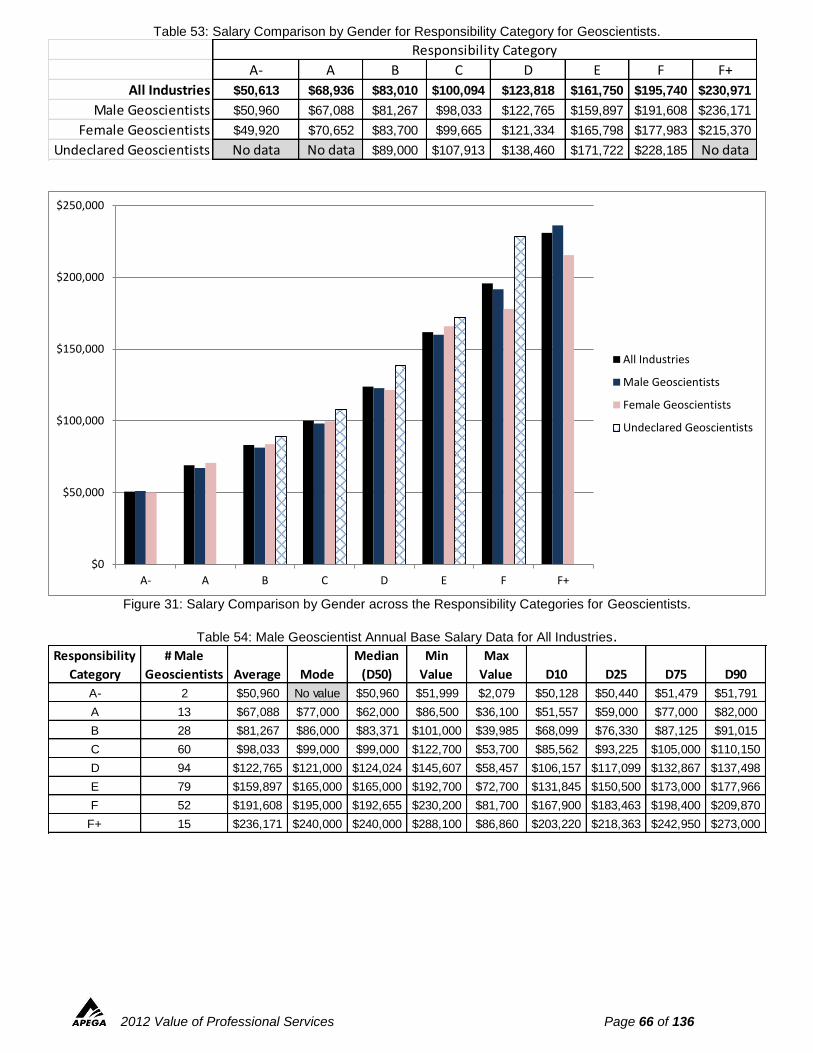
2012 Value of Professional Services Page 66 of 136
Table 53: Salary Comparison by Gender for Responsibility Category for Geoscientists.
Figure 31: Salary Comparison by Gender across the Responsibility Categories for Geoscientists.
Table 54: Male Geoscientist Annual Base Salary Data for All Industries.
A- A B C D E F F+
All Industries $50,613 $68,936 $83,010 $100,094 $123,818 $161,750 $195,740 $230,971
Male Geoscientists $50,960 $67,088 $81,267 $98,033 $122,765 $159,897 $191,608 $236,171
Female Geoscientists $49,920 $70,652 $83,700 $99,665 $121,334 $165,798 $177,983 $215,370
Undeclared Geoscientists No data No data $89,000 $107,913 $138,460 $171,722 $228,185 No data
Responsibility Category
$0
$50,000
$100,000
$150,000
$200,000
$250,000
A- A B C D E F F+
All Industries
Male Geoscientists
Female Geoscientists
Undeclared Geoscientists
Responsibility
Category
# Male
Geoscientists Average Mode
Median
(D50)
Min
Value
Max
Value D10 D25 D75 D90
A- 2 $50,960 No value $50,960 $51,999 $2,079 $50,128 $50,440 $51,479 $51,791
A 13 $67,088 $77,000 $62,000 $86,500 $36,100 $51,557 $59,000 $77,000 $82,000
B 28 $81,267 $86,000 $83,371 $101,000 $39,985 $68,099 $76,330 $87,125 $91,015
C 60 $98,033 $99,000 $99,000 $122,700 $53,700 $85,562 $93,225 $105,000 $110,150
D 94 $122,765 $121,000 $124,024 $145,607 $58,457 $106,157 $117,099 $132,867 $137,498
E 79 $159,897 $165,000 $165,000 $192,700 $72,700 $131,845 $150,500 $173,000 $177,966
F 52 $191,608 $195,000 $192,655 $230,200 $81,700 $167,900 $183,463 $198,400 $209,870
F+ 15 $236,171 $240,000 $240,000 $288,100 $86,860 $203,220 $218,363 $242,950 $273,000
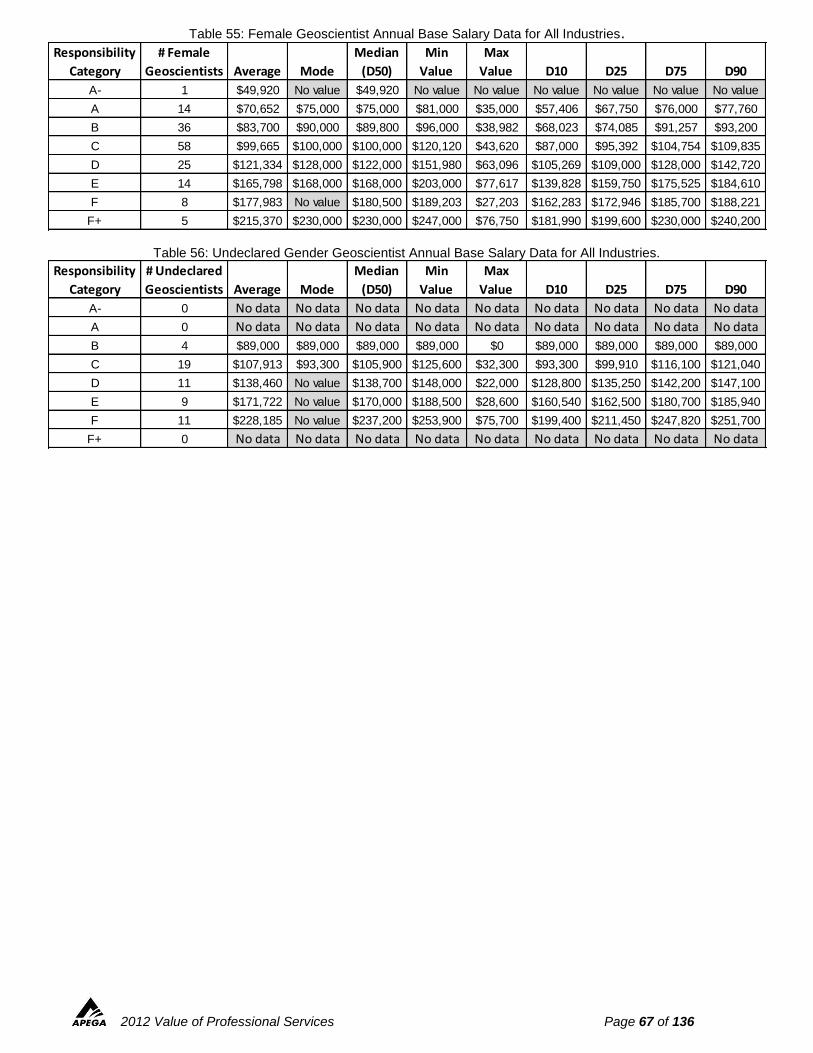
2012 Value of Professional Services Page 67 of 136
Table 55: Female Geoscientist Annual Base Salary Data for All Industries.
Table 56: Undeclared Gender Geoscientist Annual Base Salary Data for All Industries.
Responsibility
Category
# Female
Geoscientists Average Mode
Median
(D50)
Min
Value
Max
Value D10 D25 D75 D90
A- 1 $49,920 No value $49,920 No value No value No value No value No value No value
A 14 $70,652 $75,000 $75,000 $81,000 $35,000 $57,406 $67,750 $76,000 $77,760
B 36 $83,700 $90,000 $89,800 $96,000 $38,982 $68,023 $74,085 $91,257 $93,200
C 58 $99,665 $100,000 $100,000 $120,120 $43,620 $87,000 $95,392 $104,754 $109,835
D 25 $121,334 $128,000 $122,000 $151,980 $63,096 $105,269 $109,000 $128,000 $142,720
E 14 $165,798 $168,000 $168,000 $203,000 $77,617 $139,828 $159,750 $175,525 $184,610
F 8 $177,983 No value $180,500 $189,203 $27,203 $162,283 $172,946 $185,700 $188,221
F+ 5 $215,370 $230,000 $230,000 $247,000 $76,750 $181,990 $199,600 $230,000 $240,200
Responsibility
Category
# Undeclared
Geoscientists Average Mode
Median
(D50)
Min
Value
Max
Value D10 D25 D75 D90
A- 0 No data No data No data No data No data No data No data No data No data
A 0 No data No data No data No data No data No data No data No data No data
B 4 $89,000 $89,000 $89,000 $89,000 $0 $89,000 $89,000 $89,000 $89,000
C 19 $107,913 $93,300 $105,900 $125,600 $32,300 $93,300 $99,910 $116,100 $121,040
D 11 $138,460 No value $138,700 $148,000 $22,000 $128,800 $135,250 $142,200 $147,100
E 9 $171,722 No value $170,000 $188,500 $28,600 $160,540 $162,500 $180,700 $185,940
F 11 $228,185 No value $237,200 $253,900 $75,700 $199,400 $211,450 $247,820 $251,700
F+ 0 No data No data No data No data No data No data No data No data No data
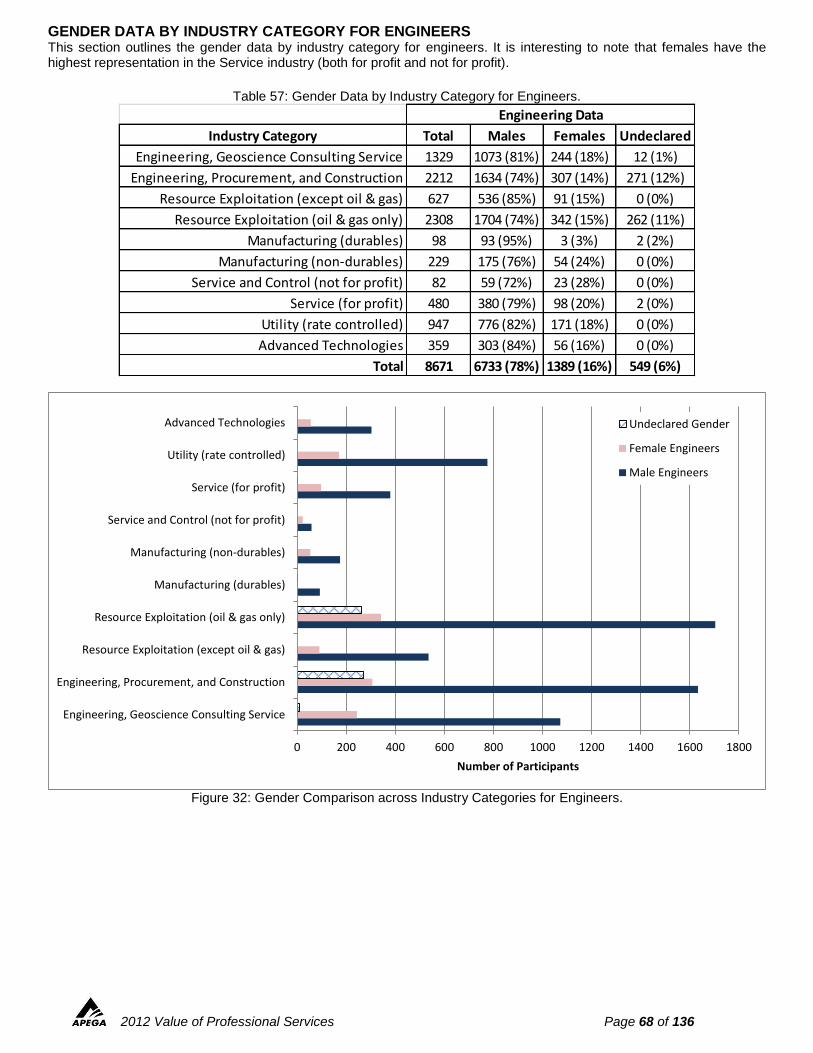
2012 Value of Professional Services Page 68 of 136
GENDER DATA BY INDUSTRY CATEGORY FOR ENGINEERS This section outlines the gender data by industry category for engineers. It is interesting to note that females have the highest representation in the Service industry (both for profit and not for profit).
Table 57: Gender Data by Industry Category for Engineers.
Figure 32: Gender Comparison across Industry Categories for Engineers.
Industry Category Total Males Females Undeclared
Engineering, Geoscience Consulting Service 1329 1073 (81%) 244 (18%) 12 (1%)
Engineering, Procurement, and Construction 2212 1634 (74%) 307 (14%) 271 (12%)
Resource Exploitation (except oil & gas) 627 536 (85%) 91 (15%) 0 (0%)
Resource Exploitation (oil & gas only) 2308 1704 (74%) 342 (15%) 262 (11%)
Manufacturing (durables) 98 93 (95%) 3 (3%) 2 (2%)
Manufacturing (non-durables) 229 175 (76%) 54 (24%) 0 (0%)
Service and Control (not for profit) 82 59 (72%) 23 (28%) 0 (0%)
Service (for profit) 480 380 (79%) 98 (20%) 2 (0%)
Utility (rate controlled) 947 776 (82%) 171 (18%) 0 (0%)
Advanced Technologies 359 303 (84%) 56 (16%) 0 (0%)
Total 8671 6733 (78%) 1389 (16%) 549 (6%)
Engineering Data
0 200 400 600 800 1000 1200 1400 1600 1800
Engineering, Geoscience Consulting Service
Engineering, Procurement, and Construction
Resource Exploitation (except oil & gas)
Resource Exploitation (oil & gas only)
Manufacturing (durables)
Manufacturing (non-durables)
Service and Control (not for profit)
Service (for profit)
Utility (rate controlled)
Advanced Technologies
Number of Participants
Undeclared Gender
Female Engineers
Male Engineers
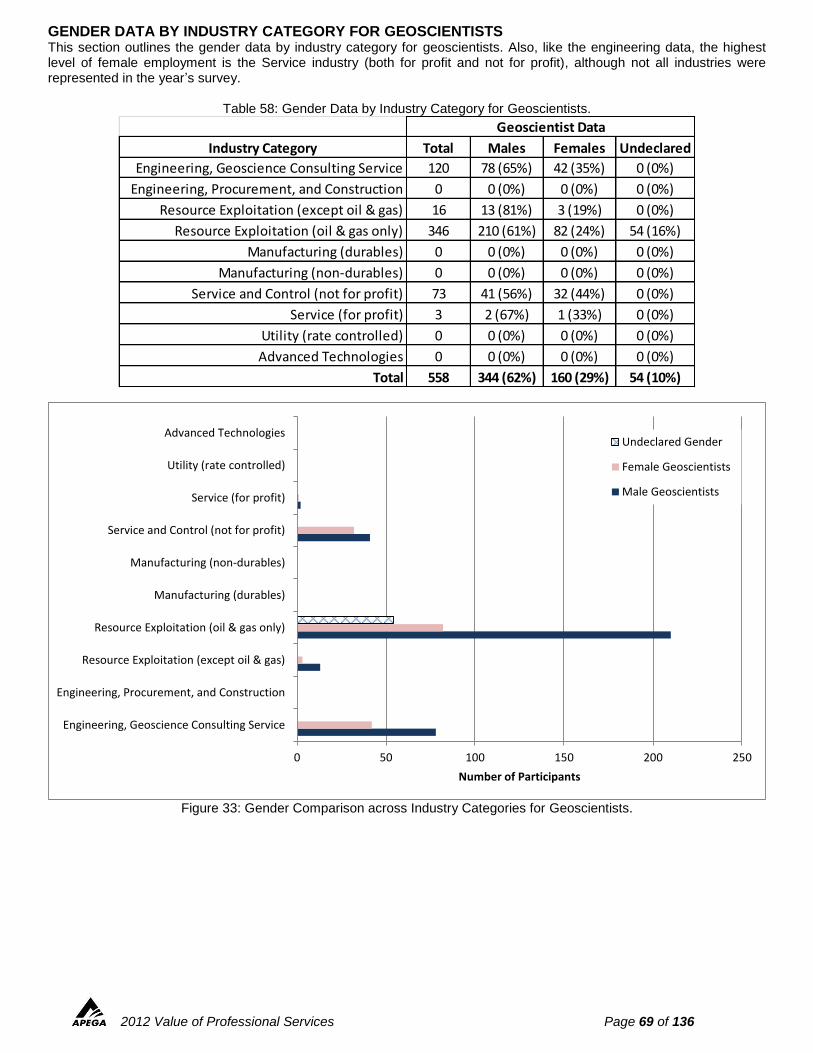
2012 Value of Professional Services Page 69 of 136
GENDER DATA BY INDUSTRY CATEGORY FOR GEOSCIENTISTS This section outlines the gender data by industry category for geoscientists. Also, like the engineering data, the highest level of female employment is the Service industry (both for profit and not for profit), although not all industries were represented in the year’s survey.
Table 58: Gender Data by Industry Category for Geoscientists.
Figure 33: Gender Comparison across Industry Categories for Geoscientists.
Industry Category Total Males Females Undeclared
Engineering, Geoscience Consulting Service 120 78 (65%) 42 (35%) 0 (0%)
Engineering, Procurement, and Construction 0 0 (0%) 0 (0%) 0 (0%)
Resource Exploitation (except oil & gas) 16 13 (81%) 3 (19%) 0 (0%)
Resource Exploitation (oil & gas only) 346 210 (61%) 82 (24%) 54 (16%)
Manufacturing (durables) 0 0 (0%) 0 (0%) 0 (0%)
Manufacturing (non-durables) 0 0 (0%) 0 (0%) 0 (0%)
Service and Control (not for profit) 73 41 (56%) 32 (44%) 0 (0%)
Service (for profit) 3 2 (67%) 1 (33%) 0 (0%)
Utility (rate controlled) 0 0 (0%) 0 (0%) 0 (0%)
Advanced Technologies 0 0 (0%) 0 (0%) 0 (0%)
Total 558 344 (62%) 160 (29%) 54 (10%)
Geoscientist Data
0 50 100 150 200 250
Engineering, Geoscience Consulting Service
Engineering, Procurement, and Construction
Resource Exploitation (except oil & gas)
Resource Exploitation (oil & gas only)
Manufacturing (durables)
Manufacturing (non-durables)
Service and Control (not for profit)
Service (for profit)
Utility (rate controlled)
Advanced Technologies
Number of Participants
Undeclared Gender
Female Geoscientists
Male Geoscientists
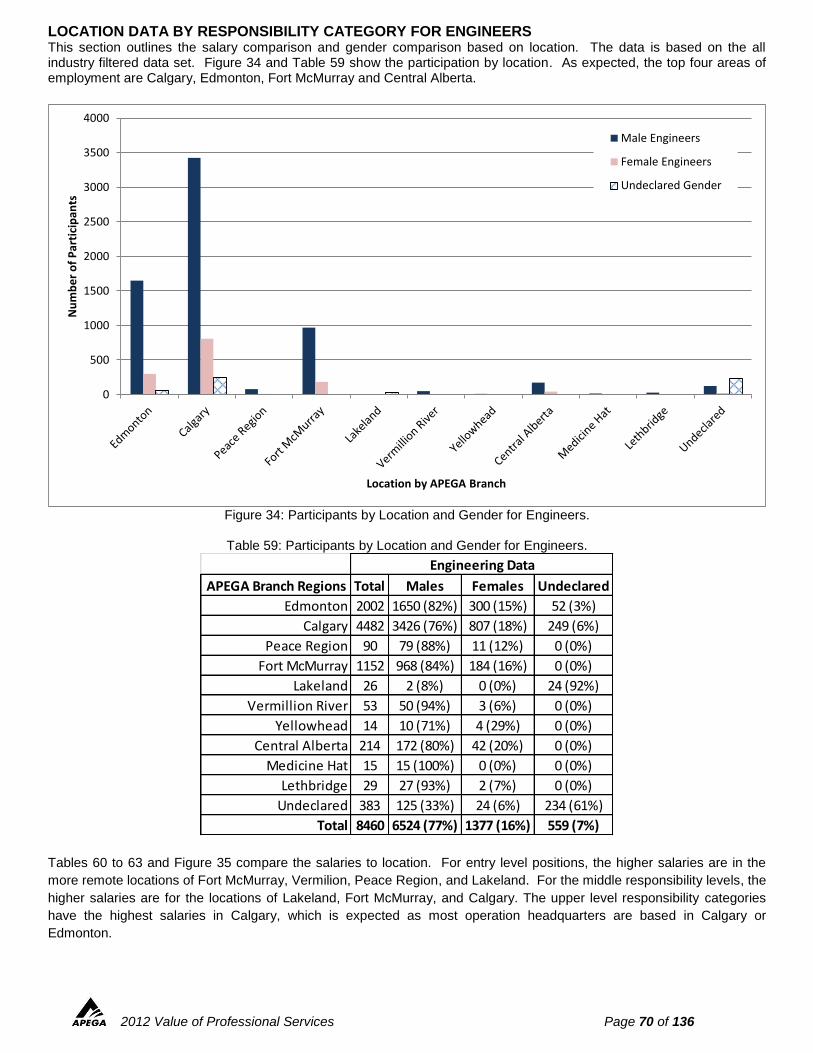
2012 Value of Professional Services Page 70 of 136
LOCATION DATA BY RESPONSIBILITY CATEGORY FOR ENGINEERS This section outlines the salary comparison and gender comparison based on location. The data is based on the all industry filtered data set. Figure 34 and Table 59 show the participation by location. As expected, the top four areas of employment are Calgary, Edmonton, Fort McMurray and Central Alberta.
Figure 34: Participants by Location and Gender for Engineers.
Table 59: Participants by Location and Gender for Engineers.
Tables 60 to 63 and Figure 35 compare the salaries to location. For entry level positions, the higher salaries are in the
more remote locations of Fort McMurray, Vermilion, Peace Region, and Lakeland. For the middle responsibility levels, the
higher salaries are for the locations of Lakeland, Fort McMurray, and Calgary. The upper level responsibility categories
have the highest salaries in Calgary, which is expected as most operation headquarters are based in Calgary or
Edmonton.
0
500
1000
1500
2000
2500
3000
3500
4000
Nu
mb
er
of
Par
tici
pan
ts
Location by APEGA Branch
Male Engineers
Female Engineers
Undeclared Gender
APEGA Branch Regions Total Males Females Undeclared
Edmonton 2002 1650 (82%) 300 (15%) 52 (3%)
Calgary 4482 3426 (76%) 807 (18%) 249 (6%)
Peace Region 90 79 (88%) 11 (12%) 0 (0%)
Fort McMurray 1152 968 (84%) 184 (16%) 0 (0%)
Lakeland 26 2 (8%) 0 (0%) 24 (92%)
Vermillion River 53 50 (94%) 3 (6%) 0 (0%)
Yellowhead 14 10 (71%) 4 (29%) 0 (0%)
Central Alberta 214 172 (80%) 42 (20%) 0 (0%)
Medicine Hat 15 15 (100%) 0 (0%) 0 (0%)
Lethbridge 29 27 (93%) 2 (7%) 0 (0%)
Undeclared 383 125 (33%) 24 (6%) 234 (61%)
Total 8460 6524 (77%) 1377 (16%) 559 (7%)
Engineering Data
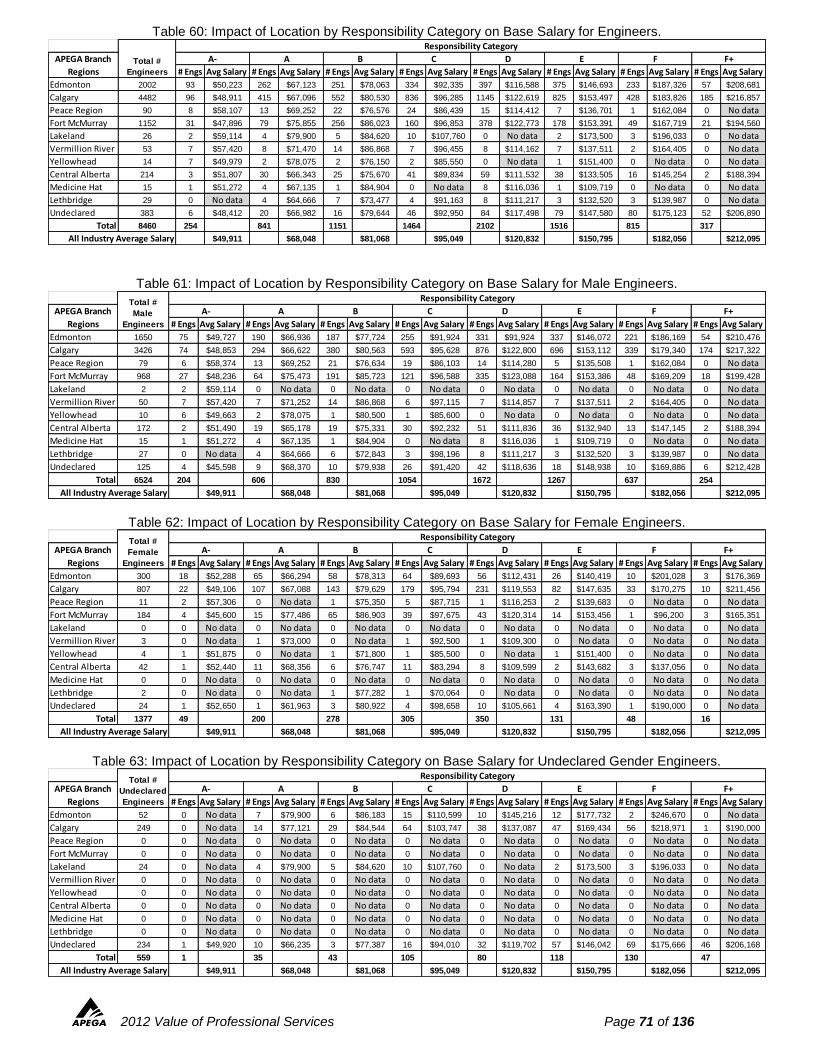
2012 Value of Professional Services Page 71 of 136
Table 60: Impact of Location by Responsibility Category on Base Salary for Engineers.
Table 61: Impact of Location by Responsibility Category on Base Salary for Male Engineers.
Table 62: Impact of Location by Responsibility Category on Base Salary for Female Engineers.
Table 63: Impact of Location by Responsibility Category on Base Salary for Undeclared Gender Engineers.
# Engs Avg Salary # Engs Avg Salary # Engs Avg Salary # Engs Avg Salary # Engs Avg Salary # Engs Avg Salary # Engs Avg Salary # Engs Avg Salary
Edmonton 2002 93 $50,223 262 $67,123 251 $78,063 334 $92,335 397 $116,588 375 $146,693 233 $187,326 57 $208,681
Calgary 4482 96 $48,911 415 $67,096 552 $80,530 836 $96,285 1145 $122,619 825 $153,497 428 $183,826 185 $216,857
Peace Region 90 8 $58,107 13 $69,252 22 $76,576 24 $86,439 15 $114,412 7 $136,701 1 $162,084 0 No data
Fort McMurray 1152 31 $47,896 79 $75,855 256 $86,023 160 $96,853 378 $122,773 178 $153,391 49 $167,719 21 $194,560
Lakeland 26 2 $59,114 4 $79,900 5 $84,620 10 $107,760 0 No data 2 $173,500 3 $196,033 0 No data
Vermillion River 53 7 $57,420 8 $71,470 14 $86,868 7 $96,455 8 $114,162 7 $137,511 2 $164,405 0 No data
Yellowhead 14 7 $49,979 2 $78,075 2 $76,150 2 $85,550 0 No data 1 $151,400 0 No data 0 No data
Central Alberta 214 3 $51,807 30 $66,343 25 $75,670 41 $89,834 59 $111,532 38 $133,505 16 $145,254 2 $188,394
Medicine Hat 15 1 $51,272 4 $67,135 1 $84,904 0 No data 8 $116,036 1 $109,719 0 No data 0 No data
Lethbridge 29 0 No data 4 $64,666 7 $73,477 4 $91,163 8 $111,217 3 $132,520 3 $139,987 0 No data
Undeclared 383 6 $48,412 20 $66,982 16 $79,644 46 $92,950 84 $117,498 79 $147,580 80 $175,123 52 $206,890
Total 8460 254 841 1151 1464 2102 1516 815 317
$49,911 $68,048 $81,068 $95,049 $120,832 $150,795 $182,056 $212,095All Industry Average Salary
Responsibility Category
APEGA Branch
RegionsTotal #
Engineers
A- A B C D E F F+
# Engs Avg Salary # Engs Avg Salary # Engs Avg Salary # Engs Avg Salary # Engs Avg Salary # Engs Avg Salary # Engs Avg Salary # Engs Avg Salary
Edmonton 1650 75 $49,727 190 $66,936 187 $77,724 255 $91,924 331 $91,924 337 $146,072 221 $186,169 54 $210,476
Calgary 3426 74 $48,853 294 $66,622 380 $80,563 593 $95,628 876 $122,800 696 $153,112 339 $179,340 174 $217,322
Peace Region 79 6 $58,374 13 $69,252 21 $76,634 19 $86,103 14 $114,280 5 $135,508 1 $162,084 0 No data
Fort McMurray 968 27 $48,236 64 $75,473 191 $85,723 121 $96,588 335 $123,088 164 $153,386 48 $169,209 18 $199,428
Lakeland 2 2 $59,114 0 No data 0 No data 0 No data 0 No data 0 No data 0 No data 0 No data
Vermillion River 50 7 $57,420 7 $71,252 14 $86,868 6 $97,115 7 $114,857 7 $137,511 2 $164,405 0 No data
Yellowhead 10 6 $49,663 2 $78,075 1 $80,500 1 $85,600 0 No data 0 No data 0 No data 0 No data
Central Alberta 172 2 $51,490 19 $65,178 19 $75,331 30 $92,232 51 $111,836 36 $132,940 13 $147,145 2 $188,394
Medicine Hat 15 1 $51,272 4 $67,135 1 $84,904 0 No data 8 $116,036 1 $109,719 0 No data 0 No data
Lethbridge 27 0 No data 4 $64,666 6 $72,843 3 $98,196 8 $111,217 3 $132,520 3 $139,987 0 No data
Undeclared 125 4 $45,598 9 $68,370 10 $79,938 26 $91,420 42 $118,636 18 $148,938 10 $169,886 6 $212,428
Total 6524 204 606 830 1054 1672 1267 637 254
$49,911 $68,048 $81,068 $95,049 $120,832 $150,795 $182,056 $212,095
APEGA Branch
Regions
Total #
Male
Engineers
All Industry Average Salary
Responsibility Category
A- A B C D E F F+
# Engs Avg Salary # Engs Avg Salary # Engs Avg Salary # Engs Avg Salary # Engs Avg Salary # Engs Avg Salary # Engs Avg Salary # Engs Avg Salary
Edmonton 300 18 $52,288 65 $66,294 58 $78,313 64 $89,693 56 $112,431 26 $140,419 10 $201,028 3 $176,369
Calgary 807 22 $49,106 107 $67,088 143 $79,629 179 $95,794 231 $119,553 82 $147,635 33 $170,275 10 $211,456
Peace Region 11 2 $57,306 0 No data 1 $75,350 5 $87,715 1 $116,253 2 $139,683 0 No data 0 No data
Fort McMurray 184 4 $45,600 15 $77,486 65 $86,903 39 $97,675 43 $120,314 14 $153,456 1 $96,200 3 $165,351
Lakeland 0 0 No data 0 No data 0 No data 0 No data 0 No data 0 No data 0 No data 0 No data
Vermillion River 3 0 No data 1 $73,000 0 No data 1 $92,500 1 $109,300 0 No data 0 No data 0 No data
Yellowhead 4 1 $51,875 0 No data 1 $71,800 1 $85,500 0 No data 1 $151,400 0 No data 0 No data
Central Alberta 42 1 $52,440 11 $68,356 6 $76,747 11 $83,294 8 $109,599 2 $143,682 3 $137,056 0 No data
Medicine Hat 0 0 No data 0 No data 0 No data 0 No data 0 No data 0 No data 0 No data 0 No data
Lethbridge 2 0 No data 0 No data 1 $77,282 1 $70,064 0 No data 0 No data 0 No data 0 No data
Undeclared 24 1 $52,650 1 $61,963 3 $80,922 4 $98,658 10 $105,661 4 $163,390 1 $190,000 0 No data
Total 1377 49 200 278 305 350 131 48 16
$49,911 $68,048 $81,068 $95,049 $120,832 $150,795 $182,056 $212,095
APEGA Branch
Regions
Total #
Female
Engineers
All Industry Average Salary
Responsibility Category
A- A B C D E F F+
# Engs Avg Salary # Engs Avg Salary # Engs Avg Salary # Engs Avg Salary # Engs Avg Salary # Engs Avg Salary # Engs Avg Salary # Engs Avg Salary
Edmonton 52 0 No data 7 $79,900 6 $86,183 15 $110,599 10 $145,216 12 $177,732 2 $246,670 0 No data
Calgary 249 0 No data 14 $77,121 29 $84,544 64 $103,747 38 $137,087 47 $169,434 56 $218,971 1 $190,000
Peace Region 0 0 No data 0 No data 0 No data 0 No data 0 No data 0 No data 0 No data 0 No data
Fort McMurray 0 0 No data 0 No data 0 No data 0 No data 0 No data 0 No data 0 No data 0 No data
Lakeland 24 0 No data 4 $79,900 5 $84,620 10 $107,760 0 No data 2 $173,500 3 $196,033 0 No data
Vermillion River 0 0 No data 0 No data 0 No data 0 No data 0 No data 0 No data 0 No data 0 No data
Yellowhead 0 0 No data 0 No data 0 No data 0 No data 0 No data 0 No data 0 No data 0 No data
Central Alberta 0 0 No data 0 No data 0 No data 0 No data 0 No data 0 No data 0 No data 0 No data
Medicine Hat 0 0 No data 0 No data 0 No data 0 No data 0 No data 0 No data 0 No data 0 No data
Lethbridge 0 0 No data 0 No data 0 No data 0 No data 0 No data 0 No data 0 No data 0 No data
Undeclared 234 1 $49,920 10 $66,235 3 $77,387 16 $94,010 32 $119,702 57 $146,042 69 $175,666 46 $206,168
Total 559 1 35 43 105 80 118 130 47
$49,911 $68,048 $81,068 $95,049 $120,832 $150,795 $182,056 $212,095All Industry Average Salary
APEGA Branch
Regions
Total #
Undeclared
Engineers
Responsibility Category
A- A B C D E F F+
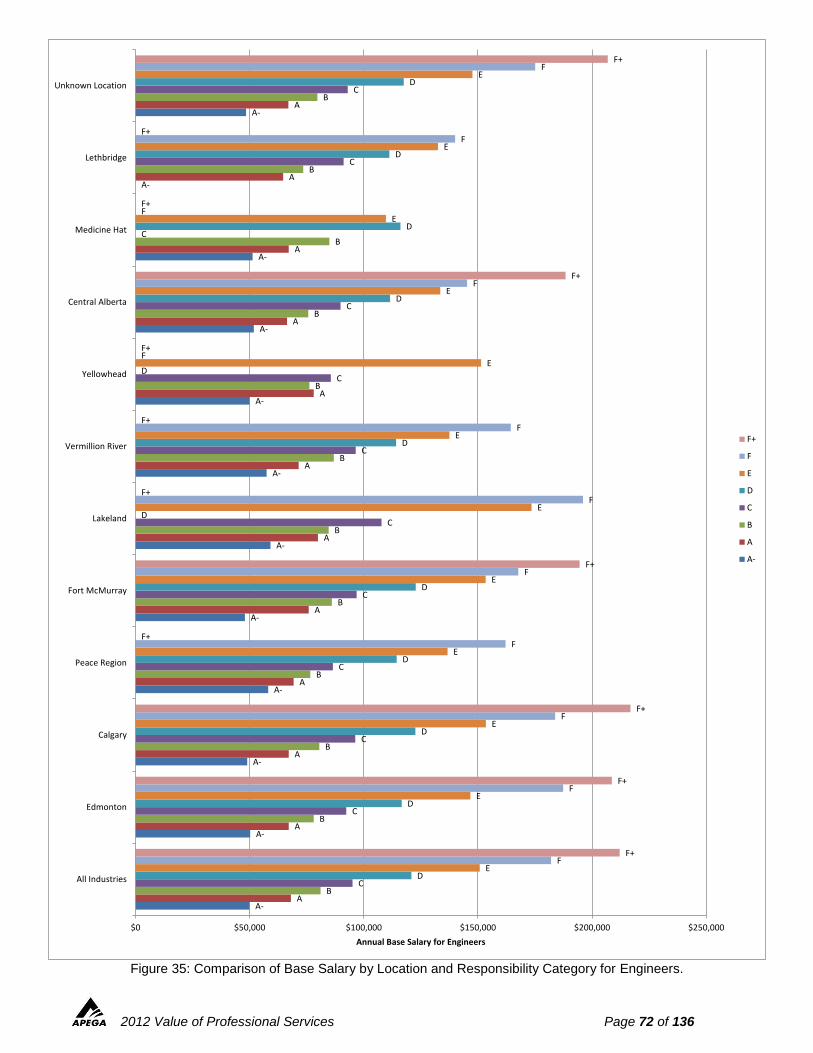
2012 Value of Professional Services Page 72 of 136
Figure 35: Comparison of Base Salary by Location and Responsibility Category for Engineers.
A-
A-
A-
A-
A-
A-
A-
A-
A-
A-
A-
A-
A
A
A
A
A
A
A
A
A
A
A
A
B
B
B
B
B
B
B
B
B
B
B
B
C
C
C
C
C
C
C
C
C
C
C
C
D
D
D
D
D
D
D
D
D
D
D
D
E
E
E
E
E
E
E
E
E
E
E
E
F
F
F
F
F
F
F
F
F
F
F
F
F+
F+
F+
F+
F+
F+
F+
F+
F+
F+
F+
F+
$0 $50,000 $100,000 $150,000 $200,000 $250,000
All Industries
Edmonton
Calgary
Peace Region
Fort McMurray
Lakeland
Vermillion River
Yellowhead
Central Alberta
Medicine Hat
Lethbridge
Unknown Location
Annual Base Salary for Engineers
F+
F
E
D
C
B
A
A-
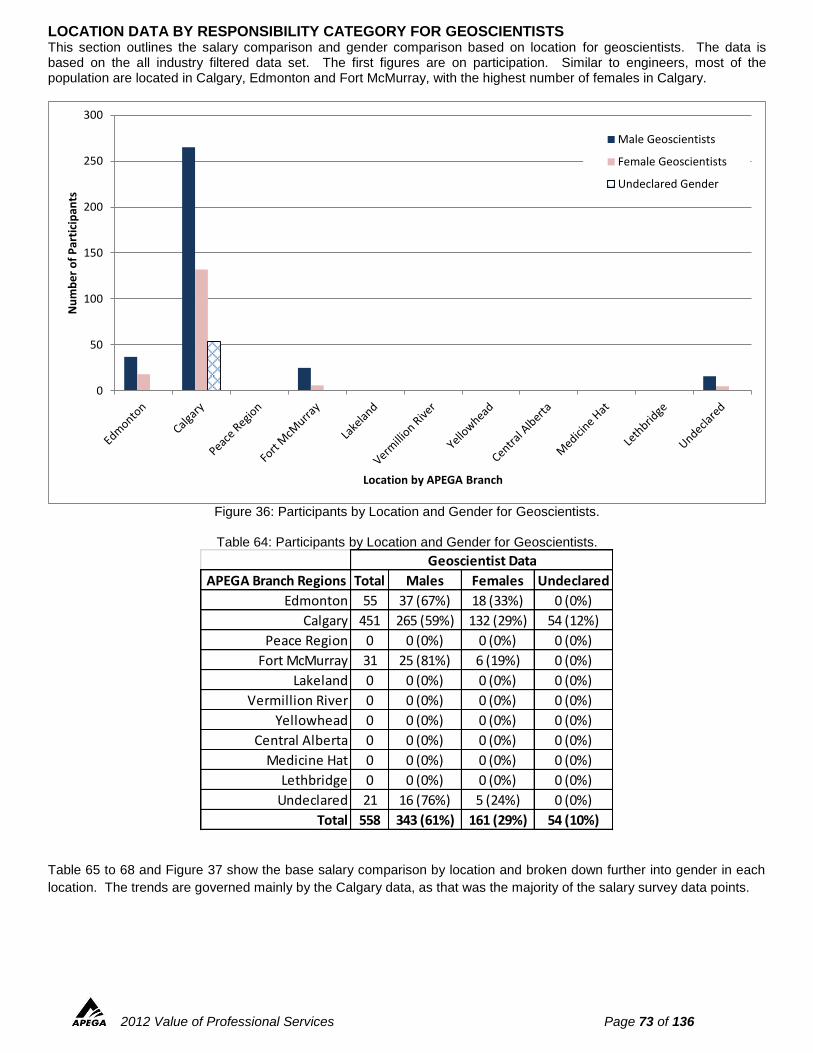
2012 Value of Professional Services Page 73 of 136
LOCATION DATA BY RESPONSIBILITY CATEGORY FOR GEOSCIENTISTS This section outlines the salary comparison and gender comparison based on location for geoscientists. The data is based on the all industry filtered data set. The first figures are on participation. Similar to engineers, most of the population are located in Calgary, Edmonton and Fort McMurray, with the highest number of females in Calgary.
Figure 36: Participants by Location and Gender for Geoscientists.
Table 64: Participants by Location and Gender for Geoscientists.
Table 65 to 68 and Figure 37 show the base salary comparison by location and broken down further into gender in each
location. The trends are governed mainly by the Calgary data, as that was the majority of the salary survey data points.
0
50
100
150
200
250
300
Nu
mb
er
of
Par
tici
pan
ts
Location by APEGA Branch
Male Geoscientists
Female Geoscientists
Undeclared Gender
APEGA Branch Regions Total Males Females Undeclared
Edmonton 55 37 (67%) 18 (33%) 0 (0%)
Calgary 451 265 (59%) 132 (29%) 54 (12%)
Peace Region 0 0 (0%) 0 (0%) 0 (0%)
Fort McMurray 31 25 (81%) 6 (19%) 0 (0%)
Lakeland 0 0 (0%) 0 (0%) 0 (0%)
Vermillion River 0 0 (0%) 0 (0%) 0 (0%)
Yellowhead 0 0 (0%) 0 (0%) 0 (0%)
Central Alberta 0 0 (0%) 0 (0%) 0 (0%)
Medicine Hat 0 0 (0%) 0 (0%) 0 (0%)
Lethbridge 0 0 (0%) 0 (0%) 0 (0%)
Undeclared 21 16 (76%) 5 (24%) 0 (0%)
Total 558 343 (61%) 161 (29%) 54 (10%)
Geoscientist Data
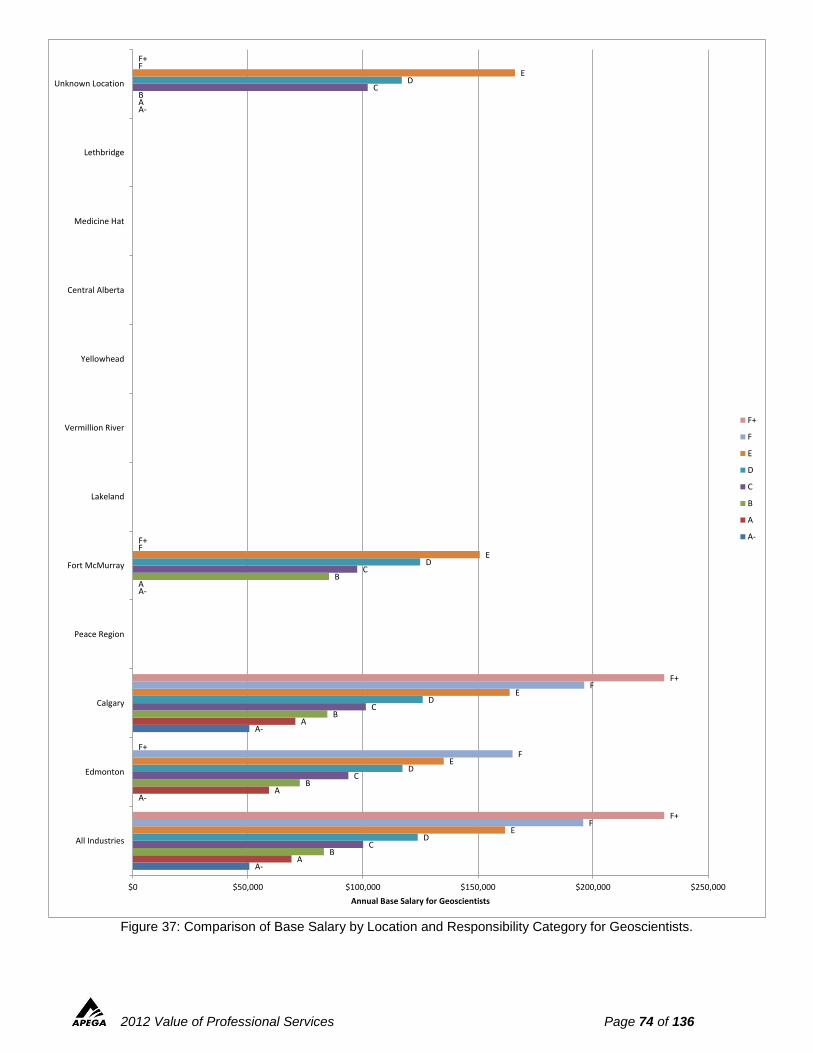
2012 Value of Professional Services Page 74 of 136
Figure 37: Comparison of Base Salary by Location and Responsibility Category for Geoscientists.
A-
A-
A-
A-
A-
A
A
A
A
A
B
B
B
B
B
C
C
C
C
C
D
D
D
D
D
E
E
E
E
E
F
F
F
F
F
F+
F+
F+
F+
F+
$0 $50,000 $100,000 $150,000 $200,000 $250,000
All Industries
Edmonton
Calgary
Peace Region
Fort McMurray
Lakeland
Vermillion River
Yellowhead
Central Alberta
Medicine Hat
Lethbridge
Unknown Location
Annual Base Salary for Geoscientists
F+
F
E
D
C
B
A
A-
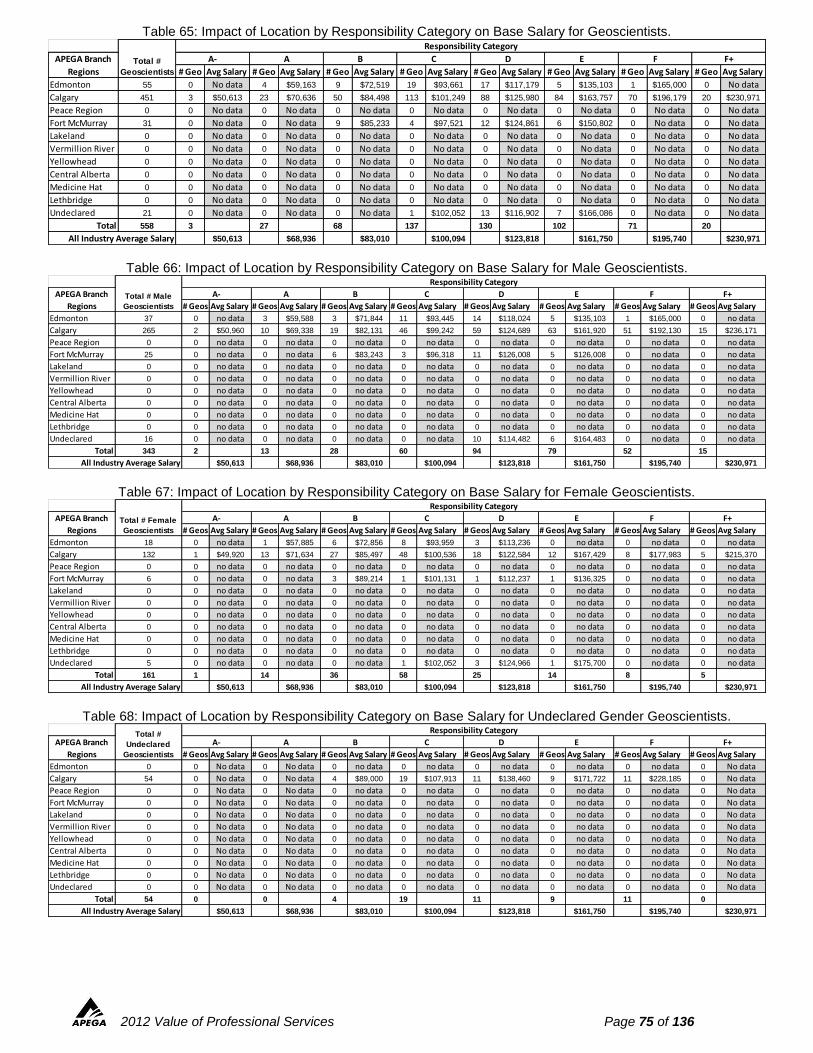
2012 Value of Professional Services Page 75 of 136
Table 65: Impact of Location by Responsibility Category on Base Salary for Geoscientists.
Table 66: Impact of Location by Responsibility Category on Base Salary for Male Geoscientists.
Table 67: Impact of Location by Responsibility Category on Base Salary for Female Geoscientists.
Table 68: Impact of Location by Responsibility Category on Base Salary for Undeclared Gender Geoscientists.
# Geo Avg Salary # Geo Avg Salary # Geo Avg Salary # Geo Avg Salary # Geo Avg Salary # Geo Avg Salary # Geo Avg Salary # Geo Avg Salary
Edmonton 55 0 No data 4 $59,163 9 $72,519 19 $93,661 17 $117,179 5 $135,103 1 $165,000 0 No data
Calgary 451 3 $50,613 23 $70,636 50 $84,498 113 $101,249 88 $125,980 84 $163,757 70 $196,179 20 $230,971
Peace Region 0 0 No data 0 No data 0 No data 0 No data 0 No data 0 No data 0 No data 0 No data
Fort McMurray 31 0 No data 0 No data 9 $85,233 4 $97,521 12 $124,861 6 $150,802 0 No data 0 No data
Lakeland 0 0 No data 0 No data 0 No data 0 No data 0 No data 0 No data 0 No data 0 No data
Vermillion River 0 0 No data 0 No data 0 No data 0 No data 0 No data 0 No data 0 No data 0 No data
Yellowhead 0 0 No data 0 No data 0 No data 0 No data 0 No data 0 No data 0 No data 0 No data
Central Alberta 0 0 No data 0 No data 0 No data 0 No data 0 No data 0 No data 0 No data 0 No data
Medicine Hat 0 0 No data 0 No data 0 No data 0 No data 0 No data 0 No data 0 No data 0 No data
Lethbridge 0 0 No data 0 No data 0 No data 0 No data 0 No data 0 No data 0 No data 0 No data
Undeclared 21 0 No data 0 No data 0 No data 1 $102,052 13 $116,902 7 $166,086 0 No data 0 No data
Total 558 3 27 68 137 130 102 71 20
$50,613 $68,936 $83,010 $100,094 $123,818 $161,750 $195,740 $230,971All Industry Average Salary
APEGA Branch
RegionsTotal #
Geoscientists
E F F+A- A B C D
Responsibility Category
# Geos Avg Salary # Geos Avg Salary # Geos Avg Salary # Geos Avg Salary # Geos Avg Salary # Geos Avg Salary # Geos Avg Salary # Geos Avg Salary
Edmonton 37 0 no data 3 $59,588 3 $71,844 11 $93,445 14 $118,024 5 $135,103 1 $165,000 0 no data
Calgary 265 2 $50,960 10 $69,338 19 $82,131 46 $99,242 59 $124,689 63 $161,920 51 $192,130 15 $236,171
Peace Region 0 0 no data 0 no data 0 no data 0 no data 0 no data 0 no data 0 no data 0 no data
Fort McMurray 25 0 no data 0 no data 6 $83,243 3 $96,318 11 $126,008 5 $126,008 0 no data 0 no data
Lakeland 0 0 no data 0 no data 0 no data 0 no data 0 no data 0 no data 0 no data 0 no data
Vermillion River 0 0 no data 0 no data 0 no data 0 no data 0 no data 0 no data 0 no data 0 no data
Yellowhead 0 0 no data 0 no data 0 no data 0 no data 0 no data 0 no data 0 no data 0 no data
Central Alberta 0 0 no data 0 no data 0 no data 0 no data 0 no data 0 no data 0 no data 0 no data
Medicine Hat 0 0 no data 0 no data 0 no data 0 no data 0 no data 0 no data 0 no data 0 no data
Lethbridge 0 0 no data 0 no data 0 no data 0 no data 0 no data 0 no data 0 no data 0 no data
Undeclared 16 0 no data 0 no data 0 no data 0 no data 10 $114,482 6 $164,483 0 no data 0 no data
Total 343 2 13 28 60 94 79 52 15
$50,613 $68,936 $83,010 $100,094 $123,818 $161,750 $195,740 $230,971
APEGA Branch
Regions
All Industry Average Salary
Responsibility Category
A- A B C D E F F+Total # Male
Geoscientists
# Geos Avg Salary # Geos Avg Salary # Geos Avg Salary # Geos Avg Salary # Geos Avg Salary # Geos Avg Salary # Geos Avg Salary # Geos Avg Salary
Edmonton 18 0 no data 1 $57,885 6 $72,856 8 $93,959 3 $113,236 0 no data 0 no data 0 no data
Calgary 132 1 $49,920 13 $71,634 27 $85,497 48 $100,536 18 $122,584 12 $167,429 8 $177,983 5 $215,370
Peace Region 0 0 no data 0 no data 0 no data 0 no data 0 no data 0 no data 0 no data 0 no data
Fort McMurray 6 0 no data 0 no data 3 $89,214 1 $101,131 1 $112,237 1 $136,325 0 no data 0 no data
Lakeland 0 0 no data 0 no data 0 no data 0 no data 0 no data 0 no data 0 no data 0 no data
Vermillion River 0 0 no data 0 no data 0 no data 0 no data 0 no data 0 no data 0 no data 0 no data
Yellowhead 0 0 no data 0 no data 0 no data 0 no data 0 no data 0 no data 0 no data 0 no data
Central Alberta 0 0 no data 0 no data 0 no data 0 no data 0 no data 0 no data 0 no data 0 no data
Medicine Hat 0 0 no data 0 no data 0 no data 0 no data 0 no data 0 no data 0 no data 0 no data
Lethbridge 0 0 no data 0 no data 0 no data 0 no data 0 no data 0 no data 0 no data 0 no data
Undeclared 5 0 no data 0 no data 0 no data 1 $102,052 3 $124,966 1 $175,700 0 no data 0 no data
Total 161 1 14 36 58 25 14 8 5
$50,613 $68,936 $83,010 $100,094 $123,818 $161,750 $195,740 $230,971
APEGA Branch
RegionsTotal # Female
Geoscientists
All Industry Average Salary
Responsibility Category
A- A B C D E F F+
# Geos Avg Salary # Geos Avg Salary # Geos Avg Salary # Geos Avg Salary # Geos Avg Salary # Geos Avg Salary # Geos Avg Salary # Geos Avg Salary
Edmonton 0 0 No data 0 No data 0 no data 0 no data 0 no data 0 no data 0 no data 0 No data
Calgary 54 0 No data 0 No data 4 $89,000 19 $107,913 11 $138,460 9 $171,722 11 $228,185 0 No data
Peace Region 0 0 No data 0 No data 0 no data 0 no data 0 no data 0 no data 0 no data 0 No data
Fort McMurray 0 0 No data 0 No data 0 no data 0 no data 0 no data 0 no data 0 no data 0 No data
Lakeland 0 0 No data 0 No data 0 no data 0 no data 0 no data 0 no data 0 no data 0 No data
Vermillion River 0 0 No data 0 No data 0 no data 0 no data 0 no data 0 no data 0 no data 0 No data
Yellowhead 0 0 No data 0 No data 0 no data 0 no data 0 no data 0 no data 0 no data 0 No data
Central Alberta 0 0 No data 0 No data 0 no data 0 no data 0 no data 0 no data 0 no data 0 No data
Medicine Hat 0 0 No data 0 No data 0 no data 0 no data 0 no data 0 no data 0 no data 0 No data
Lethbridge 0 0 No data 0 No data 0 no data 0 no data 0 no data 0 no data 0 no data 0 No data
Undeclared 0 0 No data 0 No data 0 no data 0 no data 0 no data 0 no data 0 no data 0 No data
Total 54 0 0 4 19 11 9 11 0
$50,613 $68,936 $83,010 $100,094 $123,818 $161,750 $195,740 $230,971All Industry Average Salary
APEGA Branch
Regions
Total #
Undeclared
Geoscientists
Responsibility Category
A- A B C D E F F+
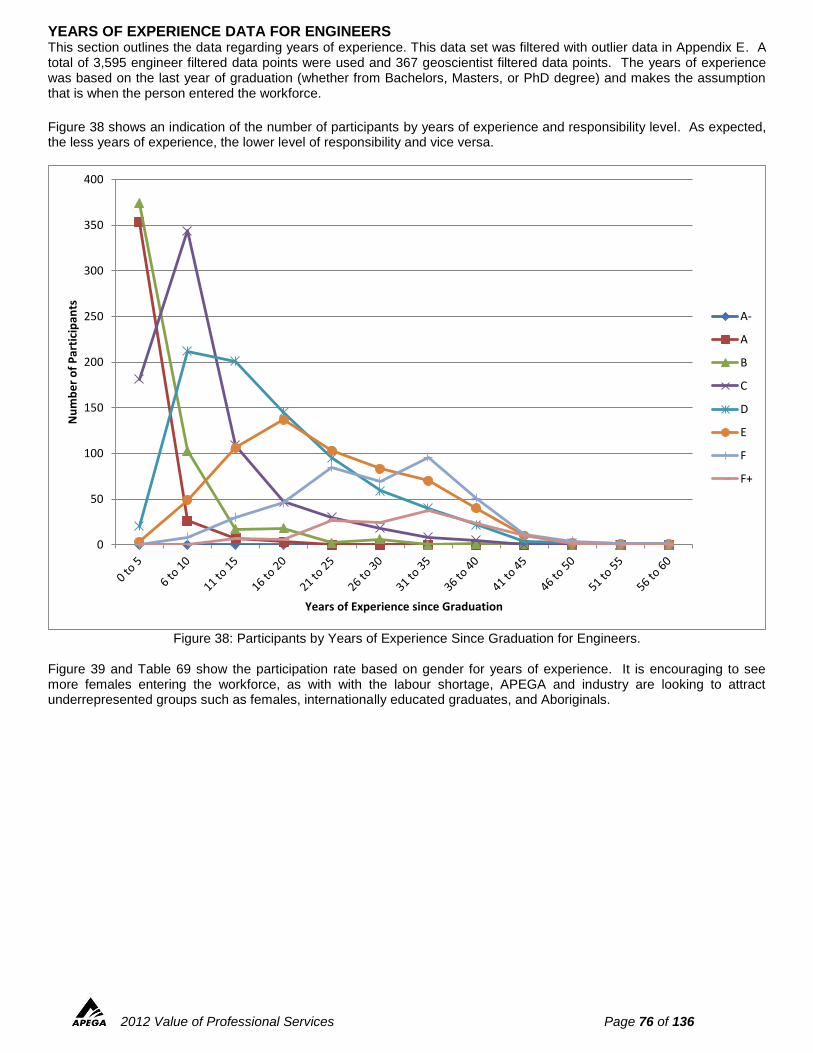
2012 Value of Professional Services Page 76 of 136
YEARS OF EXPERIENCE DATA FOR ENGINEERS This section outlines the data regarding years of experience. This data set was filtered with outlier data in Appendix E. A total of 3,595 engineer filtered data points were used and 367 geoscientist filtered data points. The years of experience was based on the last year of graduation (whether from Bachelors, Masters, or PhD degree) and makes the assumption that is when the person entered the workforce.
Figure 38 shows an indication of the number of participants by years of experience and responsibility level. As expected, the less years of experience, the lower level of responsibility and vice versa.
Figure 38: Participants by Years of Experience Since Graduation for Engineers.
Figure 39 and Table 69 show the participation rate based on gender for years of experience. It is encouraging to see more females entering the workforce, as with with the labour shortage, APEGA and industry are looking to attract underrepresented groups such as females, internationally educated graduates, and Aboriginals.
0
50
100
150
200
250
300
350
400
Nu
mb
er
of
Par
tici
pan
ts
Years of Experience since Graduation
A-
A
B
C
D
E
F
F+
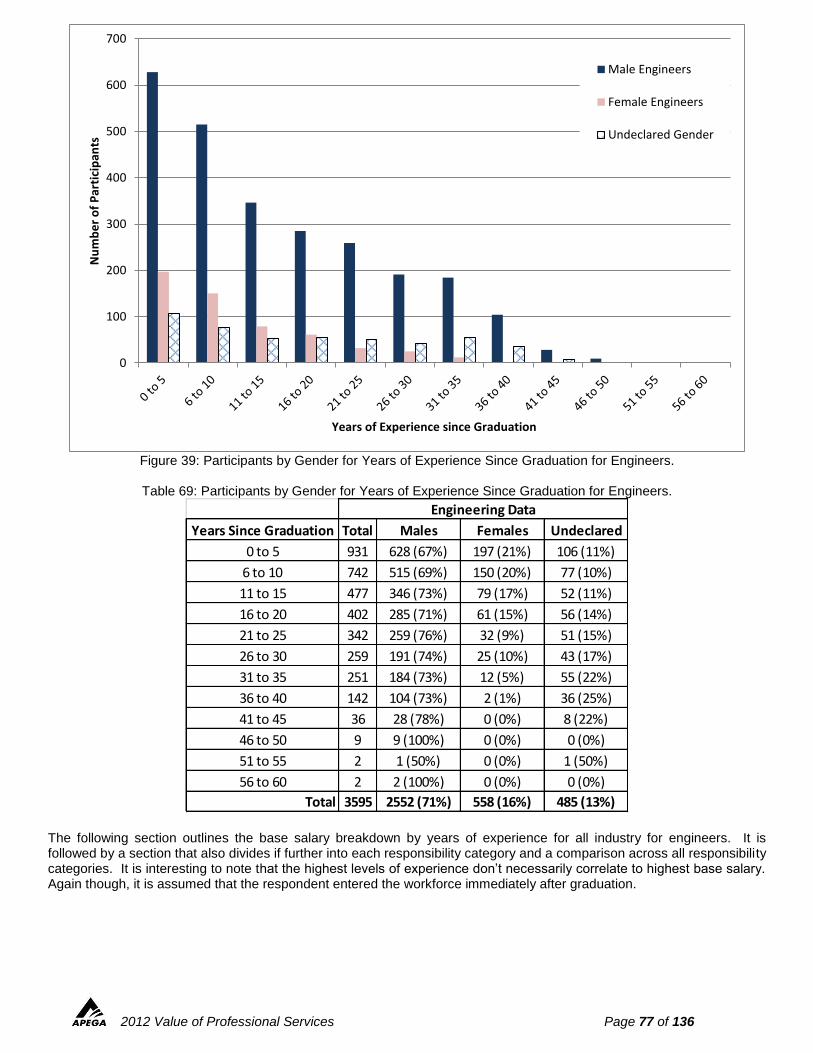
2012 Value of Professional Services Page 77 of 136
Figure 39: Participants by Gender for Years of Experience Since Graduation for Engineers.
Table 69: Participants by Gender for Years of Experience Since Graduation for Engineers.
The following section outlines the base salary breakdown by years of experience for all industry for engineers. It is followed by a section that also divides if further into each responsibility category and a comparison across all responsibility categories. It is interesting to note that the highest levels of experience don’t necessarily correlate to highest base salary. Again though, it is assumed that the respondent entered the workforce immediately after graduation.
0
100
200
300
400
500
600
700
Nu
mb
er
of
Par
tici
pan
ts
Years of Experience since Graduation
Male Engineers
Female Engineers
Undeclared Gender
Years Since Graduation Total Males Females Undeclared
0 to 5 931 628 (67%) 197 (21%) 106 (11%)
6 to 10 742 515 (69%) 150 (20%) 77 (10%)
11 to 15 477 346 (73%) 79 (17%) 52 (11%)
16 to 20 402 285 (71%) 61 (15%) 56 (14%)
21 to 25 342 259 (76%) 32 (9%) 51 (15%)
26 to 30 259 191 (74%) 25 (10%) 43 (17%)
31 to 35 251 184 (73%) 12 (5%) 55 (22%)
36 to 40 142 104 (73%) 2 (1%) 36 (25%)
41 to 45 36 28 (78%) 0 (0%) 8 (22%)
46 to 50 9 9 (100%) 0 (0%) 0 (0%)
51 to 55 2 1 (50%) 0 (0%) 1 (50%)
56 to 60 2 2 (100%) 0 (0%) 0 (0%)
Total 3595 2552 (71%) 558 (16%) 485 (13%)
Engineering Data
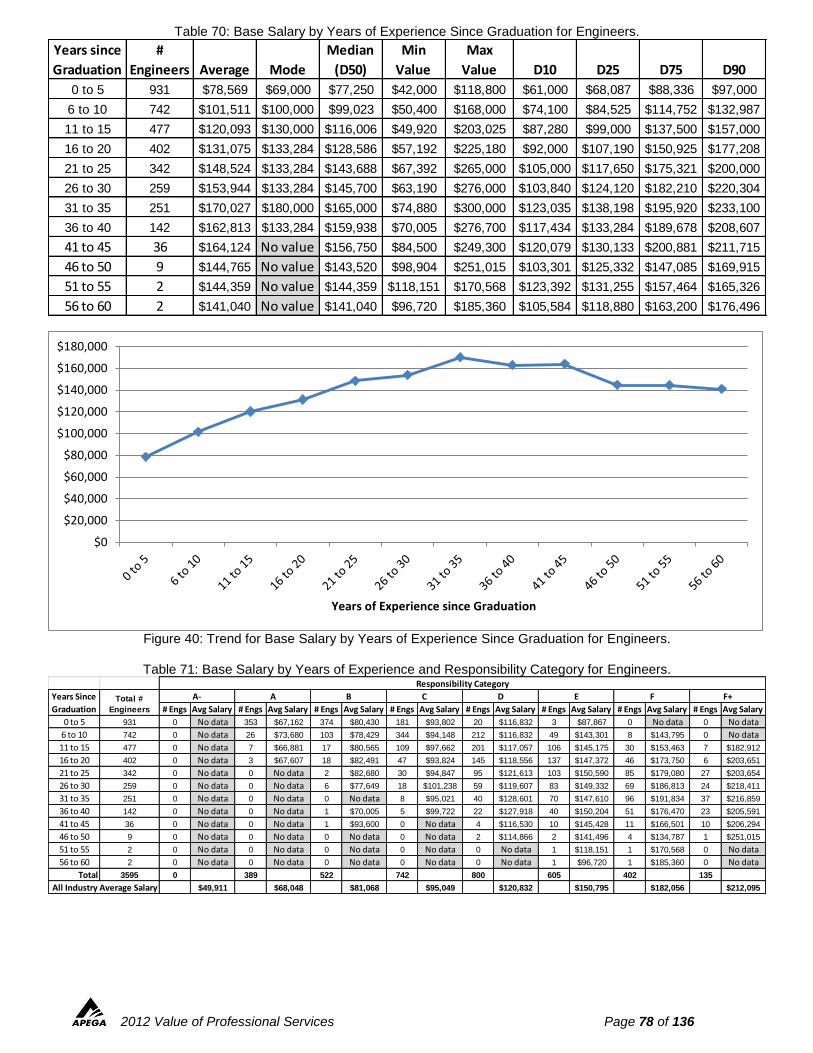
2012 Value of Professional Services Page 78 of 136
Table 70: Base Salary by Years of Experience Since Graduation for Engineers.
Figure 40: Trend for Base Salary by Years of Experience Since Graduation for Engineers.
Table 71: Base Salary by Years of Experience and Responsibility Category for Engineers.
Years since
Graduation
#
Engineers Average Mode
Median
(D50)
Min
Value
Max
Value D10 D25 D75 D90
0 to 5 931 $78,569 $69,000 $77,250 $42,000 $118,800 $61,000 $68,087 $88,336 $97,000
6 to 10 742 $101,511 $100,000 $99,023 $50,400 $168,000 $74,100 $84,525 $114,752 $132,987
11 to 15 477 $120,093 $130,000 $116,006 $49,920 $203,025 $87,280 $99,000 $137,500 $157,000
16 to 20 402 $131,075 $133,284 $128,586 $57,192 $225,180 $92,000 $107,190 $150,925 $177,208
21 to 25 342 $148,524 $133,284 $143,688 $67,392 $265,000 $105,000 $117,650 $175,321 $200,000
26 to 30 259 $153,944 $133,284 $145,700 $63,190 $276,000 $103,840 $124,120 $182,210 $220,304
31 to 35 251 $170,027 $180,000 $165,000 $74,880 $300,000 $123,035 $138,198 $195,920 $233,100
36 to 40 142 $162,813 $133,284 $159,938 $70,005 $276,700 $117,434 $133,284 $189,678 $208,607
41 to 45 36 $164,124 No value $156,750 $84,500 $249,300 $120,079 $130,133 $200,881 $211,715
46 to 50 9 $144,765 No value $143,520 $98,904 $251,015 $103,301 $125,332 $147,085 $169,915
51 to 55 2 $144,359 No value $144,359 $118,151 $170,568 $123,392 $131,255 $157,464 $165,326
56 to 60 2 $141,040 No value $141,040 $96,720 $185,360 $105,584 $118,880 $163,200 $176,496
$0
$20,000
$40,000
$60,000
$80,000
$100,000
$120,000
$140,000
$160,000
$180,000
Years of Experience since Graduation
# Engs Avg Salary # Engs Avg Salary # Engs Avg Salary # Engs Avg Salary # Engs Avg Salary # Engs Avg Salary # Engs Avg Salary # Engs Avg Salary
0 to 5 931 0 No data 353 $67,162 374 $80,430 181 $93,802 20 $116,832 3 $87,867 0 No data 0 No data
6 to 10 742 0 No data 26 $73,680 103 $78,429 344 $94,148 212 $116,832 49 $143,301 8 $143,795 0 No data
11 to 15 477 0 No data 7 $66,881 17 $80,565 109 $97,662 201 $117,057 106 $145,175 30 $153,463 7 $182,912
16 to 20 402 0 No data 3 $67,607 18 $82,491 47 $93,824 145 $118,556 137 $147,372 46 $173,750 6 $203,651
21 to 25 342 0 No data 0 No data 2 $82,680 30 $94,847 95 $121,613 103 $150,590 85 $179,080 27 $203,654
26 to 30 259 0 No data 0 No data 6 $77,649 18 $101,238 59 $119,607 83 $149,332 69 $186,813 24 $218,411
31 to 35 251 0 No data 0 No data 0 No data 8 $95,021 40 $128,601 70 $147,610 96 $191,834 37 $216,859
36 to 40 142 0 No data 0 No data 1 $70,005 5 $99,722 22 $127,918 40 $150,204 51 $176,470 23 $205,591
41 to 45 36 0 No data 0 No data 1 $93,600 0 No data 4 $116,530 10 $145,428 11 $166,501 10 $206,294
46 to 50 9 0 No data 0 No data 0 No data 0 No data 2 $114,866 2 $141,496 4 $134,787 1 $251,015
51 to 55 2 0 No data 0 No data 0 No data 0 No data 0 No data 1 $118,151 1 $170,568 0 No data
56 to 60 2 0 No data 0 No data 0 No data 0 No data 0 No data 1 $96,720 1 $185,360 0 No data
Total 3595 0 389 522 742 800 605 402 135
$49,911 $68,048 $81,068 $95,049 $120,832 $150,795 $182,056 $212,095
Years Since
Graduation
All Industry Average Salary
Responsibility Category
Total #
Engineers
A- A B C D E F F+
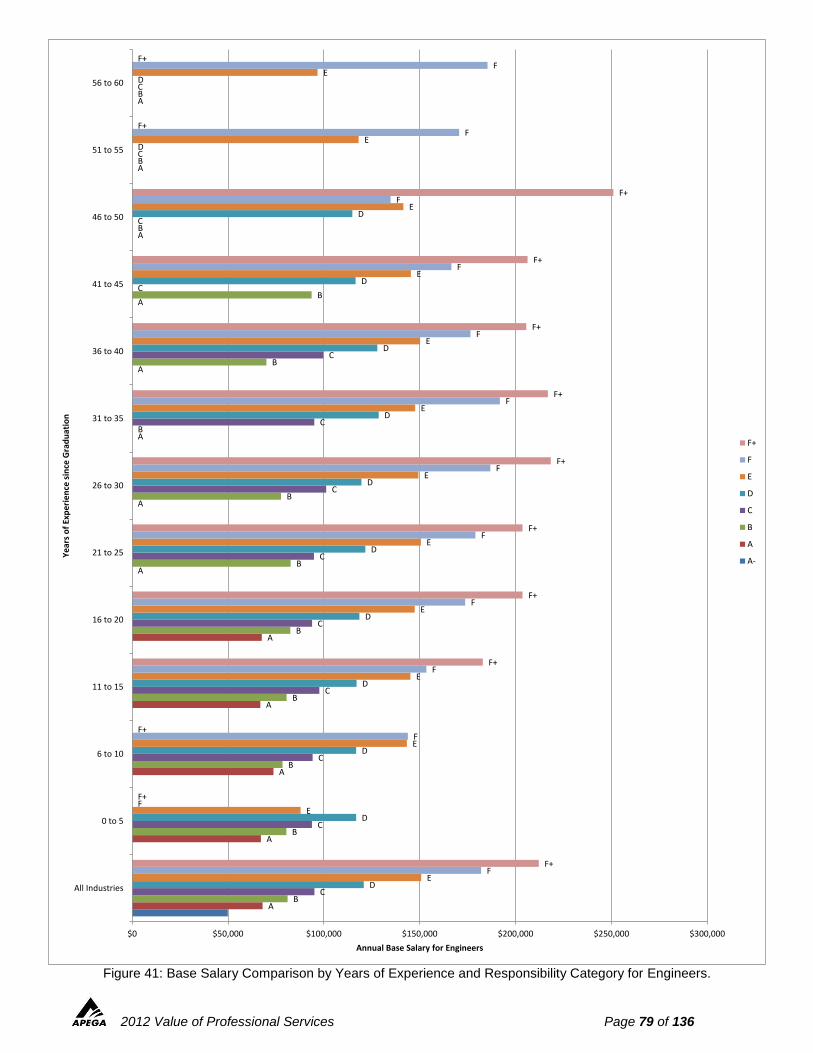
2012 Value of Professional Services Page 79 of 136
Figure 41: Base Salary Comparison by Years of Experience and Responsibility Category for Engineers.
A
A
A
A
A
A
A
A
A
A
A
A
A
B
B
B
B
B
B
B
B
B
B
B
B
B
C
C
C
C
C
C
C
C
C
C
C
C
C
D
D
D
D
D
D
D
D
D
D
D
D
D
E
E
E
E
E
E
E
E
E
E
E
E
E
F
F
F
F
F
F
F
F
F
F
F
F
F
F+
F+
F+
F+
F+
F+
F+
F+
F+
F+
F+
F+
F+
$0 $50,000 $100,000 $150,000 $200,000 $250,000 $300,000
All Industries
0 to 5
6 to 10
11 to 15
16 to 20
21 to 25
26 to 30
31 to 35
36 to 40
41 to 45
46 to 50
51 to 55
56 to 60
Annual Base Salary for Engineers
Ye
ars
of
Exp
eri
en
ce s
ince
Gra
du
atio
n
F+
F
E
D
C
B
A
A-
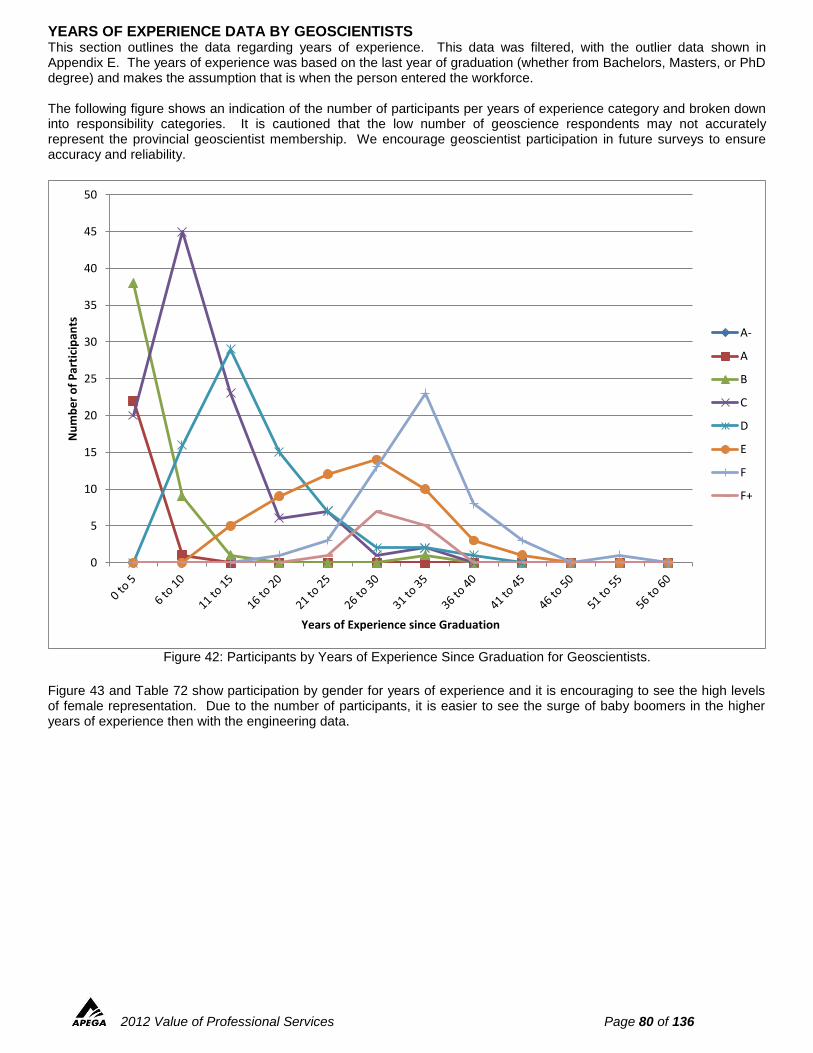
2012 Value of Professional Services Page 80 of 136
YEARS OF EXPERIENCE DATA BY GEOSCIENTISTS This section outlines the data regarding years of experience. This data was filtered, with the outlier data shown in Appendix E. The years of experience was based on the last year of graduation (whether from Bachelors, Masters, or PhD degree) and makes the assumption that is when the person entered the workforce. The following figure shows an indication of the number of participants per years of experience category and broken down into responsibility categories. It is cautioned that the low number of geoscience respondents may not accurately represent the provincial geoscientist membership. We encourage geoscientist participation in future surveys to ensure accuracy and reliability.
Figure 42: Participants by Years of Experience Since Graduation for Geoscientists.
Figure 43 and Table 72 show participation by gender for years of experience and it is encouraging to see the high levels of female representation. Due to the number of participants, it is easier to see the surge of baby boomers in the higher years of experience then with the engineering data.
0
5
10
15
20
25
30
35
40
45
50
Nu
mb
er
of
Par
tici
pan
ts
Years of Experience since Graduation
A-
A
B
C
D
E
F
F+
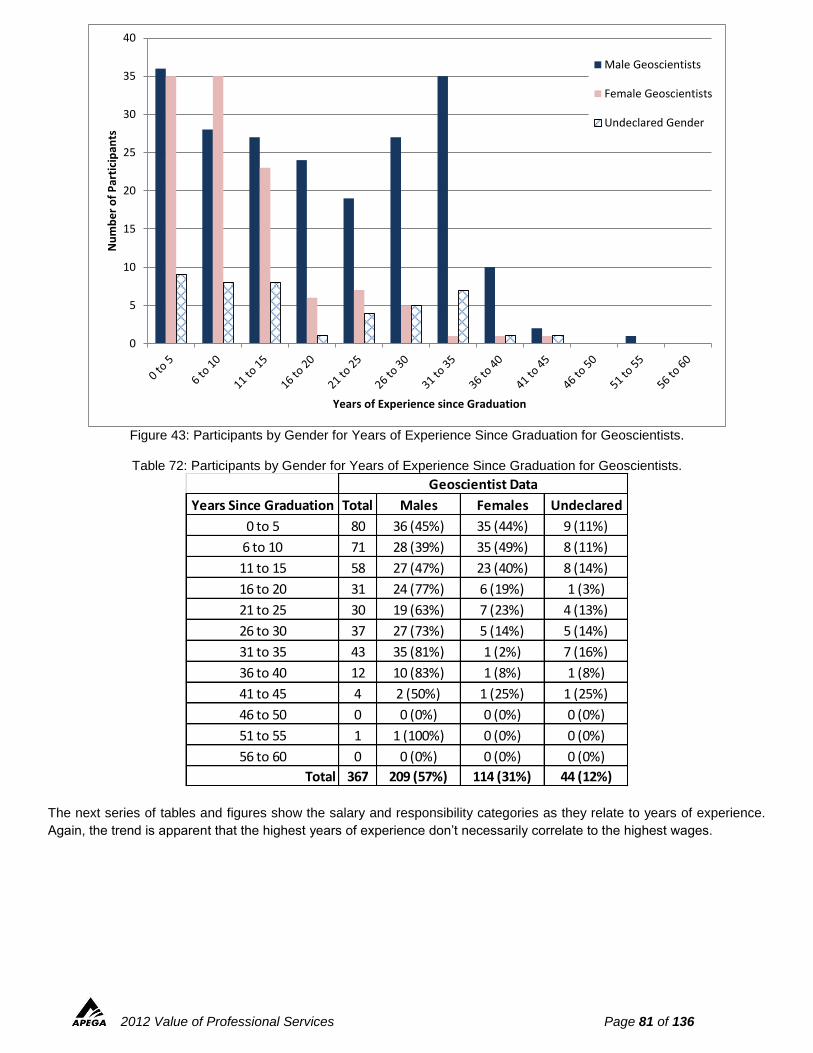
2012 Value of Professional Services Page 81 of 136
Figure 43: Participants by Gender for Years of Experience Since Graduation for Geoscientists.
Table 72: Participants by Gender for Years of Experience Since Graduation for Geoscientists.
The next series of tables and figures show the salary and responsibility categories as they relate to years of experience.
Again, the trend is apparent that the highest years of experience don’t necessarily correlate to the highest wages.
0
5
10
15
20
25
30
35
40
Nu
mb
er
of
Par
tici
pan
ts
Years of Experience since Graduation
Male Geoscientists
Female Geoscientists
Undeclared Gender
Years Since Graduation Total Males Females Undeclared
0 to 5 80 36 (45%) 35 (44%) 9 (11%)
6 to 10 71 28 (39%) 35 (49%) 8 (11%)
11 to 15 58 27 (47%) 23 (40%) 8 (14%)
16 to 20 31 24 (77%) 6 (19%) 1 (3%)
21 to 25 30 19 (63%) 7 (23%) 4 (13%)
26 to 30 37 27 (73%) 5 (14%) 5 (14%)
31 to 35 43 35 (81%) 1 (2%) 7 (16%)
36 to 40 12 10 (83%) 1 (8%) 1 (8%)
41 to 45 4 2 (50%) 1 (25%) 1 (25%)
46 to 50 0 0 (0%) 0 (0%) 0 (0%)
51 to 55 1 1 (100%) 0 (0%) 0 (0%)
56 to 60 0 0 (0%) 0 (0%) 0 (0%)
Total 367 209 (57%) 114 (31%) 44 (12%)
Geoscientist Data
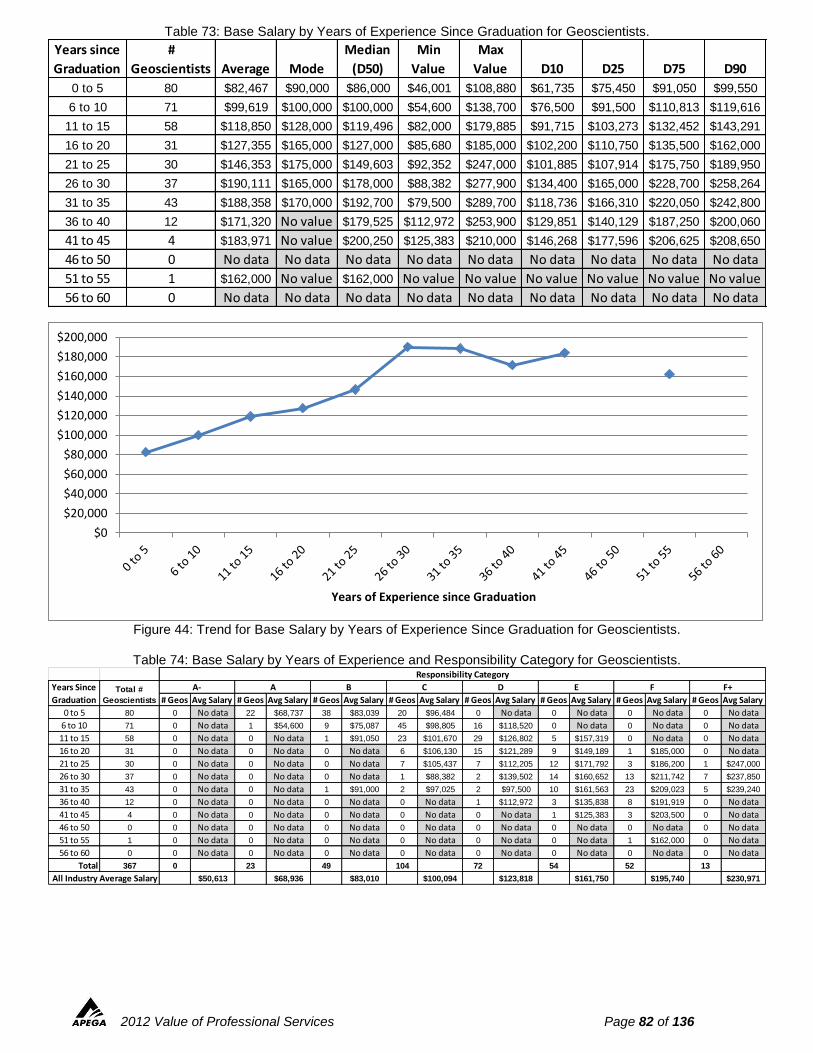
2012 Value of Professional Services Page 82 of 136
Table 73: Base Salary by Years of Experience Since Graduation for Geoscientists.
Figure 44: Trend for Base Salary by Years of Experience Since Graduation for Geoscientists.
Table 74: Base Salary by Years of Experience and Responsibility Category for Geoscientists.
Years since
Graduation
#
Geoscientists Average Mode
Median
(D50)
Min
Value
Max
Value D10 D25 D75 D90
0 to 5 80 $82,467 $90,000 $86,000 $46,001 $108,880 $61,735 $75,450 $91,050 $99,550
6 to 10 71 $99,619 $100,000 $100,000 $54,600 $138,700 $76,500 $91,500 $110,813 $119,616
11 to 15 58 $118,850 $128,000 $119,496 $82,000 $179,885 $91,715 $103,273 $132,452 $143,291
16 to 20 31 $127,355 $165,000 $127,000 $85,680 $185,000 $102,200 $110,750 $135,500 $162,000
21 to 25 30 $146,353 $175,000 $149,603 $92,352 $247,000 $101,885 $107,914 $175,750 $189,950
26 to 30 37 $190,111 $165,000 $178,000 $88,382 $277,900 $134,400 $165,000 $228,700 $258,264
31 to 35 43 $188,358 $170,000 $192,700 $79,500 $289,700 $118,736 $166,310 $220,050 $242,800
36 to 40 12 $171,320 No value $179,525 $112,972 $253,900 $129,851 $140,129 $187,250 $200,060
41 to 45 4 $183,971 No value $200,250 $125,383 $210,000 $146,268 $177,596 $206,625 $208,650
46 to 50 0 No data No data No data No data No data No data No data No data No data
51 to 55 1 $162,000 No value $162,000 No value No value No value No value No value No value
56 to 60 0 No data No data No data No data No data No data No data No data No data
$0
$20,000
$40,000
$60,000
$80,000
$100,000
$120,000
$140,000
$160,000
$180,000
$200,000
Years of Experience since Graduation
# Geos Avg Salary # Geos Avg Salary # Geos Avg Salary # Geos Avg Salary # Geos Avg Salary # Geos Avg Salary # Geos Avg Salary # Geos Avg Salary
0 to 5 80 0 No data 22 $68,737 38 $83,039 20 $96,484 0 No data 0 No data 0 No data 0 No data
6 to 10 71 0 No data 1 $54,600 9 $75,087 45 $98,805 16 $118,520 0 No data 0 No data 0 No data
11 to 15 58 0 No data 0 No data 1 $91,050 23 $101,670 29 $126,802 5 $157,319 0 No data 0 No data
16 to 20 31 0 No data 0 No data 0 No data 6 $106,130 15 $121,289 9 $149,189 1 $185,000 0 No data
21 to 25 30 0 No data 0 No data 0 No data 7 $105,437 7 $112,205 12 $171,792 3 $186,200 1 $247,000
26 to 30 37 0 No data 0 No data 0 No data 1 $88,382 2 $139,502 14 $160,652 13 $211,742 7 $237,850
31 to 35 43 0 No data 0 No data 1 $91,000 2 $97,025 2 $97,500 10 $161,563 23 $209,023 5 $239,240
36 to 40 12 0 No data 0 No data 0 No data 0 No data 1 $112,972 3 $135,838 8 $191,919 0 No data
41 to 45 4 0 No data 0 No data 0 No data 0 No data 0 No data 1 $125,383 3 $203,500 0 No data
46 to 50 0 0 No data 0 No data 0 No data 0 No data 0 No data 0 No data 0 No data 0 No data
51 to 55 1 0 No data 0 No data 0 No data 0 No data 0 No data 0 No data 1 $162,000 0 No data
56 to 60 0 0 No data 0 No data 0 No data 0 No data 0 No data 0 No data 0 No data 0 No data
Total 367 0 23 49 104 72 54 52 13
$50,613 $68,936 $83,010 $100,094 $123,818 $161,750 $195,740 $230,971
Years Since
Graduation
All Industry Average Salary
F+
Responsibility Category
Total #
Geoscientists
A- A B C D E F
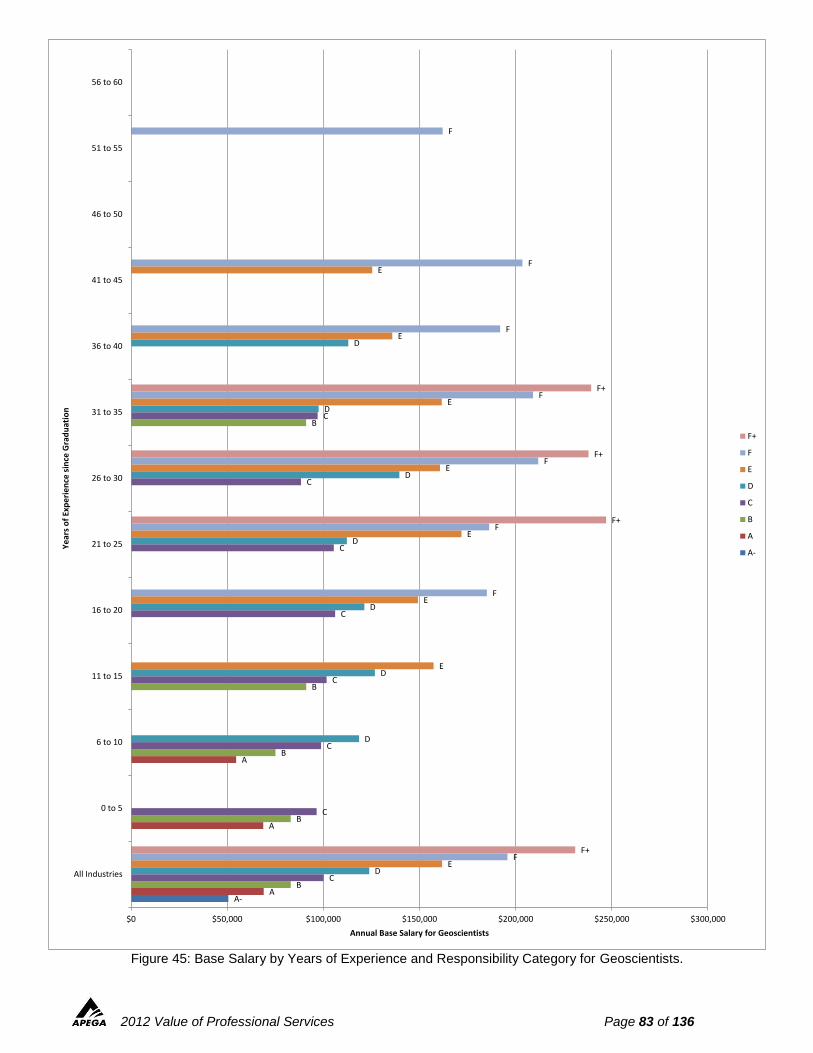
2012 Value of Professional Services Page 83 of 136
Figure 45: Base Salary by Years of Experience and Responsibility Category for Geoscientists.
A-A
A
A
B
B
B
B
B
C
C
C
C
C
C
C
C
D
D
D
D
D
D
D
D
E
E
E
E
E
E
E
E
F
F
F
F
F
F
F
F
F+
F+
F+
F+
$0 $50,000 $100,000 $150,000 $200,000 $250,000 $300,000
All Industries
0 to 5
6 to 10
11 to 15
16 to 20
21 to 25
26 to 30
31 to 35
36 to 40
41 to 45
46 to 50
51 to 55
56 to 60
Annual Base Salary for Geoscientists
Ye
ars
of
Exp
eri
en
ce s
ince
Gra
du
atio
n
F+
F
E
D
C
B
A
A-
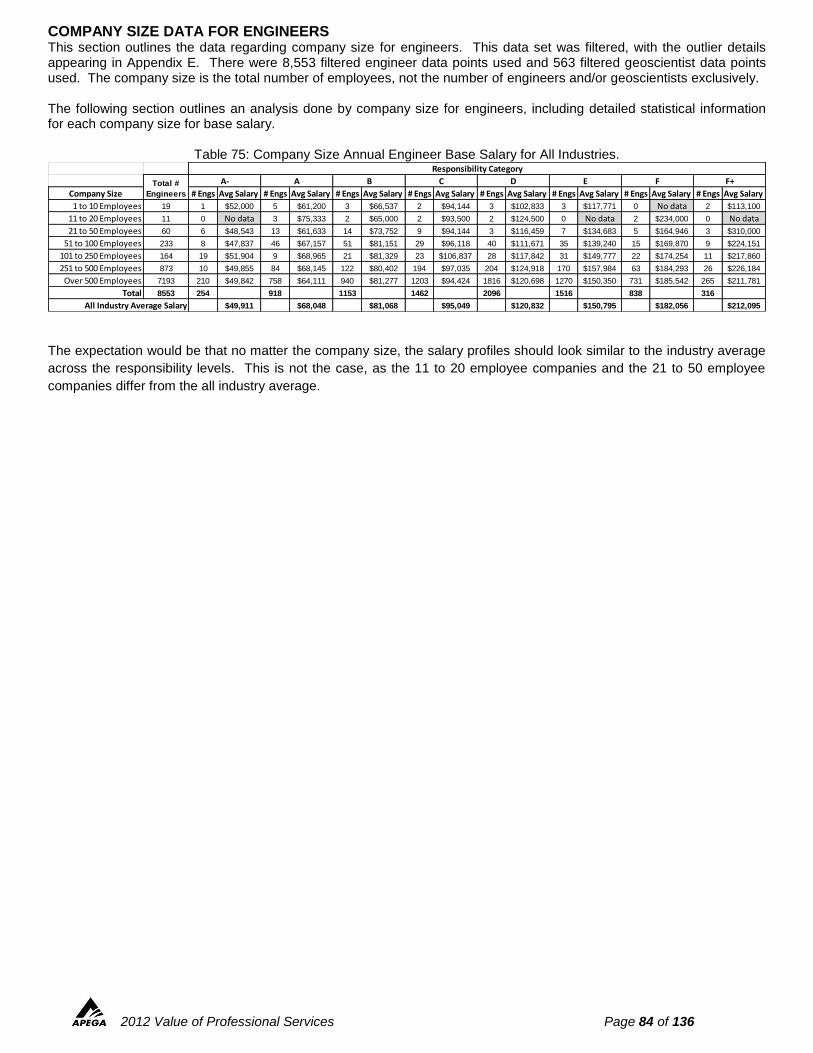
2012 Value of Professional Services Page 84 of 136
COMPANY SIZE DATA FOR ENGINEERS This section outlines the data regarding company size for engineers. This data set was filtered, with the outlier details appearing in Appendix E. There were 8,553 filtered engineer data points used and 563 filtered geoscientist data points used. The company size is the total number of employees, not the number of engineers and/or geoscientists exclusively. The following section outlines an analysis done by company size for engineers, including detailed statistical information for each company size for base salary.
Table 75: Company Size Annual Engineer Base Salary for All Industries.
The expectation would be that no matter the company size, the salary profiles should look similar to the industry average
across the responsibility levels. This is not the case, as the 11 to 20 employee companies and the 21 to 50 employee
companies differ from the all industry average.
Company Size # Engs Avg Salary # Engs Avg Salary # Engs Avg Salary # Engs Avg Salary # Engs Avg Salary # Engs Avg Salary # Engs Avg Salary # Engs Avg Salary
1 to 10 Employees 19 1 $52,000 5 $61,200 3 $66,537 2 $94,144 3 $102,833 3 $117,771 0 No data 2 $113,100
11 to 20 Employees 11 0 No data 3 $75,333 2 $65,000 2 $93,500 2 $124,500 0 No data 2 $234,000 0 No data
21 to 50 Employees 60 6 $48,543 13 $61,633 14 $73,752 9 $94,144 3 $116,459 7 $134,683 5 $164,946 3 $310,000
51 to 100 Employees 233 8 $47,837 46 $67,157 51 $81,151 29 $96,118 40 $111,671 35 $139,240 15 $169,870 9 $224,151
101 to 250 Employees 164 19 $51,904 9 $68,965 21 $81,329 23 $106,837 28 $117,842 31 $149,777 22 $174,254 11 $217,860
251 to 500 Employees 873 10 $49,855 84 $68,145 122 $80,402 194 $97,035 204 $124,918 170 $157,984 63 $184,293 26 $226,184
Over 500 Employees 7193 210 $49,842 758 $64,111 940 $81,277 1203 $94,424 1816 $120,698 1270 $150,350 731 $185,542 265 $211,781
Total 8553 254 918 1153 1462 2096 1516 838 316
$49,911 $68,048 $81,068 $95,049 $120,832 $150,795 $182,056 $212,095
Responsibility Category
Total #
Engineers
A- A B C D E
All Industry Average Salary
F F+
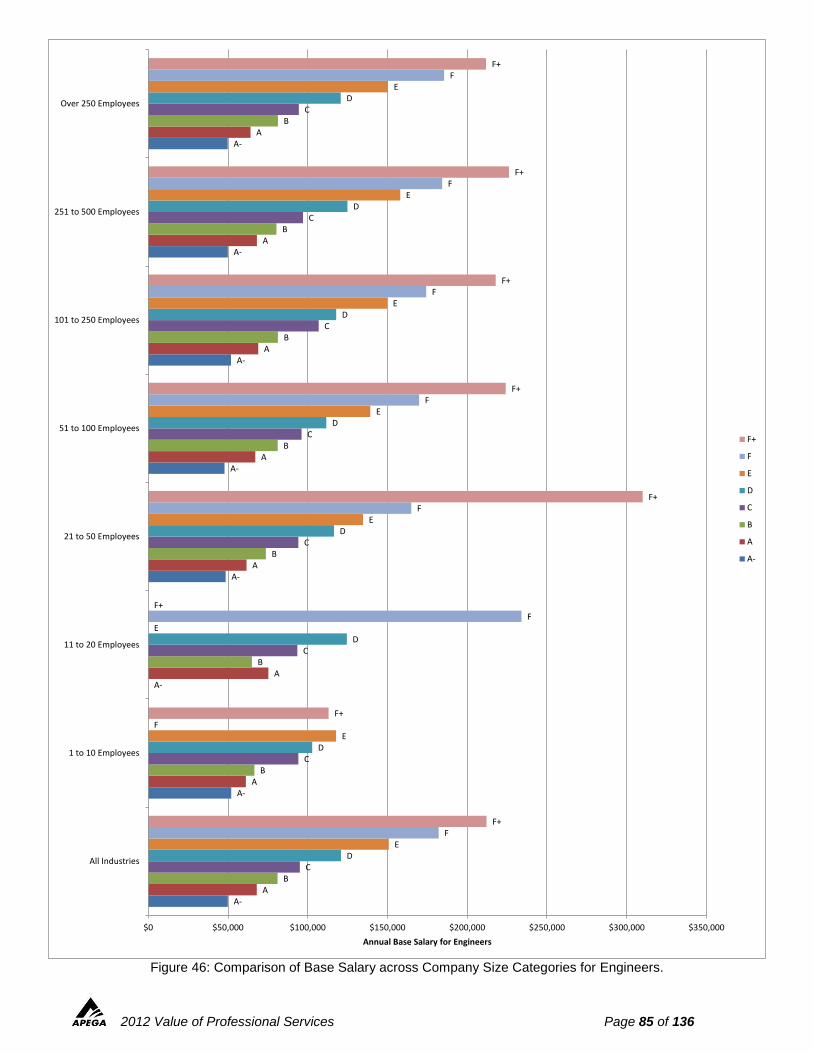
2012 Value of Professional Services Page 85 of 136
Figure 46: Comparison of Base Salary across Company Size Categories for Engineers.
A-
A-
A-
A-
A-
A-
A-
A-
A
A
A
A
A
A
A
A
B
B
B
B
B
B
B
B
C
C
C
C
C
C
C
C
D
D
D
D
D
D
D
D
E
E
E
E
E
E
E
E
F
F
F
F
F
F
F
F
F+
F+
F+
F+
F+
F+
F+
F+
$0 $50,000 $100,000 $150,000 $200,000 $250,000 $300,000 $350,000
All Industries
1 to 10 Employees
11 to 20 Employees
21 to 50 Employees
51 to 100 Employees
101 to 250 Employees
251 to 500 Employees
Over 250 Employees
Annual Base Salary for Engineers
F+
F
E
D
C
B
A
A-
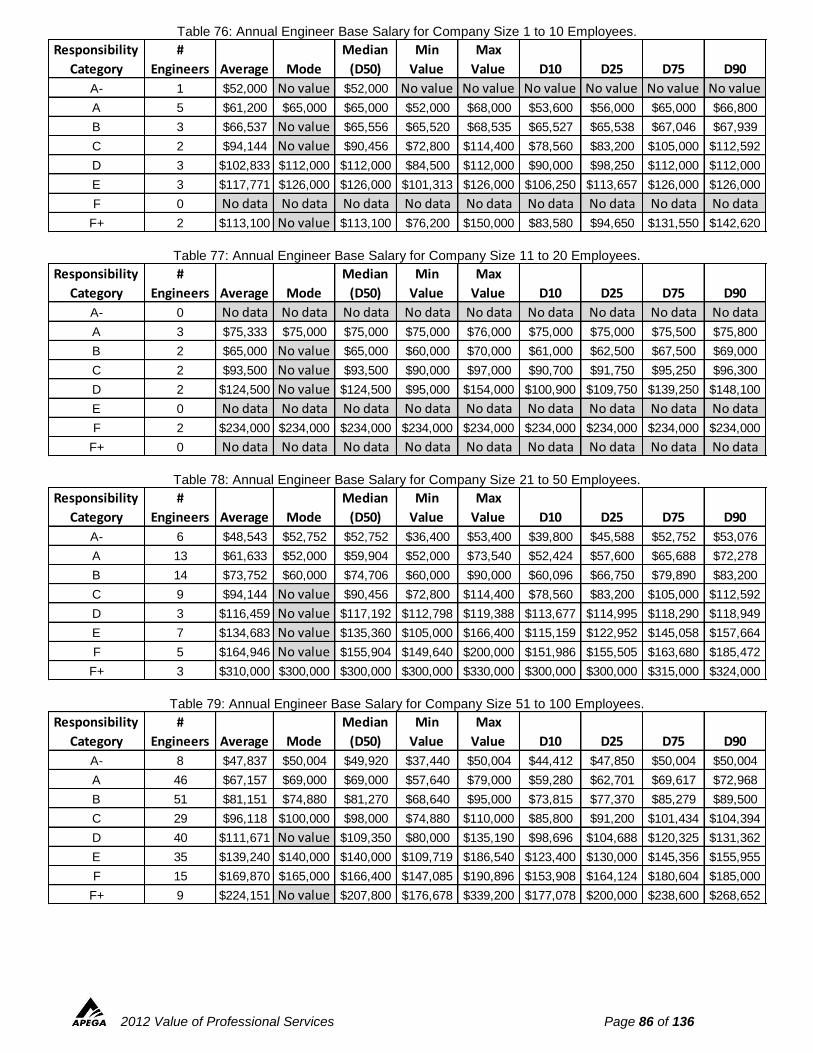
2012 Value of Professional Services Page 86 of 136
Table 76: Annual Engineer Base Salary for Company Size 1 to 10 Employees.
Table 77: Annual Engineer Base Salary for Company Size 11 to 20 Employees.
Table 78: Annual Engineer Base Salary for Company Size 21 to 50 Employees.
Table 79: Annual Engineer Base Salary for Company Size 51 to 100 Employees.
Responsibility
Category
#
Engineers Average Mode
Median
(D50)
Min
Value
Max
Value D10 D25 D75 D90
A- 1 $52,000 No value $52,000 No value No value No value No value No value No value
A 5 $61,200 $65,000 $65,000 $52,000 $68,000 $53,600 $56,000 $65,000 $66,800
B 3 $66,537 No value $65,556 $65,520 $68,535 $65,527 $65,538 $67,046 $67,939
C 2 $94,144 No value $90,456 $72,800 $114,400 $78,560 $83,200 $105,000 $112,592
D 3 $102,833 $112,000 $112,000 $84,500 $112,000 $90,000 $98,250 $112,000 $112,000
E 3 $117,771 $126,000 $126,000 $101,313 $126,000 $106,250 $113,657 $126,000 $126,000
F 0 No data No data No data No data No data No data No data No data No data
F+ 2 $113,100 No value $113,100 $76,200 $150,000 $83,580 $94,650 $131,550 $142,620
Responsibility
Category
#
Engineers Average Mode
Median
(D50)
Min
Value
Max
Value D10 D25 D75 D90
A- 0 No data No data No data No data No data No data No data No data No data
A 3 $75,333 $75,000 $75,000 $75,000 $76,000 $75,000 $75,000 $75,500 $75,800
B 2 $65,000 No value $65,000 $60,000 $70,000 $61,000 $62,500 $67,500 $69,000
C 2 $93,500 No value $93,500 $90,000 $97,000 $90,700 $91,750 $95,250 $96,300
D 2 $124,500 No value $124,500 $95,000 $154,000 $100,900 $109,750 $139,250 $148,100
E 0 No data No data No data No data No data No data No data No data No data
F 2 $234,000 $234,000 $234,000 $234,000 $234,000 $234,000 $234,000 $234,000 $234,000
F+ 0 No data No data No data No data No data No data No data No data No data
Responsibility
Category
#
Engineers Average Mode
Median
(D50)
Min
Value
Max
Value D10 D25 D75 D90
A- 6 $48,543 $52,752 $52,752 $36,400 $53,400 $39,800 $45,588 $52,752 $53,076
A 13 $61,633 $52,000 $59,904 $52,000 $73,540 $52,424 $57,600 $65,688 $72,278
B 14 $73,752 $60,000 $74,706 $60,000 $90,000 $60,096 $66,750 $79,890 $83,200
C 9 $94,144 No value $90,456 $72,800 $114,400 $78,560 $83,200 $105,000 $112,592
D 3 $116,459 No value $117,192 $112,798 $119,388 $113,677 $114,995 $118,290 $118,949
E 7 $134,683 No value $135,360 $105,000 $166,400 $115,159 $122,952 $145,058 $157,664
F 5 $164,946 No value $155,904 $149,640 $200,000 $151,986 $155,505 $163,680 $185,472
F+ 3 $310,000 $300,000 $300,000 $300,000 $330,000 $300,000 $300,000 $315,000 $324,000
Responsibility
Category
#
Engineers Average Mode
Median
(D50)
Min
Value
Max
Value D10 D25 D75 D90
A- 8 $47,837 $50,004 $49,920 $37,440 $50,004 $44,412 $47,850 $50,004 $50,004
A 46 $67,157 $69,000 $69,000 $57,640 $79,000 $59,280 $62,701 $69,617 $72,968
B 51 $81,151 $74,880 $81,270 $68,640 $95,000 $73,815 $77,370 $85,279 $89,500
C 29 $96,118 $100,000 $98,000 $74,880 $110,000 $85,800 $91,200 $101,434 $104,394
D 40 $111,671 No value $109,350 $80,000 $135,190 $98,696 $104,688 $120,325 $131,362
E 35 $139,240 $140,000 $140,000 $109,719 $186,540 $123,400 $130,000 $145,356 $155,955
F 15 $169,870 $165,000 $166,400 $147,085 $190,896 $153,908 $164,124 $180,604 $185,000
F+ 9 $224,151 No value $207,800 $176,678 $339,200 $177,078 $200,000 $238,600 $268,652
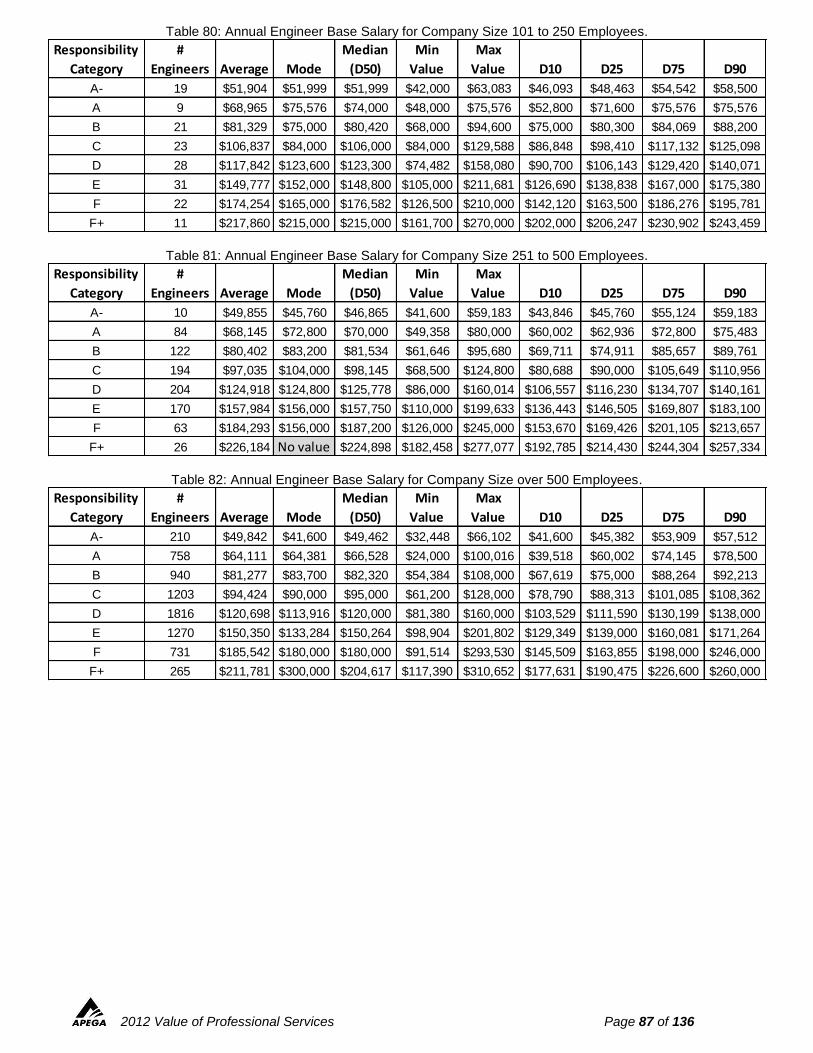
2012 Value of Professional Services Page 87 of 136
Table 80: Annual Engineer Base Salary for Company Size 101 to 250 Employees.
Table 81: Annual Engineer Base Salary for Company Size 251 to 500 Employees.
Table 82: Annual Engineer Base Salary for Company Size over 500 Employees.
Responsibility
Category
#
Engineers Average Mode
Median
(D50)
Min
Value
Max
Value D10 D25 D75 D90
A- 19 $51,904 $51,999 $51,999 $42,000 $63,083 $46,093 $48,463 $54,542 $58,500
A 9 $68,965 $75,576 $74,000 $48,000 $75,576 $52,800 $71,600 $75,576 $75,576
B 21 $81,329 $75,000 $80,420 $68,000 $94,600 $75,000 $80,300 $84,069 $88,200
C 23 $106,837 $84,000 $106,000 $84,000 $129,588 $86,848 $98,410 $117,132 $125,098
D 28 $117,842 $123,600 $123,300 $74,482 $158,080 $90,700 $106,143 $129,420 $140,071
E 31 $149,777 $152,000 $148,800 $105,000 $211,681 $126,690 $138,838 $167,000 $175,380
F 22 $174,254 $165,000 $176,582 $126,500 $210,000 $142,120 $163,500 $186,276 $195,781
F+ 11 $217,860 $215,000 $215,000 $161,700 $270,000 $202,000 $206,247 $230,902 $243,459
Responsibility
Category
#
Engineers Average Mode
Median
(D50)
Min
Value
Max
Value D10 D25 D75 D90
A- 10 $49,855 $45,760 $46,865 $41,600 $59,183 $43,846 $45,760 $55,124 $59,183
A 84 $68,145 $72,800 $70,000 $49,358 $80,000 $60,002 $62,936 $72,800 $75,483
B 122 $80,402 $83,200 $81,534 $61,646 $95,680 $69,711 $74,911 $85,657 $89,761
C 194 $97,035 $104,000 $98,145 $68,500 $124,800 $80,688 $90,000 $105,649 $110,956
D 204 $124,918 $124,800 $125,778 $86,000 $160,014 $106,557 $116,230 $134,707 $140,161
E 170 $157,984 $156,000 $157,750 $110,000 $199,633 $136,443 $146,505 $169,807 $183,100
F 63 $184,293 $156,000 $187,200 $126,000 $245,000 $153,670 $169,426 $201,105 $213,657
F+ 26 $226,184 No value $224,898 $182,458 $277,077 $192,785 $214,430 $244,304 $257,334
Responsibility
Category
#
Engineers Average Mode
Median
(D50)
Min
Value
Max
Value D10 D25 D75 D90
A- 210 $49,842 $41,600 $49,462 $32,448 $66,102 $41,600 $45,382 $53,909 $57,512
A 758 $64,111 $64,381 $66,528 $24,000 $100,016 $39,518 $60,002 $74,145 $78,500
B 940 $81,277 $83,700 $82,320 $54,384 $108,000 $67,619 $75,000 $88,264 $92,213
C 1203 $94,424 $90,000 $95,000 $61,200 $128,000 $78,790 $88,313 $101,085 $108,362
D 1816 $120,698 $113,916 $120,000 $81,380 $160,000 $103,529 $111,590 $130,199 $138,000
E 1270 $150,350 $133,284 $150,264 $98,904 $201,802 $129,349 $139,000 $160,081 $171,264
F 731 $185,542 $180,000 $180,000 $91,514 $293,530 $145,509 $163,855 $198,000 $246,000
F+ 265 $211,781 $300,000 $204,617 $117,390 $310,652 $177,631 $190,475 $226,600 $260,000
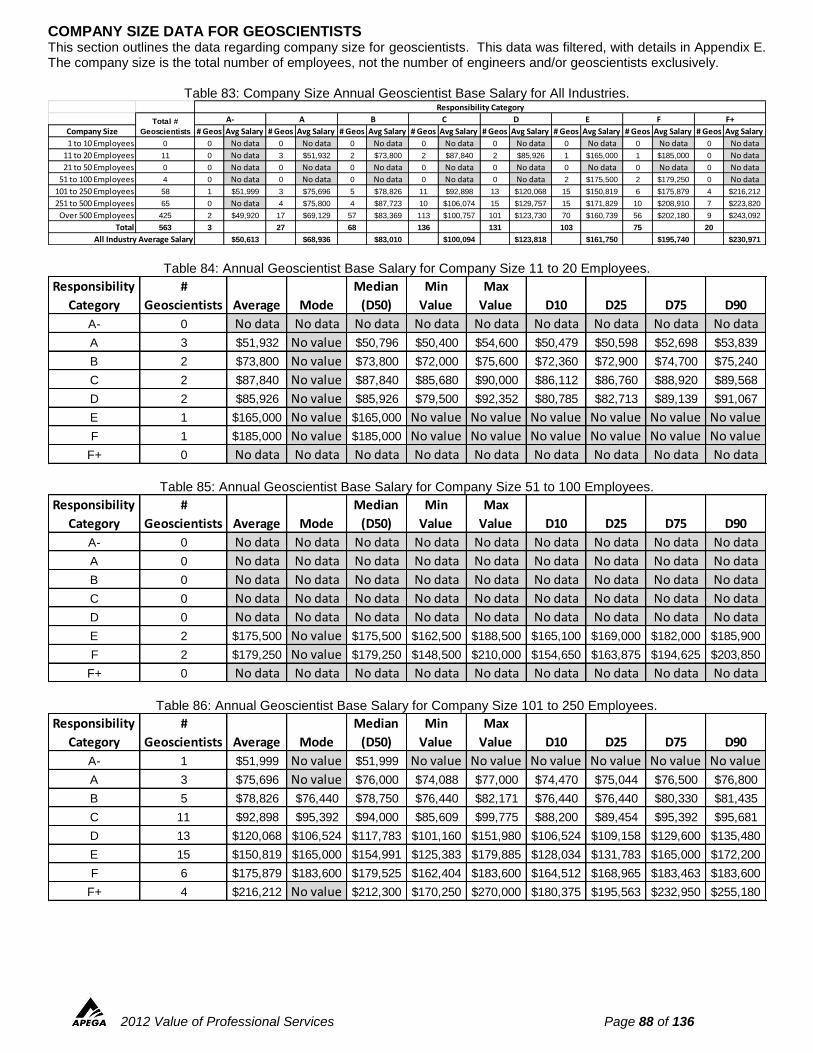
2012 Value of Professional Services Page 88 of 136
COMPANY SIZE DATA FOR GEOSCIENTISTS This section outlines the data regarding company size for geoscientists. This data was filtered, with details in Appendix E. The company size is the total number of employees, not the number of engineers and/or geoscientists exclusively.
Table 83: Company Size Annual Geoscientist Base Salary for All Industries.
Table 84: Annual Geoscientist Base Salary for Company Size 11 to 20 Employees.
Table 85: Annual Geoscientist Base Salary for Company Size 51 to 100 Employees.
Table 86: Annual Geoscientist Base Salary for Company Size 101 to 250 Employees.
Company Size # Geos Avg Salary # Geos Avg Salary # Geos Avg Salary # Geos Avg Salary # Geos Avg Salary # Geos Avg Salary # Geos Avg Salary # Geos Avg Salary
1 to 10 Employees 0 0 No data 0 No data 0 No data 0 No data 0 No data 0 No data 0 No data 0 No data
11 to 20 Employees 11 0 No data 3 $51,932 2 $73,800 2 $87,840 2 $85,926 1 $165,000 1 $185,000 0 No data
21 to 50 Employees 0 0 No data 0 No data 0 No data 0 No data 0 No data 0 No data 0 No data 0 No data
51 to 100 Employees 4 0 No data 0 No data 0 No data 0 No data 0 No data 2 $175,500 2 $179,250 0 No data
101 to 250 Employees 58 1 $51,999 3 $75,696 5 $78,826 11 $92,898 13 $120,068 15 $150,819 6 $175,879 4 $216,212
251 to 500 Employees 65 0 No data 4 $75,800 4 $87,723 10 $106,074 15 $129,757 15 $171,829 10 $208,910 7 $223,820
Over 500 Employees 425 2 $49,920 17 $69,129 57 $83,369 113 $100,757 101 $123,730 70 $160,739 56 $202,180 9 $243,092
Total 563 3 27 68 136 131 103 75 20
$50,613 $68,936 $83,010 $100,094 $123,818 $161,750 $195,740 $230,971All Industry Average Salary
F F+
Responsibility Category
Total #
Geoscientists
A- A B C D E
Responsibility
Category
#
Geoscientists Average Mode
Median
(D50)
Min
Value
Max
Value D10 D25 D75 D90
A- 0 No data No data No data No data No data No data No data No data No data
A 3 $51,932 No value $50,796 $50,400 $54,600 $50,479 $50,598 $52,698 $53,839
B 2 $73,800 No value $73,800 $72,000 $75,600 $72,360 $72,900 $74,700 $75,240
C 2 $87,840 No value $87,840 $85,680 $90,000 $86,112 $86,760 $88,920 $89,568
D 2 $85,926 No value $85,926 $79,500 $92,352 $80,785 $82,713 $89,139 $91,067
E 1 $165,000 No value $165,000 No value No value No value No value No value No value
F 1 $185,000 No value $185,000 No value No value No value No value No value No value
F+ 0 No data No data No data No data No data No data No data No data No data
Responsibility
Category
#
Geoscientists Average Mode
Median
(D50)
Min
Value
Max
Value D10 D25 D75 D90
A- 0 No data No data No data No data No data No data No data No data No data
A 0 No data No data No data No data No data No data No data No data No data
B 0 No data No data No data No data No data No data No data No data No data
C 0 No data No data No data No data No data No data No data No data No data
D 0 No data No data No data No data No data No data No data No data No data
E 2 $175,500 No value $175,500 $162,500 $188,500 $165,100 $169,000 $182,000 $185,900
F 2 $179,250 No value $179,250 $148,500 $210,000 $154,650 $163,875 $194,625 $203,850
F+ 0 No data No data No data No data No data No data No data No data No data
Responsibility
Category
#
Geoscientists Average Mode
Median
(D50)
Min
Value
Max
Value D10 D25 D75 D90
A- 1 $51,999 No value $51,999 No value No value No value No value No value No value
A 3 $75,696 No value $76,000 $74,088 $77,000 $74,470 $75,044 $76,500 $76,800
B 5 $78,826 $76,440 $78,750 $76,440 $82,171 $76,440 $76,440 $80,330 $81,435
C 11 $92,898 $95,392 $94,000 $85,609 $99,775 $88,200 $89,454 $95,392 $95,681
D 13 $120,068 $106,524 $117,783 $101,160 $151,980 $106,524 $109,158 $129,600 $135,480
E 15 $150,819 $165,000 $154,991 $125,383 $179,885 $128,034 $131,783 $165,000 $172,200
F 6 $175,879 $183,600 $179,525 $162,404 $183,600 $164,512 $168,965 $183,463 $183,600
F+ 4 $216,212 No value $212,300 $170,250 $270,000 $180,375 $195,563 $232,950 $255,180
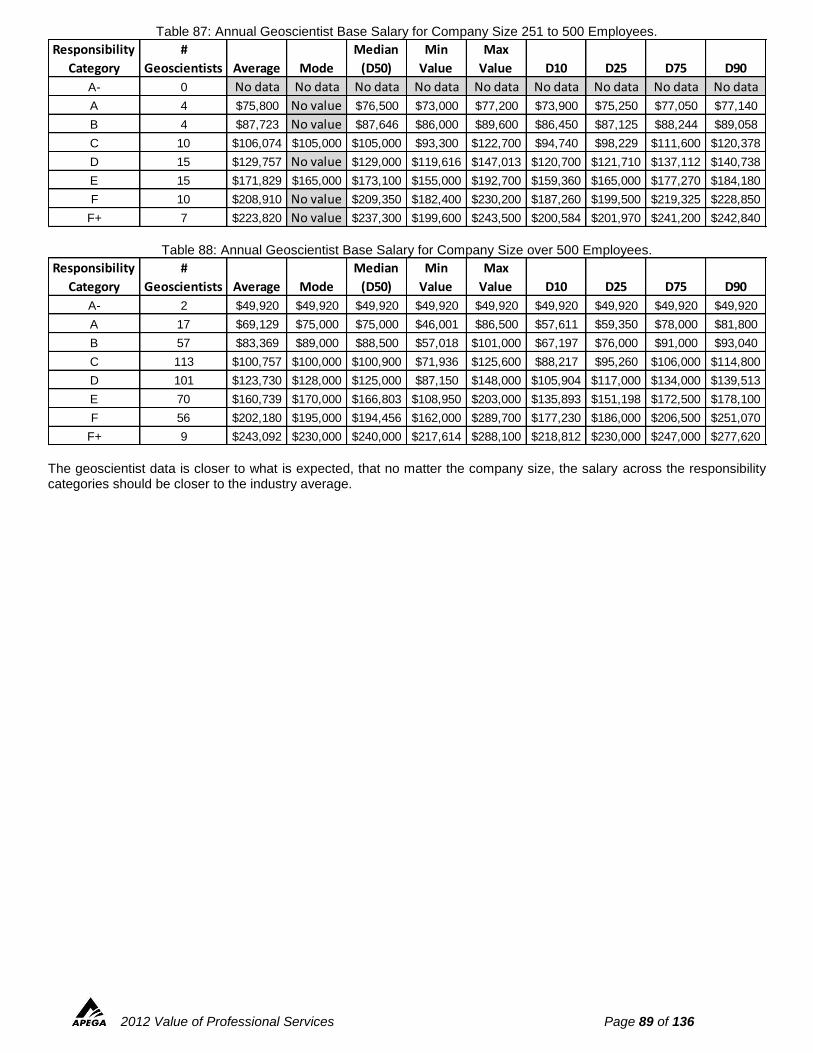
2012 Value of Professional Services Page 89 of 136
Table 87: Annual Geoscientist Base Salary for Company Size 251 to 500 Employees.
Table 88: Annual Geoscientist Base Salary for Company Size over 500 Employees.
The geoscientist data is closer to what is expected, that no matter the company size, the salary across the responsibility categories should be closer to the industry average.
Responsibility
Category
#
Geoscientists Average Mode
Median
(D50)
Min
Value
Max
Value D10 D25 D75 D90
A- 0 No data No data No data No data No data No data No data No data No data
A 4 $75,800 No value $76,500 $73,000 $77,200 $73,900 $75,250 $77,050 $77,140
B 4 $87,723 No value $87,646 $86,000 $89,600 $86,450 $87,125 $88,244 $89,058
C 10 $106,074 $105,000 $105,000 $93,300 $122,700 $94,740 $98,229 $111,600 $120,378
D 15 $129,757 No value $129,000 $119,616 $147,013 $120,700 $121,710 $137,112 $140,738
E 15 $171,829 $165,000 $173,100 $155,000 $192,700 $159,360 $165,000 $177,270 $184,180
F 10 $208,910 No value $209,350 $182,400 $230,200 $187,260 $199,500 $219,325 $228,850
F+ 7 $223,820 No value $237,300 $199,600 $243,500 $200,584 $201,970 $241,200 $242,840
Responsibility
Category
#
Geoscientists Average Mode
Median
(D50)
Min
Value
Max
Value D10 D25 D75 D90
A- 2 $49,920 $49,920 $49,920 $49,920 $49,920 $49,920 $49,920 $49,920 $49,920
A 17 $69,129 $75,000 $75,000 $46,001 $86,500 $57,611 $59,350 $78,000 $81,800
B 57 $83,369 $89,000 $88,500 $57,018 $101,000 $67,197 $76,000 $91,000 $93,040
C 113 $100,757 $100,000 $100,900 $71,936 $125,600 $88,217 $95,260 $106,000 $114,800
D 101 $123,730 $128,000 $125,000 $87,150 $148,000 $105,904 $117,000 $134,000 $139,513
E 70 $160,739 $170,000 $166,803 $108,950 $203,000 $135,893 $151,198 $172,500 $178,100
F 56 $202,180 $195,000 $194,456 $162,000 $289,700 $177,230 $186,000 $206,500 $251,070
F+ 9 $243,092 $230,000 $240,000 $217,614 $288,100 $218,812 $230,000 $247,000 $277,620
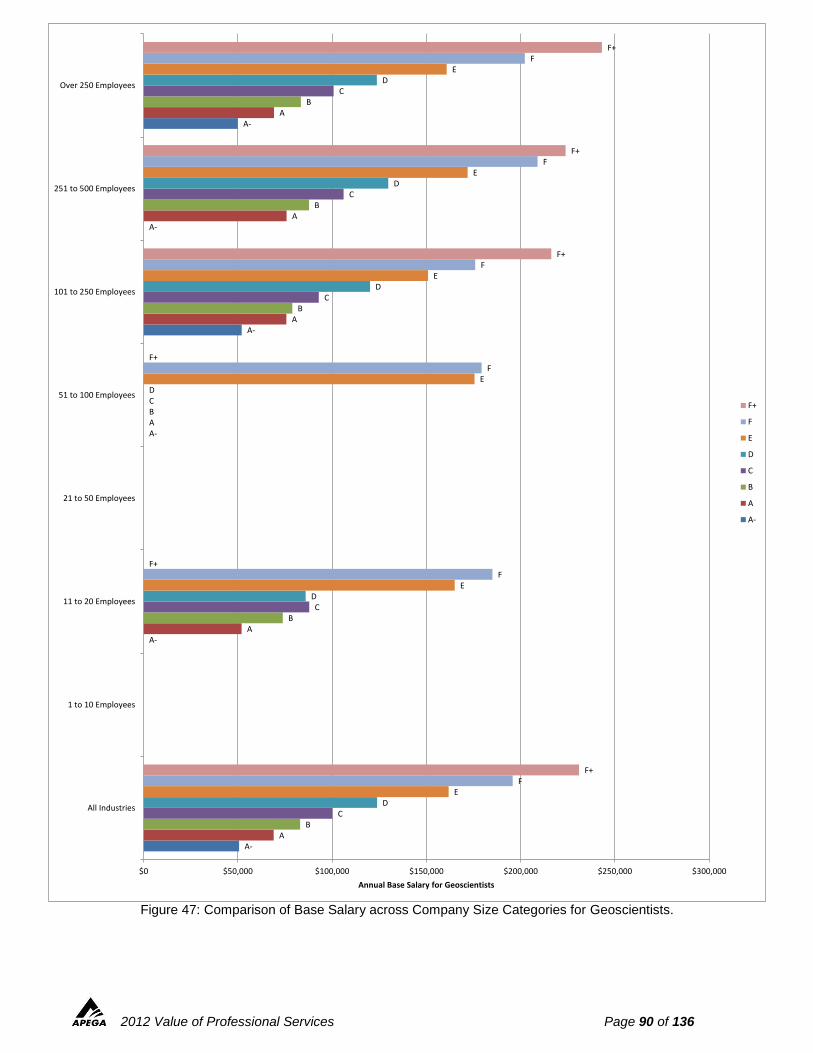
2012 Value of Professional Services Page 90 of 136
Figure 47: Comparison of Base Salary across Company Size Categories for Geoscientists.
A-
A-
A-
A-
A-
A-
A
A
A
A
A
A
B
B
B
B
B
B
C
C
C
C
C
C
D
D
D
D
D
D
E
E
E
E
E
E
F
F
F
F
F
F
F+
F+
F+
F+
F+
F+
$0 $50,000 $100,000 $150,000 $200,000 $250,000 $300,000
All Industries
1 to 10 Employees
11 to 20 Employees
21 to 50 Employees
51 to 100 Employees
101 to 250 Employees
251 to 500 Employees
Over 250 Employees
Annual Base Salary for Geoscientists
F+
F
E
D
C
B
A
A-
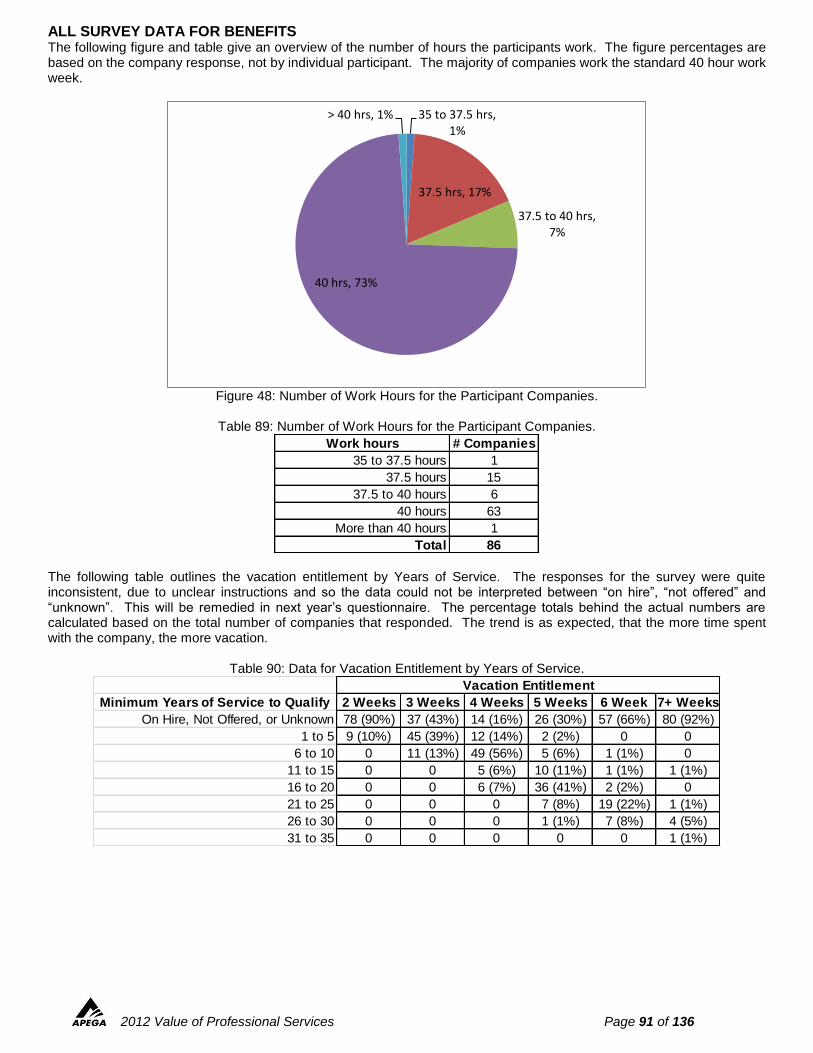
2012 Value of Professional Services Page 91 of 136
ALL SURVEY DATA FOR BENEFITS The following figure and table give an overview of the number of hours the participants work. The figure percentages are based on the company response, not by individual participant. The majority of companies work the standard 40 hour work week.
Figure 48: Number of Work Hours for the Participant Companies.
Table 89: Number of Work Hours for the Participant Companies.
The following table outlines the vacation entitlement by Years of Service. The responses for the survey were quite inconsistent, due to unclear instructions and so the data could not be interpreted between “on hire”, “not offered” and “unknown”. This will be remedied in next year’s questionnaire. The percentage totals behind the actual numbers are calculated based on the total number of companies that responded. The trend is as expected, that the more time spent with the company, the more vacation.
Table 90: Data for Vacation Entitlement by Years of Service.
35 to 37.5 hrs, 1%
37.5 hrs, 17%
37.5 to 40 hrs, 7%
40 hrs, 73%
> 40 hrs, 1%
Work hours # Companies
35 to 37.5 hours 1
37.5 hours 15
37.5 to 40 hours 6
40 hours 63
More than 40 hours 1
Total 86
Minimum Years of Service to Qualify 2 Weeks 3 Weeks 4 Weeks 5 Weeks 6 Week 7+ Weeks
On Hire, Not Offered, or Unknown 78 (90%) 37 (43%) 14 (16%) 26 (30%) 57 (66%) 80 (92%)
1 to 5 9 (10%) 45 (39%) 12 (14%) 2 (2%) 0 0
6 to 10 0 11 (13%) 49 (56%) 5 (6%) 1 (1%) 0
11 to 15 0 0 5 (6%) 10 (11%) 1 (1%) 1 (1%)
16 to 20 0 0 6 (7%) 36 (41%) 2 (2%) 0
21 to 25 0 0 0 7 (8%) 19 (22%) 1 (1%)
26 to 30 0 0 0 1 (1%) 7 (8%) 4 (5%)
31 to 35 0 0 0 0 0 1 (1%)
Vacation Entitlement
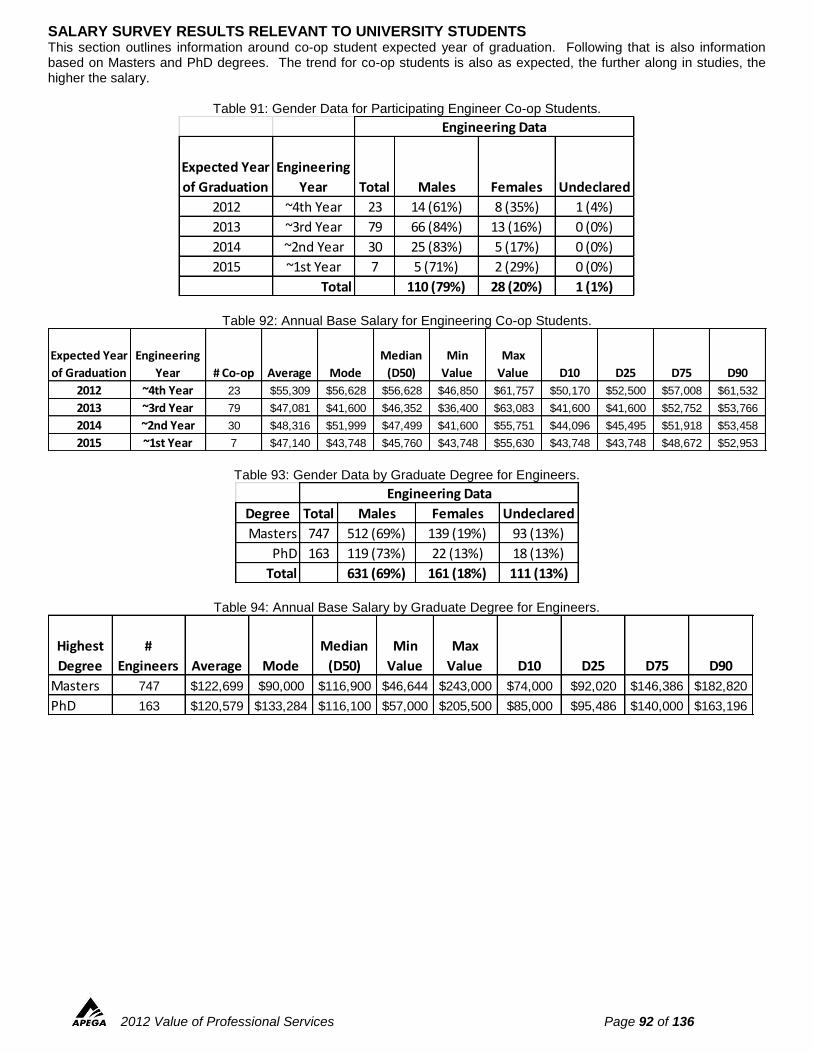
2012 Value of Professional Services Page 92 of 136
SALARY SURVEY RESULTS RELEVANT TO UNIVERSITY STUDENTS This section outlines information around co-op student expected year of graduation. Following that is also information based on Masters and PhD degrees. The trend for co-op students is also as expected, the further along in studies, the higher the salary.
Table 91: Gender Data for Participating Engineer Co-op Students.
Table 92: Annual Base Salary for Engineering Co-op Students.
Table 93: Gender Data by Graduate Degree for Engineers.
Table 94: Annual Base Salary by Graduate Degree for Engineers.
Expected Year
of Graduation
Engineering
Year Total Males Females Undeclared
2012 ~4th Year 23 14 (61%) 8 (35%) 1 (4%)
2013 ~3rd Year 79 66 (84%) 13 (16%) 0 (0%)
2014 ~2nd Year 30 25 (83%) 5 (17%) 0 (0%)
2015 ~1st Year 7 5 (71%) 2 (29%) 0 (0%)
Total 110 (79%) 28 (20%) 1 (1%)
Engineering Data
Expected Year
of Graduation
Engineering
Year # Co-op Average Mode
Median
(D50)
Min
Value
Max
Value D10 D25 D75 D90
2012 ~4th Year 23 $55,309 $56,628 $56,628 $46,850 $61,757 $50,170 $52,500 $57,008 $61,532
2013 ~3rd Year 79 $47,081 $41,600 $46,352 $36,400 $63,083 $41,600 $41,600 $52,752 $53,766
2014 ~2nd Year 30 $48,316 $51,999 $47,499 $41,600 $55,751 $44,096 $45,495 $51,918 $53,458
2015 ~1st Year 7 $47,140 $43,748 $45,760 $43,748 $55,630 $43,748 $43,748 $48,672 $52,953
Degree Total Males Females Undeclared
Masters 747 512 (69%) 139 (19%) 93 (13%)
PhD 163 119 (73%) 22 (13%) 18 (13%)
Total 631 (69%) 161 (18%) 111 (13%)
Engineering Data
Highest
Degree
#
Engineers Average Mode
Median
(D50)
Min
Value
Max
Value D10 D25 D75 D90
Masters 747 $122,699 $90,000 $116,900 $46,644 $243,000 $74,000 $92,020 $146,386 $182,820
PhD 163 $120,579 $133,284 $116,100 $57,000 $205,500 $85,000 $95,486 $140,000 $163,196
2012 Value of Professional Services Page 93 of 136
REFERENCES 1. Tupala, M., “June 2012 Stats”, Word Document, APEGA Membership Summary, June 2012.
2. Vandenberghe, J., “APEGA 2012 Salary Survey Instruction Manual”, Word Document, May 2012.
3. Website link: http://www.apega.ca/Members/Publications/salarysurvey.html. Also found by going to the APEGA
website (http://www.apega.ca/) and following the “Salary Survey” Fast Find. Information as of July 30, 2012.
4. Statistics Canada, “Consumer Price Index and major components, Canada – Not seasonally adjusted”,
Publication, http://www.statcan.gc.ca/daily-quotidien/120622/t120622a001-eng.htm, taken June 25, 2012.
5. Statistics Canada, “Consumer Price Index by province, and for Whitehorse, Yellowknife and Iqaluit – Not
seasonally adjusted”, Publication, http://www.statcan.gc.ca/daily-quotidien/120622/t120622a002-eng.htm, taken
June 25, 2012.
6. Statistics Canada, “Consumer Price Index, by city (monthly)”, Publication, http://www.statcan.gc.ca/tables-
tableaux/sum-som/l01/cst01/econ45a-eng.htm, taken June 25, 2012.
7. Government of Alberta, “Alberta’s Occupational Demand and Supply Outlook 2011-2021”, Publication,
http://employment.alberta.ca/BI/2656.html, taken June 25, 2012.
8. Government of Alberta, “Alberta’s Occupational Demand and Supply Outlook 2011-2021”, Publication, Overall
Occupational Outlook section, Page 5.
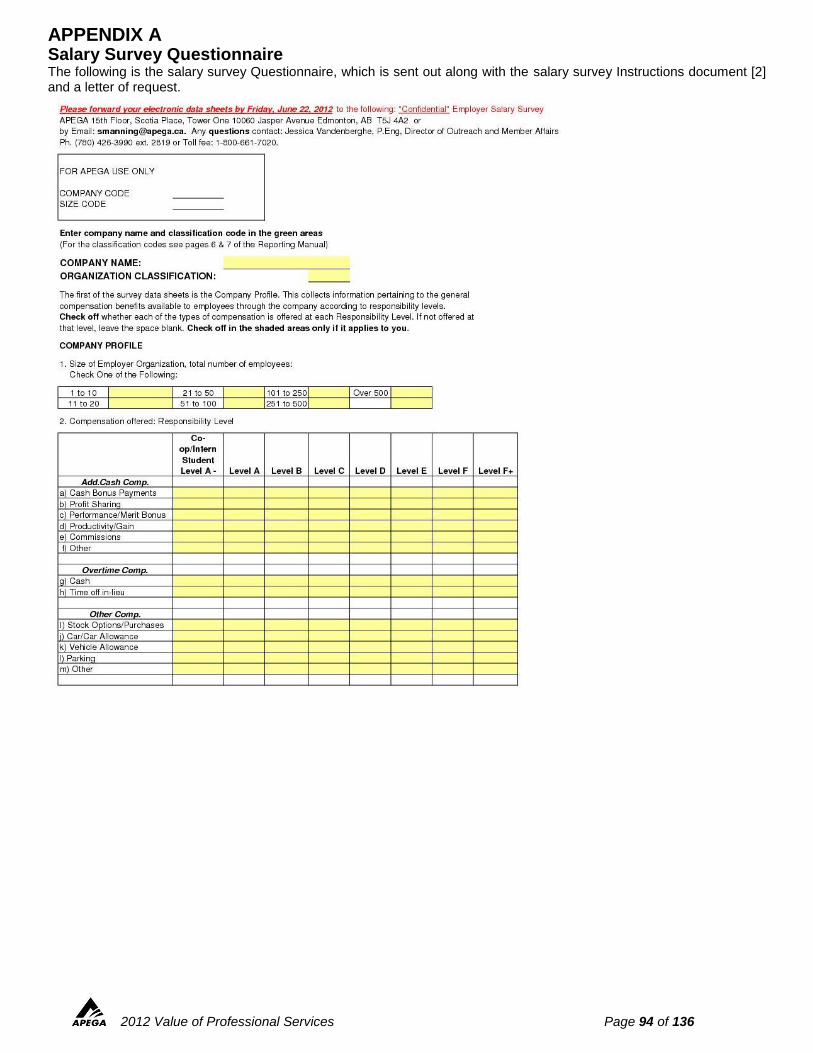
2012 Value of Professional Services Page 94 of 136
APPENDIX A Salary Survey Questionnaire The following is the salary survey Questionnaire, which is sent out along with the salary survey Instructions document [2] and a letter of request.
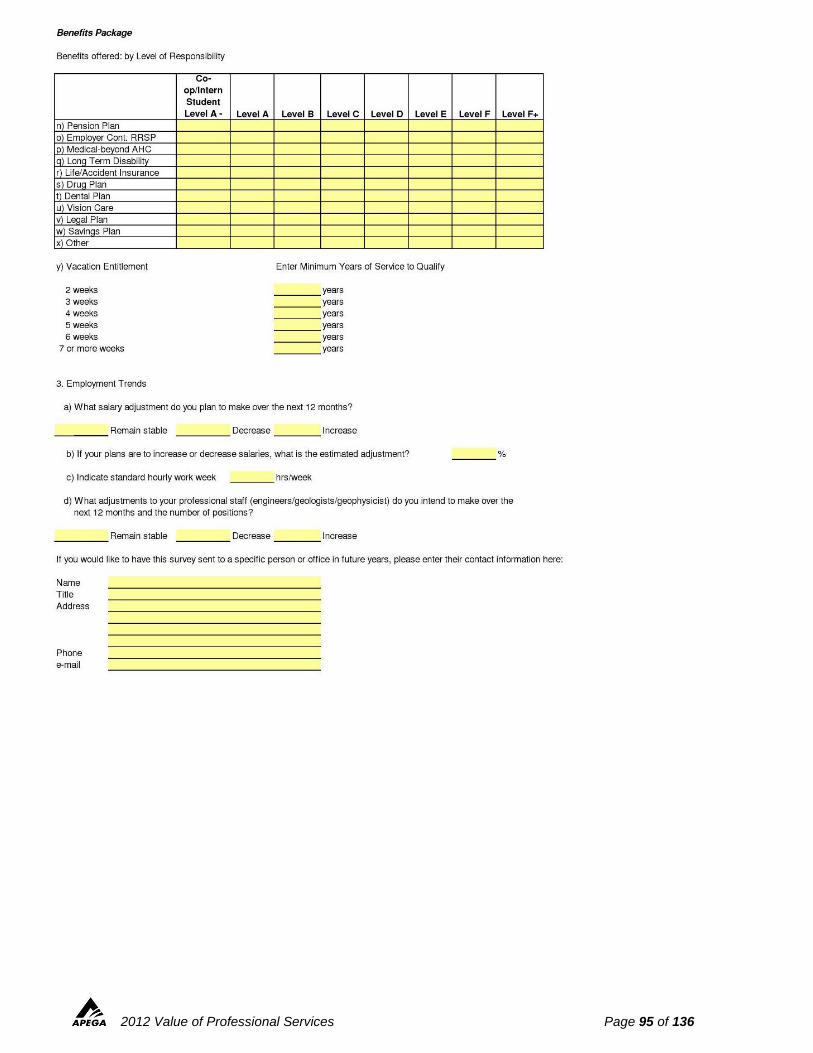
2012 Value of Professional Services Page 95 of 136
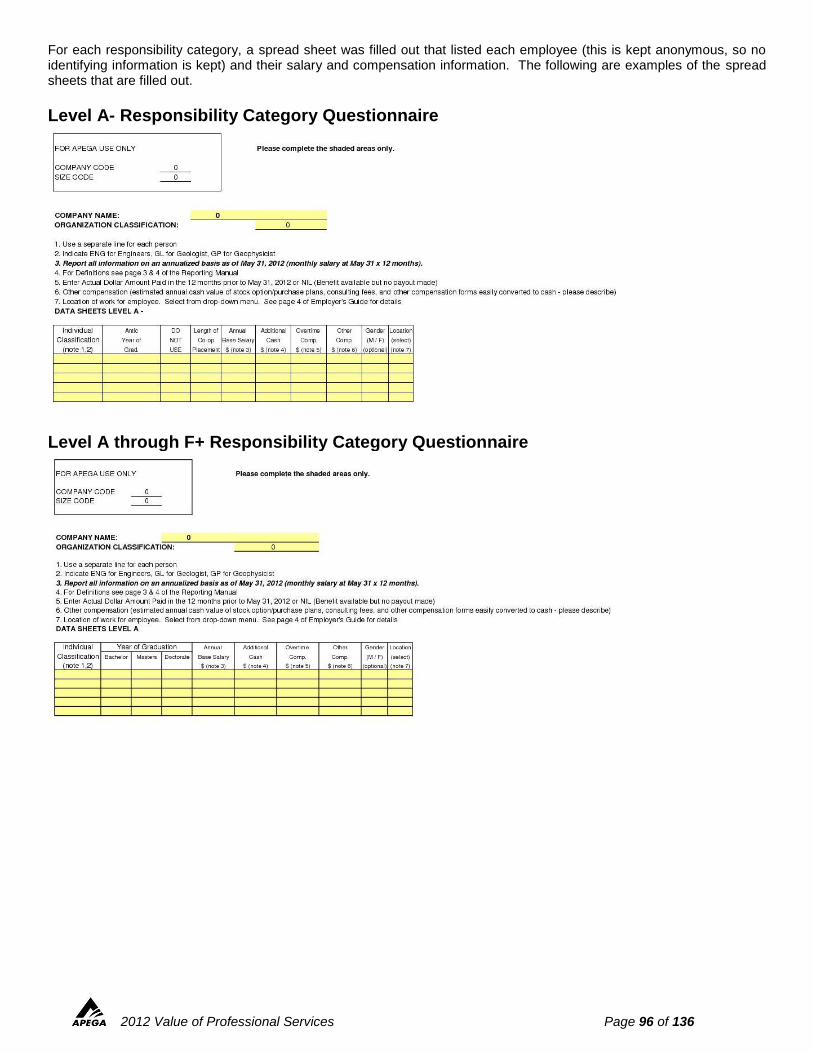
2012 Value of Professional Services Page 96 of 136
For each responsibility category, a spread sheet was filled out that listed each employee (this is kept anonymous, so no identifying information is kept) and their salary and compensation information. The following are examples of the spread sheets that are filled out.
Level A- Responsibility Category Questionnaire
Level A through F+ Responsibility Category Questionnaire
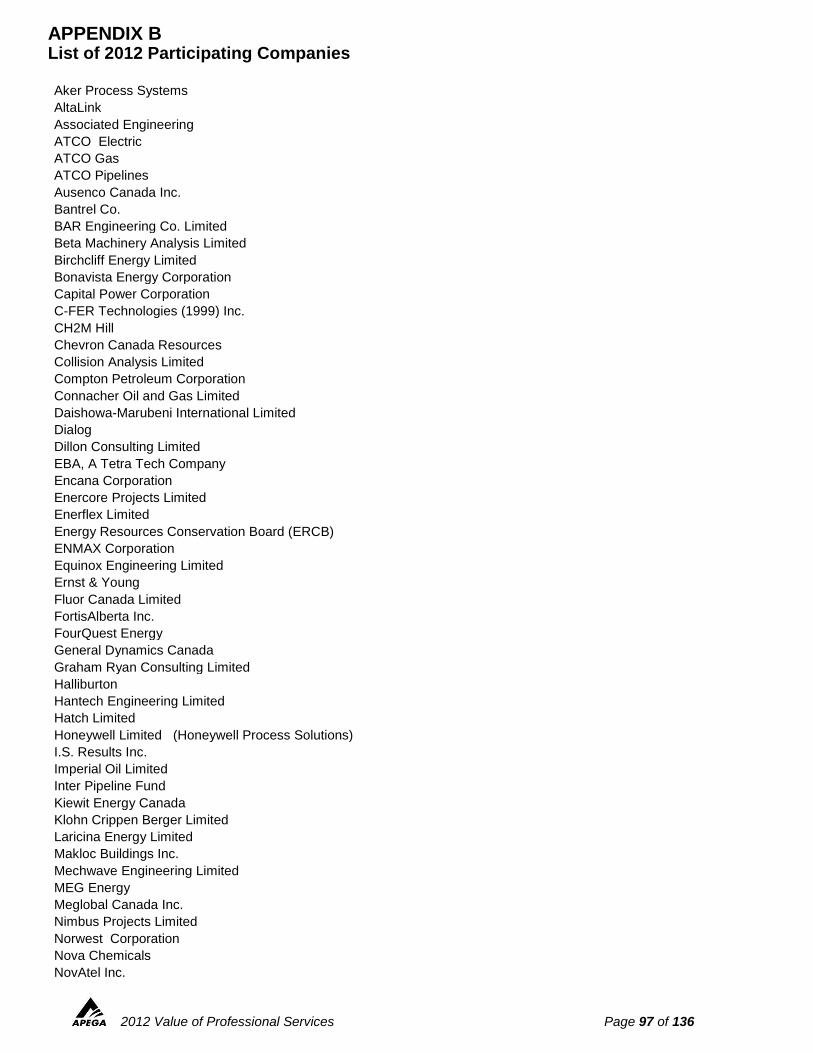
2012 Value of Professional Services Page 97 of 136
APPENDIX B List of 2012 Participating Companies Aker Process Systems
AltaLink
Associated Engineering
ATCO Electric
ATCO Gas
ATCO Pipelines
Ausenco Canada Inc.
Bantrel Co.
BAR Engineering Co. Limited
Beta Machinery Analysis Limited
Birchcliff Energy Limited
Bonavista Energy Corporation
Capital Power Corporation
C-FER Technologies (1999) Inc.
CH2M Hill
Chevron Canada Resources
Collision Analysis Limited
Compton Petroleum Corporation
Connacher Oil and Gas Limited
Daishowa-Marubeni International Limited
Dialog
Dillon Consulting Limited
EBA, A Tetra Tech Company
Encana Corporation
Enercore Projects Limited
Enerflex Limited
Energy Resources Conservation Board (ERCB)
ENMAX Corporation
Equinox Engineering Limited
Ernst & Young
Fluor Canada Limited
FortisAlberta Inc.
FourQuest Energy
General Dynamics Canada
Graham Ryan Consulting Limited
Halliburton
Hantech Engineering Limited
Hatch Limited
Honeywell Limited (Honeywell Process Solutions)
I.S. Results Inc.
Imperial Oil Limited
Inter Pipeline Fund
Kiewit Energy Canada
Klohn Crippen Berger Limited
Laricina Energy Limited
Makloc Buildings Inc.
Mechwave Engineering Limited
MEG Energy
Meglobal Canada Inc.
Nimbus Projects Limited
Norwest Corporation
Nova Chemicals
NovAtel Inc.

2012 Value of Professional Services Page 98 of 136
Orbis Engineering Field Services Limited
Pasquini & Associates Consulting Limited
Pengrowth Energy Corporation
Perpetual Energy Inc.
Petrel Robertson Consulting Limited
Pillar Resource Services Inc.
Process Ecology Inc.
PROJEX Technologies Limited
Propak Systems Limited
Quadra Chemicals
RAE Engineering and Inspection Limited
Rally Engineering Inc.
Raytheon Canada Limited
Ready Engineering Corporation
RWDI AIR Inc.
Scheffer Andrew Limited
Sherritt Metals
Sherritt Technologies
Skystone Engineering
SNC-Lavalin Inc.
Spectra Energy Transmission
Stantec Consulting Limited
Stewart Weir
Stream-Flo
Suncor Energy Inc.
Syncrude Canada Limited
Town Of Redcliff
Trace Associates Inc.
TransCanada Corporation
Vermilion Energy Inc.
WaterSMART Solutions Limited
Westview Engineering Limited
Weyerhaeuser Company Limited
WorleyParsons Canada Services Limited
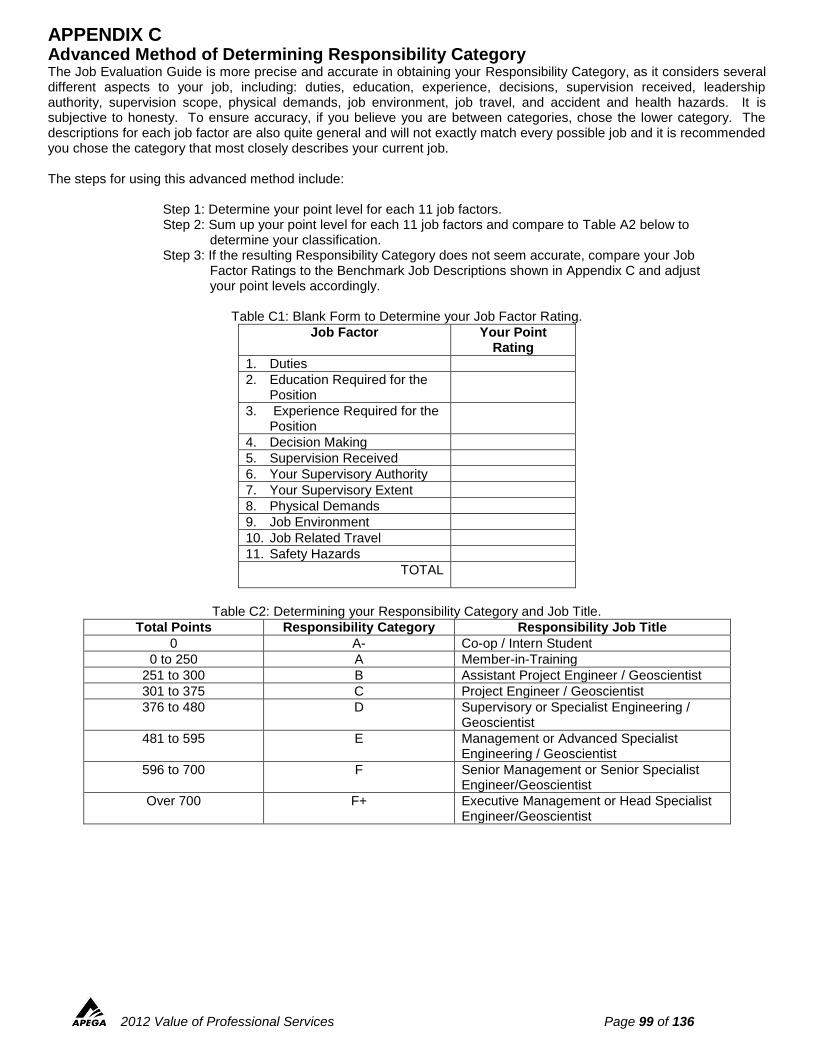
2012 Value of Professional Services Page 99 of 136
APPENDIX C Advanced Method of Determining Responsibility Category The Job Evaluation Guide is more precise and accurate in obtaining your Responsibility Category, as it considers several different aspects to your job, including: duties, education, experience, decisions, supervision received, leadership authority, supervision scope, physical demands, job environment, job travel, and accident and health hazards. It is subjective to honesty. To ensure accuracy, if you believe you are between categories, chose the lower category. The descriptions for each job factor are also quite general and will not exactly match every possible job and it is recommended you chose the category that most closely describes your current job. The steps for using this advanced method include:
Step 1: Determine your point level for each 11 job factors. Step 2: Sum up your point level for each 11 job factors and compare to Table A2 below to
determine your classification. Step 3: If the resulting Responsibility Category does not seem accurate, compare your Job
Factor Ratings to the Benchmark Job Descriptions shown in Appendix C and adjust your point levels accordingly.
Table C1: Blank Form to Determine your Job Factor Rating.
Job Factor Your Point Rating
1. Duties
2. Education Required for the Position
3. Experience Required for the Position
4. Decision Making
5. Supervision Received
6. Your Supervisory Authority
7. Your Supervisory Extent
8. Physical Demands
9. Job Environment
10. Job Related Travel
11. Safety Hazards
TOTAL
Table C2: Determining your Responsibility Category and Job Title.
Total Points Responsibility Category Responsibility Job Title
0 A- Co-op / Intern Student
0 to 250 A Member-in-Training
251 to 300 B Assistant Project Engineer / Geoscientist
301 to 375 C Project Engineer / Geoscientist
376 to 480 D Supervisory or Specialist Engineering / Geoscientist
481 to 595 E Management or Advanced Specialist Engineering / Geoscientist
596 to 700 F Senior Management or Senior Specialist Engineer/Geoscientist
Over 700 F+ Executive Management or Head Specialist Engineer/Geoscientist
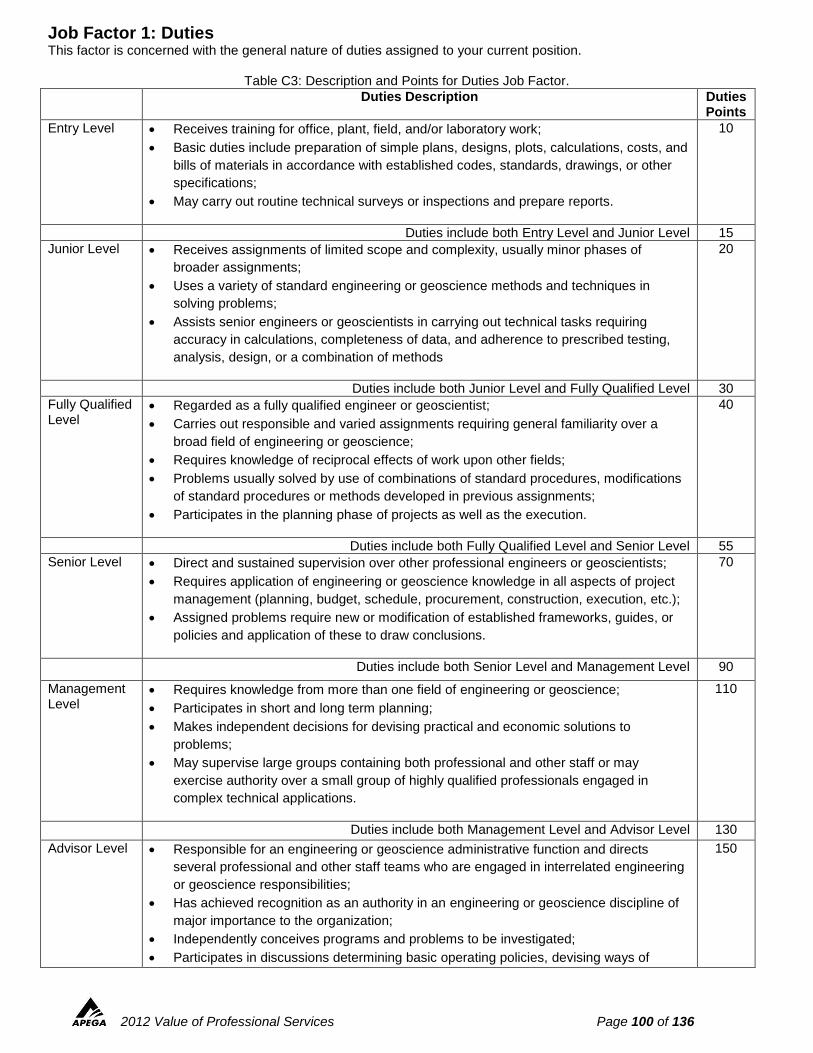
2012 Value of Professional Services Page 100 of 136
Job Factor 1: Duties This factor is concerned with the general nature of duties assigned to your current position.
Table C3: Description and Points for Duties Job Factor.
Duties Description Duties Points
Entry Level Receives training for office, plant, field, and/or laboratory work;
Basic duties include preparation of simple plans, designs, plots, calculations, costs, and
bills of materials in accordance with established codes, standards, drawings, or other
specifications;
May carry out routine technical surveys or inspections and prepare reports.
10
Duties include both Entry Level and Junior Level 15
Junior Level Receives assignments of limited scope and complexity, usually minor phases of
broader assignments;
Uses a variety of standard engineering or geoscience methods and techniques in
solving problems;
Assists senior engineers or geoscientists in carrying out technical tasks requiring
accuracy in calculations, completeness of data, and adherence to prescribed testing,
analysis, design, or a combination of methods
20
Duties include both Junior Level and Fully Qualified Level 30
Fully Qualified Level
Regarded as a fully qualified engineer or geoscientist;
Carries out responsible and varied assignments requiring general familiarity over a
broad field of engineering or geoscience;
Requires knowledge of reciprocal effects of work upon other fields;
Problems usually solved by use of combinations of standard procedures, modifications
of standard procedures or methods developed in previous assignments;
Participates in the planning phase of projects as well as the execution.
40
Duties include both Fully Qualified Level and Senior Level 55
Senior Level Direct and sustained supervision over other professional engineers or geoscientists;
Requires application of engineering or geoscience knowledge in all aspects of project
management (planning, budget, schedule, procurement, construction, execution, etc.);
Assigned problems require new or modification of established frameworks, guides, or
policies and application of these to draw conclusions.
70
Duties include both Senior Level and Management Level 90
Management Level
Requires knowledge from more than one field of engineering or geoscience;
Participates in short and long term planning;
Makes independent decisions for devising practical and economic solutions to
problems;
May supervise large groups containing both professional and other staff or may
exercise authority over a small group of highly qualified professionals engaged in
complex technical applications.
110
Duties include both Management Level and Advisor Level 130
Advisor Level Responsible for an engineering or geoscience administrative function and directs
several professional and other staff teams who are engaged in interrelated engineering
or geoscience responsibilities;
Has achieved recognition as an authority in an engineering or geoscience discipline of
major importance to the organization;
Independently conceives programs and problems to be investigated;
Participates in discussions determining basic operating policies, devising ways of
150
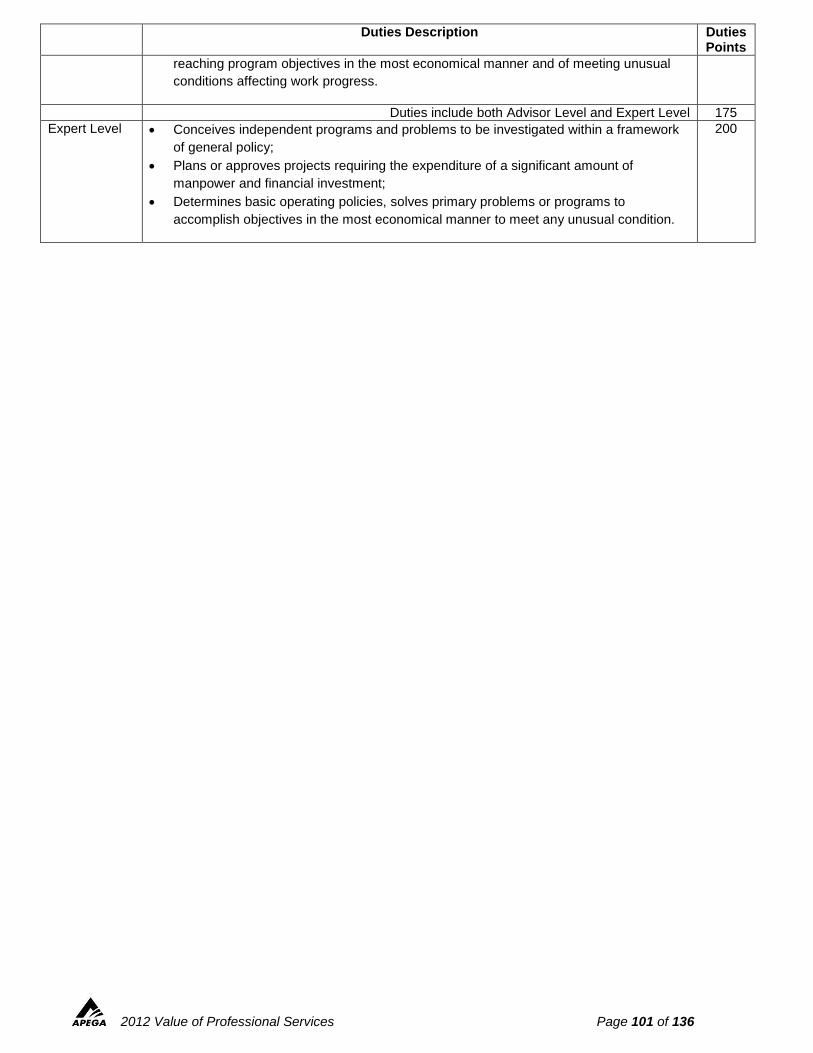
2012 Value of Professional Services Page 101 of 136
Duties Description Duties Points
reaching program objectives in the most economical manner and of meeting unusual
conditions affecting work progress.
Duties include both Advisor Level and Expert Level 175
Expert Level Conceives independent programs and problems to be investigated within a framework
of general policy;
Plans or approves projects requiring the expenditure of a significant amount of
manpower and financial investment;
Determines basic operating policies, solves primary problems or programs to
accomplish objectives in the most economical manner to meet any unusual condition.
200
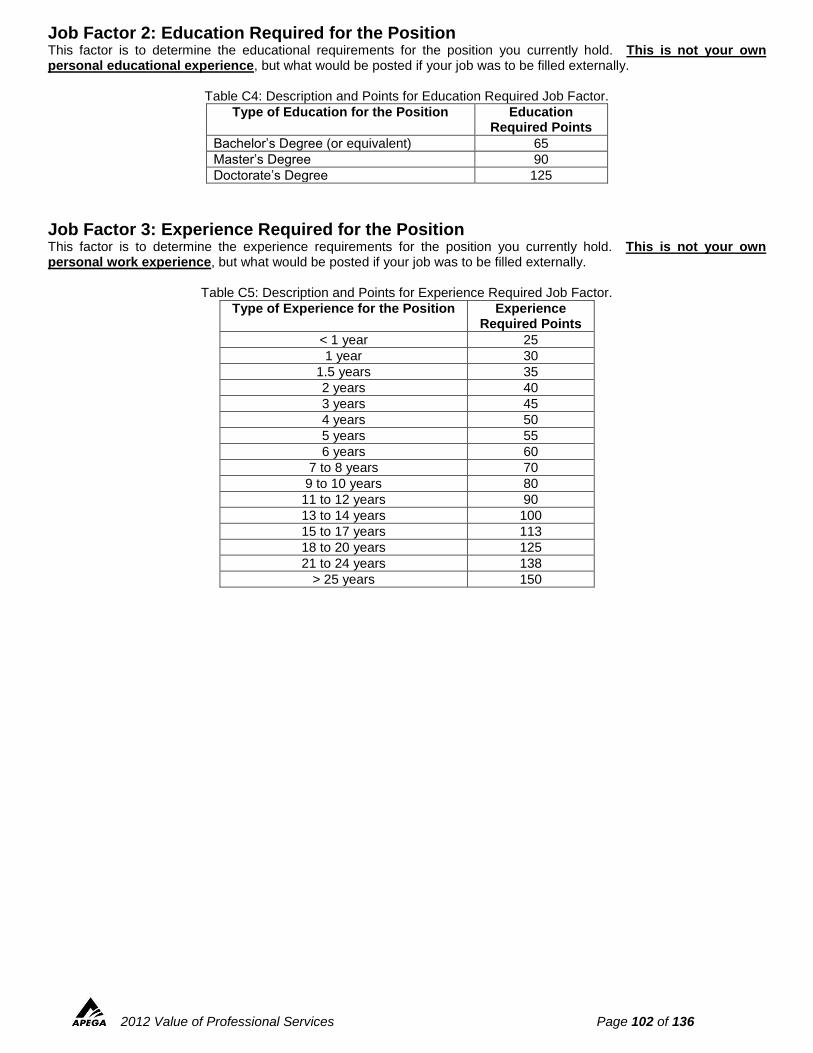
2012 Value of Professional Services Page 102 of 136
Job Factor 2: Education Required for the Position This factor is to determine the educational requirements for the position you currently hold. This is not your own personal educational experience, but what would be posted if your job was to be filled externally.
Table C4: Description and Points for Education Required Job Factor.
Type of Education for the Position Education Required Points
Bachelor’s Degree (or equivalent) 65
Master’s Degree 90
Doctorate’s Degree 125
Job Factor 3: Experience Required for the Position This factor is to determine the experience requirements for the position you currently hold. This is not your own personal work experience, but what would be posted if your job was to be filled externally.
Table C5: Description and Points for Experience Required Job Factor.
Type of Experience for the Position Experience Required Points
< 1 year 25
1 year 30
1.5 years 35
2 years 40
3 years 45
4 years 50
5 years 55
6 years 60
7 to 8 years 70
9 to 10 years 80
11 to 12 years 90
13 to 14 years 100
15 to 17 years 113
18 to 20 years 125
21 to 24 years 138
> 25 years 150
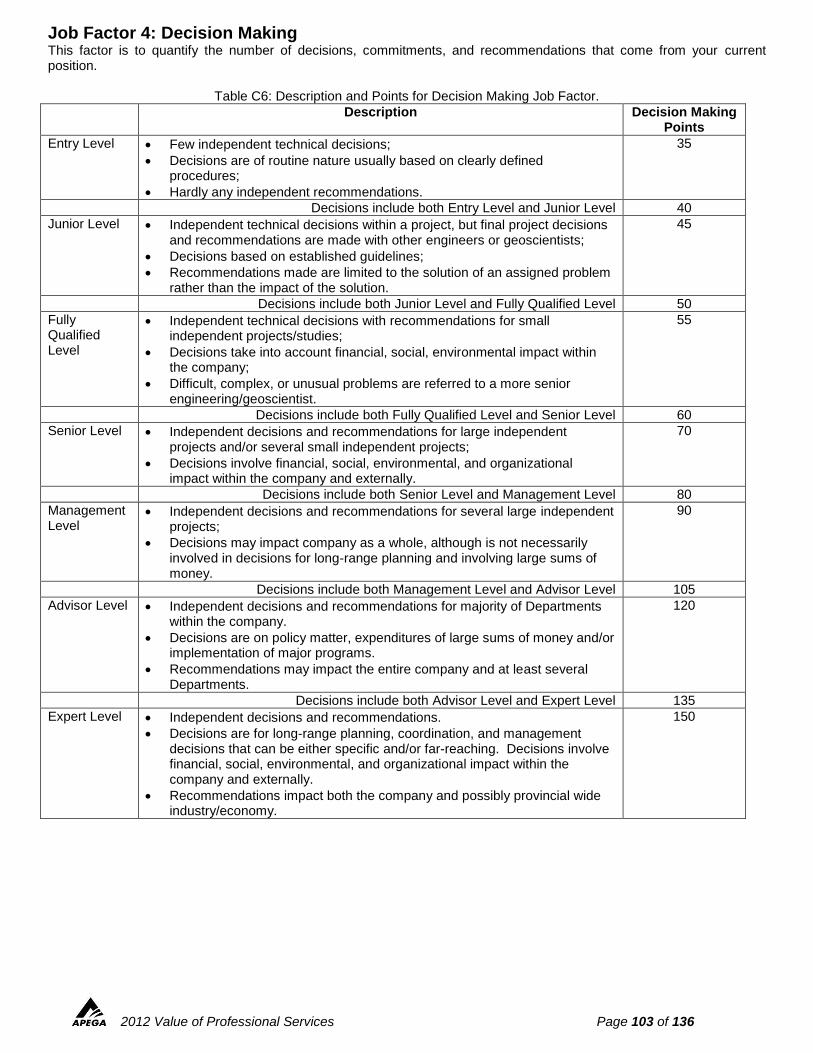
2012 Value of Professional Services Page 103 of 136
Job Factor 4: Decision Making This factor is to quantify the number of decisions, commitments, and recommendations that come from your current position.
Table C6: Description and Points for Decision Making Job Factor.
Description Decision Making Points
Entry Level Few independent technical decisions;
Decisions are of routine nature usually based on clearly defined procedures;
Hardly any independent recommendations.
35
Decisions include both Entry Level and Junior Level 40
Junior Level Independent technical decisions within a project, but final project decisions and recommendations are made with other engineers or geoscientists;
Decisions based on established guidelines;
Recommendations made are limited to the solution of an assigned problem rather than the impact of the solution.
45
Decisions include both Junior Level and Fully Qualified Level 50
Fully Qualified Level
Independent technical decisions with recommendations for small independent projects/studies;
Decisions take into account financial, social, environmental impact within the company;
Difficult, complex, or unusual problems are referred to a more senior engineering/geoscientist.
55
Decisions include both Fully Qualified Level and Senior Level 60
Senior Level Independent decisions and recommendations for large independent projects and/or several small independent projects;
Decisions involve financial, social, environmental, and organizational impact within the company and externally.
70
Decisions include both Senior Level and Management Level 80
Management Level
Independent decisions and recommendations for several large independent projects;
Decisions may impact company as a whole, although is not necessarily involved in decisions for long-range planning and involving large sums of money.
90
Decisions include both Management Level and Advisor Level 105
Advisor Level Independent decisions and recommendations for majority of Departments within the company.
Decisions are on policy matter, expenditures of large sums of money and/or implementation of major programs.
Recommendations may impact the entire company and at least several Departments.
120
Decisions include both Advisor Level and Expert Level 135
Expert Level Independent decisions and recommendations.
Decisions are for long-range planning, coordination, and management decisions that can be either specific and/or far-reaching. Decisions involve financial, social, environmental, and organizational impact within the company and externally.
Recommendations impact both the company and possibly provincial wide industry/economy.
150
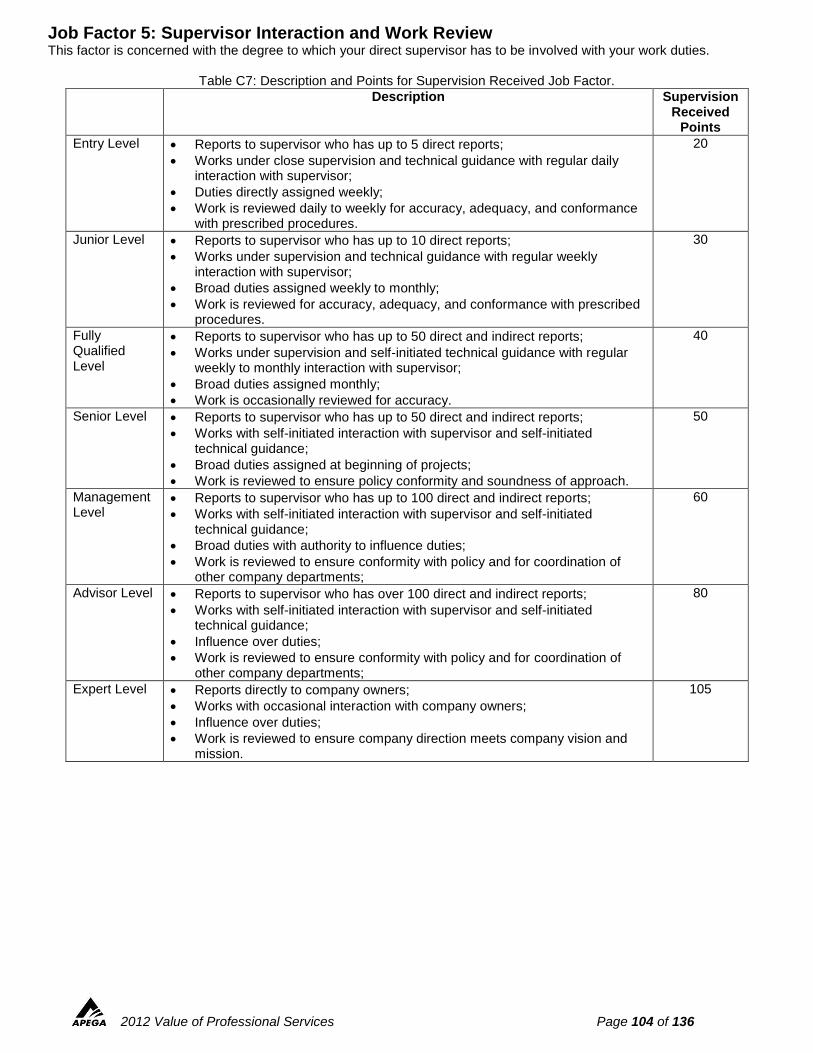
2012 Value of Professional Services Page 104 of 136
Job Factor 5: Supervisor Interaction and Work Review This factor is concerned with the degree to which your direct supervisor has to be involved with your work duties.
Table C7: Description and Points for Supervision Received Job Factor.
Description Supervision Received
Points
Entry Level Reports to supervisor who has up to 5 direct reports;
Works under close supervision and technical guidance with regular daily interaction with supervisor;
Duties directly assigned weekly;
Work is reviewed daily to weekly for accuracy, adequacy, and conformance with prescribed procedures.
20
Junior Level Reports to supervisor who has up to 10 direct reports;
Works under supervision and technical guidance with regular weekly interaction with supervisor;
Broad duties assigned weekly to monthly;
Work is reviewed for accuracy, adequacy, and conformance with prescribed procedures.
30
Fully Qualified Level
Reports to supervisor who has up to 50 direct and indirect reports;
Works under supervision and self-initiated technical guidance with regular weekly to monthly interaction with supervisor;
Broad duties assigned monthly;
Work is occasionally reviewed for accuracy.
40
Senior Level Reports to supervisor who has up to 50 direct and indirect reports;
Works with self-initiated interaction with supervisor and self-initiated technical guidance;
Broad duties assigned at beginning of projects;
Work is reviewed to ensure policy conformity and soundness of approach.
50
Management Level
Reports to supervisor who has up to 100 direct and indirect reports;
Works with self-initiated interaction with supervisor and self-initiated technical guidance;
Broad duties with authority to influence duties;
Work is reviewed to ensure conformity with policy and for coordination of other company departments;
60
Advisor Level Reports to supervisor who has over 100 direct and indirect reports;
Works with self-initiated interaction with supervisor and self-initiated technical guidance;
Influence over duties;
Work is reviewed to ensure conformity with policy and for coordination of other company departments;
80
Expert Level Reports directly to company owners;
Works with occasional interaction with company owners;
Influence over duties;
Work is reviewed to ensure company direction meets company vision and mission.
105
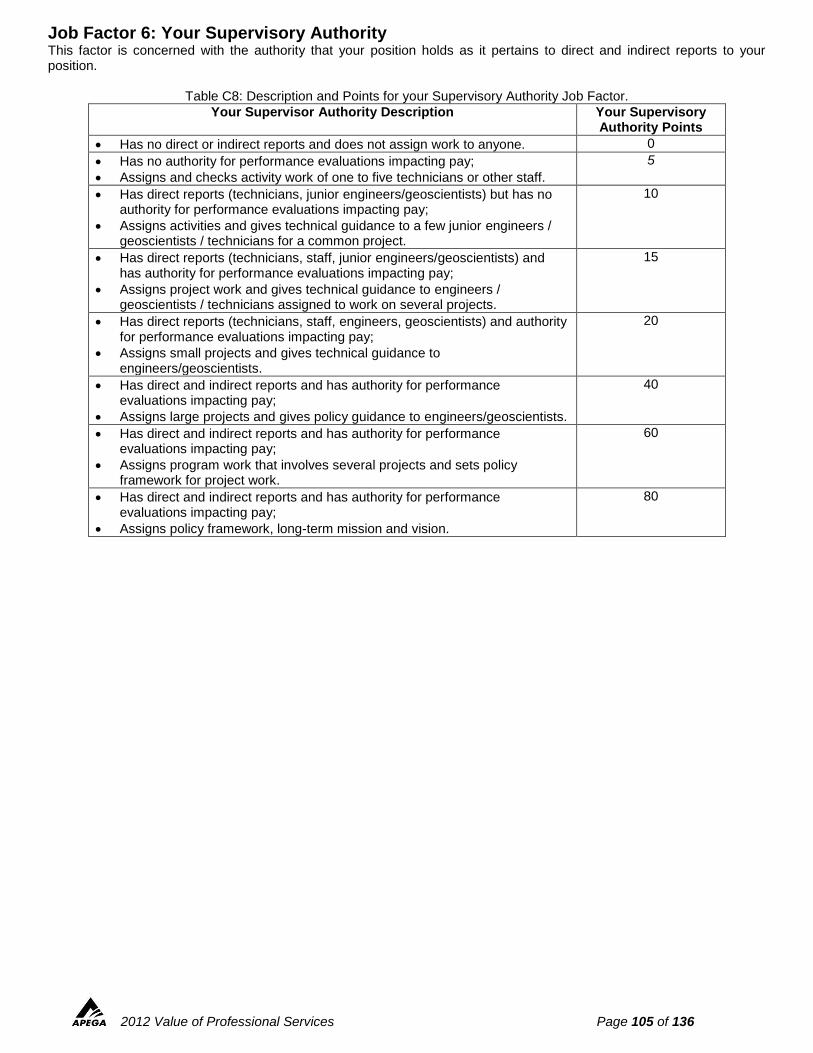
2012 Value of Professional Services Page 105 of 136
Job Factor 6: Your Supervisory Authority This factor is concerned with the authority that your position holds as it pertains to direct and indirect reports to your position.
Table C8: Description and Points for your Supervisory Authority Job Factor.
Your Supervisor Authority Description Your Supervisory Authority Points
Has no direct or indirect reports and does not assign work to anyone. 0
Has no authority for performance evaluations impacting pay;
Assigns and checks activity work of one to five technicians or other staff.
5
Has direct reports (technicians, junior engineers/geoscientists) but has no authority for performance evaluations impacting pay;
Assigns activities and gives technical guidance to a few junior engineers / geoscientists / technicians for a common project.
10
Has direct reports (technicians, staff, junior engineers/geoscientists) and has authority for performance evaluations impacting pay;
Assigns project work and gives technical guidance to engineers / geoscientists / technicians assigned to work on several projects.
15
Has direct reports (technicians, staff, engineers, geoscientists) and authority for performance evaluations impacting pay;
Assigns small projects and gives technical guidance to engineers/geoscientists.
20
Has direct and indirect reports and has authority for performance evaluations impacting pay;
Assigns large projects and gives policy guidance to engineers/geoscientists.
40
Has direct and indirect reports and has authority for performance evaluations impacting pay;
Assigns program work that involves several projects and sets policy framework for project work.
60
Has direct and indirect reports and has authority for performance evaluations impacting pay;
Assigns policy framework, long-term mission and vision.
80
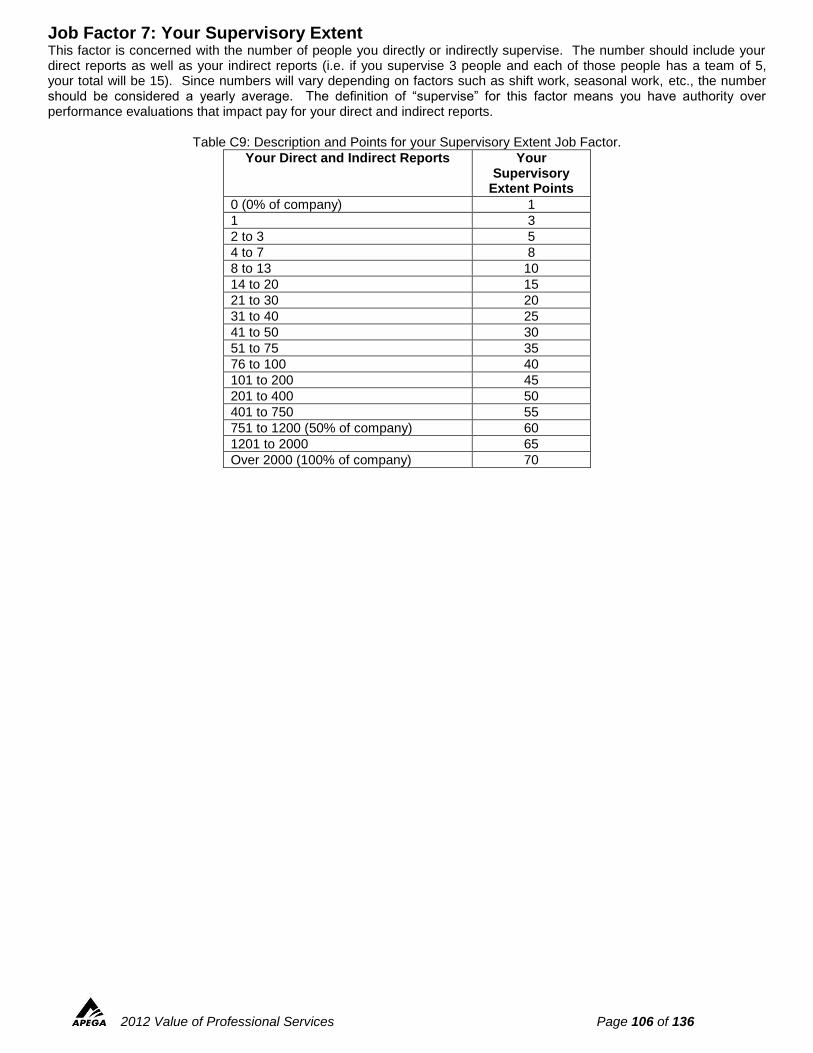
2012 Value of Professional Services Page 106 of 136
Job Factor 7: Your Supervisory Extent This factor is concerned with the number of people you directly or indirectly supervise. The number should include your direct reports as well as your indirect reports (i.e. if you supervise 3 people and each of those people has a team of 5, your total will be 15). Since numbers will vary depending on factors such as shift work, seasonal work, etc., the number should be considered a yearly average. The definition of “supervise” for this factor means you have authority over performance evaluations that impact pay for your direct and indirect reports.
Table C9: Description and Points for your Supervisory Extent Job Factor.
Your Direct and Indirect Reports Your Supervisory
Extent Points
0 (0% of company) 1
1 3
2 to 3 5
4 to 7 8
8 to 13 10
14 to 20 15
21 to 30 20
31 to 40 25
41 to 50 30
51 to 75 35
76 to 100 40
101 to 200 45
201 to 400 50
401 to 750 55
751 to 1200 (50% of company) 60
1201 to 2000 65
Over 2000 (100% of company) 70
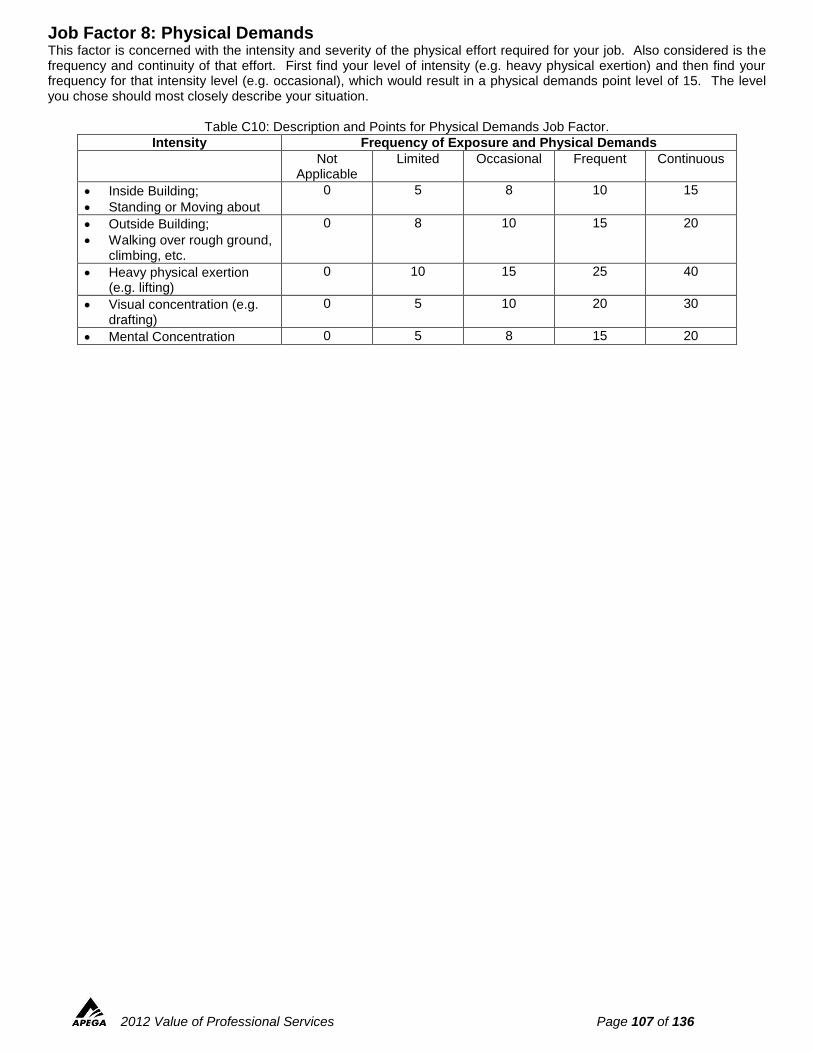
2012 Value of Professional Services Page 107 of 136
Job Factor 8: Physical Demands This factor is concerned with the intensity and severity of the physical effort required for your job. Also considered is the frequency and continuity of that effort. First find your level of intensity (e.g. heavy physical exertion) and then find your frequency for that intensity level (e.g. occasional), which would result in a physical demands point level of 15. The level you chose should most closely describe your situation.
Table C10: Description and Points for Physical Demands Job Factor.
Intensity Frequency of Exposure and Physical Demands
Not Applicable
Limited Occasional Frequent Continuous
Inside Building;
Standing or Moving about
0 5 8 10 15
Outside Building;
Walking over rough ground, climbing, etc.
0 8 10 15 20
Heavy physical exertion (e.g. lifting)
0 10 15 25 40
Visual concentration (e.g. drafting)
0 5 10 20 30
Mental Concentration 0 5 8 15 20
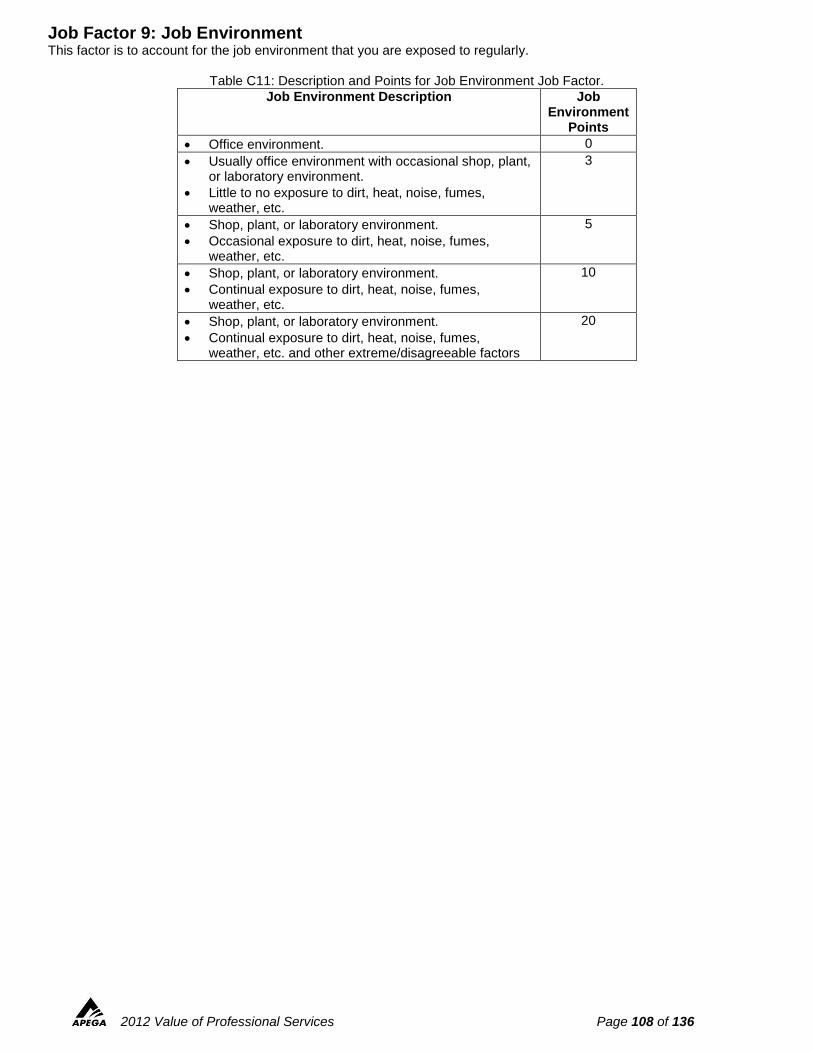
2012 Value of Professional Services Page 108 of 136
Job Factor 9: Job Environment This factor is to account for the job environment that you are exposed to regularly.
Table C11: Description and Points for Job Environment Job Factor.
Job Environment Description Job Environment
Points
Office environment. 0
Usually office environment with occasional shop, plant, or laboratory environment.
Little to no exposure to dirt, heat, noise, fumes, weather, etc.
3
Shop, plant, or laboratory environment.
Occasional exposure to dirt, heat, noise, fumes, weather, etc.
5
Shop, plant, or laboratory environment.
Continual exposure to dirt, heat, noise, fumes, weather, etc.
10
Shop, plant, or laboratory environment.
Continual exposure to dirt, heat, noise, fumes, weather, etc. and other extreme/disagreeable factors
20
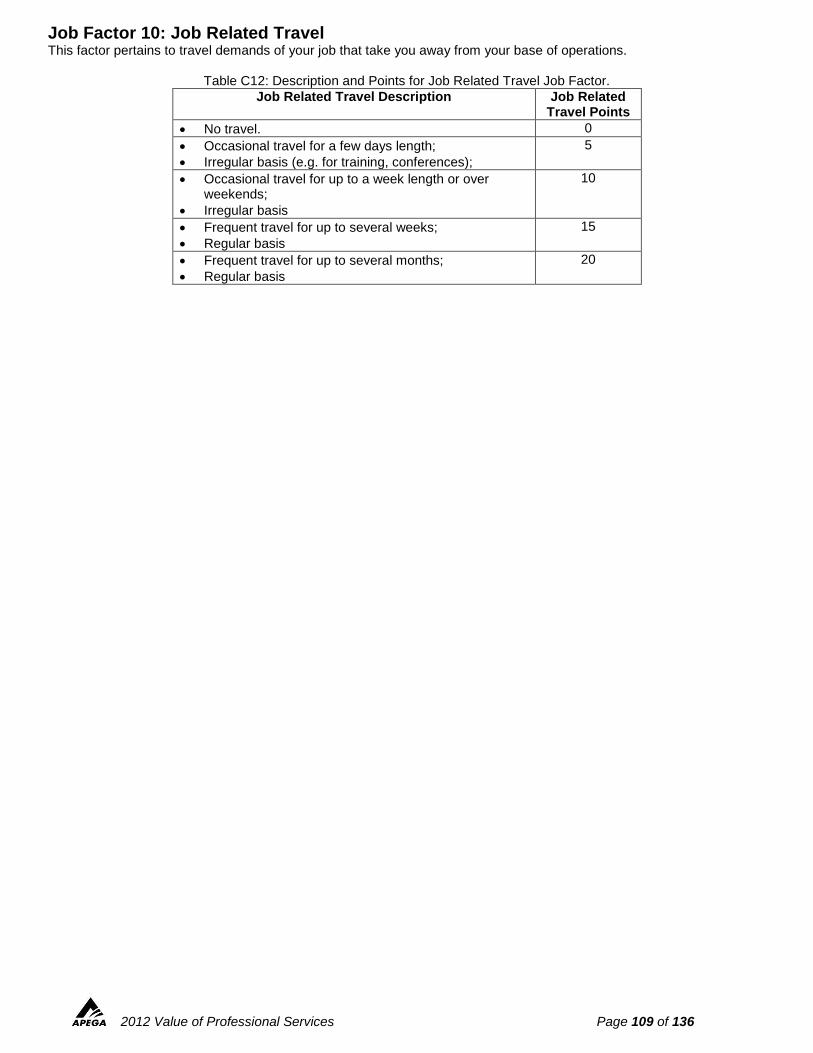
2012 Value of Professional Services Page 109 of 136
Job Factor 10: Job Related Travel This factor pertains to travel demands of your job that take you away from your base of operations.
Table C12: Description and Points for Job Related Travel Job Factor.
Job Related Travel Description Job Related Travel Points
No travel. 0
Occasional travel for a few days length;
Irregular basis (e.g. for training, conferences);
5
Occasional travel for up to a week length or over weekends;
Irregular basis
10
Frequent travel for up to several weeks;
Regular basis
15
Frequent travel for up to several months;
Regular basis
20
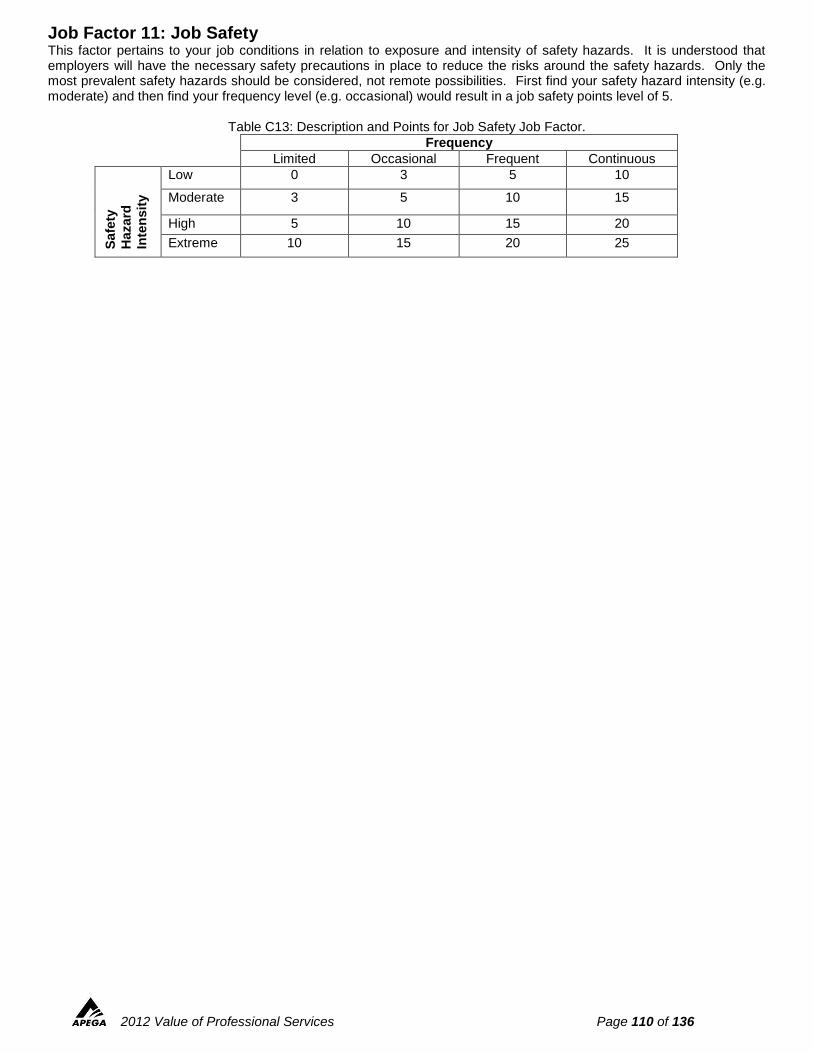
2012 Value of Professional Services Page 110 of 136
Job Factor 11: Job Safety This factor pertains to your job conditions in relation to exposure and intensity of safety hazards. It is understood that employers will have the necessary safety precautions in place to reduce the risks around the safety hazards. Only the most prevalent safety hazards should be considered, not remote possibilities. First find your safety hazard intensity (e.g. moderate) and then find your frequency level (e.g. occasional) would result in a job safety points level of 5.
Table C13: Description and Points for Job Safety Job Factor.
Frequency
Limited Occasional Frequent Continuous
Safe
ty
Hazard
Inte
nsit
y
Low 0 3 5 10
Moderate 3 5 10 15
High 5 10 15 20
Extreme 10 15 20 25

2012 Value of Professional Services Page 111 of 136
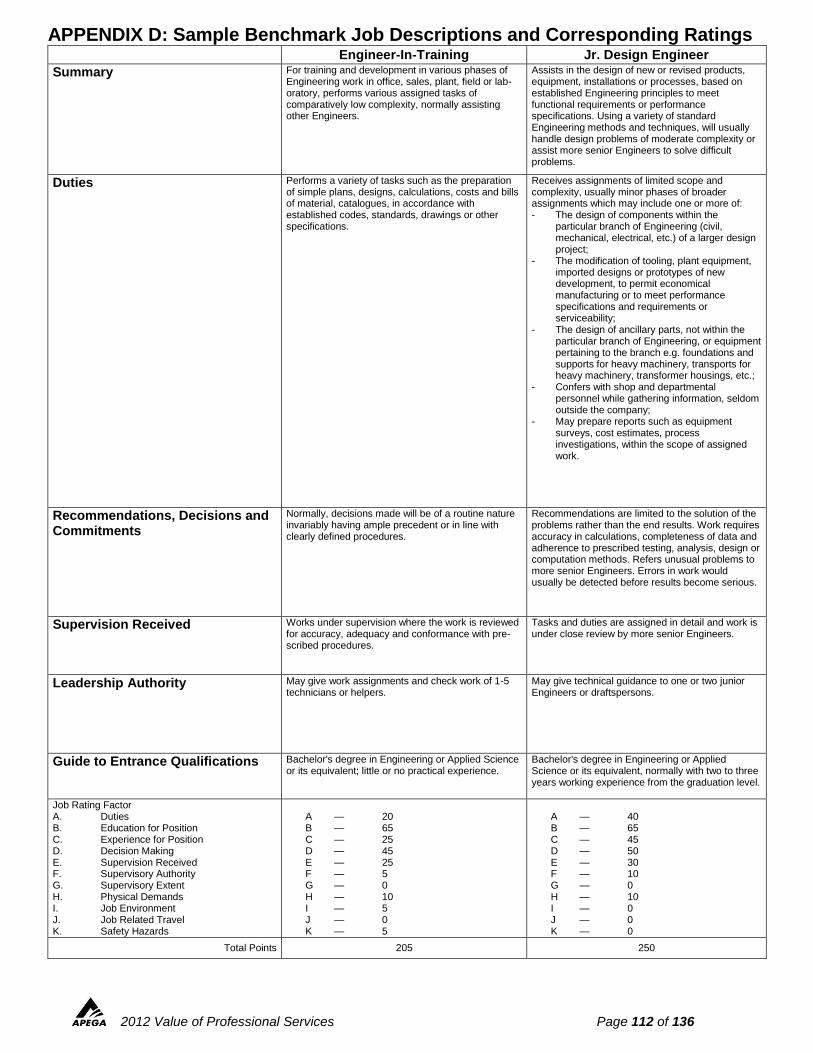
2012 Value of Professional Services Page 112 of 136
APPENDIX D: Sample Benchmark Job Descriptions and Corresponding Ratings Engineer-In-Training Jr. Design Engineer
Summary For training and development in various phases of Engineering work in office, sales, plant, field or lab-oratory, performs various assigned tasks of comparatively low complexity, normally assisting other Engineers.
Assists in the design of new or revised products, equipment, installations or processes, based on established Engineering principles to meet functional requirements or performance specifications. Using a variety of standard Engineering methods and techniques, will usually handle design problems of moderate complexity or assist more senior Engineers to solve difficult problems.
Duties Performs a variety of tasks such as the preparation of simple plans, designs, calculations, costs and bills of material, catalogues, in accordance with established codes, standards, drawings or other specifications.
Receives assignments of limited scope and complexity, usually minor phases of broader assignments which may include one or more of: - The design of components within the
particular branch of Engineering (civil, mechanical, electrical, etc.) of a larger design project;
- The modification of tooling, plant equipment, imported designs or prototypes of new development, to permit economical manufacturing or to meet performance specifications and requirements or serviceability;
- The design of ancillary parts, not within the particular branch of Engineering, or equipment pertaining to the branch e.g. foundations and supports for heavy machinery, transports for heavy machinery, transformer housings, etc.;
- Confers with shop and departmental personnel while gathering information, seldom outside the company;
- May prepare reports such as equipment surveys, cost estimates, process investigations, within the scope of assigned work.
Recommendations, Decisions and Commitments
Normally, decisions made will be of a routine nature invariably having ample precedent or in line with clearly defined procedures.
Recommendations are limited to the solution of the problems rather than the end results. Work requires accuracy in calculations, completeness of data and adherence to prescribed testing, analysis, design or computation methods. Refers unusual problems to more senior Engineers. Errors in work would usually be detected before results become serious.
Supervision Received Works under supervision where the work is reviewed for accuracy, adequacy and conformance with pre-scribed procedures.
Tasks and duties are assigned in detail and work is under close review by more senior Engineers.
Leadership Authority May give work assignments and check work of 1-5 technicians or helpers.
May give technical guidance to one or two junior Engineers or draftspersons.
Guide to Entrance Qualifications Bachelor's degree in Engineering or Applied Science or its equivalent; little or no practical experience.
Bachelor's degree in Engineering or Applied Science or its equivalent, normally with two to three years working experience from the graduation level.
Job Rating Factor A. Duties B. Education for Position C. Experience for Position D. Decision Making E. Supervision Received F. Supervisory Authority G. Supervisory Extent H. Physical Demands I. Job Environment J. Job Related Travel K. Safety Hazards
A — 20 B — 65 C — 25 D — 45 E — 25 F — 5 G — 0 H — 10 I — 5 J — 0 K — 5
A — 40 B — 65 C — 45 D — 50 E — 30 F — 10 G — 0 H — 10 I — 0 J — 0 K — 0
Total Points 205 250
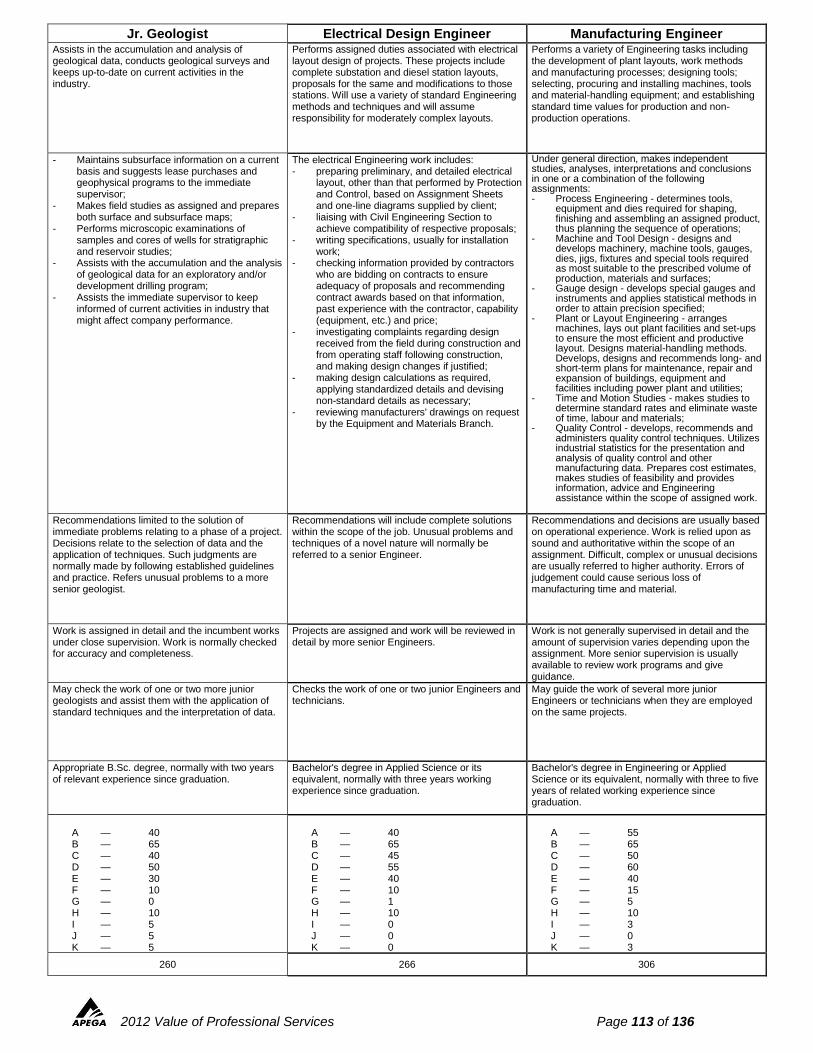
2012 Value of Professional Services Page 113 of 136
Jr. Geologist Electrical Design Engineer Manufacturing Engineer Assists in the accumulation and analysis of geological data, conducts geological surveys and keeps up-to-date on current activities in the industry.
Performs assigned duties associated with electrical layout design of projects. These projects include complete substation and diesel station layouts, proposals for the same and modifications to those stations. Will use a variety of standard Engineering methods and techniques and will assume responsibility for moderately complex layouts.
Performs a variety of Engineering tasks including the development of plant layouts, work methods and manufacturing processes; designing tools; selecting, procuring and installing machines, tools and material-handling equipment; and establishing standard time values for production and non-production operations.
- Maintains subsurface information on a current basis and suggests lease purchases and geophysical programs to the immediate supervisor;
- Makes field studies as assigned and prepares both surface and subsurface maps;
- Performs microscopic examinations of samples and cores of wells for stratigraphic and reservoir studies;
- Assists with the accumulation and the analysis of geological data for an exploratory and/or development drilling program;
- Assists the immediate supervisor to keep informed of current activities in industry that might affect company performance.
The electrical Engineering work includes: - preparing preliminary, and detailed electrical
layout, other than that performed by Protection and Control, based on Assignment Sheets and one-line diagrams supplied by client;
- liaising with Civil Engineering Section to achieve compatibility of respective proposals;
- writing specifications, usually for installation work;
- checking information provided by contractors who are bidding on contracts to ensure adequacy of proposals and recommending contract awards based on that information, past experience with the contractor, capability (equipment, etc.) and price;
- investigating complaints regarding design received from the field during construction and from operating staff following construction, and making design changes if justified;
- making design calculations as required, applying standardized details and devising non-standard details as necessary;
- reviewing manufacturers' drawings on request by the Equipment and Materials Branch.
Under general direction, makes independent studies, analyses, interpretations and conclusions in one or a combination of the following assignments: - Process Engineering - determines tools,
equipment and dies required for shaping, finishing and assembling an assigned product, thus planning the sequence of operations;
- Machine and Tool Design - designs and develops machinery, machine tools, gauges, dies, jigs, fixtures and special tools required as most suitable to the prescribed volume of production, materials and surfaces;
- Gauge design - develops special gauges and instruments and applies statistical methods in order to attain precision specified;
- Plant or Layout Engineering - arranges machines, lays out plant facilities and set-ups to ensure the most efficient and productive layout. Designs material-handling methods. Develops, designs and recommends long- and short-term plans for maintenance, repair and expansion of buildings, equipment and facilities including power plant and utilities;
- Time and Motion Studies - makes studies to determine standard rates and eliminate waste of time, labour and materials;
- Quality Control - develops, recommends and administers quality control techniques. Utilizes industrial statistics for the presentation and analysis of quality control and other manufacturing data. Prepares cost estimates, makes studies of feasibility and provides information, advice and Engineering assistance within the scope of assigned work.
Recommendations limited to the solution of immediate problems relating to a phase of a project. Decisions relate to the selection of data and the application of techniques. Such judgments are normally made by following established guidelines and practice. Refers unusual problems to a more senior geologist.
Recommendations will include complete solutions within the scope of the job. Unusual problems and techniques of a novel nature will normally be referred to a senior Engineer.
Recommendations and decisions are usually based on operational experience. Work is relied upon as sound and authoritative within the scope of an assignment. Difficult, complex or unusual decisions are usually referred to higher authority. Errors of judgement could cause serious loss of manufacturing time and material.
Work is assigned in detail and the incumbent works under close supervision. Work is normally checked for accuracy and completeness.
Projects are assigned and work will be reviewed in detail by more senior Engineers.
Work is not generally supervised in detail and the amount of supervision varies depending upon the assignment. More senior supervision is usually available to review work programs and give guidance.
May check the work of one or two more junior geologists and assist them with the application of standard techniques and the interpretation of data.
Checks the work of one or two junior Engineers and technicians.
May guide the work of several more junior Engineers or technicians when they are employed on the same projects.
Appropriate B.Sc. degree, normally with two years of relevant experience since graduation.
Bachelor's degree in Applied Science or its equivalent, normally with three years working experience since graduation.
Bachelor's degree in Engineering or Applied Science or its equivalent, normally with three to five years of related working experience since graduation.
A — 40 B — 65 C — 40 D — 50 E — 30 F — 10 G — 0 H — 10 I — 5 J — 5 K — 5
A — 40 B — 65 C — 45 D — 55 E — 40 F — 10 G — 1 H — 10 I — 0 J — 0 K — 0
A — 55 B — 65 C — 50 D — 60 E — 40 F — 15 G — 5 H — 10 I — 3 J — 0 K — 3
260 266 306
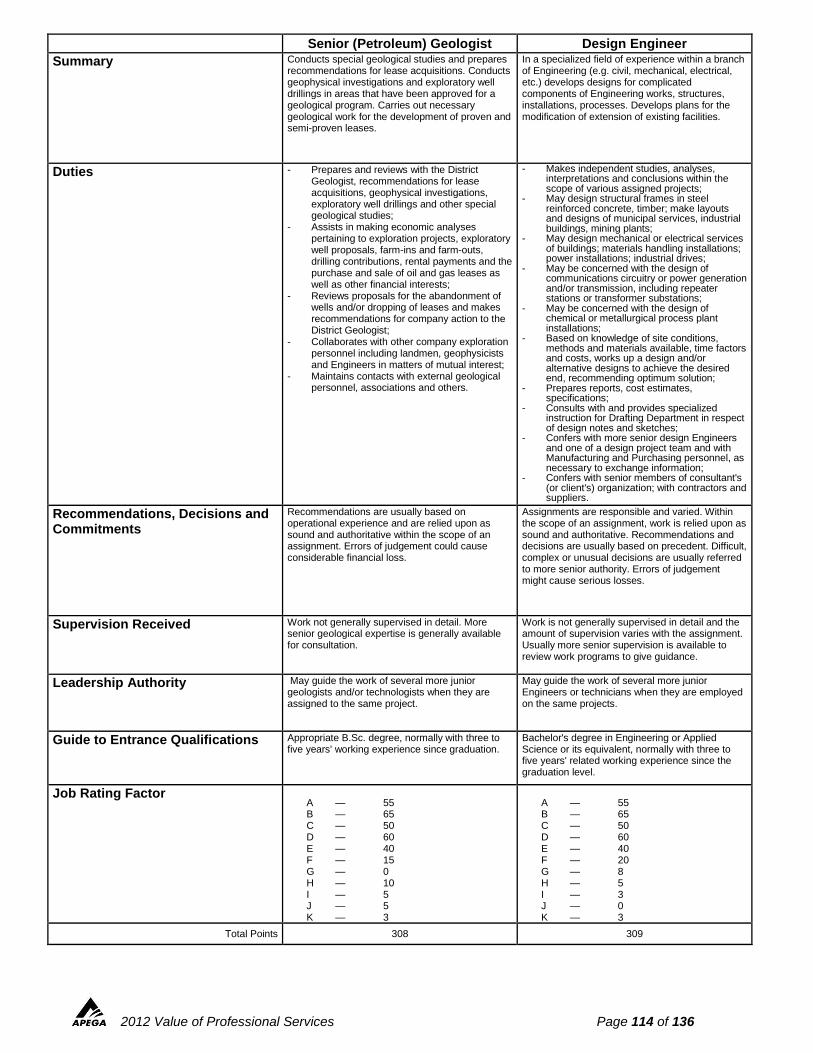
2012 Value of Professional Services Page 114 of 136
Senior (Petroleum) Geologist Design Engineer
Summary Conducts special geological studies and prepares recommendations for lease acquisitions. Conducts geophysical investigations and exploratory well drillings in areas that have been approved for a geological program. Carries out necessary geological work for the development of proven and semi-proven leases.
In a specialized field of experience within a branch of Engineering (e.g. civil, mechanical, electrical, etc.) develops designs for complicated components of Engineering works, structures, installations, processes. Develops plans for the modification of extension of existing facilities.
Duties - Prepares and reviews with the District Geologist, recommendations for lease acquisitions, geophysical investigations, exploratory well drillings and other special geological studies;
- Assists in making economic analyses pertaining to exploration projects, exploratory well proposals, farm-ins and farm-outs, drilling contributions, rental payments and the purchase and sale of oil and gas leases as well as other financial interests;
- Reviews proposals for the abandonment of wells and/or dropping of leases and makes recommendations for company action to the District Geologist;
- Collaborates with other company exploration personnel including landmen, geophysicists and Engineers in matters of mutual interest;
- Maintains contacts with external geological personnel, associations and others.
- Makes independent studies, analyses, interpretations and conclusions within the scope of various assigned projects;
- May design structural frames in steel reinforced concrete, timber; make layouts and designs of municipal services, industrial buildings, mining plants;
- May design mechanical or electrical services of buildings; materials handling installations; power installations; industrial drives;
- May be concerned with the design of communications circuitry or power generation and/or transmission, including repeater stations or transformer substations;
- May be concerned with the design of chemical or metallurgical process plant installations;
- Based on knowledge of site conditions, methods and materials available, time factors and costs, works up a design and/or alternative designs to achieve the desired end, recommending optimum solution;
- Prepares reports, cost estimates, specifications;
- Consults with and provides specialized instruction for Drafting Department in respect of design notes and sketches;
- Confers with more senior design Engineers and one of a design project team and with Manufacturing and Purchasing personnel, as necessary to exchange information;
- Confers with senior members of consultant's (or client's) organization; with contractors and suppliers.
Recommendations, Decisions and Commitments
Recommendations are usually based on operational experience and are relied upon as sound and authoritative within the scope of an assignment. Errors of judgement could cause considerable financial loss.
Assignments are responsible and varied. Within the scope of an assignment, work is relied upon as sound and authoritative. Recommendations and decisions are usually based on precedent. Difficult, complex or unusual decisions are usually referred to more senior authority. Errors of judgement might cause serious losses.
Supervision Received Work not generally supervised in detail. More senior geological expertise is generally available for consultation.
Work is not generally supervised in detail and the amount of supervision varies with the assignment. Usually more senior supervision is available to review work programs to give guidance.
Leadership Authority May guide the work of several more junior geologists and/or technologists when they are assigned to the same project.
May guide the work of several more junior Engineers or technicians when they are employed on the same projects.
Guide to Entrance Qualifications Appropriate B.Sc. degree, normally with three to five years' working experience since graduation.
Bachelor's degree in Engineering or Applied Science or its equivalent, normally with three to five years' related working experience since the graduation level.
Job Rating Factor A — 55 B — 65 C — 50 D — 60 E — 40 F — 15 G — 0 H — 10 I — 5 J — 5 K — 3
A — 55 B — 65 C — 50 D — 60 E — 40 F — 20 G — 8 H — 5 I — 3 J — 0 K — 3
Total Points 308 309
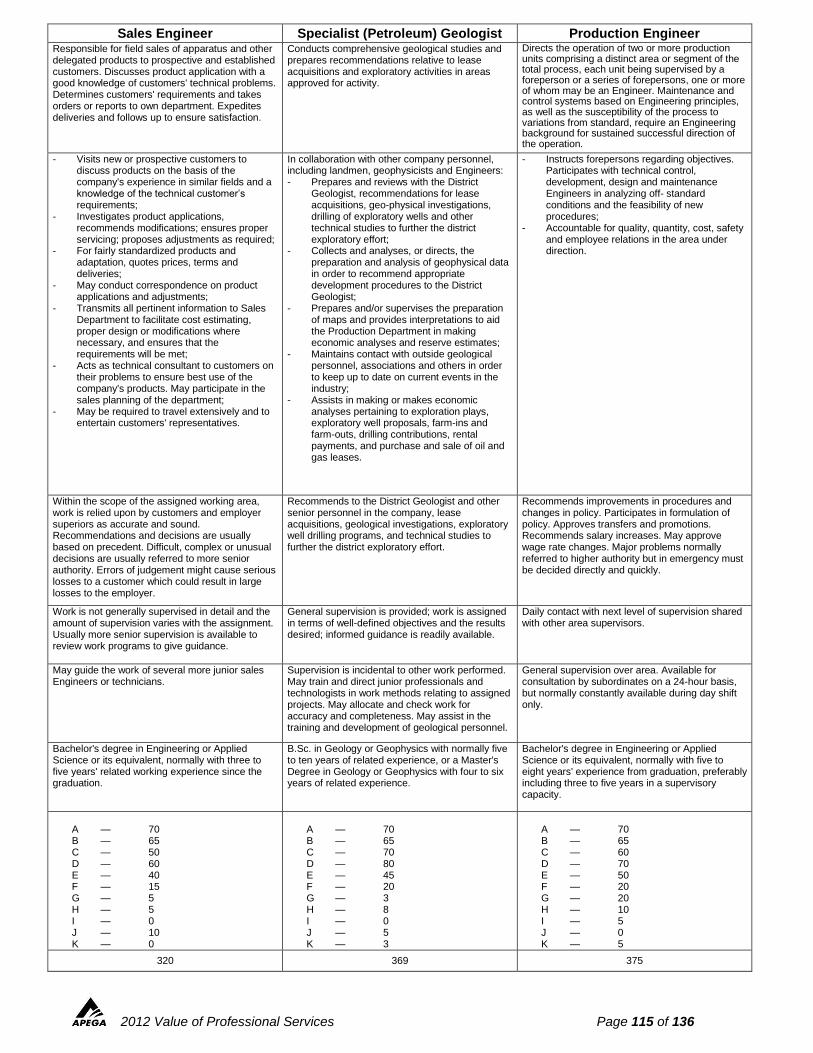
2012 Value of Professional Services Page 115 of 136
Sales Engineer Specialist (Petroleum) Geologist Production Engineer Responsible for field sales of apparatus and other delegated products to prospective and established customers. Discusses product application with a good knowledge of customers' technical problems. Determines customers' requirements and takes orders or reports to own department. Expedites deliveries and follows up to ensure satisfaction.
Conducts comprehensive geological studies and prepares recommendations relative to lease acquisitions and exploratory activities in areas approved for activity.
Directs the operation of two or more production units comprising a distinct area or segment of the total process, each unit being supervised by a foreperson or a series of forepersons, one or more of whom may be an Engineer. Maintenance and control systems based on Engineering principles, as well as the susceptibility of the process to variations from standard, require an Engineering background for sustained successful direction of the operation.
- Visits new or prospective customers to discuss products on the basis of the company's experience in similar fields and a knowledge of the technical customer’s requirements;
- Investigates product applications, recommends modifications; ensures proper servicing; proposes adjustments as required;
- For fairly standardized products and adaptation, quotes prices, terms and deliveries;
- May conduct correspondence on product applications and adjustments;
- Transmits all pertinent information to Sales Department to facilitate cost estimating, proper design or modifications where necessary, and ensures that the requirements will be met;
- Acts as technical consultant to customers on their problems to ensure best use of the company's products. May participate in the sales planning of the department;
- May be required to travel extensively and to entertain customers' representatives.
In collaboration with other company personnel, including landmen, geophysicists and Engineers: - Prepares and reviews with the District
Geologist, recommendations for lease acquisitions, geo-physical investigations, drilling of exploratory wells and other technical studies to further the district exploratory effort;
- Collects and analyses, or directs, the preparation and analysis of geophysical data in order to recommend appropriate development procedures to the District Geologist;
- Prepares and/or supervises the preparation of maps and provides interpretations to aid the Production Department in making economic analyses and reserve estimates;
- Maintains contact with outside geological personnel, associations and others in order to keep up to date on current events in the industry;
- Assists in making or makes economic analyses pertaining to exploration plays, exploratory well proposals, farm-ins and farm-outs, drilling contributions, rental payments, and purchase and sale of oil and gas leases.
- Instructs forepersons regarding objectives. Participates with technical control, development, design and maintenance Engineers in analyzing off- standard conditions and the feasibility of new procedures;
- Accountable for quality, quantity, cost, safety and employee relations in the area under direction.
Within the scope of the assigned working area, work is relied upon by customers and employer superiors as accurate and sound. Recommendations and decisions are usually based on precedent. Difficult, complex or unusual decisions are usually referred to more senior authority. Errors of judgement might cause serious losses to a customer which could result in large losses to the employer.
Recommends to the District Geologist and other senior personnel in the company, lease acquisitions, geological investigations, exploratory well drilling programs, and technical studies to further the district exploratory effort.
Recommends improvements in procedures and changes in policy. Participates in formulation of policy. Approves transfers and promotions. Recommends salary increases. May approve wage rate changes. Major problems normally referred to higher authority but in emergency must be decided directly and quickly.
Work is not generally supervised in detail and the amount of supervision varies with the assignment. Usually more senior supervision is available to review work programs to give guidance.
General supervision is provided; work is assigned in terms of well-defined objectives and the results desired; informed guidance is readily available.
Daily contact with next level of supervision shared with other area supervisors.
May guide the work of several more junior sales Engineers or technicians.
Supervision is incidental to other work performed. May train and direct junior professionals and technologists in work methods relating to assigned projects. May allocate and check work for accuracy and completeness. May assist in the training and development of geological personnel.
General supervision over area. Available for consultation by subordinates on a 24-hour basis, but normally constantly available during day shift only.
Bachelor's degree in Engineering or Applied Science or its equivalent, normally with three to five years' related working experience since the graduation.
B.Sc. in Geology or Geophysics with normally five to ten years of related experience, or a Master's Degree in Geology or Geophysics with four to six years of related experience.
Bachelor's degree in Engineering or Applied Science or its equivalent, normally with five to eight years' experience from graduation, preferably including three to five years in a supervisory capacity.
A — 70 B — 65 C — 50 D — 60 E — 40 F — 15 G — 5 H — 5 I — 0 J — 10 K — 0
A — 70 B — 65 C — 70 D — 80 E — 45 F — 20 G — 3 H — 8 I — 0 J — 5 K — 3
A — 70 B — 65 C — 60 D — 70 E — 50 F — 20 G — 20 H — 10 I — 5 J — 0 K — 5
320 369 375
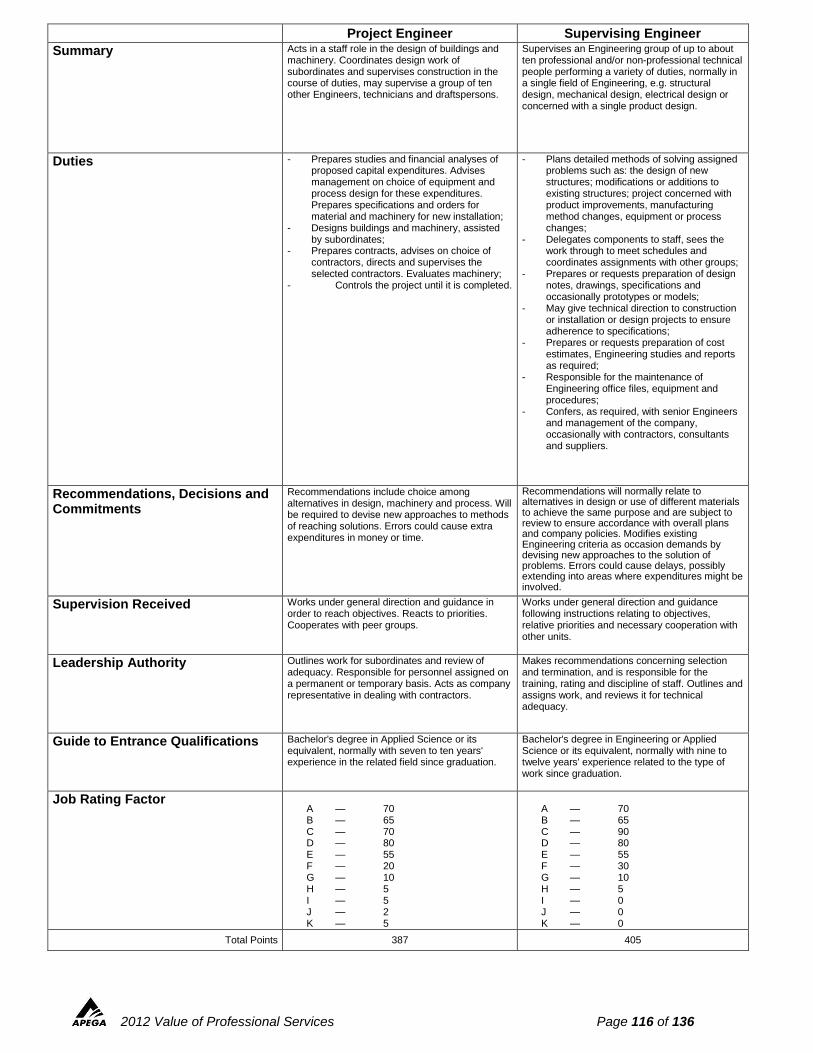
2012 Value of Professional Services Page 116 of 136
Project Engineer Supervising Engineer
Summary Acts in a staff role in the design of buildings and machinery. Coordinates design work of subordinates and supervises construction in the course of duties, may supervise a group of ten other Engineers, technicians and draftspersons.
Supervises an Engineering group of up to about ten professional and/or non-professional technical people performing a variety of duties, normally in a single field of Engineering, e.g. structural design, mechanical design, electrical design or concerned with a single product design.
Duties - Prepares studies and financial analyses of proposed capital expenditures. Advises management on choice of equipment and process design for these expenditures. Prepares specifications and orders for material and machinery for new installation;
- Designs buildings and machinery, assisted by subordinates;
- Prepares contracts, advises on choice of contractors, directs and supervises the selected contractors. Evaluates machinery;
- Controls the project until it is completed.
- Plans detailed methods of solving assigned problems such as: the design of new structures; modifications or additions to existing structures; project concerned with product improvements, manufacturing method changes, equipment or process changes;
- Delegates components to staff, sees the work through to meet schedules and coordinates assignments with other groups;
- Prepares or requests preparation of design notes, drawings, specifications and occasionally prototypes or models;
- May give technical direction to construction or installation or design projects to ensure adherence to specifications;
- Prepares or requests preparation of cost estimates, Engineering studies and reports as required;
- Responsible for the maintenance of Engineering office files, equipment and procedures;
- Confers, as required, with senior Engineers and management of the company, occasionally with contractors, consultants and suppliers.
Recommendations, Decisions and Commitments
Recommendations include choice among alternatives in design, machinery and process. Will be required to devise new approaches to methods of reaching solutions. Errors could cause extra expenditures in money or time.
Recommendations will normally relate to alternatives in design or use of different materials to achieve the same purpose and are subject to review to ensure accordance with overall plans and company policies. Modifies existing Engineering criteria as occasion demands by devising new approaches to the solution of problems. Errors could cause delays, possibly extending into areas where expenditures might be involved.
Supervision Received Works under general direction and guidance in order to reach objectives. Reacts to priorities. Cooperates with peer groups.
Works under general direction and guidance following instructions relating to objectives, relative priorities and necessary cooperation with other units.
Leadership Authority Outlines work for subordinates and review of adequacy. Responsible for personnel assigned on a permanent or temporary basis. Acts as company representative in dealing with contractors.
Makes recommendations concerning selection and termination, and is responsible for the training, rating and discipline of staff. Outlines and assigns work, and reviews it for technical adequacy.
Guide to Entrance Qualifications Bachelor's degree in Applied Science or its equivalent, normally with seven to ten years' experience in the related field since graduation.
Bachelor's degree in Engineering or Applied Science or its equivalent, normally with nine to twelve years' experience related to the type of work since graduation.
Job Rating Factor A — 70 B — 65 C — 70 D — 80 E — 55 F — 20 G — 10 H — 5 I — 5 J — 2 K — 5
A — 70 B — 65 C — 90 D — 80 E — 55 F — 30 G — 10 H — 5 I — 0 J — 0 K — 0
Total Points 387 405
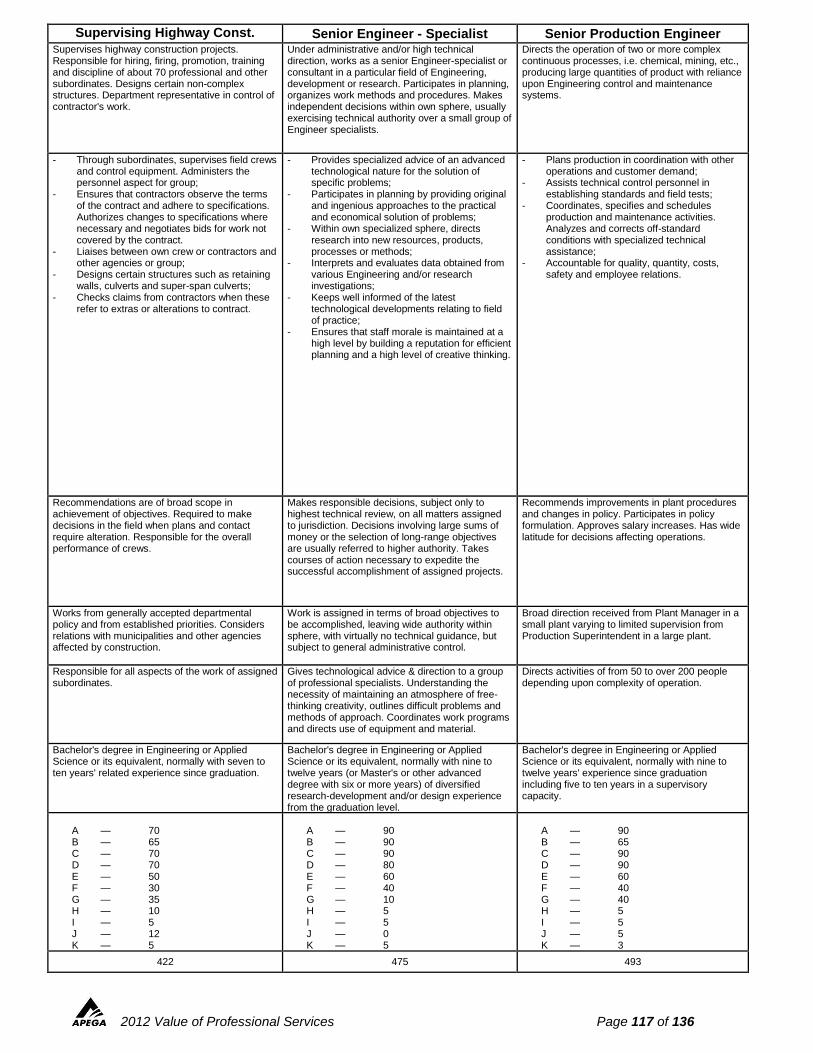
2012 Value of Professional Services Page 117 of 136
Supervising Highway Const. Engineer
Senior Engineer - Specialist Senior Production Engineer Supervises highway construction projects. Responsible for hiring, firing, promotion, training and discipline of about 70 professional and other subordinates. Designs certain non-complex structures. Department representative in control of contractor's work.
Under administrative and/or high technical direction, works as a senior Engineer-specialist or consultant in a particular field of Engineering, development or research. Participates in planning, organizes work methods and procedures. Makes independent decisions within own sphere, usually exercising technical authority over a small group of Engineer specialists.
Directs the operation of two or more complex continuous processes, i.e. chemical, mining, etc., producing large quantities of product with reliance upon Engineering control and maintenance systems.
- Through subordinates, supervises field crews and control equipment. Administers the personnel aspect for group;
- Ensures that contractors observe the terms of the contract and adhere to specifications. Authorizes changes to specifications where necessary and negotiates bids for work not covered by the contract.
- Liaises between own crew or contractors and other agencies or group;
- Designs certain structures such as retaining walls, culverts and super-span culverts;
- Checks claims from contractors when these refer to extras or alterations to contract.
- Provides specialized advice of an advanced technological nature for the solution of specific problems;
- Participates in planning by providing original and ingenious approaches to the practical and economical solution of problems;
- Within own specialized sphere, directs research into new resources, products, processes or methods;
- Interprets and evaluates data obtained from various Engineering and/or research investigations;
- Keeps well informed of the latest technological developments relating to field of practice;
- Ensures that staff morale is maintained at a high level by building a reputation for efficient planning and a high level of creative thinking.
- Plans production in coordination with other operations and customer demand;
- Assists technical control personnel in establishing standards and field tests;
- Coordinates, specifies and schedules production and maintenance activities. Analyzes and corrects off-standard conditions with specialized technical assistance;
- Accountable for quality, quantity, costs, safety and employee relations.
Recommendations are of broad scope in achievement of objectives. Required to make decisions in the field when plans and contact require alteration. Responsible for the overall performance of crews.
Makes responsible decisions, subject only to highest technical review, on all matters assigned to jurisdiction. Decisions involving large sums of money or the selection of long-range objectives are usually referred to higher authority. Takes courses of action necessary to expedite the successful accomplishment of assigned projects.
Recommends improvements in plant procedures and changes in policy. Participates in policy formulation. Approves salary increases. Has wide latitude for decisions affecting operations.
Works from generally accepted departmental policy and from established priorities. Considers relations with municipalities and other agencies affected by construction.
Work is assigned in terms of broad objectives to be accomplished, leaving wide authority within sphere, with virtually no technical guidance, but subject to general administrative control.
Broad direction received from Plant Manager in a small plant varying to limited supervision from Production Superintendent in a large plant.
Responsible for all aspects of the work of assigned subordinates.
Gives technological advice & direction to a group of professional specialists. Understanding the necessity of maintaining an atmosphere of free-thinking creativity, outlines difficult problems and methods of approach. Coordinates work programs and directs use of equipment and material.
Directs activities of from 50 to over 200 people depending upon complexity of operation.
Bachelor's degree in Engineering or Applied Science or its equivalent, normally with seven to ten years' related experience since graduation.
Bachelor's degree in Engineering or Applied Science or its equivalent, normally with nine to twelve years (or Master's or other advanced degree with six or more years) of diversified research-development and/or design experience from the graduation level.
Bachelor's degree in Engineering or Applied Science or its equivalent, normally with nine to twelve years' experience since graduation including five to ten years in a supervisory capacity.
A — 70 B — 65 C — 70 D — 70 E — 50 F — 30 G — 35 H — 10 I — 5 J — 12 K — 5
A — 90 B — 90 C — 90 D — 80 E — 60 F — 40 G — 10 H — 5 I — 5 J — 0 K — 5
A — 90 B — 65 C — 90 D — 90 E — 60 F — 40 G — 40 H — 5 I — 5 J — 5 K — 3
422 475 493
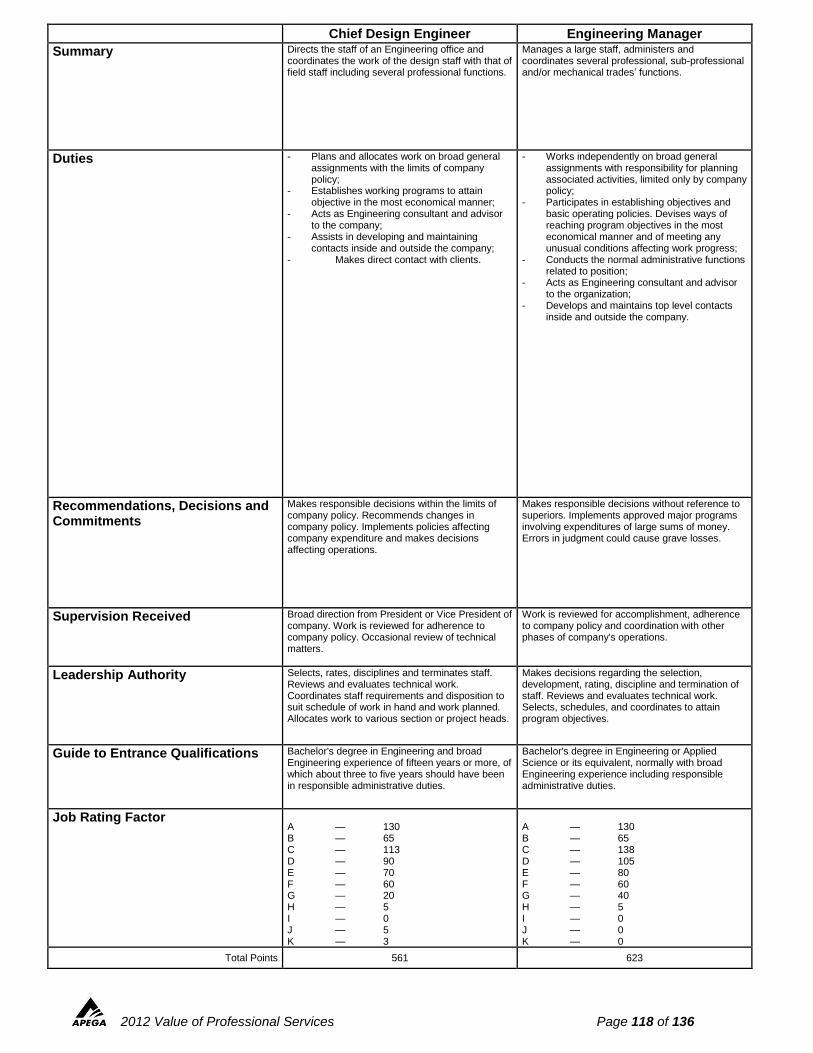
2012 Value of Professional Services Page 118 of 136
Chief Design Engineer Engineering Manager
Summary Directs the staff of an Engineering office and coordinates the work of the design staff with that of field staff including several professional functions.
Manages a large staff, administers and coordinates several professional, sub-professional and/or mechanical trades’ functions.
Duties - Plans and allocates work on broad general assignments with the limits of company policy;
- Establishes working programs to attain objective in the most economical manner;
- Acts as Engineering consultant and advisor to the company;
- Assists in developing and maintaining contacts inside and outside the company;
- Makes direct contact with clients.
- Works independently on broad general assignments with responsibility for planning associated activities, limited only by company policy;
- Participates in establishing objectives and basic operating policies. Devises ways of reaching program objectives in the most economical manner and of meeting any unusual conditions affecting work progress;
- Conducts the normal administrative functions related to position;
- Acts as Engineering consultant and advisor to the organization;
- Develops and maintains top level contacts inside and outside the company.
Recommendations, Decisions and Commitments
Makes responsible decisions within the limits of company policy. Recommends changes in company policy. Implements policies affecting company expenditure and makes decisions affecting operations.
Makes responsible decisions without reference to superiors. Implements approved major programs involving expenditures of large sums of money. Errors in judgment could cause grave losses.
Supervision Received Broad direction from President or Vice President of company. Work is reviewed for adherence to company policy. Occasional review of technical matters.
Work is reviewed for accomplishment, adherence to company policy and coordination with other phases of company's operations.
Leadership Authority Selects, rates, disciplines and terminates staff. Reviews and evaluates technical work. Coordinates staff requirements and disposition to suit schedule of work in hand and work planned. Allocates work to various section or project heads.
Makes decisions regarding the selection, development, rating, discipline and termination of staff. Reviews and evaluates technical work. Selects, schedules, and coordinates to attain program objectives.
Guide to Entrance Qualifications Bachelor's degree in Engineering and broad Engineering experience of fifteen years or more, of which about three to five years should have been in responsible administrative duties.
Bachelor's degree in Engineering or Applied Science or its equivalent, normally with broad Engineering experience including responsible administrative duties.
Job Rating Factor A — 130 B — 65 C — 113 D — 90 E — 70 F — 60 G — 20 H — 5 I — 0 J — 5 K — 3
A — 130 B — 65 C — 138 D — 105 E — 80 F — 60 G — 40 H — 5 I — 0 J — 0 K — 0
Total Points 561 623
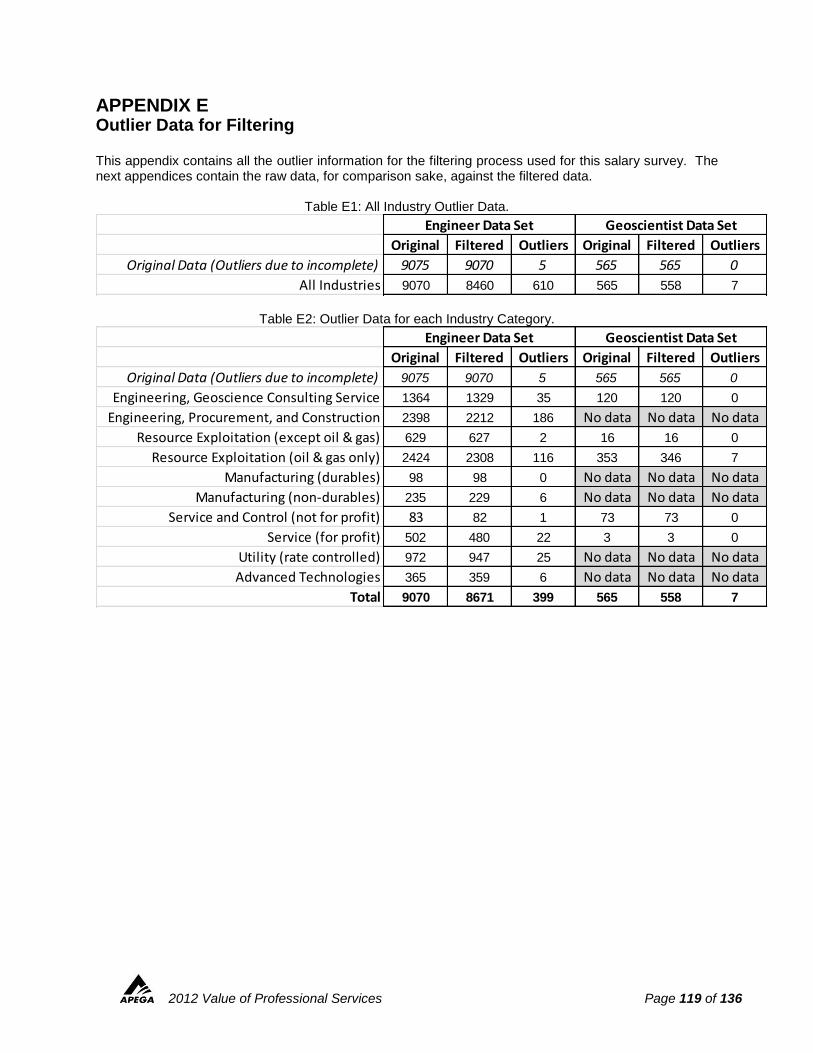
2012 Value of Professional Services Page 119 of 136
APPENDIX E Outlier Data for Filtering This appendix contains all the outlier information for the filtering process used for this salary survey. The next appendices contain the raw data, for comparison sake, against the filtered data.
Table E1: All Industry Outlier Data.
Table E2: Outlier Data for each Industry Category.
Original Filtered Outliers Original Filtered Outliers
Original Data (Outliers due to incomplete) 9075 9070 5 565 565 0
All Industries 9070 8460 610 565 558 7
Engineer Data Set Geoscientist Data Set
Original Filtered Outliers Original Filtered Outliers
Original Data (Outliers due to incomplete) 9075 9070 5 565 565 0
Engineering, Geoscience Consulting Service 1364 1329 35 120 120 0
Engineering, Procurement, and Construction 2398 2212 186 No data No data No data
Resource Exploitation (except oil & gas) 629 627 2 16 16 0
Resource Exploitation (oil & gas only) 2424 2308 116 353 346 7
Manufacturing (durables) 98 98 0 No data No data No data
Manufacturing (non-durables) 235 229 6 No data No data No data
Service and Control (not for profit) 83 82 1 73 73 0
Service (for profit) 502 480 22 3 3 0
Utility (rate controlled) 972 947 25 No data No data No data
Advanced Technologies 365 359 6 No data No data No data
Total 9070 8671 399 565 558 7
Engineer Data Set Geoscientist Data Set
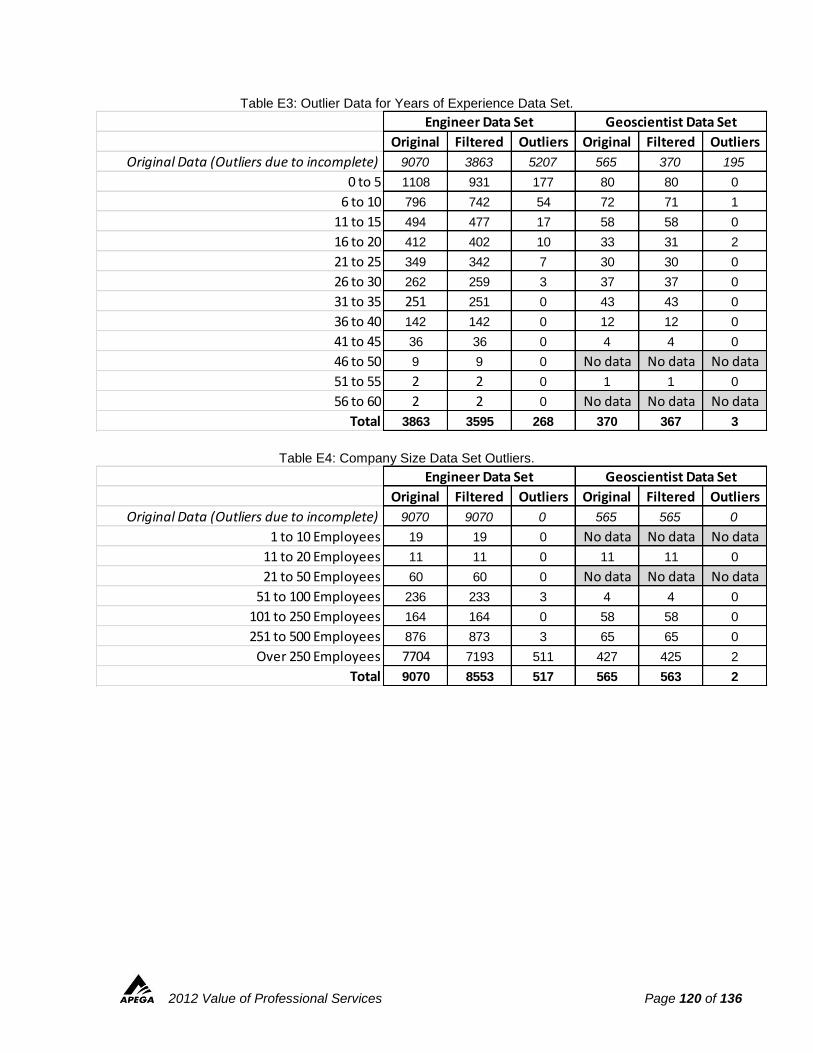
2012 Value of Professional Services Page 120 of 136
Table E3: Outlier Data for Years of Experience Data Set.
Table E4: Company Size Data Set Outliers.
Original Filtered Outliers Original Filtered Outliers
Original Data (Outliers due to incomplete) 9070 3863 5207 565 370 195
0 to 5 1108 931 177 80 80 0
6 to 10 796 742 54 72 71 1
11 to 15 494 477 17 58 58 0
16 to 20 412 402 10 33 31 2
21 to 25 349 342 7 30 30 0
26 to 30 262 259 3 37 37 0
31 to 35 251 251 0 43 43 0
36 to 40 142 142 0 12 12 0
41 to 45 36 36 0 4 4 0
46 to 50 9 9 0 No data No data No data
51 to 55 2 2 0 1 1 0
56 to 60 2 2 0 No data No data No data
Total 3863 3595 268 370 367 3
Engineer Data Set Geoscientist Data Set
Original Filtered Outliers Original Filtered Outliers
Original Data (Outliers due to incomplete) 9070 9070 0 565 565 0
1 to 10 Employees 19 19 0 No data No data No data
11 to 20 Employees 11 11 0 11 11 0
21 to 50 Employees 60 60 0 No data No data No data
51 to 100 Employees 236 233 3 4 4 0
101 to 250 Employees 164 164 0 58 58 0
251 to 500 Employees 876 873 3 65 65 0
Over 250 Employees 7704 7193 511 427 425 2
Total 9070 8553 517 565 563 2
Engineer Data Set Geoscientist Data Set
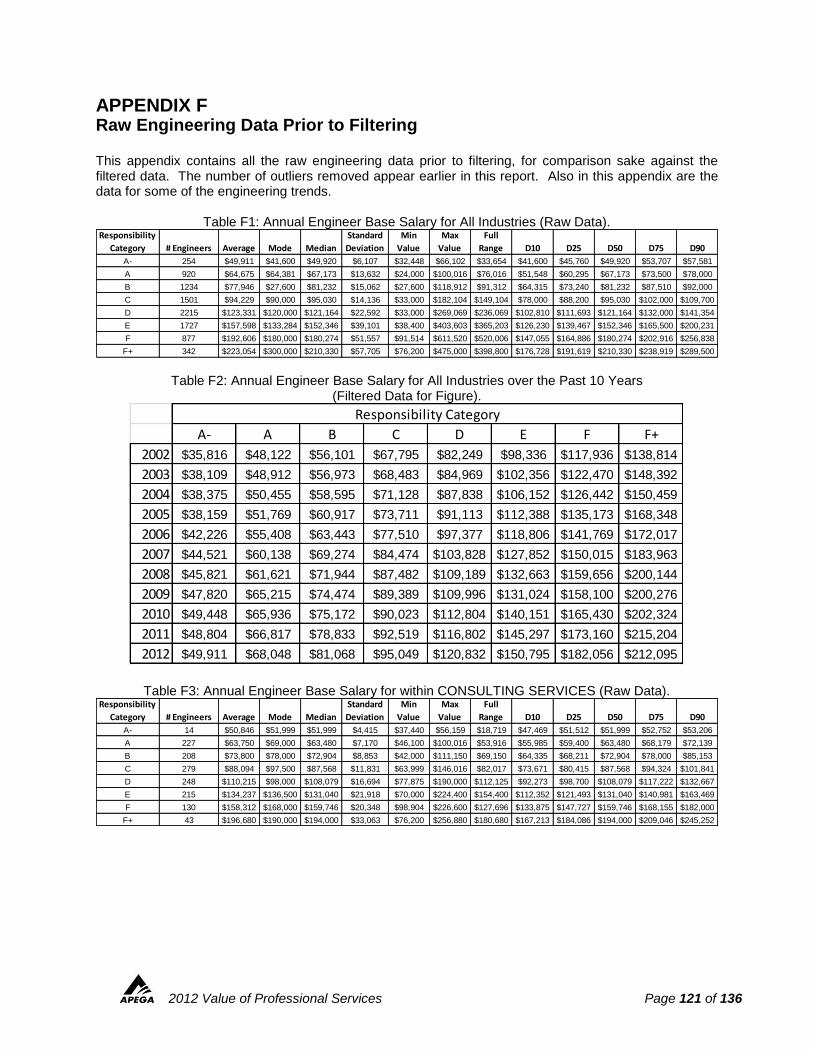
2012 Value of Professional Services Page 121 of 136
APPENDIX F Raw Engineering Data Prior to Filtering This appendix contains all the raw engineering data prior to filtering, for comparison sake against the filtered data. The number of outliers removed appear earlier in this report. Also in this appendix are the data for some of the engineering trends.
Table F1: Annual Engineer Base Salary for All Industries (Raw Data).
Table F2: Annual Engineer Base Salary for All Industries over the Past 10 Years (Filtered Data for Figure).
Table F3: Annual Engineer Base Salary for within CONSULTING SERVICES (Raw Data).
Responsibility
Category # Engineers Average Mode Median
Standard
Deviation
Min
Value
Max
Value
Full
Range D10 D25 D50 D75 D90
A- 254 $49,911 $41,600 $49,920 $6,107 $32,448 $66,102 $33,654 $41,600 $45,760 $49,920 $53,707 $57,581
A 920 $64,675 $64,381 $67,173 $13,632 $24,000 $100,016 $76,016 $51,548 $60,295 $67,173 $73,500 $78,000
B 1234 $77,946 $27,600 $81,232 $15,062 $27,600 $118,912 $91,312 $64,315 $73,240 $81,232 $87,510 $92,000
C 1501 $94,229 $90,000 $95,030 $14,136 $33,000 $182,104 $149,104 $78,000 $88,200 $95,030 $102,000 $109,700
D 2215 $123,331 $120,000 $121,164 $22,592 $33,000 $269,069 $236,069 $102,810 $111,693 $121,164 $132,000 $141,354
E 1727 $157,598 $133,284 $152,346 $39,101 $38,400 $403,603 $365,203 $126,230 $139,467 $152,346 $165,500 $200,231
F 877 $192,606 $180,000 $180,274 $51,557 $91,514 $611,520 $520,006 $147,055 $164,886 $180,274 $202,916 $256,838
F+ 342 $223,054 $300,000 $210,330 $57,705 $76,200 $475,000 $398,800 $176,728 $191,619 $210,330 $238,919 $289,500
A- A B C D E F F+
2002 $35,816 $48,122 $56,101 $67,795 $82,249 $98,336 $117,936 $138,814
2003 $38,109 $48,912 $56,973 $68,483 $84,969 $102,356 $122,470 $148,392
2004 $38,375 $50,455 $58,595 $71,128 $87,838 $106,152 $126,442 $150,459
2005 $38,159 $51,769 $60,917 $73,711 $91,113 $112,388 $135,173 $168,348
2006 $42,226 $55,408 $63,443 $77,510 $97,377 $118,806 $141,769 $172,017
2007 $44,521 $60,138 $69,274 $84,474 $103,828 $127,852 $150,015 $183,963
2008 $45,821 $61,621 $71,944 $87,482 $109,189 $132,663 $159,656 $200,144
2009 $47,820 $65,215 $74,474 $89,389 $109,996 $131,024 $158,100 $200,276
2010 $49,448 $65,936 $75,172 $90,023 $112,804 $140,151 $165,430 $202,324
2011 $48,804 $66,817 $78,833 $92,519 $116,802 $145,297 $173,160 $215,204
2012 $49,911 $68,048 $81,068 $95,049 $120,832 $150,795 $182,056 $212,095
Responsibility Category
Responsibility
Category # Engineers Average Mode Median
Standard
Deviation
Min
Value
Max
Value
Full
Range D10 D25 D50 D75 D90
A- 14 $50,846 $51,999 $51,999 $4,415 $37,440 $56,159 $18,719 $47,469 $51,512 $51,999 $52,752 $53,206
A 227 $63,750 $69,000 $63,480 $7,170 $46,100 $100,016 $53,916 $55,985 $59,400 $63,480 $68,179 $72,139
B 208 $73,800 $78,000 $72,904 $8,853 $42,000 $111,150 $69,150 $64,335 $68,211 $72,904 $78,000 $85,153
C 279 $88,094 $97,500 $87,568 $11,831 $63,999 $146,016 $82,017 $73,671 $80,415 $87,568 $94,324 $101,841
D 248 $110,215 $98,000 $108,079 $16,694 $77,875 $190,000 $112,125 $92,273 $98,700 $108,079 $117,222 $132,667
E 215 $134,237 $136,500 $131,040 $21,918 $70,000 $224,400 $154,400 $112,352 $121,493 $131,040 $140,981 $163,469
F 130 $158,312 $168,000 $159,746 $20,348 $98,904 $226,600 $127,696 $133,875 $147,727 $159,746 $168,155 $182,000
F+ 43 $196,680 $190,000 $194,000 $33,063 $76,200 $256,880 $180,680 $167,213 $184,086 $194,000 $209,046 $245,252
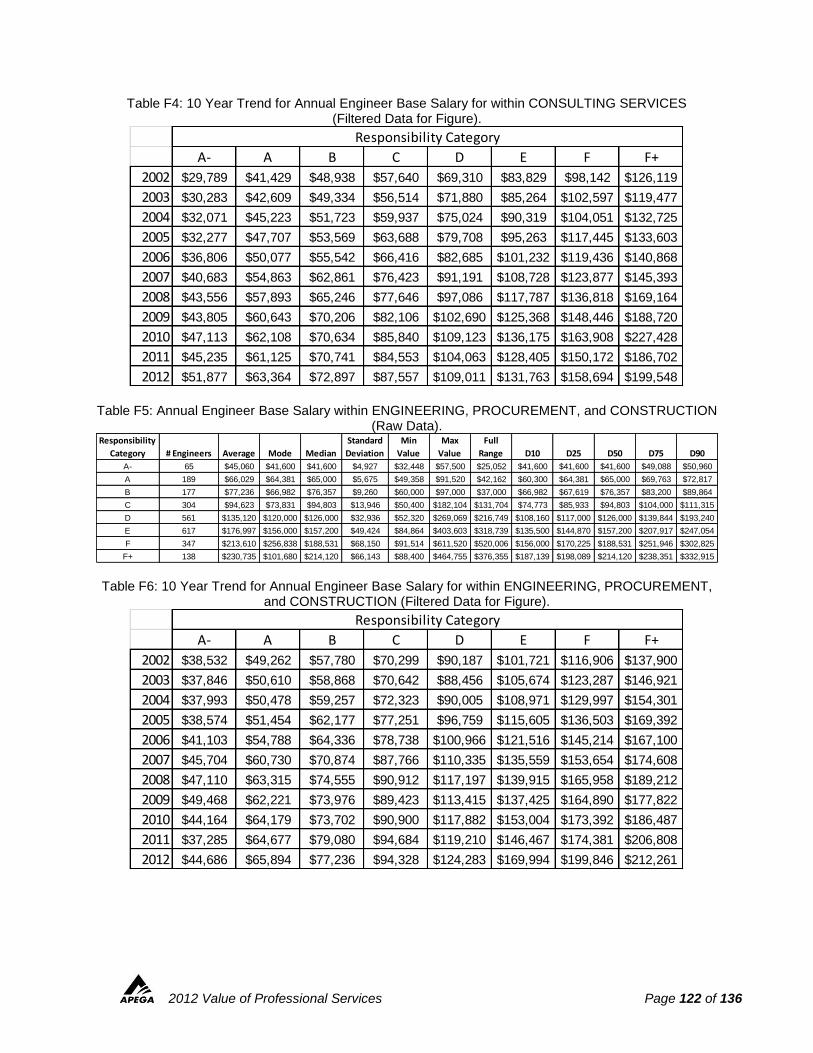
2012 Value of Professional Services Page 122 of 136
Table F4: 10 Year Trend for Annual Engineer Base Salary for within CONSULTING SERVICES (Filtered Data for Figure).
Table F5: Annual Engineer Base Salary within ENGINEERING, PROCUREMENT, and CONSTRUCTION (Raw Data).
Table F6: 10 Year Trend for Annual Engineer Base Salary for within ENGINEERING, PROCUREMENT, and CONSTRUCTION (Filtered Data for Figure).
A- A B C D E F F+
2002 $29,789 $41,429 $48,938 $57,640 $69,310 $83,829 $98,142 $126,119
2003 $30,283 $42,609 $49,334 $56,514 $71,880 $85,264 $102,597 $119,477
2004 $32,071 $45,223 $51,723 $59,937 $75,024 $90,319 $104,051 $132,725
2005 $32,277 $47,707 $53,569 $63,688 $79,708 $95,263 $117,445 $133,603
2006 $36,806 $50,077 $55,542 $66,416 $82,685 $101,232 $119,436 $140,868
2007 $40,683 $54,863 $62,861 $76,423 $91,191 $108,728 $123,877 $145,393
2008 $43,556 $57,893 $65,246 $77,646 $97,086 $117,787 $136,818 $169,164
2009 $43,805 $60,643 $70,206 $82,106 $102,690 $125,368 $148,446 $188,720
2010 $47,113 $62,108 $70,634 $85,840 $109,123 $136,175 $163,908 $227,428
2011 $45,235 $61,125 $70,741 $84,553 $104,063 $128,405 $150,172 $186,702
2012 $51,877 $63,364 $72,897 $87,557 $109,011 $131,763 $158,694 $199,548
Responsibility Category
Responsibility
Category # Engineers Average Mode Median
Standard
Deviation
Min
Value
Max
Value
Full
Range D10 D25 D50 D75 D90
A- 65 $45,060 $41,600 $41,600 $4,927 $32,448 $57,500 $25,052 $41,600 $41,600 $41,600 $49,088 $50,960
A 189 $66,029 $64,381 $65,000 $5,675 $49,358 $91,520 $42,162 $60,300 $64,381 $65,000 $69,763 $72,817
B 177 $77,236 $66,982 $76,357 $9,260 $60,000 $97,000 $37,000 $66,982 $67,619 $76,357 $83,200 $89,864
C 304 $94,623 $73,831 $94,803 $13,946 $50,400 $182,104 $131,704 $74,773 $85,933 $94,803 $104,000 $111,315
D 561 $135,120 $120,000 $126,000 $32,936 $52,320 $269,069 $216,749 $108,160 $117,000 $126,000 $139,844 $193,240
E 617 $176,997 $156,000 $157,200 $49,424 $84,864 $403,603 $318,739 $135,500 $144,870 $157,200 $207,917 $247,054
F 347 $213,610 $256,838 $188,531 $68,150 $91,514 $611,520 $520,006 $156,000 $170,225 $188,531 $251,946 $302,825
F+ 138 $230,735 $101,680 $214,120 $66,143 $88,400 $464,755 $376,355 $187,139 $198,089 $214,120 $238,351 $332,915
A- A B C D E F F+
2002 $38,532 $49,262 $57,780 $70,299 $90,187 $101,721 $116,906 $137,900
2003 $37,846 $50,610 $58,868 $70,642 $88,456 $105,674 $123,287 $146,921
2004 $37,993 $50,478 $59,257 $72,323 $90,005 $108,971 $129,997 $154,301
2005 $38,574 $51,454 $62,177 $77,251 $96,759 $115,605 $136,503 $169,392
2006 $41,103 $54,788 $64,336 $78,738 $100,966 $121,516 $145,214 $167,100
2007 $45,704 $60,730 $70,874 $87,766 $110,335 $135,559 $153,654 $174,608
2008 $47,110 $63,315 $74,555 $90,912 $117,197 $139,915 $165,958 $189,212
2009 $49,468 $62,221 $73,976 $89,423 $113,415 $137,425 $164,890 $177,822
2010 $44,164 $64,179 $73,702 $90,900 $117,882 $153,004 $173,392 $186,487
2011 $37,285 $64,677 $79,080 $94,684 $119,210 $146,467 $174,381 $206,808
2012 $44,686 $65,894 $77,236 $94,328 $124,283 $169,994 $199,846 $212,261
Responsibility Category
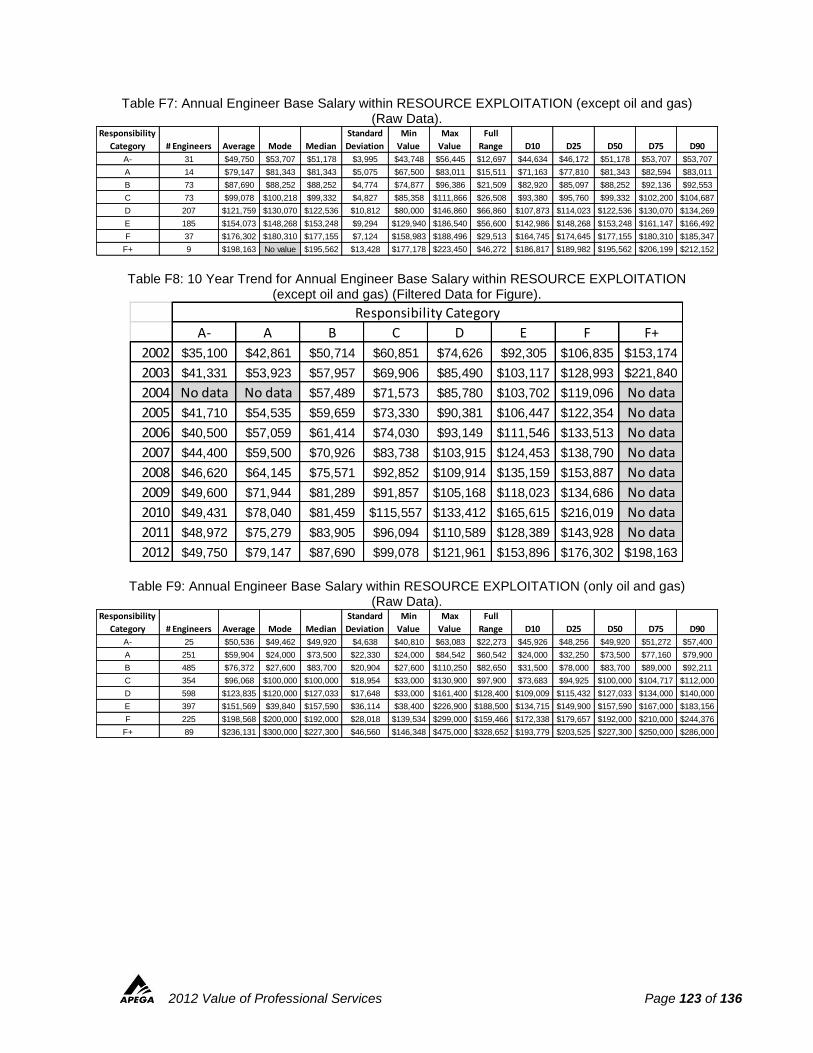
2012 Value of Professional Services Page 123 of 136
Table F7: Annual Engineer Base Salary within RESOURCE EXPLOITATION (except oil and gas) (Raw Data).
Table F8: 10 Year Trend for Annual Engineer Base Salary within RESOURCE EXPLOITATION (except oil and gas) (Filtered Data for Figure).
Table F9: Annual Engineer Base Salary within RESOURCE EXPLOITATION (only oil and gas) (Raw Data).
Responsibility
Category # Engineers Average Mode Median
Standard
Deviation
Min
Value
Max
Value
Full
Range D10 D25 D50 D75 D90
A- 31 $49,750 $53,707 $51,178 $3,995 $43,748 $56,445 $12,697 $44,634 $46,172 $51,178 $53,707 $53,707
A 14 $79,147 $81,343 $81,343 $5,075 $67,500 $83,011 $15,511 $71,163 $77,810 $81,343 $82,594 $83,011
B 73 $87,690 $88,252 $88,252 $4,774 $74,877 $96,386 $21,509 $82,920 $85,097 $88,252 $92,136 $92,553
C 73 $99,078 $100,218 $99,332 $4,827 $85,358 $111,866 $26,508 $93,380 $95,760 $99,332 $102,200 $104,687
D 207 $121,759 $130,070 $122,536 $10,812 $80,000 $146,860 $66,860 $107,873 $114,023 $122,536 $130,070 $134,269
E 185 $154,073 $148,268 $153,248 $9,294 $129,940 $186,540 $56,600 $142,986 $148,268 $153,248 $161,147 $166,492
F 37 $176,302 $180,310 $177,155 $7,124 $158,983 $188,496 $29,513 $164,745 $174,645 $177,155 $180,310 $185,347
F+ 9 $198,163 No value $195,562 $13,428 $177,178 $223,450 $46,272 $186,817 $189,982 $195,562 $206,199 $212,152
A- A B C D E F F+
2002 $35,100 $42,861 $50,714 $60,851 $74,626 $92,305 $106,835 $153,174
2003 $41,331 $53,923 $57,957 $69,906 $85,490 $103,117 $128,993 $221,840
2004 No data No data $57,489 $71,573 $85,780 $103,702 $119,096 No data
2005 $41,710 $54,535 $59,659 $73,330 $90,381 $106,447 $122,354 No data
2006 $40,500 $57,059 $61,414 $74,030 $93,149 $111,546 $133,513 No data
2007 $44,400 $59,500 $70,926 $83,738 $103,915 $124,453 $138,790 No data
2008 $46,620 $64,145 $75,571 $92,852 $109,914 $135,159 $153,887 No data
2009 $49,600 $71,944 $81,289 $91,857 $105,168 $118,023 $134,686 No data
2010 $49,431 $78,040 $81,459 $115,557 $133,412 $165,615 $216,019 No data
2011 $48,972 $75,279 $83,905 $96,094 $110,589 $128,389 $143,928 No data
2012 $49,750 $79,147 $87,690 $99,078 $121,961 $153,896 $176,302 $198,163
Responsibility Category
Responsibility
Category # Engineers Average Mode Median
Standard
Deviation
Min
Value
Max
Value
Full
Range D10 D25 D50 D75 D90
A- 25 $50,536 $49,462 $49,920 $4,638 $40,810 $63,083 $22,273 $45,926 $48,256 $49,920 $51,272 $57,400
A 251 $59,904 $24,000 $73,500 $22,330 $24,000 $84,542 $60,542 $24,000 $32,250 $73,500 $77,160 $79,900
B 485 $76,372 $27,600 $83,700 $20,904 $27,600 $110,250 $82,650 $31,500 $78,000 $83,700 $89,000 $92,211
C 354 $96,068 $100,000 $100,000 $18,954 $33,000 $130,900 $97,900 $73,683 $94,925 $100,000 $104,717 $112,000
D 598 $123,835 $120,000 $127,033 $17,648 $33,000 $161,400 $128,400 $109,009 $115,432 $127,033 $134,000 $140,000
E 397 $151,569 $39,840 $157,590 $36,114 $38,400 $226,900 $188,500 $134,715 $149,900 $157,590 $167,000 $183,156
F 225 $198,568 $200,000 $192,000 $28,018 $139,534 $299,000 $159,466 $172,338 $179,657 $192,000 $210,000 $244,376
F+ 89 $236,131 $300,000 $227,300 $46,560 $146,348 $475,000 $328,652 $193,779 $203,525 $227,300 $250,000 $286,000
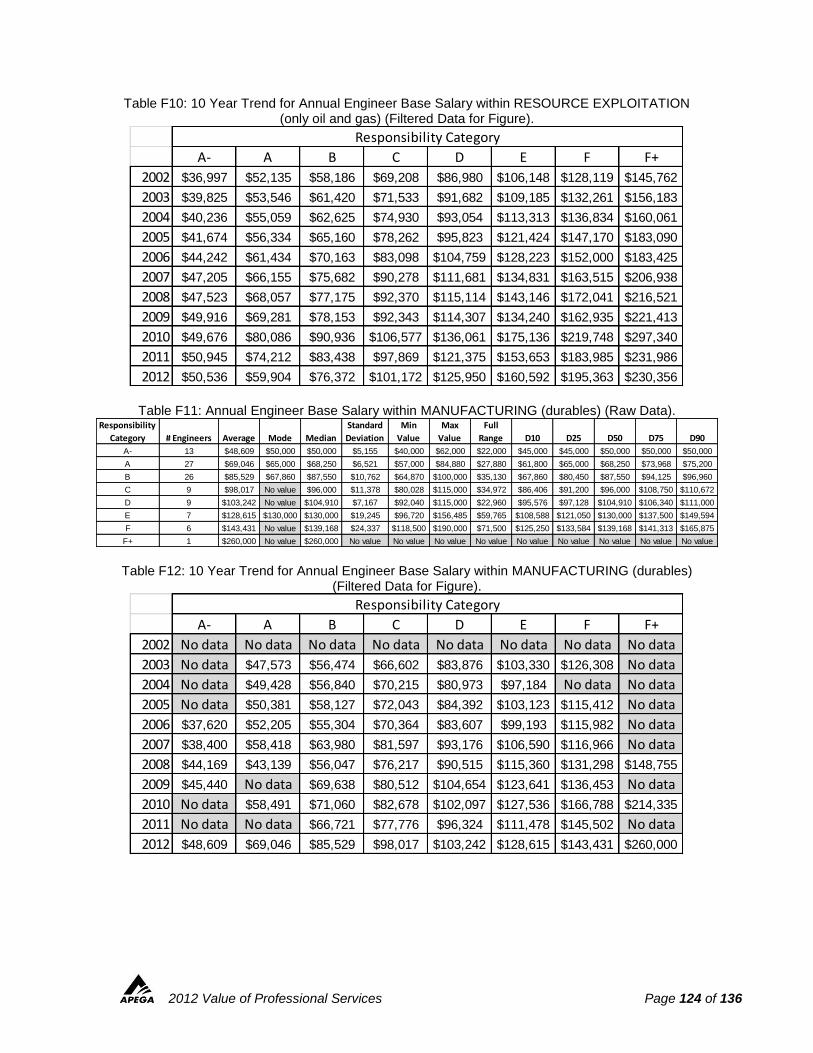
2012 Value of Professional Services Page 124 of 136
Table F10: 10 Year Trend for Annual Engineer Base Salary within RESOURCE EXPLOITATION (only oil and gas) (Filtered Data for Figure).
Table F11: Annual Engineer Base Salary within MANUFACTURING (durables) (Raw Data).
Table F12: 10 Year Trend for Annual Engineer Base Salary within MANUFACTURING (durables) (Filtered Data for Figure).
A- A B C D E F F+
2002 $36,997 $52,135 $58,186 $69,208 $86,980 $106,148 $128,119 $145,762
2003 $39,825 $53,546 $61,420 $71,533 $91,682 $109,185 $132,261 $156,183
2004 $40,236 $55,059 $62,625 $74,930 $93,054 $113,313 $136,834 $160,061
2005 $41,674 $56,334 $65,160 $78,262 $95,823 $121,424 $147,170 $183,090
2006 $44,242 $61,434 $70,163 $83,098 $104,759 $128,223 $152,000 $183,425
2007 $47,205 $66,155 $75,682 $90,278 $111,681 $134,831 $163,515 $206,938
2008 $47,523 $68,057 $77,175 $92,370 $115,114 $143,146 $172,041 $216,521
2009 $49,916 $69,281 $78,153 $92,343 $114,307 $134,240 $162,935 $221,413
2010 $49,676 $80,086 $90,936 $106,577 $136,061 $175,136 $219,748 $297,340
2011 $50,945 $74,212 $83,438 $97,869 $121,375 $153,653 $183,985 $231,986
2012 $50,536 $59,904 $76,372 $101,172 $125,950 $160,592 $195,363 $230,356
Responsibility Category
Responsibility
Category # Engineers Average Mode Median
Standard
Deviation
Min
Value
Max
Value
Full
Range D10 D25 D50 D75 D90
A- 13 $48,609 $50,000 $50,000 $5,155 $40,000 $62,000 $22,000 $45,000 $45,000 $50,000 $50,000 $50,000
A 27 $69,046 $65,000 $68,250 $6,521 $57,000 $84,880 $27,880 $61,800 $65,000 $68,250 $73,968 $75,200
B 26 $85,529 $67,860 $87,550 $10,762 $64,870 $100,000 $35,130 $67,860 $80,450 $87,550 $94,125 $96,960
C 9 $98,017 No value $96,000 $11,378 $80,028 $115,000 $34,972 $86,406 $91,200 $96,000 $108,750 $110,672
D 9 $103,242 No value $104,910 $7,167 $92,040 $115,000 $22,960 $95,576 $97,128 $104,910 $106,340 $111,000
E 7 $128,615 $130,000 $130,000 $19,245 $96,720 $156,485 $59,765 $108,588 $121,050 $130,000 $137,500 $149,594
F 6 $143,431 No value $139,168 $24,337 $118,500 $190,000 $71,500 $125,250 $133,584 $139,168 $141,313 $165,875
F+ 1 $260,000 No value $260,000 No value No value No value No value No value No value No value No value No value
A- A B C D E F F+
2002 No data No data No data No data No data No data No data No data
2003 No data $47,573 $56,474 $66,602 $83,876 $103,330 $126,308 No data
2004 No data $49,428 $56,840 $70,215 $80,973 $97,184 No data No data
2005 No data $50,381 $58,127 $72,043 $84,392 $103,123 $115,412 No data
2006 $37,620 $52,205 $55,304 $70,364 $83,607 $99,193 $115,982 No data
2007 $38,400 $58,418 $63,980 $81,597 $93,176 $106,590 $116,966 No data
2008 $44,169 $43,139 $56,047 $76,217 $90,515 $115,360 $131,298 $148,755
2009 $45,440 No data $69,638 $80,512 $104,654 $123,641 $136,453 No data
2010 No data $58,491 $71,060 $82,678 $102,097 $127,536 $166,788 $214,335
2011 No data No data $66,721 $77,776 $96,324 $111,478 $145,502 No data
2012 $48,609 $69,046 $85,529 $98,017 $103,242 $128,615 $143,431 $260,000
Responsibility Category
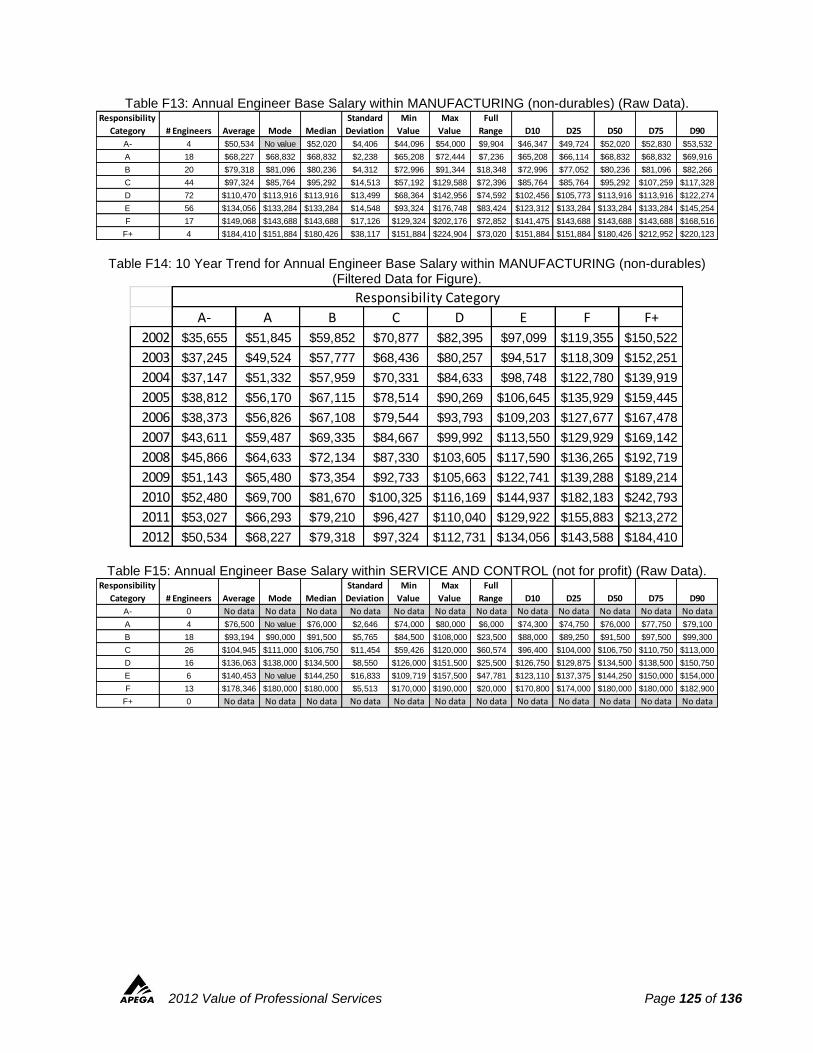
2012 Value of Professional Services Page 125 of 136
Table F13: Annual Engineer Base Salary within MANUFACTURING (non-durables) (Raw Data).
Table F14: 10 Year Trend for Annual Engineer Base Salary within MANUFACTURING (non-durables) (Filtered Data for Figure).
Table F15: Annual Engineer Base Salary within SERVICE AND CONTROL (not for profit) (Raw Data).
Responsibility
Category # Engineers Average Mode Median
Standard
Deviation
Min
Value
Max
Value
Full
Range D10 D25 D50 D75 D90
A- 4 $50,534 No value $52,020 $4,406 $44,096 $54,000 $9,904 $46,347 $49,724 $52,020 $52,830 $53,532
A 18 $68,227 $68,832 $68,832 $2,238 $65,208 $72,444 $7,236 $65,208 $66,114 $68,832 $68,832 $69,916
B 20 $79,318 $81,096 $80,236 $4,312 $72,996 $91,344 $18,348 $72,996 $77,052 $80,236 $81,096 $82,266
C 44 $97,324 $85,764 $95,292 $14,513 $57,192 $129,588 $72,396 $85,764 $85,764 $95,292 $107,259 $117,328
D 72 $110,470 $113,916 $113,916 $13,499 $68,364 $142,956 $74,592 $102,456 $105,773 $113,916 $113,916 $122,274
E 56 $134,056 $133,284 $133,284 $14,548 $93,324 $176,748 $83,424 $123,312 $133,284 $133,284 $133,284 $145,254
F 17 $149,068 $143,688 $143,688 $17,126 $129,324 $202,176 $72,852 $141,475 $143,688 $143,688 $143,688 $168,516
F+ 4 $184,410 $151,884 $180,426 $38,117 $151,884 $224,904 $73,020 $151,884 $151,884 $180,426 $212,952 $220,123
A- A B C D E F F+
2002 $35,655 $51,845 $59,852 $70,877 $82,395 $97,099 $119,355 $150,522
2003 $37,245 $49,524 $57,777 $68,436 $80,257 $94,517 $118,309 $152,251
2004 $37,147 $51,332 $57,959 $70,331 $84,633 $98,748 $122,780 $139,919
2005 $38,812 $56,170 $67,115 $78,514 $90,269 $106,645 $135,929 $159,445
2006 $38,373 $56,826 $67,108 $79,544 $93,793 $109,203 $127,677 $167,478
2007 $43,611 $59,487 $69,335 $84,667 $99,992 $113,550 $129,929 $169,142
2008 $45,866 $64,633 $72,134 $87,330 $103,605 $117,590 $136,265 $192,719
2009 $51,143 $65,480 $73,354 $92,733 $105,663 $122,741 $139,288 $189,214
2010 $52,480 $69,700 $81,670 $100,325 $116,169 $144,937 $182,183 $242,793
2011 $53,027 $66,293 $79,210 $96,427 $110,040 $129,922 $155,883 $213,272
2012 $50,534 $68,227 $79,318 $97,324 $112,731 $134,056 $143,588 $184,410
Responsibility Category
Responsibility
Category # Engineers Average Mode Median
Standard
Deviation
Min
Value
Max
Value
Full
Range D10 D25 D50 D75 D90
A- 0 No data No data No data No data No data No data No data No data No data No data No data No data
A 4 $76,500 No value $76,000 $2,646 $74,000 $80,000 $6,000 $74,300 $74,750 $76,000 $77,750 $79,100
B 18 $93,194 $90,000 $91,500 $5,765 $84,500 $108,000 $23,500 $88,000 $89,250 $91,500 $97,500 $99,300
C 26 $104,945 $111,000 $106,750 $11,454 $59,426 $120,000 $60,574 $96,400 $104,000 $106,750 $110,750 $113,000
D 16 $136,063 $138,000 $134,500 $8,550 $126,000 $151,500 $25,500 $126,750 $129,875 $134,500 $138,500 $150,750
E 6 $140,453 No value $144,250 $16,833 $109,719 $157,500 $47,781 $123,110 $137,375 $144,250 $150,000 $154,000
F 13 $178,346 $180,000 $180,000 $5,513 $170,000 $190,000 $20,000 $170,800 $174,000 $180,000 $180,000 $182,900
F+ 0 No data No data No data No data No data No data No data No data No data No data No data No data
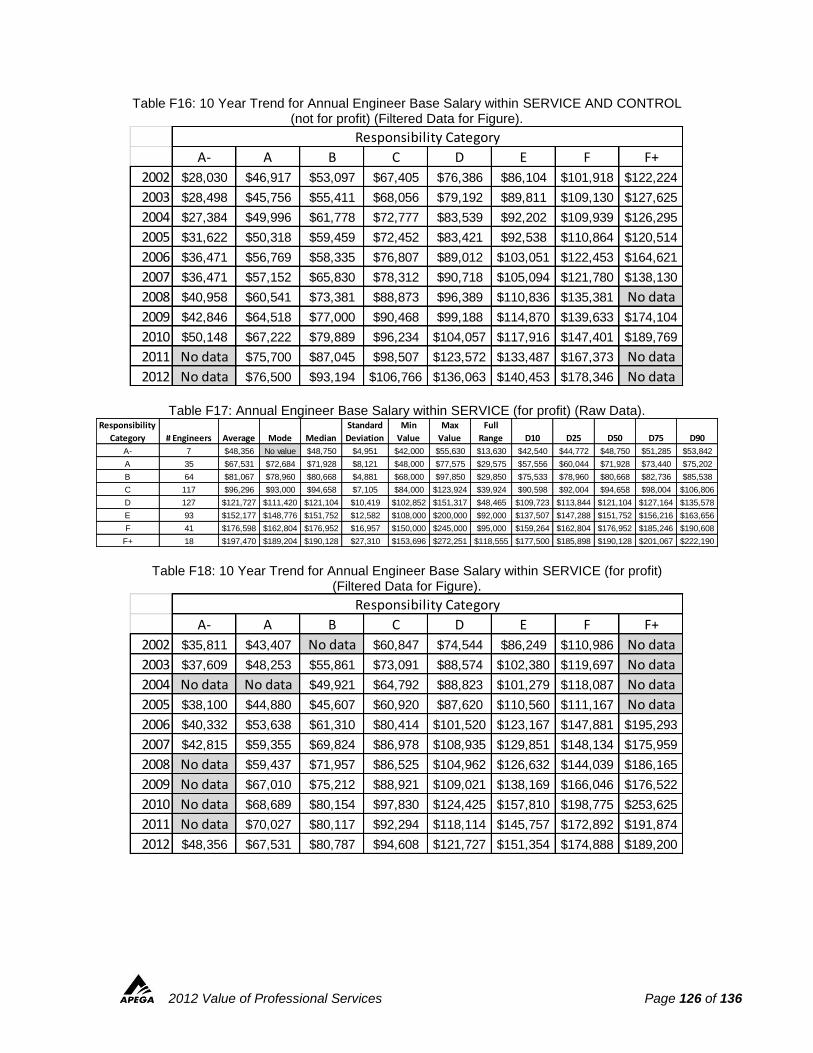
2012 Value of Professional Services Page 126 of 136
Table F16: 10 Year Trend for Annual Engineer Base Salary within SERVICE AND CONTROL (not for profit) (Filtered Data for Figure).
Table F17: Annual Engineer Base Salary within SERVICE (for profit) (Raw Data).
Table F18: 10 Year Trend for Annual Engineer Base Salary within SERVICE (for profit) (Filtered Data for Figure).
A- A B C D E F F+
2002 $28,030 $46,917 $53,097 $67,405 $76,386 $86,104 $101,918 $122,224
2003 $28,498 $45,756 $55,411 $68,056 $79,192 $89,811 $109,130 $127,625
2004 $27,384 $49,996 $61,778 $72,777 $83,539 $92,202 $109,939 $126,295
2005 $31,622 $50,318 $59,459 $72,452 $83,421 $92,538 $110,864 $120,514
2006 $36,471 $56,769 $58,335 $76,807 $89,012 $103,051 $122,453 $164,621
2007 $36,471 $57,152 $65,830 $78,312 $90,718 $105,094 $121,780 $138,130
2008 $40,958 $60,541 $73,381 $88,873 $96,389 $110,836 $135,381 No data
2009 $42,846 $64,518 $77,000 $90,468 $99,188 $114,870 $139,633 $174,104
2010 $50,148 $67,222 $79,889 $96,234 $104,057 $117,916 $147,401 $189,769
2011 No data $75,700 $87,045 $98,507 $123,572 $133,487 $167,373 No data
2012 No data $76,500 $93,194 $106,766 $136,063 $140,453 $178,346 No data
Responsibility Category
Responsibility
Category # Engineers Average Mode Median
Standard
Deviation
Min
Value
Max
Value
Full
Range D10 D25 D50 D75 D90
A- 7 $48,356 No value $48,750 $4,951 $42,000 $55,630 $13,630 $42,540 $44,772 $48,750 $51,285 $53,842
A 35 $67,531 $72,684 $71,928 $8,121 $48,000 $77,575 $29,575 $57,556 $60,044 $71,928 $73,440 $75,202
B 64 $81,067 $78,960 $80,668 $4,881 $68,000 $97,850 $29,850 $75,533 $78,960 $80,668 $82,736 $85,538
C 117 $96,296 $93,000 $94,658 $7,105 $84,000 $123,924 $39,924 $90,598 $92,004 $94,658 $98,004 $106,806
D 127 $121,727 $111,420 $121,104 $10,419 $102,852 $151,317 $48,465 $109,723 $113,844 $121,104 $127,164 $135,578
E 93 $152,177 $148,776 $151,752 $12,582 $108,000 $200,000 $92,000 $137,507 $147,288 $151,752 $156,216 $163,656
F 41 $176,598 $162,804 $176,952 $16,957 $150,000 $245,000 $95,000 $159,264 $162,804 $176,952 $185,246 $190,608
F+ 18 $197,470 $189,204 $190,128 $27,310 $153,696 $272,251 $118,555 $177,500 $185,898 $190,128 $201,067 $222,190
A- A B C D E F F+
2002 $35,811 $43,407 No data $60,847 $74,544 $86,249 $110,986 No data
2003 $37,609 $48,253 $55,861 $73,091 $88,574 $102,380 $119,697 No data
2004 No data No data $49,921 $64,792 $88,823 $101,279 $118,087 No data
2005 $38,100 $44,880 $45,607 $60,920 $87,620 $110,560 $111,167 No data
2006 $40,332 $53,638 $61,310 $80,414 $101,520 $123,167 $147,881 $195,293
2007 $42,815 $59,355 $69,824 $86,978 $108,935 $129,851 $148,134 $175,959
2008 No data $59,437 $71,957 $86,525 $104,962 $126,632 $144,039 $186,165
2009 No data $67,010 $75,212 $88,921 $109,021 $138,169 $166,046 $176,522
2010 No data $68,689 $80,154 $97,830 $124,425 $157,810 $198,775 $253,625
2011 No data $70,027 $80,117 $92,294 $118,114 $145,757 $172,892 $191,874
2012 $48,356 $67,531 $80,787 $94,608 $121,727 $151,354 $174,888 $189,200
Responsibility Category
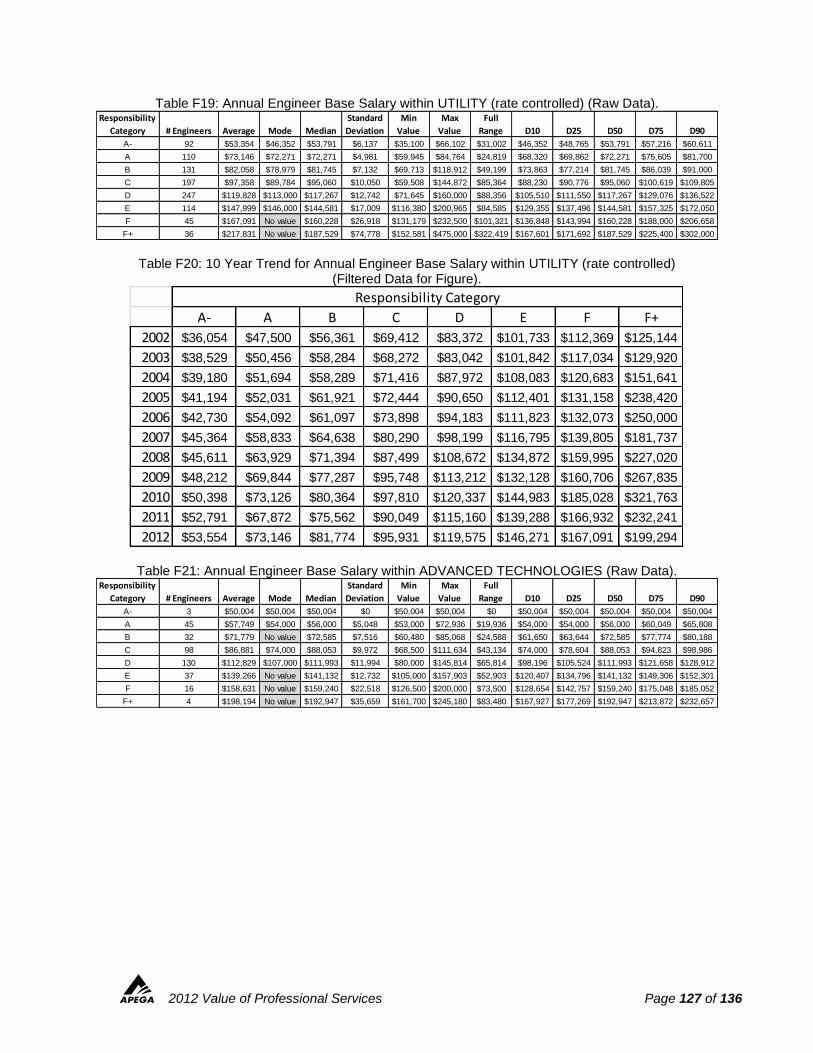
2012 Value of Professional Services Page 127 of 136
Table F19: Annual Engineer Base Salary within UTILITY (rate controlled) (Raw Data).
Table F20: 10 Year Trend for Annual Engineer Base Salary within UTILITY (rate controlled) (Filtered Data for Figure).
Table F21: Annual Engineer Base Salary within ADVANCED TECHNOLOGIES (Raw Data).
Responsibility
Category # Engineers Average Mode Median
Standard
Deviation
Min
Value
Max
Value
Full
Range D10 D25 D50 D75 D90
A- 92 $53,354 $46,352 $53,791 $6,137 $35,100 $66,102 $31,002 $46,352 $48,765 $53,791 $57,216 $60,611
A 110 $73,146 $72,271 $72,271 $4,981 $59,945 $84,764 $24,819 $68,320 $69,862 $72,271 $75,605 $81,700
B 131 $82,058 $78,979 $81,745 $7,132 $69,713 $118,912 $49,199 $73,863 $77,214 $81,745 $86,039 $91,000
C 197 $97,358 $89,784 $95,060 $10,050 $59,508 $144,872 $85,364 $88,230 $90,776 $95,060 $100,619 $109,805
D 247 $119,828 $113,000 $117,267 $12,742 $71,645 $160,000 $88,356 $105,510 $111,550 $117,267 $129,076 $136,522
E 114 $147,999 $146,000 $144,581 $17,009 $116,380 $200,965 $84,585 $129,355 $137,496 $144,581 $157,325 $172,050
F 45 $167,091 No value $160,228 $26,918 $131,179 $232,500 $101,321 $136,848 $143,994 $160,228 $188,000 $206,658
F+ 36 $217,831 No value $187,529 $74,778 $152,581 $475,000 $322,419 $167,601 $171,692 $187,529 $225,400 $302,000
A- A B C D E F F+
2002 $36,054 $47,500 $56,361 $69,412 $83,372 $101,733 $112,369 $125,144
2003 $38,529 $50,456 $58,284 $68,272 $83,042 $101,842 $117,034 $129,920
2004 $39,180 $51,694 $58,289 $71,416 $87,972 $108,083 $120,683 $151,641
2005 $41,194 $52,031 $61,921 $72,444 $90,650 $112,401 $131,158 $238,420
2006 $42,730 $54,092 $61,097 $73,898 $94,183 $111,823 $132,073 $250,000
2007 $45,364 $58,833 $64,638 $80,290 $98,199 $116,795 $139,805 $181,737
2008 $45,611 $63,929 $71,394 $87,499 $108,672 $134,872 $159,995 $227,020
2009 $48,212 $69,844 $77,287 $95,748 $113,212 $132,128 $160,706 $267,835
2010 $50,398 $73,126 $80,364 $97,810 $120,337 $144,983 $185,028 $321,763
2011 $52,791 $67,872 $75,562 $90,049 $115,160 $139,288 $166,932 $232,241
2012 $53,554 $73,146 $81,774 $95,931 $119,575 $146,271 $167,091 $199,294
Responsibility Category
Responsibility
Category # Engineers Average Mode Median
Standard
Deviation
Min
Value
Max
Value
Full
Range D10 D25 D50 D75 D90
A- 3 $50,004 $50,004 $50,004 $0 $50,004 $50,004 $0 $50,004 $50,004 $50,004 $50,004 $50,004
A 45 $57,749 $54,000 $56,000 $5,048 $53,000 $72,936 $19,936 $54,000 $54,000 $56,000 $60,049 $65,808
B 32 $71,779 No value $72,585 $7,516 $60,480 $85,068 $24,588 $61,650 $63,644 $72,585 $77,774 $80,188
C 98 $86,881 $74,000 $88,053 $9,972 $68,500 $111,634 $43,134 $74,000 $78,604 $88,053 $94,823 $98,986
D 130 $112,829 $107,000 $111,993 $11,994 $80,000 $145,814 $65,814 $98,196 $105,524 $111,993 $121,658 $128,912
E 37 $139,266 No value $141,132 $12,732 $105,000 $157,903 $52,903 $120,407 $134,796 $141,132 $149,306 $152,301
F 16 $158,631 No value $159,240 $22,518 $126,500 $200,000 $73,500 $128,654 $142,757 $159,240 $175,048 $185,052
F+ 4 $198,194 No value $192,947 $35,659 $161,700 $245,180 $83,480 $167,927 $177,269 $192,947 $213,872 $232,657
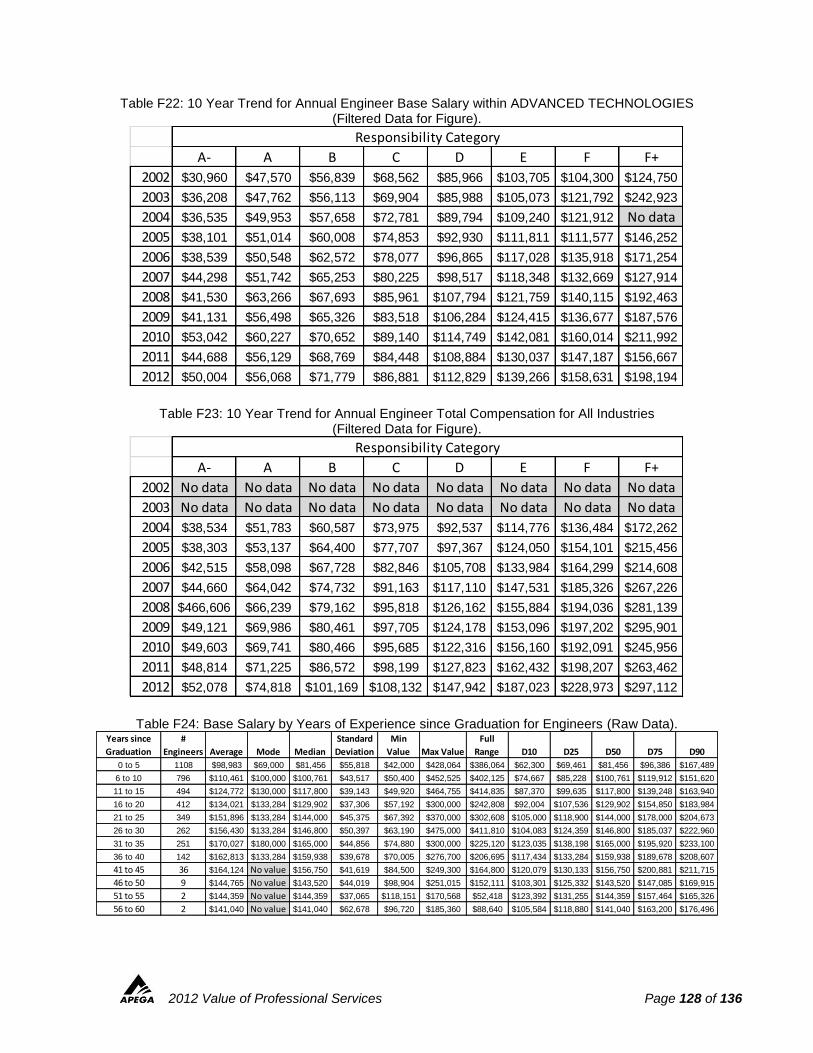
2012 Value of Professional Services Page 128 of 136
Table F22: 10 Year Trend for Annual Engineer Base Salary within ADVANCED TECHNOLOGIES (Filtered Data for Figure).
Table F23: 10 Year Trend for Annual Engineer Total Compensation for All Industries (Filtered Data for Figure).
Table F24: Base Salary by Years of Experience since Graduation for Engineers (Raw Data).
A- A B C D E F F+
2002 $30,960 $47,570 $56,839 $68,562 $85,966 $103,705 $104,300 $124,750
2003 $36,208 $47,762 $56,113 $69,904 $85,988 $105,073 $121,792 $242,923
2004 $36,535 $49,953 $57,658 $72,781 $89,794 $109,240 $121,912 No data
2005 $38,101 $51,014 $60,008 $74,853 $92,930 $111,811 $111,577 $146,252
2006 $38,539 $50,548 $62,572 $78,077 $96,865 $117,028 $135,918 $171,254
2007 $44,298 $51,742 $65,253 $80,225 $98,517 $118,348 $132,669 $127,914
2008 $41,530 $63,266 $67,693 $85,961 $107,794 $121,759 $140,115 $192,463
2009 $41,131 $56,498 $65,326 $83,518 $106,284 $124,415 $136,677 $187,576
2010 $53,042 $60,227 $70,652 $89,140 $114,749 $142,081 $160,014 $211,992
2011 $44,688 $56,129 $68,769 $84,448 $108,884 $130,037 $147,187 $156,667
2012 $50,004 $56,068 $71,779 $86,881 $112,829 $139,266 $158,631 $198,194
Responsibility Category
A- A B C D E F F+
2002 No data No data No data No data No data No data No data No data
2003 No data No data No data No data No data No data No data No data
2004 $38,534 $51,783 $60,587 $73,975 $92,537 $114,776 $136,484 $172,262
2005 $38,303 $53,137 $64,400 $77,707 $97,367 $124,050 $154,101 $215,456
2006 $42,515 $58,098 $67,728 $82,846 $105,708 $133,984 $164,299 $214,608
2007 $44,660 $64,042 $74,732 $91,163 $117,110 $147,531 $185,326 $267,226
2008 $466,606 $66,239 $79,162 $95,818 $126,162 $155,884 $194,036 $281,139
2009 $49,121 $69,986 $80,461 $97,705 $124,178 $153,096 $197,202 $295,901
2010 $49,603 $69,741 $80,466 $95,685 $122,316 $156,160 $192,091 $245,956
2011 $48,814 $71,225 $86,572 $98,199 $127,823 $162,432 $198,207 $263,462
2012 $52,078 $74,818 $101,169 $108,132 $147,942 $187,023 $228,973 $297,112
Responsibility Category
Years since
Graduation
#
Engineers Average Mode Median
Standard
Deviation
Min
Value Max Value
Full
Range D10 D25 D50 D75 D90
0 to 5 1108 $98,983 $69,000 $81,456 $55,818 $42,000 $428,064 $386,064 $62,300 $69,461 $81,456 $96,386 $167,489
6 to 10 796 $110,461 $100,000 $100,761 $43,517 $50,400 $452,525 $402,125 $74,667 $85,228 $100,761 $119,912 $151,620
11 to 15 494 $124,772 $130,000 $117,800 $39,143 $49,920 $464,755 $414,835 $87,370 $99,635 $117,800 $139,248 $163,940
16 to 20 412 $134,021 $133,284 $129,902 $37,306 $57,192 $300,000 $242,808 $92,004 $107,536 $129,902 $154,850 $183,984
21 to 25 349 $151,896 $133,284 $144,000 $45,375 $67,392 $370,000 $302,608 $105,000 $118,900 $144,000 $178,000 $204,673
26 to 30 262 $156,430 $133,284 $146,800 $50,397 $63,190 $475,000 $411,810 $104,083 $124,359 $146,800 $185,037 $222,960
31 to 35 251 $170,027 $180,000 $165,000 $44,856 $74,880 $300,000 $225,120 $123,035 $138,198 $165,000 $195,920 $233,100
36 to 40 142 $162,813 $133,284 $159,938 $39,678 $70,005 $276,700 $206,695 $117,434 $133,284 $159,938 $189,678 $208,607
41 to 45 36 $164,124 No value $156,750 $41,619 $84,500 $249,300 $164,800 $120,079 $130,133 $156,750 $200,881 $211,715
46 to 50 9 $144,765 No value $143,520 $44,019 $98,904 $251,015 $152,111 $103,301 $125,332 $143,520 $147,085 $169,915
51 to 55 2 $144,359 No value $144,359 $37,065 $118,151 $170,568 $52,418 $123,392 $131,255 $144,359 $157,464 $165,326
56 to 60 2 $141,040 No value $141,040 $62,678 $96,720 $185,360 $88,640 $105,584 $118,880 $141,040 $163,200 $176,496
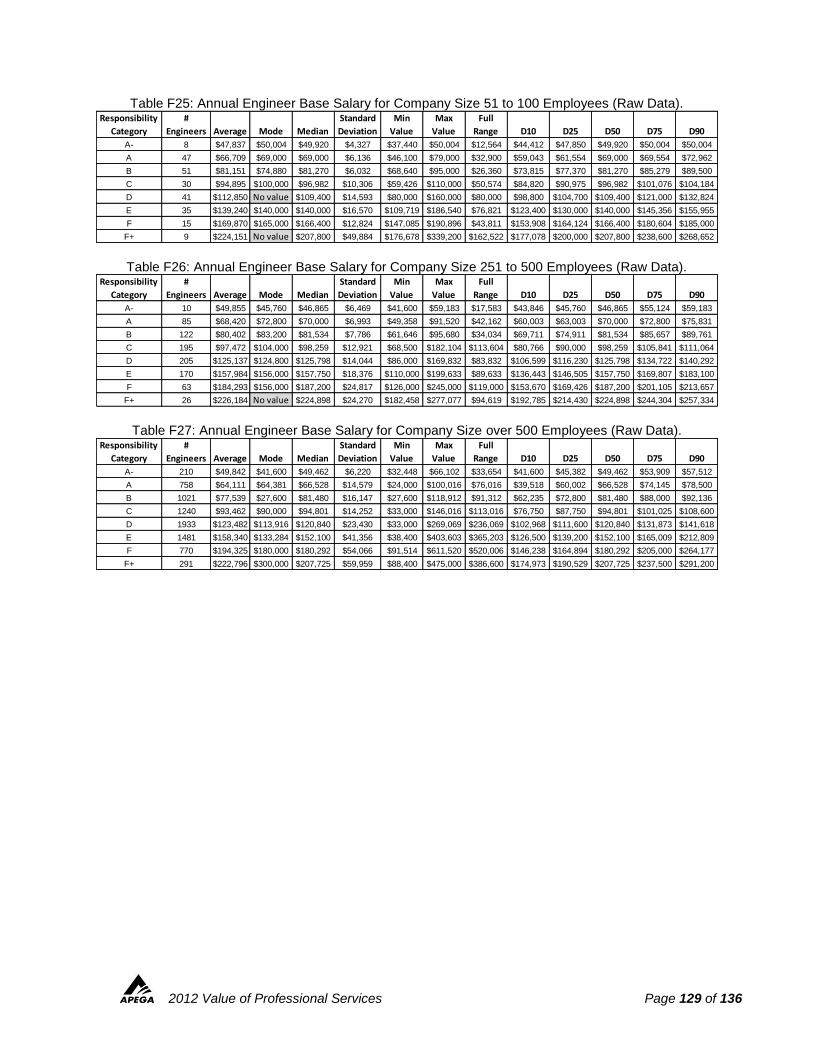
2012 Value of Professional Services Page 129 of 136
Table F25: Annual Engineer Base Salary for Company Size 51 to 100 Employees (Raw Data).
Table F26: Annual Engineer Base Salary for Company Size 251 to 500 Employees (Raw Data).
Table F27: Annual Engineer Base Salary for Company Size over 500 Employees (Raw Data).
Responsibility
Category
#
Engineers Average Mode Median
Standard
Deviation
Min
Value
Max
Value
Full
Range D10 D25 D50 D75 D90
A- 8 $47,837 $50,004 $49,920 $4,327 $37,440 $50,004 $12,564 $44,412 $47,850 $49,920 $50,004 $50,004
A 47 $66,709 $69,000 $69,000 $6,136 $46,100 $79,000 $32,900 $59,043 $61,554 $69,000 $69,554 $72,962
B 51 $81,151 $74,880 $81,270 $6,032 $68,640 $95,000 $26,360 $73,815 $77,370 $81,270 $85,279 $89,500
C 30 $94,895 $100,000 $96,982 $10,306 $59,426 $110,000 $50,574 $84,820 $90,975 $96,982 $101,076 $104,184
D 41 $112,850 No value $109,400 $14,593 $80,000 $160,000 $80,000 $98,800 $104,700 $109,400 $121,000 $132,824
E 35 $139,240 $140,000 $140,000 $16,570 $109,719 $186,540 $76,821 $123,400 $130,000 $140,000 $145,356 $155,955
F 15 $169,870 $165,000 $166,400 $12,824 $147,085 $190,896 $43,811 $153,908 $164,124 $166,400 $180,604 $185,000
F+ 9 $224,151 No value $207,800 $49,884 $176,678 $339,200 $162,522 $177,078 $200,000 $207,800 $238,600 $268,652
Responsibility
Category
#
Engineers Average Mode Median
Standard
Deviation
Min
Value
Max
Value
Full
Range D10 D25 D50 D75 D90
A- 10 $49,855 $45,760 $46,865 $6,469 $41,600 $59,183 $17,583 $43,846 $45,760 $46,865 $55,124 $59,183
A 85 $68,420 $72,800 $70,000 $6,993 $49,358 $91,520 $42,162 $60,003 $63,003 $70,000 $72,800 $75,831
B 122 $80,402 $83,200 $81,534 $7,786 $61,646 $95,680 $34,034 $69,711 $74,911 $81,534 $85,657 $89,761
C 195 $97,472 $104,000 $98,259 $12,921 $68,500 $182,104 $113,604 $80,766 $90,000 $98,259 $105,841 $111,064
D 205 $125,137 $124,800 $125,798 $14,044 $86,000 $169,832 $83,832 $106,599 $116,230 $125,798 $134,722 $140,292
E 170 $157,984 $156,000 $157,750 $18,376 $110,000 $199,633 $89,633 $136,443 $146,505 $157,750 $169,807 $183,100
F 63 $184,293 $156,000 $187,200 $24,817 $126,000 $245,000 $119,000 $153,670 $169,426 $187,200 $201,105 $213,657
F+ 26 $226,184 No value $224,898 $24,270 $182,458 $277,077 $94,619 $192,785 $214,430 $224,898 $244,304 $257,334
Responsibility
Category
#
Engineers Average Mode Median
Standard
Deviation
Min
Value
Max
Value
Full
Range D10 D25 D50 D75 D90
A- 210 $49,842 $41,600 $49,462 $6,220 $32,448 $66,102 $33,654 $41,600 $45,382 $49,462 $53,909 $57,512
A 758 $64,111 $64,381 $66,528 $14,579 $24,000 $100,016 $76,016 $39,518 $60,002 $66,528 $74,145 $78,500
B 1021 $77,539 $27,600 $81,480 $16,147 $27,600 $118,912 $91,312 $62,235 $72,800 $81,480 $88,000 $92,136
C 1240 $93,462 $90,000 $94,801 $14,252 $33,000 $146,016 $113,016 $76,750 $87,750 $94,801 $101,025 $108,600
D 1933 $123,482 $113,916 $120,840 $23,430 $33,000 $269,069 $236,069 $102,968 $111,600 $120,840 $131,873 $141,618
E 1481 $158,340 $133,284 $152,100 $41,356 $38,400 $403,603 $365,203 $126,500 $139,200 $152,100 $165,009 $212,809
F 770 $194,325 $180,000 $180,292 $54,066 $91,514 $611,520 $520,006 $146,238 $164,894 $180,292 $205,000 $264,177
F+ 291 $222,796 $300,000 $207,725 $59,959 $88,400 $475,000 $386,600 $174,973 $190,529 $207,725 $237,500 $291,200
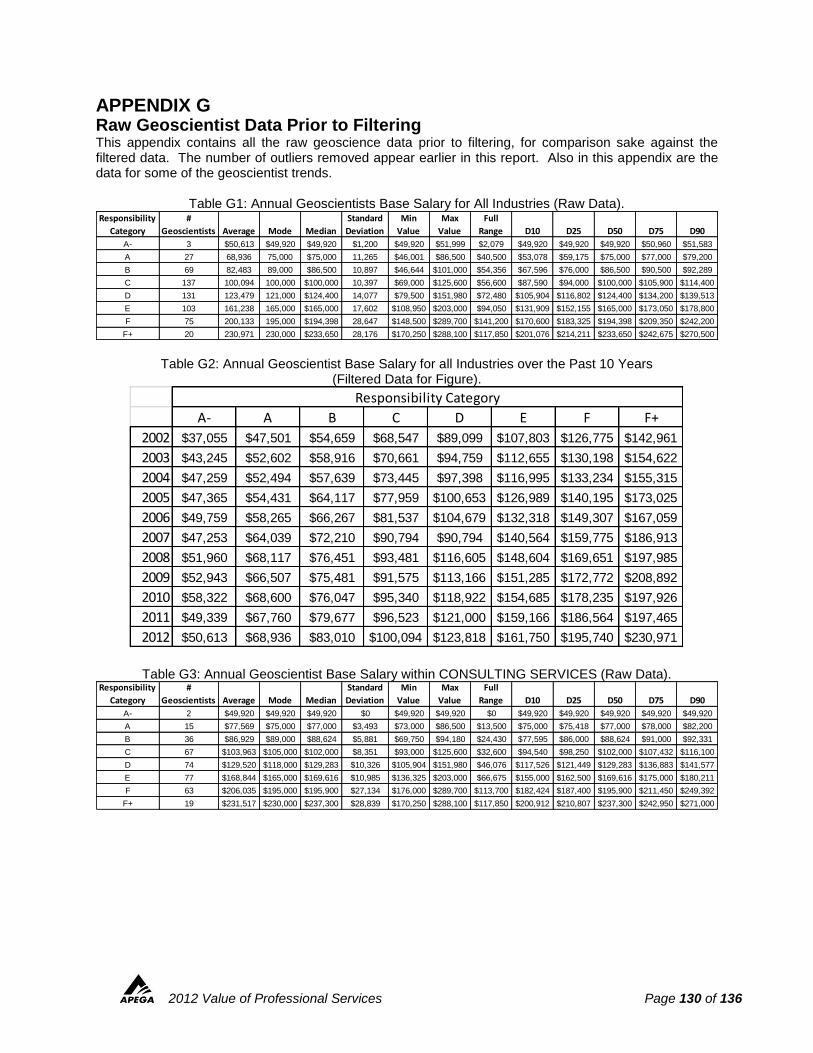
2012 Value of Professional Services Page 130 of 136
APPENDIX G Raw Geoscientist Data Prior to Filtering This appendix contains all the raw geoscience data prior to filtering, for comparison sake against the filtered data. The number of outliers removed appear earlier in this report. Also in this appendix are the data for some of the geoscientist trends.
Table G1: Annual Geoscientists Base Salary for All Industries (Raw Data).
Table G2: Annual Geoscientist Base Salary for all Industries over the Past 10 Years (Filtered Data for Figure).
Table G3: Annual Geoscientist Base Salary within CONSULTING SERVICES (Raw Data).
Responsibility
Category
#
Geoscientists Average Mode Median
Standard
Deviation
Min
Value
Max
Value
Full
Range D10 D25 D50 D75 D90
A- 3 $50,613 $49,920 $49,920 $1,200 $49,920 $51,999 $2,079 $49,920 $49,920 $49,920 $50,960 $51,583
A 27 68,936 75,000 $75,000 11,265 $46,001 $86,500 $40,500 $53,078 $59,175 $75,000 $77,000 $79,200
B 69 82,483 89,000 $86,500 10,897 $46,644 $101,000 $54,356 $67,596 $76,000 $86,500 $90,500 $92,289
C 137 100,094 100,000 $100,000 10,397 $69,000 $125,600 $56,600 $87,590 $94,000 $100,000 $105,900 $114,400
D 131 123,479 121,000 $124,400 14,077 $79,500 $151,980 $72,480 $105,904 $116,802 $124,400 $134,200 $139,513
E 103 161,238 165,000 $165,000 17,602 $108,950 $203,000 $94,050 $131,909 $152,155 $165,000 $173,050 $178,800
F 75 200,133 195,000 $194,398 28,647 $148,500 $289,700 $141,200 $170,600 $183,325 $194,398 $209,350 $242,200
F+ 20 230,971 230,000 $233,650 28,176 $170,250 $288,100 $117,850 $201,076 $214,211 $233,650 $242,675 $270,500
A- A B C D E F F+
2002 $37,055 $47,501 $54,659 $68,547 $89,099 $107,803 $126,775 $142,961
2003 $43,245 $52,602 $58,916 $70,661 $94,759 $112,655 $130,198 $154,622
2004 $47,259 $52,494 $57,639 $73,445 $97,398 $116,995 $133,234 $155,315
2005 $47,365 $54,431 $64,117 $77,959 $100,653 $126,989 $140,195 $173,025
2006 $49,759 $58,265 $66,267 $81,537 $104,679 $132,318 $149,307 $167,059
2007 $47,253 $64,039 $72,210 $90,794 $90,794 $140,564 $159,775 $186,913
2008 $51,960 $68,117 $76,451 $93,481 $116,605 $148,604 $169,651 $197,985
2009 $52,943 $66,507 $75,481 $91,575 $113,166 $151,285 $172,772 $208,892
2010 $58,322 $68,600 $76,047 $95,340 $118,922 $154,685 $178,235 $197,926
2011 $49,339 $67,760 $79,677 $96,523 $121,000 $159,166 $186,564 $197,465
2012 $50,613 $68,936 $83,010 $100,094 $123,818 $161,750 $195,740 $230,971
Responsibility Category
Responsibility
Category
#
Geoscientists Average Mode Median
Standard
Deviation
Min
Value
Max
Value
Full
Range D10 D25 D50 D75 D90
A- 2 $49,920 $49,920 $49,920 $0 $49,920 $49,920 $0 $49,920 $49,920 $49,920 $49,920 $49,920
A 15 $77,569 $75,000 $77,000 $3,493 $73,000 $86,500 $13,500 $75,000 $75,418 $77,000 $78,000 $82,200
B 36 $86,929 $89,000 $88,624 $5,881 $69,750 $94,180 $24,430 $77,595 $86,000 $88,624 $91,000 $92,331
C 67 $103,963 $105,000 $102,000 $8,351 $93,000 $125,600 $32,600 $94,540 $98,250 $102,000 $107,432 $116,100
D 74 $129,520 $118,000 $129,283 $10,326 $105,904 $151,980 $46,076 $117,526 $121,449 $129,283 $136,883 $141,577
E 77 $168,844 $165,000 $169,616 $10,985 $136,325 $203,000 $66,675 $155,000 $162,500 $169,616 $175,000 $180,211
F 63 $206,035 $195,000 $195,900 $27,134 $176,000 $289,700 $113,700 $182,424 $187,400 $195,900 $211,450 $249,392
F+ 19 $231,517 $230,000 $237,300 $28,839 $170,250 $288,100 $117,850 $200,912 $210,807 $237,300 $242,950 $271,000
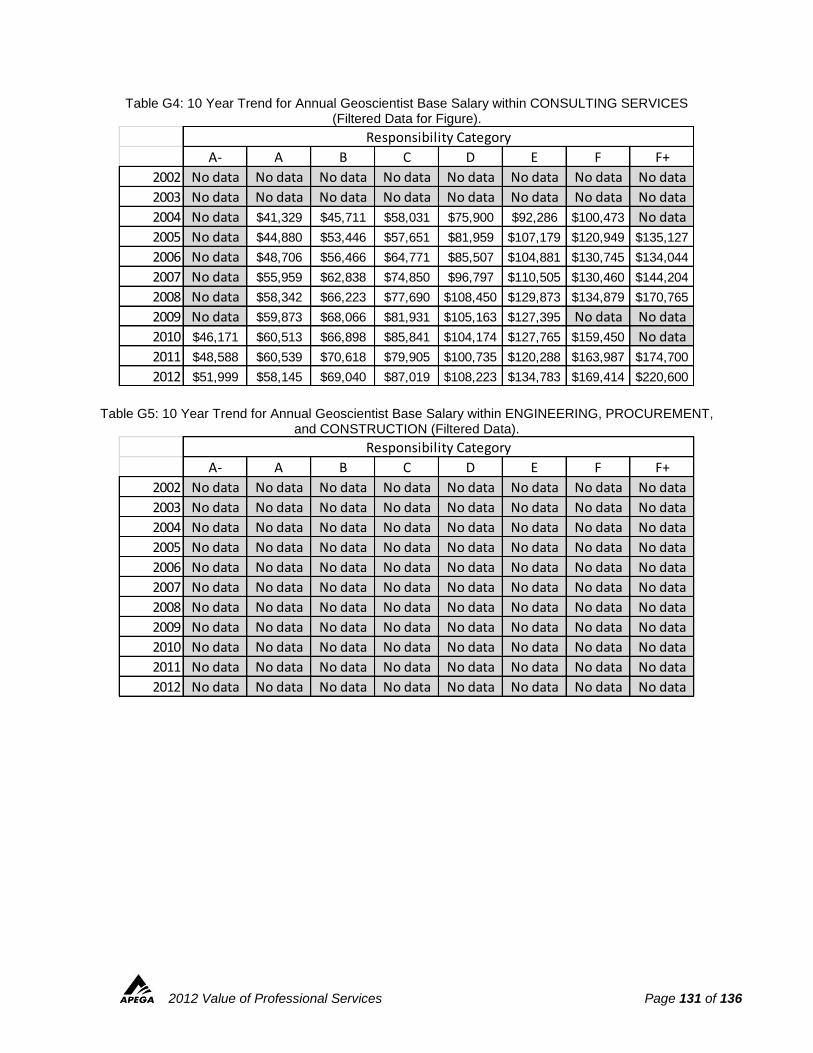
2012 Value of Professional Services Page 131 of 136
Table G4: 10 Year Trend for Annual Geoscientist Base Salary within CONSULTING SERVICES (Filtered Data for Figure).
Table G5: 10 Year Trend for Annual Geoscientist Base Salary within ENGINEERING, PROCUREMENT, and CONSTRUCTION (Filtered Data).
A- A B C D E F F+
2002 No data No data No data No data No data No data No data No data
2003 No data No data No data No data No data No data No data No data
2004 No data $41,329 $45,711 $58,031 $75,900 $92,286 $100,473 No data
2005 No data $44,880 $53,446 $57,651 $81,959 $107,179 $120,949 $135,127
2006 No data $48,706 $56,466 $64,771 $85,507 $104,881 $130,745 $134,044
2007 No data $55,959 $62,838 $74,850 $96,797 $110,505 $130,460 $144,204
2008 No data $58,342 $66,223 $77,690 $108,450 $129,873 $134,879 $170,765
2009 No data $59,873 $68,066 $81,931 $105,163 $127,395 No data No data
2010 $46,171 $60,513 $66,898 $85,841 $104,174 $127,765 $159,450 No data
2011 $48,588 $60,539 $70,618 $79,905 $100,735 $120,288 $163,987 $174,700
2012 $51,999 $58,145 $69,040 $87,019 $108,223 $134,783 $169,414 $220,600
Responsibility Category
A- A B C D E F F+
2002 No data No data No data No data No data No data No data No data
2003 No data No data No data No data No data No data No data No data
2004 No data No data No data No data No data No data No data No data
2005 No data No data No data No data No data No data No data No data
2006 No data No data No data No data No data No data No data No data
2007 No data No data No data No data No data No data No data No data
2008 No data No data No data No data No data No data No data No data
2009 No data No data No data No data No data No data No data No data
2010 No data No data No data No data No data No data No data No data
2011 No data No data No data No data No data No data No data No data
2012 No data No data No data No data No data No data No data No data
Responsibility Category
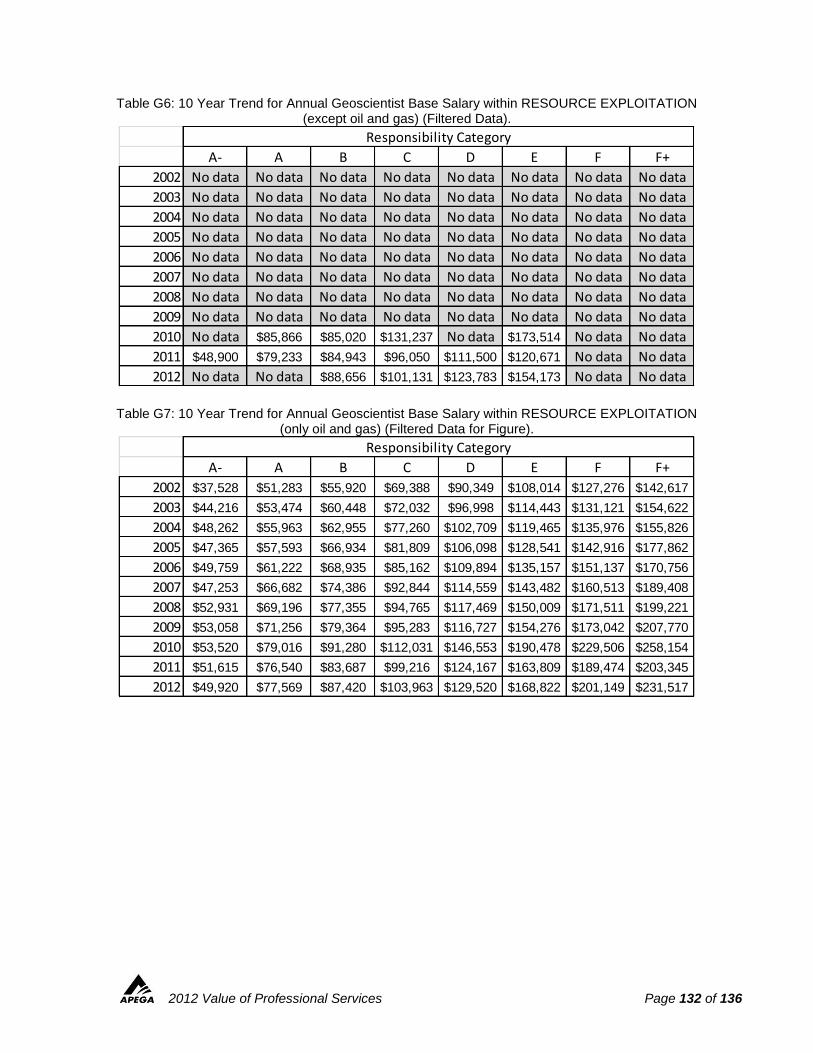
2012 Value of Professional Services Page 132 of 136
Table G6: 10 Year Trend for Annual Geoscientist Base Salary within RESOURCE EXPLOITATION (except oil and gas) (Filtered Data).
Table G7: 10 Year Trend for Annual Geoscientist Base Salary within RESOURCE EXPLOITATION (only oil and gas) (Filtered Data for Figure).
A- A B C D E F F+
2002 No data No data No data No data No data No data No data No data
2003 No data No data No data No data No data No data No data No data
2004 No data No data No data No data No data No data No data No data
2005 No data No data No data No data No data No data No data No data
2006 No data No data No data No data No data No data No data No data
2007 No data No data No data No data No data No data No data No data
2008 No data No data No data No data No data No data No data No data
2009 No data No data No data No data No data No data No data No data
2010 No data $85,866 $85,020 $131,237 No data $173,514 No data No data
2011 $48,900 $79,233 $84,943 $96,050 $111,500 $120,671 No data No data
2012 No data No data $88,656 $101,131 $123,783 $154,173 No data No data
Responsibility Category
A- A B C D E F F+
2002 $37,528 $51,283 $55,920 $69,388 $90,349 $108,014 $127,276 $142,617
2003 $44,216 $53,474 $60,448 $72,032 $96,998 $114,443 $131,121 $154,622
2004 $48,262 $55,963 $62,955 $77,260 $102,709 $119,465 $135,976 $155,826
2005 $47,365 $57,593 $66,934 $81,809 $106,098 $128,541 $142,916 $177,862
2006 $49,759 $61,222 $68,935 $85,162 $109,894 $135,157 $151,137 $170,756
2007 $47,253 $66,682 $74,386 $92,844 $114,559 $143,482 $160,513 $189,408
2008 $52,931 $69,196 $77,355 $94,765 $117,469 $150,009 $171,511 $199,221
2009 $53,058 $71,256 $79,364 $95,283 $116,727 $154,276 $173,042 $207,770
2010 $53,520 $79,016 $91,280 $112,031 $146,553 $190,478 $229,506 $258,154
2011 $51,615 $76,540 $83,687 $99,216 $124,167 $163,809 $189,474 $203,345
2012 $49,920 $77,569 $87,420 $103,963 $129,520 $168,822 $201,149 $231,517
Responsibility Category
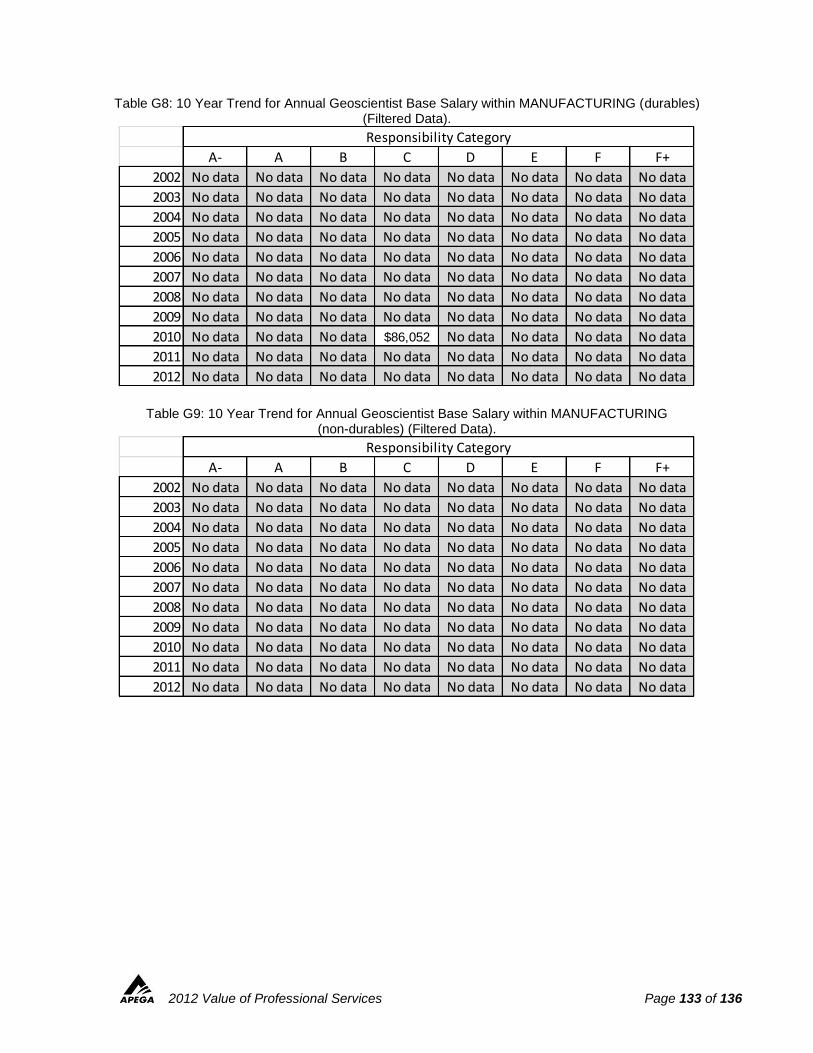
2012 Value of Professional Services Page 133 of 136
Table G8: 10 Year Trend for Annual Geoscientist Base Salary within MANUFACTURING (durables) (Filtered Data).
Table G9: 10 Year Trend for Annual Geoscientist Base Salary within MANUFACTURING (non-durables) (Filtered Data).
A- A B C D E F F+
2002 No data No data No data No data No data No data No data No data
2003 No data No data No data No data No data No data No data No data
2004 No data No data No data No data No data No data No data No data
2005 No data No data No data No data No data No data No data No data
2006 No data No data No data No data No data No data No data No data
2007 No data No data No data No data No data No data No data No data
2008 No data No data No data No data No data No data No data No data
2009 No data No data No data No data No data No data No data No data
2010 No data No data No data $86,052 No data No data No data No data
2011 No data No data No data No data No data No data No data No data
2012 No data No data No data No data No data No data No data No data
Responsibility Category
A- A B C D E F F+
2002 No data No data No data No data No data No data No data No data
2003 No data No data No data No data No data No data No data No data
2004 No data No data No data No data No data No data No data No data
2005 No data No data No data No data No data No data No data No data
2006 No data No data No data No data No data No data No data No data
2007 No data No data No data No data No data No data No data No data
2008 No data No data No data No data No data No data No data No data
2009 No data No data No data No data No data No data No data No data
2010 No data No data No data No data No data No data No data No data
2011 No data No data No data No data No data No data No data No data
2012 No data No data No data No data No data No data No data No data
Responsibility Category
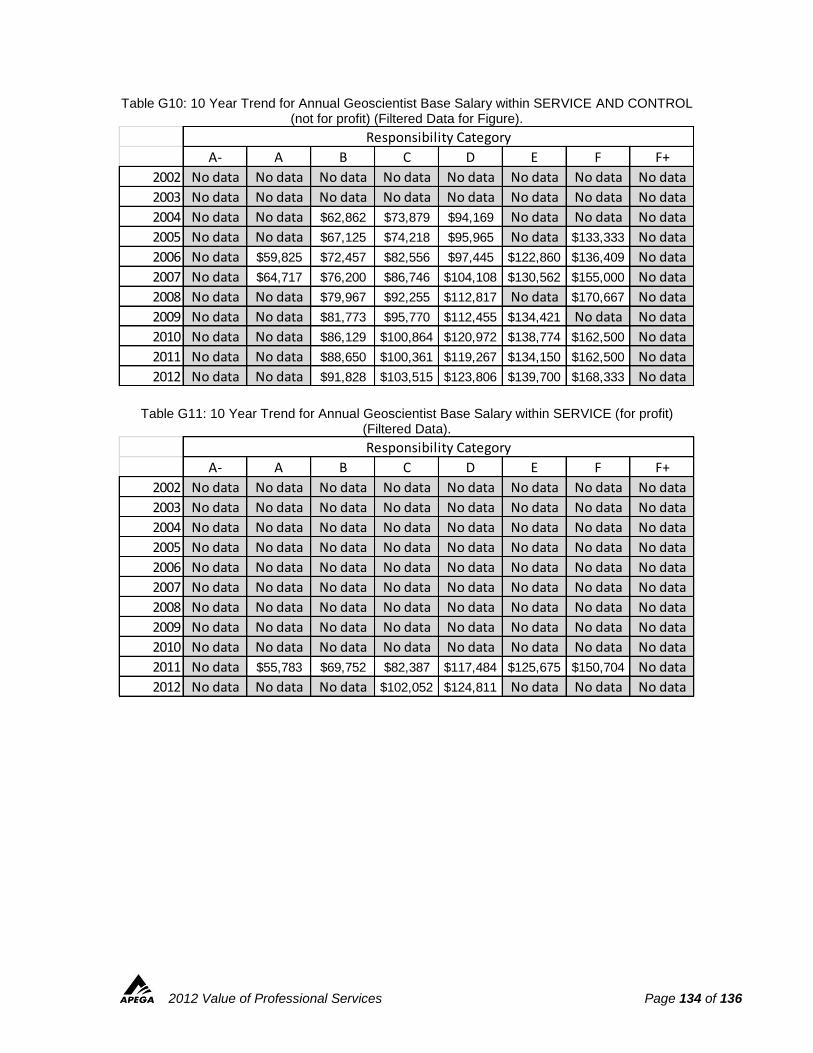
2012 Value of Professional Services Page 134 of 136
Table G10: 10 Year Trend for Annual Geoscientist Base Salary within SERVICE AND CONTROL (not for profit) (Filtered Data for Figure).
Table G11: 10 Year Trend for Annual Geoscientist Base Salary within SERVICE (for profit) (Filtered Data).
A- A B C D E F F+
2002 No data No data No data No data No data No data No data No data
2003 No data No data No data No data No data No data No data No data
2004 No data No data $62,862 $73,879 $94,169 No data No data No data
2005 No data No data $67,125 $74,218 $95,965 No data $133,333 No data
2006 No data $59,825 $72,457 $82,556 $97,445 $122,860 $136,409 No data
2007 No data $64,717 $76,200 $86,746 $104,108 $130,562 $155,000 No data
2008 No data No data $79,967 $92,255 $112,817 No data $170,667 No data
2009 No data No data $81,773 $95,770 $112,455 $134,421 No data No data
2010 No data No data $86,129 $100,864 $120,972 $138,774 $162,500 No data
2011 No data No data $88,650 $100,361 $119,267 $134,150 $162,500 No data
2012 No data No data $91,828 $103,515 $123,806 $139,700 $168,333 No data
Responsibility Category
A- A B C D E F F+
2002 No data No data No data No data No data No data No data No data
2003 No data No data No data No data No data No data No data No data
2004 No data No data No data No data No data No data No data No data
2005 No data No data No data No data No data No data No data No data
2006 No data No data No data No data No data No data No data No data
2007 No data No data No data No data No data No data No data No data
2008 No data No data No data No data No data No data No data No data
2009 No data No data No data No data No data No data No data No data
2010 No data No data No data No data No data No data No data No data
2011 No data $55,783 $69,752 $82,387 $117,484 $125,675 $150,704 No data
2012 No data No data No data $102,052 $124,811 No data No data No data
Responsibility Category
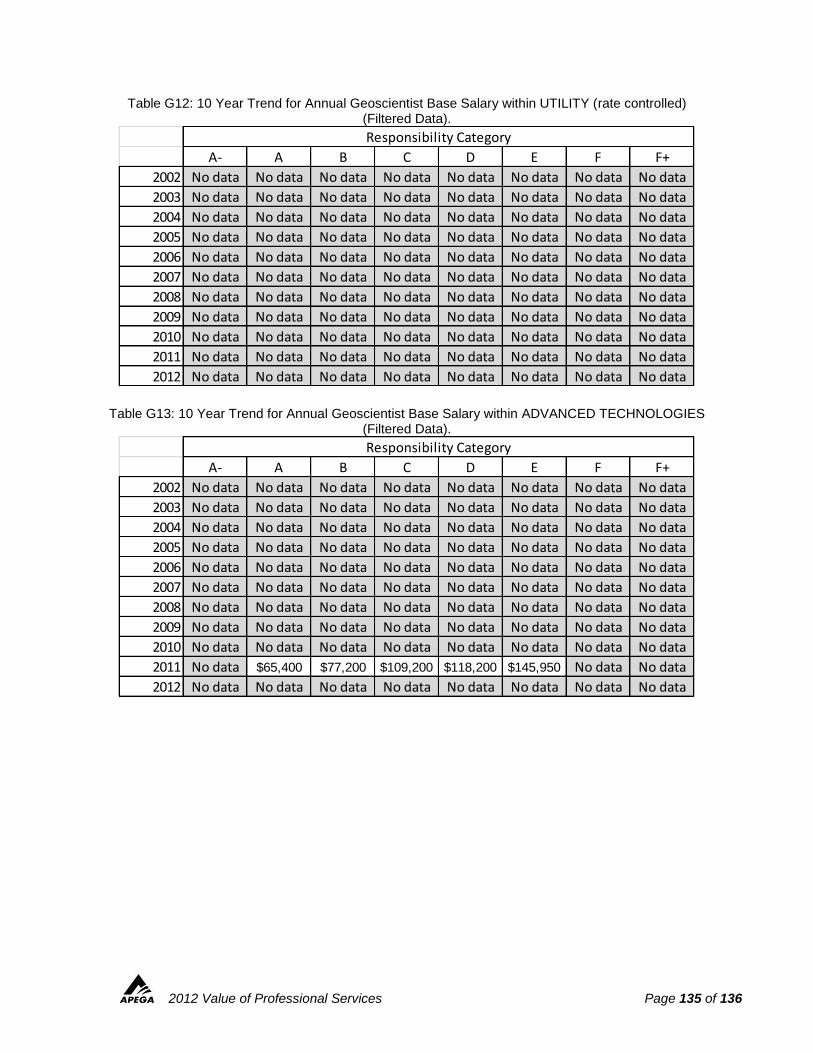
2012 Value of Professional Services Page 135 of 136
Table G12: 10 Year Trend for Annual Geoscientist Base Salary within UTILITY (rate controlled) (Filtered Data).
Table G13: 10 Year Trend for Annual Geoscientist Base Salary within ADVANCED TECHNOLOGIES (Filtered Data).
A- A B C D E F F+
2002 No data No data No data No data No data No data No data No data
2003 No data No data No data No data No data No data No data No data
2004 No data No data No data No data No data No data No data No data
2005 No data No data No data No data No data No data No data No data
2006 No data No data No data No data No data No data No data No data
2007 No data No data No data No data No data No data No data No data
2008 No data No data No data No data No data No data No data No data
2009 No data No data No data No data No data No data No data No data
2010 No data No data No data No data No data No data No data No data
2011 No data No data No data No data No data No data No data No data
2012 No data No data No data No data No data No data No data No data
Responsibility Category
A- A B C D E F F+
2002 No data No data No data No data No data No data No data No data
2003 No data No data No data No data No data No data No data No data
2004 No data No data No data No data No data No data No data No data
2005 No data No data No data No data No data No data No data No data
2006 No data No data No data No data No data No data No data No data
2007 No data No data No data No data No data No data No data No data
2008 No data No data No data No data No data No data No data No data
2009 No data No data No data No data No data No data No data No data
2010 No data No data No data No data No data No data No data No data
2011 No data $65,400 $77,200 $109,200 $118,200 $145,950 No data No data
2012 No data No data No data No data No data No data No data No data
Responsibility Category
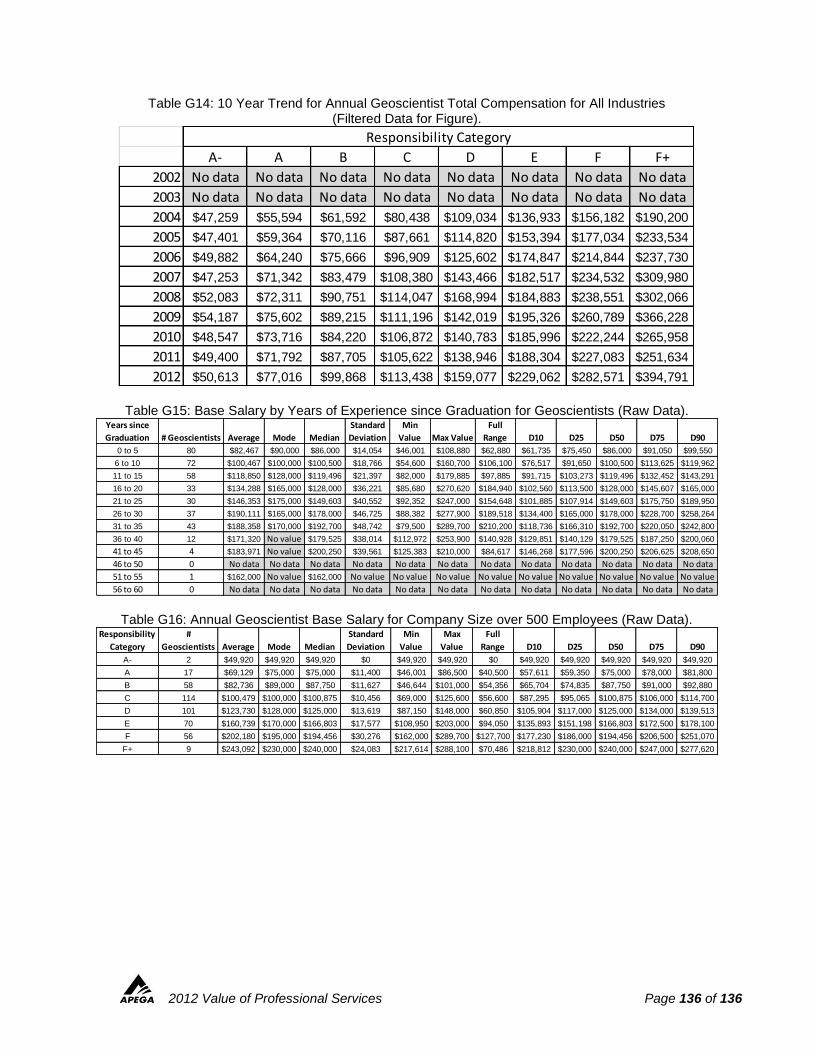
2012 Value of Professional Services Page 136 of 136
Table G14: 10 Year Trend for Annual Geoscientist Total Compensation for All Industries (Filtered Data for Figure).
Table G15: Base Salary by Years of Experience since Graduation for Geoscientists (Raw Data).
Table G16: Annual Geoscientist Base Salary for Company Size over 500 Employees (Raw Data).
A- A B C D E F F+
2002 No data No data No data No data No data No data No data No data
2003 No data No data No data No data No data No data No data No data
2004 $47,259 $55,594 $61,592 $80,438 $109,034 $136,933 $156,182 $190,200
2005 $47,401 $59,364 $70,116 $87,661 $114,820 $153,394 $177,034 $233,534
2006 $49,882 $64,240 $75,666 $96,909 $125,602 $174,847 $214,844 $237,730
2007 $47,253 $71,342 $83,479 $108,380 $143,466 $182,517 $234,532 $309,980
2008 $52,083 $72,311 $90,751 $114,047 $168,994 $184,883 $238,551 $302,066
2009 $54,187 $75,602 $89,215 $111,196 $142,019 $195,326 $260,789 $366,228
2010 $48,547 $73,716 $84,220 $106,872 $140,783 $185,996 $222,244 $265,958
2011 $49,400 $71,792 $87,705 $105,622 $138,946 $188,304 $227,083 $251,634
2012 $50,613 $77,016 $99,868 $113,438 $159,077 $229,062 $282,571 $394,791
Responsibility Category
Years since
Graduation # Geoscientists Average Mode Median
Standard
Deviation
Min
Value Max Value
Full
Range D10 D25 D50 D75 D90
0 to 5 80 $82,467 $90,000 $86,000 $14,054 $46,001 $108,880 $62,880 $61,735 $75,450 $86,000 $91,050 $99,550
6 to 10 72 $100,467 $100,000 $100,500 $18,766 $54,600 $160,700 $106,100 $76,517 $91,650 $100,500 $113,625 $119,962
11 to 15 58 $118,850 $128,000 $119,496 $21,397 $82,000 $179,885 $97,885 $91,715 $103,273 $119,496 $132,452 $143,291
16 to 20 33 $134,288 $165,000 $128,000 $36,221 $85,680 $270,620 $184,940 $102,560 $113,500 $128,000 $145,607 $165,000
21 to 25 30 $146,353 $175,000 $149,603 $40,552 $92,352 $247,000 $154,648 $101,885 $107,914 $149,603 $175,750 $189,950
26 to 30 37 $190,111 $165,000 $178,000 $46,725 $88,382 $277,900 $189,518 $134,400 $165,000 $178,000 $228,700 $258,264
31 to 35 43 $188,358 $170,000 $192,700 $48,742 $79,500 $289,700 $210,200 $118,736 $166,310 $192,700 $220,050 $242,800
36 to 40 12 $171,320 No value $179,525 $38,014 $112,972 $253,900 $140,928 $129,851 $140,129 $179,525 $187,250 $200,060
41 to 45 4 $183,971 No value $200,250 $39,561 $125,383 $210,000 $84,617 $146,268 $177,596 $200,250 $206,625 $208,650
46 to 50 0 No data No data No data No data No data No data No data No data No data No data No data No data
51 to 55 1 $162,000 No value $162,000 No value No value No value No value No value No value No value No value No value
56 to 60 0 No data No data No data No data No data No data No data No data No data No data No data No data
Responsibility
Category
#
Geoscientists Average Mode Median
Standard
Deviation
Min
Value
Max
Value
Full
Range D10 D25 D50 D75 D90
A- 2 $49,920 $49,920 $49,920 $0 $49,920 $49,920 $0 $49,920 $49,920 $49,920 $49,920 $49,920
A 17 $69,129 $75,000 $75,000 $11,400 $46,001 $86,500 $40,500 $57,611 $59,350 $75,000 $78,000 $81,800
B 58 $82,736 $89,000 $87,750 $11,627 $46,644 $101,000 $54,356 $65,704 $74,835 $87,750 $91,000 $92,880
C 114 $100,479 $100,000 $100,875 $10,456 $69,000 $125,600 $56,600 $87,295 $95,065 $100,875 $106,000 $114,700
D 101 $123,730 $128,000 $125,000 $13,619 $87,150 $148,000 $60,850 $105,904 $117,000 $125,000 $134,000 $139,513
E 70 $160,739 $170,000 $166,803 $17,577 $108,950 $203,000 $94,050 $135,893 $151,198 $166,803 $172,500 $178,100
F 56 $202,180 $195,000 $194,456 $30,276 $162,000 $289,700 $127,700 $177,230 $186,000 $194,456 $206,500 $251,070
F+ 9 $243,092 $230,000 $240,000 $24,083 $217,614 $288,100 $70,486 $218,812 $230,000 $240,000 $247,000 $277,620


