Atmospheric Hydrocarbon Emissions from Marine Vessel Transfer Operations API PUBLICATION 2514A SECOND EDITION, SEPTEMBER 1981 American Petroleum Institute 2101 L Street, Northwest Washington, D.C. 20037 11 ' COPYRIGHT American Petroleum Institute Licensed by Information Handling Services COPYRIGHT American Petroleum Institute Licensed by Information Handling Services
Transcript
Atmospheric Hydrocarbon Emissions from Marine Vessel Transfer Operations
API PUBLICATION 2514A SECOND EDITION, SEPTEMBER 1981
American Petroleum Institute 2101 L Street, Northwest Washington, D.C. 20037 11'
COPYRIGHT American Petroleum InstituteLicensed by Information Handling ServicesCOPYRIGHT American Petroleum InstituteLicensed by Information Handling Services
Atmospheric Hydrocarbon Emissions from Marine Vessel Transfer Operations
Measurement Department
API PUBLICATION 2514A SECOND EDITION, SEPTEMBER 1981
American Petroleum Institute
COPYRIGHT American Petroleum InstituteLicensed by Information Handling ServicesCOPYRIGHT American Petroleum InstituteLicensed by Information Handling Services
Nothing contained in any B P I publication is to be construed as granting any right, by implication or otherwise, for the manufacture, sale, or use in connection with any method, apparatus, or product covered by letters patent, nor as insuring anyone against liability for infringement of letters patent.
API publications may be used by anyone desiring to do so, and every effort has been made by the Institute to assure the accuracy and reliability of the data contained in them. However, the Institute makes no representation, warranty, or guarantee in connection with API publications and hereby expressly disclaims any liability or responsibility for loss or damage resulting from their use; for any violation of any federal, state, or municipal regulation with which an API publication may conflict; or for the infringement of any patent resulting from the use sf an API publication.
Copyright o 1981 American Petroleum Institute
COPYRIGHT American Petroleum InstituteLicensed by Information Handling ServicesCOPYRIGHT American Petroleum InstituteLicensed by Information Handling Services
PUBL 25L4A-81
FOREWORD
This publication presents new correlations and emission factors for use in estimating atmospheric emissions and evaporative cargo losses from marine vessel operations. It supersedes the 1976 edition of Bulletin 2514A and the section on marine vessels in the 1959 edition of Bulletin 2514.
The first edition of API Bulletin 2514, Evaporation Loss from Tank Cars, Tank Trucks, and Marine Vessels, published in 1959, presented information on evaporative losses from tank cars, tank trucks, and marine vessels. As part of the process of updating that bulletin, the subject matter was separated into two areas of study: marine vessels (Bulletin 2514A) and tank cars and trucks.
In 1976, the fiist edition of Bulletin 2514A was published as an interim publication and included information that was available at that time on atmospheric emissions resulting from loading gasoline into tankers and barges. Since then, as a result of industry-wide measurement programs, significantly more emission data have become available for other marine operations.
The API Committee on Evaporation Loss Measurement has compiled all available emissions data on marine operations currently practiced in the United States, excluding the operation of crude oil washing. These data have been developed since 1974 and resulted from test programs that used comparable vapor emission measurement procedures. These procedures represent a significant improvement over those used to develop the very limited data upon which the 1959 edition of Bulletin 2514 was based
iii
COPYRIGHT American Petroleum InstituteLicensed by Information Handling ServicesCOPYRIGHT American Petroleum InstituteLicensed by Information Handling Services
Ballasting and Confidence Intervals for Average í'W and UA Values ..... 20
V
COPYRIGHT American Petroleum InstituteLicensed by Information Handling ServicesCOPYRIGHT American Petroleum InstituteLicensed by Information Handling Services
COPYRIGHT American Petroleum InstituteLicensed by Information Handling ServicesCOPYRIGHT American Petroleum InstituteLicensed by Information Handling Services
a
a
a
7-
Abstract
This publication presents new correlations and emission factors for estimating total hydrocarbon emissions and evaporative cargo losses for marine vessel loading and ballasting operations. The publication was developed by the American Petroleum Insti- tute's Committee on Evaporation Loss Measurement, a subcommittee of the Committee on Petroleum Measurement. The correlations and factors are based on recent ship and barge emission tests during typical operations.
Correlations are presented for estimating emissions from loading and ballasting of crude oil tankers. To use the crude oil loading correlation, the Reid vapor pressure and temperature of the crude oil must be known. To use the ballasting correlation, the arrival ullage of the cargo must also be known. Use of the correlations are recommended whenever the required input data are available. No statistically significant correlation could be developed for gasoline loading.
The publication presents several emission factors for gasoline loading that differ according to type of vessel, prior cargo, and compartment treatment during the ballast voyage. Similar factors are presented for crude oil loading. Emission factors for ballast- ing of crude oil tankers are differentiated by the compartment ullage prior to discharging the cargo.
Typical overall emission factors are also provided for use for loading and ballasting operations when the information needed to apply the correlations, or the more detailed factors, is not available.
The correlations and factors for estimating emissions are applicable to product and crude oil tankers currently calling at U.S. ports. These correlations and factors should not be used for estimating emissions from very large crude carriers or for vessels that employ crude oil washing. The publication does not address crude oil loading into barges, gasoline tanker ballasting, or in-transit losses since emission data were not available for these operations.
Evaporative cargo loss estimates were also developed from the emission test data (as presented in Appendix E). Evaporative cargo loss is not necessarily equivalent to an atmospheric emission since a cargo loss occurs whenever cargo evaporates, regardless of whether or not that vapor is displaced from the compartment and emitted into the atmosphere.
COPYRIGHT American Petroleum InstituteLicensed by Information Handling ServicesCOPYRIGHT American Petroleum InstituteLicensed by Information Handling Services
Atmospheric Hydrocarbon Emissions from Marine Vessel Transfer Operations
SECTION I-SUMMARY OF EMISSION CALCULATIONS
1 .I Emission Calculation Procedures Procedures are outlined in this section to estimate the
total hydrocarbon vapor emissions resulting from three different marine transfer operations: (1) the loading of gasoline into tankers and barges, (2) the loading of crude oil into tankers, and (3) the ballasting of crude oil tankers. The emission estimating techniques provide better estimates when applied to a large number of operations or to an entire facility than when applied to a single vessel. The proce- dures are not applicable for estimating loading or ballasting emissions from very large crude carriers (VLCCs) or from vessels that employ crude oil washing.
Emission factors have been developed at three levels of increasing detail and accuracy for estimating emissions during gasoline and crude oil loading and crude oil tanker ballasting operations. The three classes of factors, all ex- pressed in pounds per thousand gallons of cargo or ballast water loaded, are as follows: Level 1-Typical Overall Emission Factors
These factors can be used to estimate emissions for a marine terminal when little or no information is available on the prior cargoes or arrival conditions of vessels calling at the terminal and on the frequency that those conditions occur. Level 2-Category-Specific Emission Factors
These factors differ according to type of vessel, prior cargo, cargo arrival ullage, and Compartment treatment during the ballast voyage, as pertinent. Level 3-Correlations for Estimating Emissions from
Loading and Ballasting of Crude Oil Tankers To use the crude oil loading correlation, the Reid vapor
pressure (RVP) and the temperature of the crude oil must be known. To use the ballasting correlation, the arrival ullage of the cargo must also be known. No statistically significant correlation could be developed for gasoline loading.
Use of the Level 3 correlations is recommended whenever the required input data are available. In their absence, use of the emission factors by category (Level 2) is expected to provide the next most accurate emission esti- mates. The typical overall factors (Level 1) are well-suited for making rough estimates when vessel arrival condition data cannot be developed reliably or are unknown.
1.1.1 GASOLINE LOADING EMISSIONS
If information on the prior cargo and compartment treat- ment during the ballast voyage is unknown, a typical overall gasoline emission factor of 1.8 pounds per 1000 gallons loaded can be assumed for tanker loading operations, and a value of 3.4 pounds per 1000 gallons can be assumed for barge loading operations. These typical overall emission factors are based on a survey of the distribution of com- partment categories at 31 U.S. refinery locations and are shown in Table 1, Level l .
Emissions from gasoline loading operations can be cal- culated if the following information is known: (1) type of vessel; (2) prior cargo; (3) compartment treatment during the ballast voyage; and (4) volume of cargo loaded.
The appropriate category and associated average emis- sion factor can then be identified in Table 1, Level 2. By multiplying the selected average emission factor (in pounds per 1000 gallons) by the volume of gasoline loaded (in 1000-gallon units), the total loading emissions (in pounds) can be estimated.
The total gasoline loading emissions canbe estimated for a vessel or marine facility by weighting the average emis- sion factors in Table 1 by the percentage of the total cargo loaded into compartments in each category. These com- partment categories are defined in 1.2.1.3. The resulting factor is then multiplied by thetotal volume loaded to obtain the estimated total gasoline loading emissions. This proce- dure is illustrated by the sample problem in 1.3.1.
1 .I .2 CRUDE OIL LOADING EMISSIONS
If the percentages of total cargo volume being loaded into the various compartment categories are unknown, a typical overall crude oil emission factor of 1.0 pound per 1000 gallons loaded can be assumed (Table 2, Level 1).
Emissions from crude oil tanker loading operations can be calculated if the following information is known: (1) prior cargo; (2) compartment treatment during the ballast voyage; and (3) volume of cargo loaded.
From this information and the average crude oil emission factors in Table 2, Level 2, total crude oil loading emissions can be estimated by the same procedure given in l. l. 1 for gasoline loading. This procedure is illustrafed by the sam- ple problem in l. 3.2.
1
COPYRIGHT American Petroleum InstituteLicensed by Information Handling ServicesCOPYRIGHT American Petroleum InstituteLicensed by Information Handling Services
2 API PUBLICATION 2514A
fable i-Total Emission Factors for Gasoline Loading Average Emission Factors
(lb11000 gal loaded) Comoartment Treatmint During By Categc
gas-freed, uncleaned I 5 Darge Volatile Uncleaned 3.9 G Barge Volatile Cleaned, gas-freed
Nonvolatile Uncleaned, cleaned, I 2.0 gas-freed
Typical Overall (Level 1)
I .8
3.4
Volatile cargoes are those with a ttue vapor pressure greater than 1.5 pounds per square inch absolute.
If . in addition to the infortnation discussed above for Level 2. ( t h a t is, prior cargo, compartment treatment during bnllast voyage, and volume of cargo loaded), the crude oil vapor pressure is known, then Equation 1 should be used to ilCCount for the effect of crude oil volatility on the average emission factor for any given compartnlent category.
= E,.\ EG ( 1)
IVlrere: ET = total crude oil loading emission factor (lb/1000
gal loaded). En = arrival emission factor, associated with the hydro-
carbon vapor in the compartment prior to loading (Ib/1000 gnl loaded).
Ec; = generated emission factor, associated with the hydrocarbon vapor generated by evaporation during loading (W1000 gal loaded).
Average values of EA for each compartment category are given in Table 3. EG can be calculated from the following equation:
Where: TVP = true vapor pressure of loaded crude oil (psia). M = average vapor molecular weight (Ib/lb-mole). G = vapor growth factor (dimensionless). T = average vapor temperature ("R = "F 4- 460).
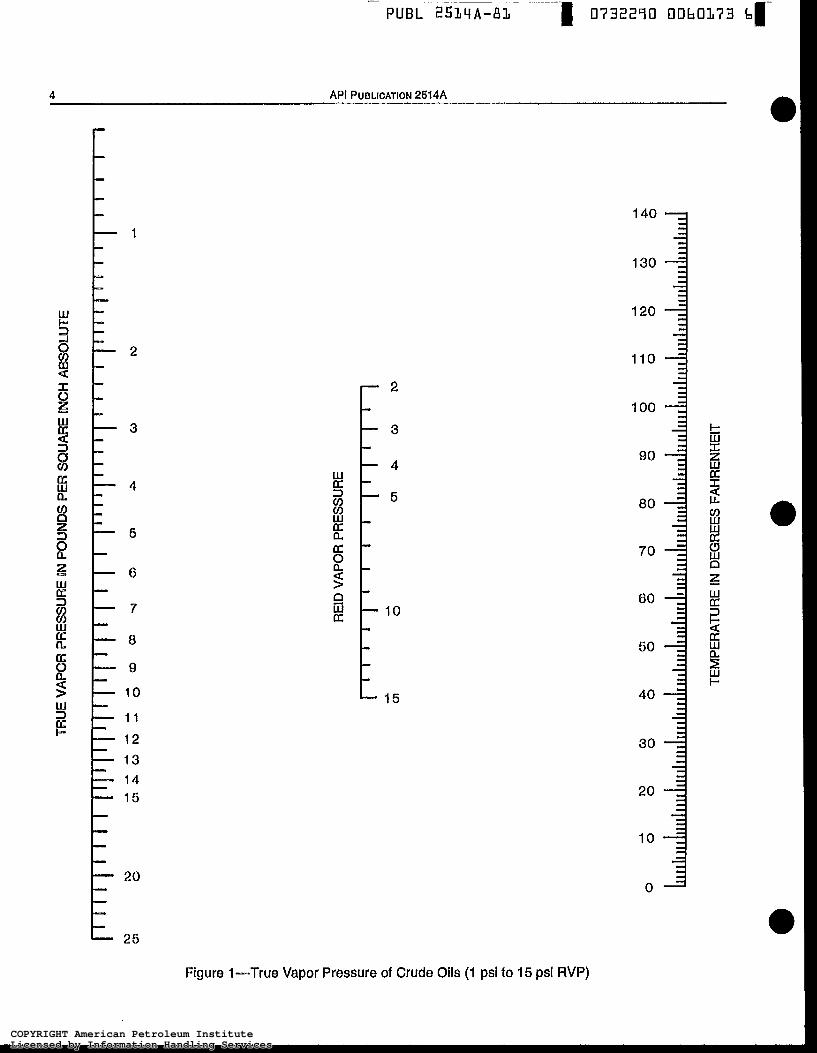
The true vapor pressure can be determined from Figure 1 if the Reid vapor pressure and the temperature of the crude oil being loaded are known. If specific values of M and T are not known, the average values given in Table 3 can be used in Equation 2. Alternately, EG can be read directly from Figure 2, which is based on the average values of M, G, and T from Table 3.
Table 2-Total Emission Factors for Crude Oil Loadinn Average Emission Factors
(lb11000 gal loaded) Compartment Treatment During By Category Typical Overall
o Volatile cargoes are those with a true vapor pressure greater than 1.5 pounds per square inch absolute.
COPYRIGHT American Petroleum InstituteLicensed by Information Handling ServicesCOPYRIGHT American Petroleum InstituteLicensed by Information Handling Services
ATMOSPHERIC HYDROCARBON EMISSIONS FROM MARINE VESSEL TRANSFER OPERATlONS 3
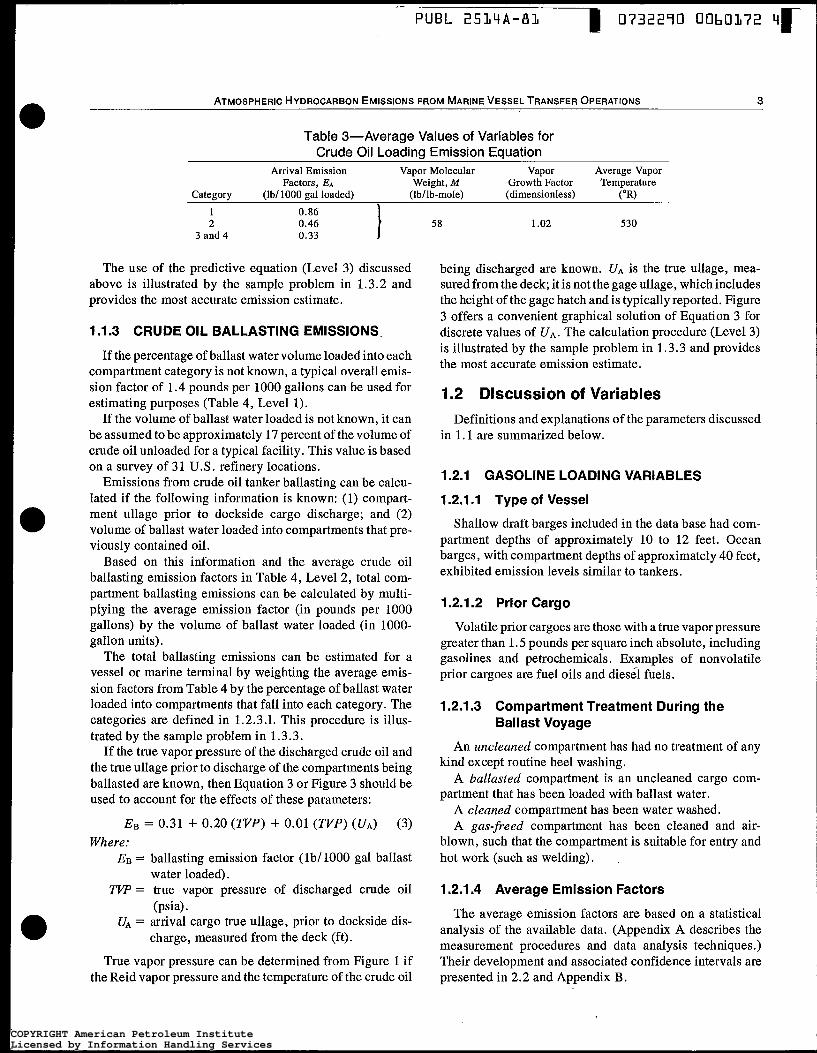
Table 3-Average Values of Variables for Crude Oil Loading Emission Equation
Amval Emission Vapor Molecular Vapor Average Vapor Factors, EA Weight, M Growth Factor Temperature
3 and 4 0.33 I The use of the predictive equation (Level 3) discussed
above is illustrated by the sample problem in 1.3.2 and provides the most accurate emission estimate.
1.1.3 CRUDE OIL BALLASTING EMISSIONS.
If the percentage of ballast water volume loaded into each compartment category is not known, a typical overall emis- sion factor of 1.4 pounds per 1000 gallons can be used for estimating purposes (Table 4, Level 1).
If the volume of ballast water loaded is not known, it can be assumed to be approximately 17 percent of the volume of crude oil unloaded for a typical facility. This value is based on a survey of 31 U.S. refinery locations.
Emissions from crude oil tanker ballasting can be calcu- lated if the following information is known: (1) compart- ment ullage prior to dockside cargo discharge; and (2) volume of ballast water loaded into compartments that pre- viously contained oil.
Based on this information and the average crude oil ballasting emission factors in Table 4, Level 2, total com- partment ballasting emissions can be calculated by multi- plying the average emission factor (in pounds per 1000 gallons) by the volume of ballast water loaded (in 1000- gallon units).
The total ballasting emissions can be estimated for a vessel or marine terminal by weighting the average emis- sion factors from Table 4 by the percentage of ballast water loaded into compartments that fall into each category. The categories are defined in 1.2.3 .l. This procedure is illus- trated by the sample problem in 1.3.3.
If the true vapor pressure of the discharged crude oil and the true ullage prior to discharge of the compartments being ballasted are known, then Equation 3 or Figure 3 should be used to account for the effects of these parameters:
E B = 0.31 + 0.20 ( 7 " ) + 0.01 (TVP) (UA) (3) Where:
EB = ballasting emission factor (lb/ 1000 gal ballast
7" = true vapor pressure of discharged crude oil
UA = arrival cargo true ullage, prior to dockside dis-
water loaded).
(psia).
charge, measured from the deck (ft).
True vapor pressure can be determined from Figure 1 if the Reid vapor pressure and the temperature of the crude oil
58 1 .o2 530
being discharged are known. UA is the true ullage, mea- sured from the deck; it is not the gage ullage, which includes the height of the gage hatch and is typically reported. Figure 3 offers a convenient graphical solution of Equation 3 for discrete values of UA. The calculation procedure (Level 3) is illustrated by the sample problem in l . 3.3 and provides the most accurate emission estimate.
1.2 Discussion of Variables Definitions and explanations of the parameters discussed
in l . 1 are summarized below.
1.2.1 GASOLINE LOADING VARIABLES
1.2.1 .I Type of Vessel
Shallow draft barges included in the data base had com- partment depths of approximately 10 to 12 feet. Ocean barges, with compartment depths of approximately 40 feet, exhibited emission levels similar to tankers.
1.2.1.2 Prior Cargo
Volatile prior cargoes are those with a true vapor pressure greater than l. 5 pounds per square inch absolute, including gasolines and petrochemicals. Examples of nonvolatile prior cargoes are fuel oils and diesel fuels.
1.2.1.3 Compartment Treatment During the Ballast Voyage
An uncleaned compartment has had no treatment of any
A ballasted compartment is an uncleaned cargo com-
A cleaned compartment has been water washed. A gas-freed compartment has been cleaned and air-
blown, such that the compartment is suitable for entry and hot work (such as welding). ,
1.2.1.4 Average Emission Factors
kind except routine heel washing.
partment that has been loaded with ballast water.
The average emission factors are based on a statistical analysis of the available data. (Appendix A describes the measurement procedures and data analysis techniques.) Their development and associated confidence intervals are presented in 2.2 and Appendix B.
COPYRIGHT American Petroleum InstituteLicensed by Information Handling ServicesCOPYRIGHT American Petroleum InstituteLicensed by Information Handling Services
4
1
2
3
4
5
6
7
8
9
10
11 12 13 14 15
20
25
A H PUBLICATION 2514A
140 j
120 1 110 1 1 O0 -3
U
z 2 I- W
4Q
30
20 -El 10 j O
Figure 1-True Vapor Pressure sf Crude Oils (1 psi to 15 psi RVP)
COPYRIGHT American Petroleum InstituteLicensed by Information Handling ServicesCOPYRIGHT American Petroleum InstituteLicensed by Information Handling Services
PUBL 2514A-BL 0732290 0060374
ATMOSPHERIC HYDROCARBON EMISSIONS FROM MARINE VESSEL TRANSFER OPERATIONS 5
.5
.4
.3
.2
.1
O O 2 4 6
TRUE VAPOR PRESSURE, TVP (PSIA)
a
NOTE: Based on average values of M, G, and T from Table 3.
Figure 2-Generated Emission Factor for Crude Oil Loading
Table 4-Emission Factors for Crude Oil Ballasting Average Emission Factors
(lb11000 gal ballast water loadeda) Compartment Condition Prior to Dockside By Category Typical Overall
Category Cargo Discharge (Level 2) (Level 1) I Fully-loaded 1.2 1.4 2 Lightered or previously 1.9 1.4
shortloaded
aOnly including ballast water loaded into cargo compartments.
COPYRIGHT American Petroleum InstituteLicensed by Information Handling ServicesCOPYRIGHT American Petroleum InstituteLicensed by Information Handling Services
e API PUBLICATION 2514A
4.0
3.5
3.8
2.5
2.8
1.5
1 .o
0.5
8
FT
18 FT
5 FT
1 FT
I I I I I o 2 4 6 8 10
TRUE VAPOR PRESSURE, TVP (PSIA)
Figure 3"Emissisn Factor for Ballasting Crude Oil Cargo Compartments
COPYRIGHT American Petroleum InstituteLicensed by Information Handling ServicesCOPYRIGHT American Petroleum InstituteLicensed by Information Handling Services
PUBL 2514A-Bl
ATMOSPHERIC HYDROCARBON EMISSIONS FROM MARINE VESSEL TRANSFER OPERATIONS 7
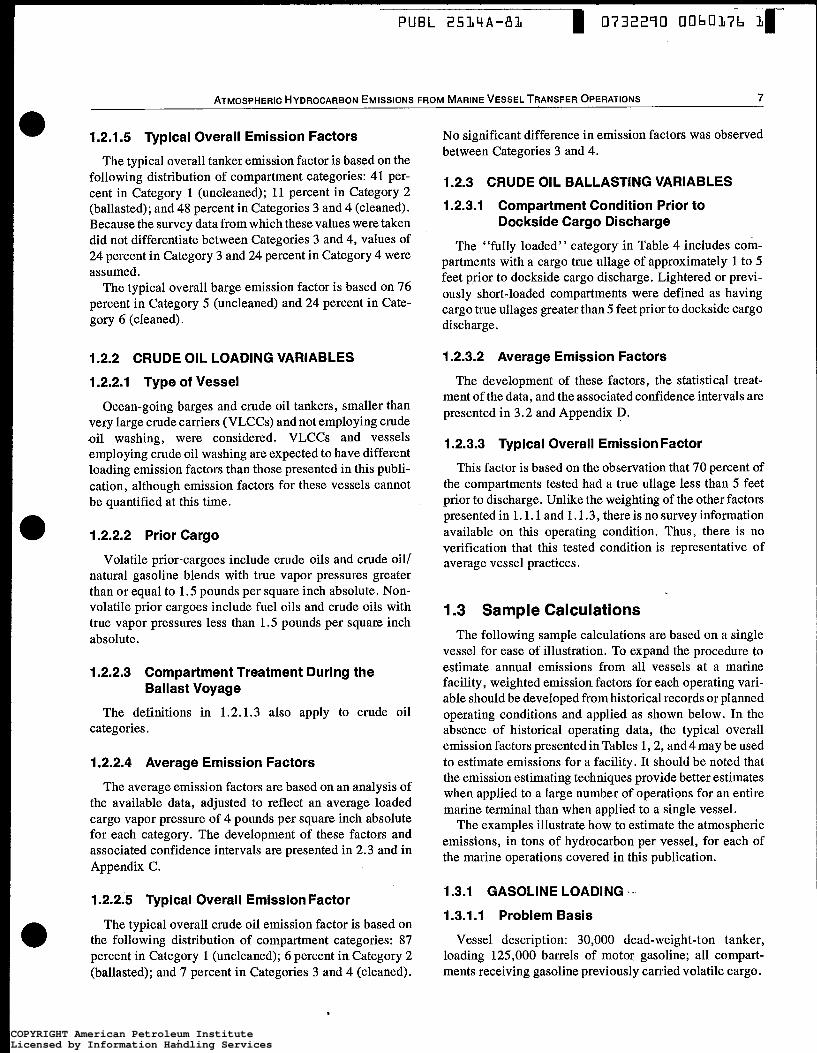
1.2.1.5 Typical Overall Emission Factors
The typical overall tanker emission factor is based on the following distribution of compartment categories: 41 per- cent in Category l (uncleaned); 11 percent in Category 2 (ballasted); and 48 percent in Categories 3 and 4 (cleaned). Because the survey data from which these values were taken did not differentiate between Categories 3 and 4, values of 24 percent in Category 3 and 24 percent in Category 4 were assumed.
The typical overall barge emission factor is based on 76 percent in Category 5 (uncleaned) and 24 percent in Cate- gory 6 (cleaned).
1.2.2 CRUDE OIL LOADING VARIABLES
1.2.2.1 Type of Vessel
Ocean-going barges and crude oil tankers, smaller than very large crude carriers (VLCCs) and not employing crude oil washing, were considered. VLCCs and vessels employing crude oil washing are expected to have different loading emission factors than those presented in this publi- cation, although emission factors for these vessels cannot be quantified at this time.
1.2.2.2 Prior Cargo
Volatile prior-cargoes include crude oils and crude oil/ natural gasoline blends with true vapor pressures greater than or equal to 1.5 pounds per square inch absolute. Non- volatile prior cargoes include fuel oils and crude oils with true vapor pressures less than 1.5 pounds per square inch absolute.
1.2.2.3 Compartment Treatment During the Ballast Voyage
The definitions in 1.2.1.3 also apply to crude oil categories.
1.2.2.4 Average Emission Factors
The average emission factors are based on an analysis of the available data, adjusted to reflect an average loaded cargo vapor pressure of 4 pounds per square inch absolute for each category. The development of these factors and associated confidence intervals are presented in 2.3 and in Appendix C.
1.2.2.5 Typical Overall Emission Factor
The typical overall crude oil emission factor is based on the following distribution of compartment categories: 87 percent in Category 1 (uncleaned); 6 percent in Category 2 (ballasted); and 7 percent in Categories 3 and 4 (cleaned).
. i
No significant difference in emission factors was observed between Categories 3 and 4.
1.2.3 CRUDE OIL BALLASTING VARIABLES
1.2.3.1 Compartment Condition Prior to Dockside Cargo Discharge
The “fully loaded” category in Table 4 includes com- partments with a cargo true ullage of approximately 1 to 5 feet p.rior to dockside cargo discharge. Lightered or previ- ously short-loaded compartments were defined as having cargo true ullages greater than 5 feet prior to dockside cargo discharge.
1.2.3.2 Average Emission Factors
The development of these factors, the statistical treat- ment of the data, and the associated confidence intervals are presented in 3.2 and Appendix D.
1.2.3.3 Typical Overall Emission Factor
This factor is based on the observation that 70 percent of the compartments tested had a true ullage less than 5 feet prior to discharge. Unlike the weighting of the other factors presented in 1. l. 1 and 1.1.3, there is no survey information available on this operating condition. Thus, there is no verification that this tested condition is representative of average vessel practices.
1.3 Sample Calculations The following sample calculations are based on a single
vessel for ease of illustration. To expand the procedure to estimate annual emissions from all vessels at a marine facility, weighted emission factors for each operating vari- able should be developed from historical records or planned operating conditions and applied- as shown below. In the absence of historical operating data, the typical overall emission factors presented in Tables 1,2, and4 may be used to estimate emissions for a facility. It should be noted that the emission estimating techniques provide better estimates when applied to a large number of operations for an entire marine terminal than when applied to a single vessel.
The examples illustrate how to estimate the atmospheric emissions, in tons of hydrocarbon per vessel, for each of the marine operations covered in this publication.
1.3.1 GASOLINE LOADING ’--
1.3.1.1 Problem Basis
Vessel description: 30,000 dead-weight-ton tanker, loading 125,000 barrels of motor gasoline; all compart- ments receiving gasoline previously carried volatile cargo.
COPYRIGHT American Petroleum InstituteLicensed by Information Handling ServicesCOPYRIGHT American Petroleum InstituteLicensed by Information Handling Services
Using the average emission factors from Table 1, Level 2, and the vessel arrival conditions given, determine a weighted average enlission factor as shown below:
Average Factor Weighted Factor €notegory Percent (lb11000 gal) (IblIOOO gal)
I 25 2.6 0.65 2 I O 1.9 o. 17 4 65 0.7 0.46
1.28 or 1.3 IbllOOO gal
Calculate the total emissions, T H C , in tons by multiplying the weighted average emission factor by the total volume of gasoline loaded (including appropriate conversion factors):
Vessel description: 30,000 dead-weight-ton tanker, loading 180,000 barrels of domestic crude oil; all compart- ments previously carried crude oil.
Compartment arrival conditions: 85 percent uncleaned (Category I ) and 15 percent cleaned (Category 3).
1.3.2.2 Solution, Case A-Crude Oll Vapor Pressure Not Available
Using the average emission factors from Table 2, Level 2, and the vessel arrival conditions given, determine a weighted average emission factor as shown below:
€ntegory Percent (lb11000 gal) (lb11000 gal) Average Factor Weighted Factor
I 85 3 15
1.1 0.94 0.6 0.09
1.03 ar 1.0 lbllOOO gal
Calculate the total emissions, TIIC, by multiplying the weighted average emission factor by the total volume of cm& oil loaded (including appropriateconversionfactors).
% I C = (1~) (&) (180 ,000bb1) (42 1 .o lb $) = 3.8 tons
1.3.2.3 Solution, Case B-Crude Oil Vapor Pressure Available
Assume the same vessel and arrival conditions as given in 1.3.2.1. Also, assume that the crude oil has a Reid vapor pressure of 4 pounds per square inch and is loaded at 60°F (520OR). Using this information, a better estimate of emis- sions can be made than shown in Case A.
To determine the total emissions, THC, the arrival and generated emission factors must first be determined.
The arrival emission factor, EA, on the average, was not found to be dependent on vapor pressure. From Table 2, the average arrival factors for Categories 1 and 3 are 0.86 and 0.33 pounds per 1000 gallons, respectively.
The generated emission factor, EG, is dependent upon the true vapor pressure of the crude oil. From Figure 1, true vapor pressure equals 2.0 pounds per square inch absolute, for a Reid vapor pressure of 4.0 pounds per square inch and a cargo temperature of GOOF. EG can be read from Figure 2 or calculated from Equation 2, assuming an average vapor molecular weight of 58 pounds per pound-mole and an average vapor growth factor of 1 .O2 from Table 3.
EG = 1.84 [0.44(2.0) - 0.421 (58)( 1.02)
(520) = O. 10 lb/1000 gal
The total emission factor, ET, is determined for each category from Equation 1. A weighted average emission factor for the total loading operation is determined from the total emission factors for each category and the given vessel arrival conditions, as shown:
Category BA + Ec = ET Percent (lb11000gal) Weighted Factor
1 0.86 0.10 0.96 85 0.82 3 0.33 0.10 0.43 15 0.06
0.88 or 0.9 IbllOOO gal
"
Calculate the total emissions, THC, as in 1.3.2.2:
Vessel description: 80,000 dead-weight-ton tanker, un- loading 600,000 barrels of crude oil; 17 percent of the cargo capacity is filled with ballast water after discharge.
Compartment conditions: 80 percent of the ballast water is loaded into compartments that had been fully loaded to 1 foot ullage (Category l), and 20 percent of the ballast
COPYRIGHT American Petroleum InstituteLicensed by Information Handling ServicesCOPYRIGHT American Petroleum InstituteLicensed by Information Handling Services
PUBL 2514A-81 1 0732290 0 0 6 0 1 7 8 T
ATMOSPHERIC HYDROCARBON EMISSIONS FROM MARINE VESSEL TRANSFER OPERATIONS 9
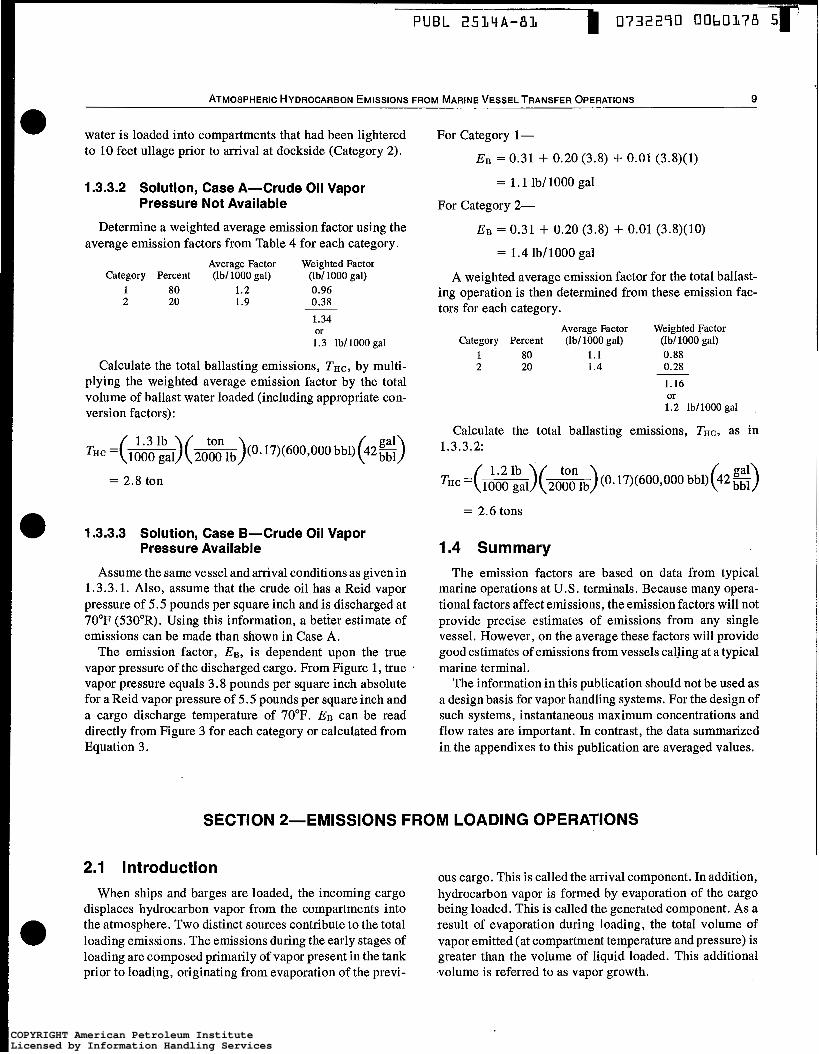
water is loaded into compartments that had been lightered to 10 feet ullage prior to arrival at dockside (Category 2).
1.3.3.2 Solution, Case A-Crude Oil Vapor Pressure Not Available
Determine a weighted average emission factor using the average emission factors from Table 4 for each category.
Calculate the total ballasting emissions, THC, by multi- plying the weighted average emission factor by the total volume of ballast water loaded (including appropriate con- version factors):
-( )(0"-)(0.17)(600,000 bb1)(42$) -
1000 gal 2000 lb 1 3 1 b
= 2.8 ton
1.3.3.3 Solution, Case B-Crude Oil Vapor Pressure Available
Assume the same vessel andarrival conditions as given in 1.3.3. l. Also, assume that the crude oil has a Reid vapor pressure of 5.5 pounds per square inch and is discharged at 70°F (530"R). Using this information, a betier estimate of emissions can be made than shown in Case A.
The emission factor, EB, is dependent upon the true vapor pressure of the discharged cargo. From Figure 1, true vapor pressure equals 3.8 pounds per square inch absolute for a Reid vapor pressure of 5.5 pounds per square inch and a cargo discharge temperature of 70°F. EB can be read directly from Figure 3 for each category or calculated from Equation 3.
For Category 1-
E g = 0.31 + 0.20 (3.8) + 0.01 (3.8)(1)
= 1.1 lb/ 1000 gal
For Category 2-
E B = 0.31 + 0.20 (3.8) + 0.01 (3.8)(10)
= l. 4 lb/ 1000 gal
A weighted average emission factor for the total ballast- ing operation is then determined from these emission fac- tors for each category.
Calculate the total ballasting emissions, THC, as in 1.3.3.2:
T -( - ~~ 1000 gal )( 2000 ton lb )(0.17)(600,000bb1)(42~)
= 2.6 tons
1.4 Su m mary The emission factors are based on data from typical
marine operations at U.S. terminals. Because many opera- tional factors affect emissions, the emission factors will not provide precise estimates of emissions from any single vessel. However, on the average these factors will provide good estimates of emissions from vessels calling at a typical marine terminal.
The information in this publication should not be used as a design basis for vapor handling systems. For the design of such systems, instantaneous maximum concentrations and flow rates are important. In contrast, the data summarized in the appendixes to this publication are averaged values.
SECTION 2-EMISSIONS FROM LOADING OPERATIONS
2.1 Introduction ous cargo. This is called the arrival componer It. In additia When ships and barges are loaded, the incoming cargo hydrocarbon vapor is formed by evaporation of the cargo
displaces hydrocarbon vapor from the compartments into being loaded. This is called the generated component. As a the atmosphere. Two distinct sources contribute to the total result of evaporation during loading, the total volume of loading emissions. The emissions during the early stages of vapor emitted (at compartment temperature and pressure) is loading are composed primarily of vapor present in the tank greater than the volume of liquid loaded. This additional prior to loading, originating from evaporation of the previ- volume is referred to as vapor growth.
COPYRIGHT American Petroleum InstituteLicensed by Information Handling ServicesCOPYRIGHT American Petroleum InstituteLicensed by Information Handling Services
2.2 Gasoline Loading 2.2.1 DATA BASE
The emission factors for gasoline loading are based on tests of I22 compartments taken during nearly 100 ship and barge loading operations. Emissions were determined by periodically sampling vapors displaced from individual cotupartnwnts during a complete loading cycle. The testing procedure is summarized in Appendix A. The data are summarized in Appendix B. The gasoline cargoes spanned a volatility range of 3.4-12.4 pounds per square inch abso- lute true vapor pressure. The test data were collected during all seasons of the year and in many regions of the country, chiefly during routine loading operations.
2.2.2 DEVELOPMENT OF EMISSION FACTORS
Analysis of the gasoline loading test data showed the need for six categories of emission factors to account for differences i n the type of vessel, prior cargo, and arrival condition.
The first broad distinction was the separation of shallow draft barges and lager vessels. Ships normally had lower emission factors than shallow draft barges. Ocean-going barges had enlission factors typical of ships.
The emission data were further differentiated by the vol- atility of the prior cargo. Volatile prior cargoes, defined as cargoes having a true vapor pressure greater than 1.5 pounds per square inch absolute, resulted in higher arrival vapor concentrations and higher total emissions than non- volatile prior cargoes. all other aspects being equal.
Finally. the data were grouped according to the com- partment operations conducted after discharge of the prior cargo. Ballasting, cleaning, and gas-freeing operations each affected the emissions observed during the subsequent loading differently. Compartments in wllich cleaning was linlited to washing out the heel of prior cargo with water were classified as uncleaned for purposes of grouping the data.
Further. analysis of the test data in each of the six categories resulted in the development of the emission fac- tors presented in Table l . Their development is described in Appendix B.
2.2.3 CONSIDERATION OF EMISSION CORRELATION
A mathematical analysis was performed to relate the generated loading emissions to the true vapor pressure of the gasoline loaded. The resulting correlation was not found to be statistically significant and did not improve upon the enlission predictions obtained using the average emission factors in Table 1. Various unmeasured random and sys- tematic effects obscured the effect of cargo vapor pressure
on the generated emissions. Consequently, no correlation is recommended at this time for predicting gasoline loading emissions as a function of the vapor pressure of the gasoline loaded.
2.2.4 ASSESSMENT OF PREDICTIONS
The emission factors presented in Table 1 are based on a broad data base and describe emissions from typical gasoline loading operations. However, every loading oper- ation appears unique in some respect. Differences related to the design and operation of individual vessels and marine terminals, as well as the characteristics and environment of the loaded prior cargoes, create significant variability in the observed emissions within each of the six categories.
A statistical analysis of the variability as it relates to confidence in the predictions is summarized in Appendix B. The analysis provides a measure of the uncertainty in the estimated emissions when the emission factors are applied. The range of emission factors for each of the six categories at 90 percent confidence for both 1 and 100 compartment loadings are presented in Appendix B (Table B-2). As shown there, the range narrows greatly as the number of compartments being estimated increases.
2.3 Crude O51 Loading 2.3.1 DATA BASE
Emission tests of 67 compartments during 16 vessel loading operations were available for development of the crude oil loading emission factors and correlation. Emis- sions weremonitored by sampling vapors vented fromindi- vidual compartments during a complete loading cycle. The testing procedure is summarized in Appendix A. All tests were conducted during routine ship loading operations.
The emission data are summarized in Appendix C! and span the following ranges:
Range
RVP of crude loaded (lb) 0.2-7.0 Loaded cargo temperature (OF) 68-120 TVP of crude loaded (psia) 1.0-6.5
Six different crude oils were loaded during the 16 tests. The majority were Southern California crudes, which tend to be moderately volatile, medium-gravity oils. The crude oils loaded were: Santa Barbara Offshore (3 tests); Mon- talvo (3 tests); Ventura (3 tests); Ventura plus 10 percent natural gasoline (4 tests); San Joaquin Heavy (2 tests); and Nigerian Light (1 test).
2.3.2 DEVELOPMENT OF EMISSION FACTORS
Table 2 presents the emission factors in pounds per 1000 gallons of crude oil loaded. These factors were developed
711
a
a
a
COPYRIGHT American Petroleum InstituteLicensed by Information Handling ServicesCOPYRIGHT American Petroleum InstituteLicensed by Information Handling Services
PUBL 2514A-B1
ATMOSPHERIC HYDROCARBON EMISSIONS FROM MARINE VESSEL TRANSFER OPERATIONS 11
for several categories, depending on compartment treat- ment during the ballast voyage and the volatility of the prior cargo, as described in 2.2.2. The factors apply to ships, excluding very large crude carriers, and to ocean-going barges.
The emission factors for Categories 1, 3, and 4 were obtained by arithmetically averaging the emission data in each of these three categories. Direct comparison of the average emission factors for the three categories was dif- ficult since the crude oil loading emission factors were found to depend onthe true vapor pressure of the crude oil loaded, but the average true vapor pressure of the crudes was not the same for the three categories. In order to compare the emission factors and provide the best estimate' of emissions, the average emission factors in Table 2 were adjusted to a common basis of 4 pounds per square inch absolute true vapor pressure using Equations 1 and 2.
The data base for Category 2 was too sparse to provide a representative average emission factor. Instead, the emis- sion factor was estimated by adjusting the crude oil emis- sion factor for Category 1 by the ratio of gasoline loading emission factors between Category 2 and Category 1.
Further details on development of the average emission factors are given in Appendix C .
2.3.3 DEVELOPMENT OF THE EMISSION CORRELATION
Several equations for correlating the emission factors with characteristics of the cargo loaded and prior cargo were examined. A statistically significant correlation was developed that relates the generated emission factor to the true vapor pressure of the cargo loaded. The relationship is given by Equation 2. Its development is described in Ap- pendix C.
No statistically significant correlations were found to relate the arrival portion of the emission factor with
characteristics of the prior cargo. The most promising cor- relating variable-the vapor pressure of the prior cargo- was not available for most tests. Other potential correlating parameters that were available, such as prior cargo ullage, did not correlate significantly with the arrival emission factors.
Use of Equations 1 and 2 whenever the true vapor pres- sure of the loaded cargo is known will improve the estimate of crude oil loading emissions as compared with the use of the average emission factors given in Table 2.
2.3.4 ASSESSMENT OF PREDICTIONS
For most of the 16 crude oil loading operations, the test data were averaged for all the compartments tested on each vessel and an average emission factor was calculated for the vessel rather than for the individual compartments. Thus, the data base, though sizable, could not be used to develop a statistical analysis of the crude oil loading emission factors. However, the average emission factors in Table 2, as well as the correlation given by Equation 2, are considered to be representative because of the large number of compartment loadings incorporated in the data base.
The correlation was based on emission data from moderate-volatility crude oils with a range of 1.0-6.5 pounds per square inch absolute true vapor pressure. Some loss in accuracy can be expected if the correlation is applied outside this range.
Emission estimates of an isolated loading are necessarily subject to greater uncertainties than erhission estimates of a large number of loadings because of unique operating con- ditions associated with a particular loading operation. With a large number of vessel loadings, random and systematic effects introduced by differing operating practices of vari- ous tankers and operators serving a terminal will tend to average out and reduce the uncertainty in the overall emis- sion estimates.
SECTION 3-EMISSIONS FROM BALLASTING OPERATIONS
3.1 Introduction Hydrocarbon vapors are displaced into the atmosphere
when a compartment that had previously carried volatile petroleum is loaded with ballast water. The emissions con- sist of vapor present in the ullage space of a cargo compart- ment at the start of unloading together with additional vapors that are generated during and after unloading. The hydrocarbon concentration of the vapor in the ullage space before unloading is directly related to the true ullage prior to discharge and to the volatility of the crude oil to be dis- charged. The vapors generated during and after unload-
ing depends chiefly on the volatility of the crude oil being discharged.
3.2 Ballasting of Crude Oil Tankers 3.2.1 DATA BASE
The data base for crude oil ballasting emissions was developed during a test program conducted at 31 refineries in the United States during a 10-month period. Because little or no gasoline is unloaded at these refineries, no test
COPYRIGHT American Petroleum InstituteLicensed by Information Handling ServicesCOPYRIGHT American Petroleum InstituteLicensed by Information Handling Services
12 API PUBLICATION 26148
data or emission factors for ballasting gasoline tankers were developed.
Crude oil ballasting emissions were determined by measuring the concentration and composition of vapors displaced from individual Compartments during normal dockside ballasting operations. The testing procedure is summarized in Appendix A.
The data base is summarized in Appendix D and includes tests during 21 ballasting operations involving 14 major crude oils that are routinely brought into U.S. refineries. Emissions were measured from 54 separate compartments. Hach test included the measurement of emissions from one to six ballasted compartments. The range of the data base is as follows:
Range RVP of crude discharged (lb) 0.7- 8.6 Crude oil temperature
during discharge (‘FI 42.0-132.0 TVP of crude discharged (psia) 1.3- 8.4
Table 4 presents average total hydrocarbon emission factoes, in pounds per 1000 gallons of ballast water loaded, for ballasting into uncleaned crude oil cargo compartments. The factors were developed for two categories, depending on the degree to which a compartment is filled just prior to discharge. The first category applies to compartments with a crude oil true ullage (distance from deck to cargo surface) cqual to or less than 5 feet just prior to discharge at the dock. The second applies to lightered or previously short-loaded compartments, with a true ullage greater than 5 feet just prior to dockside discharge.
Further details on the development of the average emis- sion factors are given in Appendix D.
3.2.3 DEVELOPMENT OF EMISSION CORRELATIONS
As with the crude oil loading emission factors, the bal- lasting emission factors were found to depend on the true
vapor pressure of the discharged crude oil. The emission factors were also found to depend on the true ullage of the cargo prior to discharge. An empirical equation, Equation 3, was developed to relate the ballasting emissions to these parameters. The use of Equation 3 improves on the emis- sion estimates obtained using the average emission factors in Table 4.
The equation was derived by combining variables that logically represent the two ballasting emission compo- nents, arrival and generated vapor. One termin the equation that includes only true vapor pressure can be thought of as representing emissions generated during unloading. Another term that includes both true vapor pressure and ullage represents the vapors present upon arrival, However, because the arrival and generated vapors are often inter- mixed during discharge, i t was not possible to correlate each emission component separately. Instead, the arrival and generated vapors were handled together in the mathematical regression analysis that was used to develop the equation. Development of the correlation is described in Appendix D.
3.2.4 ASSESSMENT OF PREDICTIONS
The data base used to develop Equation 3 encompasses crudes in the volatility range of 1.3-8.4 pounds per square inch absolute true vapor pressure. Some loss in accuracy can be expected if the correlation is applied outside this range.
The ballasting emission factors and correlation can be used with the most confidence when applied to estimate emissions from a wide range of operations at a marine terminal. Random and systematic impacts on emissions due to varying operating practices and designs of ships and marine terminals will tend to average out for larger numbers of ballasting operations. Emission estimates for fewer bal- lastings are subject to somewhat larger uncertainties. A statistical analysis of the variability in estimated emissions as it relates to the confidence in the predicted values is presented in Appendix D. The analysis provides a measure of the uncertainty in the estimated emissions when the emission factors and correlation are applied.
COPYRIGHT American Petroleum InstituteLicensed by Information Handling ServicesCOPYRIGHT American Petroleum InstituteLicensed by Information Handling Services
APPENDIX A
MEASUREMENT PROCEDURES AND DATA ANALYSIS TECHNIQUES
A.l Scope of Test Programs The test programs from which the marine emissions data
base was developed were designed to determine the total hydrocarbon emissions from a vessel's cargo tanks during gasoline and crude oil loading and during cargo tank bal- lasting after the discharge of crude oil. In general, the measurement procedures and data analysis techniques used in these programs followed those developed as part of the Western Oil and Gas Association (WOGA) Marine Mea- surement Program.' The tests were conducted during all seasons of the year and in many regions of the country, usually during routine operations. U.S.. Coast Guard ap- proval of the test procedure was obtained to ensureallsafety requirements were satisfied.
The following parameters were recorded, when appro- priate, for each compartment tested.
0 l . General information- a. Date and vessel name. b. Identification number, capacity, and depth of com-
c. Ambient, emitted vapor, and cargo/ballast water partment.
temperatures. 2. For loading tests-
a. Compartment condition upon arrival (ballast voyage
b. Loading rate. c. Identification, volume, and Reid vapor pressure of
loaded cargo (plus specific gravity and viscosity of crude oil).
treatment and prior cargo).
3. For ballasting tests- a. True ullage prior to dockside discharge of cargo. b. Unloading and ballasting rates; time between un-
loading and start of ballasting operation. c. Identification, Reid vapor pressure, specific gravity,
and viscosity of discharged crude oil; volume of bal- last water loaded.
A.2 Measurement Procedures The concentration of the hydrocarbon vapors emitted
from each tested compartment was measured periodically a - i Hydrocarbon Emissions During Marine Tanker Loading, Measurement Program, Ventrrra County, California, Western Oil and Gas Association, May 1917.
during a complete loading/ballasting cycle. In general, the measurements were made with an MSA Model 53 Gascope or a similar instrument. The gascope was connected to a probe that was inserted into the ullage trunk to approxi- mately deck level. Before and after each concentration reading, the gascope was zeroed with air supplied through a line extending over the upwind side of the ship. The true ullage at the time of each concentration reading was deter- mined by a continuous metering tape or by manual gaging.
Each gascope was connected in series with a vapor sam- ple bag that enabled concentrations readings and samples to be taken simultaneously. The vapor samples were sub- sequently analyzed by gas chromatography or nondisper- sive infrared techniques using laboratory equipment. The sample analyses were used to calibrate the respective gas- cope.
In some of the gasoline loading tests gascopes were not used. In these tests, vapor samples analyses were used exclusively to determine the hydrocarbon concentrations of the vented vapors.
A.3 Data Analysis To calculate an emission factor for each test, it was
necessary to determine the average hydrocarbon concen- tration, its molecular weight, and the total volume of the vented vapor. These values were obtained as described below.
The corrected vapor concentration readings (the gascope readings with the calibration factor applied) were plotted versus true ullage to determine the average hydrocarbon concentration for each test. A typical emission profile is shown in Figure A- l. These curves were then graphically or analytically integrated to determine an average vented hydrocarbon concentration.
Molecular weight data, usually obtained by chromato- graphic analyses of the vapor samples, were plotted in a similar fashion and used to determine an average molecular weight for each test. For some of the gasoline loading tests, molecular weight was not determined by vapor analysis. In these cases a typical vapor weight of 64 was assumed.
For loading operations, the volume of the vented vapor was calculated from the loaded cargo volume and an equa- tion to account for the increase in vapor volume due to the generation of hydrocarbon vapor during loading. This equation was derived from mass balance calculations, using the average hydrocarbon concentrations, before, during,
13
COPYRIGHT American Petroleum InstituteLicensed by Information Handling ServicesCOPYRIGHT American Petroleum InstituteLicensed by Information Handling Services
14 API PUELICATION 2514A
48
VOLUME 96 HYDROCARBON
20
0 0
I I I I I
AVERAGE % AT END OF LOADING
AVERAGE % HC
AVERAGE ARRIVAL % HC " -
I I I I I 10 20 30 40 50
TRUE ULLAGE (FEET)
Flgure A-1 "Typical Loading Emissions Profile
and at the end of loading. The vented vapor volumeis given by the following equation:
1Ylret-e: VV = total vented vapor volume, ft3 at standard condi-
VL = volume of liquid loaded, ft3 at 60'F. XT = volumetric average hydrocarbon concentration of
XV = volumetric average hydrocarbon concentration of
XR = volumetric average hydrocarbon concentration of
U1 = total tank depth, ft. [Ir = final ullage, ft.
tions.
arrival vapor.
vented vapor.
remaining vapor.
The vapor growth factor discussed in Sections 1 and 2 was calculated from the vented vapor volume using Equation A-2:
The resultant vapor growth factors were then used to calculate the average emission factors for each loading test.
For ballasting operations, it was assumed that the volume of vapor vented was equal to the volume of ballast water loaded.
The complete test procedure from the WOGA marine measurement program and the derivation of the equation for vented vapor volume are included in the BPI Documenta- tion File for Appendix A.
COPYRIGHT American Petroleum InstituteLicensed by Information Handling ServicesCOPYRIGHT American Petroleum InstituteLicensed by Information Handling Services
APPENDIX B
DEVELOPMENT OF AVERAGE EMISSION FACTORS AND CONFIDENCE INTERVALS FOR GASOLINE LOADING
6.1 Data Base The data base for gasoline loading emissions consists of
emission measurements from 122 individual vessel com- partments. These data were separated into six categories, as a function of vessel type, prior cargo, and ballast voyage compartment treatment, The emission data from each com- partment were separately analyzed to determine arrival, generated, and total emission factors. These emission fac- tors and the categories are discussed in 2.2.
The data base is summarized in Table B-l. This table includes the number of compartments in each category, and the arithmetic means, standard deviations, and minimum and maximum values of the arrival (EA), generated (EG), and total (ET) emission factors.
B.2 Data Analysis of Average Emission Factors
The first step in the data anaysis was to determine the distribution of the ET values within each category. This analysis showed that the E T values are not normally distri- buted. Instead, the distribution of ET is skewed, such that a
large number of values are below the arithmetic mean and a smaller number of values are distributed above the arithme- tic mean.
In cases where a skewed distribution exists, it is standard practice to transform the data base (that is, the ET values) into a set of values that is normally distributed. By taking the logarithm of each ET value, a normal distribution was obtained. Standard statistical tests were performed that showed that it was acceptable to assume that the data in each category, as well as the combined data base, were log- normally distributed. Means and confidence intervals were calculated for the logarithms of the ETvalues. These means and Confidence intervals were then transformed back to the original units of measurement.
The statistical analysis outlined above provides the best estimate of the mean emission factors and allows for the calculation of confidence intervals for any number of com- partment loading operations. For illustration purposes, 90 percent confidence intervals were calculated for a single compartment loading, as well as for an average emission factor for 100 compartment loadings. Table B-2 presents these means and confidence intervals for each category.
Table B-i-Average Measured Emission Factors for Gasoline Loading Arithmetic Mean Standard
Category Compartments (lb/ 1000 gal) Deviation Value Value
EA 1.99 1.149 0.32 6.10 EG 0.59 0.614 ET 2.58 0.53 6.47 1.197
3.26
EA 0.71 0.644 0.00 E G 0.96
2.22
ET 0.06
1.67 1 .O64 0.44 4.49 3.78
E A 0.55 0.404 0.07 E G
1.30 0.89 0.443 0.44
ET 1.72
1.44 0.491 0.69 2.00
E A 0.13 O. 173 E G 0.56
0.00 O . 60 0.355 o. 12 1.80
ET 0.69 0.430 O . 14 2.08
EG 1.57 3.64
0.756 ET 3.85 2.31 5.58 0.943
2.83
E A 0.00 0.000 EG 2.02 0.369
0.00
ET 2.02 0.369 1.48 2.30 2.30
Minimum Maximum
Category 1 44
0.00
Category 2 14
0.972
Category 3 7
Category 4 36
Category 5 17 E A 2.27 0.862 - 0.34
0.55
Category 6 4 0.00 1.48
15
COPYRIGHT American Petroleum InstituteLicensed by Information Handling ServicesCOPYRIGHT American Petroleum InstituteLicensed by Information Handling Services
16 ABI PUBLICATION 2614A
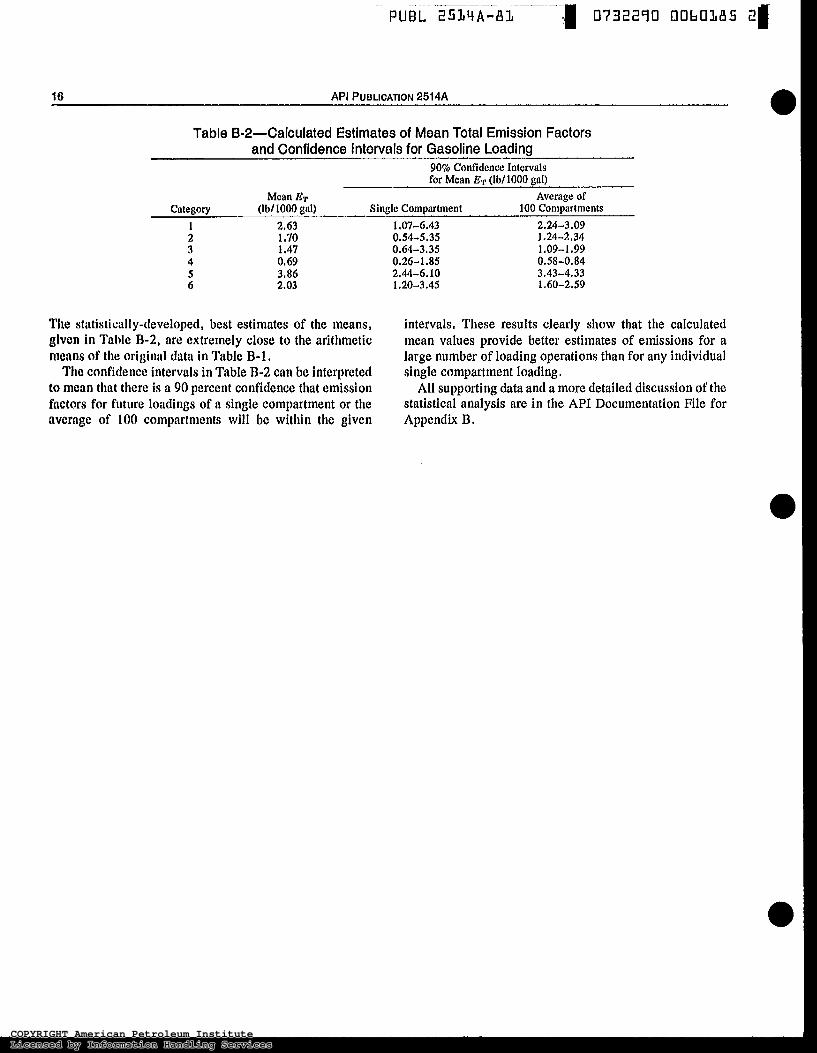
Table Eb2"Calculated Estimates of Mean Total Emission Factors and Confidence Intervals for Gasoline Loading
90% Confidence Intervals for Mean ET flb/1000 na11
Mean ET Average of Category (lb11000 gol) Single Comparbnent 100 Compartments
The statistically-developed, best estimates of the means, intervals. These results clearly show that the calculated given in Table B-2, are extremely close to the arithmetic mean values provide better estimates of emissions for a means of the original data in Table B- l . large number of loading operations than for any individual
to mean that there is a 90 percent confidence that emission All supporting data and a more detailed discussion of the factors for future loadings of a single compartment or the statistical analysis are in the API Documentation File for average of 100 compartments will be within the given Appendix B.
The confidence intervals in Table B-2 can be interpreted single compartment loading.
COPYRIGHT American Petroleum InstituteLicensed by Information Handling ServicesCOPYRIGHT American Petroleum InstituteLicensed by Information Handling Services
APPENDIX C
DEVELOPMENT OF AVERAGE EMISSION FACTORS AND CORRELATION FOR CRUDE OIL LOADING
C.l Data Base The data base for crude oil loading emissions consists of
emissionmeasurements from 16 separatevessel operations, each of which represents averages of from 1 to 11 different compartments. The entire data base represents the mea- sured emissions from 67 vessel compartments. These data were separated into three categories, as a function of prior cargo and ballast voyage compartment treatment. The emission data from each separate operation were separately analyzed to determine arrival, generated, and total emission factors. These emission factors and categories arediscussed in 2:3.
The data base is summarized in Table C-l. This fable includes the number of operations and compartments tested in each category and the arithmetic means, standard devia- tions, and minimum and maximum values of the arrival ( E A ) , generated ( E G ) , and total ( E T ) emission factors. The statistics are also presented in the table for the true vapor pressures of the loaded crude òils, since the true vapor pressure data were used in the development of an emission estimating correlation.
C.2 Data Analysis of Average Emission Factors
No statistical analysis of the emission data from each category was performed due to the limited number of sepa- rate vessel operations tested in two of the three categories.
No confidence intervals couldbe developed since emissions from several compartments had been combined into one set of calculated emission factors for each separate operation. However, because: of the large number of compartment loadings represented by the data base, it was judged that the data base as a whole was extensive enough to support the development of representative average factors.
h order to develop the best estimates of the average emission factors (Table 2), two basic modifications were made to the arithmetic averages of the data shown in Table C- l. First, the differences in the average true vapor pressure for each category were accounted for by adjusting the aver- age measured ,!& values to a common true vapor pressure of 4.0 pounds per square inch absolute. This adjustment was made by using the correlation discussed in C. 3 and given by Equations 1 and 2in Section l. Average values for the other variables in the correlation were used to develop the best estimates of & values that were consistent for each cate- gory. This procedure was used to determine ET values for Categories 1 and 314.
For Category 2, the average emission factor in Table 2 was developed from a comparison with the gasoline loading data from Table B-2. This approach was necessary since there were only two Category 2 crude oil tests conducted, the conditions during those tests were. not representative, and the results were not consistent with the results in the other categories. Therefore, the crude oil data for Category
Table C-1 -Average Measured Emission Factors for Crude Oil Loading Number of
Vessel Operations/ Arithmetic Standard Minimum
Category Maximum
Compartments Mean Deviation Value Value Category 1 3/13 TYP (psis) EA (lb/ 1000 gal) EG (lb/1000 gal) ET (lb/1000 gal)
Category 2 W P (psia)
EG (lb11000 gal) ET (lb/1000 gal)
Categories 3/4 W P (psia) E A (lb/1000 gal) EG (lb11000 gal) ET (lb/1000 gal)
EA (lb/ 1000 gal)
2/ 3
11/51
2.30 0.86 0.11 0.98
2.25 1.06 o. 10 1.16
4.31 0.33 0.33 0.65
1.836 0.243 O. 196 0.337
1.768 0.346 O. 148 O . 198
1.910 0.215 0.262 0.257
1 .o 0.60 0.00 0.60
1.0 0.81 0.00 1 .o2
1.2 0.05 0.00 0.20
4.4 1 .O8 0.34 1.25
3.5 1.30 0.21 1.30
6.5 0.75 0.84 0.98
COPYRIGHT American Petroleum InstituteLicensed by Information Handling ServicesCOPYRIGHT American Petroleum InstituteLicensed by Information Handling Services
18 AQI T)UBLICATION 2Si4A
1 was modified using the ratio of gasoline loading emission factors for Categories 1 'and 2 to obtain a crude oil emission factor for Category 2. This follows from the assumption that the ballasting of a crude oil compartment will reduce the subsequent crude oil emission factor as compared with an uncleaned, unballasted compartment to the same degree as was measured for the similar gasoline loading cases.
C.3 Development of Crude O11 Loading Emlsslon Correlation
Based on an analysis of the effects of various cargo and operational parameters on crude oil loading emissions, it was determined that the generated emissions could be re- lated to the true vapor pressure of the loaded crude oil. Any effects that other parameters may have on crude oil loading enlissions could not be quantified within the accuracy of the data and the randomly variable nature of other parameters.
Rom regression and residual analyses, the following equation was developed to relate the concentration (in vol- ume percent) of the generated vapors (CG) to the true vapor pressure (in pounds per square inch absolute) of the loaded crude oil:
Cc -0.42 -f- 0.44 ( W P ) (C- 1)
The correlntion for this relationship is statistically sig- nificant, indicating there is an effect of true vapor pressure on CC.
To use the relationship given by Equation C-1 to predict total emissions, the following equation was theoretically developed from the ideal gas law to relate the generated
emission factor ( E G ) to the concentration of generated va- pors (CG).
Where: EG = generated emission factor (lb/ 1000 gal loaded) a
CG = average concentration of generated vapors
M = molecularweight of generated vapors (lb/lb-mol). G = vapor growth factor (dimensionless). T = vapor temperature ('R = 460 + 'F').
(vol %).
For this analysis, the average concentration of generated vapors was determined by the difference between the aver- age total concentration and the average concentration of the arrival vapor.
The generated emission factor (Eo) is related to the total emission factor (ET) by the following equation:
ET = E A + EG (C-3)
Where: ET = total loading emission factor (lb/1000 gal). EA = average arrival emission factor (lb/lOOO gal). Eo = generated emission factor (lb/lOOO gal).
By combining Equations (2-1, (2-2, and C-3, an equation relating total crude oil loading emissions to true vapor pressure of the loaded crude oil is obtained.
All supporting data, equation derivations, and the proce- dures used to calculate the average emission factors and the correlation are in the API Documentation File for Appendix C.
COPYRIGHT American Petroleum InstituteLicensed by Information Handling ServicesCOPYRIGHT American Petroleum InstituteLicensed by Information Handling Services
APPENDIX D
DEVELOPMENT OF AVERAGE EMISSION FACTORS, CONFIDENCE INTERVALS, AND CORRELATION FOR CRUDE OIL BALLASTING
D.l Data Base The data base for crude oil ballasting emissions consists
of emission measurements from 54 individual vessel com- partments. These data were separated into two categories, as a function of the true cargo ullage in the compartment prior to dockside discharge. The emission data from each compartment were analyzed separately to determine total emission factors. These emission factors and the categories are'discussed in 3.2.
The data base is summarized in Table D-l. This table includes the arithmetic means, standard deviations, and minimum and maximum values of the total ballasting emis- sion factors (EB) . The statistics are also presented in the table for the true vapor pressure of the discharged crude oil and the true cargo ullage prior to dockside discharge (UA) , since the true vapor pressure and U A data were used in the development of an emission estimating correlation.
D.2 Data Analysis of Average Emission Factors
A statistical analysis of the emission data from each category was performed. As with the gasoline loading data described in Appendix B, the crude oil ballasting data were found to be log-normally distributed. Therefore, the statis- tical procedures described in B.2 were used to develop means and confidence intervals for future ballasting opera- tions in each category. These results are presented in Table
To develop the best estimates of the average emission factors, given in Table 4 of Section 1, the average emission factors were adjusted to the same truevapor pressure, using the correlation discussed in D. 3 and given by Equation 3 in Section 1. Since the average true vapor pressure of the entire data base was approximately 4 pounds per square
D-2.
inch absolute, the emission factors were calculated for a true vapor pressure of 4 pounds per square inch absolute and for typical U A values measured in each category. This procedure is similar to that used to develop the average crude oil loading emission factors, as discussed in Appen- dix C .
D.2 Development of the Crude Oil Ballasting Emission Correlation
Based on an analysis of the effects of various cargo and operational parameters on crude oil ballasting emissions, it was determined that ballasting emissions could be related to the true vapor pressure of the discharged crude oil and the true ullage ( U A ) of the cargo prior to dockside discharge. Any effects that other parameters may have on crude oil ballasting emissidns could not be quantified within the accuracy of the data and the randomly variable nature of other parameters.
From regression and residual analyses, the following equation was developed to relate the total ballasting emis- sion factor (EB) to the true vapor pressure and the true ullage prior to dockside discharge (UA) :
EB = 0.31 + 0.20 (7°F') + 0.01 (TVP) (UA) (D-1)
Where: EB = total ballasting emission factor (lb/lOOO gal).
U A = true ullage prior to dockside discharge (ft). TVP = true vapor pressure of discharged crude oil (psia).
Each of the terms in this equationis statistically significant. This correlation was used to predict total emission factors
for each category, using the average true vapor pressure of 4 pounds per square inch absolute and the typical UA values for each category, 2 feet and 20 feet, respectively, for
Table D-1-Average Measured Emission Factors for Crude Oil Ballasting Number of Arithmetic Standard Minimum Maximum
Category Compartments Mean Deviation Value Value
TYP (psia) 3.76 1.648 1.30 8.40 UA (fi) 2.71 1.475 0.90 5.00 EB (lb/1000 gal) 1.21 0.740 0.22 4.30
COPYRIGHT American Petroleum InstituteLicensed by Information Handling ServicesCOPYRIGHT American Petroleum InstituteLicensed by Information Handling Services
20 API PUBLICATION 2514A I __I_
Tablo D-2-Calculated Estimates of Emission Factors and Confidence Intervals for Crude Oil Ballasting
90% Confidence Intervals for Mean EB (Ib/lOOO gal)
- Category (Ib/lOOO gal) Single Compartment 100 Compartments
Categories 1 and 2. For these values, confidence intervals use of the average emission factors. were calculated. These results are shown in Table D-3. It All supporting data and the procedures used to calculate can be observed, by comparing the confidence intervals in the average ballasting emission factors, the correlation, and Tables B-2 and D-3, that the use of the correlation provides the confidence intervals are in the API Documentation File a better estimate of the total ballasting emissions than the for Appendix B.
Table D9"Predicted Estimates of Emission Factors for Crude Oil Ballasting and Confidence Intervals for Average TVP and UA Values
90% Confidence Intervals for Mean En (lb/1000 gal)
hlean ED Average of - Category (lb11000 gal) Single Compartment 100 Compartments Category 1 1.20 0.24-2.15 1.00-1.39
W A = 4 psi U A e 2fi
Category 2 1.87 0.91-2.83 1.65-2.09 TYP = 4 psia U A 20 ft
COPYRIGHT American Petroleum InstituteLicensed by Information Handling ServicesCOPYRIGHT American Petroleum InstituteLicensed by Information Handling Services
APPENDIX E
EVAPORATIVE CARGO LOSS ESTIMATES
E.l Sources of Evaporative Cargo Loss Evaporative cargo loss occurs whenever a liquid cargo
evaporates, regardless of whether or not that vapor is dis- placed from the compartment and emitted into the atmos- phere. Evaporation and, thus, cargo loss, occurs whenever a volatile liquid comes into contact with air (or an inert gas) that is not saturated with hydrocarbon vapor. This occurs primarily during loading and discharge operations for noninerted vessels, operating at esentially atmospheric pressure. Other operations, such as manual tank gaging and vessel transit, result in relatively negligible losses. This judgment is based on estimating typical breathing losses, assuming operating pressure/vacuum valves, and cal- culating losses from tank clingage, based on empirical clingage factors. Therefore, total evaporative cargo loss for vessels operated at atmospheric pressure can be estimated by summing the losses that occur during loading and dis- charge.
The evaporative cargo loss estimates given in this appen- dix do not apply to inerted very large crude carriers (VLCCs). No emission data from VLCCs were included in the data base, nor was data available to determine to what extent operations other than loading and discharge contrib- ute to VLCC cargo loss.
Evaporative cargo loss is only one component of an overall custody transfer loss assessment. Other aspects of cargo measurement and accounting generally have greater significance in the overall accountability of marine cargo transfers.
E.l.l EVAPORATIVE CARGO LOSS DURING LOADING
Cargo loss occurs during loading as the stock being loaded comes into contact with the air in the compartment, which is typically not saturated with hydrocarbon vapor prior to loading. This loading loss is equivalent to the generated component of emissions, which is only part of the total loading emissions, as discussed in Section 2. Rough estimates of cargo loss during loading can, therefore, be made by determining the generated part of the total loading emission factor and multiplying this factor by the total volume of cargo loaded.
For crude oil, this generated loss factor can be deter- mined from Equation 2 or Figure 2 in Section 1. If the vapor pressure of the crude oil is not known, a typical generated
loss factor of 0.3 pounds per 1000 gallons loaded can be used for estimating purposes. This factor is based on a crude oil true vapor pressure of 4 pounds per square inch absolute and a vapor molecular weight of 58 pounds per pound- mole.
For gasoline loading, typicalgeneratedloss factors of 0.7 pound per 1000 gallons loaded for tanker loading and 1.7 pounds per 1000 gallons loaded for barge loading can be used to roughly estimate the evaporative cargo loss. These factors are based on data for which the gasoline true vapor pressure averaged approximately 8 pounds per square inch absolute.
E.1.2 EVAPORATIVE CARGO LOSS DURING DISCHARGE
Cargo loss occurs in all cargo compartments during dis- charge as air is drawn into the compartment and contacts the liquid surface. The hydrocarbon vapor formed during dis- charge can subsequently be emitted to the atmosphere if ballast water is loaded into the compartment. Rough esti- mates of cargo loss during discharge can, therefore, be made by multiplying the appropriate ballasting emission factor by the total amount of cargo discharged.
This technique does not provide a precise measure of cargo loss. Some of the hydrocarbon emitted during bal- lasting was present in the tank prior to discharge and there- fore does not represent additional cargo loss. In addition, evaporative cargo loss should vary with changes in the rate of cargo discharge and the amount of heel left in the tank after discharge, although these factors cannot be quantita- tively assessed. Nevertheless, this technique does provide a reasonable rough estimate of evaporative cargo loss during discharge. ,
For crude oil discharge, typical discharge loss factors are l . 2 pounds per 1000 gallons for fully loaded tankers and l . 9 pounds per 1000 gallons for lightered or short-loaded tank- ers. These values are based on a tnie vapor pressure of 4 pounds per square inch absolute and a cargo ullage prior to dockside discharge of 2 feet and 20 feet, respectively.
For gasoline discharge, no ballasting emission data are available. However, for rough estimating purposes, esti- mates can be made by prorating the crude oil factors by the ratio of gasoline to crude oil values for the arrival compo- nent of the total loading emission factors. This approach results in gasoline discharge loss factors of approximately 1.9 pounds per 1000 gallons for tankers and 2.2 pounds per 1000 gallons for barges.
21
A COPYRIGHT American Petroleum InstituteLicensed by Information Handling ServicesCOPYRIGHT American Petroleum InstituteLicensed by Information Handling Services
Table E-1 "Volumetric Evaporative Cargo Loss Factors
E.2 Summar of Volumetric Evapora Y ive Cargo Loss Factors
Based on the discussion in €3.1, typical estimates of volumetric percentage loss have been calculated and are summarized in Table B-l. Bue to the many assumptions in developing these typical loss factors, it is not possible to quantify the expected accuracy or precision of these esti- mates. These loss factors should, therefore, be considered as rough estimates that can be expected to vary from one application to another, as illustrated by example in Table H-2. These estimates are based on typicalvapor pressures (4 pounds per square inch absolute for crude oil and 8 pounds per square inch absolute for gasoline) and vapor molecular weights (58 pounds per pound-mole for crude oil and 63 pounds per pound-mole for gasoline).
Loss during discharge accounts for approximately 80 to 90 percent of the total loss factors given in Table E-1 for crude oil and approximately 55 to 75 percent of the barge and tanker gasoline factors, respectively.
The volumetric loss factors are dependent upon cargo vapor pressure and vapor molecular weight. Although vapor pressure is oftes known or can be reasonably esti- mated. the molecular weight of the vapor is generally not known. Field measurements during crude oil emission tests llave shown that the molecular weight of the vapor varies considerably from one test to another. The observed range was from 34 to 74 pounds per pound-mole. Interestingly, the extreme values resulted from crude oils with approxi- mately equal Reid and true vapor pressures and gravities. No correlation between vapor molecular weight and crude oil properties could be developed. Much less variability
Tablo E-&="xamples of Predicted Crude Oil Evaporative Cargo Loss Factors
Crude Oil W P M Estimated Loss Vesscl Opcration (psia) (Ib/lb-mole) (Vol. %)
was observed in the gasoline tests. Therefore, although the loss factors given in Table E-1 can serve as typical rough estimates, the volumetric evaporative cargo loss from a given crude oil operation can be determined with greater confidence if the vapor molecular weight is measured, The loss correlation presented in E.3 can then be used,
E.3 Evaporative Cargo Loss Correlation for Crude Oil
A correlation to determine evaporative cargo loss factors for crude oil as a function of true vapor pressure and vapor molecular weight is developed below.
As discussed in E. 1, the total evaporative cargo loss (in volume percent) is estimated by summing the losses during loading and discharge (in pounds per 1000 gallons) and dividing by the density of the condensed vapor (in pounds per gallon) and converting to a percentage value.
From Appendix C, the loading loss factor is given below as a function of true vapor pressure and for average values of the other parameters:
EG 0.205 L0.44 ( W P ) - 0.421 (E- 1)
Where: EG = generated emission factor (lb/lOOO gal loaded).
TVP = true vapor pressure of loaded crude oil (psia).
From Appendix B, the discharge loss factor is given by:
En = U.31 t- 0.20 (TVP) 4- 0.01 ( W P ) (UA) (B-2)
Where: En = total ballasting emission factor (lb/1000 gal).
W P = true vapor pressure of discharged crude oil (psia). UA = true ullage prior to dockside discharge (ft),
The density of the condensed vapor can be expressed as a
W = 0.08 (M) (E-3) function of the vapor molecular weight:
Where: W = density of condensed vapor (lb/gal). M = vapor molecular weight (lb/lb-mole).
By assuming that true vapor pressure is roughly constant for discharge and loading, Equations E-1 , E-2, and H-3 can be combined to yield the following equation for total evaporative cargo loss, L, in volume percent:
0.275 f 0.363 ( W P ) f 0.013 ( W P ) (UA) L =
For nonlightered vessels (UA = 2 feet), Equation E-4 M 03-41
simplifies to:
0.275 f 0.389 (TVP) M L = (E-5)
COPYRIGHT American Petroleum InstituteLicensed by Information Handling ServicesCOPYRIGHT American Petroleum InstituteLicensed by Information Handling Services
a
a
a
ATMOSPHERIC HYDROCARBON EMISSIONS FROM MARINE VESSEL TRANSFER OPERATIONS 23
For lightered vessels ( U A = 20 feet), Equation E-4 simplifies to:
0.275 + 0.623 ( W P ) L = M (E-6)
Equations E-5 and E-6 can be used with a measured crude oil vapor molecular weight and an average crude oil true vapor pressure to calculate volumetric evaporative cargo loss estimates. To show the sensitivity of these equations to variations in true vapor pressure and vapor molecular
weight, calculated loss factors are given in Table E-2 for values of these parameters that span the range of true vapor pressures and vapor molecular weights typically encoun- tered.
For the examples shown in Table E-2, the loss during discharge accounts for roughly 75 to over 95 percent of the total evaporative loss. Specific loading and discharge loss factors can be calculated separately from Equations E- 1 and E-2, respectively, divided by Equation E-3 and converted to a percentage loss factor.
COPYRIGHT American Petroleum InstituteLicensed by Information Handling ServicesCOPYRIGHT American Petroleum InstituteLicensed by Information Handling Services
MEMBERSHIP OF
COMMITTEE ON EVAPORATION LOSS MEASUREMENT (1981) Committee Membership
K. M. Hanzevack (Chairman) J. K. Walten (Secretary) B. D. Anderson J. R. Arnold J. G . Berry, Jr. R. L. Bredehoft R. S. Carroll R. A. Constable R. A. Famham G . J. Good M. W. Heisterberg R. E. Hills H. D. Kerfman R. C. Kern W. L. Kline B. J. Lewis R. L. Russell J. G . Sanzo W. W. Saterbak H. J . Silver T. E. Simmons T. Smith J. L. Stevenson R. B. Wagoner S. M. Wamsley P. W. Westin J. G . Zabaga
R. A. Constable (Chairman) (1980- J. G . Berry, Jr. K. M. Hanzevack T. A. Hecht (Chairman 1979-1980) H. J. Silver, Jr. P. W. Westin J. G . Zabaga
N. Crawford
Exxon Research & Engineering Co. American Petroleum Institute Shell Pipe Line Company Colonial Pipeline Company Gulf Research & Technology Co. Chevron, U.S.A., rnc. Williams Pipe Line Co. Sun Company, Inc. Chevron Research Company The Standard Oil Co. (Ohio)
Pittsburgh Des Moines Steel Co. GATX Terminals Corp. Ultraflote Corporation Cities Service Co. The Texas Pipe Line Co. Union Oil Co. of California Time Oil Company Chicago Bridge & Iron Co. Texaco, Inc. Cities Service Company Mayflower Vapor Seal Phillips Petroleum Company Tank Services, Inc. Explorer Pipe Line Co. Atlantic Richfield Company Mobil Research & Development Corp.
GATX-TEC
Task Group 25 14A (198 1)’
1 Sun Company, Inc. Gulf Science and Technology Exxon Research & Engineering Co. Chevron U.S.A., Inc. Texaco Inc. Atlantic Richfield Co. Mobil Research & Development Corp.
Consultant
Texaco, Inc.
25
Florham Park, N.J. Washington, D.C. Houston, Tex. Atlanta, Ga. Pittsburgh, Pa. El Segundo, Calif. Tulsa, Okla. Philadelphia, Pa. Richmond, Calif. Cleveland, Ohio Chicago, Ill. Pittsburgh, Pa. Chicago, Ill. Houston, Tex. Tulsa, Okla. Houston, Tex. Brea, Calif. Seattle, Wash. Denver, Colo. Beacon, N.Y. Tulsa, Okla. Little Ferry, N.J. Bartlesville, Okla. Tulsa, Okla. Tulsa, Okla. Harvey, Ill. Princeton, N.J.
Philadelphia, Pa. Pittsburgh, Pa. Florham Park, N.J. San Francisco, Calif. Beacon, N.Y. Harvey, 11. Princeton, N.J.
Beacon, N.Y.
1
COPYRIGHT American Petroleum InstituteLicensed by Information Handling ServicesCOPYRIGHT American Petroleum InstituteLicensed by Information Handling Services