42
Spiro Analysis Software Manual Document MAN 005 SW Version 4.5.1 1 ApneaGraph® Spiro Quick Guide Analysis Software Manual
Spiro Analysis Software ManualDocument MAN 005SW Version 4.5.1 1
ApneaGraph® Spiro
Quick Guide Analysis Software Manual
Spiro Analysis Software ManualDocument MAN 005SW Version 4.5.1 2
0 Contents
0 Contents..........................................................................................................................................2
1 List of Tables ...................................................................................................................................4
2 List of Figures ..................................................................................................................................4
3 Intended Use...................................................................................................................................7
4 The Software...................................................................................................................................7
5 PC Requirements.............................................................................................................................8
6 Get Started......................................................................................................................................8
6.1 Install the PC Software............................................................................................................8
6.2 Install Android Apps................................................................................................................9
7 Spiro Analysis Activation.................................................................................................................9
8 Data Import from the Torso Unit ..................................................................................................11
9 Data Analysis.................................................................................................................................15
9.1 The Ribbon ............................................................................................................................15
9.1.1 Tab “Overview” .............................................................................................................16
9.1.1.1 Group “Catheter” ......................................................................................................16
9.1.1.2 Group “Envelope Curves” .........................................................................................16
9.1.1.3 Group “Computed Data”...........................................................................................16
9.1.1.4 Group “Pulse Oximeter” ...........................................................................................18
9.1.1.5 Group “Other Data” ..................................................................................................18
9.1.1.6 Group “Time Axis”.....................................................................................................20
9.1.2 Tab “Events”..................................................................................................................20
9.1.2.1 Respiratory event coding on the horizontal event bar .............................................20
9.1.2.2 Group “Apneic Events” .............................................................................................21
9.1.2.3 Group “Other Events” ...............................................................................................21
9.1.2.4 Group “Time Axis”.....................................................................................................21
9.1.2.5 Group “Level Colour Codes” .....................................................................................21
9.1.2.6 Group “Event Edit”....................................................................................................21
9.1.2.7 Auto Range................................................................................................................24
9.1.3 Tab “Edit” ......................................................................................................................24
9.1.3.1 Group “Analysis Window”.........................................................................................24
9.1.3.2 Group “Time Axis”.....................................................................................................25
9.1.3.3 Group “Event Edit”....................................................................................................25
Spiro Analysis Software ManualDocument MAN 005SW Version 4.5.1 3
9.1.3.4 Group “Editable Time Window” ...............................................................................25
9.1.3.5 Groups “Pressure Range”, “Pulse Rate Range” and “SpO2 Range”..........................26
9.1.3.6 Group “Graphics”......................................................................................................26
9.1.4 Tab “Output”.................................................................................................................27
9.1.4.1 Group “Report” .........................................................................................................27
9.1.4.2 Group “Graphs Output” ............................................................................................28
9.1.5 Tab “Options”................................................................................................................29
9.1.6 Tab “Window”...............................................................................................................29
9.2 Lower Edge Tabs (Views) ......................................................................................................30
9.2.1 Tab “Graphs”.................................................................................................................30
9.2.1.1 Curve manipulation using the mouse .......................................................................31
9.2.1.2 Curve manipulation using gestures...........................................................................31
9.2.2 Tab “Anthropological”...................................................................................................31
9.2.3 Tab “RDI”.......................................................................................................................32
9.2.4 Tab “Level and Snoring”................................................................................................32
9.2.5 Tab “RE” – Respiratory Effort........................................................................................33
9.2.6 Tab “SpO2”....................................................................................................................33
9.2.7 Tab “Pulse Rate” ...........................................................................................................34
9.2.8 Tab “Body Position” ......................................................................................................34
9.2.9 Tab “Equipment”...........................................................................................................35
9.2.10 Tab “Data Subfolder” ....................................................................................................35
10 Notes on POES vs PPH signals ...................................................................................................37
11 Typical use.................................................................................................................................39
11.1 Open file or Import Recording from the Torso Unit .............................................................39
11.2 Inspect data...........................................................................................................................39
11.3 Edit events.............................................................................................................................40
11.4 Add notes ..............................................................................................................................40
11.5 Generate report ....................................................................................................................40
12 Shortcut keys.............................................................................................................................41
13 Encryption Policy.......................................................................................................................41
14 Contact......................................................................................................................................41
15 References ................................................................................................................................42
Spiro Analysis Software ManualDocument MAN 005SW Version 4.5.1 4
1 List of Tables
Table 1 Curve manipulation using the mouse ......................................................................................31Table 2 Curve manipulation using gestures..........................................................................................31
2 List of Figures
Figure 1 The Spiro icon on the Desktop..................................................................................................9Figure 2 Software activation window .....................................................................................................9Figure 3 Software activation alternatives .............................................................................................10Figure 4 License ID and password page ................................................................................................10Figure 5 Entering the password ............................................................................................................11Figure 6 The Spiro Analysis software prior to reading data..................................................................11Figure 7 Icon to click for import from Torso Unit .................................................................................11Figure 8 Import data welcome page.....................................................................................................11Figure 9 Select folder page ...................................................................................................................12Figure 10 Select recording page............................................................................................................12Figure 11 Read data page .....................................................................................................................13Figure 12 Anthropologia page ..............................................................................................................14Figure 13 Password location .................................................................................................................14Figure 14 Save data page ......................................................................................................................14Figure 15 Default filename ...................................................................................................................14Figure 16 Erase SD card page................................................................................................................14Figure 17 File open................................................................................................................................15Figure 18 Catheter data checkboxes.....................................................................................................15Figure 19 Tab "Overview" .....................................................................................................................16Figure 20 PPH/POES ratio data .............................................................................................................17Figure 21 Admittance data....................................................................................................................17Figure 22 Respiration frequency data...................................................................................................18Figure 23 Oximeter data .......................................................................................................................18Figure 24 Body position data ................................................................................................................19Figure 25 Tissue vibration and airborne sound data ............................................................................19Figure 26 Airborne sound frequency window colour codes.................................................................19Figure 27 Actimeter data ......................................................................................................................20Figure 28 Tab "Events"..........................................................................................................................20Figure 29 Level colour codes.................................................................................................................21Figure 30 Event edit activation buttons................................................................................................22Figure 31 Event edit information..........................................................................................................22Figure 32 Event edit warning message .................................................................................................22Figure 33 Event edit dialogue ...............................................................................................................23Figure 34 The "Edited" symbol .............................................................................................................24Figure 35 The level column ...................................................................................................................24Figure 36 “Analysis Window”................................................................................................................24
Spiro Analysis Software ManualDocument MAN 005SW Version 4.5.1 5
Figure 37 Group "Time axis" .................................................................................................................25Figure 38 Group "Editable Time Window"............................................................................................25Figure 39 Statistics dialogue .................................................................................................................26Figure 40 Groups for range settings .....................................................................................................26Figure 41 Tab "Output".........................................................................................................................27Figure 42 Enter clinic text dialogue.......................................................................................................27Figure 43 Custom footer text example .................................................................................................27Figure 44 Custom icon example............................................................................................................28Figure 45 Optional graphics to the report. Example.............................................................................28Figure 46 Tab "Options"........................................................................................................................29Figure 47 Tab "Window".......................................................................................................................29Figure 48 Two recordings compared using tiled windows ...................................................................30Figure 49 Tab "Graphs".........................................................................................................................30Figure 50 Tab "Anthropological"...........................................................................................................32Figure 51 Tab "RDI"...............................................................................................................................32Figure 52 Tab "Level and Snoring"........................................................................................................33Figure 53 Tab "RE" ................................................................................................................................33Figure 54 Tab "SpO2"............................................................................................................................34Figure 55 Tab "Pulse Rate"....................................................................................................................34Figure 56 Tab "Body Position" ..............................................................................................................35Figure 57 Tab "Equipment"...................................................................................................................35Figure 58 Tab "Data Subfolder" ............................................................................................................36Figure 59 Detailed view of the "Data Subfolder"..................................................................................36Figure 60 The Bernoulli equation..........................................................................................................38Figure 61 Typical use of the Spiro Analysis software............................................................................39
Spiro Analysis Software ManualDocument MAN 005SW Version 4.5.1 6
Thank you for purchasing an ApneaGraph® Spiro equipment.
The ApneaGraph® Spiro is a sleep diagnostic tool providing information on your patients sleep andbreathing.
The ApneaGraph® Spiro is unique in the sleep diagnostic market place in that it not only providesinformation on the type (obstructive or central), Severity and location of the nocturnal obstructionto better facilitate the clinician in choosing the correct form of treatment for the patient.
Manual version 4.5.1Covers software versions 4.5.1Date 07 December 2016Copyright © 2015-2016Spiro Medical AS All rights reserved
Made bySpiro Medical ASNattlandsveien 8NO-5093 BergenNorwayWebsite: www.spiromedical.com
Copyright Notice
This manual is copyright © by Spiro Medical AS.
Disclaimer
This document may contain typographical errors or technical inaccuracies. Spiro Medical does notaccept any liability for the use or misuse whether direct or indirect of the products, or for damagesarising out of the use of or inability to use the products. Users must accept all responsibility for anyresults obtained by or concluded from data obtained by the products including software from SpiroMedical. All clinical conclusions and decisions that are based on the use of this product are theresponsibility of the user.
Spiro Analysis Software ManualDocument MAN 005SW Version 4.5.1 7
3 Intended Use
ApneaGraph® Spiro device is intended for recording of physiological signals during sleep. TheApneaGraph® Spiro® device is for continuous operation for a maximum of 8 hours of dataacquisition, or one full night of sleep.
The software is intended used by a professional medical doctor who will review the data and decideon the diagnosis of the patient. The final diagnosis is entirely the responsibility of the doctor and notthe Spiro Analysis software. The Doctor is responsible for assessment of the patient and his or hercondition and should review the measured data carefully.
The intended equipment environments are hospitals, institutions, sleep centres, sleep clinics, orother test environments, including the patient’s home.
The device is to be used by a doctor, a nurse or specially trained personnel at a hospital or surgery.The software is to be used by a medical doctor.
The equipment must be installed and put into service in accordance with the information in the usermanual, Spiro Medical document MAN 001.
The device or software does not require any operations or intervention by the patient.
All analysis based on current American Academy of Sleep Medicine (AASM) criteria 2007 & 2013.
4 The Software
The ApneaGraph® Spiro software comes in three separate downloads.
App “AGS Clinical Setup”. This is Bluetooth® Low Energy Wireless software required to set upthe ApneaGraph® for a patient study).
App “AGS Monitor”. This is software required to monitor an ongoing data acquisition via theBluetooth® Low Energy link (range 100 m free sight).
PC Software “Spiro Analysis”. This is the desktop software required to analyse a completedrecording.
Your Spiro Analysis is also used to upload a patient overnight recording from the ApneaGraph® SpiroTorso device.
At the time of writing, the Apps can be obtained from Spiro Medical.
The Spiro Analysis software can be obtained from www.spiromedical.com/Downloads. Sign up for atrial version and you will get a link for the download. You may get a warning that the software is notcommonly downloaded, but this is because the software is relatively new. Both the installation fileand the executable are signed – proving that the software comes from Spiro Medical AS.
The trial software can be used for 14 days. Activation codes can be obtained from Spiro Medical orpurchased via the activation link.
Spiro Analysis Software ManualDocument MAN 005SW Version 4.5.1 8
To update the software, uninstall the old version and download a new trial package. Once installedon the same machine, the old credentials will be inherited and the full version will immediately beavailable.
5 PC Requirements
A Windows PC with Windows 7 (service pack 1) or higher. This is required in order for the graphicsengine Direct2D to run. Note that some graphics adapters and know to crash on Direct2D (these are:Intel G35-1, Intel G35-2, Intel GL960-1, Intel GL960-2, Intel GM 965-1, Intel GM 965-2, Intel MobileHD Graphics).
In order for the PDF report generation to work, Java Runtime Environment 1.5.x or higher is required(Version 8, update 60 is available for download from Sun).
6 Get Started
These are the files required:
“Spiro Analysis 4.5.1 Setup.exe”o For acquisition and analysis of data from the ApneaGraph® Spiro Torso Unit.o The installation includes user manual and the executable file.o Can obtained from http://spiromedical.com/downloads.
«AGSMonitorV2.apk»o Monitor app for Android.o Can be obtained from [email protected]
“AGSSetup V2.apk”o Clinical setup app for Android.o Can be obtained from [email protected]
6.1 Install the PC Software
Download the Spiro Analysis software via the link on http://spiromedical.com/downloads/. Uninstall old versions of the Spiro Analysis software (via the Control Panel, Programs and
Features. Name “Spiro Analysis”, Publisher “Spiro Medical AS”). Double click the file "Spiro Analysis 4.5.1 Setup.exe". (4.5.1 is the version number, this will
change).o All users of the PC will be able to run the software.
Software will be installed and shortcuts will be placedo on the Startup Menu under "Spiro Medical",o on the Desktop.
Spiro Analysis Software ManualDocument MAN 005SW Version 4.5.1 9
6.2 Install Android Apps
Copy the apk files to the Android tablet or phone. Manage files on the Android device and tap the apk files. This will install the app. Note that security settings must be set to allow for installation of apps from other sources
than Google Play.
7 Spiro Analysis Activation
1. Start the software by clicking on thedesktop icon or by selecting SpiroAnalysis under Spiro Medical (Apps byname listing or under the Start buttonif you have one)
Figure 1 The Spiro icon on the Desktop
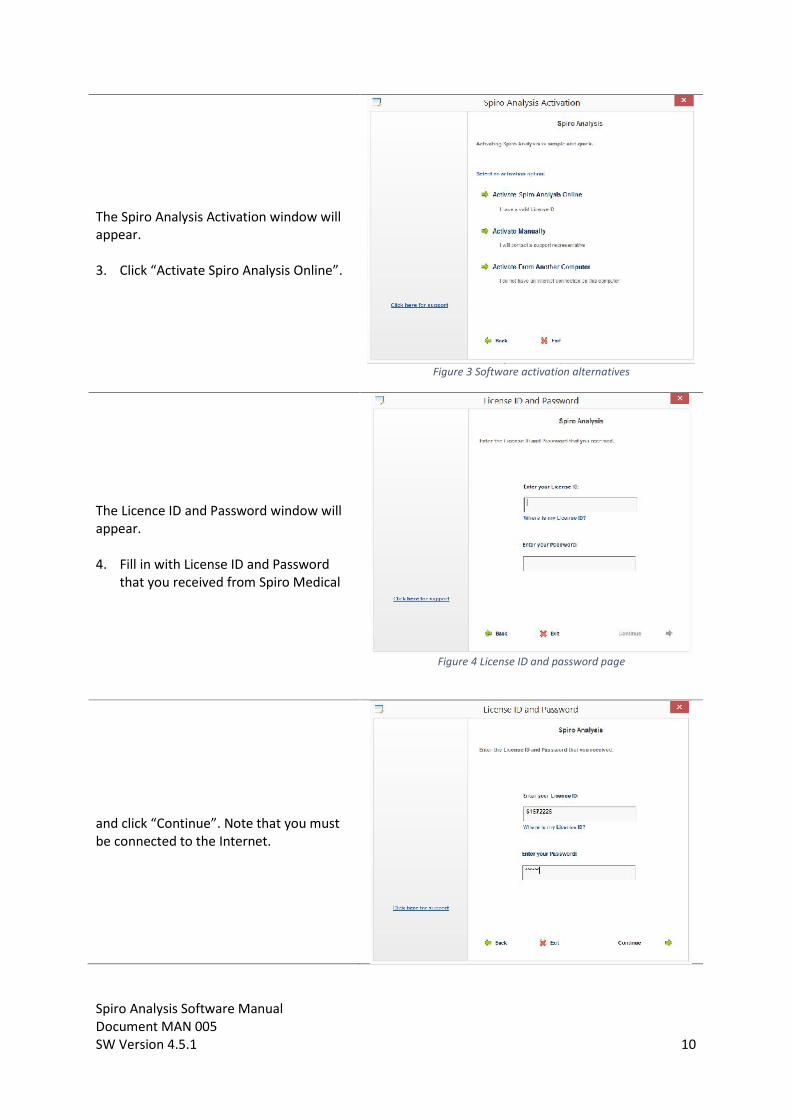
2. If you choose to activate, the licensewindow will appear. Click “ActivateSpiro Analysis” or “Evaluate SpiroAnalysis” to use the software for 14days as a trial.
Figure 2 Software activation window
Spiro Analysis Software ManualDocument MAN 005SW Version 4.5.1 10
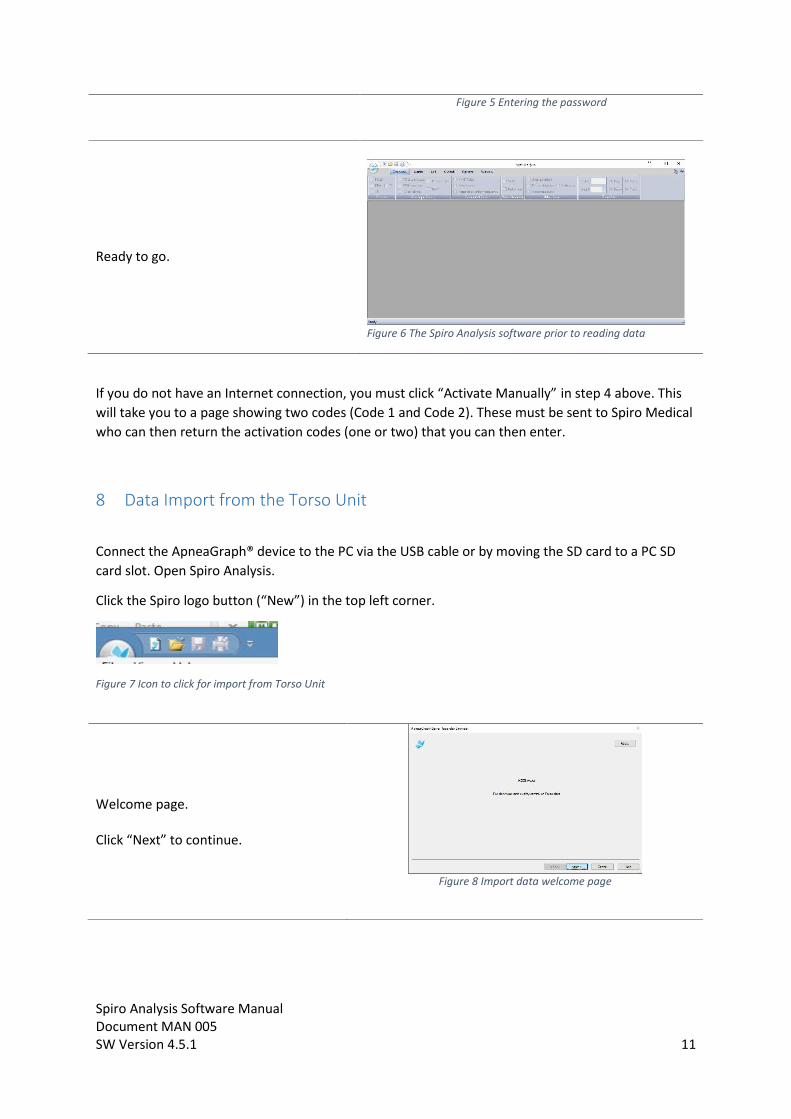
The Spiro Analysis Activation window willappear.
3. Click “Activate Spiro Analysis Online”.
Figure 3 Software activation alternatives
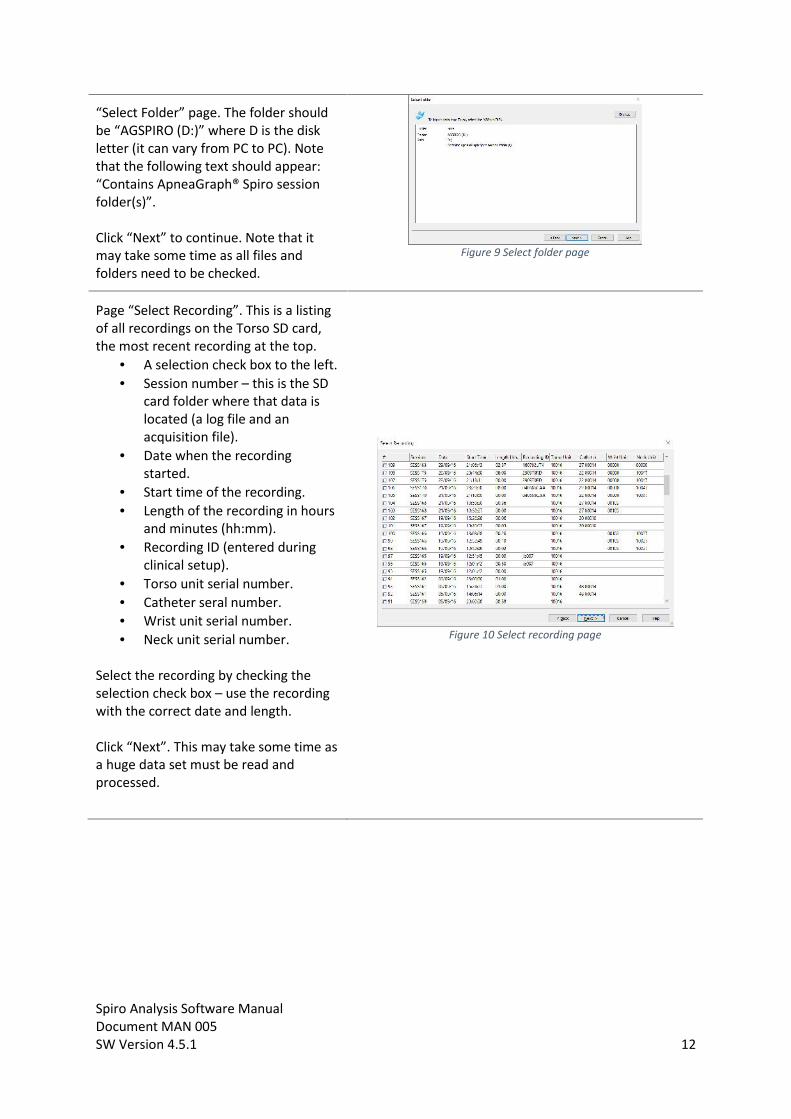
The Licence ID and Password window willappear.
4. Fill in with License ID and Passwordthat you received from Spiro Medical
Figure 4 License ID and password page
and click “Continue”. Note that you mustbe connected to the Internet.
Spiro Analysis Software ManualDocument MAN 005SW Version 4.5.1 11
Figure 5 Entering the password
Ready to go.
Figure 6 The Spiro Analysis software prior to reading data
If you do not have an Internet connection, you must click “Activate Manually” in step 4 above. Thiswill take you to a page showing two codes (Code 1 and Code 2). These must be sent to Spiro Medicalwho can then return the activation codes (one or two) that you can then enter.
8 Data Import from the Torso Unit
Connect the ApneaGraph® device to the PC via the USB cable or by moving the SD card to a PC SDcard slot. Open Spiro Analysis.
Click the Spiro logo button (“New”) in the top left corner.
Figure 7 Icon to click for import from Torso Unit
Welcome page.
Click “Next” to continue.
Figure 8 Import data welcome page
Spiro Analysis Software ManualDocument MAN 005SW Version 4.5.1 12
“Select Folder” page. The folder shouldbe “AGSPIRO (D:)” where D is the diskletter (it can vary from PC to PC). Notethat the following text should appear:“Contains ApneaGraph® Spiro sessionfolder(s)”.
Click “Next” to continue. Note that itmay take some time as all files andfolders need to be checked.
Figure 9 Select folder page
Page “Select Recording”. This is a listingof all recordings on the Torso SD card,the most recent recording at the top.
A selection check box to the left. Session number – this is the SD
card folder where that data islocated (a log file and anacquisition file).
Date when the recordingstarted.
Start time of the recording. Length of the recording in hours
and minutes (hh:mm). Recording ID (entered during
clinical setup). Torso unit serial number. Catheter seral number. Wrist unit serial number. Neck unit serial number.
Select the recording by checking theselection check box – use the recordingwith the correct date and length.
Click “Next”. This may take some time asa huge data set must be read andprocessed.
Figure 10 Select recording page
Spiro Analysis Software ManualDocument MAN 005SW Version 4.5.1 13
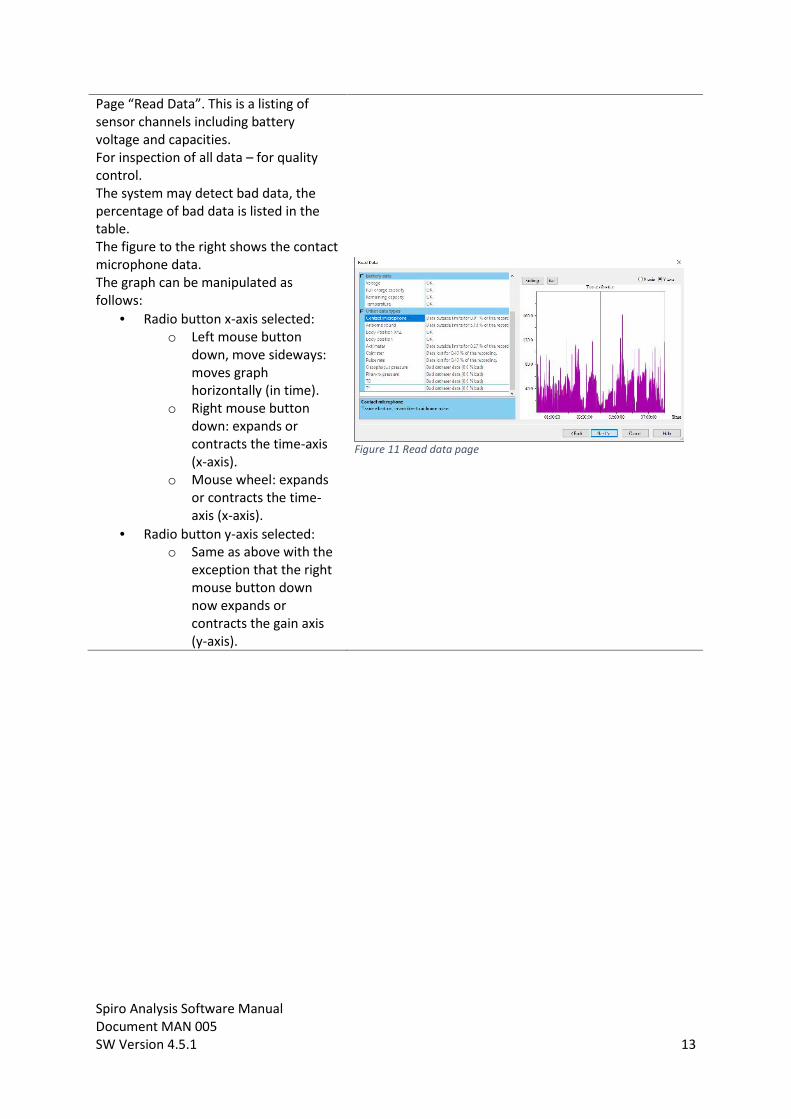
Page “Read Data”. This is a listing ofsensor channels including batteryvoltage and capacities.For inspection of all data – for qualitycontrol.The system may detect bad data, thepercentage of bad data is listed in thetable.The figure to the right shows the contactmicrophone data.The graph can be manipulated asfollows:
Radio button x-axis selected:o Left mouse button
down, move sideways:moves graphhorizontally (in time).
o Right mouse buttondown: expands orcontracts the time-axis(x-axis).
o Mouse wheel: expandsor contracts the time-axis (x-axis).
Radio button y-axis selected:o Same as above with the
exception that the rightmouse button downnow expands orcontracts the gain axis(y-axis).
Figure 11 Read data page
Spiro Analysis Software ManualDocument MAN 005SW Version 4.5.1 14
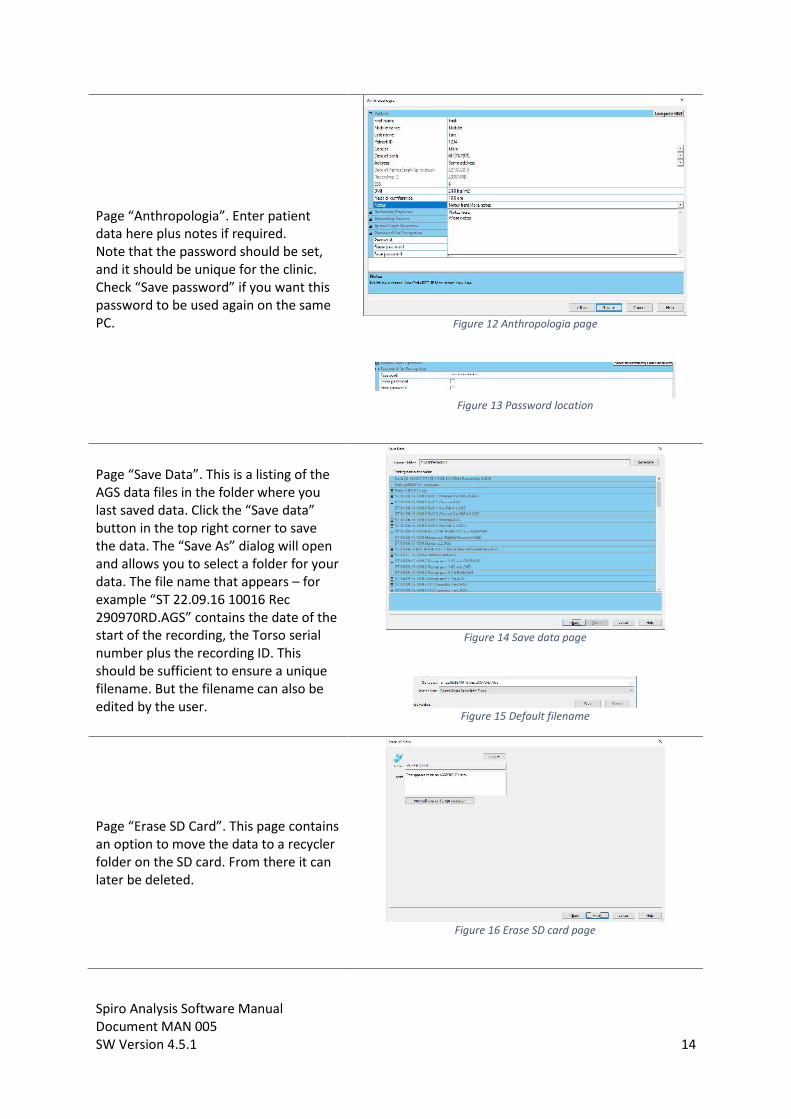
Page “Anthropologia”. Enter patientdata here plus notes if required.Note that the password should be set,and it should be unique for the clinic.Check “Save password” if you want thispassword to be used again on the samePC. Figure 12 Anthropologia page
Figure 13 Password location
Page “Save Data”. This is a listing of theAGS data files in the folder where youlast saved data. Click the “Save data”button in the top right corner to savethe data. The “Save As” dialog will openand allows you to select a folder for yourdata. The file name that appears – forexample “ST 22.09.16 10016 Rec290970RD.AGS” contains the date of thestart of the recording, the Torso serialnumber plus the recording ID. Thisshould be sufficient to ensure a uniquefilename. But the filename can also beedited by the user.
Figure 14 Save data page
Figure 15 Default filename
Page “Erase SD Card”. This page containsan option to move the data to a recyclerfolder on the SD card. From there it canlater be deleted.
Figure 16 Erase SD card page
Spiro Analysis Software ManualDocument MAN 005SW Version 4.5.1 15
Note that if the Torso Unit is left with the battery inserted, data acquisition will start at the presettime – the date is ignored. Hence one may experience that all channels are “dead” – if the Torso unitwas on a desk.
Of particular importance is the ability to inspect the battery voltage, remaining capacity and fullcharge capacity. The latter indicates if the battery is near end-of-life or not.Note also that next to each data type is the result of an evaluation of data quality – showingpercentage of “good” data.
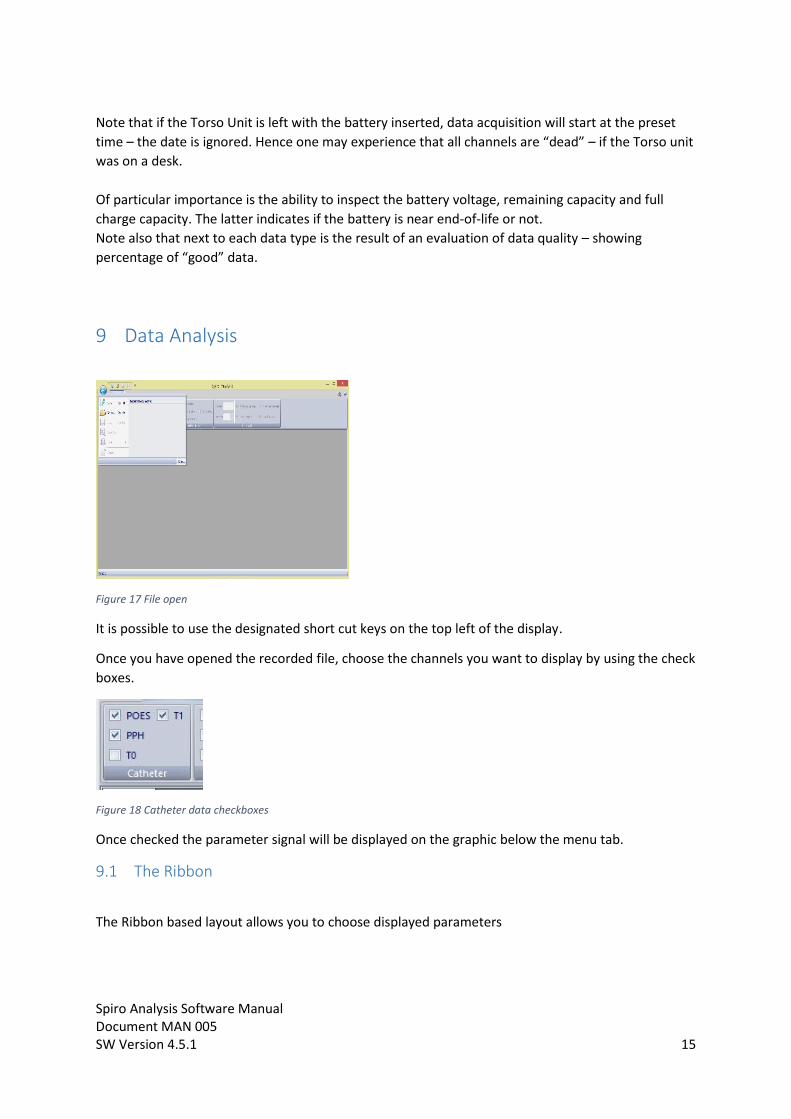
9 Data Analysis
Figure 17 File open
It is possible to use the designated short cut keys on the top left of the display.
Once you have opened the recorded file, choose the channels you want to display by using the checkboxes.
Figure 18 Catheter data checkboxes
Once checked the parameter signal will be displayed on the graphic below the menu tab.
9.1 The Ribbon
The Ribbon based layout allows you to choose displayed parameters
Spiro Analysis Software ManualDocument MAN 005SW Version 4.5.1 16
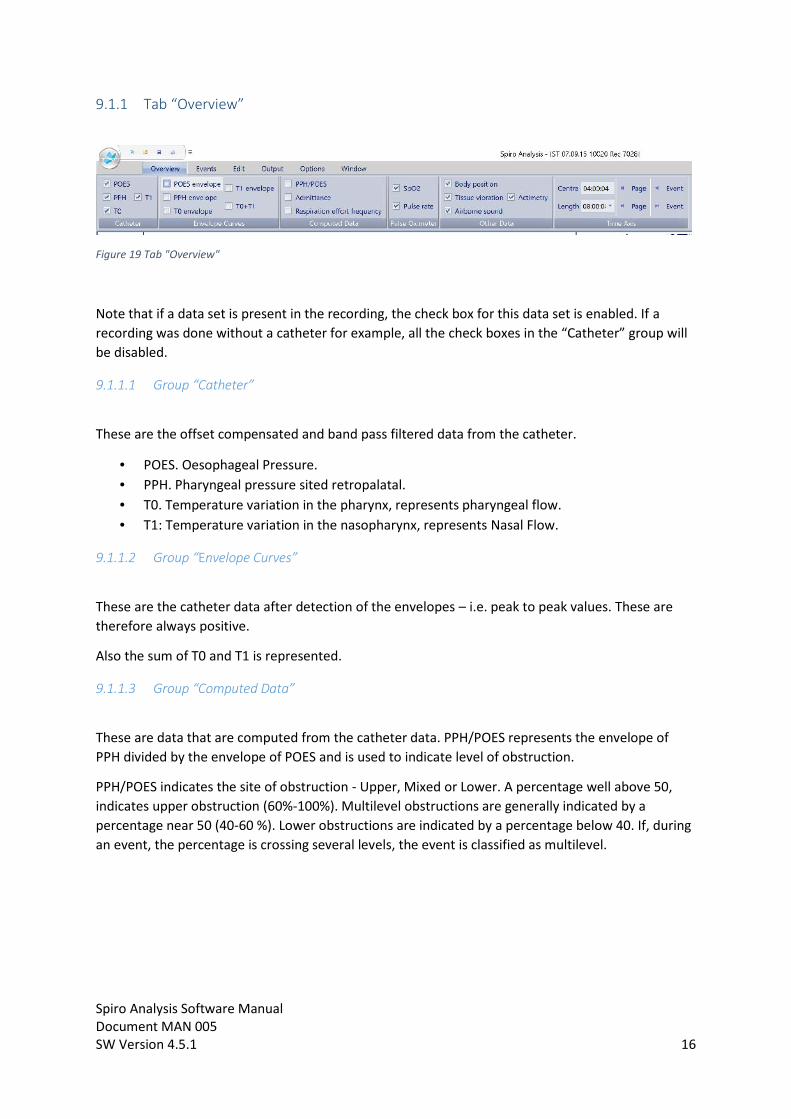
9.1.1 Tab “Overview”
Figure 19 Tab "Overview"
Note that if a data set is present in the recording, the check box for this data set is enabled. If arecording was done without a catheter for example, all the check boxes in the “Catheter” group willbe disabled.
9.1.1.1 Group “Catheter”
These are the offset compensated and band pass filtered data from the catheter.
POES. Oesophageal Pressure. PPH. Pharyngeal pressure sited retropalatal. T0. Temperature variation in the pharynx, represents pharyngeal flow. T1: Temperature variation in the nasopharynx, represents Nasal Flow.
9.1.1.2 Group “Envelope Curves”
These are the catheter data after detection of the envelopes – i.e. peak to peak values. These aretherefore always positive.
Also the sum of T0 and T1 is represented.
9.1.1.3 Group “Computed Data”
These are data that are computed from the catheter data. PPH/POES represents the envelope ofPPH divided by the envelope of POES and is used to indicate level of obstruction.
PPH/POES indicates the site of obstruction - Upper, Mixed or Lower. A percentage well above 50,indicates upper obstruction (60%-100%). Multilevel obstructions are generally indicated by apercentage near 50 (40-60 %). Lower obstructions are indicated by a percentage below 40. If, duringan event, the percentage is crossing several levels, the event is classified as multilevel.
Spiro Analysis Software ManualDocument MAN 005SW Version 4.5.1 17
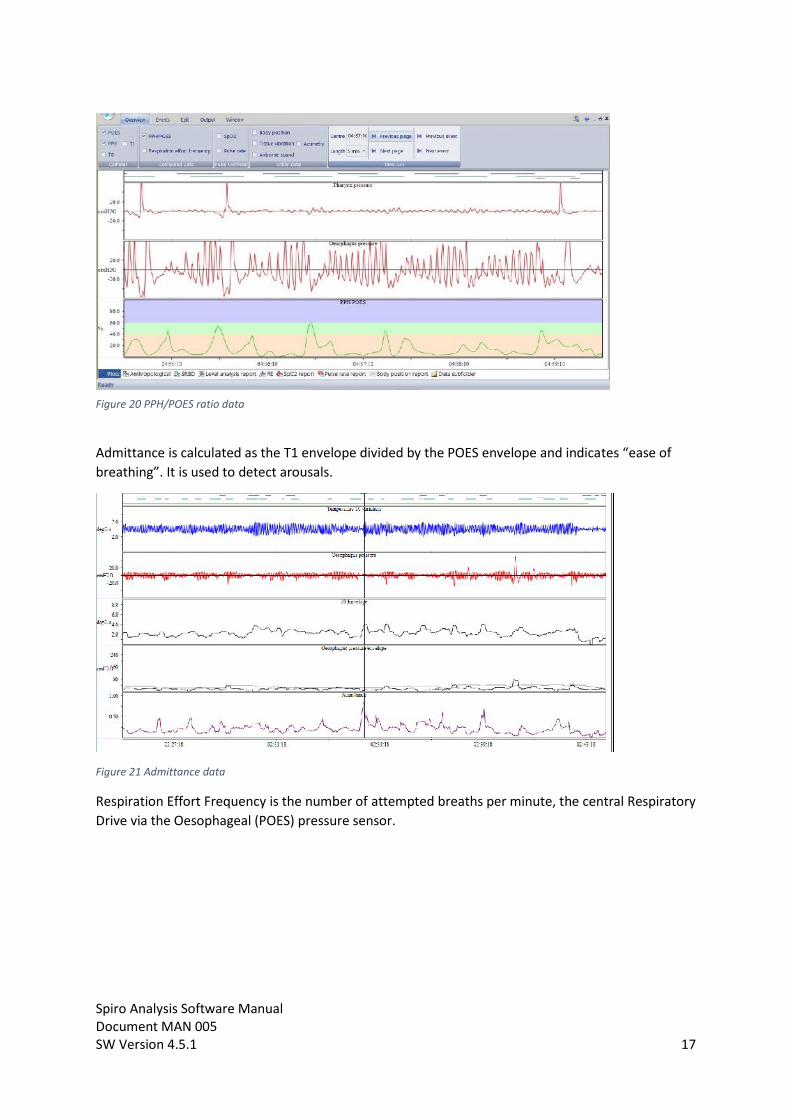
Admittance is calculated as the T1 envelope divided by the POES envelope and indicates “ease ofbreathing”. It is used to detect arousals.
Figure 21 Admittance data
Respiration Effort Frequency is the number of attempted breaths per minute, the central RespiratoryDrive via the Oesophageal (POES) pressure sensor.
Figure 20 PPH/POES ratio data
Spiro Analysis Software ManualDocument MAN 005SW Version 4.5.1 18
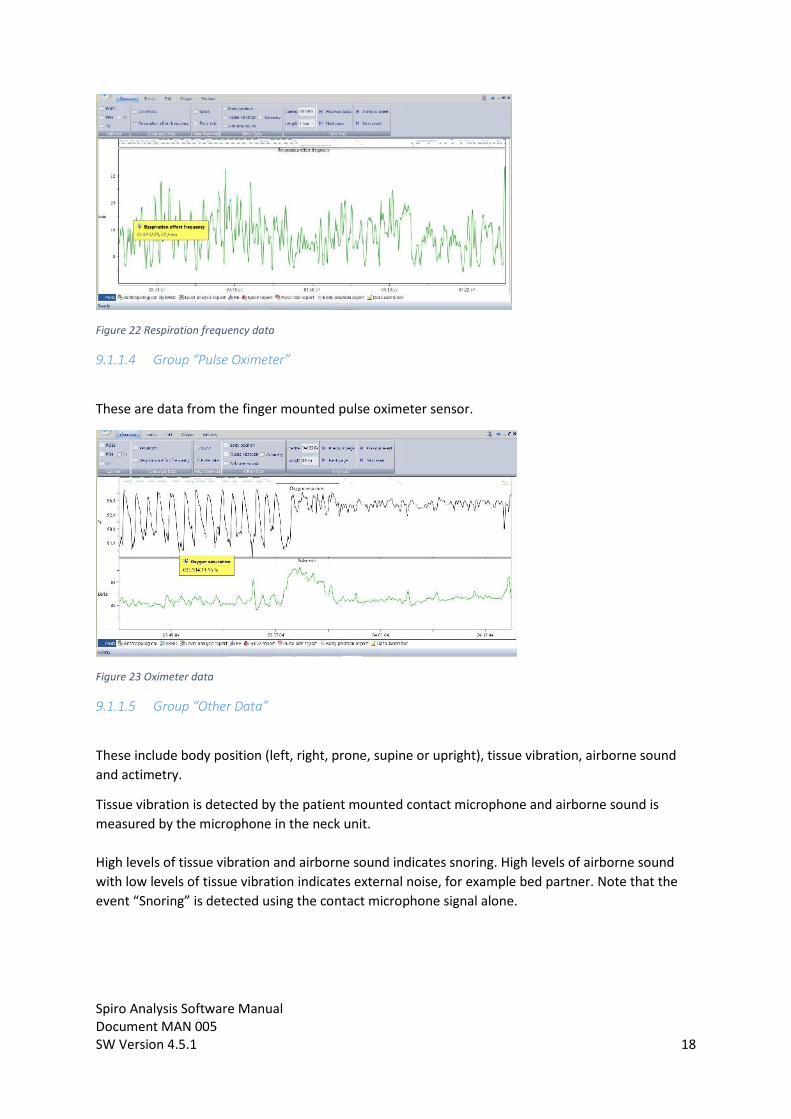
Figure 22 Respiration frequency data
9.1.1.4 Group “Pulse Oximeter”
These are data from the finger mounted pulse oximeter sensor.
Figure 23 Oximeter data
9.1.1.5 Group “Other Data”
These include body position (left, right, prone, supine or upright), tissue vibration, airborne soundand actimetry.
Tissue vibration is detected by the patient mounted contact microphone and airborne sound ismeasured by the microphone in the neck unit.
High levels of tissue vibration and airborne sound indicates snoring. High levels of airborne soundwith low levels of tissue vibration indicates external noise, for example bed partner. Note that theevent “Snoring” is detected using the contact microphone signal alone.
Spiro Analysis Software ManualDocument MAN 005SW Version 4.5.1 19
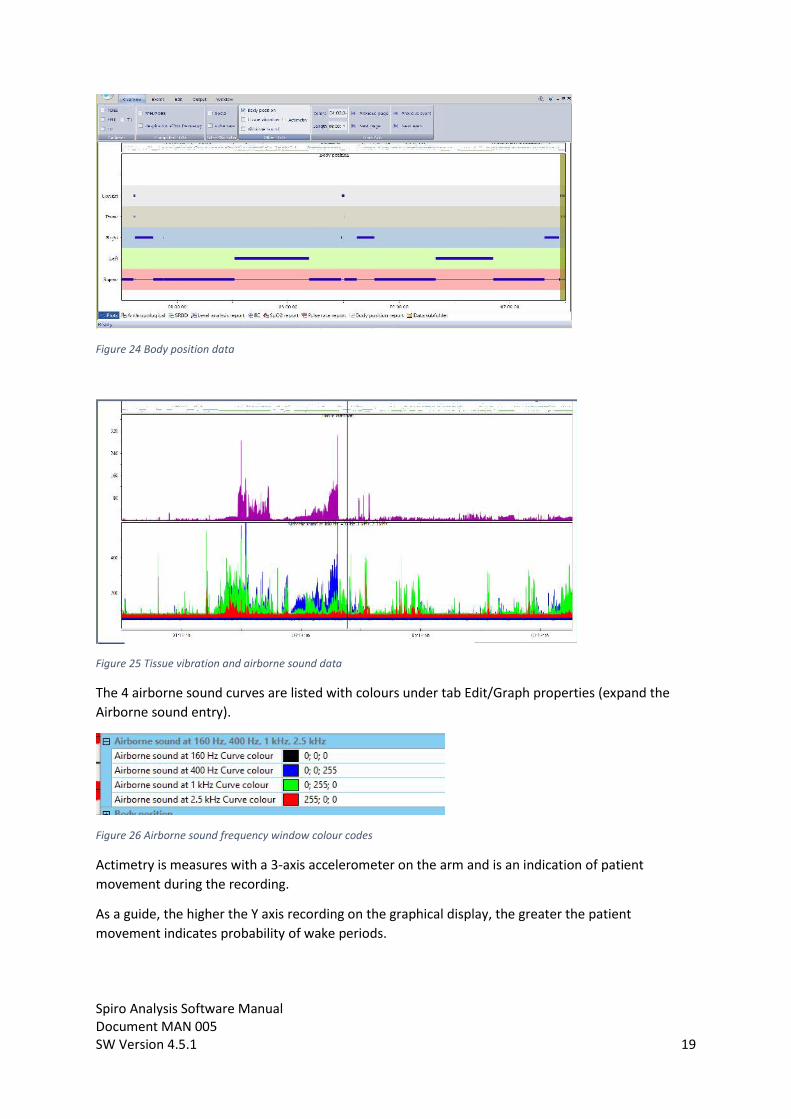
Figure 24 Body position data
Figure 25 Tissue vibration and airborne sound data
The 4 airborne sound curves are listed with colours under tab Edit/Graph properties (expand theAirborne sound entry).
Figure 26 Airborne sound frequency window colour codes
Actimetry is measures with a 3-axis accelerometer on the arm and is an indication of patientmovement during the recording.
As a guide, the higher the Y axis recording on the graphical display, the greater the patientmovement indicates probability of wake periods.
Spiro Analysis Software ManualDocument MAN 005SW Version 4.5.1 20
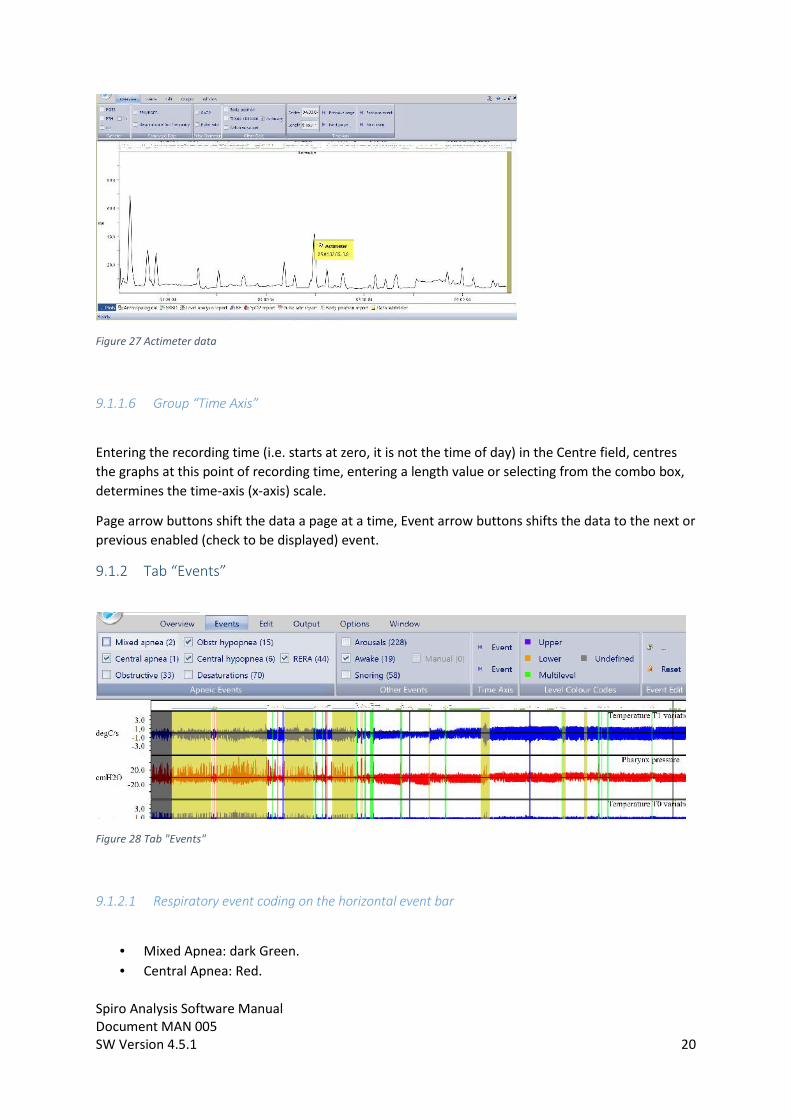
Figure 27 Actimeter data
9.1.1.6 Group “Time Axis”
Entering the recording time (i.e. starts at zero, it is not the time of day) in the Centre field, centresthe graphs at this point of recording time, entering a length value or selecting from the combo box,determines the time-axis (x-axis) scale.
Page arrow buttons shift the data a page at a time, Event arrow buttons shifts the data to the next orprevious enabled (check to be displayed) event.
9.1.2 Tab “Events”
Figure 28 Tab "Events"
9.1.2.1 Respiratory event coding on the horizontal event bar
Mixed Apnea: dark Green. Central Apnea: Red.
Spiro Analysis Software ManualDocument MAN 005SW Version 4.5.1 21
Obstructive Apnea: Blue. Obstructive Hypopnea: Olive Green. Central Hypopnea: Purple. SPo2 drops: Turquoise. Arousals Following Respiratory Events (RERA) : Pink. Awake: Blue. Snoring: Light Green.
All analysis based on current American Academy of Sleep Medicine (AASA) criteria 2007 & 2013.
9.1.2.2 Group “Apneic Events”
These are the classic events plus Respiratory Effort Related Arousals (RERA). “Classic events” aremixed apnea, central apnea, obstructive apnea, hypopnea and oxygen desaturations.
9.1.2.3 Group “Other Events”
These are arousals that are not part of classic events, awake periods (from the actimeter), snoringperiods (from the contact microphone).
9.1.2.4 Group “Time Axis”
The event arrows causes shift of the data to the previous or next enabled event.
9.1.2.5 Group “Level Colour Codes”
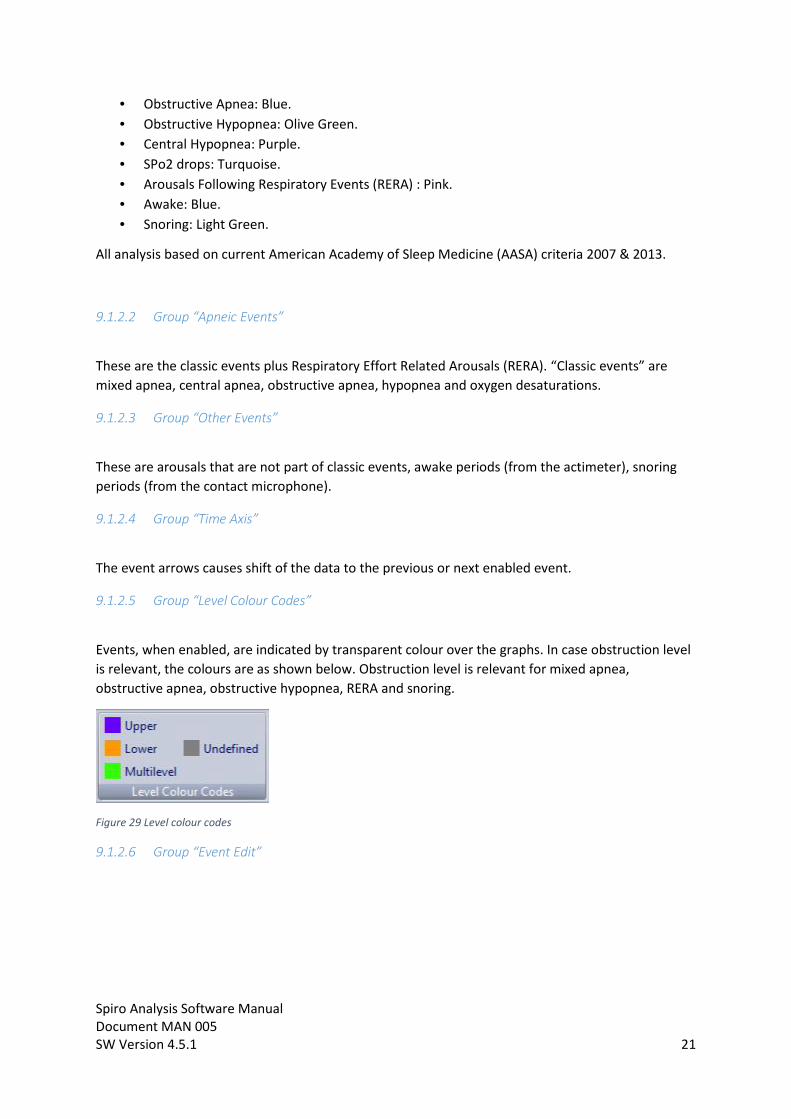
Events, when enabled, are indicated by transparent colour over the graphs. In case obstruction levelis relevant, the colours are as shown below. Obstruction level is relevant for mixed apnea,obstructive apnea, obstructive hypopnea, RERA and snoring.
Figure 29 Level colour codes
9.1.2.6 Group “Event Edit”
Spiro Analysis Software ManualDocument MAN 005SW Version 4.5.1 22
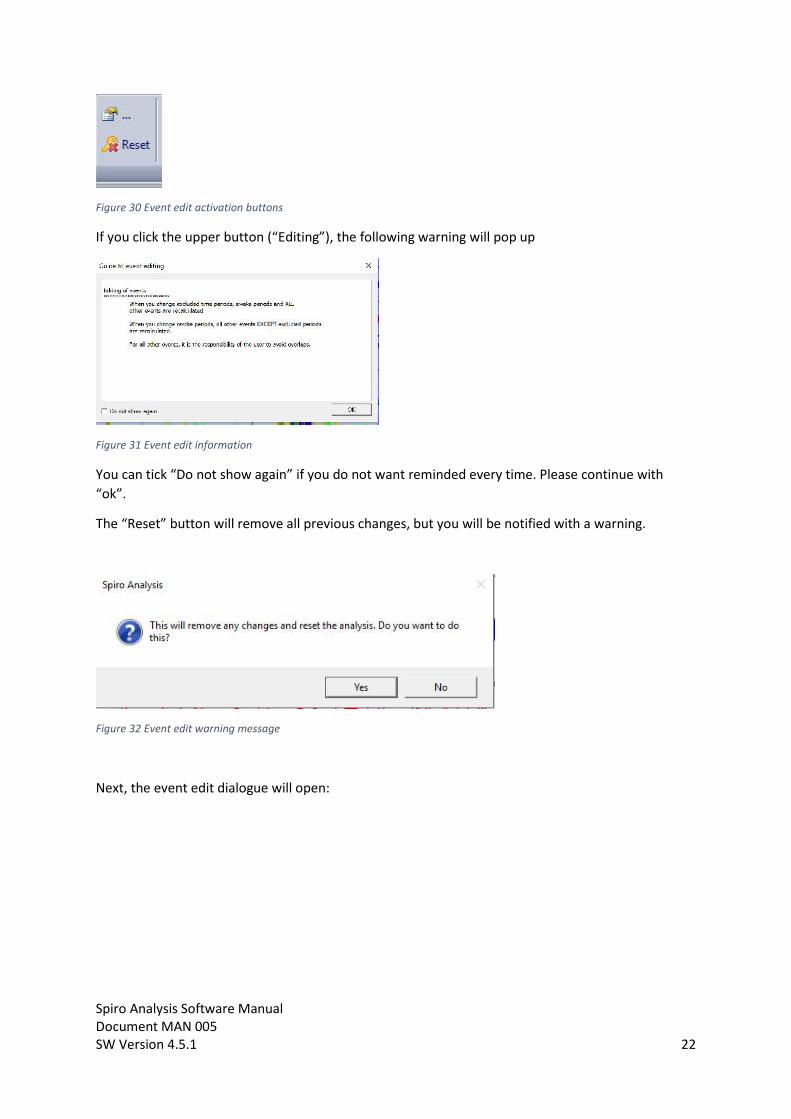
Figure 30 Event edit activation buttons
If you click the upper button (“Editing”), the following warning will pop up
Figure 31 Event edit information
You can tick “Do not show again” if you do not want reminded every time. Please continue with“ok”.
The “Reset” button will remove all previous changes, but you will be notified with a warning.
Figure 32 Event edit warning message
Next, the event edit dialogue will open:
Spiro Analysis Software ManualDocument MAN 005SW Version 4.5.1 23
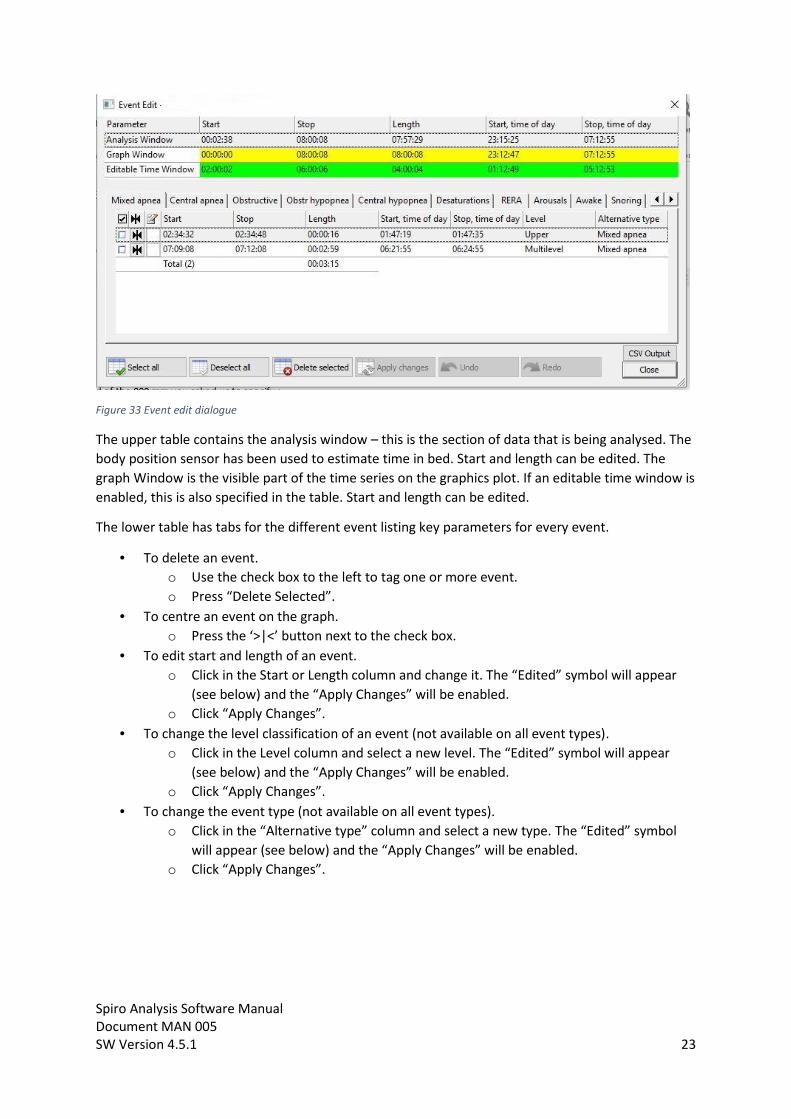
Figure 33 Event edit dialogue
The upper table contains the analysis window – this is the section of data that is being analysed. Thebody position sensor has been used to estimate time in bed. Start and length can be edited. Thegraph Window is the visible part of the time series on the graphics plot. If an editable time window isenabled, this is also specified in the table. Start and length can be edited.
The lower table has tabs for the different event listing key parameters for every event.
To delete an event.o Use the check box to the left to tag one or more event.o Press “Delete Selected”.
To centre an event on the graph.o Press the ‘>|<’ button next to the check box.
To edit start and length of an event.o Click in the Start or Length column and change it. The “Edited” symbol will appear
(see below) and the “Apply Changes” will be enabled.o Click “Apply Changes”.
To change the level classification of an event (not available on all event types).o Click in the Level column and select a new level. The “Edited” symbol will appear
(see below) and the “Apply Changes” will be enabled.o Click “Apply Changes”.
To change the event type (not available on all event types).o Click in the “Alternative type” column and select a new type. The “Edited” symbol
will appear (see below) and the “Apply Changes” will be enabled.o Click “Apply Changes”.
Spiro Analysis Software ManualDocument MAN 005SW Version 4.5.1 24
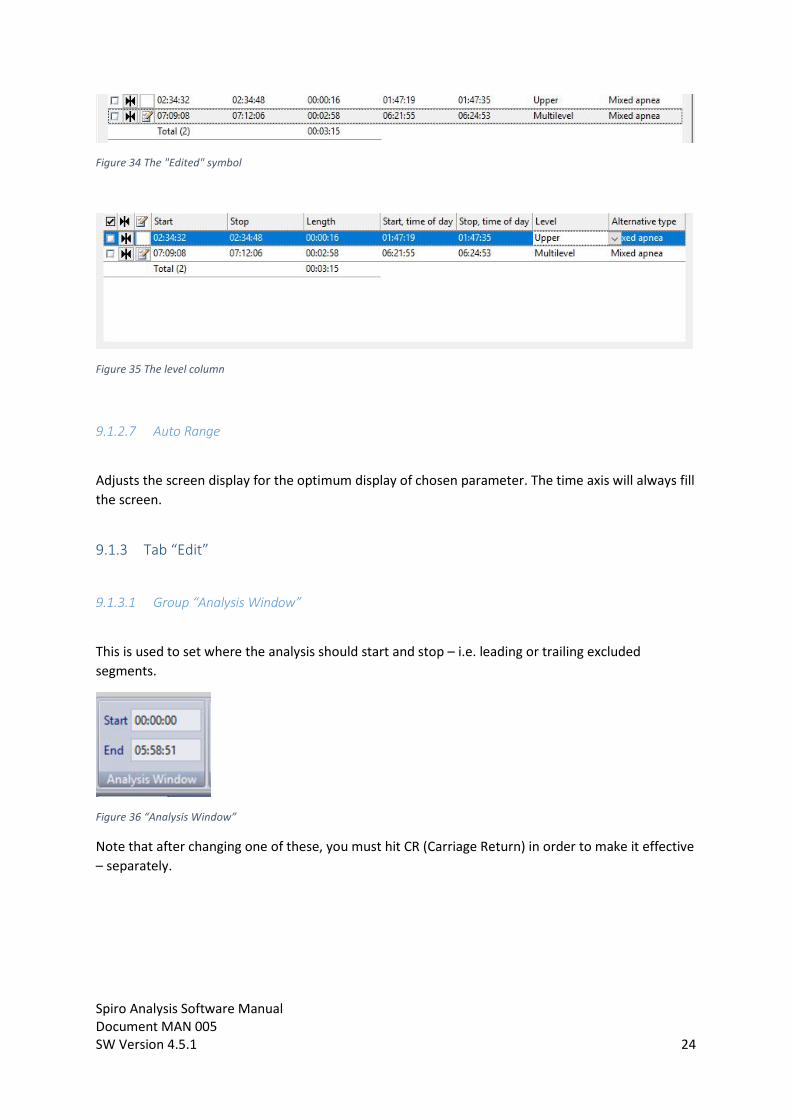
Figure 34 The "Edited" symbol
Figure 35 The level column
9.1.2.7 Auto Range
Adjusts the screen display for the optimum display of chosen parameter. The time axis will always fillthe screen.
9.1.3 Tab “Edit”
9.1.3.1 Group “Analysis Window”
This is used to set where the analysis should start and stop – i.e. leading or trailing excludedsegments.
Figure 36 “Analysis Window”
Note that after changing one of these, you must hit CR (Carriage Return) in order to make it effective– separately.
Spiro Analysis Software ManualDocument MAN 005SW Version 4.5.1 25
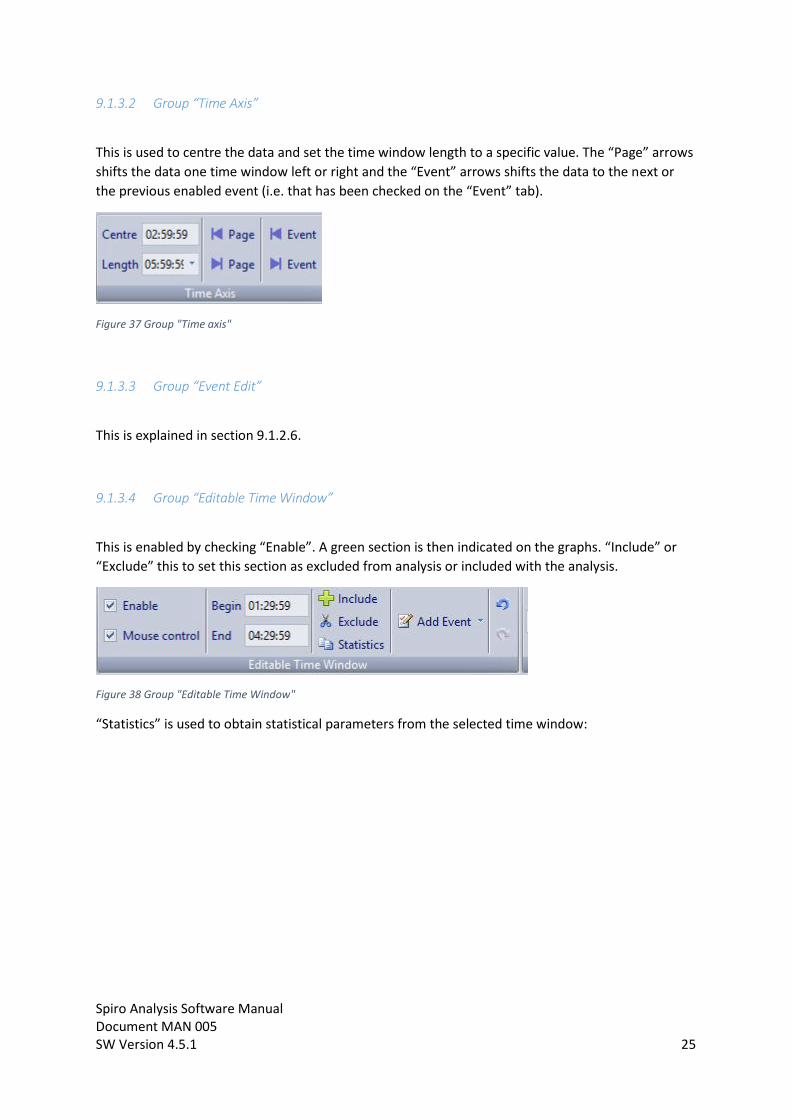
9.1.3.2 Group “Time Axis”
This is used to centre the data and set the time window length to a specific value. The “Page” arrowsshifts the data one time window left or right and the “Event” arrows shifts the data to the next orthe previous enabled event (i.e. that has been checked on the “Event” tab).
Figure 37 Group "Time axis"
9.1.3.3 Group “Event Edit”
This is explained in section 9.1.2.6.
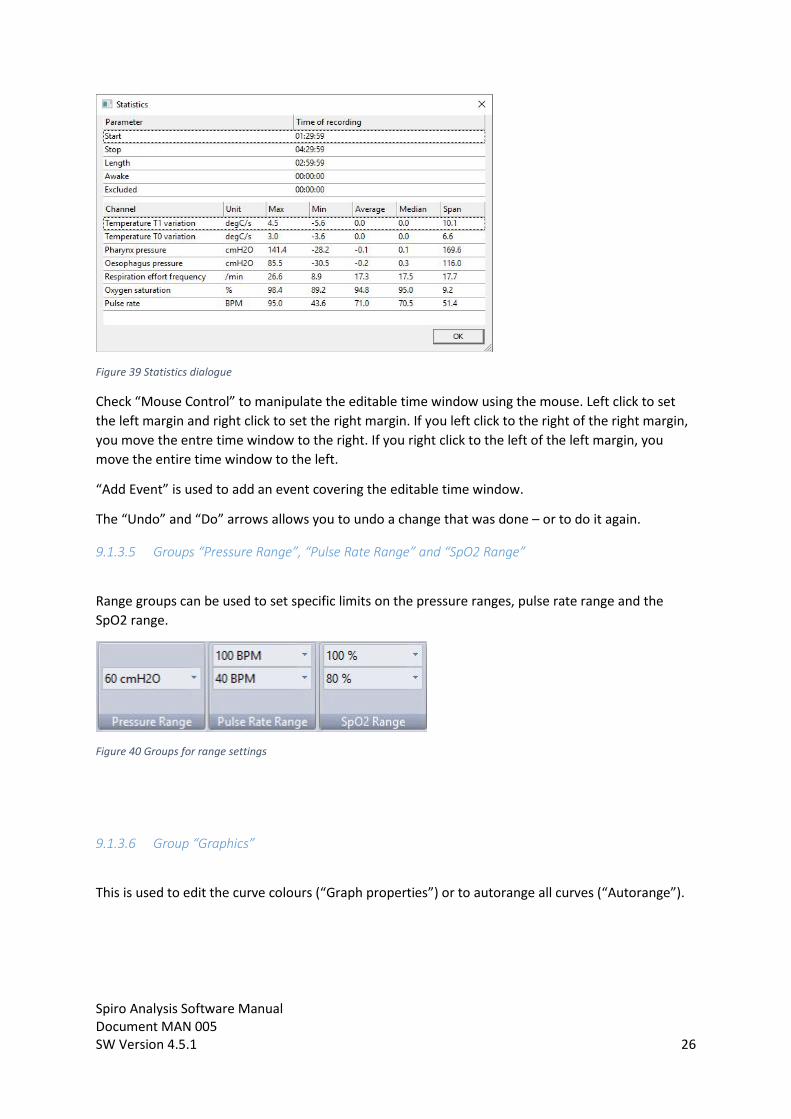
9.1.3.4 Group “Editable Time Window”
This is enabled by checking “Enable”. A green section is then indicated on the graphs. “Include” or“Exclude” this to set this section as excluded from analysis or included with the analysis.
Figure 38 Group "Editable Time Window"
“Statistics” is used to obtain statistical parameters from the selected time window:
Spiro Analysis Software ManualDocument MAN 005SW Version 4.5.1 26
Figure 39 Statistics dialogue
Check “Mouse Control” to manipulate the editable time window using the mouse. Left click to setthe left margin and right click to set the right margin. If you left click to the right of the right margin,you move the entre time window to the right. If you right click to the left of the left margin, youmove the entire time window to the left.
“Add Event” is used to add an event covering the editable time window.
The “Undo” and “Do” arrows allows you to undo a change that was done – or to do it again.
9.1.3.5 Groups “Pressure Range”, “Pulse Rate Range” and “SpO2 Range”
Range groups can be used to set specific limits on the pressure ranges, pulse rate range and theSpO2 range.
Figure 40 Groups for range settings
9.1.3.6 Group “Graphics”
This is used to edit the curve colours (“Graph properties”) or to autorange all curves (“Autorange”).
Spiro Analysis Software ManualDocument MAN 005SW Version 4.5.1 27
9.1.4 Tab “Output”
Figure 41 Tab "Output"
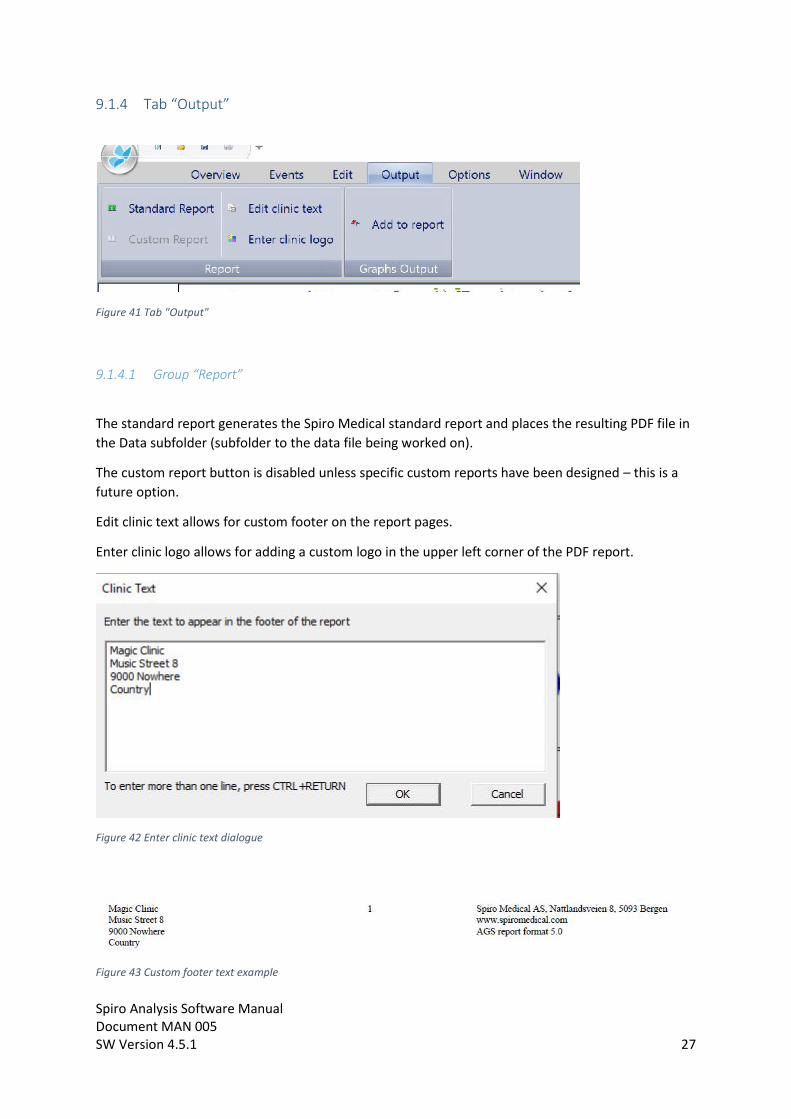
9.1.4.1 Group “Report”
The standard report generates the Spiro Medical standard report and places the resulting PDF file inthe Data subfolder (subfolder to the data file being worked on).
The custom report button is disabled unless specific custom reports have been designed – this is afuture option.
Edit clinic text allows for custom footer on the report pages.
Enter clinic logo allows for adding a custom logo in the upper left corner of the PDF report.
Figure 42 Enter clinic text dialogue
Figure 43 Custom footer text example
Spiro Analysis Software ManualDocument MAN 005SW Version 4.5.1 28
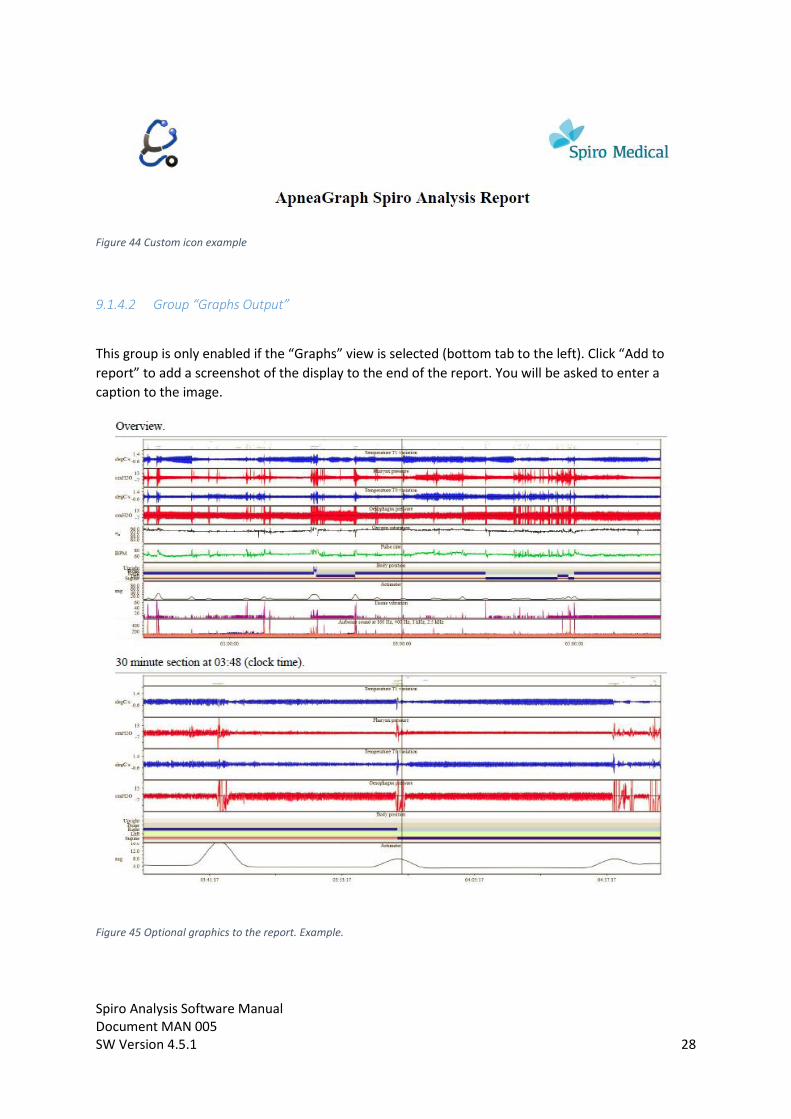
Figure 44 Custom icon example
9.1.4.2 Group “Graphs Output”
This group is only enabled if the “Graphs” view is selected (bottom tab to the left). Click “Add toreport” to add a screenshot of the display to the end of the report. You will be asked to enter acaption to the image.
Figure 45 Optional graphics to the report. Example.
Spiro Analysis Software ManualDocument MAN 005SW Version 4.5.1 29
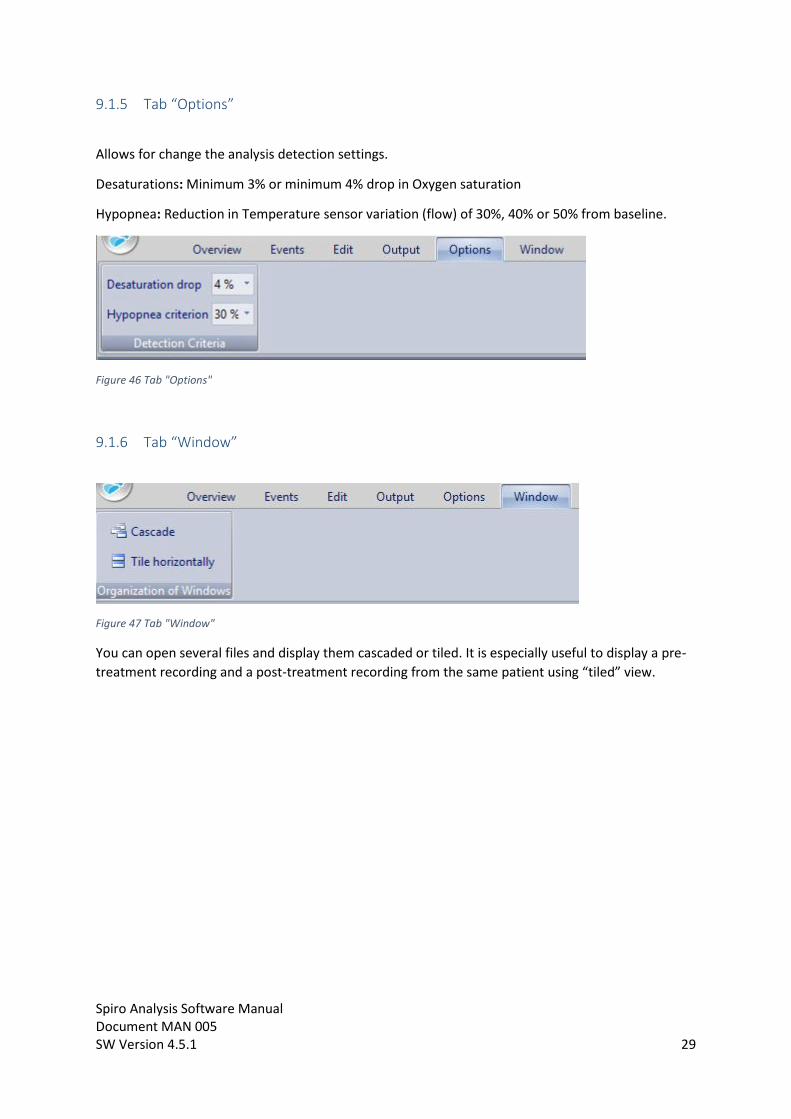
9.1.5 Tab “Options”
Allows for change the analysis detection settings.
Desaturations: Minimum 3% or minimum 4% drop in Oxygen saturation
Hypopnea: Reduction in Temperature sensor variation (flow) of 30%, 40% or 50% from baseline.
Figure 46 Tab "Options"
9.1.6 Tab “Window”
Figure 47 Tab "Window"
You can open several files and display them cascaded or tiled. It is especially useful to display a pre-treatment recording and a post-treatment recording from the same patient using “tiled” view.
Spiro Analysis Software ManualDocument MAN 005SW Version 4.5.1 30
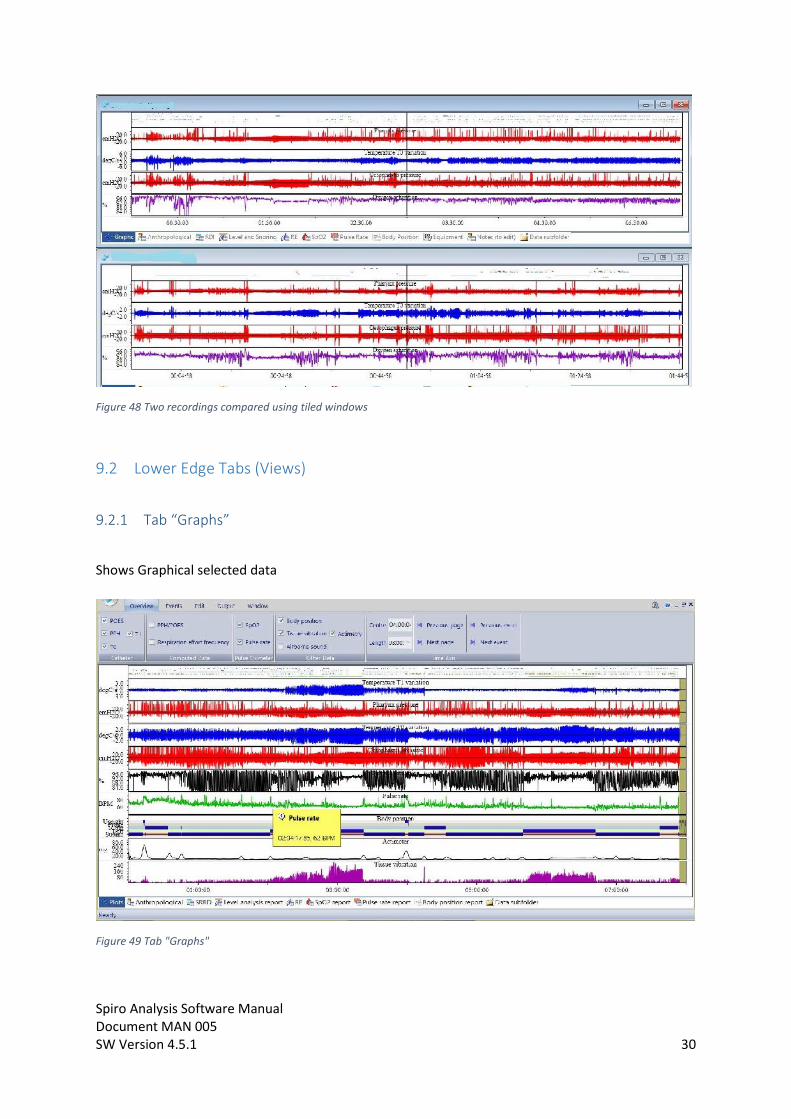
Figure 48 Two recordings compared using tiled windows
9.2 Lower Edge Tabs (Views)
9.2.1 Tab “Graphs”
Shows Graphical selected data
Figure 49 Tab "Graphs"
Spiro Analysis Software ManualDocument MAN 005SW Version 4.5.1 31
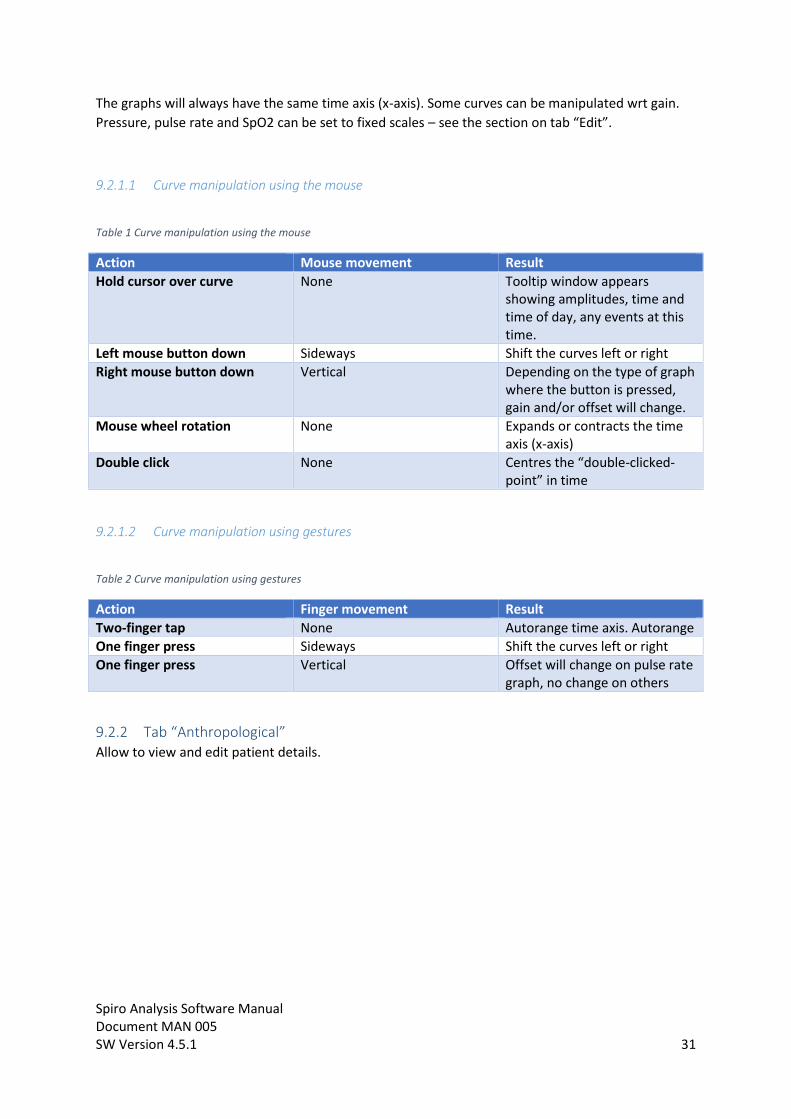
The graphs will always have the same time axis (x-axis). Some curves can be manipulated wrt gain.Pressure, pulse rate and SpO2 can be set to fixed scales – see the section on tab “Edit”.
9.2.1.1 Curve manipulation using the mouse
Table 1 Curve manipulation using the mouse
Action Mouse movement ResultHold cursor over curve None Tooltip window appears
showing amplitudes, time andtime of day, any events at thistime.
Left mouse button down Sideways Shift the curves left or rightRight mouse button down Vertical Depending on the type of graph
where the button is pressed,gain and/or offset will change.
Mouse wheel rotation None Expands or contracts the timeaxis (x-axis)
Double click None Centres the “double-clicked-point” in time
9.2.1.2 Curve manipulation using gestures
Table 2 Curve manipulation using gestures
Action Finger movement ResultTwo-finger tap None Autorange time axis. AutorangeOne finger press Sideways Shift the curves left or rightOne finger press Vertical Offset will change on pulse rate
graph, no change on others
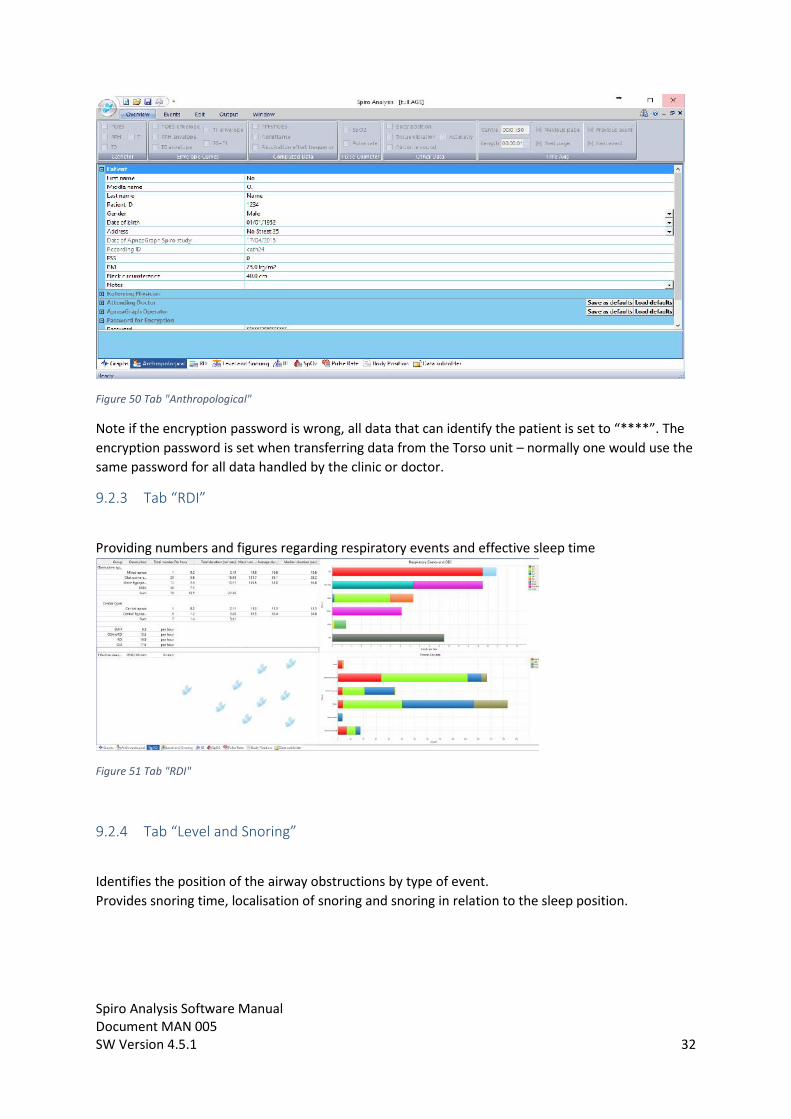
9.2.2 Tab “Anthropological”Allow to view and edit patient details.
Spiro Analysis Software ManualDocument MAN 005SW Version 4.5.1 32
Figure 50 Tab "Anthropological"
Note if the encryption password is wrong, all data that can identify the patient is set to “****”. Theencryption password is set when transferring data from the Torso unit – normally one would use thesame password for all data handled by the clinic or doctor.
9.2.3 Tab “RDI”
Providing numbers and figures regarding respiratory events and effective sleep time
Figure 51 Tab "RDI"
9.2.4 Tab “Level and Snoring”
Identifies the position of the airway obstructions by type of event.Provides snoring time, localisation of snoring and snoring in relation to the sleep position.
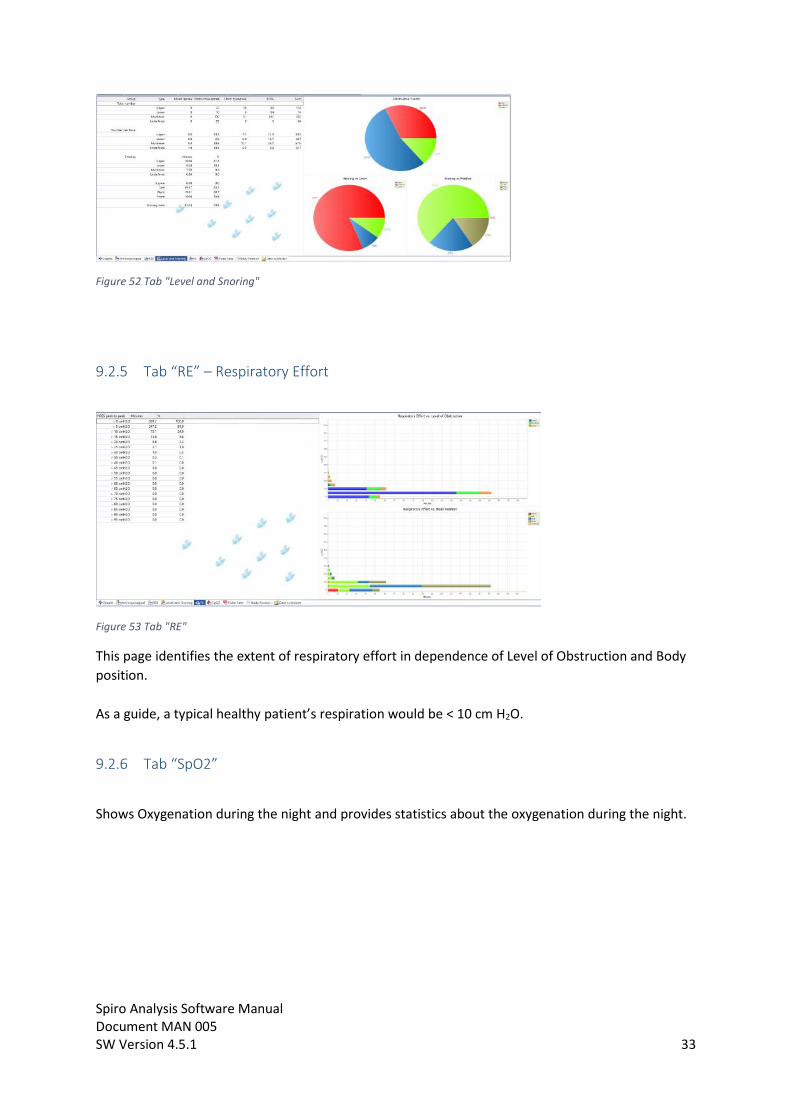
Spiro Analysis Software ManualDocument MAN 005SW Version 4.5.1 33
Figure 52 Tab "Level and Snoring"
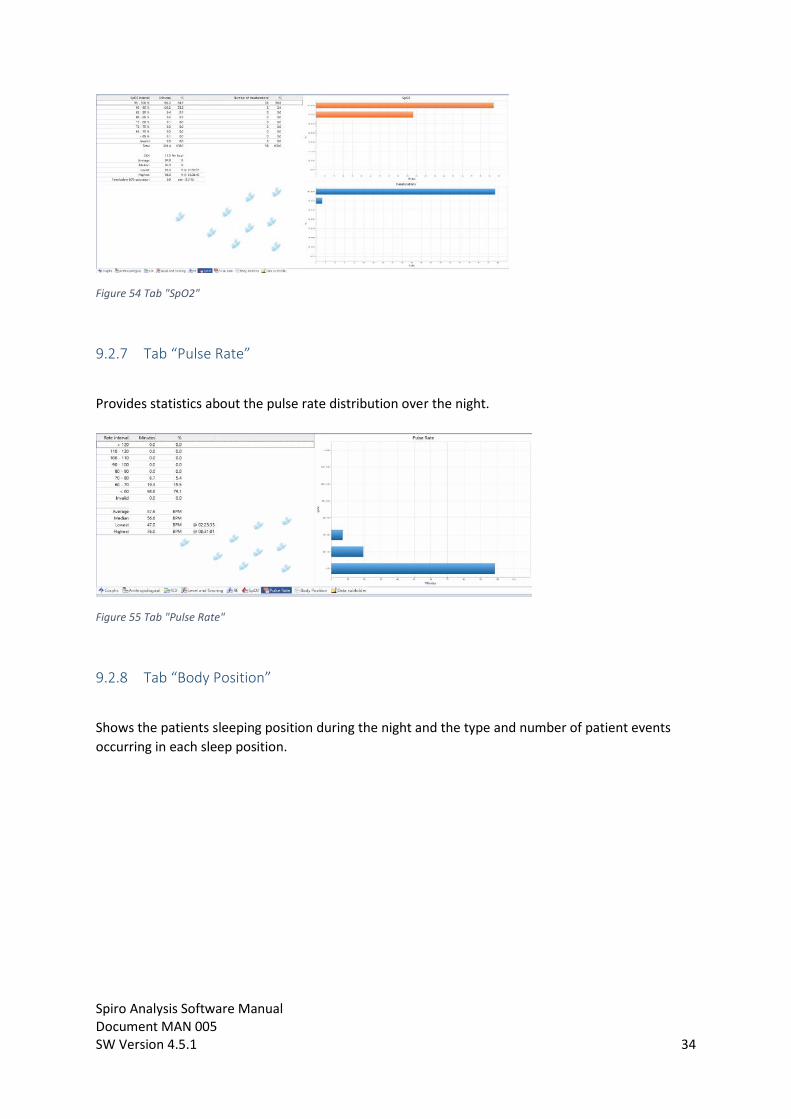
9.2.5 Tab “RE” – Respiratory Effort
Figure 53 Tab "RE"
This page identifies the extent of respiratory effort in dependence of Level of Obstruction and Bodyposition.
As a guide, a typical healthy patient’s respiration would be < 10 cm H2O.
9.2.6 Tab “SpO2”
Shows Oxygenation during the night and provides statistics about the oxygenation during the night.
Spiro Analysis Software ManualDocument MAN 005SW Version 4.5.1 34
Figure 54 Tab "SpO2"
9.2.7 Tab “Pulse Rate”
Provides statistics about the pulse rate distribution over the night.
Figure 55 Tab "Pulse Rate"
9.2.8 Tab “Body Position”
Shows the patients sleeping position during the night and the type and number of patient eventsoccurring in each sleep position.
Spiro Analysis Software ManualDocument MAN 005SW Version 4.5.1 35
Figure 56 Tab "Body Position"
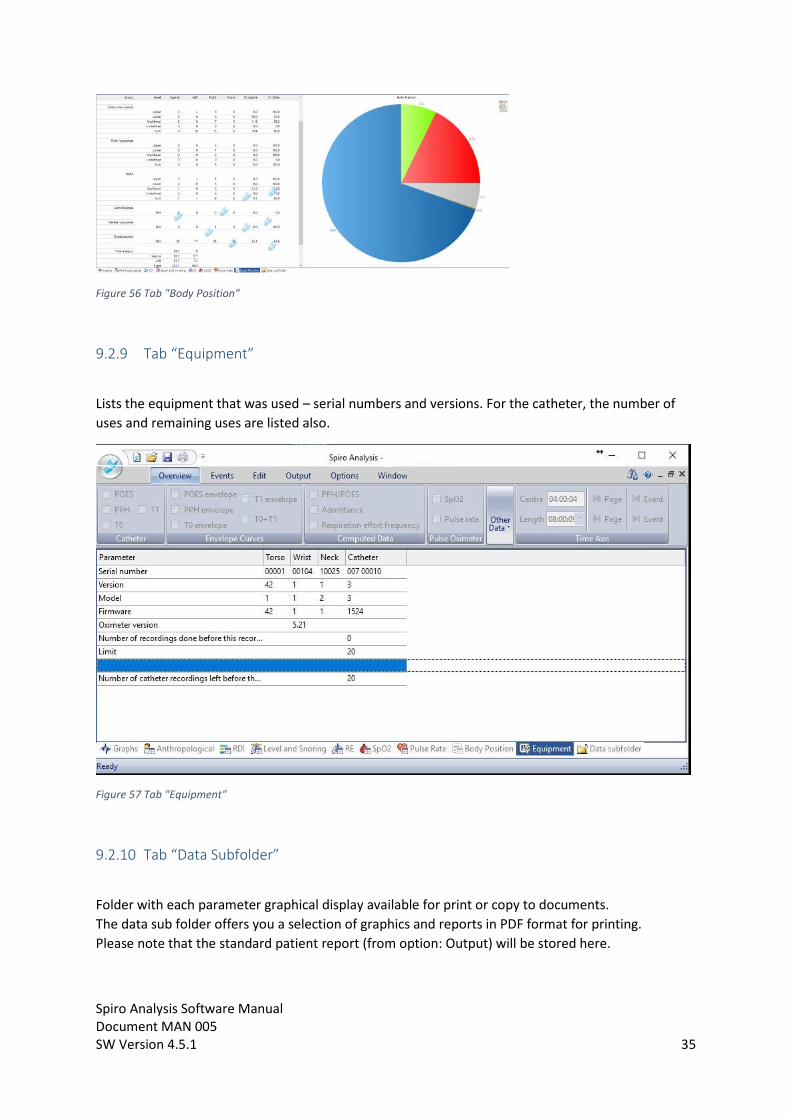
9.2.9 Tab “Equipment”
Lists the equipment that was used – serial numbers and versions. For the catheter, the number ofuses and remaining uses are listed also.
Figure 57 Tab "Equipment"
9.2.10 Tab “Data Subfolder”
Folder with each parameter graphical display available for print or copy to documents.The data sub folder offers you a selection of graphics and reports in PDF format for printing.Please note that the standard patient report (from option: Output) will be stored here.
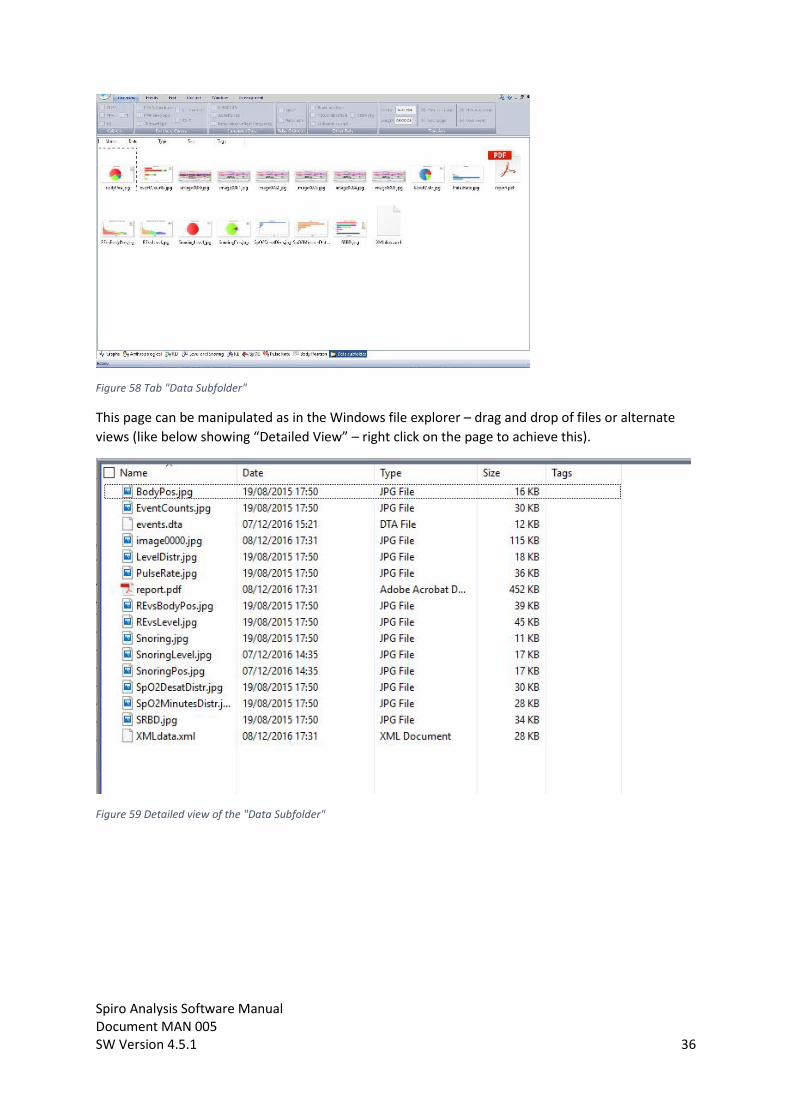
Spiro Analysis Software ManualDocument MAN 005SW Version 4.5.1 36
Figure 58 Tab "Data Subfolder"
This page can be manipulated as in the Windows file explorer – drag and drop of files or alternateviews (like below showing “Detailed View” – right click on the page to achieve this).
Figure 59 Detailed view of the "Data Subfolder"
Spiro Analysis Software ManualDocument MAN 005SW Version 4.5.1 37
10 Notes on POES vs PPH signals
Sometimes, the PPH signal is stronger than the POES signal. This may not be logical as the POES isthe driving pressure.
PPH is in a channel where there is flow, POES is not.
The following physical phenomena are present:
A. Flow,B. pressure variation,C. tissue movement,D. peristatic waves,E. stretching of catheter (this effect has been virtually eliminated on the catheter).
A is present in PPH, not in POES
B is present in PPH and POES
C is present in both, but much more complicated in PPH.
D is present in both POES and PPH, as positive spikes.
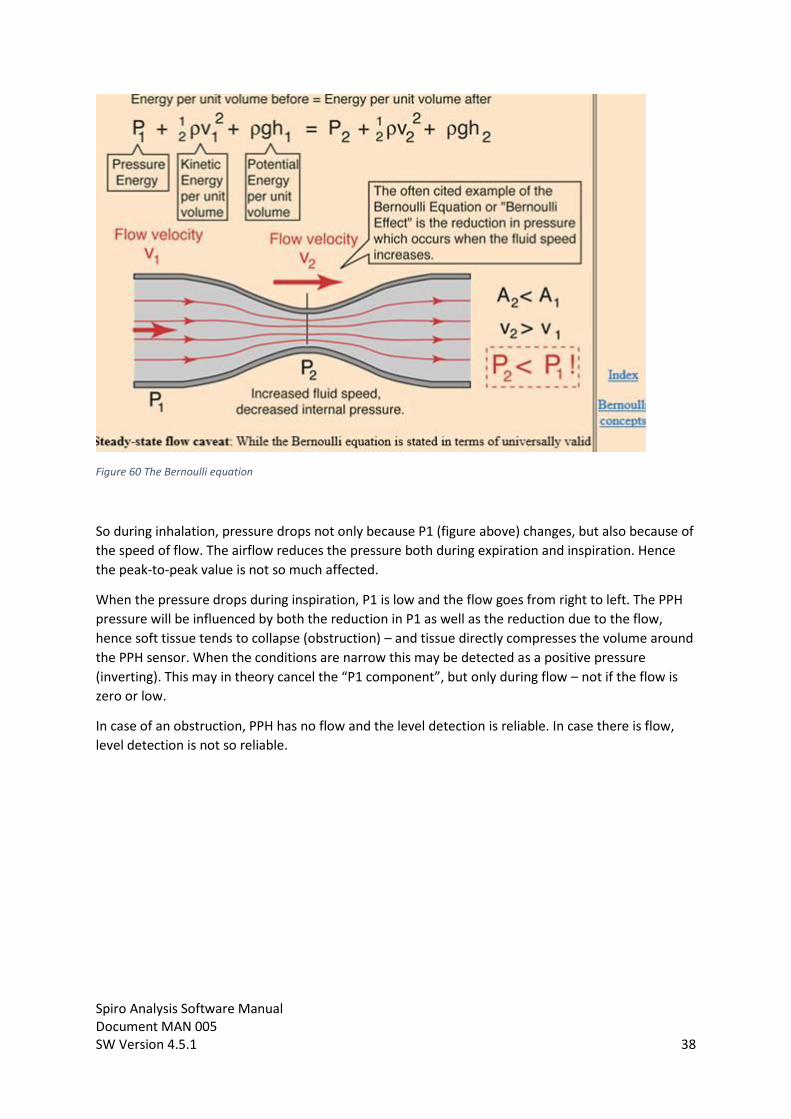
When there is a flow, pressure goes down according to the Bernoulli equation (this is why airplanesfly):
Spiro Analysis Software ManualDocument MAN 005SW Version 4.5.1 38
Figure 60 The Bernoulli equation
So during inhalation, pressure drops not only because P1 (figure above) changes, but also because ofthe speed of flow. The airflow reduces the pressure both during expiration and inspiration. Hencethe peak-to-peak value is not so much affected.
When the pressure drops during inspiration, P1 is low and the flow goes from right to left. The PPHpressure will be influenced by both the reduction in P1 as well as the reduction due to the flow,hence soft tissue tends to collapse (obstruction) – and tissue directly compresses the volume aroundthe PPH sensor. When the conditions are narrow this may be detected as a positive pressure(inverting). This may in theory cancel the “P1 component”, but only during flow – not if the flow iszero or low.
In case of an obstruction, PPH has no flow and the level detection is reliable. In case there is flow,level detection is not so reliable.
Spiro Analysis Software ManualDocument MAN 005SW Version 4.5.1 39
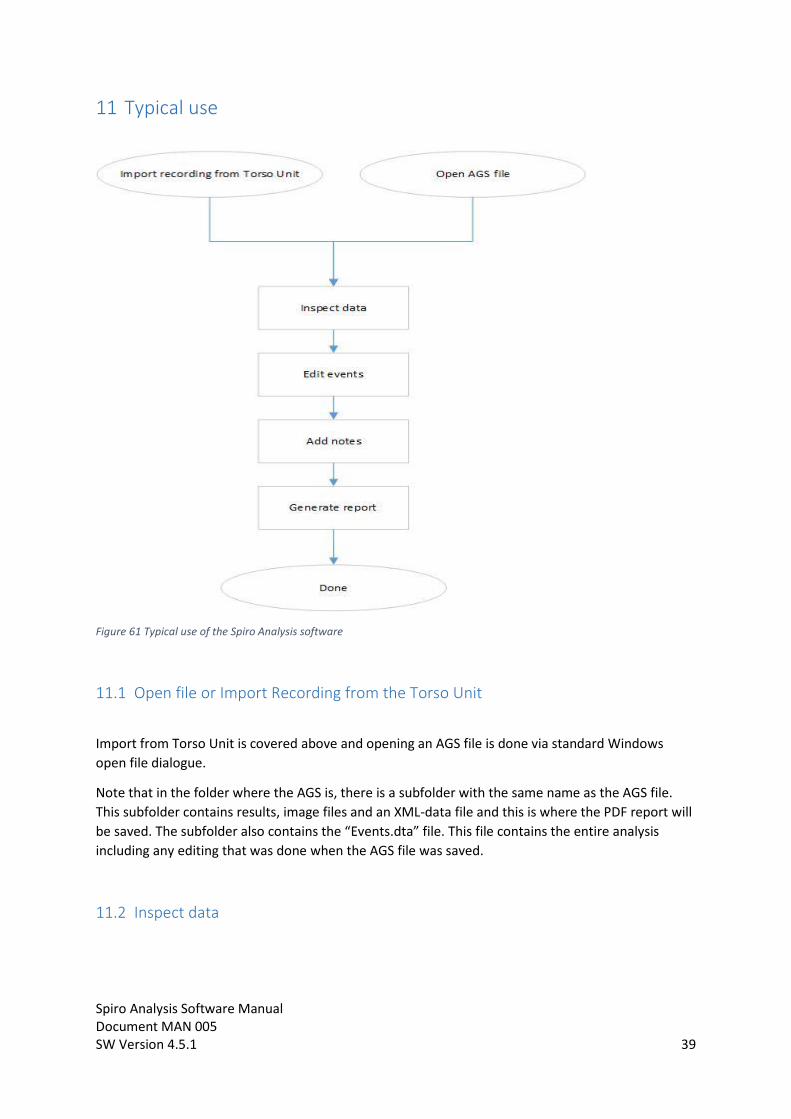
11 Typical use
Figure 61 Typical use of the Spiro Analysis software
11.1 Open file or Import Recording from the Torso Unit
Import from Torso Unit is covered above and opening an AGS file is done via standard Windowsopen file dialogue.
Note that in the folder where the AGS is, there is a subfolder with the same name as the AGS file.This subfolder contains results, image files and an XML-data file and this is where the PDF report willbe saved. The subfolder also contains the “Events.dta” file. This file contains the entire analysisincluding any editing that was done when the AGS file was saved.
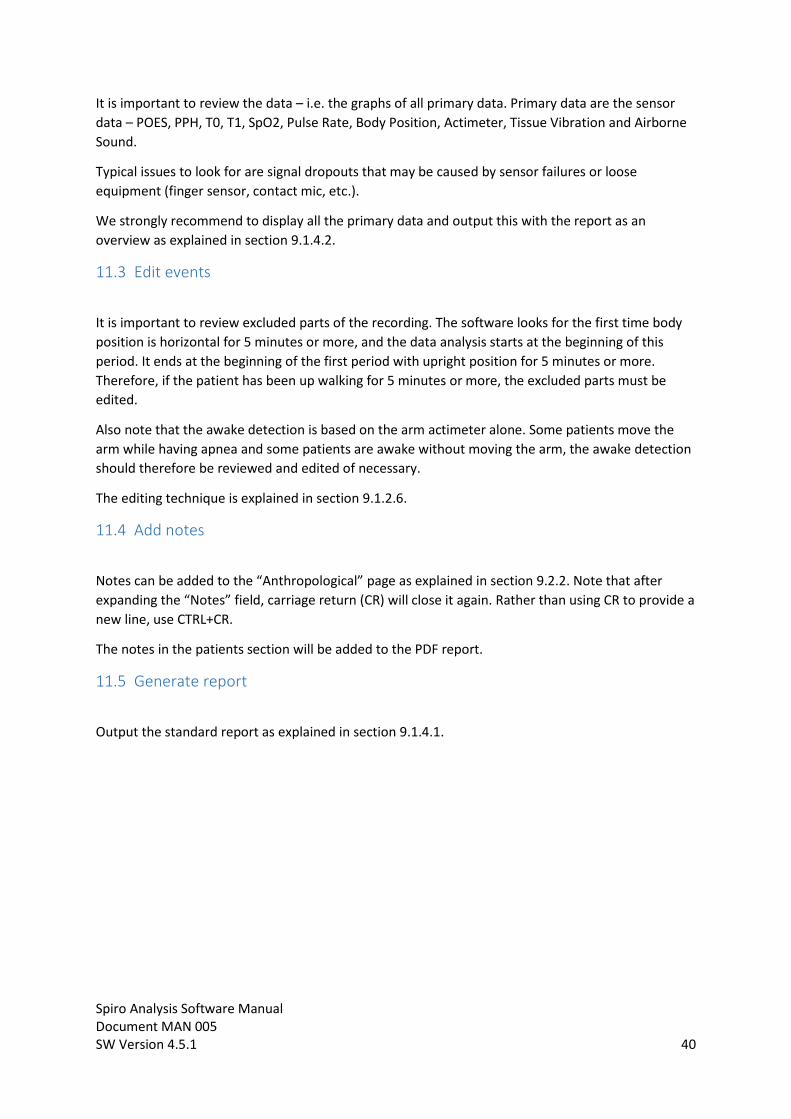
11.2 Inspect data
Spiro Analysis Software ManualDocument MAN 005SW Version 4.5.1 40
It is important to review the data – i.e. the graphs of all primary data. Primary data are the sensordata – POES, PPH, T0, T1, SpO2, Pulse Rate, Body Position, Actimeter, Tissue Vibration and AirborneSound.
Typical issues to look for are signal dropouts that may be caused by sensor failures or looseequipment (finger sensor, contact mic, etc.).
We strongly recommend to display all the primary data and output this with the report as anoverview as explained in section 9.1.4.2.
11.3 Edit events
It is important to review excluded parts of the recording. The software looks for the first time bodyposition is horizontal for 5 minutes or more, and the data analysis starts at the beginning of thisperiod. It ends at the beginning of the first period with upright position for 5 minutes or more.Therefore, if the patient has been up walking for 5 minutes or more, the excluded parts must beedited.
Also note that the awake detection is based on the arm actimeter alone. Some patients move thearm while having apnea and some patients are awake without moving the arm, the awake detectionshould therefore be reviewed and edited of necessary.
The editing technique is explained in section 9.1.2.6.
11.4 Add notes
Notes can be added to the “Anthropological” page as explained in section 9.2.2. Note that afterexpanding the “Notes” field, carriage return (CR) will close it again. Rather than using CR to provide anew line, use CTRL+CR.
The notes in the patients section will be added to the PDF report.
11.5 Generate report
Output the standard report as explained in section 9.1.4.1.
Spiro Analysis Software ManualDocument MAN 005SW Version 4.5.1 41
12 Shortcut keys
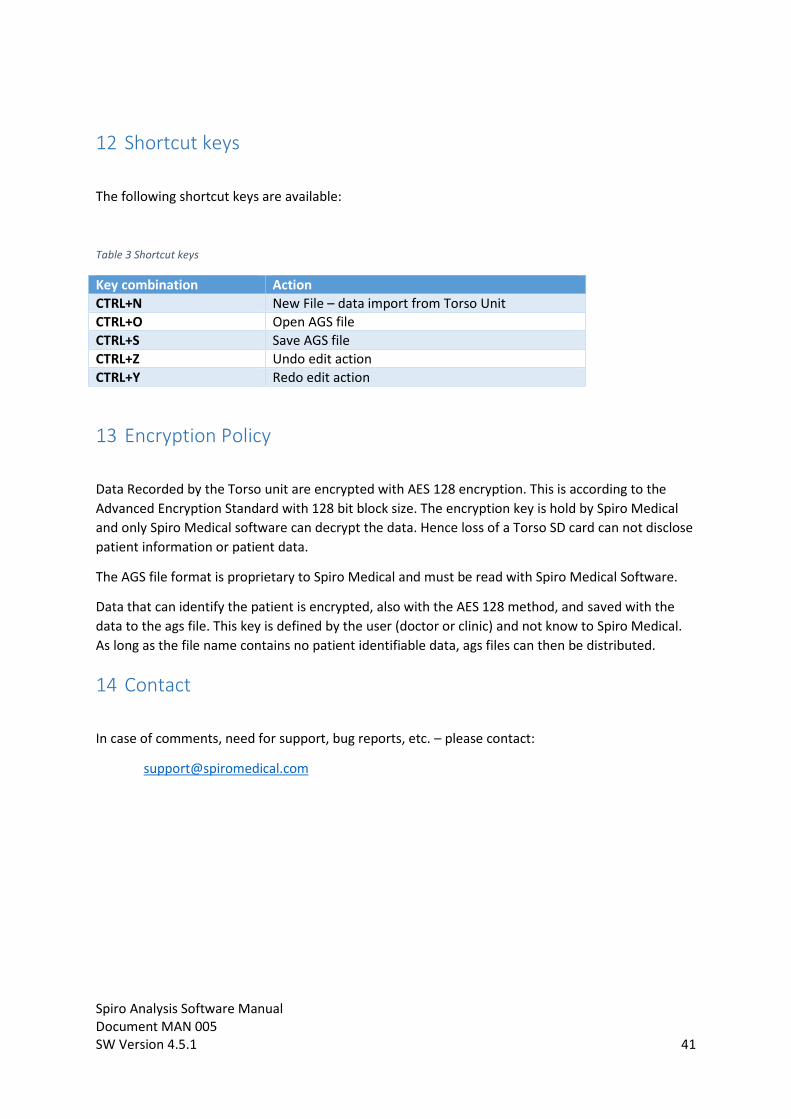
The following shortcut keys are available:
Table 3 Shortcut keys
Key combination ActionCTRL+N New File – data import from Torso UnitCTRL+O Open AGS fileCTRL+S Save AGS fileCTRL+Z Undo edit actionCTRL+Y Redo edit action
13 Encryption Policy
Data Recorded by the Torso unit are encrypted with AES 128 encryption. This is according to theAdvanced Encryption Standard with 128 bit block size. The encryption key is hold by Spiro Medicaland only Spiro Medical software can decrypt the data. Hence loss of a Torso SD card can not disclosepatient information or patient data.
The AGS file format is proprietary to Spiro Medical and must be read with Spiro Medical Software.
Data that can identify the patient is encrypted, also with the AES 128 method, and saved with thedata to the ags file. This key is defined by the user (doctor or clinic) and not know to Spiro Medical.As long as the file name contains no patient identifiable data, ags files can then be distributed.
14 Contact
In case of comments, need for support, bug reports, etc. – please contact:

Spiro Analysis Software ManualDocument MAN 005SW Version 4.5.1 42
15 References
1. Iber C, Ancoli-Israel S, Chesson AL, Jr., Quan SF. for the American Academy of Sleep Medicine.The AASM manual for the scoring of sleep and associated events: rules, terminology andtechnical specifications. 1st ed. Westchester, IL: American Academy of Sleep Medicine; 2007.
2. Berry RB, Brooks R, Gamaldo CE, et al. for the American Academy of Sleep Medicine. Darien, IL:American Academy of Sleep Medicine; 2013. The AASM Manual for the Scoring of Sleep andAssociated Events: Rules, Terminology and Technical Specifications, Version 2.0.2


