38
Apogee ANNUAL REPORT 2002 ADDING VALUE TO GLASS

ApogeeA N N U A L R E P O R T 2 0 0 2
ADDING VALUE TO GLASS

Year Ended Year EndedMarch 2, March 3, Percent
(In thousands, except per share data and percentages) 2002 2001 Change
OPERATING RESULTSNet sales . . . . . . . . . . . . . . . . . . . . . . . . . . . $ 802,315 $ 865,200 – 7%Operating income . . . . . . . . . . . . . . . . . . . . . 44,127 31,894 38%Earnings from continuing operations . . . . . . . . 26,142 13,361 96%Earnings from discontinued operations . . . . . . — 1,641 – 100%Net earnings . . . . . . . . . . . . . . . . . . . . . . . . 26,142 15,002 74%Earnings per share — diluted
From continuing operations . . . . . . . . . . . 0.91 0.48 90%From discontinued operations . . . . . . . . . . — 0.06 – 100%Net earnings . . . . . . . . . . . . . . . . . . . . . . 0.91 0.54 69%
BALANCE SHEET DATAWorking capital . . . . . . . . . . . . . . . . . . . . . . . 47,845 37,754 27%Total assets . . . . . . . . . . . . . . . . . . . . . . . . . 409,116 432,679 – 5%Total long-term debt . . . . . . . . . . . . . . . . . . . 69,098 104,206 – 34%Shareholders’ equity . . . . . . . . . . . . . . . . . . . 170,934 148,292 15%Invested capital* . . . . . . . . . . . . . . . . . . . . . 265,899 276,964 – 4%
CASH FLOW DATADepreciation and amortization . . . . . . . . . . . . 27,034 34,229 – 21%EBITDA** . . . . . . . . . . . . . . . . . . . . . . . . . . 71,161 66,123 8%Net cash flow provided by operating activities . . 53,284 62,069 – 14%Capital expenditures . . . . . . . . . . . . . . . . . . . 10,466 14,823 – 29%Free cash flow*** . . . . . . . . . . . . . . . . . . . . . 42,818 47,246 – 9%
FINANCIAL RATIOSGross margin . . . . . . . . . . . . . . . . . . . . . . . . 23.4% 20.7%Operating margin . . . . . . . . . . . . . . . . . . . . . 5.5% 3.7%Return on average shareholders’ equity . . . . . . 16.4% 10.5%Return on average invested capital . . . . . . . . . 9.6% 5.0%Long-term debt to total capital . . . . . . . . . . . . 28.8% 41.3%
OTHER DATADividends paid per share . . . . . . . . . . . . . . . . 0.215 0.21 2%Book value per share . . . . . . . . . . . . . . . . . . . 6.03 5.33 13%Average shares outstanding — diluted . . . . . . . 28,817 27,898 3%Number of shareholders . . . . . . . . . . . . . . . . 8.3 10.2 – 19%Number of employees . . . . . . . . . . . . . . . . . . 5.3 5.9 – 10%
* Long-term debt + other long-term liabilities + shareholders’ equity** Earnings before interest, taxes, depreciation and amortization*** Net cash flow provided by operating activities – capital expenditures
FINANCIAL HIGHLIGHTSCORPORATE OVERVIEW
Apogee Enterprises is a world leader intechnologies involving the design and develop-ment of value-added glass products, servicesand systems. Apogee’s businesses maintainindustry leadership through quality, service andinnovation, and are committed to providingsuperior value to shareholders, customers,employees, business partners and the community.The company is organized in three segments:
Architectural products and servicesbusinesses design, engineer, fabricate,install, service and renovate the walls of glassand windows comprising the outside skin of commercial and institutional buildings.
Automotive replacement glass and servicesbusinesses fabricate, repair and replaceautomobile windshields and windows.
Large-scale optical technologies businessesdevelop and produce high technology glass that enhances the visual performanceof products for the display, imaging andpicture framing industries.
Apogee’s Vision. Set new standards for value-added glass products and services in our markets.
SEGMENT REVENUES(In millions)
FY98 FY99 FY00 FY01 FY02
$3
21
.8$
34
7.2
$6
3.7
$3
50
.0$
38
0.5
$5
8.7
$3
94
.1$
37
7.5
$6
9.9
$4
41
.5$
33
3.3
$9
0.8
$4
79
.4$
25
5.1
$6
7.8
SEGMENT OPERATING INCOME(In millions)
FY98 FY99 FY00 FY01 FY02
$2
6.8
$1
3.5
$6
.5
$2
3.5
$1
8.4
$2
.5
$2
0.5
$0
.2–
$0
.5
$2
7.4
$1
.4 $4
.6
$3
4.4
$1
6.1
– $
4.4
REVENUES(In millions)
FY98 FY99 FY00 FY01 FY02
$8
02
.3
$8
65
.2
$8
40
.5
$7
88
.1
$7
31
.1
EPS(From continuing operations, diluted)
FY98 FY99 FY00 FY01 FY02
$0
.91
$0
.48
$0
.11
$0
.73
$0
.85
Cover Photo: The Pinnacle, Atlanta, GA – Viracon
2Aesthetics and energy-efficiency of architecturalglass, and strengths in security glazing andrenovation add value for customers.
6Chairman Russ Hufferhighlights earnings andoperational achieve-ments, and strategiesfor continued growth in shareholder value.
8Opportunities andchallenges faced bysegments, from largest— architectural, tosmallest — large-scaleoptical, and toughestindustry — automotive.
14Management’sDiscussion and Analysis,an in-depth review ofApogee’s performance.
20Consolidated FinancialStatementsNotes to Financial Statements 24Management’s Report 31Report of Independent Public Accountants 31Eleven Years in Review 32Directors and Officers 34Apogee Businesses 34Investor Information 35
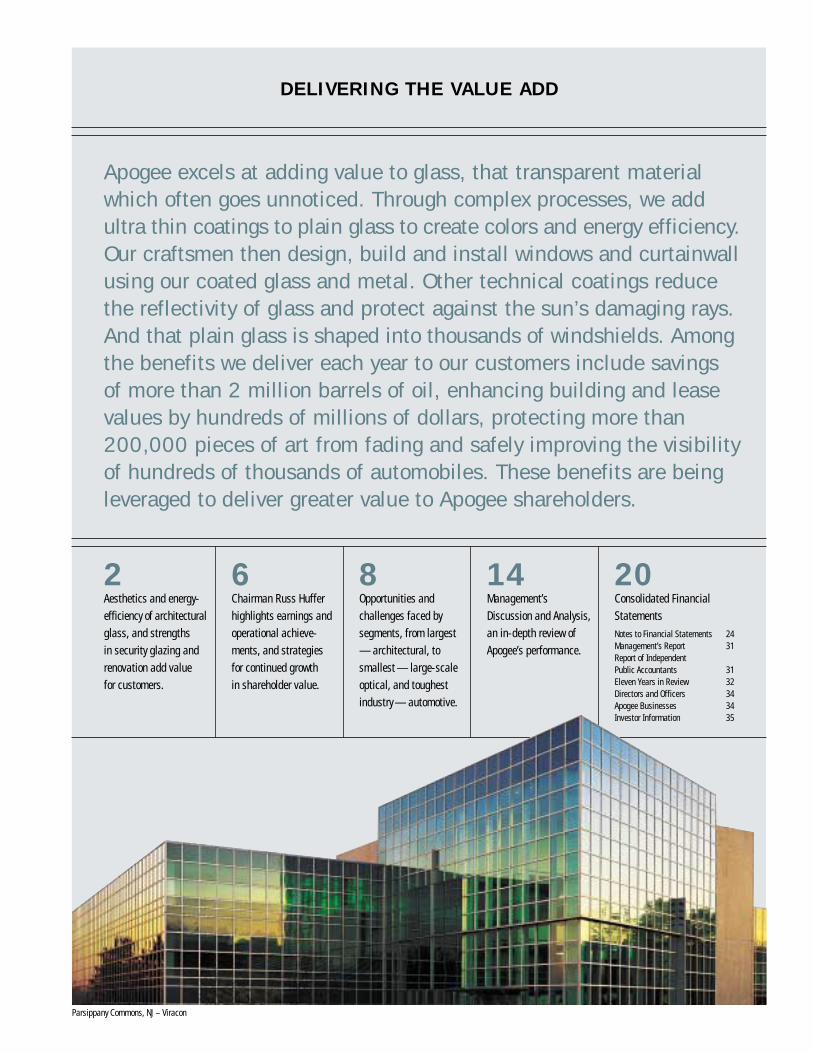
Apogee excels at adding value to glass, that transparent materialwhich often goes unnoticed. Through complex processes, we addultra thin coatings to plain glass to create colors and energy efficiency.Our craftsmen then design, build and install windows and curtainwallusing our coated glass and metal. Other technical coatings reducethe reflectivity of glass and protect against the sun’s damaging rays.And that plain glass is shaped into thousands of windshields. Amongthe benefits we deliver each year to our customers include savingsof more than 2 million barrels of oil, enhancing building and leasevalues by hundreds of millions of dollars, protecting more than200,000 pieces of art from fading and safely improving the visibilityof hundreds of thousands of automobiles. These benefits are beingleveraged to deliver greater value to Apogee shareholders.
DELIVERING THE VALUE ADD
Parsippany Commons, NJ – Viracon
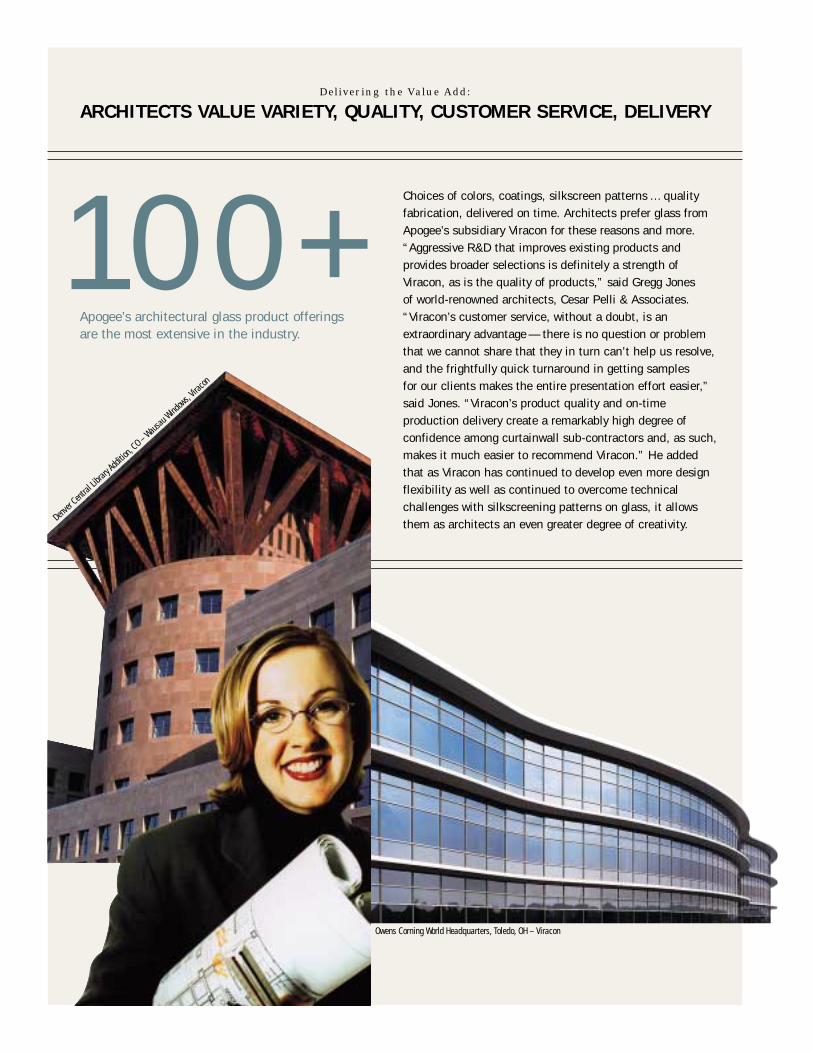
Choices of colors, coatings, silkscreen patterns … qualityfabrication, delivered on time. Architects prefer glass fromApogee’s subsidiary Viracon for these reasons and more.“Aggressive R&D that improves existing products andprovides broader selections is definitely a strength ofViracon, as is the quality of products,” said Gregg Jones of world-renowned architects, Cesar Pelli & Associates.“Viracon’s customer service, without a doubt, is anextraordinary advantage — there is no question or problemthat we cannot share that they in turn can’t help us resolve,and the frightfully quick turnaround in getting samples for our clients makes the entire presentation effort easier,”said Jones. “Viracon’s product quality and on-timeproduction delivery create a remarkably high degree ofconfidence among curtainwall sub-contractors and, as such,makes it much easier to recommend Viracon.” He addedthat as Viracon has continued to develop even more designflexibility as well as continued to overcome technicalchallenges with silkscreening patterns on glass, it allowsthem as architects an even greater degree of creativity.
100+Apogee’s architectural glass product offerings are the most extensive in the industry.
Delivering the Value Add:
ARCHITECTS VALUE VARIETY, QUALITY, CUSTOMER SERVICE, DELIVERY
Owens Corning World Headquarters, Toledo, OH – Viracon
Denver
Central
Librar
y Add
ition,
CO – Wausau
Window
s, Vira
con
3Apogee Enterprises, Inc.
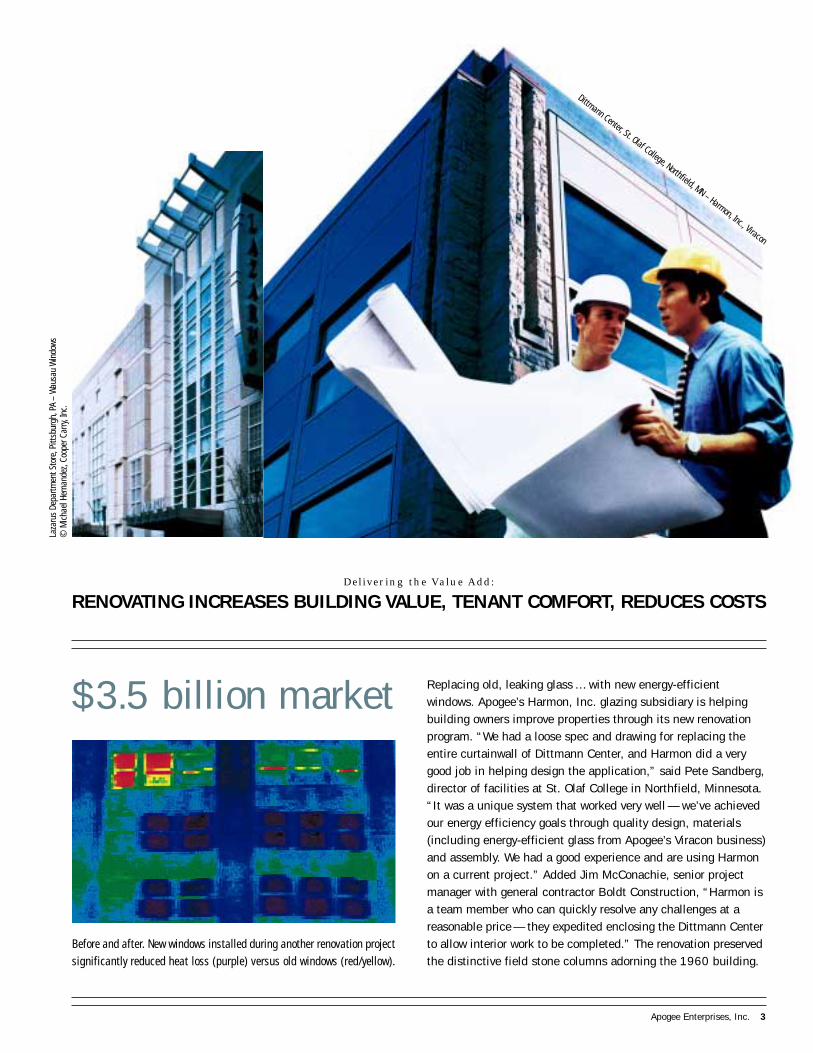
$3.5 billion market Replacing old, leaking glass … with new energy-efficientwindows. Apogee’s Harmon, Inc. glazing subsidiary is helpingbuilding owners improve properties through its new renovationprogram. “We had a loose spec and drawing for replacing theentire curtainwall of Dittmann Center, and Harmon did a verygood job in helping design the application,” said Pete Sandberg,director of facilities at St. Olaf College in Northfield, Minnesota.“It was a unique system that worked very well — we’ve achievedour energy efficiency goals through quality design, materials(including energy-efficient glass from Apogee’s Viracon business)and assembly. We had a good experience and are using Harmonon a current project.” Added Jim McConachie, senior projectmanager with general contractor Boldt Construction, “Harmon isa team member who can quickly resolve any challenges at areasonable price — they expedited enclosing the Dittmann Centerto allow interior work to be completed.” The renovation preservedthe distinctive field stone columns adorning the 1960 building.
Before and after. New windows installed during another renovation projectsignificantly reduced heat loss (purple) versus old windows (red/yellow).
Delivering the Value Add:
RENOVATING INCREASES BUILDING VALUE, TENANT COMFORT, REDUCES COSTS
Laza
rus
Depa
rtmen
t Sto
re, P
ittsb
urgh
, PA
– W
ausa
u W
indo
ws©
Mic
hael
Her
nand
ez, C
oope
r Car
ry, In
c.
Dittmann Center, St. Olaf College, Northfield, MN – Harmon, Inc., Viracon

Saving lives, protecting property … from blasts, hurricanesand more. That’s the goal of protective glazing from Apogeecompanies, and windows incorporating laminated glass from Viracon delivered these benefits on September 11. The section of the Pentagon that was damaged had under-gone blast-resistant renovation that included Viracon glass.“The Pentagon Renovation Office has received numerous e-mails and phone calls from occupants of the officesdirectly above the crash site, all of whom credit the strengthof the glass with saving their lives,” said Brett Eaton of thePentagon press office. Lee Evey, who heads the billion-dollar Pentagon renovation program, said, “… if there hadbeen no structural hardening, I can’t imagine what thedeath and destruction would be.”
9/11Glass from Apogee played a role in saving livesat the Pentagon.
Delivering the Value Add:
SAFEGUARDING PEOPLE WITH PROTECTIVE GLASS
Mt. Sinai/Salick Cancer Center, Miami Beach, FL – Viracon
Pentagon, Washington, D.C. – Viracon
FCCI
, Sar
asot
a, F
L –
Vira
con

Delivering the Value Add:
ENERGY-EFFICIENT WINDOWS REDUCE AIR CONDITIONING COSTS
5Apogee Enterprises, Inc.
2-3 yearsEnergy-efficient glass … lower air conditioning costs, quickpayback, greater comfort for tenants. Apogee businesses WausauWindow and Wall Systems and Viracon together provided anenergy-efficient window system for the dramatic, award-winningFinova Corporate Center in Scottsdale, Arizona. “Wausau wasextremely helpful in looking at the skin area and architecture of the building and refining the tricky corners where the glasssteps up and down,” said Joe Worrall, project manager for DFD Architecture. “They were a pre-bid consultant to us on theproject.” He said they selected Viracon glass based on the “color and aesthetics, and the helpfulness of the sales rep inproviding samples and selecting the right technical product.”The firm’s mechanical engineers conservatively estimatedsavings of $10,000 to $12,000 per year in air conditioningcosts and a two to three-year payback for the energy-efficientglass on a building that will be in use 50 years or more.
Savings from energy-efficient glass produce a quickpayback. High-performance window and wall designs alsoimprove tenant comfort.
Finova Corporate Center, Scottsdale, AZ – Wausau W
indows, Viracon
ADC Corporate World Headquarters, M
inneapolis, MN – Harm
on, Inc., Viracon

Apogee again achieved a strong perform-ance in fiscal year 2002, thanks to solidresults in our architectural segment.
I am especially pleased with these achievements which highlightApogee’s progress:
Earnings per share from continuingoperations up 90 percent to $0.91 per diluted share, comparedwith $0.48 in fiscal year 2001.Long-term debt declined 34 percentto $69.1 million at year-end, versus$104.2 million when we started fiscal year 2002.Project savings of $4.4 million(excluding start up costs) achieved inthe first year of the Six Sigma/Leanbusiness improvement initiative fromtraining the equivalent of 60 full-timeBlack Belt project leaders in the use of tools for simplifying and perfectingour businesses.
Our focus for the past two fiscal years has been on earnings growth, rather thantop-line growth, so it was especiallygratifying to produce these results on asmaller revenue base. Revenues weredown 1 percent compared to last year afterbeing adjusted for the PPG Auto Glass,LLC joint venture formed in July 2000.Reported revenues for fiscal 2002 were$802.3 million, compared to $865.2million the previous year.
DELIVERING PREDICTABLE
PERFORMANCE. We have achievedsignificant earnings growth and morepredictable results as we’ve gained controlof our businesses, the first leg of ourstrategic plan. The second element of our three-part strategy is to strengthenour business platform by optimizingprofitability, followed by positioning ourbusiness portfolio for long-termsustainable growth, the third leg.
In my Air Force flight instructor days,young pilots would ask me “how will Iknow when I’ll make it?” My answer was“when you strap on the airplane versusstrapping in.” Our results are evidence thatApogee has gained control and strappedon its businesses. Architectural segmentoperating income was up 26 percent, autoglass collectively (including the distributionjoint venture) approached previousrecord levels of operating income, our operating margin improved almost 2 percentage points to 5.5 percent, andmanufacturing is operating effectively.
Another example is our renewedbalance sheet strength. We’ve reduced ourdebt to $69.1 million from a high ofalmost $200 million early in fiscal year2000. Our discipline in managing debt,working capital and capital expendituresallowed us to raise our dividend 5 percent(and make a second contribution to theUniversity of Minnesota Cancer Center,
for a total gift of $1 million over severalyears). Through our Six Sigma initiative,we’re creating additional manufacturingcapacity so we won’t need significantcapital short-term to meet growth needsover the next 24 months.
STRENGTHENING OUR BUSINESSES.
Six Sigma is a key element in our effortsto strengthen our business platform byoptimizing profitability, the second leg of our strategy. We have approximately 75 Six Sigma projects completed orunderway, and the two highlighted hereillustrate the kind of bottom-line andcash benefits we are gaining. Tru Vue issaving $350,000 by eliminating anunnecessary manufacturing step that wascausing picture framing glass breakage.Harmon AutoGlass and Wausau Windowand Wall Systems projects are improvinginvoicing processes, for collective savingsof $350,000 from reduced workingcapital and increased revenues.
In addition, use of the Six Sigma toolsis helping us offset the gravity of the downeconomy. The slowdown impacted ourlarge-scale optical segment throughoutthe fiscal year and the architecturalsegment in the fourth quarter, since theconstruction industry traditionally lagsthe general economy. The value-addedarchitectural opportunities describedbelow should also help us weather this
LETTER TO SHAREHOLDERS

Ongoing emphasis on cash flow, withcontinued control of working capitaland capital spending to further reducedebt and better position Apogee totake advantage of opportunities.
Our goal is 10 to 15 percent annualearnings growth, with nominal top linegrowth in the short term as we focus ontaking out costs and improving marginsduring these difficult economic times. We expect a slower start to fiscal year2003 due to the economy, followed by a
stronger second half. Longer-term, ourobjective is 10 percent annual revenuegrowth when our platform for long-termsustainable growth is put in place once the economy recovers.
We’re committed to enhancingshareholder wealth by setting thestandards for value-added glass productsand services in our markets. Thank youfor your ongoing support.
Russell HufferChairman, President and Chief Executive Officer
our value-added architectural glassproducts; protecting more than 200,000pieces of art from fading in sunlight; and safely improving the visibility ofhundreds of thousands of automobiles. As our performance has improved, we’ve enhanced our shareholder valuethrough our increased stock price andgrowing dividend.
But we recognize that we still havesignificant opportunities. These factorswill help us further improve Apogee’sperformance in fiscal year 2003:
Growing opportunities for our archi-tectural products due to new legislation,increased demand for security and blast-resistant glass, the renovation marketwe’re pursuing, and cost-competitive,shorter-lead time window productsthat leverage our existing designs via acomputer configuration system.New markets already being penetratedand new products finding initialsuccess in our large-scale opticalbusinesses position them to improvewhen the economy rebounds.Savings goal of $9 to $12 million from our Six Sigma effort, which hasalready yielded significant productivityimprovements and should offsetinflationary pressures this year.Stable architectural segment backlog,which has held at approximately $190million for five quarters.
slowdown. Economists expect recovery inmid to late calendar 2002, which we’vefactored into our fiscal 2003 outlook.
POSITIONING FOR GROWTH. The thirdpart of our strategy, positioning ourportfolio for long-term growth, involvesdetermining how we can differentiate our products, services, technology andpricing; exploiting synergies betweenbusinesses; scrutinizing businesses andmarkets to determine where our capitaldollars flow; and seeking opportunities.
We’re focused on our largest segment and its strengths in delivering aestheticwindow and wall systems demanded byarchitects and the energy-efficient andhurricane-resistant glass being mandatedin legislation. Our renovation effortsinitiated in fiscal year 2002 also offergreat potential. Our large-scale opticalbusinesses are focused on products thatwill have a competitive edge as theeconomy rebounds, and our efforts in the low-growth auto glass segment centeron making our retail business a morepredictable cash flow generator.
EARNINGS GROWTH AGAIN PRIORITY
IN FY03. Our strength lies in the valuewe’re delivering to our customers eachyear. Annually, we’re helping them save more than 2 million barrels of oilfrom our energy-efficient products;enhancing building and lease values byhundreds of millions of dollars through
7Apogee Enterprises, Inc.
EPS RETURNED TO PREVIOUS LEVELS(From continuing operations, diluted)
LONG-TERM DEBT DECLINED SIGNIFICANTLY(In millions)
FY98 FY99 FY00 FY01 FY02
$0
.91
$0
.48
$0
.11
$0
.73
$0
.85
FY98 FY99 FY00 FY01 FY02
$6
9.1$
10
4.2
$1
64
.4
$1
65
.1
$1
52
.0

Landmark buildings around the world,universities, schools, government buildingsand hospitals, office complexes insuburbia, Las Vegas casinos and airportsall benefit from the value Apogee adds toglass. The company’s architecturalsegment businesses have strong brandssynonymous with high quality, leading-edge products and services.
In fiscal 2002, the segment contributedmore than 75 percent of Apogee’s operatingearnings on 60 percent of the company’srevenues. Earnings were up more than 25 percent from the previous year, thanksto favorable product mix, good costcontrols and operating improvements.The architectural products and servicesunit, which has achieved a five-yearhistorical compounded annual revenuegrowth rate of 11 percent compared togrowth of 5 percent in its target markets,will serve as the foundation for Apogee’srenewed growth strategy moving ahead.
Opportunities for Apogee’s value-added glass products and services areemerging from new legislation mandating
use of hurricane-resistant and energy-efficient glass, demands to better safeguardpeople with blast and bomb-resistantprotective glass, the company’s consultativeapproach to renovating older buildings,and untapped metro markets for glazingservices. To create their visions forbuildings, architects specify Apogee’s glassfor its variety of colors, coatings andsilkscreen patterns unavailable fromcompetitors. They also value its fabricationcapacity and expertise which ensure glassorders are delivered complete and on-time.General and glazing contractors turn toApogee companies for quality windows,curtainwall, installation and repairs.
Delivering these products and servicesare Viracon, which applies high-techcoatings to glass to create colors, reflectivityand energy efficiency; Wausau Window and Wall Systems, which manufactureswindows and curtainwall; Linetec, whichcoats the aluminum used to frame windows;and Harmon, Inc., which installs glass for new construction, renovation and replacements.
SEGMENT AT A GLANCE. Apogee’s
businesses serving the architectural products
and services market design, engineer, fabricate,
install, service and renovate the walls of glass
and windows comprising the outside skin
of commercial and institutional buildings.
Harmon, Inc.: the largest U.S. full-service
building glass installation, maintenance
and renovation company.
Linetec: a high-performance paint and
anodizing finisher.
Viracon: the leading fabricator of coated,
high-performance architectural glass
for global markets.
Wausau Window and Wall Systems:
a manufacturer of engineered aluminum
windows and curtainwall systems.
Business Sector No.1
ARCHITECTURAL PRODUCTS AND SERVICES
Linc
oln
Cine
ma,
Mia
mi,
FL –
Vira
con
© S
teve
n Br
ooke
Stu
dios

9Apogee Enterprises, Inc.
SUCCEEDING IN SLOWDOWN. Despitethe economic slowdown, the segment’sbusiness remained strong until the fourthquarter when the construction industry,which lags the general economy, wasimpacted. Although the architecturalsegment backlog has held at approximately$190 million since the end of fiscal year2001, in the second half of fiscal 2002Apogee saw a shift from shorter to longerlead-time projects, which have lesspredictable schedules. Despite the overallslowdown, some regions served by Apogeeremain strong and it is deploying projectmanagers from slower markets to assist in these thriving metro areas.
Apogee is anticipating a soft landingfor construction due to lower interestrates and office vacancies compared to thelast downturn several years ago. It expectsthat office construction will reboundbeginning later in the year and sustaingrowth. The company expects a slowerfirst half and flat to low single-digitgrowth overall in architectural revenues in fiscal year 2003. The added value ofthe company’s products and savings fromthe Six Sigma business improvementprocess should somewhat offset the impactof the construction slowdown. Six Sigmaoperations and administrative projects areexpected to further improve efficiency,customer service and delivery times.
NEW LAWS DRIVING DEMAND. Newstandard building codes that states arestarting to adopt should lead to greaterdemand for Apogee’s hurricane-resistantand energy-efficient products. Floridaearlier this year became the first state to require hurricane-resistant glass incoastal areas, with several additionalAtlantic and Gulf Coast states consideringsimilar legislation.
California, one of the first states toadopt energy-efficiency codes in the mid-1990s, last year implemented even morestringent commercial building codesaimed at reducing energy consumption,
in part through expanded reliance onenergy-efficient window and curtainwallsystems. They followed Washington andMassachusetts in passing this legislation,which is also being considered in otherstates. Viracon’s comprehensive energy-efficient line, featuring products in a varietyof colors including a new one combiningreflectivity with energy savings, exceedseven the strictest codes so the company iswell positioned to meet growing demand.Wausau and Harmon, Inc. offer windowdesigns incorporating these energy-efficient products.
PROTECTING PEOPLE, ASSETS. Theterrorism of 2001, combined with attackson federal buildings and embassies in past years, is leading to increased interestin security and protective windows andcurtainwall to shield building occupantsagainst dangers. For example, constructionon a new building in mid-town Manhattanwas ceased in late September 2001 andrestarted later in the fall with laminatedprotective glass on the lower nine floorsof the 38-story building for increasedprotection and safety.
Numerous news accounts have pointedto the lives saved at the Pentagon fromimprovements made in the glass andwindow systems. Viracon protective glazinghad been incorporated in the renovatedsection of the Pentagon that was hit by theterrorists last fall and will be included in the reconstruction of that section. The business has also provided products to many other federal building projects in recent years.
SELLING BENEFITS OF RENOVATION.
Although not a new market for Apogeecompanies, renovation as a focus offersgreat promise. If only 5 percent of the 25 billion commercial square feet builtbefore 1985 is renovated annually, itwould equal the new construction markettoday. Apogee’s glazing contractor,Harmon, Inc., demonstrated the
renovation potential through a pilotprogram in the Twin Cities during fiscal2002. It will introduce the renovationinitiative in six additional markets thisyear and company-wide in fiscal year2004, when it expects renovation to benearly a fifth of its business.
Viracon glass often is used forrenovation, including currently for amulti-year project to replace the originalglass in a landmark Chicago building.The new energy-efficient glass matchesthe old to maintain a consistent lookthroughout the process. Wausau’shistorically accurate renovation windowsalso are in demand at universities.
Building owners renovate glazing to address failures, outdated technology(such as single pane, non-energy-efficientglass) and safety concerns. They benefit by improving the value of their buildingsand increasing comfort for tenants.Installation of new energy-efficient glassalso lowers operating costs due to reducedheating and air conditioning bills.
Apogee has been diversifying its glazingofferings to offset the new constructionindustry cycles. Renovation and the existingservice business have higher margins andserve the same building owners andproperty managers. Harmon, Inc. is alsoworking to expand its ongoing maintenanceservices by targeting larger customersranging from financial institutions withmany branches to building campuses.
GROWING EXISTING PRODUCTS,
MARKETS. The segment’s solid line ofsight to growth is also built upon furtherpenetrating existing markets andmaximizing opportunities with existingproducts and services. For the most part,this growth can be achieved with existingcapacity, which today is at approximately70 percent utilization and growingthrough Six Sigma.

Wausau is leveraging its existing designs and engineering knowledge via aconfigure-to-order computer system todeliver quality custom windows faster andmore competitively priced. This productline grew 30 percent in fiscal year 2002through significant sales to schools, andrevenues are expected to increase by morethan 50 percent this year. Currentlyserving 13 U.S. metro areas, Harmon, Inc.plans to enter two new markets in fiscal2003 by following existing customers into new regions.
At only about 7 percent of segmentrevenues today, international markets area growth opportunity for Viracon’sarchitectural glass. It is focused on thethriving markets in South America andthe Far East, including China which willhost the summer Olympics in 2008.Linetec, the paint and anodizing finisher,is working to grow both its architecturaland non-architectural business regionally,based on its state of the art finishing,technical expertise, one-stop shopcapabilities, trucking program, quickturnaround times, flexible customerservice and field service strengths.
New products that expand existingglass, window and curtainwall offeringswill also provide potential during fiscalyear 2003. Viracon will continue topartner with suppliers to incorporate theirtechnologies in new products. As Apogeecontinues to improve its balance sheet, it will evaluate growth opportunities forthis segment. The U.S. constructionindustry is using more coated, energy-efficient glass, and Apogee is exploringhow to serve the emerging market for alower-end more limited line with fewercolors and less complexity.
SEGMENT AT A GLANCE. Apogee’s
businesses serving the large-scale
optical technologies industry develop
and produce high technology glass that
enhances the visual performance of
products for the display, imaging and
picture framing industries. They coat
larger surfaces of glass in high volume,
versus the smaller optical lenses and
filters for eyeglasses, binoculars and
fiber optics produced by small-scale
optical businesses.
Tru Vue: a North American
value-added glass and matboard
manufacturer for the custom framing
and pre-framed art markets.
Viratec Thin Films: a producer of
optical thin film coatings for the
global display and imaging markets.
MARKET OUTLOOK
2002 U.S. NON-RESIDENTIAL CURTAINWALL,ARCHITECTURAL WINDOW, STOREFRONT NEW CONSTRUCTION MARKET ESTIMATED AT $9.32 BILLIONApogee Target Markets* about 54% of Total, 2002 Outlook Varies(Dollars in billions) 2002
Outlook$2.29 Other Commercial – 9%$2.11 Office Buildings* – 3%$1.58 Stores – 6%$1.38 Education* + 5%$1.01 Other Institutional1* – 2%$0.48 Health Care* + 6%$0.46 Manufacturing + 2%
(Sources: Apogee estimates based on F.W. Dodge forecasts)1Includes courthouses, sports arenas and airport terminals, all Apogee targets, as well as churches, detention facilities,post offices, theaters, convention centers and freight terminals
Apogee’s businesses in this segment last year hadrevenues of almost $500 million, for only a 10 percentshare of its $5.0 billion target markets. Even thoughthe businesses are all industry leaders, their shares in this fragmented market are small. Harmon, Inc.’sshare within the small to mid-size constructionprojects market is 2 percent; Wausau’s share of thenon-residential aluminum window and curtainwallniche is 2 percent; and Linetec’s share of architecturalfinishing is 5 percent. F.W. Dodge, a building researchfirm, projects a slight decrease to modest growth in2002 in the sectors served by these companies —office buildings, education, health care and otherinstitutional. In addition, FMI, a construction industryconsulting firm, forecasts a 5 percent increase in another Apogee market, building renovation.Apogee estimates this total market at approximately$1.7 billion in 2002, based on F.W. Dodge data.
Viracon, the largest business in the segment, holdsa 14 percent share of the $1.5 billion North Americanarchitectural glass fabrication market (2002, basedon F.W. Dodge, Ducker Research and Viracon data).Currently 62 percent of this market is comprised ofcoated glass. The coated portion is expected to growto 69 percent by 2004 as the industry continues toshift to higher performing products. The architecturalglass market can be further divided into low, middle,high middle and high-performance glass. Viraconholds a 59 percent share of the combined highperformance (larger, complex projects with coatedglass) and high middle performance (smaller projectswith coated glass and shorter lead times) sectors,which are about 24 percent of the total. Based onmarket research firm data, Viracon expects thearchitectural glass market to grow 2 percent annuallythrough 2004, with the high and high middleperformance sectors growing at a faster rate as thelooks and energy-efficiency of value-added glass areincreasingly incorporated in buildings.

11Apogee Enterprises, Inc.
The U.S. recession pressured the large-scale optical segment throughout fiscal year2002, as the severe downturn in the PCindustry and the slowdown in retail framingmarkets significantly impacted sales andled to an operating loss for the segment.
The segment is expected to rebound in the second half of fiscal year 2003,consistent with anticipated improvementsin consumer spending. Revenue growthfor fiscal year 2003 is expected to be inthe high single digits, and the segmentshould be profitable for the year. Longerterm, it continues to have the highestpotential growth rate of Apogee’s segments.
FRAMING GLASS CONVERSION
CONTINUES. Tru Vue continues toconvert the framing industry to itsproprietary value-added glass, TruGuard,which protects pictures and art fromdeteriorating in sunlight and increasesprofitability for framers. TruGuard salesgrew more than 30 percent in fiscal year2002, a trend that should continue asMichaels Stores, Inc., the nation’s largestart and craft retailer, converts a seconddistribution center to TruGuard early inthe year and, for the second year in a row,we expect more than 1,000 independentframers to convert to the product.
Other fiscal 2003 efforts includeexpansion of sales in Canada through Tru Vue’s largest customer, Larson-Juhl,a focus on operational improvementespecially in the newer pre-framed artbusiness, and streamlining of thematboard line.
NEW PRODUCTS, NEW MARKETS.
Viratec is now focused on diversifying itsmarkets via two products with widerapplications. First-surface mirrors, anexisting product that improves the qualityof projected images, are being sold to thegrowing projection television market andsuch customers as Sony, in addition to thescanner and slowing copier industries.Viratec is having initial success with a newanti-reflective coating on acrylic, whichbrings a new level of technology, qualityand cost competitiveness to worldwidemarkets. Orders have been received forthe product from a TV manufacturer toreduce glare on projection TVs and fromother information display customers.
To remain competitive in the rapidlychanging consumer electronics markets,Viratec has improved its productdevelopment process and operations tobetter respond with quality products thatcan be manufactured cost effectively.
Business Sector No.2
LARGE-SCALE OPTICAL TECHNOLOGIES
MARKET OUTLOOK
NORTH AMERICAN FRAMING GLASS MARKET TOTALS $300 MILLIONTru Vue Leading Fast-Growing Value-Added Glass Segment(Dollars in millions)
$183 Pre-Framed Art$117 Custom Framing
(Sources: Home Accents, Russell Field Papers, AFG, TheBlackstone Group, Edelmann Scott, Inc., The Advanstar Group,Unity Marketing, American Business Info and Tru Vue)
Tru Vue estimates they have a 65 percent share of the sector of this market that has been converted tovalue-added glass. Although these retail markets havebeen impacted by the recession, the glass market isexpected to grow 11 percent annually through 2005.
VIRATEC FOCUSING ON GROWINGPROJECTION TV MARKETViratec has been hit hard by the recession, which has accelerated the replacement of the CRT by flatscreen computer monitors. Viratec estimates itsmarkets will grow about 20 percent annually over thenext five years as declining demand for aftermarketanti-reflective filters for CRTs is more than offset by emerging markets for projection TV and flat screenproducts. Viratec is focused on serving the growingprojection TV market, estimated to increase 12 percentannually through 2006 by Stanford Resources, with first surface mirrors and new anti-reflectiveacrylic shields. These markets, along with the display,imaging and art glass markets that Viratec is alsoworking to grow, total approximately $100 milliontoday, based on data from Stanford Resources,DisplaySearch, Semiconductor Industry Association,DataQuest, IDC, Intel, Business Week, Lyra Research,Cap Ventures, InfoTrends, Ducker, various distributorsand customers, and Viratec.

Apogee has made great strides in bringingmore stability to its auto replacement glass businesses. In fiscal year 2002, these businesses, which include Apogee’sminority share of a joint venture,produced operating income and cash flowthat approached their most successful pastyears. Critical to this progress wereformation of the PPG Auto Glass, LLCjoint venture in fiscal 2001, which alsoyielded a long-term customer for Apogee’swindshield manufacturing unit, andcontinued cost controls in the company’sretail unit.
The automotive replacement glass and services segment, though, remains the company’s most challenging unit—it serves a highly competitive, low-growthindustry. Currently Apogee’s highestpriority in this segment is to continue toimprove the performance and profitabilityof its retail auto replacement glass businessto allow the segment to be a strong cashflow generator for the company.
JV KEY TO SEGMENT IMPROVEMENTS.
Apogee joined with PPG Industries, Inc.in July 2000 to form an automotivereplacement glass distribution jointventure (owned 34 percent by Apogee),which reduced overcapacity in that marketsegment and expanded geographic reach.Although impacted by overall industrysoftness and pricing, and demand pressuresfrom imported windshields, the jointventure had a net positive impact onApogee’s earnings from equity in affiliatesand the automotive segment operatingincome in fiscal 2002. Amendmentsmade to the supply agreements related toPPG Auto Glass during fiscal year 2002permanently adjusted pricing for Apogee’swindshield manufacturing business,resulting in higher income for the segmentbut lower earnings for the joint venture.
The joint venture is important to theconsistency Apogee is starting to achievein auto replacement glass. The company’swindshield manufacturing unit has acontract with PPG that reduces theunpredictability of the highly competitiveand slowed market. Recognizing its
Business Sector No.3
AUTOMOTIVE REPLACEMENT GLASS AND SERVICES
SEGMENT AT A GLANCE. Apogee’s
automotive replacement glass and services
companies fabricate, repair and replace
automobile windshields and windows.
Harmon AutoGlass: a U.S. chain of retail
auto glass replacement and repair shops.
Viracon/Curvlite: a U.S. fabricator
of aftermarket foreign and domestic car
windshields.

13Apogee Enterprises, Inc.
strength in short runs, PPG has calledupon Viracon/Curvlite to produce anincreasing number of smaller volumeparts. The manufacturer’s ability toquickly introduce replacement parts fornew vehicles also should contribute tosustained profitability. Viracon/Curvliteis looking for slight growth from increasedrecreational vehicle and bus windshieldsales, and by marketing its limitedautomobile windshield capacity beyondPPG needs to other customers.
GROWING RETAIL THE PRIORITY.
Improved unit sales by Harmon AutoGlassis also key to the performance of the joint venture, since under the agreementHarmon purchases the majority of itswindshields from PPG Auto Glass and isits largest customer. Harmon’s ability toregain market share, which in part declineddue to strategies to reduce low-marginbusiness, is integral to maintaining thesegment’s revenues in fiscal year 2003compared to the prior year, and toimproved profitability.
Harmon is focused on increasing salesthroughout all its traditional customersegments, ranging from insurancecompanies and agents to automobiledealers, fleet owners and consumers.Numerous national and local marketingprograms are being implemented toheighten awareness of the Harmon brandand its long-standing reputation for safe,secure installations. Proper installationsensure consumers realize the full safetybenefits of their cars’ windshields, whichprovide 20 percent or more of thestructural integrity of vehicles.
As pricing pressures continue, Harmonplans to further increase operationalefficiency, reduce costs and improveservice levels through more precise routingand scheduling of mobile windshieldreplacement services and staffingprocedures that provide the flexibilityrequired for a seasonal business.
MARKET OUTLOOK
U.S. AUTO REPLACEMENT GLASS(WHOLESALE) SALES EXPECTED TOINCREASE 4% ANNUALLY(In billions)
(Source: Frost & Sullivan)
U.S. demand for automobile replacement windshieldsand windows is expected to increase only slightlythrough 2006, with units to increase about 1 percentannually and pricing about 3 percent for a total of 4 percent revenue growth. However, windshield repairs,which are less costly, are expected to grow at aboutthree times the rate of replacements. The currentannual market is approximately 11 million windshieldunits and 3.5 million side and back windows.
Although one of the largest companies in autoreplacement glass retail services, Harmon’s share ofthis fragmented market is only approximately 5 percent.Viracon/Curvlite has approximately 6 percent of theaftermarket windshield manufacturing market.
02 03 04 05 06$
1.3
8
$1
.33
$1
.28
$1
.23
$1
.18

FY 2002: MANAGEMENT’S DISCUSSION AND ANALYSIS
INTRODUCTIONApogee Enterprises, Inc. is a world leader in technologies involving thedesign and development of value-added glass products, services and sys-tems. We are organized in three segments:
The Architectural Products and Services segment (Architectural)designs, engineers, fabricates, installs, services and renovates the wallsof glass and windows comprising the outside skin of commercial andinstitutional buildings. The businesses in this segment include: Viracon,the leading fabricator of coated, high-performance architectural glassfor global markets; Harmon, Inc., the largest U.S. full-service buildingand glass installation, maintenance and renovation company; WausauWindow and Wall Systems, a manufacturer of custom, aluminum win-dows and curtainwall systems; and Linetec, a high-performance paintand anodizing finisher.Large-Scale Optical Technologies segment (LSO) develops and pro-duces high technology glass that enhances the visual performance ofproducts for the display, imaging and picture framing industries. Thebusinesses in this segment include: Tru Vue, a North American value-added glass and matboard manufacturer for the custom framing andpre-framed art markets; and Viratec Thin Films, a producer of opticalthin film coatings for the global display and imaging markets.Automotive Replacement Glass and Services segment (Auto Glass) fab-ricates, repairs and replaces automobile windshields and windows. Thebusinesses in this segment include: Harmon AutoGlass, a U.S. chainof retail auto glass replacement and repair stores; and Viracon/Curvlite,a U.S. fabricator of aftermarket foreign and domestic car windshields.
PERFORMANCEThe relationship between various components of operations, stated as apercent of net sales, is illustrated below for the past three fiscal years.
(Percent of net sales) 2002 2001 2000
Net sales . . . . . . . . . . . . . . . . . . 100.0% 100.0% 100.0%Cost of sales . . . . . . . . . . . . . . . . 76.6 79.3 80.1
Gross profit . . . . . . . . . . . . . . 23.4 20.7 19.9Selling, general and
administrative expenses . . . . . 17.9 17.0 17.6
Operating income . . . . . . . . . 5.5 3.7 2.3Interest expense, net . . . . . . . . . . 0.7 1.3 1.3Equity in (loss) income
of affiliated companies . . . . . . (0.1) 0.2 (0.3)
Earnings from continuing operations before income taxes . . . . . . . . . . 4.7 2.6 0.7
Income taxes . . . . . . . . . . . . . . . 1.4 1.1 0.4
Earnings from continuing operations . . . . . . . . . . . . 3.3 1.5 0.3
Earnings from discontinued operations, net . . . . . . . . . . . 0.0 0.2 1.1
Net earnings . . . . . . . . . . . . . 3.3% 1.7% 1.4%
Fiscal 2002 Compared to Fiscal 2001Consolidated net sales decreased 7% in fiscal 2002 to $802.3 millionfrom $865.2 million in fiscal 2001. Net sales decreased 1% comparedto the prior year, after being adjusted for the July 2000 formation of PPGAuto Glass, LLC (PPG Auto Glass) joint venture. The results of the AutoGlass distribution unit, which we contributed to the joint venture, werenot included in our continuing operations in fiscal 2002, as they werethrough the second quarter of fiscal 2001. The remaining net decrease
is attributable to volume reductions and lower pricing from competitivepressures in the Auto Glass segment and slowdown in the markets servedby the LSO segment. These reductions were partially offset by increasedrevenues in our Architectural segment due to increased volume and moreefficient and effective operations. Additionally, fiscal 2002 comprised of52 weeks versus 53 weeks in fiscal 2001.
On a consolidated basis, cost of sales, as a percentage of net sales,fell to 76.6% for fiscal 2002, improving from 79.3% in fiscal 2001. Theprimary factors were efficiencies gained in our Architectural segment, aswell as cost reductions and sales of higher-margin product mix in that seg-ment. These improvements impacted margin by 3.2%. The net of theformation of the PPG Auto Glass joint venture and pricing amendmentsto the PPG Auto Glass supply agreements made during the second quar-ter of fiscal 2002 increased margins by 0.4%. These increases were offsetby significant margin reductions within the LSO segment.
Selling, general and administrative (SG&A) expenses, as a percentageof sales, increased to 17.9% from 17.0%, but decreased $3.5 million. Keycomponents attributable to the decline in SG&A expenses were reductionsin depreciation, and salaries and related costs in the Auto Glass segmentto reduce its overall cost structure. These declines were partially offset byincreased performance-based incentive expenses and training costs.
Net interest expense decreased to $5.2 million for fiscal 2002 from$11.1 million in fiscal 2001, reflecting significantly lower borrowing levelsand a lower weighted-average interest rate under the revolving credit agree-ment. Also contributing to this decrease were interest components of taxrefunds received during the year.
Our equity in loss from affiliated companies was $1.0 million in fiscal2002 versus equity in income of $1.5 million in the prior year. The amend-ments made to the supply agreements related to the PPG Auto Glass jointventure in the current year second quarter led to lower earnings during theyear for PPG Auto Glass. This decline was somewhat offset by lower costsat the TerraSun joint venture, which was shut down during the third quar-ter of fiscal 2002.
Our effective income tax rate of 31.0% of pre-tax earnings from con-tinuing operations decreased from the 39.9% of pre-tax earnings fromcontinuing operations reported in fiscal 2001. This reduction was due toa decrease in tax reserves as a result of the closure of certain tax periodsand due to the relationship of permanent book and tax differences.
Our fiscal 2002 earnings from continuing operations increased to$26.1 million or $0.91 diluted earnings per share. This compared to earn-ings from continuing operations of $13.4 million, or $0.48 diluted earningsper share, a year earlier. The increase in earnings is largely attributableto the revenue and productivity gains within our Architectural segment, areduced cost structure in the auto glass related businesses, and lowerinterest and taxes, offset by losses in our LSO segment.
We did not report earnings from operations of discontinued businessesin fiscal 2002. In fiscal 2001, we reported earnings from operations ofdiscontinued businesses of $1.6 million after tax, or $0.06 diluted earn-ings per share. Our fiscal 2002 net earnings were $26.1 million, or $0.91diluted earnings per share. This compared to $15.0 million, or $0.54diluted earnings per share, a year ago.
Segment AnalysisArchitectural Products and Services
(In thousands) 2002 2001 2000
Net sales . . . . . . . . . . . . . . . . . . $479,364 $441,466 $394,104Operating income . . . . . . . . . . . . 34,396 27,393 20,513Depreciation and amortization . . . 16,617 16,111 15,693Capital expenditures . . . . . . . . . . 5,078 6,257 23,382Assets . . . . . . . . . . . . . . . . . . . . 225,038 225,668 226,929

15Apogee Enterprises, Inc.
FY 2002: MANAGEMENT’S DISCUSSION AND ANALYSIS
Architectural net sales for fiscal 2002 increased 9% to $479.4 millionfrom $441.5 million in fiscal 2001. The increase is due to an increase inthe number of curtainwall installation projects, due to the new renovationinitiatives and growth at new and mature shops, and improved operationsallowing for more capacity and shipments at our window systems and cur-tainwall manufacturing business.
Operating income for the segment in fiscal 2002 increased 26% to$34.4 million from $27.4 million in the prior year. The resultant operat-ing margins increased to 7.2% for fiscal 2002 from 6.2% in fiscal 2001.The majority of the improvement in operating income was driven by salesmix changes to higher margin products and efficiencies in manufacturingin glass fabricating, partially offset by slightly lower margins in installation.
The segment’s depreciation and amortization and capital expendituresremained flat for the period compared to prior year. Total assets at theend of fiscal 2002 were consistent with those at the end of fiscal 2001.
Large-Scale Optical Technologies
(In thousands) 2002 2001 2000
Net sales . . . . . . . . . . . . . . . . . . $ 67,829 $ 90,768 $ 69,934Operating (loss) income . . . . . . . . (4,350) 4,571 (540)Depreciation and amortization . . . 3,292 5,916 5,354Capital expenditures . . . . . . . . . . 2,229 2,677 17,254Assets . . . . . . . . . . . . . . . . . . . . 53,781 68,489 77,538
LSO net sales of $67.8 million decreased 25% over fiscal 2001. Thedecrease in net sales and resulting operating loss were a direct result ofthe severe downturn in the PC industry and the slowdown in retail framingmarkets, along with the closure of the San Diego facility during the firstquarter of the year. LSO reported an operating loss of $4.4 million for fiscal2002, compared to operating income of $4.6 million for fiscal 2001.
Depreciation and amortization decreased to $3.3 million for fiscal2002 from $5.9 million for the prior year due to sale and leaseback agree-ments entered into on certain production equipment during fiscal 2001.The leases are accounted for as operating leases in accordance with SFASNo. 13, Accounting for Leases. Capital expenditures for fiscal year 2002were $2.2 million compared to $2.7 million in fiscal 2001.
Total assets decreased to $53.8 million at the end of fiscal 2002 from$68.5 million at the end of fiscal 2001. This decrease is attributable tothe sale of assets from the shutdown of the San Diego facility, and an over-all reduction in working capital requirements due to the slowdown.
Automotive Replacement Glass and Services
(In thousands) 2002 2001 2000
Net sales . . . . . . . . . . . . . . . . . . $255,133 $333,311 $377,499Operating income . . . . . . . . . . . . 16,088 1,429 184Depreciation and amortization . . . 6,527 11,873 10,615Capital expenditures . . . . . . . . . . 3,101 5,922 3,918Assets . . . . . . . . . . . . . . . . . . . . 84,508 96,595 123,040
Auto Glass net sales decreased 23% to $255.1 million in fiscal 2002.Segment revenues, which declined 9% compared to fiscal 2001 after beingadjusted for the PPG Auto Glass joint venture, decreased due to reducedretail unit volumes from loss of market share and lower prices as a resultof competitive pricing pressures. Market data indicates that unit demandfor replacement auto glass in the U.S. increased 4% during fiscal 2002.
Auto Glass operating income increased to $16.1 million for fiscal 2002from operating income of $1.4 million in fiscal 2001 due to a combina-tion of improvements in the retail business and changes in PPG Auto Glass
supply agreements. Approximately 70% of the operating income improve-ment resulted from amendments made to the supply agreements relatedto the PPG Auto Glass joint venture, effective beginning the second quar-ter of this year. These amendments permanently adjusted pricing to thejoint venture from our windshield manufacturing business, resulting inhigher income for the segment. The remaining gains were the result of oper-ational improvements and cost reductions implemented late fiscal 2001for retail. At the end of fiscal 2002, Auto Glass had 270 Harmon AutoGlassretail locations and 174 co-branded facilities. The segment continues topursue opportunities to increase utilization and improve efficiencies.
Depreciation and amortization decreased to $6.5 million for fiscal2002 from $11.9 million for the prior year. This is the result of certainsignificant computer hardware and software applications becoming fullydepreciated during fiscal 2001. Capital expenditures for fiscal year 2002were $3.1 million compared to $5.9 million in fiscal 2001.
Total assets decreased to $84.5 million at the end of fiscal 2002 from$96.6 million at the end of fiscal 2001. This decrease is attributable tothe reduction of distribution business assets not included in the contri-bution to the PPG Auto Glass joint venture. We sold certain remainingassets and realized the reduction of working capital assets. In addition,there were reductions in working capital requirements due to the reduc-tions of receivables in the retail business.
Fiscal 2001 Compared to Fiscal 2000Consolidated net sales increased 3% in fiscal 2001 to $865.2 million from$840.5 million in fiscal 2000. The results of the Auto Glass distributionunit, which Apogee contributed to the PPG Auto Glass joint venture, werenot included in Apogee’s continuing operations for the third and fourth quar-ters of fiscal 2001, as they were through the second quarter of fiscal 2001.Fiscal 2001 revenues grew 11% compared to the prior year after beingadjusted for the formation of the joint venture. The majority of the increaseis attributable to increased unit production due to the full-year impact ofplant expansions completed during fiscal 2000, enhanced equipment uti-lization and the impact of fiscal year 2001 acquisitions. Additionally, fiscal2001 comprised of 53 weeks while fiscal 2000 comprised of 52 weeks.
On a consolidated basis, cost of sales, as a percentage of net sales,fell to 79.3% for fiscal 2001, improving from 80.1% in fiscal 2000. Theprimary factors underlying the resulting increase in gross profit percent-age were improved performance attributable to enhanced manufacturingperformance within the Architectural and Large-Scale Optical segments,as well as cost reduction initiatives within the Automotive ReplacementGlass segment. These improvements were partially offset by higher gen-eral liability and health insurance related expenses across all segments.
Selling, general and administrative (SG&A) expenses, as a percentageof sales, decreased to 17.0% from 17.6%. After being adjusted for theformation of the PPG Auto Glass joint venture, SG&A expenses decreased,as a percentage of sales, from 18.5% in fiscal 2000. The primary factorfor the decrease was due to the cost reduction initiatives implemented atthe Automotive Replacement Glass segment, as well as reductions inexpenses related to doubtful accounts across all segments. These wereoffset by increases in amounts expensed for bonuses and incentives.
Net interest expense rose slightly to $11.1 million, or 1.3% of sales,in fiscal 2001. The increase reflected higher weighted-average interestrates under the Company’s revolving credit agreement. This was somewhatoffset by lower average borrowing levels during fiscal 2001 as comparedto fiscal 2000.
Apogee’s equity in income from affiliated companies was $1.5 millionin fiscal 2001 compared to equity in loss from affiliated companies of $2.8million a year ago. Income associated with the Company’s PPG Auto Glassjoint venture, including rationalization and other transaction related adjust-ments, was offset by the Company’s TerraSun research and development
joint venture. The PPG Auto Glass joint venture formed on July 29, 2000,combined the Company’s and PPG Industries, Inc.’s (PPG) U.S. automo-tive replacement glass distribution businesses into a newly formed entity,PPG Auto Glass, with the Company having a 34% ownership interest in thejoint venture. Fiscal 2000 results were largely attributable to TerraSun.
Apogee’s effective income tax rate of 39.9% of pre-tax earnings fromcontinuing operations decreased from the 50.8% of pre-tax earnings fromcontinuing operations reported in fiscal 2000. This reduction is due to therelationship of book and tax differences as a percentage of pre-tax income.
Apogee’s fiscal 2001 earnings from continuing operations increased to$13.4 million or $0.48 diluted earnings per share. This compared to earn-ings from continuing operations of $3.1 million, or $0.11 diluted earningsper share, a year earlier.
The Company reported earnings from operations of discontinued busi-nesses of $1.6 million after tax, or $0.06 diluted earnings per share forfiscal 2001 as compared to $9.1 million after tax, or $ 0.33 diluted earn-ings per share, a year earlier.
Apogee’s fiscal 2001 net earnings were $15.0 million, or $0.54 dilutedearnings per share. This compared to $12.2 million, or $0.44 diluted earn-ings per share, a year ago. The return on average shareholders’ equity was10.5% for fiscal 2001 versus 9.1% for fiscal 2000.
Segment AnalysisArchitectural Products and ServicesArchitectural net sales for fiscal 2001 increased 12% over fiscal 2000.Viracon reported an increase in net sales of 18%, mostly due to theincreased capacity from the full-year impact associated with the comple-tion of the Statesboro facility. Additionally, strong customer demand forViracon’s high-performance architectural glass products significantlyimproved sales volume. Harmon, Inc. reported a 19% increase in netsales, primarily due to an increased number of curtainwall installationprojects and Linetec improved sales by 5%. These increases were offsetby a slowdown in shipments at Wausau Window and Wall Systems due tothe facility not being able to fill its available short lead-time capacityduring the second half of the year.
Operating income for the segment of $27.4 million represented anincrease of 34% over prior year. This was the result of increased produc-tion capacity and improved utilization at Viracon as well as increasedearnings at Harmon, Inc. and Linetec. These increases were partially offsetby reductions in earnings at Wausau Window and Wall Systems.
The Architectural segment backlog, at March 3, 2001, remained at recordlevels of $190.0 million, compared to $153.6 million at February 26, 2000.
Large-Scale Optical TechnologiesLSO net sales of $90.8 million represented a 30% increase over fiscal2000. Tru Vue reported a 25% improvement in sales due to increaseddemand for their high margin, value-added glass products. Additionally, TruVue expanded its pre-framed art business through the acquisitions ofBalangier Fine Art and Designs, and Corporate Art Services, Inc. Theseacquisitions represent 40% of the Tru Vue increase for fiscal 2001 sales.Viratec reported a net sales increase of 37% over fiscal 2000 levels due tostrong operational improvement that allowed for significant volume growth.
LSO operating income of $4.6 million for fiscal 2001 compared favor-ably to an operating loss of $0.5 million for fiscal 2000. The increase wasthe result of the increased sales volume at both of the segment’s opera-tions as well as the impact of sales of higher margin products from Tru Vueand improved equipment utilization at Viratec. These increases were offsetby acquisition related integration costs at Tru Vue and the impact of shut-down costs for Viratec’s San Diego facility. The shutdown of the San Diegofacility will not have a material impact on next year’s financial results.
Automotive Replacement Glass and ServicesAuto Glass net sales decreased 12% to $333.3 million in fiscal 2001.Fiscal 2001 revenues for the segment grew 4% compared to the prior yearafter being adjusted for the formation of the PPG Auto Glass joint venture.Net sales of the auto glass retail unit decreased 2% compared with thoseof a year ago due, in part, to soft demand for auto replacement glass serv-ices. The retail unit volume decrease was offset by unit price increases.Market data indicates that unit demand for replacement auto glass in theU.S. rose 4.2% during fiscal 2001. In an effort to improve margins, HarmonAutoGlass closed retail facilities and implemented strategies to reduce lowmargin business. This resulted in a reduction in volume of 14.9%.
Auto Glass operating income increased to $1.4 million for fiscal 2001from operating income of $0.2 million in fiscal 2000. During fiscal 2001,as part of the Company’s initiative to maintain customer service andreduce costs, Harmon AutoGlass reduced headcount through positioneliminations, closed 37 underperforming stores, or nearly 11% of its retaillocations, and transitioned call center operations to APAC CustomerServices, Inc. Harmon AutoGlass continued to maintain a presence inmost markets where shop closings occurred. Viracon/Curvlite reportedslightly increased operating income over the prior year.
At the end of fiscal 2001, Auto Glass had 287 Harmon AutoGlassretail locations and 167 co-branded facilities. The segment continues toexplore opportunities to increase utilization and improve efficiencies.
Related Party TransactionsAs a result of our 34% interest in PPG Auto Glass, of which PPG has theremaining interest, various contracts and transactions the Company entersinto with PPG Auto Glass are deemed to be “related party” transactions.Under the terms of this multi-year agreement, the Company’s retail autoglass business is committed to purchasing at least 75% of its replace-ment windshield needs from PPG Auto Glass. The terms are negotiatedon an arms length basis. We believe that the amounts paid for such trans-actions represent the amounts that would normally be paid to unrelatedthird parties for similar transactions.
Discontinued OperationsDuring fiscal 2001, the Company completed the sale of substantially all ofthe assets of VIS’N Service Corporation (VIS’N), a non-auto glass focused,third-party administered claims processor, in two separate transactions withno impact to net earnings. In fiscal 2000, the Company completed thesale of 100% of the stock of its large-scale domestic curtainwall business,Harmon, Ltd. The sale of Harmon, Ltd. and the Company’s detention/security business in fiscal 1999, combined with the fiscal 1998 exit frominternational curtainwall operations effectively removed the Company fromthe large-scale construction business. All of the above-mentioned busi-nesses are presented as discontinued operations in the accompanyingfinancial statements and notes. Prior periods have been restated.
At March 2, 2002, accruals totaling $19.7 million represented theremaining estimated future cash outflows associated with the exit from dis-continued operations. The majority of these cash expenditures are expectedto be made within the next two to three years. The primary components ofthe accrual relate to the remaining exit costs from the international cur-tainwall operations of our large-scale construction business, legal costs andother costs associated with the proceedings noted above. The long-termelements within the accrual related to the international curtainwall opera-tions include bonds outstanding of which the precise degree of liabilityrelated to these matters will not be known until they are settled within theU.K. and French courts, and product liability issues, consisting of warrantyand rework issues on these international construction projects.
FY 2002: MANAGEMENT’S DISCUSSION AND ANALYSIS

17Apogee Enterprises, Inc.
Recently Issued Accounting PronouncementsThe Financial Accounting Standards Board (FASB) issued Statement ofFinancial Accounting Standards (SFAS) No. 133 regarding accounting forderivative instruments and hedging activities. SFAS No. 133, as amendedby SFAS No. 137 and No. 138, establishes accounting and reporting stan-dards requiring that derivative instruments (including certain derivativeinstruments embedded in other contracts) be recorded in the balancesheet either as an asset or liability measured at fair value. SFAS No. 133requires changes in the derivative’s fair value to be recognized in earningsor, for derivatives that hedge market risk related to future cash flows, inaccumulated other comprehensive loss/income, unless specific hedgeaccounting criteria are met. The Company adopted SFAS No. 133 onMarch 4, 2001 and determined its derivative instruments, consisting ofinterest rate swap agreements, qualify for hedge accounting treatment.The adoption resulted in the Company recording the fair value of its inter-est rate swap agreements as a liability for $1.8 million with an offsettingadjustment to other comprehensive earnings, net of tax, of $1.1 million.The net present liability associated with these interest rate swap agreementswas $2.5 million at March 2, 2002.
In June 2001, FASB issued SFAS No. 141, Business Combinations,and SFAS No. 142, Goodwill and Other Intangible Assets. SFAS No. 141requires business combinations initiated after June 30, 2001 to beaccounted for using the purchase method of accounting. Under SFAS No.142, amortization of goodwill and indefinite-lived intangible assets willcease and instead the carrying value of these assets will be evaluated forimpairment by applying a fair-value based test on at least an annual basis.We must adopt SFAS No. 142 on March 3, 2002 and we are currentlyevaluating the effects adoption will have on our consolidated financialstatements. Goodwill amortization expense recorded during fiscal 2002was $1.5 million.
In August 2001, FASB issued SFAS No. 144, Accounting for theImpairment or Disposal of Long-Lived Assets. This statement, whichaddresses financial accounting and reporting for the impairment and dis-posal of long-lived assets, will be adopted on March 3, 2002, with noimpact on our financial statements.
LIQUIDITY AND CAPITAL RESOURCES
(In thousands, except percentages) 2002 2001
Cash provided by operations . . . . . . . . . . . . . . . . $ 53,284 $ 62,069Capital expenditures . . . . . . . . . . . . . . . . . . . . . 10,466 14,823Proceeds from dispositions of property . . . . . . . . . 5,598 17,834Payments on long-term debt, net . . . . . . . . . . . . . 38,296 60,703Debt to invested capital . . . . . . . . . . . . . . . . . . . 26.0% 37.6%
Operating ActivitiesCash provided by continuing operating activities of $53.3 million decreasedby $8.8 million compared to last year. This is the result of increasing work-ing capital by $0.6 million versus a reduction of $8.4 million in fiscal2001. Net income plus noncash charges was essentially flat compared tothe prior year.
Investing ActivitiesFiscal 2002 investing activities used cash of $3.2 million as comparedto $1.1 million of cash provided in fiscal 2001 as a result of the receiptof $16.0 million related to a sales and leaseback transaction of operat-ing equipment in the prior year. New capital investment in fiscal 2002totaled $10.5 million, versus $14.8 million and $44.0 million in fiscal2001 and 2000, respectively. The decreases over the past two years arethe result of completing and starting up the significant projects initiatedover the preceding two years.
In fiscal 2003, the Company expects to incur capital expenditures asnecessary to maintain existing facilities and information systems. Fiscal2003 expenditures are expected to be less than $25.0 million.
In fiscal 2002, the Company had proceeds on the sale of certain land,buildings and equipment totaling $5.6 million compared to $17.8 mil-lion in fiscal 2001. Included in the fiscal 2002 and fiscal 2001 amountswere sales and leaseback agreements on miscellaneous equipment total-ing $2.1 million and $16.0 million, respectively. We are not expecting tohave any such agreements for fiscal 2003.
Financing ActivitiesPayments on long-term debt decreased to $38.3 million for fiscal 2002from $60.7 million for fiscal 2001. We continued to focus on debt reduc-tion during fiscal 2002, evidenced by the reduction in our debt to investedcapital percentage, which improved to 26.0% at the end of fiscal 2002from 37.6% at the end of fiscal 2001. Long-term debt, including currentinstallments of $0.6 million, stood at $69.7 million at March 2, 2002compared to $104.5 million at March 3, 2001. The majority of our long-term debt at the end of the year, $60.7 million, consisted of bankborrowings under a syndicated revolving credit facility.
Other Financing ActivitiesFuture Cash Payments Due by Period
(In thousands) 2003 2004 After 2004
Long-term debt . . . . . . . . . . . . . . $ 640 $ 61,240 $ 7,858Operating leases (undiscounted) . . 15,317 11,944 27,804Other obligations . . . . . . . . . . . . . 382 183 25
Total cash obligations . . . . . . . $ 16,339 $ 73,367 $ 35,687
For fiscal 2003, we expect that outstanding borrowings will generallydecline over the course of the year. We believe that current cash on hand,cash generated from operating activities, and the available credit facilityshould be adequate to fund our working capital requirements and plannedcapital expenditures through fiscal 2003. If we are unable to generateenough cash through operations to satisfy our working capital require-ments and planned capital expenditures, we have available funds fromour syndicated revolving credit facility.
On March 2, 2002, we had a total of $125.0 million available underthe syndicated revolving credit facility of which $60.7 million was in use.This facility, which expires in May 2003, permits borrowing at competitiveinterest rates and is available for general corporate purposes. During fiscal2001, we reduced the credit facility from $275.0 million to $200.0 mil-lion. During fiscal 2002, we reduced the credit facility from $200.0 millionto $125.0 million. Our receivables, inventory, equipment and intangiblessecure the credit facility. Based upon our satisfaction of certain financialcovenants during fiscal 2001, we have the right to cause this securityinterest to be released upon our request. At March 2, 2002, we were incompliance with all financial covenants of the credit facility.
In April 2002, we expect to enter into a new, four-year, unsecured, com-mitted credit facility in the amount of $125.0 million. This credit facilitywill require us to maintain a level of net worth and certain financial ratios.These ratios include maintaining an interest coverage ratio (EBITDA dividedby interest expense) of more than 3.0 and a debt to EBITDA ratio of lessthan 3.0. At March 2, 2002, these ratios were 9.8 and 1.0, respectively. Ifwe are not in compliance with these ratios at the end of any quarter, thedebt can be accelerated. Upon establishment of this new credit facility,the parties to the previously existing $125.0 million secured credit facil-ity are expected to agree to terminate the previously existing credit facility.
FY 2002: MANAGEMENT’S DISCUSSION AND ANALYSIS

During fiscal 2002, $2.0 million of variable rate industrial revenuebonds were issued and the resulting proceeds were loaned to us to financea portion of our capital projects in Faribault, MN and McCook, IL. In April2002, an additional $1.0 million of variable rate industrial bonds wereissued and the resulting proceeds were loaned to the Company to financea portion of our capital projects in Wausau, WI.
In fiscal 1999, we entered into an interest rate swap agreement, whichexpires in fiscal 2004, that effectively converted $25.0 million of vari-able rate borrowings into a fixed rate obligation. In fiscal 2000, we enteredinto an interest rate swap agreement, which expires in fiscal 2003, whicheffectively converted $10.0 million of variable rate borrowings into a fixedrate obligation. During fiscal 2002, we extended each of these swapagreements one year and modified the fixed rate obligation.
We experienced a material increase in our risk retention for our third-party product liability coverages effective for fiscal 2003. A materialrework event would have a material adverse effect on our operating results.
From time to time, we acquire the use of certain assets such as ware-houses, automobiles, forklifts, trucks, office equipment and some manu-facturing equipment through operating leases. Many of these operatingleases have termination penalties. However, because the assets are usedin the conduct of our business operations, it is unlikely that any signifi-cant portion of these operating leases would be terminated prior to thenormal expiration of their lease terms. Therefore, we consider the riskrelated to termination penalties to be minimal.
OUTLOOKOverall revenue growth for fiscal 2003 versus fiscal 2002 is anticipated tobe flat to low single digits, with year-on-year growth occurring in thesecond half.
Architectural segment is expected to have flat to low single digit rev-enue growth for the year, with second half growth dependent on animproving construction industry. The segment’s focus on complex,value-added projects results in longer lead times from project approvalto production, creating the temporary softness moving from the fourthquarter of fiscal 2002 into the first quarter of fiscal 2003.LSO segment revenues are expected to grow in the high single digits,driven by the timing of improvements in retail consumer electronics andframing markets and the expected success of new product initiatives.Automotive replacement glass segment revenues are expected to beapproximately flat, as single digit windshield volume growth is slightlyoffset by customer mix and competitive pricing. Volume growth will bedriven by improving industry conditions and retail’s ability to gainmarket share.
Gross margin percentages are expected to improve slightly, with operat-ing efficiencies achieved largely through Six Sigma and other processimprovement initiatives, which should offset increases in wages, health careand insurance costs. At the same time, there is expected to be increasedmargin pressure in the Architectural and Auto Glass segments driven bycompetitive actions in soft markets. Selling, general and administrativeexpenses will grow slightly, as will the amount as a percent of sales, due toinvestments in marketing and information technology initiatives.
Earnings per share are expected to grow, with the year-on-year growthanticipated to begin starting in the third quarter when the improving econ-omy should positively impact Apogee’s value-added architectural and LSObusinesses.
CRITICAL ACCOUNTING POLICIESManagement has evaluated the accounting policies used in the prepara-tion of the accompanying financial statements and related notes andbelieves those policies to be reasonable and appropriate. We believe thatthe most critical accounting policies applied in the presentation of ourfinancial statements relate to accounting for contingencies, under whichwe accrue a loss when it is probable that a liability has been incurred andthe amount can be reasonably estimated. Contingencies, by their nature,relate to uncertainties that require management to exercise judgment bothin assessing the likelihood that a liability has been incurred as well as inestimating the amount of potential loss. The most important contingen-cies impacting our financial statements are as follows:
Collectibility of accounts receivable – We establish allowances fordoubtful accounts for specifically identified, as well as anticipated,doubtful accounts based on credit profiles of our customers, currenteconomic trends, contractual terms and conditions, and historical pay-ment experience. We feel that there is no concentration of credit riskdue to the diversity of our markets, channels of distribution, and thegeographic location of customers.Disputes and claims regarding product liability and warranties –Occasionally, we are subject to claims associated with our productsand services, principally as a result of disputes with our customersinvolving our architectural products. The time period from when aclaim is asserted to when it is resolved either by dismissal, negotia-tion, settlement or litigation can be several years. Additionally, whilewe maintain product liability insurance, the arrangements includesignificant self-retention of risk in the form of policy deductibles. Inaddition, certain claims could be determined to be uninsured. Weaccrue based on our estimates of known claims, as well as anticipatedclaims for possible product warranty and rework costs.Discontinued operations – We accrue for the remaining estimatedfuture cash outflows associated with the exit from discontinued oper-ations. The majority of these cash expenditures are expected to bemade within the next two to three years. The primary components ofthe accrual relate to the remaining exit costs from the internationalcurtainwall operations of our large-scale construction business. Theselong-term accruals include settlement of the outstanding bonds, ofwhich the precise degree of liability related to these matters will notbe known until they are settled within the U.K. and French courts; andproduct liability issues and legal costs may be incurred, as they relateto our warranties and possible rework issues on the international anddomestic construction projects.Self-insurance reserves – We obtain substantial amounts of commercialinsurance for potential losses for general liability, workers’ compen-sation and automobile liability risk. However, an amount of risk isretained on a self-insured basis through a wholly owned insurancesubsidiary. Reserve requirements are established based on actuarialprojections of ultimate losses.Taxes – We estimate our income taxes for each of the jurisdictions inwhich we operate. We include differences between our deferred taxassets and tax liabilities in our consolidated balance sheet. We assessthe likelihood that our deferred tax assets will be recovered from futuretaxable income, and to the extent we believe that recovery is not likely,we establish a valuation allowance. Significant judgment is required indetermining our provisions for income taxes, our deferred tax assetsand liabilities, and our future taxable income for purposes of assessingour ability to utilize any future tax benefit from our deferred tax assets.
FY 2002: MANAGEMENT’S DISCUSSION AND ANALYSIS

19Apogee Enterprises, Inc.
As part of our ongoing financial reporting process, a collaborative effortis undertaken involving Apogee managers with financial responsibility forfinancial reporting, credit, product and project management, quality, legal,and tax and outside advisors such as consultants, engineers, lawyers andactuaries. The results of this effort provides management with the necessaryinformation on which to base their judgments on these contingencies anddevelop the estimates used to prepare the financial statements. We believethat the amounts recorded in the accompanying financial statementsrelated to these contingencies are based on the best estimates and judg-ments of the appropriate Apogee management. However, outcomes coulddiffer from our estimates and could materially adversely affect our futureoperating results, financial position and cash flows.
IMPACT OF INFLATIONOur financial statements are prepared on a historical cost basis, whichdoes not completely account for the effects of inflation. The cost ofuncoated glass, one of our primary raw materials, was slightly higher ascompared to the prior year as our vendors were able to pass on the impactof higher natural gas costs for part of the year. In the case of our glassfabrication unit, we were able to pass a portion of this cost onto our cus-tomers so there was relatively no impact. We expect the cost of glass tobe flat or increase slightly in fiscal 2003. While our construction andsupply contracts are at fixed prices, the material components are usuallybased on firm quotes obtained from suppliers. Labor costs, including taxesand fringe benefits, rose in fiscal 2002 and a moderate increase also canbe anticipated for fiscal 2003. While these and other inflationary andmarket pressures on costs are expected in fiscal 2003, we anticipate thatongoing improvements in manufacturing efficiencies and reductions inoverhead will mitigate the negative effect of inflation and selling priceson fiscal 2003 operating income.
MARKET RISKSOur principal market risk is sensitivity to interest rates, which is the riskthat changes in interest rates will reduce net earnings of the Company. Tomanage our direct risk from changes in market interest rates, managementactively monitors the interest sensitive components of our balance sheet,primarily debt obligations, as well as market interest rates in order to mini-mize the impact of changes in interest rates on net earnings and cash flow.
We use interest swaps to fix a portion of our variable rate borrowingsfrom fluctuations in interest rates. As of March 2, 2002, we had interestswaps covering $35.0 million of variable rate debt. The net present liabil-ity associated with these swaps is $2.5 million at the end of fiscal 2002.
The primary measure of interest rate risk is the simulation of netincome under different interest rate environments. The approach used toquantify interest rate risk is a sensitivity analysis. This approach calcu-lates the impact on net earnings, relative to a base case scenario, of ratesincreasing or decreasing gradually over the next 12 months by 200 basispoints. This change in interest rates affecting our financial instrumentswould result in approximately a $0.1 million impact to net earnings. Asinterest rates increase, net earnings decrease; as interest rates decrease,net earnings increase.
We have a policy of using forward exchange contracts to hedge our netexposures, by currency, related to the foreign currency-denominated mon-etary assets and liabilities, and future firm commitments of our operations.
Forward exchange contracts are also used from time to time to managenear-term foreign currency cash requirements. The primary objective ofthese hedging activities is to maintain an approximately balanced posi-tion in foreign currencies so that exchange gains and losses resulting fromexchange rate changes, net of related tax effects, are minimized.
As of March 2, 2002, we had $2.1 million of forward contracts out-standing. A 10% adverse change in foreign exchange rates would result inexchange losses from these contracts that would, in all material respects,be fully offset by exchange gains on the underlying net monetary exposuresfor which the contracts are designated as hedges.
FORWARD LOOKING STATEMENTSThis discussion contains “forward-looking statements” within the meaningof the Private Securities Litigation Reform Act of 1995. These statementsreflect the Company’s current views with respect to future events andfinancial performance. The words “believe,” “expect,” “anticipate,”“intend,” “estimate,” “forecast,” “project,” “should” and similar expres-sions are intended to identify “forward-looking statements” within themeaning of the Private Securities Litigation Reform Act of 1995. All fore-casts and projections in this document are “forward-looking statements,”and are based on management’s current expectations or beliefs of theCompany’s near-term results, based on current information available per-taining to the Company, including the risk factors noted below.
The Company wishes to caution investors that any forward-looking state-ments made by or on behalf of the Company are subject to uncertaintiesand other factors that could cause actual results to differ materially fromsuch statements. These uncertainties and other risk factors include, butare not limited to, those noted below. There can be no assurances giventhat Harmon AutoGlass will effectively leverage its operational improve-ments to recapture market share and increase sales. There can be noassurances that PPG Auto Glass, Apogee’s automotive replacement glassdistribution joint venture with PPG Industries, will achieve favorable long-term operating results. In addition, there can be no assurances thatApogee’s Architectural segment, which serves high-end markets with value-added products, will not be further impacted by the slowed economy. Therealso can be no assurances that there will not be additional erosion in theLSO segment revenues due to the severe downturn in the PC industry anda slowdown in retail markets.
A number of other factors should be considered in conjunction withthis report’s forward-looking statements, any discussion of operations orresults by the Company or its representatives and any forward-looking dis-cussion, as well as comments contained in press releases, presentationsto securities analysts or investors, or other communications by theCompany. These other factors are set forth in the cautionary statementfiled as Exhibit 99 to the Company’s Annual Report on Form 10-K, andinclude, without limitation, cautionary statements regarding changes ineconomic and market conditions, factors related to competitive pricing,quality, facility utilization, new product introductions, seasonal and cycli-cal conditions and customer dependency. Also included are other risksrelated to financial risk, self-insurance, environmental risk and discon-tinued operations. New factors emerge from time to time and it is notpossible for management to predict all such factors, nor can it assess theimpact of each such factor on the business or the extent to which anyfactor, or a combination of factors, may cause actual results to differ mate-rially from those contained in any forward-looking statements.
FY 2002: MANAGEMENT’S DISCUSSION AND ANALYSIS
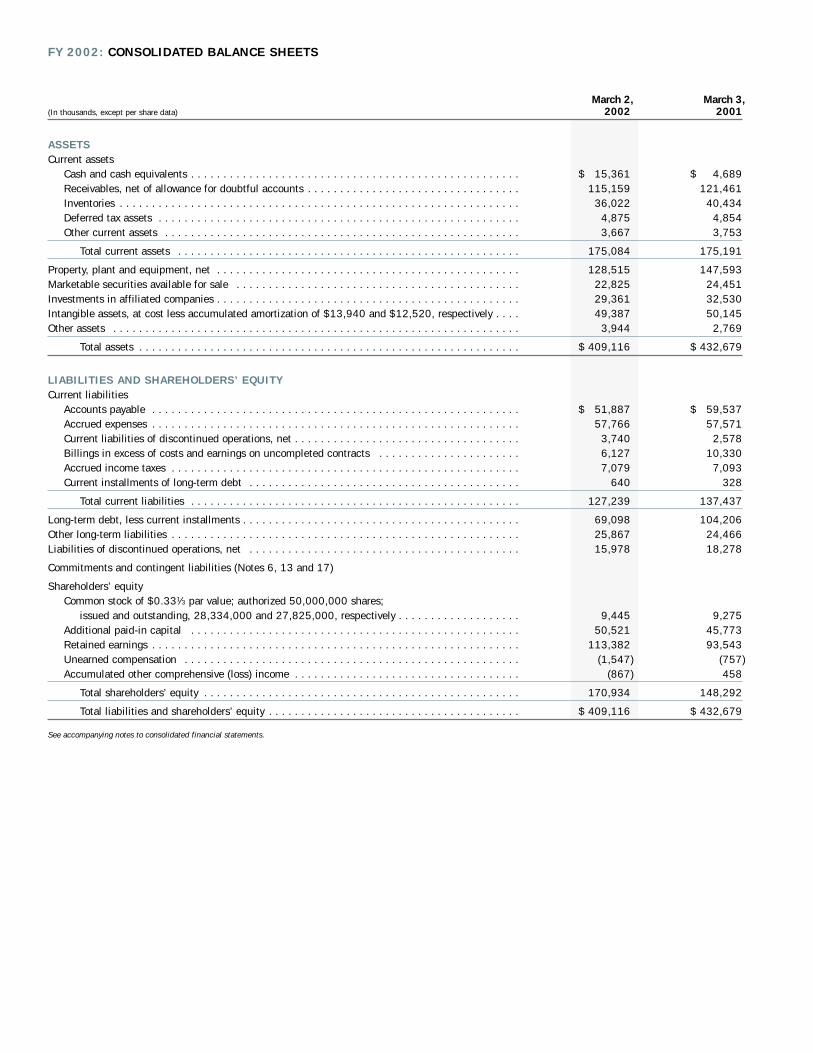
March 2, March 3,(In thousands, except per share data) 2002 2001
ASSETSCurrent assets
Cash and cash equivalents . . . . . . . . . . . . . . . . . . . . . . . . . . . . . . . . . . . . . . . . . . . . . . . . . . . $ 15,361 $ 4,689Receivables, net of allowance for doubtful accounts . . . . . . . . . . . . . . . . . . . . . . . . . . . . . . . . . 115,159 121,461Inventories . . . . . . . . . . . . . . . . . . . . . . . . . . . . . . . . . . . . . . . . . . . . . . . . . . . . . . . . . . . . . . 36,022 40,434Deferred tax assets . . . . . . . . . . . . . . . . . . . . . . . . . . . . . . . . . . . . . . . . . . . . . . . . . . . . . . . . 4,875 4,854Other current assets . . . . . . . . . . . . . . . . . . . . . . . . . . . . . . . . . . . . . . . . . . . . . . . . . . . . . . . 3,667 3,753
Total current assets . . . . . . . . . . . . . . . . . . . . . . . . . . . . . . . . . . . . . . . . . . . . . . . . . . . . . 175,084 175,191
Property, plant and equipment, net . . . . . . . . . . . . . . . . . . . . . . . . . . . . . . . . . . . . . . . . . . . . . . . 128,515 147,593Marketable securities available for sale . . . . . . . . . . . . . . . . . . . . . . . . . . . . . . . . . . . . . . . . . . . . 22,825 24,451Investments in affiliated companies . . . . . . . . . . . . . . . . . . . . . . . . . . . . . . . . . . . . . . . . . . . . . . . 29,361 32,530Intangible assets, at cost less accumulated amortization of $13,940 and $12,520, respectively . . . . 49,387 50,145Other assets . . . . . . . . . . . . . . . . . . . . . . . . . . . . . . . . . . . . . . . . . . . . . . . . . . . . . . . . . . . . . . . 3,944 2,769
Total assets . . . . . . . . . . . . . . . . . . . . . . . . . . . . . . . . . . . . . . . . . . . . . . . . . . . . . . . . . . . $ 409,116 $ 432,679
LIABILITIES AND SHAREHOLDERS’ EQUITYCurrent liabilities
Accounts payable . . . . . . . . . . . . . . . . . . . . . . . . . . . . . . . . . . . . . . . . . . . . . . . . . . . . . . . . . $ 51,887 $ 59,537Accrued expenses . . . . . . . . . . . . . . . . . . . . . . . . . . . . . . . . . . . . . . . . . . . . . . . . . . . . . . . . . 57,766 57,571Current liabilities of discontinued operations, net . . . . . . . . . . . . . . . . . . . . . . . . . . . . . . . . . . . 3,740 2,578Billings in excess of costs and earnings on uncompleted contracts . . . . . . . . . . . . . . . . . . . . . . 6,127 10,330Accrued income taxes . . . . . . . . . . . . . . . . . . . . . . . . . . . . . . . . . . . . . . . . . . . . . . . . . . . . . . 7,079 7,093Current installments of long-term debt . . . . . . . . . . . . . . . . . . . . . . . . . . . . . . . . . . . . . . . . . . 640 328
Total current liabilities . . . . . . . . . . . . . . . . . . . . . . . . . . . . . . . . . . . . . . . . . . . . . . . . . . . 127,239 137,437
Long-term debt, less current installments . . . . . . . . . . . . . . . . . . . . . . . . . . . . . . . . . . . . . . . . . . . 69,098 104,206Other long-term liabilities . . . . . . . . . . . . . . . . . . . . . . . . . . . . . . . . . . . . . . . . . . . . . . . . . . . . . . 25,867 24,466Liabilities of discontinued operations, net . . . . . . . . . . . . . . . . . . . . . . . . . . . . . . . . . . . . . . . . . . 15,978 18,278
Commitments and contingent liabilities (Notes 6, 13 and 17)
Shareholders’ equityCommon stock of $0.331⁄3 par value; authorized 50,000,000 shares;
issued and outstanding, 28,334,000 and 27,825,000, respectively . . . . . . . . . . . . . . . . . . . 9,445 9,275Additional paid-in capital . . . . . . . . . . . . . . . . . . . . . . . . . . . . . . . . . . . . . . . . . . . . . . . . . . . 50,521 45,773Retained earnings . . . . . . . . . . . . . . . . . . . . . . . . . . . . . . . . . . . . . . . . . . . . . . . . . . . . . . . . . 113,382 93,543Unearned compensation . . . . . . . . . . . . . . . . . . . . . . . . . . . . . . . . . . . . . . . . . . . . . . . . . . . . (1,547) (757)Accumulated other comprehensive (loss) income . . . . . . . . . . . . . . . . . . . . . . . . . . . . . . . . . . . (867) 458
Total shareholders’ equity . . . . . . . . . . . . . . . . . . . . . . . . . . . . . . . . . . . . . . . . . . . . . . . . . 170,934 148,292
Total liabilities and shareholders’ equity . . . . . . . . . . . . . . . . . . . . . . . . . . . . . . . . . . . . . . . $ 409,116 $ 432,679
See accompanying notes to consolidated financial statements.
FY 2002: CONSOLIDATED BALANCE SHEETS

21Apogee Enterprises, Inc.
Year-Ended Year-Ended Year-EndedMarch 2, March 3, February 26,
(In thousands, except per share data) 2002 2001 2000
Net sales . . . . . . . . . . . . . . . . . . . . . . . . . . . . . . . . . . . . . . . . . . . . . . . . $ 802,315 $ 865,200 $ 840,488Cost of sales . . . . . . . . . . . . . . . . . . . . . . . . . . . . . . . . . . . . . . . . . . . . . . 614,587 686,203 673,253
Gross profit . . . . . . . . . . . . . . . . . . . . . . . . . . . . . . . . . . . . . . . . . . . . 187,728 178,997 167,235Selling, general and administrative expenses . . . . . . . . . . . . . . . . . . . . . . . 143,601 147,103 147,817
Operating income . . . . . . . . . . . . . . . . . . . . . . . . . . . . . . . . . . . . . . . . 44,127 31,894 19,418Interest expense, net . . . . . . . . . . . . . . . . . . . . . . . . . . . . . . . . . . . . . . . . 5,215 11,122 10,359Equity in (loss) income of affiliated companies . . . . . . . . . . . . . . . . . . . . . . (1,026) 1,465 (2,817)
Earnings from continuing operations before income taxes . . . . . . . . . . . . 37,886 22,237 6,242Income taxes . . . . . . . . . . . . . . . . . . . . . . . . . . . . . . . . . . . . . . . . . . . . . 11,744 8,876 3,171
Earnings from continuing operations . . . . . . . . . . . . . . . . . . . . . . . . . . 26,142 13,361 3,071Earnings from discontinued operations, net of income taxes . . . . . . . . . . . . — 1,641 9,104
Net earnings . . . . . . . . . . . . . . . . . . . . . . . . . . . . . . . . . . . . . . . . . . . $ 26,142 $ 15,002 $ 12,175
Earnings per share — basicContinuing operations . . . . . . . . . . . . . . . . . . . . . . . . . . . . . . . . . . . . . $ 0.94 $ 0.48 $ 0.11Discontinued operations . . . . . . . . . . . . . . . . . . . . . . . . . . . . . . . . . . . — 0.06 0.33
Net earnings . . . . . . . . . . . . . . . . . . . . . . . . . . . . . . . . . . . . . . . . . . . $ 0.94 $ 0.54 $ 0.44
Earnings per share — dilutedContinuing operations . . . . . . . . . . . . . . . . . . . . . . . . . . . . . . . . . . . . . $ 0.91 $ 0.48 $ 0.11Discontinued operations . . . . . . . . . . . . . . . . . . . . . . . . . . . . . . . . . . . — 0.06 0.33
Net earnings . . . . . . . . . . . . . . . . . . . . . . . . . . . . . . . . . . . . . . . . . . . $ 0.91 $ 0.54 $ 0.44
Weighted average basic shares outstanding . . . . . . . . . . . . . . . . . . . . . . . . 27,910 27,675 27,603Weighted average diluted shares outstanding . . . . . . . . . . . . . . . . . . . . . . . 28,817 27,898 27,794
See accompanying notes to consolidated financial statements.
FY 2002: CONSOLIDATED RESULTS OF OPERATIONS

AccumulatedCommon Additional Other
Shares Common Paid-In Retained Unearned Comprehensive Comprehensive(In thousands) Outstanding Stock Capital Earnings Compensation (Loss) Income Earnings
Balance at February 27, 1999 . . . . . . . 27,623 $ 9,208 $ 41,903 $ 80,194 $ (721) $ 80
Net earnings . . . . . . . . . . . . . . . . . — — — 12,175 — — $ 12,175Unrealized loss on marketable
securities, net of $204 tax benefit . . . . . . . . . . . . . . . . — — — — — (382) (382)
Unearned compensation, net . . . . . — — — — (167) —Tax benefit associated
with stock plans . . . . . . . . . . . . — — 803 — — —Common stock issued . . . . . . . . . . 309 103 2,678 — — —Common stock repurchased
and retired . . . . . . . . . . . . . . . . (189) (63) (278) (1,928) — —Cash dividends ($0.21 per share) . . — — — (5,833) — —
Balance at February 26, 2000 . . . . . . . 27,743 $ 9,248 $ 45,106 $ 84,608 $ (888) $ (302) $ 11,793
Net earnings . . . . . . . . . . . . . . . . . — — — 15,002 — — $ 15,002Unrealized gain on marketable
securities, net of $407 tax expense . . . . . . . . . . . . . . . — — — — — 760 760
Unearned compensation, net . . . . . — — — — 131 —Tax benefit associated
with stock plans . . . . . . . . . . . . — — 236 — — —Common stock issued . . . . . . . . . . 118 39 493 — — —Common stock repurchased
and retired . . . . . . . . . . . . . . . . (36) (12) (62) (233) — —Cash dividends ($0.21 per share) . . — — — (5,834) — —
Balance at March 3, 2001 . . . . . . . . . 27,825 $ 9,275 $ 45,773 $ 93,543 $ (757) $ 458 $ 15,762
Net earnings . . . . . . . . . . . . . . . . . — — — 26,142 — — $ 26,142Unrealized gain on marketable
securities, net of $112 tax expense . . . . . . . . . . . . . . . — — — — — 207 207
Initial impact of adoption of SFAS No.133, net of $672 tax benefit . — — — — — (1,109) (1,109)
Unrealized loss on derivatives, net of $257 tax benefit . . . . . . . — — — — — (423) (423)
Unearned compensation, net . . . . . — — — — (790) —Tax benefit associated
with stock plans . . . . . . . . . . . . — — 400 — — —Common stock issued . . . . . . . . . . 542 181 4,396 — — —Common stock repurchased
and retired . . . . . . . . . . . . . . . . (33) (11) (48) (225) — —Cash dividends ($0.215 per share) . . — — — (6,078) — —
Balance at March 2, 2002 . . . . . . . . . 28,334 $ 9,445 $ 50,521 $ 113,382 $ (1,547) $ (867) $ 24,817
See accompanying notes to consolidated financial statements.
FY 2002: CONSOLIDATED STATEMENTS OF SHAREHOLDERS’ EQUITY

23Apogee Enterprises, Inc.
Year-Ended Year-Ended Year-EndedMarch 2, March 3, February 26,
(In thousands) 2002 2001 2000
OPERATING ACTIVITIESNet earnings . . . . . . . . . . . . . . . . . . . . . . . . . . . . . . . . . . . . . . . . . . . . . . $ 26,142 $ 15,002 $ 12,175Adjustments to reconcile net earnings to net cash
provided by operating activities:Net earnings from discontinued operations . . . . . . . . . . . . . . . . . . . . . . — (1,641) (9,104)Depreciation and amortization . . . . . . . . . . . . . . . . . . . . . . . . . . . . . . . 27,034 34,229 33,019Deferred income taxes . . . . . . . . . . . . . . . . . . . . . . . . . . . . . . . . . . . . (515) 4,832 (3,524)Dividends received in excess of (less than) the results
from equity investments . . . . . . . . . . . . . . . . . . . . . . . . . . . . . . . . . 3,437 (4,040) 152(Gain) loss on disposal of assets . . . . . . . . . . . . . . . . . . . . . . . . . . . . . (1,935) 2,102 28Other, net . . . . . . . . . . . . . . . . . . . . . . . . . . . . . . . . . . . . . . . . . . . . . (249) 3,201 316
Changes in operating assets and liabilities, net of effect of acquisitions:Receivables . . . . . . . . . . . . . . . . . . . . . . . . . . . . . . . . . . . . . . . . . 6,302 4,292 (6,828)Inventories . . . . . . . . . . . . . . . . . . . . . . . . . . . . . . . . . . . . . . . . . . 4,539 5,394 637Accounts payable and accrued expenses . . . . . . . . . . . . . . . . . . . . . (6,613) (856) 14,258Billings in excess of costs and earnings on uncompleted contracts . . . (4,203) 503 (1,795)Refundable and accrued income taxes . . . . . . . . . . . . . . . . . . . . . . . (655) (949) 2,209
Net cash provided by operating activities . . . . . . . . . . . . . . . . . . 53,284 62,069 41,543
INVESTING ACTIVITIESCapital expenditures . . . . . . . . . . . . . . . . . . . . . . . . . . . . . . . . . . . . . . . . (10,466) (14,823) (44,025)Proceeds from sales of property, plant and equipment . . . . . . . . . . . . . . . . . 5,598 17,834 14,672Acquisition of businesses, net of cash acquired . . . . . . . . . . . . . . . . . . . . . (247) (3,602) (1,983)Purchases of marketable securities . . . . . . . . . . . . . . . . . . . . . . . . . . . . . . (8,438) (7,900) (17,469)Sales/maturities of marketable securities . . . . . . . . . . . . . . . . . . . . . . . . . . 10,383 9,570 19,169
Net cash (used in) provided by investing activities . . . . . . . . . . . . (3,170) 1,079 (29,636)
FINANCING ACTIVITIESDecrease in net borrowings under revolving credit agreement . . . . . . . . . . . . (35,300) (60,500) (8,200)Proceeds from issuance of long-term debt . . . . . . . . . . . . . . . . . . . . . . . . . 2,000 — 7,650Payments on long-term debt . . . . . . . . . . . . . . . . . . . . . . . . . . . . . . . . . . . (2,996) (203) (1,294)Increase in deferred debt expense . . . . . . . . . . . . . . . . . . . . . . . . . . . . . . . (223) (563) (334)Proceeds from issuance of common stock . . . . . . . . . . . . . . . . . . . . . . . . . 4,577 532 2,781Repurchase and retirement of common stock . . . . . . . . . . . . . . . . . . . . . . . (284) (307) (2,269)Dividends paid . . . . . . . . . . . . . . . . . . . . . . . . . . . . . . . . . . . . . . . . . . . . (6,078) (5,834) (5,833)
Net cash used in financing activities . . . . . . . . . . . . . . . . . . . . . (38,304) (66,875) (7,499)
Cash (used in) provided by discontinued operations . . . . . . . . . . . . . . . . . . (1,138) 1,224 1,466
Increase (decrease) in cash and cash equivalents . . . . . . . . . . . . . . . . . . . . 10,672 (2,503) 5,874Cash and cash equivalents at beginning of year . . . . . . . . . . . . . . . . . . . . . 4,689 7,192 1,318
Cash and cash equivalents at end of year . . . . . . . . . . . . . . . . . . . . . . . . . . $ 15,361 $ 4,689 $ 7,192
Supplemental schedule of non-cash investing activities:Net assets contributed to PPG Auto Glass, LLC (see Note 5) . . . . . . . . . . . . $ — $ 30,359 $ —Net assets acquired through assumption of debt (see Note 12) . . . . . . . . . . 1,500 684 —
See accompanying notes to consolidated financial statements.
FY 2002: CONSOLIDATED STATEMENTS OF CASH FLOWS

one SUMMARY OF SIGNIFICANT ACCOUNTING POLICIES AND RELATED DATA
Basis of Consolidation. The consolidated financial statements include theaccounts of Apogee Enterprises, Inc., a Minnesota corporation, and allmajority-owned subsidiaries (the Company). The equity method is used toaccount for the Company’s joint ventures. Transactions between Apogeeand its subsidiaries have been eliminated in consolidation. Certainamounts from prior-years’ financial statements have been reclassified toconform with this year’s presentation. Apogee’s fiscal year ends on theSaturday closest to February 28. Fiscal year 2002 and 2000 each con-sisted of 52 weeks, while fiscal 2001 consisted of 53 weeks.
Cash and Cash Equivalents. Investments with an original maturity of threemonths or less are included in cash and cash equivalents.
Inventories. Inventories, which consist primarily of purchased glass andaluminum, are valued at the lower of cost or market. Approximately 96%of the inventories are valued by use of the last-in, first-out (LIFO) method,which does not exceed market. If the first-in, first-out (FIFO) method hadbeen used, inventories would have been $3.4 million and $3.1 millionhigher than reported at March 2, 2002, and March 3, 2001, respectively.
Property, Plant and Equipment. Property, plant and equipment are car-ried at cost. Significant improvements and renewals are capitalized.Repairs and maintenance are charged to expense as incurred. Depreciationis computed on a straight-line basis, based on estimated useful lives of20 to 40 years for buildings and 2 to 15 years for equipment.
Intangible Assets and Amortization. Intangible assets consist principallyof the excess of cost over the fair value of net assets acquired (goodwill)and are amortized on a straight-line basis, primarily over 40 years.Amortization expense amounted to $2.3 million, $2.4 million and $2.3million in 2002, 2001 and 2000, respectively.
Long-Lived Assets. The carrying value of long-lived assets such as prop-erty, plant and equipment and intangible assets is reviewed whencircumstances suggest that the assets have been impaired. If this reviewindicates that the long-lived assets will not be recoverable based on theestimated undiscounted cash flows over the remaining amortization period,the carrying value of such assets are reduced to estimated fair value.
Financial Instruments. Unless otherwise noted, the Company’s financialinstruments approximate fair value.
Self-Insurance. The Company obtains substantial amounts of commercialinsurance for potential losses for general liability, workers’ compensationand automobile liability risk. However, a reasonable amount of risk isretained on a self-insured basis through a wholly owned insurance subsidiary,Prism Assurance, Inc. (Prism). Reserve requirements are established basedon actuarial projections of ultimate losses. Losses estimated to be paidwithin 12 months are classified as accrued expenses, while losses expectedto be payable in later periods are included in other long-term liabilities.
Revenue Recognition. The Company recognizes revenue from constructioncontracts on a percentage-of-completion basis, measured by the per-centage of costs incurred to date to estimated total costs for eachcontract. Contract costs include materials, labor and other direct costsrelated to contract performance. Provisions are established for estimatedlosses, if any, on uncompleted contracts in the period in which such lossesare determined. Amounts representing contract change orders, claims orother items are included in sales only when they have been approved bycustomers. Revenue from the sale of products or services provided andthe related cost of sales are recorded upon shipment or as services arerendered. In a small number of instances the Company also recognizesrevenue on a bill and hold basis, in which revenue is recognized at thetime of billing, and the product is shipped at a later date, as agreed uponby the Company and the customer.
Income Taxes. The Company accounts for income taxes as prescribed by Statements of Financial Accounting Standards (SFAS) No. 109,Accounting for Income Taxes, which requires use of the asset and liabilitymethod. This method recognizes deferred tax assets and liabilities basedupon the future tax consequences of temporary differences between finan-cial and tax reporting.
Foreign Currency. The financial statements of foreign operations have beentranslated to U.S. dollars, using the rules of SFAS No. 52, Foreign CurrencyTranslation. Balance sheet accounts are stated in U.S. dollars, generally atthe year-end exchange rate. Results of operations are translated at averageexchange rates for the respective period.
The Company may periodically enter into forward currency exchangecontracts to manage specific foreign currency exposures related to foreignconstruction contracts, receivables and bank borrowings denominated inforeign currencies. As of March 2, 2002, the Company had $2.1 millionin forward contracts maturing in 2003. Gains and losses on forward con-tracts related to receivables are recognized currently, while gains andlosses related to construction projects are deferred and accounted for asa part of the related transaction.
Accounting Estimates. The preparation of the consolidated financial state-ments in conformity with accounting principles generally accepted in theU.S. requires management to make estimates and assumptions that affectthe reported amounts of assets and liabilities and disclosure of contin-gent assets and liabilities at the date of the consolidated financialstatements and the reported amounts of net sales and expenses duringthe reporting period. Amounts subject to significant estimates andassumptions include, but are not limited to, insurance reserves, warrantyreserves, reserves related to discontinued operations, net sales recogni-tion for construction contracts, and the status of outstanding disputes andclaims. Actual results could differ from those estimates.
New Accounting Standards. The Financial Accounting Standards Board(FASB) issued SFAS No. 133 regarding accounting for derivative instru-ments and hedging activities. SFAS No. 133, as amended by SFAS No. 137 and No. 138, establishes accounting and reporting standardsrequiring that derivative instruments (including certain derivative instru-ments embedded in other contracts) be recorded in the balance sheeteither as an asset or liability measured at fair value. SFAS No. 133requires changes in the derivative’s fair value to be recognized in earn-ings or, for derivatives that hedge market risk related to future cash flows,in accumulated other comprehensive loss/income, unless specific hedgeaccounting criteria are met. The Company adopted SFAS No. 133 on
FY 2002: NOTES TO CONSOLIDATED FINANCIAL STATEMENTS

25Apogee Enterprises, Inc.
March 4, 2001 and determined its derivative instruments, consisting ofinterest rate swap agreements, qualify for hedge accounting treatment.The adoption resulted in the Company recording the fair value of its inter-est rate swap agreements as a liability for $1.8 million with an offsettingadjustment to other comprehensive earnings, net of tax, of $1.1 million.The net present liability associated with these interest rate swap agree-ments was $2.5 million at March 2, 2002.
In June 2001, FASB issued SFAS No. 141, Business Combinations,and SFAS No. 142, Goodwill and Other Intangible Assets. SFAS No. 141requires business combinations initiated after June 30, 2001 to beaccounted for using the purchase method of accounting. Under SFAS No. 142, amortization of goodwill and indefinite-lived intangible assetswill cease and instead the carrying value of these assets will be evaluatedfor impairment by applying a fair-value based test on at least an annualbasis. The Company must adopt SFAS No. 142 on March 3, 2002. TheCompany is currently evaluating the effects adoption of SFAS No. 142 willhave on its consolidated financial statements. Goodwill amortizationexpense recorded during fiscal 2002 was $1.5 million.
In August 2001, FASB issued SFAS No. 144, Accounting for theImpairment or Disposal of Long-Lived Assets. This statement addressesfinancial accounting and reporting for the impairment and disposal oflong-lived assets. The Company will adopt this standard on March 3,2002, with no impact to its consolidated financial statements.
two WORKING CAPITAL
(In thousands) 2002 2001
ReceivablesTrade accounts . . . . . . . . . . . . . . . . . . . . . . . . . $ 89,552 $102,171Construction contracts . . . . . . . . . . . . . . . . . . . . 22,817 16,819Contract retainage . . . . . . . . . . . . . . . . . . . . . . . 6,816 6,334Other receivables . . . . . . . . . . . . . . . . . . . . . . . . 1,838 5,079
Total receivables . . . . . . . . . . . . . . . . . . . . . . . . 121,023 130,403Less allowance for doubtful accounts . . . . . . . . . . (5,864) (8,942)
Net receivables . . . . . . . . . . . . . . . . . . . . . . $115,159 $121,461
(In thousands) 2002 2001
InventoriesRaw materials . . . . . . . . . . . . . . . . . . . . . . . . . . $ 16,235 $ 20,124Work-in-process . . . . . . . . . . . . . . . . . . . . . . . . . 5,807 6,259Finished goods . . . . . . . . . . . . . . . . . . . . . . . . . 9,351 12,406Costs and earnings in excess of billings
on uncompleted contracts . . . . . . . . . . . . . . . 4,629 1,645
Total inventories . . . . . . . . . . . . . . . . . . . . . . $ 36,022 $ 40,434
(In thousands) 2002 2001
Accrued ExpensesPayroll and related benefits . . . . . . . . . . . . . . . . $ 23,802 $ 24,077Insurance . . . . . . . . . . . . . . . . . . . . . . . . . . . . . 10,908 9,928Taxes, other than income taxes . . . . . . . . . . . . . . 3,437 3,927Pension . . . . . . . . . . . . . . . . . . . . . . . . . . . . . . 4,160 4,777Interest . . . . . . . . . . . . . . . . . . . . . . . . . . . . . . . 525 1,048Other . . . . . . . . . . . . . . . . . . . . . . . . . . . . . . . . 14,934 13,814
Total accrued expenses . . . . . . . . . . . . . . . . . $ 57,766 $ 57,571
FY 2002: NOTES
three PROPERTY, PLANT AND EQUIPMENT
(In thousands) 2002 2001
Land . . . . . . . . . . . . . . . . . . . . . . . . . . . . . . . . $ 4,185 $ 5,408Buildings and improvements . . . . . . . . . . . . . . . . 88,506 89,787Machinery and equipment . . . . . . . . . . . . . . . . . 129,006 139,290Office equipment and furniture . . . . . . . . . . . . . . 55,463 60,627Construction-in-progress . . . . . . . . . . . . . . . . . . . 4,818 8,656
Total property, plant and equipment . . . . . . . . . . 281,978 303,768Less accumulated depreciation . . . . . . . . . . . . . . (153,463) (156,175)
Net property, plant and equipment . . . . . . . . . $128,515 $147,593
Depreciation expense was $24.7 million, $31.9 million and $30.7 mil-lion in 2002, 2001 and 2000, respectively.
four MARKETABLE SECURITIES
The Company’s wholly owned insurance subsidiary, Prism, that insures aportion of the Company’s workers’ compensation, general liability andautomobile liability risks uses reinsurance agreements to meet statutoryrequirements. The reinsurance carrier requires Prism to maintain fixed matu-rity investments for the purpose of providing collateral for Prism’s obligationsunder the reinsurance agreement. Prism’s fixed maturity investments areclassified as “available for sale” and are carried at market value as pre-scribed by SFAS No. 115, Accounting for Certain Investments in Debt andEquity Securities. Unrealized gains and losses are reported in a separatecomponent of shareholders’ equity, net of income taxes, until the invest-ments are sold. The amortized cost, gross unrealized gains and losses andestimated fair values of investments available for sale at March 2, 2002and March 3, 2001 are as follows:
Gross Gross EstimatedAmortized Unrealized Unrealized Market
(In thousands) Cost Gains Losses Value
March 2, 2002Municipal bonds . . . . $ 21,801 $ 1,028 $ (4) $ 22,825
Total investments . . . . $ 21,801 $ 1,028 $ (4) $ 22,825
March 3, 2001U.S. Treasury Notes . . $ 3,464 $ 82 $ — $ 3,546Municipal bonds . . . . 20,282 675 (52) 20,905
Total investments . . . . $ 23,746 $ 757 $ (52) $ 24,451

The amortized cost and estimated fair values of investments at March 2,2002 by contractual maturity are shown below. Expected maturities maydiffer from contractual maturities as borrowers may have the right to callor prepay obligations with or without call or prepayment penalties.
EstimatedAmortized Market
(In thousands) Cost Value
Due within one year . . . . . . . . . . . . . . . . . . . . . . $ 1,002 $ 1,007Due after one year through five years . . . . . . . . . . 5,159 5,429Due after five years through ten years . . . . . . . . . 6,399 6,723Due after ten years through fifteen years . . . . . . . 4,851 5,141Due beyond fifteen years . . . . . . . . . . . . . . . . . . 4,390 4,525
Total . . . . . . . . . . . . . . . . . . . . . . . . . . . . . . . . . $ 21,801 $ 22,825
Gross realized gains of $0.2 million, $0 and $0 and gross realizedlosses of $0, $0.1 million and $0.5 million were recognized in fiscal2002, 2001 and 2000, respectively, and are included in interest expense,net in the accompanying Consolidated Results of Operations.
five INVESTMENTS
In July 2000, the Company and PPG Industries, Inc. (PPG) combined theirU.S. automotive replacement glass distribution businesses into a jointventure, PPG Auto Glass, LLC (PPG Auto Glass), of which the Companyhas a 34 percent interest. On March 2, 2002, the Company’s investmentin PPG Auto Glass was $29.0 million, of which $7.3 million representsthe unamortized excess of the cost of the investment over the value of theunderlying net tangible assets when the joint venture was formed. In con-nection with the formation of PPG Auto Glass, the Company agreed tosupply the joint venture, through PPG, with most of the Company’s wind-shield fabrication capacity on market-based terms and conditions. Inaddition, the Company’s automobile windshield repair and replacementbusiness agreed to purchase 75% of its windshield needs from PPG AutoGlass on market-based terms and conditions. Purchases from PPG AutoGlass were $44.8 million and $29.0 million for fiscal 2002 and 2001,respectively. Amounts owed to PPG Auto Glass were $5.5 million and$7.3 million at the end of fiscal 2002 and 2001, respectively.
During the second quarter of fiscal 2002, the Company, PPG and PPGAuto Glass amended the windshield supply agreements to permanentlyadjust pricing for the windshields manufactured and sold to more accu-rately reflect current market pricing. As a result of these amendments, aportion of earnings that would have previously been reported in equity inincome from affiliated companies was reported in operating income in theAuto Glass segment for the current year. The impact on fiscal 2002 resultswas an increase to operating income of $8.4 million, with an offset toincome from affiliated companies. Additionally, $1.8 million was recordedas a one-time net increase to operating income as a result of these changes.
In September 2001, the Company decided to discontinue fundingTerraSun, LLC, its research and development joint venture of which theCompany had a 50 percent interest. As a result, TerraSun discontinuedits operations and its tangible assets have been sold, while retaining itsintangible assets.
The Company’s share of earnings for its affiliated companies is beforeincome taxes and includes amortization of the excess cost over the value ofthe underlying net tangible assets and expenses retained by the Company.
six LONG-TERM DEBT
(In thousands) 2002 2001
Borrowings under revolving credit agreement, interest ranging from 3.25% to 5.00% . . . . . . $ 60,700 $ 96,000
Other, interest ranging from 1.49% to 7.00% . . . 9,038 8,534
Total long-term debt . . . . . . . . . . . . . . . . . . . . . . 69,738 104,534Less current installments . . . . . . . . . . . . . . . . . . (640) (328)
Net long-term debt . . . . . . . . . . . . . . . . . . . . $ 69,098 $104,206
Long-term debt maturities are as follows:
(In thousands)
Fiscal Year2003 . . . . . . . . . . . . . . . . . . . . . . . . . . . . . . . . . . . . . . . . . . . $ 6402004 . . . . . . . . . . . . . . . . . . . . . . . . . . . . . . . . . . . . . . . . . . . 61,2402005 . . . . . . . . . . . . . . . . . . . . . . . . . . . . . . . . . . . . . . . . . . . 3082006 . . . . . . . . . . . . . . . . . . . . . . . . . . . . . . . . . . . . . . . . . . . 1502007 . . . . . . . . . . . . . . . . . . . . . . . . . . . . . . . . . . . . . . . . . . . —Thereafter . . . . . . . . . . . . . . . . . . . . . . . . . . . . . . . . . . . . . . . . 7,400
Total . . . . . . . . . . . . . . . . . . . . . . . . . . . . . . . . . . . . . . . . . $ 69,738
The Company maintained a committed, secured credit facility at March 2,2002 and March 3, 2001 totaling $125.0 million and $200.0 million,respectively. The credit facility required the Company to maintain mini-mum levels of net worth and certain financial ratios. The majority of theborrowings under the credit facility are made at a rate equal to three-monthLIBOR (London Interbank Offered Rate) plus an applicable margin. Theapplicable margin is calculated based upon the Company’s financial ratios.At March 3, 2002, the applicable margin was 1.5%. The Company’s receiv-ables, inventory, equipment and intangibles secure the credit facility. Basedupon the Company’s satisfaction of certain financial covenants during fiscal2001, the Company has the right to cause this security interest to bereleased upon its request. At March 2, 2002, the Company was in com-pliance with all of the financial covenants of the credit facility.
Selected information related to bank borrowings is as follows:
(In thousands, except percentages) 2002 2001
Average daily borrowings during the year . . . . . . . $ 83,894 $136,284Maximum borrowings outstanding during the year . 108,800 156,800Weighted average interest rate during the year . . . 6.5% 8.1%
The Company has entered into an interest rate swap agreement thateffectively converts $10.0 million of variable rate borrowings into a fixedrate obligation. This agreement, which was set to expire in 2003, wasextended to 2004. The Company receives payments at variable rates whilemaking payments at a fixed rate of 5.955%. Prior to the extension, thefixed rate was 7.21%. The Company also has entered into an interest rateswap agreement that effectively converts $25.0 million of variable rate bor-rowings into a fixed rate obligation. This agreement, which was set to expirein 2004, was extended to 2005. The Company receives payments at vari-able rates while making payments at a fixed rate of 6.665%. Prior to theextension, the fixed rate was 7.125%. The net interest paid or receivedassociated with these agreements is included in interest expense. The netpresent liability associated with these interest rate swap agreements was$2.5 and $1.8 million at March 2, 2002 and March 3, 2001, respectively.
FY 2002: NOTES

27Apogee Enterprises, Inc.
seven INTEREST, NET
(In thousands) 2002 2001 2000
Interest on debt . . . . . . . . . . . . . $ 6,633 $ 12,610 $ 11,939Other interest expense . . . . . . . . . 667 420 636
Total interest expense . . . . . . . . . 7,300 13,030 12,575Less interest income . . . . . . . . . . (2,085) (1,908) (2,216)
Interest expense, net . . . . . . . $ 5,215 $ 11,122 $ 10,359
Interest payments, including interest expense allocated to discontinuedoperations, were $7.5 million, $12.3 million and $12.5 million in 2002,2001 and 2000, respectively.
eight EMPLOYEE BENEFIT PLANS
The Company maintains a qualified defined contribution pension plan thatcovers substantially all full-time, non-union employees. Contributions tothe plan are based on a percentage of employees’ base earnings. Depositsof the pension costs with the trustee are made annually. All pension costswere fully funded or accrued as of year-end. Contributions to the plan were$4.3 million, $4.7 million and $4.9 million in 2002, 2001 and 2000,respectively.
The Company also maintains a 401(k) savings plan, which allowsemployees to contribute 1% to 13% of their compensation. Apogeematches 30% of the first 6% of the employee contributions. Contributionsto the plan were $1.7 million, $2.0 million and $2.1 million in 2002,2001 and 2000, respectively.
Effective January 1, 2002, the Company froze the qualified definedcontribution pension plan, and amended the 401(k) savings plan to adda contribution that will be made by the Company annually, which is basedon a percentage of employee’s base earnings. In addition, the Companyraised the maximum amount that employees are allowed to contribute tothe plan from 13% to 60%, up to statutory limits. The Apogee match of30% of the first 6% of the employee contributions remains unchanged.On or around July 1, 2002, the assets in the frozen qualified defined con-tribution pension plan are scheduled to be merged into the 401(k) savingsplan resulting in a single 401(k) retirement savings plan.
nine SHAREHOLDERS’ EQUITY AND STOCK OPTION PLANS
A class of 200,000 shares of junior preferred stock with a par value of$1.00 is authorized, but unissued.
The Company has a Shareholders’ Rights Plan, under which each shareof outstanding common stock has an associated preferred share purchaseright. The rights are exercisable only under certain circumstances, includ-ing the acquisition by a person or group of 10% of the outstanding sharesof the Company’s common stock. Upon exercise, the rights would allowholders of such rights to purchase common stock of Apogee or an acquir-ing company at a discounted price, which generally would be 50% of therespective stock’s current fair market value.
The 1997 Stock Option Plan and 1987 Stock Option Plan (the “Plans”)each provide for the issuance of up to 2,500,000 options to purchaseCompany stock. Options awarded under these Plans, either in the form ofincentive stock options or nonstatutory options, are exercisable at anoption price equal to the fair market value at the date of award. The 1987Plan has expired and no new grants of stock options may be made underthis Plan.
The 1987 Partnership Plan, a plan designed to increase the owner-ship of Apogee stock by key employees, allows participants selected bythe Compensation Committee of the Board of Directors to use earnedincentive compensation to purchase Apogee common stock. The pur-chased stock is then matched by an equal award of restricted stock, whichvests over a predetermined period. Common shares of 3,200,000 areauthorized for issuance under the Plan. As of March 2, 2002, 2,786,000shares have been issued or committed under the Plan. The Companyexpensed $2.3 million, $1.8 million and $0.8 million in conjunction withthe Partnership Plan in 2002, 2001 and 2000, respectively.
A summary of option transactions under the Plans for 2002, 2001and 2000 follows:
Options Outstanding
AverageNumber of Exercise
Shares Price Option Price Range
Balances, February 27, 1999 . 1,581,514 $13.27 $ 4.48 – $25.00Options granted . . . . . . . . . . 453,500 11.28 6.75 – 13.44Options exercised . . . . . . . . . (136,704) 6.66 6.50 – 8.69Options canceled . . . . . . . . . (238,875) 14.11 6.50 – 16.75
Balances, February 26, 2000 . 1,659,435 $13.15 $ 4.48 – $25.00Options granted . . . . . . . . . . 728,100 4.80 3.75 – 5.81Options exercised . . . . . . . . . (1,250) 4.19 4.19 – 4.19Options canceled . . . . . . . . . (274,507) 10.28 3.97 – 17.75
Balances, March 3, 2001 . . . 2,111,778 $10.67 $ 3.75 – $25.00Options granted . . . . . . . . . . 560,200 8.83 8.60 – 14.40Options exercised . . . . . . . . . (123,509) 8.15 4.19 – 16.75Options canceled . . . . . . . . . (84,090) 8.43 4.81 – 16.75
Balances, March 2, 2002 . . . 2,464,379 $10.45 $ 3.75 – $25.00
The following table summarizes information about stock options out-standing and exercisable at March 2, 2002:
Options Outstanding Options Exercisable
Weighted- Weighted-Remaining Average Average
Range of Number Contractual Exercise Number ExerciseExercise Prices Outstanding Life Price Exercisable Price
$ 3.75 – $ 5.00 499,957 7.9 years $ 4.68 150,182 $ 4.495.01 – 10.00 714,040 7.9 years 8.20 154,190 7.87
10.01 – 15.00 738,632 6.3 years 12.63 560,132 12.8315.01 – 25.00 511,750 3.9 years 16.10 501,750 16.08
2,464,379 6.6 years $10.45 1,366,254 $12.55
FY 2002: NOTES

ten INCOME TAXES
The components of income tax expense (benefit) related to continuingoperations for each of the last three fiscal years are as follows:
(In thousands) 2002 2001 2000
Current:Federal . . . . . . . . . . . . . . . . . . . . $ 10,752 $ 3,642 $ 6,229State and local . . . . . . . . . . . . . . 1,507 402 466
Total current . . . . . . . . . . . . . 12,259 4,044 6,695
Deferred:Federal . . . . . . . . . . . . . . . . . . . . (692) 4,282 (3,453)State and local . . . . . . . . . . . . . . 177 550 (71)
Total deferred . . . . . . . . . . . . (515) 4,832 (3,524)
Total income tax expense . $ 11,744 $ 8,876 $ 3,171
Income tax payments, net of refunds, were $13.0 million, $4.5 millionand $8.5 million in 2002, 2001 and 2000, respectively.
The differences between statutory federal tax rates and consolidatedeffective tax rates are as follows:
2002 2001 2000
Statutory federal tax rate . . . . . . . 35.0% 35.0% 35.0%State and local income taxes,
net of federal tax benefit . . . . 2.9 2.8 4.1Tax credits . . . . . . . . . . . . . . . . . (1.5) (3.3) (2.0)Foreign sales corporation . . . . . . . (0.5) (0.8) (7.3)Goodwill amortization . . . . . . . . . 1.2 1.8 6.4Meals and entertainment . . . . . . . 0.7 1.3 5.5Tax reserves . . . . . . . . . . . . . . . . (5.9) 4.9 14.4Other, net . . . . . . . . . . . . . . . . . . (0.9) (1.8) (5.3)
Consolidated effective tax rate . . . 31.0% 39.9% 50.8%
Tax benefits for deductions associated with the 1987 Stock Option Planand the 1987 Partnership Plan amounted to $0.4 million, $0.2 millionand $0.8 million in 2002, 2001 and 2000, respectively. These benefitswere added directly to additional paid-in capital and were not reflected inthe determination of income tax expense.
Deferred tax assets and deferred tax liabilities at March 2, 2002 andMarch 3, 2001 are as follows:
2002 2001
(In thousands) Current Noncurrent Current Noncurrent
Accounts receivable . . . . $ 2,297 $ — $ 3,457 $ (183)Accrued insurance . . . . . — 3,031 — 3,205Deferred compensation . 37 5,747 37 6,208Inventory . . . . . . . . . . . 999 — 559 —Depreciation . . . . . . . . . — (2,822) — ( 2,816)Employee benefit plans . (182) — ( 372) —Mark to market of
interest rate swaps . . — 929 — —Other . . . . . . . . . . . . . . 1,724 (3,855) 1,173 ( 4,807)
Deferred tax assets . . . . $ 4,875 $ 3,030 $ 4,854 $ 1,607
In accordance with the disclosure-only provisions of SFAS No. 123,Accounting for Stock-Based Compensation, no compensation cost has beenrecognized with respect to the Plans. Had compensation cost for the Plansbeen determined based on the fair value of the awards, the Company’s netearnings (loss) and earnings (loss) per share would have been reduced tothe pro forma amounts indicated below:
(In thousands, except per share data) 2002 2001 2000
As reported:Net earnings
Continuing operations . . . . . . $ 26,142 $ 13,361 $ 3,071Discontinued operations . . . . . — 1,641 9,104
$ 26,142 $ 15,002 $ 12,175
Earnings per share — dilutedContinuing operations . . . . . . $ 0.91 $ 0.48 $ 0.11Discontinued operations . . . . . — 0.06 0.33
$ 0.91 $ 0.54 $ 0.44
Pro forma:Net earnings (loss)
Continuing operations . . . . . . $ 25,186 $ 10,045 $ (250)Discontinued operations . . . . . — 1,641 9,104
$ 25,186 $ 11,686 $ 8,854
Earnings (loss) per share — dilutedContinuing operations . . . . . . $ 0.87 $ 0.35 $ (0.01)Discontinued operations . . . . . — 0.06 0.32
$ 0.87 $ 0.41 $ 0.32
The above pro forma amounts may not be representative of the effectson reported net earnings (loss) for future years. The weighted average fairvalue per option at the date of grant for options granted in fiscal 2002,fiscal 2001 and fiscal 2000 was $4.23, $1.86 and $4.89, respectively.The fair value of each option grant is estimated on the date of grant usingthe Black-Scholes option-pricing model with the following weighted-aver-age assumptions used for grants in 2002, 2001 and 2000:
2002 2001 2000
Dividend yield . . . . . . . . . . . . . . . 2.4% 4.4% 1.8%Expected volatility . . . . . . . . . . . . 67.3% 60.5% 62.4%Risk-free interest rate . . . . . . . . . 4.4% 7.5% 4.8%Expected lives . . . . . . . . . . . . . . . 4.6 years 3.9 years 3.8 years
FY 2002: NOTES

At March 2, 2002, accruals totaling $19.7 million represented theremaining estimated future cash outflows associated with the exit from dis-continued operations. The majority of these cash expenditures are expectedto be made within the next two to three years. The primary componentsof the accrual relate to the remaining exit costs from the internationalcurtainwall operations of the large-scale construction business. Theselong-term accruals include settlement of the outstanding bonds, of whichthe precise degree of liability related to these matters will not be knownuntil they are settled within the U.K. and French courts; and productliability issues and legal costs may be incurred, as they relate to theCompany’s warranties and possible rework issues on these internationaland domestic construction projects.
twelve ACQUISITIONS
In fiscal 2002 and 2001, the Large-Scale Optical Technologies seg-ment expanded its pre-framed art business by purchasing three high-endpre-framed art companies. The purchase price of these businesses was$6.0 million, including the assumption of $2.2 million in debt, and resultedin recording $4.5 million as goodwill.
In fiscal 2000, the Auto Glass segment purchased the assets of onedistribution center. The purchase price of the acquisition was $2.0 mil-lion, including $0.6 million recorded as goodwill, with no debt assumed.
Unless noted, no liabilities were assumed in the above transactions.All of the above transactions were accounted for by the purchase method.Accordingly, the consolidated financial statements include the net assetsand results of operations from the dates of acquisition.
thirteen LEASES
As of March 2, 2002, the Company was obligated under noncancelableoperating leases for buildings and equipment. Certain leases provide forincreased rentals based upon increases in real estate taxes or operatingcosts. Future minimum rental payments under noncancelable operatingleases are:
(In thousands)
Fiscal Year2003 . . . . . . . . . . . . . . . . . . . . . . . . . . . . . . . . . . . . . . . . . . . $ 15,3172004 . . . . . . . . . . . . . . . . . . . . . . . . . . . . . . . . . . . . . . . . . . . 11,9442005 . . . . . . . . . . . . . . . . . . . . . . . . . . . . . . . . . . . . . . . . . . . 9,6492006 . . . . . . . . . . . . . . . . . . . . . . . . . . . . . . . . . . . . . . . . . . . 6,6752007 . . . . . . . . . . . . . . . . . . . . . . . . . . . . . . . . . . . . . . . . . . . 5,813Thereafter . . . . . . . . . . . . . . . . . . . . . . . . . . . . . . . . . . . . . . . . 5,667
Total minimum payments . . . . . . . . . . . . . . . . . . . . . . . . . . $ 55,065
Total rental expense was $22.9 million, $21.8 million and $23.8 mil-lion in 2002, 2001 and 2000, respectively.
eleven DISCONTINUED OPERATIONS
During fiscal 2001, the Company completed the sale of substantially all ofthe assets of VIS’N Service Corporation (VIS’N), a non-auto glass focused,third-party administered claims processor, in two separate transactions.These transactions effectively removed the Company from the third-partyadministered claims processing business. This business is presented asdiscontinued operations in the consolidated financial statements and notes.
In fiscal 2000, the Company completed the sale of 100% of the stockof its large-scale domestic curtainwall business, Harmon, Ltd. In fiscal1999, the Company executed the sale of its detention/security business.Combined with the fiscal 1998 exit from international curtainwall opera-tions, these transactions effectively removed the Company from thelarge-scale construction business. These businesses are presented as dis-continued operations in the consolidated financial statements and notes.
(In thousands) 2002 2001 2000
Earnings from Operations of Discontinued BusinessesNet sales . . . . . . . . . . . . . . . . . . $ — $ 2,750 $ 28,331Earnings before income taxes* . . . — 2,525 9,821Income tax expense . . . . . . . . . . . — 884 717Earnings from operations,
net of income taxes . . . . . . . . $ — $ 1,641 $ 9,104
* Includes net interest expense allocations (based on the ratio of net operating assets of discon-tinued operations to consolidated net assets) of $0, $0 and $0.1 million for 2002, 2001 and2000, respectively.
The 2000 effective income tax rate of 7.3% on discontinued opera-tions was due to a decrease in the valuation allowance resulting from theutilization of certain tax assets that were previously reserved for.
(In thousands) 2002 2001
Net Liabilities of Discontinued OperationsCurrent assets . . . . . . . . . . . . . . . . . . . . . . . . . . $ — $ 629Accrued liabilities . . . . . . . . . . . . . . . . . . . . . . . (19,718) (21,485)
Net liabilities of discontinued operations . . . . . . . (19,718) (20,856)Less net current liabilities
of discontinued operations . . . . . . . . . . . . . . 3,740 2,578
Net long-term liabilities of discontinued operations . $ (15,978) $ (18,278)
In fiscal 1998, the Company recorded pre-tax charges of $96.1 mil-lion related to the international curtainwall operations. The chargesincluded an amount for the estimated loss on disputed construction con-tracts in Europe, including the accrual of certain penalty amounts, and aprovision for the accrual of legal and related costs associated with the res-olution of legal proceedings related to organizational changes in themajority-owned European curtainwall unit. The charges also includedamounts for severance and termination benefits for employees in France,Asia and the U.S., the write-down of property and equipment and otherlong-term assets to their estimated net salable value, and other items suchas lease termination costs. The charges also reflected the estimated costsassociated with exiting the European operations, including the completionof certain remaining projects and closure of bonds. In March 1998, thefive operating companies comprising the European curtainwall operationsfiled for bankruptcy or commenced liquidation, effectively relinquishingcontrol over those entities.
29Apogee Enterprises, Inc.
FY 2002: NOTES

fifteen BUSINESS SEGMENTS DATA
The Company’s segments are aligned to match the markets they serve inorder to underscore the Company’s growth potential and to reflect its chang-ing business mix and focus. The segments are Architectural Products andServices (Architectural), Large-Scale Optical Technologies (LSO) andAutomotive Replacement Glass and Services (Auto Glass). The Architecturalsegment designs, engineers, fabricates, installs, services and renovates thewalls of glass and windows comprising the outside skin of commercial andinstitutional buildings. The LSO segment develops and produces high tech-nology glass that enhances the visual performance of products for thedisplay, imaging and picture framing industries. The Auto Glass segmentfabricates, repairs and replaces automobile windshields and windows.
(In thousands) 2002 2001 2000
Net SalesArchitectural . . . . . . . . . . . . . . . . $479,364 $441,466 $394,104Large-scale optical . . . . . . . . . . . 67,829 90,768 69,934Auto glass . . . . . . . . . . . . . . . . . 255,133 333,311 377,499Intersegment elimination . . . . . . . (11) (345) (1,049)
Total . . . . . . . . . . . . . . . . . . . $802,315 $865,200 $840,488
Operating IncomeArchitectural . . . . . . . . . . . . . . . . $ 34,396 $ 27,393 $ 20,513Large-scale optical . . . . . . . . . . . (4,350) 4,571 (540)Auto glass . . . . . . . . . . . . . . . . . 16,088 1,429 184Corporate and other . . . . . . . . . . . (2,007) (1,499) (739)
Total . . . . . . . . . . . . . . . . . . . $ 44,127 $ 31,894 $ 19,418
Depreciation and AmortizationArchitectural . . . . . . . . . . . . . . . . $ 16,617 $ 16,111 $ 15,693Large-scale optical . . . . . . . . . . . 3,292 5,916 5,354Auto glass . . . . . . . . . . . . . . . . . 6,527 11,873 10,615Corporate and other . . . . . . . . . . . 598 329 1,357
Total . . . . . . . . . . . . . . . . . . . $ 27,034 $ 34,229 $ 33,019
Capital ExpendituresArchitectural . . . . . . . . . . . . . . . . $ 5,078 $ 6,257 $ 23,382Large-scale optical . . . . . . . . . . . 2,229 2,677 17,254Auto glass . . . . . . . . . . . . . . . . . 3,101 5,922 3,918Corporate and other . . . . . . . . . . . 58 (33) (529)
Total . . . . . . . . . . . . . . . . . . . $ 10,466 $ 14,823 $ 44,025
Identifiable AssetsArchitectural . . . . . . . . . . . . . . . . $225,038 $225,668 $226,929Large-scale optical . . . . . . . . . . . 53,781 68,489 77,538Auto glass . . . . . . . . . . . . . . . . . 84,508 96,595 123,040Corporate and other . . . . . . . . . . . 45,789 41,927 53,647
Total . . . . . . . . . . . . . . . . . . . $409,116 $432,679 $481,154
Apogee’s export net sales are less than 10% of consolidated net sales.No single customer, including government agencies, accounts for 10% ormore of consolidated net sales. Segment operating income is net sales lesscost of sales and operating expenses. Operating income does not includeprovision for interest expense or income taxes. “Corporate and other” includesmiscellaneous corporate activity not allocable to business segments.
During fiscal 2002, 2001 and 2000, the Company entered intoagreements for the sale and leaseback of certain production equipment,which are significant to the operations of the businesses. The sale priceof the equipment was $2.1 million, $16.0 million and $13.4 million,respectively. The Company has a purchase option at projected future fairmarket value under the agreements. The leases are classified as operat-ing leases in accordance with SFAS No. 13, Accounting for Leases.
Under the aforementioned sale-leaseback transactions, a total gain of$9.7 million has been deferred and is being recognized over the terms ofthe leases. The March 2, 2002 and March 3, 2001 unamortized portionof the deferred gain of $7.5 million and $8.7 million, respectively, isincluded in the balance sheet captions accrued expenses and other long-term liabilities. The average annual lease payment over the life of theseleases is $4.8 million.
fourteen QUARTERLY DATA (UNAUDITED)
(In thousands, Quarter
except per share data) First Second Third Fourth
Fiscal 2002Net sales . . . . . . . . . . . . . $203,606 $210,233 $200,293 $188,183Gross profit . . . . . . . . . . . 45,304 51,400 45,811 45,213Earnings from continuing
operations . . . . . . . . . 5,602 10,341 5,844 4,355Earnings from discontinued
operations . . . . . . . . . — — — —Net earnings . . . . . . . . . . 5,602 10,341 5,844 4,355Earnings per share — basic
From continuing operations . . . . . . 0.20 0.37 0.21 0.16
From discontinued operations . . . . . . — — — —
Net earnings . . . . . . . 0.20 0.37 0.21 0.16Earnings per share—diluted
From continuing operations . . . . . . 0.20 0.36 0.20 0.15
From discontinued operations . . . . . . — — — —
Net earnings . . . . . . . 0.20 0.36 0.20 0.15
Fiscal 2001Net sales . . . . . . . . . . . . . $237,253 $236,364 $197,291 $194,292Gross profit . . . . . . . . . . . 47,914 47,056 41,322 42,705Earnings from continuing
operations . . . . . . . . . 2,020 4,200 2,962 4,179Earnings from discontinued
operations . . . . . . . . . — — — 1,641Net earnings . . . . . . . . . . 2,020 4,200 2,962 5,820Earnings per share — basic
From continuing operations . . . . . . 0.07 0.15 0.11 0.15
From discontinued operations . . . . . . — — — 0.06
Net earnings . . . . . . . 0.07 0.15 0.11 0.21Earnings per share—diluted
From continuing operations . . . . . . 0.07 0.15 0.11 0.15
From discontinued operations . . . . . . — — — 0.06
Net earnings . . . . . . . 0.07 0.15 0.11 0.21
FY 2002: NOTES

sixteen EARNINGS PER SHARE
The following table presents a reconciliation of the share amounts usedin the computation of basic and diluted earnings per share:
(In thousands) 2002 2001 2000
Basic earnings per share —Weighted common shares outstanding . . . . . . . . . . . . . . 27,910 27,675 27,603
Weighted common shares assumed upon exercise of stock options . 596 63 48
Unvested shares held in trust for deferred compensation plans . 311 160 143
Diluted earnings per share —Weighted common shares and potential common shares outstanding . . . . . . . . . . . . . . 28,817 27,898 27,794
There were 881,000, 1,498,000 and 1,529,000 stock options excludedin fiscal 2002, 2001 and 2000, respectively, from the computation ofdilutive earnings per share due to their anti-dilutive effect.
seventeen COMMITMENTS AND CONTINGENT LIABILITIES
At March 2, 2002, the Company had ongoing letters of credit relatedto its risk management programs, construction contracts and certainindustrial development bonds. The total value of letters of credit underwhich the Company is obligated as of March 2, 2002 was approximately$14.4 million.
The Company has entered into a number of noncompete agreements,associated with acquisitions and former employees. As of March 2, 2002,future payments of $0.6 million were committed under such agreements.
The Company has been a party to various legal proceedings inciden-tal to its normal operating activities. In particular, like others in theconstruction industry, the Company’s construction businesses are routinelyinvolved in various disputes and claims arising out of construction proj-ects, sometimes involving significant monetary damages or productreplacement. Although it is impossible to predict the outcome of suchproceedings, facts currently available indicate that no such claims willresult in losses that would have a material adverse effect on the financialcondition, results of operations or cash flows of the Company.
31Apogee Enterprises, Inc.
FY 2002: NOTES
MANAGEMENT’S REPORTThe management of Apogee Enterprises, Inc. is responsible for the prepara-tion of the consolidated financial statements included in this Annual Report.
To ensure the reliability of financial data, Apogee has established, andmaintains, an internal control system. We believe the internal controls inuse give reasonable assurance that financial reports do not contain anymaterial misstatement.
We believe that the financial statements and related notes in thisreport are presented fairly in all material respects, and that they were pre-pared according to generally accepted accounting principles.
Russell HufferChairman, President and Chief Executive Officer
Michael B. ClauerExecutive Vice President and Chief Financial Officer
REPORT OF INDEPENDENT PUBLIC ACCOUNTANTSTo: Apogee Enterprises, Inc.:We have audited the accompanying consolidated balance sheets of ApogeeEnterprises, Inc. (a Minnesota corporation) and subsidiaries as of March 2,2002 and March 3, 2001, and the related consolidated results of opera-tions, statements of shareholders’ equity and cash flows for the three yearsended March 2, 2002. These financial statements are the responsibilityof the Company’s management. Our responsibility is to express an opinionon these financial statements based on our audits.
We conducted our audits in accordance with auditing standards gen-erally accepted in the United States. Those standards require that we planand perform the audit to obtain reasonable assurance about whether thefinancial statements are free of material misstatement. An audit includesexamining, on a test basis, evidence supporting the amounts and disclo-sures in the financial statements. An audit also includes assessing theaccounting principles used and significant estimates made by manage-ment, as well as evaluating the overall financial statement presentation.We believe that our audits provide a reasonable basis for our opinion.
In our opinion, the financial statements referred to above present fairly,in all material respects, the financial position of Apogee Enterprises, Inc.and subsidiaries as of March 2, 2002 and March 3, 2001, and the resultsof their operations and their cash flow for the three years ended March 2,2002, in conformity with accounting principles generally accepted in the United States.
ARTHUR ANDERSEN LLPMinneapolis, MinnesotaApril 2, 2002

(In thousands, except per share data and percentages)* 2002 2001 2000 1999 1998
OPERATING RESULTSNet sales . . . . . . . . . . . . . . . . . . . . . . . . . . . . . . . . . . . . . . $ 802,315 $ 865,200 $ 840,488 $ 788,062 $ 731,094Gross profit . . . . . . . . . . . . . . . . . . . . . . . . . . . . . . . . . . . . . 187,728 178,997 167,235 170,415 165,139Operating income . . . . . . . . . . . . . . . . . . . . . . . . . . . . . . . . 44,127 31,894 19,418 43,352 45,659Earnings (loss) from continuing operations . . . . . . . . . . . . . . . 26,142 13,361 3,071 20,245 24,114Earnings (loss) from discontinued operations . . . . . . . . . . . . . — 1,641 9,104 4,988 (75,169)Net earnings (loss) . . . . . . . . . . . . . . . . . . . . . . . . . . . . . . . . 26,142 15,002 12,175 25,233 (51,055)Earnings (loss) per share — basic
From continuing operations . . . . . . . . . . . . . . . . . . . . . . . 0.94 0.48 0.11 0.73 0.87From discontinued operations . . . . . . . . . . . . . . . . . . . . . — 0.06 0.33 0.18 (2.70)Net earnings (loss) . . . . . . . . . . . . . . . . . . . . . . . . . . . . . 0.94 0.54 0.44 0.91 (1.84)
Earnings (loss) per share — dilutedFrom continuing operations . . . . . . . . . . . . . . . . . . . . . . . 0.91 0.48 0.11 0.73 0.85From discontinued operations . . . . . . . . . . . . . . . . . . . . . — 0.06 0.33 0.18 (2.65)Net earnings (loss) . . . . . . . . . . . . . . . . . . . . . . . . . . . . . 0.91 0.54 0.44 0.91 (1.80)
Effective tax rate — % . . . . . . . . . . . . . . . . . . . . . . . . . . . . . 31.0 39.9 50.8 37.6 37.4
OPERATING RATIOSGross margin — % . . . . . . . . . . . . . . . . . . . . . . . . . . . . . . . . 23.4 20.7 19.9 21.6 22.6Operating margin — % . . . . . . . . . . . . . . . . . . . . . . . . . . . . . 5.5 3.7 2.3 5.5 6.2Net margin — continuing operations — % . . . . . . . . . . . . . . . . 3.3 1.5 0.4 2.6 3.3Net margin — % . . . . . . . . . . . . . . . . . . . . . . . . . . . . . . . . . 3.3 1.7 1.4 3.2 (7.0)Return on:
Average shareholders’ equity — % . . . . . . . . . . . . . . . . . . 16.4 10.5 9.1 21.0 (36.2)Average invested capital — % . . . . . . . . . . . . . . . . . . . . . . 9.6 5.0 3.7 8.3 (16.7)Average total assets — % . . . . . . . . . . . . . . . . . . . . . . . . . 6.2 3.3 2.6 5.8 (12.5)
FUNDS FLOW DATADepreciation and amortization . . . . . . . . . . . . . . . . . . . . . . . . $ 27,034 $ 34,229 $ 33,019 $ 25,798 $ 22,463Capital expenditures . . . . . . . . . . . . . . . . . . . . . . . . . . . . . . 10,466 14,823 44,025 77,392 37,892Dividends . . . . . . . . . . . . . . . . . . . . . . . . . . . . . . . . . . . . . . 6,078 5,834 5,833 5,666 5,251
YEAR-END DATATotal assets . . . . . . . . . . . . . . . . . . . . . . . . . . . . . . . . . . . . . $ 409,116 $ 432,679 $ 481,154 $ 466,389 $ 405,526Current assets . . . . . . . . . . . . . . . . . . . . . . . . . . . . . . . . . . . 175,084 175,191 214,422 204,308 206,858Current liabilities . . . . . . . . . . . . . . . . . . . . . . . . . . . . . . . . . 127,239 137,437 135,397 119,796 97,750Working capital . . . . . . . . . . . . . . . . . . . . . . . . . . . . . . . . . . 47,845 37,754 79,025 84,512 109,108
Current ratio . . . . . . . . . . . . . . . . . . . . . . . . . . . . . . . . . . 1.4 1.3 1.6 1.7 2.1Long-term debt . . . . . . . . . . . . . . . . . . . . . . . . . . . . . . . . . . 69,098 104,206 164,371 165,097 151,967
% of invested capital . . . . . . . . . . . . . . . . . . . . . . . . . . . 26.0 37.6 50.2 51.0 53.1Shareholders’ equity . . . . . . . . . . . . . . . . . . . . . . . . . . . . . . 170,934 148,292 137,772 130,664 109,600
% of invested capital . . . . . . . . . . . . . . . . . . . . . . . . . . . 64.3 53.5 42.1 40.4 38.3
INVESTMENT INFORMATIONDividends per share . . . . . . . . . . . . . . . . . . . . . . . . . . . . . . . $ 0.215 $ 0.210 $ 0.210 $ 0.205 $ 0.190Book value per share . . . . . . . . . . . . . . . . . . . . . . . . . . . . . . 6.03 5.33 4.97 4.73 3.99Price range during year:
High . . . . . . . . . . . . . . . . . . . . . . . . . . . . . . . . . . . . . . . 18.65 9.50 14.31 15.50 25Low . . . . . . . . . . . . . . . . . . . . . . . . . . . . . . . . . . . . . . . . 6.28 3.25 4 8.13 10.38Close . . . . . . . . . . . . . . . . . . . . . . . . . . . . . . . . . . . . . . . 11.30 9 5 8.75 12.94
Price/earnings ratio at year-end . . . . . . . . . . . . . . . . . . . . . . . 13 17 11 10 NMDividend yield at year-end — % . . . . . . . . . . . . . . . . . . . . . . . 1.9 2.3 4.2 2.4 1.5Shares outstanding at year-end (In thousands) . . . . . . . . . . . . . . . 28,334 27,825 27,743 27,623 27,453Average monthly trading volume (In thousands) . . . . . . . . . . . . . . 4,043 3,545 2,666 1,962 4,065
* Share and per share data have been adjusted for the fiscal 1997 stock dividend.** Fiscal 1994 figures reflect the cumulative effect of a change in accounting for income taxes, which increased net earnings by $0.5 million, or 2 cents per share.NM = Not meaningful
FY 2002: ELEVEN YEARS IN REVIEW

33Apogee Enterprises, Inc.
(In thousands, except per share data and percentages)* 1997 1996 1995 1994** 1993 1992
OPERATING RESULTSNet sales . . . . . . . . . . . . . . . . . . . . . . . . . . $ 642,226 $ 567,823 $ 516,022 $ 426,400 $ 367,878 $ 364,578Gross profit . . . . . . . . . . . . . . . . . . . . . . . . 143,761 116,426 102,400 84,184 71,141 67,193Operating income . . . . . . . . . . . . . . . . . . . . 44,628 34,729 31,535 23,803 8,779 2,730Earnings (loss) from continuing operations . . 26,827 20,656 19,160 16,279 6,657 (1,300)Earnings (loss) from discontinued operations . (607) (2,820) (6,110) (12,446) (2,143) 9,805Net earnings (loss) . . . . . . . . . . . . . . . . . . . 26,220 17,836 13,050 3,833 4,514 8,505Earnings (loss) per share — basic
From continuing operations . . . . . . . . . . . 0.98 0.76 0.72 0.62 0.25 (0.05)From discontinued operations . . . . . . . . . (0.02) (0.10) (0.23) (0.47) (0.08) 0.36Net earnings (loss) . . . . . . . . . . . . . . . . . 0.96 0.66 0.49 0.14 0.17 0.32
Earnings (loss) per share — dilutedFrom continuing operations . . . . . . . . . . . 0.96 0.76 0.71 0.61 0.25 (0.05)From discontinued operations . . . . . . . . . (0.02) (0.10) (0.23) (0.47) (0.08) 0.36Net earnings (loss) . . . . . . . . . . . . . . . . . 0.93 0.65 0.48 0.14 0.17 0.31
Effective tax rate — % . . . . . . . . . . . . . . . . . 31.5 35.4 35.1 32.6 28.8 (113.5)
OPERATING RATIOSGross margin — % . . . . . . . . . . . . . . . . . . . . 22.4 20.5 19.8 19.7 19.3 18.4Operating margin — % . . . . . . . . . . . . . . . . . 6.9 6.1 6.1 5.6 2.4 0.7Net margin — continuing operations — % . . . 4.2 3.6 3.7 3.8 1.8 (0.4)Net margin — % . . . . . . . . . . . . . . . . . . . . . 4.1 3.1 2.5 0.9 1.2 2.3Return on:
Average shareholders’ equity — % . . . . . . 16.9 13.5 10.9 3.4 4.0 7.6Average invested capital — % . . . . . . . . . 9.2 7.6 6.7 2.4 3.0 5.7Average total assets — % . . . . . . . . . . . . 7.1 5.5 4.5 1.6 2.1 4.2
FUNDS FLOW DATADepreciation and amortization . . . . . . . . . . . $ 17,860 $ 13,122 $ 11,972 $ 12,423 $ 12,344 $ 14,407Capital expenditures . . . . . . . . . . . . . . . . . . 34,203 20,038 22,603 11,447 6,393 9,985Dividends . . . . . . . . . . . . . . . . . . . . . . . . . . 4,806 4,453 4,154 3,841 3,584 3,505
YEAR-END DATATotal assets . . . . . . . . . . . . . . . . . . . . . . . . $ 410,522 $ 327,233 $ 317,085 $ 257,877 $ 213,372 $ 212,282Current assets . . . . . . . . . . . . . . . . . . . . . . . 159,095 149,414 155,608 123,301 102,869 112,847Current liabilities . . . . . . . . . . . . . . . . . . . . 86,178 83,574 90,876 92,536 61,702 63,786Working capital . . . . . . . . . . . . . . . . . . . . . . 72,916 65,840 64,732 30,765 41,167 49,061
Current ratio . . . . . . . . . . . . . . . . . . . . . 1.8 1.8 1.7 1.3 1.7 1.8Long-term debt . . . . . . . . . . . . . . . . . . . . . . 127,640 79,102 80,566 35,688 28,419 25,267
% of invested capital . . . . . . . . . . . . . . . 39.4 32.5 35.6 21.6 18.7 17.0Shareholders’ equity . . . . . . . . . . . . . . . . . . 172,150 138,922 124,628 114,062 112,336 113,780
% of invested capital . . . . . . . . . . . . . . . 53.1 57.0 55.1 69.0 74.1 76.6
INVESTMENT INFORMATIONDividends per share . . . . . . . . . . . . . . . . . . . $ 0.175 $ 0.165 $ 0.155 $ 0.145 $ 0.135 $ 0.130Book value per share . . . . . . . . . . . . . . . . . . 6.17 5.14 4.64 4.28 4.26 4.23Price range during year:
High . . . . . . . . . . . . . . . . . . . . . . . . . . . 23.75 9.88 9.25 8.88 6.38 9Low . . . . . . . . . . . . . . . . . . . . . . . . . . . 9.63 6.50 5.75 5.13 4.13 4.75Close . . . . . . . . . . . . . . . . . . . . . . . . . . 19.88 9.81 8.63 7.25 5.81 6.13
Price/earnings ratio at year-end . . . . . . . . . . 21 15 18 50 34 19Dividend yield at year-end — % . . . . . . . . . . 0.9 1.7 1.9 2.0 2.3 2.1Shares outstanding at year-end (In thousands) . . 27,882 27,034 26,886 26,624 26,354 26,922Average monthly trading volume (In thousands) . . 4,795 1,776 1,613 519 644 1,386
FY 2002: ELEVEN YEARS IN REVIEW

BOARD OF DIRECTORS
Bernard P. Aldrich, 52 1,2
President and Chief Executive OfficerRimage Corporation
Donald W. Goldfus, 68 3
Retired Chairman of the Board
Barbara B. Grogan, 54 1,3
Chairman and PresidentWestern Industrial Contractors
Harry A. Hammerly, 68 1
Retired Executive Vice President3M Company
J. Patrick Horner, 52 1,4
ChairmanThe Horner Group
Russell Huffer, 52Chairman, President and Chief Executive Officer
James L. Martineau, 61 4
Retired Executive Vice President
Stephen C. Mitchell, 58 2,3
President and Chief Operating OfficerThe Knight Group, LLC
Laurence J. Niederhofer, 69 3,4
Retired Chief Executive OfficerApogee Wausau Group
Ray C. Richelsen, 60 2
Retired Executive Vice President3M Company
Michael E. Shannon, 65 2,3,4
Retired Chairman of the BoardEcolab, Inc.
1 Audit Committee2 Compensation Committee3 Corporate Governance Committee4 Finance Committee
FY 2002: CORPORATE INFORMATION
CORPORATE OFFICERS
Russell Huffer, 52Chairman, President and Chief Executive Officer
Michael B. Clauer, 45Executive Vice President andChief Financial Officer
Joseph T. Deckman, 58Executive Vice President
Larry D. Stordahl, 59Executive Vice President
Patricia A. Beithon, 48General Counsel and Secretary
Gary R. Johnson, 40Vice President and Treasurer
James S. Porter, 41Vice President of Strategy and Planning
APOGEE BUSINESSES
Architectural Products and Services
Minneapolis, MNJohn L. FryePresident
Additional Locations:Atlanta, GABaltimore, MDChicago, ILCincinnati, OHCleveland, OHDenver, CODetroit, MIIndianapolis, INOrlando, FLSouth Bend, INTampa, FLWashington, D.C.
Wausau, WIRick A. MarshallPresident
Additional Location:Villa Rica, GA
Owatonna, MNDonald C. PyattPresident
Additional Location:Statesboro, GA
Wausau, WIAlan A. VerploeghPresident
Large-Scale OpticalTechnologies
McCook, ILMichael B. ClauerPresident (interim)
Additional Locations:Little Ferry, NJOrlando, FLSalt Lake City, UT
Faribault, MNErik J. BjornardPresident
Automotive ReplacementGlass and Services
Minneapolis, MNRobert E. MunzenriderPresident
Additional Locations:There are more than 400shops and service centersthroughout the United States.
Owatonna, MNRobert C. JungbluthPresident

35Apogee Enterprises, Inc.
Stock MarketApogee Enterprises, Inc. common stock is traded onthe Nasdaq Stock Market under the symbol APOG.
Corporate Headquarters7900 Xerxes Avenue South, Suite 1800Minneapolis, MN 55431-1159Telephone: (952) 835-1874Fax: (952) 835-3196
Corporate Web Sitewww.apog.com
Independent AuditorsArthur Andersen LLPMinneapolis, MN
Quarterly CalendarThe company’s fiscal year ends the Saturday nearest the last day ofFebruary. Fiscal 2003 quarter-end dates are June 1, 2002, August 31,2002, November 30, 2002 and March 1, 2003. Quarterly results are usu-ally announced approximately three weeks after the end of each quarter,with the exception of the fourth quarter results which are announcedapproximately five weeks after the year-end.
Cash DividendsApogee has paid quarterly cash dividends in May, August, November andFebruary since 1974.
Transfer Agent and RegistrarFor inquiries regarding stock certificates, such as lost certificates, namechanges and ownership transfers, contact:
The Bank of New YorkShareholder Relations, Dept. 11EP.O. Box 11258, Church Street StationNew York, NY 10286-1258Telephone: (800) 524-4458E-mail: [email protected]: www.stockbny.com
Annual Shareholders’ MeetingThe meeting will be held at 10 a.m. CDT on Tuesday, June 18, 2002, inthe Lutheran Brotherhood Building Auditorium, 625 Fourth Avenue South,Minneapolis, MN. Apogee also will be webcasting the annual meeting forshareholders: Go to the Apogee Web site at www.apog.com, click on“investor relations” and then click on the webcast link at the top of thatpage at least 15 minutes prior to the 10 a.m. CDT meeting to register,download and install any necessary software.
Investor Relations ContactMary Ann Jackson, Director of Investor RelationsTelephone: (952) 830-0674
Investor InformationAdditional information, such as Forms 10-K, 10-Q and proxy statementsas filed with the Securities & Exchange Commission, and results and news releases may be obtained at no charge through one of the following:
Internet: www.apog.comE-mail: [email protected]: (952) 896-2422Fax: (952) 896-2400Mail: Attn: Investor Relations, Corporate Headquarters address
Multiple AccountsSome shareholders prefer to keep their holdings in more than one account,and they are welcome to do so. However, some multiple accounts are unin-tentional and will occur if one stock purchase is made with the middleinitial and a subsequent purchase without the middle initial. Please con-tact us for information on how to merge accounts.
Forward-Looking StatementsSee page 19.
Quarterly Stock Prices and Dividend Rates
Fiscal 2002 High Low Dividend
First Quarter . . . . . . . . . . . . . . $ 11.990 $ 6.281 $ 0.053Second Quarter . . . . . . . . . . . . 15.700 9.250 0.053Third Quarter . . . . . . . . . . . . . . 17.000 6.860 0.055Fourth Quarter . . . . . . . . . . . . . 18.650 9.990 0.055
Fiscal 2001 High Low Dividend
First Quarter . . . . . . . . . . . . . . $ 5.500 $ 3.313 $ 0.053Second Quarter . . . . . . . . . . . . 4.531 3.250 0.053Third Quarter . . . . . . . . . . . . . . 6.063 4.313 0.053Fourth Quarter . . . . . . . . . . . . . 9.500 4.625 0.053
GLOSSARY OF TERMS
Auto Glass Repair. A process that bonds glass together with a UV-cured, opticallymatched resin to restore the windshield’s strength, prevent the break from spreadingand improve the windshield’s cosmetic appearance.
Black Belts. Trained managers who use Six Sigma tools and methodologies to leadand complete high-impact improvement projects.
Curtainwall. An exterior multi-story wall consisting of an aluminum framing systemanchored to steel or concrete, glazed or filled with glass in the vision areas and withpanels in the nonvision or spandrel areas.
Energy-Efficient Glass. Generally, insulated glass units incorporating coatings thattransmit high levels of visible light while lowering the heat gain from solar energy.Insulated glass is fabricated from two or more panes of glass separated by a sealedair space and used primarily to reduce the transfer of heat or sound.
Hurricane-Resistant Glass. Glass laminated with a special composite used primarilyto protect a building from wind and wind-borne debris from hurricane-force winds. Tomeet the safety requirements of building codes, it must pass both projectile impactand cyclic wind pressure tests.
Optical Coatings. Thin film metal oxide coatings which are sputter-deposited onto abase material such as glass. Optical coatings selectively control the reflection andtransmission of light, and can provide electrical and static dissipation.
Protective Glazing. Laminated glass products that offer protection and mitigateagainst the threats of nature and mankind. Products have been tested for ballistic,forced-entry, windstorm or bomb-blast protection.
Six Sigma/Lean Thinking or Manufacturing. A business improvement process foreliminating non-value-added process steps from the customer’s view (Lean) andreducing variation within processes (Six Sigma). It uses fact-based analytical toolsand methodologies for preventing defects in products, processes and services, reduc-ing cycle times and controlling costs to generate value for customers.
Certain trademarks, copyrights and trade names are owned or licensed by Apogee Enterprises, Inc.or its wholly owned subsidiaries. PPG Auto Glass is a trademark of PPG Industries. Other productnames mentioned may be trademarks or registered trademarks of their respective companies.
FY 2002: INVESTOR INFORMATION

Apogee Enterprises, Inc.7900 Xerxes Avenue South, Suite 1800Minneapolis, MN 55431-1159(952) 835-1874www.apog.com


