23
Apollo Hospitals Enterprise Limited Q3 FY 2011 Earnings Update
| Date post: | 07-May-2018 |
| Category: |
Documents |
| Upload: | truonghanh |
| View: | 214 times |
| Download: | 1 times |

Apollo Hospitals Enterprise LimitedQ3 FY 2011 Earnings Update

2
Safe Harbour
Numbers mentioned in this Presentation in respect of information provided on hospital operatingparameters and other operating metrics have been compiled by the management and are beingprovided only by way of additional information. These are not to be construed as being provided underany legal or regulatory requirements. The accuracy of these numbers have neither been vetted norapproved by the Audit Committee and the Board of Directors of Apollo Hospitals Enterprise Limited(AHEL), nor have they been vetted or reviewed by the Auditors, and therefore may differ from theactual.
Statements in this “Presentation” describing the Company’s objectives, projections, estimates,expectations or predictions may be “forward looking statements” within the meaning of applicablesecurities laws and regulations. Actual results could differ materially from those expressed or implied.
Important risk factors and uncertainties could make a material difference to the Company’s operations.These risks include but are not limited to, the risk factors described in AHEL’s prospectus, annualreports and other periodic filings made by the company. The Company assumes no responsibility topublicly amend, modify or revise any forward looking statement, on the basis of any subsequentdevelopment, information or events, or otherwise.

3
Contents• Q3 Highlights• Consolidated Financial Performance• Standalone Financial Performance• Operational Performance - Hospitals • Operational Performance - Retail Pharmacy• Update on Projects• Update on non-hospital JVs, Associates

4
Q3 Highlights – (1/2)
Performance
Capacity
• YTD Dec FY 11 Consolidated revenues - Rs.18,997 million (up 27.4% yoy)
• YTD Dec FY 11 Consolidated EBITDA - Rs. 3,152 million (up 32.8% yoy)
• Consolidated EBITDA margin expanded 68 bps to 16.6%.
• Retail pharmacies continued to demonstrate improvement in operating performance reportinga positive EBITDA margin during the quarter. Mature stores have surpassed their EBITDAtarget of 5% ahead of schedule with an EBITDA margin of 5.23% during the quarter.
• Apollo Munich Re Health Insurance recorded Gross Written Premium (GWP) of Rs. 1,402million during the nine months, higher by 75% over last year. Earned premium more thandoubled to Rs. 963 million in YTD Dec FY11 compared to Rs. 475 million in the same periodlast year.
• Apollo Health Street continues to enjoy strong patronage from payers as well as providers.Focus on operating efficiencies has resulted in significant improvement in financialperformance.
• 53 hospitals with total bed capacity of 8,234 beds as on Dec 31, 2010
• 26 owned hospitals with 3,287 beds capacity
• 10 Subs/JVs/Associates with 2,197 beds capacity
• 17 Managed/Franchise hospitals with 2,750 beds.
• The 4,194 operating beds at owned hospitals including subs / JV’s / Associates had anoccupancy of 74%
• 32 standalone pharmacies (net) were added during the quarter and the total number ofpharmacies as on Dec 31, 2010 is 1,142.

5
• Launched the Apollo Cosmetic Clinics during the quarter. These state-of-the-art clinics willbe centers of excellence offering comprehensive treatments for a range of cosmeticenhancements and will enable AHEL to offer its expertise to the fast growing market forwellness and lifestyle treatments in India.
• Apollo Hospitals wins the − "India's Most Preferred Hospital" − Viewer's Choice Award byCNBC-TV18.
• Apollo Hospitals' Billion Hearts Beating won the ‘Campaign of The Year’ Award at the WorldBrand Congress 2010
• Apollo Speciality Hospitals – Madurai won the IMC Ramkrishna Bajaj National QualityAwards 2010 for Healthcare.
• CRISIL Equities has assigned a CRISIL IER fundamental grade of 5/5 to Apollo Hospitals – itis only the second company in India to receive this rating.
• A new cancer treatment facility was launched at Indraprastha Apollo hospital, Delhicomprising the Novalis Tx and a Bone Marrow Transplant Unit.
• Apollo Hospitals, Chennai commissioned the next generation 3D Electro-anatomicalmapping system, which enables accurate location and treatment of electrophysiologicaldisorders of the heart.
• Apollo Bramwell Hospital has launched a Stem Cell Therapy Program.
• The first successful Allogeneic Bone Marrow Transplant (BMT) was performed at ApolloHospitals. In Allogeneic BMTs, the bone marrow is received from a donor.
• Doctors at Apollo Hospitals, Chennai implanted biodegradable stents in two patients as apart of the last phase of the human trials. These stents are designed to dissolve in the bodywithin two years. They are in the last phase of clinical trials and if proved viable couldrevolutionise current approaches to treatments in this area.
Q3 Highlights – (2/2)Major Initiatives & Recognitions
World-class technology
Patient Care Excellence

6
Contents• Q3 Highlights• Consolidated Financial Performance• Standalone Financial Performance• Operational Performance - Hospitals • Operational Performance - Retail Pharmacy• Update on Projects• Update on non-hospital JVs, Associates

7
Q3 FY'10 Q3 FY'11 yoy (%)YTD Dec
FY'10YTD Dec
FY'11 yoy (%)
Income from Operations 5,015 6,136 22.3% 14,105 17,935 27.1%Add: Share of JVs 234 297 26.7% 716 922 28.7%Total Revenues 5,249 6,432 22.5% 14,821 18,857 27.2%
EBITDA 848 1,045 23.3% 2,457 3,226 31.3%
margin (%) 16.1% 16.2% 10 bps 16.6% 17.1% 53 bps
Profit After EO, Tax, MI, Share of Associates 426 431 1.1% 1,206 1,386 14.9%
Total Debt 8,959 Cash and cash equivalents 1,554
• 27.2% y-o-y increase in YTD Dec FY11 Revenues.
• 31.3% growth in YTD Dec FY11 EBITDA and 53 bps y-o-y improvement in EBITDA margins led by continued growth in the core business and retail pharmacies (AHEL Standalone – 23 bps EBITDA improvement) as well as in key subsidiary & JV hospitals (Bangalore, Ahmedabad, Kolkata)
Consolidated Financial Performance * [Excluding Apollo Munich Health Insurance] ` Mio
• * Unaudited Estimates; Basis of consolidation in the Appendix (last page) • AHEL’s performance easier to interpret without Apollo Munich consolidation – results with Apollo Munich consolidated are provided in the
Appendix ( investment (c.` 216 mn for a 13.17%) ownership in Apollo Munich Insurance is ring-fenced )• JVs include Ahmedabad-50%, Kolkata-50% ,PET CT – 50%, Quintiles – 40%, Apollo Lavasa – 34.66% `• The Consolidated Revenues and Consolidated EBITDA do not include other income of Standalone
8
Contents• Q3 Highlights• Consolidated Financial Performance• Standalone Financial Performance• Operational Performance - Hospitals • Operational Performance - Retail Pharmacy• Update on Projects• Update on non-hospital JVs, Associates

9
Q3 FY'10 Q3 FY'11 yoy (%)YTD Dec
FY'10YTD Dec
FY'11 yoy (%)Revenue 4,809 6,009 13,429 17,106 Total Income 4,809 6,009 25.0% 13,429 17,106 27.4%
Operative Expenses (2,634) (3,328) 26.3% (7,334) (9,362) 27.6%Employee Expenses (745) (904) 21.3% (2,067) (2,599) 25.8%Administrative & Other Expenses (653) (835) 27.8% (1,844) (2,323) 26.0%Total Expenses (4,032) (5,066) 25.7% (11,245) (14,284) 27.0%
EBITDA 777 943 21.3% 2,184 2,822 29.2%margin (%) 16.2% 15.7% -47 bps 16.3% 16.5% 23 bps
Depreciation (141) (178) (399) (520) EBIT 636 764 20.2% 1,785 2,302 29.0%margin (%) 13.2% 12.7% -51 bps 13.3% 13.5% 17 bps
Financial Expenses (85) (134) (271) (430) Other Income 107 51 274 155
Profit Before Tax 658 682 3.6% 1,789 2,027 13.4%
Profit After Tax 439 458 4.3% 1,228 1,346 9.6%margin (%) 9.1% 7.6% -151 bps 9.1% 7.9% -127 bps
ROCE (Annualized) 14.0% 14.4% 13.1% 14.4%Capital Employed 18,149 21,279 18,149 21,279
Standalone Financial Performance – (1/2) ` Mio
• YTD Dec FY11 revenue growth at 27.4%
• YTD Dec FY11 EBITDA margin improves by 23 bps to 16.5%
• YTD Dec FY11 EBIT margin expands 17 bps to 13.5%
Impact of New projects

10
Q3 FY'10 Q3 FY'11 yoy (%)YTD Dec
FY'10YTD Dec
FY'11 yoy (%)Revenues from each segment
Heathcare Services * 3,482 4,277 22.8% 9,917 12,317 24.2%Stand-alone Pharmacy 1,329 1,734 30.5% 3,514 4,793 36.4%Other Income 107 51 274 155
Total 4,917 6,061 23.3% 13,705 17,265 26.0%Less: Intersegmental Revenue (1) (2) (2) (4)
Net Revenues (incl. other income) 4,915 6,059 23.3% 13,703 17,261 26.0%
Profit before Tax & Interest (EBIT)Heathcare Services * 681 773 13.5% 1,927 2,351 22.0%Stand-alone Pharmacy (45) (9) (142) (49) Other Income 107 51 274 155
Total EBIT (incl. other income) 743 815 9.8% 2,059 2,457 19.3%
Profit before Tax & Interest (EBIT) marginsHeathcare Services * 19.6% 18.1% 19.4% 19.1%Stand-alone Pharmacy n.m. n.m. n.m. n.m.
Total EBIT margin (incl. other income) 15.1% 13.5% -166 bps 15.0% 14.2% -79 bps
Interest Expense (85) (134) (271) (430)
Profit Before Tax 658 682 3.6% 1,789 2,028 13.4%
Capital Employed Healthcare services 16,384 19,128 16,384 19,128 Healthcare services - ROCE( Annualized) 16.6% 16.2% 15.7% 16.4%
Standalone Segment-wise Performance – (2/2)
• 24.2% yoy growth in Healthcare Services segment revenues
• 36.4% yoy growth in Retail Pharmacy revenues
• YTD Dec FY11 EBIT expands 22% in the Healthcare services segment
• Reduced losses at the EBIT level in the Pharmacy business (despite further expansion of 32 pharmacies) with a path towards profitability.
• Healthcare services ROCE at 16.4% (YTD Dec FY11 annualised).
* Healthcare Services consists of Hospitals, Hospital Based Pharmacies and Consulting
` Mio

11
Contents• Q3 Highlights• Consolidated Financial Performance• Standalone Financial Performance• Operational Performance - Hospitals • Operational Performance - Retail Pharmacy• Update on Projects• Update on non-hospital JVs, Associates

12
AHEL Standalone Hospitals Chennai Cluster Hyderabad Cluster Others* SIGNIFICANT SUBS / JVs**YTD Dec
FY'10YTD Dec
FY'11 yoy %YTD Dec
FY'10YTD Dec
FY'11 yoy %YTD Dec
FY'10YTD Dec
FY'11 yoy %YTD Dec
FY'10YTD Dec
FY'11 yoy %YTD Dec
FY'10YTD Dec
FY'11 yoy %
No. of Op. Beds 2,707 2,993 1,113 1,105 670 809 924 1,079 955 991
Inpatient Volume 108,470 123,304 13.7% 48,947 53,780 9.9% 27,389 29,727 8.5% 32,134 39,797 23.8% 37,438 43,942 17.4%Outpatient Volume 288,982 371,959 28.7% 147,986 172,446 16.5% 65,762 85,750 30.4% 75,234 113,763 51.2% 142,147 149,622 5.3%
Inpatient ALOS (days) 5.07 5.01 4.67 4.67 4.71 4.82 5.99 5.63 4.84 4.61 Occupancy (%) 74% 75% 75% 83% 70% 64% 76% 75% 69% 74%
Inpatient Revenue 8,295 10,167 22.6% 3,820 4,590 20.1% 1,447 1,788 23.6% 1,256 1,734 38.0% 1,633 1,997 22.3%Outpatient Revenue 1,477 2,000 35.4% 1,009 1,332 32.1% 230 351 52.5% 238 317 32.9% 440 626 42.4%ARPOB ^ (Rs / Day) 17,760 19,680 10.8% 21,116 23,593 11.7% 13,000 14,929 14.8% 7,762 9,158 18.0% 11,441 12,940 13.1%
Total Net Revenue ^ 9,772 12,167 24.5% 4,829 5,922 22.6% 1,677 2,139 27.5% 1,495 2,051 37.2% 2,073 2,623 26.6%
Operational Performance - Hospitals
^ In comparing Apollo’s operating metrics with other hospitals, please note that Apollo’s Net Revenue is Net of Doctor Fee (due to Apollo Hospital’s Fee for Service Model), and that the ARPOB calculated above does not include revenues from Doctor fees.
Outpatient volume represents New Registrations only
* Others include Madurai, Mysore, Vizag, Pune,, Karur, Karimnagar, Bilaspur, Bhubaneswar
** Significant Hospital JVs/Subs are - Ahmedabad-50%, Bangalore-51%, Kolkata-50% ,Kakinada- 100% (full revenues shown in table above)
• Mature clusters
– Strong continued revenue growth in mature clusters (Chennai – 22.6%, Hyderabad – 27.5%)
– Focus on reducing ALOS, Increasing ARPOB through pricing, case-mix improvement
• New Hospitals (Others) – driving substantial growth (37.2%) – focus on Inpatient growth (23%+) / Outpatient Volume growth (51%+)
• Significant Subsidiary & JV hospitals’ continued improving performance
• Hospital based pharmacies also grew revenues at 22% ( to ` 4,920 million) and EBITDA at 33%+ yoy
AHEL Standalone Hospitals` Mio

13
Contents• Q3 Highlights• Consolidated Financial Performance• Standalone Financial Performance• Operational Performance - Hospitals • Operational Performance - Retail Pharmacy• Update on Projects• Update on non-hospital JVs, Associates

14
Q3 FY 10 Q3 FY 11 yoy% YTD Dec FY 10
YTD Dec FY 11 yoy%
No of Stores 321 315 321 315 Total Area Sq ft/store 280 281 280 281Revenue/store 1.89 2.18 15.4% 5.31 6.20 16.8%Rent /store 0.05 0.05 11% 0.14 0.15 6%EBIDTA /store 0.06 0.11 76% 0.16 0.31 102%EBIDTA MARGIN % 3.42% 5.23% 181 bps 2.93% 5.05% 213 bps
No of Stores 1,043 1,142 1,043 1,142Total Area Sq ft/store 319 320 319 320Revenue/store 1.27 1.52 19% 3.36 4.17 24%Rent /store 0.05 0.05 -2% 0.15 0.15 1%EBIDTA /store (0.03) 0.01 (0.09) 0.01 EBIDTA MARGIN % -2.05% 0.69% -2.73% 0.28%Total Revenues 1,328.6 1,733.5 3,513.7 4,792.9 EBIDTA (27.2) 5.4 (100.3) 6.9 EBIDTA MARGIN % -2% 0% -3% 0%
1,764.9 2,150.4 1,764.9 2,150.4 48.3 39.8 131.5 100.7
Total No. of Employees 6,301 6,673 6,301 6,673 Receivable Days 5 8 5 8 Payable days 12 8 12 8
Total
Capital Employed (` Mio)Capex (` Mio)
Particulars
Upto 2007 Batch
Operational Performance – Retail Pharmacy• Retail Pharmacy
operations continuing to grow rapidly, with a steady path to profitability
• LFL revenue per store growth for the upto-2007* batch of stores is 17% (yoy)
• LFL EBIDTA per store growth for the upto-2007* batch of stores is 76% (qoq) and EBIDTA margin improved by 181 bps to 5.23%
• Net addition of 32stores this quarter
* Stores operational by March 31, 2007
` Mio
• Growth in Revenue per store by 24% (yoy) despite addition of new stores during the quarter
• EBIDTA positive in Q3 at 5.4 Mio and 6.9 Mio in YTD Dec FY11

15
Contents• Q3 Highlights• Consolidated Financial Performance• Standalone Financial Performance• Operational Performance - Hospitals • Operational Performance - Retail Pharmacy• Update on Projects• Update on non-hospital JVs, Associates

16
Key Hospital Expansion Plan & Update on ExecutionDescription Investment Details
Upto Dec'10 Est. Date of
of Project Total AHEL AHEL Completion FY 11 FY 12 FY 13 FY 14Cost Share Invested Est. Est. Est. Est.
Own ProjectsHyderabad - International Block Expansion 1,225 1,225 1,129 Mar-11 100
SecunderabadSuper Specialty 370 370 370 Apr-10 150
HydergudaSuper Specialty 443 443 40 Jun-11 175
NelloreREACH Hospital 667 667 91 Oct-12 200
AyanambakkamREACH Hospital 700 700 66 Jun-12 200
NashikREACH Hospital 520 520 34 Jun-12 125
KaraikudiREACH Hospital 262 262 262 Mar-11 100
Chennai-Main Expansion 100 100 Mar-13 30
BelapurSuper Specialty 3,500 3,500 727 Jun-13 350
South MumbaiSuper Specialty 1,400 1,400 - Jun-13 300
Bilaspur-Oncology Expansion 80 80 - Sep-11
VizagSuper specialty 1,150 1,150 80 Jun-13 300
TrichyREACH Hospital 655 655 136 Jun-13 200
Joint Ventures / Associates
MLCP Car parking 337 83 - Sep-12
ThaneSuper specialty 2,000 500 - Mar-13 250
Bangalore Expansion 60 60 - Feb-11 52New Delhi Expansion 400 - - Feb-11 136TOTAL 13,869 11,715 2,935 538 175 1,005 950
2668 Total number of beds
Operational beds
Rs. Millions

17
Contents• Q3 Highlights• Consolidated Financial Performance• Standalone Financial Performance• Operational Performance - Hospitals • Operational Performance - Retail Pharmacy• Update on Projects• Update on non-hospital JVs, Associates

18
Apollo Health Street Update*
• AHEL owns 38.69% of Apollo Health Street
Key Updates / Initiatives
` Mio
• Regulatory impetus on controlling US healthcare costs – Health Street well-positioned to capitalize on that trend
• Legal entities simplified by a series of mergers. Now only two entities in US and two in India
• Strong momentum in payer and provider sales
Q3 FY '10 Q3 FY '11 yoy (%) YTD Dec
FY' 10 YTD Dec
FY' 11 yoy (%)Revenues 1,136 1,056 -7% 3,477 3,253 -6%Other Income 39 (5) 43 17 -60%Total Income 1,175 1,051 -11% 3,520 3,270 -7.1%
Operative Expenses 316 244 -23% 1,050 839 -20.1%Employee Expenses 604 646 7% 1,878 1,968 4.8%Total Expenses 920 890 -3% 2,929 2,808 -4.1%
EBITDA 215 166 -23% 549 445 -18.9%margin (%) 19% 16% 16% 14%
Financial Expenses (28) 90 153 237 Depreciation 50 47 145 132
Profit Before Tax 129 (50) -139% 150 (6) -104.3%
Profit After Tax 75 (35) -146% 79 1 -99.1%

19
Q3 FY '10 Q3 FY '11 yoy (%) YTD Dec
FY' 10 YTD Dec
FY' 11 yoy (%)
Gross Written Premium 310 528 70% 799 1,402 75%Earned Premium 197 366 86% 475 963 103%Other Income (incl. Interest Income) 27 37 37% 74 104 41%Total Income 224 403 80% 548 1,067 95%
Claims & Commission Expense 200 275 38% 503 723 44%Employee Expenses 74 119 61% 192 324 69%Administrative & Other Expenses 136 213 57% 352 580 65%
Total Expenses 410 607 48% 1,047 1,627 55%
EBITDA (186) (204) (499) (560)
Depreciation 18 22 22% 51 64 25%
Profit Before Tax (204) (226) (550) (624)
Profit After Tax (204) (226) (550) (624)
Combined Ratio 175% 141%
Apollo Munich Health Insurance Company Update *
• AHEL owns 13.17% of Apollo Munich Health Insurance
Key Updates / Initiatives
• During YTD Dec FY11, the company achieved gross written premium of ` 1,402 Million against a premium of ̀ 799 Million in YTD Dec FY 10.
• Overall positive trend in the top line with improvement in operating parameters.
• The company added 1office in this quarter , totalling to 40 offices
• The company expects to achieve a premium of INR 2 Billion in FY11.
` Mio

20
Q & A

21
Consolidated Financial Performance * [Including Apollo Munich Health Insurance] ` Mio
• Unaudited Estimates; Basis of consolidation in the Appendix (last page)
• JVs include Ahmedabad-50%, Kolkata-50% ,PET CT – 50%, Apollo Munich – 13.17%, Quintiles – 40%, Apollo Lavasa – 34.66%
• The Consolidated revenues and consolidated EBDITA do not include other income of Standalone
Q3 FY'10 Q3 FY'11 yoy (%)YTD Dec
FY'10YTD Dec
FY'11 yoy (%)
Income from Operations 5,015 6,136 22.3% 14,105 17,935 27.1%Add: Share of JVs 262 326 24.7% 808 1,063 31.6%
Total Revenues 5,277 6,462 22.5% 14,913 18,997 27.4%
EBITDA 835 1,042 24.8% 2,374 3,152 32.8%
margin (%) 15.8% 16.1% 30 bps 15.9% 16.6% 68 bps
Profit After EO, Tax, MI, Share of Associates 403 415 3.1% 1,115 1,304 17.0%
Total Debt 8,959 Cash and cash equivalents 1,554
22
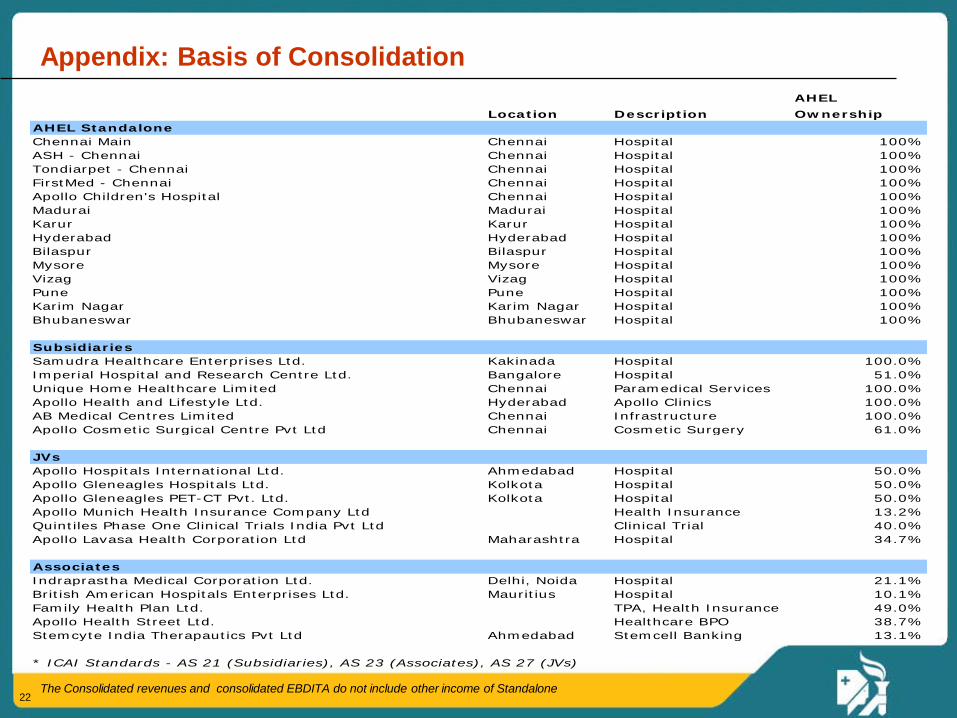
Appendix: Basis of Consolidation
The Consolidated revenues and consolidated EBDITA do not include other income of Standalone
AHELLocation Description Ownership
AHEL StandaloneChennai Main Chennai Hospital 100%ASH - Chennai Chennai Hospital 100%Tondiarpet - Chennai Chennai Hospital 100%FirstMed - Chennai Chennai Hospital 100%Apollo Children's Hospital Chennai Hospital 100%Madurai Madurai Hospital 100%Karur Karur Hospital 100%Hyderabad Hyderabad Hospital 100%Bilaspur Bilaspur Hospital 100%Mysore Mysore Hospital 100%Vizag Vizag Hospital 100%Pune Pune Hospital 100%Karim Nagar Karim Nagar Hospital 100%Bhubaneswar Bhubaneswar Hospital 100%
SubsidiariesSamudra Healthcare Enterprises Ltd. Kakinada Hospital 100.0%Imperial Hospital and Research Centre Ltd. Bangalore Hospital 51.0%Unique Home Healthcare Limited Chennai Paramedical Services 100.0%Apollo Health and Lifestyle Ltd. Hyderabad Apollo Clinics 100.0%AB Medical Centres Limited Chennai Infrastructure 100.0%Apollo Cosmetic Surgical Centre Pvt Ltd Chennai Cosmetic Surgery 61.0%
JVsApollo Hospitals International Ltd. Ahmedabad Hospital 50.0%Apollo Gleneagles Hospitals Ltd. Kolkota Hospital 50.0%Apollo Gleneagles PET-CT Pvt. Ltd. Kolkota Hospital 50.0%Apollo Munich Health Insurance Company Ltd Health Insurance 13.2%Quintiles Phase One Clinical Trials India Pvt Ltd Clinical Trial 40.0%Apollo Lavasa Health Corporation Ltd Maharashtra Hospital 34.7%
AssociatesIndraprastha Medical Corporation Ltd. Delhi, Noida Hospital 21.1%British American Hospitals Enterprises Ltd. Mauritius Hospital 10.1%Family Health Plan Ltd. TPA, Health Insurance 49.0%Apollo Health Street Ltd. Healthcare BPO 38.7%Stemcyte India Therapautics Pvt Ltd Ahmedabad Stemcell Banking 13.1%
* ICAI Standards - AS 21 (Subsidiaries), AS 23 (Associates), AS 27 (JVs)

23
Hospitals – Understanding Key Operating Metrics
• Number of operating bedsOperating Beds
Occupancy
AvLOS
ARPOB / day
x
x
x
• In-patient Bed Days
• Average Length of Stay per In-patient
Outpatient Visits
• Average Revenue Per Occupied Bed Day
Description
• -
• In-patient Bed Days Billed
• In-Patient Bed Days / In-Patient Admissions
• (IP Revenue1 + OP Revenue + Hospital Based Pharmacy Revenue) /IP Bed Days
Formula / Calculation
• Project execution• Capital Expenditure
• Brand• Doctor reputation• Quality of outcomes• Competition
• Case-Mix / Type of procedures• Leverage technology to shorten
stay
• Case-Mix / Type of procedures• Better utilization of operational
theatres, medical equipment• Pricing
Key Driver
1. Apollo does not include consultant fee in its IP Revenue reporting as consultants at Apollo operate on a fee-for-service model
Contribution
x
• Contribution • Revenue – Variable costs
• Purchasing efficiency• Operating efficiency


![[International Business]Apollo Hospitals](https://static.documents.pub/doc/80x56/54b4c0354a795965718b46a0/international-businessapollo-hospitals.jpg)


