72
ABN 96 125 222 924 2017 ANNUAL REPORT APOLLO MINERALS LIMITED ANNUAL REPORT 2017

ABN 96 125 222 924
2017ANNUAL REPORT
Apollo Minerals Limited
PERTHLevel 9, BGC Centre, 28 The Esplanade Perth WA 6000
Telephone: +61 8 9322 6322 Facsimile: +61 8 9322 6558
Website: www.apollominerals.com.auEmail: [email protected]
APO
LLO M
INERA
LS LIMITED
AN
NU
AL REPO
RT 2017
LONDONUnit 3C, Princes House, 38 Jermyn Street London SW1Y 6DN
Telephone: +44 203 903 1930 Facsimile: +44 207 434 4450

CORPORATE DIRECTORY Directors: Mr Ian Middlemas – Chairman Mr Robert Behets – Non-Executive Director Dr Michel Bonnemaison – Non-Executive Director Mr Ajay Kejriwal – Non-Executive Director Mr Mark Pearce – Non-Executive Director
Company Secretary: Mr Clint McGhie
Registered and Principal Office: Level 9, BGC Centre, 28 The Esplanade, Perth WA 6000 Tel: +61 8 9322 6322 Fax: +61 8 9322 6558
London Office: Unit 3C, Princes House, 38 Jermyn Street, London SW1Y 6DN Tel: +44 203 903 1930 Fax: +44 207 434 4450
Share Register: Security Transfer Australia Pty Ltd 770 Canning Highway, Applecross WA 6953 Tel: +61 8 9315 2333 Fax: +61 8 9315 2233
Securities Exchange Listing: Australian Securities Exchange Home Branch – Perth Level 40, Central Park 152-158 St Georges Terrace Perth WA 6000
ASX Code: AON – Fully paid ordinary shares
Bankers: Australia – Australia and New Zealand Banking Group Limited France – Banque Populaire
Solicitors: DLA Piper Australia DLA Piper France
Auditor: Hall Chadwick
CONTENTS PAGE
Directors’ Report 1
Auditor’s Independence Declaration 22
Consolidated Statement of Profit or Loss and Other Comprehensive Income 23
Consolidated Statement of Financial Position 24
Consolidated Statement of Changes in Equity 25
Consolidated Statement of Cash Flows 26
Notes to the Financial Statements 27
Directors’ Declaration 60
Independent Auditor’s Report 61
Corporate Governance 66
ASX Additional Information 67

DIRECTORS’ REPORT
Apollo Minerals Limited ANNUAL REPORT 2017 1
The Directors of Apollo Minerals Limited present their report on the Consolidated Entity consisting of Apollo Minerals Limited (“Company” or “Apollo Minerals”) and the entities it controlled at the end of, or during, the year ended 30 June 2017 (“Consolidated Entity” or “Group”).
DIRECTORS
The names and details of the Company's directors in office at any time during the financial year or since the end of the financial year are: Current Directors
Mr Ian Middlemas Chairman (appointed 8 July 2016) Mr Robert Behets Non-Executive Director (appointed 12 October 2016) Dr Michel Bonnemaison Non-Executive Director (appointed 30 June 2017) Mr Ajay Kejriwal Non-Executive Director (appointed 30 June 2017) Mr Mark Pearce Non-Executive Director (appointed 8 July 2016) Former Directors
Mr Richard Shemesian Non-Executive Director (resigned 30 June 2017) Mr Eric Finlayson Non-Executive Director (resigned 8 July 2016) Mr Guy Robertson Non-Executive Director (resigned 8 July 2016) Unless otherwise stated, Directors held their office from 1 July 2016 until the date of this report.
CURRENT DIRECTORS AND OFFICERS
Mr Ian Middlemas B.Com, CA Chairman
Mr Middlemas is a Chartered Accountant, a member of the Financial Services Institute of Australasia and holds a Bachelor of Commerce degree. He worked for a large international Chartered Accounting firm before joining the Normandy Mining Group where he was a senior group executive for approximately 10 years. He has had extensive corporate and management experience, and is currently a director with a number of publicly listed companies in the resources sector.
Mr Middlemas was appointed a Director of the Company on 8 July 2016. During the three year period to the end of the financial year, Mr Middlemas has held directorships in Cradle Resources Limited (May 2016 – present), Paringa Resources Limited (October 2013 – present), Berkeley Energia Limited (April 2012 – present), Prairie Mining Limited (August 2011 – present), Salt Lake Potash Limited (January 2010 – present), Equatorial Resources Limited (November 2009 – present), Piedmont Lithium Limited (September 2009 – present), Sovereign Metals Limited (July 2006 – present), Odyssey Energy Limited (September 2005 – present), Syntonic Limited (April 2010 – June 2017) and Papillon Resources Limited (May 2011 – October 2014).
Mr Robert Behets B.Sc(Hons), FAusIMM, MAIG
Non-Executive Director
Mr Behets is a geologist with over 28 years’ experience in the mineral exploration and mining industry in Australia and internationally. He has had extensive corporate and management experience and has been Director of a number of ASX-listed companies in the resources sector including Mantra Resources Limited (“Mantra”), Papillon Resources Limited, and Berkeley Energia Limited. Mr Behets was instrumental in the founding, growth and development of Mantra, an African-focused uranium company, through to its acquisition by ARMZ for approximately A$1 billion in 2011. Prior to Mantra, he held various senior management positions during a long career with WMC Resources Limited.
Mr Behets has a strong combination of technical, commercial and managerial skills and extensive experience in exploration, mineral resource and ore reserve estimation, feasibility studies and operations across a range of commodities, including uranium, gold and base metals. He is a Fellow of The Australasian Institute of Mining and Metallurgy, a Member of the Australian Institute of Geoscientists and was previously a member of the Australasian Joint Ore Reserve Committee (“JORC”).

DIRECTORS’ REPORT (Continued)
2
CURRENT DIRECTORS AND OFFICERS (Continued)
Mr Behets was appointed a Director of the Company on 12 October 2016. During the three-year period to the end of the financial year, Mr Behets has also held directorships in Piedmont Lithium Limited (February 2017 – present), Berkeley Energia Limited (April 2012 – present), Equatorial Resources Limited (February 2016 – present), Cradle Resources Limited (May 2016 – July 2017) and Papillon Resources Limited (May 2012 – October 2014).
Dr Michel Bonnemaison D.Sc, PhD, F. SEG Non-Executive Director
Dr Bonnemaison is a French geologist with extensive experience in Europe, Africa and South America. Dr Bonnemaison spent much of the last 35 years working with the French geological survey (BRGM) and was the Deputy Head of Minerals Resources Division. He was President and CEO of SEIEMSA, a subsidiary of the BRGM mining group in Spain. Dr Bonnemaison completed a PhD on the metallogeny of the Salsigne gold mine and is widely recognised as one the preeminent authorities on gold deposits in France.
Dr Bonnemaison was appointed a Director of the Company on 30 June 2017. During the three year period to the end of the financial year, Dr Bonnemaison has not held any other directorships in listed companies.
Mr Ajay Kejriwal B.Sc (Economics), ACA Non-Executive Director
Mr Kejriwal has over 25 years’ experience in finance and commerce, and is currently a consultant to Juniper Capital, a natural resource investment and advisory business. Prior to Juniper Capital he was a banker leading many investment transactions across oil and gas, mining, real estate and asset management sectors. He has previously worked as a banker for the Principal Investments business at Nomura in London and Hong Kong, Cazenove and Co and Morgan Stanley. Mr Kejriwal is a Chartered Accountant, having qualified with PriceWaterhouseCoopers in 1994.
Mr Kejriwal was appointed a Director of the Company on 30 June 2017. During the three year period to the end of the financial year, Mr Kejriwal held a directorship in Sirius Petroluem plc (September 2013 – November 2015).
Mr Mark Pearce B.Bus, CA, FCIS, FFin Non-Executive Director
Mr Pearce is a Chartered Accountant and is currently a director of several listed companies that operate in the resources sector. He has had considerable experience in the formation and development of listed resource companies and has worked for several large international Chartered Accounting firms. Mr Pearce is also a Fellow of the Governance Institute of Australia and a Fellow of the Financial Services Institute of Australasia.
Mr Pearce was appointed a Director of the Company on 8 July 2016. During the three year period to the end of the financial year, Mr Pearce has held directorships in Salt Lake Potash Limited (August 2014 – present), Prairie Mining Limited (August 2011 – present), Equatorial Resources Limited (November 2009 – present), Piedmont Lithium Limited (September 2009 – present), Sovereign Metals Limited (July 2006 – present), Odyssey Energy Limited (September 2005 – present) and Syntonic Limited (April 2010 – October 2016).
Mr Clint McGhie B.Com, CA, ACIS, FFin
Company Secretary
Mr McGhie is a Chartered Accountant and Chartered Secretary. He commenced his career at a large international Chartered Accounting firm, and has held the position of Company Secretary and/or Chief Financial Officer for a number of listed companies that operate in the resources sector.
Mr McGhie was appointed Company Secretary of Apollo Minerals Limited on 8 July 2016.

Apollo Minerals Limited ANNUAL REPORT 2017 3
PRINCIPAL ACTIVITIES
The principal activities of the Consolidated Entity during the year consisted of the identification, acquisition, exploration and development of resource projects. During the year, the Group identified and acquired the Couflens tungsten-copper-gold project (“Couflens Project”) in southern France.
OPERATING AND FINANCIAL REVIEW
Operations
Highlights during and subsequent to the end of the year included:
➢ Completed the acquisition of an 80% interest in the Couflens Project which comprises an exploration licence that covers a 42km2 area in the Pyrenees region. The Couflens Project includes the historic Salau mine, which was one of the world’s highest grade tungsten mines when it operated from 1971 to 1986.
• Salau mine is recorded to have produced approximately 930,000 tonnes at 1.5% WO3 for around 11,500 tonnes of WO3 in concentrate prior to closure
• Production grades were 2.0 to 2.5% WO3 in the mine’s latter years
• Deposit remains open at depth, with previous drilling below the base of the existing underground development that confirmed the continuation of the mineralised system
• An initial review of extensive historical exploration and production database has been completed
• Priority tungsten-copper-gold exploration targets identified within, and immediately adjacent to, the Salau mine
• Substantial news flow is expected with a planned work program to include mine sampling and drilling utilising existing underground development in order to outline sufficient high grade tungsten mineralisation to facilitate estimation of Mineral Resources and commencement of mine feasibility studies
• Salau mine’s existing underground development and infrastructure will be examined to determine the most efficient method to progress mine exploration and development activities and potential mine reactivation
• Additional tungsten-copper-gold prospects have been identified within the broader project area and surface exploration programs will be undertaken with a view to further assessing these prospects and generating new targets
➢ Dr Michel Bonnemaison, a highly credentialed French geologist with specific expertise in gold deposits in France and Mr Ajay Kejriwal, an experienced European based corporate and capital markets executive, were appointed as Directors of the Company with effect from the completion of the Couflens Project acquisition.

DIRECTORS’ REPORT (Continued)
4
OPERATING AND FINANCIAL REVIEW (Continued)
Couflens Project
The Couflens Project area is located 130km south of Toulouse, within the Pyrenees region near the border with Spain (Figure 1). The Couflens Project comprises the recently granted Couflens exploration licence (“Couflens PER”) which covers an area of 42km2 centred on the Salau mine, formerly one of the world’s highest grade tungsten mines.
Figure 1 - Couflens Project / Salau Mine Location
The Salau scheelite skarn tungsten deposit was discovered in the early 1960’s by the Bureau de Recherches Géologiques et Minières (“BRGM”). Les Mines d’Anglade (“LMA”) operated the mine from 1971 to 1986 which is reported to have produced approximately 930,000 tonnes of ore at an average grade of 1.5% WO3 to yield approximately 11,500 tonnes of WO3 in concentrate.
Notwithstanding the existence of remaining resources, the discovery of promising mineralised zones elsewhere (Fonteilles et al., 1989) and the higher grade production from the latter years of production (up to 2.48% WO3) (Figure 2), the precipitous fall in the tungsten price caused by Chinese dumping in 1986 led to mine closure.

Apollo Minerals Limited ANNUAL REPORT 2017 5
Figure 2 - Tonnage and grade from historic tungsten (WO3) production at the Salau Mine
Project Geology
Salau is a tungsten-bearing (primarily scheelite) skarn deposit developed at the contact between Devonian pelites and calcareous sediments of the Barregiennes Formation and a Hercynian-aged granodiorite stock (“Fourque”) (Figure 3). The skarn formed within both the carbonate-bearing sediments and, to a much lesser degree, the host granodiorite. Mineralisation is directly related to the Fourque granodiorite which provided hot, tungsten-copper-gold bearing solutions that reacted with the host rocks to form the skarns and deposit metal-bearing minerals.
Figure 3 - Salau Mine Geology with Exploration Targets

DIRECTORS’ REPORT (Continued)
6
OPERATING AND FINANCIAL REVIEW (CONTINUED)
Salau consists of two known mineralised systems, the Bois d’Anglade embayment (Formation Nord, Gulfe, Formation Sud, and S.C. ore zones) and Veronique (Figures 3 and 4). Bois d’Anglade was discovered first and provided the bulk of the early production. Veronique, 300m to the west, was discovered in 1975 and provided higher grade tungsten production (average 1.9% WO3), including gold-rich material (not recovered in milling) towards the end of the mine life. Limited sampling of material from the lower section of the Veronique Southeast zone indicated the presence of high grade gold (Fonteilles et al, 1989).
Figure 4 - Salau Mine Long Section
Exploration Potential - Salau Mine Area
Previous underground drilling by the former mine owners recorded a number of high grade tungsten-bearing skarn intersections below the 1,230m level access adit (Figure 4), which represents the down-plunge continuation of the Veronique ore system. The tungsten grade of this zone of mineralisation was reported as being similar to that derived from mining in the upper levels of Veronique. The system remains open at depth and is believed to contain substantial gold credits as stated in Fonteilles et al, 1989.
Potential also remains around the other previously mined areas (Veronique and Bois d’Anglade systems) where remnant zones of tungsten-bearing material appear present.
In addition, discoveries documented by LMA at “Quer de l’Aigle” and “Christine”, plus a number of other scheelite skarn occurrences at the surface on the flanks of the Fourque granodiorite remain largely untested (Figure 3).
Additional tungsten-copper-gold prospects have been identified within the broader project area and surface exploration programs will be undertaken with a view to further assessing these prospects and generating new targets.
Apollo Minerals Limited ANNUAL REPORT 2017 7
Work Plan - Salau Mine Area
The initial work plan for the Salau mine area includes:
• Continued review and digitisation of available mine production and exploration data
• Mine area and old tailings area risk assessments
• Initial access and assessment of existing mine development and stoping areas
• Mapping and sampling of mineralisation exposed in previously developed mine areas
• Generation of a 3D model of the geology, zones of mineralisation and principal controls on mineralisation
• Underground drilling to confirm known zones of mineralisation and test for extensions of these zones
• Estimation and reporting of a Mineral Resource in accordance with the JORC Code
Initial work will focus on defining sufficient high grade tungsten mineralisation to justify commencement of mine feasibility studies, as well as testing the gold potential within and adjacent to the Salau mine area.
The Company will undertake the work program with a strong commitment to all aspects of sustainable development with an integrated approach to economic, social, environmental, health and safety management.
Orpheus Joint Venture – Fraser Range
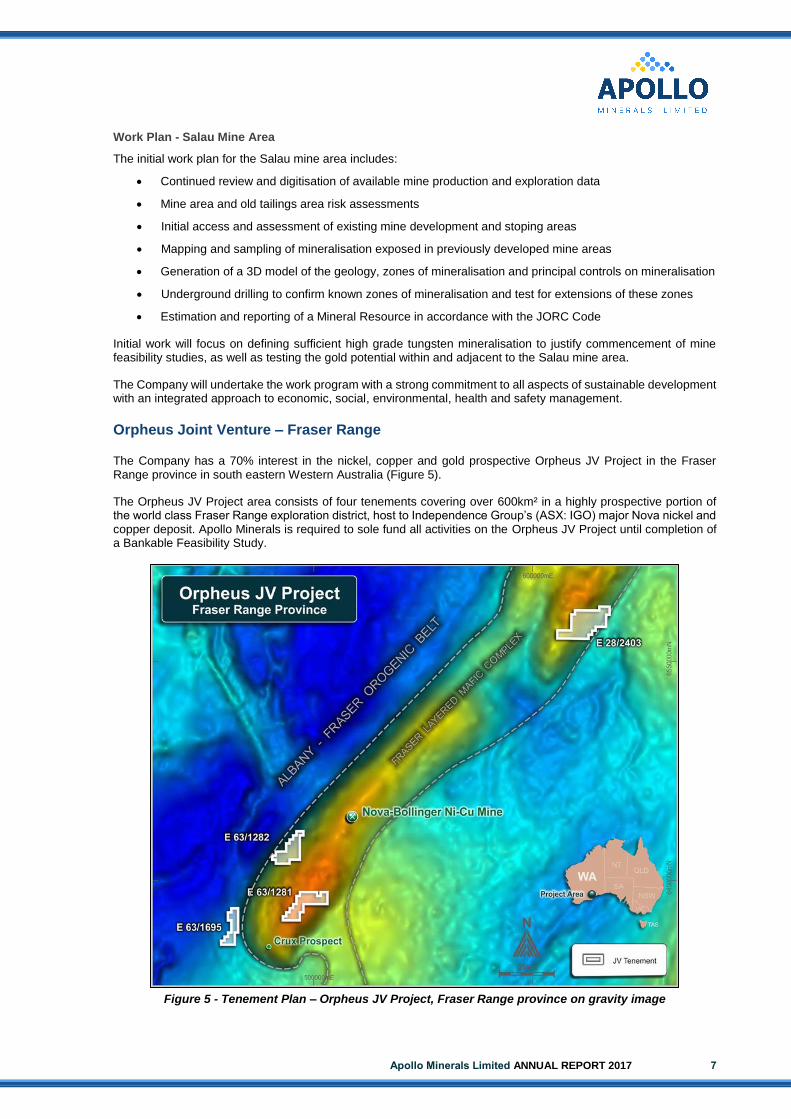
The Company has a 70% interest in the nickel, copper and gold prospective Orpheus JV Project in the Fraser Range province in south eastern Western Australia (Figure 5).
The Orpheus JV Project area consists of four tenements covering over 600km² in a highly prospective portion of the world class Fraser Range exploration district, host to Independence Group’s (ASX: IGO) major Nova nickel and copper deposit. Apollo Minerals is required to sole fund all activities on the Orpheus JV Project until completion of a Bankable Feasibility Study.
Figure 5 - Tenement Plan – Orpheus JV Project, Fraser Range province on gravity image

DIRECTORS’ REPORT (Continued)
8
OPERATING AND FINANCIAL REVIEW (CONTINUED)
The Fraser Range province is highly prospective for nickel, copper and gold, and has attracted significant exploration since the discovery of the Nova deposit in 2012. The bulk of the Orpheus JV Project is strategically located along strike and mid-way between the Nova deposit to the northeast and Independence Group’s Crux nickel prospect to the southwest.
During the year the Company completed a comprehensive review of all available data within the Orpheus JV Project area. With the exception of E63/1281, where previous work has identified disseminated nickel-copper sulphides in fertile mafic intrusives, minimal effective exploration has been undertaken over much of Apollo Mineral’s ground holding.
The review identified a number of priority targets, both empirical and conceptual, that require ground follow-up. These included two airborne electromagnetic (“HeliTEM”) anomalies that had not been previously identified and a conceptual drill target at the Plato Prospect.
Gravity surveys, field verification and surface sampling programs are underway to follow-up these priority targets. Once the results from this field work are returned and assessed, additional ground based geophysical surveys (i.e. electromagnetic) will be carried out to further delineate these targets (if warranted).
Kango North Iron Project
The Kango North Iron project covers 400km2 in Gabon, on the west coast of Central Africa. The Project is located 110km by road from the country’s capital Libreville and is positioned close to well-maintained roads, the national electricity grid, shipping ports and open access railway.
Apollo Minerals has an earn-in joint venture with a diversified Middle Eastern group who are required to sole fund exploration at the Project. The JV partner can earn up to a 50.1% interest in the Project through the contribution of ~$4m (US$3m) in exploration and development. Apollo Minerals will be free carried at no cost during exploration until the JV partner earns a 50.1% interest or ceases funding prior to completing the earn-in. In the first stage of the JV, the partner has earned a 30% interest.
The results of a field geological mapping and sampling program, undertaken with the objective of providing greater geological understanding of the known mineralised anomalies and to better identify targets for further iron ore exploration activities, were received during the year. Based on the accumulation of historical technical data and in conjunction with this mapping campaign, the recommend next phase of exploration is to conduct an initial scout drilling on the P3-P4-P6 Prospect and additional infill drilling at the P2 Prospect.
Corporate
On 30 June 2017, Apollo Minerals completed the acquisition of Ariege Tungstene SAS (“Ariege”), which holds an 80% interest in Mines du Salat SAS (“MdS”). MdS is governed by a Shareholder Agreement with Variscan Mines SAS (“Variscan France”) which holds the remaining 20% interest.
Pursuant to the Shareholder Agreement and subject to regulatory approval, Variscan France will transfer the Couflens PER into MdS. Ariege is required to spend €2.5 million over 3 years, or it may elect to withdraw from the Shareholder Agreement and return its shareholding in MdS to Variscan France. Variscan France will be free carried until completion of a Definitive Feasibility Study (“DFS”) (or total expenditures reaching €25 million).
Dr Michel Bonnemaison, a highly credentialed French geologist with specific expertise in gold deposits in France and Mr Ajay Kejriwal, an experienced European based corporate and capital markets executive, were appointed as Directors of the Company with effect from the completion of the Couflens Project acquisition.
In May 2016, the Company announced that it would restructure the Board and undertake a comprehensive recapitalisation process. Following Shareholder approval in June 2016, the Company has completed a 1 for 4 share consolidation, a placement of 42 million shares at $0.05 each raising $2.1 million (before costs), followed by a 1 for 1 non-renounceable entitlements issue at $0.05 each raising $3.1 million (before costs). Upon completion of the placement in July 2016, Mr Ian Middlemas was appointed Chairman of the Company and Mr Mark Pearce was appointed a Non-Executive Director.
Mr Robert Behets, an experienced mining executive, was appointed to the Board in October 2016.

Apollo Minerals Limited ANNUAL REPORT 2017 9
Results of Operations
The net loss of the Group attributable to members of the Company for the year ended 30 June 2017 was $1,383,441 (2016 Restated: $2,631,611). This loss is partly attributable to:
(i) exploration and evaluation expenditure of $519,928 (2016 Restated: $622,982), which is attributable to the Group’s accounting policy of expensing exploration and evaluation expenditure (other than expenditures incurred in the acquisition of the rights to explore) incurred by the Group in the period subsequent to the acquisition of the rights to explore up to the successful completion of definitive feasibility studies for each separate area of interest. Refer to note 1(d) regarding a change in the policy for accounting for exploration and evaluation expenditure to that applied in previous years; and
(ii) non-cash share based payments expenses of $442,219 (2016: $357,518) which is attributable to the Group’s accounting policy of expensing the value of shares and incentive options (estimated using an option pricing model) granted to key employees, consultants and advisors. The value of incentive options is measured at grant date and recognised over the period during which the option holders become unconditionally entitled to the options.
The decrease in the loss for the year ended 30 June 2017 compared to the year ended 30 June 2016 (restated) is is partly attributed to the impairment of exploration and evaluation assets of $50,000 in 2017 and $930,757 in 2016.
Financial Position
At 30 June 2017, the Group had cash reserves of $3,741,309 (2016: $175,362) and no debt, placing the Company in a good position to continue exploration on its current exploration and development activities.
At 30 June 2017, the Group had net assets of $10,116,176 (2016 Restated: $515,358), an increase of $9,600,818 compared with the previous year. This is largely attributable to the Company’s capital raising during the year which raised net proceeds of $5.2 million, less the net cash used in operating and investing activities of $1.6 million, and the net increase in exploration and evaluation expenditure of $6.2 million following the acquisition of the Couflens Project on 30 June 2017.
Earnings Per Share 2017
Cents
2016 Restated
Cents
Basic loss per share (1.21) (14.44)1
Note: 1 2016 basic loss per share is post 1 for 4 consolidation effective 17 June 2016.
Dividends
No dividends were paid or declared since the start of the financial year. No recommendation for payment of dividends has been made.

DIRECTORS’ REPORT (Continued)
10
OPERATING AND FINANCIAL REVIEW (CONTINUED)
Business Strategies and Prospects for Future Financial Years
The objective of the Group is to create long-term shareholder value through the discovery, development and acquisition of technically and economically viable mineral deposits.
To date, the Group has not commenced production of any minerals, nor has it identified a Mineral Resource in accordance with the JORC Code. To achieve its objective, the Group currently has the following business strategies and prospects over the medium term:
• defining sufficient high grade tungsten mineralisation within and adjacent to the Salau Mine area to justify commencement of mine feasibility studies;
• testing the gold potential within and adjacent to the Salau mine area;
• undertake regional exploration on the wider 42km² Couflens Project area where additional tungsten-copper-gold prospects have been identified; and
• conduct further field work to follow up targets identified at the Fraser Range Project.
All of these activities are inherently risky and the Board is unable to provide certainty of the expected results of these activities, or that any or all of these likely developments will be achieved. The material business risks faced by the Group that could have an effect on the Group’s future prospects, and how the Group manages these risks, include:
• The Company’s exploration properties may never be brought into production – the exploration for, and development of, mineral deposits involves a high degree of risk. Few properties which are explored are ultimately developed into producing mines. The Salau mine operated from April 1971 to November 1986. Since that time, the original mine portal has been barricaded up and as a result the Company has not been able to enter the mine to assess the condition of the existing mine development and underground infrastructure or conduct any due diligence activities. There is no guarantee that the Company will be able to utilise existing mine development and infrastructure or that it will identify sufficient resources or established economic qualities of reserves to re-establish mine operations. To mitigate this risk, the Company will undertake systematic and staged exploration and testing programs on its mineral properties (including the Couflens Project) and, subject to the results of these exploration programs, the Company will then progressively undertake a number of technical and economic studies with respect to its projects prior to making a decision to mine. However there can be no guarantee that the studies will confirm the technical and economic viability of the Company’s mineral properties or that the properties will be successfully brought into production;
• The Company’s activities at the Couflens Project are subject to the laws of France – The Couflens Project is located in the Region of Midi-Pyrenees, France and as such, the operations of the Company will be exposed to related risks and uncertainties associated with the country, regional and local jurisdictions. As part of the regulatory framework in France for exploration and mining activities, the Company will be required to engage with the local community. Opposition to the Project, or changes in local community support, along with any changes in mining or investment policies or in political attitude in France and, in particular to the mining, processing or use of tungsten, may adversely affect the operations, delay or impact the approval process or conditions imposed, increase exploration and development costs, or reduce profitability of the Company;
• The Company has contractual rights in the Couflens PER until regulatory approval is granted for the transfer of Couflens PER into MdS – Whilst the Company expects approval to be granted in due course, it may need to negotiate a satisfactory resolution if the transfer were not approved and appeals and other remedies are exhausted;
• The Company’s activities will require further capital – the exploration and any development of the Company’s exploration properties will require substantial additional financing. Failure to obtain sufficient financing may result in delaying, or the indefinite postponement of, exploration and any development of the Company’s properties or even a loss of property interest. There can be no assurance that additional capital or other types of financing will be available if needed or that, if available, the terms of such financing will be favourable to the Company;

Apollo Minerals Limited ANNUAL REPORT 2017 11
• The Company may be adversely affected by fluctuations in commodity prices, including tungsten and gold – the price of commodities fluctuate widely and are affected by numerous factors beyond the control of the Company. Future production, if any, from the Company’s mineral properties will be dependent upon the price of commodities being adequate to make these properties economic. The Company currently does not engage in any hedging or derivative transactions to manage commodity price risk. As the Company’s operations change, this policy will be reviewed periodically going forward; and
• Global financial conditions may adversely affect the Company’s growth and profitability – many industries, including the mineral resource industry, are impacted by these market conditions. Some of the key impacts include contraction in credit markets resulting in a widening of credit risk, devaluations and high volatility in global equity, commodity, foreign exchange and precious metal markets, and a lack of market liquidity. Due to the current nature of the Company’s activities, a slowdown in the financial markets or other economic conditions may adversely affect the Company’s growth and ability to finance its activities.
ENVIRONMENTAL REGULATION AND PERFORMANCE
The Group's operations are subject to various environmental laws and regulations under the relevant government's legislation. Full compliance with these laws and regulations is regarded as a minimum standard for all operations to achieve.
Instances of environmental non-compliance by an operation are identified either by external compliance audits or inspections by relevant government authorities.
There have been no known breaches of environmental laws and regulations by the Group during the financial year.
SIGNIFICANT CHANGES IN THE STATE OF AFFAIRS
(i) On 30 June 2017, the Company completed the acquisition of an 80% interest in the Couflens Project in southern France. The Couflens Project comprises a recently granted exploration permit that covers a 42km2 area in the Pyrenees region and includes the historic Salau mine, which was one of the world’s highest grade tungsten mines when it operated from 1971 to 1986.
Apollo Minerals acquired its interest in the Couflens Project through the acquisition of 100% of the shares in Ariege Tungstene SAS, which holds an 80% interest in Mines du Salat SAS. Consideration for the acquisition of Ariege included:
(a) A$250,000 cash paid on completion, and A$500,000 in deferred cash consideration payable in two instalments of A$250,000 upon satisfaction of performance milestones;
(b) 15,000,000 fully paid ordinary shares issued on completion; and
(c) 65,000,000 convertible performance shares issued on completion, which convert into fully paid ordinary shares upon upon satisfaction of performance milestones.
Following completion of the acquisition of its interest in the Couflens Project, Dr Michel Bonnemaison, a highly credentialed French geologist with specific expertise in gold deposits in France and Mr Ajay Kejriwal, an experienced European based corporate and capital markets executive, were appointed Non-Executive Directors of the Company effective 30 June 2017. Mr Richard Shemesian also retired as a Non-Executive Director following the completion of the acquisition.
(ii) On 12 October 2016, the Company appointed experienced mining executive, Mr Robert Behets, as a Non-Executive Director of the Company.
(iii) As announced in May 2016, the Company completed a recapitalisation in August 2016, including the placement of 42 million shares at an issue price of $0.05 to raise $2.1 million before costs, and a 1 for 1 non-renounceable entitlement issue of 62.4 million shares at an issue price of $0.05 to raise $3.12 million before costs.
Following completion of the initial placement, Mr Ian Middlemas was appointed Chairman and Mr Mark Pearce was appointed Non-Executive Director of the Company with effect from 8 July 2016. Mr Eric Finlayson and Mr Guy Roberston resigned as Non-Executive Directors effective the same date. Mr Robertson was also replaced as Company Secretary by Mr Clint McGhie.

DIRECTORS’ REPORT (Continued)
12
SIGNIFICANT EVENTS AFTER THE BALANCE DATE
As at the date of this report, there are no matters or circumstances which have arisen since 30 June 2017 that have significantly affected or may significantly affect:
• the operations, in financial years subsequent to 30 June 2017, of the Consolidated Entity;
• the results of those operations, in financial years subsequent to 30 June 2017, of the Consolidated Entity; or
• the state of affairs, in financial years subsequent to 30 June 2017, of the Consolidated Entity.
DIRECTORS' INTERESTS
As at the date of this report, the Directors' interests in the securities of the Company are as follows:
Interest in securities at the date of the report
Ordinary Shares(1)
Performance Shares(2)
$0.05 Options(3)
$0.075 Options(4)
$0.20 Options(5)
$0.25 Options(6)
Ian Middlemas 12,000,000 - - - - -
Robert Behets 2,500,000 - 500,000 500,000 500,000 500,000
Michel Bonnemaison 1,875,000 8,125,000 - - - -
Ajay Kejriwal(7) 13,125,000 56,875,000 - - - -
Mark Pearce 4,000,000 - 500,000 500,000 - -
Notes:
1 “Ordinary Shares” means fully paid ordinary shares in the capital of the Company. 2 “Performance Shares” means a performance share that will convert into ordinary shares upon satisfaction of relevant
milestones. 3 “$0.05 Options” means an option to subscribe for 1 ordinary Share in the capital of the Company at an exercise price of
$0.05 on or before 30 June 2018. 4 “$0.075 Options” means an option to subscribe for 1 ordinary Share in the capital of the Company at an exercise price of
$0.075 on or before 30 June 2019. 5 “$0.20 Options” means an option to subscribe for 1 ordinary Share in the capital of the Company at an exercise price of
$0.20 on or before 30 June 2020. 6 “$0.25 Options” means an option to subscribe for 1 ordinary Share in the capital of the Company at an exercise price of
$0.25 on or before 30 June 2021. 7 Mr Kejriwal’s interest in the Ordinary Shares and Performance Shares is an indirect interest in the securities held by
Juniper Capital Partners Limited. Mr Kejriwal has been nominated as a Director by Juniper Capital Partners Limited and he may be able to indirectly influence voting of the securities.
SHARE OPTIONS At the date of this report the following options have been issued by the Company over unissued capital:
• 1,678,125 unlisted options exercisable at $0.52 each on or before 28 February 2018;
• 1,500,000 unlisted options exercisable at $0.05 each on or before 30 June 2018;
• 2,000,000 unlisted options exercisable at $0.075 each on or before 30 June 2019;
• 1,250,000 unlisted options exercisable at $0.20 each on or before 30 June 2020;
• 1,500,000 unlisted options exercisable at $0.32 each on or before 30 November 2020; and
• 1,600,000 unlisted options exercisable at $0.25 each on or before 30 June 2021. During the year ended 30 June 2017 and up to the date of this report, no ordinary shares have been issued as a result of the exercise of options.

Apollo Minerals Limited ANNUAL REPORT 2017 13
INDEMNIFICATION AND INSURANCE OF OFFICERS AND AUDITORS
The Constitution of the Company requires the Company, to the extent permitted by law, to indemnify any person who is or has been a director or officer of the Company or Group for any liability caused as such a director or officer and any legal costs incurred by a director or officer in defending an action for any liability caused as such a director or officer.
During or since the end of the financial year, no amounts have been paid by the Company or Group in relation to the above indemnities. During the financial year, $8,409 insurance premiums were paid by the Group (2016: $7,110) to insure against a liability incurred by a person who is or has been a director or officer of the Company or Group.
PROCEEDINGS ON BEHALF OF COMPANY
No person has applied for leave of court to bring proceedings on behalf of the Company or intervene in any proceedings to which the Company is a part for the purpose of taking responsibility on behalf of the Company for all or any part of those proceedings.
The Company was not a party to any such proceedings during the year.
DIRECTORS' MEETINGS
The number of meetings of directors held during the year and the number of meetings attended by each director were as follows:
Board Meetings
Number eligible to attend Number attended
Current Directors
Ian Middlemas 3 2
Robert Behets 1 1
Michel Bonnemaison - -
Ajay Kejriwal - -
Mark Pearce 3 3
Former Directors
Richard Shemesian 4 4
Eric Finlayson 1 1
Guy Robertson 1 1
There were no Board committees during the financial year. The Board as a whole currently performs the functions of an Audit Committee, Risk Committee, Nomination Committee, and Remuneration Committee, however this will be reviewed should the size and nature of the Company’s activities change.

DIRECTORS’ REPORT (Continued)
14
REMUNERATION REPORT (AUDITED)
This Remuneration Report, which forms part of the Directors’ Report, sets out information about the remuneration of Key Management Personnel (“KMP”) of the Group.
Details of Key Management Personnel
The KMP of the Group during or since the end of the financial year were as follows: Current Directors
Mr Ian Middlemas Chairman (appointed 8 July 2016) Mr Robert Behets Non-Executive Director (appointed 12 October 2016) Dr Michel Bonnemaison Non-Executive Director (appointed 30 June 2017) Mr Ajay Kejriwal Non-Executive Director (appointed 30 June 2017) Mr Mark Pearce Non-Executive Director (appointed 8 July 2016) Former Directors
Mr Richard Shemesian Non-Executive Director (resigned 30 June 2017) Mr Eric Finlayson Non-Executive Director (resigned 8 July 2016) Mr Guy Robertson Non-Executive Director (resigned 8 July 2016) Other KMP
Mr Clint McGhie Company Secretary (appointed 8 July 2016) Unless otherwise disclosed, the KMP held their position from 1 July 2016 until the date of this report.
Remuneration Policy
The Group’s remuneration policy for its KMP has been developed by the Board taking into account the size of the Group, the size of the management team for the Group, the nature and stage of development of the Group’s current operations, and market conditions and comparable salary levels for companies of a similar size and operating in similar sectors.
In addition to considering the above general factors, the Board has also placed emphasis on the following specific issues in determining the remuneration policy for KMP:
• the Group is currently focused on undertaking exploration and appraisal activities on existing projects, and identifying and acquiring suitable new resource projects;
• risks associated with small market capitalisation resource companies whilst exploring and developing projects; and
• other than profit which may be generated from asset sales, the Company does not expect to be undertaking profitable operations until sometime after the commencement of commercial production on any of its projects.
Executive Remuneration
The Group’s remuneration policy is to provide a fixed remuneration component and a performance based component (short term incentive and long term incentive). The Board believes that this remuneration policy is appropriate given the considerations discussed in the section above and is appropriate in aligning executives’ objectives with shareholder and business objectives.
Fixed Remuneration
Fixed remuneration consists of base salaries, as well as employer contributions to superannuation funds and other non-cash benefits. Fixed remuneration is reviewed annually by the Board. The process consists of a review of company and individual performance, relevant comparative remuneration externally and internally and, where appropriate, external advice on policies and practices.

Apollo Minerals Limited ANNUAL REPORT 2017 15
Performance Based Remuneration – Short Term Incentive
Executives may be entitled to an annual cash bonus upon achieving various key performance indicators (“KPI’s”), as set by the Board. Having regard to the current size, nature and opportunities of the Company, the Board has determined that these KPI’s will include measures such as successful completion of exploration activities (e.g. completion of exploration programs within budgeted timeframes and costs), development activities (e.g. completion of scoping and/or feasibility studies), corporate activities (e.g. recruitment of key personnel) and business development activities (e.g. project acquisitions and capital raisings). Prior to the end of each financial year, the Board assesses performance against these criteria.
Given recent market conditions and the status of the Company’s operations, the Board has determined not to pay any cash bonuses in respect to the 2017 financial year (2016: Nil).
Performance Based Remuneration – Long Term Incentive
The Board has chosen to issue Incentive Options (where appropriate) to some executives as a key component of the incentive portion of their remuneration, in order to attract and retain the services of the executives and to provide an incentive linked to the performance of the Company. The Board considers that each executive’s experience in the resources industry will greatly assist the Company in progressing its projects to the next stage of development and the identification of new projects.
The Board may grant Incentive Options to executives with exercise prices at and/or above market share price (at the time of agreement). As such, Incentive Options granted to executives will generally only be of benefit if the executives perform to the level whereby the value of the Company increases sufficiently to warrant exercising the Incentive Options granted. Other than service-based vesting conditions, there are no additional performance criteria on the Incentive Options granted to executives, as given the speculative nature of the Company’s activities and the small management team responsible for its running, it is considered the performance of the executives and the performance and value of the Company are closely related. The Company prohibits executives entering into arrangements to limit their exposure to Incentive Options granted as part of their remuneration package.
Non-Executive Director Remuneration
The Board’s policy is to remunerate Non-Executive Directors at market rates for comparable companies for time, commitment and responsibilities. Given the current size, nature and risks of the Company, Incentive Options have also been used to attract and retain Non-Executive Directors. The Board determines payments to the Non-Executive Directors and reviews their remuneration annually, based on market practice, duties and accountability. Independent external advice is sought when required.
The maximum aggregate amount of fees that can be paid to Non-Executive Directors is subject to approval by shareholders at a General Meeting. Director’s fees paid to Non-Executive Directors accrue on a daily basis. Fees for Non-Executive Directors are not linked to the performance of the Group. However, to align Directors’ interests with shareholder interests, the Directors are encouraged to hold shares in the Company and Non-Executive Directors may in limited circumstances receive Incentive Options in order to secure their services.
The Company prohibits Non-Executive Directors from entering into arrangements to limit their exposure to Incentive Options granted as part of their remuneration package.
Fees for the Chairman are presently set at $36,000 (2016: $60,000) per annum. Fees for Non-Executive Directors’ are presently set at $20,000 per annum plus compulsory superannuation where applicable (2016: $36,000 - $70,000 inclusive of superannuation). These fees cover main board activities only.
Non-Executive Directors may receive additional remuneration for other services provided to the Company, including but not limited to, membership of committees.

DIRECTORS’ REPORT (Continued)
16
REMUNERATION REPORT (AUDITED) (Continued)
Relationship between Remuneration of KMP and Shareholder Wealth
During the Company’s exploration and development phases of its business, the Board anticipates that the Company will retain earnings (if any) and other cash resources for the exploration and development of its resource projects. Accordingly the Company does not currently have a policy with respect to the payment of dividends and returns of capital. Therefore there was no relationship between the Board’s policy for determining, or in relation to, the nature and amount of remuneration of KMP and dividends paid and returns of capital by the Company during the current and previous four financial years.
The Board did not determine, and in relation to, the nature and amount of remuneration of the KMP by reference to changes in the price at which shares in the Company traded between the beginning and end of the current and the previous four financial years. However, as noted above, a number of KMP have received Incentive Options which generally will only be of value should the value of the Company’s shares increase sufficiently to warrant exercising the Incentive Options.
Relationship between Remuneration of KMP and Earnings
As discussed above, the Company is currently undertaking exploration activities and is actively pursuing new business opportunities, and does not expect to be undertaking profitable operations (other than by way of material asset sales, none of which is currently planned) until sometime after the successful commercialisation, production and sales of commodities from one or more of its projects. Accordingly the Board does not consider earnings during the current and previous four financial years when determining, and in relation to, the nature and amount of remuneration of KMP.
The Board does not directly base remuneration levels on the Company’s share price or movement in the share price over the financial year. However, as noted above, a number of KMP have received Incentive Options which generally will only be of value should the value of the Company’s shares increase sufficiently to warrant exercising the Incentive Options granted.
Emoluments of Directors and Other KMP
Details of the nature and amount of each element of the emoluments of each of the KMP of Apollo Minerals Limited are as follows:
2017
Short-term benefits Share-based payments
Total
$
Percentage performance
related
%
Salary & fees
$
Super-annuation
$
Options
$
Current Directors
Ian Middlemas(1) 35,250 - - 35,250 -
Robert Behets(2) 106,951 1,372 161,786 270,109 59.9%
Michel Bonnemaison(3) - - - - -
Ajay Kejriwal(4) - - - - -
Mark Pearce(5) 19,603 1,862 39,854 61,319 65.0%
Former Directors
Richard Shemesian(6) 20,000 - - 20,000 -
Eric Finlayson(7) - - - - -
Guy Robertson(8) 5,745 - - 5,745 -
Other KMP
Clint McGhie(9) - - 73,482 73,482 100.0%
Total 187,549 3,234 275,122 465,905
Notes: 1 Mr Middlemas was appointed Chairman on 8 July 2016.
Apollo Minerals Limited ANNUAL REPORT 2017 17
2 Mr Behets was appointed Non-Executive Director on 12 October 2016. In addition to Non-Executive Directors fees, Ouro Preto Pty Ltd, an entity associated with Mr Behets, was paid, or is payable, A$92,507 for additional services provided in respect of exploration and business development activities which is included in Mr Behets’ salary & fees amount.
3 Dr Bonnemaison was appointed Non-Executive Director on 30 June 2017. 4 Mr Kejriwal was appointed Non-Executive Director on 30 June 2017. 5 Mr Pearce was appointed Non-Executive Director on 8 July 2016. 6 Mr Shemesian resigned as a Director on 30 June 2017. 7 Mr Finlayson resigned as a Director on 8 July 2016. 8 Mr Robertson resigned as a Director and Company Secretary on 8 July 2016. In addition to Non-Executive Director fees,
Integrated CFO Solutions Pty Ltd, an entity associated with Mr Robertson was paid $5,000 for the provision of company secretarial and CFO support services to the Company in July 2016 which is included in Mr Robertson’s salary & fees amount.
9 Mr McGhie was appointed Company Secretary on 8 July 2016. Mr McGhie provides services as the Company Secretary through a services agreement with Apollo Group Pty Ltd (‘Apollo’). During the year, Apollo was paid or is payable A$225,000 for the provision of serviced office facilities and administrative, accounting, company secretarial and transaction services to the Group.
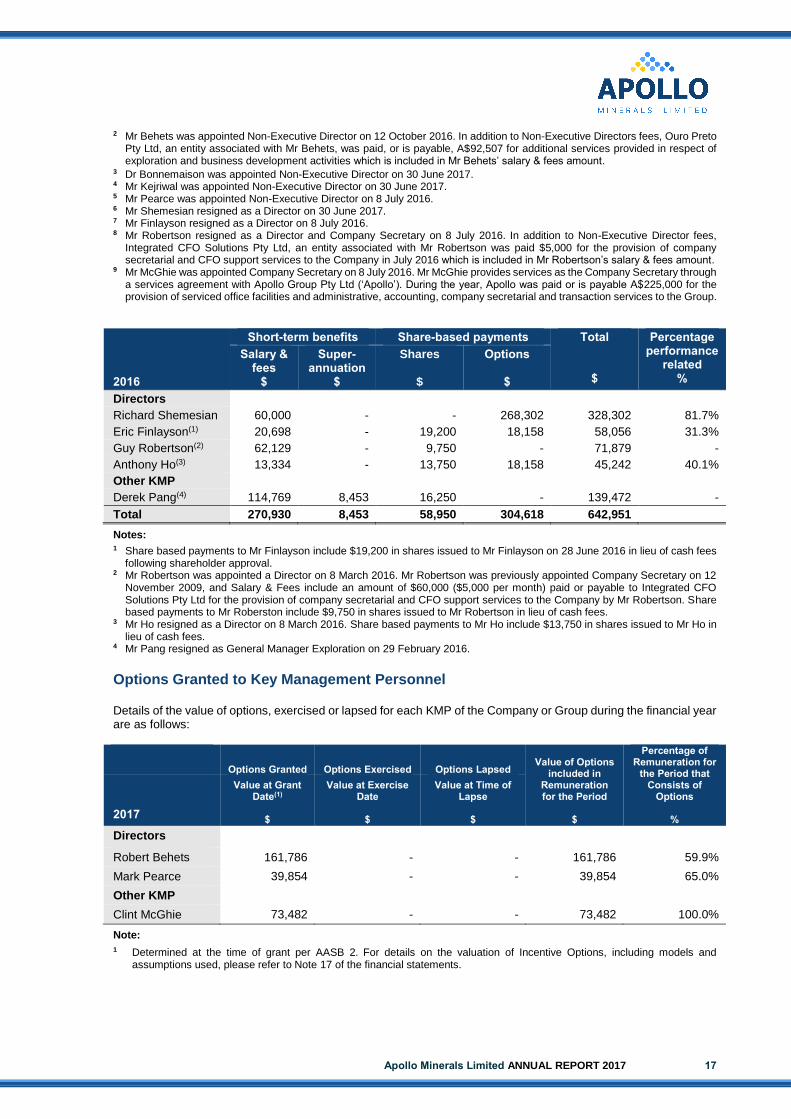
2016
Short-term benefits Share-based payments Total
$
Percentage performance
related %
Salary & fees
$
Super-annuation
$
Shares
$
Options
$
Directors
Richard Shemesian 60,000 - - 268,302 328,302 81.7%
Eric Finlayson(1) 20,698 - 19,200 18,158 58,056 31.3%
Guy Robertson(2) 62,129 - 9,750 - 71,879 -
Anthony Ho(3) 13,334 - 13,750 18,158 45,242 40.1%
Other KMP
Derek Pang(4) 114,769 8,453 16,250 - 139,472 -
Total 270,930 8,453 58,950 304,618 642,951
Notes: 1 Share based payments to Mr Finlayson include $19,200 in shares issued to Mr Finlayson on 28 June 2016 in lieu of cash fees
following shareholder approval. 2 Mr Robertson was appointed a Director on 8 March 2016. Mr Robertson was previously appointed Company Secretary on 12
November 2009, and Salary & Fees include an amount of $60,000 ($5,000 per month) paid or payable to Integrated CFO Solutions Pty Ltd for the provision of company secretarial and CFO support services to the Company by Mr Robertson. Share based payments to Mr Roberston include $9,750 in shares issued to Mr Robertson in lieu of cash fees.
3 Mr Ho resigned as a Director on 8 March 2016. Share based payments to Mr Ho include $13,750 in shares issued to Mr Ho in lieu of cash fees.
4 Mr Pang resigned as General Manager Exploration on 29 February 2016.
Options Granted to Key Management Personnel
Details of the value of options, exercised or lapsed for each KMP of the Company or Group during the financial year are as follows:
Options Granted Options Exercised Options Lapsed Value of Options
included in Remuneration for the Period
$
Percentage of Remuneration for
the Period that Consists of
Options
% 2017
Value at Grant Date(1)
$
Value at Exercise Date
$
Value at Time of Lapse
$
Directors
Robert Behets 161,786 - - 161,786 59.9%
Mark Pearce 39,854 - - 39,854 65.0%
Other KMP
Clint McGhie 73,482 - - 73,482 100.0%
Note:
1 Determined at the time of grant per AASB 2. For details on the valuation of Incentive Options, including models and assumptions used, please refer to Note 17 of the financial statements.

DIRECTORS’ REPORT (Continued)
18
REMUNERATION REPORT (AUDITED) (Continued)
Options Granted to Key Management Personnel (Continued)
Details of unlisted Incentive Options granted by the Company to each KMP of the Group during the financial year are as follows:
2017
Security
Grant Date
Expiry Date
Exercise Price
$
Grant Date Fair
Value(1)
$
No. Granted
No. Vested at 30 June
2017
Directors
Robert Behets Options 7-Jul-16 30-Jun-18 0.05 0.0400 500,000 500,000
Options 7-Jul-16 30-Jun-19 0.075 0.0397 500,000 500,000
Options 21-Jun-17 30-Jun-20 0.20 0.1187 500,000 500,000
Options 21-Jun-17 30-Jun-21 0.25 0.1252 500,000 500,000
Mark Pearce Options 7-Jul-16 30-Jun-18 0.05 0.0400 500,000 500,000
Options 7-Jul-16 30-Jun-19 0.075 0.0397 500,000 500,000
Other KMP
Clint McGhie Options 21-Jun-17 30-Jun-20 0.20 0.1187 250,000 250,000
Options 21-Jun-17 30-Jun-21 0.25 0.1252 350,000 350,000
Note:
1 Determined at the time of grant per AASB 2. For details on the valuation of Incentive Options, including models and assumptions used, please refer to Note 17 of the financial statements.
Option Holdings of Key Management Personnel
2017
Held at 1 July 2016
(#)
Granted as Compen-
sation
(#)
Expired
(#)
Net Change Other
(#)
Held at 30 June 2017
(#)
Vested and Exercisable at 30 June 2017
(#)
Current Directors
Ian Middlemas -(1) - - - - -
Robert Behets 1,000,000(1)(3) 1,000,000 - - 2,000,000 2,000,000
Michel Bonnemaison -(1) - - - - -
Ajay Kejriwal -(1) - - - - -
Mark Pearce 1,000,000(1) - - - 1,000,000 1,000,000
Former Directors
Richard Shemesian 3,375,000 - - - 3,375,000(2) 3,375,000
Eric Finlayson 193,750 - - - 193,750(2) 193,750
Guy Robertson 22,500 - - - 22,500(2) 22,500
Other KMP
Clint McGhie -(1) 600,000 - - 600,000 600,000
Notes: 1 As at date of appointment. 2 As at date of resignation. 3 Issued as compensation prior to appointment as a Director.
Apollo Minerals Limited ANNUAL REPORT 2017 19
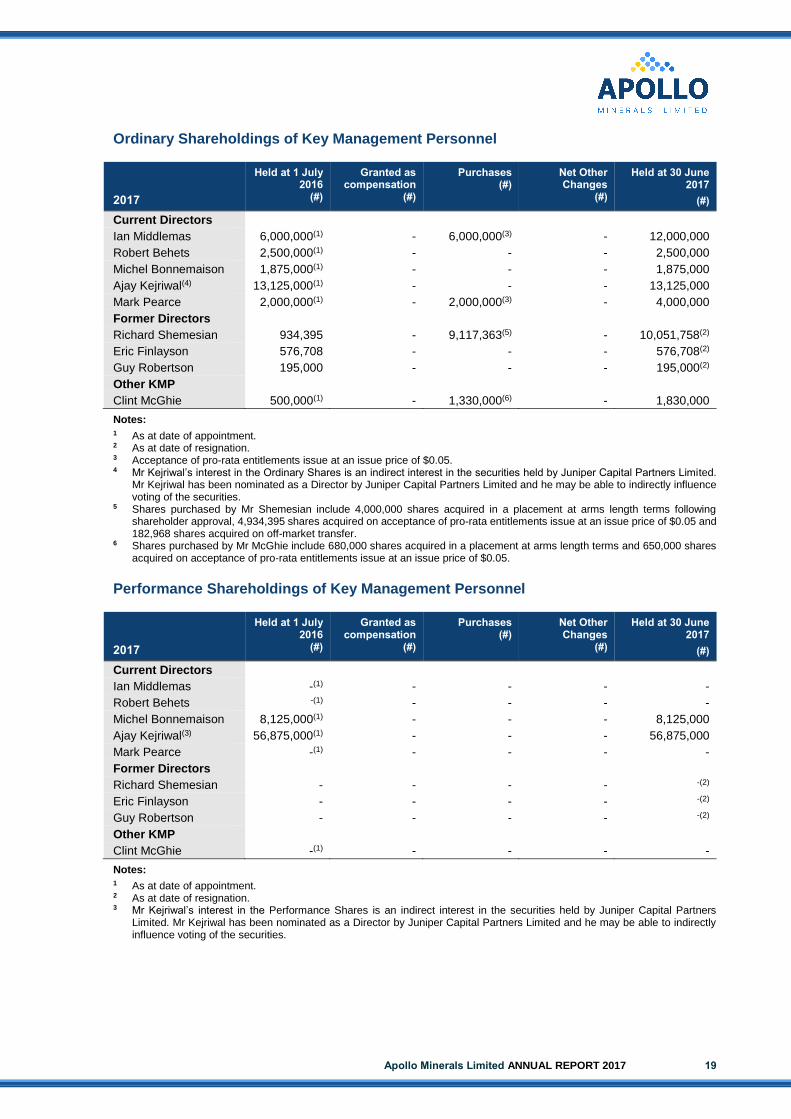
Ordinary Shareholdings of Key Management Personnel
2017
Held at 1 July 2016
(#)
Granted as compensation
(#)
Purchases (#)
Net Other Changes
(#)
Held at 30 June 2017
(#)
Current Directors
Ian Middlemas 6,000,000(1) - 6,000,000(3) - 12,000,000
Robert Behets 2,500,000(1) - - - 2,500,000
Michel Bonnemaison 1,875,000(1) - - - 1,875,000
Ajay Kejriwal(4) 13,125,000(1) - - - 13,125,000
Mark Pearce 2,000,000(1) - 2,000,000(3) - 4,000,000
Former Directors
Richard Shemesian 934,395 - 9,117,363(5) - 10,051,758(2)
Eric Finlayson 576,708 - - - 576,708(2)
Guy Robertson 195,000 - - - 195,000(2)
Other KMP
Clint McGhie 500,000(1) - 1,330,000(6) - 1,830,000
Notes: 1 As at date of appointment. 2 As at date of resignation. 3 Acceptance of pro-rata entitlements issue at an issue price of $0.05. 4 Mr Kejriwal’s interest in the Ordinary Shares is an indirect interest in the securities held by Juniper Capital Partners Limited.
Mr Kejriwal has been nominated as a Director by Juniper Capital Partners Limited and he may be able to indirectly influence voting of the securities.
5 Shares purchased by Mr Shemesian include 4,000,000 shares acquired in a placement at arms length terms following shareholder approval, 4,934,395 shares acquired on acceptance of pro-rata entitlements issue at an issue price of $0.05 and 182,968 shares acquired on off-market transfer.
6 Shares purchased by Mr McGhie include 680,000 shares acquired in a placement at arms length terms and 650,000 shares acquired on acceptance of pro-rata entitlements issue at an issue price of $0.05.
Performance Shareholdings of Key Management Personnel
2017
Held at 1 July 2016
(#)
Granted as compensation
(#)
Purchases (#)
Net Other Changes
(#)
Held at 30 June 2017
(#)
Current Directors
Ian Middlemas -(1) - - - -
Robert Behets -(1) - - - -
Michel Bonnemaison 8,125,000(1) - - - 8,125,000
Ajay Kejriwal(3) 56,875,000(1) - - - 56,875,000
Mark Pearce -(1) - - - -
Former Directors
Richard Shemesian - - - - -(2)
Eric Finlayson - - - - -(2)
Guy Robertson - - - - -(2)
Other KMP
Clint McGhie -(1) - - - -
Notes: 1 As at date of appointment. 2 As at date of resignation. 3 Mr Kejriwal’s interest in the Performance Shares is an indirect interest in the securities held by Juniper Capital Partners
Limited. Mr Kejriwal has been nominated as a Director by Juniper Capital Partners Limited and he may be able to indirectly influence voting of the securities.
DIRECTORS’ REPORT (Continued)
20
REMUNERATION REPORT (AUDITED) (Continued)
Employment Contracts with Directors and Key Management Personnel
Current Directors
Mr Ian Middlemas, Chairman, has a letter of appointment confirming the terms and conditions of his appointment as a non-executive director and chairman of the Company dated 8 July 2016. In accordance with the terms of this letter of appointment, Mr Middlemas receives a fee of $36,000 per annum plus superannuation.
Mr Robert Behets, Non-Executive Director, has a letter of appointment confirming the terms and condtions of his appointment as a non-executive director of the Company dated 21 February 2017. In accordance with the terms of this letter of appointment, Mr Behets receives a fee of $20,000 per annum plus superannuation. Mr Behets also has a services agreement with the Company effective 15 August 2016, which provides for a consultancy fee at the rate of $1,000 per day for management and technical services provided by Mr Behets. Either party may terminate the agreement without penalty or payment by giving one months’ notice.
Dr Michel Bonnemaison, Non-Executive Director, has a letter of appointment confirming the terms and conditions of his appointment as a non-executive director of the Company dated 28 June 2017. In accordance with the terms of this letter of appointment, Dr Bonnemaison currently receives a fee of $20,000 per annum. With effect from 1 August 2017, Dr Bonnemaison will receive gross remuneration of €5,000 per month (plus any statutory social security and tax charges attributable to the Company) in respect of his mandate as President of Mines du Salat SAS. Dr Bonnemaison will also be employed as CEO of Mines du Salat on terms yet to be finalised, but including gross remuneration of €10,000 per month (plus any statutory social security and tax charges attributable to the Company). Upon commencement as CEO of Mines du Salat, the Non-Executive Director fees payable to Dr Bonnemaison under his letter of appointment dated 28 June 2017 will be considered to form part of the gross remuneration paid for the role of CEO.
Mr Ajay Kejriwal, Non-Executive Director, has a letter of appointment confirming the terms and conditions of his appointment as a non-executive director of the Company dated 28 June 2017. In accordance with the terms of this letter of appointment, Mr Kejriwal receives a fee of $20,000 per annum.
Mr Mark Pearce, Non-Executive Director, has a letter of appointment confirming the terms and conditions of his appointment as a non-executive director of the Company dated 8 July 2016. In accordance with the terms of this letter of appointment, Mr Pearce receives a fee of $20,000 per annum plus superannuation.
Loans from Key Management Personnel
No loans were provided to or received from Key Management Personnel during the year ended 30 June 2017 (2016: Nil).
Other Transactions
Apollo Group Pty Ltd (‘Apollo Group’), a Company of which Mr Mark Pearce is a director and beneficial shareholder, provides corporate, administration and company secretarial services and serviced office facilities to the Company under a services agreement effective from 1 July 2016. Either party can terminate the services agreement at any time for any reason by giving one months’ written notice. Apollo Group received a monthly retainer of $15,000 (exclusive of GST) for the provision of these services for the period from 1 July 2016 to 31 March 2017, and $20,000 per month from 1 April 2017 to 30 June 2017. The monthly retainer is reviewed every six to twelve months and is based on Apollo Group’s budgeted cost of providing the services to the Company (and other companies utilising same or similar services from Apollo) for the next six to twelve month period, with minimal or no mark-up. From time to time, Apollo Group may also receive additional fees (as agreed with the Company) in respect of services provided by Apollo Group to the Company that are not included in the agreed services covered by the monthly retainer. During the year, Apollo Group was paid additional fees of $30,000 for services in relation to a transaction.

Apollo Minerals Limited ANNUAL REPORT 2017 21
Mines du Salat SAS has signed a services agreement dated 1 September 2017 with SARL E-Mines (‘E-Mines’), a Company of which Dr Michel Bonnemaison is a director and beneficial shareholder. In accordance with the agreement, E-Mines will provide geoscience consulting services to Mines du Salat in support of the Company’s Couflens Project for a 12 month period from 1 September 2017. There is a schedule of rates applicable to the services provided based on the relevant qualifications and experience of the individuals providing the services ranging from €350 to €1,100 per day. The agreement may be extended by mutual agreement and can be terminated by either party with 30 days notice without penalty.
End of Remuneration Report
NON-AUDIT SERVICES
There were no non-audit services provided by the auditor (or by another person or firm on the auditor’s behalf) during the financial year.
AUDITOR'S INDEPENDENCE DECLARATION
The lead auditor's independence declaration for the year ended 30 June 2017 has been received and can be found on page 22 of the Directors' Report. Signed in accordance with a resolution of the directors.
ROBERT BEHETS Director
28 September 2017
Competent Person Statement
The information in this report that relates to Exploration Results from the Couflens Project in France is based on information compiled by Robert Behets, a Competent Person who is a Fellow of The Australasian Institute of Mining and Metallurgy and a Member of the Australian Institute of Geoscientists. Mr Behets is a holder of shares and options in, and is a director of, Apollo Minerals Limited. Mr Behets has sufficient experience which is relevant to the style of mineralisation and type of deposit under consideration and to the activity which he is undertaking to qualify as a Competent Person as defined in the 2012 Edition of the ‘Australasian Code for Reporting of Exploration Results, Mineral Resources and Ore Reserves’. Mr Behets consents to the inclusion in the report of the matters based on his information in the form and context in which it appears.
.

AUDITOR’S INDEPENDENCE DECLARATION
22
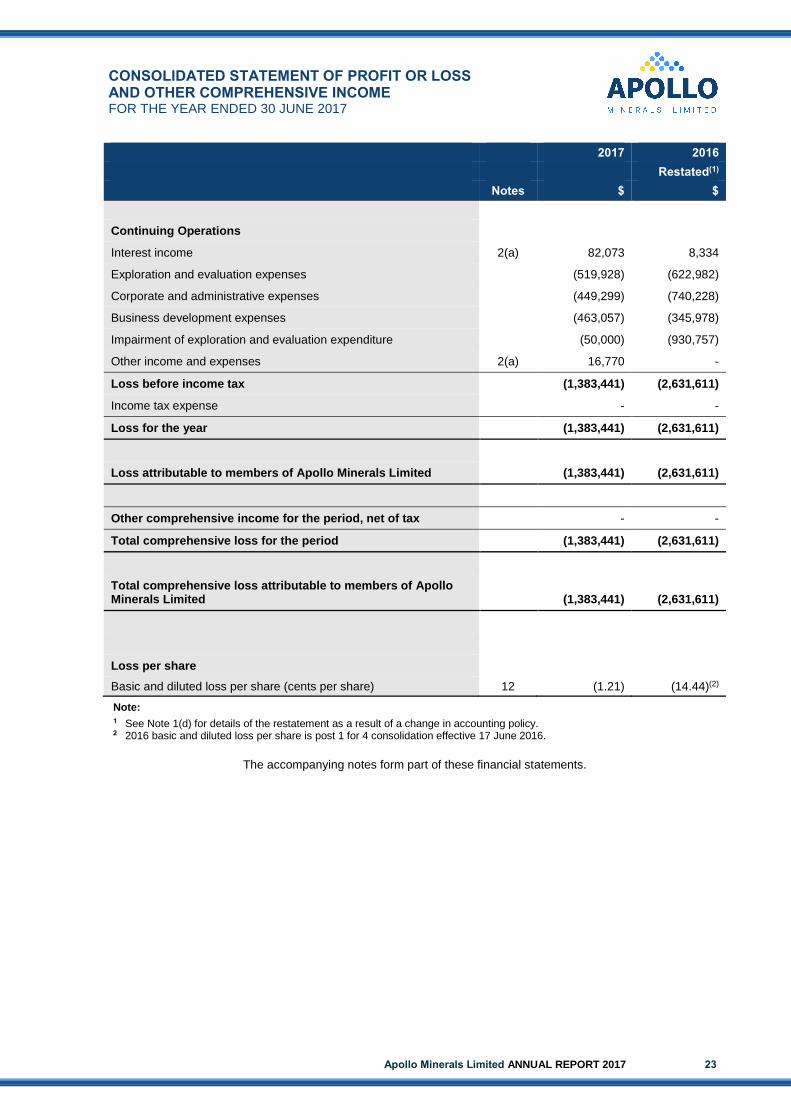
CONSOLIDATED STATEMENT OF PROFIT OR LOSS AND OTHER COMPREHENSIVE INCOME FOR THE YEAR ENDED 30 JUNE 2017
Apollo Minerals Limited ANNUAL REPORT 2017 23
2017 2016
Restated(1)
Notes $ $
Continuing Operations
Interest income 2(a) 82,073 8,334
Exploration and evaluation expenses (519,928) (622,982)
Corporate and administrative expenses (449,299) (740,228)
Business development expenses (463,057) (345,978)
Impairment of exploration and evaluation expenditure (50,000) (930,757)
Other income and expenses 2(a) 16,770 -
Loss before income tax (1,383,441) (2,631,611)
Income tax expense - -
Loss for the year (1,383,441) (2,631,611)
Loss attributable to members of Apollo Minerals Limited (1,383,441) (2,631,611)
Other comprehensive income for the period, net of tax - -
Total comprehensive loss for the period (1,383,441) (2,631,611)
Total comprehensive loss attributable to members of Apollo Minerals Limited
(1,383,441) (2,631,611)
Loss per share
Basic and diluted loss per share (cents per share) 12 (1.21) (14.44)(2)
Note: 1 See Note 1(d) for details of the restatement as a result of a change in accounting policy. 2 2016 basic and diluted loss per share is post 1 for 4 consolidation effective 17 June 2016.
The accompanying notes form part of these financial statements.

CONSOLIDATED STATEMENT OF FINANCIAL POSITION AS AT 30 JUNE 2017
24
2017
2016
As at 1 July 2015
Restated(1) Restated(1)
Notes $ $ $
ASSETS
Current Assets
Cash and cash equivalents 11(b) 3,741,309 175,362 808,308
Trade and other receivables 4 122,926 14,785 757,665
Total Current Assets 3,864,235 190,147 1,565,973
Non-Current Assets
Property, plant and equipment 5 4,835 - -
Exploration and evaluation assets 6 6,667,645 500,000 1,314,656
Total Non-Current Assets 6,672,480 500,000 1,314,656
TOTAL ASSETS 10,536,715 690,147 2,880,629
LIABILITIES
Current Liabilities
Trade and other payables 7 420,539 174,789 327,728
Total Current Liabilities 420,539 174,789 327,728
TOTAL LIABILITIES 420,539 174,789 327,728
NET ASSETS 10,116,176 515,358 2,552,901
EQUITY
Contributed equity 8 44,072,803 35,940,353 35,650,903
Reserves 9 2,124,395 690,188 686,391
Accumulated losses 10 (37,248,920) (36,115,183) (33,784,393)
Equity Attributable To Members of Apollo Minerals Limited 8,948,278 515,358 2,552,901
Non-controlling interests 1,167,898 - -
TOTAL EQUITY 10,116,176 515,358 2,552,901
Note: 1 See Note 1(d) for details of the restatement as a result of a change in accounting policy.
The accompanying notes form part of these financial statements.

CONSOLIDATED STATEMENT OF CHANGES IN EQUITY FOR THE YEAR ENDED 30 JUNE 2017
Apollo Minerals Limited ANNUAL REPORT 2017 25
Attributable to the equity holders of the parent
Contributed
Equity
Share based
Payment Reserve
Accumulated Losses Total
Non-controlling
interests Total
Equity
$ $ $ $ $ $
Balance at 1 July 2016 35,940,353 690,188 (36,115,183) 515,358 - 515,358
Net loss for the year - - (1,383,441) (1,383,441) - (1,383,441)
Total comprehensive income/(loss) for the year - - (1,383,441) (1,383,441) - (1,383,441)
Transactions with owners recorded directly in equity
Issue of shares 8,198,885 - - 8,198,885 - 8,198,885
Share issue costs (66,435) - - (66,435) - (66,435)
Share based payments - 1,683,911 - 1,683,911 - 1,683,911
Expiry of incentive options - (249,704) 249,704 - - -
Initial recognition of Non-controlling interests - - - - 1,167,898 1,167,898
Balance at 30 June 2017 44,072,803 2,124,395 (37,248,920) 8,948,278 1,167,898 10,116,176
Balance at 1 July 2015 35,650,903 686,391 (27,381,438) 8,955,856 - 8,955,856
Adjustment on change in accounting policy(1) - - (6,402,955) (6,402,955) - (6,402,955)
Balance at 1 July 2015 (Restated) 35,650,903 686,391 (33,784,393) 2,552,901 - 2,552,901
Net loss for the year (Restated) - - (2,631,611) (2,631,611) - (2,631,611)
Total comprehensive income/(loss) for the year - - (2,631,611) (2,631,611) - (2,631,611)
Transactions with owners recorded directly in equity
Issue of shares 289,450 - - 289,450 - 289,450
Expiry of options - (300,821) 300,821 - - -
Share based payments - 304,618 - 304,618 - 304,618
Balance at 30 June 2016 (Restated) 35,940,353 690,188 (36,115,183) 515,358 - 515,358
Note: 1 See Note 1(d) for details of the restatement as a result of a change in accounting policy.
The accompanying notes form part of these financial statements.

CONSOLIDATED STATEMENT OF CASH FLOWS FOR THE YEAR ENDED 30 JUNE 2017
26
2017 2016
Restated(1)
Notes $ $
Operating activities
Payments to suppliers and employees (1,085,560) (1,345,885)
Research and development tax rebate - 665,522
GST refunds received 51,498 103,794
Interest received 82,073 13,623
Net cash flows used in operating activities 11(a) (951,989) (562,946)
Investing activities
Proceeds from sale of exploration and evaluation assets 50,000 -
Purchase of property, plant and equipment (4,932) -
Acquisition of a subsidiary, net of cash acquired 13 (691,250) -
Payment for acquisition of exploration assets - (70,000)
Net cash flows used in investing activities (646,182) (70,000)
Financing activities
Proceeds from issue of shares 5,219,104 -
Share issue costs (54,986) -
Net cash flows from financing activities 5,164,118 -
Net increase/(decrease) in cash and cash equivalents 3,565,947 (632,946)
Cash and cash equivalents at the beginning of the year 175,362 808,308
Cash and cash equivalents at the end of the year 11(b) 3,741,309 175,362
Note: 1 See Note 1(d) for details of the restatement as a result of a change in accounting policy.
The accompanying notes form part of these financial statements.

NOTES TO THE FINANCIAL STATEMENTS FOR THE YEAR ENDED 30 JUNE 2017
Apollo Minerals Limited ANNUAL REPORT 2017 27
1. STATEMENT OF SIGNIFICANT ACCOUNTING POLICIES
The significant accounting policies adopted in preparing the financial report of Apollo Minerals Limited (“Apollo Minerals” or “Company”) and its consolidated entities (“Consolidated Entity” or “Group”) for the year ended 30 June 2017 are stated to assist in a general understanding of the financial report.
Apollo Minerals is a Company limited by shares, incorporated and domiciled in Australia, whose shares are publicly traded on the Australian Securities Exchange.
The financial report of the Group for the year ended 30 June 2017 was authorised for issue in accordance with a resolution of the Directors on 26 September 2017.
(a) Basis of Preparation
The financial report is a general purpose financial report, which has been prepared in accordance with Australian Accounting Standards (“AASBs”) adopted by the Australian Accounting Standards Board (“AASB”) and the Corporations Act 2001.
The financial report has been prepared on a historical cost basis. The financial report is presented in Australian dollars.
The consolidated financial statements have been prepared on a going concern basis which assumes the continuity of normal business activity and the realisation of assets and the settlement of liabilities in the ordinary course of business.
The Consolidated Entity has incurred a net loss after tax of $1,383,441 (2016: loss of $2,631,611) and net cash outflows used in operations of $951,989 (2016: outflows of $562,946). The ability of the Consolidated Entity to continue as a going concern is dependent on the ability of the consolidated entity to manage its planned exploration activities and other expenses including minimum expenditure so as not to exceed the existing cash reserves. The Consolidated Entity’s forecast for the period to 30 September 2018 indicates that if required, the Consolidated Entity will have sufficient cash to continue the exploration without raising additional funds.
The Group has updated the classification of expenses to make the Statement of Profit or Loss and Other Comprehensive Income more relevant to users of the financial report. This has resulted in the reclassification of some items in the prior period, however, has not impacted upon the reported loss for the period or earnings per share.
(b) Statement of Compliance
The financial report complies with Australian Accounting Standards and International Financial Reporting Standards (“IFRS”) as issued by the International Accounting Standards Board.
In the current year, the Group has adopted all of the new and revised Standards and Interpretations issued by the AASB that are relevant to its operations and effective for the current annual reporting period. New and revised standards and amendments thereof and interpretations effective for the current reporting period that are relevant to the Group include:
• AASB 2014-4 Amendments to Australian Accounting Standards - Clarification of Acceptable Methods of Depreciation and Amortisation which clarify the principle in AASB 116 Property, Plant and Equipment and AASB 138 Intangible Assets that revenue reflects a pattern of economic benefits that are generated from operating a business (of which the asset is part) rather than the economic benefits that are consumed through use of the asset;
• AASB 2015-1 Amendments to Australian Accounting Standards - Annual Improvements to Australian Accounting Standards 2012–2014 Cycle which clarify certain requirements in AASB 5 Non-current Assets Held for Sale and Discontinued Operations, AASB 7 Financial Instruments: Disclosures, AASB 119 Employee Benefits, and AASB 134 Interim Financial Reporting; and
• AASB 2015-2 Amendments to Australian Accounting Standards - Disclosure Initiative: Amendments to AASB 101 which amends AASB 101 Presentation of Financial Statements to clarify existing presentation and disclosure requirements and to ensure entities are able to use judgement when applying the Standard in determining what information to disclose, where and in what order information is presented in their financial statements.
The adoption of these new and revised standards has not resulted in any significant changes to the Group's accounting policies or to the amounts reported for the current or prior periods.

NOTES TO THE FINANCIAL STATEMENTS FOR THE YEAR ENDED 30 JUNE 2017 (Continued)
28
1. STATEMENT OF SIGNIFICANT ACCOUNTING POLICIES (Continued)
(b) Statement of Compliance (Continued)
Australian Accounting Standards and Interpretations that have recently been issued or amended but are not yet effective have not been adopted by the Group for the annual reporting period ended 30 June 2017. Those which may be relevant to the Group are set out in the table below, but these are not expected to have any significant impact on the Group's financial statements:
Standard/Interpretation Application
Date of Standard
Application Date for Group
AASB 2016-2 Amendments to Australian Accounting Standards - Disclosure Initiative: Amendments to AASB 107
1 January 2017 1 July 2017
AASB 9 Financial Instruments, and relevant amending standards 1 January 2018 1 July 2018
AASB 15 Revenue from Contracts with Customers, and relevant amending standards 1 January 2018 1 July 2018
AASB 2016-5 Amendments to Australian Accounting Standards – Classification and Measurement of Share-based Payment Transactions
1 January 2018 1 July 2018
AASB Interpretation 22 Foreign Currency Transactions and Advance Consideration 1 January 2018 1 July 2018
AASB 16 Leases 1 January 2019 1 July 2019
(c) Principles of Consolidation
The consolidated financial statements incorporate the assets and liabilities of all subsidiaries of the Company as at 30 June 2017 and the results of all subsidiaries for the year then ended.
Subsidiaries are all entities (including structured entities) over which the group has control. The group controls an entity when the group is exposed to, or has rights to, variable returns from its involvement with the entity and has the ability to affect those returns through its power to direct the activities of the entity.
The financial statements of the subsidiaries are prepared for the same reporting period as the Company, using consistent accounting policies. Accounting policies of subsidiaries have been changed where necessary to ensure consistency with the policies adopted by the Company.
Subsidiaries are fully consolidated from the date on which control is transferred to the Company. They are de-consolidated from the date that control ceases. Intercompany transactions and balances, income and expenses and profits and losses between Group companies, are eliminated.
Non-controlling interests are allocated their share of net profit after tax in the statement of comprehensive income and are presented within equity in the consolidated statement of financial position, separately from the equity of the owners of the parent.
Total comprehensive income within a subsidiary is attributed to the non-controlling interest even if that results in a deficit balance.
A change in the ownership interest of a subsidiary that does not result in a loss of control is accounted for as an equity transaction.
(d) Change in Accounting Policy
The Group has re-assessed its accounting for exploration and evaluation expenditure after initial recognition. The Group has previously capitalised all costs incurred in connection with the exploration and evaluation of areas with current rights of tenure and recognised them as exploration and evaluation assets. Costs carried forward in respect of an area of interest that was abandoned were written off in the year in which the decision to abandon was made.
The Group has elected to change the method of accounting for exploration and evaluation expenditure, and the new policy has been applied retrospectively (with comparative information restated accordingly). Under the new policy:

Apollo Minerals Limited ANNUAL REPORT 2017 29
• exploration and evaluation expenditure incurred in the acquisition of the rights to explore (including payments to landowners required under the Group’s mineral leases) is capitalised and recognised as an exploration and evaluation asset; and
• exploration and evaluation expenditure incurred subsequent to the acquisition of the rights to explore will now be expensed as incurred, up to and until the completion of a bankable feasibility study.
For further details, refer to Note 1(k).
The Directors are of the opinion that the change in accounting policy provides users with more relevant and no less reliable information as the policy is more transparent and less subjective. The policy is common for exploration focussed companies where exploration and evaluation expenditure is viewed as an ongoing expense of discovery, until a technical feasibility study has been completed. The impact of this change in accounting policy is reflected below.
For comparative purposes, the change of accounting policy has resulted in the restatement of the affected financial statement line items for the prior periods as follows:
Impact on equity
1 July 2015
$
30 June 2016
$
Decrease in exploration and evaluation assets (6,402,955) (417,786)
Net decrease in equity (6,402,955) (417,786)
Impact on statement of profit or loss
30 June 2016
$
Recognised exploration expenditure (502,110)
Decrease in exploration and evaluation expenditure written off 6,487,279
Decrease in loss 5,985,169
Attributable to:
Members of Apollo Minerals Limited 5,985,169
Non-controlling interests -
Basic and diluted loss per share have also been restated. The amount of the impact on basic and diluted loss per share for the restated result for the year ended 30 June 2016 due to the change in accounting policy is a decrease in loss per share of 32.9 cents.
Impact on statement of cash flows
30 June 2016
$
Operating activities
Payments to suppliers (569,354)
GST refunds received 103,794
Research and development tax rebate 665,522
Increase in net cash outflow from operating activities 199,962
Payment for exploration expenditure 465,560
Research and development tax rebate (665,522)
Decrease in net cash outflow from investing activities (199,962)
The impact of the change in accounting policy has not been quantified for the current period as these accounting records have not been maintained.

NOTES TO THE FINANCIAL STATEMENTS FOR THE YEAR ENDED 30 JUNE 2017 (Continued)
30
1. SUMMARY OF SIGNIFICANT ACCOUNTING POLICIES (Continued)
(e) Foreign Currencies
Functional and presentation currency
The functional currency of each of the Group's entities is measured using the currency of the primary economic environment in which that entity operates. The consolidated financial statements are presented in Australian dollars which is the Company's functional and presentation currency.
Transactions and balances
Foreign currency transactions are translated into functional currency using the exchange rates prevailing at the date of the transaction. Foreign currency monetary items are translated at the year-end exchange rate. Non-monetary items measured at historical cost continue to be carried at the exchange rate at the date of the transaction. Non-monetary items measured at fair value are reported at the exchange rate at the date when fair values were determined.
Exchange differences arising on the translation of monetary items are recognised in the income statement, except where deferred in equity as a qualifying cash flow or net investment hedge.
Exchange differences arising on the translation of non-monetary items are recognised directly in equity to the extent that the gain or loss is directly recognised in equity, otherwise the exchange difference is recognised in the income statement.
Group companies
The financial results and position of foreign operations whose functional currency is different from the group's presentation currency are translated as follows:
• assets and liabilities are translated at year-end exchange rates prevailing at that reporting date;
• income and expenses are translated at average exchange rates for the period; and
• retained earnings are translated at the exchange rates prevailing at the date of the transaction.
Exchange differences arising on translation of foreign operations are transferred directly to the group's foreign currency translation reserve in equity. These differences are recognised in profit or loss in the period in which the operation is disposed.
(f) Cash and Cash Equivalents
Cash and cash equivalents include cash on hand, deposits held at call with banks, other short-term highly liquid investments with original maturities of 2 months or less, and bank overdrafts. Bank overdrafts are shown within short-term borrowings in current liabilities on the statement of financial position.
(g) Trade and Other Receivables
Trade receivables are recognised and carried at original invoice amount less an allowance for any uncollectable debts. An estimate for doubtful debts is made when collection of the full amount is no longer probable. Bad debts are written-off as incurred.
Receivables from related parties are recognised and carried at the nominal amount due and are interest free.
(h) Investments and Other Financial Assets
(i) Classification
Financial assets in the scope of AASB 139 Financial Instruments: Recognition and Measurement are classified as either financial assets at fair value though profit or loss, loans and receivables, held-to-maturity investments, or available-for-sale investments, as appropriate. When financial assets are recognised initially they are measured at fair value, plus, in the case of investments not at fair value through profit or loss, directly attributable transaction costs. The Group determines the classification of its financial assets after initial recognition and, when allowed and appropriate, re-evaluates this designation at each financial year-end.

Apollo Minerals Limited ANNUAL REPORT 2017 31
Financial assets at fair value through profit or loss
Financial assets at fair value through profit or loss are financial assets held for trading. A financial asset is classified in this category if acquired principally for the purpose of selling in the short term. Derivatives are also categorised as held for trading unless they are designated as hedges. Assets in this category are classified as current assets. Loans and receivables
Loans and receivables are non-derivative financial assets with fixed or determinable payments that are not quoted in an active market. They arise when the Group provides money, goods or services directly to a debtor with no intention of selling the receivable. They are included in current assets, except for those with maturities greater than twelve months after the reporting date which are classified as non-current assets. Loans and receivables are included in receivables in the statement of financial position.
Held-to-maturity investments
Non-derivative financial assets with fixed or determinable payments and fixed maturity are classified as held-to-maturity when the Group has the positive intention and ability to hold to maturity. Investments intended to be held for an undefined period are not included in this classification. Investments that are indeed to be held-to-maturity, such as bonds, are subsequently measured at amortised cost. This cost is computed as the amount initially recognised minus principal repayments, plus or minus the cumulative amortisation using the effective interest method of any difference between the initially recognised amount and the maturity amount. This calculation includes all fees and points paid or received between parties to the contract that are an integral part of the effective interest rate, transaction costs and all other premiums and discounts. For investments carried at amortised cost, gains and losses are recognised in profit or loss when the investments are derecognised or impaired, as well as through the amortisation process.
Available-for-sale financial assets
Available-for-sale financial assets, comprising principally marketable equity securities, are non-derivatives that are either designated in this category or not classified in any of the other categories. They are included in non-current assets unless management intends to dispose of the investment within twelve months of the reporting date.
(i) Recognition and derecognition
Purchases and sales of investments are recognised on trade-date – the date on which the Group commits to purchase or sell the asset. Investments are initially recognised at fair value plus transaction costs for all financial assets not carried at fair value through profit or loss. Financial assets are derecognised when the rights to receive cash flows from the financial assets have expired or have been transferred and the Group has transferred substantially all the risks and rewards of ownership.
(ii) Subsequent measurement
Available-for-sale financial assets and financial assets at fair value through profit or loss are subsequently carried at fair value. Loans and receivables and held-to-maturity investments are carried at amortised cost using the effective interest rate method. Realised and unrealised gains and losses arising from changes in the fair value of the 'financial assets at fair value through profit or loss' category are included in the statement of comprehensive income in the period in which they arise. Unrealised gains and losses arising from changes in the fair value of non-monetary securities classified as available-for-sale are recognised in equity in the investments available for sale reserve. When securities classified as available-for-sale are sold or impaired, the accumulated fair value adjustments previously reported in equity are included in the statement of comprehensive income as gains and losses on disposal of investment securities.
(iii) Impairment
The Group assesses at each balance date whether there is objective evidence that a financial asset or group of financial assets is impaired. In the case of equity securities classified as available for sale, a significant or prolonged decline in the fair value of a security below its cost is considered in determining whether the security is impaired. If any such evidence exists for available-for-sale financial assets, the cumulative loss – measured as the difference between the acquisition cost and the current fair value, less any impairment loss on that financial asset previously recognised in profit and loss – is transferred from equity to the statement of comprehensive income. Impairment losses recognised in the statement of comprehensive income on equity instruments classified as held for sale are not reversed through the statement of comprehensive income.

NOTES TO THE FINANCIAL STATEMENTS FOR THE YEAR ENDED 30 JUNE 2017 (Continued)
32
1. STATEMENT OF SIGNIFICANT ACCOUNTING POLICIES (Continued)
(i) Interests in Joint Ventures
The Group's share of the assets, liabilities, revenue and expenses of joint venture operations (if any) are included in the appropriate items of the consolidated financial statements. Details of the Group's interests in joint ventures are shown at Note 19.
(j) Parent entity financial information
The financial information for the parent entity, Apollo Minerals Limited, disclosed in Note 16 has been prepared on the same basis as the consolidated financial statements, except for investments in subsidiaries, associates and joint venture entities which are accounted for at cost in the financial statements of Apollo Minerals Limited.
(k) Property, Plant and Equipment
(i) Cost and valuation
Plant and equipment is measured at cost less accumulated depreciation and impairment losses.
(ii) Depreciation
Depreciation is provided on a straight line basis on all property, plant and equipment.
2017 2016
Major depreciation periods are:
Plant and equipment 2 – 5 years 2 – 5 years
Office equipment 2 – 5 years 2 – 5 years
(l) Exploration and Evaluation Expenditure
Expenditure on exploration and evaluation is accounted for in accordance with the 'area of interest' method.
Exploration and evaluation expenditure encompasses expenditures incurred by the Group in connection with the exploration for and evaluation of mineral resources before the technical feasibility and commercial viability of extracting a mineral resource are demonstrable.
For each area of interest, expenditure incurred in the acquisition of rights to explore is capitalised, classified as tangible or intangible, and recognised as an exploration and evaluation asset. Exploration and evaluation assets are measured at cost at recognition and are recorded as an asset if:
(i) the rights to tenure of the area of interest are current; and
(ii) at least one of the following conditions is also met:
• the exploration and evaluation expenditures are expected to be recouped through successful development and exploitation of the area of interest, or alternatively, by its sale; and
• exploration and evaluation activities in the area of interest have not at the reporting date reached a stage which permits a reasonable assessment of the existence or otherwise of economically recoverable reserves, and active and significant operations in, or in relation to, the area of interest are continuing.
Exploration and evaluation expenditure incurred by the Group subsequent to the acquisition of the rights to explore is expensed as incurred, up until the technical feasibility and commercial viability of the project has been demonstrated with a bankable feasibility study.

Apollo Minerals Limited ANNUAL REPORT 2017 33
Capitalised exploration costs are reviewed at each reporting date to establish whether an indication of impairment exists. If any such indication exists, the recoverable amount of the capitalised exploration costs is estimated to determine the extent of the impairment loss (if any). Where an impairment loss subsequently reverses, the carrying amount of the asset is increased to the revised estimate of its recoverable amount, but only to the extent that the increased carrying amount does not exceed the carrying amount that would have been determined had no impairment loss been recognised for the asset in previous years.
Where a decision is made to proceed with development, accumulated expenditure is tested for impairment and transferred to development properties, and then amortised over the life of the reserves associated with the area of interest once mining operations have commenced.
Recoverability of the carrying amount of the exploration and evaluation assets is dependent on successful development and commercial exploitation, or alternatively, sale of the respective areas of interest.
(m) Payables
Liabilities are recognised for amounts to be paid in the future for goods and services received. Trade accounts payable are normally settled within 60 days.
(n) Provisions
Provisions are recognised when the group has a legal or constructive obligation, as a result of past events, for which it is probable that an outflow of economic benefits will result and that outflow can be reliably measured.
(o) Revenue Recognition
Revenues are recognised at the fair value of the consideration received net of the amount of goods and services tax (GST) payable to the taxation authority. Revenue is recognised to the extent that it is probable that the economic benefits will flow to the Group and can be reliably measured.
Interest revenue is recognised as it accrues, taking into account the effective yield on the financial asset.
(p) Income Tax
The income tax expense for the period is the tax payable on the current period's taxable income based on the notional income tax rate for each jurisdiction adjusted by changes in deferred tax assets and liabilities attributable to temporary differences between the tax bases of assets and liabilities and their carrying amounts in the financial statements, and to unused tax losses.
Deferred tax assets and liabilities are recognised for temporary differences at the tax rates expected to apply when the assets are recovered or liabilities are settled, based on those tax rates which are enacted or substantively enacted for each jurisdiction. The relevant tax rates are applied to the cumulative amounts of deductible and taxable temporary differences to measure the deferred tax asset or liability. An exception is made for certain temporary differences arising from the initial recognition of an asset or a liability. No deferred tax asset or liability is recognised in relation to these temporary differences if they arose on goodwill or in a transaction, other than a business combination, that at the time of the transaction did not affect either accounting profit or taxable profit or loss.
Deferred tax liabilities and assets are not recognised for temporary differences between the carrying amount and tax bases of investments in controlled entities where the Company is able to control the timing of the reversal of the temporary differences and it is probable that the differences will not reverse in the foreseeable future.
Deferred tax assets are recognised for deductible temporary differences and unused tax losses only if it is probable that future taxable amounts will be available to utilise those temporary differences and losses.
The carrying amount of deferred income tax assets is reviewed at each reporting date and reduced to the extent that it is no longer probable that sufficient taxable profit will be available to allow all or part of the deferred income tax asset to be utilised.
Unrecognised deferred income tax assets are reassessed at each balance date and are recognised to the extent that it has become probable that future taxable profit will allow the deferred tax asset to be recovered.

NOTES TO THE FINANCIAL STATEMENTS FOR THE YEAR ENDED 30 JUNE 2017 (Continued)
34
1. STATEMENT OF SIGNIFICANT ACCOUNTING POLICIES (Continued)
(p) Income Tax (Continued)
Current and deferred tax balances attributable to amounts recognised directly in equity are also recognised directly in equity.
Deferred tax assets and deferred tax liabilities are offset only if a legally enforceable right exists to set off current tax assets against tax liabilities and the deferred tax liabilities relate to the same taxable entity and the same taxation authority.
(q) Employee Entitlements
A provision is made for the Group's liability for employee benefits arising from services rendered by employees to balance date. Employee benefits that are expected to be settled within 12 months have been measured at the amounts expected to be paid when the liability is settled, plus related on-costs. Employee benefits payable later than 12 months have been measured at the present value of the estimated future cash outflows to be made for those benefits.
(r) Earnings per Share
Basic earnings per share (“EPS”) is calculated by dividing the net profit/loss attributable to members of the Company for the reporting period, after excluding any costs of servicing equity, by the weighted average number of ordinary shares of the Company, adjusted for any bonus issue or share consolidation.
Diluted EPS is calculated by dividing the basic EPS earnings, adjusted by the after tax effect of financing costs associated with dilutive potential Ordinary Shares and the effect on revenues and expenses of conversion to Ordinary Shares associated with dilutive potential Ordinary Shares, by the weighted average number of Ordinary Shares and dilutive Ordinary Shares adjusted for any bonus issue or share consolidation.
(s) Goods and Services Tax
Revenues, expenses and assets are recognised net of the amount of GST, except where the amount of GST incurred is not recoverable from the Australian Tax Office. In these circumstances the GST is recognised as part of the cost of acquisition of the asset or as part of the expense. Receivables and payables in the statement of financial position are shown inclusive of GST.
Cash flows are presented in the statement of cash flows on a gross basis, except for the GST component of investing and financing activities, which are disclosed as operating cash flows.
(t) Use and Revision of Accounting Estimates
The preparation of the financial report requires management to make judgements, estimates and assumptions that affect the application of accounting policies and the reported amounts of assets, liabilities, income and expenses. Actual results may differ from these estimates. The estimates and underlying assumptions are reviewed on an ongoing basis. Revisions to accounting estimates are recognised in the period in which the estimate is revised if the revision affects only that period, or in the period of the revision and future periods if the revision affects both current and future periods.
In particular, information about significant areas of estimation uncertainty and critical judgements in applying accounting policies that have the most significant effect on the amount recognised in the financial statements are described Note 1(aa).

Apollo Minerals Limited ANNUAL REPORT 2017 35
(u) Operating Segments An operating segment is a component of an entity that engages in business activities from which it may earn revenues and incur expenses (including revenues and expenses relating to transactions with other components of the same entity), whose operating results are regularly reviewed by the entity's chief operating decision maker to make decisions about resources to be allocated to the segment and assess its performance and for which discrete financial information is available. The chief operating decision maker has been identified as the Board of Directors, taken as a whole. This includes start up operations which are yet to earn revenues. Management will also consider other factors in determining operating segments such as the existence of a line manager and the level of segment information presented to the board of directors.
Operating segments have been identified based on the information provided to the Board of Directors.
The group aggregates two or more operating segments when they have similar economic characteristics, and the segments are similar in each of the following respects:
• Nature of the products and services,
• Nature of the production processes,
• Type or class of customer for the products and services,
• Methods used to distribute the products or provide the services, and if applicable
• Nature of the regulatory environment.
Operating segments that meet the quantitative criteria as prescribed by AASB 8 are reported separately. However, an operating segment that does not meet the quantitative criteria is still reported separately where information about the segment would be useful to users of the financial statements.
Information about other business activities and operating segments that are below the quantitative criteria are combined and disclosed in a separate category for “all other segments”.
(v) Impairment of Assets
The Group assesses at each reporting date whether there is an indication that an asset may be impaired. If any such indication exists, or when annual impairment testing for an asset is required, the Group makes an estimate of the asset's recoverable amount. An asset's recoverable amount is the higher of its fair value less costs to sell and its value in use and is determined for an individual asset, unless the asset does not generate cash inflows that are largely independent of those from other assets or groups of assets and the asset's value in use cannot be estimated to be close to its fair value. In such cases the asset is tested for impairment as part of the cash-generating unit to which it belongs. When the carrying amount of an asset or cash-generating unit exceeds its recoverable amount, the asset or cash-generating unit is considered impaired and is written down to its recoverable amount. In assessing the value in use, the estimated future cash flows are discounted to their present value using a pre-tax discount rate that reflects current market assessments of the time value of money and the risks specific to the asset.
An assessment is also made at each reporting date as to whether there is any indication that previously recognised impairment losses may no longer exist or may have decreased. If such indication exists, the recoverable amount is estimated. A previously recognised impairment loss is reversed only if there has been a change in the estimates used to determine the asset's recoverable amount since the last impairment loss was recognised. If that is the case the carrying amount of the asset is increased to its recoverable amount. That increased amount cannot exceed the carrying amount that would have been determined, net of depreciation, had no impairment loss been recognised for the asset in prior years. Such reversal is recognised in profit or loss unless the asset is carried at a revalued amount, in which case the reversal is treated as a revaluation increase. After such a reversal the depreciation charge is adjusted in future periods to allocate the asset's revised carrying amount, less any residual value, on a systematic basis over its remaining useful life.
(w) Fair Value Estimation
The fair value of financial assets and financial liabilities must be estimated for recognition and measurement or for disclosure purposes.

NOTES TO THE FINANCIAL STATEMENTS FOR THE YEAR ENDED 30 JUNE 2017 (Continued)
36
1. STATEMENT OF SIGNIFICANT ACCOUNTING POLICIES (Continued)
(w) Fair Value Estimation (Continued)
The fair value of financial instruments traded in active markets (such as publicly traded derivatives, and trading and available-for-sale securities) is based on quoted market prices at the reporting date. The quoted market price used for financial assets held by the Group is the current bid price; the appropriate quoted market price for financial liabilities is the current ask price.
The nominal value less estimated credit adjustments of trade receivables and payables are assumed to approximate their fair values. The fair value of financial liabilities for disclosure purposes is estimated by discounting the future contractual cash flows at the current market interest rate that is available to the Group for similar financial instruments.
(x) Issued Capital
Ordinary Shares are classified as equity. Issued and paid up capital is recognised at the fair value of the consideration received by the Company. Incremental costs directly attributable to the issue of new shares or options are shown in equity as a deduction, net of tax, from the proceeds.
(y) Dividends
Provision is made for the amount of any dividend declared, being appropriately authorised and no longer at the discretion of the Group, on or before the end of the year but not distributed at balance date.
(z) Share-Based Payments
Equity-settled share-based payments are provided to officers, employees, consultants and other advisors. These share-based payments are measured at the fair value of the equity instrument at the grant date. Where options are issued, fair value is determined using the Black Scholes option pricing model. Where ordinary shares are issued, fair value is determined using volume weighted average price for ordinary shares for an appropriate period prior to the issue of the shares. Further details on how the fair value of equity-settled share based payments has been determined can be found in Note 17.
The fair value determined at the grant date is expensed on a straight-line basis over the vesting period, based on the Company's estimate of equity instruments that will eventually vest. At each reporting date, the Company revises its estimate of the number of equity instruments expected to vest. The impact of the revision of the original estimates, if any, is recognised in profit or loss over the remaining vesting period, with a corresponding adjustment to the share based payments reserve. Equity-settled share-based payments may also be provided as consideration for the acquisition of assets. Where ordinary shares are issued, the transaction is recorded at fair value based on the volume weighted average price for ordinary shares for an appropriate period prior to the issue of the shares. Where performance shares are issued, the transaction is recorded at fair value based on the volume weighted average price for ordinary shares for an appropriate period prior to the issue of the performance shares, adjusted for Management’s assessment of the probability that the relevant milestone for each class of performance share will be met. The acquisition is then recorded as an asset or expensed in accordance with accounting standards.
(aa) Significant judgements and key assumptions
The directors evaluate estimates and judgements incorporated into the financial report based on historical knowledge and best available current information. Estimates assume a reasonable expectation of future events and are based on current trends and economic data, obtained both externally and within the group.

Apollo Minerals Limited ANNUAL REPORT 2017 37
(i) Key judgements
The Group capitalises expenditure incurred in the acquisition of rights to explore and records this as an asset where it is considered likely to be recoverable or where the activities have not reached a stage which permits a reasonable assessment of the existence of reserves (Note 1(l)). In accordance with this policy and with the impairment policy at Note 1(v), the Company has written down some of the carrying value of exploration and evaluation expenditure during the year. There are also certain areas of interest from which no reserves have been extracted, but the directors are of the continued belief that such expenditure should not be written off since feasibility studies in such areas have not yet concluded. Such capitalised expenditure is carried at reporting date at $6,667,645 (2016 Restated: $500,000).
The Group recognises share based payments in accordance with the policy at Note 1(z) and Note 17.
2017 2016
$ $
2. REVENUE AND OTHER INCOME
(a) Other income
Interest income 82,073 8,334
Foreign exchange gain 16,770 -
98,843 8,334
2017 2016
Restated
$ $
3. INCOME TAX
(a) Recognised in the Statement of Comprehensive Income
Current income tax
Current income tax benefit in respect of the current year - -
Adjustments in respect of current income tax of previous years - (193,361)
Deferred income tax
Relating to origination and reversal of temporary differences 446,859 (666,577)
Deferred tax assets not previously brought to account (446,859) -
Deferred tax assets not brought to account - 859,938
Income tax expense reported in the statement of comprehensive income - -

NOTES TO THE FINANCIAL STATEMENTS FOR THE YEAR ENDED 30 JUNE 2017 (Continued)
38
2017 2016
Restated
$ $
3. INCOME TAX (Continued)
(b) Reconciliation Between Tax Expense and Accounting Loss Before Income Tax
Accounting loss before income tax (1,383,441) (2,631,611)
At the domestic income tax rate of 27.5% (2016: 30%) (380,446) (789,483)
Expenditure not allowable for income tax purposes 241,246 122,906
Effect of decrease in Australian income tax rate(1) 586,059 -
Adjustments in respect of current income tax of previous years - (193,361)
Deferred tax assets not previously brought to account (446,859) -
Deferred tax assets not brought to account - 859,938
Income tax expense attributable to loss - -
(c) Deferred Tax Assets and Liabilities
Deferred income tax at 30 June relates to the following:
Deferred Tax Liabilities
Exploration and evaluation assets 114,612 150,000
Deferred tax assets used to offset deferred tax liabilities (114,612) (150,000)
- -
Deferred Tax Assets
Accrued expenditure 9,075 34,086
Property, plant and equipment 1,692 2,401
Capital allowances 22,898 62,333
Tax losses available to offset against future taxable income 6,666,797 7,083,889
Deferred tax assets used to offset deferred tax liabilities (114,612) (150,000)
Deferred tax assets not brought to account (6,585,850) (7,032,709)
- -
Note: 1 From the 2016–17 income tax year, the small business company tax rate has been reduced to 27.5% in accordance with
enacted tax legislation.
The benefit of deferred tax assets not brought to account will only be brought to account if:
• future assessable income is derived of a nature and of an amount sufficient to enable the benefit to be realised;
• the conditions for deductibility imposed by tax legislation continue to be complied with; and
• no changes in tax legislation adversely affect the Group in realising the benefit.
(d) Tax Consolidation
The Company and its wholly-owned Australian resident entities have not implemented the tax consolidation legislation.

Apollo Minerals Limited ANNUAL REPORT 2017 39
2017 2016
$ $
4. TRADE AND OTHER RECEIVABLES (CURRENT)
GST and other receivables 122,926 14,785
122,926 14,785
2017 2016
$ $
5. PROPERTY, PLANT AND EQUIPMENT (NON-CURRENT)
(a) Plant and Equipment
At cost 4,932 40,020
Accumulated depreciation and impairment (97) (40,020)
Net carrying amount 4,835 -
(b) Reconciliation
Carrying amount at beginning of year - -
Acquisitions 4,932 -
Depreciation (97) -
Carrying amount at end of year, net of accumulated depreciation and impairment 4,835 -

NOTES TO THE FINANCIAL STATEMENTS FOR THE YEAR ENDED 30 JUNE 2017 (Continued)
40
Notes 2017 2016 Restated
$ $
6. EXPLORATION AND EVALUATION ASSETS (NON-CURRENT)
(a) Exploration and evaluation assets by area of interest
Couflens (France) 6,267,645 -
Fraser Range (Western Australia) 400,000 400,000
Commonwealth Hill (South Australia)(2) - 100,000
Kango North (Gabon)(2) - -
Total exploration and evaluation assets 6,667,645 500,000
(b) Reconciliation of carrying amount:
Carrying amount at beginning of year 500,000 1,314,656
Acquisition of Couflens 13 6,267,645 -
Acquisition of additional interest in Gabon project - 250,000
Disposal of interest in Commonwealth Hill project (50,000) -
Exploration expenditure written off(2) (50,000) (930,757)
Research and development rebate received/receivable - (133,899)
Balance at end of financial year(1) 6,667,645 500,000
Notes: 1 The ultimate recoupment of costs carried forward for exploration and evaluation expenditure is dependent on the successful
development and commercial exploitation or sale of the respective areas of interest. 2 The Directors have made an assessment of the recoverability of the capitalised exploration and evaluation expenditure for each
of the Commonwealth Hill and Kango North area of interest and have written these areas down to nil.
2017 2016
$ $
7. TRADE AND OTHER PAYABLES (CURRENT)
Trade creditors 387,539 70,590
Accrued expenses 33,000 104,199
420,539 174,789
Notes 2017 2016
$ $
8. CONTRIBUTED EQUITY
(a) Issued Capital
139,914,218 (2016: 20,382,141) Ordinary Shares 8(b) 44,072,803 35,940,353
44,072,803 35,940,353
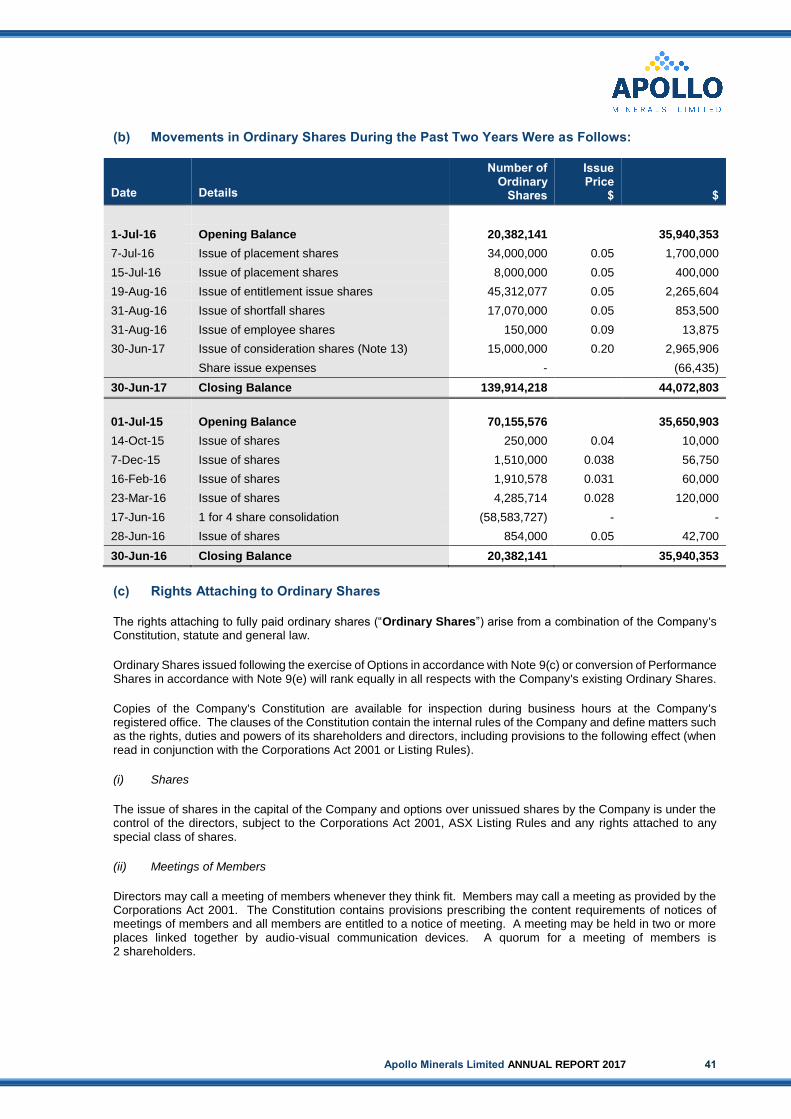
Apollo Minerals Limited ANNUAL REPORT 2017 41
(b) Movements in Ordinary Shares During the Past Two Years Were as Follows: Date
Details
Number of Ordinary
Shares
Issue Price
$
$
1-Jul-16 Opening Balance 20,382,141 35,940,353
7-Jul-16 Issue of placement shares 34,000,000 0.05 1,700,000
15-Jul-16 Issue of placement shares 8,000,000 0.05 400,000
19-Aug-16 Issue of entitlement issue shares 45,312,077 0.05 2,265,604
31-Aug-16 Issue of shortfall shares 17,070,000 0.05 853,500
31-Aug-16 Issue of employee shares 150,000 0.09 13,875
30-Jun-17 Issue of consideration shares (Note 13) 15,000,000 0.20 2,965,906
Share issue expenses - (66,435)
30-Jun-17 Closing Balance 139,914,218 44,072,803
01-Jul-15 Opening Balance 70,155,576 35,650,903
14-Oct-15 Issue of shares 250,000 0.04 10,000
7-Dec-15 Issue of shares 1,510,000 0.038 56,750
16-Feb-16 Issue of shares 1,910,578 0.031 60,000
23-Mar-16 Issue of shares 4,285,714 0.028 120,000
17-Jun-16 1 for 4 share consolidation (58,583,727) - -
28-Jun-16 Issue of shares 854,000 0.05 42,700
30-Jun-16 Closing Balance 20,382,141 35,940,353
(c) Rights Attaching to Ordinary Shares
The rights attaching to fully paid ordinary shares (“Ordinary Shares”) arise from a combination of the Company's Constitution, statute and general law.
Ordinary Shares issued following the exercise of Options in accordance with Note 9(c) or conversion of Performance Shares in accordance with Note 9(e) will rank equally in all respects with the Company's existing Ordinary Shares.
Copies of the Company's Constitution are available for inspection during business hours at the Company's registered office. The clauses of the Constitution contain the internal rules of the Company and define matters such as the rights, duties and powers of its shareholders and directors, including provisions to the following effect (when read in conjunction with the Corporations Act 2001 or Listing Rules).
(i) Shares
The issue of shares in the capital of the Company and options over unissued shares by the Company is under the control of the directors, subject to the Corporations Act 2001, ASX Listing Rules and any rights attached to any special class of shares.
(ii) Meetings of Members
Directors may call a meeting of members whenever they think fit. Members may call a meeting as provided by the Corporations Act 2001. The Constitution contains provisions prescribing the content requirements of notices of meetings of members and all members are entitled to a notice of meeting. A meeting may be held in two or more places linked together by audio-visual communication devices. A quorum for a meeting of members is 2 shareholders.

NOTES TO THE FINANCIAL STATEMENTS FOR THE YEAR ENDED 30 JUNE 2017 (Continued)
42
8. CONTRIBUTED EQUITY (Continued)
(c) Rights Attaching to Ordinary Shares (Continued)
(iii) Voting
Subject to any rights or restrictions at the time being attached to any shares or class of shares of the Company, each member of the Company is entitled to receive notice of, attend and vote at a general meeting. Resolutions of members will be decided by a show of hands unless a poll is demanded. On a show of hands each eligible voter present has one vote. However, where a person present at a general meeting represents personally or by proxy, attorney or representative more than one member, on a show of hands the person is entitled to one vote only despite the number of members the person represents. On a poll each eligible member has one vote for each fully paid share held and a fraction of a vote for each partly paid share determined by the amount paid up on that share.
(iv) Changes to the Constitution
The Company's Constitution can only be amended by a special resolution passed by at least three quarters of the members present and voting at a general meeting of the Company. At least 28 days' written notice specifying the intention to propose the resolution as a special resolution must be given.
(v) Listing Rules
Provided the Company remains admitted to the Official List, then despite anything in its Constitution, no act may be done that is prohibited by the Listing Rules, and authority is given for acts required to be done by the Listing Rules. The Company's Constitution will be deemed to comply with the Listing Rules as amended from time to time.
Notes 2017 2016
$ $
9. RESERVES
Share based payments reserve:
Nil (2016:1,763,549) $1.20 Options expiring 28 February 2017 - 249,704
1,678,125 (2016: 1,678,125) $0.52 Options expiring 28 February 2018 135,868 135,868
1,500,000 (2016: 500,000 Unissued) $0.05 Options expiring 30 June 2018 69,233 29,264
2,000,000 (2016: 1,000,000 Unissued) $0.075 Options expiring 30 June 2019 97,195 57,456
1,250,000 (2016: Nil) $0.20 Options expiring 30 June 2020 148,381 -
1,500,000 (2016: 1,500,000) $0.32 Options expiring 30 November 2020 217,896 217,896
1,600,000 (2016: Nil) $0.25 Options expiring 30 June 2021 200,255 -
Sub-total options 9(b) 868,828 690,188
10,000,000 (2016: Nil) Class A Performance Shares 593,181 -
10,000,000 (2016: Nil) Class B Performance Shares 197,727 -
10,000,000 (2016: Nil) Class C Performance Shares 197,727 -
15,000,000 (2016: Nil) Class D Performance Shares 148,295 -
20,000,000 (2016: Nil) Class E Performance Shares 118,637 -
Sub-total performance shares 9(d) 1,255,567 -
Total share based payments reserve 2,124,395 690,188
Total Reserves 2,124,395 690,188
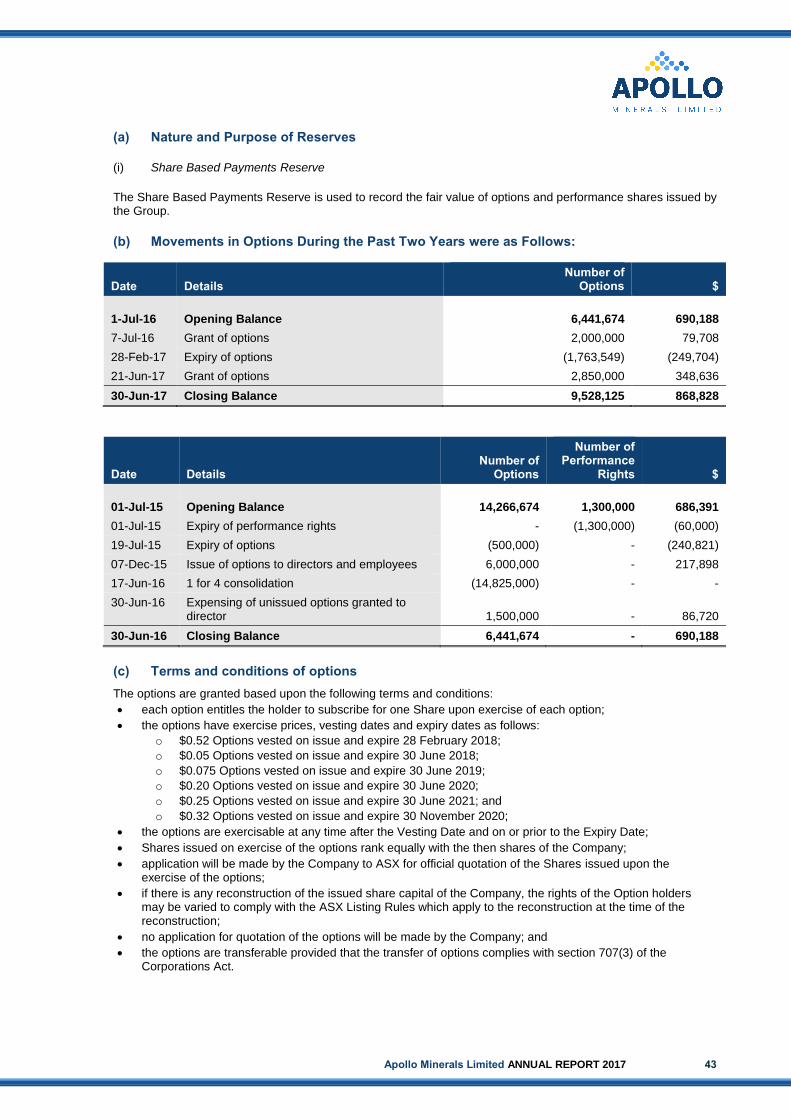
Apollo Minerals Limited ANNUAL REPORT 2017 43
(a) Nature and Purpose of Reserves
(i) Share Based Payments Reserve
The Share Based Payments Reserve is used to record the fair value of options and performance shares issued by the Group.
(b) Movements in Options During the Past Two Years were as Follows:
Date Details Number of
Options $
1-Jul-16 Opening Balance 6,441,674 690,188
7-Jul-16 Grant of options 2,000,000 79,708
28-Feb-17 Expiry of options (1,763,549) (249,704)
21-Jun-17 Grant of options 2,850,000 348,636
30-Jun-17 Closing Balance 9,528,125 868,828
Date Details Number of
Options
Number of Performance
Rights $
01-Jul-15 Opening Balance 14,266,674 1,300,000 686,391
01-Jul-15 Expiry of performance rights - (1,300,000) (60,000)
19-Jul-15 Expiry of options (500,000) - (240,821)
07-Dec-15 Issue of options to directors and employees 6,000,000 - 217,898
17-Jun-16 1 for 4 consolidation (14,825,000) - -
30-Jun-16 Expensing of unissued options granted to director 1,500,000 - 86,720
30-Jun-16 Closing Balance 6,441,674 - 690,188
(c) Terms and conditions of options
The options are granted based upon the following terms and conditions:
• each option entitles the holder to subscribe for one Share upon exercise of each option;
• the options have exercise prices, vesting dates and expiry dates as follows:
o $0.52 Options vested on issue and expire 28 February 2018;
o $0.05 Options vested on issue and expire 30 June 2018;
o $0.075 Options vested on issue and expire 30 June 2019;
o $0.20 Options vested on issue and expire 30 June 2020;
o $0.25 Options vested on issue and expire 30 June 2021; and
o $0.32 Options vested on issue and expire 30 November 2020;
• the options are exercisable at any time after the Vesting Date and on or prior to the Expiry Date;
• Shares issued on exercise of the options rank equally with the then shares of the Company;
• application will be made by the Company to ASX for official quotation of the Shares issued upon the exercise of the options;
• if there is any reconstruction of the issued share capital of the Company, the rights of the Option holders may be varied to comply with the ASX Listing Rules which apply to the reconstruction at the time of the reconstruction;
• no application for quotation of the options will be made by the Company; and
• the options are transferable provided that the transfer of options complies with section 707(3) of the Corporations Act.

NOTES TO THE FINANCIAL STATEMENTS FOR THE YEAR ENDED 30 JUNE 2017 (Continued)
44
9. RESERVES (Continued)
(d) Movements in Performance Shares During the Past Two Years were as Follows:
Date Details Number of
Performance Shares $
1-Jul-16 Opening Balance - -
30-Jun-17 Issue of Class A Performance Shares 10,000,000 593,181
Issue of Class B Performance Shares 10,000,000 197,727
Issue of Class C Performance Shares 10,000,000 197,727
Issue of Class D Performance Shares 15,000,000 148,296
Issue of Class E Performance Shares 20,000,000 118,636
30-Jun-17 Closing Balance 65,000,000 1,255,567
Note: 1 The fair value of the Performance Shares at the acquisition date has been determined with reference to the share price of
Apollo Minerals Limited on the date of acquisition of Ariege Tungstene SAS (refer Note 13), adjusted for Management’s assessment of the probability that the relevant milestone for each class of Performance Shares will be met.
(e) Terms and Conditions of Performance Shares
The Performance Shares are granted on the following terms and conditions:
• Each Performance Share will convert into one Share upon Share will convert into one Share upon the first of the following occurring, on or prior to the Expiry Date:
(i) the satisfaction of the relevant Milestone; or
(ii) an Asset Sale.
• Milestones:
- Class A Milestone: means the announcement by the Company to ASX of the delineation of at least an Inferred and Indicated Mineral Resource of at least 25,000 tonne WO3 at an average grade of not less than 1.0% WO3 using a cut-off grade of not less than 0.3% WO3 on the Project Licences and which is prepared and reported in accordance with the provisions of the JORC Code. For the avoidance of doubt, the referenced tonnes and grade are WO3 values, not WO3 equivalent values incorporating by-products credits.
- Class B Milestone: means the announcement by the Company to ASX of the delineation of at least an Inferred and Indicated Mineral Resource of at least 500,000 troy ounces of gold at an average grade of not less than 0.8 grams per tonne on the Project Licences and which is prepared and reported in accordance with the provisions of the JORC Code.
- Class C Milestone: means the release of a comprehensive announcement by the Company to ASX of the results of a positive Scoping Study on all or part of the Project Licences.
- Class D Milestone: means the release of a comprehensive announcement by the Company to ASX of the results of a positive Pre-Feasibility Study on all or part of the Project Licences.
- Class E Milestone: means the release of a comprehensive announcement by the Company to ASX of the results of a positive Definitive Feasibility Study on all or part of the Project Licences.
• Asset Sale means the announcement by the Company of any completed direct or indirect sale, lease, exchange, or other transfer (in one transaction or a series of related transactions) of all or part of the Exploration Permit, other than to an entity controlled by the Company, provided that the total amount of consideration received by the Company is at least A$21 million.
• Subject to a number of conditions, if on or prior to the Expiry Date a Share Sale occurs then each Performance Share will immediately convert into one Share.
• Share Sale means:
(i) the announcement by the Company of an unconditional Takeover Bid in relation to the Company resulting in the person making the Takeover Bid having a Relevant Interest of 50% or more of the Shares and which is announced as, or has been declared, unconditional; or
(ii) the announcement by the Company that shareholders of the Company have, at a Court convened meeting of shareholders, voted in favour, by the necessary majority, of a proposed scheme of arrangement under which all Shares are to be either cancelled or transferred to a third party, and the Court, by order, approves the proposed scheme of arrangement; or

Apollo Minerals Limited ANNUAL REPORT 2017 45
(iii) the announcement by the Company of the acquisition by a person or any group of related persons (other than the Company) of the power, directly or indirectly, to vote or direct the voting of the Shares having more than 50% of the ordinary voting power of the Company,
provided that that the price paid per Share acquired is at least A$0.15 (as adjusted to take into account any pro rata issue of securities, bonus issue of securities, or reconstruction of issued capital, including consolidation, sub-division, reduction or return, taking place after the grant or issue of the Performance Shares).
• Expiry Date means 5.00pm (Perth time) on the date which is 5 years after the date of issue.
• If the Milestone for a Performance Share is not met by the Expiry Date, the total number of the relevant class of Performance Shares will convert into one Share.
• The Company shall allot and issue Shares upon conversion of the Performance Shares for no consideration.
• Shares issued on conversion of the Performance Shares rank equally with the then shares of the Company.
• If there is any reorganisation of the issued share capital of the Company, the rights of the Performance Shareholders will be varied to the extent necessary to comply with the ASX Listing Rules which apply to the reorganisation at the time of the reorganisation. The Performance Shareholders shall have no right to vote, subject to the Corporations Act.
• No application for quotation of the Performance Shares will be made by the Company.
• The Performance Share are not transferable.
2017 2016
Restated
$ $
10. ACCUMULATED LOSSES
Balance at 1 July (36,115,183) (33,784,393)
Transfer of expired option and performance rights balances 249,704 300,821
Net loss for the year attributable to members of the Company (1,383,441) (2,631,611)
Balance at 30 June (37,248,920) (36,115,183)

NOTES TO THE FINANCIAL STATEMENTS FOR THE YEAR ENDED 30 JUNE 2017 (Continued)
46
2017 2016
Restated
$ $
11. STATEMENT OF CASH FLOWS
(a) Reconciliation of the Net Loss After Tax to the Net Cash Flows from Operations
Loss for the year (1,383,441) (2,631,611)
Adjustment for non-cash income and expense items
Equity settled share-based payments 442,219 357,518
Exploration expenditure written off 50,000 930,757
Depreciation 97 -
Foreign exchange movement (16,810) -
Provision for receivable - 41,500
Adjustment for R&D Rebate - 133,899
Change in operating assets and liabilities
(Increase)/decrease in trade and other receivables (17,284) 742,880
(Decrease) in trade and other payables (26,770) (137,889)
Net cash outflow from operating activities (951,989) (562,946)
(b) Reconciliation of Cash
Cash at bank and on hand 3,741,309 175,362
Balance at 30 June 3,741,309 175,362
(c) Non-cash Financing and Investing Activities
30 June 2017
On 30 June 2017, the Company issued 15,000,000 Ordinary Shares and 65,000,000 Performance Shares as consideration for the acquisition of Ariege Tungstene SAS. Refer to Note 13 for further details.
30 June 2016
During the year ended 30 June 2016, the Company issued new shares to the value of $180,000 in part consideration for the acquisition of a 17.5% interest in Apollo African Holdings Limited. 1,910,578 shares were issued on 16 February 2016 at a deemed issue price of $0.031 each, and 4,285,714 shares were issued on 23 March 2016 at a deemed price of $0.028, for total share based consideration of $180,000.
There were no other non-cash financing and investing activities during the year ended 30 June 2017 or 30 June 2016.
2017 2016
Restated
Cents Cents
12. EARNINGS PER SHARE
(a) Basic and Diluted Profit/(Loss) per Share
Total basic and diluted loss per share (1.21) (14.44)
Note: 1 2016 basic and diluted loss per share is post 1 for 4 consolidation effective 17 June 2016.

Apollo Minerals Limited ANNUAL REPORT 2017 47
2017 2016
Restated
$ $
The following reflects the income and share data used in the calculations of basic and diluted earnings per share:
Net loss attributable to members of the Company (1,383,441) (2,631,611)
Effect of dilutive securities - -
Earnings used in calculating basic and diluted earnings per share from continuing operations (1,383,441) (2,631,611)
Number of Ordinary
Shares
2017
Number of Ordinary
Shares
2016
Weighted average number of Ordinary Shares used in calculating basic and diluted earnings per share 114,745,380 18,218,511
On 17 June 2016, the Company completed a 1 for 4 Consolidation. The weighted average number of ordinary shares used in calculating basic and diluted earnings per share has been retrospectively adjusted in the prior period to reflect the impact of the Consolidation.
(b) Non-Dilutive Securities
As at balance date, there were 9,528,125 issued options and 65,000,000 issued Performance Shares (which represent 74,528,125 potential Ordinary Shares) which were not dilutive as they would decrease the loss per share.
(c) Conversions, Calls, Subscriptions or Issues after 30 June 2017
There have been no conversions to, calls of, or subscriptions for Ordinary Shares or issues of potential Ordinary Shares since the reporting date and before completion of this financial report.

NOTES TO THE FINANCIAL STATEMENTS FOR THE YEAR ENDED 30 JUNE 2017 (Continued)
48
13. ACQUISITION OF CONTROLLED ENTITY
On 30 June 2017, the Group completed the acquisition of Ariege Tungstene SAS which holds an 80% interest in Mines du Salat SAS. Mines du Salat SAS is governed by a Shareholder Agreement with Variscan Mines SAS, holder of the Couflens PER, pursuant to which Variscan France will transfer the Couflens PER to Mines du Salat SAS. The transaction has been accounted for as an asset acquisition in accordance with the Group’s accounting policy for exploration and evaluation expenditure, considering AASB 3 Business Combinations and the nature of the asset being acquired.
The total cost of the acquisition was $4,959,203 and comprised as follows:
Notes 30 June 2017
$
Fair value of net assets acquired:
Cash and cash equivalents
29,669
Trade and other receivables 90,857
Exploration and evaluation assets
6,267,645
Trade and other payables
(261,070)
Net assets acquired 6,127,101
Non-Controlling Interest (1,167,898)
Net assets acquired attributable to members of Apollo Minerals Limited 4,959,203
Costs of the acquisition:
Cash and cash equivalents 250,000
Loan to Ariege Tungstene SAS pre-acquisition 487,730
Deferred cash consideration(1) -
15,000,000 Fully Paid Ordinary Shares(2) 8(b) 2,965,906
10,000,000 Class A Performance Shares(3) 9(e) 593,181
10,000,000 Class B Performance Shares(3) 9(e) 197,727
10,000,000 Class C Performance Shares(3) 9(e) 197,727
15,000,000 Class D Performance Shares(3) 9(e) 148,296
20,000,000 Class E Performance Shares(3) 9(e) 118,636
4,959,203
Net cash outflow on acquisition:
Cash consideration (250,000)
Loan provided pre-acquisition (470,919)
Cash acquired on acquisition 29,669
(691,250)
Notes:
1 Deferred cash consideration includes A$250,000 payable upon satisfaction of the Class A Milestone (refer Note 9(e)) and
A$250,000 payable upon satisfaction of the Class B Milestone (refer Note 9(e)). In accordance with AASB 137, these deferred payments are considered contingent liabilities as there is a present obligation that can be reliably measured, but the obligation is not probable (more likely than not).
2 The fair value of the fully paid ordinary shares issued at the acquisition date has been determined using the 7 day volume
weighted average share price on 30 June 2017 being $0.198 per share. 3 The fair value of the performance shares at the acquisition date has been determined with reference to the 7 day volume
weighted average share price on 30 June 2017 being $0.198 per share, adjusted for Management’s assessment of the probability that the relevant milestone for each class of Performance Shares will be met.
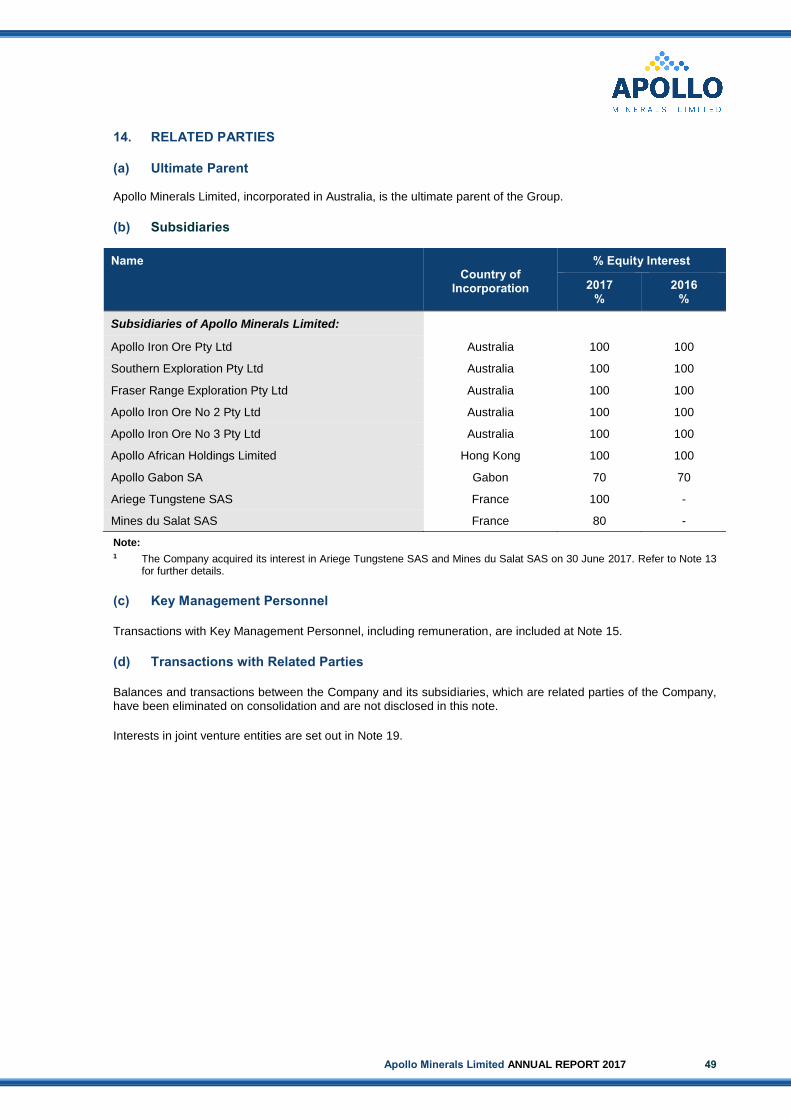
Apollo Minerals Limited ANNUAL REPORT 2017 49
14. RELATED PARTIES
(a) Ultimate Parent Apollo Minerals Limited, incorporated in Australia, is the ultimate parent of the Group.
(b) Subsidiaries
Name Country of
Incorporation
% Equity Interest
2017 %
2016 %
Subsidiaries of Apollo Minerals Limited:
Apollo Iron Ore Pty Ltd Australia 100 100
Southern Exploration Pty Ltd Australia 100 100
Fraser Range Exploration Pty Ltd Australia 100 100
Apollo Iron Ore No 2 Pty Ltd Australia 100 100
Apollo Iron Ore No 3 Pty Ltd Australia 100 100
Apollo African Holdings Limited Hong Kong 100 100
Apollo Gabon SA Gabon 70 70
Ariege Tungstene SAS France 100 -
Mines du Salat SAS France 80 -
Note: 1 The Company acquired its interest in Ariege Tungstene SAS and Mines du Salat SAS on 30 June 2017. Refer to Note 13
for further details.
(c) Key Management Personnel
Transactions with Key Management Personnel, including remuneration, are included at Note 15.
(d) Transactions with Related Parties
Balances and transactions between the Company and its subsidiaries, which are related parties of the Company, have been eliminated on consolidation and are not disclosed in this note.
Interests in joint venture entities are set out in Note 19.

NOTES TO THE FINANCIAL STATEMENTS FOR THE YEAR ENDED 30 JUNE 2017 (Continued)
50
15. KEY MANAGEMENT PERSONNEL
(a) Details of Key Management Personnel
The KMP of the Group during or since the end of the financial year were as follows: Current Directors
Mr Ian Middlemas Chairman (appointed 8 July 2016) Mr Robert Behets Non-Executive Director (appointed 12 October 2016) Dr Michel Bonnemaison Non-Executive Director (appointed 30 June 2017) Mr Ajay Kejriwal Non-Executive Director (appointed 30 June 2017) Mr Mark Pearce Non-Executive Director (appointed 8 July 2016) Former Directors
Mr Richard Shemesian Non-Executive Director (resigned 30 June 2017) Mr Eric Finlayson Non-Executive Director (resigned 8 July 2016) Mr Guy Robertson Non-Executive Director (resigned 8 July 2016) Other KMP
Mr Clint McGhie Company Secretary (appointed 8 July 2016) Unless otherwise disclosed, the KMP held their position from 1 July 2016 until the date of this report.
2017 2016
$ $
(b) Key Management Personnel Compensation
Short-term employee benefits 187,549 270,930
Post-employment benefits 3,234 8,453
Share-based payments – shares - 58,950
Share-based payments – grant of options 275,122 304,618
Total compensation 465,905 642,951
(c) Loans from Key Management Personnel
No loans were provided to or received from Key Management Personnel during the year ended 30 June 2017 (2016: Nil).
(d) Other Transactions
Apollo Group Pty Ltd (‘Apollo Group’), a Company of which Mr Mark Pearce is a director and beneficial shareholder, provides corporate, administration and company secretarial services and serviced office facilities to the Company under a services agreement effective from 1 July 2016. Either party can terminate the services agreement at any time for any reason by giving one months’ written notice. Apollo Group received a monthly retainer of $15,000 (exclusive of GST) for the provision of these services for the period from 1 July 2016 to 31 March 2017, and $20,000 per month from 1 April 2017 to 30 June 2017. The monthly retainer is reviewed every six to twelve months and is based on Apollo Group’s budgeted cost of providing the services to the Company (and other companies utilising same or similar services from Apollo) for the next six to twelve month period, with minimal or no mark-up. From time to time, Apollo Group may also receive additional fees (as agreed with the Company) in respect of services provided by Apollo Group to the Company that are not included in the agreed services covered by the monthly retainer. During the year, Apollo Group was paid additional fees of $30,000 for services in relation to a transaction.

Apollo Minerals Limited ANNUAL REPORT 2017 51
Subsequent to year end, Mines du Salat SAS has signed a services agreement with SARL E-Mines (‘E-Mines’), a Company of which Dr Michel Bonnemaison is a director and beneficial shareholder. In accordance with the agreement, E-Mines will provide geoscience consulting services to Mines du Salat in support of the Company’s Couflens Project for a 12 month period from 1 September 2017. There is a schedule of rates applicable to the services provided based on the relevant qualifications and experience of the individuals providing the services ranging from €350 to €1,100 per day. The agreement may be extended by mutual agreement and can be terminated by either party with 30 days notice without penalty.
2017 2016
$ $
16. PARENT ENTITY DISCLOSURES
(a) Financial Position
Assets
Current Assets 3,743,709 190,147
Non-Current Assets 4,876,310 917,789
Total Assets 8,620,019 1,107,936
Liabilities
Current Liabilities 159,462 174,785
Total Liabilities 159,462 174,785
Equity
Contributed Equity 44,072,803 35,940,353
Reserves 2,124,395 690,188
Accumulated Losses (37,736,641) (35,697,390)
Total Equity 8,460,557 933,151
(b) Financial Performance
Loss for the year (1,871,168) (8,504,503)
Other comprehensive income - -
Total comprehensive loss (1,871,168) (8,504,503)
(c) Other
No guarantees have been entered into by the parent entity in relation to its subsidiaries.
Refer to Note 22 for details of commitments.
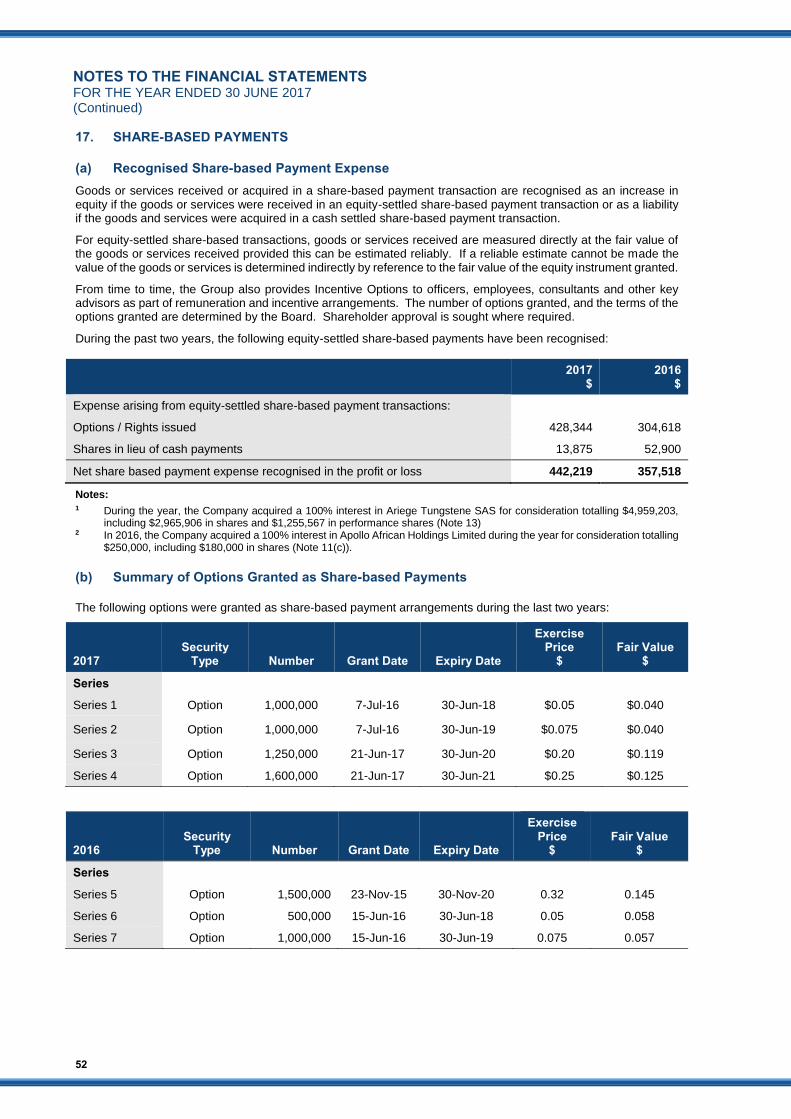
NOTES TO THE FINANCIAL STATEMENTS FOR THE YEAR ENDED 30 JUNE 2017 (Continued)
52
17. SHARE-BASED PAYMENTS
(a) Recognised Share-based Payment Expense
Goods or services received or acquired in a share-based payment transaction are recognised as an increase in equity if the goods or services were received in an equity-settled share-based payment transaction or as a liability if the goods and services were acquired in a cash settled share-based payment transaction.
For equity-settled share-based transactions, goods or services received are measured directly at the fair value of the goods or services received provided this can be estimated reliably. If a reliable estimate cannot be made the value of the goods or services is determined indirectly by reference to the fair value of the equity instrument granted.
From time to time, the Group also provides Incentive Options to officers, employees, consultants and other key advisors as part of remuneration and incentive arrangements. The number of options granted, and the terms of the options granted are determined by the Board. Shareholder approval is sought where required.
During the past two years, the following equity-settled share-based payments have been recognised:
2017
$ 2016
$
Expense arising from equity-settled share-based payment transactions:
Options / Rights issued 428,344 304,618
Shares in lieu of cash payments 13,875 52,900
Net share based payment expense recognised in the profit or loss 442,219 357,518
Notes: 1 During the year, the Company acquired a 100% interest in Ariege Tungstene SAS for consideration totalling $4,959,203,
including $2,965,906 in shares and $1,255,567 in performance shares (Note 13) 2 In 2016, the Company acquired a 100% interest in Apollo African Holdings Limited during the year for consideration totalling
$250,000, including $180,000 in shares (Note 11(c)).
(b) Summary of Options Granted as Share-based Payments
The following options were granted as share-based payment arrangements during the last two years:
2017 Security
Type Number Grant Date Expiry Date
Exercise Price
$ Fair Value
$
Series
Series 1 Option 1,000,000 7-Jul-16 30-Jun-18 $0.05 $0.040
Series 2 Option 1,000,000 7-Jul-16 30-Jun-19 $0.075 $0.040
Series 3 Option 1,250,000 21-Jun-17 30-Jun-20 $0.20 $0.119
Series 4 Option 1,600,000 21-Jun-17 30-Jun-21 $0.25 $0.125
2016 Security
Type Number Grant Date Expiry Date
Exercise Price
$ Fair Value
$
Series
Series 5 Option 1,500,000 23-Nov-15 30-Nov-20 0.32 0.145
Series 6 Option 500,000 15-Jun-16 30-Jun-18 0.05 0.058
Series 7 Option 1,000,000 15-Jun-16 30-Jun-19 0.075 0.057

Apollo Minerals Limited ANNUAL REPORT 2017 53
The following table illustrates the number and weighted average exercise prices (WAEP) of Incentive Options granted as share-based payments at the beginning and end of the financial year:
2017 Number
2017 WAEP
2016 Number
2016 WAEP
Outstanding at beginning of year 4,412,500 $0.394 6,150,000 $0.390
Adjustment for consolidation - - (4,237,500)(1) $0.205
Granted by the Company during the year 4,850,000 $0.160 3,000,000 $0.193
Expired/cancelled during the year (625,000) $1.200 (500,000) $2.500
Outstanding at end of year 8,637,500 $0.204 4,412,500 $0.394
Note: 1 Adjustment for 1 for 4 consolidation effective 17 June 2016.
The outstanding balance of options granted as share based payments on issue as at 30 June 2017 is represented by:
• 787,500 $0.52 Incentive Options at an exercise price of $0.52 on or before 28 February 2018;
• 1,500,000 $0.05 Incentive Options at an exercise price of $0.05 on or before 30 June 2018;
• 2,000,000 $0.075 Incentive Options at an exercise price of $0.075 on or before 30 June 2019;
• 1,250,000 $0.20 Incentive Options at an exercise price of $0.20 on or before 30 June 2020
• 1,500,000 $0.32 Incentive Options at an exercise price of $0.32 on or before 30 November 2020; and
• 1,600,000 $0.25 Incentive Options at an exercise price of $0.25 on or before 30 June 2021.
(c) Weighted Average Remaining Contractual Life
The weighted average remaining contractual life for the Incentive Options outstanding at 30 June 2017 is 2.47 years (2016: 2.8 years).
(d) Range of Exercise Prices
The range of exercise prices of Incentive Options outstanding at 30 June 2017 is $0.05 to $0.52 (2016: $0.05 to $1.20
(e) Weighted Average Fair Value
The weighted average fair value of Incentive Options granted during the year ended 30 June 2017 is $0.088 (2016: $0.101).

NOTES TO THE FINANCIAL STATEMENTS FOR THE YEAR ENDED 30 JUNE 2017 (Continued)
54
17. SHARE-BASED PAYMENTS (Continued)
(f) Option Pricing Model
The fair value of the equity-settled Incentive Options granted is estimated as at the date of grant using the Black-Scholes option valuation model taking into account the terms and conditions upon which the options were granted.
30 June 2017 and 30 June 2016
The following table lists the inputs to the valuation model used for share options granted by the Group during the years ended 30 June 2017 and 30 June 2016:
2017 Options Options Options Options
Inputs Series 1 Series 2 Series 3 Series 4
Exercise Price $0.05 $0.075 $0.20 $0.25
Grant date share price $0.069 $0.069 $0.198 $0.198
Dividend yield(1) - - - -
Volatility(2) 95% 95% 95% 95%
Risk free interest rate 1.58% 1.54% 1.79% 1.99%
Grant date 7-Jul-16 7-Jul-16 21-Jun-17 21-Jun-17
Expiry date 30-Jun-18 30-Jun-19 30-Jun-20 30-Jun-21
Expected life of option(3) 1.98 years 2.98 years 3.03 years 4.03 years
Fair value at grant date $0.040 $0.040 $0.119 $0.125
Notes: 1 The dividend yield reflects the assumption that the current dividend payout will remain unchanged. 2 The expected volatility reflects the assumption that the historical volatility is indicative of future trends, which may not
necessarily be the actual outcome. 3 The expected life of the options is based on the expiry date of the options as there is limited track record of the early exercise
of options.
2016 Options Options Options
Inputs Series 5(1) Series 6 Series 7
Exercise Price $0.32 $0.05 $0.075
Grant date share price $0.16 $0.09 $0.09
Dividend yield(2) - - -
Volatility(3) 160% 95% 95%
Risk free interest rate 1.81% 1.63% 1.58%
Grant date 23-Nov-15 15-Jun-16 15-Jun-16
Expiry date 30-Nov-20 30-Jun-18 30-Jun-19
Expected life of option(4) 5.02 years 2.04 years 3.04 years
Fair value at grant date $0.145 $0.058 $0.057
Notes: 1 Adjusted for 1 for 4 consolidation effective 17 June 2016. 2 The dividend yield reflects the assumption that the current dividend payout will remain unchanged. 3 The expected volatility reflects the assumption that the historical volatility is indicative of future trends, which may not
necessarily be the actual outcome. 4 The expected life of the options is based on the expiry date of the options as there is limited track record of the early exercise
of options.

Apollo Minerals Limited ANNUAL REPORT 2017 55
2017 2016
$ $
18. AUDITORS' REMUNERATION
Amounts received or due and receivable by Hall Chadwick for:
an audit or review of the financial report of the entity and any other entity in the consolidated group 27,500 28,177
other services in relation to the entity and any other entity in the consolidated group - 1,650
27,500 29,827
19. INTERESTS IN JOINT VENTURES
The Group has interests in the following joint venture operations:
Name Principal Activities Country
Interest Carrying Amount
2017 %
2016 %
2017 $
2016 $
Orpheus JV Exploration for nickel, copper and gold in the Fraser Range
Western Australia
70 70 400,000 400,000
Orpheus Joint Venture
Fraser Range Exploration Pty Ltd, a 100% owned subsidiary of Apollo Minerals Limited has a 70% interest in the unincorporated Orpheus Joint Venture with Enterprise Metals Limited (30% interest). The Orpheus Joint Venture area consists of four tenements in the prospective Fraser Range province.
Fraser Range Exploration Pty Ltd is required to sole fund all joint venture activities until the date when Fraser Range Exploration Pty Ltd delivers a Bankable Feasibility Study for a Mining Area to Enterprise Metals Limited.
20. SEGMENT INFORMATION
AASB 8 requires operating segments to be identified on the basis of internal reports about components of the Consolidated Entity that are regularly reviewed by the chief operating decision maker in order to allocate resources to the segment and to assess its performance.
The Consolidated Entity operates in one segment, being exploration for mineral resources. This is the basis on which internal reports are provided to the Directors for assessing performance and determining the allocation of resources within the Consolidated Entity. Following acquisition of Ariege Tungstene SAS on 30 June 2017, the Consolidated Entity operates in Australia and France.
Information regarding the non-current assets by geographical location is reported below. No segment information is provided for France in relation to revenue and profit or loss for the year ended 30 June 2017.
(a) Reconciliation of Non-current Assets by geographical location
2017
$ 2016
$
Australia 404,835 500,000
France 6,267,645 -
6,672,480 500,000

NOTES TO THE FINANCIAL STATEMENTS FOR THE YEAR ENDED 30 JUNE 2017 (Continued)
56
21. FINANCIAL RISK MANAGEMENT OBJECTIVES AND POLICIES
(a) Overview
The Group's principal financial instruments comprise receivables, payables, cash and short-term deposits. The main risks arising from the Group's financial instruments are interest rate risk, credit risk and liquidity risk.
This note presents information about the Group's exposure to each of the above risks, its objectives, policies and processes for measuring and managing risk, and the management of capital. Other than as disclosed, there have been no significant changes since the previous financial year to the exposure or management of these risks.
The Group manages its exposure to key financial risks in accordance with the Group's financial risk management policy. Key risks are monitored and reviewed as circumstances change (e.g. acquisition of a new project) and policies are revised as required. The overall objective of the Group's financial risk management policy is to support the delivery of the Group's financial targets whilst protecting future financial security.
Given the nature and size of the business and uncertainty as to the timing and amount of cash inflows and outflows, the Group does not enter into derivative transactions to mitigate the financial risks. In addition, the Group's policy is that no trading in financial instruments shall be undertaken for the purposes of making speculative gains. As the Group's operations change, the Directors will review this policy periodically going forward.
The Board of Directors has overall responsibility for the establishment and oversight of the risk management framework. The Board reviews and agrees policies for managing the Group's financial risks as summarised below.
(b) Credit Risk
Credit risk is the risk of financial loss to the Group if a customer or counterparty to a financial instrument fails to meet its contractual obligations. This arises principally from cash and cash equivalents and trade and other receivables.
There are no significant concentrations of credit risk within the Group. The carrying amount of the Group's financial assets represents the maximum credit risk exposure, as represented below:
2017 2016
$ $
Cash and cash equivalents 3,741,309 175,362
Trade and other receivables 122,926 14,785
3,864,235 190,147
Trade and other receivables are comprised primarily of GST/TVA refunds due. Where possible the Group trades only with recognised, creditworthy third parties. It is the Group's policy that all customers who wish to trade on credit terms are subject to credit verification procedures.
With respect to credit risk arising from cash and cash equivalents, the Group's exposure to credit risk arises from default of the counter party, with a maximum exposure equal to the carrying amount of these instruments.

Apollo Minerals Limited ANNUAL REPORT 2017 57
(c) Liquidity Risk
Liquidity risk is the risk that the Group will not be able to meet its financial obligations as they fall due. The Board's approach to managing liquidity is to ensure, as far as possible, that the Group will always have sufficient liquidity to meet its liabilities when due. At 30 June 2017, the Group had sufficient liquid assets to meet its financial obligations.
The contractual maturities of financial liabilities, including estimated interest payments, are provided below. There are no netting arrangements in respect of financial liabilities.
2017 Group ≤6 Months
$
6-12 Months
$
1-5 Years
$
≥5 Years
$
Total
$
Financial Assets
Cash and cash equivalents 3,741,309 - - - 3,741,309
Trade and other receivables 122,926 - - - 122,926
3,864,235 - - - 3,864,235
Financial Liabilities
Trade and other payables 420,539 - - - 420,539
420,539 - - - 420,539
(d) Interest Rate Risk
The Group's exposure to the risk of changes in market interest rates relates primarily to the cash and short-term deposits with a floating interest rate.
These financial assets with variable rates expose the Group to cash flow interest rate risk. All other financial assets and liabilities, in the form of receivables and payables are non-interest bearing.
At the reporting date, the interest rate profile of the Group's interest-bearing financial instruments was:
2017 2016
$ $
Interest-bearing financial instruments
Cash at bank and on hand 3,741,309 175,362
3,741,309 175,362
The Group currently does not engage in any hedging or derivative transactions to manage interest rate risk.

NOTES TO THE FINANCIAL STATEMENTS FOR THE YEAR ENDED 30 JUNE 2017 (Continued)
58
21. FINANCIAL RISK MANAGEMENT OBJECTIVES AND POLICIES (Continued)
(d) Interest Rate Risk (Continued) Interest rate sensitivity
A sensitivity of 1% (100 basis points) has been selected as this is considered reasonable given the current level of both short term and long term interest rates. A 1% (100 basis points) movement in interest rates at the reporting date would have increased (decreased) equity and profit and loss by the amounts shown below. This analysis assumes that all other variables, remain constant. The analysis is performed on the same basis for 2016.
Profit or loss Other Comprehensive Income
100bp Increase
100bp Decrease
100bp Increase
100bp Decrease
2017
Group
Cash and cash equivalents 37,413 (37,413) 37,413 (37,413)
2016
Group
Cash and cash equivalents 1,753 (1,753) 1,753 (1,753)
(e) Commodity Price Risk
The Group is exposed to commodity price risk. These commodity prices can be volatile and are influenced by factors beyond the Group's control. As the Group is currently engaged in exploration and business development activities, no sales of commodities are forecast for the next 12 months, and accordingly, no hedging or derivative transactions have been used to manage commodity price risk.
(f) Capital Management
The Board's policy is to maintain a strong capital base so as to maintain investor, creditor and market confidence and to sustain future development of the business. Given the stage of development of the Group, the Board's objective is to minimise debt and to raise funds as required through the issue of new shares.
There were no changes in the Group's approach to capital management during the year.
The Group is not subject to externally imposed capital requirements.
(g) Fair Value
The net fair value of financial assets and financial liabilities approximates their carrying value. The methods for estimating fair value are outlined in the relevant notes to the financial statements.
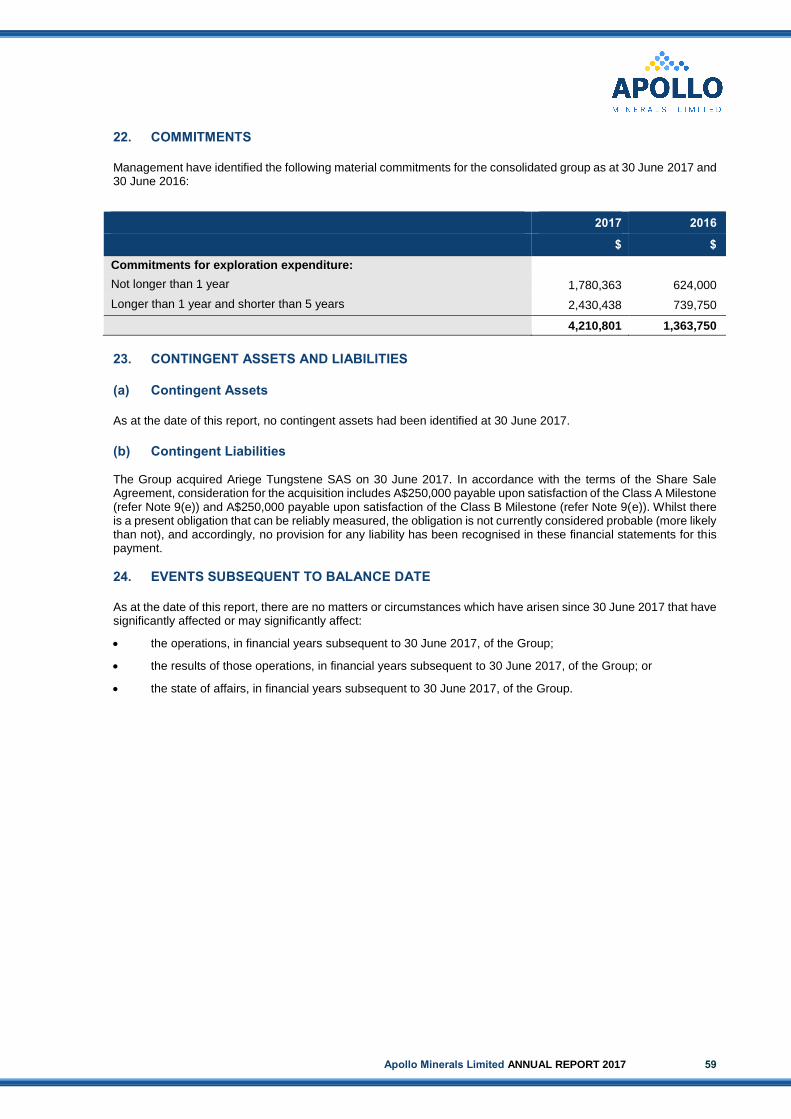
Apollo Minerals Limited ANNUAL REPORT 2017 59
22. COMMITMENTS
Management have identified the following material commitments for the consolidated group as at 30 June 2017 and 30 June 2016:
2017 2016
$ $
Commitments for exploration expenditure:
Not longer than 1 year 1,780,363 624,000
Longer than 1 year and shorter than 5 years 2,430,438 739,750
4,210,801 1,363,750
23. CONTINGENT ASSETS AND LIABILITIES
(a) Contingent Assets
As at the date of this report, no contingent assets had been identified at 30 June 2017.
(b) Contingent Liabilities The Group acquired Ariege Tungstene SAS on 30 June 2017. In accordance with the terms of the Share Sale Agreement, consideration for the acquisition includes A$250,000 payable upon satisfaction of the Class A Milestone (refer Note 9(e)) and A$250,000 payable upon satisfaction of the Class B Milestone (refer Note 9(e)). Whilst there is a present obligation that can be reliably measured, the obligation is not currently considered probable (more likely than not), and accordingly, no provision for any liability has been recognised in these financial statements for this payment.
24. EVENTS SUBSEQUENT TO BALANCE DATE
As at the date of this report, there are no matters or circumstances which have arisen since 30 June 2017 that have significantly affected or may significantly affect:
• the operations, in financial years subsequent to 30 June 2017, of the Group;
• the results of those operations, in financial years subsequent to 30 June 2017, of the Group; or
• the state of affairs, in financial years subsequent to 30 June 2017, of the Group.

DIRECTORS’ DECLARATION
DIRECTORS’ DECLARATION
60
In accordance with a resolution of the directors of Apollo Minerals Limited:
1. In the opinion of the directors:
(a) the attached financial statements, notes and the additional disclosures included in the directors' report designated as audited, are in accordance with the Corporations Act 2001, including:
(i) section 296 (compliance with accounting standards and Corporations Regulations 2001); and
(ii) section 297 (gives a true and fair view of the financial position as at 30 June 2017 and of the performance for the year ended on that date of the Group); and
(b) there are reasonable grounds to believe that the Company will be able to pay its debts as and when they become due and payable.
2. The attached financial statements and notes thereto are in compliance with International Financial Reporting Standards, as stated in Note 1(b) to the financial statements.
3. The Directors have been given a declaration required by section 295A of the Corporations Act 2001 for the financial year ended 30 June 2017.
On behalf of the Board
ROBERT BEHETS Director
28 September 2017

INDEPENDENT AUDITOR’S REPORT TO THE MEMBERS OF APOLLO MINERALS LIMITED
Apollo Minerals Limited ANNUAL REPORT 2017 61
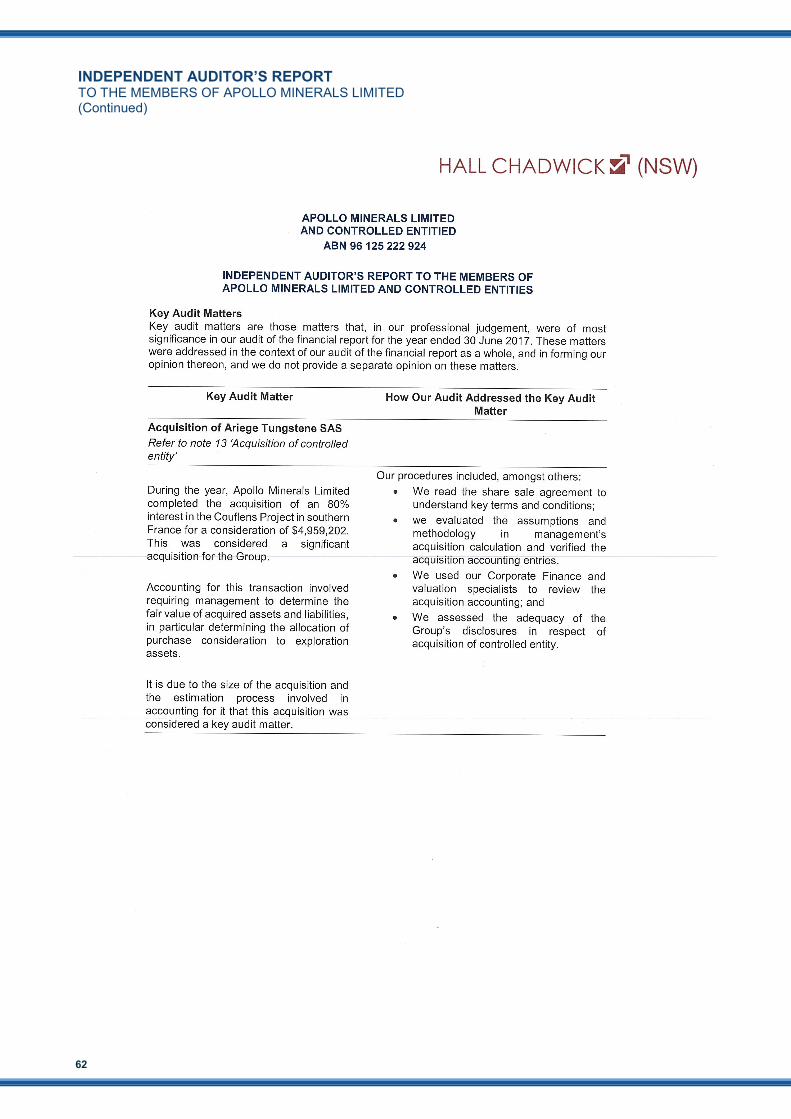
INDEPENDENT AUDITOR’S REPORT TO THE MEMBERS OF APOLLO MINERALS LIMITED (Continued)
62

Apollo Minerals Limited ANNUAL REPORT 2017 63

INDEPENDENT AUDITOR’S REPORT TO THE MEMBERS OF APOLLO MINERALS LIMITED (Continued)
64

Apollo Minerals Limited ANNUAL REPORT 2017 65
CORPORATE GOVERNANCE STATEMENT
66
Apollo Minerals Limited (“Apollo Minerals” or “Company”) and the entities it controls believe corporate governance is important for the Company in conducting its business activities.
The Board of Apollo Minerals has adopted a suite of charters and key corporate governance documents which articulate the policies and procedures followed by the Company.
These documents are available in the Corporate Governance section of the Company’s website, www.apollominerals.com.au. These documents are reviewed annually to address any changes in governance practices and the law.
The Company’s Corporate Governance Statement 2017, which explains how Apollo Minerals complies with the ASX Corporate Governance Council’s ‘Corporate Governance Principles and Recommendations – 3rd Edition’ in relation to the year ended 30 June 2017, is available in the Corporate Governance section of the Company’s website, www.apollominerals.com.au and will be lodged with ASX together with an Appendix 4G at the same time that this Annual Report is lodged with ASX.
In addition to the ASX Corporate Governance Council’s ‘Corporate Governance Principles and Recommendations – 3rd Edition’ the Board has taken into account a number of important factors in determining its corporate governance policies and procedures, including the:
• relatively simple operations of the Company, which currently only undertakes mineral exploration and
development activities;
• cost verses benefit of additional corporate governance requirements or processes;
• size of the Board;
• Board’s experience in the resources sector;
• organisational reporting structure and number of reporting functions, operational divisions and employees;
• relatively simple financial affairs with limited complexity and quantum;
• relatively small market capitalisation and economic value of the entity; and
• direct shareholder feedback.
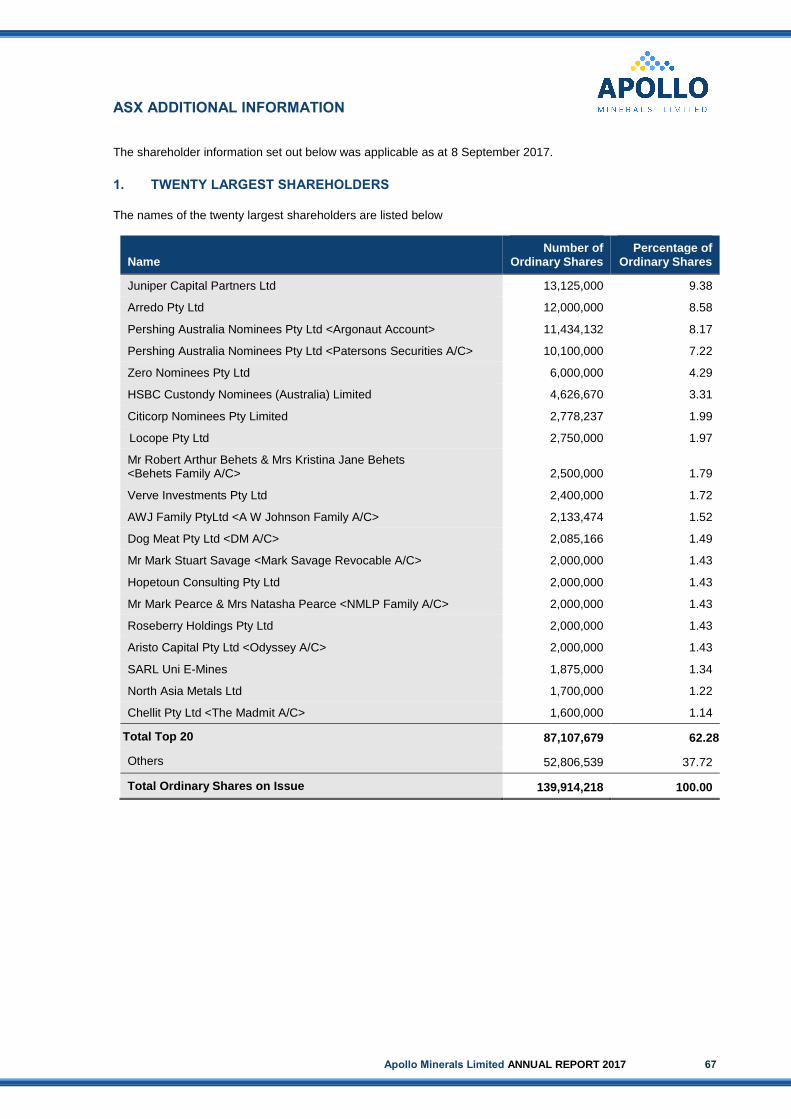
ASX ADDITIONAL INFORMATION
Apollo Minerals Limited ANNUAL REPORT 2017 67
The shareholder information set out below was applicable as at 8 September 2017.
1. TWENTY LARGEST SHAREHOLDERS
The names of the twenty largest shareholders are listed below
Name Number of
Ordinary Shares Percentage of
Ordinary Shares
Juniper Capital Partners Ltd 13,125,000 9.38
Arredo Pty Ltd 12,000,000 8.58
Pershing Australia Nominees Pty Ltd <Argonaut Account> 11,434,132 8.17
Pershing Australia Nominees Pty Ltd <Patersons Securities A/C> 10,100,000 7.22
Zero Nominees Pty Ltd 6,000,000 4.29
HSBC Custondy Nominees (Australia) Limited 4,626,670 3.31
Citicorp Nominees Pty Limited 2,778,237 1.99
Locope Pty Ltd 2,750,000 1.97
Mr Robert Arthur Behets & Mrs Kristina Jane Behets <Behets Family A/C> 2,500,000 1.79
Verve Investments Pty Ltd 2,400,000 1.72
AWJ Family PtyLtd <A W Johnson Family A/C> 2,133,474 1.52
Dog Meat Pty Ltd <DM A/C> 2,085,166 1.49
Mr Mark Stuart Savage <Mark Savage Revocable A/C> 2,000,000 1.43
Hopetoun Consulting Pty Ltd 2,000,000 1.43
Mr Mark Pearce & Mrs Natasha Pearce <NMLP Family A/C> 2,000,000 1.43
Roseberry Holdings Pty Ltd 2,000,000 1.43
Aristo Capital Pty Ltd <Odyssey A/C> 2,000,000 1.43
SARL Uni E-Mines 1,875,000 1.34
North Asia Metals Ltd 1,700,000 1.22
Chellit Pty Ltd <The Madmit A/C> 1,600,000 1.14
Total Top 20 87,107,679 62.28
Others 52,806,539 37.72
Total Ordinary Shares on Issue 139,914,218 100.00
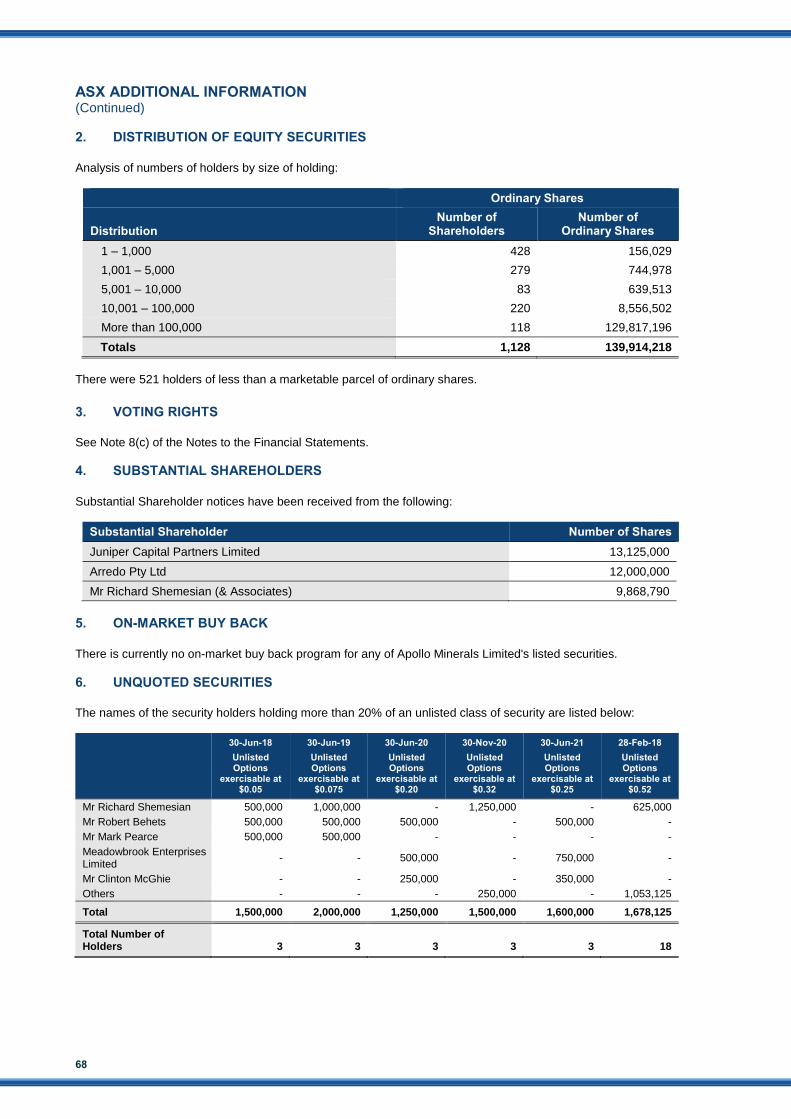
ASX ADDITIONAL INFORMATION (Continued)
68
2. DISTRIBUTION OF EQUITY SECURITIES
Analysis of numbers of holders by size of holding:
Ordinary Shares
Distribution Number of
Shareholders Number of
Ordinary Shares
1 – 1,000 428 156,029
1,001 – 5,000 279 744,978
5,001 – 10,000 83 639,513
10,001 – 100,000 220 8,556,502
More than 100,000 118 129,817,196
Totals 1,128 139,914,218
There were 521 holders of less than a marketable parcel of ordinary shares.
3. VOTING RIGHTS
See Note 8(c) of the Notes to the Financial Statements.
4. SUBSTANTIAL SHAREHOLDERS
Substantial Shareholder notices have been received from the following:
Substantial Shareholder Number of Shares
Juniper Capital Partners Limited 13,125,000
Arredo Pty Ltd 12,000,000
Mr Richard Shemesian (& Associates) 9,868,790
5. ON-MARKET BUY BACK
There is currently no on-market buy back program for any of Apollo Minerals Limited's listed securities.
6. UNQUOTED SECURITIES
The names of the security holders holding more than 20% of an unlisted class of security are listed below:
30-Jun-18
Unlisted Options
exercisable at $0.05
30-Jun-19
Unlisted Options
exercisable at $0.075
30-Jun-20
Unlisted Options
exercisable at $0.20
30-Nov-20
Unlisted Options
exercisable at $0.32
30-Jun-21
Unlisted Options
exercisable at $0.25
28-Feb-18
Unlisted Options
exercisable at $0.52
Mr Richard Shemesian 500,000 1,000,000 - 1,250,000 - 625,000
Mr Robert Behets 500,000 500,000 500,000 - 500,000 -
Mr Mark Pearce 500,000 500,000 - - - -
Meadowbrook Enterprises Limited
- - 500,000 - 750,000 -
Mr Clinton McGhie - - 250,000 - 350,000 -
Others - - - 250,000 - 1,053,125
Total 1,500,000 2,000,000 1,250,000 1,500,000 1,600,000 1,678,125
Total Number of Holders 3 3 3 3 3 18

Apollo Minerals Limited ANNUAL REPORT 2017 69
7. MINERAL RESOURCES STATEMENT
To date, the Company has not reported any Mineral Resources or Ore Reserves for its exploration projects.
8. EXPLORATION INTERESTS
As at 8 September 2016, the Company has an interest in the following projects:
Project Name Permit Number Percentage Interest Status
Couflens Project Couflens PER 80% Granted
Fraser Range E63/1281 70% Granted
E63/1282 70% Granted
E28/2403 70% Granted
E63/16951 70% Application
Commonwealth Hill EL5969 100% Granted
EL6013 100% Granted
Kango North G1-3402 70% Granted
Notes:
1 Exploration Licence E63/1695 in application pending grant by the Western Australian DMP 2 Exploration licence G1-340 subject to earn-in by Zoradox Ltd to earn up to 50.1% interest in Apollo Gabon SA, which owns
the Kango North Project.

ABN 96 125 222 924
2017ANNUAL REPORT
Apollo Minerals Limited
PERTHLevel 9, BGC Centre, 28 The Esplanade Perth WA 6000
Telephone: +61 8 9322 6322 Facsimile: +61 8 9322 6558
Website: www.apollominerals.com.auEmail: [email protected]
APO
LLO M
INERA
LS LIMITED
AN
NU
AL REPO
RT 2017
LONDONUnit 3C, Princes House, 38 Jermyn Street London SW1Y 6DN
Telephone: +44 203 903 1930 Facsimile: +44 207 434 4450


