42
Rosemarie R. Calma, Cristina F. Olo and Teofila S. Santos Apoptosis in Ovarian Cells of Nile Tilapia (Oreochromis niloticus) Chronically Exposed to Pyrethroid

Rosemarie R. Calma, Cristina F. Olo and Teofila S. Santos
Apoptosis in Ovarian Cells of Nile Tilapia (Oreochromis niloticus)
Chronically Exposed toPyrethroid
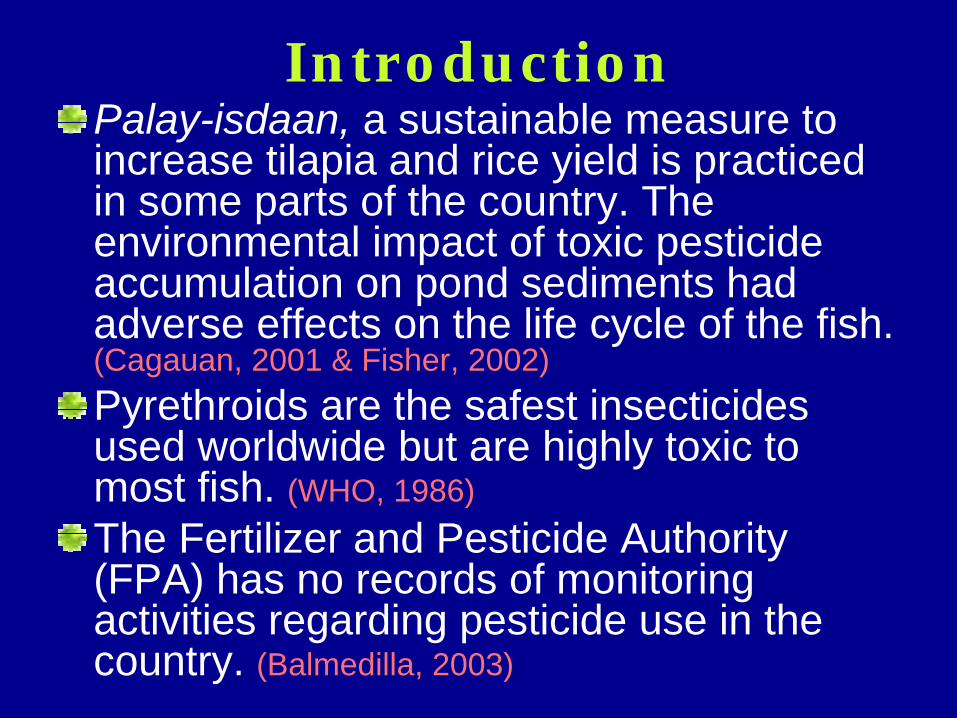
IntroductionPalay-isdaan, a sustainable measure to increase tilapia and rice yield is practiced in some parts of the country. The environmental impact of toxic pesticide accumulation on pond sediments had adverse effects on the life cycle of the fish. (Cagauan, 2001 & Fisher, 2002)Pyrethroids are the safest insecticides used worldwide but are highly toxic to most fish. (WHO, 1986)The Fertilizer and Pesticide Authority (FPA) has no records of monitoring activities regarding pesticide use in the country. (Balmedilla, 2003)

Hormones and pesticides act as endocrine-disruptors in fish. (Janz & Van derKraak, 1997, Wood & Van der Kraak, 2002, Weber et al, 2002)Endocrine-disrupting chemicals are correlated with early or precocious sexual maturity in fish. (Colbourn as cited by Gillete, 1997)
Increased fecundity and fertility of Nile Tilapia at a smaller size due to environmental harshness. (Khallaf et al, 2000)

Gonadosomatic Index (GSI) is the percentage ratio of the gonad weight and body weight used to determine fecundity among fish. (Janz et al, 1997)
Spontaneous apoptosis (programmed cell death without inflammation) is necessary to maintain homeostasis in reproductive cells. (King, 2000)Induction of apoptosis by endocrine-disruptors in the environment (ex. pyrethroid) could alter the reproductive potential of Nile Tilapia.

This study aims :
to determine the effect of the time of exposure and the different concentrations of pyrethroid to the GSI of Nile Tilapia.
to correlate the Gonadosomatic Index of Nile Tilapia with the body weight and gonad weight.
to determine the histological signs of apoptosis in the ovarian cells of Nile Tilapia.

Methodology
Acclimation
Range-Finding Test
Sublethal Exposure Test
Control 75%50%25%

Housing

Feeds : 30-35% crude protein
Amount: 30% @ AM and 10% @PM of total fish BW.
Time: 3x a day 8 AM, 11 AM, 4 PM
Pyrethroid: 2mg tablet, 25mg/L deltamethrin as an active ingredient
Dilution: 3 tabs/L = 0.10 mg/L

Nile Tilapia (BFAR 2000) Samples

Laboratory Analyses Tools


Data Collection• In situ analysis of apoptotic signs in the
ovarian cells (+ present, - absent)• GSI (body weight, gonad weight)• Physico-chemical parameters were
monitored• Temperature (28-32 oC)• Dissolved oxygen (3-6 mg/L)• pH (7-8)• Conductivity (µS/cm (0.65) = TDS mg/L)
243-300 mg/L• Water hardness as CaCO3 (hard – very hard)

Statistical Analysis!PROC ANOVA – applying of treatments on 2
variables
!Two -factorial design! The doses of pyrethroid were used as
factor A with 4 levels (0%, 25%, 50% and 75%)
! Weeks of treatment was factor B with 4 levels (1, 2, 3 & 4)
!Student Newman Keul Test (SNK]- to detect treatment mean significance

RESULTS
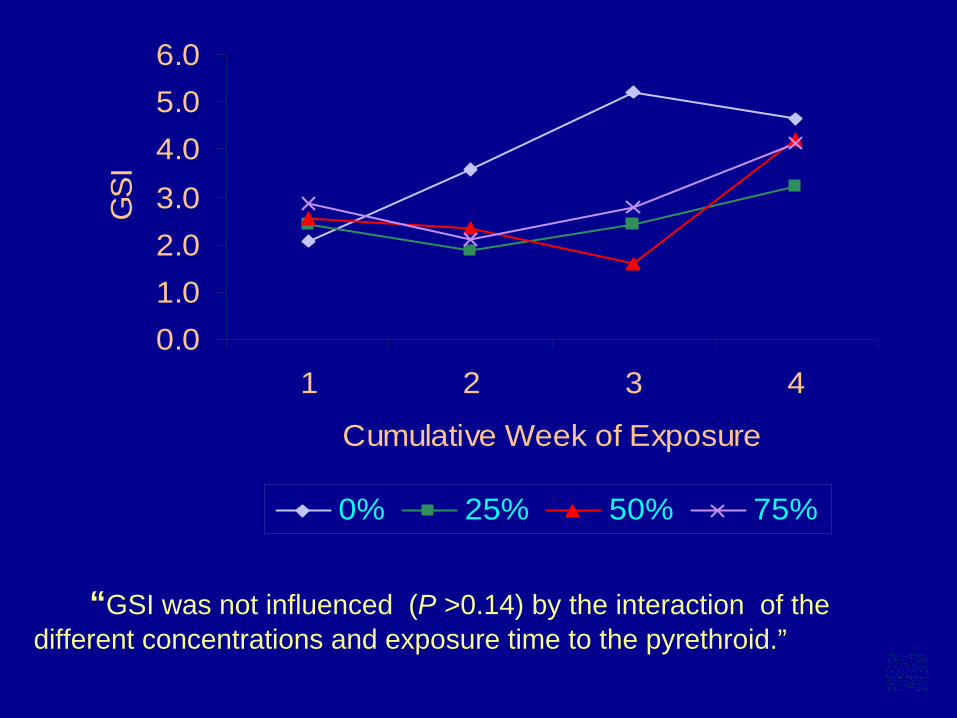
• GSI was not influenced (P >0.14) by the interaction of the different concentrations and exposure time to the pyrethroid.
• The different sublethal concentrations of the pyrethroid significantly (P < 0.03) decreased the GSI.
• The GSI was highly influenced (P < 0.006) by the time of exposure.
A. Gonadosomatic Index

B. Correlations
• GSI and BW showed a negative correlation (r = -0.124)
• A significant (P < 0.05) relationship exists (r = 0.896) between GSI and GW.
• A low correlation ( r = 0.291) exists between GW and BW

C. Histological Analysis
Oocytes at different stages of development dominated by yolk granular stages, few cortical-alveolar stages and previtellogenicoocytes
Asynchronous ovary of Nile Tilapia

Proliferating Oogonia
(a) Slightly ovoid oogonium with granular materials occupying the entire cytoplasm,
(b) oogonium with distinct nuclear area,(c) oogonia next to yolk granular oocyte with
enlarged nuclear area and several primer nucleoli and
(d) slightly spherical oogonium with reduced cytoplasmic area and four primer nucleoli. (H&E, HPO 3x)
a b c d

Previtellogenic Oocytes
(a) Oocyte at chromatin nucleolar stage with large nucleus,
(b) oocyte at chromatin-nucleolar stage with prime nucleoli and distinct chromatids.
a b______
25µm

Previtellogenic Oocytes
a. Oocyte at perinucleolar stage with several perinucleoli and surrounding theca folliculicells
b. Perinucleolar stage with nucleoli along the periphery of the nucleoplasm surrounded by the developing zona radiata.
a b

Vitellogenic Oocytes
(a) cortical alveolar oocyte with distinct ring of cortical alveoli anterior to the zona radiata and prominent nucleus with several nucleoli,
(b) cortical alveolar oocyte with smaller nucleus (c) irregularly-shaped cortical alveoli along the
center of the ooplasm.
a b c

Vitellogenic Oocytes
• Oocytes at yolk granular stage with nuclear area almost entirely covered with yolk granules (HPO)

Table 2. Histological apoptotic signs in the ovarian cells of O.niloticus exposed to different sublethal concentrations of pyrethroid observed on a weekly interval.

Histological Features of ApoptosisBlebbing Membrane
Perinucleolar oocyte (a) and oogonia (b) exposed to 75% sublethal concentration of pyrethroid (a) LPO 5.3x
a b
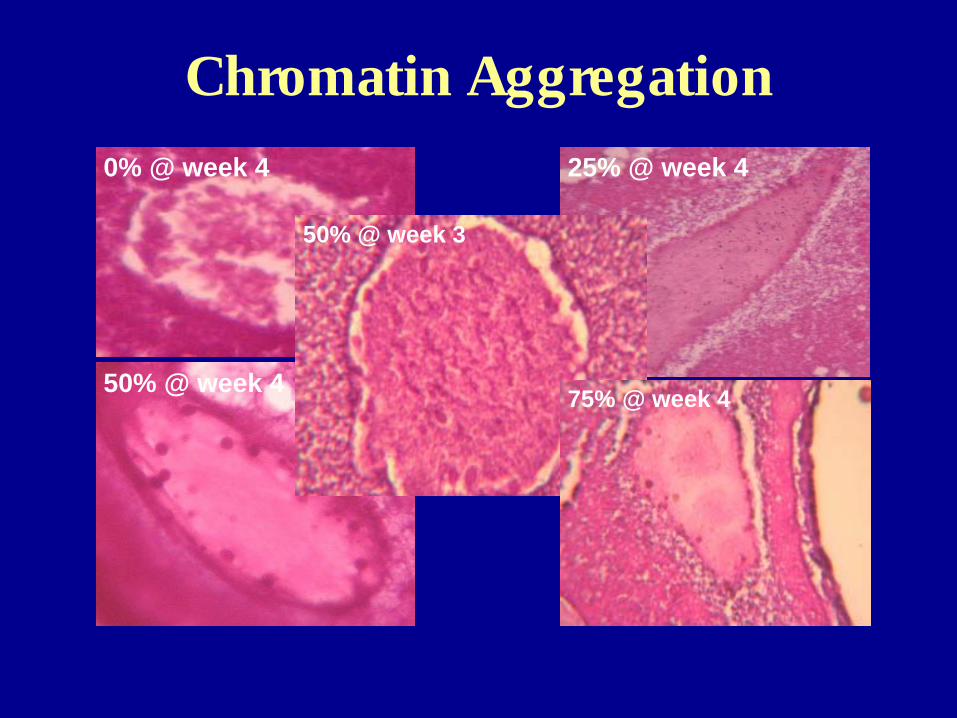
Chromatin Aggregation
0% @ week 4 25% @ week 4
50% @ week 4 75% @ week 4
50% @ week 3

Nuclear Condensation
Nuclear condensations of the oocytes at week 4

Cytoplasmic condensation
Cytoplasmic condensations in the oocytesexposed to 75% sublethal concentration of pyrethroid at week 4.
a b c

Theca /Granulosa breakdown
• Theca and granulosa layer disruption at the basement membrane exposed to 75% sublethal concentration of pyrethroid.
Gr
Th
Theca cells

Vesicle formation
Formation of membrane-bound vesicles in oocytes exposed to 25% @ wk 3 (a), 50% @ wk 3 (b) and 75% @ wk 1 (c) sublethalconcentration of pyrethroid. (LPO/ H & E 4.3x).
a b c

ConclusionsGSI was influenced by the exposure to pyrethroid.
GSI is highly correlated with gonad weight but not body weight.
Prolonged exposure to endocrine disruptor (pyrethroid) resulted into early apoptotic signs on the ovarian cells.

Recommendation
Assessment on the use of pesticides or fertilizers as endocrine disruptors in fish ponds and the possibility of early sexual maturation in tilapia brought about by the induction of apoptosis.

Acknowledgements

References• Herrera, A.A. (1996). Histology of Tilapia Oreochromis niloticus. BFAR, Q.C.Phils• Mair, G.C. & Abella, T. A. (eds.) (1997). Technoguide in the production of genetically male Tilapia (GMT)
FAC/CLSU. Nueva Ecija, Philippines.• Blanco, B.P.Jr. &. Pinto, R.D (2002). (newsletter) Raising Tilapia in your backyard. BFAR, Q.C. Philippines.• Bolivar, R.B. & Brown, C.L. (2003). Cost containment options for Tilapia production in Central Luzon, Republic of
the Philippines; Product Diversification Research 2 (10PDVR2)/Experiment/Philippines. The Pond Dynamics/Aquaculture CRSP , USAID Grant No. LAG-G-00-96-90015-00. Central Luzon State University, Philippines & Florida International.
• Cagauan, A.G., Branckaert R. D. S. & Van Hove, C. (2001). Rice-duck farming in Asia: Increasing its production potentials by integration with fish and the nitrogen-fixing aquatic fern Azolla. The First INFPD/FAO Electronic Conference on Family Poultry. 235-248.
• Kocher, T.D., Woo-Jai Lee, Sobolewska, H., Penman D. & McAndrew, B. (1998 March). A genetic linkage map of a cichlid fish, the Tilapia (Oreochromis niloticus) Genetics Society of America. Genetics 148, pp. 1225–1232 La Don S. (1997) a fish farmer’s guide to water quality in Aquaculture Extension Fact Sheet AS-503 Sea Grant #IL-IN-SG-97-2; rev. 3/97
• Marquez, E. B. (2002). (newsletter). Tilapia hatchery management. BFAR, Q.C. Philippines.• Zafra, E.H. (2002) (newsletter) Fishpond grow-out management of Tilapia. BFAR, Q.C. Philippines.• Bardakci, F., Ozansoy, Ü. & Koptagel, E. (2000). A comparison of oogenesis under constant and fluctuating
temperatures in Doctor fish, Garra rufa Heckel, 1843 (Teleostei: Cyprinidae)(http://www.epress.com/w3jbio/vol5bardakci/paper.htm)
• International Center for Living Aquatic Resources Management (ICLARM), (2003).(http://www.worldfishcenter.org/index.htm)
• Khallaf, E.A., Galal M. & Authman, M. (2000). The Biology of O. niloticus in a polluted canal. Zoology Department, Faculty of Science, Minufiya University, Shebeen Al-Koom Egypt. (http://www-heb.pac.dfo-mpo.gc.ca/congress/2000/Papers/toxicologypdf/khallaf.pdf.)
• Arida, J. (2003). Bureau of Fisheries and Aquatic Resources Reg. IV• Balmedilla, R. (2003). Fertilizer and Pesticide Authority, Manila.• Carandang, L. (2003) Bureau of Fisheries and Aquatic Resources Reg. IV

0.01.02.03.04.05.06.0
1 2 3 4
Cumulative Week of Exposure
GS
I
0% 25% 50% 75%
“GSI was not influenced (P >0.14) by the interaction of the different concentrations and exposure time to the pyrethroid.”

a
b b b
00.5
11.5
22.5
33.5
4
GSI
0 25 50 75
Sublethal Concentrations ( % in mg/L)
“ Compared with the control group which has higher GSI, treated groups regardless of concentrations showed reduction in GSI.”

a aa
b
00.5
11.5
22.5
33.5
44.5
GSI
1 2 3 4
Weeks of Exposure
“ The GSI @ 4th week was significantly different with the first 3 weeks. As the week of exposure progresses, the GSI increases“

Correlation Between GSI and BW
r = - 0.124
0
20
40
60
80
100
120
140
160
0 2 4 6 8 10 12GSI
Body
Weigh
t (g)

Correlation Between GSI and GW
r = 0.896
0
1
2
3
4
5
6
7
8
9
0 2 4 6 8 10 12GSI
Gon
ad W
eigh
t (g)
“ Gonad weight regardless of the body weight can be used as an indicator of fecundity to measure the reproductive fitness of O. niloticus.”

Correlation Between GW and BW
r= 0.291
0
20
40
60
80
100
120
140
160
0 1 2 3 4 5 6 7 8Gonad Weight (g)
Body
Wei
ght (
g)
“ Body weight is not an indicator of gonad weight. O. niloticus can be more fecund even at lower body weight.”
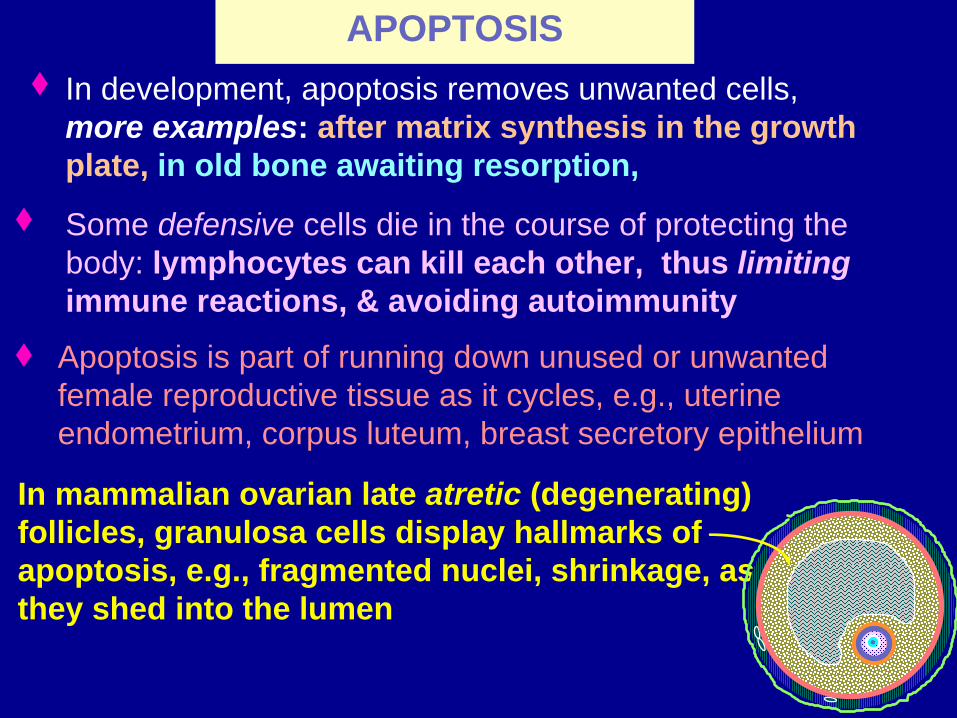
APOPTOSISIn development, apoptosis removes unwanted cells,more examples: after matrix synthesis in the growth plate, in old bone awaiting resorption,
Apoptosis is part of running down unused or unwanted female reproductive tissue as it cycles, e.g., uterine endometrium, corpus luteum, breast secretory epithelium
In mammalian ovarian late atretic (degenerating) follicles, granulosa cells display hallmarks of apoptosis, e.g., fragmented nuclei, shrinkage, as they shed into the lumen
Some defensive cells die in the course of protecting the body: lymphocytes can kill each other, thus limitingimmune reactions, & avoiding autoimmunity

APOPTOSIS: Contexts I Where usedIn development, apoptosis removes unwanted cells; for example in separating the digits of the hand, culling excess neurons, eliminating inappropriately sensitive lymphocytesIn mature tissues that undergo renewal, e.g., blood cells, some epithelia, the outdated cells deliberately destroy themselves, if they canSome defensive cells die in the course of protecting the body, e.g. neutrophils, or in developing maximum affinity for attacking an invader, e.g. B lymphocytes
Apoptosis is used in running down unused or unwanted female reproductive tissue as it cycles, e.g., uterine endometrium, corpus luteum, breast gland epithelium
Most tumor cells grow; some become apoptoticInfected cells may be removed by apoptosis

Apoptosis
Eric Niederhoffer
SIU-SOM
Cell death
Fas
FasL
TNF-R1
TNF
TRADD
FADD
Cas8 Caseff
Mit
Cyt c
Protein degradation
DNase


![RESEARCH ARTICLE Open Access Eugenol triggers apoptosis in ... · melanoma cells [15] and HL-60 leukemia cells [18]. Moreover, eugenol induced apoptosis and inhibited inva-sion and](https://static.documents.pub/doc/80x56/5f4f7d0ba4b13a76607ab1f6/research-article-open-access-eugenol-triggers-apoptosis-in-melanoma-cells-15.jpg)


![Prohibitin (PHB) inhibits apoptosis in rat granulosa cells ...apoptosis of granulosa cells (GCs) during follicular growth and development [1, 2]. Ovarian GCs play an important physiological](https://static.documents.pub/doc/80x56/5f84f4a5739a256f3f64c746/prohibitin-phb-inhibits-apoptosis-in-rat-granulosa-cells-apoptosis-of-granulosa.jpg)