APPENDICES Appendix- 1 Materials for Workshop 1.1 1st Workshop (January 2008) 1.2 2nd Workshop (August 26, 2008) 1.3 3rd Workshop (November 5, 2008) Appendix- 2 Technology Transfer Seminar Appendix- 3 A summary of a Study on a Railway Link Plan for Coal Transportation Appendix- 4 Coal Supply to PLN Appendix- 5 Operation Record 5.1 Operation Performance Record for the Existing Power Plants of PJB 5.2 Operation Performance Record for the Existing Power Plants of Indonesia Power Appendix- 6 Simulation Data of WASP IV 6.1 Input Data 6.2 Output Data Appendix- 7 General Information of System Planning Appendix- 8 Outline of PSS/E Software Appendix- 9 “Analisis Dampak Lingkungan (ANDAL) Pembangunan Pembangkit Listrik Tenaga Uap (PLTU) 2 Jawa Timur Kapasitas 1 × (600-700) MW di Kabupaten Probolinggo” Appendix-10 “Pemantauan Pelaksanaan RKL dan RPL PLTU Suralaya Unit 1-8 Semester 1 Tahun 2007” Appendix-11 “NOTA DINAS No. 062/121/PD Y5/2008” for SUMMARY AMDAL PLTU1 Jawa Tengah Rembang
Appendix- 3 A summary of a Study on a Railway Link Plan for Coal Transportation
Appendix- 4 Coal Supply to PLN
Appendix- 5 Operation Record 5.1 Operation Performance Record for the Existing Power Plants of PJB 5.2 Operation Performance Record for the Existing Power Plants of Indonesia Power
Appendix- 6 Simulation Data of WASP IV 6.1 Input Data 6.2 Output Data
Appendix- 7 General Information of System Planning
Appendix- 8 Outline of PSS/E Software
Appendix- 9 “Analisis Dampak Lingkungan (ANDAL) Pembangunan Pembangkit Listrik
Tenaga Uap (PLTU) 2 Jawa Timur Kapasitas 1 × (600-700) MW di Kabupaten Probolinggo”
Appendix-10 “Pemantauan Pelaksanaan RKL dan RPL PLTU Suralaya Unit 1-8 Semester 1 Tahun 2007”
Appendix-11 “NOTA DINAS No. 062/121/PD Y5/2008” for SUMMARY AMDAL PLTU1 Jawa Tengah Rembang
APPENDIX-1 MATERIALS FOR WORKSHOP
1.1 1st Workshop (January 2008)
1.2 2nd Workshop (August 26, 2008)
1.3 3rd Workshop (November 5, 2008)
1.1 1st Workshop (January 2008)
1
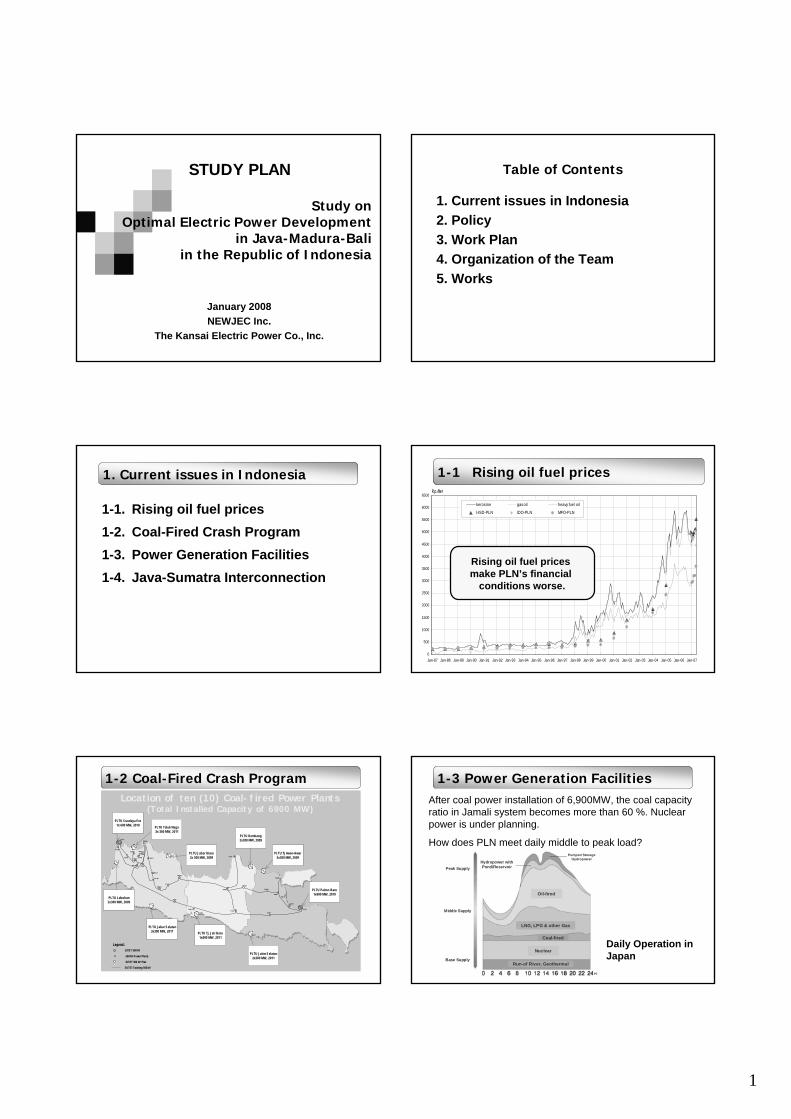
Study onOptimal Electric Power Development
in Java-Madura-Baliin the Republic of Indonesia
January 2008NEWJEC Inc.
The Kansai Electric Power Co., Inc.
STUDY PLAN Table of Contents
1. Current issues in Indonesia2. Policy3. Work Plan4. Organization of the Team5. Works
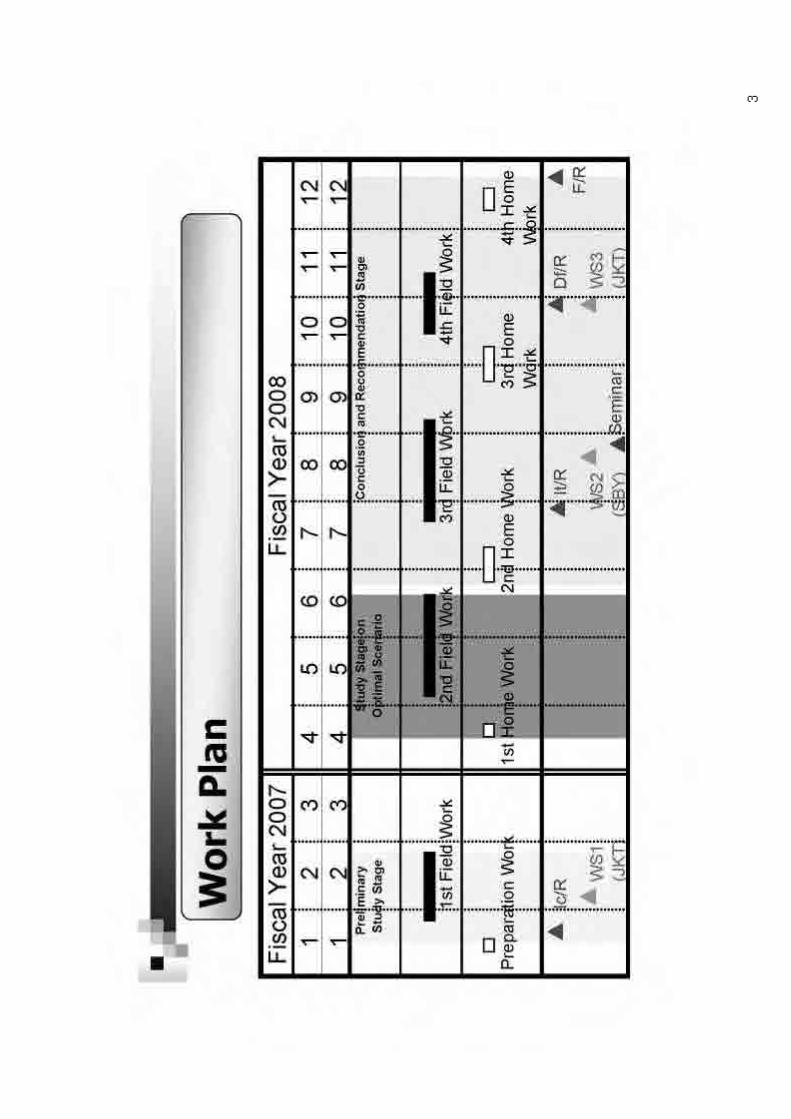
Conclusion and Recommendation StagePreliminaryStudy Stage
1st Field Work 3rd Field Work 4th Field Work
Preparation Work 2nd Home Work
Ic/R
WS1(JKT)
WS2(SBY)
Df/R
WS3(JKT)
F/R
1st Home Work
It/R
2nd Field Work
3rd HomeWork
4th HomeWork
Seminar
4. Organization of the Team
Development ofTransmission Sys.
Development ofPower Resources
Indonesia Counterpart Team
The KANSAI Electric Power Co., Inc.Power System Division
(Member of Consortium)
T. MatsunoNEWJEC
Primary EnergyReview
Power DemandForecast
Economc andFinancial
Environmentaland Social Con.
Consortium for "The Study on OptimalElectric Power Development in Java-Madura-
Bali in the Republic of Indonesia"
JICA Study Team
NEWJEC Inc.International Operations
Team Leader/PowerDevelopment Plan
System Planning
Y. TanakaNEWJEC
Y. KoyamaKANSAI
Y. MatsudaNEWJEC
Y. NakajimaNEWJEC
H. YamadaThe KANSAI
Economic andFinancial
M. NishidaNEWJEC
Environmental andSocial Con.T. Ohwadai
JANUS
System Operation Power GenerationExpansion Plan
Primary EnergySupply
Poer DemandForecast
S. YamaokaNEWJEC
Coordinator
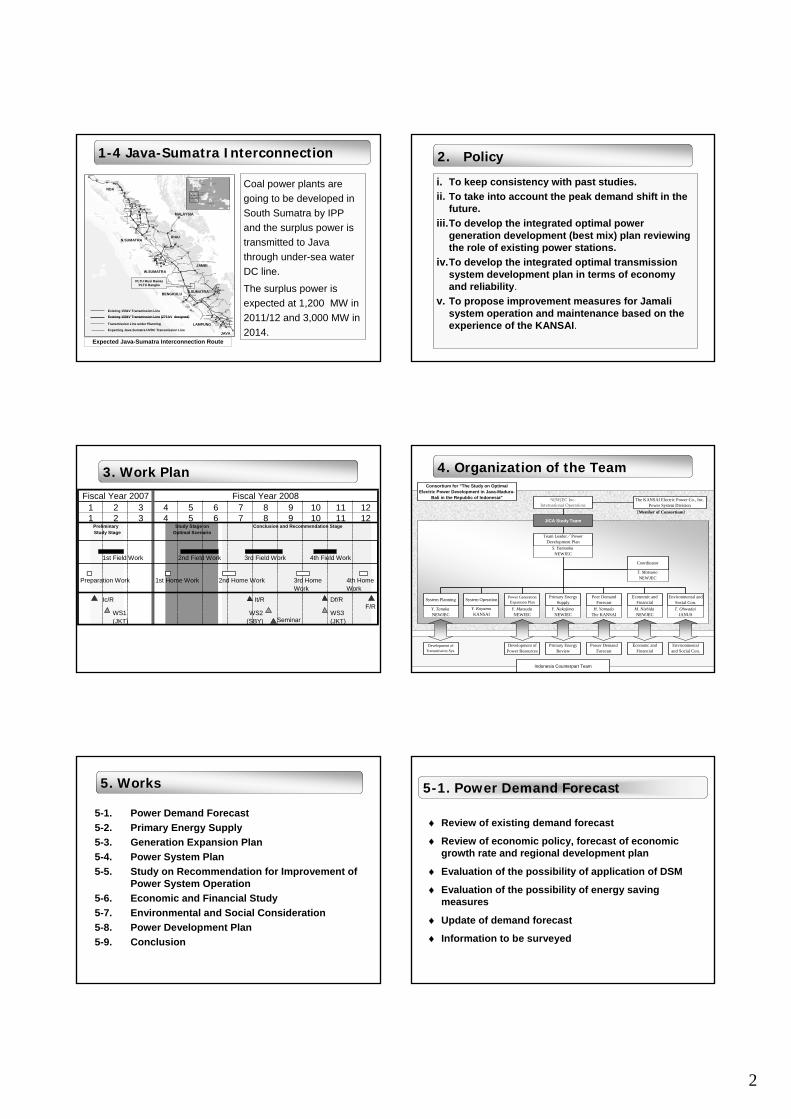
5. Works
5-1. Power Demand Forecast5-2. Primary Energy Supply5-3. Generation Expansion Plan5-4. Power System Plan5-5. Study on Recommendation for Improvement of
Power System Operation5-6. Economic and Financial Study5-7. Environmental and Social Consideration5-8. Power Development Plan5-9. Conclusion
♦ Review of existing demand forecast
♦ Review of economic policy, forecast of economic growth rate and regional development plan
♦ Evaluation of the possibility of application of DSM
♦ Evaluation of the possibility of energy saving measures
♦ Update of demand forecast
♦ Information to be surveyed
5-1. Power Demand Forecast
3
(1) Review the existing demand forecast :- RUPTL- RUKN- other documents
(2) Review the outline of the software for demand forecast which is used in MEMR and PLN
Review the economic situation in the area which will be considered for demand forecast;
- Population in Jamali area (number and growth)- GDP growth rate and energy consumption by sector- Regional development plan
♦Review of existing demand forecast
♦ Review of economic policy, forecast of economic growth rate and regional development plan
♦ Evaluation of the possibility of application of DSM
♦Evaluation of the possibility of energy saving measures
(1) Review the action plan for DSM which was studied in the past(2) Evaluate the possibility of application of DSM considering the
situation in Japan(3) Present methods for DSM in Japan if necessary
(1) Evaluates the effects of possible measures for energy saving- Evaluation of possibility and calculation of effects of measures for
energy saving in factories, commercial demands and households.- Calculation of the reduction of energy consumption by applying
electrical appliances- Evaluation of other measures
(2) In the study, JICA team will have a support from the team of“The Study on Energy Conservation Promotion in Indonesia”
♦ Update of demand forecast
In consideration of the review of existing documents and the study, the demand from 2009 to 2028 will be forecasted in following ways;
Micro forecastForecast entire demand by accumulationof demands in each area.(1) Extract parameters which affect
regional demand forecast (2) Build a demand forecast model and
assume a transition of parameters in the future
(3) Forecast energy consumption by sector
(4) Calculate energy consumption by region
(5) Calculate generated energy by region(6) Calculate peak demand by region(7) Calculate entire peak demand
Macro forecastForecast a entire demand directly.
(1) Extract parameters which affect entire demand forecast
(2) Build a demand forecast model and assume a transition of parameters in the future
Consistency between the result of micro forecast and the one of macro forecast will be checked.
♦ Information to be surveyed
• The latest demand forecast and grounds for it. (Peak demand, Energy consumption, Number of customers, load factor, losses, electrification rate, etc.)
• Existing capacity and taking-over estimation of captive generators
• PLN Statistics、PLN Annual Report• Regional supply and demand • Outline of “DKL” and “Simple-E”
MEMR, DGEEUPLN, System
PlanningPLN, P3B
Information and documents to be surveyed
Organization to be visited
Other information such as economic index, social development plan and DSM will also be surveyed with other experts.
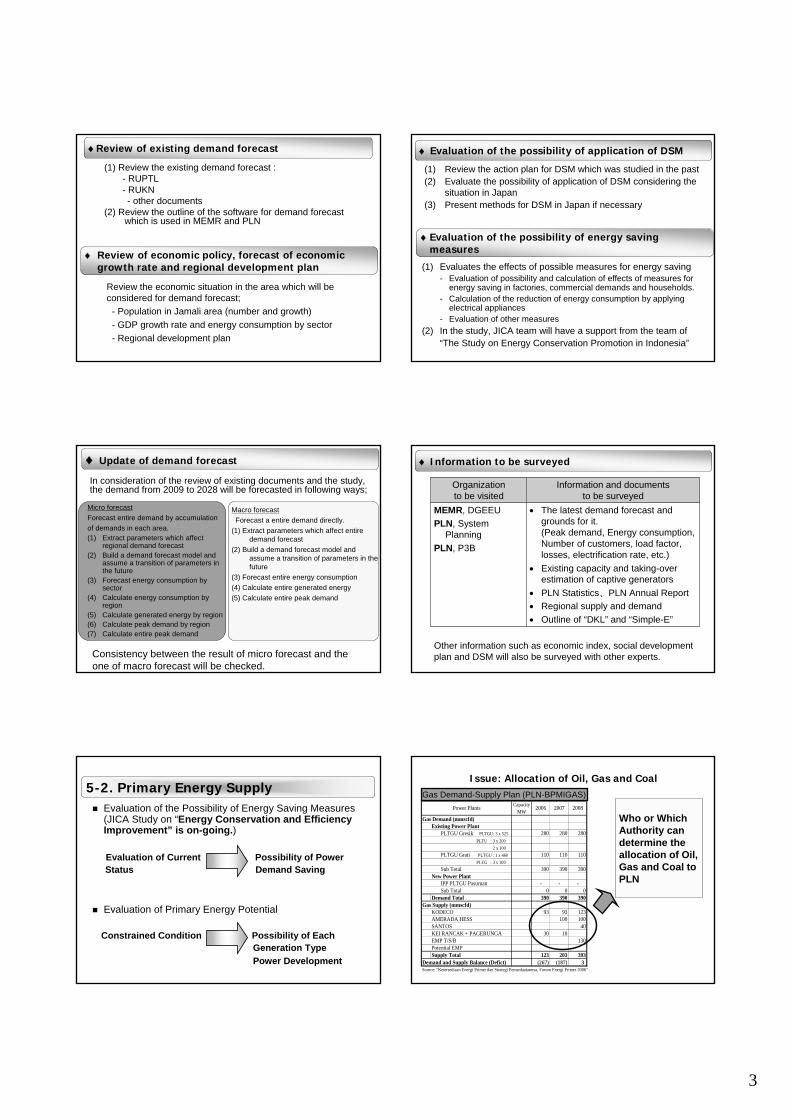
5-2. Primary Energy SupplyEvaluation of the Possibility of Energy Saving Measures(JICA Study on “Energy Conservation and Efficiency Improvement” is on-going.)
Evaluation of Current Possibility of PowerStatus Demand Saving
Evaluation of Primary Energy Potential
Constrained Condition Possibility of EachGeneration TypePower Development
Issue: Allocation of Oil, Gas and Coal
CapacityMW
Gas Demand (mmscfd)Existing Power Plant
PLTGU Gresik PLTGU: 3 x 525 280 280 280 PLTU : 3 x 200 2 x 100
PLTGU Grati PLTGU : 1 x 460 110 110 110 PLTG : 3 x 100
Demand and Supply Balance (Defict) (267) (187) 3Source: "Ketersediaan Energi Primer dan Strategi Pemanfaatannya, Forum Energi Primer 2006"
Power Plants 2006 2007 2008
Who or Which Authority can determine the allocation of Oil,Gas and Coal to PLN
Gas Demand-Supply Plan (PLN-BPMIGAS)
4
Business Structure Model of PGNTransmission
Upstream Supplier
PGN
(Power, Petro
chemical)
Large Offtaker
Gas
GTA
GSPA & GDP
PGN as the Transporter- PGN does not owned the gas- Gas Transportation Agreement (GTA)- Long term- Tariff in USD- Ship-or-Pay Volumes
Gas
Required Data/Information
Development Plans for Oil, Gas and Coal including the Related InfrastructuresAllocation Mechanism of Oil, Gas and Coal to Power Sector (PLN) Procurement Processes of Primary EnergyDevelopment Plans of Gas Pipeline NetworkPotential Reserve of Hydro and Geothermal
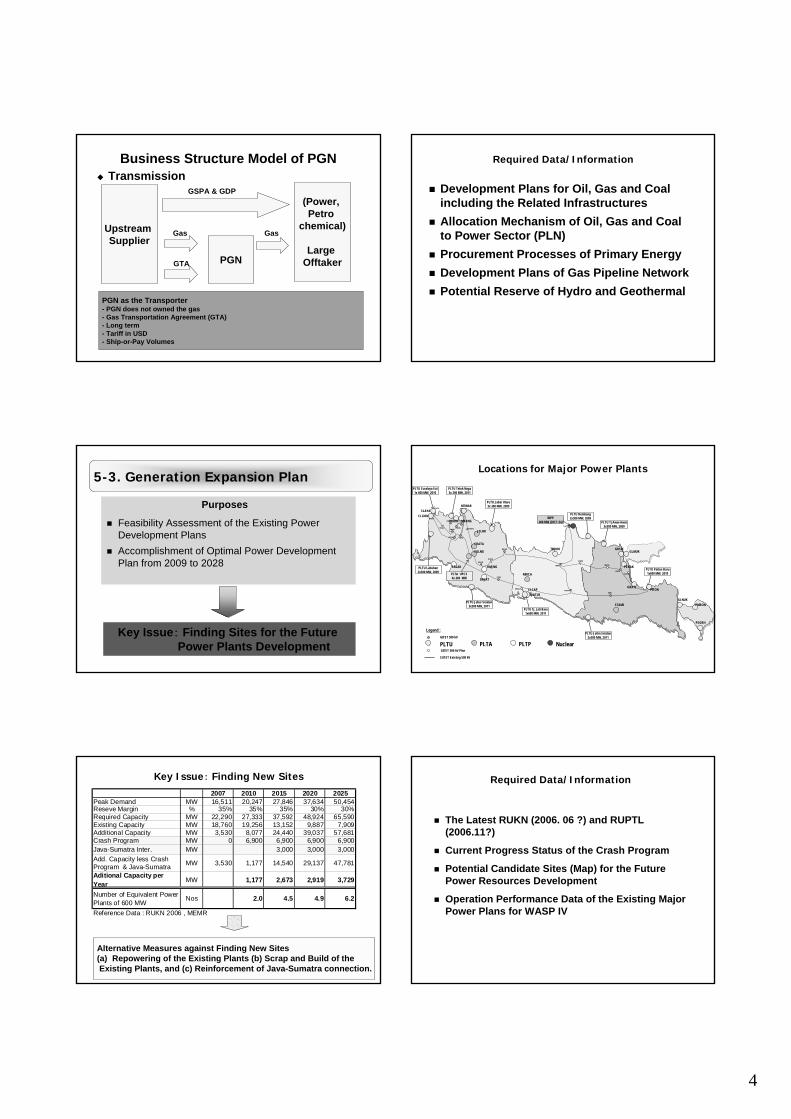
5-3. Generation Expansion Plan
Purposes
Feasibility Assessment of the Existing Power Development PlansAccomplishment of Optimal Power Development Plan from 2009 to 2028
Key Issue: Finding Sites for the Future Power Plants Development
GITET 500 kV
Legend :
SUTET Existing 500 kV
PLTU GITET 500 kV Plan
CBATU
BKASI
MTWAR
CIBNG
CWANG
KMBNG
GNDULBRAJA
CLGON
SLAYA
RCKEK
MDCAN
BDSLN
CLCAP
RWALOPEDAN
UNGAR
TASIK
KDIRI
PWDDI
GRSIK
TJATI
SBBRT
DEPOK
PITON
SBSLN
NGBNG
PLTU Rembang2x300 MW, 2009
PLTU Tj Awar-Awar3x300 MW, 2009
PLTU Paiton Baru1x600 MW, 2010
PLTU Jatim Selatan2x300 MW, 2011
PLTU Tj. Jati Baru1x600 MW, 2011
PLTU Jabar Selatan3x300 MW, 2011
PLTU Labuhan2x300 MW, 2009
PLTU Suralaya Ext1x 600 MW, 2010
PLTU Teluk Naga3x 300 MW, 2011
PLTU Jabar Utara3x 300 MW, 2009
PERAK
PITON
SLAYAMTWAR
PRIOK MKRNGCLGON
GLMUR
GLNUKPMRON
PSGRH
KMJNG
DRJAT
SALAK
CRATA
SGLNG
MRICA
STAMI
GRATI
TBROK
PLTA UPCS4x 260 MW
INPP400 MW (2017~24)
PLTA PLTP Nuclear
TJATI-B
JTLHR
CLCAP
Locations for Major Power Plants
Key Issue: Finding New Sites
Alternative Measures against Finding New Sites(a) Repowering of the Existing Plants (b) Scrap and Build of the Existing Plants, and (c) Reinforcement of Java-Sumatra connection.
Potential Candidate Sites (Map) for the Future Power Resources Development
Operation Performance Data of the Existing Major Power Plans for WASP IV
5
Step 1 : • Collection of Documents related to System study• Hearing of Power System Situation
Incorporation of Evaluation Result into Plan
-- Main Site Visits & Related documents –Site Visit : PLN, P3BPLN,Resional Control Center(4 Sites)Related Documents : •PLN Statistics 2006
•Power System Development plan•Power system Grid Code Criteria•Data Required for System Analysis•Power development Method of P3B
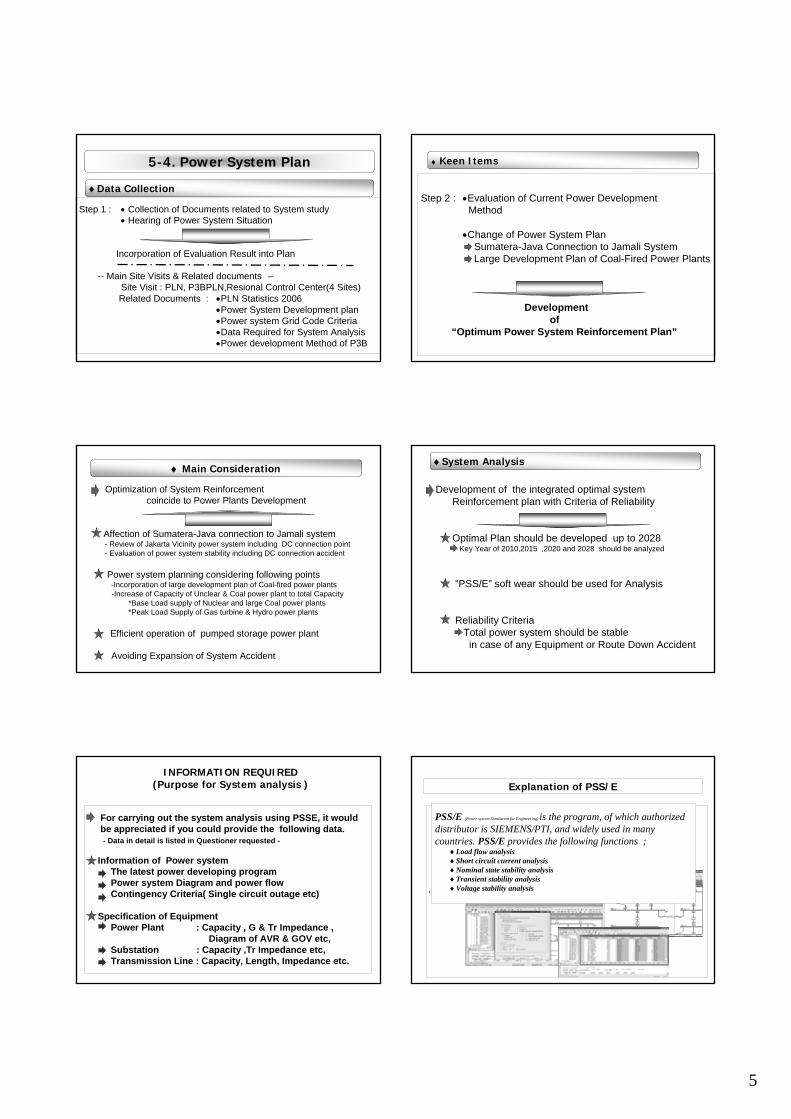
5-4. Power System Plan
♦Data CollectionStep 2 : •Evaluation of Current Power Development
Method
•Change of Power System PlanSumatera-Java Connection to Jamali SystemLarge Development Plan of Coal-Fired Power Plants
Development of
“Optimum Power System Reinforcement Plan”
♦ Keen Items
♦ Main Consideration
Optimization of System Reinforcementcoincide to Power Plants Development
Affection of Sumatera-Java connection to Jamali system- Review of Jakarta Vicinity power system including DC connection point - Evaluation of power system stability including DC connection accident
Power system planning considering following points-Incorporation of large development plan of Coal-fired power plants-Increase of Capacity of Unclear & Coal power plant to total Capacity
*Base Load supply of Nuclear and large Coal power plants*Peak Load Supply of Gas turbine & Hydro power plants
Efficient operation of pumped storage power plant
Avoiding Expansion of System Accident
Development of the integrated optimal systemReinforcement plan with Criteria of Reliability
Optimal Plan should be developed up to 2028 Key Year of 2010,2015 ,2020 and 2028 should be analyzed
”PSS/E” soft wear should be used for Analysis
Reliability Criteria Total power system should be stablein case of any Equipment or Route Down Accident
♦System Analysis
For carrying out the system analysis using PSSE, it would be appreciated if you could provide the following data.- Data in detail is listed in Questioner requested -
Information of Power systemThe latest power developing programPower system Diagram and power flow Contingency Criteria( Single circuit outage etc)
Specification of EquipmentPower Plant : Capacity , G & Tr Impedance ,
Diagram of AVR & GOV etc, Substation : Capacity ,Tr Impedance etc,Transmission Line : Capacity, Length, Impedance etc.
INFORMATION REQUIRED(Purpose for System analysis )
(
PSS/E (Power system Simulation for Engineering) is the program, of which authorized distributor is SIEMENS/PTI, and widely used in many countries. PSS/E provides the following functions ;
♦Load flow analysis♦Short circuit current analysis♦Nominal state stability analysis♦Transient stability analysis ♦Voltage stability analysis
Explanation of PSS/E
6
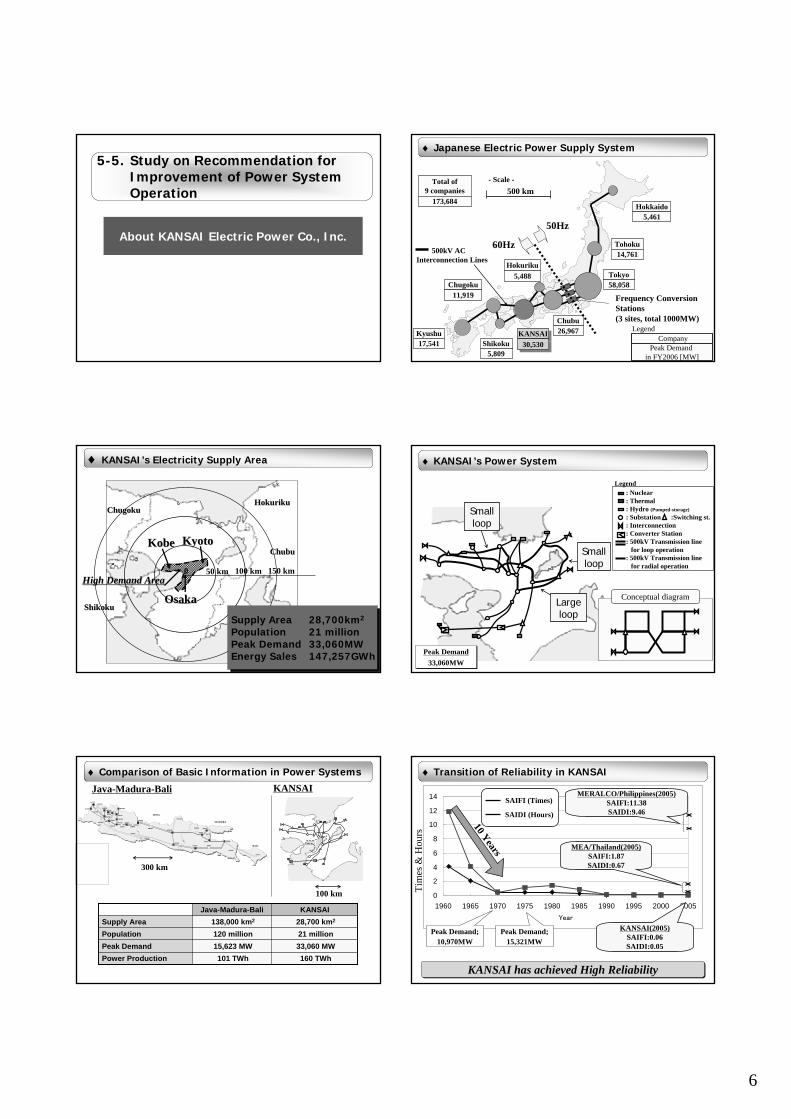
5-5. Study on Recommendation for Improvement of Power System Operation
About KANSAI Electric Power Co., Inc.
KANSAI30,530Shikoku
5,809
Hokkaido5,461
Tohoku14,761
Tokyo58,058
Chubu26,967
Hokuriku5,488
Kyushu17,541
Chugoku11,919
60Hz
50Hz
Frequency Conversion Stations(3 sites, total 1000MW)
CompanyPeak Demand
in FY2006 [MW]
Legend
Total of9 companies
173,684500 km
- Scale -
500kV AC Interconnection Lines
♦ Japanese Electric Power Supply System
High Demand AreaHigh Demand Area
Supply Area 28,700km2
Population 21 millionPeak Demand 33,060MWEnergy Sales 147,257GWh
ChubuChubu
ChugokuChugoku
ShikokuShikoku
HokurikuHokuriku
KobeKobe
OsakaOsaka
KyotoKyoto
50 km 100 km0 150 km
♦ KANSAI’s Electricity Supply Area
Smallloop
Smallloop
Largeloop
Conceptual diagram
: Nuclear: Thermal: Hydro (Pumped-storage): Substation :Switching st. : Interconnection: Converter Station: 500kV Transmission line
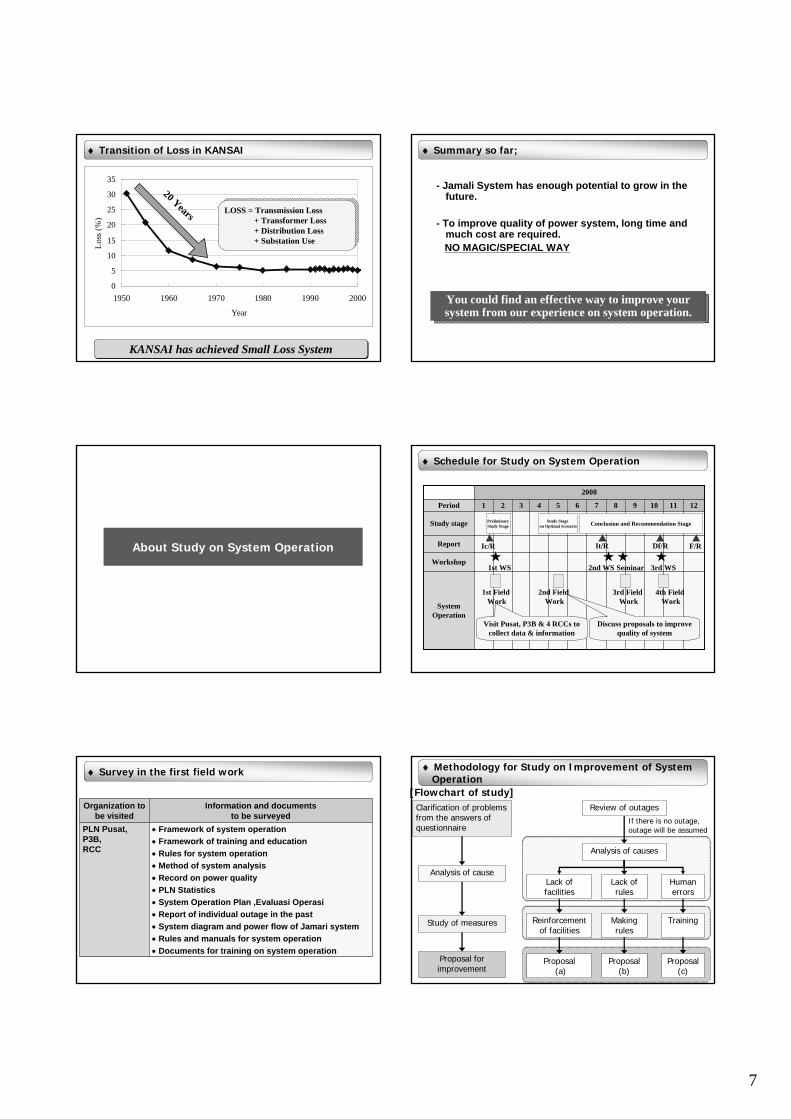
LOSS = Transmission Loss + Transformer Loss+ Distribution Loss + Substation Use
KANSAI has achieved Small Loss System
20 Years
♦ Transition of Loss in KANSAI
- Jamali System has enough potential to grow in the future.
- To improve quality of power system, long time and much cost are required. NO MAGIC/SPECIAL WAY
You could find an effective way to improve your system from our experience on system operation.
♦ Summary so far;
About Study on System Operation
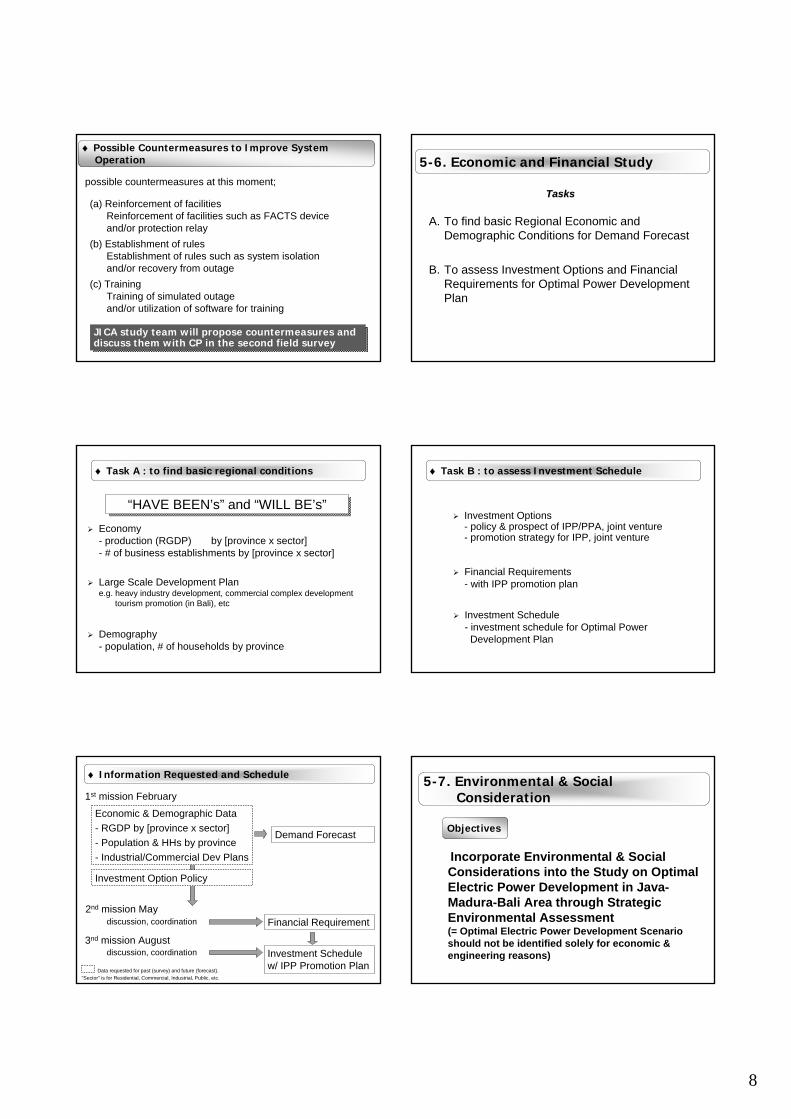
System Operation
Workshop
Report
Study stage
121110987654321Period
2008
PreliminaryStudy Stage
Study Stage on Optimal Scenario Conclusion and Recommendation Stage
Ic/R It/R Df/R F/R
1st WS 2nd WS 3rd WS
1st Field Work
2nd Field Work
Seminar
3rd Field Work
4th Field Work
Visit Pusat, P3B & 4 RCCs to collect data & information
Discuss proposals to improve quality of system
♦ Schedule for Study on System Operation
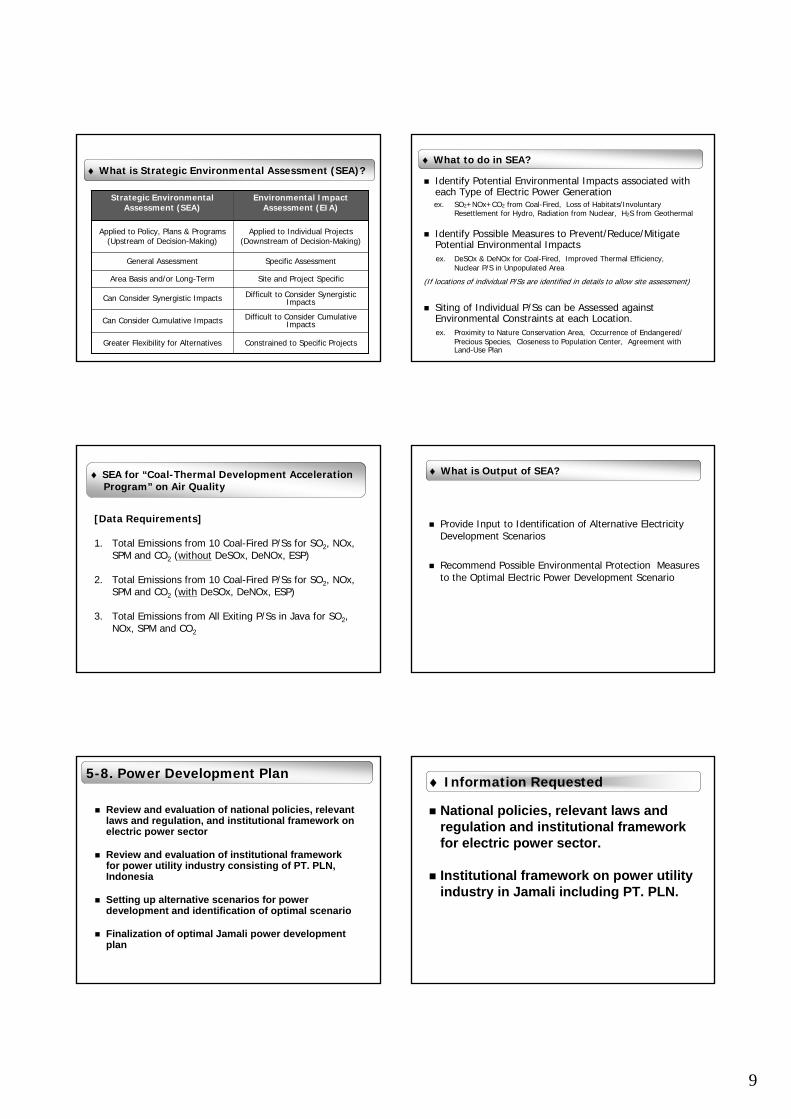
• Framework of system operation• Framework of training and education• Rules for system operation• Method of system analysis• Record on power quality• PLN Statistics• System Operation Plan ,Evaluasi Operasi• Report of individual outage in the past • System diagram and power flow of Jamari system• Rules and manuals for system operation• Documents for training on system operation
PLN Pusat, P3B,RCC
Information and documents to be surveyed
Organization to be visited
♦ Survey in the first field work
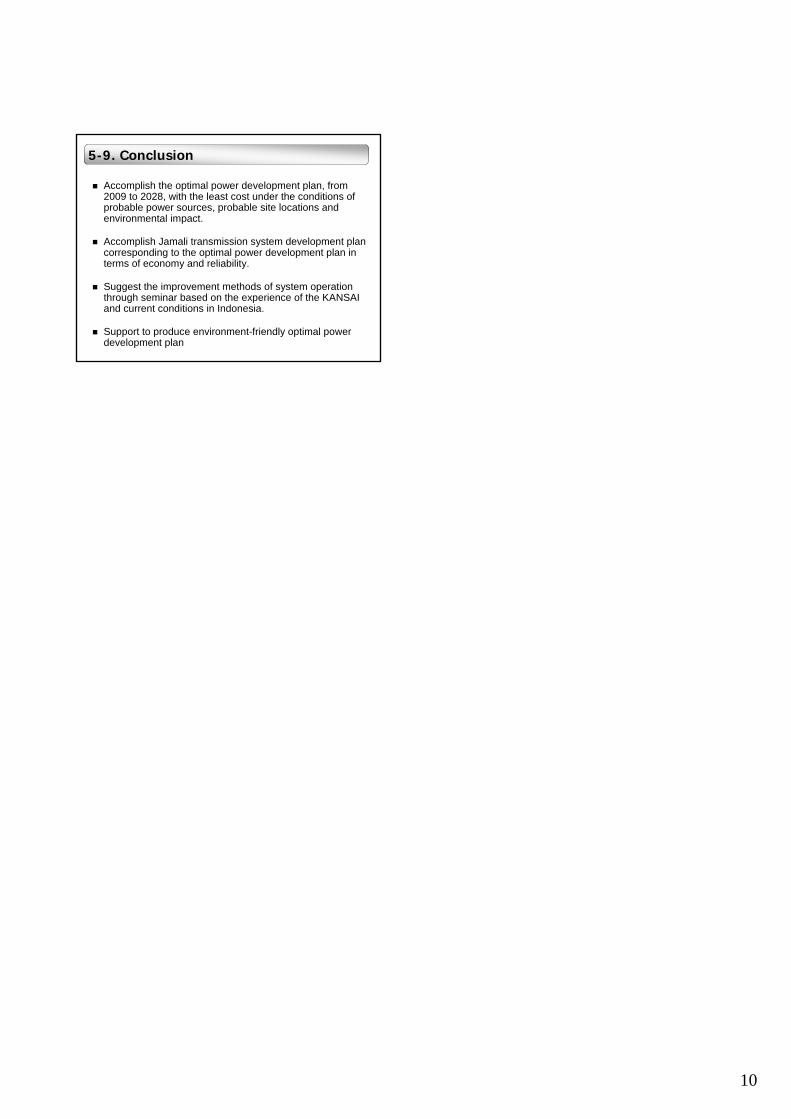
Clarification of problems from the answers of questionnaire
Analysis of cause
Study of measures
Proposal for improvement
[Flowchart of study]Review of outages
Analysis of causes
Lack of facilities
Lack of rules
Humanerrors
Reinforcement of facilities
Makingrules
Training
Proposal(a)
Proposal (b)
Proposal (c)
If there is no outage, outage will be assumed
♦ Methodology for Study on Improvement of System Operation
8
(a) Reinforcement of facilities Reinforcement of facilities such as FACTS device and/or protection relay
(b) Establishment of rulesEstablishment of rules such as system isolation and/or recovery from outage
(c) Training Training of simulated outage and/or utilization of software for training
possible countermeasures at this moment;
JICA study team will propose countermeasures and discuss them with CP in the second field survey
♦ Possible Countermeasures to Improve System Operation 5-6. Economic and Financial Study
A. To find basic Regional Economic and Demographic Conditions for Demand Forecast
B. To assess Investment Options and Financial Requirements for Optimal Power Development Plan
TasksTasks
♦ Task A : to find basic regional conditions
Economy- production (RGDP) by [province x sector] - # of business establishments by [province x sector]
Large Scale Development Plane.g. heavy industry development, commercial complex development
tourism promotion (in Bali), etc
Demography- population, # of households by province
“HAVE BEEN’s” and “WILL BE’s”
♦ Task B : to assess Investment Schedule
Investment Options- policy & prospect of IPP/PPA, joint venture- promotion strategy for IPP, joint venture
Financial Requirements- with IPP promotion plan
Investment Schedule- investment schedule for Optimal PowerDevelopment Plan
♦ Information Requested and Schedule
1st mission February
2nd mission May
Investment Option Policy
Demand Forecast
Financial Requirement
3nd mission AugustInvestment Schedule w/ IPP Promotion Plan Data requested for past (survey) and future (forecast).
“Sector” is for Residential, Commercial, Industrial, Public, etc.
discussion, coordination
discussion, coordination
Economic & Demographic Data- RGDP by [province x sector]- Population & HHs by province- Industrial/Commercial Dev Plans
5-7. Environmental & Social Consideration
Incorporate Environmental & Social Considerations into the Study on Optimal Electric Power Development in Java-Madura-Bali Area through Strategic Environmental Assessment(= Optimal Electric Power Development Scenario should not be identified solely for economic & engineering reasons)
Objectives
9
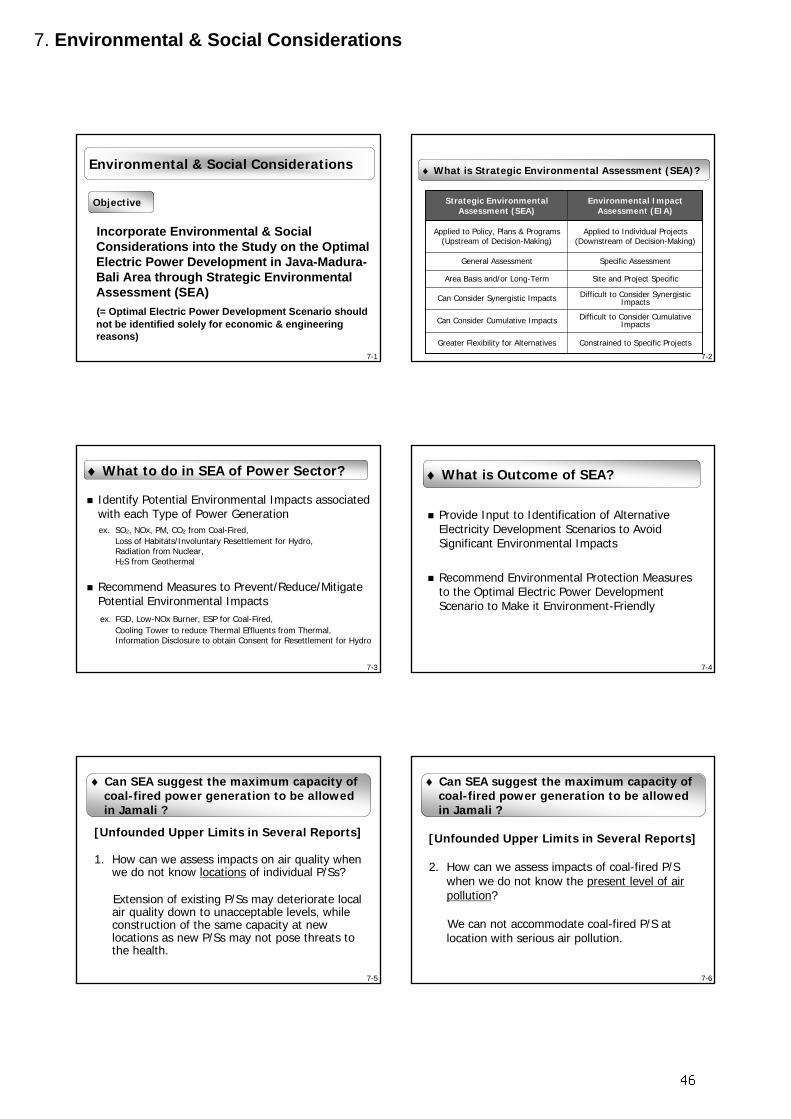
♦ What is Strategic Environmental Assessment (SEA)?
Constrained to Specific ProjectsGreater Flexibility for Alternatives
Difficult to Consider Cumulative ImpactsCan Consider Cumulative Impacts
Difficult to Consider Synergistic ImpactsCan Consider Synergistic Impacts
Site and Project SpecificArea Basis and/or Long-Term
Specific AssessmentGeneral Assessment
Applied to Individual Projects(Downstream of Decision-Making)
Applied to Policy, Plans & Programs(Upstream of Decision-Making)
Environmental Impact Assessment (EIA)
Strategic Environmental Assessment (SEA)
♦ What to do in SEA?
Identify Potential Environmental Impacts associated with each Type of Electric Power Generationex. SO2+NOx+CO2 from Coal-Fired, Loss of Habitats/Involuntary
Resettlement for Hydro, Radiation from Nuclear, H2S from Geothermal
Identify Possible Measures to Prevent/Reduce/Mitigate Potential Environmental Impactsex. DeSOx & DeNOx for Coal-Fired, Improved Thermal Efficiency,
Nuclear P/S in Unpopulated Area
(If locations of individual P/Ss are identified in details to allow site assessment)
Siting of Individual P/Ss can be Assessed against Environmental Constraints at each Location.ex. Proximity to Nature Conservation Area, Occurrence of Endangered/
Precious Species, Closeness to Population Center, Agreement with Land-Use Plan
♦ SEA for “Coal-Thermal Development Acceleration Program” on Air Quality
[Data Requirements]
1. Total Emissions from 10 Coal-Fired P/Ss for SO2, NOx, SPM and CO2 (without DeSOx, DeNOx, ESP)
2. Total Emissions from 10 Coal-Fired P/Ss for SO2, NOx, SPM and CO2 (with DeSOx, DeNOx, ESP)
3. Total Emissions from All Exiting P/Ss in Java for SO2, NOx, SPM and CO2
♦ What is Output of SEA?
Provide Input to Identification of Alternative Electricity Development Scenarios
Recommend Possible Environmental Protection Measures to the Optimal Electric Power Development Scenario
Review and evaluation of national policies, relevant laws and regulation, and institutional framework on electric power sector
Review and evaluation of institutional framework for power utility industry consisting of PT. PLN, Indonesia
Setting up alternative scenarios for power development and identification of optimal scenario
Finalization of optimal Jamali power development plan
5-8. Power Development Plan
National policies, relevant laws and regulation and institutional framework for electric power sector.
Institutional framework on power utility industry in Jamali including PT. PLN.
♦ Information Requested
10
5-9. Conclusion
Accomplish the optimal power development plan, from 2009 to 2028, with the least cost under the conditions of probable power sources, probable site locations and environmental impact.
Accomplish Jamali transmission system development plan corresponding to the optimal power development plan in terms of economy and reliability.
Suggest the improvement methods of system operation through seminar based on the experience of the KANSAI and current conditions in Indonesia.
Support to produce environment-friendly optimal power development plan
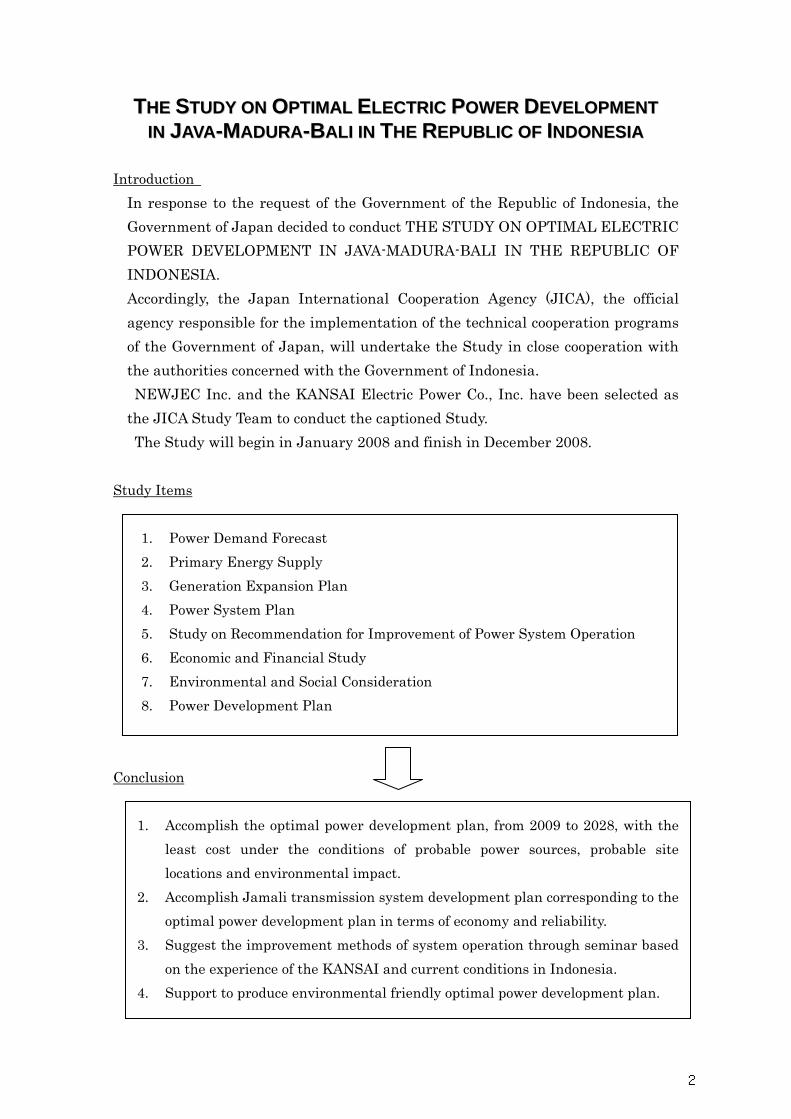
In response to the request of the Government of the Republic of Indonesia, the Government of Japan decided to conduct THE STUDY ON OPTIMAL ELECTRIC POWER DEVELOPMENT IN JAVA-MADURA-BALI IN THE REPUBLIC OF INDONESIA. Accordingly, the Japan International Cooperation Agency (JICA), the official agency responsible for the implementation of the technical cooperation programs of the Government of Japan, will undertake the Study in close cooperation with the authorities concerned with the Government of Indonesia. NEWJEC Inc. and the KANSAI Electric Power Co., Inc. have been selected as the JICA Study Team to conduct the captioned Study. The Study will begin in January 2008 and finish in December 2008.
Study Items
1. Power Demand Forecast 2. Primary Energy Supply 3. Generation Expansion Plan 4. Power System Plan 5. Study on Recommendation for Improvement of Power System Operation 6. Economic and Financial Study 7. Environmental and Social Consideration 8. Power Development Plan
Conclusion
1. Accomplish the optimal power development plan, from 2009 to 2028, with the least cost under the conditions of probable power sources, probable site locations and environmental impact.
2. Accomplish Jamali transmission system development plan corresponding to the optimal power development plan in terms of economy and reliability.
3. Suggest the improvement methods of system operation through seminar based on the experience of the KANSAI and current conditions in Indonesia.
4. Support to produce environmental friendly optimal power development plan.
2
3
The Study on Optimal Electric Power Development in Java-Madura-Bali in the Republic of Indonesia
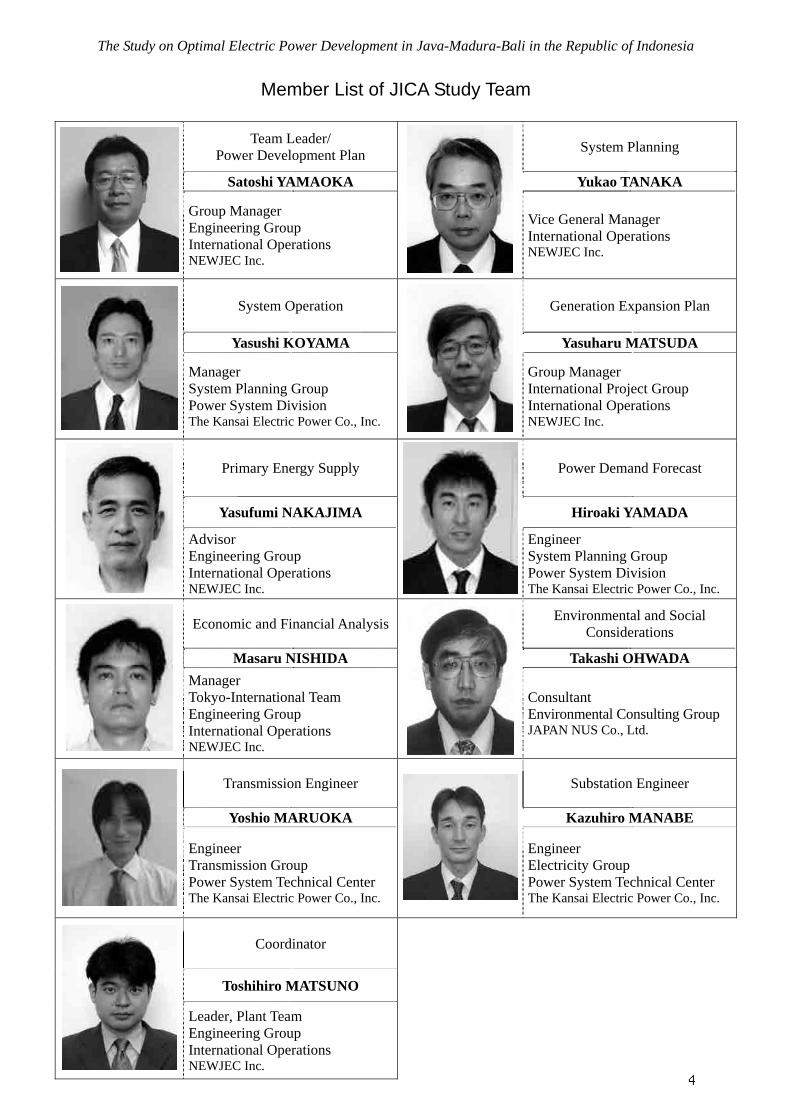
Member List of JICA Study Team
Team Leader/ Power Development Plan System Planning
Satoshi YAMAOKA Yukao TANAKA
Group Manager Engineering Group International Operations NEWJEC Inc.
Vice General Manager International Operations NEWJEC Inc.
System Operation Generation Expansion Plan
Yasushi KOYAMA Yasuharu MATSUDA
Manager System Planning Group Power System Division The Kansai Electric Power Co., Inc.
Group Manager International Project Group International Operations NEWJEC Inc.
Primary Energy Supply Power Demand Forecast
Yasufumi NAKAJIMA Hiroaki YAMADA
Advisor Engineering Group International Operations NEWJEC Inc.
Engineer System Planning Group Power System Division The Kansai Electric Power Co., Inc.
Economic and Financial Analysis Environmental and Social Considerations
Masaru NISHIDA Takashi OHWADA
Manager Tokyo-International Team Engineering Group International Operations NEWJEC Inc.
Consultant Environmental Consulting Group JAPAN NUS Co., Ltd.
Transmission Engineer Substation Engineer
Yoshio MARUOKA Kazuhiro MANABE
Engineer Transmission Group Power System Technical Center The Kansai Electric Power Co., Inc.
Engineer Electricity Group Power System Technical Center The Kansai Electric Power Co., Inc.
Coordinator
Toshihiro MATSUNO
Leader, Plant Team Engineering Group International Operations NEWJEC Inc.
4
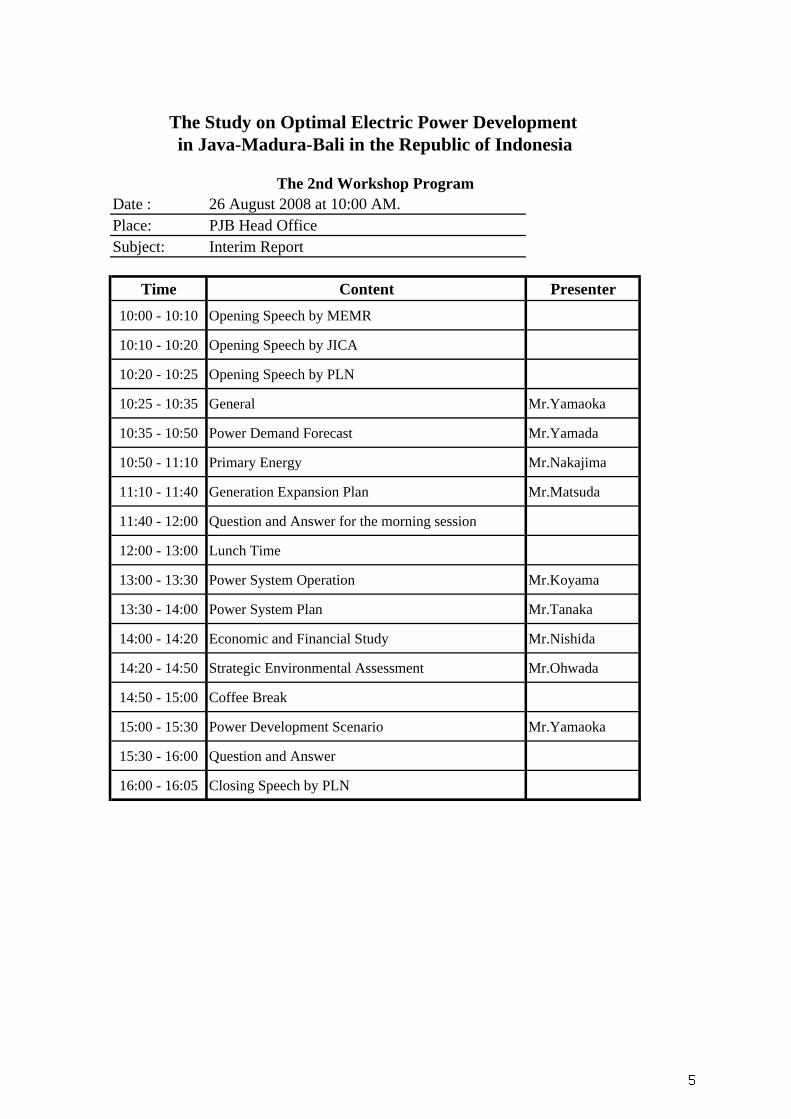
Date : 26 August 2008 at 10:00 AM.Place: PJB Head OfficeSubject: Interim Report
Time Content Presenter10:00 - 10:10 Opening Speech by MEMR
10:10 - 10:20 Opening Speech by JICA
10:20 - 10:25 Opening Speech by PLN
10:25 - 10:35 General Mr.Yamaoka
10:35 - 10:50 Power Demand Forecast Mr.Yamada
10:50 - 11:10 Primary Energy Mr.Nakajima
11:10 - 11:40 Generation Expansion Plan Mr.Matsuda
11:40 - 12:00 Question and Answer for the morning session
12:00 - 13:00 Lunch Time
13:00 - 13:30 Power System Operation Mr.Koyama
13:30 - 14:00 Power System Plan Mr.Tanaka
14:00 - 14:20 Economic and Financial Study Mr.Nishida
15:00 - 15:30 Power Development Scenario Mr.Yamaoka
15:30 - 16:00 Question and Answer
16:00 - 16:05 Closing Speech by PLN
The Study on Optimal Electric Power Development in Java-Madura-Bali in the Republic of Indonesia
The 2nd Workshop Program
5
1. POWER DEMAND FORECAST
SPEAKER: MR. YAMADA HIROAKI,
KANSAI ELECTRIC POWER CO., Inc.
6
1. Demand Forecast
Demand Forecast
1-1
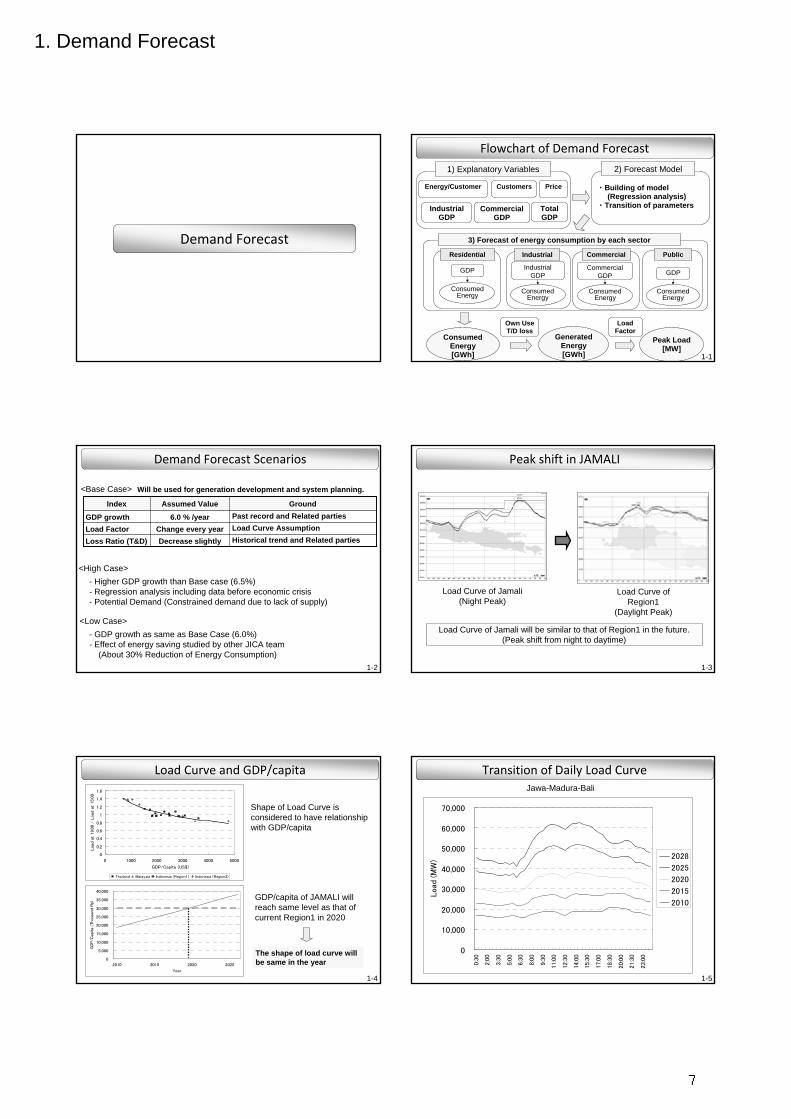
Flowchart of Demand Forecast
Residential
Consumed Energy[GWh]
Generated Energy[GWh]
Peak Load[MW]
Own UseT/D loss
LoadFactor
Energy/Customer
CommercialGDP
IndustrialGDP
TotalGDP
Customers Price ・Building of model(Regression analysis)
・Transition of parameters
1) Explanatory Variables 2) Forecast Model
3) Forecast of energy consumption by each sector
GDP
Consumed Energy
Industrial
Industrial GDP
Consumed Energy
Commercial
Commercial GDP
Consumed Energy
Public
GDP
Consumed Energy
1-2
Demand Forecast Scenarios
Load Curve AssumptionChange every yearLoad FactorPast record and Related parties6.0 % /yearGDP growth
Historical trend and Related partiesDecrease slightlyLoss Ratio (T&D)
GroundAssumed ValueIndex
<Base Case>
<Low Case>
Will be used for generation development and system planning.
<High Case>- Higher GDP growth than Base case (6.5%)- Regression analysis including data before economic crisis- Potential Demand (Constrained demand due to lack of supply)
- GDP growth as same as Base Case (6.0%)- Effect of energy saving studied by other JICA team
(About 30% Reduction of Energy Consumption)1-3
Peak shift in JAMALI
Load Curve of Jamali(Night Peak)
Load Curve of Region1
(Daylight Peak)
Load Curve of Jamali will be similar to that of Region1 in the future.(Peak shift from night to daytime)
1-4
Load Curve and GDP/capita
0
5,000
10,000
15,000
20,000
25,000
30,000
35,000
40,000
2010 2015 2020 2025
Year
GDP/C
apita (Thou
sand
Rp)
GDP/capita of JAMALI will reach same level as that of current Region1 in 2020
0
0.2
0.4
0.6
0.8
1
1.2
1.4
1.6
0 1000 2000 3000 4000 5000
GDP/Capita (US$)
Load a
t 19:0
0 /
Load a
t 15:0
0
Thailand Malaysia Indonesia (Region1) Indonesia (Region2)
Shape of Load Curve is considered to have relationship with GDP/capita
The shape of load curve will be same in the year
1-5
Transition of Daily Load CurveJawa-Madura-Bali
0
10,000
20,000
30,000
40,000
50,000
60,000
70,000
0:30
2:00
3:30
5:00
6:30
8:00
9:30
11:0
0
12:3
0
14:0
0
15:3
0
17:0
0
18:3
0
20:0
0
21:3
0
23:0
0
Load
(M
W) 2028
2025
2020
2015
2010
7
1. Demand Forecast
1-6
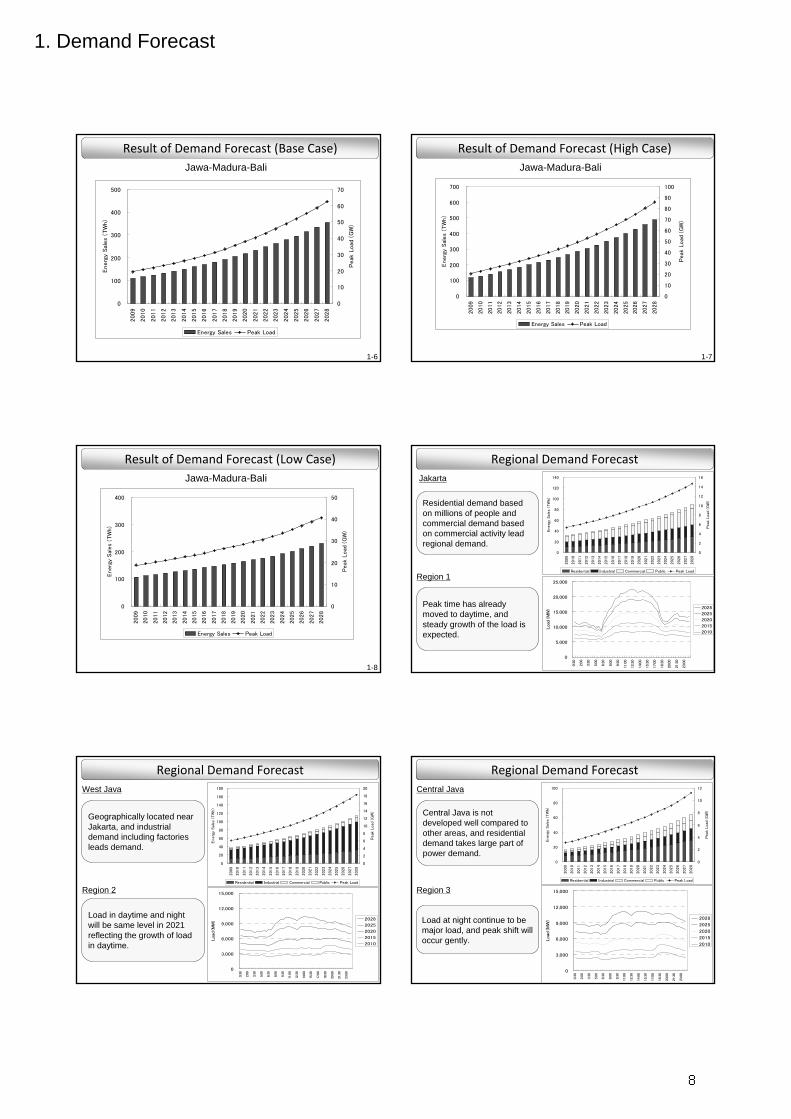
Result of Demand Forecast (Base Case)Jawa-Madura-Bali
0
100
200
300
400
500
2009
2010
2011
2012
2013
2014
2015
2016
2017
2018
2019
2020
2021
2022
2023
2024
2025
2026
2027
2028
Energ
y Sal
es
(TW
h)
0
10
20
30
40
50
60
70
Peak
Load
(G
W)
Energy Sales Peak Load
1-7
Result of Demand Forecast (High Case)Jawa-Madura-Bali
0
100
200
300
400
500
600
700
2009
2010
2011
2012
2013
2014
2015
2016
2017
2018
2019
2020
2021
2022
2023
2024
2025
2026
2027
2028
Energ
y Sal
es
(TW
h)
0
10
20
30
40
50
60
70
80
90
100
Peak
Load
(G
W)
Energy Sales Peak Load
1-8
Result of Demand Forecast (Low Case)Jawa-Madura-Bali
0
100
200
300
400
2009
2010
2011
2012
2013
2014
2015
2016
2017
2018
2019
2020
2021
2022
2023
2024
2025
2026
2027
2028
Energ
y S
ales
(TW
h)
0
10
20
30
40
50
Peak
Load
(G
W)
Energy Sales Peak Load
1-9
Regional Demand Forecast
Region 1
0
5,000
10,000
15,000
20,000
25,000
0:30
2:00
3:30
5:00
6:30
8:00
9:30
11:00
12:30
14:00
15:30
17:00
18:30
20:00
21:30
23:00
Load
(M
W) 2028
2025
2020
2015
2010
Jakarta
0
20
40
60
80
100
120
140
2009
2010
2011
2012
2013
2014
2015
2016
2017
2018
2019
2020
2021
2022
2023
2024
2025
2026
2027
2028
Energ
y Sal
es
(TW
h)
0
2
4
6
8
10
12
14
16
Peak
Load
(G
W)
Residential Industrial Commercial Public Peak Load
Residential demand based on millions of people and commercial demand based on commercial activity lead regional demand.
Peak time has already moved to daytime, and steady growth of the load is expected.
1-10
Regional Demand Forecast
Region 2
0
3,000
6,000
9,000
12,000
15,000
0:30
2:00
3:30
5:00
6:30
8:00
9:30
11:00
12:30
14:00
15:30
17:00
18:30
20:00
21:30
23:00
Load
(M
W) 2028
2025
2020
2015
2010
West Java
0
20
40
60
80
100
120
140
160
180
2009
2010
2011
2012
2013
2014
2015
2016
2017
2018
2019
2020
2021
2022
2023
2024
2025
2026
2027
2028
Energ
y S
ales
(TW
h)
0
2
4
6
8
10
12
14
16
18
20
Peak
Load
(G
W)
Residential Industrial Commercial Public Peak Load
Geographically located near Jakarta, and industrial demand including factories leads demand.
Load in daytime and night will be same level in 2021 reflecting the growth of load in daytime.
1-11
Regional Demand ForecastCentral Java
0
3,000
6,000
9,000
12,000
15,000
0:30
2:00
3:30
5:00
6:30
8:00
9:30
11:00
12:30
14:00
15:30
17:00
18:30
20:00
21:30
23:00
Load
(M
W) 2028
2025
2020
2015
2010
0
20
40
60
80
100
2009
2010
2011
2012
2013
2014
2015
2016
2017
2018
2019
2020
2021
2022
2023
2024
2025
2026
2027
2028
Energ
y Sal
es
(TW
h)
0
2
4
6
8
10
12
Peak
Load
(G
W)
Residential Industrial Commercial Public Peak Load
Central Java is not developed well compared to other areas, and residential demand takes large part of power demand.
Load at night continue to be major load, and peak shift will occur gently.
Region 3
8
1. Demand Forecast
1-12
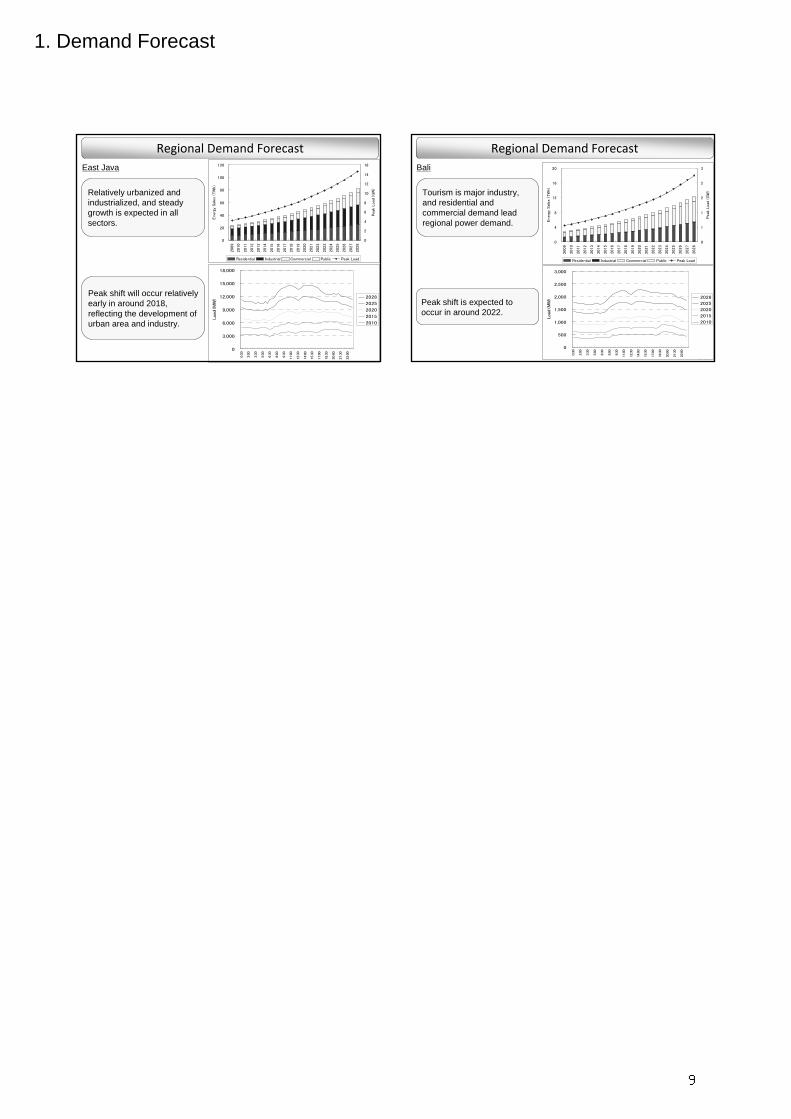
Regional Demand ForecastEast Java
0
20
40
60
80
100
120
2009
2010
2011
2012
2013
2014
2015
2016
2017
2018
2019
2020
2021
2022
2023
2024
2025
2026
2027
2028
Energ
y Sal
es
(TW
h)
0
2
4
6
8
10
12
14
16
Peak
Load
(G
W)
Residential Industrial Commercial Public Peak Load
0
3,000
6,000
9,000
12,000
15,000
18,000
0:30
2:00
3:30
5:00
6:30
8:00
9:30
11:00
12:30
14:00
15:30
17:00
18:30
20:00
21:30
23:00
Load
(M
W) 2028
2025
2020
2015
2010
Relatively urbanized and industrialized, and steady growth is expected in all sectors.
Peak shift will occur relatively early in around 2018, reflecting the development of urban area and industry.
1-13
Regional Demand ForecastBali
0
500
1,000
1,500
2,000
2,500
3,000
0:30
2:00
3:30
5:00
6:30
8:00
9:30
11:00
12:30
14:00
15:30
17:00
18:30
20:00
21:30
23:00
Load
(M
W) 2028
2025
2020
2015
2010
0
4
8
12
16
20
2009
2010
2011
2012
2013
2014
2015
2016
2017
2018
2019
2020
2021
2022
2023
2024
2025
2026
2027
2028
Energ
y Sal
es
(TW
h)
0
1
1
2
2
3
Peak
Load
(G
W)
Residential Industrial Commercial Public Peak Load
Tourism is major industry,and residential and commercial demand lead regional power demand.
Peak shift is expected to occur in around 2022.
9
2. Primary Energy
SPEAKER: MR. NAKAJIMA YASUFUMI,
NEWJEC Inc.
10
2. Primary Energy
2-1
Primary Energy
2-2
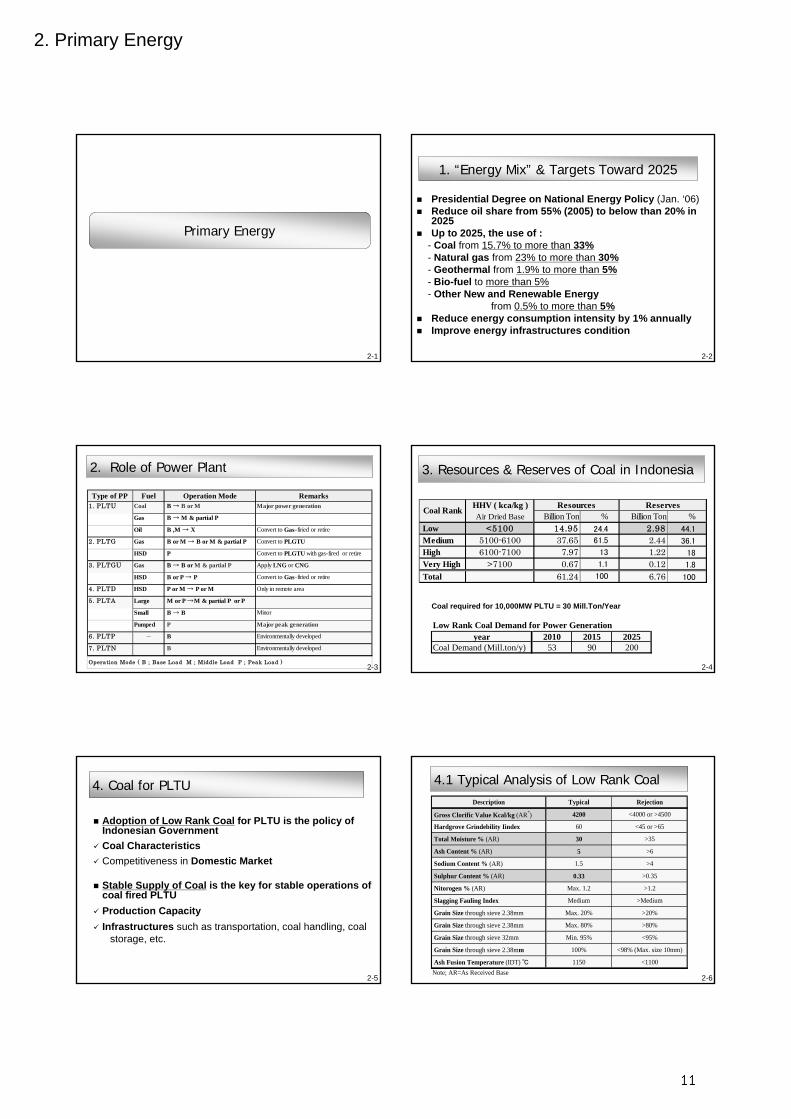
1. “Energy Mix” & Targets Toward 2025
Presidential Degree on National Energy Policy (Jan. ‘06)Reduce oil share from 55% (2005) to below than 20% in 2025Up to 2025, the use of :
- Coal from 15.7% to more than 33%- Natural gas from 23% to more than 30%- Geothermal from 1.9% to more than 5%- Bio-fuel to more than 5%- Other New and Renewable Energy
from 0.5% to more than 5%Reduce energy consumption intensity by 1% annuallyImprove energy infrastructures condition
2-3
2. Role of Power Plant
Type of PP Fuel Operation Mode Remarks1. PLTU Coal B → B or M Major power generation
Gas B → M & partial P
Oil B ,M → X Convert to Gas-firied or retire
2. PLTG Gas B or M → B or M & partial P Convert to PLGTU
HSD P Convert to PLGTU with gas-fired or retire
3. PLTGU Gas B → B or M & partial P Apply LNG or CNG
HHV ( kca/kg )Air Dried Base Billion Ton % Billion Ton %
Low <5100 14.95 24.4 2.98 44.1
Medium 5100-6100 37.65 61.5 2.44 36.1
High 6100-7100 7.97 13 1.22 18
Very High >7100 0.67 1.1 0.12 1.8
Total 61.24 100 6.76 100
Coal Rank Resources Reserves
Coal required for 10,000MW PLTU = 30 Mill.Ton/Year
Low Rank Coal Demand for Power Generationyear 2010 2015 2025
Coal Demand (Mill.ton/y) 53 90 200
2-5
4. Coal for PLTU
Adoption of Low Rank Coal for PLTU is the policy of Indonesian GovernmentCoal CharacteristicsCompetitiveness in Domestic Market
Stable Supply of Coal is the key for stable operations of coal fired PLTUProduction CapacityInfrastructures such as transportation, coal handling, coal
storage, etc.
2-6
4.1 Typical Analysis of Low Rank CoalDescription Typical Rejection
Gross Clorific Value Kcal/kg (AR*) 4200 <4000 or >4500
Hardgrove Grindebility Iindex 60 <45 or >65
Total Moisture % (AR) 30 >35
Ash Content % (AR) 5 >6
Sodium Content % (AR) 1.5 >4
Sulphur Content % (AR) 0.33 >0.35
Nitorogen % (AR) Max. 1.2 >1.2
Slagging Fauling Index Medium >Medium
Grain Size through sieve 2.38mm Max. 20% >20%
Grain Size through sieve 2.38mm Max. 80% >80%
Grain Size through sieve 32mm Min. 95% <95%
Grain Size through sieve 2.38mm 100% <98% (Max. size 10mm)
Ash Fusion Temperature (IDT) ℃ 1150 <1100Note; AR=As Received Base
11
2. Primary Energy
2-7
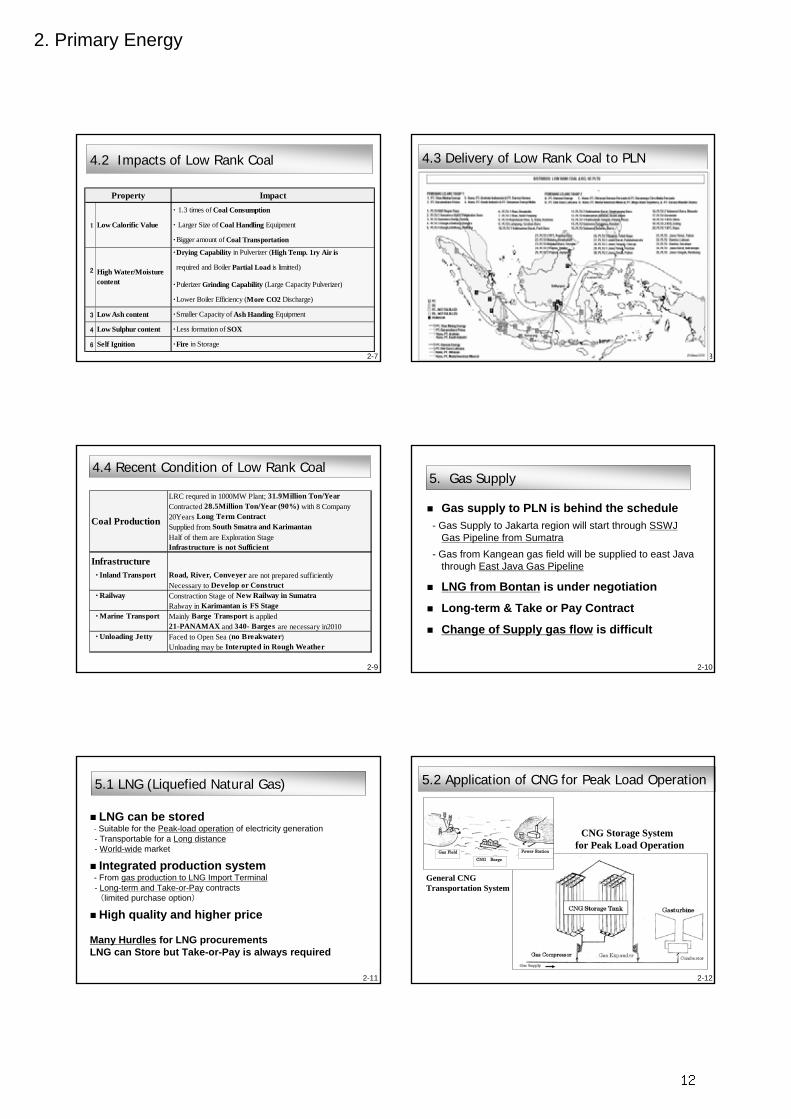
4.2 Impacts of Low Rank Coal
Impact・ 1.3 times of Coal Consumption
1 ・ Larger Size of Coal Handling Equipment
・Bigger amount of Coal Transportation
・Drying Capability in Pulverizer (High Temp. 1ry Air is
3 Low Ash content ・Smaller Capacity of Ash Handing Equipment
4 Low Sulphur content ・Less formation of SOX
6 Self Ignition ・Fire in Storage
Low Calorific Value
High Water/Moisturecontent
Property
2-8
4.3 Delivery of Low Rank Coal to PLN
2-9
4.4 Recent Condition of Low Rank Coal
LRC requred in 1000MW Plant; 31.9Million Ton/YearContracted 28.5Million Ton/Year (90%) with 8 Company20Years Long Term ContractSupplied from South Smatra and KarimantanHalf of them are Exploration StageInfrastructure is not Sufficient
Infrastructure ・Inland Transport Road, River, Conveyer are not prepared sufficiently
Necessary to Develop or Construct ・Railway Constraction Stage of New Railway in Sumatra
Ralway in Karimantan is FS Stage ・Marine Transport Mainly Barge Transport is applied
21-PANAMAX and 340- Barges are necessary in2010 ・Unloading Jetty Faced to Open Sea (no Breakwater)
Unloading may be Interupted in Rough Weather
Coal Production
2-10
5. Gas Supply
Gas supply to PLN is behind the schedule- Gas Supply to Jakarta region will start through SSWJ
Gas Pipeline from Sumatra- Gas from Kangean gas field will be supplied to east Java
through East Java Gas Pipeline
LNG from Bontan is under negotiation
Long-term & Take or Pay Contract
Change of Supply gas flow is difficult
2-11
5.1 LNG (Liquefied Natural Gas)
LNG can be stored- Suitable for the Peak-load operation of electricity generation- Transportable for a Long distance- World-wide market
Integrated production system- From gas production to LNG Import Terminal- Long-term and Take-or-Pay contracts(limited purchase option)
High quality and higher price
Many Hurdles for LNG procurements LNG can Store but Take-or-Pay is always required
2-12
5.2 Application of CNG for Peak Load Operation
CNG BargeGas Field Power Station
CNG Storage Systemfor Peak Load Operation
General CNG Transportation System
12
2. Primary Energy
2-13
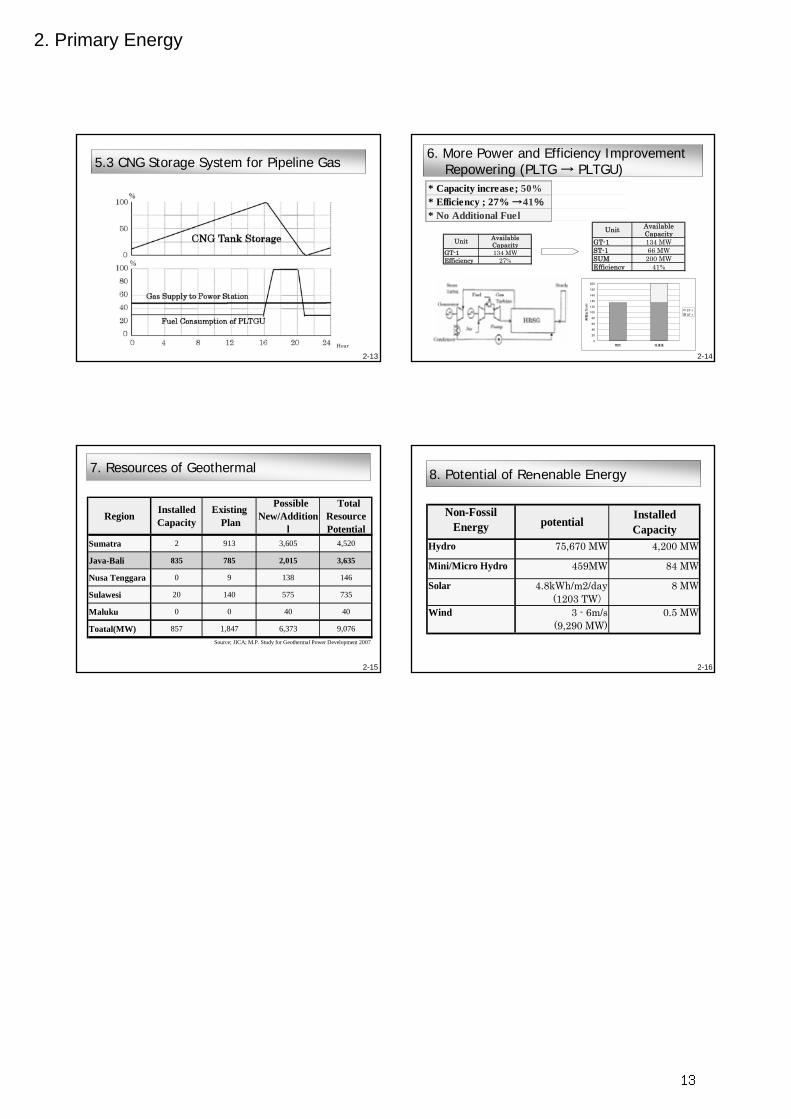
5.3 CNG Storage System for Pipeline Gas
Hour
2-14
6. More Power and Efficiency ImprovementRepowering (PLTG → PLTGU)
0
20
40
60
80
100
120
140
160
180
200
現状 改造後
発電出力(kW)
ST-1
GT-1
AvailableCapacity
GT-1 134 MWEfficiency 27%
Unit
AvailableCapacity
GT-1 134 MWST-1 66 MWSUM 200 MWEfficiency 41%
Unit
* No Additional Fuel
* Capacity increase; 50%* Efficiency ; 27% →41%
2-15
7. Resources of Geothermal
Region InstalledCapacity
Existing Plan
PossibleNew/Addition
l
TotalResourcePotential
Sumatra 2 913 3,605 4,520
Java-Bali 835 785 2,015 3,635
Nusa Tenggara 0 9 138 146
Sulawesi 20 140 575 735
Maluku 0 0 40 40
Toatal(MW) 857 1,847 6,373 9,076Source; JICA; M.P. Study for Geothermal Power Development 2007
2-16
8. Potential of Renenable Energy
Non-FossilEnergy potential Installed
CapacityHydro 75,670 MW 4,200 MW
Mini/Micro Hydro 459MW 84 MW
Solar 4.8kWh/m2/day(1203 TW)
8 MW
Wind 3 - 6m/s(9,290 MW)
0.5 MW
13
3. GENERATION EXPANSION PLAN
SPEAKER: MR. MATSUDA YASUHARU,
NEWJEC Inc.
14
3. Generation Expansion Plan
Generation Expansion Plan
3-2
Table of Contents
1. Power Business in Jamali
1.1 Existing Power Generation Facilities1.2 Existing Power Generation Expansion Plan1.3 (Power Tariff and) Fuel Prices
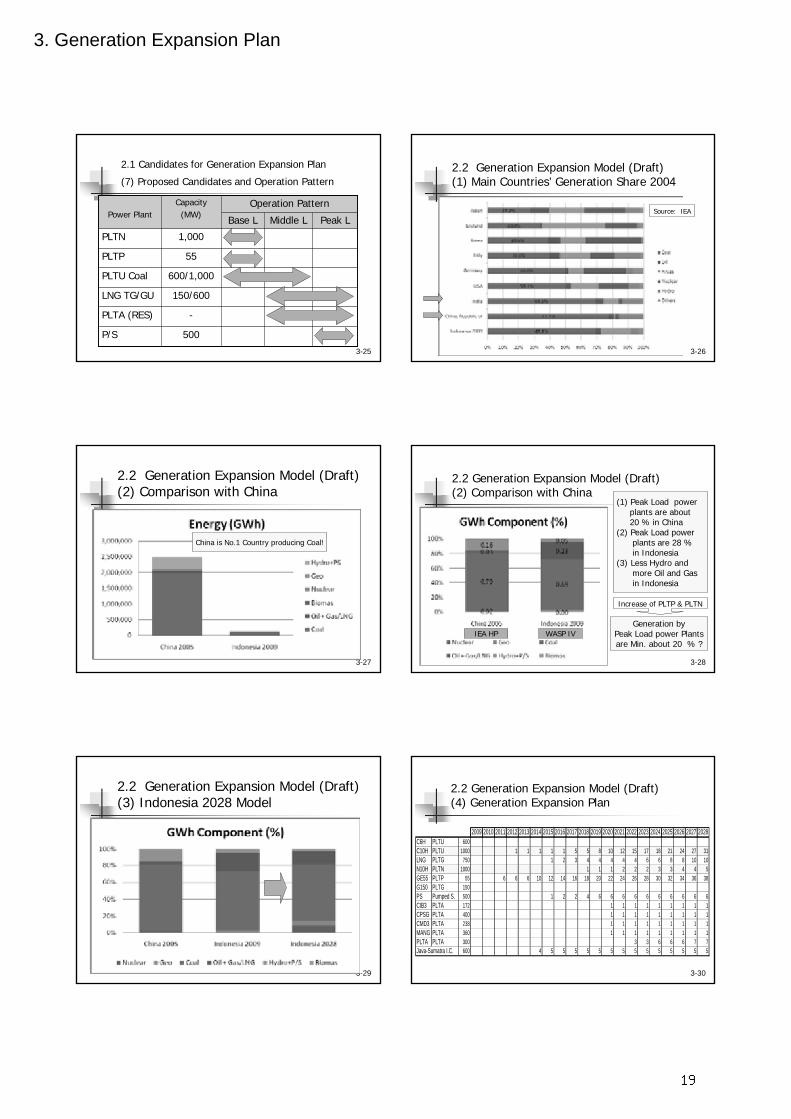
2. Generation Expansion Plan2.1 Candidates for Generation Expansion Plan
2.2 Generation Expansion Model (Draft)
3-3
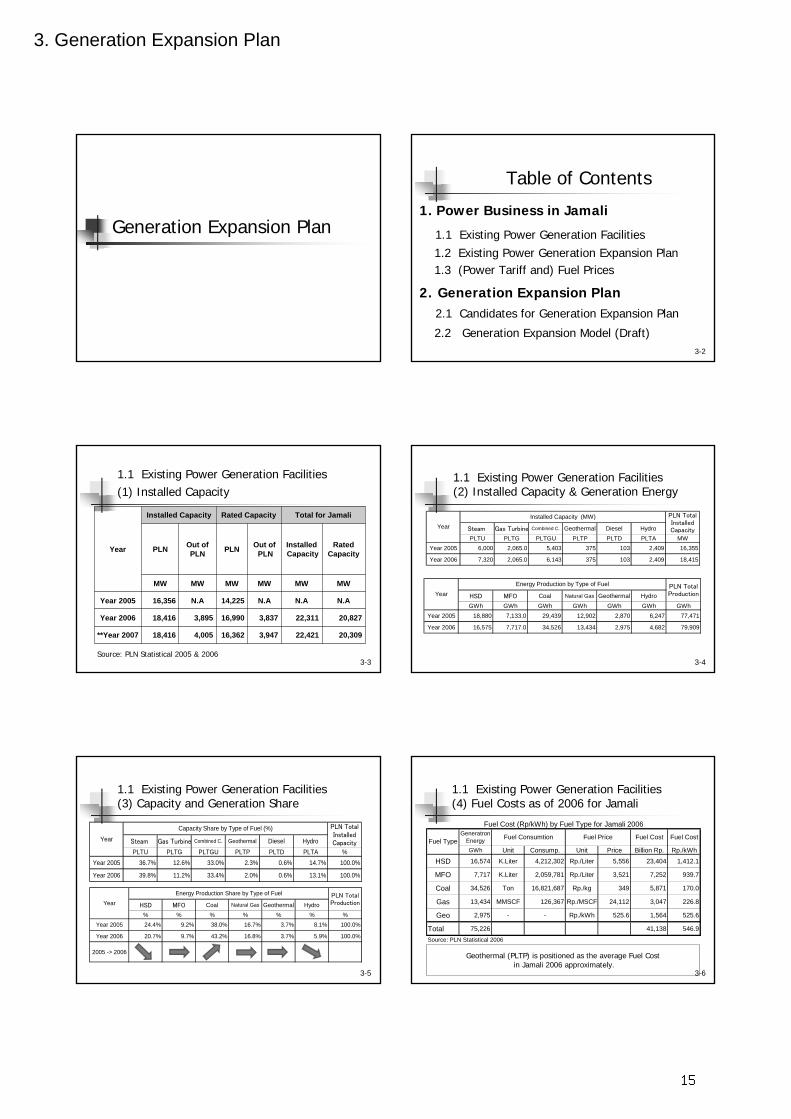
1.1 Existing Power Generation Facilities(1) Installed Capacity
20,30922,4213,94716,3624,00518,416**Year 2007
20,82722,3113,83716,9903,89518,416Year 2006
N.AN.AN.A14,225N.A16,356Year 2005
MWMWMWMWMWMW
RatedCapacity
InstalledCapacity
Out ofPLNPLNOut of
PLNPLN
Total for JamaliRated CapacityInstalled Capacity
Year
Source: PLN Statistical 2005 & 20063-4
1.1 Existing Power Generation Facilities(2) Installed Capacity & Generation Energy
Steam Gas Turbine Combined C. Geothermal Diesel HydroPLTU PLTG PLTGU PLTP PLTD PLTA MW
Year 2005 6,000 2,065.0 5,403 375 103 2,409 16,355
Year 2006 7,320 2,065.0 6,143 375 103 2,409 18,415
Source: Key World Energy Statistics 2007, IEA 3-18
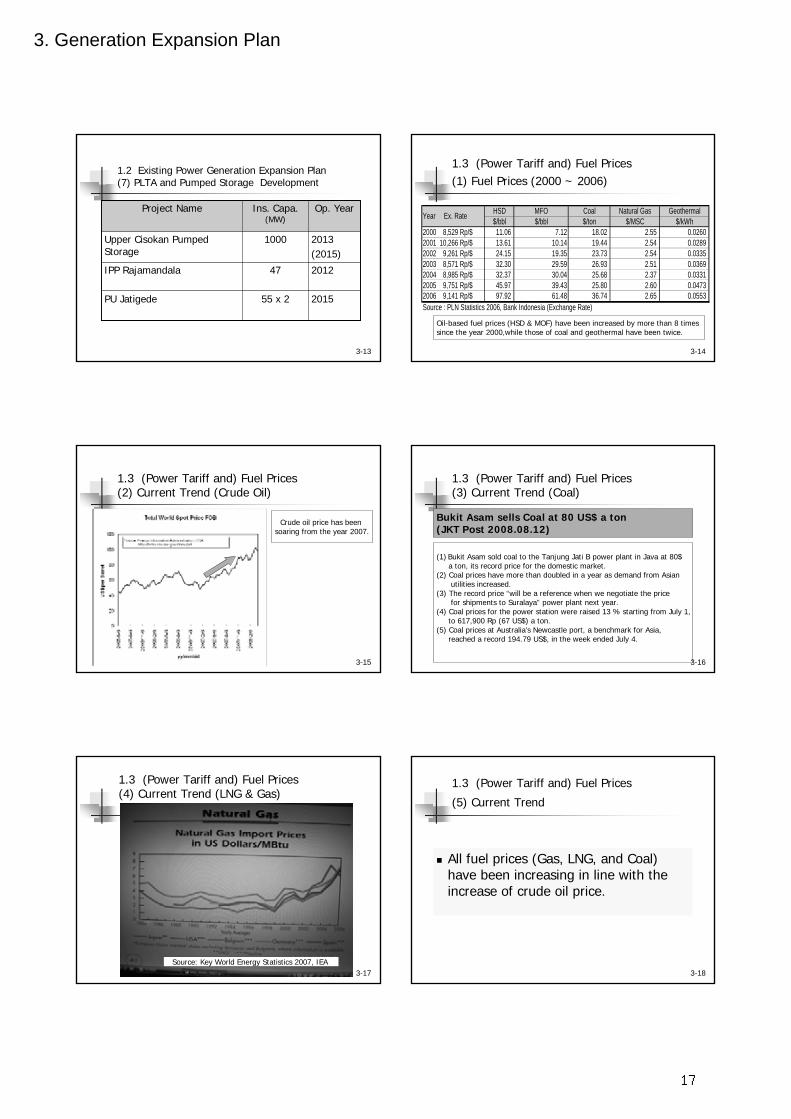
1.3 (Power Tariff and) Fuel Prices
(5) Current Trend
All fuel prices (Gas, LNG, and Coal) have been increasing in line with the increase of crude oil price.
17
3. Generation Expansion Plan
3-19
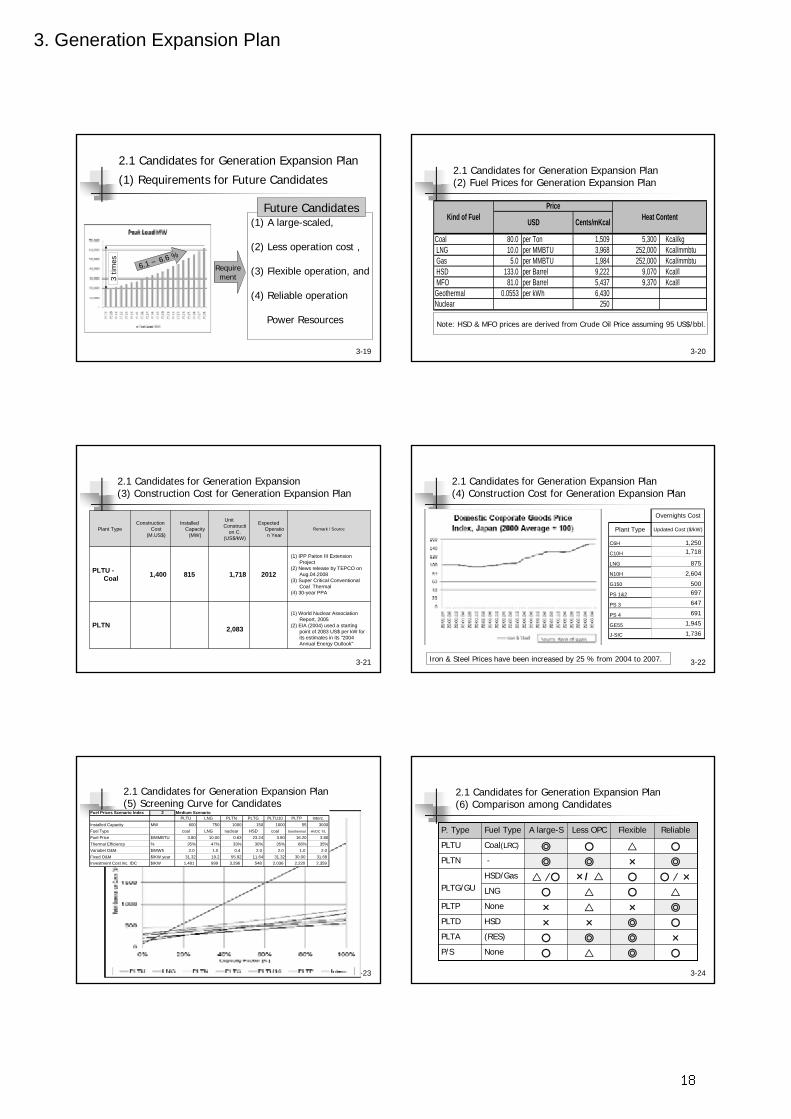
2.1 Candidates for Generation Expansion Plan
(1) Requirements for Future Candidates
Requirement
6.1 ~ 6.6 %
3 tim
es
(1) A large-scaled,
(2) Less operation cost ,
(3) Flexible operation, and
(4) Reliable operation
Power Resources
Future Candidates
3-20
2.1 Candidates for Generation Expansion Plan(2) Fuel Prices for Generation Expansion Plan
Coal 80.0 per Ton 1,509 5,300 Kcal/kg LNG 10.0 per MMBTU 3,968 252,000 Kcal/mmbtu Gas 5.0 per MMBTU 1,984 252,000 Kcal/mmbtu HSD 133.0 per Barrel 9,222 9,070 Kcal/l MFO 81.0 per Barrel 5,437 9,370 Kcal/lGeothermal 0.0553 per kWh 6,430Nuclear 250
Heat ContentUSD Cents/mKcalKind of FuelPrice
Note: HSD & MFO prices are derived from Crude Oil Price assuming 95 US$/bbl.
3-21
2.1 Candidates for Generation Expansion(3) Construction Cost for Generation Expansion Plan
(1) World Nuclear Association Report, 2005
(2) EIA (2004) used a starting point of 2083 US$ per kW for its estimates in its "2004 Annual Energy Outlook"
2,083 PLTN
(1) IPP Paiton III ExtensionProject
(2) News release by TEPCO on Aug.04.2008
(3) Super Critical Conventional Coal Thermal
(4) 30-year PPA
20121,718 8151,400 PLTU -Coal
Remark / SourceExpected
Operation Year
Unit Constructi
on C.(US$/kW)
Installed Capacity
(MW)
Construction Cost
(M.US$)Plant Type
3-22
2.1 Candidates for Generation Expansion Plan(4) Construction Cost for Generation Expansion Plan
Iron & Steel Prices have been increased by 25 % from 2004 to 2007.
Plant Type Updated Cost ($/kW)
C6H 1,250 C10H 1,718
LNG 875 N10H 2,604 G150 500 PS 1&2 697
PS 3 647
PS 4 691
GE55 1,945
J-SIC 1,736
Overnights Cost
3-23
2.1 Candidates for Generation Expansion Plan(5) Screening Curve for Candidates
Fuel Prices Scenario Index 2 Medium ScenarioPLTU LNG PLTN PLTG PLTU10 PLTP Interc.
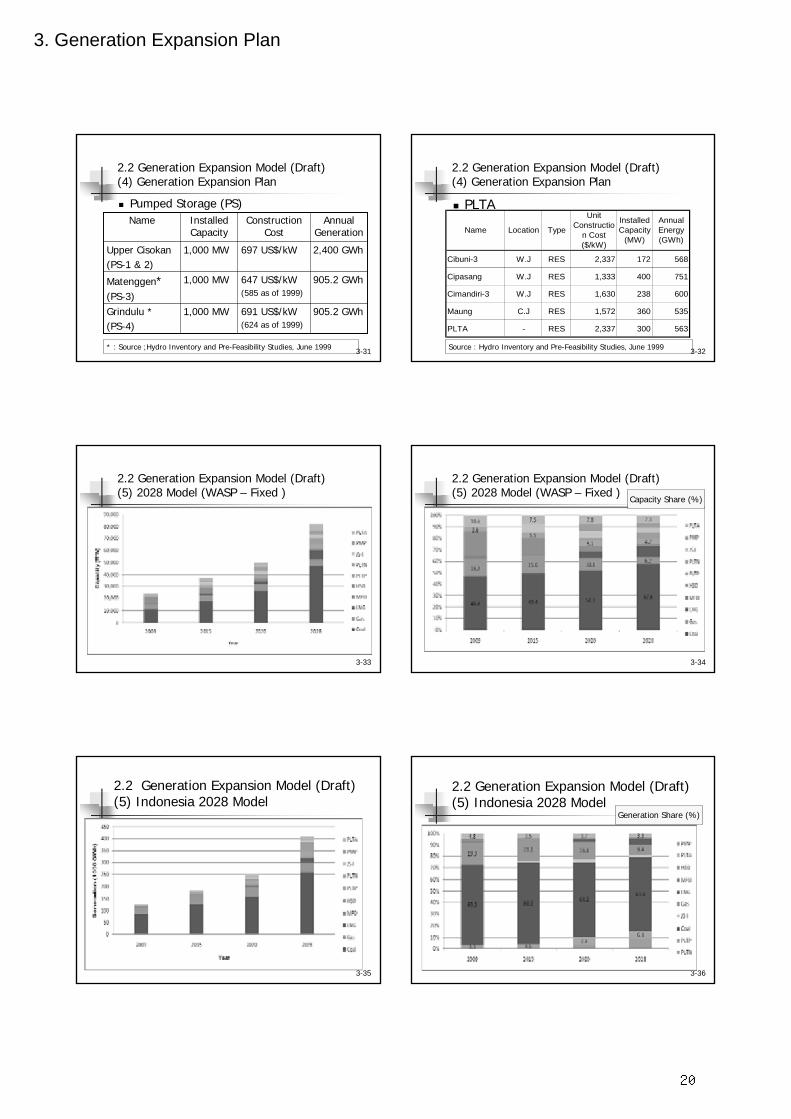
* : Source ;Hydro Inventory and Pre-Feasibility Studies, June 1999 3-32
2.2 Generation Expansion Model (Draft)(4) Generation Expansion Plan
PLTA
Cibuni-3 W.J RES 2,337 172 568
Cipasang W.J RES 1,333 400 751
Cimandiri-3 W.J RES 1,630 238 600
Maung C.J RES 1,572 360 535
PLTA - RES 2,337 300 563
AnnualEnergy(GWh)
UnitConstructio
n Cost($/kW)
TypeLocationNameInstalledCapacity
(MW)
Source : Hydro Inventory and Pre-Feasibility Studies, June 1999
3-33
2.2 Generation Expansion Model (Draft)(5) 2028 Model (WASP – Fixed )
3-34
2.2 Generation Expansion Model (Draft)(5) 2028 Model (WASP – Fixed )
Capacity Share (%)
3-35
2.2 Generation Expansion Model (Draft)(5) Indonesia 2028 Model
3-36
2.2 Generation Expansion Model (Draft)(5) Indonesia 2028 Model
Generation Share (%)
20
3. Generation Expansion Plan
3-37
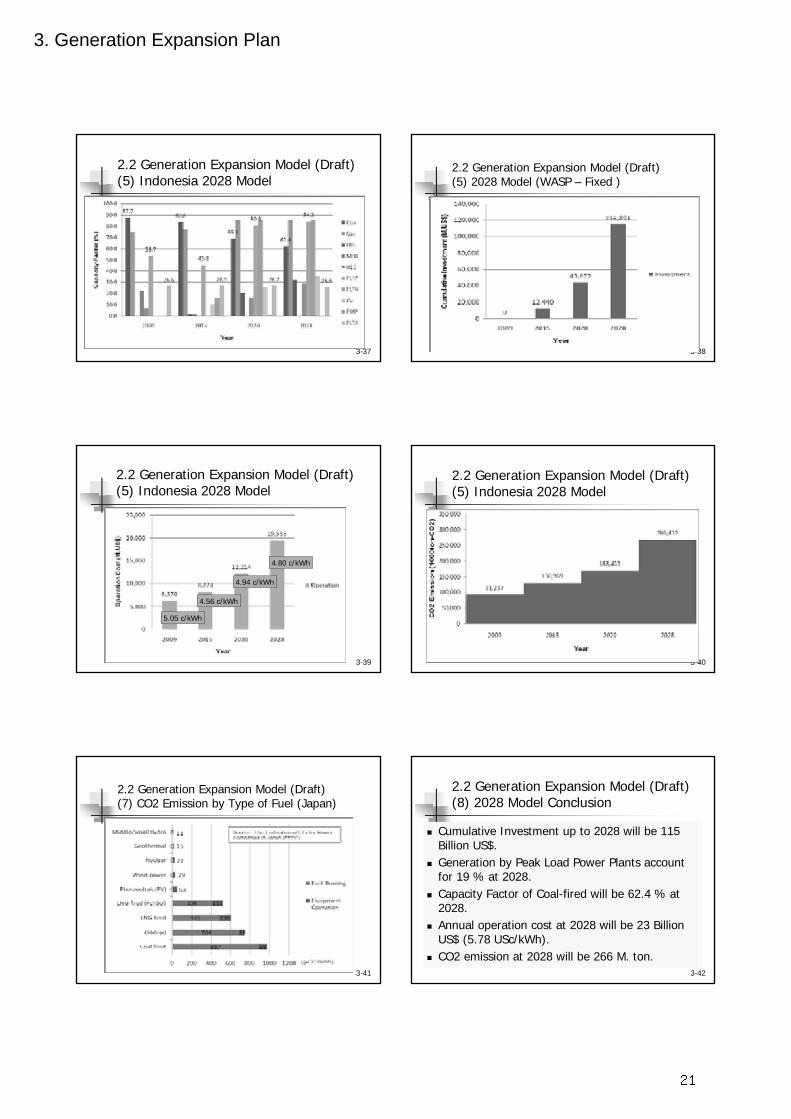
2.2 Generation Expansion Model (Draft)(5) Indonesia 2028 Model
3-38
2.2 Generation Expansion Model (Draft)(5) 2028 Model (WASP – Fixed )
3-39
2.2 Generation Expansion Model (Draft)(5) Indonesia 2028 Model
4.80 c/kWh
4.94 c/kWh
4.56 c/kWh
5.05 c/kWh
3-40
2.2 Generation Expansion Model (Draft)(5) Indonesia 2028 Model
3-41
2.2 Generation Expansion Model (Draft)(7) CO2 Emission by Type of Fuel (Japan)
3-42
2.2 Generation Expansion Model (Draft)(8) 2028 Model Conclusion
Cumulative Investment up to 2028 will be 115 Billion US$. Generation by Peak Load Power Plants account for 19 % at 2028.Capacity Factor of Coal-fired will be 62.4 % at 2028.Annual operation cost at 2028 will be 23 Billion US$ (5.78 USc/kWh). CO2 emission at 2028 will be 266 M. ton.
21
3. Generation Expansion Plan
3-43
2.2 Generation Expansion Model (Draft)(9) World Trend of Coal-fired Plants (1/2)
In the U.S. utilities are building 28 coal-fired plants and another 66 are in early planning, as gas price hikes motivate new interest.German is building 16 new plants to come on line by 2012.In Italy, Enel is converting to coal from oil-fueled power plants.Britain has endorsed new coal.
3-44
2.2 Generation Expansion Model (Draft)(9) World Trend of Coal-fired Plants (2/2)
Over the past three years, China has added each year new coal plants equivalent to Britain’s entire electricity-generating capacity.India has approved eight “ultra mega” plants which will add nearly half again to its present generating capacity.The United Arab Emirates ordered the Gulf’s first coal plant last month.
Source: Jakarta Post, August 19, 2008
22
4. POWER SYSTEM OPERATION
SPEAKER: MR. KOYAMA YASUSHI,
KANSAI ELECTRIC POWER CO., Inc.
23
4. Power System Operation
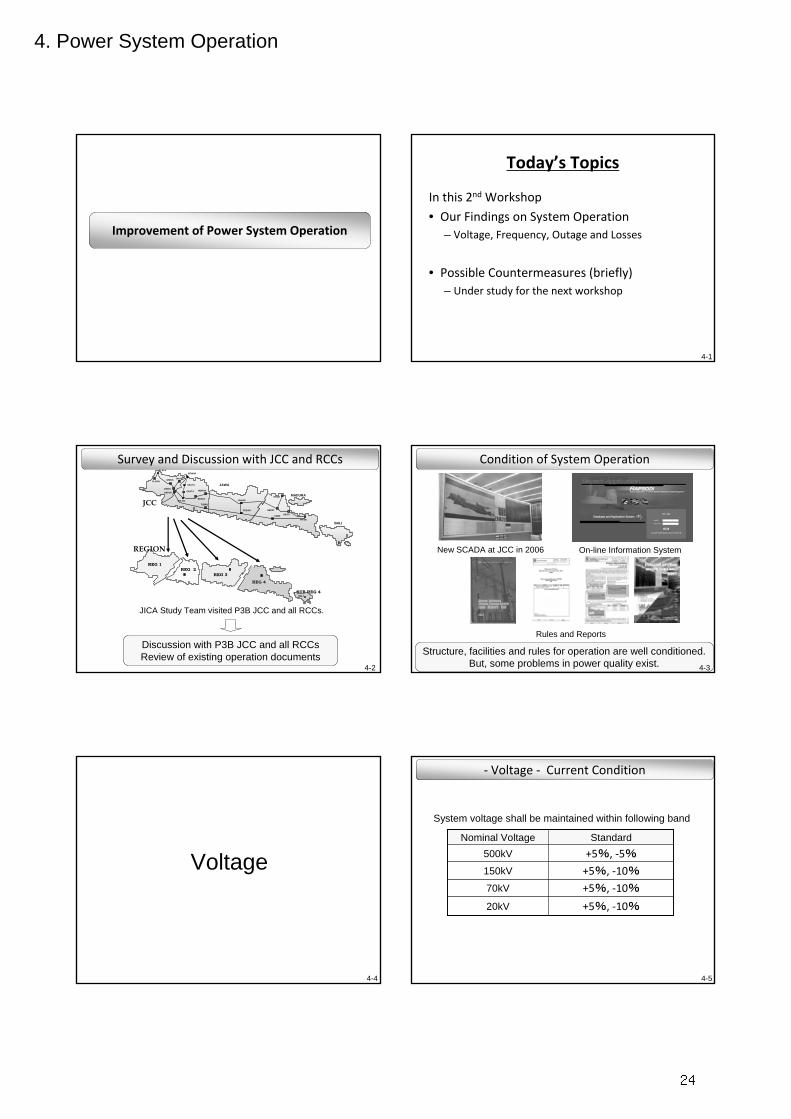
Improvement of Power System Operation
4-1
Today’s Topics
In this 2nd Workshop
• Our Findings on System Operation– Voltage, Frequency, Outage and Losses
• Possible Countermeasures (briefly)– Under study for the next workshop
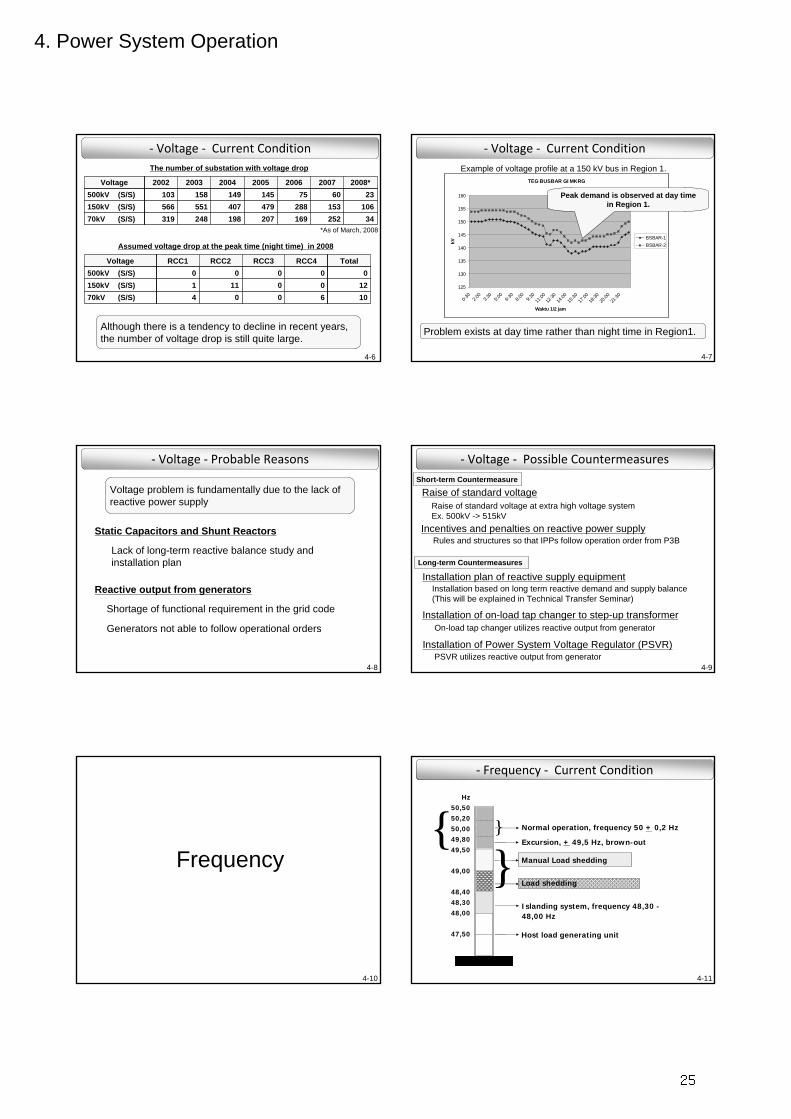
Survey and Discussion with JCC and RCCs
JICA Study Team visited P3B JCC and all RCCs.
Discussion with P3B JCC and all RCCsReview of existing operation documents
REG 2REG 2REG 3REG 3
REG 4REG 4
BALISUB REG 4SUB REG 4
REGIONREGION
REG 1REG 1
JCC
SLAYA
BKASI
CIBNG
GNDUL
CRATA
SGLNGBDSLN
GRSIK
PITON
SBRAT
UNGAR
JAWA
MADURA
BALI
GRATI
CBATUCLGON
MDRCN
PEDAN
TSBRU
DEPOK
KDIRI
MTWAR
4-2 4-3
Condition of System Operation
New SCADA at JCC in 2006
Structure, facilities and rules for operation are well conditioned.But, some problems in power quality exist.
On-line Information System
Rules and Reports
4-3
4-4
Voltage
4-5
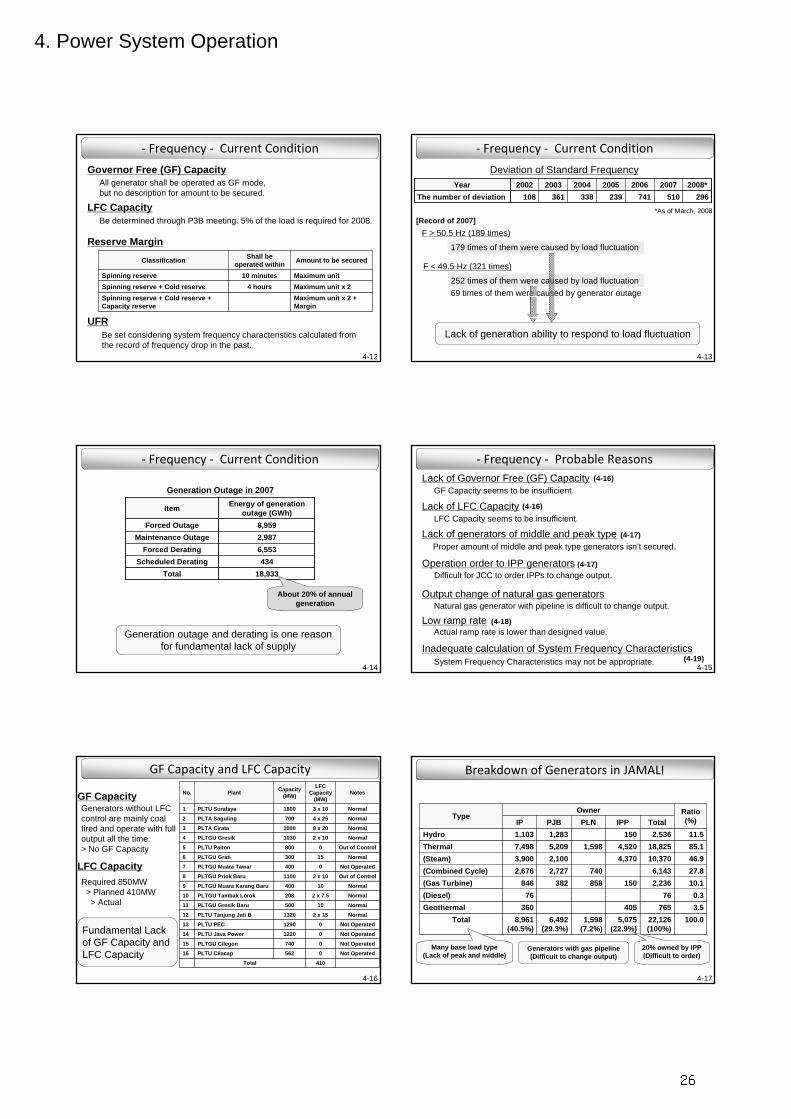
‐ Voltage ‐ Current Condition
System voltage shall be maintained within following band
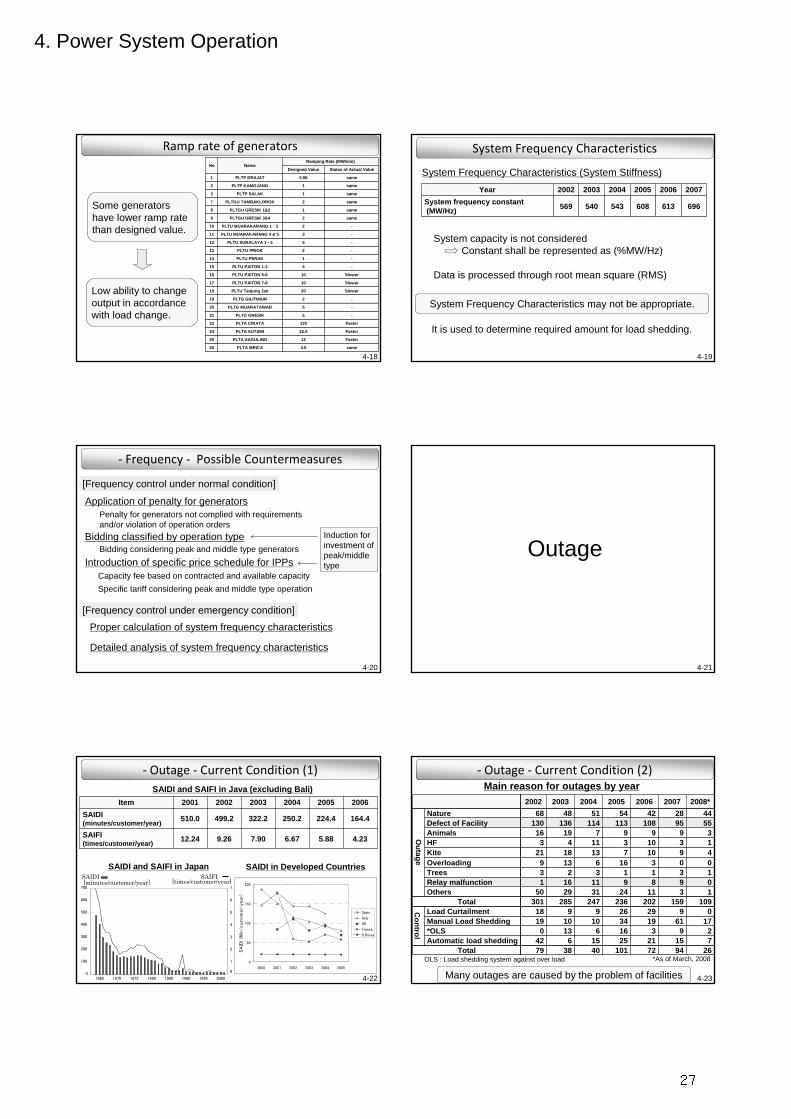
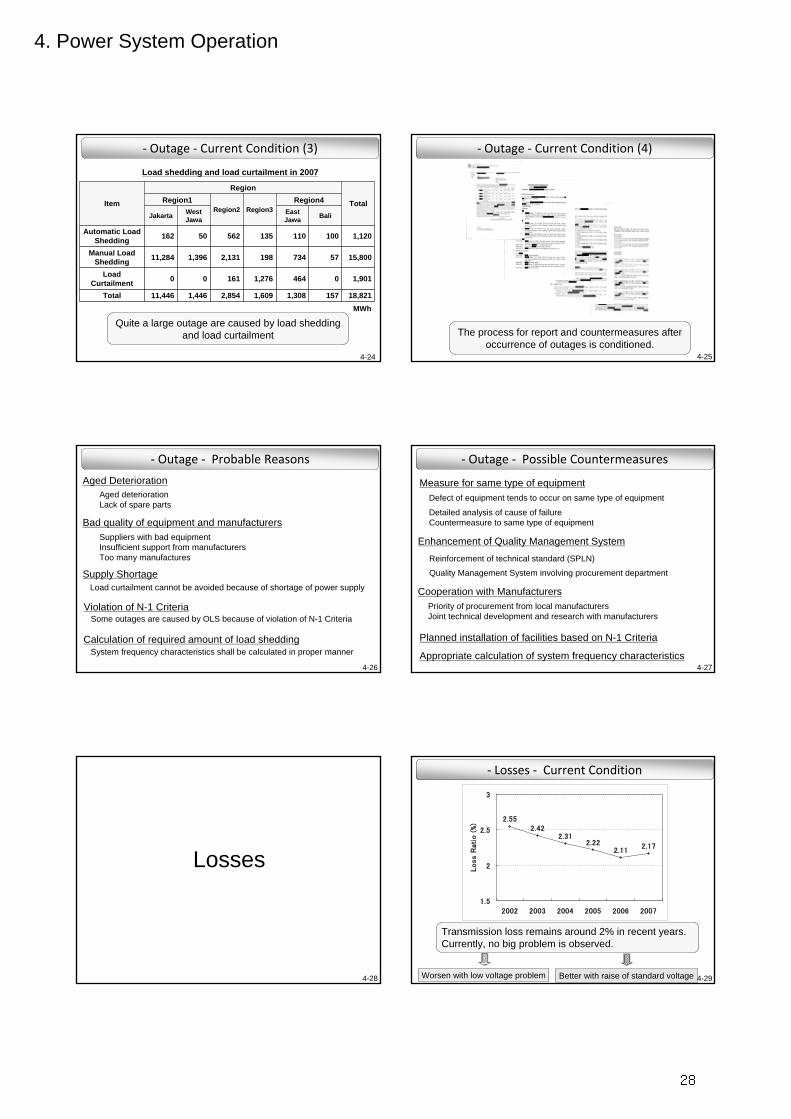
Quite a large outage are caused by load shedding and load curtailment
MWh
4-24 4-25
‐ Outage ‐ Current Condition (4)
The process for report and countermeasures after occurrence of outages is conditioned.
4-26
‐ Outage ‐ Probable Reasons
Aged Deterioration
Bad quality of equipment and manufacturers
Supply Shortage
Calculation of required amount of load shedding
Aged deteriorationLack of spare parts
Suppliers with bad equipmentInsufficient support from manufacturersToo many manufactures
Violation of N-1 Criteria
System frequency characteristics shall be calculated in proper manner
Some outages are caused by OLS because of violation of N-1 Criteria
Load curtailment cannot be avoided because of shortage of power supply
4-27
‐ Outage ‐ Possible Countermeasures
Enhancement of Quality Management System
Measure for same type of equipmentDefect of equipment tends to occur on same type of equipment
Detailed analysis of cause of failure Countermeasure to same type of equipment
Planned installation of facilities based on N-1 Criteria
Appropriate calculation of system frequency characteristics
Quality Management System involving procurement department
Reinforcement of technical standard (SPLN)
Priority of procurement from local manufacturersJoint technical development and research with manufacturers
Cooperation with Manufacturers
4-28
Losses
4-29
‐ Losses ‐ Current Condition
Transmission loss remains around 2% in recent years.Currently, no big problem is observed.
2.552.42
2.312.22
2.112.17
1.5
2
2.5
3
2002 2003 2004 2005 2006 2007
Loss R
ati
o (
%)
Worsen with low voltage problem Better with raise of standard voltage
28
4. Power System Operation
4-30
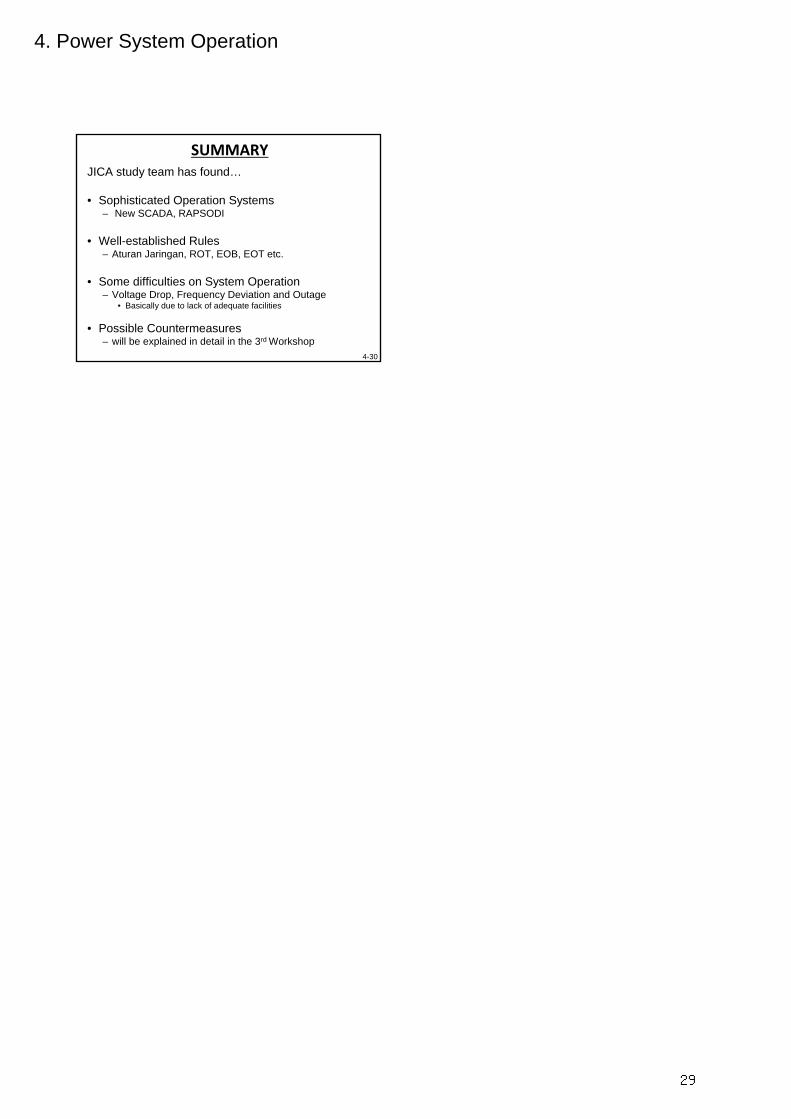
SUMMARYJICA study team has found…
• Sophisticated Operation Systems– New SCADA, RAPSODI
• Well-established Rules– Aturan Jaringan, ROT, EOB, EOT etc.
• Some difficulties on System Operation – Voltage Drop, Frequency Deviation and Outage
• Basically due to lack of adequate facilities
• Possible Countermeasures – will be explained in detail in the 3rd Workshop
29
5. POWER SYSTEM PLAN
SPEAKER: MR. TANAKA YUKAO,
NEWJEC INC.
30
5. Power System Plan
Fig. 1 Project Location
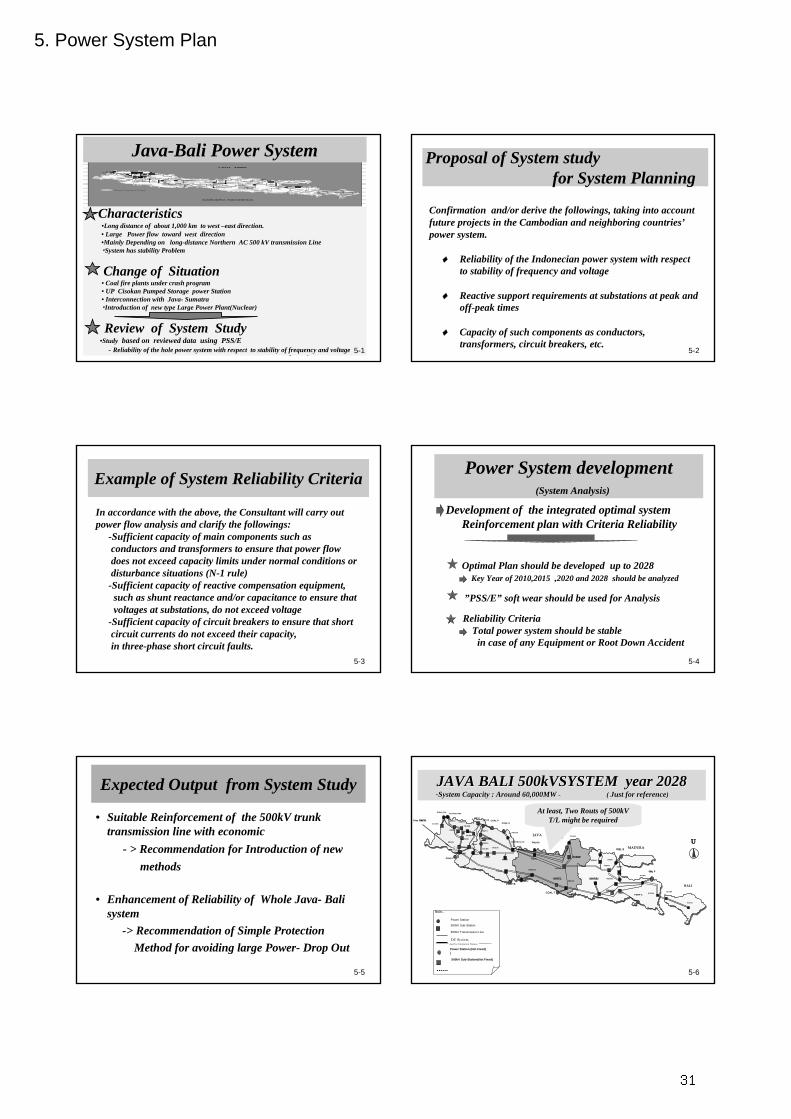
Characteristics•Long distance of about 1,000 km to west –east direction. • Large Power flow toward west direction•Mainly Depending on long-distance Northern AC 500 kV transmission Line ・System has stability Problem
Change of Situation• Coal fire plants under crash program• UP Cisokan Pumped Storage power Station• Interconnection with Java- Sumatra・Introduction of new type Large Power Plant(Nuclear)
Review of System Study•Study based on reviewed data using PSS/E
- Reliability of the hole power system with respect to stability of frequency and voltage
SISTEM TENAGA LISTRIK JAMALI JAWA – MADURA - BALI
H
SLAYA
SRANG
CNJUR
KSBRU
JTLHR
PDLRGCRATA
MRICA
WSOBO
RWALO
BNTUL KLTEN
JELOKSGRAH
BABAT
GRSIK
KRIAN
KKTES
KBAGN
PMKSN
STBDO
BDWSO
JMBER
BWNGI
JAJARBOJLI
WLERI
UNGARSMNEPGLTMR
JTAKE
SLIRA
GARNG
ASAHI
KKSTL
CLGON
CBBAT
TBROK
U
ACCUNGAR
GU
BNGIL
JAVA
MADURA
BALI
SALAK
U
KRPYK BKLAN
GRATI
GU
A
MKRNG
BGBRU CIBNG
SGLNG
TGRNGGU
ACCCWANG
GU
PRIOK
P A
P
BDSLN
KMJNG
SRGEN
A
U MTWARBKASI
PALUR
PERAK
A
A
GU
SPANG
GLNUK
NGARA
ACCWARU
A
CRBONACC
CGRLG
PITONU
PEDAN
LWANG
SRAGI
UBRNG
JTBRG
HRGLS
CBATUGNDUL
KMBNG
A
KDMBO
PKLON CEPU
RBANG
BLORA
KUDUSPATI
JPARA
LMJNG
PBLGO
Wilayah Tegangan Randah
SGMDU
ULNGAN
BJGRO
WLNGI
A
MGUNG
MKRTO
MNRJO
NGAWI
KDBRU
SURYA
MJNNG
BNJAR
DRJATCAMIS
GARUTP
TSMYA
MENESBUNAR
PMLNG
BMAYU
KBSEN
KLBKL
LMNISG GBONG
PWRJOKNTUG
TRGLKPCTAN
PMRON
BTRTI AMLRA
SANUR
KAPAL GNYAR
BTRTI
NSDUA
GPSGRH
KRBKN
LAUT JAWA
SAMUDRA INDONESIA
Java-Bali Power System
5-1
Proposal of System studyfor System Planning
Confirmation and/or derive the followings, taking into account future projects in the Cambodian and neighboring countries’power system.
♦ Reliability of the Indonecian power system with respectto stability of frequency and voltage
♦ Reactive support requirements at substations at peak andoff-peak times
♦ Capacity of such components as conductors,transformers, circuit breakers, etc.
5-2
Example of System Reliability Criteria
In accordance with the above, the Consultant will carry out power flow analysis and clarify the followings:
-Sufficient capacity of main components such asconductors and transformers to ensure that power flowdoes not exceed capacity limits under normal conditions ordisturbance situations (N-1 rule)
-Sufficient capacity of reactive compensation equipment,such as shunt reactance and/or capacitance to ensure thatvoltages at substations, do not exceed voltage
-Sufficient capacity of circuit breakers to ensure that shortcircuit currents do not exceed their capacity, in three-phase short circuit faults.
5-3
Development of the integrated optimal systemReinforcement plan with Criteria Reliability
Optimal Plan should be developed up to 2028 Key Year of 2010,2015 ,2020 and 2028 should be analyzed
”PSS/E” soft wear should be used for Analysis
Reliability Criteria Total power system should be stable
in case of any Equipment or Root Down Accident
Power System development (System Analysis)
5-4
Expected Output from System Study
• Suitable Reinforcement of the 500kV trunk transmission line with economic
- > Recommendation for Introduction of newmethods
• Enhancement of Reliability of Whole Java- Bali system
-> Recommendation of Simple Protection Method for avoiding large Power- Drop Out
5-5
JAVA
CLGON
SURALAYA
KMBNG
BKASI
GNDUL
CWANG
CBATU
CIBNGCRATA
SGLNG BDSLN
MANDIRANCAN
PEDAN
UNGARKRIAN
GRSIK
SBLTN
PITON
KEDIRI
MADURA
BALI
DEPOK
MRTWR
TJ JATI
NGBNG
GRATI
TSMYA
U
TMBUN
BOJONEGARA
CSKAN
CILACAP
RCKEK
PWTAN
PMLNG
BNGIL WTDOLGLNUK
KAPAL
NGORO
RAWALO
LENGK
BLRJA
500kV Sub-Station
Note :
500kV Transmission Line
Power Station
DC System
DURIKABI
KSBRU
MNIREJ
KBAGN
COAL K
COAL P
PSHP ACOAL T
PSHP B
PSHP C
COAL PCOAL S
INPP
Power Station (Not Fixed))500kV Sub-Station(Not Fixed)
************ Just for Calculation Purpose ************
PARUNG
PMLNG
From SUMATRA
LAGAD PORWP
BNTUL
JAVA BALI 500kVSYSTEM year 2028JAVA BALI 500kVSYSTEM year 2028--System Capacity : Around 60,000MW System Capacity : Around 60,000MW -- ( ( Just for referenceJust for reference))
At least, Two Routs of 500kV T/L might be required
5-6
31
5. Power System Plan
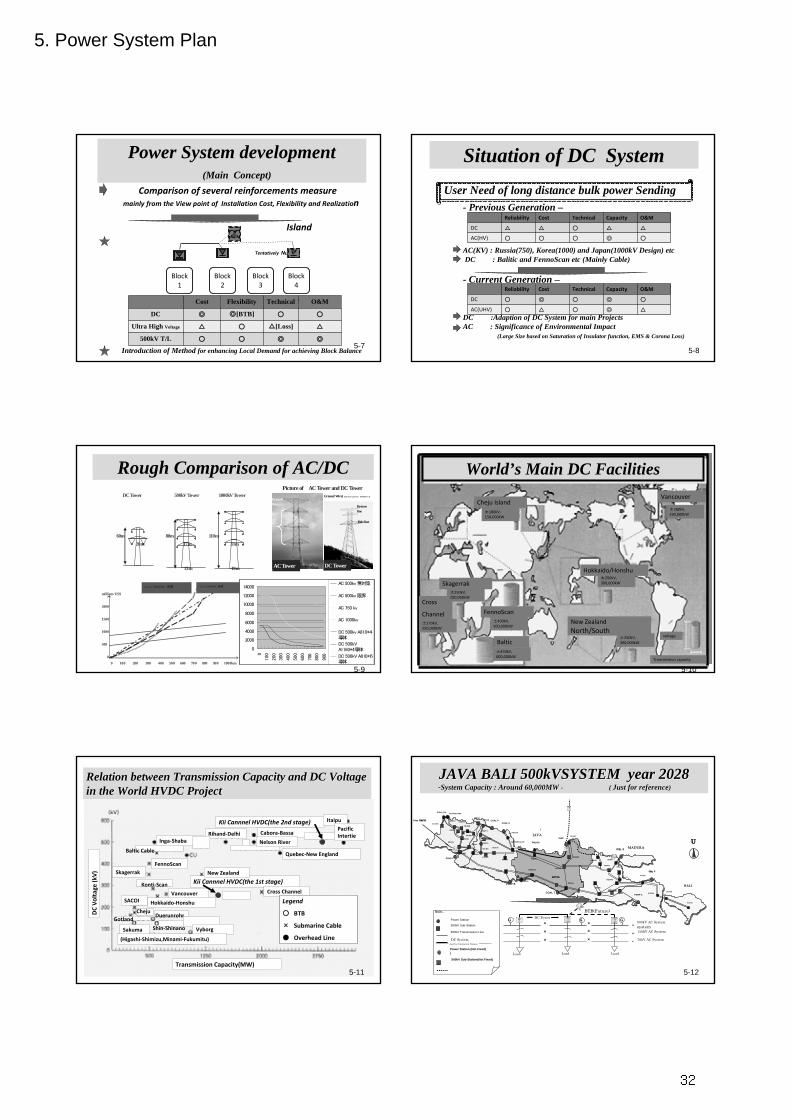
Comparison of several reinforcements measuremainly from the View point of Installation Cost, Flexibility and Realization
Island
Tentatively Nuclear
Other island
Introduction of Method for enhancing Local Demand for achieving Block Balance
Power System development (Main Concept)
Block1
Block4
Block 2
Block3
Cost Flexibility Technical O&M
DC ◎ ◎[BTB] ○ ○
Ultra High Voltage △ ○ △[Loss] △
500kV T/L ○ ○ ◎ ◎5-7
User Need of long distance bulk power Sending- Previous Generation –
AC(KV) : Russia(750), Korea(1000) and Japan(1000kV Design) etcDC : Balitic and FennoScan etc (Mainly Cable)
- Current Generation –
DC :Adaption of DC System for main ProjectsAC : Significance of Environmental Impact
(Large Size based on Saturation of Insulator function, EMS & Corona Loss)
直流送電設備の送電容量と直流電圧Relation between Transmission Capacity and DC Voltage Relation between Transmission Capacity and DC Voltage in the World HVDC Projectin the World HVDC Project
Kii Cannnel HVDC(the 2nd stage)
Kii Cannnel HVDC(the 1st stage)
Transmission Capacity(MW)
DC Voltage
(kV)
Inga‐ShabaRihand‐Delhi Cabora‐Bassa
Quebec‐New England
Nelson River
Itaipu
Pacific Intertie
Baltic Cable
FennoScanSkagerrak
Konti‐Scan
Vancouver
Hokkaido‐HonshuSACOI
ChejuGotland
Shin‐Shinano Vyborg
Cross Channel
Legend
○ BTB
× Submarine Cable
● Overhead Line
New Zealand
Sakuma
(Higashi‐Shimizu,Minami‐Fukumitu)
Duerunrohr
5-11
JAVA BALI 500kVSYSTEM year 2028JAVA BALI 500kVSYSTEM year 2028--System Capacity : Around 60,000MW System Capacity : Around 60,000MW -- ( ( Just for referenceJust for reference))
JAVA
CLGON
SURALAYA
KMBNG
BKASI
GNDUL
CWANG
CBATU
CIBNGCRATA
SGLNG BDSLN
MANDIRANCAN
PEDAN
UNGARKRIAN
GRSIK
SBLTN
PITON
KEDIRI
MADURA
BALI
DEPOK
MRTWR
TJ JATI
NGBNG
GRATI
TSMYA
U
TMBUN
BOJONEGARA
CSKAN
CILACAP
RCKEK
PWTAN
PMLNG
BNGIL WTDOLGLNUK
KAPAL
NGORO
RAWALO
LENGK
BLRJA
500kV Sub-Station
Note :
500kV Transmission Line
Power Station
BTB(Future)
DC System
DC Power500kV AC Systemsystem150kV AC System
70kV AC System
LoadLoadLoad
×
×
×
G GG×
×
×
DURIKABI
KSBRU
BNTUL
KBAGN
COAL K
COAL P
PSHP ACOAL T
PSHP B
PSHP C
COAL PCOAL S
INPP
Power Station (Not Fixed))500kV Sub-Station(Not Fixed)
************ Just for Calculation Purpose ************
PARUNG
PMLNG
From SUMATRA
LAGAD PORWP
5-12
32
5. Power System Plan
Converter transformer
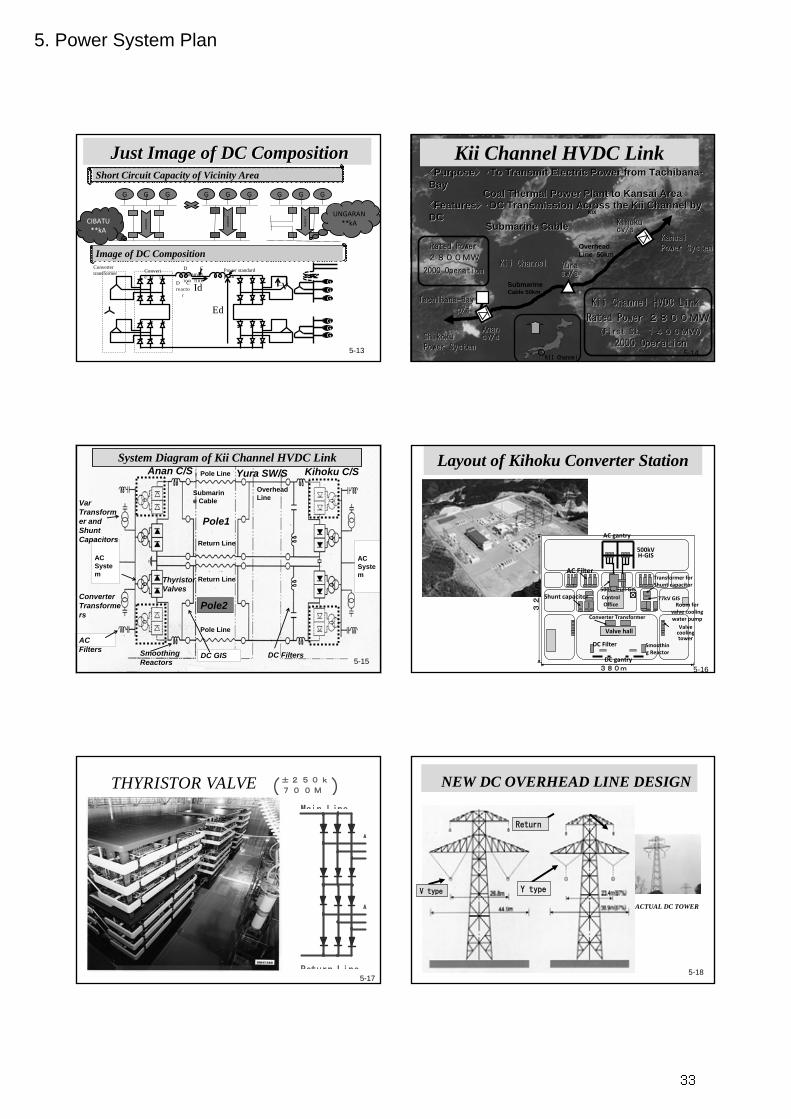
Just Image of DC CompositionJust Image of DC Composition
Converte r s
Id
Ed
V
Power standard point
D C reacto
r
D C transmission line G
GG
GGG
GG GGGG
3000MW
1200MW
G G G
3000MW
Short Circuit Capacity of Vicinity Area
Image of DC Composition
CIBATU**kA
UNGARAN**kA
5-13
Kii Channel HVDC LinkKii Channel HVDC Link<<PurposePurpose> > ・・To Transmit Electric Power from TachibanaTo Transmit Electric Power from Tachibana--Bay Bay
Coal Thermal Power Plant to Kansai AreaCoal Thermal Power Plant to Kansai Area<<FeaturesFeatures>> ・・DC Transmission Across the DC Transmission Across the KiiKii Channel by Channel by DCDC
Submarine CableSubmarine CableKansaiKansai
Power SystemPower System
ShikokuShikokuPower SystemPower System
KiiKii ChannelChannel
AnanAnancv/scv/s
YuraYurasw/ssw/s
KihokuKihokucv/scv/s
TachibanaTachibana--BayBayp/sp/s
2800MW2800MW
2000 Operation2000 Operation
Kii Channel HVDC Link
KiiKii Channel HVDC LinkChannel HVDC Link
Rated Power Rated Power 2800MW2800MW
((First St. First St. 1400MW)1400MW)
2000 Operation2000 Operation
Rated PowerRated Power
Submarine Cable 50km
Overhead Line 50km
KII Channel
KIX
5-14
System Diagram of Kii Channel HVDC LinkAnan C/S Yura SW/S Kihoku C/S
Submarine Cable
Pole1
Pole2
Pole Line
Return Line
Return Line
Pole Line
Overhead Line
DC FiltersDC GISSmoothing Reactors
ThyristorValves
AC Filters
AC System
AC System
Converter Transformers
VarTransformer and Shunt Capacitors
5-15
Layout of Kihoku Converter Station
32
0m
Converter Transformer
Control Office
Valve cooling tower
AC Filter
Room for valve cooling water pump
Transformer for Shunt capacitor
Shunt capacitor
AC gantry
DC gantry
500kVH‐GIS
500kV Full‐GIS
Smoothing Reactor
Valve hall
DC Filter
77kV GIS
380m 5-16
±2 50k
7 0 0 M( )THYRISTOR VALVE Main Line
Return Line
A
A
5-17
V type Y type
Return
NEW DC OVERHEAD LINE DESIGN
ACTUAL DC TOWER
5-18
33
5. Power System Plan
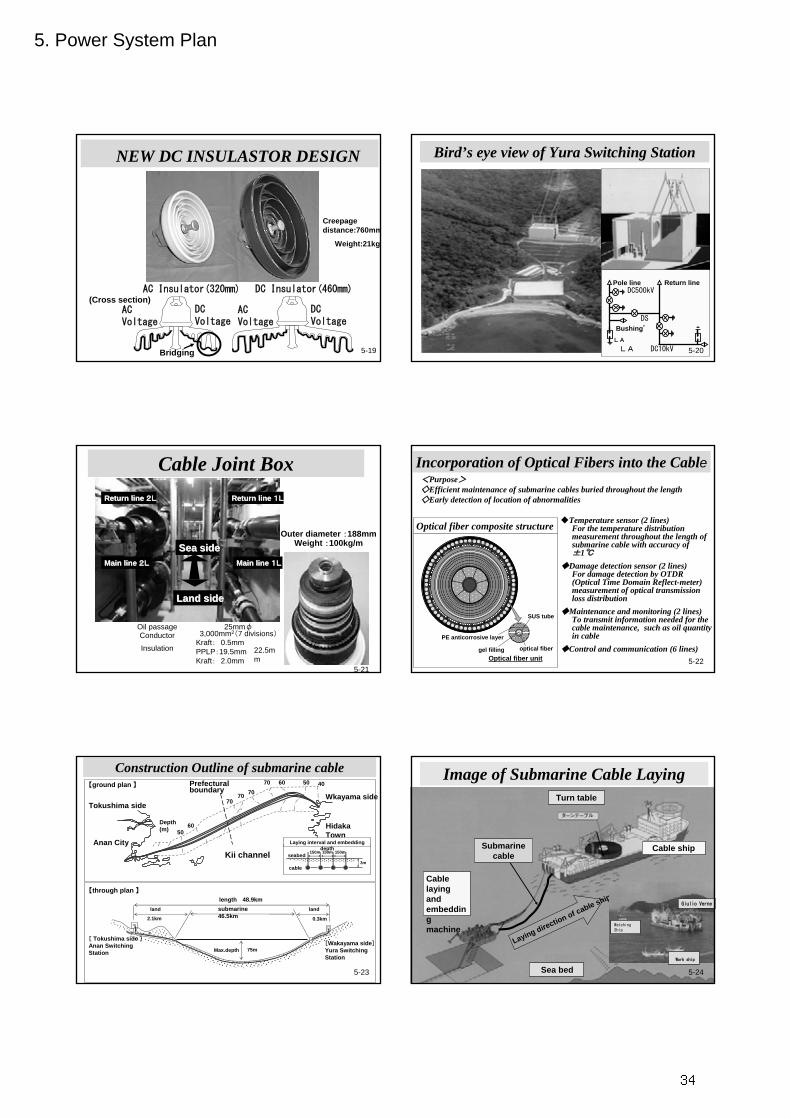
NEW DC INSULASTOR DESIGN
(Cross section)AC Insulator(320mm) DC Insulator(460mm)
ACVoltage
DCVoltage
Bridging
ACVoltage
DCVoltage
Creepagedistance:760mm
Weight:21kg
5-19
Bird’s eye view of Yura Switching Station
LA
Return linePole line
Bushing゙
DC500kV
DC10kVLALA
DS
5-20
Main lineMain line 1L1L
Return lineReturn line 1L1L
Main lineMain line 2L2L
Return lineReturn line 2L2L
Land sideLand side
Sea sideSea side
Cable Joint Box
Outer diameter :188mmWeight :100kg/m
22.5mm
Kraft: 0.5mm PPLP:19.5mmKraft: 2.0mm
Insulation
3,000mm2(7 divisions)Conductor25mmφOil passage
5-21
◆Temperature sensor (2 lines)For the temperature distribution measurement throughout the length of submarine cable with accuracy of ±1℃
◆Damage detection sensor (2 lines)For damage detection by OTDR (Optical Time Domain Reflect-meter) measurement of optical transmission loss distribution
◆Maintenance and monitoring (2 lines)To transmit information needed for the cable maintenance, such as oil quantity in cable
◆Control and communication (6 lines)
<Purpose>◇Efficient maintenance of submarine cables buried throughout the length◇Early detection of location of abnormalities
Optical fiber composite structure
PE anticorrosive layer
Optical fiber unit
SUS tube
gel filling optical fiber
Incorporation of Optical Fibers into the Cable
5-22
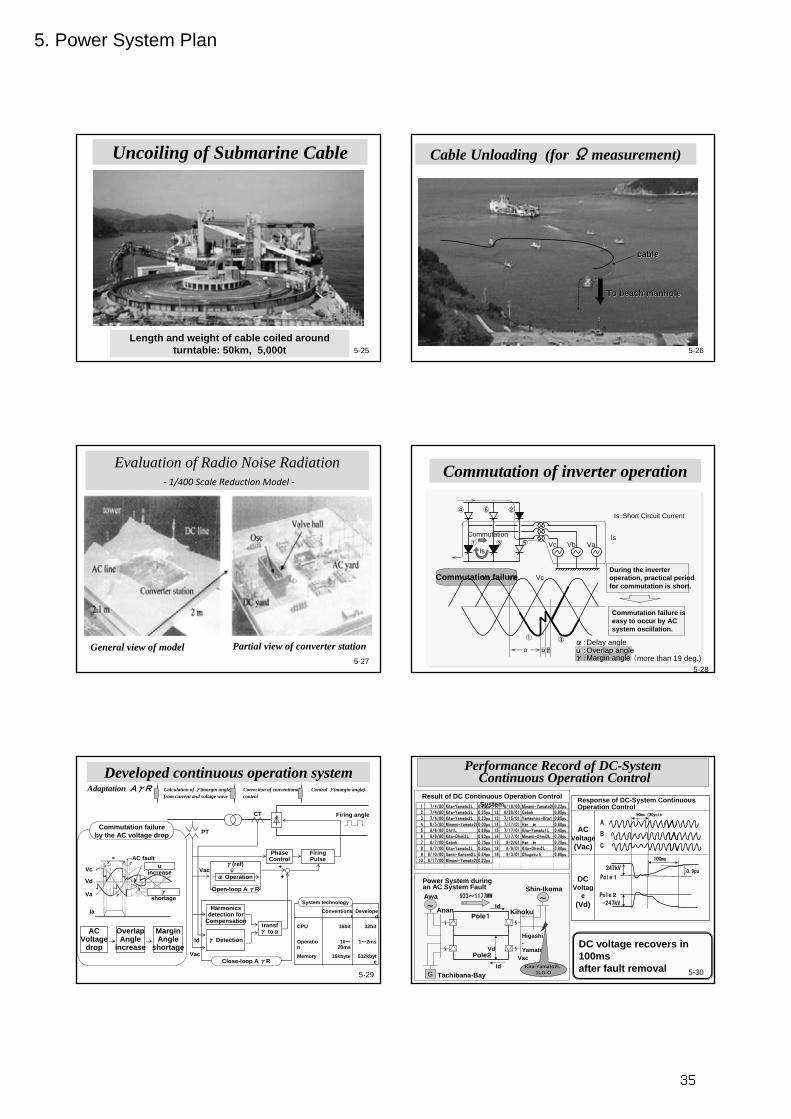
length 48.9kmsubmarine46.5km
land
2.1km 0.3km
75mMax.depth
[ Tokushima side ]Anan Switching Station
[Wakayama side]Yura Switching Station
【through plan 】
Prefectural boundary
Kii channel
Wkayama side
Hidaka Town
Tokushima side
Anan City
405060707070
70
6050
seabed
cable
150m 150m 150m
3m
Laying interval and embedding depth
【ground plan 】
Construction Outline of submarine cable
Depth (m)
land
5-23
Cable laying and embedding machine
Cable ship
Sea bed
Laying direction of cable ship
Turn table
Image of Submarine Cable Laying
Submarine cable
Watching Ship
Giulio Verne
Work ship
5-24
34
5. Power System Plan
Length and weight of cable coiled around Length and weight of cable coiled around turntable: 50km, 5,000tturntable: 50km, 5,000t
Uncoiling of Submarine Cable
5-25
To beach manholeTo beach manhole
cablecable
Cable Unloading (for Ω measurement)
5-26
Evaluation of Radio Noise Radiation‐ 1/400 Scale Reduction Model ‐
General view of model Partial view of converter station5-27
Commutation of inverter operation
①
②
③
④ ⑥
⑤
Commutation
Is:Short Circuit Current
During the inverter operation, practical periodfor commutation is short.
Commutation failure is easy to occur by AC system oscillation.
αα:Delay angle
Vc Vb Va
Vc
Is
① ③
Commutation failure
(more than 19 deg.)γ:Margin angleγ
Is
u
VbVa
u :Overlap angle
5-28
Developed continuous operation system
Commutation failureby the AC voltage drop
ACVoltage
drop
OverlapAngle
increase
MarginAngle
shortage
Vc
Vd
Va
Ia
αγ γu
u
γγ
shortage
u increase
AC fault
CPU 16bit 32bit
Operation
10~20ms
1~2ms
Memory 16kbyte 512kbyte
Conventional
Developed
Harmonicsdetection for
Compensation
γ Detection
transfγ toα
PhaseControl
FiringPulse
α Operation
γ(ref)
Open-loop A γR
Close-loop A γR
PT
CT
Vac ++
Vac
Id
Firing angle
System technology
Adaptation AγR Calculation of γ(margin angle) Correction of conventional Control γ(margin angle) from current and voltage wave control
5-29
Performance Record of DC-SystemContinuous Operation Control
DC voltage recovers in DC voltage recovers in 100ms100msafter fault removalafter fault removal
ACACVoltageVoltage((VacVac))
Response of DCResponse of DC--System Continuous System Continuous Operation ControlOperation Control
AA
BB
CC
100ms100ms
--247kV247kV
0.9pu0.9pu
DCDCVoltagVoltag
ee((VdVd))
PolePole11
PolePole22
247kV247kV
~
AwaAwa
G
AnanAnan KihokuKihokuPolePole11
PolePole22
933933~~1177MW1177MW
Vd
Id
~
~
~
~
ShinShin--IkomaIkoma
HigashiHigashi--YamatoYamato
Vac
~
KitaKita--Yamato2L Yamato2L 1LG1LG--OO
Power System during Power System during an AC System Faultan AC System Fault
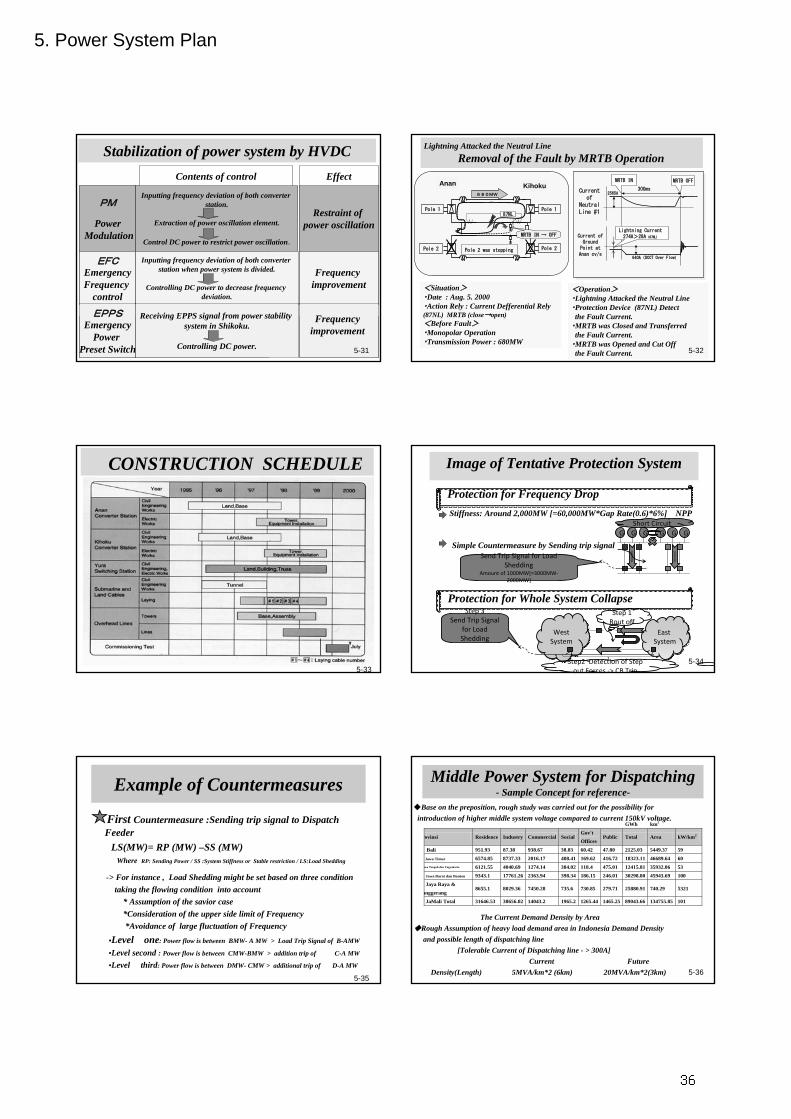
Stabilization of power system by HVDCContents of control Effect
PM
PowerModulation
Inputting frequency deviation of both converter station.
Extraction of power oscillation element.
Control DC power to restrict power oscillation.
Restraint of power oscillation
EFC周波数制御
系統分断時に両変換所の周波数偏差を入力し、両変換所の周波数偏差を減少させるように直流電力を制御する
周波数改善
EPPS緊急電力融通制御
系統分断時に四国の系統安定化装置より、EPPS信号を受信して直流電力を制御する
周波数改善
EFCEmergencyFrequency
control
Inputting frequency deviation of both converter station when power system is divided.
Controlling DC power to decrease frequency deviation.
Frequency improvement
EPPSEmergency
Power Preset Switch
Receiving EPPS signal from power stability system in Shikoku.
Controlling DC power.
Frequency improvement
5-31
Lightning Attacked the Neutral Line Removal of the Fault by MRTB Operation
<Situation>・Date : Aug. 5. 2000・Action Rely : Current Defferential Rely(87NL) MRTB (close→open)<Before Fault>・Monopolar Operation・Transmission Power : 680MW
<Operation>・Lightning Attacked the Neutral Line・Protection Device (87NL) Detect
the Fault Current.・MRTB was Closed and Transferred
the Fault Current. ・MRTB was Opened and Cut Off
the Fault Current.
Pole 1
Pole 2
Pole 1
Pole 2
MRTB IN → OFF
300ms300msCurrent Current of of
Neutral Neutral Line #1Line #1
Current of Current of Ground Ground
Point at Point at Anan Anan cv/scv/s
2565A2565A
640A640A((DCCT Over FlowDCCT Over Flow))
Lightning Current274A>28A(87NL)
MRTB IN MRTB OFF
87NL
Pole 2 was stopping
680MW
Anan Kihoku
5-32
CONSTRUCTION SCHEDULE
5-33
Protection for Frequency DropStiffness: Around 2,000MW [=60,000MW*Gap Rate(0.6)*6%] NPP
Simple Countermeasure by Sending trip signal
Protection for Whole System Collapse
Image of Tentative Protection System
GG GGGG
3000MW
Short Circuit
3000MWSend Trip Signal for Load
SheddingAmount of 1000MW[=3000MW‐
2000MW]
GG
EastSystem
West System
Step 1Rout off
Step 3Send Trip Signal
for Load Shedding
Step2 Detection of Step out Forces ‐> CB Trip
5-34
Example of Countermeasures
First Countermeasure :Sending trip signal to Dispatch Feeder
LS(MW)= RP (MW) –SS (MW) Where RP: Sending Power / SS :System Stiffness or Stable restriction / LS:Load Shedding
-> For instance , Load Shedding might be set based on three conditiontaking the flowing condition into account
* Assumption of the savior case *Consideration of the upper side limit of Frequency *Avoidance of large fluctuation of Frequency
•Level one: Power flow is between BMW- A MW > Load Trip Signal of B-AMW
•Level second : Power flow is between CMW-BMW > addition trip of C-A MW
•Level third: Power flow is between DMW- CMW > additional trip of D-A MW
5-35
◆Base on the preposition, rough study was carried out for the possibility forintroduction of higher middle system voltage compared to current 150kV voltage.
The Current Demand Density by Area◆Rough Assumption of heavy load demand area in Indonesia Demand Density
and possible length of dispatching line[Tolerable Current of Dispatching line - > 300A]
Current FutureDensity(Length) 5MVA/km*2 (6km) 20MVA/km*2(3km)
GWh km2
rovinsi Residence Industry Commercial Social Gov't
Offices Public Total Area kW/km2
Bali 951.93 87.38 938.67 38.83 60.42 47.80 2125.03 5449.37 59
Jawa Timur 6574.85 8737.33 2016.17 408.41 169.62 416.72 18323.11 46689.64 60 awa Tengah dan Yogyakarta 6121.55 4040.69 1274.14 384.02 118.4 475.01 12415.81 35932.86 53
Jawa Barat dan Banten 9343.1 17761.26 2363.94 398.34 186.15 246.01 30298.80 45943.69 100
Middle Power System for Dispatching - Sample Concept for reference-
5-36
36
5. Power System Plan
Example of Dispatching System
5-37
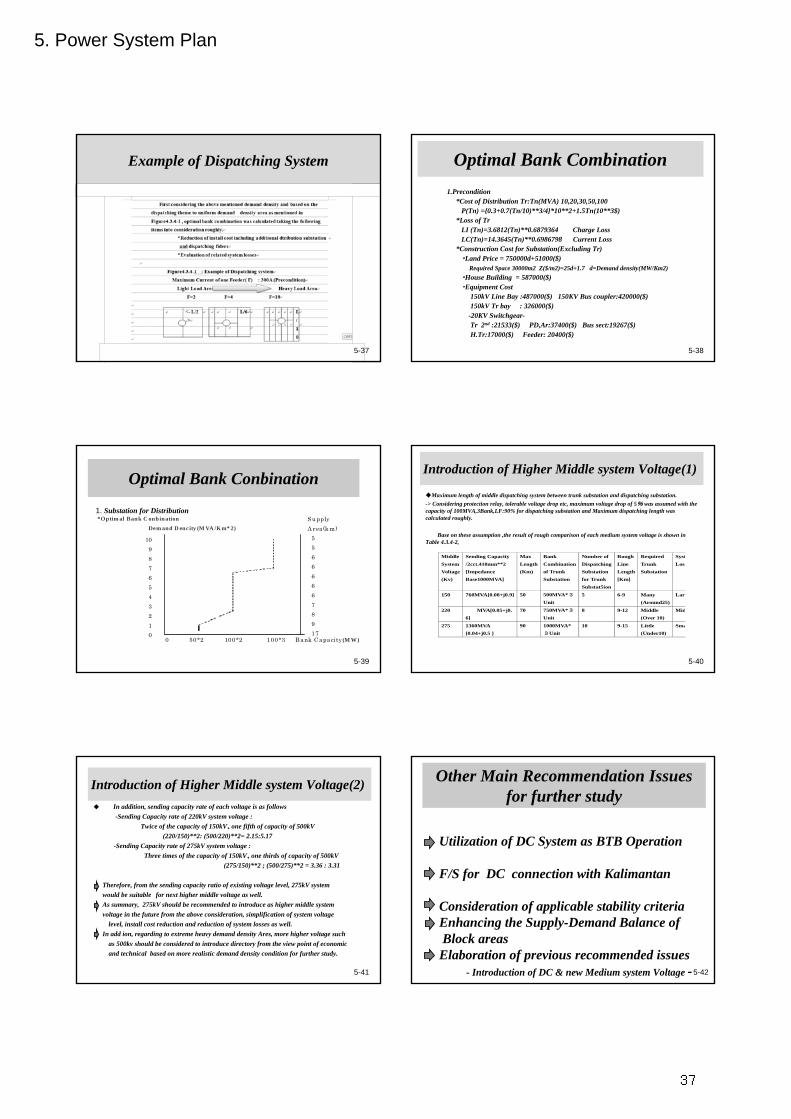
Optimal Bank Combination1.Precondition
*Cost of Distribution Tr:Tn(MVA) 10,20,30,50,100P(Tn) ={0.3+0.7(Tn/10)**3/4}*10**2+1.5Tn(10**3$)
*Loss of TrLI (Tn)=3.6812(Tn)**0.6879364 Charge LossLC(Tn)=14.3645(Tn)**0.6986798 Current Loss
*Construction Cost for Substation(Excluding Tr)・Land Price = 750000d+51000($)
Required Space 30000m2 Z($/m2)=25d+1.7 d=Demand density(MW/Km2)・House Building = 587000($) ・Equipment Cost
150kV Line Bay :487000($) 150KV Bus coupler:420000($)150kV Tr bay : 326000($)
-20KV Switchgear-Tr 2nd :21533($) PD,Ar:37400($) Bus sect:19267($)H.Tr:17000($) Feeder: 20400($)
5-38
*Optim al Bank C onbination Dem and D enc ity (M VA /Km* 2)
10 9 8 7 6 5 4 3 2 1 0
0 50*2 100*2 100*3 B ank C apaci ty (M W)
S u pply A rea(k m)
5 5 6 6 6 6
6 7 8 9 17
Optimal Bank Conbination
1. Substation for Distribution
5-39
◆Maximum length of middle dispatching system between trunk substation and dispatching substation.-> Considering protection relay, tolerable voltage drop etc, maximum voltage drop of 5% was assumed with the capacity of 100MVA,3Bank,LF:90% for dispatching substation and Maximum dispatching length was calculated roughly.
Base on these assumption ,the result of rough comparison of each medium system voltage is shown in Table 4.3.4-2,
Introduction of Higher Middle system Voltage(1)
Middle
SystemVoltage(Kv)
Sending Capacity
/2cct.410mm**2 [Impedance Base1000MVA]
Max
Length(Km)
Bank
Combination of Trunk Substation
Number of
Dispatching Substation for Trunk
Substat5ion
Rough
Line Length [Km]
Required
Trunk Substation
Syst
Loss
150 760MVA[0.08+j0.9] 50 500MVA*3
Unit 5 6-9 Many
(Around25)Larg
220 MVA[0.05+j0.6]
70 750MVA*3
Unit 8 9-12 Middle
(Over 10) Mid
275 1360MVA [0.04+j0.5 ]
90 1000MVA*3Unit
10 9-15 Little (Under10)
Sma
5-40
◆ In addition, sending capacity rate of each voltage is as follows-Sending Capacity rate of 220kV system voltage :
Twice of the capacity of 150kV、one fifth of capacity of 500kV(220/150)**2: (500/220)**2= 2.15:5.17
-Sending Capacity rate of 275kV system voltage :Three times of the capacity of 150kV、one thirds of capacity of 500kV
(275/150)**2 ; (500/275)**2 = 3.36 : 3.31
Therefore, from the sending capacity ratio of existing voltage level, 275kV system would be suitable for next higher middle voltage as well.As summary, 275kV should be recommended to introduce as higher middle system voltage in the future from the above consideration, simplification of system voltage
level, install cost reduction and reduction of system losses as well.In add ion, regarding to extreme heavy demand density Ares, more higher voltage such
as 500kv should be considered to introduce directory from the view point of economicand technical based on more realistic demand density condition for further study.
Introduction of Higher Middle system Voltage(2)
5-41
Utilization of DC System as BTB Operation
F/S for DC connection with Kalimantan
Consideration of applicable stability criteriaEnhancing the Supply-Demand Balance of Block areasElaboration of previous recommended issues
- Introduction of DC & new Medium system Voltage -
Other Main Recommendation Issuesfor further study
5-42
37
5. Power System Plan
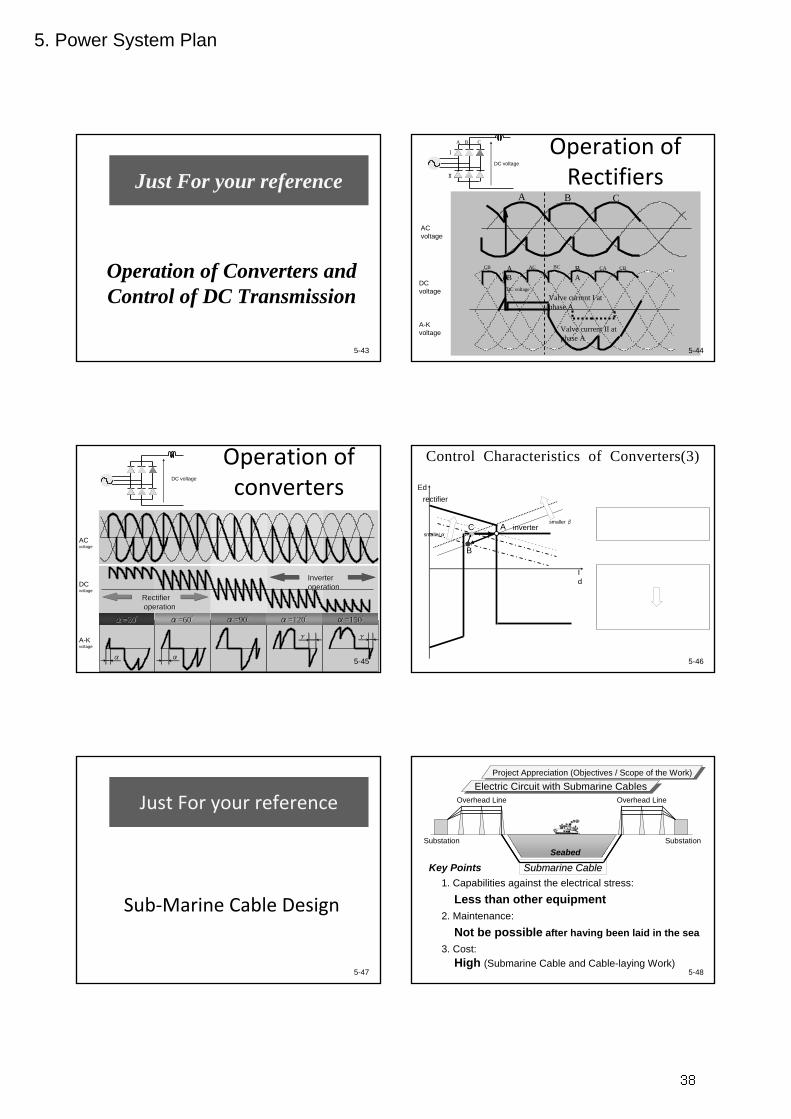
Operation of Converters and Control of DC Transmission
Just For your reference
5-43
Operation of Rectifiers
A B C
AB
BA
AC CABC CBCB
DC voltage
Valve current I at phase A
AA BB CC
ⅠⅠ
ⅡⅡ
AC voltage
DC voltage
A-K voltage
DC voltage
Valve current II at phase A
5-44
αα=90=90 ゚゚αα=60=60 ゚゚
Operation of converters
αα αα
αα=120=120 ゚゚ αα=150=150 ゚゚
γγ
αα=30=30 ゚゚
AA--KKvoltagevoltage
γγ
Rectifier Rectifier operationoperation
InverterInverteroperationoperation
DC voltage
ACvoltage
DCvoltage
5-45
Ed
Id
rectifier
inverterA
B
Csmallerα
smaller β ( )指令値dd IIK −= 1α
( )dd EEK −= 指令値2α
( )指令値dd EEK −+= 2πβ
βπα −=
Control Characteristics of Converters(3)Control Characteristics of Converters(3)
5-46
Sub‐Marine Cable Design
Just For your reference
5-47
Substation Substation
Overhead Line Overhead Line
Seabed
Submarine Cable
Electric Circuit with Submarine Cables
Less than other equipment
Not be possible after having been laid in the sea
High (Submarine Cable and Cable-laying Work)
1. Capabilities against the electrical stress:
2. Maintenance:
3. Cost:
Key Points Submarine CableSubmarine Cable
Project Appreciation (Objectives / Scope of the Work)
5-48
38
5. Power System Plan
Measuring Width
Depth
Fish
Side Scanning Sonar
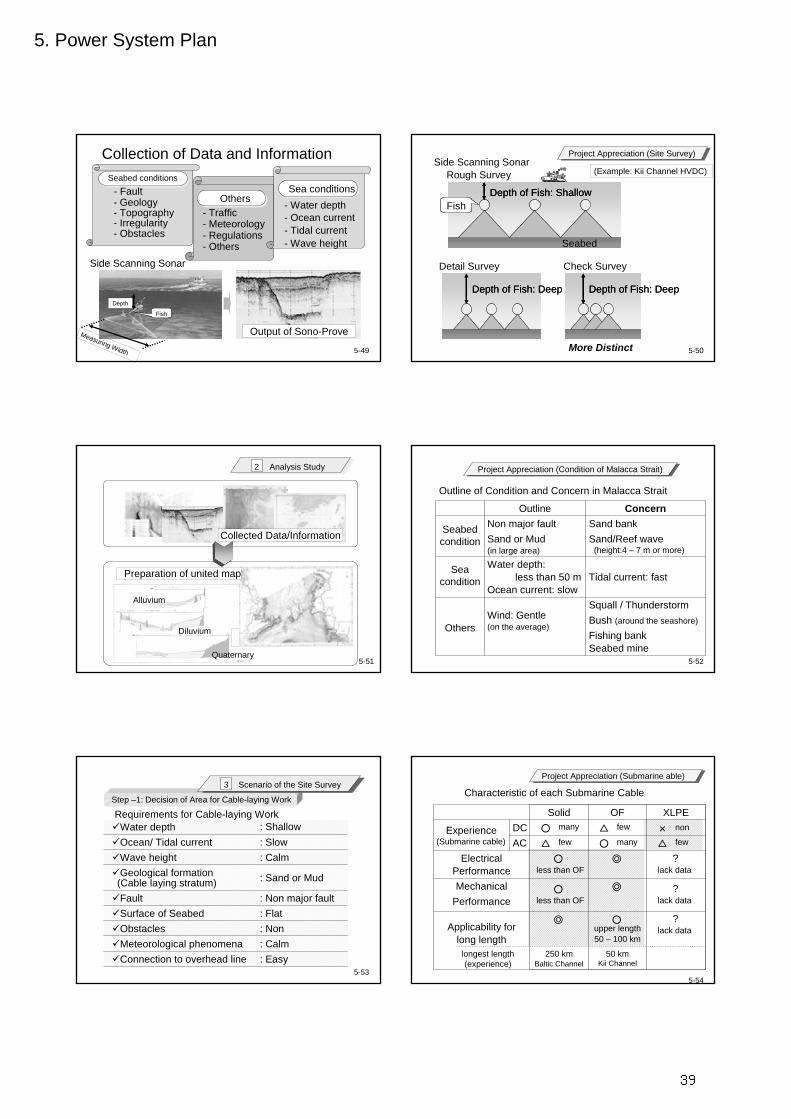
Collection of Data and InformationSeabed conditions
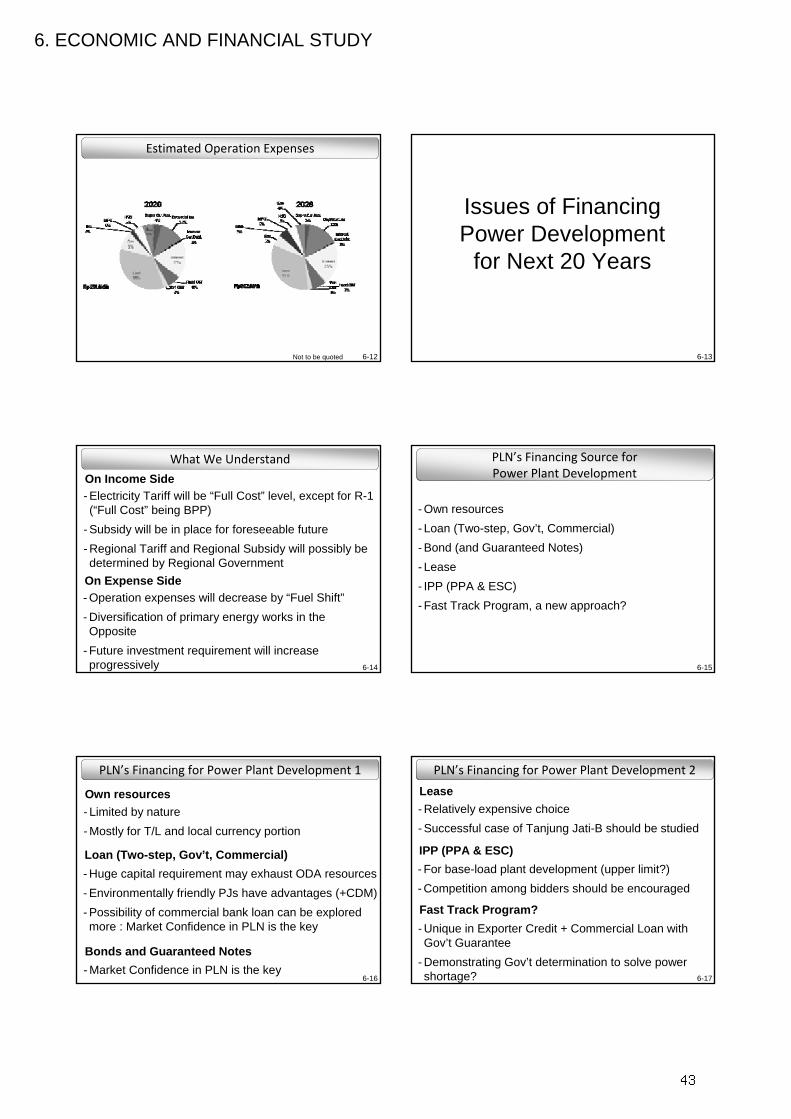
- Electricity Tariff will be “Full Cost” level, except for R-1(“Full Cost” being BPP)
- Subsidy will be in place for foreseeable future- Regional Tariff and Regional Subsidy will possibly be determined by Regional Government
On Income Side
- Operation expenses will decrease by “Fuel Shift”- Diversification of primary energy works in the Opposite
- Future investment requirement will increase progressively
On Expense Side
6-15
PLN’s Financing Source for Power Plant Development
- Own resources- Loan (Two-step, Gov’t, Commercial)- Bond (and Guaranteed Notes) - Lease- IPP (PPA & ESC)- Fast Track Program, a new approach?
6-16
PLN’s Financing for Power Plant Development 1
- Limited by nature- Mostly for T/L and local currency portion
Own resources
Loan (Two-step, Gov’t, Commercial)- Huge capital requirement may exhaust ODA resources- Environmentally friendly PJs have advantages (+CDM)- Possibility of commercial bank loan can be explored more : Market Confidence in PLN is the key
Bonds and Guaranteed Notes- Market Confidence in PLN is the key
6-17
PLN’s Financing for Power Plant Development 2
- Relatively expensive choice- Successful case of Tanjung Jati-B should be studied
Lease
IPP (PPA & ESC)- For base-load plant development (upper limit?)- Competition among bidders should be encouraged
Fast Track Program?- Unique in Exporter Credit + Commercial Loan with Gov’t Guarantee
- Demonstrating Gov’t determination to solve power shortage?
43
6. ECONOMIC AND FINANCIAL STUDY
6-18
Issues of BPP 1
- Being Basis of Tariff, determines PLN’s Income- Including only Depreciation cost as capital expense component
- Only value of depreciating (= existing) facilities- Does not allow for the cost of rapidly expanding future facilities
Current BPP
6-19
Issues of BPP 2
- Raising level of BPP to allow for future investment,realizing “Consumer Supported Financing”
- Amendment to regulations on PLN’s accounting is necessary, e.g., “accelerated depreciation” for definite period
- Another way of showing Government determination- Market confidence would be bolstered, which may ease difficulties of seeking finance from commercial banks
Change to New BPP
6-20
Strategy for Financing Power Development
- ODA loans for environmentally friendly projects (low CO2 emission + due consideration on social/ environmental impacts)
- Possibility and benefit of CDM must be exploited- Improving investment climate (environment) for both domestic and foreign capital, to encourage IPP
- Revising BPP to allow for future investment need- Operation cost must be minimized to gain consumers support for raised tariff(BPP) by introduction of better facility management schemes (eg.asset management)
- Other possibility, Lease and Fast Track, should be studied for further applications
44
7. STRATEGIC ENVIRONMENT ASSESSMENT
SPEAKER: MR. OHWADA TAKASHI,
JAPAN NUS CO., LTD
45
7. Environmental & Social Considerations
7-1
Incorporate Environmental & Social Considerations into the Study on the Optimal Electric Power Development in Java-Madura-Bali Area through Strategic Environmental Assessment (SEA)(= Optimal Electric Power Development Scenario should not be identified solely for economic & engineering reasons)
Objective
Environmental & Social Considerations
7-2
♦ What is Strategic Environmental Assessment (SEA)?
Constrained to Specific ProjectsGreater Flexibility for Alternatives
Difficult to Consider Cumulative ImpactsCan Consider Cumulative Impacts
Difficult to Consider Synergistic ImpactsCan Consider Synergistic Impacts
Site and Project SpecificArea Basis and/or Long-Term
Specific AssessmentGeneral Assessment
Applied to Individual Projects(Downstream of Decision-Making)
Applied to Policy, Plans & Programs(Upstream of Decision-Making)
Environmental Impact Assessment (EIA)
Strategic Environmental Assessment (SEA)
7-3
♦ What to do in SEA of Power Sector?
Identify Potential Environmental Impacts associated with each Type of Power Generationex. SO2, NOx, PM, CO2 from Coal-Fired,
Loss of Habitats/Involuntary Resettlement for Hydro, Radiation from Nuclear, H2S from Geothermal
Recommend Measures to Prevent/Reduce/Mitigate Potential Environmental Impactsex. FGD, Low-NOx Burner, ESP for Coal-Fired,
Cooling Tower to reduce Thermal Effluents from Thermal, Information Disclosure to obtain Consent for Resettlement for Hydro
7-4
♦ What is Outcome of SEA?
Provide Input to Identification of Alternative Electricity Development Scenarios to Avoid Significant Environmental Impacts
Recommend Environmental Protection Measures to the Optimal Electric Power Development Scenario to Make it Environment-Friendly
7-5
♦ Can SEA suggest the maximum capacity of coal-fired power generation to be allowed in Jamali ?
[Unfounded Upper Limits in Several Reports]
1. How can we assess impacts on air quality when we do not know locations of individual P/Ss?
Extension of existing P/Ss may deteriorate local air quality down to unacceptable levels, while construction of the same capacity at new locations as new P/Ss may not pose threats to the health.
7-6
♦ Can SEA suggest the maximum capacity of coal-fired power generation to be allowed in Jamali ?
[Unfounded Upper Limits in Several Reports]
2. How can we assess impacts of coal-fired P/S when we do not know the present level of air pollution?
We can not accommodate coal-fired P/S at location with serious air pollution.
46
7. Environmental & Social Considerations
7-7
♦ How to predict local air quality under operation of new P/S?
Acceptable Increase = Air Quality Standard – Present Air Quality
Present Air Pollution
Present Air Pollution
Present Air Quality
Increase by New P/S
Future Air Quality
Acceptable Increase
Air Quality Standard
7-8
♦ Can SEA suggest the maximum capacity of coal-fired power generation to be allowed in Jamali ?
[Unfounded Upper Limits in Several Reports]
3. How can we assess impacts on air quality when we do not know efficiency of ESP at each P/S?
We can accommodate more P/Ss in Jamali, if more efficient ESP is introduced to them (This is also the case for FGD and Low-NOx burner).
7-9
♦ Can SEA suggest the maximum capacity of coal-fired power generation to be allowed in Jamali ?
[Unfounded Upper Limits in Several Reports]
4. How can we set a limit on CO2 emission from P/Ss when Indonesia does not have a legally-binding target for its CO2 emission reduction under Kyoto Protocol?
Indonesia reserves a right to emit CO2 for its industrial development. We can not limit the maximum CO2 emission from power generation.
7-10
♦How can we “reduce” CO2 emission from thermal power generation?
[Efficient use of fuel]
1) Improvement of generation efficiency.
2) Natural gas than oil. Oil than coal.
[Recovery of CO2]
1) CCS (Carbon Capture & Storage)
2) CO2 sequestration by forests
7-11
♦ Can SEA suggest the maximum capacity of coal-fired power generation to be allowed in Jamali ?
[To Justify the Maximum Acceptable Capacity]
We need to know;
1) Locations of individual P/Ss, and
2) Present level of air pollution, and
3) Efficiency of ESP, FGD and Low-NOx Burner, or
4) CO2 emission reduction target for the power sector.
7-12
♦ Does hydroelectric power generation suppress global warming?
[HEPPs may NOT be “clean” as we thought]
1. All reservoirs of HEPPs release CH4 into the atmosphere.
Influx of excessive nutrients to reservoir →Proliferations of phytoplankton/floating plants →
Anaerobic decomposition → CH4 emission
47
7. Environmental & Social Considerations
7-13
♦ Does hydroelectric power generation suppress global warming?
[HEPPs are NOT always friendly to the earth]
2. CH4 has GWC (Global Warming Coefficient) of 21.
(1 ton of CH4 = 21 tons of CO2)
Too much CH4 emission from reservoir →
Offset CO2 emission reduction by HEPP →
HEPP will be an emission source of GHG7-14
♦ Does hydroelectric power generation suppress global warming?
[Some HEPPs may be emission source of GHG]
As results,
We can not rely CO2 emission reduction solely on
HEPP.
HEPP with a large reservoir can not be registered as CDM project.
7-15
♦ Is geothermal power generation environment-friendly?
[No emission of SO2, NOx, PM and CO2
from geothermal power generation]
But,
H2S emission → Offensive odor, corrosion of metal,
negative impacts on local vegetation.
As and Hg effluent → Toxic to aquatic fauna.
7-16
♦ Why is geothermal power generation promoted?
[Geothermal power generation is notnecessarily environment-friendly]
Geothermal power generation has its specific environmental problems, and it is promoted because geothermal energy is domestic energy.
48
8. POWER DEVELOPMENT SCENARIO
SPEAKER: MR. YAMAOKA SATOSHI,
NEWJEC INC.
49
8. Power Development ScenarioPower Development Scenario
8-1
Power Development ScenarioPower Development Scenario
8-2
ContentsContents
1 Concept
2 Base scheme
3 Optimization study
4 Suggestion for follow-up projects
8-3
Power source development scenario
Transmission system development scenario
Strategic environmental assessment
Demand forecast
Power development Base scheme scenario
Alternative scenario and optimization
Flow chartfor
Alternative Scenario and optimization
1. Concept
8-4
TargetTarget
✦Oil free to avoid high oil fuel price
✦Annual demand increase 6.5 %
✦Reserve margin 30 %
✦More capacity: 22.3 GW in 2006 to 81.2 GW in 2028, 3.64 times
✦More production energy:104.8 TWh in 2006 to 406.6 TWh in 2028, 3.88 times
8-5
Elements Elements
Generation Cost
Globalenvironmental
Impact Best Mix of Power
Sources
More power Fuel Cost
System Reliability
System Stability
Strategic environmentalassessment
Construction Cost
More energy
8-6
Power sources Power sources
Current players
Sources Base Middle Peak
Coal
Geothermal
Small hydro
Gas
Oil
Reservoir hydro
50
8. Power Development ScenarioPower Development Scenario
8-7
Power SourcesPower Sources
Future playersSources Base Middle Peak
CoalGeothermalSmall hydro
Reservoir hydroGas (LNG)
OilPumped Storage
NuclearSolar, wind, biomass
Transmit from Sumatra
8-8
Plan Plan
Sources Development Plan
Coal
Main substitution for oil, but base load
FTP is on-going, 6,900 MW in Jamali by 2010/11
Low rank domestic coal will be applied.
IssuesProcurement is uncertain.
Logistics shall be established.
Common use of existing infrastructure is economic in extension of running plants.Environmental impact, air pollution is anticipated.
8-9
Sources Development Plan
Natural Gas
LNG enables peak load supply.
Three gas plants, MK, MT, TP, total 1,678 MW are on going.
Bojanegara CC, 4@750 MW, is planned.
Issues
Procurement is uncertain.
LNG logistics shall be established.
Less air pollution than coal.
Plan Plan
8-10
Sources Development Plan
Geothermal
To be advanced in policy, 5 % on energy basis.Existing 835 MW , prioritized 785 MW, and feasible 2,015 MW, total 3,635 MW.
Capacity ratio 5 % will be attainable in 2025.
IPPs are expected more than PLN’s own development.
IssuesHigh initial cost, but fuel is domestic.
Sites are in protected areas.
No CO2 emission.
Plan Plan
8-11
Sources Development Plan
Hydro
Large potential of reservoir type and run-of-river.No reservoir type constructed after Cirata II, 1998.
Potential studies executed before 1998.
Issues
High initial cost, but no fuel cost.
LARAP is essential.
Clean energy, no CO2 emission.
Plan Plan
8-12
Sources Development Plan
Pumped Storage
Large potential of pumped storage in Jamali.
Upper Cisokan PS, 1000MW is ready for construction. Next PS shall be studied more.
Issues
Coal thermal power will be used for pumping.
Economic in combination with coal or nuclear.
LARAP is essential.
Clean energy, no CO2 emission.
Sea water PS has more environmental issues.
Plan Plan
51
8. Power Development ScenarioPower Development Scenario
8-13
Sources Development Plan
Nuclear
Base load supply with a large unit.
About 4,000 MW is assumed by 2028.
Delay from road map, first unit operation later than 2018.
Issues
High initial cost, but low fuel cost.
Safety assessment is essential.
Clean energy, no CO2 emission.
Plan Plan
8-14
Sources Development Plan
Biomass
Future base load supply.
Bio fuel or phytogenic waste
Primary energy target 5 % by 2025.
IssuesHigh fuel cost.
Logistics of fuel is challenging.
Clean energy, no CO2 emission.
Plan Plan
8-15
Sources Development Plan
Renewable;small hydro, solar & wind
Future base load supply.
Primary energy target 3 % by 2025.
More studies needed for site identification.
IssuesHigh initial cost, but no fuel cost.
Clean energy, no CO2 emission.
Plan Plan
8-16
Sources Development Plan
Transmission from
Sumatra
Future base load supply.
Capacity 3,600 MW in mine-mouth coal in Sumatra.
Transmit 3,000 MW to Jamali in 2015.
IssuesFuture expansion plan of DC transmission line.
High initial cost.
No air pollution in Jamali.
Plan Plan
8-17
2. Base Scheme2. Base Scheme
Long term target: Follow primary energy policy or power generation development plan that Indonesian government or PLN has announced.
Short term target : Oil fuel use is suppressed.
8-18
Target of Primary Energy Consumption for Target of Primary Energy Consumption for Power SectorPower Sector
8. Power Development ScenarioPower Development Scenario
8-19
Change of primary energy consumption by Change of primary energy consumption by fuel (base scheme)fuel (base scheme)
Year 2006
Coal43%
Geothermal4%
Hydro6%
Gas17%
Oil30%
104.8 TWh
Year 2028
Transmit fromSumatera
6-9%Others (Nuclear)4-9%
Gas12-19%
Oil0.2-3%
Coal56-66%
Geothermal5-7%
Hydro4-8%
406.6 TWh
3.9 times
8-20
3. Optimization Study 3. Optimization Study
Scheme 1: Low energy
production cost
Scheme 3:Less global
environmental Impact
Scheme 2: Reliable and
stable system
Best Mix of Power Sources
8-21
Power development target (2028)Power development target (2028)for Base scheme for Base scheme
Sources
Scenario
Oil Coal Gas Geo-thermal Hydro Pumped
storage Nuclear Renew-able
Present 2006
Capacity rate
2006(%)29 39 17 3.5 11.5 0 0 0
Energy rate 2006
(%)30.4 43.2 3.7 3.7 5.9 0 0 0
Base Scheme
Energy rate 0.2 % due
to PLN target.
Energy rate 56-66 % due to policy.
Energy rate 12 %
due to policy and on-going projects.
Energy rate 5 % due to policy and feasible capacity.
Energy rate 4-8 % due to policy.
Due capacity
developed for peak according to WASP.
Capacity rate 5-7 %,
4-5 GW due to
roadmap.
Negligible.
8-22
Power development target (2028)Power development target (2028)in Scheme 1in Scheme 1::
lower generation cost lower generation cost (Priority to coal) (Priority to coal)
Sources Oil Coal Gas Geo-thermal Hydro Pumped
storage nuclear Renew-able
Target
Energy rate 0.2 % due to PLN
target.
Energy rate 70 %
because of cheap fuel.
Positively developed.
Capacity rate 10 % because of expensive
fuel. Not
positive.
Capacity 1,620 MW, 2% added
with feasible 785 MW.
Energy rate down
to 2 % due to
high initial cost. Not
positive.
Due capacity
developed for peak according to WASP.
Capacity up to 5
GW (7%) due to cheap
production cost.
Negligible due to
expensive production
cost.
8-23
Power development target (2028)Power development target (2028)in Scheme 2:in Scheme 2:Reliable and stable power supply systemReliable and stable power supply system
Sources Oil coal Gas Geo-thermal hydro Pumped
storage nuclear Renew-able
Target
Energy rate 2-3 % to keep a source.
Cover power
shortage.
Energy rate 19 %,
positively developed using LNG
Available capacity 3.6 GW, 5 %, positively
developed.
Energy rate 4-8 %,
storage type
developed.
Due capacity
developed for peak according to WASP.
Capacity 5 GW
(7%) to diversify sources.
Energy rate 4 %,
solar, wind and biomass,
to diversify sources.
8-24
Power development target (2028)Power development target (2028)in Scheme 3: in Scheme 3: Less global environmental impactLess global environmental impact
Sources Oil coal Gas Geo-thermal hydro Pumped
storage nuclear Renew-able
Target
Energy rate 2-3 % to keep a source.
Cover shortage, at least 18 %
capacity after FTP.
Energy rate 19 %,
positively developed using LNG.
Available capacity 3.6 GW, 5 %, positively developed.
Energy rate 4-8 %, to
be developed.
Due capacity
developed for peak according to WASP.
Capacity 5 GW
(7%) to reduce
CO2 emission.
Energy rate 5 % by solar
and wind, and 2 %
by biomass.
53
8. Power Development ScenarioPower Development Scenario
8-25
Energy Production Ratio by Fuel in ScenariosEnergy Production Ratio by Fuel in Scenarios(Total 406.6 TWh, 2028)(Total 406.6 TWh, 2028)
0
20
40
60
80
100
Base Less expensive More reliable Environmentoriented
Alternative senario
Fuel
ratio
%
coal gas oil hydro geothermal renewable nuclear transmit (Sumatera)
more coal
morediversified
morerenewable
Scheme 1Base Scheme Scheme 2 Scheme 3
8-26
4. Suggestion for Follow4. Suggestion for Follow--up Projectup Project
✦ gas storage; LNG or CNG,
✦ infrastructure to procure coal,
✦ hydropower plants including pumped storage,
✦ Java-Kalimantan interconnection,
✦ direct current transmission line project in Jamali region.