39 th SAW 145 Assessment Report APPENDIX 1. MEASUREMENT ERRORS IN SHELL HEIGHT MEASUREMENTS FROM VIDEO AND DREDGE SURVEYS The School of Marine Science and Technology (SMAST) at the University of Massachusetts, Dartmouth and the Northeast Fisheries Science Center (NEFSC) carried out collaborative experiments during February 2004 to characterize potential measurement errors in sea scallop shell height data collected during video and dredge surveys. Measurement errors are present to varying degrees in all types of survey data and it is important to know if they are large enough to affect stock assessment results and fisheries management advice. Data sets with measurement errors may provide information not elsewhere available and it is usually possible to accommodate measurement errors, once they are quantified, using modern stock assessment modeling techniques. For example, SMAST video data are valuable because they likely sample scallops over a broad range of lengths (80+ mm) with high and constant efficiency. The NEFSC survey dredge, for example, has lower efficiency for large scallops that must be accommodated when using dredge survey data. Even large measurement errors may be tolerated if large quantities of data can be collected inexpensively. In any case, decisions about how to interpret and use data are easier to make once the nature of any measurement errors is determined. Shell height data are an important element in stock assessment work for sea scallops because shell heights are converted to meat weights that are used to calculate stock biomass. Meat weight increases as a cubic function of shell height so that doubling the shell height of a sea scallop would, for example, increase its meat weight by about 8– fold. Thus, relatively small errors in shell height data might result in significant under- or over estimation of stock biomass. Moreover, maximum shell height and shell height composition data are used to estimate growth and mortality parameters used in estimating stock status and in calculating biological reference points used by managers. The SMAST/NMFS study was designed to measure two types of measurement errors: 1) errors that systematically bias shell height data so that measurements are consistently lower or higher than actual shell height, and 2) random measurement errors that increase the variability of shell height measurements making them higher or lower than the actual shell height without affecting the mean. Both types of errors are potentially important. The former tend to bias stock biomass estimates. Effects of the latter are more complex. Random errors obscure information about growth and recruitment strength in shell height composition data, by shifting scallops from modal shell height groups to adjacent shell height groups (i.e. by “smoothing” the length composition). Large random measurement errors may artificially increase the apparent abundance of very large or small scallops. The rapidly increasing nature of shell height- meat weight relationships in scallops means that a 10% increase in shell height generates a change in meat weight that is larger than the decrease in meat weight from a 10% decrease in shell height. Consequently, biomass estimates will be biased with symmetrical (equal positive and negative) random errors in shell heights data.
Transcript
39th SAW 145 Assessment Report
APPENDIX 1. MEASUREMENT ERRORS IN SHELL HEIGHT MEASUREMENTS FROM VIDEO AND DREDGE SURVEYS
The School of Marine Science and Technology (SMAST) at the University of
Massachusetts, Dartmouth and the Northeast Fisheries Science Center (NEFSC) carried out collaborative experiments during February 2004 to characterize potential measurement errors in sea scallop shell height data collected during video and dredge surveys. Measurement errors are present to varying degrees in all types of survey data and it is important to know if they are large enough to affect stock assessment results and fisheries management advice. Data sets with measurement errors may provide information not elsewhere available and it is usually possible to accommodate measurement errors, once they are quantified, using modern stock assessment modeling techniques. For example, SMAST video data are valuable because they likely sample scallops over a broad range of lengths (80+ mm) with high and constant efficiency. The NEFSC survey dredge, for example, has lower efficiency for large scallops that must be accommodated when using dredge survey data. Even large measurement errors may be tolerated if large quantities of data can be collected inexpensively. In any case, decisions about how to interpret and use data are easier to make once the nature of any measurement errors is determined.
Shell height data are an important element in stock assessment work for sea
scallops because shell heights are converted to meat weights that are used to calculate stock biomass. Meat weight increases as a cubic function of shell height so that doubling the shell height of a sea scallop would, for example, increase its meat weight by about 8–fold. Thus, relatively small errors in shell height data might result in significant under- or over estimation of stock biomass. Moreover, maximum shell height and shell height composition data are used to estimate growth and mortality parameters used in estimating stock status and in calculating biological reference points used by managers.
The SMAST/NMFS study was designed to measure two types of measurement
errors: 1) errors that systematically bias shell height data so that measurements are consistently lower or higher than actual shell height, and 2) random measurement errors that increase the variability of shell height measurements making them higher or lower than the actual shell height without affecting the mean. Both types of errors are potentially important. The former tend to bias stock biomass estimates. Effects of the latter are more complex. Random errors obscure information about growth and recruitment strength in shell height composition data, by shifting scallops from modal shell height groups to adjacent shell height groups (i.e. by “smoothing” the length composition). Large random measurement errors may artificially increase the apparent abundance of very large or small scallops. The rapidly increasing nature of shell height-meat weight relationships in scallops means that a 10% increase in shell height generates a change in meat weight that is larger than the decrease in meat weight from a 10% decrease in shell height. Consequently, biomass estimates will be biased with symmetrical (equal positive and negative) random errors in shell heights data.
39th SAW 146 Assessment Report
The purpose of the collaborative SMAST/NEFSC experiments was to estimate measurement errors in shell height data collected routinely in video surveys and using measurement boards which have been used since the late 1970’s to collect shell height from scallops taken during NEFSC dredge surveys. For experiments, video and measuring board shell height measurements were compared with accurate shell height measurements made using scientific calipers. Caliper measurements are least affected by measurement errors and were used as a presumably accurate “standard” in data analysis. SMAST and NEFSC staff carried out all of the experimental work at the SMAST facility in New Bedford, analyzed the data, and prepared this report collaboratively. Materials and Methods
Shell height of a sea scallop is the longest distance between the umbo and the shell margin. The NEFSC scallop survey (Serchuk and Wigley, 1986) uses a measuring board to record shell heights to the nearest 5 mm interval. For example, a scallop with shell height = 54.7 mm falls into the 50.0-54.9 mm shell height group and, in the absence of any measurement errors, would be recorded as 52.5 mm in the NEFSC scallop survey. Measurement boards used in experiments were standard equipment actually used on scallop surveys. During surveys, a number of technicians measure scallops using different measurement boards (each scallop is measured once). All scallops are measured unless the tow is unusually large, in which case all scallops in a large random subsample are measured. These procedures reduce errors in characterizing shell height composition for survey catches due to subsampling. Errors may depend on the height of the technician to the extent that the technician’s eye will be higher above the board.
Scallops are placed on measuring boards with the umbo resting on the bottom of
the board and ventral valve (bottom shell) down (towards the board). Technicians sit with the board in the middle of their field of view and a tally device is used to record the number of scallops in each 5 mm interval. Measurement errors may occur because the ventral valve of scallop shells is rounded and the technician looks down at the shell margin (which lies above the board) towards the measurement marks. The shell may roll somewhat against the board. The technician may record a shell height observation using the wrong shell size group.
SMAST conducted video surveys during 1999-2003 using methods described by
Stokesbury et al. (2002) and Stokesbury et al. (2004). Briefly, a video camera mounted at the top of a steel pyramid-shape frame gives a 2.8 m2 image of the sea floor (in calculations, the assumed area is increased to 3.235 m2 to compensate for “edge” effects). Video survey stations are arrayed in a systematic pattern along the coast and four images are collected at each station. After the first image is collected, for example, the pyramid is raised so that the sea floor can no longer be viewed, the vessel is allowed to drift for approximately 50 m, and then the pyramid is lowered again to collect the second image. After the pyramid touches bottom, the field of view is allowed to clear before a video image is captured for analysis.
39th SAW 147 Assessment Report
Images of the sea floor are recorded on a high resolution S-VHS tape. The time, depth, number of scallops observed, and latitude and longitude from differential GPS are recorded for each image. Video survey gear includes an additional smaller camera mounted lower and on the side of the pyramid that is useful for identifying and counting small specimens. Experimental results for the small camera are not presented here because the large camera is used to obtain data most immediately useful for stock assessment work.
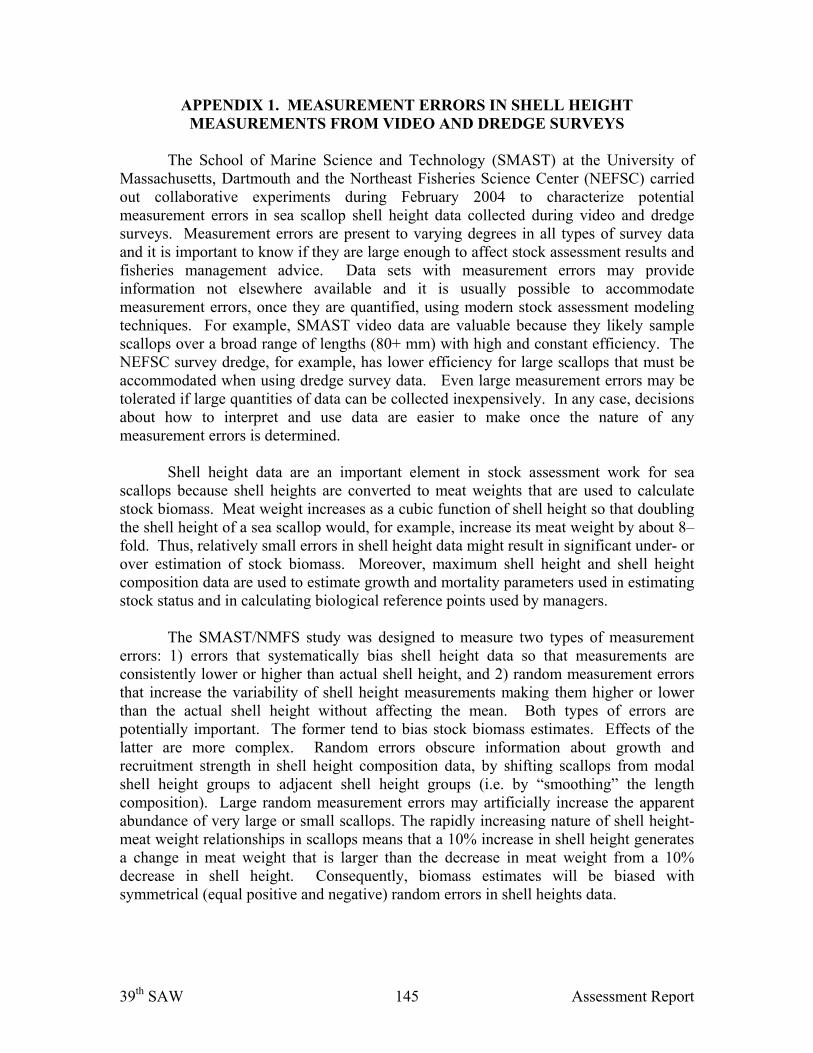
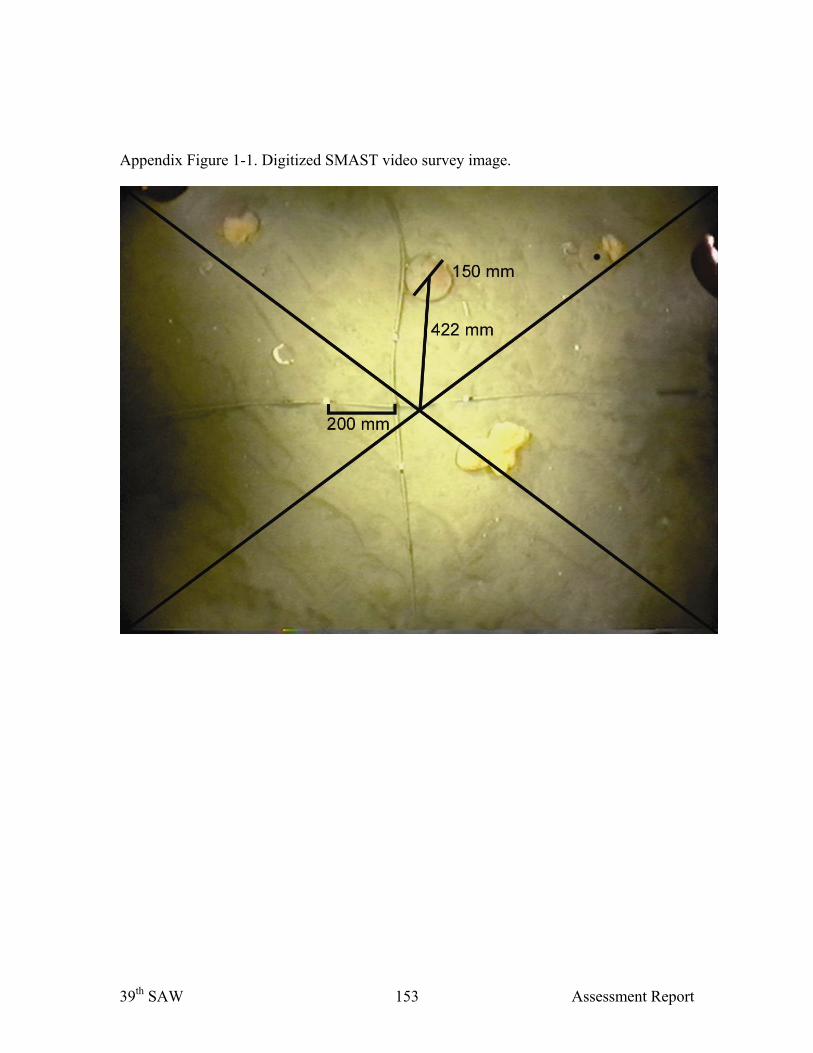
VHS video survey images (Appendix Figure 1-1) are replayed in the laboratory where a digitized image with each scallop uniquely identified is created using Image Pro Plus software. A technician placed the computer cursor on the umbo and the outer margin of each shell so that Image Pro calculated and the distance between the two points. Shell height data from video measurements are recorded to the nearest mm.
Measurement errors in video shell height measurements may arise from a variety
of factors. The maximum resolution of the video system is 3 mm due to pixel size so that, for example, a 100 mm scallop measured properly might be recorded as being 99 or 102 mm. There may be errors in cursor placement during the measurement process. Irregularities on the bottom and the angle of the scallop with respect to the camera may contribute to measurement errors.
Scallop shell height data from video images are affected by the distance between
the scallop and the center of the sampling frame because specimens further from the middle are also further from the camera. Other factors, such as lens curvature and resolution of video equipment, also appear important. Correction factors to adjust for distance from the middle of the sampling frame have been developed but are currently uncertain. Moreover, it is theoretically possible to make adjustments for bias but it is probably not possible to use correction factors to remove random errors from shell height data (a more promising approach is to include measurement errors in models fit to the data). For example Stokesbury et al. (2002) used a “step” correction factor and Stokesbury et al. (2004) used the “curve” correction factor:
2
22
)( y(y)(x)shc +
=
where: c = corrected shell height (mm) sh = original shell height (mm) o
y = vertical camera height from the base of the sampling pyramid x = distance from the center of the quadrant (mm).
Results for video data with and without the curve correction factor are presented in this report.
Damaged shell margins due to the survey dredge; previous encounters with commercial gear, and benthic predators may all cause measurement errors in shell height data from measurement boards, video gear and calipers. However, these factors had little
39th SAW 148 Assessment Report
effect on experimental data where the goal was to measure the shell heights (including broken edges) by various methods using the same scallops or scallop shells.
Measuring board and video shell heights for the same scallop or group of scallops
collected by different technicians were treated as independent observations in this analysis because the data from both surveys used in stock assessment modeling are single measurements from one technician. It should be possible to use the experimental data to quantify the component of variance in shell height data due to differences among technicians in both surveys. Some results of this analysis are relevant but the topic is outside the scope of this report.
Experiment I (live scallops)
Live scallops (n=393, caliper shell heights 56-141 mm) were collected by fishing
vessels during early February, taken to the laboratory and then divided in a haphazard fashion into ten groups with 24-61 individuals per group. Each group was held until needed in laboratory tanks filled with seawater inside mesh bags labeled 1-10 for identification. Scallops from one group at a time were placed haphazardly on sand and gravel spread under the video equipment in a large tank filled with seawater (sand and gravel were used to mimic some types of natural irregularities in the sea floor). Shell height data were collected from the video images using standard video survey procedures with four shell height measurements made independently for each specimen by four different persons. In addition to video measurements, all of the scallops in each group were individually measured once with calipers by one technician and once independently by each of three technicians using different measuring boards.
Mean shell height and shell height composition information for each type of
measurement, as well as scatter plots and linear regression were used to characterize bias and random errors. It was not possible to evaluate measurement errors for individual scallops in Experiment 1 because individual scallops in the experiment were not uniquely identified. It was possible to estimate bias as, for example, the mean shell height for board measurements minus the mean shell height for caliper measurements.
Experiment 2 (numbered scallops shells)
In the second experiment, the dorsal valve (top shell) of 172 individual scallop shells (caliper shell heights 39-192 mm) was marked with unique labels so that video, measurement board, and caliper shell heights could be compared for each individual shell. Labels were inside (under) the valve to prevent identification by technicians while measurements were taken. For video measurements, the shells were placed haphazardly on sand and gravel at the bottom of a tank filled with seawater. Two technicians (rather than four as in Experiment 1) were available for collecting measuring board shell height data during the second experiment.
39th SAW 149 Assessment Report
Results
Experiment 1 (live scallops)
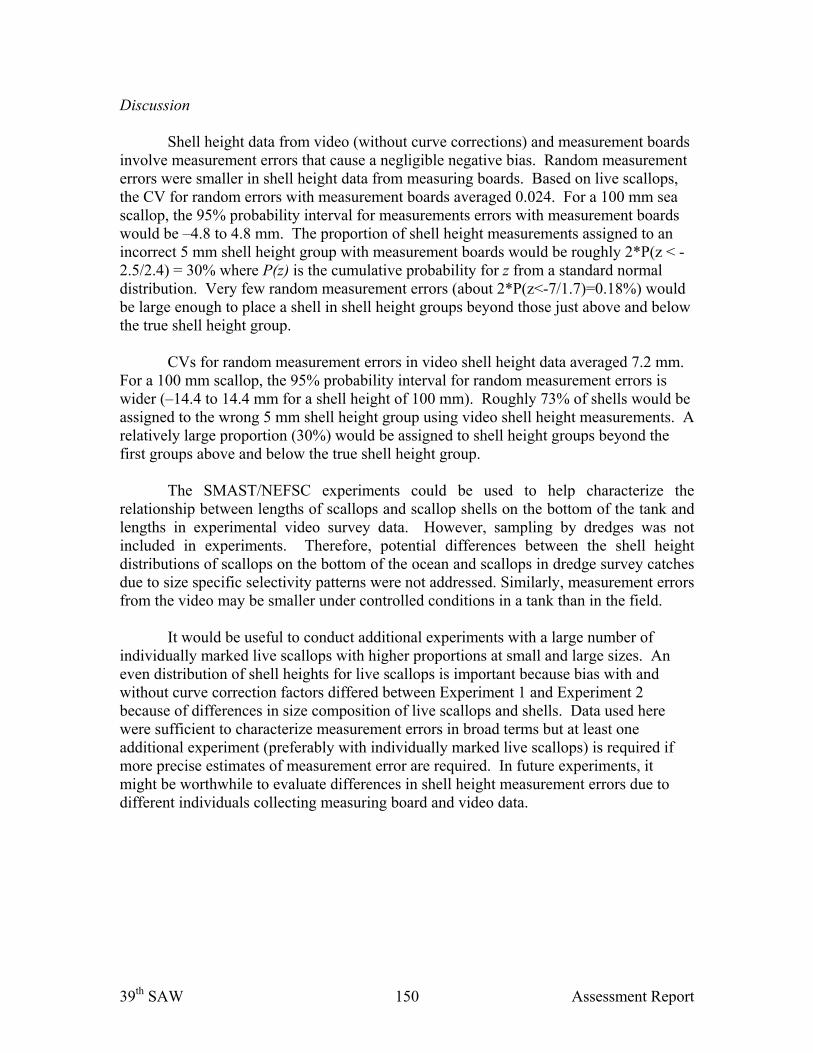
Shell height measurements by measuring boards all had a slight negative bias (-
0.4 to -0.9 mm, Appendix Table 1-1). Video measurements without the curve correction factor had a usually negative bias (–1.4 to 0.5 mm) while video measurements with the correction factor showed relatively high positive bias (3.3 to 5.4 mm).
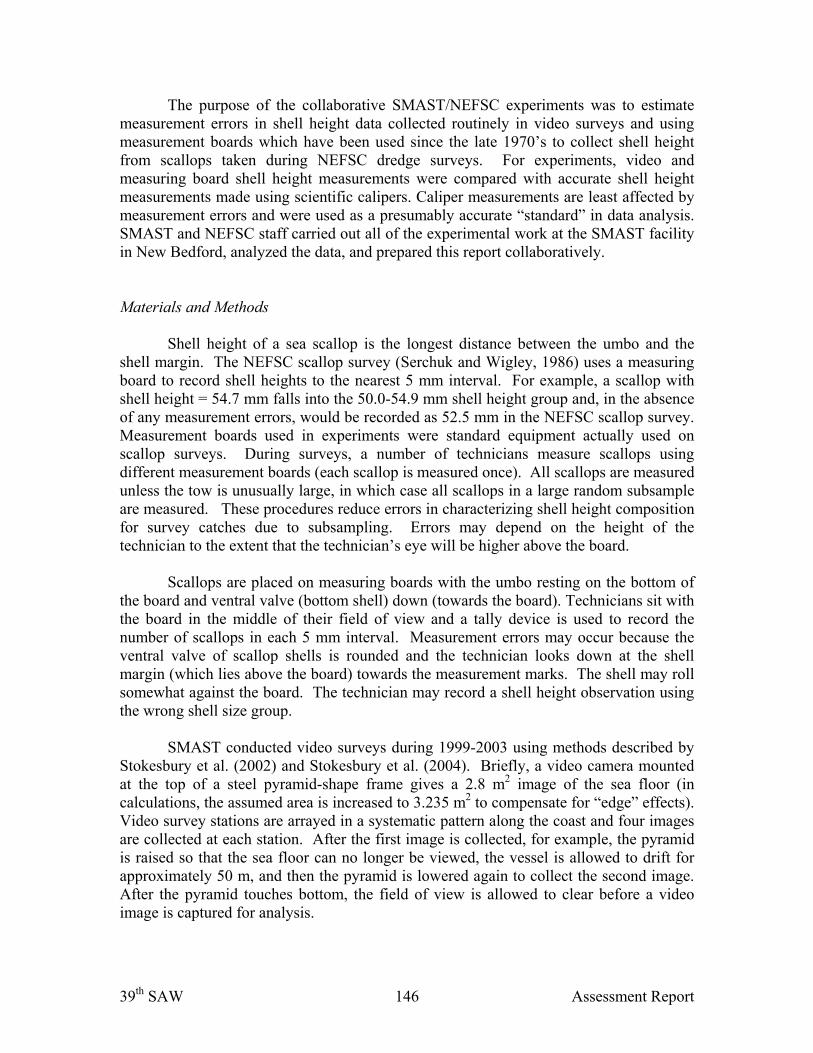
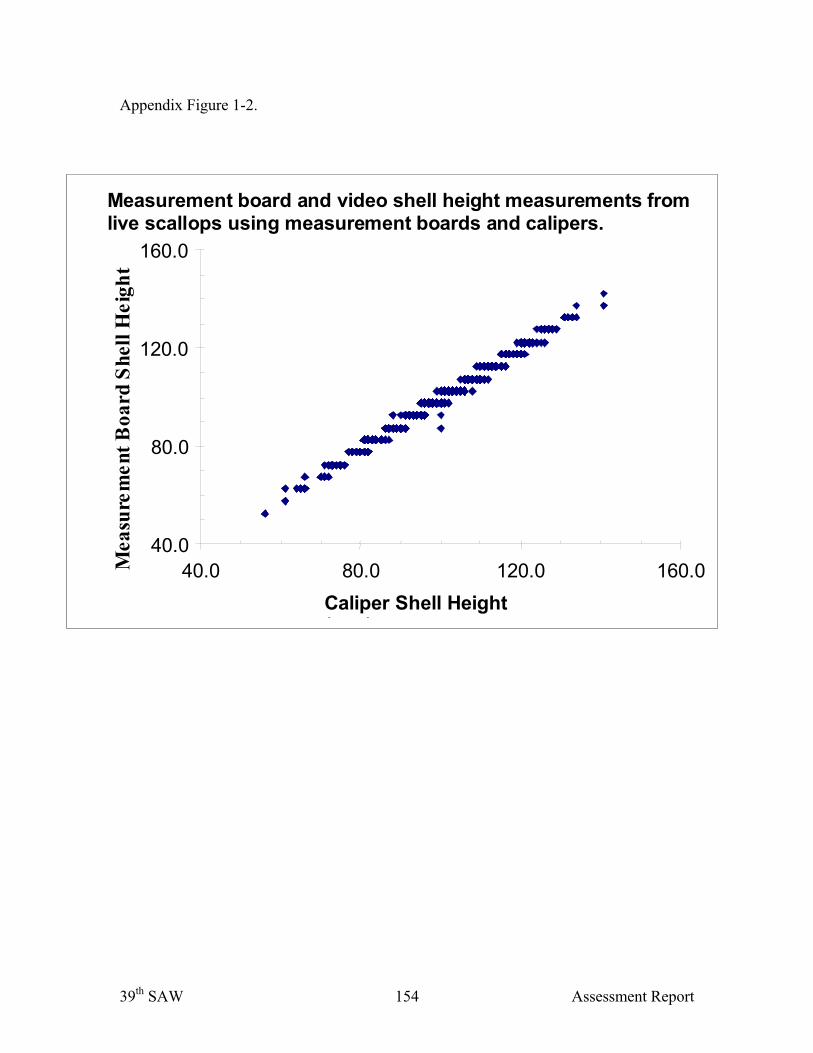
Shell heights from measuring boards were relatively precise (Appendix Figure 1-
2). Combining individual board and caliper measurements for all groups, the standard error of residuals around the regression line ( ) ( )videoboard SHSH lnln α= was 0.017 (α=0.998, R2=0.99). Assuming a multiplicative model with constant CV, these results indicate that the CV for measurement errors in board shell height data is about 1.7%. This technique was not applied to video data because it was not possible to link individual video and caliper shell height measurements for live scallops.
Experiment 2 (numbered scallops shells) Measurement errors for individually identified scallop shells in Experiment 2
were characterized by computing the mean and standard deviation of shell height differences for each shell (e.g. video shell height minus caliper shell height), and with Bland-Altman plots (Bland and Altman 1986; Bland and Altman 1995). Bland-Altman plots are designed to avoid spurious conclusions in comparing data with measurement errors to a relatively precise standard.
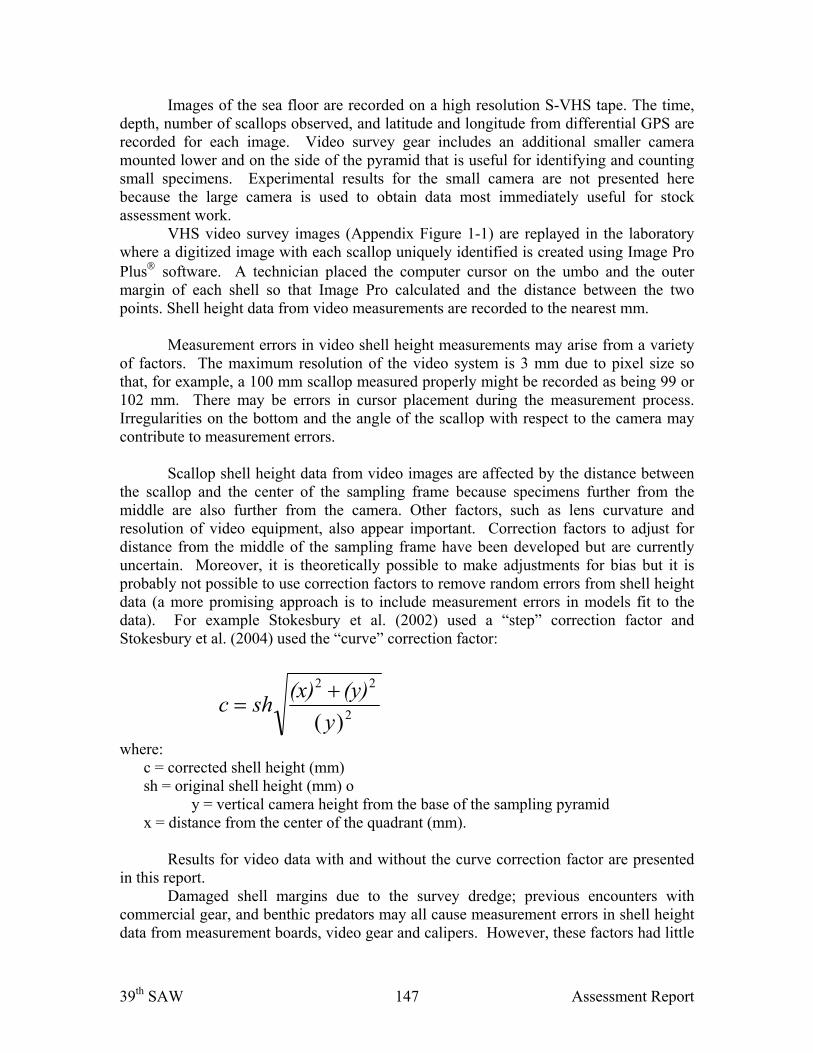
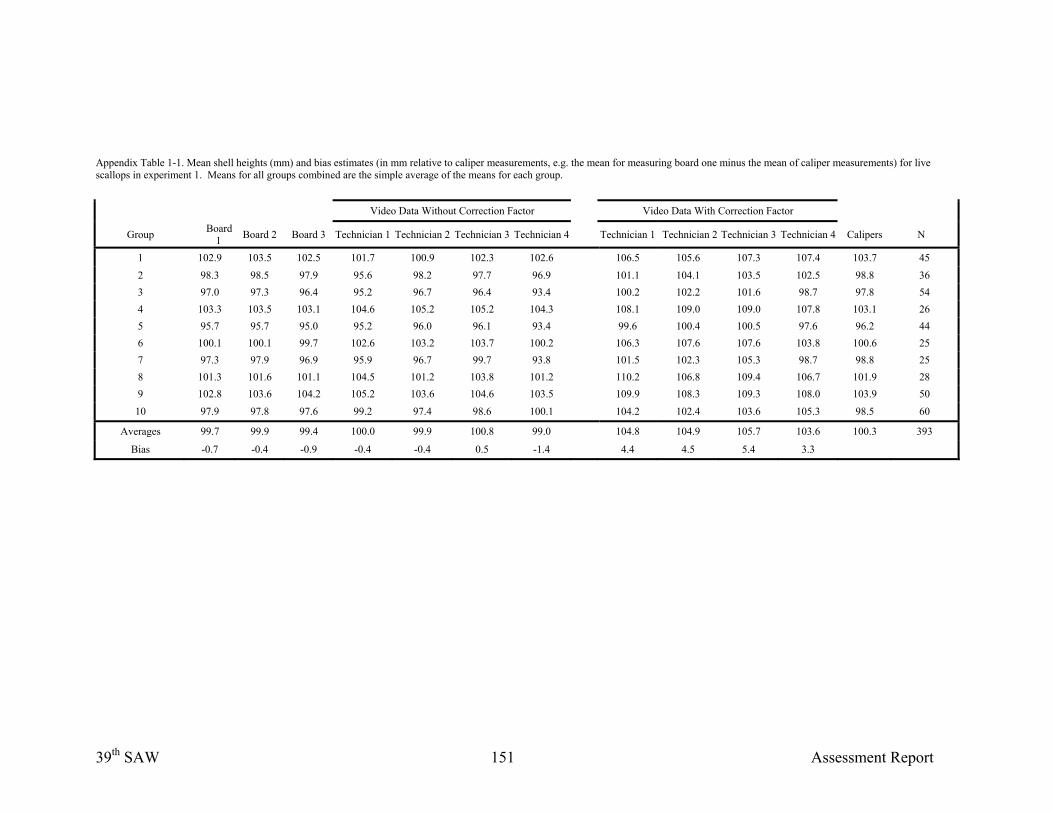
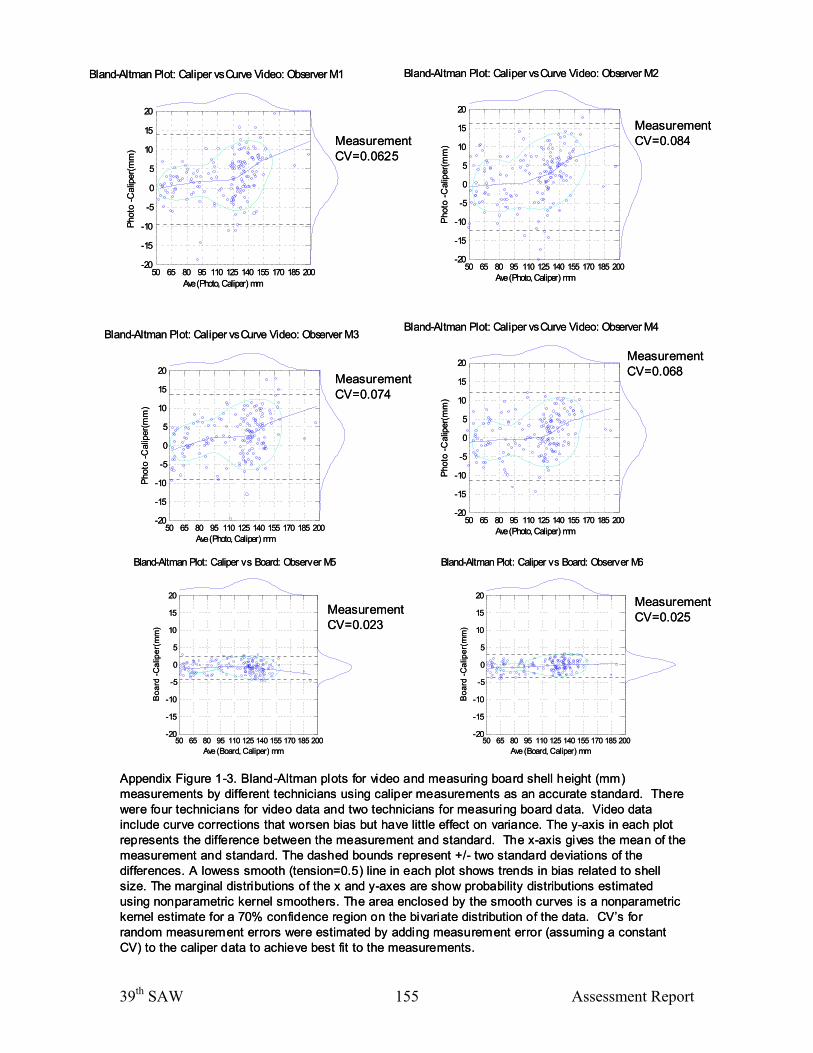
As in Experiment 1, results for uniquely labeled shells showed a small negative
bias for measuring boards (Appendix Table 1-2). Video measurements without the curve correction had a substantial negative bias (-5.8 to –4.0 mm). Video measurements with the curve correction factors had an intermediate positive bias (0.4 to 2.4 mm). Bland-Altman plots confirm these patterns and suggest that the standard deviation of random measurement errors probably increases with shell size (Appendix Figure 1-3). Increasing standard deviations indicate that random measurement errors for one technician may be multiplicative with a constant CV that is independent of shell size (rather than a constant standard deviation). Differences in results for live scallops in Experiment 1 and scallop shells in Experiment 2 were due to a much wider and more even range of lengths for shells in Experiment 2.
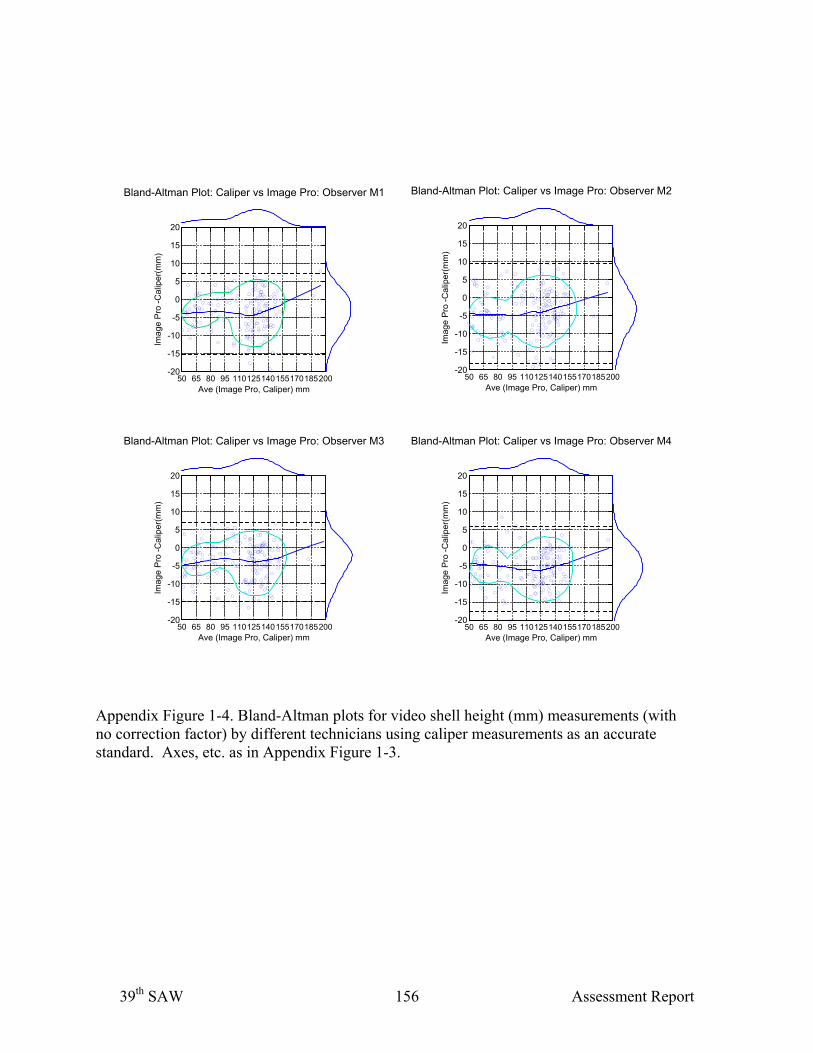
The CV for random measurement errors in each set of shell height data was
estimated by applying normal measurement errors to caliper data and choosing the CV value that gave the best fit to the observed data (e.g. for video measurements by one technician, Appendix Figure 1-4). Assuming random errors had constant CV’s and using curve corrected data, CVs for random measurement errors ranged 0.023 to 0.025 (average 0.024) for measuring boards and 0.053 to 0.084 (average 0.072) for video measurements by different technicians.
39th SAW 150 Assessment Report
Discussion Shell height data from video (without curve corrections) and measurement boards
involve measurement errors that cause a negligible negative bias. Random measurement errors were smaller in shell height data from measuring boards. Based on live scallops, the CV for random errors with measurement boards averaged 0.024. For a 100 mm sea scallop, the 95% probability interval for measurements errors with measurement boards would be –4.8 to 4.8 mm. The proportion of shell height measurements assigned to an incorrect 5 mm shell height group with measurement boards would be roughly 2*P(z < -2.5/2.4) = 30% where P(z) is the cumulative probability for z from a standard normal distribution. Very few random measurement errors (about 2*P(z<-7/1.7)=0.18%) would be large enough to place a shell in shell height groups beyond those just above and below the true shell height group.
CVs for random measurement errors in video shell height data averaged 7.2 mm.
For a 100 mm scallop, the 95% probability interval for random measurement errors is wider (–14.4 to 14.4 mm for a shell height of 100 mm). Roughly 73% of shells would be assigned to the wrong 5 mm shell height group using video shell height measurements. A relatively large proportion (30%) would be assigned to shell height groups beyond the first groups above and below the true shell height group.
The SMAST/NEFSC experiments could be used to help characterize the relationship between lengths of scallops and scallop shells on the bottom of the tank and lengths in experimental video survey data. However, sampling by dredges was not included in experiments. Therefore, potential differences between the shell height distributions of scallops on the bottom of the ocean and scallops in dredge survey catches due to size specific selectivity patterns were not addressed. Similarly, measurement errors from the video may be smaller under controlled conditions in a tank than in the field.
It would be useful to conduct additional experiments with a large number of
individually marked live scallops with higher proportions at small and large sizes. An even distribution of shell heights for live scallops is important because bias with and without curve correction factors differed between Experiment 1 and Experiment 2 because of differences in size composition of live scallops and shells. Data used here were sufficient to characterize measurement errors in broad terms but at least one additional experiment (preferably with individually marked live scallops) is required if more precise estimates of measurement error are required. In future experiments, it might be worthwhile to evaluate differences in shell height measurement errors due to different individuals collecting measuring board and video data.
39th SAW 151 Assessment Report
Appendix Table 1-1. Mean shell heights (mm) and bias estimates (in mm relative to caliper measurements, e.g. the mean for measuring board one minus the mean of caliper measurements) for live scallops in experiment 1. Means for all groups combined are the simple average of the means for each group. Video Data Without Correction Factor Video Data With Correction Factor
Appendix Table 1-2. Means and standard deviations (mm) for differences (e.g. measuring board – caliper) in shell height measurements from individually labeled scallop shells. Differences between measurements by different technicians (1-4 for video data; 1-2 for measuring boards) and caliper shell heights. Results are shown for video shell heights with and without a correction factor.
Technique, technician and correction
Mean Difference (mm) SD (mm)
Video 1 no curve correction -4.0 5.7 Video 1 with curve correction 2.3 5.8 Video 2 no curve correction -4.3 7.0 Video 2 with correction 2.0 7.2 Video 3 no curve correction -4.0 5.5 Video 3 with correction 2.4 5.7 Video 4 no curve correction -5.8 6.0 Video 4 with correction 0.4 5.9 Measuring board 1 -0.9 1.7 Measuring board 2 -0.4 1.6
39th SAW 153 Assessment Report
Appendix Figure 1-1. Digitized SMAST video survey image.
39th SAW 154 Assessment Report
Appendix Figure 1-2.
Measurement board and video shell height measurements from live scallops using measurement boards and calipers.
40.0
80.0
120.0
160.0
40.0 80.0 120.0 160.0Caliper Shell Height ( )
Mea
sure
men
t Boa
rd S
hell
Hei
ght
Measurement board and video shell height measurements from live scallops using measurement boards and calipers.
40.0
80.0
120.0
160.0
40.0 80.0 120.0 160.0Caliper Shell Height ( )
Mea
sure
men
t Boa
rd S
hell
Hei
ght
39th SAW 155 Assessment Report
Appendix Figure 1-3. Bland-Altman plots for video and measuring board shell height (mm) measurements by different technicians using caliper measurements as an accurate standard. There were four technicians for video data and two technicians for measuring board data. Video data include curve corrections that worsen bias but have little effect on variance. The y-axis in each plot represents the difference between the measurement and standard. The x-axis gives the mean of the measurement and standard. The dashed bounds represent +/- two standard deviations of the differences. A lowess smooth (tension=0.5) line in each plot shows trends in bias related to shell size. The marginal distributions of the x and y-axes are show probability distributions estimated using nonparametric kernel smoothers. The area enclosed by the smooth curves is a nonparametric kernel estimate for a 70% confidence region on the bivariate distribution of the data. CV’s for random measurement errors were estimated by adding measurement error (assuming a constant CV) to the caliper data to achieve best fit to the measurements.
Appendix Figure 1-3. Bland-Altman plots for video and measuring board shell height (mm) measurements by different technicians using caliper measurements as an accurate standard. There were four technicians for video data and two technicians for measuring board data. Video data include curve corrections that worsen bias but have little effect on variance. The y-axis in each plot represents the difference between the measurement and standard. The x-axis gives the mean of the measurement and standard. The dashed bounds represent +/- two standard deviations of the differences. A lowess smooth (tension=0.5) line in each plot shows trends in bias related to shell size. The marginal distributions of the x and y-axes are show probability distributions estimated using nonparametric kernel smoothers. The area enclosed by the smooth curves is a nonparametric kernel estimate for a 70% confidence region on the bivariate distribution of the data. CV’s for random measurement errors were estimated by adding measurement error (assuming a constant CV) to the caliper data to achieve best fit to the measurements.
Bland-Altman Plot: Caliper vs Image Pro: Observer M1
50 65 80 95 110125140155170185200Ave (Image Pro, Caliper) mm
-20
-15
-10
-5
0
5
10
15
20
Imag
e P
ro -C
alip
er(m
m)
Bland-Altman Plot: Caliper vs Image Pro: Observer M2
50 65 80 95 110125140155170185200Ave (Image Pro, Caliper) mm
-20
-15
-10
-5
0
5
10
15
20
Imag
e P
ro -C
alip
er(m
m)
Bland-Altman Plot: Caliper vs Image Pro: Observer M3
50 65 80 95 110125140155170185200Ave (Image Pro, Caliper) mm
-20
-15
-10
-5
0
5
10
15
20
Imag
e P
ro -C
alip
er(m
m)
Bland-Altman Plot: Caliper vs Image Pro: Observer M4
50 65 80 95 110125140155170185200Ave (Image Pro, Caliper) mm
-20
-15
-10
-5
0
5
10
15
20
Imag
e P
ro -C
alip
er(m
m)
Appendix Figure 1-4. Bland-Altman plots for video shell height (mm) measurements (with no correction factor) by different technicians using caliper measurements as an accurate standard. Axes, etc. as in Appendix Figure 1-3.


![Discussion of errors in gain measurements of standard ...ClaytonandHollis,1966]todeterminepolarizationchar- acteristicsofothermorecomplicatedantennas. Themeasurementofantennagainisthusessentiallyameasure-](https://static.documents.pub/doc/80x56/5acd370d7f8b9a73128dbde7/discussion-of-errors-in-gain-measurements-of-standard-claytonandhollis1966todeterminepolarizationchar-.jpg)


