153 APPENDIX 1 REFERENCE VALUES FOR THE CALCULATION OF ADIABATIC FLAME TEMPERATURE Table A1.1 Values of coefficients AL, BL, CL and DL for 400 T P and h Gas AL BL CL DL CO 299180 37.85 -4571.9 -31.1 CO 2 56835 66.27 -11634 -200 H 357070 20.79 -7.9 -3.9 H 2 326490 40.35 -8085.2 -121 H 2 O 88923 49.36 -7940.8 -117 N 2 31317 37.46 -4559.3 -34.82 O 255120 24.6 -2729.2 13.86 O 2 43388 42.27 -6635.4 -55.15 OH 217810 37.36 -5561.4 -44.06 NO 111050 37.81 -2874.8 -15.7 N 326040 17.19 5371.4 64.67
Transcript
153
APPENDIX 1
REFERENCE VALUES FOR THE CALCULATION OF
ADIABATIC FLAME TEMPERATURE
Table A1.1 Values of coefficients AL, BL, CL and DL for 400
T P and h
Gas AL BL CL DL
CO 299180 37.85 -4571.9 -31.1
CO2 56835 66.27 -11634 -200
H 357070 20.79 -7.9 -3.9
H2 326490 40.35 -8085.2 -121
H2O 88923 49.36 -7940.8 -117
N2 31317 37.46 -4559.3 -34.82
O 255120 24.6 -2729.2 13.86
O2 43388 42.27 -6635.4 -55.15
OH 217810 37.36 -5561.4 -44.06
NO 111050 37.81 -2874.8 -15.7
N 326040 17.19 5371.4 64.67
154
Table A1.2 Values of coefficients AH, BH, CH and DH for 1600
T P and h
Gas AH BH CH DH
CO 309070 39.29 -6201.9 -42.77
CO2 93048 68.58 -16979 -220.4
H 357010 20.79 0 -3.82
H2 461750 46.23 -27649 -176.6
H2O 154670 60.43 -19212 -204.6
N2 44639 39.32 -6753.4 -50.24
O 298360 23.17 -6910.3 21.81
O2 127010 46.25 -18798 -92.15
OH 298750 42.86 -17695 -92.24
NO 138670 39.92 -7061.8 -33.9
N 486400 26.91 -18159 -20.31
Table A1.3 Hrp and Urp values at 298 K
Heat of reaction
CO2 H2O O2 N2
Urp (kJ/kmole) 9364 57316 17200 15780
Hrp (kJ/kmole) 6886 54838 14722 13302
155
APPENDIX 2
DETAILS OF PROPERTIES FOR DIESEL AND
OXYGENATES
DIESEL
Diesel or Diesel fuel is a specific fractional distillate of fuel oil
(mostly petroleum) that is used as fuel in a diesel engine invented by German
engineer Rudolf Diesel.
Diesel is produced from petroleum as a hydrocarbon mixture by
fractional distillation of crude oil between 250 °C and 350 °C at atmospheric
pressure.
It is sometimes called petrodiesel (or, less seriously, dinodiesel).
Chemical composition
Petroleum-derived diesel is composed of about 75% saturated
hydrocarbons (primarily paraffins including n, iso, and cycloparaffins), and
25% aromatic hydrocarbons (including naphthalenes and alkylbenzenes).
Chemical Formula
The average chemical formula for common diesel fuel is C12H23,
ranging approximately from C10H20 to C15H28.
156
Physical Properties of Diesel
1. Diesel is immiscible with water.
2. Petro Diesel is considered to be a fuel oil and is about 18%
denser than gasoline.
3. Diesel typically weighs about 7.1 pounds (lb) per US gallon
(gal) (850 grams per liter (g/l)).
4. Diesel combustion exhaust is a major source of atmospheric
soot and fine particles.
5. Diesel exhaust also contains nanoparticles.
6. Approximate chemical composition of diesel oil is given
below.
Chemical substance Volume percentage
157
ESTERS
Esters are the derivatives of carboxylic acids (RCOOH)
prepared by the alkylation of carboxylic acids with alcohols.
RCOOH + R OH RCOOR
Some representative examples are given below:
Alcohol Carboxylic acid Ester
Name Formula Name Formula Name Formula
Methanol CH3OH
Formic acid
HCOOH Methyl formate
HCOO CH3
Acetic acid
CH3COOH Methyl aceate
CH3COO CH3
Ethanol CH3CH2OH
Formic acid
HCOOH Ethyl formate
HCOO CH2CH3
Acetic acid
CH3COOH Ethyl acetate
CH3COO CH2CH3
Propanol CH3CH2
CH2OHAcetic acid
CH3COOH Propyl acetate
CH3COO CH2CH2CH3
They are characterized by the presence of carbonyloxy
functional group (– COO-).
Esters of aliphatic carboxylic acids are generally represented
as RCOOR’.
Acyl group Alkyloxy group
O
O R'R
158
Esters in general are liquids with characteristic odour.
Esters of aromatic carboxylic acids are represented as
ArCOOR’.
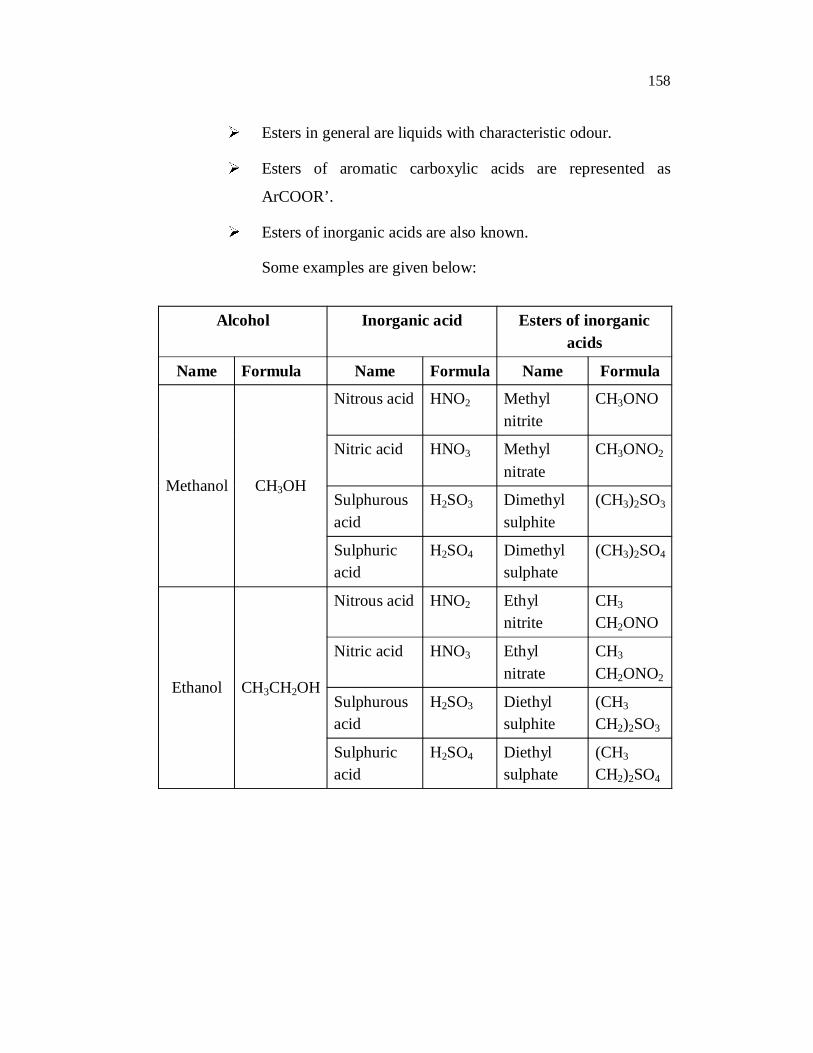
Esters of inorganic acids are also known.
Some examples are given below:
Alcohol Inorganic acid Esters of inorganic acids
Name Formula Name Formula Name Formula
Methanol CH3OH
Nitrous acid HNO2 Methyl nitrite
CH3ONO
Nitric acid HNO3 Methyl nitrate
CH3ONO2
Sulphurous acid
H2SO3 Dimethyl sulphite
(CH3)2SO3
Sulphuric acid
H2SO4 Dimethyl sulphate
(CH3)2SO4
Ethanol CH3CH2OH
Nitrous acid HNO2 Ethyl nitrite
CH3
CH2ONO
Nitric acid HNO3 Ethyl nitrate
CH3
CH2ONO2
Sulphurous acid
H2SO3 Diethyl sulphite
(CH3 CH2)2SO3
Sulphuric acid
H2SO4 Diethyl sulphate
(CH3 CH2)2SO4
159
2-ETHOXYETHANOL
Other names for 2-Ethoxyethanol: Cellosolve or ethyl cellosolve or
ethylene glycol ethyl ether or oxitol.
H2C
CH2
OCH2
CH3
HO
2-ethoxyethanol
Properties
Molecular formula : C4H10O2
Molar mass : 90.12 gmol
Density : 0.930 g/cm3
Melting point : -70 °C, 203 K, -94 °F
Boiling point : 135 °C, 408 K, 275 °F
Flash point : 44 °C
It is a clear, colorless, nearly odorless liquid
It is miscible with water, ethanol, diethyl ether, acetone, and ethyl
acetate.
Preparation: 2-Ethoxyethanol can be manufactured by the reaction of ethylene oxide with ethanol.
Uses
It is a solvent used widely in commercial and industrial applications. As with other glycol ethers, 2-ethoxyethanol will dissolve oils,
resins, grease, waxes, nitrocellulose, and lacquers. This is an ideal property as
a multi-purpose cleaner and therefore 2-ethoxyethanol is used in products such as varnish removers and degreasing solutions.
160
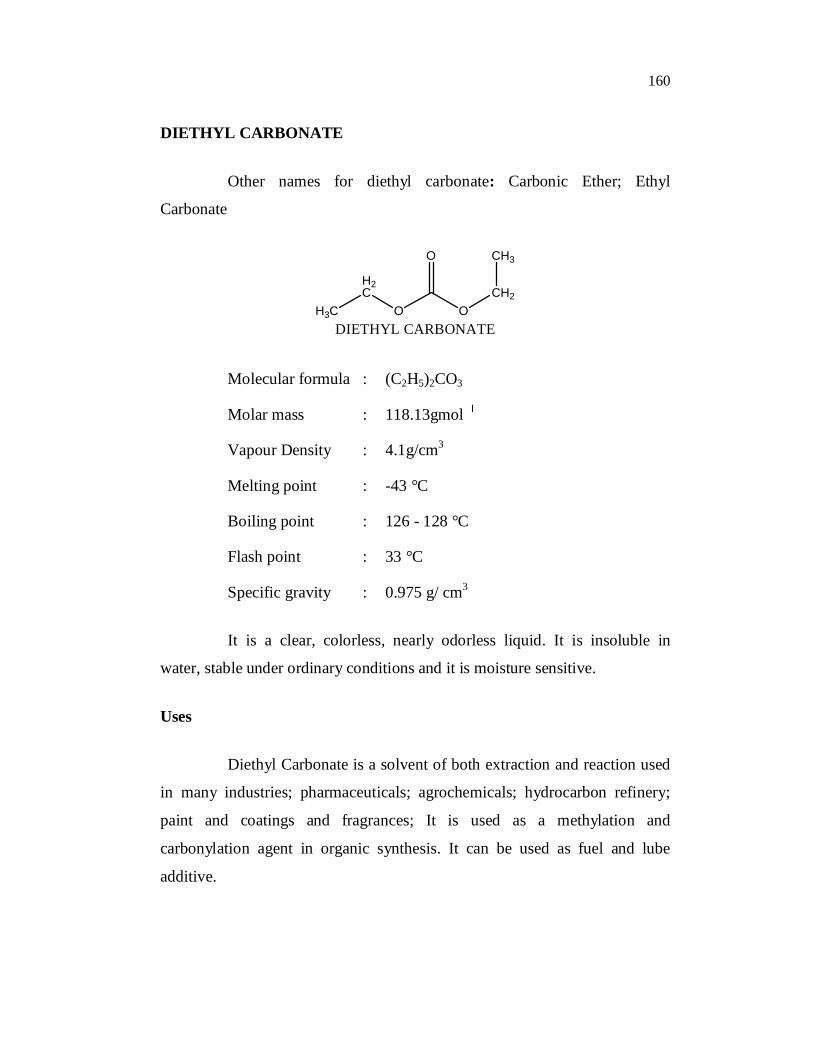
DIETHYL CARBONATE
Other names for diethyl carbonate: Carbonic Ether; Ethyl
Carbonate
O
O
OCH2
CH3
H2C
H3CDIETHYL CARBONATE
Molecular formula : (C2H5)2CO3
Molar mass : 118.13gmol
Vapour Density : 4.1g/cm3
Melting point : -43 °C
Boiling point : 126 - 128 °C
Flash point : 33 °C
Specific gravity : 0.975 g/ cm3
It is a clear, colorless, nearly odorless liquid. It is insoluble in
water, stable under ordinary conditions and it is moisture sensitive.
Uses
Diethyl Carbonate is a solvent of both extraction and reaction used
in many industries; pharmaceuticals; agrochemicals; hydrocarbon refinery;
paint and coatings and fragrances; It is used as a methylation and
carbonylation agent in organic synthesis. It can be used as fuel and lube
additive.
161
ETHERS
Diethyl ether, also known as ether, ethyl ether and ethoxyethane,
is a clear, colorless, and highly flammable liquid with a low boiling point and
a characteristic odor. It is the most common member of a class of chemical
compounds known generically as ethers. It is an isomer of butanol. Diethyl
ether has the formula CH3-CH2-O-CH2-CH3. It is used as a common solvent
and has been used as a general anesthetic.
Ethers are the substances that possess C–O-C bond.
OCC
They possess the hydrocarbon substituent linked on either side of
the oxygen.
The hydrocarbon substituent may be aliphatic (R-O-R), aromatic
(Ar-O-Ar) or mixed (Ar-O-R) type in nature.
Ethers can be prepared by different methods. One such method is
the Dehydration of alcohols as shown below:
162
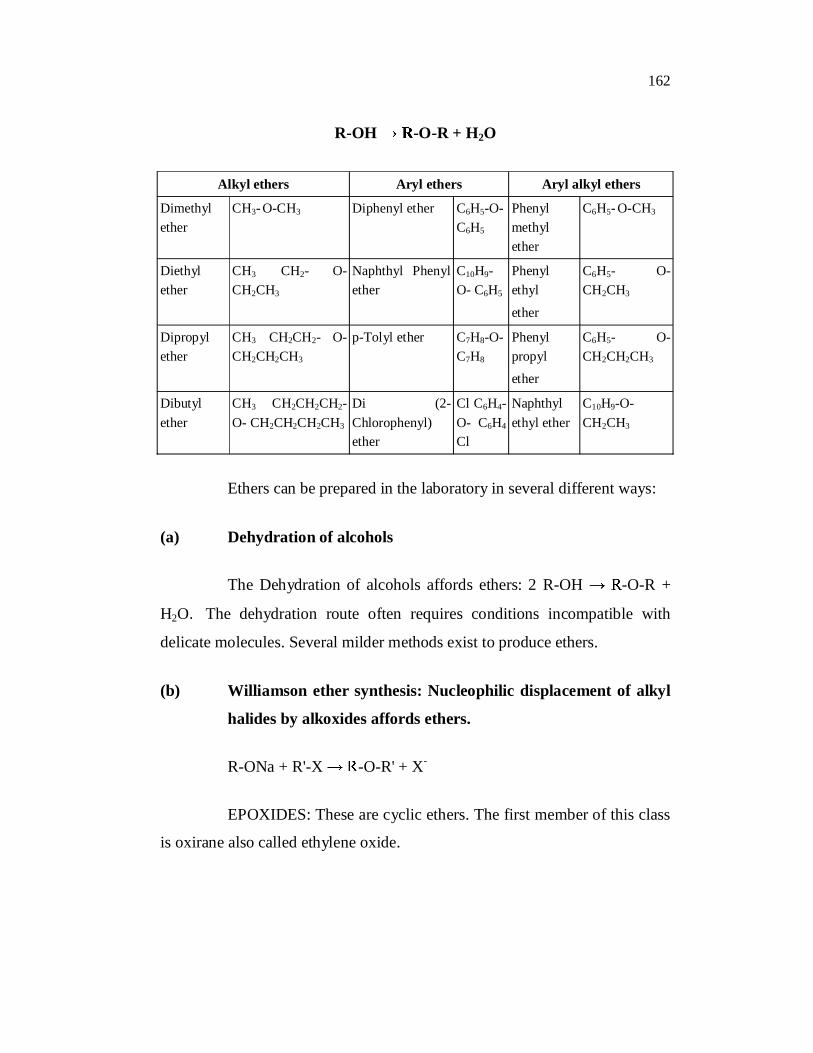
R-OH -O-R + H2O
Alkyl ethers Aryl ethers Aryl alkyl ethers
Dimethyl ether
CH3- O-CH3 Diphenyl ether C6H5-O-C6H5
Phenyl methyl ether
C6H5- O-CH3
Diethyl ether
CH3 CH2- O-CH2CH3
Naphthyl Phenyl ether
C10H9-O- C6H5
Phenyl ethyl
ether
C6H5- O-CH2CH3
Dipropyl ether
CH3 CH2CH2- O-CH2CH2CH3
p-Tolyl ether C7H8-O-C7H8
Phenyl propyl ether
C6H5- O-CH2CH2CH3
Dibutyl ether
CH3 CH2CH2CH2-O- CH2CH2CH2CH3
Di (2-Chlorophenyl) ether
Cl C6H4-O- C6H4
Cl
Naphthyl ethyl ether
C10H9-O-CH2CH3
Ethers can be prepared in the laboratory in several different ways:
(a) Dehydration of alcohols
The Dehydration of alcohols affords ethers: 2 R-OH -O-R +
H2O. The dehydration route often requires conditions incompatible with
delicate molecules. Several milder methods exist to produce ethers.
(b) Williamson ether synthesis: Nucleophilic displacement of alkyl
halides by alkoxides affords ethers.
R-ONa + R'-X -O-R' + X-
EPOXIDES: These are cyclic ethers. The first member of this class
is oxirane also called ethylene oxide.
163
Epoxides are typically prepared by oxidation of alkenes. The most
important epoxide in terms of industrial scale is ethylene oxide, which is
produced by oxidation of ethylene with oxygen.
DIETHYL ETHER
O
H2C
H3C
H2C
CH3
Other names for diethyl ether: Ether, Ethyl ether, Ethoxyethane
Preparation: Diethyl ether can be prepared both in laboratories
and on an industrial scale by treating ethanol with sulphuric acid under
suitable conditions.
Properties: Ether is sparingly soluble in water (6.9 g/100 mL). The
diffusion of diethyl ether in air is 0.918·10 m2/s (298K 101.325 kPa).
Chemical formula : C4H10O
Molecular weight : 74.12
Boiling Point : 313.54 [K]
Melting Point : 156.57 [K]
Critical Temp. : 487.33 [K]
Critical Pres : 38.15 [Bar]
Critical Vol. : 277.5 [cm3/mol]
Heat of Form : -258.11 [kJ/mol]
Elemental analysis : C = 64.82; H = 13.60; O = 21.59
General uses: It is commonly used as solvent and as a general
anesthetic.
164
165
166
167
168
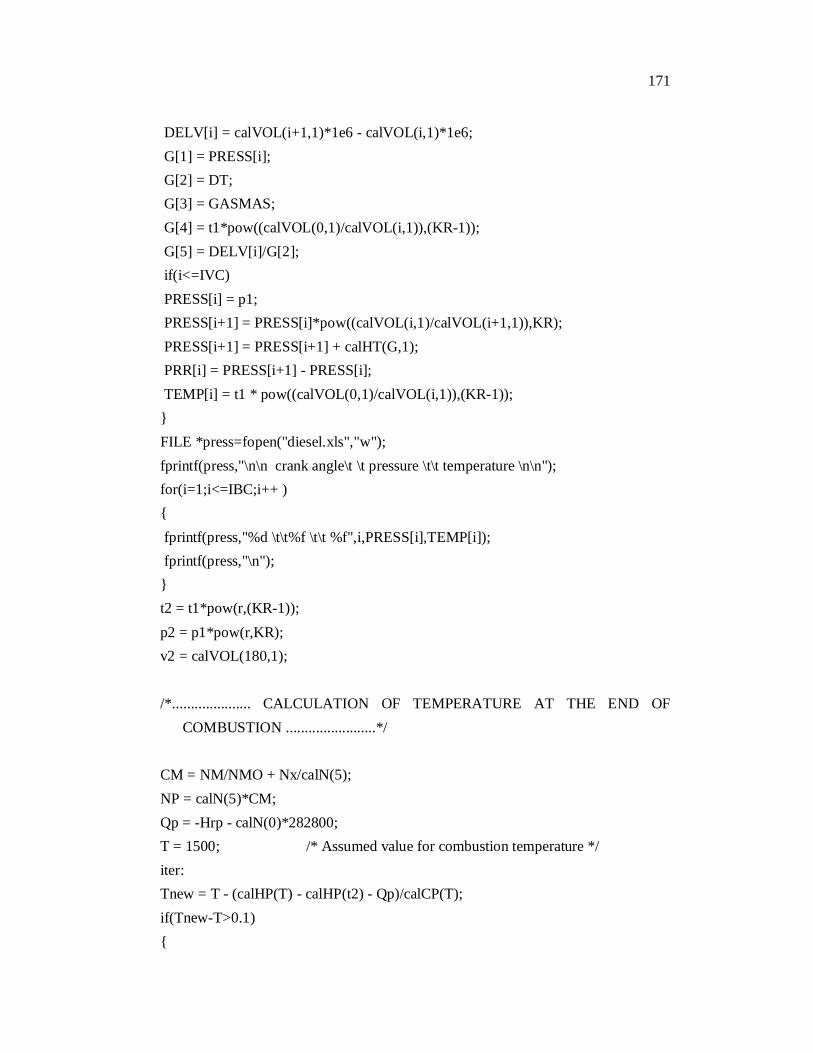
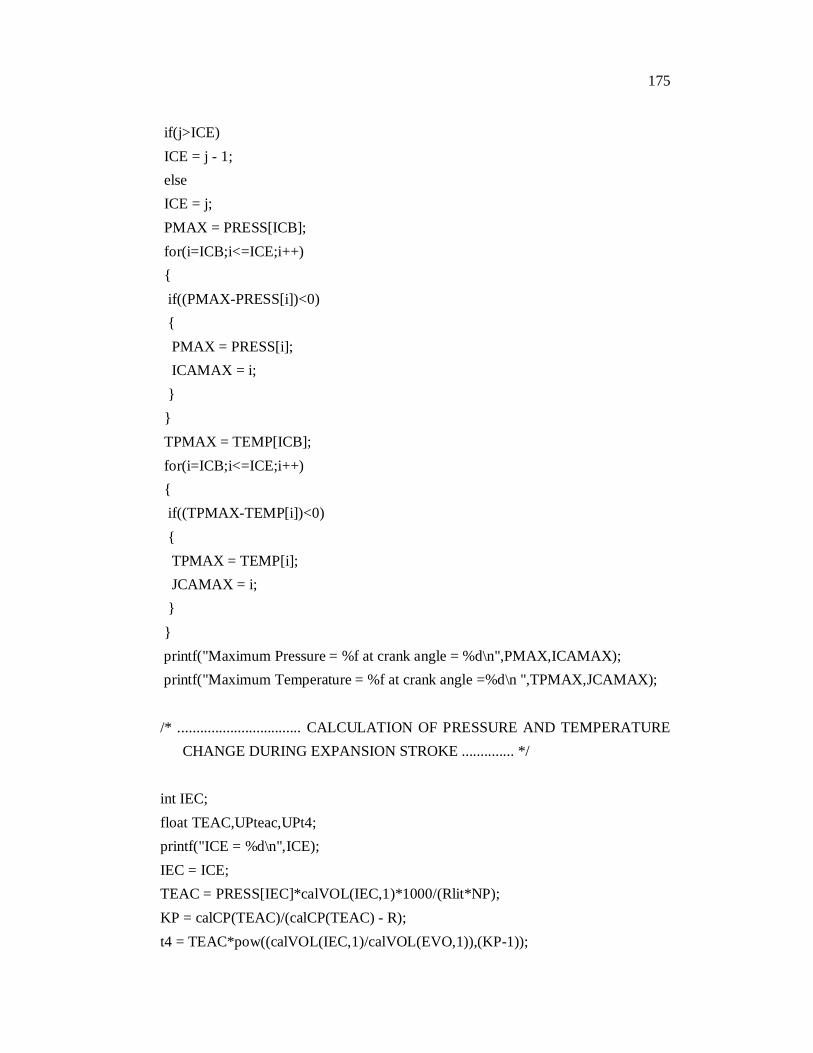
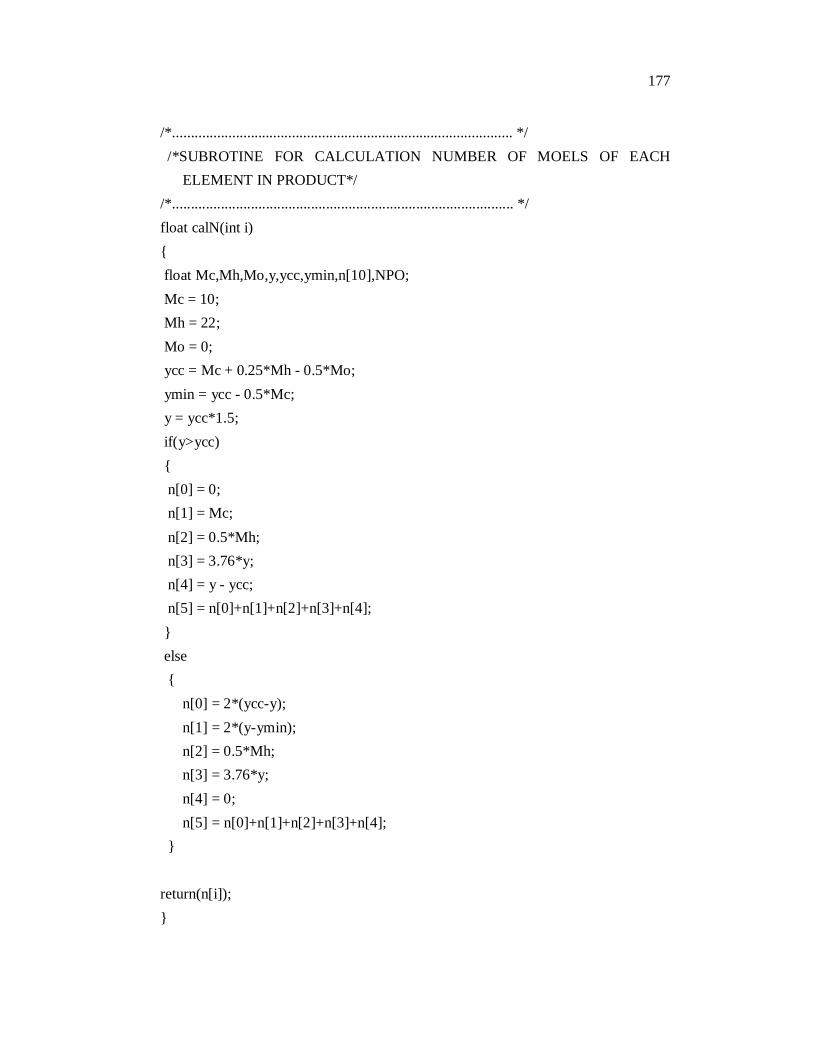
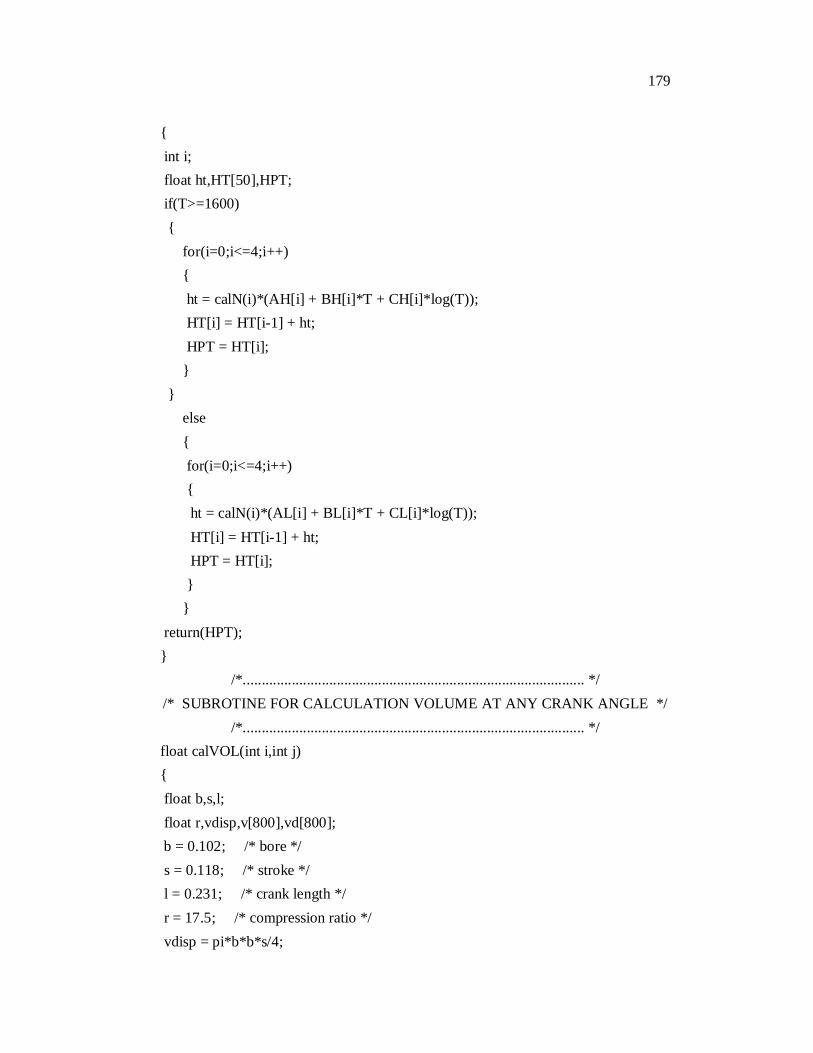
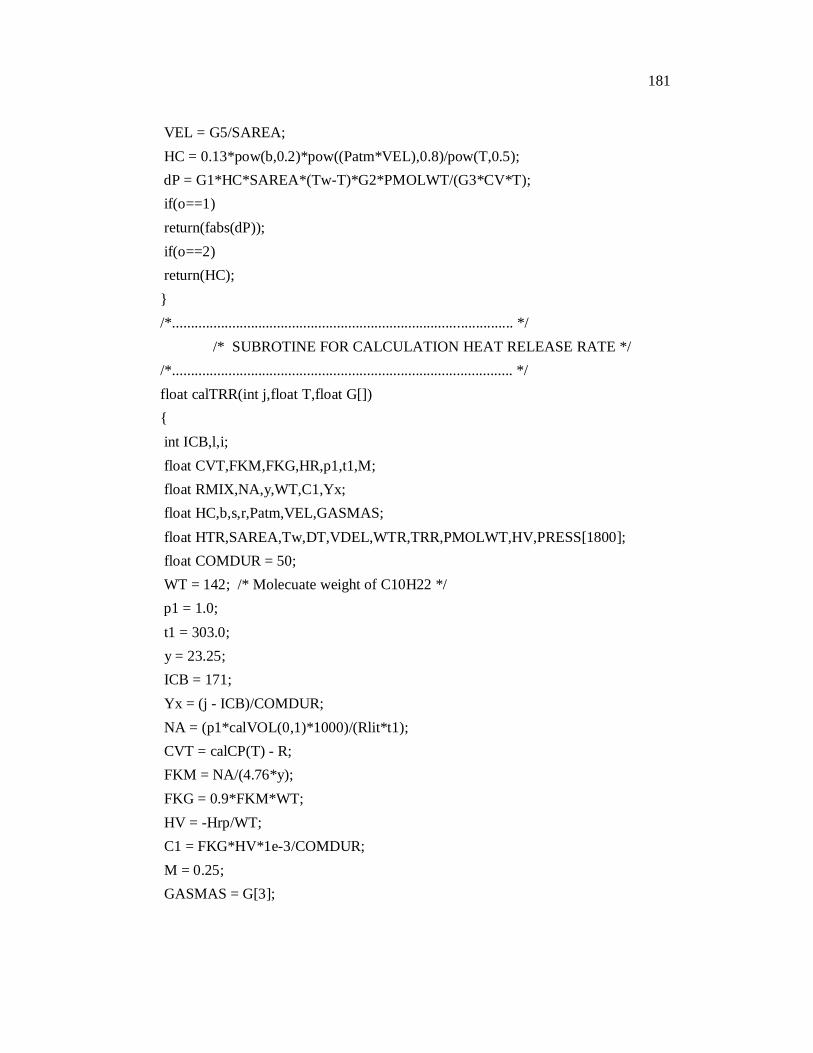
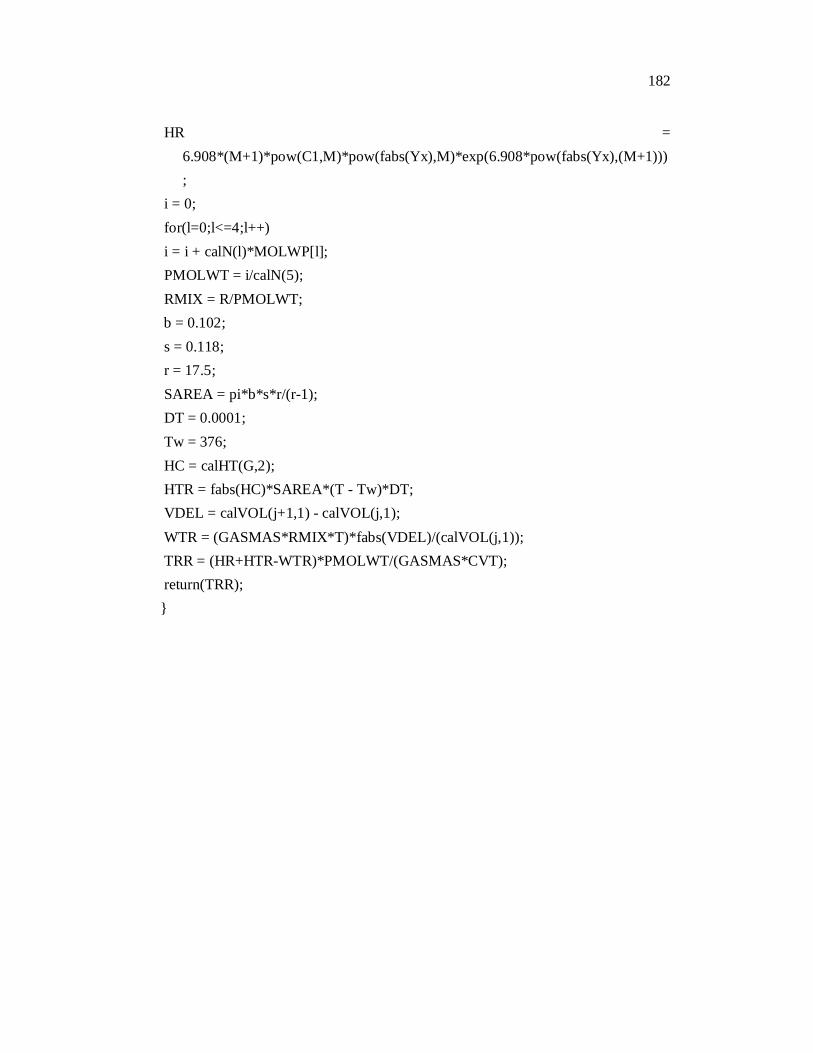
APPENDIX 3
A COMPUTER PROGRAM FOR COMBUSTION
SIMULATION
#include<stdio.h>#include<conio.h>#include<math.h> #define pi 3.1415926long double AL[]={299180,56835,88923,31317,43388}; long double BL[]={37.85,66.27,49.36,37.46,42.27}; long double CL[]={-4571.9,-11634,-7940.8,-4559.3,-6635.4}; long double AH[]={309070,93048,154670,44639,127010}; long double BH[]={39.29,68.58,60.43,39.32,46.25}; long double CH[]={-6201.9,-16979,-19212,-6753.4,-18798}; int RPM = 1500;long double Hrp = -6261300; heating value of diesel at constant pressure in
kJ/kmol*/ float MOLWP[]={28,44,18,28,32}; float R = 8.314; /* gas constant in KJ/Kmole K */ float Rlit = 0.082060; /* gas constant in litre-atmosphere/Kmole K */float IVO = 535.5; float IVC = 35.5; float EVO = 324.5 ; float EVC = 544.5; /* Valve Timing in degree crank angle*/float calVOL(int i,int j);float calN(int i); float calCP(float T); float calHP(float T); float calHT(float G[],int o); float calTRR(int i,float T,float G[]);void main(){clrscr();int i,j,I,I1,I2,ID,IMX,IBC,ICE,ICB,ICAMAX,JCAMAX;
169
float b,s,l; float r,vtotal,vdisp,vtdc,vbdc,vcv,v[800];float DT,Nx,k,CM,NP,NMO,NM,NA,SUM,PMOLWT,RMOLWT,RMIX;float pa,p1,p2,p3,p3D,p4,ta,t1,t2,t3,t4,v1,v2,v3,v4;float Mc,Mh,Mo,y,ycc,ymin,AFR;float PMAX,PMX,PRMAX,T,Tnew,Cv,n[50];float CPR,CPP,CVR,KR,KP,Wcomp,Wcomb,Wexp,Wnet; float GASMAS,PRESS[1800],TEMP[1800],PRR[1800],DELV[1800],G[1800];float RK1,RK2,RK3,RK4,DELP[1800],FUN[3000]; float Vdel,TPMAX;long double Qp; b =0.102; /* bore */s =0.118; /* stroke */l =0.231; /* crank length */r = 17.5; /* compresssion ratio */pa = 1; /* ambient pressure */ ta = 303; /* ambient air temperature */ vdisp = pi*b*b*s/4;vbdc = vdisp*r/(r-1); vtdc = vbdc - vdisp;printf("Displacement Volume = %f",vdisp); printf("\n");printf("Volume at BDC = %f",vbdc); printf("\n");printf("Volume at TDC = %f",vtdc);printf("\n\n\n"); p1 = pa;t1 = ta; Nx = 0; /* residual exhaust from previous cycle */k = 1.4; /* polytropic index */ /* fuel used is diesel .......... C10H22 */ Mc = 10; /* number of moles of carbon */Mh = 22; /* number of moles of hydrogen */ Mo = 0; /* number of moles of oxygen */ ycc = Mc + 0.25*Mh - 0.5*Mo; /* chemically correct amount of oxygen */
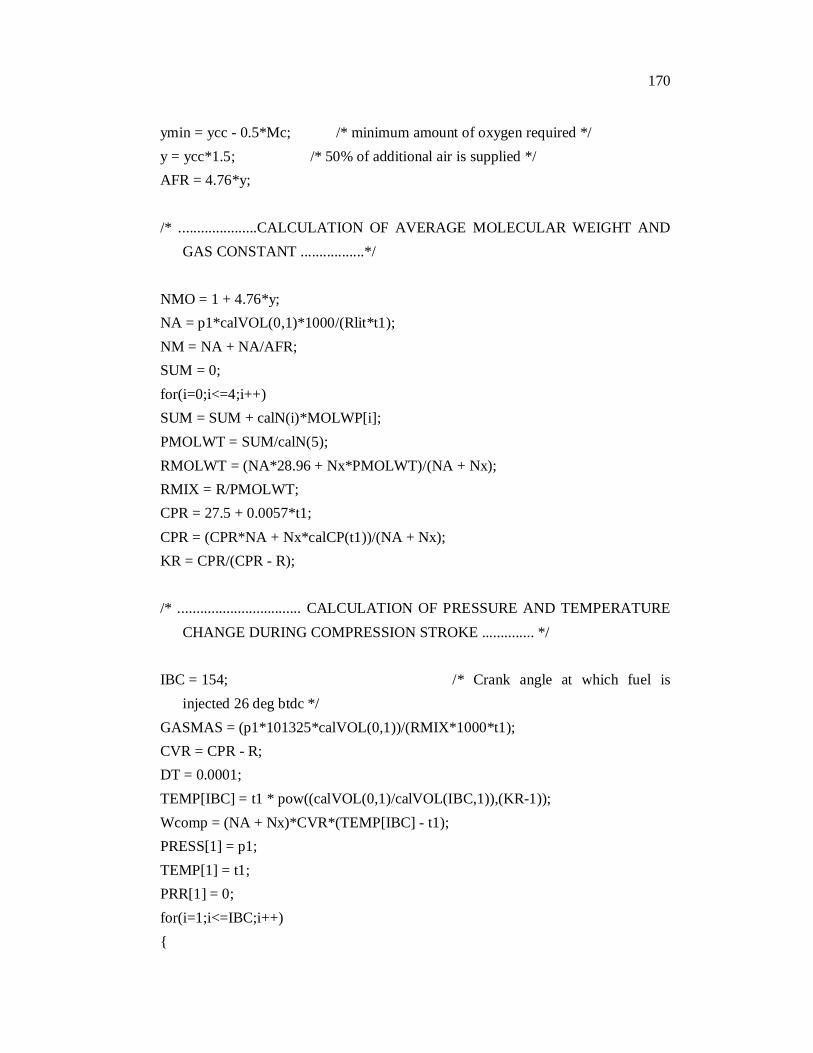
170
ymin = ycc - 0.5*Mc; /* minimum amount of oxygen required */ y = ycc*1.5; /* 50% of additional air is supplied */AFR = 4.76*y;
/* .....................CALCULATION OF AVERAGE MOLECULAR WEIGHT AND GAS CONSTANT .................*/
NMO = 1 + 4.76*y; NA = p1*calVOL(0,1)*1000/(Rlit*t1);NM = NA + NA/AFR; SUM = 0;for(i=0;i<=4;i++) SUM = SUM + calN(i)*MOLWP[i]; PMOLWT = SUM/calN(5);RMOLWT = (NA*28.96 + Nx*PMOLWT)/(NA + Nx); RMIX = R/PMOLWT; CPR = 27.5 + 0.0057*t1;CPR = (CPR*NA + Nx*calCP(t1))/(NA + Nx);KR = CPR/(CPR - R);
/* ................................. CALCULATION OF PRESSURE AND TEMPERATURE CHANGE DURING COMPRESSION STROKE .............. */
IBC = 154; /* Crank angle at which fuel is injected 26 deg btdc */
/*........................................................................................... */ /* SUBROTINE FOR CALCULATION VOLUME AT ANY CRANK ANGLE */
NOTE: PRESSURE VALUES AND OTHER LOSSES ARE READ FROM A
INPUT FILE
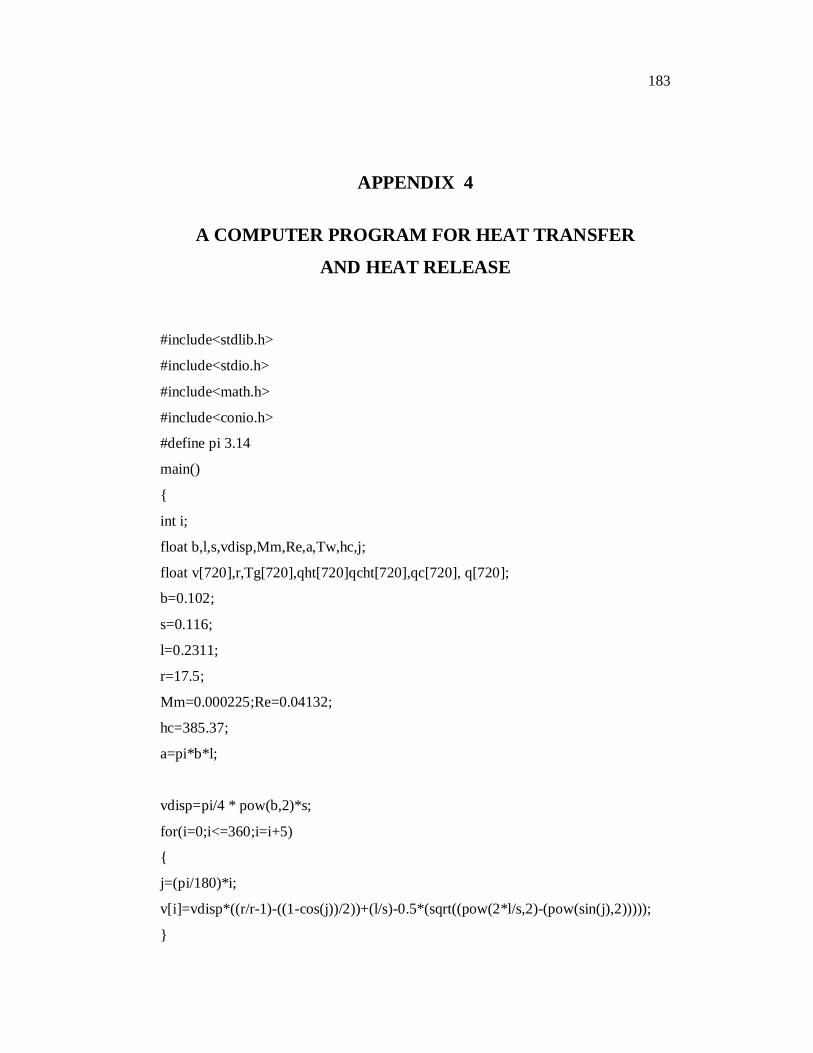
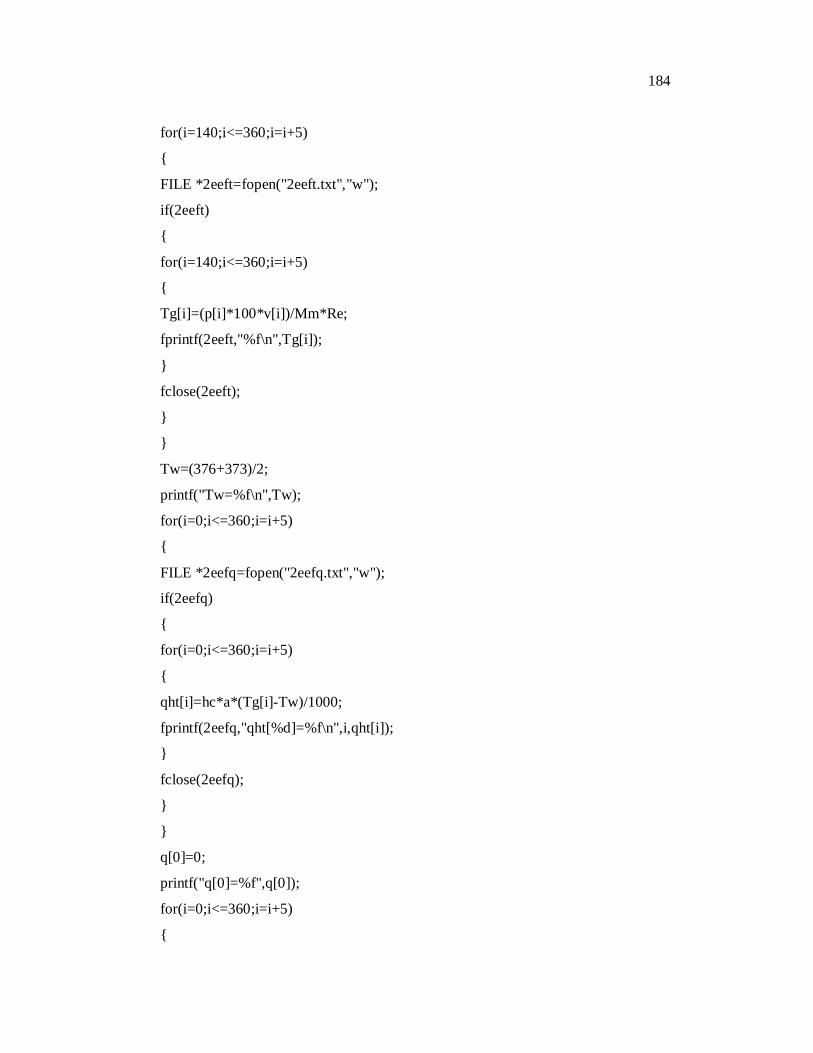
187
APPENDIX 5
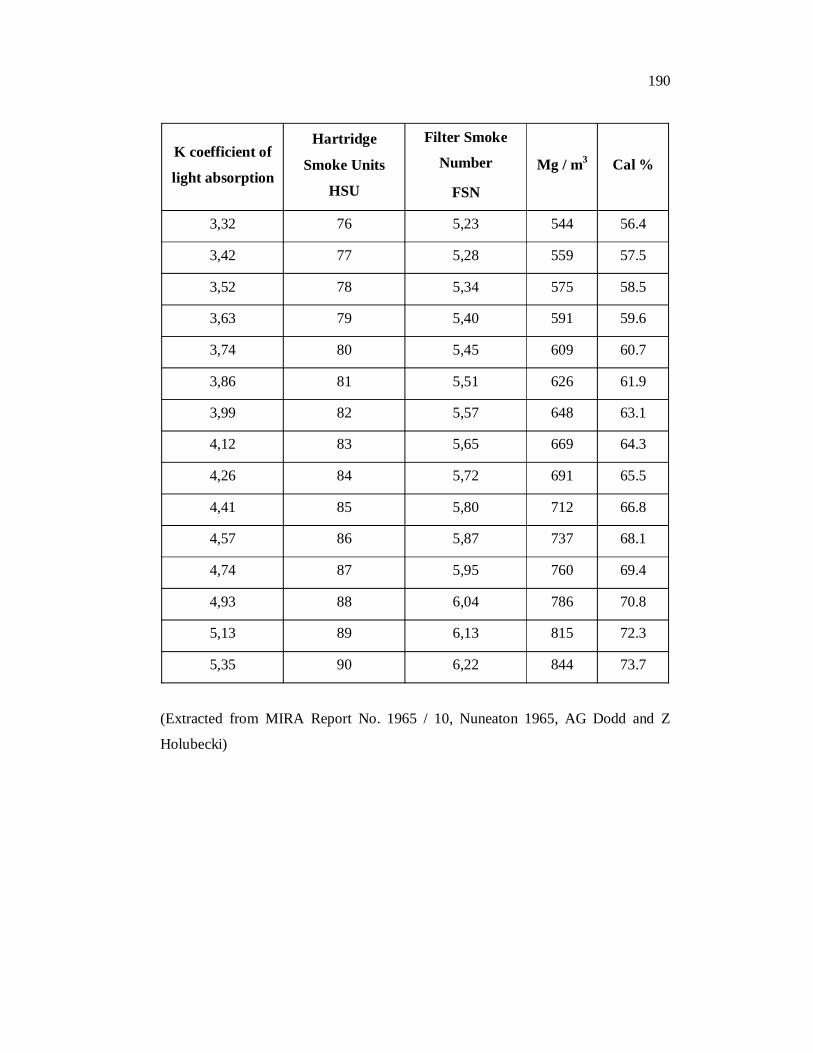
CONVERSION CHART FOR K, HSU, FSN AND mg/m3
K coefficient of
light absorption
Hartridge
Smoke Units
HSU
Filter Smoke
Number
FSN
Mg / m3 Cal %
0.25 10 1,10 33 6.1
0.27 11 1,20 38 6.5
0.30 12 1,30 42 7.2
0.32 13 1,40 47 7.7
0.35 14 1,48 52 8.4
0.38 15 1,57 57 9.1
0.41 16 1,67 62 9.7
0.43 17 1,75 66 10.2
0.46 18 1,84 71 10.9
0.49 19 1,93 76 11.5
0.52 20 2.02 81 12.2
0.55 21 2.10 86 12.8
0.58 22 2.18 91 13.5
0.61 23 2.26 96 14.1
0.64 24 2.34 101 14.8
0.67 25 2.42 106 15.4
0.70 26 2.50 111 16.1
0.73 27 2.57 117 16.7
0.76 28 2.64 122 17.3
0.80 29 2.71 127 18.1
188
K coefficient of
light absorption
Hartridge
Smoke Units
HSU
Filter Smoke
Number
FSN
Mg / m3 Cal %
0,83 30 2,77 1,33 18.7
0.86 31 2,83 1,38 19.3
0.90 32 2.89 1,44 20.1
0,93 33 2,96 150 20.7
0,97 34 3,02 156 21.5
1,00 35 3,08 162 22.1
1,04 36 3,14 168 22.9
1,07 37 3,20 174 23.5
1,11 38 3,26 181 24.2
1,15 39 3,31 187 25.0
1,19 40 3,37 193 25.7
1,23 41 3,42 199 26.5
1,27 42 3,47 206 27.2
1,31 43 3,53 213 27.9
1,35 44 3,59 220 28.6
1,39 45 3,64 227 29.4
1,43 46 3,70 234 30.1
1,48 47 3,75 241 30.9
1,52 48 3,80 248 31.6
1,57 49 3,86 256 32.5
1,61 50 3,91 264 33.1
1,66 51 3,96 272 34.0
1,71 52 4,01 281 34.8
189
K coefficient of
light absorption
Hartridge
Smoke Units
HSU
Filter Smoke
Number
FSN
Mg / m3 Cal %
1,76 53 4,07 290 35.6
1,81 54 4,12 299 36.4
1,86 55 4,17 308 37.2
1,91 56 4,22 317 38.0
1,96 57 4,27 326 38.7
2,02 58 4,32 335 39.6
2,07 59 4,37 345 40.4
2,13 60 4,42 355 41.3
2,19 61 4,47 365 42.2
2,25 62 4,52 375 43.0
2,31 63 4,57 385 43.9
2,38 64 4,62 395 44.8
2,44 65 4,67 406 45.7
2,51 66 4,72 416 46.6
2,58 67 4,76 428 47.5
2,65 68 4,81 439 48.4
2,72 69 4,86 450 49.3
2,80 70 4,91 462 50.3
2,88 71 4,96 475 51.3
2,96 72 5,01 489 52.3
3,04 73 5,07 501 53.2
3,13 74 5,12 514 54.3
3,22 75 5,17 529 55.3
190
K coefficient of
light absorption
Hartridge
Smoke Units
HSU
Filter Smoke
Number
FSN
Mg / m3 Cal %
3,32 76 5,23 544 56.4
3,42 77 5,28 559 57.5
3,52 78 5,34 575 58.5
3,63 79 5,40 591 59.6
3,74 80 5,45 609 60.7
3,86 81 5,51 626 61.9
3,99 82 5,57 648 63.1
4,12 83 5,65 669 64.3
4,26 84 5,72 691 65.5
4,41 85 5,80 712 66.8
4,57 86 5,87 737 68.1
4,74 87 5,95 760 69.4
4,93 88 6,04 786 70.8
5,13 89 6,13 815 72.3
5,35 90 6,22 844 73.7
(Extracted from MIRA Report No. 1965 / 10, Nuneaton 1965, AG Dodd and Z
Holubecki)
191
APPENDIX 6
Examiners’ remarks and corrections carried out
Chapter No.
Foreign Examiner remarks Corrections carried out
2 Most of the references provided in the thesis are either SAE papers or published before year 2000. More and better effort should be made to update the references, for example, “Fuel” and “Energy and Fuel” may provide very useful information.
Literature from Energy & fuel added on ignition delay – page: 18. Some other references included in the text are Wenqiao Yuan (2005), Wade L.G. Jr. (2008), Ramadhas A.S. (2005), Pulkrabek W.W.(2006), Marcello Canova 2005), etc.
3 Page 21: The ratios of 3%, 6% and 9% of oxygenate by weight in preparing the diesel oxygenate blends should be justified. It seems that they are chosen by random.
Page 22: If the physical and chemical properties of the various diesel oxygenate blends are obtained from the literatures, references for Table3.1 should be specified clearly.
The blending levels are determined such that the blends cover 0.65% to 4.14% oxygen by weight with diesel fuel in the ratios of 3.0, 6.0 and 9.0 percent by weight. The blending levels are restricted due to reduction of calorific value, corrosion and lubricity problems.. Page: 22.
Literature reference given C. Mani Natarajan 2001, Page: 23.
4 Page 35: It is unreasonable to neglect dissociation at high temperature combustion processes.
(Ganesan V,1996) as complete combustion is assumed. However, disassociation losses are compensated in computing the values of specific heats, where temperature is accounted.
Page 40: On the one hand, it is stated that a maximum emission reduction is obtained for diesel oxygenate blends having oxygenate from 1% to 8% by weight. On the other hand, the ratios of 3%, 6% and 9% by weight are used. It seems rather unreasonable to adopt different ranges.
Oxygenate is corrected as oxygen. Page: 41 the three oxygenates 2EE, DEC
and DEE are blended with diesel fuel in the ratios of 3.0, 6.0 and 9.0 percent by weight to have oxygen content varying between 0.65% and 4.14%..
192
Chapter No.
Foreign Examiner remarks Corrections carried out
4 Page 53: This is one of the most curial points requiring major revision. Description on the experimental investigation of pollutant emissions (NOX, HC and particulates) needs to be presented in great detail. What do you measure? What are the instrument and equipment involved? How to perform the measurements? How to handle the data? What are the accuracy and experimental error? The description is too brief and I have the impression that the experimental investigation is not conducted in the present study. In addition, particulate and smoke emissions should not be directly related even though smoke is part of the particulate emissions. As the particulate emissions are predicted according to the conversion chart of the smoke meter manual, accuracy and reliability of the presented results are very doubtful. Besides, what range of particulates you want to measure?
Description of 5 Gas analyzer given. Page: 55Emission analyser is also self-calibrating type. If the calibration is with in the required time span, the analyser skips to the leak test to ensure that there are no air leaks in the unit. It will not pass to the next stage until the leak test has passed. It will automatically perform an auto zero test whilst warming up, and at intervals during use to ensure that the measurement accuracy is maintained. HC (Non dispersive infra red analyser) and NOX values (chemical sensor and catalytic reaction) are measured in ppm by volume. CO and CO2 readings (Non dispersive infra red analyser) are given as percentage by volume.
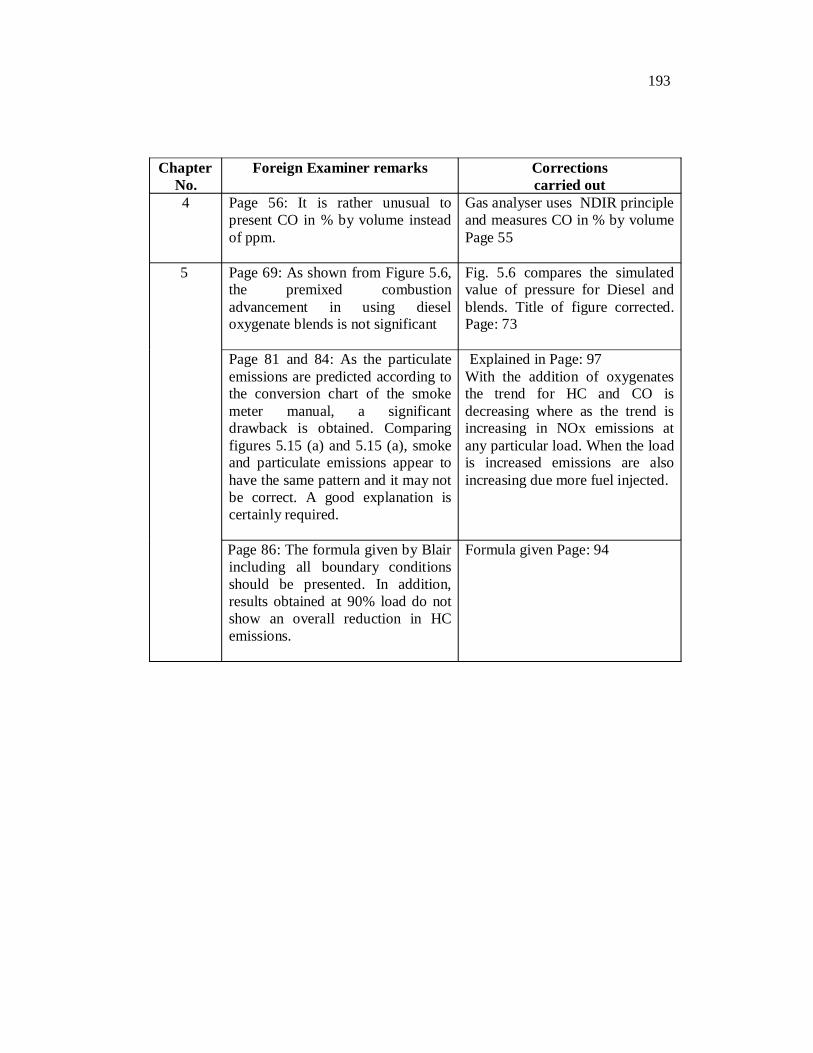
4 Page 56: It is rather unusual to present CO in % by volume instead of ppm.
Gas analyser uses NDIR principleand measures CO in % by volume Page 55
5 Page 69: As shown from Figure 5.6,
the premixed combustion advancement in using diesel oxygenate blends is not significant
Fig. 5.6 compares the simulated value of pressure for Diesel and blends. Title of figure corrected. Page: 73
Page 81 and 84: As the particulate emissions are predicted according to the conversion chart of the smoke meter manual, a significant drawback is obtained. Comparing figures 5.15 (a) and 5.15 (a), smoke and particulate emissions appear to have the same pattern and it may not be correct. A good explanation is certainly required.
Explained in Page: 97With the addition of oxygenates the trend for HC and CO is decreasing where as the trend is increasing in NOx emissions at any particular load. When the load is increased emissions are also increasing due more fuel injected.
Page 86: The formula given by Blair including all boundary conditions should be presented. In addition, results obtained at 90% load do not show an overall reduction in HC emissions.
Formula given Page: 94
194
Chapter No.
Foreign Examiner remarks Corrections carried out
5 Page 87, 89 and 92: It is directly related to what I have pointed out previously (Page 53), a significant drawback is observed here. Comparing Figures 5.17(a), 5.18(a) and 5.20(a), HC, NOX and CO emissions appear to have very similar patterns and such coincidence is rather unusual. A good justification is definitely needed.
Explained in Page: 97
With the addition of oxygenates the trend for HC and CO is decreasing where as the trend is increasing in NOx emissions at any particular load. When the load is increased emissions are also increased due more fuel injected
Page 89 and 91: As temperature plays a significant role in NOX emissions, it is certainly useful to establish some relationships between Figure 5.19 “Peak Temperature” with Figure 5.18(a) “NOX Emissions”.
Figure drawn 5.25(b) Pages:100&101.Even though the peak temperature is reduced with oxygenates addition, the average temperature is high due better combustion resulting in higher NOX emissions
Page 124: Summary of the discussion is too brief. Some statements such as “……..Performance of all the three oxygenates is found to be good” are not appropriate to be used in the summary of a PhD Thesis, instead, quantitative statements are more preferred.
Summary is detailed & quantified. Pages: 141-145 The performance of oxygenates at 6.0% blending level is summarized as shown below. 2-Ethoxy ethanol reduced smoke emissions by 0.55 FSN and particulate emissions by 0.35 g/k W-hr at 60% load……
Page 125: Section 5.3: “Findings” is not yet completed. The proposed Equation (5.1) should not be presented here if validation is not yet performed. Perhaps, it may better be presented in the Appendix
Validation part is added. Page: 146. The validation of “m” values and the model is discussed and shown in Figures 5.1 to 5.20.
195
Chapter
No.Foreign Examiner remarks Corrections
carried outPage 126: All statements made in the section “Conclusions” must be supported by facts and evidence. I do not recall any investigation made in the present study to examine the “loss of lubricity” and “increased corrosion”.
Conclusions modified. Page: 147The smoke intensity is found to be reduced more than 30% to 40% in 9.0% blending level of 2-Ethoxy ethanol and Diethyl carbonate. 25 to 30% for diethyl ether in 9.0% and 20% to 30% for 6.0% blending and 15 to 20% for 3.0% blending of all oxygenates…
Page 128 and 129: Again, I do not recall any investigation made in the present study to examine the influences of “Solubility”, “stability”, “flash point”, “lubricity” and “biodegradability” on smoke reduction, and the “vibration and noise reduction abilities” of the diesel oxygenate blends. It is not acceptable to have empty statements in the concluding section.
Conclusions modified. Page: 147Other properties of the blending compounds like cetane number and sulphur content also have a say in smoke reduction.
6 In addition, there are several typo-mistakes found and have been marked in the draft. Certainly, they are required to be amended. Besides, I have made some comments on pages xviii, 24, 25, 30, 32, 37, 82, 98 and 112, which should also be considered.
Typo-mistakes corrected as shown.
196
Chapter No.
Indian Examiner remarks Corrections carried out
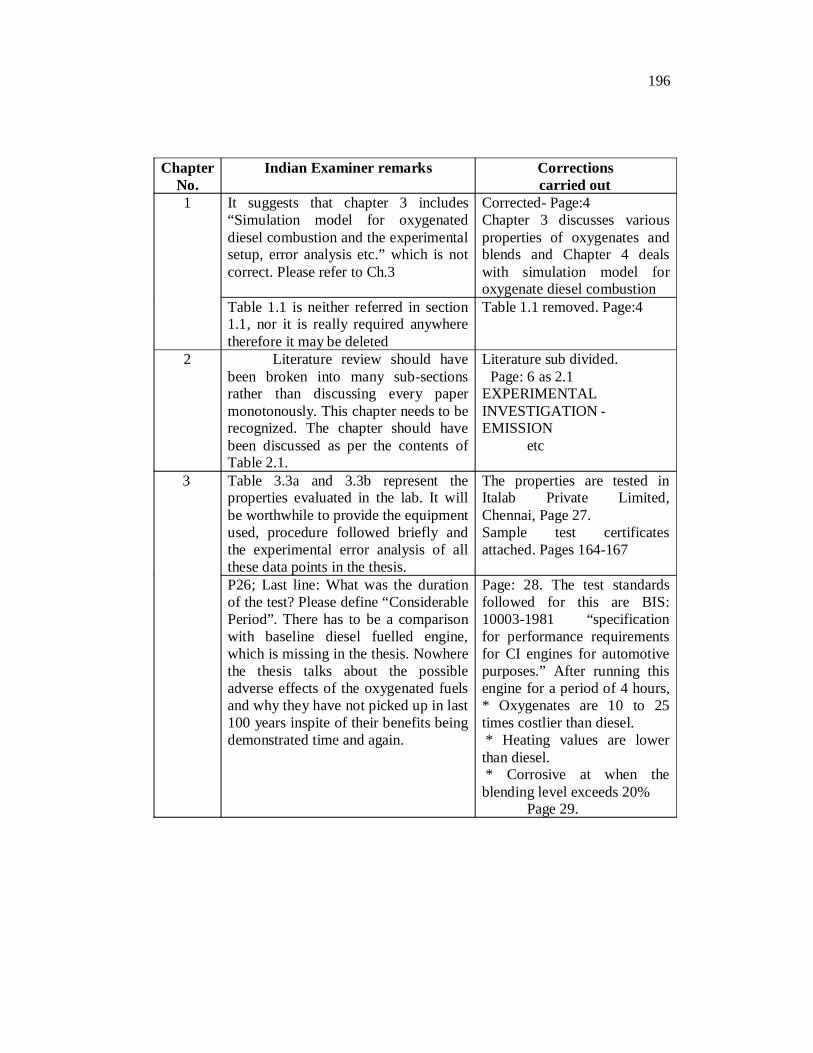
1 It suggests that chapter 3 includes “Simulation model for oxygenated diesel combustion and the experimental setup, error analysis etc.” which is not correct. Please refer to Ch.3
Corrected- Page:4 Chapter 3 discusses various properties of oxygenates and blends and Chapter 4 deals with simulation model for oxygenate diesel combustion
Table 1.1 is neither referred in section 1.1, nor it is really required anywhere therefore it may be deleted
Table 1.1 removed. Page:4
2 Literature review should have been broken into many sub-sections rather than discussing every paper monotonously. This chapter needs to be recognized. The chapter should have been discussed as per the contents of Table 2.1.
Literature sub divided.Page: 6 as 2.1
EXPERIMENTAL INVESTIGATION - EMISSION
etc
3
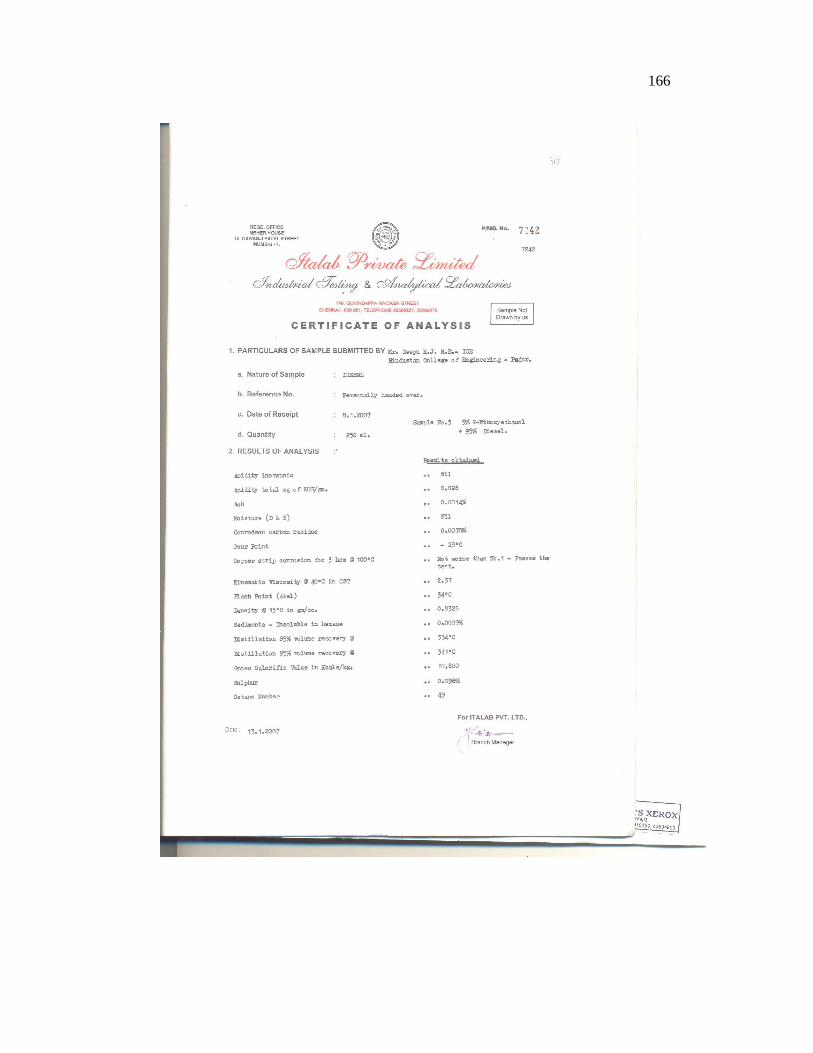
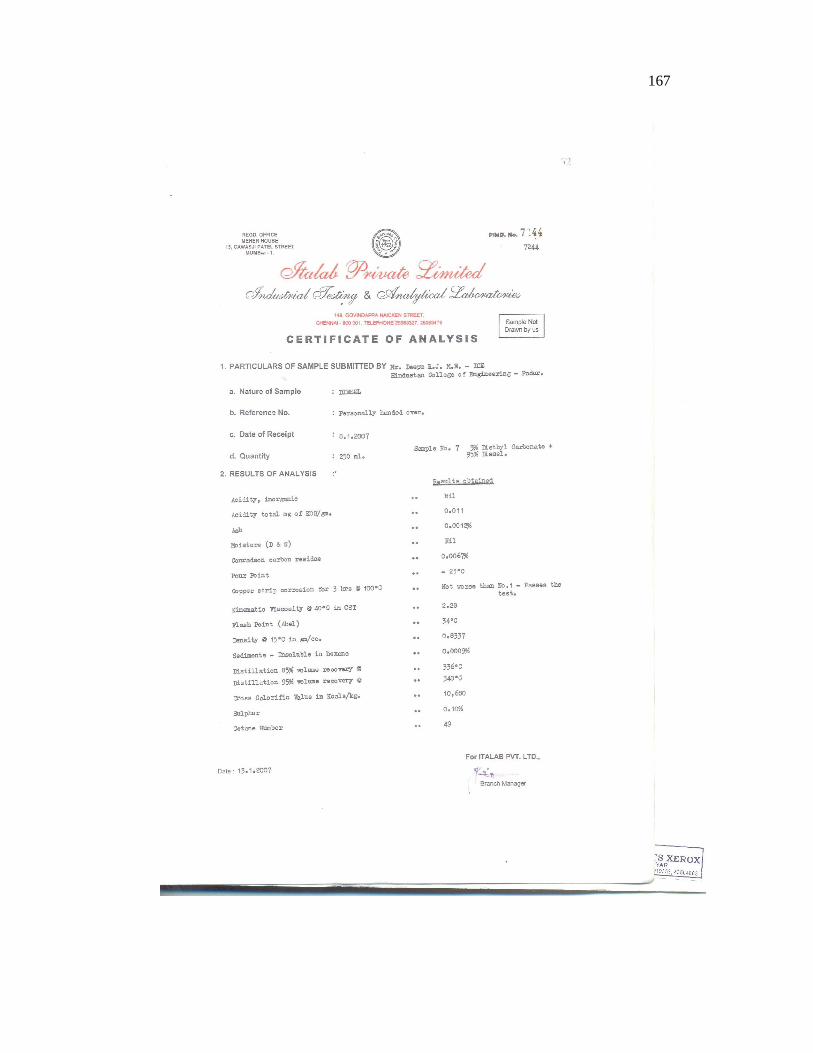
Table 3.3a and 3.3b represent the properties evaluated in the lab. It will be worthwhile to provide the equipment used, procedure followed briefly and the experimental error analysis of all these data points in the thesis.
The properties are tested in Italab Private Limited, Chennai, Page 27.Sample test certificates attached. Pages 164-167
P26; Last line: What was the duration of the test? Please define “Considerable Period”. There has to be a comparison with baseline diesel fuelled engine, which is missing in the thesis. Nowhere the thesis talks about the possible adverse effects of the oxygenated fuels and why they have not picked up in last 100 years inspite of their benefits being demonstrated time and again.
Page: 28. The test standards followed for this are BIS: 10003-1981 “specification for performance requirements for CI engines for automotive purposes.” After running this engine for a period of 4 hours, * Oxygenates are 10 to 25 times costlier than diesel. * Heating values are lower than diesel. * Corrosive at when the blending level exceeds 20%
Page 29.
197
Chapter
No.Indian Examiner remarks Corrections
carried out 4
Figure 4.2 is very poorly drawn and poorly labeled schematic diagram of the experimental setup and need improvement
Fig. 4.2 replaced. Page: 42
P50: It is not clear as to how the data is taken every 1 crank angle degree (CAD) without using a high precision shaft encoder? Has it been used? If yes, please provide details in the thesis. If no, please explain how the measurement of pressure-crank angle diagram is done accurately without any signal for crank angle degrees.
At every 1interval, the PC based engine-indicating system, measures the cylinder pressure for all the four strokes. Thus, 720 angle and pressure values are collected. Figure 4.2.
P53: This chapter provides details of smoke meter and its working principle however there are no details of exhaust gas analyzer. It is important to provide the specifications of the emission measurement system, range, accuracy, measurement principle and repeatability. It is also important to note that portable 5-gas analyzer does not provide reliable readings especially for NOX measurement and it is good only as “Garage equipment” rather than equipment required for “Research and Development”.
Explained in Page: 55 HC (Non dispersive infra red analyser) and NOX values (chemical sensor and catalytic reaction) are measured in ppm by volume. CO and CO2 readings (Non dispersive infra red analyser) are given as percentage by volume.
198
Chapter
No.Indian Examiner remarks Corrections
carried out 5 P64: How can you conclude that the
experimental results and simulation results are similar. One can clearly see a difference of at least 7-8 bars in peak cylinder pressure and visibly different shapes of the curves. This is definitely a WRONG conclusion based on figure 5.1 – 5.4. It shows that there are glaring loopholes in the simulation model, which is too simplistic to capture the complexities of engine combustion process. The chemical kinetics software “Chemkin” should have been used to incorporate the chemical kinetics of combustion of the three oxygenated fuels in order to get superior and more reliable results. Why only 30% load is chosen for model validation w.r.t. experimental data (Figure 5.1–5.4). It is a normal practice to validate the model at idling, partial load and full load to verify that the model is predicting results well over the entire load range of the engine.
Explained Page: 82The simulated values are
higher as the model is a basic one with zero dimensional single zone combustion configurations. This model computes the heat release values with the assumptions that all fuel injected in to the cylinder is completely burned instantaneously having no unburned or partially burned zone.
P71: Figure 5.8 shows variations (with errors of upto 5 bars) between the experimental and simulation results. Figures 5.5 – 5.7 show simulation results where the difference in peak cylinder pressure is of the order of 1-3 bar, which is lower than the errors in earlier mentioned figures. This could be well within the statistical error rather than any actual difference in combustion behavior. This needs to be explained scientifically. Same observation is also valid for figures 5.9 – 5.14.
Explained in Page: 82
However the mass fraction of fuel burned is determined based on Wiebe’s combustion model and the values of “m” are determined based on oxygen content and chemical structure of the oxygenate. This show a path for further research in modeling oxygenated diesel combustion.
199
Chapter No.
Indian Examiner remarks Corrections carried out
5 Section 5.1.In the name of model validation, validation is done only by using P-theta diagram. The current practice is to use “Rate of Heat Release” diagrams also for model validation.
Rate of heat release diagrams included for model validationPages 82 to 85
Section 5.2. Table 5.4 / Figure 5.16: The particulates have been reported in g/kw-hr whereas there is no description of a “Partial dilution tunnel / full flow dilution tunnel” being used in the chapter 4. These equipments are essential for such measurements. Please explain how these measurements are made without these equipments.Another observation about the emission measurements in general is that “NOX and Particulate are the pollutants of main concern from CI engines, CO and HC are emitted in very small quantities due to large A/F ratio combustion therefore these species are largely insignificant”.
The particulate levels are obtained from the conversion chart of the smoke meter manual (ULX900 HSU manual) and on switching to particulate mode the readings are displayed in mg/m3. The conversion chart scales include compensation for the temperature of the smoke. Page 54.
Figure 5.18: There is no clear cut trend of NOX increase / decrease with increasing oxygen content of the fuel. Similarly there is not a very clear trend for particulate (figure 5.17). There are several outliers. Please explain scientific reason behind this behavior of these fuels.
The temperature effect on NOX emissions is clearly shown in Fig. 5.25(b). At 45% and 60%loads the trend is closer to 30% load. …. Pages 100-101
Figure 5.23: The thermal efficiency curves are very low for the kind of engine being used. This suggests that the engines are not properly tuned.
Thermal efficiency of the engine is low as the engine is old. However the engine is tuned for maximum performance.Page 107
Figure 5.24 – 5.33: All the curves should also have been shown with a motoring curve for a better appreciation of the combustion.
Motoring curve shown.Pages 114 – 121
200
Chapter No.
Indian Examiner remarks Corrections carried out
5 Figure 5.34; 5.43: The ROHR diagrams show that the heat release (combustion) starts at -20 CAD and continues beyond 160 CAD suggesting that combustion duration is more than 200 CAD. In any CI engine, combustion lasts between 30 – 90 CAD depending on load (Ref: J B Heywood). The ROHR curve shape is also not correct. Please check your algorithm of converting pressure data into ROHR data. This needs to be corrected. Please look at the typical ROHR curve shapes in any research paper and compare the one provided in the thesis.
Rate of Heat release diagrams corrected. Page 129 – 133
5 Overall, combustion analysis includes analysis of P-Theta, dP/dTheta and ROHR diagrams. A detailed combustion analysis should have included more analysis of the combustion data such as cumulative heat release, 5%, 90% mass burn rates and durations, ignition delay period, combustion duration calculations etc., which are completely missing from this doctoral thesis. The base data is required for this analysis is already available. Only careful analysis of this data is required followed by presentation in graphs and one can get volumes of new information available about the combustion taking place with the oxygenated fuels. Clearly, one is required to do a few more calculations carefully and meticulously in order to get these results and is expected from a thesis submitted for the award of a doctoral degree.
Discussion on cumulative heat release, net heat release, combustion efficiency added. Pages 135 – 140
201
Chapter No. Indian Examiner remarks
Corrections carried out
- P.164: References: There are several mistakes in references. Please pickup any journals “Author Guidelines” and do the referencing carefully according to it following a uniform style and provide complete referencing information.
Mistakes in references corrected Page: 198
5 Simulation is normally carried out for predicting results which can not be attained by experiments. In this thesis, a model has been made, validated with the experimental results and the simulation and experimental results of Pressure-crank angle diagrams have been compared at several places. The model has however not been used for any purpose, which can not be served by experiments therefore defeating the whole exercise / effort of modeling. It is required to do some further analysis using computer simulation model developed in this research, which can not be possibly done using experiments and than include those results in the thesis in order to be able to justify the effort involved in modeling.
The basic idea behind developing this model is to test the oxygenates for higher blending levels. Higher blending levels of oxygenates has many limitations such as reduction of heating value, loss of lubricity, corrosion of engine components etc. Despite such limitations oxygenates affect highly the smoke and particulate emissions. They also affect HC, CO and NOX emissions beside some improvement in brake thermal efficiency. Before actually testing the oxygenates in an engine, simulation model shall be used for evaluating the oxygenates. Page - 39