24
Appendix 16 DEPOMOD Report with full production cycle

Appendix 16 DEPOMOD Report with full production cycle

Depositional Modelling TASSAL – WEST OF WEDGE
Background
Predictive modelling was undertaken using DEPOMOD v2.4.1 (Scottish Environment Protection Agency) to predict carbon
deposition on the sea bed arising from fish farm operations. It should be noted that the DEPOMOD platform was developed as a
predictive management tool. This modelling package is internationally recognised and widely used for both site management and
a regulatory tool to understand and predict potential impacts from farming operations.
Model procedure
The DEPOMOD platform has a modular design with three major components, a grid generation module, particle trajectory model and a resuspension model. The three modules work together to integrate empirical field data to produce a series of spatially referenced model outputs.
Grid generation module
The first module is the grid generator which converts field derived bathymetric data into a uniform grid containing information on depth, pen positions and sampling station positions for the area of interest. Raw bathymetric data, collected by Marine Solutions during the Zone Assessment, was processed using a gridding algorithm in Surfer V11.6 (Golden Software) to produce abathymetric grid covering the proposed farming zone (Figure 1).

Figure 1 . Site Map showing bathymetric contour data, lease (dashed line) and zone boundaries (solid line).
To produce fine-scale model outputs the grid generation module created a 15mx15m grid from the post-processed bathymetric
data. Sixteen (16) pen positions, designated by Tassal, were then integrated into the resulting bathymetric grid prior to running
the particle trajectory model.
Particle trajectory model
The particle trajectory module takes a series of estimates for parameters such as feed rate, feed wastage, feed digestibility and
the hydrodynamics of the site to calculate the initial deposition of particles on the bathymetry grid produced by the grid
generation module.

Production schedules have the greatest influence on the structure and number of model runs required to accurately predict
deposition over the production cycle. Production data was supplied by Tassal and modified by Marine Solutions to derive a daily
feed rate for ingestion into the DEPOMOD model framework (kg.pen-1.day-1).
The particle trajectory model requires individual model runs to be performed for any change in pellet diameter and or feed rates.
However due to the complex production cycle for this lease it was decide to use a uniform pellet size (9mm) throughout the
entire production cycle to reduce the number of model iterations required. Using a 9mm pellet size will overestimate the total
volume of carbon deposition as this pellet size class contains the highest % carbon by volume. Based on the production data 36
separate model runs, one representing each month at each of two leases, were performed to complete the full production cycle.
Settling velocities for both feed and faecal particles were estimated by the particle trajectory model within DEPOMOD using anormalised distribution around a mean value which is a standard method in the absence of empirical data shown in Table 1.
Parameter Estimate
Water content of feed 9%
Feed digestibility 79%
Feed wastage (% of feed fed) 1%
Carbon as % of feed (dry weight) 9mm = 49%
Carbon as % of faeces (dry weight) 20%
Feed particle settling velocities 9mm Mean = 0.122 m.sec-1, SD = 0.02196
Faecal particle settling velocities Mean = 0.032 m.sec-1, SD = 0.011
Table 1. Particle trajectory model parameter estimates.

Hydrodynamics at the site were obtained from an ADCP deployment spanning approximately 6 weeks and sampled at a
frequency of every 10 minutes. Due to a limitation on the number of depth zones the DEPOMOD model can ingest, the full ADCP
record was summarised into 5 discrete layers to cover the 45Fm of the water column.
Resuspension module
The re-suspension module takes the results of the particle trajectory model and redistributes particles according to near–bed
current flow fields (obtained from the ADCP data) to predict the net carbon accumulated on the sea bed within the grid area. The
resuspension model also has the capability to ingest wind speed data to predict the effect on resuspension however due to the
depth of the site it was decided not to enable this option in the model runs.
Outputs from each model run where post-processed using Surfer v11.6 (Golden Software) to derive continuous gridded data for
map generation.
Model Outputs
Outputs from the carbon deposition models have been provided as a series of images following a standard nomenclature. Each
file name indicates the model used (carbon deposition) and the numbered production stage (1-18).
All model outputs are georeferenced data layers and can be read and incorporated directly into any GIS software platform.

DEPOSITIONAL MODELLING
Full Production Cycle

STEP 1

STEP 2

STEP 3

STEP 4

STEP 5

STEP 6

STEP 7

STEP 8
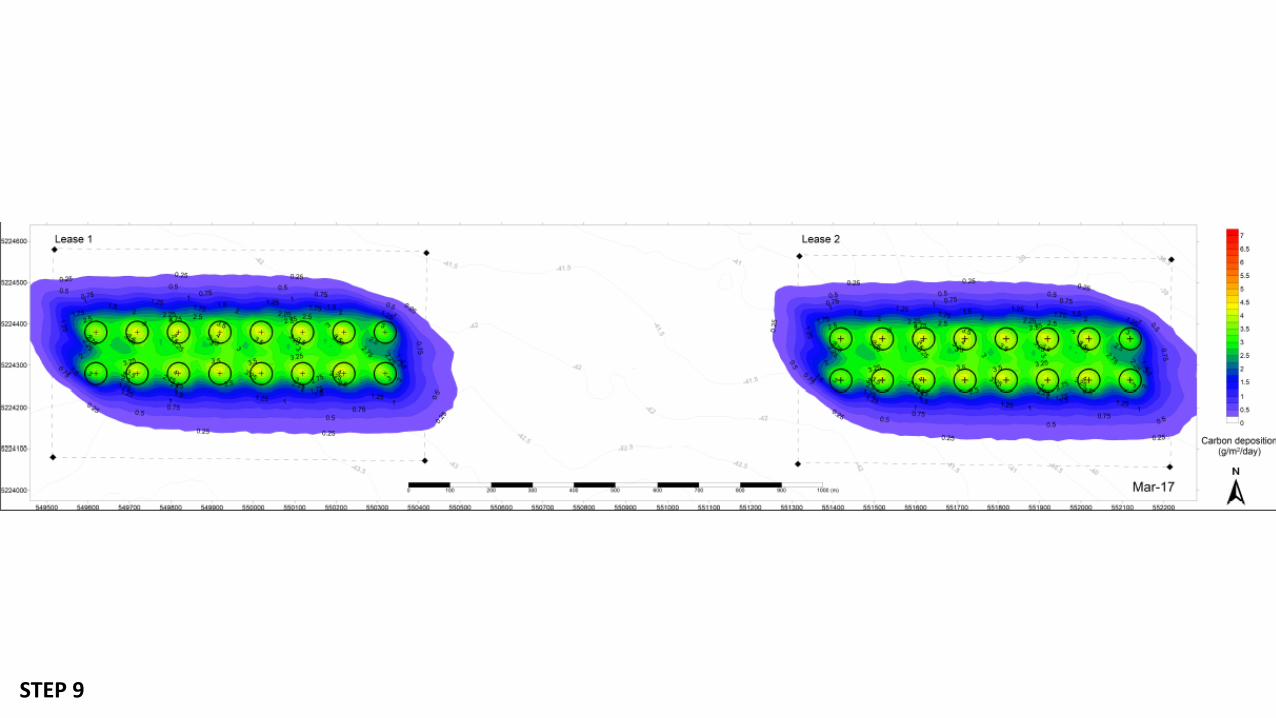
STEP 9

STEP 10

STEP 11

STEP 12
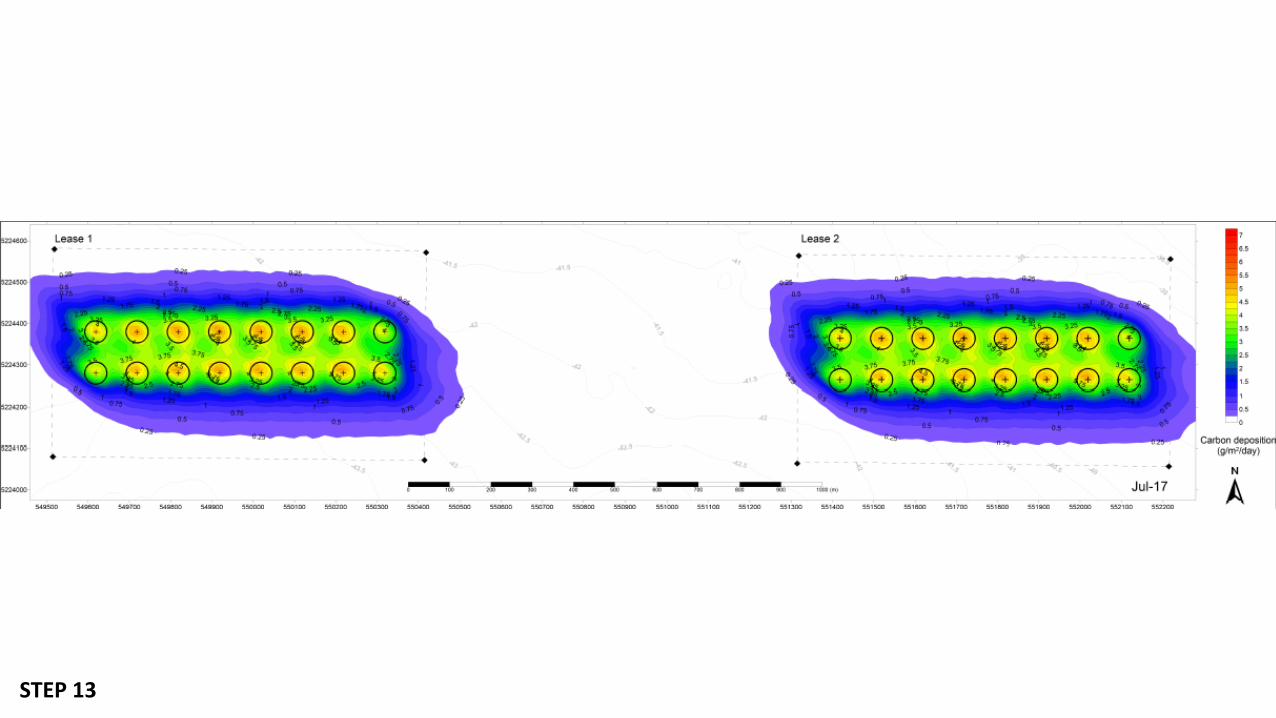
STEP 13

STEP 14

STEP 15

STEP 16

STEP 17

STEP 18


