Page 1
March 2011 | Frontier Economics, Atkins, ITS 1
Appendix 2 – A2 Motorway in Poland
Appendix 2 – A2 Motorway in Poland
2.1 Introduction
2.1.1 Project overview
This chapter presents the results of the ex post analysis for the first pilot project,
the construction of the A2 motorway between Konin and Strykow in Poland.
Location
The central position of Poland in Central-Eastern Europe means that the main
transport corridors passing through it are of international significance. More
specifically the A2 Motorway forms part of the European Route E30 between
Berlin and Belarus. As illustrated in Figure 1, the A2 also forms a cross section
with the proposed A1 (a north south axis between Gdansk and Vienna) at
Strykow (north of Lodz). The A1 also forms part of the European TEN-T and
therefore forms a route of international significance linking Poland with Austria;
Hungary and Greece.
The A2 Konin to Strykow improvements considered in this evaluation is located
between Poznan and Warsaw and is shown in Figure 1.
Page 2
2 Frontier Economics, Atkins, ITS | March 2011
Appendix 2 – A2 Motorway in Poland
Figure 1. Location of the A2 Motorway Project in its National Context
Source: Openstreetmap.org
Description
Whilst the A2 enhancements are clearly of strategic significance to international
traffic, it also serves as a more regional/local link between Konin (at the western
extremity) and Lodz (at the eastern extremity). Prior to the improvements on
this stretch of the A2, the main connecting route between these main settlements
was the single lane R72. Congestion however remains an issue in peak periods on
the R14 (linking Strykow with Lowicz) which remains a single carriageway road.
It has experienced a considerable increase in traffic flows since the pilot project
opened. After the opening, the A2 has since been extended to include a bypass
around the village of Strykow. This was completed in 2008 and removed
significant proportions of through traffic from the R14 (see figure 2 for location)
through the village.
Good transport connectivity is regarded as key to supporting economic activity
and inward investment in the Lodz and Wielkopolska Viovodeships (Regions).
At the regional and local level, both the A1 and A2 have been recognised recently
as a key strength in assisting the delivery of regional and national economic
growth.
Given their strong strategic location combined with other economic stimulus
methods such as property tax breaks and incentives for SME (small and medium
Page 3
March 2011 | Frontier Economics, Atkins, ITS 3
Appendix 2 – A2 Motorway in Poland
size enterprises), Lodz and Konin (amongst others) are major focal points for
future economic growth both regionally and nationally. Already these
settlements have attracted significant inward investment from multi-national
organisations in the food, distribution, electrical manufacturing and car
manufacturing sectors – recent examples include Nestle; Unicom; Wrigley;
Volkswagen and Skoda.
The project evaluated comprised of the construction of a dual 2 lane motorway
between Konin and Strykow. The project was developed in two phases, from
Konin to Emilia (85.8 km, Phase 1) and between Emilia and Strykow (18.1 km,
Phase 2). Key timescales for the project are summarised as follows:
Commencement of Construction – December 2003;
Phase 1 Official Opening (Konin to Emilia) – June 2006;
Phase 2 Official Opening (Emilia – Strykow) – July 2006;
Strykow Bypass Official Opening – December 2008; and,
Estimated completion date of A2 upgrades between Berlin and Warsaw
– 2012.
The A2 is, in part, toll motorway, with the exception of this new section. There
are proposals in place to introduce tolls on the section between Konin and
Stykow, and in April 2010 the construction of toll plazas at either end of the
project extremity was underway. The location of the project in its regional
context is shown in Figure 2
Page 4
4 Frontier Economics, Atkins, ITS | March 2011
Appendix 2 – A2 Motorway in Poland
Figure 2. Location of the A2 Motorway Project in its Regional Context
Source: Openstreetmap.org
Figure 3 provides a comparison between the A2 motorway, which is a dual two-
lane motorway, and the former route and current main alternative (the R2),
which is a wide single lane and subject to varying speed limits and route quality.
The R72 (the former route between Konin and Lodz) is similar to the R2 and
passes through a number of towns and villages.
Page 5
March 2011 | Frontier Economics, Atkins, ITS 5
Appendix 2 – A2 Motorway in Poland
Figure 3. A2 Motorway (above) and R2 (below)
Source: Photos taken during site visit (27th April 2010)
As set out in the Polish National Transport Policy 2006-2025, continued growth
in Poland‟s economic prosperity (as shown in Figure 4) in the period 2000-2007
brought with it a number of problematic trends in national transport patterns,
including:
increased mobility of people in the form of greater car ownership
(Table 1);
a smaller mode share for rail freight and passenger transport (the freight
distribution market being more focused on road transportation);
growing user expectations in terms of comfort; reliability; safety; travel
time and low cost; and,
Page 6
6 Frontier Economics, Atkins, ITS | March 2011
Appendix 2 – A2 Motorway in Poland
a growing burden on the environment.
Figure 4. GDP per Capita for Lodzkie and Wielkopolskie Vovoidships compared to
Poland.
Source: Poland Central Statistical Office (http://www.stat.gov.pl/gus/index_ENG_HTML.htm)
Table 1. Growth in Car Ownership 2003 to 2008
2003 to
2004
2004 to
2005
2005 to
2006
2006 to
2007
2007 to
2008
Poland 6.5% 3.0% 8.5% 9.0% 10.2%
Łódzkie 5.1% 1.3% 8.0% 8.9% 10.1%
Wielkopolskie 5.8% -2.8% 7.9% 8.9% 11.0%
Source: Poland Central Statistical Office (http://www.stat.gov.pl/gus/index_ENG_HTML.htm)
Strategic policy context
The policy background for the A2 Konin to Strykow improvements has been
clearly set out in the individual Funding Applications. The A2 runs through the
industrial centre of Poland. Its improvement was identified as being a key
priority to supporting accession and integration into the EU in key strategy
documents including the National Transport Policy 2001 -2015; Conception of
the National Land Use Policy and Economical Strategy and Polish National
Development Plan 2004 -2006.
The Polish National Development Plan 2004-2006 identified this project as one
of the first priorities for developing the wider national motorway system in
Poland and sets out the socio-economic strategy for its first years of membership
0
5,000
10,000
15,000
20,000
25,000
30,000
35,000
2000 2001 2002 2003 2004 2005 2006 2007
GD
P (P
LN
) p
er
ca
pita
POLAND
ŁÓDZKIE
WIELKOPOLSKIE
Page 7
March 2011 | Frontier Economics, Atkins, ITS 7
Appendix 2 – A2 Motorway in Poland
in the EU. This document has since been updated in the form of the “Strategy
of Transport Infrastructure Development in 2004-2006 and following years”.
The main objectives stated in the latter are focused on removing barriers to
economic development posed by the insufficient transport infrastructure and on
improving the integration of Poland's transport network with the network of the
European Union and reducing environmental and social costs caused by lack of
infrastructure. Specific priorities for the investment included:
ensuring of effective road and rail connections needed for
intensification of trade turnover within the Common Market;
improvement of accessibility of main urban areas in Poland, constituting
vital centres of economic development;
support of the regional development;
improvement of road traffic safety and elimination of high social and
economic costs of road accidents;
reduction of environmental protection costs owing to more sustainable
development of transport sector; and
development of the inter-modal systems.
2.1.2 Sources
We have used a number of different data sources for this review. They can be
grouped into two categories:
project documentation; and,
primary & secondary data.
We summarise them below
Project documentation
We have obtained a number of documents relating to the A2 Konin to Strykow
project. These are listed in Table 2, together with their source.
Page 8
8 Frontier Economics, Atkins, ITS | March 2011
Appendix 2 – A2 Motorway in Poland
Table 2. Summary of project-related documentation
Document (Author) Obtained from
Feasibility Study (GDDKiA)
Konin to Stykow (February 2003) GDDKiA
Financial Gap Calculation Report (PriceWaterhouseCoopers)
Konin to Emilia (August 2008)
Emilia to Strykow (August 2008)
GDDKiA
Final Report (GDDKiA)
Konin to Emilia (August 2008)
Emilia to Strykow (August 2008)
DG REGIO & GDDKiA
Environmental Report Non Technical Summary (GDDKiA) (May 2004)
GDDKiA
EC Application for Assistance Forms:
Subsection: Emilia to Strykow (March 2003)
Subsection: Dabie - Wartkowice – Emilia (October 2004)
Subsection: Konin to Dabie (October 2004)
GDDKiA
Economic Analysis Report
Subsection: Emilia to Strykow (March 2003)
Economic and Financial Analysis Report
Subsection: Dabie to Emilia (October 2004)
GDDKiA
EC Commission Decisions
Subsection: Konin to Emilia
Subsection: Emilia to Strykow
DG REGIO
Financing Memorandum
Subsection: Emilia to Strykow DG REGIO
Primary and secondary data
We have undertaken a comprehensive data collection exercise. A summary of the
data we have obtained is shown in Table 3. We are grateful to GDDKiA, CUPT,
Ministry of Infrastructure and the EIB for their help and assistance.
Page 9
March 2011 | Frontier Economics, Atkins, ITS 9
Appendix 2 – A2 Motorway in Poland
Table 3. Summary of Primary & Secondary Data Availability
Data Pre-project Opening Post-project Opening
Traffic flows
Comprehensive traffic count data has been supplied by GDDKiA for the year 2005 on the following routes: R2, R14 and R72.
A number of traffic counts which were undertaken in March 2010 have been made available from TransProjekt Warszawa (subcontractor of GDDKiA) for the following routes: A2, R2 and R72 and R14. A full set of data has been collected for the 2010 National Traffic Census but this could not be made available within the timescales of this study.
Highway journey times
Discussions with the key stakeholders revealed that pre project journey times on the main strategic route prior to the A2 opening (R2) do not exist. Therefore in the absence of further information the predicted ‘do-nothing’ journey times will be used to represent the pre project situation.
Post opening ‘moving observer’ journey time surveys were undertaken by the study team during the site visit in April 2010 for the purposes of this evaluation on the A2 (new route) and R2 (old route to Lowicz), R72 (old route to Lodz), and R14. These surveys were undertaken in both directions throughout the weekday.
Accident data
Accident numbers, location and frequency data has been provided by GDDKiA for the local highway network which includes R2 to the north and R72 to the south and R14 in the east. This covers the time period 2004 to 2006.
Accident numbers, location and frequency data has been provided by GDDKiA for the A2 project section, and the local highway network which includes R2 in the north, R72 in the south, and R14 in the east. This data covers the time period 2006 to 2008.
Project Costs
Predicted project costs are contained in the EC Application for Assistance Forms for each subsection of the project.
Project costs are contained in the Final Report which was submitted to DG Regio following completion of the project.
2.2 Ex post cost-benefit analysis
This section describes the analysis that has been undertaken to evaluate the ex
post outcome of this project, using observed data between 2005 and 2010. The
Standard Application Forms for Funding presented the economic benefits for
the relevant subsection of the project (with the exception of the Emilia to
Strykow Application which presented the economic analysis for the entire A2
motorway project based on the assumption that this section would not be built
without the other sections of the motorway). The Feasibility Study also presents
the economic benefits for the entire project and lists a number of the key
assumptions. The main sources of information used for this ex post CBA are
therefore the Application Form for the Emilia to Strykow subsection and the
Feasibility Study.
Following a site visit and discussions with key stakeholders, it has been
confirmed that the project has been implemented in line with that described in
the Application Form for Funding. This can be summarised as follows:
construction of dual 2 lane motorway between Konin and Strykow
which is not subject to tolls upon opening;
Page 10
10 Frontier Economics, Atkins, ITS | March 2011
Appendix 2 – A2 Motorway in Poland
construction of 7 grade separated interchanges facilitating access to and
from „gmina‟ and „voivoidship‟ highways;
environmental mitigation measures including planting and noise
barriers; and
associated ancillary infrastructure including service stations, signage and
maintenance centres.
2.2.1 Headline results from the analysis:
This section offers some headline results from the analysis which will be explored
in more detail in the following sections of this report.
Economic analysis
A summary of the results of the ex post economic analysis is shown in Table 4
with a summary of the difference between the high and low case scenario
contained in Table 5.
Table 4. Summary of ex post economic analysis (2003 prices)
Low case High case
Net Present Value (€m) 523 900
Economic IRR (%) 18.2% 22.8%
Benefit-cost ratio 3.0 4.4
Source: Own calculation
Page 11
March 2011 | Frontier Economics, Atkins, ITS 11
Appendix 2 – A2 Motorway in Poland
Table 5. Summary of the differences between the high and low case scenarios.
Scenario Traffic Flows Assumption Traffic Speed
Assumption
High Case
Traffic growth assumed to be the same as forecast (approximately 2-4% per annum throughout the
appraisal period).
Minimum speed 35km/h
Low Case Traffic growth 50% less than the forecast growth throughout the
appraisal period.
Minimum speed cut-off 2km/h faster than high case on R2. (37km/h).
Source: Own calculation
A detailed breakdown of the results is shown in Annexe 1
Financial analysis
We have also carried a financial analysis for the „Low case‟ and „High case‟
scenarios. From the point of view of the financial analysis both scenarios are
equivalent. There are two reasons why this is the case. First, the infrastructure is
a toll free motorway and revenues are zero in both cases, and second, costs are
the same in both scenarios. We have calculated the Financial Net Present Value
and Financial Rate of Return, for both the investment – FNPV(C) and FRR(C) –
and the capital employed – FNPV(K) and FRR (K). Finally, by taking into
account the EU and national contribution, we have also undertaken a financial
sustainability analysis. Table 6 summarises the results of the financial analysis for
each scenario. A detailed breakdown of the financial analysis results is contained
in Annexe 1.
Page 12
12 Frontier Economics, Atkins, ITS | March 2011
Appendix 2 – A2 Motorway in Poland
Table 6. Summary of ex post financial analysis (2003 prices)
Low/High case
Net Present Value – Investment (€m) -263
Financial IRR – Investment (%) -3.5%
Net Present Value – Capital (€m) 47
Financial IRR – Capital (%) 11.6%
Source: Own calculation
Wider socio-economic impacts
The project was implemented during a period of rapid economic growth in
Poland, so the wider socio-economic impacts directly attributable to the project
are difficult to establish. However, it is clear from our discussions with local and
regional stakeholders that the project has been instrumental in improving
connectivity at a local and regional scale. Anecdotal evidence from our
discussions also highlighted evidence of increased tourism, development of new
industries, and improvements to quality of life.
2.2.2 Costs
This section undertakes a comparison between the predicted and outturn project
costs in order to identify areas of under/overspend. The predicted and observed
project costs are contained in the Final Reports for the two subsections and are
summarised in Table 7.
Page 13
March 2011 | Frontier Economics, Atkins, ITS 13
Appendix 2 – A2 Motorway in Poland
Table 7. Summary of ex ante and ex post project costs (2003 prices discounted to
2003)
Cost Category Ex Ante
(€m)
Ex Post
(€m)
Level 1 (including VAT)
‘All-in’ 401.4 406.3
Level 2 (excludes VAT)
Land Purchase 0.1 0.2
Construction 324.7 327.7
Technical Support 13.6 15.7
Publicity 0.1 0.1
Source: Own calculation based on Application Reports and Project Completion Report
Table 7 shows that the actual costs are slightly higher than originally forecast. In
discussions with key stakeholders it became clear that the Application for EU
funding was based on an estimate of costs. The Project Completion Report
specified the following reasons for increases in cost over and above the Tender
price for construction:
extra land acquisition was required;
poor weather conditions in 2005 during the main construction phase;
additional drainage, earthworks and safety improvements required; and,
20% decrease in the value of the Euro compared to that assumed when
preparing the Feasibility Study and cost estimations.
We sought more disaggregated cost data on the basis of the methodology
developed by Work Package 10 of the ex post evaluation of the ERDF in the
2000-06 programming period.1 Neither the forecast or outturn costs made
available to the study team were consistent with the Level 2 or 3 unit cost
categories prescribed Work Package 10. The evaluation team did make enquiries
with GDDKiA and the EIB to obtain a more detailed set of cost figures, and
clarification of any differences. However, it was stated that the Application
1 „Ex post evaluation of cohesion policy programmes 2000-06. Work package 10: Efficiency – Unit costs of major projects‟.
Published on: http://ec.europa.eu/regional_policy/sources/docgener/evaluation/rado2_en.htm
Page 14
14 Frontier Economics, Atkins, ITS | March 2011
Appendix 2 – A2 Motorway in Poland
Forms and Project Completion Report should be used for definitive information
and a more detailed breakdown of costs is unlikely to be available.
Table 8 shows the project costs split into costs per km. With the data available
this is the closest match to Level 2 and 3 costs. Our analysis shows that on a cost
per km basis land purchase costs were around 67% higher than forecast. The
Level 1 unit cost was as predicted at €3.9m per km.
Table 8. Summary of ex ante and ex post project costs per km (2003 prices
discounted to 2003
Cost Category Ex Ante
(€)
Ex Post
(€)
Level 1 (including VAT)
‘All-in’ (€m/km) 3.9m €3.9m
Level 2 (excludes VAT)
Land Purchase (€/km) 900 1,500
Construction (€m/km) 3.1m 3.2m
Technical Support (€m/km) 0.1m 0.2m
Publicity (€/km) 600 400
Source: Own calculation based on Application Reports and Project Completion Report
2.2.3 Direct benefits
Time savings
The Application Form for Funding predicted journey times on two routes in the
study area. Post opening journey time surveys have therefore been undertaken by
the project team and a comparison of these figures is presented in Table 9.
Page 15
March 2011 | Frontier Economics, Atkins, ITS 15
Appendix 2 – A2 Motorway in Poland
Table 9. Summary of Predicted vs. Observed Journey Time Savings
Route Without project With
project Savings
Predicted
(Unknown
date)
Konin
to
Lowicz
2h 8min
(via R2)
1h 44min
(via A2, R14) 24min
Konin
to Lodz
2h 14min
(via R72)
1h 24min
(via A2) 50min
Observed
(2010)
Konin
to
Lowicz
2h 8min*
(via R2)
1h 36min
(via A2, R14) 32min
Konin
to Lodz
2h 14min*
(via R72)
1 hour
(via A2) 1 hour 15min
(*) Pre implementation journey time data was not available for this project. The predicted ‘without’ project
journey times have therefore been used for the purposes of this evaluation, which seem robust from our
observations on the site visit.
The table shows that the journey time savings resulting from the A2 project are
one hour 15mins which is greater than the predicted saving of 50 minutes. The
post opening journey times on R2 are also better than predicted.
Traffic Impacts and Congestion Reduction
Predicted traffic volumes were presented in the Feasibility Report for 2006. A
selected few of these counts have been factored to 2010 flows (at a growth rate
of 4% per annum) and are presented in Table 10. Also contained in the table are
observed pre and post implementation traffic flows. The pre project traffic flows
from 2005 have been factored by the same growth rate as those used for the
predicted flows, whilst the post opening traffic volumes are from 2010 so require
no factoring.
Page 16
16 Frontier Economics, Atkins, ITS | March 2011
Appendix 2 – A2 Motorway in Poland
Table 10. Summary of Predicted vs. Observed Traffic Volumes
Road Location
Predicted (2010) Observed (2010)
Without
Project
With
Project Before After
A2
Modla (west of
project) 19,200 19,800 17,000 21,200
Dabie to Kolo N/A 16,900 N/A 18,800
Emilia to
Wartkowice N/A 19,200 N/A 16,300
R2
Kolo 24,900 14,300 24,300 10,500
Kutno 16,200 7,900 15,900 7,400
R72
Aleksandrow
Lodski 9,300 4,500 10,900 6,300
Turek 6,700 5,000 9,800 5,400
R14 Jamno 14,800 23,900 12,500 16,700
Source: Predicted: Feasibility Study. Observed: GDDKiA.
The traffic flow data shows that actual traffic flows on the A2 are marginally
higher than predicted on the western section (Dabie to Kolo) and lower than
predicted on the eastern section (Emilia to Wartkowice). Traffic flows have
reduced considerably on the R2 and are now lower than forecast. Flows on the
R72 between Konin and Lodz have also decreased but are still higher than
forecast. R14 between Strykow and Lowicz has experienced an increase in traffic
volumes as expected, but traffic volumes are considerably lower than predicted
on this route.
The traffic flows presented in this section suggest that the vast majority of the
traffic using the A2 has re-assigned from the R2 in the north and the R72 in the
south. The figures suggest that there has been very little additional traffic as a
result of the project.
Safety
Observed accident data on the main routes in the vicinity of the project has been
made available by GDDKiA, and covers the period 2004 to 2008. The opening
year, 2006, has been excluded from the evaluation as it has not been possible to
determine whether the accidents recorded in this year occurred before or after
Page 17
March 2011 | Frontier Economics, Atkins, ITS 17
Appendix 2 – A2 Motorway in Poland
opening. The period 2004-2005 has therefore been selected to represent the pre
project situation, with 2007-2008 representing the post opening situation. This
data has been compared to the predicted number of accidents over the same time
period.
Table 11 shows that the number of predicted accidents is higher than observed.
This is primarily because the predicted accidents cover many of the minor roads
in the modelled area. As traffic volumes on these minor roads are not forecast to
significantly change as a result of the project, and hence we would not envisage
large change in accident numbers on these „minor roads‟. The observed data
cover the main strategic routes where traffic flows are forecast to have changed
(A2, R2, R72, R14). Therefore even though the percentage difference between
predicted and observed is similar, the absolute difference in the number of
accidents is likely to be a more accurate representation of the impact of the
project.
Table 11. Summary of Predicted vs. Observed Accident Numbers
Predicted Observed
Before Opening (2004 and 2005) 1,058 434
Post Opening (2007 and 2008) 937 395
Difference 121 39
% Difference 13% 10%
Source: Predicted: Feasibility Study Appendices. Observed: GDDKiA.
2.2.4 Externalities
The Application for Funding states that 0.5% of the benefits of the entire project
arise from savings due to lower air pollution levels. However, the technical basis
for these figures could not be established from the available documentation. As
these figures form a small proportion of the overall benefits they have not been
evaluated in this study.
2.2.5 Wider impacts
The Cohesion Fund is a structural instrument that helps Member States to
reduce economic and social disparities and to stabilise their economies.
Therefore it is important that this evaluation considers not only the impacts on
journey times, safety and utilisation, but also some of the more qualitative
impacts relating to the social, economic and physical environment. The ex ante
documentation for the three elements of the A2 project contained relatively little
information regarding the specific wider economic, social and environmental
Page 18
18 Frontier Economics, Atkins, ITS | March 2011
Appendix 2 – A2 Motorway in Poland
impacts likely to emerge from the projects. With respect to non-quantifiable
impacts the ex ante documentation stated that it was not possible to identify all
of the factors associated with the development of new motorway links in the
region of Poznan and Lodz. Despite this statement, the following anticipated
impacts were recorded elsewhere in the application document:
the project will create conditions for the improvement of transport and
development of the road network, which constitutes a growth factor;
it will improve safety for wild animals in proximity of the project;
pollutant volumes emitted into the air will be reduced;
environmental protection measures such as sound barriers, rain water
treatment facilities, overpasses for wild animals and protective greenery
belts will help mitigate against the adverse impacts of the new
motorway;
relieve traffic from towns and villages located on the old A2 alignment;
and,
support of national development aims set out in: Transport
Infrastructure Development Strategy 2000-2006; Polish Cohesion
Funding Utilising Strategy; National Transport Policy 2001-2015; and
the Polish Land Use Policy and Economic Strategy.
Further to the above, the ex ante evaluation provided an estimate of the number
of jobs (direct and indirect) that the project was anticipated to generate in the
construction and operational phases. The detail of the forecast impact on jobs is
discussed further in the sections that follow. The remainder of this section sets
out our general approach to assessing the wider impacts of this project. It then
summarises the impacts identified by stakeholders that can be attributed, at least
in part, to the A2 Konin to Strykow improvement.
Approach to Ex Post Evaluation
The recent global economic downturn, growth in Poland‟s national economy and
other policy/infrastructural interventions implemented at local, regional and
national levels will all have influenced the emerging patterns of development,
economic growth, social and environmental change along the A2 corridor.
To obtain a qualitative understanding of the broad economic, social and
environmental costs and benefits materialising from the A2 project, we talked to
with representatives of the following organisations:
Lowicz Town Office (Lowicz Town Mayor);
General Directorate for National Roads and Motorways: Lowicz;
Page 19
March 2011 | Frontier Economics, Atkins, ITS 19
Appendix 2 – A2 Motorway in Poland
Department of Planning and Maintenance of the Lowicz Powiat Road
Network;
Strykow Gmina Office (Strykow Mayor and Roads Inspector);
Lodz Special Economic Zone (Investment Development Specialists);
General Directorate for National Roads and Motorways: Lodz
(Economic and Finance Department/Environmental Protection
Department;
Kutno Department of Environmental Protection, Office for Promotion
and the Investor Service;
Konin Powiat – Promotion and Development Department; and
Konin Town Office (Department of Economic Activity and
Development).
The feedback provided in these consultations (intended to provide a range of
perspectives from officials within settlements across the extent of the project)
illustrates that much of the evidence regarding the wider economic, social and
environmental impacts of the A2 is at best anecdotal and often could not be
supported by quantitative statistics. It was also stated that wider economic
factors such as the recent economic downturn and Poland‟s access to the EU in
2004 may have influenced recent economic and land-use behaviours in the Lodz
region. There was however a degree of consistency in the views presented by
each consultee, this in its own right helps give some confidence in the likely
impacts of the A2 Konin to Strykow project. The remainder of this section now
focuses on summarising the emerging messages from these consultations.
Economy Impacts
The A2 Konin to Strykow Project is fully contained within the Lodz Special
Economic Zone (SEZ). The Lodz SEZ covers a geographical area of 1,162Ha
and contains some 18,670 workplace establishments. The purpose of the SEZ is
to support economic development of the Łódź region by encouraging
diversification of the business community; job creation; encouraging uptake of
modern production techniques and technologies; drawing upon existing
academic and research infrastructure and provide support for the existing
businesses in the Lodz region.
Consultation with stakeholders, suggests the A2 has been one example of an
enabler of economic growth in the Łódź area. The existing A2 alongside
proposals for completion of the project to Warsaw and proposals for the A1
project is regarded as a major selling point for government authorities attempting
to attract inward investment; land development and economic growth.
Collectively the stakeholders from across the Lodz region perceived that the A2
Page 20
20 Frontier Economics, Atkins, ITS | March 2011
Appendix 2 – A2 Motorway in Poland
project has made a positive contribution alongside other infrastructural and
policy measures to improving the economic environment across the region.
Economic Development and Investment
As part of a wider package of policy and infrastructural interventions, the A2
project is regarded as a key enabler of economic regeneration and development
by authorities in locality of the A2 project. Figure 5 provides and illustration of
the growth levels being in the Lodz SEZ, some of which can be attributed to the
ongoing improvements to the A2.
Figure 5. Investment expenditure and number of workplaces in the Lodz SEZ 1998-
2009
Source: LODZ SEZ Flexicurity – Our Key to Success (Lodz Special Economic Zone, 2008)
Whilst it is recognised that there were likely other background influences
contributing to rapid growth in the region, the rapid recent increase in
development along the A2 provides an example of the importance that the
business and industrial community place on accessibility to their suppliers, labour
force and markets. The A2 (and future A1) was also regarded as a key piece of
infrastructure which has helped to enhance investment conditions. The project
has been instrumental in attracting investment in the logistics sector. It was cited
by one stakeholder that in recent years, 8 new businesses were established in
Kutno‟s Industrial area close to the former A2 and felt that the distributing and
manufacturing sectors have benefited since the construction of the A2. It is
largely felt that development in the corridor has been fuelled by faster and more
reliable connectivity within Poland and to bordering countries (more specifically
to the west) provided by the A2. There was a perceived increased in international
Page 21
March 2011 | Frontier Economics, Atkins, ITS 21
Appendix 2 – A2 Motorway in Poland
lorry movements that was regarded as an indicator of how the A2 has helped
facilitate business activity. This is verified by the traffic data collected for the
existing and former A2 corridors (Table 12) which confirms a 75% increase in
HGV traffic in the A2 corridor.
Table 12. Summary of changes in A2 corridor HGV flows
Route Goods Vehicles flows
Light Goods Vehicles Heavy Goods Vehicles
R2 5.500 2,100
New A2 N/A 7,500
Total 5,500 9,600
Source: Observed before and after opening traffic count data
Anecdotally, greater road accessibility to region alongside other measures aimed
at attracting businesses has helped broaden the industry base in the corridor.
Although heavy industry remains important in the sub-region, diversification is
recognised as a key trend emerging in the region due to the increased presence of
major multinational companies from Western Europe and China. Indeed
development sites have not solely been converted to logistic and warehouse
accommodation, but for a mixture of uses including production of white goods;
food manufacturing; high tech goods and building materials. It should be
recognised that stakeholders have further attempted to exploit they geographical
and logistical advantage by offering development plots with good access to
resources; economic and social infrastructure; water and waste water facilities;
good cellular coverage; gas and electric connections as well as a range of tax and
other incentives offered by the Lodz SEZ.
The settlements of Warsaw; Poznan; Lodz, Wiceznia, Kutno, and Strykow and
other locations on the A2 exits are regarded as key beneficiaries of the A2. It is
envisaged by many that the completion of the A2 to Warsaw will only add to
further economic strengthening of the region. A concluding comment by the
SEZ, was that the levels of growth and land development achieved in Lodz of
late would have been difficult to achieve without investment in A2. Figure 6
illustrates the key focal points for development in the Lodz SEZ.
According to stakeholders, feedback from the business community regarding the
relative success and failures of the project has been non-existent. However it is
felt that rapid development levels been observed in the vicinity of the project is
evidence of the positive economic effects of the project on encouraging business
activity. There is general agreement that reduced international and national
journey times via the A2 could only result in enhanced business productivity and
Page 22
22 Frontier Economics, Atkins, ITS | March 2011
Appendix 2 – A2 Motorway in Poland
hence enables continued investment by companies in expansion. The stakeholder
representative from Kutno, stated that anecdotally the Kutno plain region had
had some medium adverse impacts on the gastronomy industry.
Figure 6. Distribution of Sub-Special Economic Zones in the vicinity of the A2
Motorway
Source: Lodz SEZ Flexicurity – Our Key to Success (2008)
Foreign Direct Investment
Available development land adjacent to exit points on the new A2 has been
subject to much interest from Foreign Direct Investors (FDI‟s). Improved
access to major economic centres such as Warsaw and Poznan and connectivity
from neighbouring countries (particularly to the west) has helped attract major
FDI into the settlements along the A2. Recent land purchases close to the A2
have been predominantly made by foreign investors, while Polish businesses have
been more interested in developing sites closer to the main towns where there is
better access to labour and markets. It was suggested that FDI‟s have been keen
Page 23
March 2011 | Frontier Economics, Atkins, ITS 23
Appendix 2 – A2 Motorway in Poland
to exploit the logistical and visibility benefits offered by the A2. In the vicinity of
Strykow, over 0.5million Ha of land has been developed mostly by foreign
companies from other parts of Western Europe and North America.
There were some suggestions that internal trading has increased between towns
and of strengthening supply chains, particularly those located along the A2
corridor, businesses previously based in Poznan have now moved to nearer to
Warsaw to exploit the levels of accessibility that were not there before.
Few stakeholders reported adverse economic impacts from the A2, a
representative from the SEZ suggested there had been a „probable‟ reduction in
service/fuel trade on bypassed route, although this has been offset with gains on
the R14 where traffic has increased following project opening.
Administrative Burdens
When challenged on the administrative burdens created following opening, little
feedback was provided. A number of stakeholders did comment on the increased
maintenance costs associated with pavement damage caused by diversions of
heavy traffic during construction on to lower capacity local routes and increased
traffic on the R14 following opening of the A2. One stakeholder quoted a 50%
increase in maintenance costs following the opening of the A2 due to new trips
generated by the increased development around the A2.
The R14 suffers from heavy congestion but this is due for renewal following the
works for the completion of the A2 to Warsaw by 2012, which will offer further
accessibility benefits. Congestion is particularly prevalent on the periphery of
Lowicz and is offsetting some of the journey time gains offered by the A2
improvement. Furthermore, Strykow‟s position at the end of the upgraded A2
had created some local congestion issues in town. These have since been resolved
following the completion of the A2 Strykow Bypass. Strykow‟s representatives
stated that their budgets for investment in the Gemina had increased by 40 times
since 2000, and this is perceived as a reflection of the increased attractiveness of
the area due to the A2 and proposals for the A1 corridor.
Property Values
Land values have increased substantially in recent years according to SEZ (100%
increase in recent years). This appears to reflect the commercial attractiveness of
the sites to investors whom have a preference for highly accessible sites with
good visibility from the core network, but is also reflected in the high sales prices
achieved by farmers selling their land along the proposed route.
Page 24
24 Frontier Economics, Atkins, ITS | March 2011
Appendix 2 – A2 Motorway in Poland
Social Impacts
Skills, Labour and Employment
Whilst it is not clear how these figures were prepared, Table 13 summarises the
number of jobs anticipated to be created as a result of the A2 project at the ex
ante stage. With an absence of baseline assumptions and the range of other
influencing factors affecting job growth in the vicinity of the project and Poland
more generally, it is not appropriate to provide a quantitative estimate of the
number of jobs created by the project as part of this ex post evaluation.
Table 13. Summary of Forecast Job Creation at time of Ex ante Appraisal
Construction Phase Operational Phase
Project
Phase Direct Jobs
Indirect
Jobs
Expected
Duration
Direct Jobs
(Increase
per annum)
Indirect
Jobs
(Increase
per annum)
Konin to
Dabie 1,450 2,200 15 140 325
Dabie to
Emilia 1,250 1,900 15 160 375
Emilia to
Strykow 300 625 21 32 80
TOTALS 3,000 4,725 - 332 780
Source: Application for Funding documents
Consultees in Lodz, Strykow, Konin, Kutno and Lowicz did provide verbal
feedback suggesting that the A2 improvement has facilitated job creation through
the large increase in investment in the area over recent years. A number of
consultees felt that historically the region had struggled to retain graduates and
skilled workers trained at Lodz‟s University. However there was some feeling that
this trend was declining and that urban areas with good linkages were becoming
more attractive places to seek employment in a variety of sectors including
warehousing, logistics and distribution, white goods manufacturing and electronic
items. Responses from stakeholders in Konin suggest there has been a decline in
local unemployment, however it is unclear whether this is attributable solely to
the A2 improvement or wider economic influences.
Community Impacts and Quality of Life
The main observable impact of the A2 has been its effects on traffic volumes and
composition.
Page 25
March 2011 | Frontier Economics, Atkins, ITS 25
Appendix 2 – A2 Motorway in Poland
As demonstrated in previous sections, the completion of the A2 has led to a shift
of traffic from less suitable populated routes onto an all-purpose inter-urban
route. Feedback provided by the Kutno stakeholder confirmed that no post
opening noise or air quality monitoring had taken place since the opening of the
project. They did however confirm that there has been a reduction in traffic on
the DK92 (former A2), assuming a link between traffic volumes and such types
of pollution, it is reasonable to assume that the latter have also reduced. It was
also confirmed the effect of this reduced traffic was a positive impact on quality
of life and the social environment. Konin and Strykow authorities also
recognised the positive impact of the projects on removing freight traffic from
less suitable routes in built up areas.
Whilst the enhanced connectivity and associated development investment has
brought many benefits, several stakeholders commented in the increase in
presence of HGV traffic. Whilst the A2 is suited to accommodating such traffic,
the R14 (particularly between Warsaw and Lowicz) is regarded as below standard
for carrying increased volumes of HGV‟s which in turn has contributed to safety;
congestion; air quality and noise concerns along the route. Furthermore a
number of stakeholders made reference to disrupted farming activities along the
R14 due to farming land being severed by a heavily trafficked route.
Issues of “rat running” were also put forward by stakeholders to the east of the
project still evident following opening of the A2 – this was largely attributed to
traffic attempting to avoid worsening congestion on the R14. It was
acknowledged that the completion of the A2 towards Warsaw will alleviate such
issues.
Whilst increased traffic in built up areas has its adverse impacts, there was
recognition that its causation (increased traffic) does have its benefits to local
communities. Increased development and economic presence essentially helps to
generate extra income for a settlement which can then be invested in improving
public realm.
Tourism Impacts
Stakeholders representing Stykow, Lodz, Konin and Lowicz all provided
examples of how the A2 had help to increase accessibility and attendance to the
region‟s tourist and cultural provisions. An anecdotal example was given by
Lowicz‟s representatives, according to whom the local annual Folklaw festival is
now attracting attendees from a wider geographical area. Such events are
regarded as major income earners as visitors spend money that supports hotels,
restaurants, leisure facilities and other services. Further feedback from a Konin
stakeholder illustrated that the A2 had help broaden the availability of cultural
opportunities and access to natural heritage.
Page 26
26 Frontier Economics, Atkins, ITS | March 2011
Appendix 2 – A2 Motorway in Poland
Impacts on the Environment
In response to the Environmental Impact Assessment prepared at the ex ante
phase of the project, a number of environmental mitigation measures were
proposed as follows:
noise absorbent barriers to be erected adjacent to settlements in order
to achieve the requirements of the national noise regulations;
animal crossing points comprising modified underpasses and some
special overpasses;
water pollution control structures between the road drains and the out-
fall, points to surface or ground water; this comprise oil interceptors,
sand traps, and two forms of combined balancing ponds/storage
reservoirs to treat road run-off to achieve national water quality
standards; and
vegetation plantings to assist in the amelioration of air pollution in the
area of settlements.
Two Post Opening Studies have been undertaken following the opening of the
A2. The first published in January 2008 focused on the section from Dabie to
Strykow, whilst the second published in June 2010 focussed on impacts between
Strykow I and Strykow II junctions. Both were conducted on behalf of
GDDKIA. Whilst stakeholders were asked to provide evidence on the emerging
environmental impacts of the project, very few examples were given.
Stakeholders all commented on the adverse effect of the increased traffic on the
R14 on noise and air quality, but no other examples of impact was provided.
The conclusions from the two studies are summarised as follows:
First study (Dabie to Strykow, 2008):
additional noise mitigation measures to improve acoustic conditions in
built up areas adjacent to the A2 should be put in place;
at locations adjacent to A2 with high noise levels (>60db during the day
and >50db during night time hours) it was recommended for land use
to be reserved for non residence purposes;
there was no evidence that the motorway has had a negative impact on
air quality or human health. The highest recorded level of nitrogen
dioxide in the air was 79u/m3 per hour (39.5% of permissible
thresholds);
concentration of petroleum hydrocarbons and slime were within
permissible levels;
Page 27
March 2011 | Frontier Economics, Atkins, ITS 27
Appendix 2 – A2 Motorway in Poland
a frequent monitoring and maintenance of water equipment was
recommended;
there was no evidence that the A2 on this section has had a negative
impact on soil condition in the proximity of the motorway;
the agricultural order of the area through which the motorway passes
had been disrupted, bringing a new order to surrounding areas; and,
the construction of the A2 has resulted in disturbance in wild animal
movements although there is some evidence that the two animal
underpasses were being used by both small domestic and wild animals.
Second study (Strykow II to Strykow I, 2010)
noise levels do not exceed maximum thresholds, but are approaching
them;
air pollution does not exceed permissible levels; and
the implemented rainwater management system is ensuring that soil and
ground water systems are not adversely affected in the vicinity of the A2
alignment.
Land Use Impacts
As highlighted elsewhere in this analysis, stakeholders perceive that the A2 has
had a significant impact on the development of land around exit points along the
A2 (particularly at Strykow and Konin, as shown, for example, in Figure 7).
Moreover, it has facilitated development on the edge of other settlements in the
Lodz SEZ including Kutno; Lowicz and Lodz itself.
Page 28
28 Frontier Economics, Atkins, ITS | March 2011
Appendix 2 – A2 Motorway in Poland
Figure 7. New Development at Strykow
Discussions with stakeholders in Konin and Strykow showed that the A2 has
been central to local spatial planning processes as local authorities were keen to
exploit the accessibility advantages it offers. In order to mitigate against the
adverse impacts of new development around the A2, Strykow has introduced a
policy that only development with a neutral or beneficial impact on the local
environment will be granted planning permission.
Modal Shift
In accordance with growing economic prosperity in Poland, car ownership has
increased in recent years (as shown in Table 1). This is reflected in increasing
traffic volumes discussed elsewhere in this document. Long term modal share
data shows that the proportional changes in car ownership levels in the vicinity
of the project are in line with national trends. Feedback from stakeholders
suggests that the A2 has resulted in reduced utilisation of the rail freight system
due to the increased attractiveness and flexibility of the road network.
Suggestions were also made that people‟s travel horizons may have increased
along the A2 corridor as journey times have reduced, however this can not be
verified in quantitative terms.
Utilisation rates
As requested by the TORs, we have considered the evolution of the utilisation
rate of the project since opening. We have calculated this by considering, for the
year 2010, the ratio between the actual total number of passenger car units
Page 29
March 2011 | Frontier Economics, Atkins, ITS 29
Appendix 2 – A2 Motorway in Poland
(PCUs) and the total potential number of PCUs that could be accommodated on
the A2, based on our route capacity calculations.
Table 14 shows the total number of PCUs in 2010 for two sections of A2. The
table also shows the total maximum capacity available, based on a calculation of
Congestion Reference Flow given by the UK formula:
Capacity = 2300 - (A x proportion of HGVs)
= 2300 – (24 x 50%)
= 1,100 x 4 lanes * hour to day factor (assumed 10 for this project)
= 44,000 vehicles per day
Table 14. Utilisation rates on the A2 Konin to Strykow (2010)
A2 Section Observed Flow
(PCUs)
Theoretical
Capacity Utilisation Rate
Dabie to Kolo 29,700 44,000 67%
Emilia to Wartkowice 24,450 44,000 56%
Source: Own calculation based on GDDKiA data, PCU factor =2 for HGVs and UK Capacity Formulae
Based on our calculation, we have found that utilisation rates on the two sections
of A2 are between 56% and 67%, largely because of the very high HGV
proportion of 50% suggesting spare capacity does exist. However, we note that,
due the assumptions underpinning this calculation, this result should be treated
as purely indicative and only represents a snapshot of the current situation.
Table 15 presents the utilisation rate at the end of the appraisal period (2022) if
the forecast traffic growth is realised (2010 to 2022 = 39% increase). This shows
that the project would be approaching capacity in 2022 if the forecast traffic
growth is realised.
Table 15. Estimated Utilisation rates on the A2 Konin to Strykow (2022)
A2 Section Observed Flow
(PCUs)
Theoretical
Capacity Utilisation Rate
Dabie to Kolo 41,300 44,000 94%
Emilia to Wartkowice 34,000 44,000 77%
Source: Own calculation based on GDDKiA data, PCU factor =2 for HGVs and UK Capacity Formulae
It should be noted that the forecast growth assumes no tolls on this section. If
for example, traffic growth was half of that forecast as a result of the tolls, the
Page 30
30 Frontier Economics, Atkins, ITS | March 2011
Appendix 2 – A2 Motorway in Poland
utilisation would be 81% and 66% for the Dabie to Kolo and Emilia to
Wartkowice sections respectively.
Unintended Effects
The nature of the positive impacts observed following project opening are largely
as desired and on the whole adverse unintended effects have largely been
avoided. Anecdotal evidence from stakeholders suggests that increased traffic on
the R14 between the improved section of the A2 and Warsaw has had adverse
impacts on noise, air quality and road safety. Furthermore maintenance
challenges on the R14 and other links to the A2 have emerged as a result of
greater presence of HGVs in the vicinity of the scheme. Furthermore public
awareness of proposals for development of Poland‟s motorway network has lead
to land values rising more than expected – hence the higher than expected land
costs associated with this scheme.
Accompanying Actions
We would envisage that the dramatic increase in capacity provided by the new
motorway is likely to have been sufficient to promote the success of the scheme
in its own right. The improved A2 itself has been used as a key selling point for
those involved in promoting economic development along the route e.g. Stykow,
Lowicz, Lodz and Konin.
2.2.6 Uncertainty and sensitivity analysis
The A2 project was appraised over a 20 year period and it‟s clearly impossible to
state what changes will occur in this timeframe which may affect the benefits
(traffic demand, other nearby projects etc). This unknown has therefore been
considered by introducing a high case and a low case scenario primarily based on
changes in traffic demand. A summary of the high and low case selected for this
study is shown in Table 5.
Re Forecast of impacts
A detailed analysis of the calculations used to inform the ex ante predicted
benefits has been undertaken prior to reforecasting the impacts using actual data,
and it can be seen that the route experiencing the most benefit due to the project
is the R2 – as would be expected. However, the magnitude of the difference
between the non investment and investment options is significant and therefore
warranted further investigation.
It is clear from the calculation spreadsheets that the predicted speed in the non
investment situation is 10km/h for the entire appraisal period from Konin to
Krośniewice (west of Kutno), and 10km/h from 2008 onwards between
Krośniewice and Lowicz. This entire stretch of road is over 100km in length and
represents a without project journey time in excess of 9 hours. This is clearly
Page 31
March 2011 | Frontier Economics, Atkins, ITS 31
Appendix 2 – A2 Motorway in Poland
significantly greater than the figures presented in the Funding Application which
states that a journey time saving between Konin and Lowicz of 24 minutes is
expected.
Hence, the primary reason for the high level of journey time and vehicle
operating costs benefits is the assumed non investment speeds that have been
modelled on the R2.
For example, in the UK, speed-flow relationships have been derived for different
road types, and these assume a minimum speed cut-off which is based on the
assumption that below a certain speed (45km/h in the case of a single
carriageway road), vehicles would either:
re-assign to alternative routes;
spread into quieter time periods or overnight (often known as peak
spreading); or
not travel at all, which is often modelled as suppressed traffic, which is
released in the form of induced traffic when journey times improve in
the future.
In our view, these speeds are unrealistically low, and this has been reflected in the
selection of the high and low case scenarios used for the outturn assessment.
Therefore, we have re-calculated the ex ante economic benefits of the project. To
do so, we have updated „with‟ and „without‟ project traffic volumes, assume
logical speeds on a number of key routes, and update VOT, VOC and traffic
accident rate values from recent sources. Below we provide a summary of our
assumptions.
Pre project (factored) and post project traffic volumes for 2010 were used in
conjunction with the same growth profile as used in the ex ante appraisal.
This assumed a traffic volume growth rate of approximately 2-4% per
annum.
The „investment‟ accident costs derived in this evaluation have been reduced
by 68% to account for the observed reduction in accidents (39) compared to
predicted (121).
The study area was revised to only include the key routes where benefits
would be expected. These are as follows: R2 (between Konin and Strykow),
R72 (between Konin and Lodz), R14 (between Lodz and Strykow) and the
A2 motorway. The A1 (running north-south through the area) and the R14
south of Lodz have therefore been removed from this evaluation.
The „non investment‟ vehicle speeds on the R2 have been increased from
10km/h to a minimum of 35km/h (i.e. a speed cut-off has been applied).
Page 32
32 Frontier Economics, Atkins, ITS | March 2011
Appendix 2 – A2 Motorway in Poland
10km/h is a very low speed cutoff for a rural road and indeed many urban
areas. Therefore 35km/h has been selected to more accurately reflect what
would occur in reality, and this still represents a conservative estimate.
The „investment‟ speeds on the R2 have been checked to ensure appropriate
logical speeds that reflect the lower traffic flows are adopted.
The „investment‟ speeds on the R14 between Strykow and Lowicz have been
increased as based on the site observations they appeared very low in the ex
ante appraisal. (A speed cut-off of 30km/h has therefore been applied).
Value of Time – Updated values taken from HEATCO (2006)2 guidance in
2002 prices adjusted to 2003. The actual journey type split (commute, work
etc) is unknown so the UK‟s WebTAG guidance default proportions have
been used.
Value of Accidents – These have been taken from the HEATCO (2006)
guidance in 2002 prices adjusted to 2003 with the split by severity taken
from the defaults used in the UK‟s COBA (Cost Benefit Analysis) accident
appraisal software.
Vehicle Operating Costs – This has been taken from the Blue Book for
Poland (September 2008)3, produced by JASPERS and adjusted to 2003
prices.
This approach is seen as the most appropriate for deriving a best estimate of the
outturn benefits of the project as it utilises updated sources of information whilst
retaining the „common sense‟ approach towards vehicle speeds discussed
previously. The low and high case developed to test the sensitivity of the project
to changes in traffic flow and speeds is summarised in Table 5 earlier in this
report.
Margin of Error
The high case scenario demand over the 30 year evaluation period generates an
NPV 72% above the low case scenario. This is primarily due to the level of
uncertainty associated with the levels of economic and associated traffic growth
forecast in Poland over the 30 year period, and also due to the different
assuptions of minimum speed cut offs used for the low and high case scenarios.
2 http://heatco.ier.uni-stuttgart.de/
3http://www.funduszestrukturalne.gov.pl/NR/rdonlyres/B07E158E-3A7A-43A2-87C4
84E1533AA415/47156/BlueBookPublicTransportfinalMRRMI12_092.pdf
Page 33
March 2011 | Frontier Economics, Atkins, ITS 33
Appendix 2 – A2 Motorway in Poland
2.3 Review ex ante cost-benefit analysis
Throughout this study, we have followed the „EC Guide‟. The majority of the ex
ante appraisal documentation was prepared between 2002 and 2004 (shown in
Table 2). However, it should be noted that the CBA for this project was
prepared in accordance with pre-existing EU guidelines entitled “Guide to Cost
Benefit Analysis of Major Projects in the Context of EC Regional Policy” (June
1997).
The Feasibility Study covers the entire stretch from Konin to Strykow. It
provides a summary of the context for this project. Its objectives are explicitly
stated in the EU Funding Application and can be summarised as follows:
provide a fast and convenient connection of the existing A2 motorway
section with Lodz and with Warsaw via existing national roads.
relieve traffic from the existing national road (No 2) and local towns
and villages between Konin and Lowicz;
improve safety on the existing roads (in particular National Route No
2); and,
Allow use by heavy trucks up to 115kN axle load.
Although the Feasibility Study provides some context to the project
development, the EU Application Forms contain the most comprehensive
description of the transport problems in the area, the project objectives and its
role in contributing to the overall transport vision for Poland (Transport
Infrastructure Development Strategy 2004-2006).
The CBA for this project only considered the implementation option that was
actually built. From brief commentary in the Feasibility Study, we understand that
the decision on the route was taken in 1995-96, although no indication is given
regarding this decision and its rationale.
2.3.1 Headline results from the analysis
Table 16 shows the results of the ex ante economic analysis of the project, which
shows a very positive benefit-cost ratio. A financial analysis was not undertaken
for this project, and the implications are considered later in this section.
Page 34
34 Frontier Economics, Atkins, ITS | March 2011
Appendix 2 – A2 Motorway in Poland
Table 16. Results of ex ante economic analysis
NPV (€ million,
2003 prices)
Economic IRR ~
(%)
Benefit-Cost
Ratio
Konin - Strykow 1,867 20.2% 3.1
Source: Application for EU Assistance Reports – March 2003
2.3.2 Key aspects of ex ante CBA
Traffic Analysis
The Feasibility Study contains traffic forecasts for the „non investment‟ (the do-
minimum) and the „investment‟ (the do-something) variants for the opening year
(2006) and a horizon year (2020). The 2020 forecast assumes that the A2 has
been completed between Germany and Warsaw, although it is unclear from the
technical documentation when exactly the next stage of the motorway becomes
operational. After reviewing the calculations we have received, we believe the
impact of the A2 extension are still excluded from the final years of the appraisal
period. The percentage increase in traffic throughout the appraisal period has
been derived using local guidance (‘Forecast of Traffic on Rural Network of National
Roads until the year 2020’), and the traffic growth ratios were assumed for the
whole area and not split by road classification. A number of other key
assumptions were used in the forecasting procedure:
the proportions of light and heavy vehicles were assumed to be 80%
and 20% respectively;
the potential impact of new traffic-generating developments in the area
was not considered; and
the forecasts do not include the potential for induced traffic resulting
from the project.
We could not obtain an explanation for the split between light and heavy
vehicles. However, an analysis of observed post-opening data suggests that this
assumption has significantly underestimated the proportion of heavy vehicles
both on the A2 and on the surrounding local highway network.
The study area for the ex ante appraisal is sufficient in size, as it covers the
obvious parallel routes (R2 in the north), R72 (in the south) and other local roads
in the area. The ex ante analysis also considers the potential for traffic re-
assignment from these nearby routes, presenting the predicted percentage
changes (albeit with a large range).
Page 35
March 2011 | Frontier Economics, Atkins, ITS 35
Appendix 2 – A2 Motorway in Poland
Economic analysis
As noted previously, the ex ante CBA only includes an analysis of the „non
investment‟ and „investment‟ options. It does not consider any other route
alignments at this stage. The project was appraised over a 20 year period (2003-
2023). The analysis assumes that capital costs would be incurred in 2003, 2004
and 2005 prior to opening in 2006. It was therefore assumed that benefits would
be accrued from 2006 onwards.
The project costs have been presented in the Feasibility Report (in Zlotys), and
are summarised in the EU Application forms (in Euros). When the currencies are
converted at the stated exchange rate (4.2PLN = 1 Euro), the costs in both
documents match. Predicted costs are also presented in the Project Completion
Final Reports for the 2 subsections alongside the actual costs accrued during
construction. The Final Report provides a breakdown of costs by key elements
(land purchase, construction, VAT etc). It is noted that the predicted costs
information falls short of the degree of granularity required to calculate „Level 3‟
unit costs as specified in Work Package 10, and are actually little more than „Level
1‟ costs with some additional breakdown.
With regards to benefits, the CBA makes the following assumptions:
Time Savings. The main time benefit for this project is for those users
who switch to the motorway, with predicted time savings of 24 minutes
between Konin and Lowicz and 50 minutes between Konin and Lodz. The
congestion relief for users remaining on the other local roads would have
been considered in the traffic model and resulting economic analysis.
However, the available documentation provides no commentary in this
regard. The values of time have been derived from Polish sources. These are
€3.60/hour for cars, €6/hour for trucks, and €29/hour for buses. It should
be noted that the values of time do not distinguish between leisure time and
work time. We would expect to see a higher value for drivers‟ work time.
The rationale for not differentiating between journey purposes (i.e. business
or leisure) is not presented.
Accidents. To calculate the accident savings, the CBA has assumed the
following values: €60,000 per accident, €120,000 per fatality and €25,000 per
injury. These were used in conjunction with standard accident rates by road
classification along with the predicted traffic volumes. The CBA presented
the monetary benefit arising from reduction in accidents but did not provide
an indication of which parts of the network are likely to see the most
benefits. It is noted that the cost of a fatality is very low compared to UK
values and indeed those contained in the 2002 EU Guide to CBA. The
assumptions underlying the ex ante accident costs are not reported in the
documentation.
Page 36
36 Frontier Economics, Atkins, ITS | March 2011
Appendix 2 – A2 Motorway in Poland
Vehicle Operating Costs. These benefits were established by calculating
the change in vehicle kilometres as a result of the project, then applying a
monetary impact per vehicle kilometre. The average monetary value used
was €0.16/km for cars and €0.60/km for trucks. The values take into
account factors such as highway condition and vehicle speed. The CBA,
however, did not present the rationale supporting these assumptions and
only indicated the average values used.
Air Pollution Emissions. Air pollution emissions account for a very small
proportion of the overall predicted project benefits (0.5%). They were
calculated using a cost per 1000 vehicle kilometres ranging from €0.72 to
€18.57, depending on the speed and type of vehicle. Again, the underlying
assumptions behind the calculations were not explicitly stated in the CBA.
In order to calculate the annual benefits of the project over 20 years, the CBA
multiplied the above values by the number of vehicles, taking into account traffic
volume growth and modelled speed changes. The „rule of a half‟, presented in
Annexe 1, would not have been required in this instance as no new trips were
assumed to result from the project.
In terms of wider socio-economic impacts, the Funding Application quantifies
the number of direct and indirect jobs that would be created in both the
construction and operational phases of the road investment. However,
supporting commentary to back up the figures was not provided.
An Environmental Impact Assessment was undertaken. The Funding
Applications contains a summary of the main results. Based on a review of the
Non-Technical Summary, it would appear that all aspects of the environmental
impacts were considered in detail. The air pollution impacts were monetised
based on changes in traffic volumes but these results are presented only in the
Funding Applications. A number of measures to mitigate the negative
environmental impacts were also presented (including noise barriers, wildlife
tunnels).
The CBA appendices contain the results of the calculations of costs and benefits
for each year of the appraisal period and present the net present value (NPV), the
internal rate of return (IRR), and the benefit-cost ratio (BCR). The CBA used
the 8% discount rate suggested by the EU guidelines “Guide to Cost Benefit
Analysis of Major Projects in the Context of EC Regional Policy” (June 1997) at
the time of application.
Table 17 provides a summary of the results of the ex ante cost benefit analysis.
These figures are presented in the Application for Funding for the Emilia to
Strykow subsection (although they relate to the entire project) and are the ones
we use to compare ex ante and ex post CBA later in this chapter.
Page 37
March 2011 | Frontier Economics, Atkins, ITS 37
Appendix 2 – A2 Motorway in Poland
Table 17. Summary of Predicted Benefits
Benefit Unit Value Present Value (€m)
Vehicle Operating Costs Car: €0.16/km
Truck: €0.6/km 1,289
Passenger time costs
Car: €3.6/hour
Truck €6/hour
Bus €29/hour
5,784
Drivers worktime costs Car: €3.6/hour 4,037
Accidents
€60,000/accident
€120,000/fatality
€25,000/injury
507
Air Pollution From €0.72 to €18.57/1000
vehicle km. 59
TOTAL 11,676
Source: GDDKiA
This table shows overall benefits of €11.7bn for the A2 Motorway between
Konin and Strykow, with 84% of the benefits being derived from journey time
savings, 11% from savings in vehicle operating costs, 4.5% from accident
benefits, with only 0.5% from air pollution benefits.
Financial analysis
The CBA was completed on the basis that the project would not be a toll
motorway, therefore it was assumed that a detailed financial analysis was not
required. However, the absence of tolls does not eliminate the need to carry out a
financial analysis. This is therefore an omission in the ex ante appraisal. We note
that the infrastructure necessary for collecting tolls is being installed even though,
based on the information available the future tolling of the route was not
considered in the CBA documents. The impact of tolls would clearly have a
detrimental impact of the economic results of the project, whilst improving the
financial results due to the income from revenues.
Time savings
An analysis of the technical documentation reveals a lack of detailed predicted
journey times. The Funding Application presents a forecast journey time saving
between Konin and Lodz of 50 minutes and between Konin and Lowicz of 24
Page 38
38 Frontier Economics, Atkins, ITS | March 2011
Appendix 2 – A2 Motorway in Poland
minutes. However, from this information, we could not ascertain exactly where
the journey time measurements were taken (for example, it could be the Lodz
junction on the A2 or Lodz city centre). For the purposes of the ex post
evaluation considered later in this chapter, we have made an assumption
regarding the start and end points for the predicted journey times.
Given the predicted journey time savings of an hour or more in future years, the
assumption of no induced traffic is conservative, as these time savings would
make induced traffic relevant to the appraisal.
Sensitivity Analysis and Risk Assessment
In addition to the „non investment‟ and „investment‟ options considered in the ex
ante appraisal, a small number of sensitivity tests were undertaken which aimed
to provide evidence relating to the robustness of the economic benefits of the
project. The tests which were presented are as follows:
+/-20% total traffic; and
+/-20% project costs.
It is understood that a standalone Risk Analysis document was not prepared for
this project, and the results of the above tests were presented in the Feasibility
Study and the EU Application for Funding documents. This showed that despite
variations in costs and traffic volumes, the project still performed well in terms of
its Internal Rate of Return (IRR). The IRR showed less variation resulting from
changes in cost than traffic flows. However, the results provide sufficient
confirmation that the benefits of the project are maintained despite the
substantial cost and traffic under/over estimates tested.
There is no indication from the documentation that any other forms of risk
and/or sensitivity analysis was undertaken for this project.
2.3.3 Summary
The CBA presented for the project option which was finally implemented is
complete and follows the appraisal guidance that was appropriate at the time.
However, we have identified a number of issues which are summarised next:
The decision making process for the choice of route alignment was carried
out prior to the CBA, therefore the reasons underpinning the selected
alignment are not considered in detail in the CBA assessment;
The predicted benefits seem to be high for a project of this kind (in excess
of €11billion). Although a project of this nature would be expected to
generate considerable benefits, the reasons for the exceptionally large
magnitude of benefits have been investigated in detail;
Page 39
March 2011 | Frontier Economics, Atkins, ITS 39
Appendix 2 – A2 Motorway in Poland
The CBA documents made available to the evaluation team do not provide
sufficient clarification regarding how the key assumptions were derived and
are often not consistent. This is supported by discussions with stakeholders
who stated that consultants often underestimate the importance of the
assumptions used in the CBA.
Based on the information received, it‟s clear that a formal risk assessment
was not undertaken for this project. Although the results of a small number
of sensitivity tests were presented.
There is no single self contained CBA document, with the data and results
spread between the Feasibility Study, EU Application Forms, and Economic
Assessment Reports. A standalone document which explicitly details the
process, assumptions and results is recommended which would create an
element of consistency and clarity when comparing different projects.
Based on discussions with stakeholders in Poland, there is a general view
that the quality of CBA‟s being published is improving; and
The key risks associated with this project (as with many others) were
identified as the forecasting of traffic demands, journey time assumptions
and project costs. We have carefully reviewed these assumptions as part of
our ex post evaluation.
2.4 Differences between ex post and ex ante analysis
Table 18 compares the results of the ex ante economic analysis as reported in the
Application for Funding Reports with the results of the ex post CBA for
Approach 3b, which we consider as the most representative ex post scenario.
Page 40
40 Frontier Economics, Atkins, ITS | March 2011
Appendix 2 – A2 Motorway in Poland
Table 18. Comparison of ex ante and ex post economic CBA (2003 prices)
Ex ante Ex post
Low case High case
Net Present Value (€m) 1,867 523 900
Economic IRR (%) 20.2% 18% 23%
Benefit-cost ratio 3.1 3.0 4.4
Source: GDDKiA for ex ante analysis and own calculation for ex post analysis
Overall, GDDKiA estimated that the project would deliver value for money,
with an NPV of €1,867m and a benefit-cost ratio of 3.1. However, we have
reviewed in detail all of the key parameters and made some significant revisions
in our ex post evaluation, and even with these changes the ex post analysis has
confirmed that the project has delivered value for money.
We have identified a few sources of differences between the ex ante analysis and
the ex post evaluation. We address them below.
Capital cost
Capital costs reported in the ex post evaluation are €406m, up from
approximately €400m reported in the ex ante analysis.
Traffic volumes
With regards to traffic volumes, the actual traffic volumes on the A2 are similar
to those predicted, with a greater transfer from Road 2 than predicted, but less
transfer from Road 72 than predicted.
In short, the traffic volume predictions in 2010 were realistic, and the traffic
volume growth was also sensible at 3-4% p.a. which is less than observed trends
in the corridor
Benefit calculation
With regards to benefit calculation, there are two main causes for the difference
between the ex ante and ex post analyses.
Different parameters. For the ex post CBA we have used updated values
for all the parameters used to calculate the benefits of the project, ranging
from the value of time, the reduction of vehicle operating costs and updated
accident costs. These are generally higher values than those used in the
Page 41
March 2011 | Frontier Economics, Atkins, ITS 41
Appendix 2 – A2 Motorway in Poland
original CBA (even when compared at the same price base) and hence the
application of this change has increased the benefits.
Modelled Speeds. As discussed previously, we have changed the modelled
speeds used in future years significantly. The CBA assumes that traffic
growth on Road 2 would cause journey speeds to deteriorate very quickly,
and speeds of 10km/h are shown for 2009, and all subsequent years. In our
view, this is unrealistic and we have increased these speeds to incorporate a
more sensible cut-off in line with best practice.
Inclusion of additional impacts
The ex ante CBA does not include two elements that should be included in
analysis.
Induced Traffic. The CBA states that induced traffic has not been
considered, i.e. only re-assigned traffic uses the new A2 Motorway. With
time savings of an hour, this level of time saving is likely to lead to additional
traffic in the corridor. This is likely to be the release of „suppressed‟ trips in
the „Without‟ Investment scenario, as well as generating completely new
trips. Once the A2 is complete to Warsaw, induced traffic may be
significant. The exclusion of this source of traffic may have under-estimated
benefits.
Foregone government revenues from the fuel tax. Changing vehicle
kilometres and vehicle speeds implies a change in overall fuel consumption,
which, in turn, implies a change in government revenues from the fuel tax.
The GDDKiA CBA did not include this impact in the ex ante CBA.
Discount rate
Finally, we note that, in the ex ante analysis, the calculation of the NPV of the
project used an 8% discount rate, as suggested by the guidance available at the
time. Currently, The EU recommends the use of a 5.5% discount rate which we
have used for the ex post evaluation. For comparison purposes, we have
calculated the NPV of the ex post evaluation using a discount rate of 8%. Table
19 summarises the results. It can be seen that the ex ante results shown
previously in Table 18 closely match the low and high case results discounted at
8% here. This indicates that on a like with basis, the project has delivered value
for money broadly in line with that predicted.
Page 42
42 Frontier Economics, Atkins, ITS | March 2011
Appendix 2 – A2 Motorway in Poland
Table 19. Estimate of 30 year economic benefit (discounted to 2003 at 8%)
Scenario
Undiscounted
Benefits
(€m)
Discounted
Benefits
(€m)
NPV IRR BCR
High Case 2,197 880 622 22% 3.2
Low Case 1,392 601.1 346 18% 2.2
Source: Own calculation
Finally, we note that the current Polish discount rate as specified by the National
Bank of Poland is 3.75%.
Residual value
In the ex post analysis we have calculated the expected residual value of the
project at the end of the appraisal period. In order to do this we have applied a
linear depreciation over 40 years to the capital expenditure incurred.
2.5 Role of CBA in decision-making process
In April 2010, we undertook structured interviews with senior representatives of
several central bodies to understand the role and success of the CBA approach.
The organisations we met with were:
Generalna Dyrekcja Drog Krajowych I Autostrad (GDDKiA);
Centre for European Transport Projects (CUPT);
Ministry of Infrastructure; and
The European Investment Bank (EIB).
With the exception of CUPT, all of the bodies consulted were involved in the
application process for the A2 Konin to Stykow project. The depth of ex ante
evaluation for the A2 project was largely dictated by the processes and
requirements set out by the EU guidelines in “Guide to Cost Benefit Analysis of
Major Projects in the Context of EC Regional Policy” (June 1997) at the time of
application.
It was generally felt that CBA guidance is useful and gives sufficient flexibility for
Member States to adopt aspects of their own CBA processes to meet the
challenges posed by different types of transport project. This does however
create some problems in that consultants regularly misunderstand the importance
of documenting their CBA assumptions clearly as part of the overall application
process.
Page 43
March 2011 | Frontier Economics, Atkins, ITS 43
Appendix 2 – A2 Motorway in Poland
Overall, the rigour of CBA auditing for Polish funding applications has improved
over recent years. Internally within Poland, all applications for cohesion funding
under the 2007-2013 have been subjected to a greater degree of auditing than was
the case for the A2 Konin to Strykow under the previous ISPA and 2000-2006
cohesion funding processes. An illustration of improvements to CBA auditing
procedures is the establishment of CUPT in 2007. The mission of this body is to
support beneficiaries such as GDDKiA in the preparation for and
implementation of EU funded projects including those funded through the EU
Cohesion Fund.
As a major investor in the A2 Konin to Strykow project and of other major
transport projects implemented in new Member States, the EIB undertook its
own CBA analysis using its own models based on more conservative values of
time, accidents and vehicle operating costs. Our discussions with the EIB were
useful to understand the Polish CBA issues and the key areas of risk, namely
traffic demand and cost forecasting.
Discussions held with the relevant stakeholders have revealed that CBA was not
used as a tool to prioritise between alignments for this pilot project as the
alignment had been set many years before EU accession. Our discussions
revealed that Poland has a national priority to build up its motorway network,
only after this has been achieved will CBA be more comprehensively used to
prioritise projects or options. Furthermore there was a general consensus that it
was political influence determining which projects progress and not the outcome
from CBA which at most confirms the extent to which a chosen project offers
value for money. This was also a view that Member States regard CBA as a
hurdle to jump in order to secure funding and the “go versus no go” scenario
rarely exists.
Stakeholders from the Member States expressed that it was rare to find poor
economically performing projects in the current list of priorities as they represent
such significant improvements to the national road network.
As result of EU guidance, the establishment of CUPT and greater experience of
CBA analysis for EU projects, it is generally felt that the reliability of the
application of CBA in Poland is improving.
Page 45
March 2011 | Frontier Economics, Atkins, ITS 45
Appendix 2 – A2 Motorway in Poland
Detailed results
Figure 8. A2 Motorway – Poland. Economic analysis (€m, 2003 prices) – Low case
Source: Own calculation
2003 2004 2005 2006 2007 2008 2009 2010 2011 2012
BENEFITS
Consumers Surplus
Time Benefits 0.0 0.0 0.0 56.5 85.2 95.3 95.5 94.2 91.4 86.8
Vehicle Operating Costs 0.0 0.0 0.0 -39.0 -1.0 0.6 8.0 11.5 9.7 5.3
Environmental Benefits 0.0 0.0 0.0 -0.1 0.1 0.1 0.1 0.1 0.1 0.0
Accident Reduction 0.0 0.0 0.0 -3.2 -1.7 -1.8 -1.4 -1.8 -2.1 -2.4
TOTAL BENEFITS 0.0 0.0 0.0 14.2 82.5 94.2 102.3 104.0 99.1 89.7
COSTS
Investment Costs
Land Purchase 0.0 0.1 0.0
Construction 25.9 222.8 93.2
Technical Support 1.2 10.7 4.5
Publicity 0.0 0.0 0.0
Total Investment costs 27.2 233.6 97.7
TOTAL COSTS 27.2 233.6 97.7 0.0 0.0 0.0 0.0 0.0 0.0 0.0
NET BENEFITS -27.2 -233.6 -97.7 14.2 82.5 94.2 102.3 104.0 99.1 89.7
2013 2014 2015 2016 2017 2018 2019 2020 2021 2022
BENEFITS
Consumers Surplus
Time Benefits 105.5 111.1 115.7 119.7 125.1 129.9 140.4 152.2 164.3 177.3
Vehicle Operating Costs 10.1 10.6 8.6 9.0 21.9 22.6 26.1 31.2 32.6 34.6
Environmental Benefits 0.1 0.1 0.2 0.2 0.2 0.2 0.4 0.4 0.4 0.4
Accident Reduction -2.3 -2.4 -2.5 -2.9 -3.0 -3.3 -1.4 -2.6 -2.7 -2.8
TOTAL BENEFITS 113.4 119.5 121.9 126.0 144.2 149.4 165.4 181.2 194.6 209.5
COSTS
Investment Costs
Land Purchase
Construction
Technical Support
Publicity
Total Investment costs -190.0
TOTAL COSTS 0.0 0.0 0.0 0.0 0.0 0.0 0.0 0.0 0.0 -190.0
NET BENEFITS 113.4 119.5 121.9 126.0 144.2 149.4 165.4 181.2 194.6 399.5
Discount Rate 5.5%
ENPV 523
ERR 18.2%
B/C Ratio 2.96
Page 46
46 Frontier Economics, Atkins, ITS | March 2011
Figure 9. A2 Motorway – Poland. Financial return on investment (€m, 2003 prices) –
Low case
Source: Own calculation
2003 2004 2005 2006 2007 2008 2009 2010 2011 2012
TOTAL REVENUES 0.0 0.0 0.0 0.0 0.0 0.0 0.0 0.0 0.0 0.0
Land Purchase 0.0 0.1 0.0
Construction 25.9 222.8 93.2
Technical Support 1.2 10.7 4.5
Publicity 0.0 0.0 0.0
TOTAL INVESTMENT COSTS 27.2 233.6 97.7 0.0 0.0 0.0 0.0 0.0 0.0 0.0
Maintenance 0.0 0.0 0.0 0.0 0.0 0.0 0.0 0.0 0.0 0.0
TOTAL OPERATING COSTS 0.0 0.0 0.0 0.0 0.0 0.0 0.0 0.0 0.0 0.0
TOTAL OUTFLOWS 27.2 233.6 97.7 0.0 0.0 0.0 0.0 0.0 0.0 0.0
CASH FLOW -27.2 -233.6 -97.7 0.0 0.0 0.0 0.0 0.0 0.0 0.0
2013 2014 2015 2016 2017 2018 2019 2020 2021 2022
TOTAL REVENUES 0.0 0.0 0.0 0.0 0.0 0.0 0.0 0.0 0.0 0.0
Land Purchase
Construction
Technical Support
Publicity
TOTAL INVESTMENT COSTS 0.0 0.0 0.0 0.0 0.0 0.0 0.0 0.0 0.0 -190.0
Maintenance 0.0 0.0 0.0 0.0 0.0 0.0 0.0 0.0 0.0 0.0
TOTAL OPERATING COSTS 0.0 0.0 0.0 0.0 0.0 0.0 0.0 0.0 0.0 0.0
TOTAL OUTFLOWS 0.0 0.0 0.0 0.0 0.0 0.0 0.0 0.0 0.0 -190.0
CASH FLOW 0.0 0.0 0.0 0.0 0.0 0.0 0.0 0.0 0.0 190.0
Discount rate 5.0%
FNPV (C) -263
FRR (C) -3.5%
Page 47
March 2011 | Frontier Economics, Atkins, ITS 47
Appendix 2 – A2 Motorway in Poland
Figure 10. A2 Motorway – Poland. Financial return on capital (€m, 2003 prices) –
Low case
Source: Own calculation
2003 2004 2005 2006 2007 2008 2009 2010 2011 2012
Revenues
Residual values
TOTAL FINANCIAL INFLOWS 0.0 0.0 0.0 0.0 0.0 0.0 0.0 0.0 0.0 0.0
Local contribution
Regional contrintribution
National contribution -1.4 -30.3 66.2 -1.3
Total national public contribution -1.4 -30.3 66.2 -1.3 0.0 0.0 0.0 0.0 0.0 0.0
Maintenance
Total Operating Costs 0.0 0.0 0.0 0.0 0.0 0.0 0.0 0.0 0.0 0.0
TOTAL FINANCIAL OUTFLOWS -1.4 -30.3 66.2 -1.3 0.0 0.0 0.0 0.0 0.0 0.0
NET CASH FLOW 1.4 30.3 -66.2 1.3 0.0 0.0 0.0 0.0 0.0 0.0
2013 2014 2015 2016 2017 2018 2019 2020 2021 2022
Revenues
Residual values 190.0
TOTAL FINANCIAL INFLOWS 0.0 0.0 0.0 0.0 0.0 0.0 0.0 0.0 0.0 190.0
Local contribution
Regional contrintribution
National contribution
Total national public contribution 0.0 0.0 0.0 0.0 0.0 0.0 0.0 0.0 0.0 0.0
Maintenance
Total Operating Costs 0.0 0.0 0.0 0.0 0.0 0.0 0.0 0.0 0.0 0.0
TOTAL FINANCIAL OUTFLOWS 0.0 0.0 0.0 0.0 0.0 0.0 0.0 0.0 0.0 0.0
NET CASH FLOW 0.0 0.0 0.0 0.0 0.0 0.0 0.0 0.0 0.0 190.0
Discount rate 5.0%
FNPV (K) 47
FRR (K) 11.6%
Page 48
48 Frontier Economics, Atkins, ITS | March 2011
Figure 11. A2 Motorway – Poland. Financial sustainability (€m, 2003 prices) – Low
case
Source: Own calculation
2003 2004 2005 2006 2007 2008 2009 2010 2011 2012
EU Grant 28.6 263.9 31.6 1.3
Local contribution
Regional contrintribution
National contribution -1.4 -30.3 66.2 -1.3
Total national public contribution -1.4 -30.3 66.2 -1.3 0.0 0.0 0.0 0.0 0.0 0.0
Operating subsidies
FINANCIAL RESOURCES 27.2 233.6 97.7 0.0 0.0 0.0 0.0 0.0 0.0 0.0
Passenger vehicles
Goods vehicles
TOTAL REVENUES 0.0 0.0 0.0 0.0 0.0 0.0 0.0 0.0 0.0 0.0
TOTAL INFLOWS 27.2 233.6 97.7 0.0 0.0 0.0 0.0 0.0 0.0 0.0
Land Purchase 0.0 0.1 0.0
Construction 25.9 222.8 93.2
Technical Support 1.2 10.7 4.5
Publicity 0.0 0.0 0.0
TOTAL INVESTMENTS COSTS 27.2 233.6 97.7 0.0 0.0 0.0 0.0 0.0 0.0 0.0
Maintenance
TOTAL OPERATING COSTS 0.0 0.0 0.0 0.0 0.0 0.0 0.0 0.0 0.0 0.0
TOTAL OUTFLOWS 27.2 233.6 97.7 0.0 0.0 0.0 0.0 0.0 0.0 0.0
NET CASH FLOW 0.0 0.0 0.0 0.0 0.0 0.0 0.0 0.0 0.0 0.0
CUMULATED CASH FLOW 0.0 0.0 0.0 0.0 0.0 0.0 0.0 0.0 0.0 0.0
2013 2014 2015 2016 2017 2018 2019 2020 2021 2022
EU Grant
Local contribution
Regional contrintribution
National contribution
Total national public contribution 0.0 0.0 0.0 0.0 0.0 0.0 0.0 0.0 0.0 0.0
Operating subsidies
FINANCIAL RESOURCES 0.0 0.0 0.0 0.0 0.0 0.0 0.0 0.0 0.0 0.0
Passenger vehicles
Goods vehicles
TOTAL REVENUES 0.0 0.0 0.0 0.0 0.0 0.0 0.0 0.0 0.0 0.0
TOTAL INFLOWS 0.0 0.0 0.0 0.0 0.0 0.0 0.0 0.0 0.0 0.0
Land Purchase
Construction
Technical Support
Publicity
TOTAL INVESTMENTS COSTS 0.0 0.0 0.0 0.0 0.0 0.0 0.0 0.0 0.0 0.0
Maintenance
TOTAL OPERATING COSTS 0.0 0.0 0.0 0.0 0.0 0.0 0.0 0.0 0.0 0.0
TOTAL OUTFLOWS 0.0 0.0 0.0 0.0 0.0 0.0 0.0 0.0 0.0 0.0
NET CASH FLOW 0.0 0.0 0.0 0.0 0.0 0.0 0.0 0.0 0.0 0.0
CUMULATED CASH FLOW 0.0 0.0 0.0 0.0 0.0 0.0 0.0 0.0 0.0 0.0
Page 49
March 2011 | Frontier Economics, Atkins, ITS 49
Appendix 2 – A2 Motorway in Poland
Figure 12. A2 Motorway – Poland. Economic analysis (€m, 2003 prices) – High case
Source: Own calculation
2003 2004 2005 2006 2007 2008 2009 2010 2011 2012
BENEFITS
Consumers Surplus
Time Benefits 0.0 0.0 0.0 69.4 82.5 95.7 99.4 102.0 103.1 102.8
Vehicle Operating Costs 0.0 0.0 0.0 -9.7 -1.7 1.8 5.9 11.5 11.9 9.7
Environmental Benefits 0.0 0.0 0.0 0.1 0.1 0.1 0.1 0.1 0.1 0.1
Accident Reduction 0.0 0.0 0.0 -1.9 -2.0 -2.0 -1.5 -1.8 -2.0 -2.1
TOTAL BENEFITS 0.0 0.0 0.0 57.8 78.9 95.6 103.9 111.8 113.2 110.6
COSTS
Investment Costs
Land Purchase 0.0 0.1 0.0
Construction 25.9 222.8 93.2
Technical Support 1.2 10.7 4.5
Publicity 0.0 0.0 0.0
Total Investment costs 27.2 233.6 97.7
TOTAL COSTS 27.2 233.6 97.7 0.0 0.0 0.0 0.0 0.0 0.0 0.0
NET BENEFITS -27.2 -233.6 -97.7 57.8 78.9 95.6 103.9 111.8 113.2 110.6
2013 2014 2015 2016 2017 2018 2019 2020 2021 2022
BENEFITS
Consumers Surplus
Time Benefits 85.0 85.8 85.4 84.2 83.9 81.8 84.9 88.6 90.8 93.4
Vehicle Operating Costs 3.3 1.3 -3.6 -5.8 -8.2 -10.8 0.7 2.1 0.0 -1.8
Environmental Benefits 0.0 0.0 0.0 0.0 0.0 0.0 0.0 0.0 0.0 0.0
Accident Reduction -2.6 -2.8 -3.1 -3.6 -3.9 -4.2 -2.7 -3.6 -3.7 -4.0
TOTAL BENEFITS 85.7 84.3 78.7 74.9 71.8 66.9 82.9 87.1 87.1 87.6
COSTS
Investment Costs
Land Purchase
Construction
Technical Support
Publicity
Total Investment costs 0.0 0.0 0.0 -190.0
TOTAL COSTS 0.0 0.0 0.0 0.0 0.0 0.0 0.0 0.0 0.0 -190.0
NET BENEFITS 85.7 84.3 78.7 74.9 71.8 66.9 82.9 87.1 87.1 277.5
Discount Rate 5.5%
ENPV 900
ERR 22.8%
B/C Ratio 4.36
Page 50
50 Frontier Economics, Atkins, ITS | March 2011
Figure 13. A2 Motorway – Poland. Financial return on investment (€m, 2003 prices)
– High case
Source: Own calculation
2003 2004 2005 2006 2007 2008 2009 2010 2011 2012
TOTAL REVENUES 0.0 0.0 0.0 0.0 0.0 0.0 0.0 0.0 0.0 0.0
Land Purchase 0.0 0.1 0.0
Construction 25.9 222.8 93.2
Technical Support 1.2 10.7 4.5
Publicity 0.0 0.0 0.0
TOTAL INVESTMENT COSTS 27.2 233.6 97.7 0.0 0.0 0.0 0.0 0.0 0.0 0.0
Maintenance 0.0 0.0 0.0 0.0 0.0 0.0 0.0 0.0 0.0 0.0
TOTAL OPERATING COSTS 0.0 0.0 0.0 0.0 0.0 0.0 0.0 0.0 0.0 0.0
TOTAL OUTFLOWS 27.2 233.6 97.7 0.0 0.0 0.0 0.0 0.0 0.0 0.0
CASH FLOW -27.2 -233.6 -97.7 0.0 0.0 0.0 0.0 0.0 0.0 0.0
2013 2014 2015 2016 2017 2018 2019 2020 2021 2022
TOTAL REVENUES 0.0 0.0 0.0 0.0 0.0 0.0 0.0 0.0 0.0 0.0
Land Purchase
Construction
Technical Support
Publicity
TOTAL INVESTMENT COSTS 0.0 0.0 0.0 0.0 0.0 0.0 0.0 0.0 0.0 -190.0
Maintenance 0.0 0.0 0.0 0.0 0.0 0.0 0.0 0.0 0.0 0.0
TOTAL OPERATING COSTS 0.0 0.0 0.0 0.0 0.0 0.0 0.0 0.0 0.0 0.0
TOTAL OUTFLOWS 0.0 0.0 0.0 0.0 0.0 0.0 0.0 0.0 0.0 -190.0
CASH FLOW 0.0 0.0 0.0 0.0 0.0 0.0 0.0 0.0 0.0 190.0
Discount rate 5.0%
FNPV (C) -263
FRR (C) -3.5%
Page 51
March 2011 | Frontier Economics, Atkins, ITS 51
Appendix 2 – A2 Motorway in Poland
Figure 14. A2 Motorway – Poland. Financial return on capital (€m, 2003 prices) –
High case
Source: Own calculation
2003 2004 2005 2006 2007 2008 2009 2010 2011 2012
Revenues
Residual values
TOTAL FINANCIAL INFLOWS 0.0 0.0 0.0 0.0 0.0 0.0 0.0 0.0 0.0 0.0
Local contribution
Regional contrintribution
National contribution -1.4 -30.3 66.2 -1.3
Total national public contribution -1.4 -30.3 66.2 -1.3 0.0 0.0 0.0 0.0 0.0 0.0
Maintenance
Total Operating Costs 0.0 0.0 0.0 0.0 0.0 0.0 0.0 0.0 0.0 0.0
TOTAL FINANCIAL OUTFLOWS -1.4 -30.3 66.2 -1.3 0.0 0.0 0.0 0.0 0.0 0.0
NET CASH FLOW 1.4 30.3 -66.2 1.3 0.0 0.0 0.0 0.0 0.0 0.0
2013 2014 2015 2016 2017 2018 2019 2020 2021 2022
Revenues
Residual values 190.0
TOTAL FINANCIAL INFLOWS 0.0 0.0 0.0 0.0 0.0 0.0 0.0 0.0 0.0 190.0
Local contribution
Regional contrintribution
National contribution
Total national public contribution 0.0 0.0 0.0 0.0 0.0 0.0 0.0 0.0 0.0 0.0
Maintenance
Total Operating Costs 0.0 0.0 0.0 0.0 0.0 0.0 0.0 0.0 0.0 0.0
TOTAL FINANCIAL OUTFLOWS 0.0 0.0 0.0 0.0 0.0 0.0 0.0 0.0 0.0 0.0
NET CASH FLOW 0.0 0.0 0.0 0.0 0.0 0.0 0.0 0.0 0.0 190.0
Discount rate 5.0%
FNPV (K) 47
FRR (K) 11.6%
Page 52
52 Frontier Economics, Atkins, ITS | March 2011
Figure 15. A2 Motorway – Poland. Financial sustainability (€m, 2003 prices) – High
case
Source: Own calculation
2003 2004 2005 2006 2007 2008 2009 2010 2011 2012
EU Grant 28.6 263.9 31.6 1.3
Local contribution
Regional contrintribution
National contribution -1.4 -30.3 66.2 -1.3
Total national public contribution -1.4 -30.3 66.2 -1.3 0.0 0.0 0.0 0.0 0.0 0.0
Operating subsidies
FINANCIAL RESOURCES 27.2 233.6 97.7 0.0 0.0 0.0 0.0 0.0 0.0 0.0
Passenger vehicles
Goods vehicles
TOTAL REVENUES 0.0 0.0 0.0 0.0 0.0 0.0 0.0 0.0 0.0 0.0
TOTAL INFLOWS 27.2 233.6 97.7 0.0 0.0 0.0 0.0 0.0 0.0 0.0
Land Purchase 0.0 0.1 0.0
Construction 25.9 222.8 93.2
Technical Support 1.2 10.7 4.5
Publicity 0.0 0.0 0.0
TOTAL INVESTMENTS COSTS 27.2 233.6 97.7 0.0 0.0 0.0 0.0 0.0 0.0 0.0
Maintenance
TOTAL OPERATING COSTS 0.0 0.0 0.0 0.0 0.0 0.0 0.0 0.0 0.0 0.0
TOTAL OUTFLOWS 27.2 233.6 97.7 0.0 0.0 0.0 0.0 0.0 0.0 0.0
NET CASH FLOW 0.0 0.0 0.0 0.0 0.0 0.0 0.0 0.0 0.0 0.0
CUMULATED CASH FLOW 0.0 0.0 0.0 0.0 0.0 0.0 0.0 0.0 0.0 0.0
2013 2014 2015 2016 2017 2018 2019 2020 2021 2022
EU Grant
Local contribution
Regional contrintribution
National contribution
Total national public contribution 0.0 0.0 0.0 0.0 0.0 0.0 0.0 0.0 0.0 0.0
Operating subsidies
FINANCIAL RESOURCES 0.0 0.0 0.0 0.0 0.0 0.0 0.0 0.0 0.0 0.0
Passenger vehicles
Goods vehicles
TOTAL REVENUES 0.0 0.0 0.0 0.0 0.0 0.0 0.0 0.0 0.0 0.0
TOTAL INFLOWS 0.0 0.0 0.0 0.0 0.0 0.0 0.0 0.0 0.0 0.0
Land Purchase
Construction
Technical Support
Publicity
TOTAL INVESTMENTS COSTS 0.0 0.0 0.0 0.0 0.0 0.0 0.0 0.0 0.0 0.0
Maintenance
TOTAL OPERATING COSTS 0.0 0.0 0.0 0.0 0.0 0.0 0.0 0.0 0.0 0.0
TOTAL OUTFLOWS 0.0 0.0 0.0 0.0 0.0 0.0 0.0 0.0 0.0 0.0
NET CASH FLOW 0.0 0.0 0.0 0.0 0.0 0.0 0.0 0.0 0.0 0.0
CUMULATED CASH FLOW 0.0 0.0 0.0 0.0 0.0 0.0 0.0 0.0 0.0 0.0
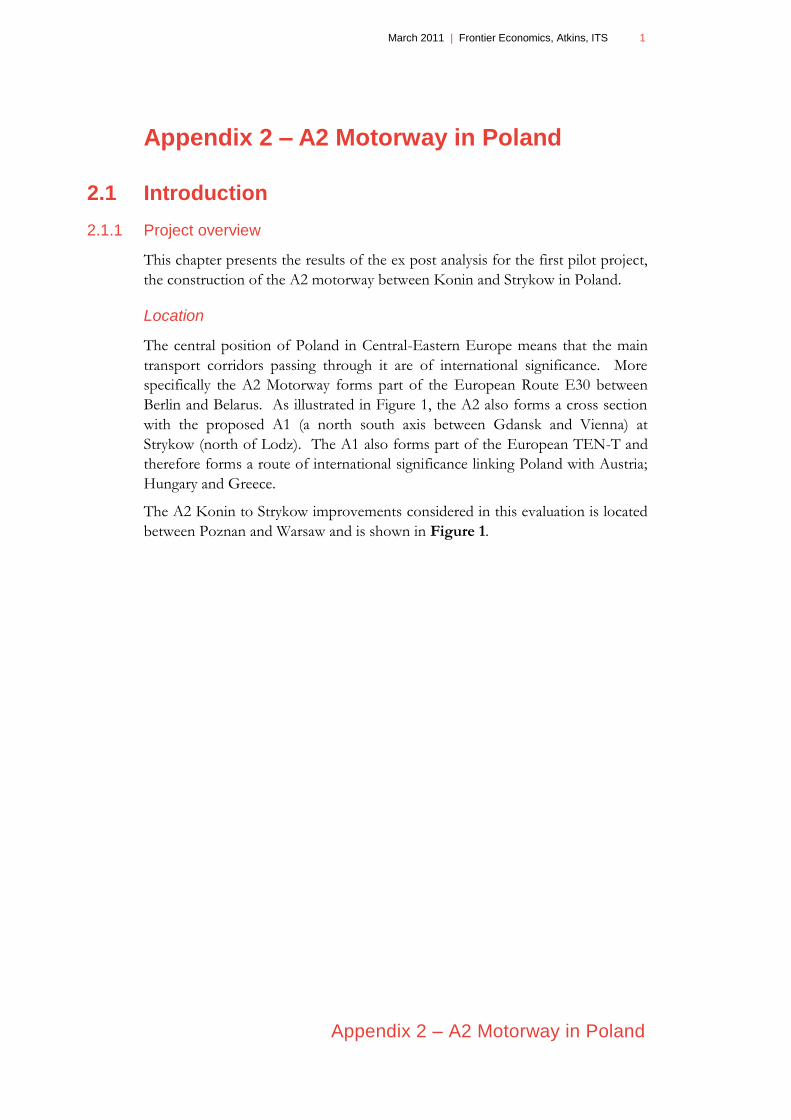
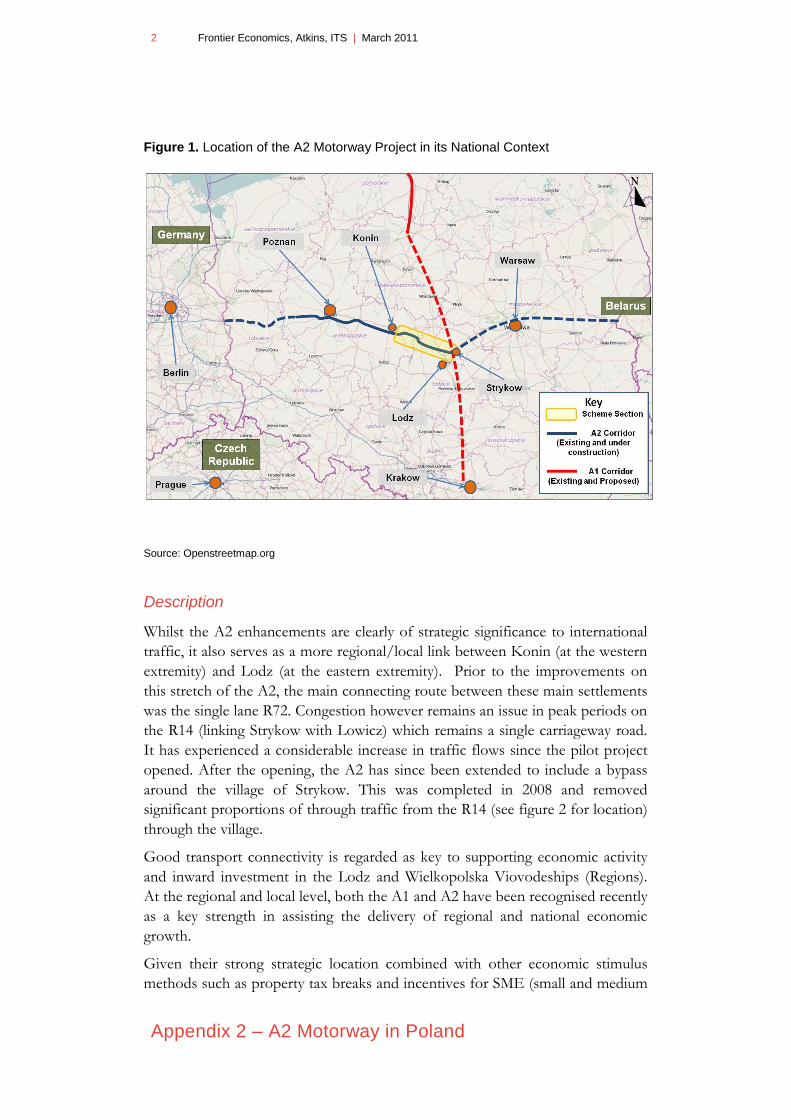
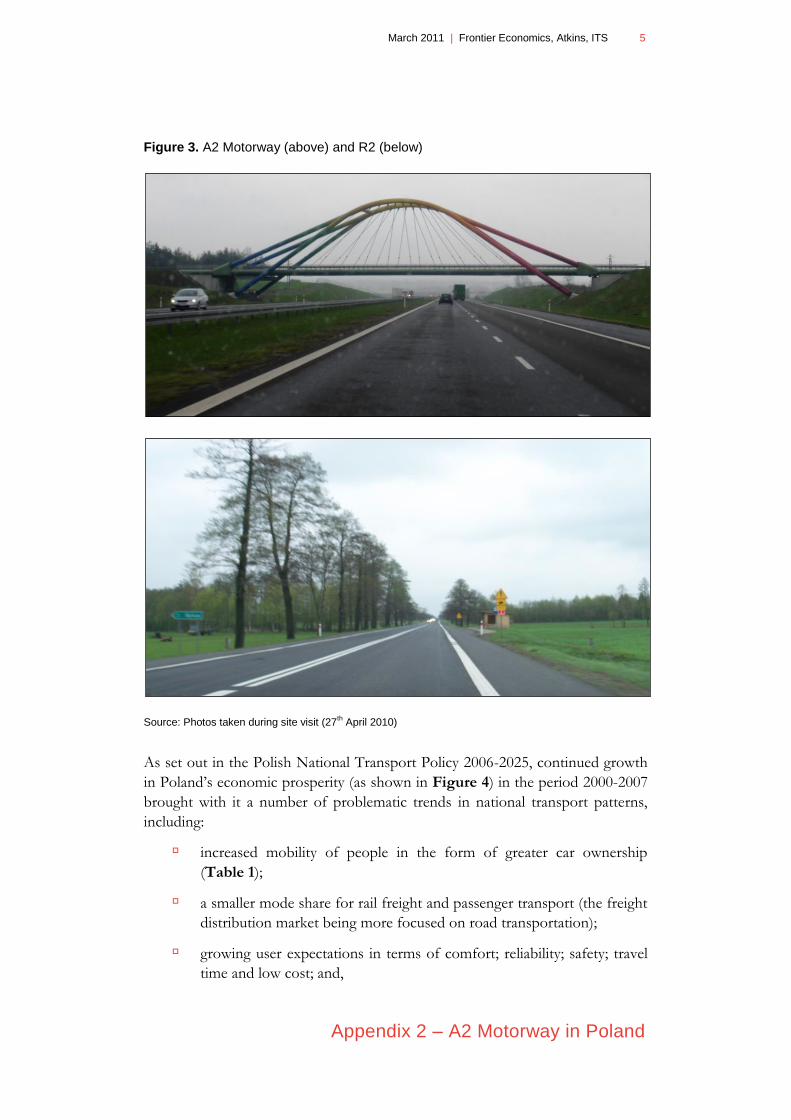
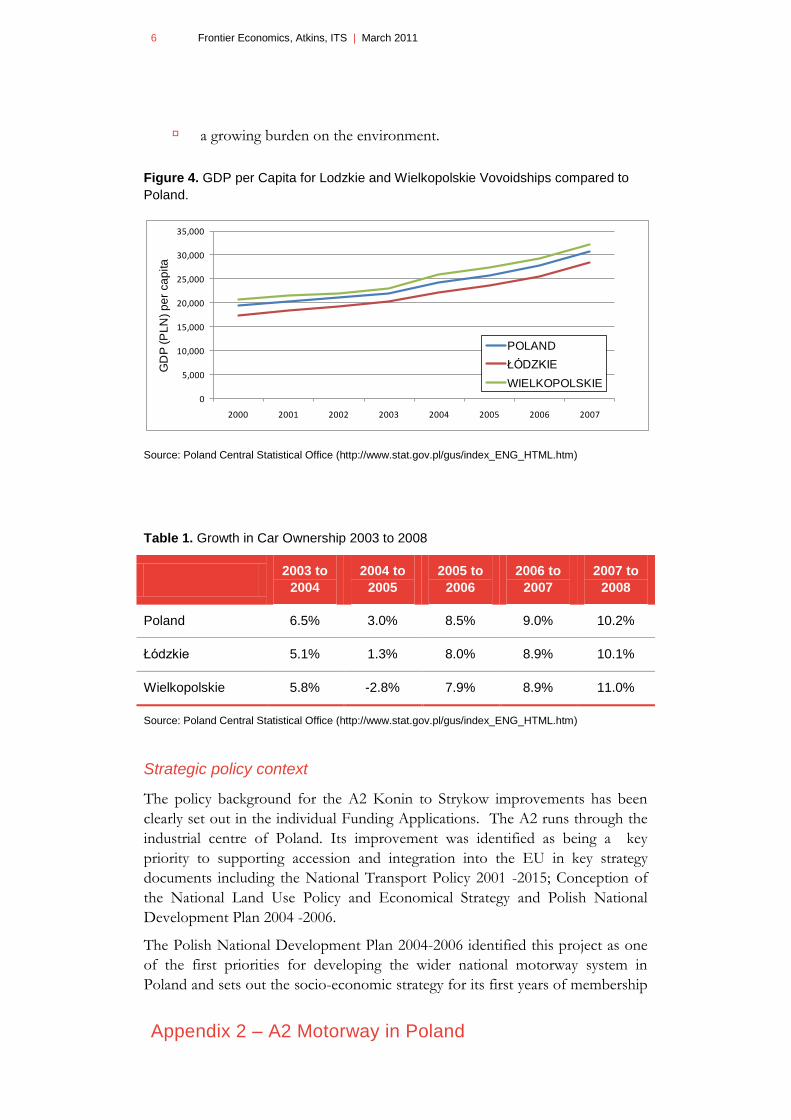
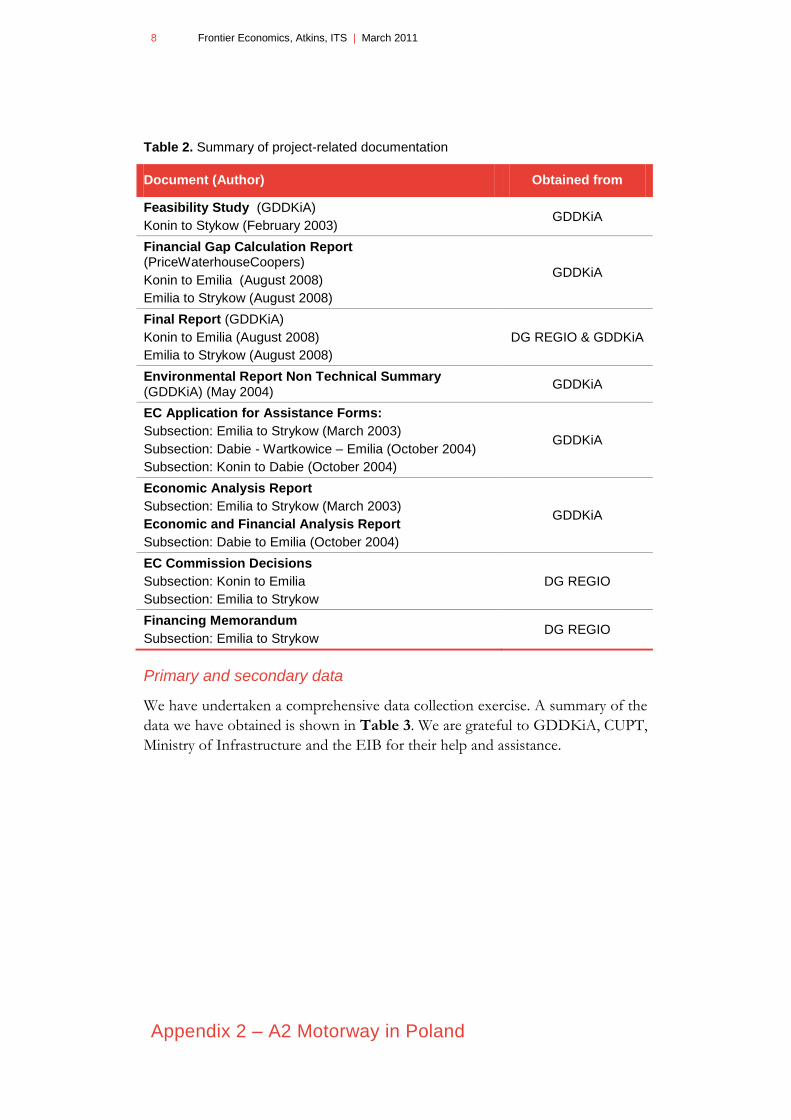
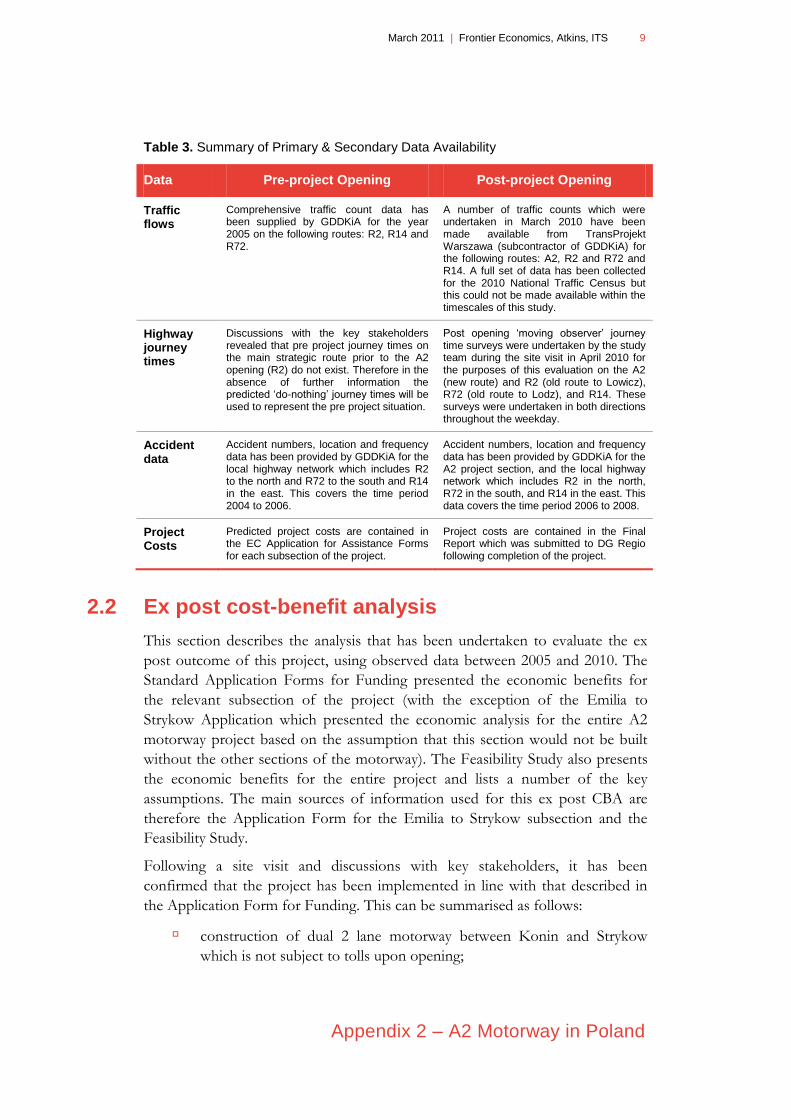
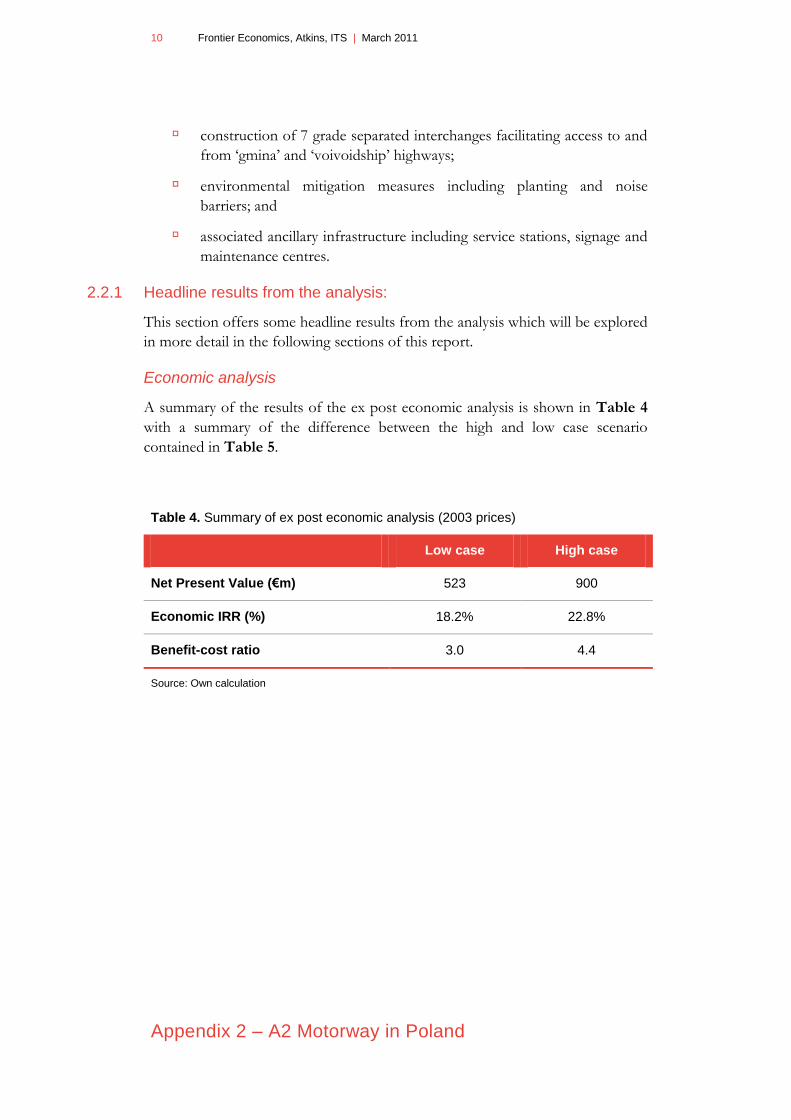
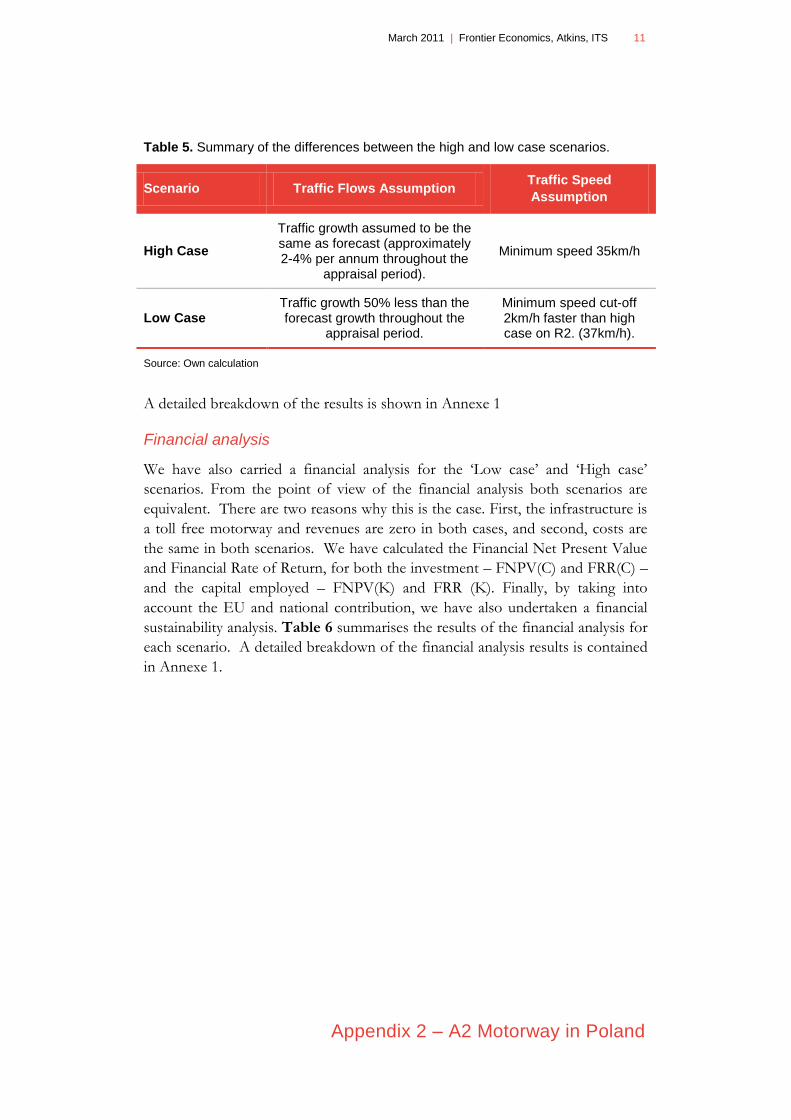

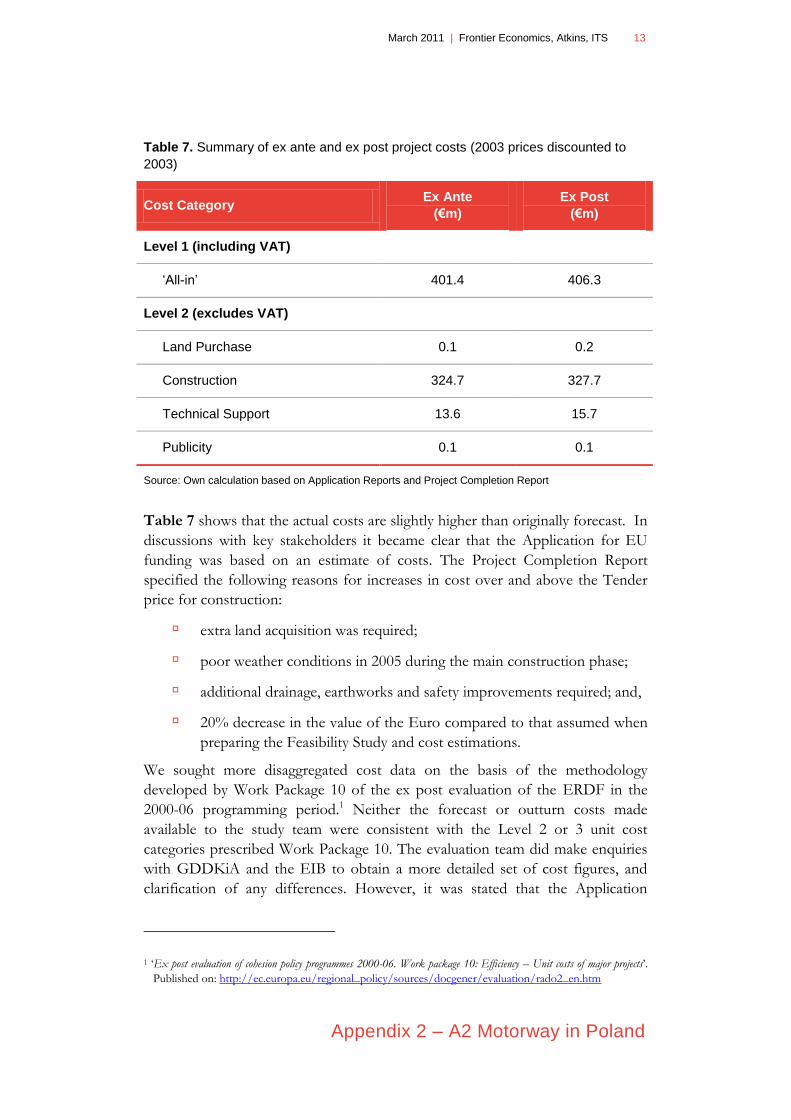
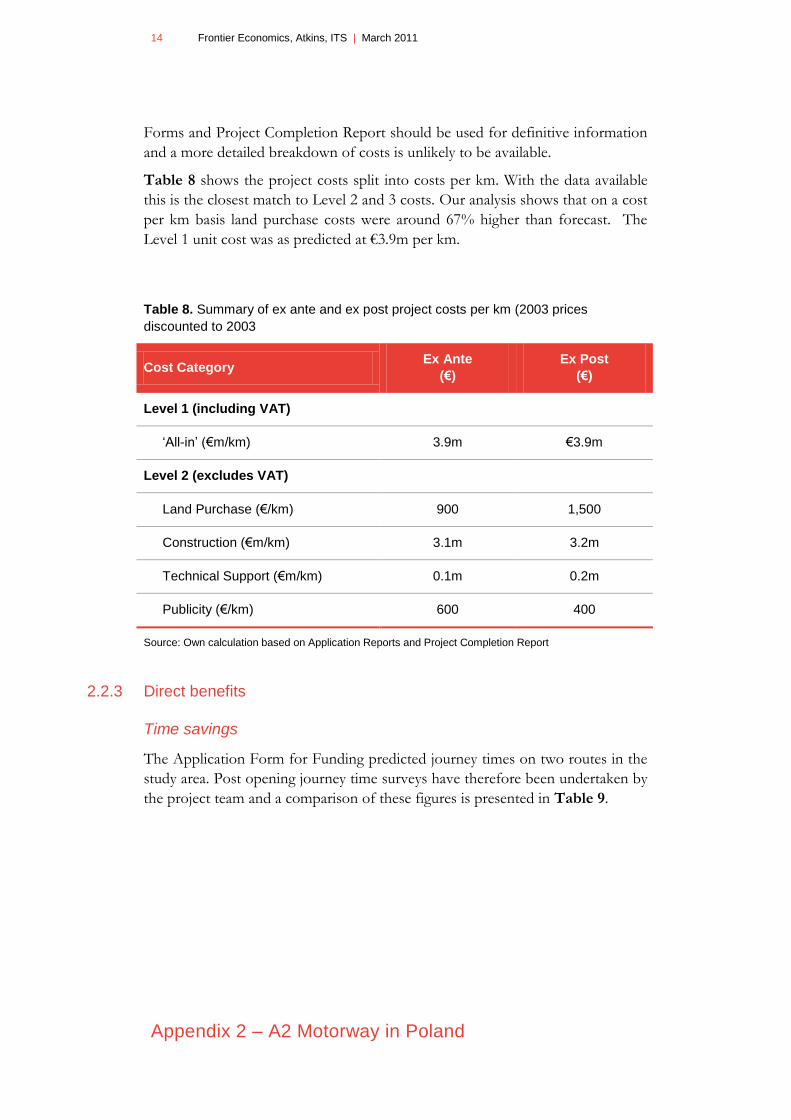
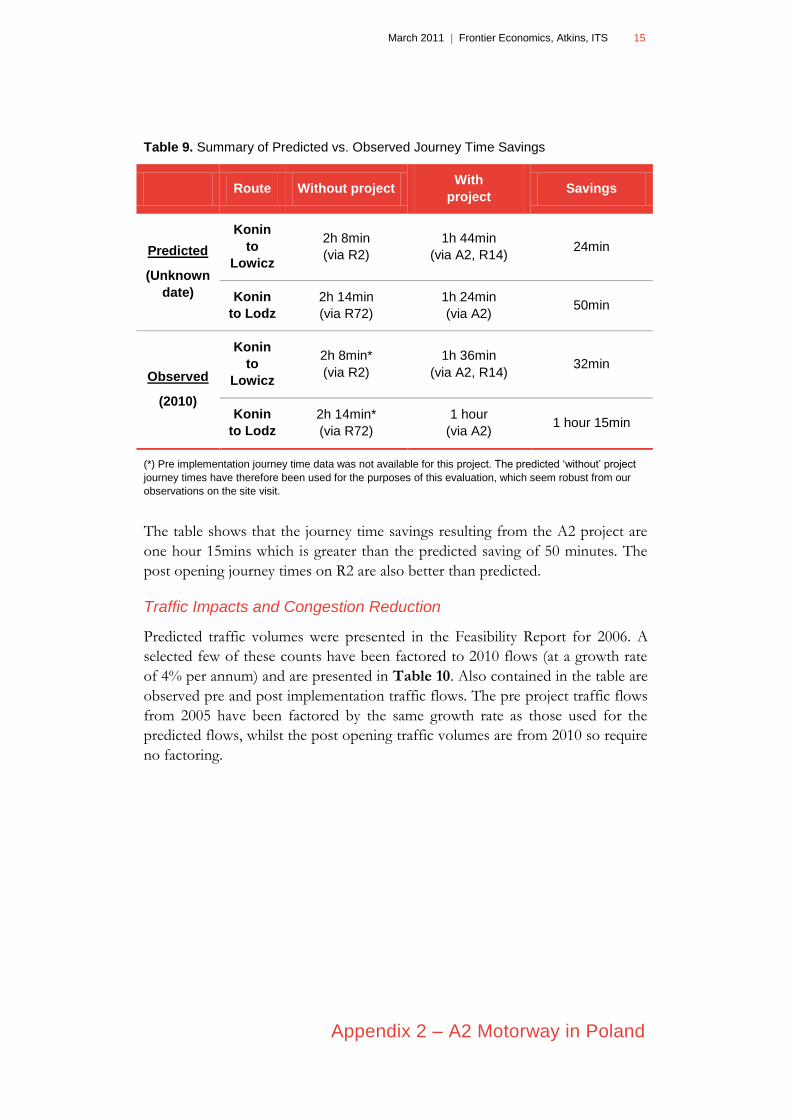
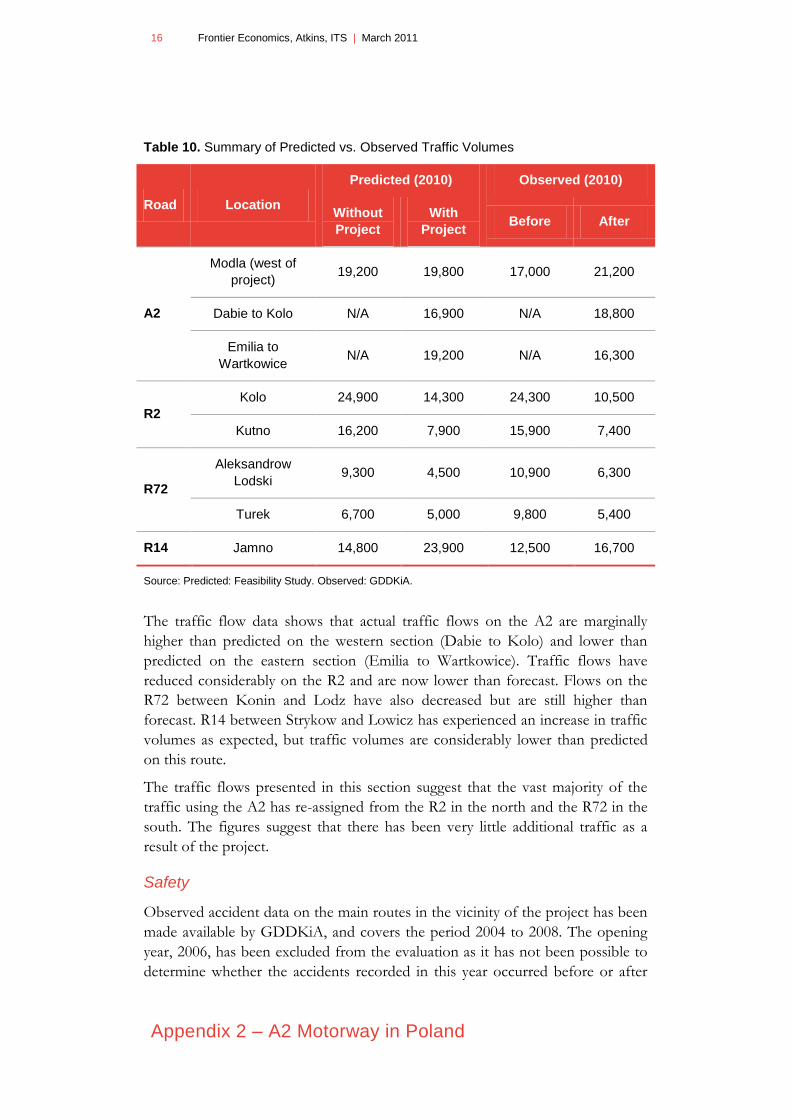
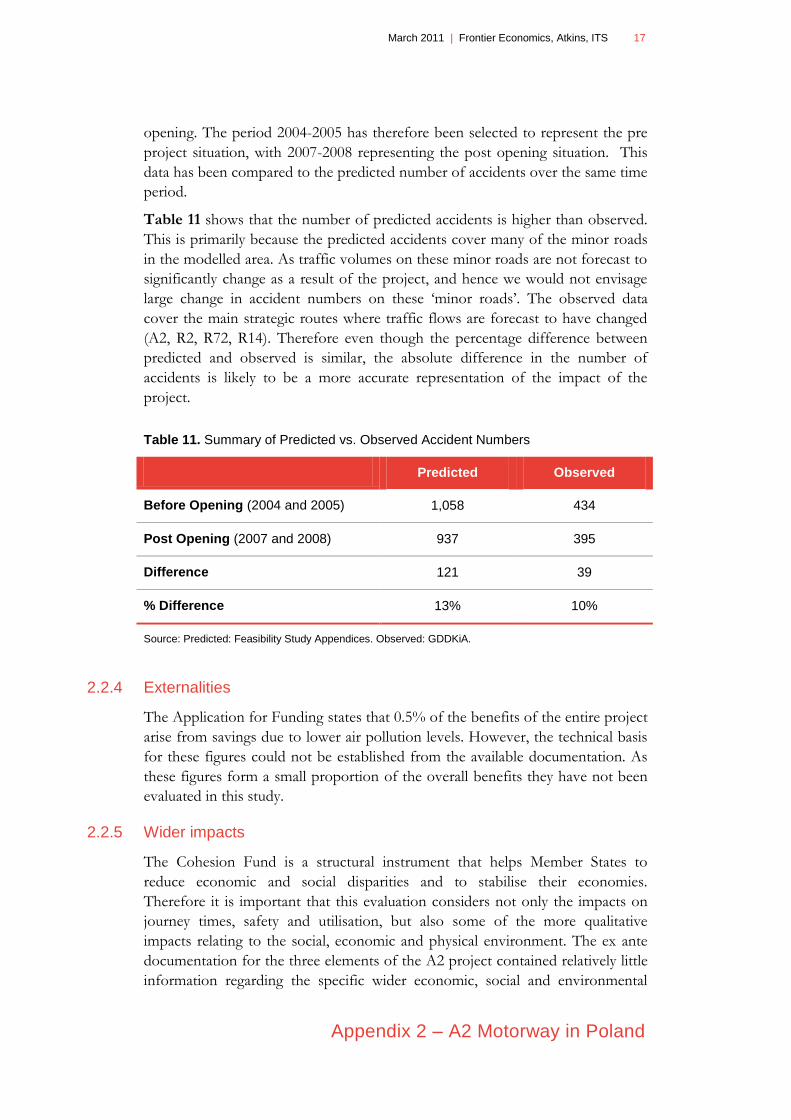

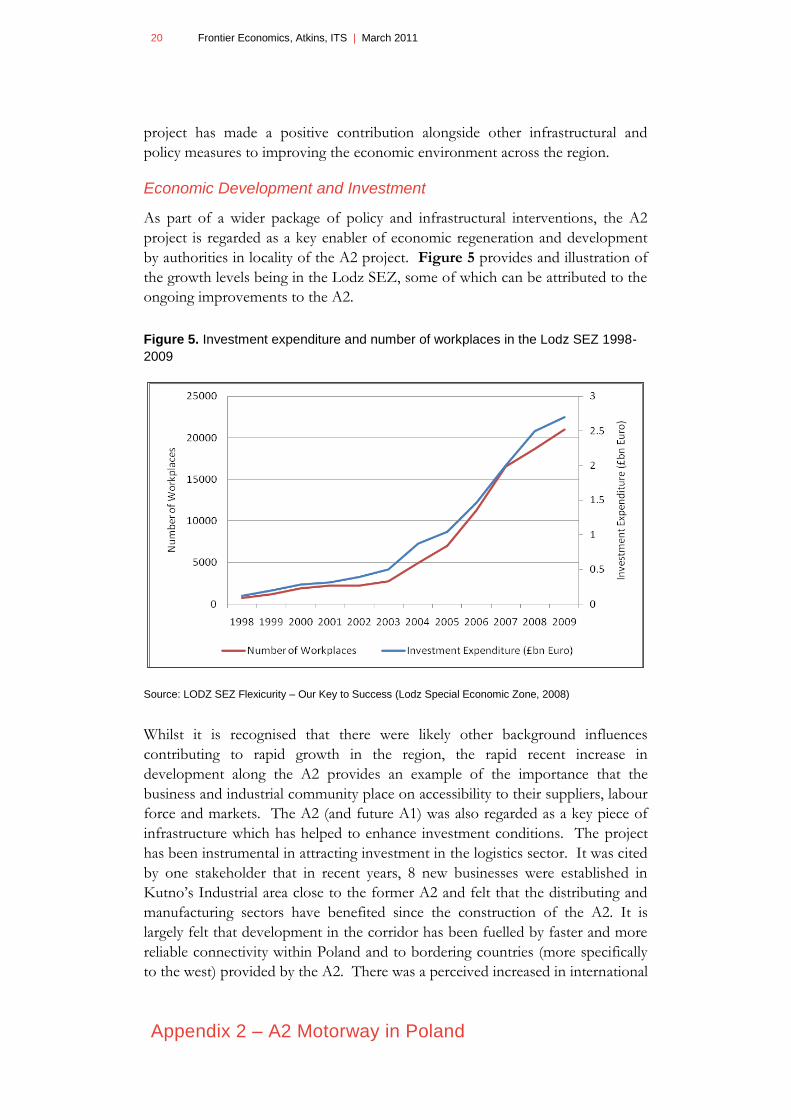
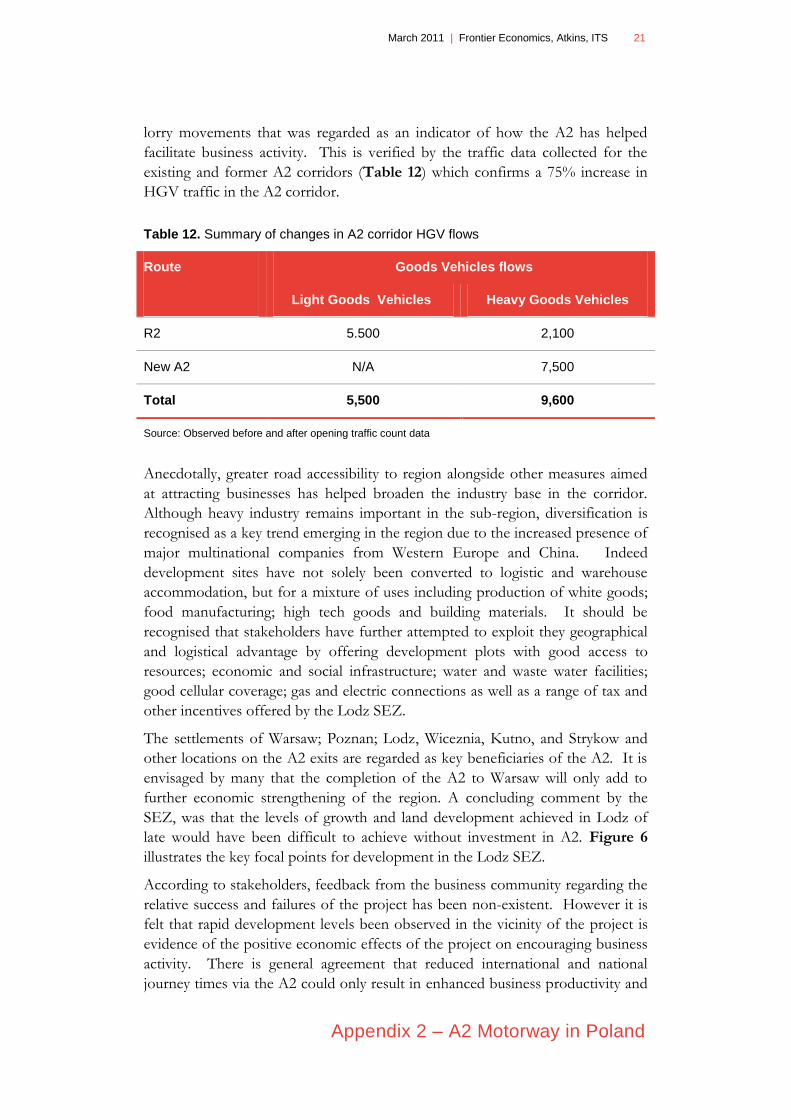
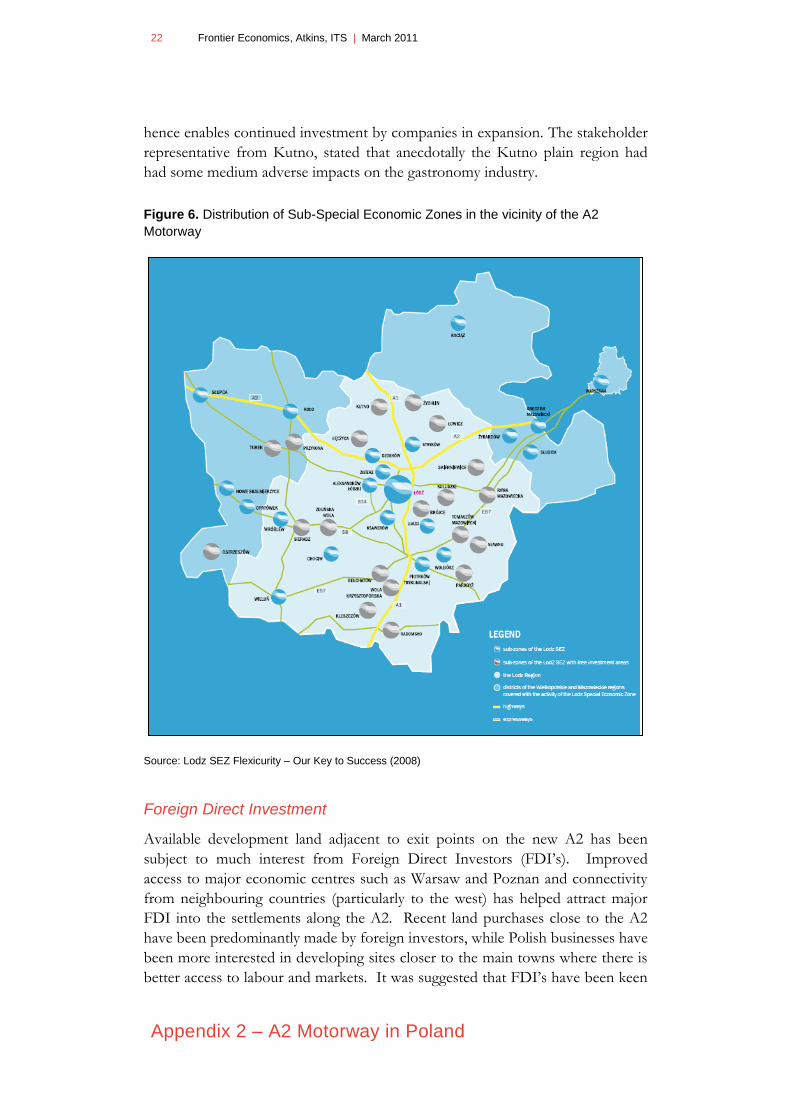
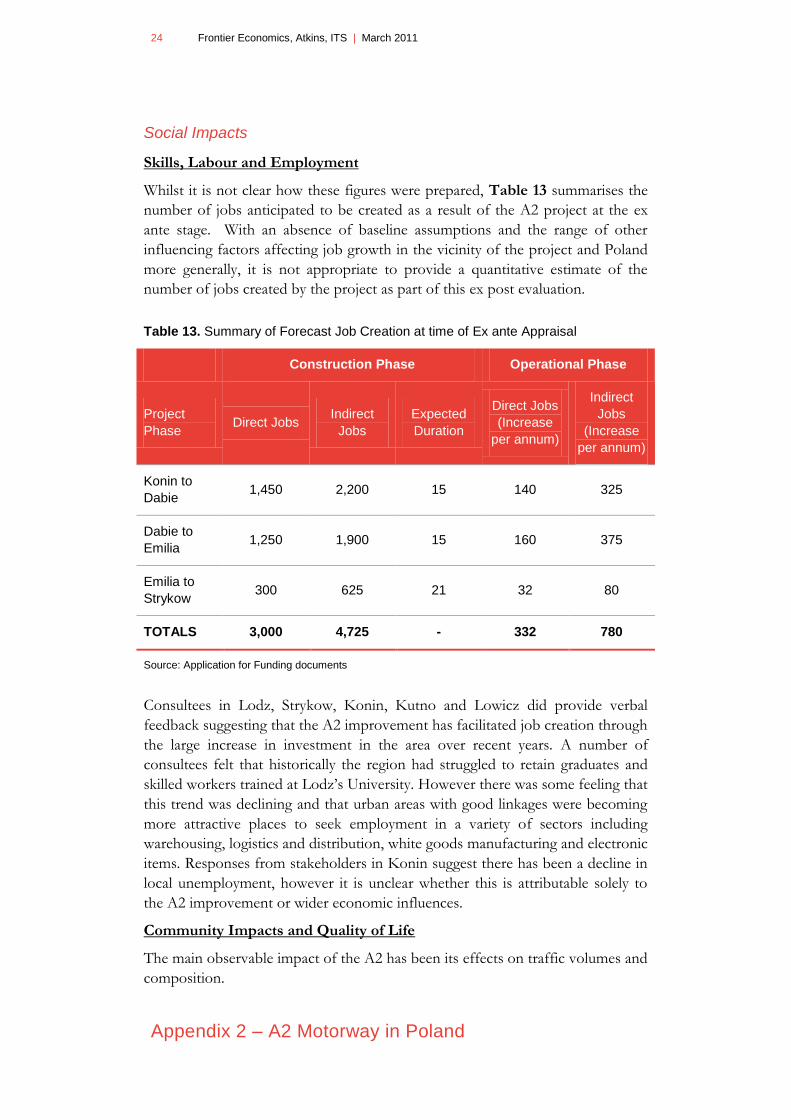
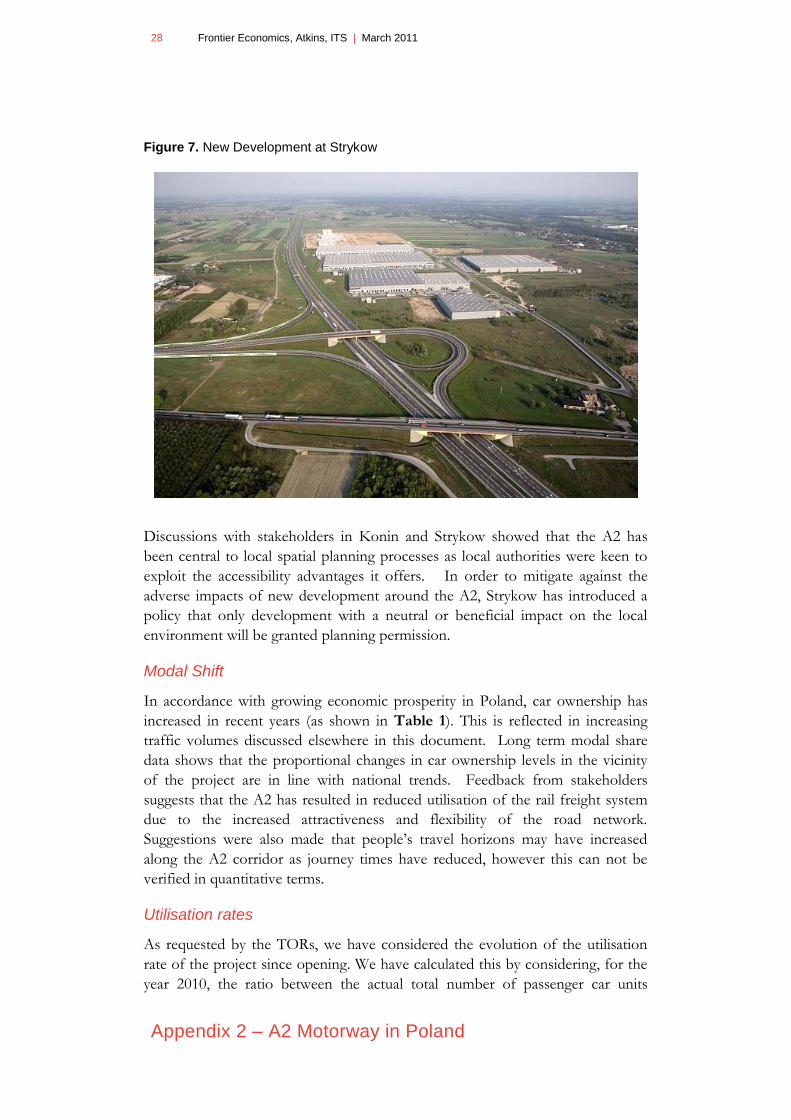
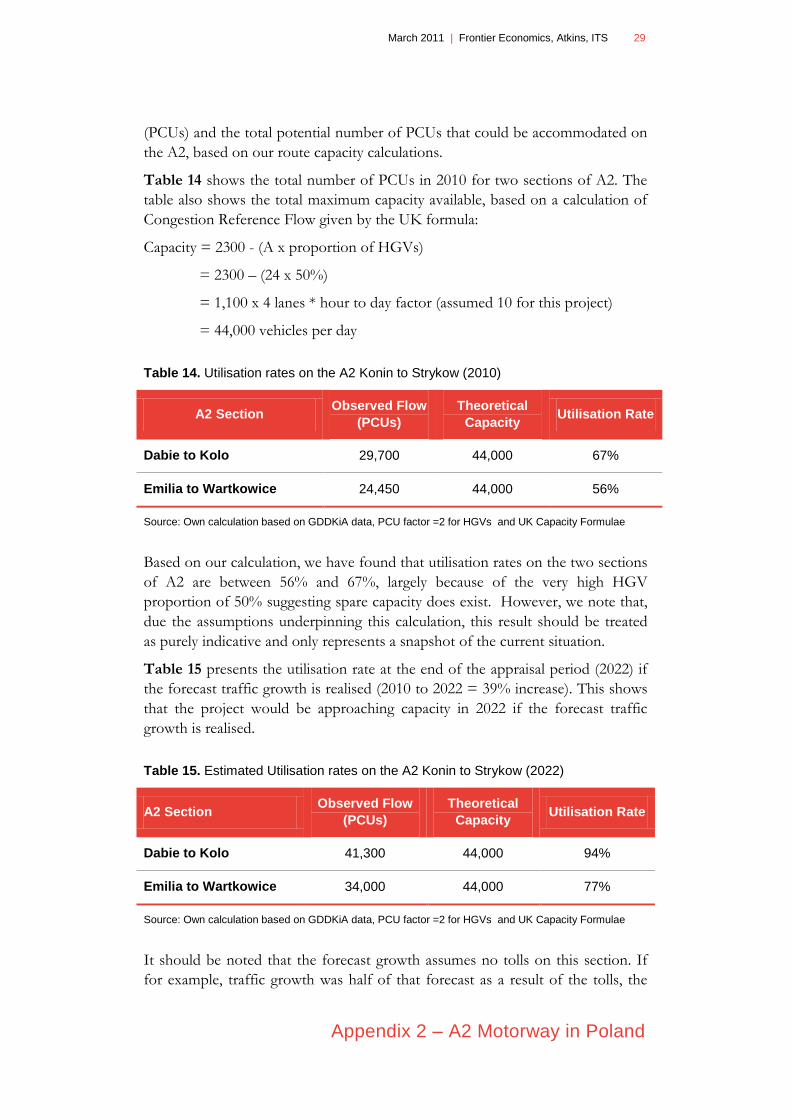
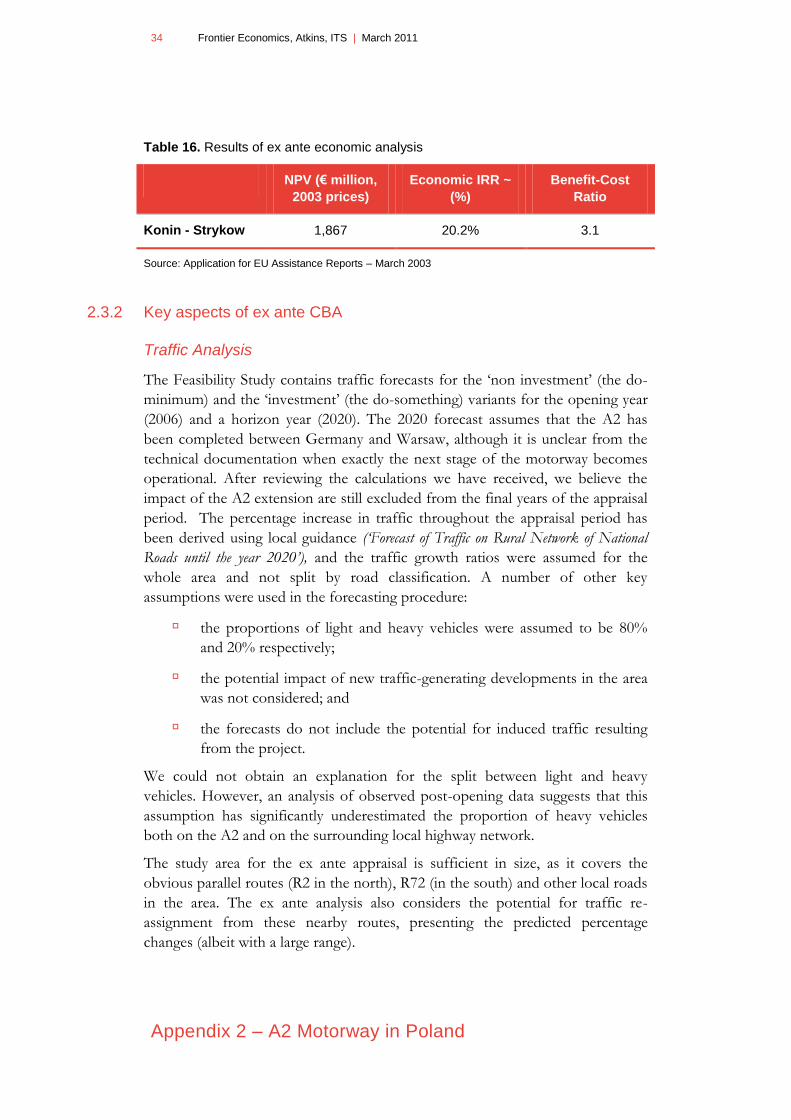
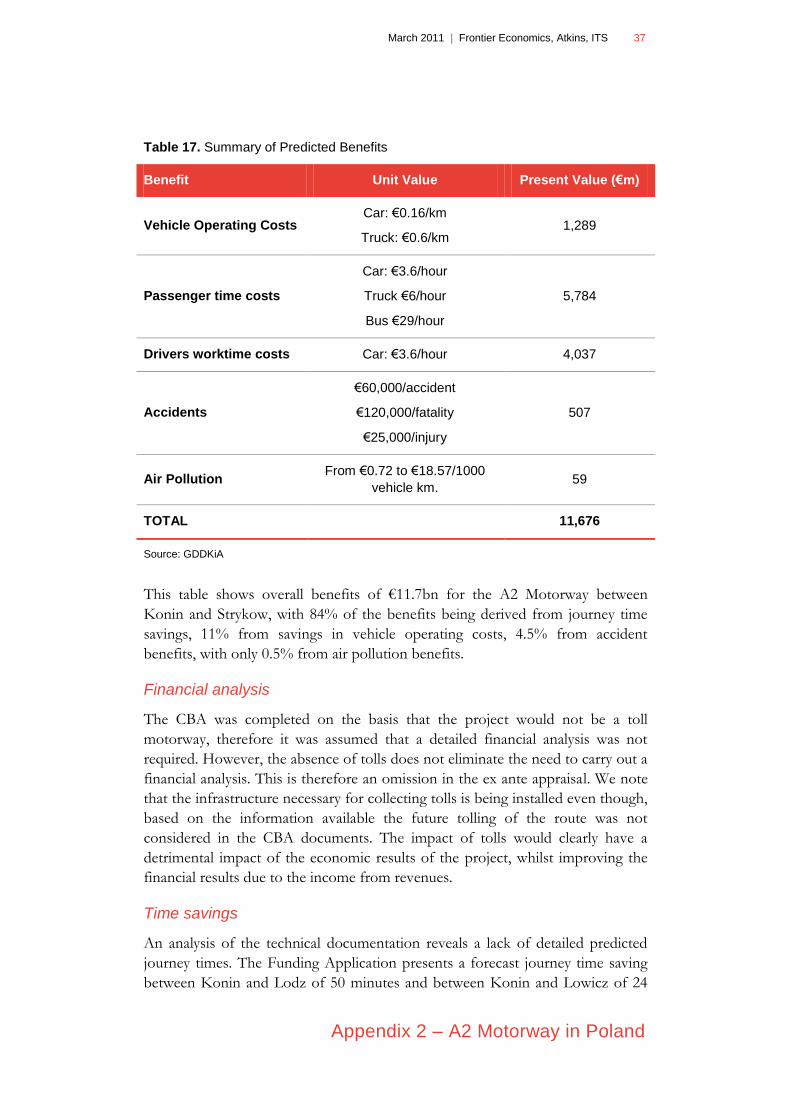
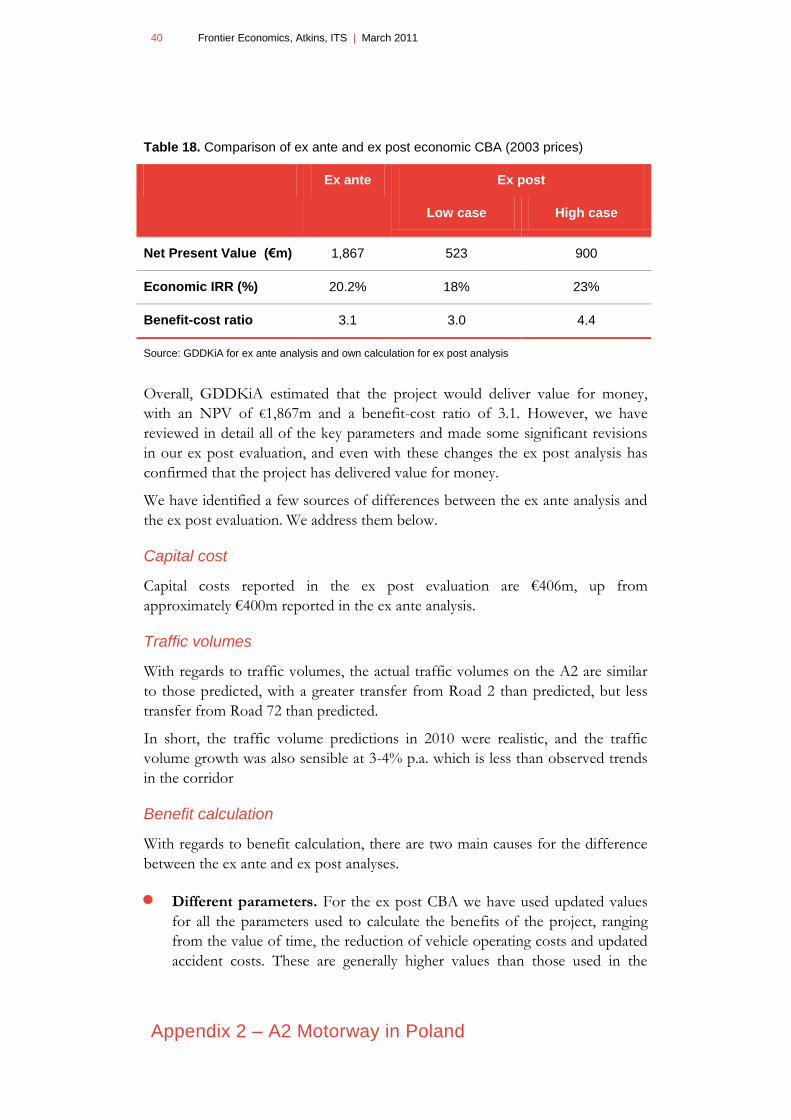
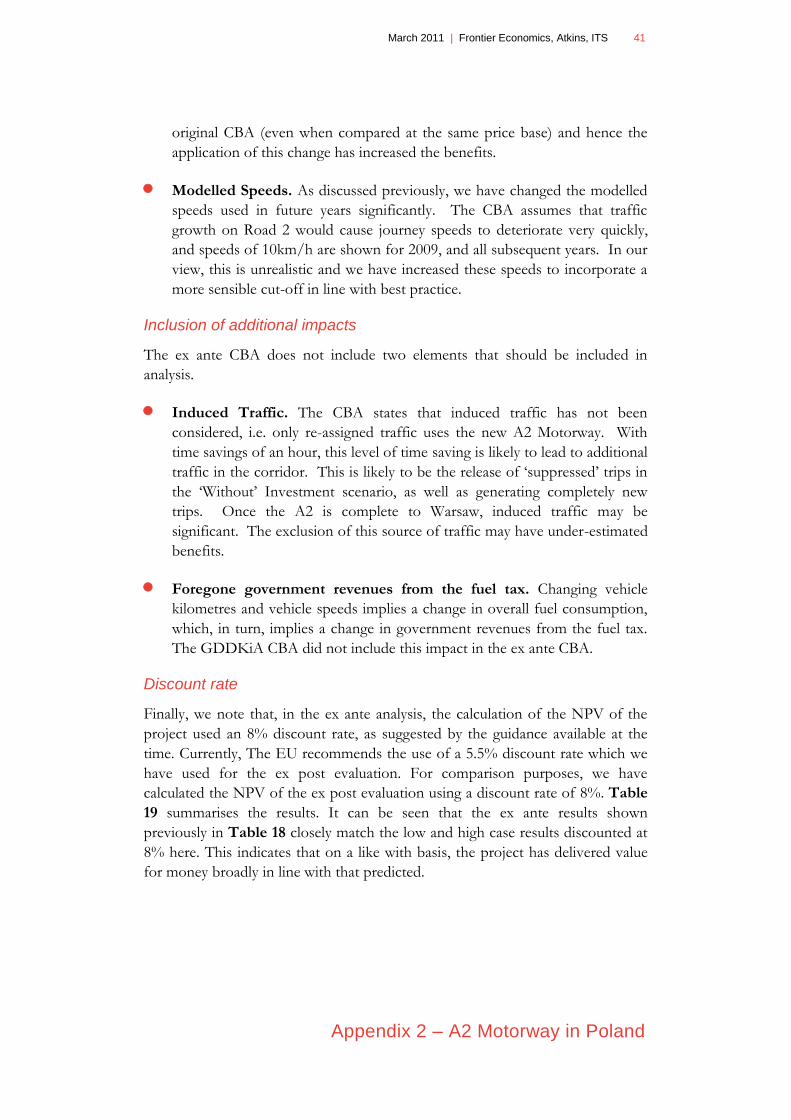
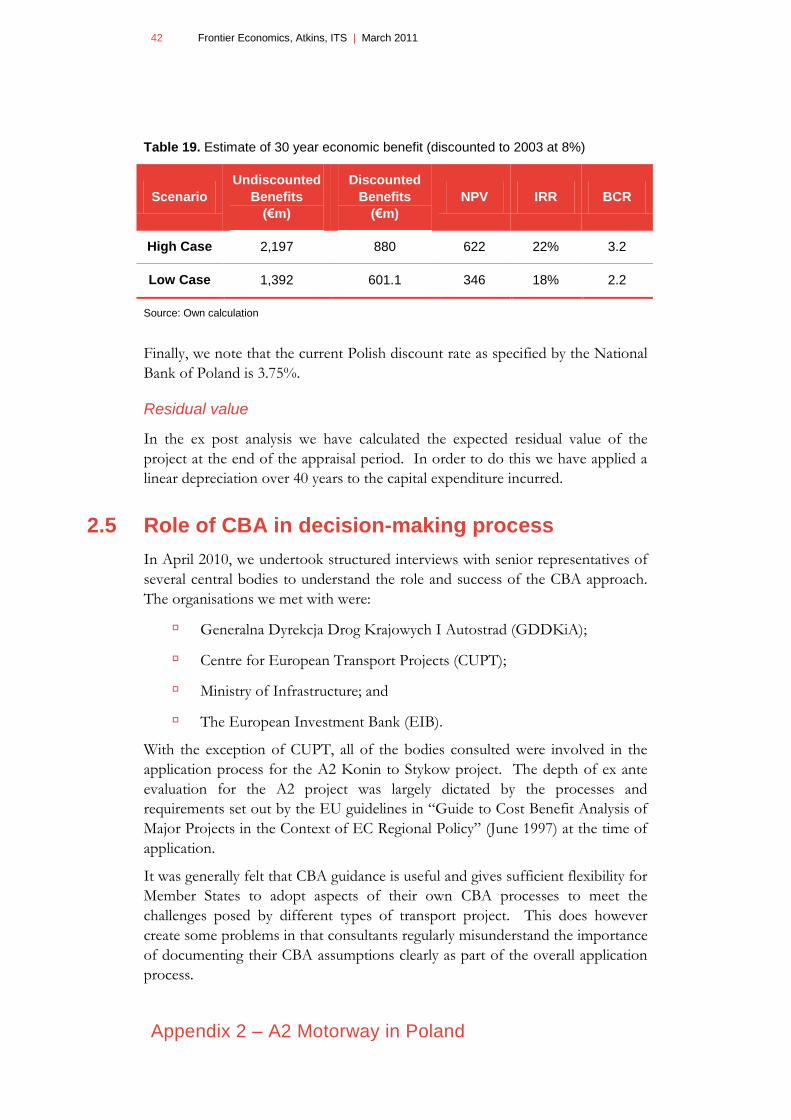

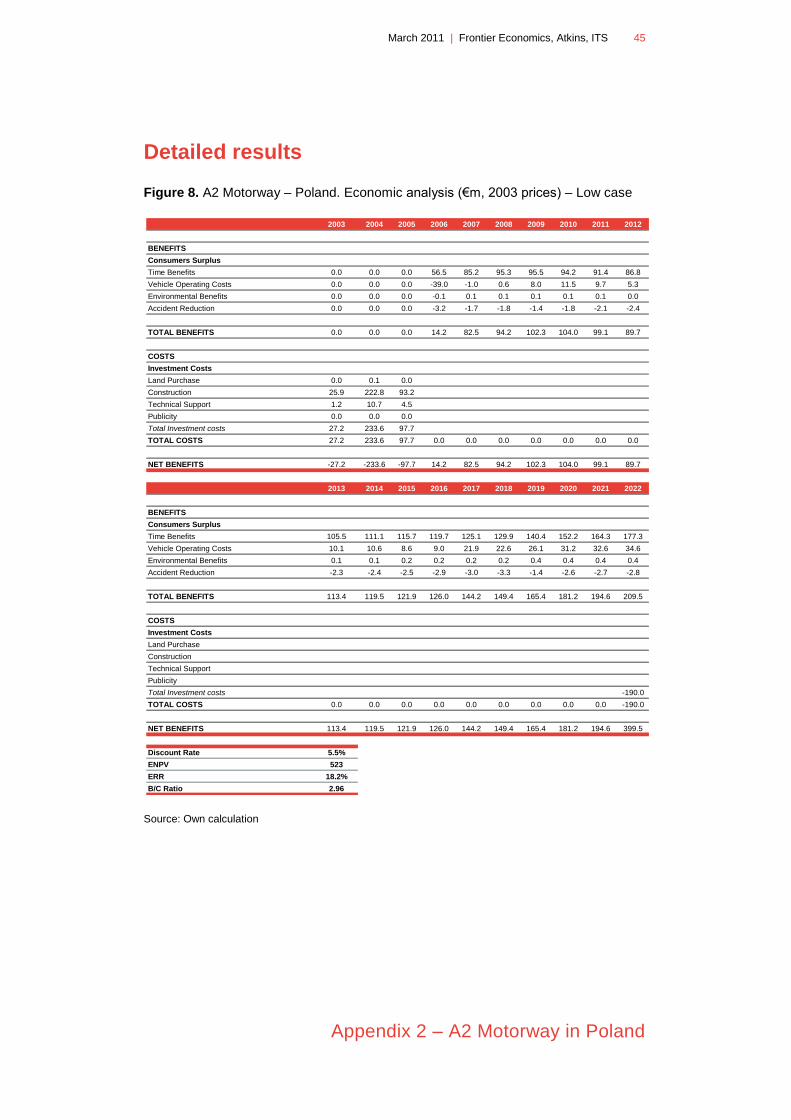
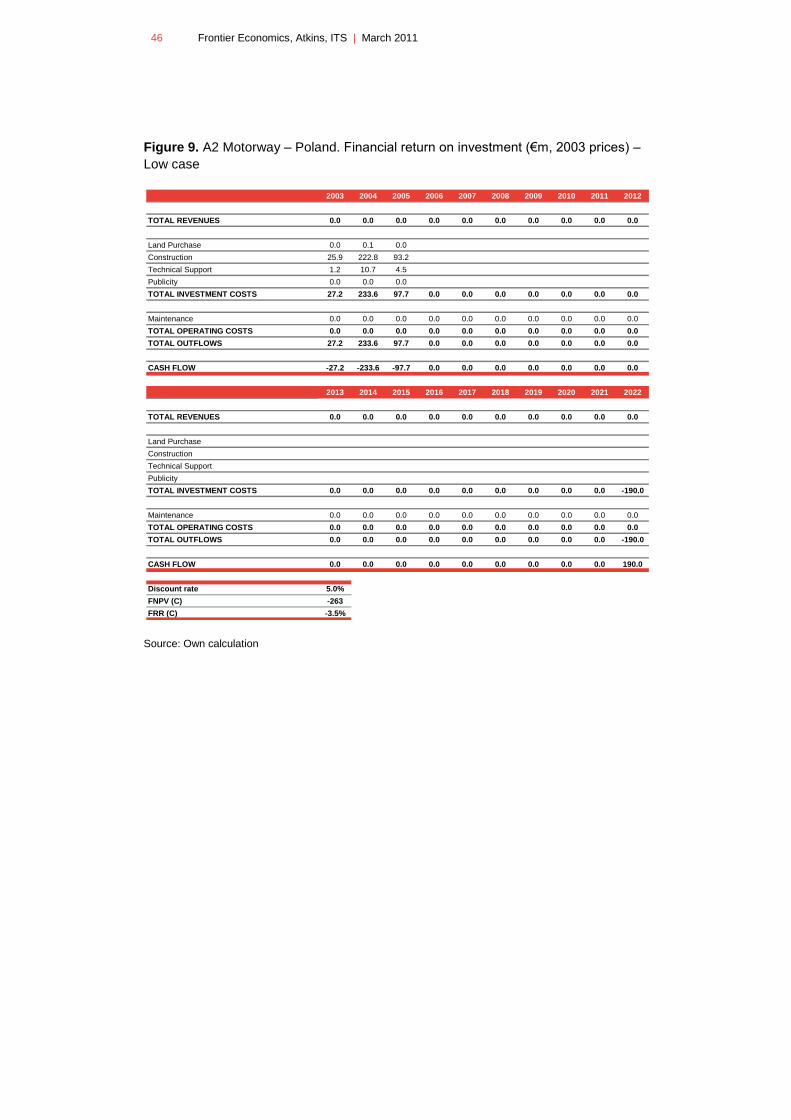
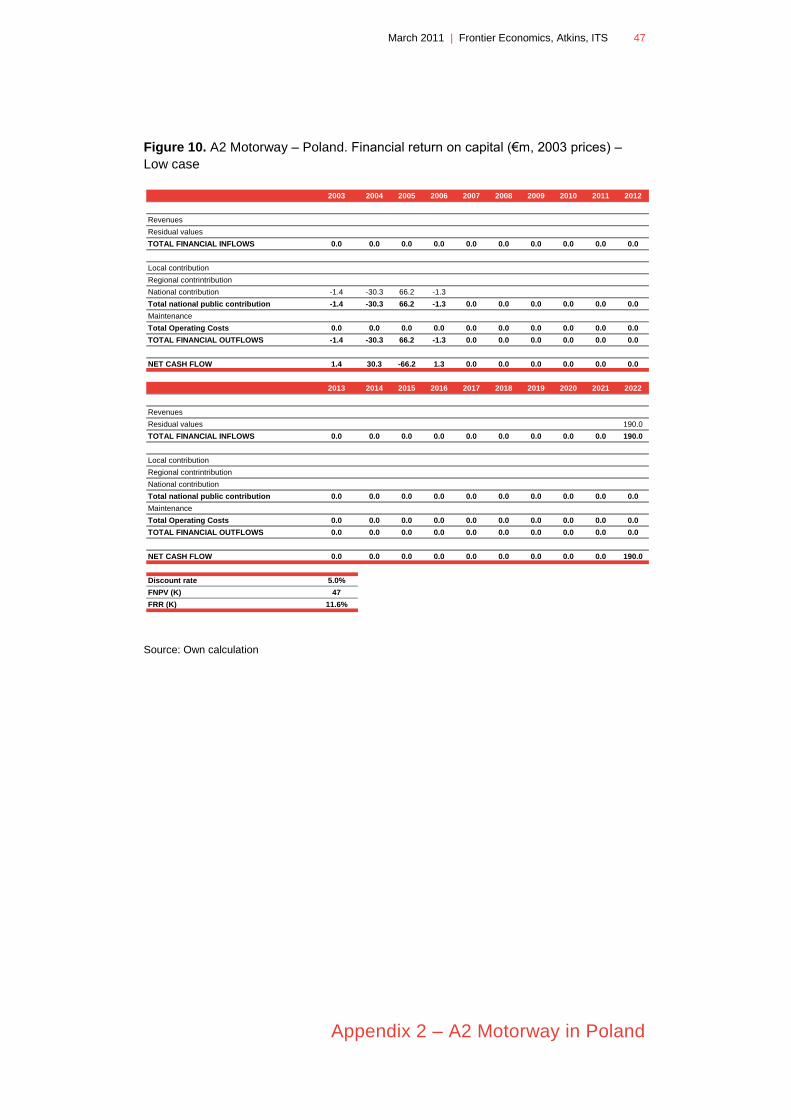
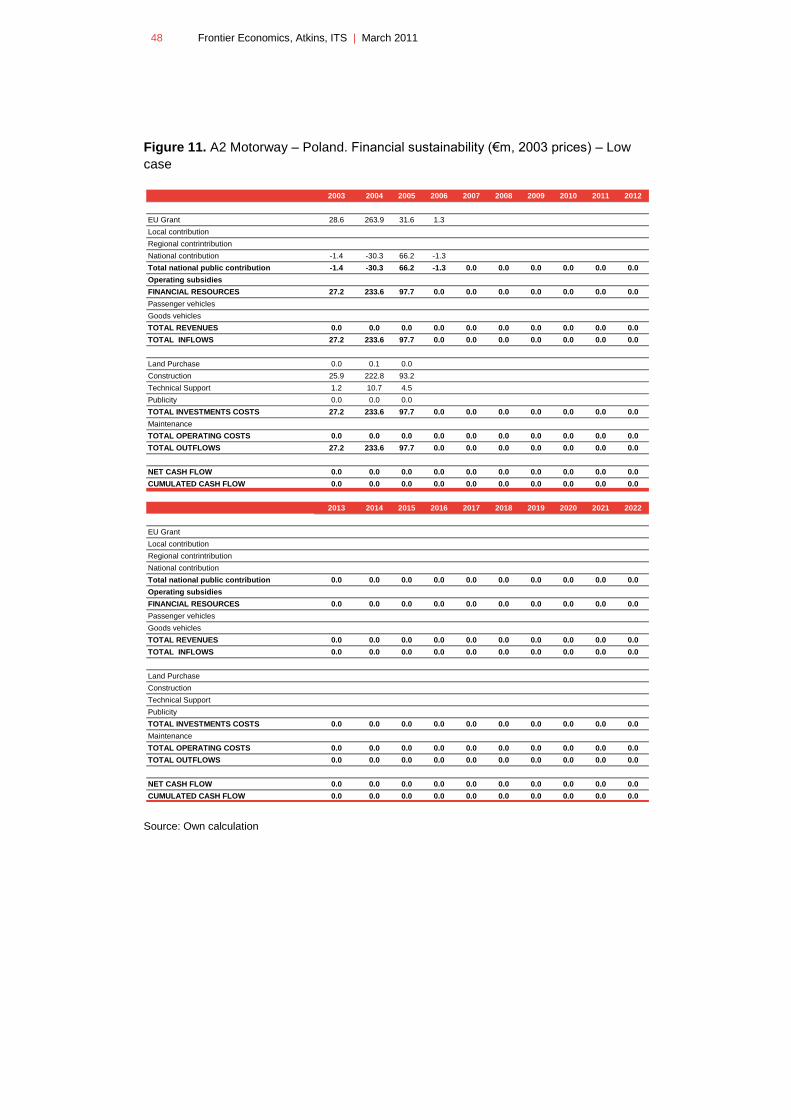
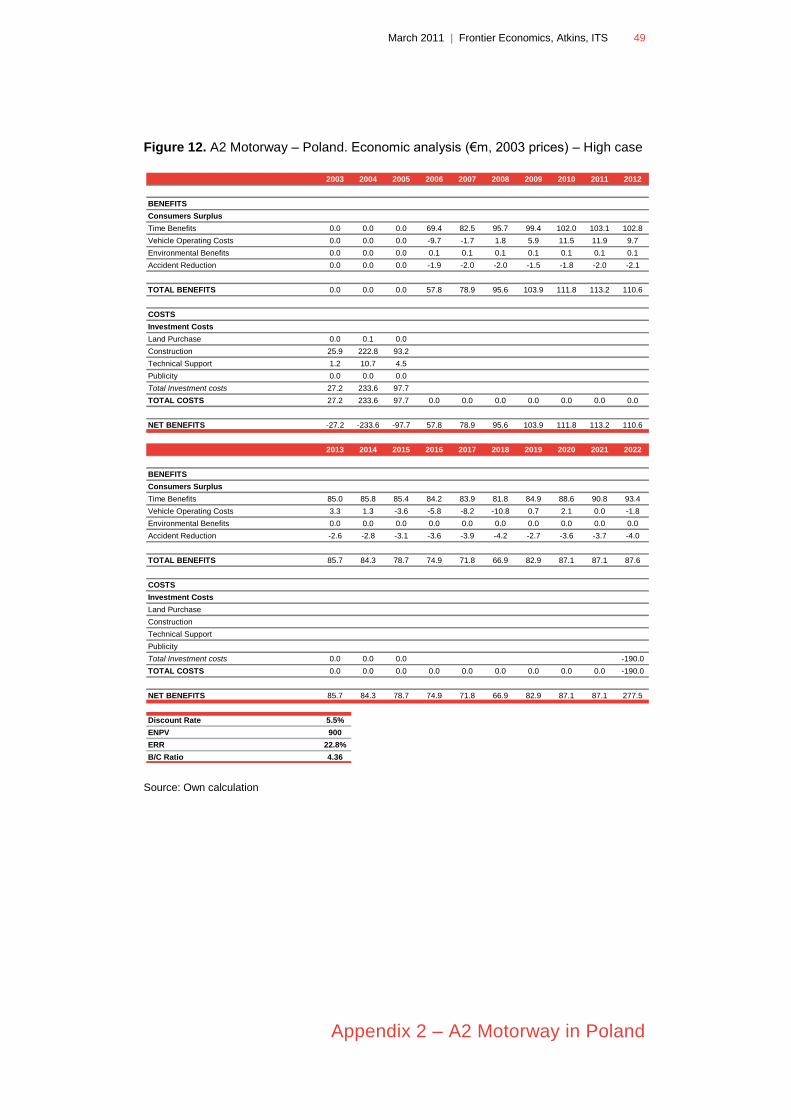

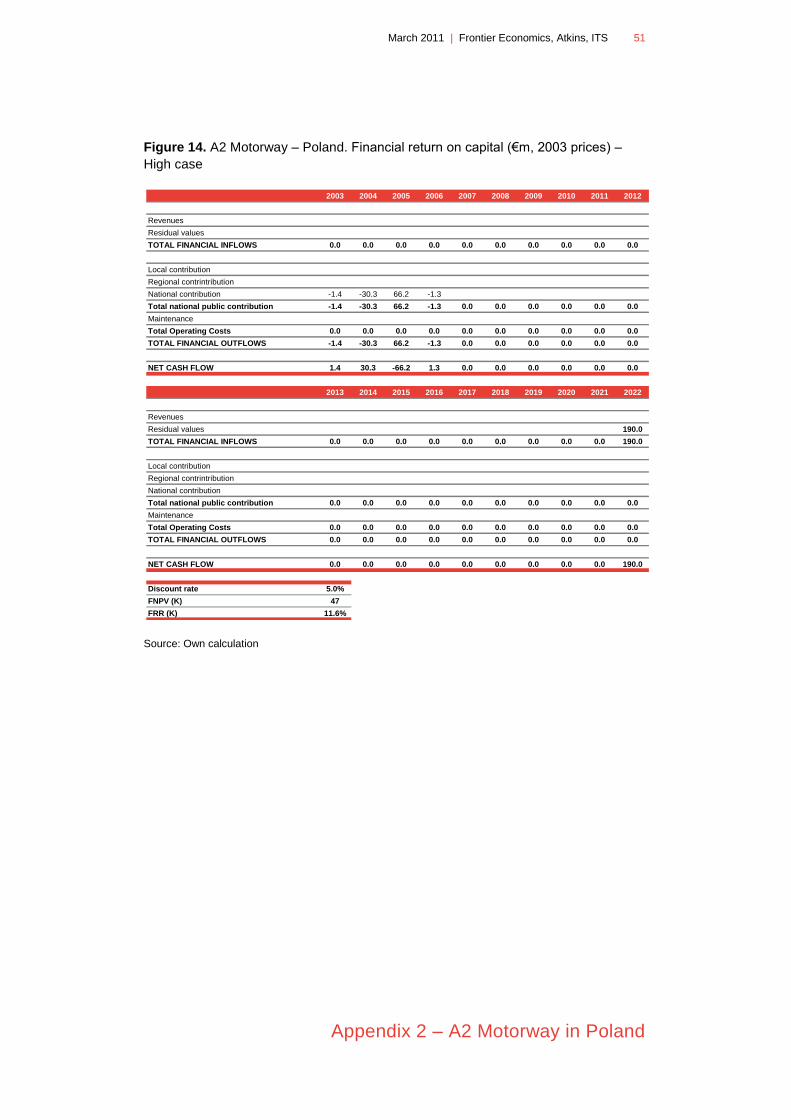


![Smart motorway design guide - Roads and Maritime Services · 2017-04-21 · Smart [1]Motorway Technical Direction and the Smart Motorway Guidelines[2]. 1.2 Smart motorway document](https://static.documents.pub/doc/80x56/5e764c607cf5f006800a1c9a/smart-motorway-design-guide-roads-and-maritime-services-2017-04-21-smart-1motorway.jpg)


