321
Appendix 3 Strategic Environmental Assessment Report
Appendix 3
Strategic Environmental Assessment Report
Japan International Cooperation Agency Nepal Electricity Authority
Nationwide Master Plan Study
on Storage-type Hydroelectric Power Development
in Nepal
Strategic Environmental Assessment Report
February 2014
Electric Power Development Co., Ltd. (J-POWER)
Nationwide Master Plan Study on Storage-type Hydroelectric Power Development in Nepal
Table of Contents
CHAPTER 1 INTRODUCTION .................................................................................................. 1
CHAPTER 2 TARGET SETTING OF SEA ................................................................................. 1
CHAPTER 3 ENVIRONMENTAL BASELINE .......................................................................... 1
TEMPERATURE AND RAINFALL ................................................................................................. 1 3.1 GEOGRAPHY ............................................................................................................................ 2 3.2 RIVER SYSTEM ......................................................................................................................... 3 3.3 PROTECTED AREA .................................................................................................................... 3 3.4 CONSERVATION SPECIES .......................................................................................................... 7 3.5 POPULATION .......................................................................................................................... 19 3.6 ADMINISTRATIVE BOUNDARY ................................................................................................ 20 3.7 ETHNICITY ............................................................................................................................. 21 3.8 LITERACY RATE ..................................................................................................................... 25 3.9 LAND USE .............................................................................................................................. 26 3.10 RAFTING ................................................................................................................................ 26 3.11 TRANSPORTATION .................................................................................................................. 27 3.12
CHAPTER 4 LAW AND REGULATIONS ................................................................................ 28
RELATED LAWS AND REGULATIONS ....................................................................................... 28 4.1 POLICIES AND GUIDELINES ................................................................................................... 29 4.2 INTERNATIONAL AGREEMENT AND TREATY ........................................................................... 30 4.3 EIA AND IEE REQUIREMENT ................................................................................................. 31 4.4
CHAPTER 5 ZERO OPTION .................................................................................................... 35
SOLAR POWER GENERATION ................................................................................................. 35 5.1 WIND POWER GENERATION ................................................................................................... 35 5.2 THERMAL POWER GENERATION (DIESEL OR GAS TURBINE) ................................................. 35 5.3
CHAPTER 6 FIRST STEP ........................................................................................................ 36
PROJECT DESCRIPTION .......................................................................................................... 36 6.1 SCREENING ITEMS AND METHODS ......................................................................................... 37 6.2(1) On-going Projects ............................................................................................................. 37 (2) Overlapped Project .......................................................................................................... 37 (3) Not appropriate as Storage-type Hydroelectric Power Projects ................................... 37
SCREENED PROJECTS ............................................................................................................ 38 6.3(1) On-going Projects ............................................................................................................. 38 (2) Overlapped Project .......................................................................................................... 39 (3) Not appropriate Projects ................................................................................................. 39
CHAPTER 7 SECOND STEP ................................................................................................... 45
PROJECT DESCRIPTION ......................................................................................................... 45 7.1 SCOPING AND EVALUATION METHODS .................................................................................. 46 7.2
Final Report Appendix 3 SEA Report
i
Nationwide Master Plan Study on Storage-type Hydroelectric Power Development in Nepal
(1) Evaluation Items and Methods ....................................................................................... 47 (2) Weighting of the Second Step ......................................................................................... 79
IMPACT ASSESSMENT ............................................................................................................. 82 7.3(1) Impact Evaluation ........................................................................................................... 82 (2) Sensitivity Analysis ....................................................................................................... 102
SELECTION OF PROMISING PROJECT ................................................................................... 111 7.4(1) Total Installed Capacity of Promising Projects ............................................................ 111 (2) Number of Project in Each River Basin ....................................................................... 111 (3) Overlap with Issued Survey and Construction License for Generation..................... 113 (4) Selection of Promising Projects ..................................................................................... 115
CHAPTER 8 THIRD STEP ..................................................................................................... 116
PROJECT DESCRIPTION ....................................................................................................... 116 8.1 SCOPING .............................................................................................................................. 142 8.2(1) Evaluation Items and Methods ..................................................................................... 142 (2) Weighting of the Third Step .......................................................................................... 155
IMPACT ASSESSMENT ........................................................................................................... 161 8.3(1) Impact Evaluation ......................................................................................................... 161 (2) Sensitivity Analysis ....................................................................................................... 210
CHAPTER 9 CUMULATIVE IMPACT ................................................................................... 247
PROJECT DESCRIPTION ....................................................................................................... 247 9.1(1) Existing Projects ............................................................................................................ 247 (2) Possible Projects ............................................................................................................ 251
SCOPING .............................................................................................................................. 255 9.2 IMPACT ASSESSMENT ........................................................................................................... 256 9.3(1) Water Regulation Effects on Eetland Ecosystem ........................................................ 256 (2) Barrier Effects on Migration Fish ................................................................................ 258 (3) Space Crowning Impact on Forest Ecosystem ............................................................. 261
CHAPTER 10 MITIGATION MEASURES............................................................................... 263
MITIGATION FOR INDIVIDUAL PROJECT............................................................................... 263 10.1(1) Chera-1 Project .............................................................................................................. 263 (2) Lower Jhimruk Project .................................................................................................. 263 (3) Madi Project ................................................................................................................... 263 (4) Nalsyau Gad Project ...................................................................................................... 263 (5) Naumure (W. Rapti) Project .......................................................................................... 263 (6) Lower Badigad Project .................................................................................................. 263 (7) Andhi Khola Project....................................................................................................... 263 (8) Dudh Koshi Project ........................................................................................................ 264 (9) Kokhajor-1 Project ......................................................................................................... 264 (10) Sun Koshi No.3 Project .................................................................................................. 264 MITIGATION FOR CUMULATIVE IMPACT ............................................................................... 264 10.2
Final Report Appendix 3 SEA Report
ii
Nationwide Master Plan Study on Storage-type Hydroelectric Power Development in Nepal
(1) Water Regulation Effects on Wetland Ecosystem ........................................................ 264 (2) Barrier Effects on Migration Fish ................................................................................ 265 (3) Space Crowning Impact on Forest Ecosystem ............................................................. 266
CHAPTER 11 MONITORING METHODS .............................................................................. 267
ENVIRONMENTAL MONITORING FOR INDIVIDUAL PROJECT ................................................ 267 11.1 ENVIRONMENTAL MONITORING FOR CUMULATIVE IMPACT ................................................ 267 11.2
CHAPTER 12 STAKEHOLDER MEETING ............................................................................. 267
THE 1ST STAKEHOLDERS MEETING ..................................................................................... 267 12.1 THE 2ND STAKEHOLDERS MEETING .................................................................................... 274 12.2 THE 3RD STAKEHOLDERS MEETING .................................................................................... 284 12.3 DISCUSSION AT THE REGIONAL OFFICE IN POKHARA .......................................................... 291 12.4 SEA REPORT EVALUATION MEETING .................................................................................. 293 12.5 DISCUSSION AT MINISTRY OF FORESTS AND SOIL CONSERVATION ...................................... 297 12.6 DISCUSSION AT THE WWF NEPAL ....................................................................................... 297 12.7 DISCUSSION AT THE IUCN NEPAL ....................................................................................... 299 12.8 DISCUSSION AT THE DEPARTMENT OF FOREST UNDER THE MINISTRY OF FORESTS AND SOIL 12.9
CONSERVATION ................................................................................................................................ 300 DISCUSSION AT THE DIRECTORATE OF FISHERIES DEVELOPMENT, NATIONAL INLAND 12.10
FISHERIES AND AQUACULTURE DEVELOPMENT PROGRAM ............................................................. 301
CHAPTER 13 SUGGESTIONS FOR EIAS IN FS STAGE ...................................................... 302
REQUIRED DOCUMENTS FOR ENVIRONMENTAL AND SOCIAL CONSIDERATION .................... 302 13.1(1) Environment Impact Assessment (EIA/IEE) ............................................................... 302 (2) Environmental Management Plan ............................................................................... 302 (3) Resettlement Action Plan .............................................................................................. 302 (4) Indigenous People Plan ................................................................................................. 304 COMPREHENSIVE SCOPING IN FS STAGE ............................................................................. 305 13.2 ATTENTIONAL ISSUES OF PHYSICAL ENVIRONMENT ........................................................... 307 13.3(1) Air quality ...................................................................................................................... 307 (2) Water quality.................................................................................................................. 308 (3) Water flow ...................................................................................................................... 308 (4) Waste .............................................................................................................................. 309 (5) Topography and geology ................................................................................................ 309 (6) Noise and vibration........................................................................................................ 310 (7) Odor ................................................................................................................................ 310 (8) Sedimentation ................................................................................................................ 311 ATTENTIONAL ISSUES OF NATURAL ENVIRONMENT ............................................................ 311 13.4(1) Protected Area ................................................................................................................ 311 (2) Plants .............................................................................................................................. 311 (3) Terrestrial animals ........................................................................................................ 312 (4) Aquatic species ............................................................................................................... 312
Final Report Appendix 3 SEA Report
iii
Nationwide Master Plan Study on Storage-type Hydroelectric Power Development in Nepal
ATTENTIONAL ISSUES OF SOCIAL ENVIRONMENT ................................................................ 313 13.5(1) Resettlement and land acquisition ............................................................................... 313 (2) Water use ........................................................................................................................ 313 (3) Accident .......................................................................................................................... 314 (4) Life and Livelihood ........................................................................................................ 314 (5) Use of land and natural resources ................................................................................ 315 (6) Infrastructure ................................................................................................................ 315 (7) Culture............................................................................................................................ 315 (8) Landscape ....................................................................................................................... 316 (9) Ethnic minority and Indigenous people ....................................................................... 316 (10) Working environment and work safety ........................................................................ 317
Final Report Appendix 3 SEA Report
iv

Nationwide Master Plan Study on Storage-type Hydroelectric Power Development in Nepal
List of Annexes
The following SEA Annexes are included in Appendix 5 of Final Report.
SEA Annex 1: Geological Survey Report - Dudh Koshi (E-01) SEA Annex 2: Geological Survey Report - Kokhajor-1 (E-06) SEA Annex 3: Geological Survey Report - Sun Koshi No.3 (E-17) SEA Annex 4: Geological Survey Report - Lower Badigad (C-02) SEA Annex 5: Geological Survey Report - Andhi Khola (C-08) SEA Annex 6 Geological Survey Report - Chera-1 (W02) SEA Annex 7: Geological Survey Report - Lower Jhimruk (W-05) SEA Annex 8: Geological Survey Report - Madi (W-06) SEA Annex 9: Geological Survey Report - Nalsyau Gad (W-23) SEA Annex 10: Geological Survey Report - Naumure (W. Rapti) (W-25) SEA Annex 11: Environmental Survey Summary Report SEA Annex 12: Environmental Survey Report - Dudh Koshi (E-01) SEA Annex 13: Environmental Survey Report - Kokhajor-1 (E-06) SEA Annex 14: Environmental Survey Report - Sun Koshi No.3 (E-17) SEA Annex 15: Environmental Survey Report - Lower Badigad (C-02) SEA Annex 16: Environmental Survey Report - Andhi Khola (C-08) SEA Annex 17: Environmental Survey Report - Chera-1 (W02) SEA Annex 18: Environmental Survey Report - Lower Jhimruk (W-05) SEA Annex 19: Environmental Survey Report - Madi (W-06) SEA Annex 20: Environmental Survey Report - Nalsyau Gad (W-23) SEA Annex 21: Environmental Survey Report - Naumure (W. Rapti) (W-25) SEA Annex 22: Comments on SEA Report from Department of Forests
Final Report Appendix 3 SEA Report
v
Nationwide Master Plan Study on Storage-type Hydroelectric Power Development in Nepal
List of Tables
Table 3.4-1 National Protected Area in Nepal ............................................................................. 4 Table 3.4-2 International Protected Area in Nepal ....................................................................... 5 Table 3.4-3 List of Key Biodiversity Area in Nepal .................................................................... 6 Table 3.5-1 IUCN Red-List Species and Protected Wildlife in Nepal ......................................... 7 Table 3.5-2 Distribution maps of National Red List Mammals in Nepal .................................. 14 Table 3.8-1 Population of Ethnic Gropes ................................................................................... 21 Table 3.8-2 Definition of Janajati .............................................................................................. 24 Table 5.3-1 Comparison of Electric Power Generation Methods in Nepal................................ 36 Table 6.1-1 Potential Projects (67 projects) in the First Step ..................................................... 37 Table 6.2-1 Screening Condition for Not Appropriate Projects ................................................. 38 Table 6.3-1 Screening of the Potential Projects ......................................................................... 43 Table 7.1-1 Candidate Project at the Second Step (31 projects) ................................................ 46 Table 7.2-1 List of Gauging Stations Selected for Energy Calculation (1/2) ............................ 48 Table 7.2-2 Evaluation Criterion for Reliability of Flow Data .................................................. 50 Table 7.2-3 Evaluation Criterion for Risk of GLOF .................................................................. 51 Table 7.2-4 Evaluation Criterion for Sedimentation .................................................................. 52 Table 7.2-5 Geologic and Seismic Dataset for Each Project Site (5-1) ..................................... 53 Table 7.2-6 Evaluation Criterion for Geology applied by NEA ................................................ 63 Table 7.2-7 Evaluation Criterion for Site Geology .................................................................... 65 Table 7.2-8 Evaluation Criterion for Proximity to Large Tectonic Thrusts ............................... 67 Table 7.2-9 Closeness to Other Faults ....................................................................................... 67 Table 7.2-10 Evaluation Criterion for Natural Hazard (Earthquakes) ......................................... 67 Table 7.2-11 Evaluation Criterion for Seismicity – Matrix ......................................................... 68 Table 7.2-12 Evaluation Criterion for Length of Access Road .................................................... 71 Table 7.2-13 Evaluation Criterion for Difficulty Level of Financing .......................................... 71 Table 7.2-14 Study Level of Candidate Projects on the Long List .............................................. 71 Table 7.2-15 Classification of Study Level for Evaluation of Reliability.................................... 72 Table 7.2-16 Evaluation Criterion for Reliability of Development Plan ..................................... 72 Table 7.2-17 Evaluation Criterion for Unit Generation Cost ....................................................... 73 Table 7.2-18 Evaluation Criterion for Installed Capacity ............................................................ 73 Table 7.2-19 Evaluation Criterion for Annual Energy Production .............................................. 74 Table 7.2-20 Evaluation Criterion for Energy Production in the Dry Season ............................. 74 Table 7.2-21 Evaluation Criterion for Impact on the Forest Area ............................................... 75 Table 7.2-22 Points for the Impact on Protected Area ................................................................. 75 Table 7.2-23 Evaluation Criterion for Impact on Protected Area ................................................ 75 Table 7.2-24 List of Fishes used in the Evaluation ...................................................................... 76 Table 7.2-25 Evaluation Criterion for Impact on Fishes .............................................................. 76 Table 7.2-26 List of Species and Points for Impact on Conservation Species ............................. 77 Table 7.2-27 Evaluation Criterion for Conservation Species ...................................................... 77 Table 7.2-28 Evaluation Criterion for Impact of Construction for Transmission Line to
the Social Environment........................................................................................... 77 Final Report
Appendix 3 SEA Report
vi

Nationwide Master Plan Study on Storage-type Hydroelectric Power Development in Nepal
Table 7.2-29 Evaluation Criterion for Impact on Household ....................................................... 78 Table 7.2-30 Evaluation Criterion for Impact on Agricultural Land ........................................... 78 Table 7.2-31 Evaluation Criterion for Impact on Ethnic Minority .............................................. 79 Table 7.2-32 Evaluation Criterion for Impact on Tourism ........................................................... 79 Table 7.2-33 Evaluation Items and Weight at the Second Stage (Base Case).............................. 80 Table 7.2-34 Weight of Evaluation Item (Case 1) ....................................................................... 81 Table 7.2-35 Weight of Evaluation Item (Case 2) ....................................................................... 81 Table 7.3-1 Impact on Protected Area ........................................................................................ 94 Table 7.3-2 Impact on Conservation Species ............................................................................. 96 Table 7.3-3 Impact on Tourism ................................................................................................ 102 Table 7.3-4 Evaluation Score and Ranking .............................................................................. 103 Table 7.3-5 Evaluation Score and Ranking of Each Case ........................................................ 104 Table 7.3-6 (1) Evaluation Score and Ranking of Base Case (1/3) ................................................ 105 Table 7.4-1 Promising Projects (Number of promising projects in each river basin is
five or less) ............................................................................................................ 112 Table 7.4-2 Issued Survey and Construction License for Generation ....................................... 113 Table 7.4-3 Promising Projects (taking issued licenses into consideration) ............................. 114 Table 7.4-4 Selection of Promising Projects ............................................................................. 115 Table 7.4-5 Promising Projects ................................................................................................. 115 Table 8.1-1 Promising Projects on the third Step (10 projects) ................................................ 116 Table 8.1-2 Salient Features of Promising Projects .................................................................. 119 Table 8.1-3 Source Reports of Promising Projects .................................................................. 120 Table 8.1-4 Salient Features of the Dudh Koshi Project (E-01) .............................................. 123 Table 8.1-5 Salient Features of the Kokhajor-1 Project (E-06) ............................................... 125 Table 8.1-6 Salient Features of the Sun Koshi No.3 Project (E-17) ........................................ 127 Table 8.1-7 Salient Features of the Lower Badigad Project (C-02) ......................................... 129 Table 8.1-8 Salient Features of the Andhi Khola Project (C-08) ............................................. 131 Table 8.1-9 Salient Features of the Chera-1 Project (W-02) .................................................... 133 Table 8.1-10 Salient Features of the Lower Jhimruk Project (W-05) ........................................ 135 Table 8.1-11 Salient Features of the Madi Project (W-06) ........................................................ 137 Table 8.1-12 Salient Features of the Nalsyau Gad Project (W-23) ............................................ 139 Table 8.1-13 Salient Features of the Naumure (W. Rapti) Project (W-25) ................................ 141 Table 8.2-1 Evaluation Criterion for Reliability of Flow Data ................................................ 143 Table 8.2-2 Evaluation Criterion for Risk of GLOF ................................................................ 143 Table 8.2-3 Evaluation Criterion for Sedimentation ................................................................ 143 Table 8.2-4 Evaluation Criteria for Geological Conditions of Site (Basic Evaluation) ........... 145 Table 8.2-5 Evaluation Criteria for Geological Conditions of Site (Deduction of point) ........ 146 Table 8.2-6 Evaluation Criteria for Geological Conditions of Site (Score) ............................. 146 Table 8.2-7 Evaluation Criterion for Large Tectonic Thrust and Fault .................................... 147 Table 8.2-8 Evaluation Criterion for Seismicity (Class by Area) ............................................ 147 Table 8.2-9 Evaluation Criterion for Seismicity (Class by Acceleration) ................................ 147 Table 8.2-10 Evaluation Criterion for Seismicity (Matrix of Score) ......................................... 147 Table 8.2-11 Time required for Each Stage ............................................................................... 148
Final Report Appendix 3 SEA Report
vii
Nationwide Master Plan Study on Storage-type Hydroelectric Power Development in Nepal
Table 8.2-12 Evaluation Criterion for Lead Time to Commencement of Commercial
Operation .............................................................................................................. 148 Table 8.2-13 Evaluation Criterion for Unit Generation Cost ..................................................... 149 Table 8.2-14 Evaluation Criterion for Installed Capacity .......................................................... 149 Table 8.2-15 Evaluation Criterion for Annual Energy Production ............................................ 149 Table 8.2-16 Evaluation Criterion for Energy Production in the Dry Season ........................... 150 Table 8.2-17 Evaluation Criterion for Impact on Forest ............................................................ 150 Table 8.2-18 Evaluation Criterion for Impact of Flora .............................................................. 151 Table 8.2-19 Evaluation Criterion for Impact on Terrestrial Fauna ........................................... 151 Table 8.2-20 Evaluation Criterion for Impact on Protected Area .............................................. 152 Table 8.2-21 Evaluation Criterion for Impact on Aquatic Fauna ............................................... 152 Table 8.2-22 Evaluation Criterion for Impact of Transmission Line ......................................... 152 Table 8.2-23 Evaluation Criterion for Impact on Household, etc. ............................................. 153 Table 8.2-24 Evaluation Criterion for Impact on Ethnic Minority Group ................................. 153 Table 8.2-25 Evaluation Criterion for Impact on Agriculture .................................................... 154 Table 8.2-26 Evaluation Criterion for Impact on Fishery .......................................................... 154 Table 8.2-27 Evaluation Criterion for Impact on Tourism and Culture ..................................... 154 Table 8.2-28 Evaluation Criterion for Impact on Infrastructure ................................................ 155 Table 8.2-29 Evaluation Criterion for Impact on Rural Economy and Development Plan ....... 155 Table 8.2-30 Weight of Evaluation Item (Case 1: Even weight) ............................................... 157 Table 8.2-31 Weight of Evaluation Item (Case 2: Technical conditions oriented) .................... 158 Table 8.2-32 Weight of Evaluation Item (Case 3: Environmental impact oriented) .................. 159 Table 8.2-33 Weight of Evaluation Item (Case 4: Technical conditions oriented
extremely) ............................................................................................................. 160 Table 8.3-1 Summary of Study Result for Reliability on Flow Data ....................................... 161 Table 8.3-2 Summary of Study Result on Risk of GLOF ........................................................ 162 Table 8.3-3 Summary of Study Result on Life of Reservoir ................................................... 163 Table 8.3-4 Summary of Flow Data for Promising Projects .................................................... 164 Table 8.3-5 Summary of Energy Calculation Result for Promising Projects........................... 165 Table 8.3-6 Physical Contingency Ratio of Civil Works for Desk Study-Level Projects ........ 166 Table 8.3-7 Summary of Project Cost for Promising Projects ................................................. 167 Table 8.3-8 Evaluation of Unit Generation Cost ..................................................................... 167 Table 8.3-9 Summary of Required Time to Commencement of Construction ........................ 168 Table 8.3-10 Summary of Construction Period for Promising Projects..................................... 168 Table 8.3-11 Summary of Lead Time to COD for Promising Projects ...................................... 169 Table 8.3-12 Evaluation of Time to Commencement of Commercial Operation ...................... 169 Table 8.3-13 Evaluation of Site Geology of the Dudh Koshi Project ........................................ 171 Table 8.3-14 Evaluation of Site Geology of the Kokhajor-1 Project ......................................... 172 Table 8.3-15 Evaluation of Site Geology of the Sun Koshi No.3 Project .................................. 172 Table 8.3-16 Evaluation of Site Geology of the Lower Badigad Project ................................... 173 Table 8.3-17 Evaluation of Site Geology of Andhi Khola Project ............................................. 173 Table 8.3-18 Evaluation of Site Geology of the Chera-1 Project .............................................. 174 Table 8.3-19 Evaluation of Site Geology of the Lower Jhimruk Project ................................... 174
Final Report Appendix 3 SEA Report
viii

Nationwide Master Plan Study on Storage-type Hydroelectric Power Development in Nepal
Table 8.3-20 Evaluation of Site Geology of the Madi Project ................................................... 175 Table 8.3-21 Evaluation of Site Geology of the Nalsyau Gad Project....................................... 175 Table 8.3-22 Evaluation of Site Geology of the Naumure (W. Rapti) Project ........................... 176 Table 8.3-23 Evaluation Summary of Seismicity ...................................................................... 177 Table 8.3-24 Evaluation Summary of Geological Condition of Site ......................................... 178 Table 8.3-25 Evaluation Summary of Thrust and Fault ............................................................. 179 Table 8.3-26 Impact on Forest in the Reservoir Area ................................................................ 180 Table 8.3-27 Impact on Flora in the Reservoir Area .................................................................. 182 Table 8.3-28 Impact on terrestrial Fauna ................................................................................... 185 Table 8.3-29 Impact on Fish ...................................................................................................... 189 Table 8.3-30 Impact on Rare Species and Protected Area in the Downstream .......................... 191 Table 8.3-31 Length of Transmission Line ................................................................................ 193 Table 8.3-32 Impact on Building ............................................................................................... 194 Table 8.3-33 Number of Ethnic Minority GroupsProject Name ................................................ 195 Table 8.3-34 Impact on Agriculture ........................................................................................... 196 Table 8.3-35 Impact on Fisheries ............................................................................................... 199 Table 8.3-36 Impact on Tourism and Culture ............................................................................ 203 Table 8.3-37 Impact on Infrastructures ...................................................................................... 205 Table 8.3-38 Impact on the Local Economy and the Existing Development Plan .................... 208 Table 8.3-39 Evaluation Score and Ranking (Summary) .......................................................... 210 Table 8.3-40 (1) Evaluation Score and Ranking of Case 1 (1/8) .................................................... 211 Table 8.3-41 (1) Evaluation Score and Ranking of Case 2 (1/8) ................................................... 219 Table 8.3-42 (1) Evaluation Score and Ranking of Case 3 (1/8) ................................................... 227 Table 8.3-43 (1) Evaluation Score and Ranking of Case 4 (1/8) ................................................... 235 Table 9.1-1 Operating and Constructing Major Hydro Power plants in Nepal ........................ 247 Table 9.1-2 Operating Major Irrigation Barrage in Nepal and India ....................................... 249 Table 9.1-3 HPPs in Preparation Stage of Construction .......................................................... 252 Table 9.1-4 Candidate Projects ................................................................................................ 253 Table 9.1-5 Main road projects in Nepal ................................................................................. 255 Table 9.2-1 Scoping Table for Cumulative Impact .................................................................. 256 Table 9.3-1 Existing and Planned Storage-type Major Hydroelectric Power Projects ............ 257 Table 9.3-2 Schedule of Water Requirements of the Gandak Project in Cumecs .................... 258 Table 9.3-3 Number of Existing and Planned HPP in Each River Basin ................................. 259 Table 12.1-1 Comment in the First Stakeholders Meeting and Reply or Action Taken by
NEA and Study Team (Tentative) ......................................................................... 268 Table12.1-2 Program of the 1st Stakeholders Meeting ............................................................. 272 Table 12.1-3 Participant List of the 1st Stakeholders Meeting .................................................. 273 Table 12.2-1 Comment in the Second Stakeholders Meeting and Reply or Action Taken
by NEA and Study Team (Tentative) .................................................................... 274 Table12.2-2 Program of the 2nd Stakeholders Meeting ........................................................... 281 Table 12.2-3 Participant List of the 2nd Stakeholders Meeting ................................................. 282 Table 12.3-1 Comment in the Third Stakeholders Meeting and Reply or Action Taken by
NEA and Study Team (Tentative) ......................................................................... 285 Final Report
Appendix 3 SEA Report
ix

Nationwide Master Plan Study on Storage-type Hydroelectric Power Development in Nepal
Table12.3-2 Program of the 3rd Stakeholders Meeting ............................................................ 288 Table12.3-3 Participant List of the 3rd Stakeholders Meeting ................................................. 289 Table 13.1-1 Required documents for Transmission line and Hydropower plant ...................... 302 Table 13.1-2 Required information of RAP ............................................................................... 303 Table 13.1-3 Required Information of IPP ................................................................................ 304 Table 13.2-1 Comprehensive Scoping for Hydropower Plant ................................................... 306 Table 13.2-2 Comprehensive Scoping on Transmission Line .................................................... 307
List of Figures
Figure 3.1-1 Rainfall and Temperature in Kathmandu (1981-2010) ............................................. 2 Figure 3.2-1 Elevation Map ........................................................................................................... 2 Figure 3.3-1 River systems in Nepal ............................................................................................. 3 Figure 3.4-1 National Parks and World Heritage .......................................................................... 4 Figure 3.5-1 Habitat of Important Fishes in Nepal ...................................................................... 13 Figure 3.6-1 Population density in Nepal .................................................................................... 20 Figure 3.7-1 Administrative boundaries ...................................................................................... 20 Figure 3.9-1 Literacy Rate ........................................................................................................... 25 Figure 3.9-2 Literacy rate growth ................................................................................................ 25 Figure 3.10-1 Land Use Map ........................................................................................................ 26 Figure 3.11-1 Major Rafting Routes ............................................................................................. 27 Figure 3.12-1 Main national roads in Nepal .................................................................................. 27 Figure 7.1-1 Location of Candidate Projects on the Second Step ............................................... 45 Figure 7.2-1 Location of Gauging Stations Selected for Energy Calculation ............................. 47 Figure 7.2-2 Monsoon Wetness Index Isolines............................................................................ 50 Figure 7.2-3 Example of Active Faults in Nepal ......................................................................... 66 Figure 7.2-4 Actual Distribution of Proximity to Large Tectonic Thrusts for all Project
Sites ........................................................................................................................ 67 Figure 7.2-5 Actual Distribution of Acceleration for All Project Sites ....................................... 69 Figure 7.2-6 Geology Evaluation Outcome from All three Criteria for All Project Sites ........ 69 Figure 7.2-7 Availability of Geological Maps in Nepal .............................................................. 70 Figure 7.3-1 Reliability of flow Data (Score) ............................................................................. 82 Figure 7.3-2 Risk of GLOF (Score) ............................................................................................ 83 Figure 7.3-3 Sedimentation (Life Time of Reservoir: Year) ........................................................ 83 Figure 7.3-4 Sedimentation (Score) ............................................................................................ 84 Figure 7.3-5 Seismicity (Score) ................................................................................................... 84 Figure 7.3-6 Geological Condition of Site (Score)...................................................................... 85 Figure 7.3-7 Natural Hazard (Earthquake) (Score) ..................................................................... 85 Figure 7.3-8 Length of Access Road (km) .................................................................................. 86 Figure 7.3-9 Length of Access Road (Score) .............................................................................. 86 Figure 7.3-10 Difficulty Level of Financing (2012 Project Cost: MUS$) .................................... 87 Figure 7.3-11 Difficulty Level of Financing (Score) .................................................................... 87
Final Report Appendix 3 SEA Report
x

Nationwide Master Plan Study on Storage-type Hydroelectric Power Development in Nepal
Figure 7.3-12 Reliability of Development Plan (Score) ................................................................ 88 Figure 7.3-13 Unit Generation Cost (US cent/kWh) ..................................................................... 88 Figure 7.3-14 Unit Generation Cost (Score) ................................................................................. 89 Figure 7.3-15 Installed Capacity (MW) ........................................................................................ 89 Figure 7.3-16 Installed Capacity (Score) ....................................................................................... 90 Figure 7.3-17 Annual Energy Production (GWh) ......................................................................... 90 Figure 7.3-18 Annual Energy Production (Score) ......................................................................... 91 Figure 7.3-19 Energy Production in the Dry Season (GWh) ........................................................ 91 Figure 7.3-20 Energy Production in the Dry Season (Score) ........................................................ 92 Figure 7.3-21 Impact on Forest (Inundated Forest Area: ha) ........................................................ 92 Figure 7.3-22 Impact on Forest (Unit Inundated Forest Area: ha/MW) ........................................ 93 Figure 7.3-23 Impact on Forest (Score) ........................................................................................ 93 Figure 7.3-24 Impact on Protected Area (Score) ........................................................................... 94 Figure 7.3-25 Impact on Fishes (Score) ........................................................................................ 95 Figure 7.3-26 Impact on Conservation Species (Score) ................................................................ 95 Figure 7.3-27 Impact on Locality by Construction of Transmission Line (km) ............................ 97 Figure 7.3-28 Impact on Locality by Construction of Transmission Line (Score) ........................ 97 Figure 7.3-29 Impact on Household (Households) ....................................................................... 98 Figure 7.3-30 Impact on Household (Score) ................................................................................. 98 Figure 7.3-31 Impact on Agriculture (Inundated Agricultural Land: ha) ...................................... 99 Figure 7.3-32 Impact on Agriculture (Unit inundated Agricultural Land: ha/MW) ...................... 99 Figure 7.3-33 Impact on Agriculture (Score) ................................................................................ 99 Figure 7.3-34 Impact on Ethnic Minority (Number of Ethnic Minority Groups) ....................... 100 Figure 7.3-35 Impact on Ethnic Minority (Score) ....................................................................... 100 Figure 7.3-36 Impact on Tourism (Number of Religious Asset and Trekking Route) ................ 101 Figure 7.3-37 Impact on Tourism (Score) ................................................................................... 101 Figure 8.1-1 Location of Promising Projects on the third Step .................................................. 117 Figure 8.1-2 Locations of Promising Projects in Isohyetal Map ................................................ 117 Figure 8.1-3 Locations of Promising Projects in Seismic Hazard Map ..................................... 118 Figure 8.1-4 Location of Dudh Koshi Project (E-01) ................................................................ 122 Figure 8.1-5 General Layout of the Dudh Koshi Project (E-01) ............................................... 122 Figure 8.1-6 Location of Kokhajor-1 Project (E-06) ................................................................. 124 Figure 8.1-7 General Layout of the Kokhajor-1 Project (E-06) ................................................ 124 Figure 8.1-8 Location of Sun Koshi No.3 Project (E-17) ......................................................... 126 Figure 8.1-9 General Layout of the Sun Koshi No.3 Project (E-17) ......................................... 126 Figure 8.1-10 Location of Lower Badigad Project (C-02) .......................................................... 128 Figure 8.1-11 General Layout of the Lower Badigad Project (C-02) ......................................... 128 Figure 8.1-12 Location of Andhi Khola Project (C-08) .............................................................. 130 Figure 8.1-13 General Layout of the Andhi Khola Project (C-08) .............................................. 130 Figure 8.1-14 Location of Chera-1 Project (W-02) ..................................................................... 132 Figure 8.1-15 General Layout of the Chera-1 Project (W-02) .................................................... 132 Figure 8.1-16 Location of Lower Jhimruk Project (W-05) ......................................................... 134 Figure 8.1-17 General Layout of the Lower Jhimruk Project (W-05) ......................................... 134
Final Report Appendix 3 SEA Report
xi

Nationwide Master Plan Study on Storage-type Hydroelectric Power Development in Nepal
Figure 8.1-18 Location of Madi Project (W-06) ......................................................................... 136 Figure 8.1-19 General Layout of the Madi Project (W-06) ......................................................... 136 Figure 8.1-20 Location of Nalsyau Gad Project (W-23) ............................................................. 138 Figure 8.1-21 General Layout of the Nalsyau Gad Project (W-23) ............................................. 138 Figure 8.1-22 Location of Naumure (W. Rapti) Project (W-25) ................................................. 140 Figure 8.1-23 General Layout of the Naumure (W. Rapti) Project (W-25) ................................. 140 Figure 8.3-1 Forest Land in the Reservoir Area ........................................................................ 180 Figure 8.3-2 Number of Trees in the Reservoir Area ................................................................ 181 Figure 8.3-3 Average of Crown Coverage in the Reservoir Area (%) ....................................... 181 Figure 8.3-4 Number of Plant Species Reported in the Reservoir Area .................................... 184 Figure 8.3-5 Number of Plant Species of Conservation Significance in the Reservoir
Area ...................................................................................................................... 184 Figure 8.3-6 Number of Mammal Species Reported in the Reservoir Area .............................. 187 Figure 8.3-7 Number of Bird Species Reported in the Reservoir Area ..................................... 187 Figure 8.3-8 Number of Herpetofauna Species Reported in the Reservoir Area ...................... 187 Figure 8.3-9 Number of Conservation Mammalian Species Reported in the Reservoir
Area ...................................................................................................................... 188 Figure 8.3-10 Number of Conservation Bird Species Reported in the Reservoir Area ............... 188 Figure 8.3-11 Number of Conservation Herpetofauna Species Reported in the Reservoir
Area ...................................................................................................................... 188 Figure 8.3-12 Number of Fish Species Reported in the Reservoir Area ..................................... 190 Figure 8.3-13 Number of Fish Species of Conservation Significance in the Reservoir
Area ...................................................................................................................... 190 Figure 8.3-14 Length of Recession Area (km) ............................................................................ 190 Figure 8.3-15 Number of the Protected Area in the Downstream ............................................... 192 Figure 8.3-16 Number of the Protected Species in the Downstream .......................................... 192 Figure 8.3-17 Impact on Forest by Transmission Line ................................................................ 193 Figure 8.3-18 Number of Household........................................................................................... 194 Figure 8.3-19 Number of Schools ............................................................................................... 194 Figure 8.3-20 Number of Industries ............................................................................................ 195 Figure 8.3-21 Total Numbers of Ethnic Minority Groups ........................................................... 196 Figure 8.3-22 Impact on Cultivated Land (km2) ......................................................................... 197 Figure 8.3-23 Impact on the Number of Irrigation Systems........................................................ 197 Figure 8.3-24 Impact on Number of Fishermen .......................................................................... 201 Figure 8.3-25 Number of the Nearest Fish Markets .................................................................... 201 Figure 8.3-26 Availability of Fish in the Market (kg/day) .......................................................... 201 Figure 8.3-27 Total Sales of Fish Market (Rs./day) .................................................................... 202 Figure 8.3-28 Total Income of Fisherman (Rs./Year) .................................................................. 202 Figure 8.3-29 Number of Cultural Structures (Temples) ............................................................ 204 Figure 8.3-30 Number of Tourist Facilities ................................................................................. 204 Figure 8.3-31 Number of Tourist/Year ........................................................................................ 204 Figure 8.3-32 Impact on Roads ................................................................................................... 206 Figure 8.3-33 Impact on Bridges ................................................................................................. 206
Final Report Appendix 3 SEA Report
xii

Nationwide Master Plan Study on Storage-type Hydroelectric Power Development in Nepal
Figure 8.3-34 Impact on Water Mill / Hydroelectric power ........................................................ 206 Figure 8.3-35 Impact on Drinking Water Schemes ..................................................................... 207 Figure 8.3-36 Number of Markets ............................................................................................... 209 Figure 8.3-37 Number of Existing Plans ..................................................................................... 209 Figure 8.3-38 Number of Previous Experience / Issues .............................................................. 209 Figure 8.3-39 (1) Characteristics of Promising Projects (1) .......................................................... 243 Figure 9.1-1 Existing HPPs and Irrigation Barrage ................................................................... 250 Figure 9.1-2 Existing road network in Nepal ............................................................................ 251 Figure 9.1-3 HPPs in Preparation Stage and Candidate projects .............................................. 252 Figure 9.1-4 Issued Licenses by Ministry of Energy (2012) ..................................................... 253 Figure 9.1-5 Planned Major Irrigations in Nepal ...................................................................... 254 Figure 9.1-6 Planned Road (2011/2012) ................................................................................... 254 Figure 9.3-1 Existing and Planned Barrier in Karnali River System ........................................ 259 Figure 9.3-2 Existing and Planned Barrier in Gandaki River System ....................................... 260 Figure 9.3-3 Existing and Planned Barrier in Koshi River System ........................................... 260 Figure 9.3-4 Land Use and Existing and Planned Projects (West) ............................................ 261 Figure 9.3-5 Land Use and Existing and Planned Projects (Center) ......................................... 262 Figure 9.3-6 Land Use and Existing and Planned Projects (East) ............................................. 262 Figure 12.1-1 Weightage of Evaluation Criteria ......................................................................... 271 Figure12.1-2 Summary Result about Technical and Economic Conditions ............................... 271 Figure12.1-3 Summary Result about Social and Natural Environment ..................................... 272 Figure 12.2-1 Summary Result of Hydrology Rating ................................................................. 278 Figure12.2-2 Summary Result of Geology Rating ..................................................................... 279 Figure 12.2-3 Summary Result of Effectiveness Rating ............................................................. 279 Figure 12.2-4 Summary Result of Natural Environment Rating ................................................. 280 Figure 12.2-5 Summary Result of Social Environment Rating ................................................... 280 Figure 12.2-6 Cases of Sensitive Analysis .................................................................................. 281 Figure 12.2-7 Example of Press Release about 2nd Stakeholders Meeting .................................. 284 Figure 12.3-1 Example of Press Release about 3rd Stakeholders Meeting .................................. 291
Final Report Appendix 3 SEA Report
xiii

Nationwide Master Plan Study on Storage-type Hydroelectric Power Development in Nepal
Chapter 1 Introduction
The method of Strategic Environmental Assessment (SEA) is adopted for the project evaluation in the Nationwide Master Plan Study on Storage Type Hydroelectric Power Development in Nepal. This SEA report is an appendix of the final report of the Nationwide Master Plan Study on Storage Type Hydroelectric Power Development in Nepal. The SEA study contains both technical and environmental aspects. But some technical issues such as Hydrology and Geology are consisted for SEA evaluation. More detail discussions on the technical matters are described in the final report.
Chapter 2 Target Setting of SEA
The electricity power demand in FY2031/32 is forecasted at 4,279 MW (Base case) as described in Chapter 7 of the Final report. The target of the SEA is to propose 10 promising projects and their developing order in order to fulfill this demand mainly by storage type hydroelectric power projects in environmentally sustainable manners without having serious impact on natural environment and social issues. The run-of-river type hydroelectric power projects are not considered in the SEA. But they are included in development planning in the main report.
Chapter 3 Environmental Baseline
The environmental baseline in Nepal is briefly summarized in this section. The site survey results for the third step are attached as SEA Annex 11 – SEA Annex 21 in Appendix 5. The site surveys were conducted only in dry season. Then some fauna and flora of rainy season might be lacked.
Temperature and Rainfall 3.1
The lowest average temperature in Kathmandu (Alt. 1,336 m) is 10.9 °C in January and the highest is 24.4°C. The annual rainfall is 1,476 mm. Dry seasons is May to October and rainy season is November to April. Rainfall pattern in a year is almost similar in the country. The monthly rainfall and temperature is shown in Figure 3.1-1.
Final Report Appendix 3 SEA Report
1

Nationwide Master Plan Study on Storage-type Hydroelectric Power Development in Nepal
Source: Japan Meteorological Agency
Figure 3.1-1 Rainfall and Temperature in Kathmandu (1981-2010)
Geography 3.2
Nepal has Low zone under 1,000 m along southern Indian border and the elevation goes up toward North East until Himalaya Mountain range over 8,000 m. Most of the possible HPPs locate around 1,000 m to 1,500 m. The elevation map is shown in Figure 3.2-1.
Figure 3.2-1 Elevation Map
0
50
100
150
200
250
300
350
400
0
5
10
15
20
25
30
1 2 3 4 5 6 7 8 9 10 11 12
Rain
Fal
l
Tem
pera
ture
mm ℃
Final Report Appendix 3 SEA Report
2
Nationwide Master Plan Study on Storage-type Hydroelectric Power Development in Nepal
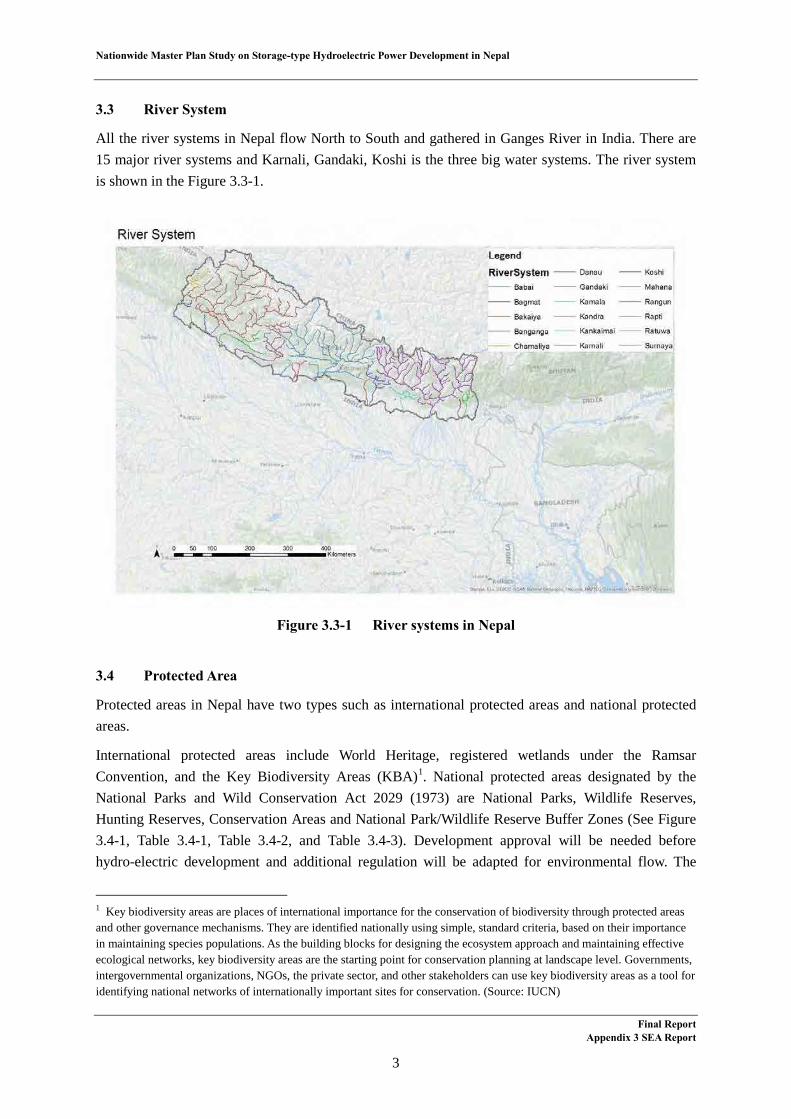
River System 3.3
All the river systems in Nepal flow North to South and gathered in Ganges River in India. There are 15 major river systems and Karnali, Gandaki, Koshi is the three big water systems. The river system is shown in the Figure 3.3-1.
Figure 3.3-1 River systems in Nepal
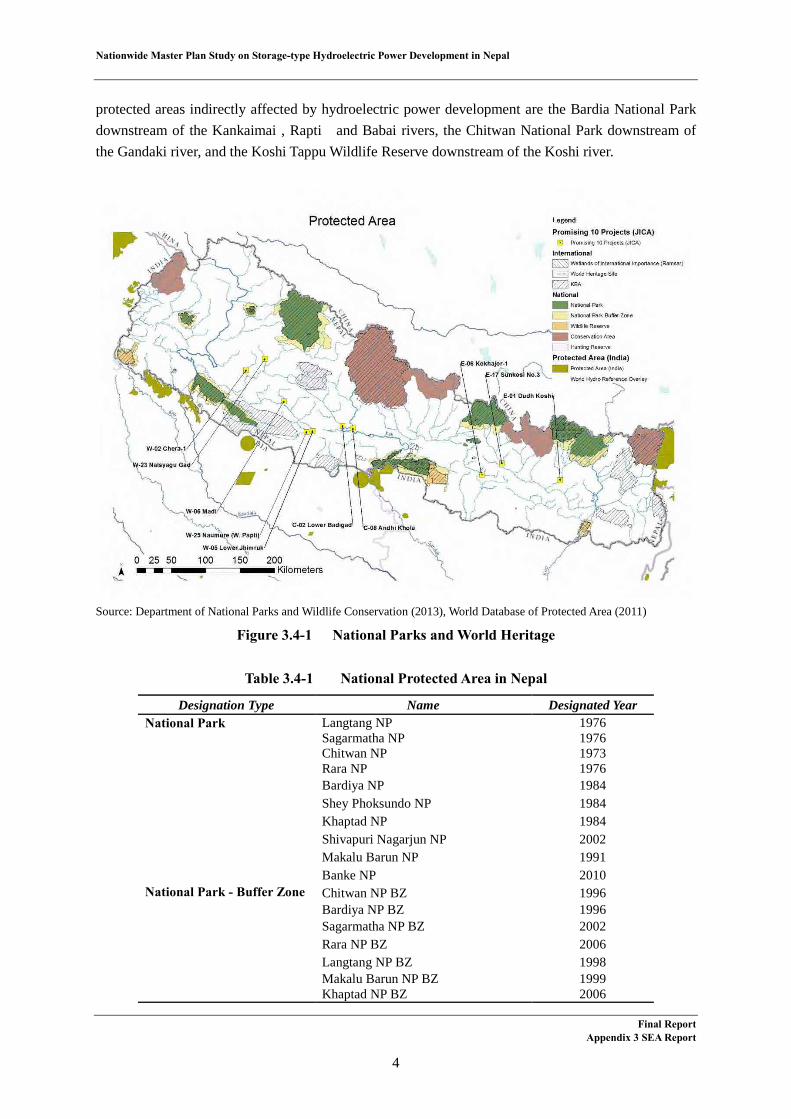
Protected Area 3.4
Protected areas in Nepal have two types such as international protected areas and national protected areas.
International protected areas include World Heritage, registered wetlands under the Ramsar Convention, and the Key Biodiversity Areas (KBA)1. National protected areas designated by the National Parks and Wild Conservation Act 2029 (1973) are National Parks, Wildlife Reserves, Hunting Reserves, Conservation Areas and National Park/Wildlife Reserve Buffer Zones (See Figure 3.4-1, Table 3.4-1, Table 3.4-2, and Table 3.4-3). Development approval will be needed before hydro-electric development and additional regulation will be adapted for environmental flow. The
1 Key biodiversity areas are places of international importance for the conservation of biodiversity through protected areas and other governance mechanisms. They are identified nationally using simple, standard criteria, based on their importance in maintaining species populations. As the building blocks for designing the ecosystem approach and maintaining effective ecological networks, key biodiversity areas are the starting point for conservation planning at landscape level. Governments, intergovernmental organizations, NGOs, the private sector, and other stakeholders can use key biodiversity areas as a tool for identifying national networks of internationally important sites for conservation. (Source: IUCN)
Final Report Appendix 3 SEA Report
3
Nationwide Master Plan Study on Storage-type Hydroelectric Power Development in Nepal
protected areas indirectly affected by hydroelectric power development are the Bardia National Park downstream of the Kankaimai , Rapti and Babai rivers, the Chitwan National Park downstream of the Gandaki river, and the Koshi Tappu Wildlife Reserve downstream of the Koshi river.
Source: Department of National Parks and Wildlife Conservation (2013), World Database of Protected Area (2011)
Figure 3.4-1 National Parks and World Heritage
Table 3.4-1 National Protected Area in Nepal
Designation Type Name Designated Year National Park
Langtang NP 1976 Sagarmatha NP 1976 Chitwan NP 1973 Rara NP 1976 Bardiya NP 1984 Shey Phoksundo NP 1984 Khaptad NP 1984 Shivapuri Nagarjun NP 2002 Makalu Barun NP 1991 Banke NP 2010
National Park - Buffer Zone
Chitwan NP BZ 1996 Bardiya NP BZ 1996 Sagarmatha NP BZ 2002 Rara NP BZ 2006 Langtang NP BZ 1998 Makalu Barun NP BZ 1999 Khaptad NP BZ 2006
Final Report Appendix 3 SEA Report
4

Nationwide Master Plan Study on Storage-type Hydroelectric Power Development in Nepal
Designation Type Name Designated Year Shey Phoksundo NP BZ 1998 Banke NP BZ 2010
Wildlife Reserve
Shuklaphanta WR 1976 Koshi Tappu WR 1976 Parsa WR 1984
Wildlife Reserve- Buffer Zone
Parsa WR BZ 2005 Koshi Tappu WR BZ 2004 Shuklaphanta WR BZ 2004
Conservation Area Annapurna CA 1992 Kanchanjunga CA 1997 Manasalu CA 1998 Krishnasar CA 2009 Gaurishankar CA 2010 Api Nampa CA 2010
Hunting Reserve Dhorpatan HR 1987
Table 3.4-2 International Protected Area in Nepal
Designation Type Name Designated Year World Heritage Site Sagarmatha National Park 1979
Chitwan National Park 1984 Wetlands of International Importance (Ramsar)
Koshi Tappu 1987 Gokyo and associated lakes 2007 Gosaikunda and associated lakes 2007 Phoksundo Lake 2007 Rara Lake 2007 Mai Pokhari 2008 Beeshazar and associated lakes 2003 Ghodaghodi Lake Area 2003 Jagadishpur Reservoir 2003
Final Report Appendix 3 SEA Report
5
Nationwide Master Plan Study on Storage-type Hydroelectric Power Development in Nepal
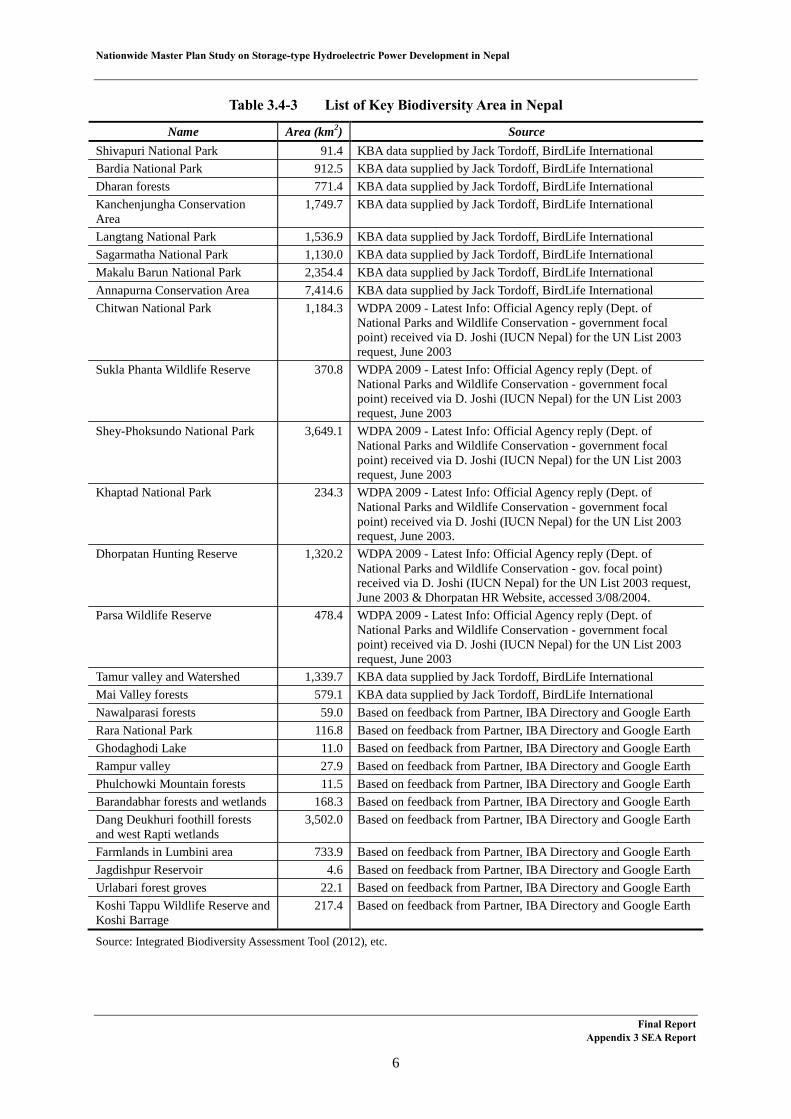
Table 3.4-3 List of Key Biodiversity Area in Nepal
Name Area (km2) Source Shivapuri National Park 91.4 KBA data supplied by Jack Tordoff, BirdLife International Bardia National Park 912.5 KBA data supplied by Jack Tordoff, BirdLife International Dharan forests 771.4 KBA data supplied by Jack Tordoff, BirdLife International Kanchenjungha Conservation Area
1,749.7 KBA data supplied by Jack Tordoff, BirdLife International
Langtang National Park 1,536.9 KBA data supplied by Jack Tordoff, BirdLife International Sagarmatha National Park 1,130.0 KBA data supplied by Jack Tordoff, BirdLife International Makalu Barun National Park 2,354.4 KBA data supplied by Jack Tordoff, BirdLife International Annapurna Conservation Area 7,414.6 KBA data supplied by Jack Tordoff, BirdLife International Chitwan National Park 1,184.3 WDPA 2009 - Latest Info: Official Agency reply (Dept. of
National Parks and Wildlife Conservation - government focal point) received via D. Joshi (IUCN Nepal) for the UN List 2003 request, June 2003
Sukla Phanta Wildlife Reserve 370.8 WDPA 2009 - Latest Info: Official Agency reply (Dept. of National Parks and Wildlife Conservation - government focal point) received via D. Joshi (IUCN Nepal) for the UN List 2003 request, June 2003
Shey-Phoksundo National Park 3,649.1 WDPA 2009 - Latest Info: Official Agency reply (Dept. of National Parks and Wildlife Conservation - government focal point) received via D. Joshi (IUCN Nepal) for the UN List 2003 request, June 2003
Khaptad National Park 234.3 WDPA 2009 - Latest Info: Official Agency reply (Dept. of National Parks and Wildlife Conservation - government focal point) received via D. Joshi (IUCN Nepal) for the UN List 2003 request, June 2003.
Dhorpatan Hunting Reserve 1,320.2 WDPA 2009 - Latest Info: Official Agency reply (Dept. of National Parks and Wildlife Conservation - gov. focal point) received via D. Joshi (IUCN Nepal) for the UN List 2003 request, June 2003 & Dhorpatan HR Website, accessed 3/08/2004.
Parsa Wildlife Reserve 478.4 WDPA 2009 - Latest Info: Official Agency reply (Dept. of National Parks and Wildlife Conservation - government focal point) received via D. Joshi (IUCN Nepal) for the UN List 2003 request, June 2003
Tamur valley and Watershed 1,339.7 KBA data supplied by Jack Tordoff, BirdLife International Mai Valley forests 579.1 KBA data supplied by Jack Tordoff, BirdLife International Nawalparasi forests 59.0 Based on feedback from Partner, IBA Directory and Google Earth Rara National Park 116.8 Based on feedback from Partner, IBA Directory and Google Earth Ghodaghodi Lake 11.0 Based on feedback from Partner, IBA Directory and Google Earth Rampur valley 27.9 Based on feedback from Partner, IBA Directory and Google Earth Phulchowki Mountain forests 11.5 Based on feedback from Partner, IBA Directory and Google Earth Barandabhar forests and wetlands 168.3 Based on feedback from Partner, IBA Directory and Google Earth Dang Deukhuri foothill forests and west Rapti wetlands
3,502.0 Based on feedback from Partner, IBA Directory and Google Earth
Farmlands in Lumbini area 733.9 Based on feedback from Partner, IBA Directory and Google Earth Jagdishpur Reservoir 4.6 Based on feedback from Partner, IBA Directory and Google Earth Urlabari forest groves 22.1 Based on feedback from Partner, IBA Directory and Google Earth Koshi Tappu Wildlife Reserve and Koshi Barrage
217.4 Based on feedback from Partner, IBA Directory and Google Earth
Source: Integrated Biodiversity Assessment Tool (2012), etc.
Final Report Appendix 3 SEA Report
6

Nationwide Master Plan Study on Storage-type Hydroelectric Power Development in Nepal
Conservation Species 3.5
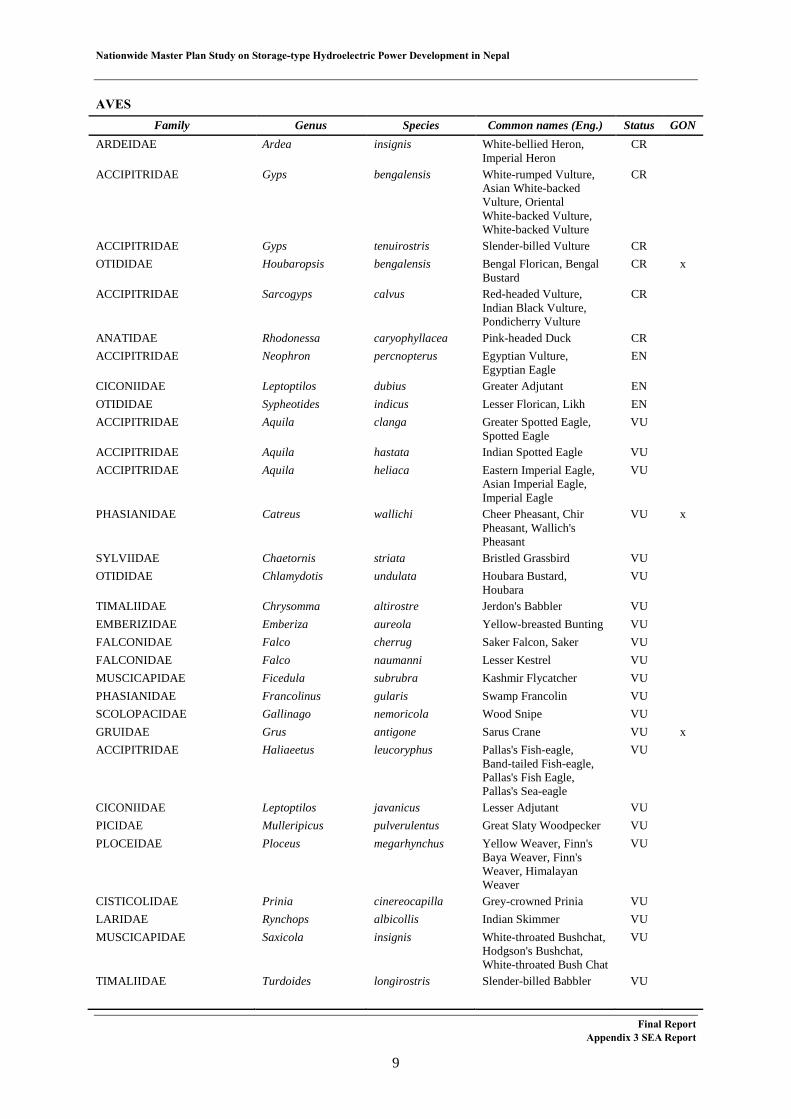
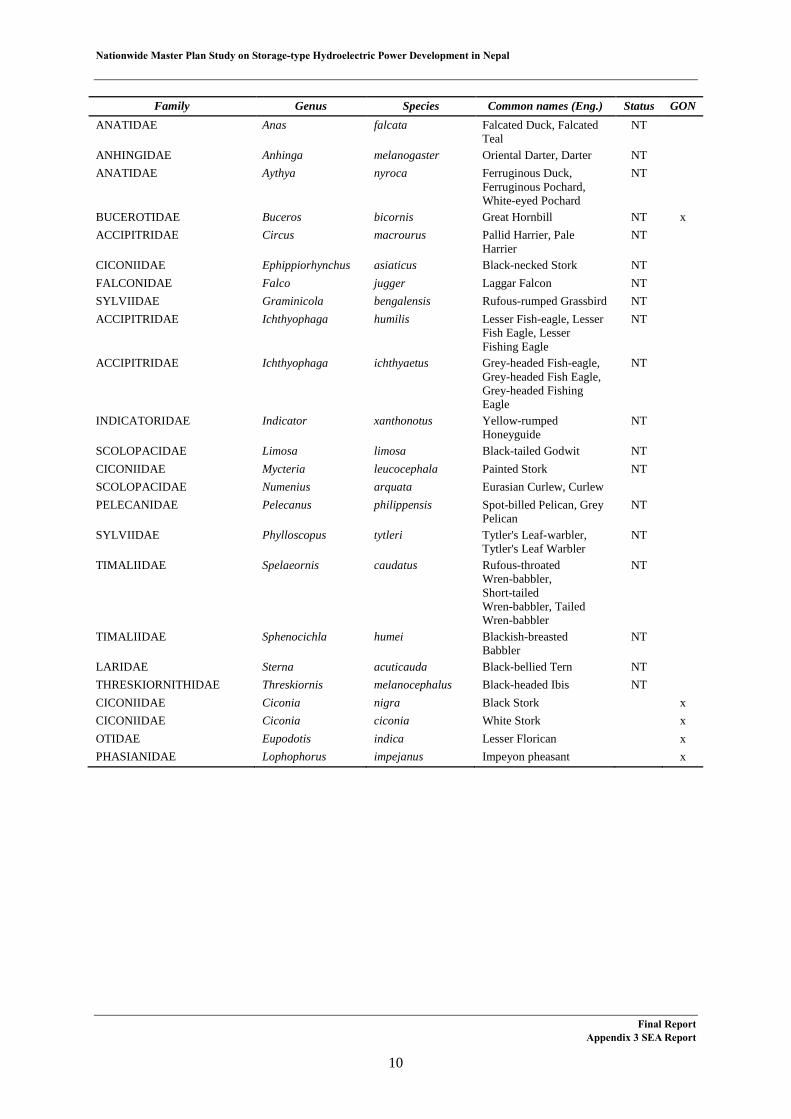
88 species which are above rank VU (Vulnerable) are listed on IUCN (International Union for Conservation of Nature) red list in Nepal (See Table 3.5-1). Distribution areas of some species are proved. The Government of Nepal also identifies the 39 protected wildlife in the National Parks and Wildlife Conservation Act, 2029 (1973).
Table 3.5-1 IUCN Red-List Species and Protected Wildlife in Nepal PLANTAE
Family Genus Species Common names (Eng.) Status SCAPANIACEAE Andrewsianthus ferrugineus EN SOLENOSTOMATACEAE Diplocolea sikkimensis EN
TAKAKIACEAE Takakia ceratophylla VU SOLENOSTOMATACEAE Scaphophyllum speciosum VU CYCADACEAE Cycas pectinata VU LEGUMINOSAE Dalbergia latifolia Bombay Blackwood, Indian Rosewood,
Indonesian Rosewood, Malabar Rosewood VU
ULMACEAE Ulmus wallichiana VU MAMMALIA
Family Genus Species Common names (Eng.) Status GON SUIDAE Porcula salvania Pygmy Hog CR MURIDAE Apodemus gurkha Himalayan Wood Mouse,
Himalayan Field Mouse EN
CERVIDAE Axis porcinus Hog Deer, Indochinese Hog Deer, Thai Hog Deer
EN
BOVIDAE Bubalus arnee Asian Buffalo, Asiatic Buffalo, Indian Buffalo, Indian Water Buffalo, Water Buffalo, Wild Asian Buffalo, Wild Water Buffalo
EN x
LEPORIDAE Caprolagus hispidus Hispid Hare, Assam Rabbit EN x CANIDAE Cuon alpinus Dhole, Asiatic Wild Dog,
Indian Wild Dog, Red Dog EN
ELEPHANTIDAE Elephas maximus Asian Elephant, Indian Elephant EN x MANIDAE Manis pentadactyla Chinese Pangolin EN x MOSCHIDAE Moschus chrysogaster Alpine Musk Deer, Himalayan
Musk Deer EN x
MOSCHIDAE Moschus fuscus Black Musk Deer, Dusky Musk Deer
EN
MOSCHIDAE Moschus leucogaster Himalayan Muskdeer, Himalayan Musk-deer, Himalayan Musk Deer
EN
FELIDAE Panthera tigris Tiger EN x FELIDAE Panthera uncia Snow Leopard, Ounce EN x BOVIDAE Pantholops hodgsonii Chiru, Tibetan Antelope EN x PLATANISTIDAE Platanista gangetica South Asian River Dolphin,
Blind River Dolphin, Ganges Dolphin, Ganges River Dolphin, Ganges Susu, Indus River Dolphin
EN x
FELIDAE Prionailurus viverrinus Fishing Cat EN AILURIDAE Ailurus fulgens Red Panda, Lesser Panda, Red
Cat-bear VU x
Final Report Appendix 3 SEA Report
7

Nationwide Master Plan Study on Storage-type Hydroelectric Power Development in Nepal
Family Genus Species Common names (Eng.) Status GON
MUSTELIDAE Aonyx cinerea Asian Small-clawed Otter, Oriental Small-clawed Otter, Small-clawed Otter
VU
VIVERRIDAE Arctictis binturong Binturong, Bearcat, Palawan Binturong
VU
BOVIDAE Bos mutus Wild Yak, Yak VU x
BOVIDAE Bos gaurus Gaur, Indian Bison VU x MUSTELIDAE Lutrogale perspicillata Smooth-coated Otter, Indian
Smooth-coated Otter VU
URSIDAE Melursus ursinus Sloth Bear VU VESPERTILIONIDAE Myotis sicarius Mandelli's Mouse-eared Myotis,
Mandelli's Mouse-eared Bat VU
FELIDAE Neofelis nebulosa Clouded Leopard VU x FELIDAE Pardofelis marmorata Marbled Cat VU RHINOCEROTIDAE Rhinoceros unicornis Greater One-horned Rhino,
Great Indian Rhinoceros, Indian Rhinoceros
VU x
CERVIDAE Rucervus duvaucelii Barasingha, Swamp Deer VU CERVIDAE Rusa unicolor Sambar, Sambar Deer VU BOVIDAE Tetracerus quadricornis Four-horned Antelope,
Chousingha VU x
URSIDAE Ursus thibetanus Asiatic Black Bear, Himalayan Black Bear
VU
BOVIDAE Capricornis thar Himalayan Serow NT BOVIDAE Hemitragus jemlahicus Himalayan Tahr NT HYAENIDAE Hyaena hyaena Striped Hyaena NT x MUSTELIDAE Lutra lutra Eurasian Otter, Common Otter,
European Otter, European River Otter, Old World Otter
NT
CERCOPITHECIDAE Macaca assamensis Assam Macaque, Assamese Macaque
NT x
BOVIDAE Naemorhedus goral Himalayan Goral, Goral NT BOVIDAE Ovis ammon Argali, Wild Sheep NT x FELIDAE Panthera pardus Leopard NT SCIURIDAE Petaurista nobilis Bhutan Giant Flying Squirrel,
Grays Giant Flying Squirrel, Noble Giant Flying Squirrel
NT
SCIURIDAE Ratufa bicolor Black Giant Squirrel, Malayan Giant Squirrel
NT
CERCOPITHECIDAE Semnopithecus hector Tarai Gray Langur, Gray Langur, Hanuman Langur, Lesser Hill Langur, Tarai Sacred Langur
NT
VIVERRIDAE Viverra zibetha Large Indian Civet NT Cervidae Cervus duvaucelii Swamp Deer x Felidae Lynx lynx Lynx x MANIDAE Manis crasscaudata Pangolin x Canidae Canis lupus Gray Wolf x Viverridae Prionodon pardicolor Lingsang x FELIDAE Prionailurus bengalensis Leopard Cat x Suidae Sus salvanius Pygmy Hog x URSIDAE Ursus arctos Himalayan Brown Beer x
Final Report Appendix 3 SEA Report
8
Nationwide Master Plan Study on Storage-type Hydroelectric Power Development in Nepal
AVES
Family Genus Species Common names (Eng.) Status GON ARDEIDAE Ardea insignis White-bellied Heron,
Imperial Heron CR
ACCIPITRIDAE Gyps bengalensis White-rumped Vulture, Asian White-backed Vulture, Oriental White-backed Vulture, White-backed Vulture
CR
ACCIPITRIDAE Gyps tenuirostris Slender-billed Vulture CR OTIDIDAE Houbaropsis bengalensis Bengal Florican, Bengal
Bustard CR x
ACCIPITRIDAE Sarcogyps calvus Red-headed Vulture, Indian Black Vulture, Pondicherry Vulture
CR
ANATIDAE Rhodonessa caryophyllacea Pink-headed Duck CR ACCIPITRIDAE Neophron percnopterus Egyptian Vulture,
Egyptian Eagle EN
CICONIIDAE Leptoptilos dubius Greater Adjutant EN OTIDIDAE Sypheotides indicus Lesser Florican, Likh EN ACCIPITRIDAE Aquila clanga Greater Spotted Eagle,
Spotted Eagle VU
ACCIPITRIDAE Aquila hastata Indian Spotted Eagle VU ACCIPITRIDAE Aquila heliaca Eastern Imperial Eagle,
Asian Imperial Eagle, Imperial Eagle
VU
PHASIANIDAE Catreus wallichi Cheer Pheasant, Chir Pheasant, Wallich's Pheasant
VU x
SYLVIIDAE Chaetornis striata Bristled Grassbird VU OTIDIDAE Chlamydotis undulata Houbara Bustard,
Houbara VU
TIMALIIDAE Chrysomma altirostre Jerdon's Babbler VU EMBERIZIDAE Emberiza aureola Yellow-breasted Bunting VU FALCONIDAE Falco cherrug Saker Falcon, Saker VU FALCONIDAE Falco naumanni Lesser Kestrel VU MUSCICAPIDAE Ficedula subrubra Kashmir Flycatcher VU PHASIANIDAE Francolinus gularis Swamp Francolin VU SCOLOPACIDAE Gallinago nemoricola Wood Snipe VU GRUIDAE Grus antigone Sarus Crane VU x ACCIPITRIDAE Haliaeetus leucoryphus Pallas's Fish-eagle,
Band-tailed Fish-eagle, Pallas's Fish Eagle, Pallas's Sea-eagle
VU
CICONIIDAE Leptoptilos javanicus Lesser Adjutant VU PICIDAE Mulleripicus pulverulentus Great Slaty Woodpecker VU PLOCEIDAE Ploceus megarhynchus Yellow Weaver, Finn's
Baya Weaver, Finn's Weaver, Himalayan Weaver
VU
CISTICOLIDAE Prinia cinereocapilla Grey-crowned Prinia VU LARIDAE Rynchops albicollis Indian Skimmer VU MUSCICAPIDAE Saxicola insignis White-throated Bushchat,
Hodgson's Bushchat, White-throated Bush Chat
VU
TIMALIIDAE Turdoides longirostris Slender-billed Babbler VU
Final Report Appendix 3 SEA Report
9
Nationwide Master Plan Study on Storage-type Hydroelectric Power Development in Nepal
Family Genus Species Common names (Eng.) Status GON
ANATIDAE Anas falcata Falcated Duck, Falcated Teal
NT
ANHINGIDAE Anhinga melanogaster Oriental Darter, Darter NT ANATIDAE Aythya nyroca Ferruginous Duck,
Ferruginous Pochard, White-eyed Pochard
NT
BUCEROTIDAE Buceros bicornis Great Hornbill NT x ACCIPITRIDAE Circus macrourus Pallid Harrier, Pale
Harrier NT
CICONIIDAE Ephippiorhynchus asiaticus Black-necked Stork NT FALCONIDAE Falco jugger Laggar Falcon NT SYLVIIDAE Graminicola bengalensis Rufous-rumped Grassbird NT ACCIPITRIDAE Ichthyophaga humilis Lesser Fish-eagle, Lesser
Fish Eagle, Lesser Fishing Eagle
NT
ACCIPITRIDAE Ichthyophaga ichthyaetus Grey-headed Fish-eagle, Grey-headed Fish Eagle, Grey-headed Fishing Eagle
NT
INDICATORIDAE Indicator xanthonotus Yellow-rumped Honeyguide
NT
SCOLOPACIDAE Limosa limosa Black-tailed Godwit NT CICONIIDAE Mycteria leucocephala Painted Stork NT SCOLOPACIDAE Numenius arquata Eurasian Curlew, Curlew PELECANIDAE Pelecanus philippensis Spot-billed Pelican, Grey
Pelican NT
SYLVIIDAE Phylloscopus tytleri Tytler's Leaf-warbler, Tytler's Leaf Warbler
NT
TIMALIIDAE Spelaeornis caudatus Rufous-throated Wren-babbler, Short-tailed Wren-babbler, Tailed Wren-babbler
NT
TIMALIIDAE Sphenocichla humei Blackish-breasted Babbler
NT
LARIDAE Sterna acuticauda Black-bellied Tern NT THRESKIORNITHIDAE Threskiornis melanocephalus Black-headed Ibis NT CICONIIDAE Ciconia nigra Black Stork x CICONIIDAE Ciconia ciconia White Stork x OTIDAE Eupodotis indica Lesser Florican x PHASIANIDAE Lophophorus impejanus Impeyon pheasant x
Final Report Appendix 3 SEA Report
10
Nationwide Master Plan Study on Storage-type Hydroelectric Power Development in Nepal
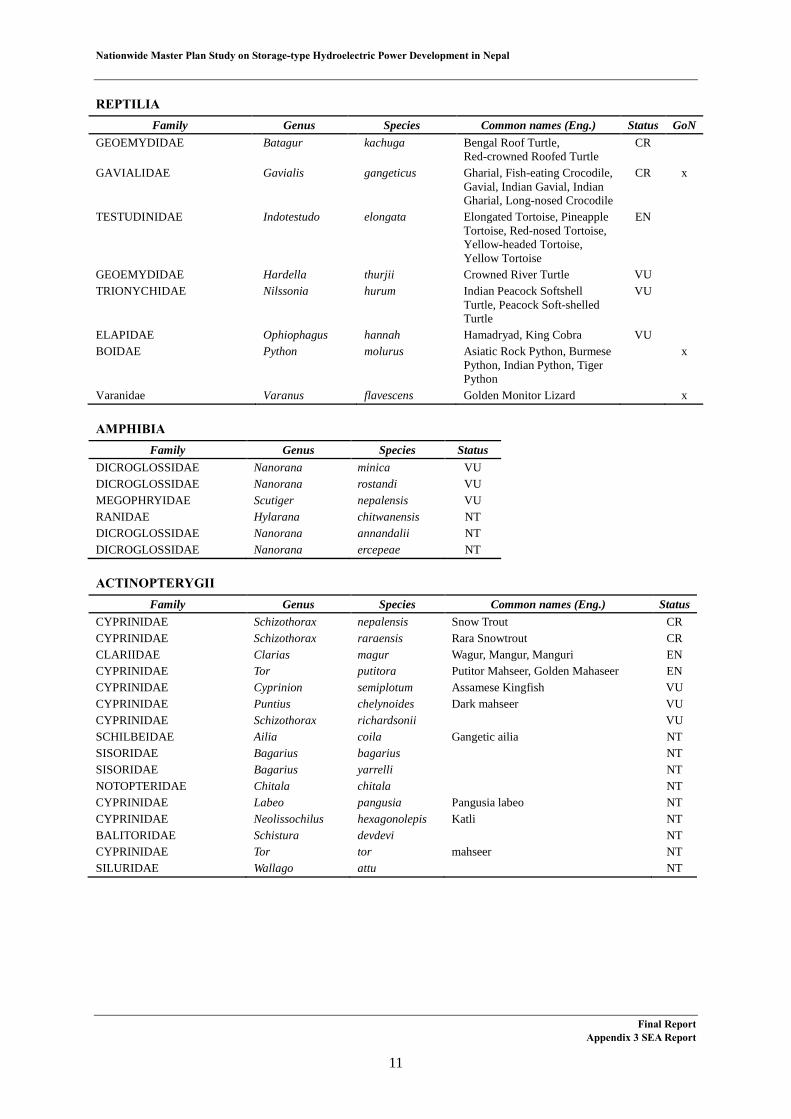
REPTILIA
Family Genus Species Common names (Eng.) Status GoN GEOEMYDIDAE Batagur kachuga Bengal Roof Turtle,
Red-crowned Roofed Turtle CR
GAVIALIDAE Gavialis gangeticus Gharial, Fish-eating Crocodile, Gavial, Indian Gavial, Indian Gharial, Long-nosed Crocodile
CR x
TESTUDINIDAE Indotestudo elongata Elongated Tortoise, Pineapple Tortoise, Red-nosed Tortoise, Yellow-headed Tortoise, Yellow Tortoise
EN
GEOEMYDIDAE Hardella thurjii Crowned River Turtle VU TRIONYCHIDAE Nilssonia hurum Indian Peacock Softshell
Turtle, Peacock Soft-shelled Turtle
VU
ELAPIDAE Ophiophagus hannah Hamadryad, King Cobra VU BOIDAE Python molurus Asiatic Rock Python, Burmese
Python, Indian Python, Tiger Python
x
Varanidae Varanus flavescens Golden Monitor Lizard x AMPHIBIA
Family Genus Species Status DICROGLOSSIDAE Nanorana minica VU DICROGLOSSIDAE Nanorana rostandi VU MEGOPHRYIDAE Scutiger nepalensis VU RANIDAE Hylarana chitwanensis NT DICROGLOSSIDAE Nanorana annandalii NT DICROGLOSSIDAE Nanorana ercepeae NT ACTINOPTERYGII
Family Genus Species Common names (Eng.) Status CYPRINIDAE Schizothorax nepalensis Snow Trout CR CYPRINIDAE Schizothorax raraensis Rara Snowtrout CR CLARIIDAE Clarias magur Wagur, Mangur, Manguri EN CYPRINIDAE Tor putitora Putitor Mahseer, Golden Mahaseer EN CYPRINIDAE Cyprinion semiplotum Assamese Kingfish VU CYPRINIDAE Puntius chelynoides Dark mahseer VU CYPRINIDAE Schizothorax richardsonii VU SCHILBEIDAE Ailia coila Gangetic ailia NT SISORIDAE Bagarius bagarius NT SISORIDAE Bagarius yarrelli NT NOTOPTERIDAE Chitala chitala NT CYPRINIDAE Labeo pangusia Pangusia labeo NT CYPRINIDAE Neolissochilus hexagonolepis Katli NT BALITORIDAE Schistura devdevi NT CYPRINIDAE Tor tor mahseer NT SILURIDAE Wallago attu NT
Final Report Appendix 3 SEA Report
11
Nationwide Master Plan Study on Storage-type Hydroelectric Power Development in Nepal
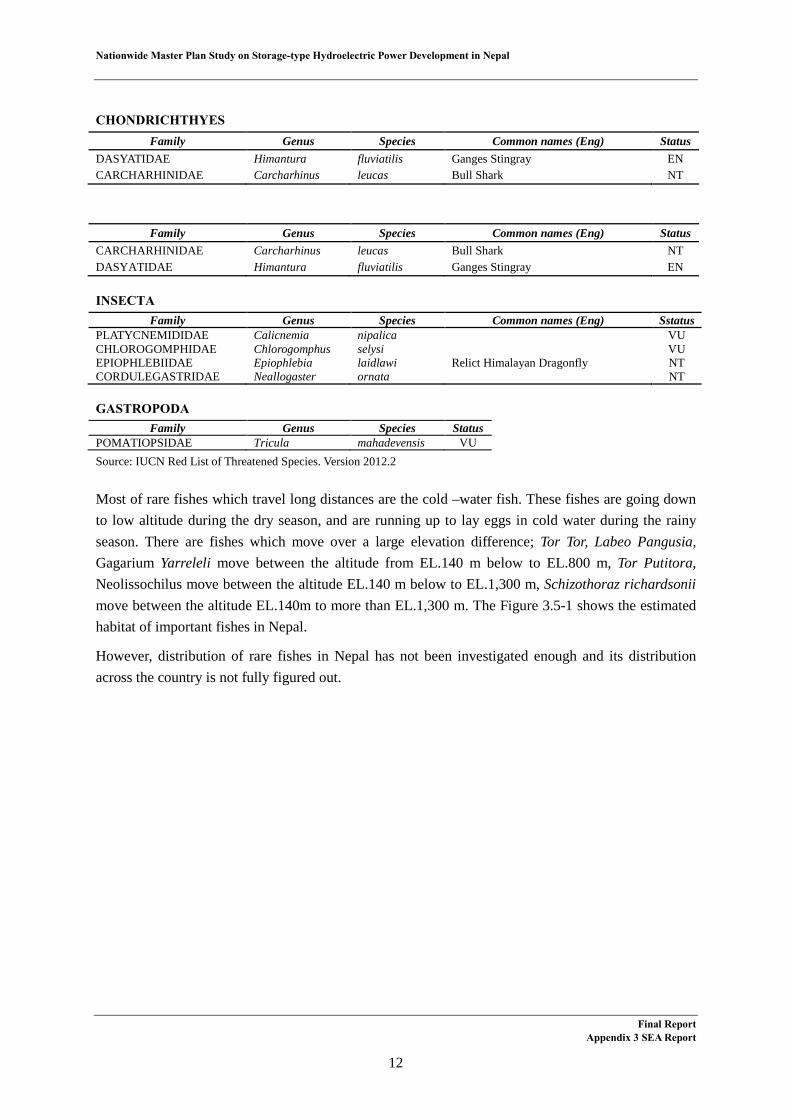
CHONDRICHTHYES
Family Genus Species Common names (Eng) Status DASYATIDAE Himantura fluviatilis Ganges Stingray EN CARCHARHINIDAE Carcharhinus leucas Bull Shark NT
Family Genus Species Common names (Eng) Status CARCHARHINIDAE Carcharhinus leucas Bull Shark NT DASYATIDAE Himantura fluviatilis Ganges Stingray EN INSECTA
Family Genus Species Common names (Eng) Sstatus PLATYCNEMIDIDAE Calicnemia nipalica VU CHLOROGOMPHIDAE Chlorogomphus selysi VU EPIOPHLEBIIDAE Epiophlebia laidlawi Relict Himalayan Dragonfly NT CORDULEGASTRIDAE Neallogaster ornata NT GASTROPODA
Family Genus Species Status POMATIOPSIDAE Tricula mahadevensis VU Source: IUCN Red List of Threatened Species. Version 2012.2
Most of rare fishes which travel long distances are the cold –water fish. These fishes are going down to low altitude during the dry season, and are running up to lay eggs in cold water during the rainy season. There are fishes which move over a large elevation difference; Tor Tor, Labeo Pangusia, Gagarium Yarreleli move between the altitude from EL.140 m below to EL.800 m, Tor Putitora, Neolissochilus move between the altitude EL.140 m below to EL.1,300 m, Schizothoraz richardsonii move between the altitude EL.140m to more than EL.1,300 m. The Figure 3.5-1 shows the estimated habitat of important fishes in Nepal.
However, distribution of rare fishes in Nepal has not been investigated enough and its distribution across the country is not fully figured out.
Final Report Appendix 3 SEA Report
12

Nationwide Master Plan Study on Storage-type Hydroelectric Power Development in Nepal
Figure 3.5-1 Habitat of Important Fishes in Nepal
Final Report Appendix 3 SEA Report
13

Nationwide Master Plan Study on Storage-type Hydroelectric Power Development in Nepal
Table 3.5-2 Distribution maps of National Red List Mammals in Nepal
Final Report Appendix 3 SEA Report
14
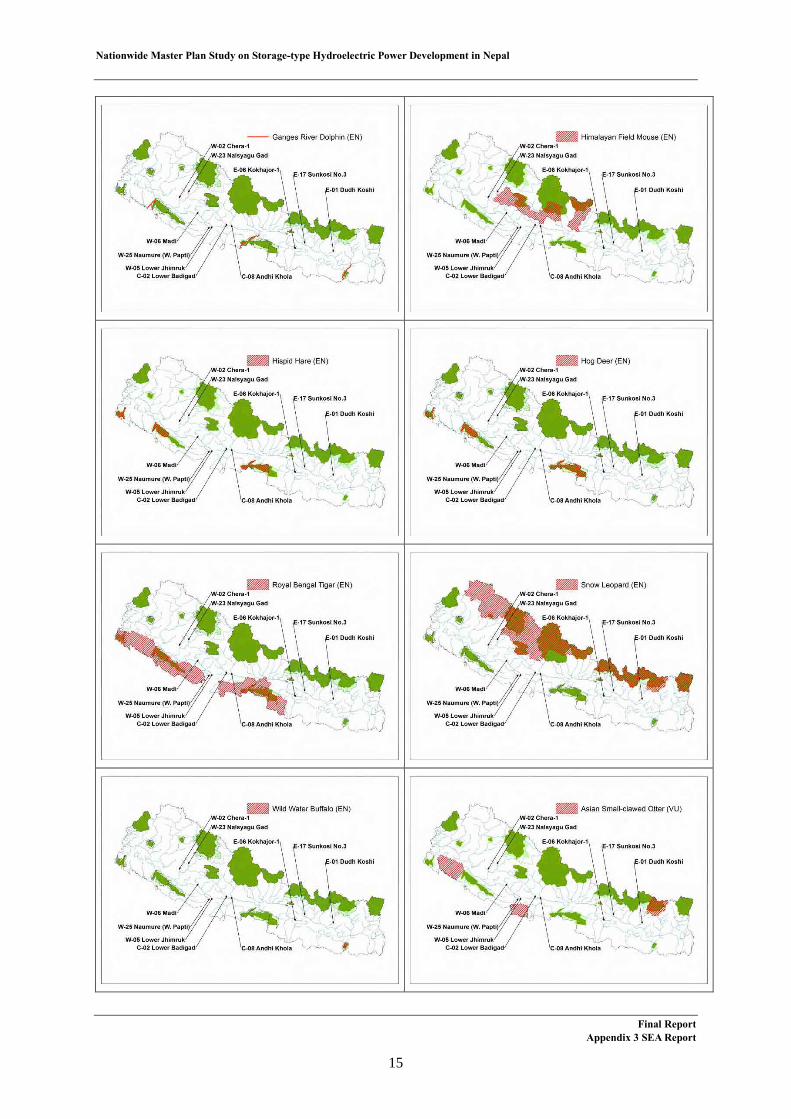
Nationwide Master Plan Study on Storage-type Hydroelectric Power Development in Nepal
Final Report Appendix 3 SEA Report
15

Nationwide Master Plan Study on Storage-type Hydroelectric Power Development in Nepal
Final Report Appendix 3 SEA Report
16
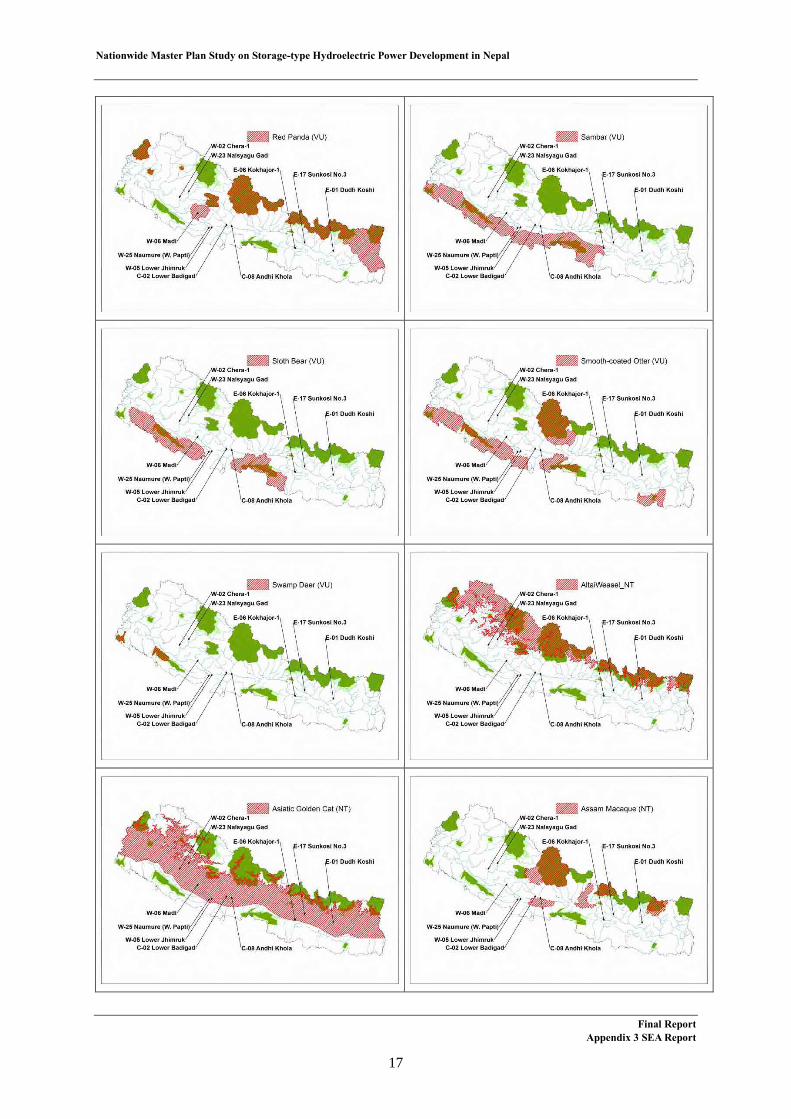
Nationwide Master Plan Study on Storage-type Hydroelectric Power Development in Nepal
Final Report Appendix 3 SEA Report
17

Nationwide Master Plan Study on Storage-type Hydroelectric Power Development in Nepal
Final Report Appendix 3 SEA Report
18

Nationwide Master Plan Study on Storage-type Hydroelectric Power Development in Nepal
Source: The Status of Nepal’s Mammals: The National Red List Series (IUCN 2012)
Population 3.6
Population of Nepal has been growing average 2.2% per year since 1960. The census data in 2011 show total population is 26,494,504. Child Mortality Rate has been decreasing from 290 to 48 per 1,000 and Life Expectancy at birth has been increasing from 38.5 to 68.5 years since 1960 to 2011. The population density is higher in Kathmandu, Pokara and low land along the Indian border than the other area. Figure 3.6-1 shows the population density map.
Final Report Appendix 3 SEA Report
19

Nationwide Master Plan Study on Storage-type Hydroelectric Power Development in Nepal
Source: Population census (2011)
Figure 3.6-1 Population density in Nepal
Administrative Boundary 3.7
Nepal has five Development Regions, 14 Zones, 75 Districts and 4,056 Village Development Committees. Figure 3.7-1 shows the map of the boundaries.
Figure 3.7-1 Administrative boundaries
Final Report Appendix 3 SEA Report
20

Nationwide Master Plan Study on Storage-type Hydroelectric Power Development in Nepal
Ethnicity 3.8
Nepal has various ethnic groups. 128 ethnic groups are recorded in the population census 2011. These ethnic groups are classified in six groups such as Adivasi/Janajati, BCTS, Dalit, Madhesi, Religious Minority, and others. Adivasi/Janajati is indigenous people who account for 36% of the national total population (See Table 3.8-2). BCTS (Brahmin/Chhetri/Thakuri/Sanyashi Dalit) is high caste people who account for 32%. Dalit is bottom caste people who account for 14%. Madhesi is the people living in Tarai plain who account for 14%2. Religious Minority means Islamic people who account for 4% (See Table 3.8-1). The National Foundation for Development of Indigenous Nationalities Act (2002) identified 59 ethnic groups as Adivasi/Janajati which own language, religion, tradition, culture, civilization and traditional egalitarian social structure and classified in five groups from endangered to advantaged based on the alienations. But it cannot be concluded that these counted groups are only the indigenous people. 48 out of 59 Adivasi/Janajatis are listed on the Census 2011 and other groups are under discussion if they are to be included in Adivasi/Janajati now. Then the classification of ethnic groups in Nepal is a matter of argument because of the history that Rana families forced no-Hindu groups into caste system and various epithets.
Table 3.8-1 Population of Ethnic Gropes
Category Name Madhesi Population Rate Adivasi/ Janajati
Endangered Meche * 4,867 21,284 0.0% 0.1% Raji * 4,235 0.0% Lepcha 3,445 0.0% Pattharkatta/ Kushwadiya
* 3,182 0.0%
Hayu 2,925 0.0% Kisan * 1,739 0.0% Raute 618 0.0% Kusunda 273 0.0% Bankariya - - Mugali - -
Highly marginalized
Dhanuk * 219,808 594,030 0.8% 2.2% Danuwar * 84,115 0.3% Majhi * 83,727 0.3% Chepang /Praja 68,399 0.3% Satar/ Santhal * 51,735 0.2% Jhangad/ Dhagar * 37,424 0.1% Thami * 28,671 0.1% Bote * 10,397 0.0% Brahmu/ Baramo 8,140 0.0% Lhomi 1,614 0.0% Thudam - - Siyar (Chumba) - -
2 Total population of Madheshi of 71 ethnics which are listed on Census 2011 out of 94 Madhesi ethnics (GoN on Magh 21, 2065 (2009) identified) are 12,449,631 which is 47% of total national population. But this figure excluded the Madheshi which are overlapped with Adivasi/Janajati or Dalit.
Final Report Appendix 3 SEA Report
21
Nationwide Master Plan Study on Storage-type Hydroelectric Power Development in Nepal
Category Name Madhesi Population Rate Marginalized Tharu * 1,737,470 3,891,696 6.6% 14.7%
Tamang 1,539,830 5.8% Kumal * 121,196 0.5% Gharti/Bhujel 118,650 0.4% Rajbansi * 115,242 0.4% Kumhar * 62,399 0.2% Sunuwar 55,712 0.2% Gangai * 36,988 0.1% Dhimal * 26,298 0.1% Tajpuriya * 19,213 0.1% Darai * 16,789 0.1% Pahari 13,615 0.1% Bhote 13,397 0.1% Dura 5,394 0.0% Dolpo 4,107 0.0% Lhopa 2,624 0.0% Topkegola 1,523 0.0% Walung 1,249 0.0% Free - - Mugali - - Larke (Nupriba) - -
Disadvantaged Magar 1,887,733 3,587,191 7.1% 13.5% Rai 620,004 2.3% Gurung 522,641 2.0% Limbu 387,300 1.5% Sherpa 112,946 0.4% Yakkha 24,336 0.1% Chhantyal/Chhantel 11,810 0.0% Hyolmo 10,752 0.0% Jirel 5,774 0.0% Byasi/Sauka 3,895 0.0% Tangbe - - Tin Gaunle Thakali - - Bahra Gaunle - - Marphali Thakali - -
Advanced Newar 1,321,933 1,335,148 5.0% 5.0% Thakali 13,215 0.0%
Others Janajati Others 1,228 1,228 0.0% 0.0% BCTS Chhetree 4,398,053 8,412,507 16.6% 31.8%
Brahman - Hill * 3,226,903 12.2% Thakuri 425,623 1.6% Sanyasi/Dasnami * 227,822 0.9% Brahman - Tarai * 134,106 0.5%
Dalit Kami 1,258,554 3,594,447 4.8% 13.6% Damai/Dholi 472,862 1.8% Sarki 374,816 1.4% Chamar/ Harijan/ Ram * 335,893 1.3% Musahar * 234,490 0.9%
Final Report Appendix 3 SEA Report
22

Nationwide Master Plan Study on Storage-type Hydroelectric Power Development in Nepal
Category Name Madhesi Population Rate Dusadh/ Pasawan/ Pasi * 208,910 0.8% Dhobi * 109,079 0.4% Tatma/Tatwa * 104,865 0.4% Lohar * 101,421 0.4% Khatwe * 100,921 0.4% Bantar/Sardar * 55,104 0.2% Badi 38,603 0.1% Dom * 13,268 0.1% Kori * 12,276 0.0% Gaine 6,791 0.0% Sarbaria * 4,906 0.0% Halkhor 4,003 0.0% Chidimar * 1,254 0.0% Kalar * 1,077 0.0% Dalit Others 155,354 0.6%
Madhesi (Other) Yadav * 1,054,458 3,747,586 4.0% 14.1% Teli * 369,688 1.4% Koiri/Kushwaha * 306,393 1.2% Kurmi * 231,129 0.9% Mallaha * 173,261 0.7% Kewat * 153,772 0.6% Kathabaniyan * 138,637 0.5% Kalwar * 128,232 0.5% Kanu * 125,184 0.5% Hajam/Thakur * 117,758 0.4% Sudhi * 93,115 0.4% Halwai * 83,869 0.3% Baraee * 80,597 0.3% Bin * 75,195 0.3% Nuniya * 70,540 0.3% Sonar * 64,335 0.2% Kahar * 53,159 0.2% Marwadi * 51,443 0.2% Kayastha * 44,304 0.2% Rajput * 41,972 0.2% Lodh * 32,837 0.1% Badhaee * 28,932 0.1% Bangali * 26,582 0.1% Gaderi/Bhedihar * 26,375 0.1% Mali * 14,995 0.1% Dhunia * 14,846 0.1% Rajdhob * 13,422 0.1% Rajbhar * 9,542 0.0% Punjabi/Sikh * 7,176 0.0% Amat * 3,830 0.0% Munda * 2,350 0.0% Dev * 2,147 0.0% Kamar * 1,787 0.0%
Final Report Appendix 3 SEA Report
23
Nationwide Master Plan Study on Storage-type Hydroelectric Power Development in Nepal
Category Name Madhesi Population Rate Koche * 1,635 0.0% Nurang * 278 0.0% Terai Others * 103,811 0.4%
Religious Minority Musalman * 1,164,255 1,164,255 4.4% 4.4% Others Kulung 28,613 145,132 0.1% 0.5%
Ghale 22,881 0.1% Khawas 18,513 0.1% Undefined Others 15,277 0.1% Nachhiring 7,154 0.0% Yamphu 6,933 0.0% Chamling 6,668 0.0% Foreigner 6,651 0.0% Aathpariya 5,977 0.0% Bantaba 4,604 0.0% Thulung 3,535 0.0% Mewahang Bala 3,100 0.0% Bahing 3,096 0.0% Natuwa 3,062 0.0% Dhankar/ Dharikar 2,681 0.0% Dhandi 1,982 0.0% Samgpang 1,681 0.0% Khaling 1,571 0.0% Loharung 1,153 0.0%
Total 26,494,504 100.0%
Source: Census 2011; Nepal Federation of Indigenous Nationalities Act (2004); GoN on 2065 Magh 21 (2009-2-3)
Table 3.8-2 Definition of Janajati
“Nationality (Janajati) is that community which has its own mother tongue and traditional culture and yet do not fall under the conventional four fold Varna of Hindu or Hindu hierarchical caste structure. A Janajati group has the following characteristics:
• A distinct collective identity • Own language, religion, tradition, culture and civilization; own traditional
egalitarian social structure • Traditional homeland or geographical area • Written or oral history • Having “we-feeling” • Have had no decisive role in politics and government in modern Nepal;
Who declare themselves as Janajati” Source: The National Committee for Development of Nationalities (1996)
Final Report Appendix 3 SEA Report
24
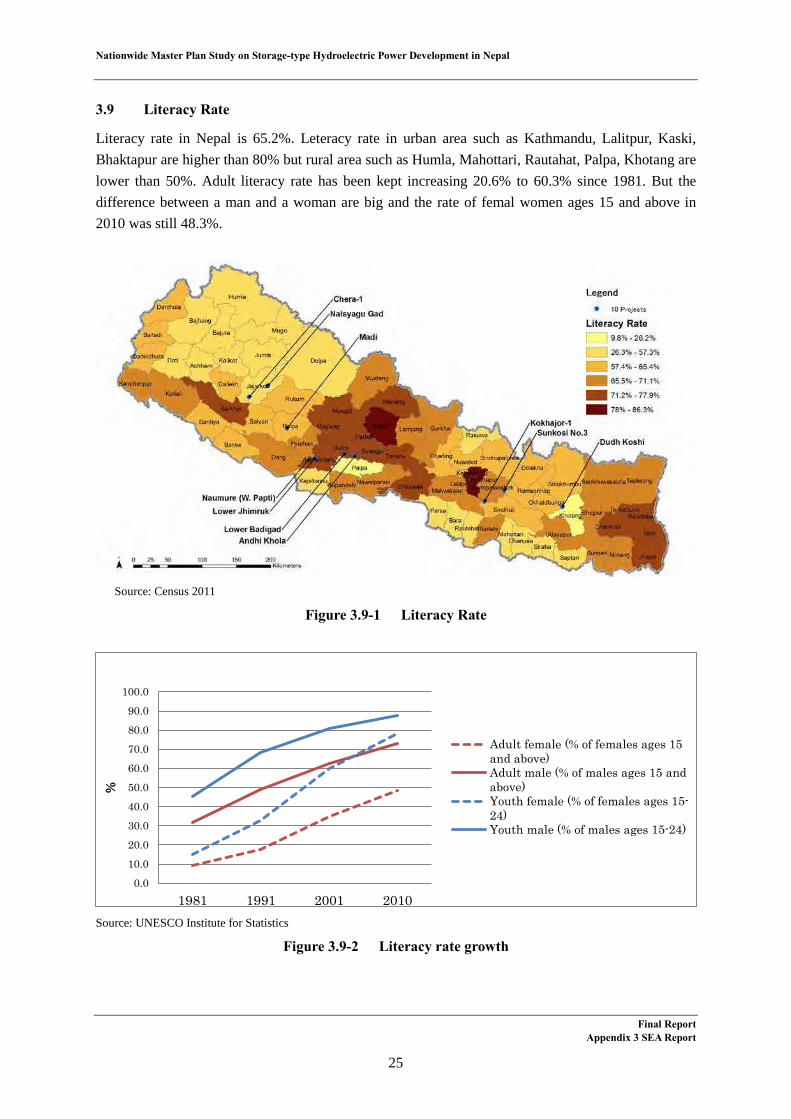
Nationwide Master Plan Study on Storage-type Hydroelectric Power Development in Nepal
Literacy Rate 3.9
Literacy rate in Nepal is 65.2%. Leteracy rate in urban area such as Kathmandu, Lalitpur, Kaski, Bhaktapur are higher than 80% but rural area such as Humla, Mahottari, Rautahat, Palpa, Khotang are lower than 50%. Adult literacy rate has been kept increasing 20.6% to 60.3% since 1981. But the difference between a man and a woman are big and the rate of femal women ages 15 and above in 2010 was still 48.3%.
Source: Census 2011
Figure 3.9-1 Literacy Rate
Source: UNESCO Institute for Statistics
Figure 3.9-2 Literacy rate growth
0.010.020.030.040.050.060.070.080.090.0
100.0
1981 1991 2001 2010
%
Adult female (% of females ages 15and above)Adult male (% of males ages 15 andabove)Youth female (% of females ages 15-24)Youth male (% of males ages 15-24)
Final Report Appendix 3 SEA Report
25
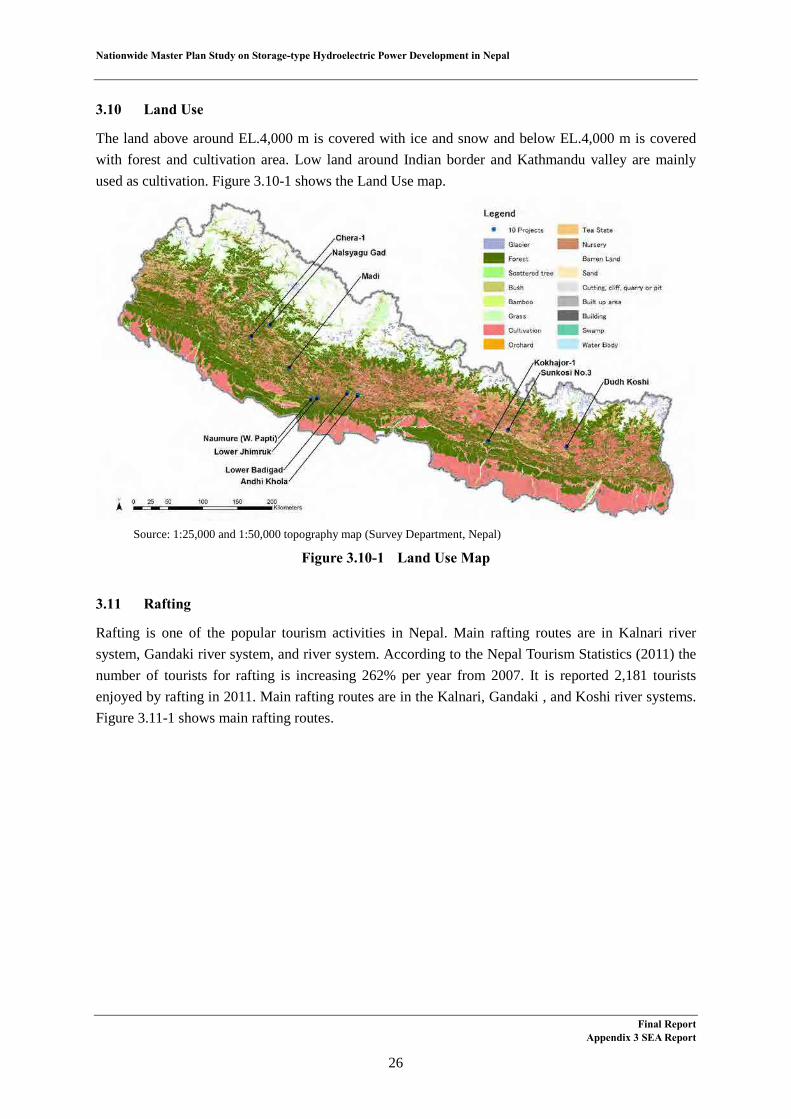
Nationwide Master Plan Study on Storage-type Hydroelectric Power Development in Nepal
Land Use 3.10
The land above around EL.4,000 m is covered with ice and snow and below EL.4,000 m is covered with forest and cultivation area. Low land around Indian border and Kathmandu valley are mainly used as cultivation. Figure 3.10-1 shows the Land Use map.
Source: 1:25,000 and 1:50,000 topography map (Survey Department, Nepal)
Figure 3.10-1 Land Use Map
Rafting 3.11
Rafting is one of the popular tourism activities in Nepal. Main rafting routes are in Kalnari river system, Gandaki river system, and river system. According to the Nepal Tourism Statistics (2011) the number of tourists for rafting is increasing 262% per year from 2007. It is reported 2,181 tourists enjoyed by rafting in 2011. Main rafting routes are in the Kalnari, Gandaki , and Koshi river systems. Figure 3.11-1 shows main rafting routes.
Final Report Appendix 3 SEA Report
26

Nationwide Master Plan Study on Storage-type Hydroelectric Power Development in Nepal
Figure 3.11-1 Major Rafting Routes
Transportation 3.12
National roads of Nepal cut longitudinally West to East. But the transportation of goods has many difficulties, because the roads are easily to be blocked by the landslide in rainy season. Figure 3.12-1 shows main National roads in Nepal.
Source: 1:25,000 and 1:50,000 topography map (Survey Department, Nepal)
Figure 3.12-1 Main national roads in Nepal
Final Report Appendix 3 SEA Report
27
Nationwide Master Plan Study on Storage-type Hydroelectric Power Development in Nepal
Chapter 4 Law and Regulations
Environment protection Act (1997) and National Environment Impact Assessment Guidelines (1993) stipulate EIA procedures in Nepal. But there are no laws and regulations which provide SEA procedures. Land compensation is stipulated by Land Acquisition Act 2034 (1977) and Land Acquisition Guidelines 2049(1993). But they are only mentioning the payment compensation and far different from the resettlement guidelines by JICA; it does not meet the requirement of JICA. Forest compensation is prescribed by Forest Act 2049 (1993 and 1995 amendments) and Forest Regulation 2052 (1995). But the detail discussion of the compensation cannot be started until issuance of the generation license which can be obtained after financing. Drinking water standard is provided by National Drinking Water Quality Standards, 2062 but there is no ambient river water quality standard in Nepal. Other laws and regulations related with Environment are as follows.
Related Laws and Regulations 4.1
Following are the key policy instruments of the Government of Nepal attracted by the project in the process of development licensing, surveys, design, development and operation.
- Aquatic Animals Protection Act 2017 (1960) and Amendment 2055 (1999);
- District Development Committee (Working Agreements) Rules 2050 (1993);
- Electricity Act 2049 (1992) and Electricity Rules 2050 (1993);
- Environment Protection Act 2053 (1997) and Environment Protection Regulations 2054 (1997);
- Explosives Substances Act 2018 (1961);
- Forest Act 2049 (1993 and 1995 amendments) and Forest Regulation 2051 (1995);
- Hydropower Development Policy 2056 (2001);
- Labor Act 2048 (1992);
- Land Administration Act 2024 (1967);
- Land Acquisition Act 2034 (1977) and Land Acquisition Guidelines 2049 (1993);
- Local Self Governance Act 2055 (1999) and Local Self Governance Regulation 2056 (1999);
- National Parks and Wildlife Conservation Act 2029 (1973) and National Parks and Wildlife Conservation Regulation 2030 (1974);
- Public Roads Act 2031 (1974);
- Soil and Watershed Conservation Act 2039 (1982);
- Solid Waste (Management and Resource Mobilization) Act 2044 (1987), repealed 2067 (2010);
- Village Development Committee (Working Procedures) Rules 2050 (1994); and,
- Water Resources Act 2049 (1992) and Water Resources Rules 2050 (1993).
Regarding the compliance labor environment and Land Acquisition in Nepal, these are determined by Labor Act 2048 (1992) and Land Acquisition Act 2034 (1977). The followings are the brief summary
Final Report Appendix 3 SEA Report
28

Nationwide Master Plan Study on Storage-type Hydroelectric Power Development in Nepal
of these acts, respectively.
Labor Act 2048 (1992)
This act is consisting with 11 chapters and stipulates various conditions for labors.
Employment and job security is stipulated in Chapter 2, such as classification of the posts, prohibition on child labor and restriction on minor and women, on job security, retrenchment and reemployment and so on. The labor condition about working hours is stipulated in Chapter 3, and about remuneration is stipulated in mainly in Chapter 4. Regarding the measurement aimed at industrial accident prevention relating to occupational health and safety, it is stipulated in chapter 5. Welfare arrangements are stipulated in Chapter 6. Special arrangement applicable in respect of specific enterprise such as construction enterprise, it is stipulated in Chapter 7. Chapter 8 determined conduct and penalties and Chapter 10 determined settlements of labor disputes. Other Chapters describe preliminary, board officers and other provision and Miscellaneous.
Land Acquisition Act 2034 (1977)
This act is consisting 43 sections and stipulates the compensation measures and its institutional framework.
Section 3 stipulates power of Government to Acquire Lands anywhere for public purpose subject to compensation. Section 4 empowers government to acquire land upon request by institutions for indicated purpose in this section subject to the payment of compensation and all expenses stipulated in this act. Section 5, 6, 7 and 8 stipulate provisions and procedures for initiating initial land acquisition process and estimating compensation rates. Section 9 and 10 stipulate procedures and provisions for notification to land acquisition. Section 11 stipulates right of landowners to file complain within a time-limit of seven days from the date of the publication of the notice with regards to the land right, if they might be affected by the notice., Section 13, 14, and 15 stipulate procedures and provisions of compensation fixation. Section 16 and 17 stipulate criteria for compensation fixation. Section 19 stipulates discloser of the compensation entitlement through public notification. Section 25 stipulates the special cases such as urgent necessity to maintain transport or communication facilities, or to ensure the safety. In these cases, provision of complain against the compensation rates to the Ministry or Home Affairs and the decision of the Ministry of Home Affairs on complain is final according to this section. Section 39 stipulates the penalties for the case necessary process has not correctly taken as described in this act. Other sections describe the role and necessary preparation taking by government side, the rules for a special case such as the land acquisition for diplomatic missions and international agencies and other rules relating to acquire or sell the land.
Policies and Guidelines 4.2
Following policies and guidelines of the government of Nepal will have to be complied in the environmental study including study procedures, impact identification and prediction, design of the
Final Report Appendix 3 SEA Report
29
Nationwide Master Plan Study on Storage-type Hydroelectric Power Development in Nepal
mitigation prescriptions and so on.
- Hydropower Development Policy 2056 (2001);
- National Environmental Impact Assessment Guidelines 2049 (1993);
- Draft EIA Guidelines for Water Resources Sector 2050 (1994);
- EIA Guidelines for Forestry Sector 2050 (1995);
- Forestry Sector Policy 2057 (2000);
- Water Resource strategy, 2002;
- Land use policy, 2068;
- Nepal Biodiversity strategy, 2002;
- Sustainable Development Agenda for Nepal, 2003;
- Climate change policy, 2011;
- Leasehold Forestry policy, 2002;
- National Agriculture policy, 2004;
- Rural Energy Policy, 2006;
- Agrobiodiversity policy, 2007;
- Tourisum policy, 2009;
- Forest Fire Management Strategy, 2010;
- National wetland Policy, 2012; and,
- Irrigation policy, 2013.
International Agreement and Treaty 4.3
The international Agreements and treaties applicable to the Study are as follows.
- Biosphere Reserves
- Convention on International Trade in Endangered Species of Wild Fauna and Flora (CITES) (1973)
- International Tropical Timber Agreement for the Asia and Pacific Region (1956)
- Ramsar Convention (1971)
- World Heritage Site Convention
- ILO Convention concerning Indigenous and Tribal Peoples in Independent Countries (1989, No. 169)
- Convention on Biological Diversity (CBD) (1992)
- United Nations Framework Convention on Climate Change (1992)
- Kyoto Protocol to the United Nations Framework Convention on Climate Change (1998)
- Basel Convention the Montreal Protocol on Substances that Deplete the Ozone Layer
- International Treaty on plant Genetic Resources for Food and Agriculture (2001)
Final Report Appendix 3 SEA Report
30
Nationwide Master Plan Study on Storage-type Hydroelectric Power Development in Nepal
EIA and IEE requirement 4.4
There is no legal requirement for Strategic Environmental Assessment of Hydropower Project in Nepal. But Environmental Impact Assessment (EIA) or Initial Environmental Examination (IEE) will be required when projects move to feasibility study. The Environment Protection Act 1997 (EPA 1997) and Environment Protection Rules 1997 (EPR 2010 as amended) stipulates the projects which need EIA or IEE. All the hydropower projects which are more than 50MW are reqired to prepare EIA. Transmission line projects more than 132kV are required EIA. Followings are the requiring IEE/EIA projects in the EPR 1997.
Requireing IEE projects
1. Supply of electricity though the constructions of transmission lines of from 33 to 132 KV capacity.
2. Operation of rural electrification projects of 1 to 6 MW. 3. Operation of electricity generation projects from 5 to 50 MW capacity. Requireing EIA projects
1. Supply of electricity through installation of transmission lines of more than 132kv.capacity. 2. Operation of more than 6 mva. Rural Electrification Projects. 3. Operation of electricity generation projects with a capacity of more than 50 MW. 4. Generation of more than 1mw. Diesel or the heat electricity. Matters to be mentioned in IEE/EIA are also stipulated in EPR 1997 as follows.
Matters to be mentioned in IEE (EPR 1997, 2010 amended)
1. Name and address of individual or institution preparing the report: 2 Summery of the proposal: (To briefly mention the following matters in regard to the possibly impact of the implementation of the proposal on the environment):
(a) Objectives of the proposal, (b) Impact on land-use. (c) Adverse impact on the environment impact on human life, and population pressure, (d) Damage to be suffered by local goods or objects, (e) Other necessary matters.
3. The following matters must be explicitly mentioned in respect to the proposal: (a) Type of proposal,
(i) Processing, (ii) Manufacturing, (iii) Installation, (iv) Service delivery, (v) Others.
(b) If related to delivery, the nature and type of goods to be delivered. (c) Proposal's
(i) Installed capacity (ii) Number of hours to be operated per day or year.
Final Report Appendix 3 SEA Report
31
Nationwide Master Plan Study on Storage-type Hydroelectric Power Development in Nepal
(d) Materials to be used (quantity and year to be mentioned). (e) Emission resulting from the implementation of the proposal (the time of operation and the consequent volume of emission to be specified)
(i) Solid (ii) Liquid (iii) Air, (iv) Gas, (v) Noise (vi) Dust, (vii) Others
(f) Energy to be used: (i) Type, (ii) Sources (iii) Volume of consumption (per day and year)
(g) Human Resource requirements: (h) Resources required for the implementation of the proposal:
(i) Total (Gross) capital (ii) Working capital (iii) Land area, (iv) Building and their types, (v) Machinery and tools (vi) Others.
(i) Detailed particulars of the area where the project is to be implemented: (i) Maps, (ii) Population and condition relating to settlements in the area as well as in the nearby areas, (iii) Particulars of any sensitive things or objects, if any, located close to the area where the proposal is to be implemented (iv) Current situation (v) Sources of water (vi) Arrangement made for disposing or processing the waste (vii) Paths for movement in the area where the proposal is to be implemented
(j) Manufacturing processes (k) Details of the technology (l) Other necessary matters.
4. Impact of the implementation of the proposal on the environment: (a) Impact on the social, economic cultural spheres:
(i) Impact on human health, (ii) Degradation of cultivable land, (iii) Destruction of forests, (iv) Changes in social, cultural and religious norms and value, (v) Others.
(b) Biological Impact: (i) Population, (ii) Flora and fauna. (iii) 'Natural habitat and communities
(c) Physical Impact: (i) Land, (ii) Atmosphere,
Final Report Appendix 3 SEA Report
32

Nationwide Master Plan Study on Storage-type Hydroelectric Power Development in Nepal
(iii) Water, (iv) Noise, (v) Man-made objects, (vi) Others
5. Alternatives for the implementation of the proposal: (a) Design (b) Project site (c) Processes, time-schedule, (d) Raw materials to be used, (e) Others
6. Alternatives to reduce or control the impact of the implementation of the proposal on the environment. 7. Matters to be monitored while implementing the proposal. 8. Other necessary matters.
Matters to be mentioned in EIA (EPR 1997, 2010 amended) 1. Name and Address of the individual or intuition preparing the report: 2. Summary of the proposal: (to mention the following matters in regard to the possible impact of the implementation of the proposal on the environment.):
(a) Objectives of the proposal , (b) Impact on land-use, (c) Adverse impact on the environment, impact on human life, and population pressure, (d) Damage to be suffered by local goods or objects (e) Other necessary matters.
3. Summary of the Report: Brief particulars of the matters mentioned in the report relating to the environmental impact assessment. 4. Particulars of the proposal:
(a) To specify the technical, geographical, environmental, economic, social, cultural and physical aspects of the proposal. (b) To specify the objectives, working policies and work-schedule of the activities to be undertaken during each phase of the implementation of the proposal.
5. Basic information relating to the proposal: To mention basic information about the geo-physical, cultural, biological, and social and economic conditions of the area to be assessed, as well any possible change that may occur there before the implementation of the proposal. In case there are any data which may not be available or any Subject which may not be covered by the study, they too should be mentioned. 6. Identification of environmental Impact: To mention the possible positive and negative impact on the following spheres of the environment while implementing the proposal, and estimate and specify the volume of possible impart according to time and work schedules as far as possible.
(a) Geographical area likely to have positive or negative impact of the implementation of the proposal and thereof time-schedule. (b) Impact of waste and pollution to be emitted through the implementation of the proposal. (c) Direct or indirect and cumulative impact of the implementation of the proposal on the environment.
7. Analysis of the alternatives for the proposal: The following matters are to be analyzed: (a) Matters concerning the design of the proposal, project site, technology, operation procedure, time –schedule and raw materials to be used. (b) Comparison is to be made on the basis of the fixed and working capital, local suitability , institutional training and supervision needed for the implementation of the proposal, and the
Final Report Appendix 3 SEA Report
33
Nationwide Master Plan Study on Storage-type Hydroelectric Power Development in Nepal
environmental cost and returns and economic significance of each alternative measures are to be analyzed as far as possible. (c) Short, medium and long – term adverse impact of the implementation of the proposal. (d) Sources of energy to be used for the implementation of the proposal and measures to be adopted for saving such energy. (e) Analysis of the consequences of the non- implementation of the proposal.
8. Measure to reduce environmental impact: (a) To mention practical preventive measures to be adopted for all activities which could have a negative impact on the environment. (b) In case the environmental impact cannot be fully avoided through preventive measures, arrangements made for payments of compensation shall be mentioned. The effectiveness of the preventive measures shall be analyzed from the view point of their cost on the basis of the comparison with other possible alternatives. (c) The effectiveness of the preventive measures shall be analyzed from the viewpoint of their cost on the basis of a comparison with other possible alternatives.
9. To mentioned matters concerning environmental management plans. 10. Review of policy and Legal Provisions: To review the related policies, laws, and Rules on the basis of the nature and scale of the proposal. If any policy or legal provision, needs to e reformed, to specify the same. 11. Monitoring of the Proposal: To mention the procedure of monitoring the impact of the implementation of the proposal on the environment, as well as the monitoring agency, time-schedule, monitoring and evaluation Indicators etc. 12. To mention the format and relevancy of environmental examinations. 13. Reference materials: To make at list of publications quoted as references while preparing the report in the following manner:
(a) Author, (b) Date of Publication, (c) Title of the material quoted, (d) Year volume, number, etc. (if any) (e) Page number
14. To include the following particulars in the Annexes: (a) Maps relating to the land structure, geographical location, land-use and land-capacity and other maps related to the study. (b) Aerial photographs as far as possible of the proposal implementation site and the surrounding areas, (c) Questionnaires or lists of Subject matters used for field research. (d) Matters connected with the evaluation of the environmental impact such as charts and photographs. (e) Hydrological and climatic data (by arranging them serially and chronologically) (f) Data relating to flora and fauna of the proposal implementation site, (g) Geological and risk evaluation data (if available), (h) Information relating to the quality of air and water and the noise level before and after the operation of the project it available. (i) Matrix or serial graphs relevant to the environmental impact assessment. (j) Maps, slides records, video films and visual support equipments. (k) Cropping techniques and data relating to livestock farming, soil features, and quantity of chemical fertilizers used. (l) List of written reference materials used at the time of preparing the study report. (m) List of invitees and participants and records of discussions, meetings and gathering among the
Final Report Appendix 3 SEA Report
34
Nationwide Master Plan Study on Storage-type Hydroelectric Power Development in Nepal
concerned agencies, and brief particular of monitoring operations. (n) List of names of individuals and institutions comprising of the study team involved in the preparation of the environmental impact assessment report. (o) Name, address and telephone number of the individuals and institutions contacted in the course of the study.
Chapter 5 Zero Option
If there are no hydroelectric power projects in Nepal, Solar Power, Wind Power, Thermal Power would be the alternative generation source. Followings show the possibility of the alternative source in Nepal. All of them can be the generation source to some extent, but cannot be stable and low cost energy supply to fulfill the energy demand.
Solar Power Generation 5.1
Since the generation cost by solar power is considerably high at the present time, construction of a number of large-scale solar power generation facilities that are connected to the integrated power system is considered to be unfeasible for the time being. On the other hand, it is suitable for electrification of each house/facility and the power source for street light. However, solar power generation facilities are not able to produce electricity during the night and their output fluctuate depending on the intensity of sunlight, electric storage devices like rechargeable batteries should be combined with them.
Wind Power Generation 5.2
Since there are many examples in many countries and its generation cost is relatively modest, wind power generation is one of promising power generation method as one of power sources that are to be connected to the integrated power system. However, since its output largely fluctuates depending on wind conditions and power generation responding the demand is difficult, the rate of its installed capacity in the power system has an upper limit. In addition, when it is used alone or in a small-scale rural power grid, electric storage devices like rechargeable batteries are required for stable power supply.
Thermal Power Generation (Diesel or Gas Turbine) 5.3
Thermal power generation is not affected by the nature and excellent in responding to the demand fluctuation, but it will be used only for the power source in emergency in Nepal. And generation cost would be high and CO2 emission would be highest. It does not have any plan to construct a new thermal electric power plant at present.
Final Report Appendix 3 SEA Report
35
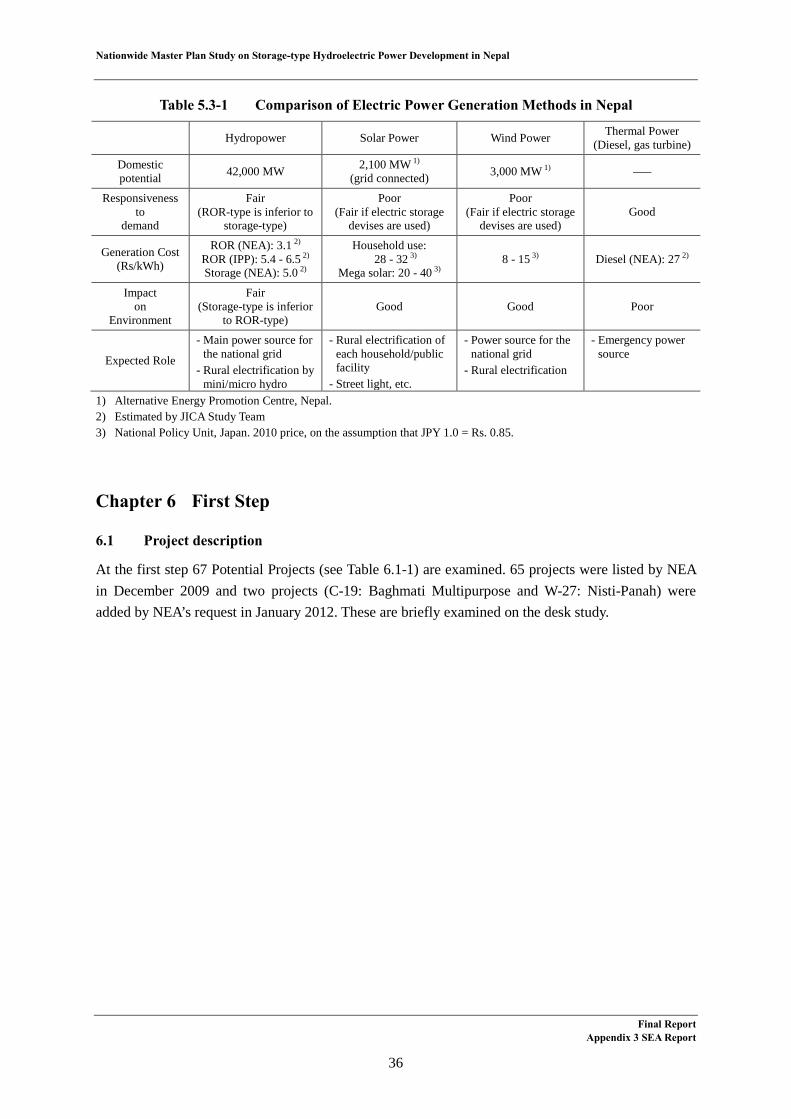
Nationwide Master Plan Study on Storage-type Hydroelectric Power Development in Nepal
Table 5.3-1 Comparison of Electric Power Generation Methods in Nepal
Hydropower Solar Power Wind Power Thermal Power (Diesel, gas turbine)
Domestic potential 42,000 MW 2,100 MW 1)
(grid connected) 3,000 MW 1) –––
Responsiveness to
demand
Fair (ROR-type is inferior to
storage-type)
Poor (Fair if electric storage
devises are used)
Poor (Fair if electric storage
devises are used) Good
Generation Cost (Rs/kWh)
ROR (NEA): 3.1 2) ROR (IPP): 5.4 - 6.5 2) Storage (NEA): 5.0 2)
Household use: 28 - 32 3)
Mega solar: 20 - 40 3) 8 - 15 3) Diesel (NEA): 27 2)
Impact on
Environment
Fair (Storage-type is inferior
to ROR-type) Good Good Poor
Expected Role
- Main power source for the national grid
- Rural electrification by mini/micro hydro
- Rural electrification of each household/public facility
- Street light, etc.
- Power source for the national grid
- Rural electrification
- Emergency power source
1) Alternative Energy Promotion Centre, Nepal. 2) Estimated by JICA Study Team 3) National Policy Unit, Japan. 2010 price, on the assumption that JPY 1.0 = Rs. 0.85.
Chapter 6 First Step
Project description 6.1
At the first step 67 Potential Projects (see Table 6.1-1) are examined. 65 projects were listed by NEA in December 2009 and two projects (C-19: Baghmati Multipurpose and W-27: Nisti-Panah) were added by NEA’s request in January 2012. These are briefly examined on the desk study.
Final Report Appendix 3 SEA Report
36

Nationwide Master Plan Study on Storage-type Hydroelectric Power Development in Nepal
Table 6.1-1 Potential Projects (67 projects) in the First Step
*: Added in January 2012.
Screening items and methods 6.2
First step aims to exclude projects deemed inappropriate as candidates of evaluation in the Study. Following three conditions are adopted for screening. The information used for the screening is NEA consultation, previous project report, and previous master plan study report given by NEA. Site survey and additional document survey was not conducted for the First Step.
(1) On-going Projects
The evaluation of the projects in Detail Design / Feasibility Study was deemed not useful. Then these projects were excluded from the project to be evaluated in the Study. However, these projects were taken into consideration in the Master Plan that was prepared in the final stage of this study.
(2) Overlapped Project
The locations of some projects are about the same with other project. These duplicated projects were excluded.
(3) Not appropriate as Storage-type Hydroelectric Power Projects
From the viewpoints of installed capacity, dam height, project cost, regulating capacity of
No. Project NameCapacity
(MW)No. Project Name
Capacity(MW)
No. Project NameCapacity
(MW)E-01 Dudh Koshi 300.0 C-01 Kaligandaki-Modi 816.4 W-01 Barbung Khola 122.9E-02 Dudh Koshi-2 456.6 C-02 Lower Badigad 380.3 W-02 Chera-1 148.7E-03 Dudh Koshi-3 1,048.6 C-03 Lower Daraudi 120.2 W-03 Chera-2 104.3E-04 Dudh Koshi-4 1,603.0 C-04 Seti-Trisuli 128.0 W-04 Humla-Karnali 467.1E-05 Khimti 128.1 C-05 Upper Daraudi 111.4 W-05 Lower Jhimruk 142.5E-06 Kokhajor-1 111.5 C-06 Kaligandaki-2 660.0 W-06 Madi 199.8E-07 Likhu-1 91.2 C-07 Budhi Gandaki 600.0 W-07 Mugu Karnali 3,843.8E-08 Mulghat 2,647.7 C-08 Andhi Khola 180.0 W-08 Sani Bhari-1 763.5E-09 Piluwa-2 107.3 C-09 Langrang Khola 218.0 W-09 Sani Bhari-2 646.9E-10 Rosi-2 106.5 C-10 Uttar Ganga 300.0 W-10 Sharada-2 96.8E-11 Sankhuwa-1 176.0 C-11 Madi-Ishaneshor 86.0 W-11 Thuli Gad-2 119.7E-12 Tama Koshi-3 330.0 C-12 Kali Gandaki No.1 1,500.0 W-12 Tila-1 617.2E-13 Tamor No.1 696.0 C-13 Marsyangdi 510.0 W-13 Tila-3 481.9E-14 Tamor (Terahathum) 380.0 C-14 Seti (Gandaki) 230.0 W-14 Thuli Gad 120.0E-15 Sun Koshi No.1 1,357.0 C-15 Dev Ghat 150.0 W-15 LR-1 98.0E-16 Sun Koshi No.2 1,110.0 C-16 Bhomichok 200.0 W-16 BR-3B 801.0E-17 Sun Koshi No.3 536.0 C-17 Trishulganga 1,500.0 W-17 BR-4 667.0E-18 Sun Koshi No.3 432.0 C-18 Ridi Khola 97.0 W-18 Surkhet 600.0E-19 Sun Koshi No.3 190.0 C-19 Bagmati MP * 140.0 W-19 Lakarpata 1,200.0E-20 Indrawati 91.2 W-20 Bhanakot 810.0E-21 Kankai 90.0 W-21 Thapna 500.0
W-22 SR-6 642.0W-23 Nalsyagu Gad 400.0W-24 Sarada Babai 75.0W-25 Naumure (W. Rapti) 245.0W-26 Lohare Khola 67.0W-27 Nisti-Panah * 90.4
Eastern River Basin Central River Basin Western River Basin
Final Report Appendix 3 SEA Report
37
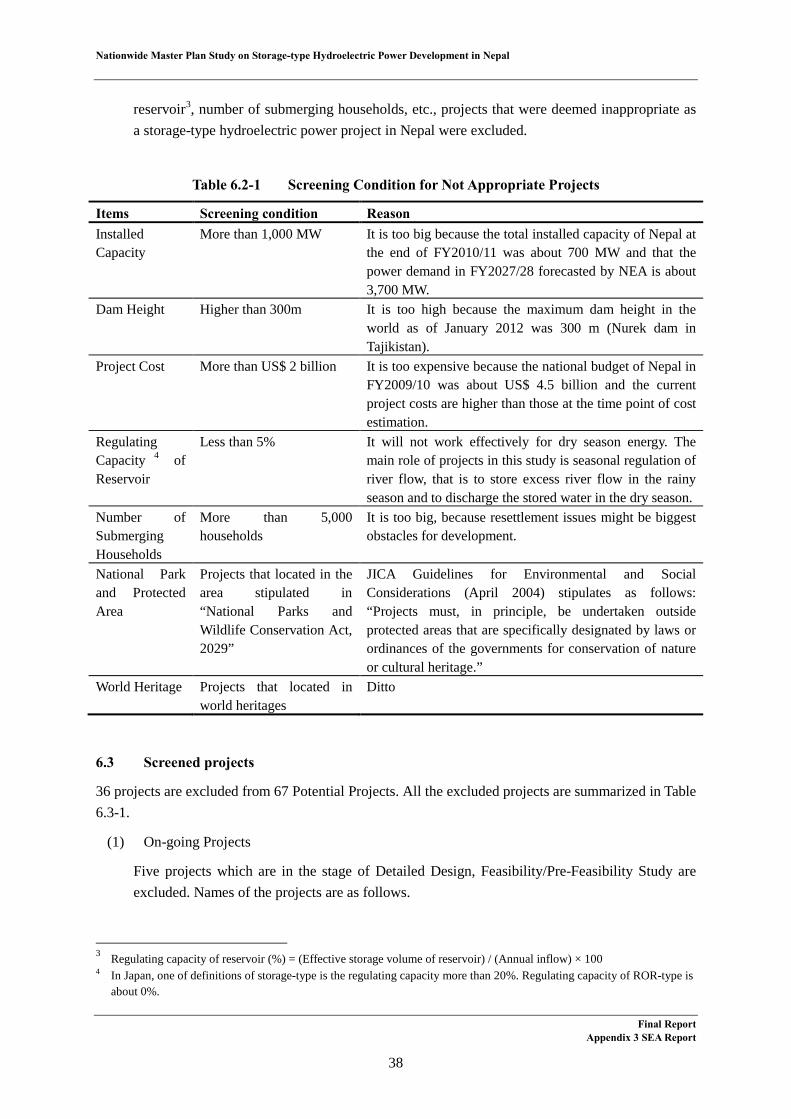
Nationwide Master Plan Study on Storage-type Hydroelectric Power Development in Nepal
reservoir3, number of submerging households, etc., projects that were deemed inappropriate as a storage-type hydroelectric power project in Nepal were excluded.
Table 6.2-1 Screening Condition for Not Appropriate Projects
Items Screening condition Reason Installed Capacity
More than 1,000 MW It is too big because the total installed capacity of Nepal at the end of FY2010/11 was about 700 MW and that the power demand in FY2027/28 forecasted by NEA is about 3,700 MW.
Dam Height Higher than 300m It is too high because the maximum dam height in the world as of January 2012 was 300 m (Nurek dam in Tajikistan).
Project Cost More than US$ 2 billion It is too expensive because the national budget of Nepal in FY2009/10 was about US$ 4.5 billion and the current project costs are higher than those at the time point of cost estimation.
Regulating Capacity 4 of Reservoir
Less than 5% It will not work effectively for dry season energy. The main role of projects in this study is seasonal regulation of river flow, that is to store excess river flow in the rainy season and to discharge the stored water in the dry season.
Number of Submerging Households
More than 5,000 households
It is too big, because resettlement issues might be biggest obstacles for development.
National Park and Protected Area
Projects that located in the area stipulated in “National Parks and Wildlife Conservation Act, 2029”
JICA Guidelines for Environmental and Social Considerations (April 2004) stipulates as follows: “Projects must, in principle, be undertaken outside protected areas that are specifically designated by laws or ordinances of the governments for conservation of nature or cultural heritage.”
World Heritage Projects that located in world heritages
Ditto
Screened projects 6.3
36 projects are excluded from 67 Potential Projects. All the excluded projects are summarized in Table 6.3-1.
(1) On-going Projects
Five projects which are in the stage of Detailed Design, Feasibility/Pre-Feasibility Study are excluded. Names of the projects are as follows.
3 Regulating capacity of reservoir (%) = (Effective storage volume of reservoir) / (Annual inflow) × 100 4 In Japan, one of definitions of storage-type is the regulating capacity more than 20%. Regulating capacity of ROR-type is
about 0%.
Final Report Appendix 3 SEA Report
38
Nationwide Master Plan Study on Storage-type Hydroelectric Power Development in Nepal
Project in Detailed Design Stage
C-07: Budhi Gandaki (600 MW)
Projects on which FS or Pre-FS is in progress
E-14: Tamor (Terahathum) (530 MW) C-06: Kaligandaki-2 (660 MW) C-19: Bagmati Multipurpose (140 MW) W-27: Nisti-Panah (90.4 MW)
(2) Overlapped Project
Five projects are excluded because of duplication of the location. Followings are the name of the projects.
E-13: Tamor No. 1 (696 MW) Tamor No. 1 was excluded and E-14: Tamor (Terahathum) (530 MW) was adopted because the study of Tamor (Terahathum) project was conducted later than Tamor No. 1.
E-18: Sun Koshi No. 3 (432 MW) and E-19: Sun Koshi No. 3 (190 MW) These two projects were excluded and E-17: Sun Koshi No. 3 (536 MW) was adopted because this alternative is the optimum development plan in “Master Plan Study on the Koshi River Water Resources Development” (March 1985, JICA).
C-14: Seti (Gandaki) (230 MW) This project was excluded because its location overlaps with Upper Seti projects that is now in the detailed design stage.
W-14: Thuli Gad (120 MW) Thuli Gad was excluded and W-11: Thuli Gad -2 (119.7 MW) was adopted because the study of Thuli Gad -2 projects was conducted later than Thuli Gad.
W-15: LR-1 (98 MW) LR-1 was excluded and W-26: Lohare Khola (67 MW) was adopted because the study of Lohare Khola project was conducted later than LR-1.
(3) Not appropriate Projects
36 projects are excluded from the viewpoints of installed capacity, dam height, project cost, regulating capacity of reservoir5, number of submerging households, etc.
5 Regulating capacity of reservoir (%) = (Effective storage volume of reservoir) / (Annual inflow) × 100
Final Report Appendix 3 SEA Report
39

Nationwide Master Plan Study on Storage-type Hydroelectric Power Development in Nepal
Installed Capacity
Projects whose installed capacity was more than 1,000 MW were excluded taking into consideration that the total installed capacity of Nepal at the end of FY2010/11 was about 700 MW and that the power demand in FY2027/28 forecasted by NEA is about 3,700 MW. The projects excluded are as follows (see the column C of Table 6.3-1).
E-03: Dudh Koshi-3 (1,048.6 MW) E-04: Dudh Koshi-4 (1,603 MW) E-08: Mulghat (2,647.7 MW) E-15: Sun Koshi No. 1 (1,357 MW) E-16: Sun Koshi No. 2 (1,110 MW) C-12: Kali Gandaki No. 1 (1,500 MW) C-17: Trishulganga (1,500 MW) W-07: Mugu Karnali (3,843.8 MW) W-19: Lakarpata (1,200 MW)
Dam Height
Projects whose dam height was higher than 300 m were excluded taking into consideration that the maximum dam height in the world as of January 2012 was 300m (Nurek dam in Tajikistan). The projects excluded are as follows (see the column D of Table 6.3-1).
E-03: Dudh Koshi-3 (357m) E-04: Dudh Koshi-4 (425m) W-07: Mugu Karnali (694m) W-08: Sani Bhari-1 (417m) W-09: Sani Bhari-2 (330m) W-13: Tila-3 (338m)
Project Cost
Projects whose project cost at the estimated point of time was more than US$ 2 billion were excluded taking into consideration that the national budget of Nepal in FY2009/10 was about US$ 4.5 billion and the current project costs are higher than those at the time point of cost estimation. The projects excluded are as follows (see the column E of Table 6.3-1).
E-03: Dudh Koshi-3 (US$ 2.26billion) E-04: Dudh Koshi-4 (US$ 2.87 billion) E-08: Mulghat (US$ 2.37 billion) W-07: Mugu Karnali (US$ 4.78 billion)
Final Report Appendix 3 SEA Report
40
Nationwide Master Plan Study on Storage-type Hydroelectric Power Development in Nepal
Regulating Capacity of Reservoir
Projects whose regulating capacity of reservoir was less than 5%6 were excluded taking into consideration that the main role of projects in this Study is seasonal regulation of river flow that is to store excess river flow in the rainy season and to discharge the stored water in the dry season. The projects excluded are as follows (see the column F of Table 6.3-1).
E-05: Khimti (2.91%) E-07: Likhu-1 (2.87%) E-15: Sun Koshi No. 1 (0.19%) C-04: Seti-Trisuli (2.56%) C-15: Dev Ghat (0.32%) C-16: Bhomichok (0.07%) W-04: Humla-Karnali (2.73%) W-13: Tila-3 (2.13%)
Number of Submerging Households
Since large number of relocation of households has a serious impact on the social environment of the project area, projects that required more than 5,000 households of submergence were excluded. The projects excluded are as follows (see the column G of Table 6.3-1).
E-21: Kankai (11,700) C-06: Kaligandaki-2 (7,000) C-13: Marsyangdi (5,170) W-16: BR-3B: (9,270) W-18: Surkhet (6,600) W-19: Lakarpata (20,400)
National Park and Protected Area7
Projects that located in the area stipulated in “National Parks and Wildlife Conservation Act, 2029” were excluded. The projects excluded are as follows (see the column H of Table 6.3-1).
E-11: Sankhuwa-1 (Makalu-Barun Conservation Area) C-09: Langtang Khola (Langtang National Park) C-10: Uttar Ganga (Dhorpatan Hunting Reserve)
6 In Japan, one of definitions of storage-type is the regulating capacity more than 20%. Regulating capacity of ROR-type is about 0%.
7 JICA Guidelines for Environmental and Social Considerations (April 2004) stipulates as follows: “Projects must, in principle, be undertaken outside protected areas that are specifically designated by laws or ordinances of the governments for conservation of nature or cultural heritage.”
Final Report Appendix 3 SEA Report
41

Nationwide Master Plan Study on Storage-type Hydroelectric Power Development in Nepal
World Heritage
Projects that located in world heritages were to be excluded. However, there was no project in Table 6.3-1 that locates in a world heritage.
Final Report Appendix 3 SEA Report
42

N
ationwide M
aster Plan Study on Storage-type Hydroelectric Pow
er Developm
ent in Nepal
Final Report
Appendix 3 SE
A Report
43
Table 6.3-1 Screening of the Potential Projects
A B C D E F G H
DD, FS orPre FSStage
Overlap withOther Project
InstalledCapacity
> 1,000MW
Dam Height> 300m
Project Cost> US$2,000M
RegulatingCapability
Factor< 5%
SubmergingHouses > 5,000
National Parks andWildlife
Conservation Act
E-01 Dudh Koshi
E-02 Dudh Koshi-2 ** 3.50E-03 Dudh Koshi-3 1,048.6 357.0 2,264.3E-04 Dudh Koshi-4 1,603.0 425.0 2,872.6E-05 Khimti 2.91E-06 Kokhajor-1
E-07 Likhu-1 2.87E-08 Mulghat 2,647.7 2,368.1E-09 Piluwa-2
E-10 Rosi-2
E-11 Sankhuwa-1 Conservation AreaE-12 Tama Koshi-3
E-13 Tamor No.1 with E-14E-14 Tamor (Terahathum) Pre FSE-15 Sun Koshi No.1 1,357.0 0.19E-16 Sun Koshi No.2 1,110.0E-17 Sun Koshi No.3 (536 MW)
E-18 Sun Koshi No.3 (432 MW) with E-17E-19 Sun Koshi No.3 (190 MW) with E-17E-20 Indrawati
E-21 Kankai 11,700C-01 Kaligandaki-Modi
C-02 Lower Badigad
C-03 Lower Daraudi
C-04 Seti-Trisuli 2.56C-05 Upper Daraudi
C-06 Kaligandaki-2 FS 7,000C-07 Budhi Gandaki DDC-08 Andhi Khola
C-09 Langrang Khola National ParkC-10 Uttar Ganga Hunting ReserveC-11 Madi-Ishaneshor .C-12 Kali Gandaki No.1 1,500.0C-13 Marsyangdi 5,170C-14 Seti (Gandaki) with Upper SetiC-15 Dev Ghat 0.32C-16 Bhomichok 0.07C-17 Trishulganga 1,500.0C-18 Ridi Khola
C-19 Bagmati MP * FSW-01 Barbung Khola ** 2.75W-02 Chera-1
W-03 Chera-2
W-04 Humla-Karnali 2.73W-05 Lower Jhimruk
W-06 Madi
W-07 Mugu Karnali 3,843.8 694.0 4,868.1W-08 Sani Bhari-1 417.0W-09 Sani Bhari-2 330.0W-10 Sharada-2
W-11 Thuli Gad-2
W-12 Tila-1
W-13 Tila-3 338.0 2.13W-14 Thuli Gad with W-11W-15 LR-1 with W-26W-16 BR-3B 9,270W-17 BR-4
W-18 Surkhet 6,600W-19 Lakarpata 1,200.0 20,400W-20 Bhanakot
W-21 Thapna
W-22 SR-6
W-23 Nalsyagu Gad
W-24 Sarada Babai
W-25 Naumure (W. Rapti)
W-26 Lohare Khola
W-27 Nisti-Panah * Pre FS
* : Added in January 2012** : These projects are not excluded from the objects of evaluation because of the request by NEA.
Excluded from Object of Evaluation
No. Project NameSelected
CandidateProject
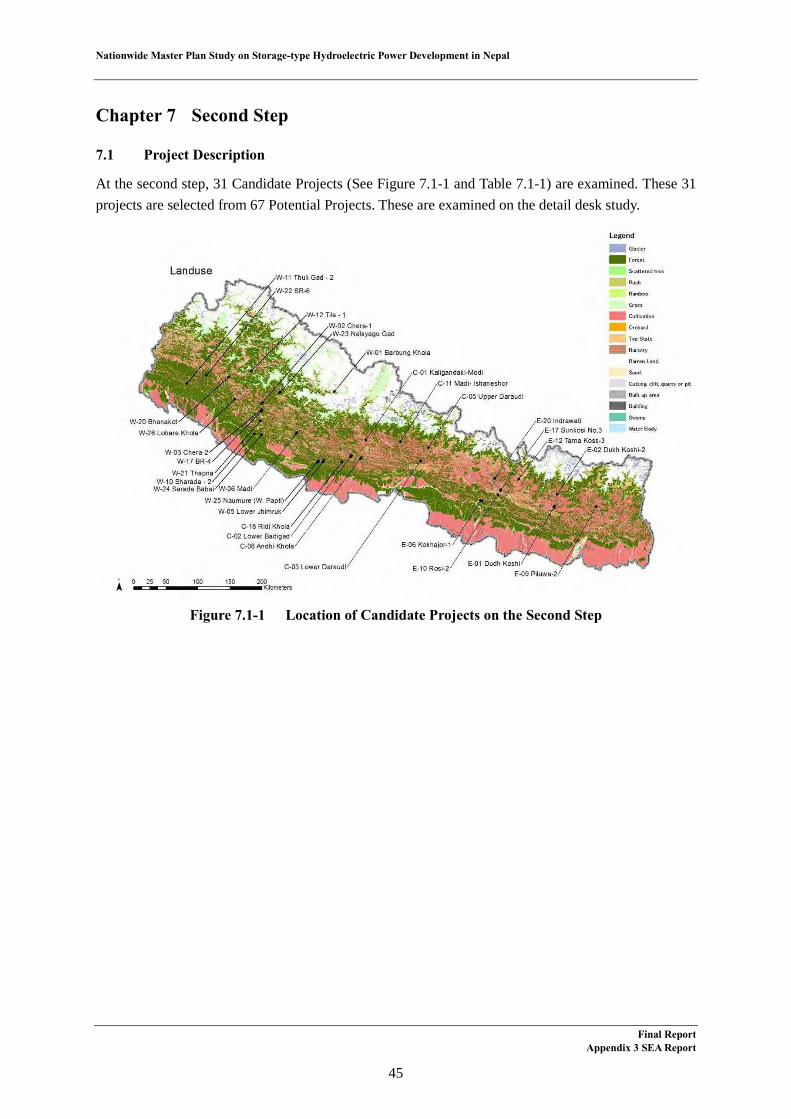
Nationwide Master Plan Study on Storage-type Hydroelectric Power Development in Nepal
Chapter 7 Second Step
Project Description 7.1
At the second step, 31 Candidate Projects (See Figure 7.1-1 and Table 7.1-1) are examined. These 31 projects are selected from 67 Potential Projects. These are examined on the detail desk study.
Figure 7.1-1 Location of Candidate Projects on the Second Step
Final Report Appendix 3 SEA Report
45
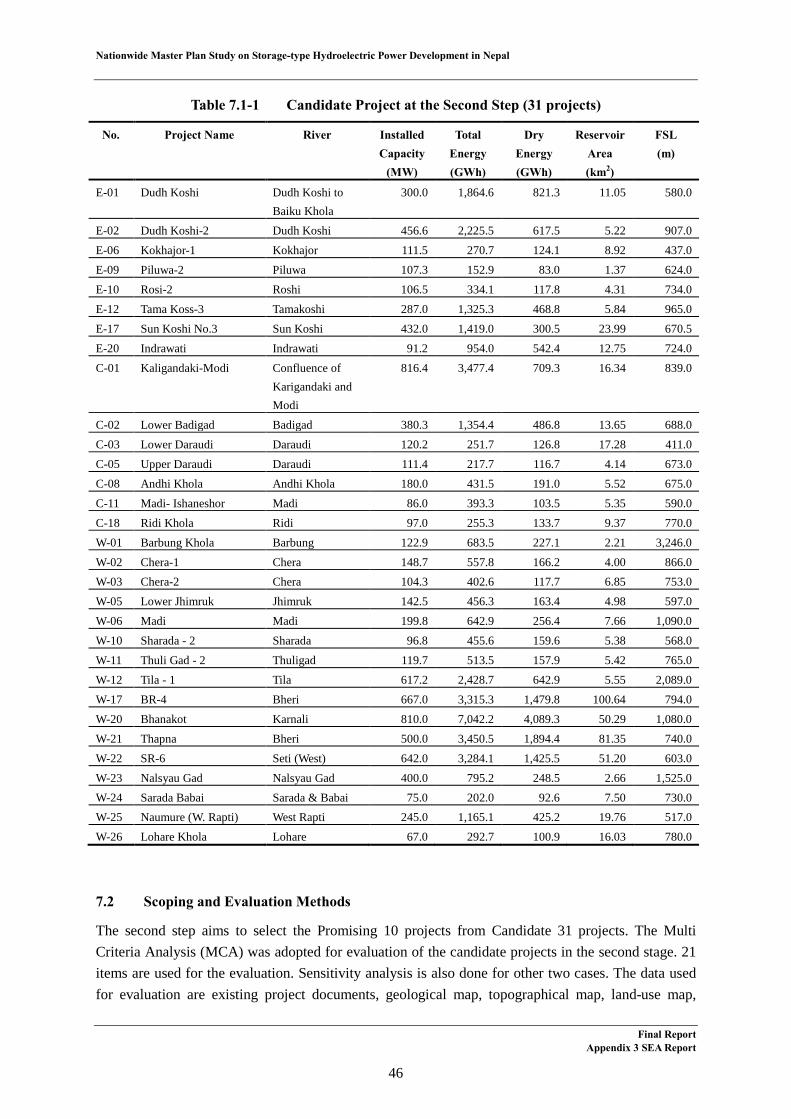
Nationwide Master Plan Study on Storage-type Hydroelectric Power Development in Nepal
Table 7.1-1 Candidate Project at the Second Step (31 projects)
No. Project Name River Installed Capacity
(MW)
Total Energy (GWh)
Dry Energy (GWh)
Reservoir Area (km2)
FSL (m)
E-01 Dudh Koshi Dudh Koshi to Baiku Khola
300.0 1,864.6 821.3 11.05 580.0
E-02 Dudh Koshi-2 Dudh Koshi 456.6 2,225.5 617.5 5.22 907.0 E-06 Kokhajor-1 Kokhajor 111.5 270.7 124.1 8.92 437.0 E-09 Piluwa-2 Piluwa 107.3 152.9 83.0 1.37 624.0 E-10 Rosi-2 Roshi 106.5 334.1 117.8 4.31 734.0 E-12 Tama Koss-3 Tamakoshi 287.0 1,325.3 468.8 5.84 965.0 E-17 Sun Koshi No.3 Sun Koshi 432.0 1,419.0 300.5 23.99 670.5 E-20 Indrawati Indrawati 91.2 954.0 542.4 12.75 724.0 C-01 Kaligandaki-Modi Confluence of
Karigandaki and Modi
816.4 3,477.4 709.3 16.34 839.0
C-02 Lower Badigad Badigad 380.3 1,354.4 486.8 13.65 688.0 C-03 Lower Daraudi Daraudi 120.2 251.7 126.8 17.28 411.0 C-05 Upper Daraudi Daraudi 111.4 217.7 116.7 4.14 673.0 C-08 Andhi Khola Andhi Khola 180.0 431.5 191.0 5.52 675.0 C-11 Madi- Ishaneshor Madi 86.0 393.3 103.5 5.35 590.0 C-18 Ridi Khola Ridi 97.0 255.3 133.7 9.37 770.0 W-01 Barbung Khola Barbung 122.9 683.5 227.1 2.21 3,246.0 W-02 Chera-1 Chera 148.7 557.8 166.2 4.00 866.0 W-03 Chera-2 Chera 104.3 402.6 117.7 6.85 753.0 W-05 Lower Jhimruk Jhimruk 142.5 456.3 163.4 4.98 597.0 W-06 Madi Madi 199.8 642.9 256.4 7.66 1,090.0 W-10 Sharada - 2 Sharada 96.8 455.6 159.6 5.38 568.0 W-11 Thuli Gad - 2 Thuligad 119.7 513.5 157.9 5.42 765.0 W-12 Tila - 1 Tila 617.2 2,428.7 642.9 5.55 2,089.0 W-17 BR-4 Bheri 667.0 3,315.3 1,479.8 100.64 794.0 W-20 Bhanakot Karnali 810.0 7,042.2 4,089.3 50.29 1,080.0 W-21 Thapna Bheri 500.0 3,450.5 1,894.4 81.35 740.0 W-22 SR-6 Seti (West) 642.0 3,284.1 1,425.5 51.20 603.0 W-23 Nalsyau Gad Nalsyau Gad 400.0 795.2 248.5 2.66 1,525.0 W-24 Sarada Babai Sarada & Babai 75.0 202.0 92.6 7.50 730.0 W-25 Naumure (W. Rapti) West Rapti 245.0 1,165.1 425.2 19.76 517.0 W-26 Lohare Khola Lohare 67.0 292.7 100.9 16.03 780.0
Scoping and Evaluation Methods 7.2
The second step aims to select the Promising 10 projects from Candidate 31 projects. The Multi Criteria Analysis (MCA) was adopted for evaluation of the candidate projects in the second stage. 21 items are used for the evaluation. Sensitivity analysis is also done for other two cases. The data used for evaluation are existing project documents, geological map, topographical map, land-use map,
Final Report Appendix 3 SEA Report
46
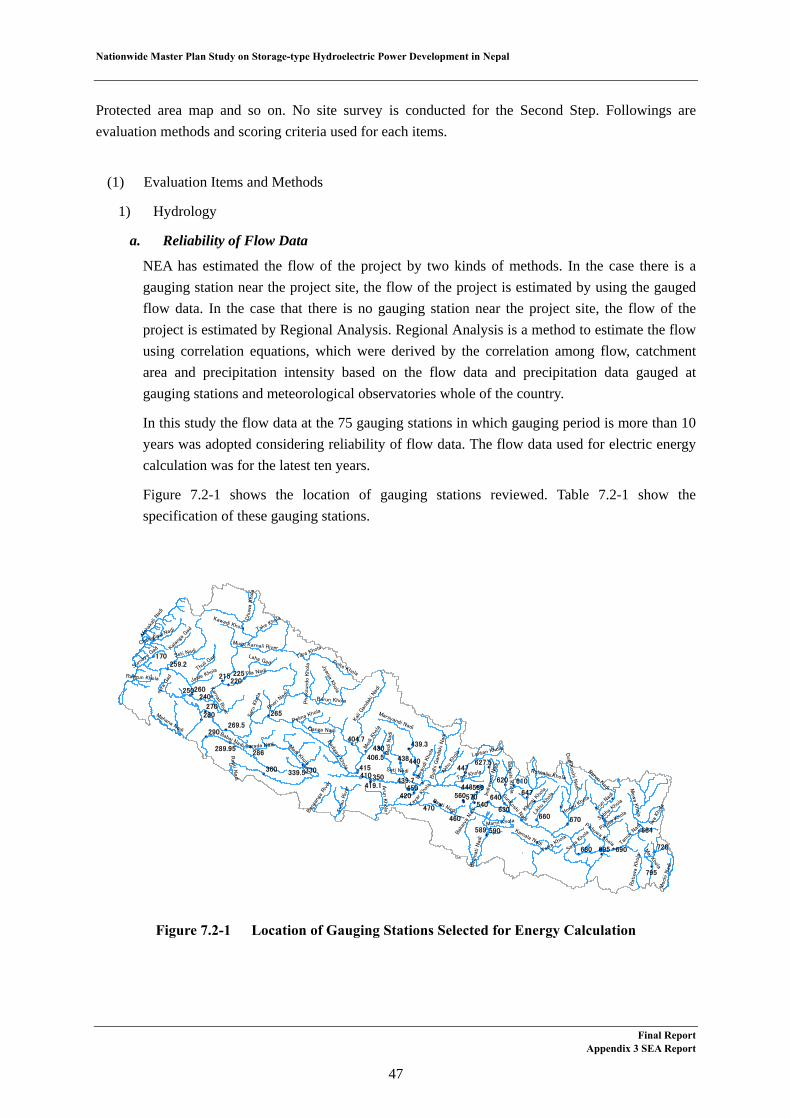
Nationwide Master Plan Study on Storage-type Hydroelectric Power Development in Nepal
Final Report Appendix 3 SEA Report
47
Protected area map and so on. No site survey is conducted for the Second Step. Followings are evaluation methods and scoring criteria used for each items.
(1) Evaluation Items and Methods
1) Hydrology
a. Reliability of Flow Data
NEA has estimated the flow of the project by two kinds of methods. In the case there is a gauging station near the project site, the flow of the project is estimated by using the gauged flow data. In the case that there is no gauging station near the project site, the flow of the project is estimated by Regional Analysis. Regional Analysis is a method to estimate the flow using correlation equations, which were derived by the correlation among flow, catchment area and precipitation intensity based on the flow data and precipitation data gauged at gauging stations and meteorological observatories whole of the country.
In this study the flow data at the 75 gauging stations in which gauging period is more than 10 years was adopted considering reliability of flow data. The flow data used for electric energy calculation was for the latest ten years.
Figure 7.2-1 shows the location of gauging stations reviewed. Table 7.2-1 show the specification of these gauging stations.
Figure 7.2-1 Location of Gauging Stations Selected for Energy Calculation
Seti Nadi
Bheri
Nadi
Mah
akali N
adi
Arun
Nad
i
Babai Nadi
Rapti Nadi
Tamor
Nad
i
Bag
mat
i N
adi
Marsyandi Nadi
Thuli G
ad
Karnali R
iver
Kali G
anda
ki N
adi
DudhK
oshi N
adi
Tila Nadi
Madi
Nad
i
Likh
u Kh
ola
Kamala Nadi
Mec
hi N
adi
Bak
aiya
Nad
i
SunKoshi Nadi
Madi Khola
Mahana Nadi
Bud
hi G
anda
ki N
adi
Mai Khola
Mod
i Kho
la
Chamaliya N
adi
Hongu
Khola
Ganga Nadi
Barun Nadi
Tadi Khola
Dar
audi
Kho
la
Badigad K
hola
Chuw
a K
hola
Surna
ya G
ad Kalang
a Gad
Arun K
hola Kh
imti
Khola
Barun Khola
Ratu
wa
Kho
la
Kawadi Khola
Marin Khola
Tin
au R
iver
Iwa
Kho
la
Ban
gang
a River
Bale
phi K
hola M
ewa K
hola
Sabha
Kho
la
Lantan Khola
Indr
awat
i N
adi
Tawa K
hola
Sarada Nadi
Take Khol
a
Phoks
undo K
hola
Akh
u Kh
ola
Mugu Karnali River
Pikhuwa Khola
Rolwalin Khola
Piluwa K
hola
Jaide Khola
Polte KholaRangun Khola
Sar
u Kho
la
Tora Khola
Pelma Khola
sera
Gad
Kaya
r Kho
la
Sawa
Khola
Laha Gad Jyanja Khola
Seti Nadi
Rapti N
adi
795
728695 690
684
680
670660
647640
630
620 610
590589
570560540
530
470
460
450 448
447440438
430
420
415410
360350
330
290
286
280270
265
260250240
225220
215
170
627.5
439.7
439.3
419.1
406.5
404.7
339.5
269.5
259.2
289.95
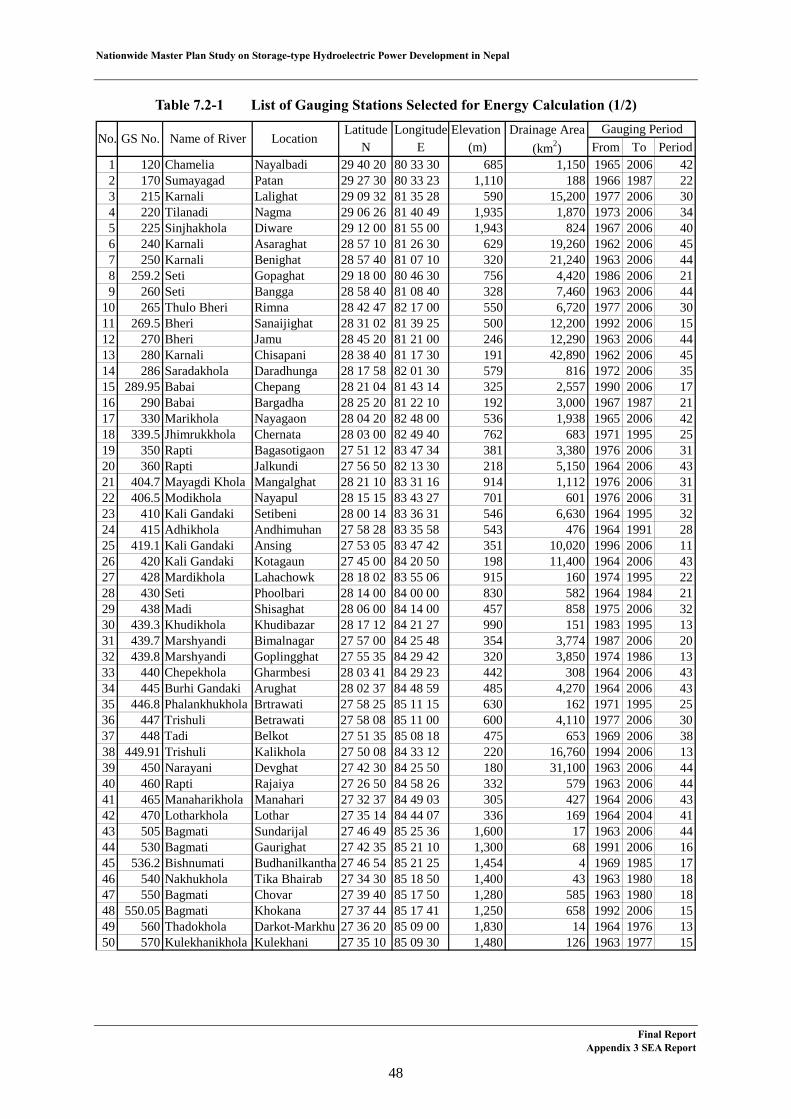
Nationwide Master Plan Study on Storage-type Hydroelectric Power Development in Nepal
Table 7.2-1 List of Gauging Stations Selected for Energy Calculation (1/2)
Latitude Longitude Elevation Drainage AreaN E (m) (km2) From To Period
1 120 Chamelia Nayalbadi 29 40 20 80 33 30 685 1,150 1965 2006 422 170 Sumayagad Patan 29 27 30 80 33 23 1,110 188 1966 1987 223 215 Karnali Lalighat 29 09 32 81 35 28 590 15,200 1977 2006 304 220 Tilanadi Nagma 29 06 26 81 40 49 1,935 1,870 1973 2006 345 225 Sinjhakhola Diware 29 12 00 81 55 00 1,943 824 1967 2006 406 240 Karnali Asaraghat 28 57 10 81 26 30 629 19,260 1962 2006 457 250 Karnali Benighat 28 57 40 81 07 10 320 21,240 1963 2006 448 259.2 Seti Gopaghat 29 18 00 80 46 30 756 4,420 1986 2006 219 260 Seti Bangga 28 58 40 81 08 40 328 7,460 1963 2006 44
10 265 Thulo Bheri Rimna 28 42 47 82 17 00 550 6,720 1977 2006 3011 269.5 Bheri Sanaijighat 28 31 02 81 39 25 500 12,200 1992 2006 1512 270 Bheri Jamu 28 45 20 81 21 00 246 12,290 1963 2006 4413 280 Karnali Chisapani 28 38 40 81 17 30 191 42,890 1962 2006 4514 286 Saradakhola Daradhunga 28 17 58 82 01 30 579 816 1972 2006 3515 289.95 Babai Chepang 28 21 04 81 43 14 325 2,557 1990 2006 1716 290 Babai Bargadha 28 25 20 81 22 10 192 3,000 1967 1987 2117 330 Marikhola Nayagaon 28 04 20 82 48 00 536 1,938 1965 2006 4218 339.5 Jhimrukkhola Chernata 28 03 00 82 49 40 762 683 1971 1995 2519 350 Rapti Bagasotigaon 27 51 12 83 47 34 381 3,380 1976 2006 3120 360 Rapti Jalkundi 27 56 50 82 13 30 218 5,150 1964 2006 4321 404.7 Mayagdi Khola Mangalghat 28 21 10 83 31 16 914 1,112 1976 2006 3122 406.5 Modikhola Nayapul 28 15 15 83 43 27 701 601 1976 2006 3123 410 Kali Gandaki Setibeni 28 00 14 83 36 31 546 6,630 1964 1995 3224 415 Adhikhola Andhimuhan 27 58 28 83 35 58 543 476 1964 1991 2825 419.1 Kali Gandaki Ansing 27 53 05 83 47 42 351 10,020 1996 2006 1126 420 Kali Gandaki Kotagaun 27 45 00 84 20 50 198 11,400 1964 2006 4327 428 Mardikhola Lahachowk 28 18 02 83 55 06 915 160 1974 1995 2228 430 Seti Phoolbari 28 14 00 84 00 00 830 582 1964 1984 2129 438 Madi Shisaghat 28 06 00 84 14 00 457 858 1975 2006 3230 439.3 Khudikhola Khudibazar 28 17 12 84 21 27 990 151 1983 1995 1331 439.7 Marshyandi Bimalnagar 27 57 00 84 25 48 354 3,774 1987 2006 2032 439.8 Marshyandi Goplingghat 27 55 35 84 29 42 320 3,850 1974 1986 1333 440 Chepekhola Gharmbesi 28 03 41 84 29 23 442 308 1964 2006 4334 445 Burhi Gandaki Arughat 28 02 37 84 48 59 485 4,270 1964 2006 4335 446.8 Phalankhukhola Brtrawati 27 58 25 85 11 15 630 162 1971 1995 2536 447 Trishuli Betrawati 27 58 08 85 11 00 600 4,110 1977 2006 3037 448 Tadi Belkot 27 51 35 85 08 18 475 653 1969 2006 3838 449.91 Trishuli Kalikhola 27 50 08 84 33 12 220 16,760 1994 2006 1339 450 Narayani Devghat 27 42 30 84 25 50 180 31,100 1963 2006 4440 460 Rapti Rajaiya 27 26 50 84 58 26 332 579 1963 2006 4441 465 Manaharikhola Manahari 27 32 37 84 49 03 305 427 1964 2006 4342 470 Lotharkhola Lothar 27 35 14 84 44 07 336 169 1964 2004 4143 505 Bagmati Sundarijal 27 46 49 85 25 36 1,600 17 1963 2006 4444 530 Bagmati Gaurighat 27 42 35 85 21 10 1,300 68 1991 2006 1645 536.2 Bishnumati Budhanilkantha 27 46 54 85 21 25 1,454 4 1969 1985 1746 540 Nakhukhola Tika Bhairab 27 34 30 85 18 50 1,400 43 1963 1980 1847 550 Bagmati Chovar 27 39 40 85 17 50 1,280 585 1963 1980 1848 550.05 Bagmati Khokana 27 37 44 85 17 41 1,250 658 1992 2006 1549 560 Thadokhola Darkot-Markhu 27 36 20 85 09 00 1,830 14 1964 1976 1350 570 Kulekhanikhola Kulekhani 27 35 10 85 09 30 1,480 126 1963 1977 15
No.Gauging Period
GS No. Name of River Location
Final Report Appendix 3 SEA Report
48

Nationwide Master Plan Study on Storage-type Hydroelectric Power Development in Nepal
Source: Stream flow summary (1962-2006), October 2008, DHM
NEA has calculated the monthly flow data by Regional Analysis using the flow data before 1990 and the Monsoon Wetness Isolines based on the precipitation before 1984. In this study the Study Team revised the calculation formula for monthly flow as follows using the flow data before 2006 and precipitation before 2010. Figure 7.2-2 shows Monsoon Wetness Index Isolines revised based on the monthly average precipitation data before 2010.
January: Q = 0.0249 × A0.8847 February: Q = 0.0203 × A0.892 March: Q = 0.0178 × A0.9039 April: Q = 0.0163 × A0.9345 May: Q = 0.0188 × A0.9748 June: Q = 0.01682 × A0.23219 × MWI0.521437 July: Q = 0.00256 × A0.892982 × MWI0.62385 August: Q = 0.005817 × A0.889299 × MWI0.541055 September: Q = 0.004677 × A0.877219 × MWI0.535014 October: Q = 0.00304A × 0.863316 × MWI0.497909 November: Q = 0.001422 × A0.873818 × MWI0.491577 December: Q = 0.000995 × A0.88672 × MWI0.470822
Latitude Longitude Elevation Drainage AreaN E (m) (km2) From To Period
51 589 Bagmati Padharadoven 27 09 06 85 29 30 180 2,700 1979 2006 2852 590 Bagmati Karmaiya 27 08 22 85 29 22 177 2,720 1965 1979 1553 600.1 Arun Uwagaun 27 35 21 87 20 22 1,294 26,750 1985 2006 2254 602 Sabayakhola Tumilingtar 27 18 36 87 12 45 305 375 1974 2006 3355 602.5 Hinwakhola Pipaltar 27 17 45 87 13 30 300 110 1974 2006 3356 604.5 Arun Turkighat 27 20 00 87 11 30 414 28,200 1975 2006 3257 606 Arun Simle 26 55 42 87 09 16 152 30,380 1986 2006 2158 610 Bhotekosi Barbise 27 47 18 85 53 55 840 2,410 1965 2006 4259 620 Balephi Jalbire 27 48 20 85 46 10 793 629 1964 2006 4360 627.5 Melamchi Helambu 28 02 21 85 32 07 2,134 84 1990 2006 1761 630 Sunkosi Pachuwarghat 27 33 30 85 45 10 602 4,920 1964 2006 4362 640 Rosikhola Panauti 27 34 50 85 30 50 1,480 87 1964 1987 2463 647 Tamakosi Busti 27 38 05 86 05 12 849 2,753 1971 2006 3664 650 Khimtikhola Rasnalu 27 34 30 86 11 50 1,120 313 1964 2006 4365 652 Sunkosi Khurkot 27 20 11 86 00 01 455 10,000 1968 2006 3966 660 Likhu Sangutar 27 20 10 86 13 10 543 823 1964 2006 4367 668.5 Solukhola Salme 27 30 03 86 34 52 1,800 246 1987 2006 2068 670 Dudhakosi Rabuwabazar 27 16 14 86 40 02 460 4,100 1964 2006 4369 680 Sunkosi Kampughat 26 52 28 86 49 10 200 17,600 1966 1985 2070 681 Sunkosi Hampchuwar 26 55 15 87 08 45 150 18,700 1991 2006 1671 684 Tamur Majhitar 27 09 30 87 42 45 533 4,050 1996 2006 1172 690 Tamur Mulghat 26 55 50 87 19 45 276 5,640 1965 2006 4273 695 Saptakosi Chatara 26 52 00 87 09 30 140 54,100 1977 2006 3074 728 Maikhola Rajdwali 26 52 45 87 55 45 609 377 1983 2006 2475 795 Kankai Mainachuli 26 41 12 87 52 44 125 1,148 1972 2006 35
No.Gauging Period
GS No. Name of River Location
Final Report Appendix 3 SEA Report
49
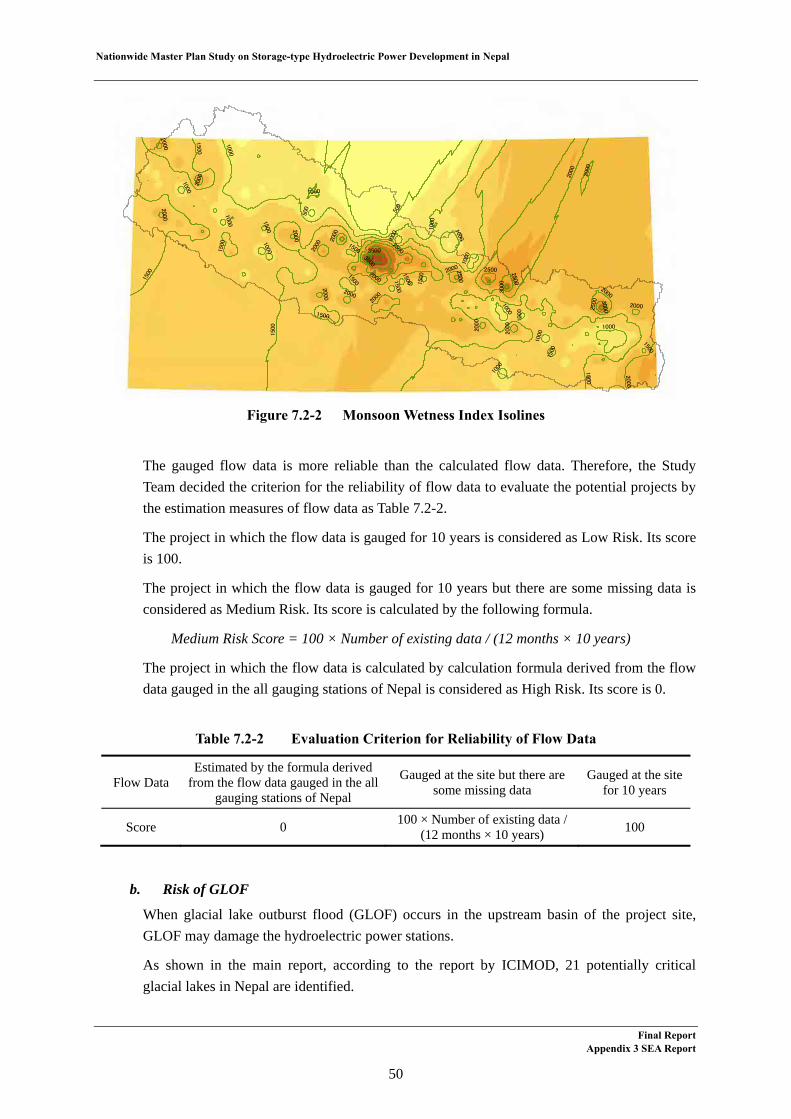
Nationwide Master Plan Study on Storage-type Hydroelectric Power Development in Nepal
Final Report Appendix 3 SEA Report
50
Figure 7.2-2 Monsoon Wetness Index Isolines
The gauged flow data is more reliable than the calculated flow data. Therefore, the Study Team decided the criterion for the reliability of flow data to evaluate the potential projects by the estimation measures of flow data as Table 7.2-2.
The project in which the flow data is gauged for 10 years is considered as Low Risk. Its score is 100.
The project in which the flow data is gauged for 10 years but there are some missing data is considered as Medium Risk. Its score is calculated by the following formula.
Medium Risk Score = 100 × Number of existing data / (12 months × 10 years)
The project in which the flow data is calculated by calculation formula derived from the flow data gauged in the all gauging stations of Nepal is considered as High Risk. Its score is 0.
Table 7.2-2 Evaluation Criterion for Reliability of Flow Data
Flow Data Estimated by the formula derived
from the flow data gauged in the all gauging stations of Nepal
Gauged at the site but there are some missing data
Gauged at the site for 10 years
Score 0 100 × Number of existing data / (12 months × 10 years) 100
b. Risk of GLOF
When glacial lake outburst flood (GLOF) occurs in the upstream basin of the project site, GLOF may damage the hydroelectric power stations.
As shown in the main report, according to the report by ICIMOD, 21 potentially critical glacial lakes in Nepal are identified.
1500
100020
00
500
25003000
3500
2000
1500
1500
2000
1000
500
1000
1500
2000
1500
3000
2500
2000
1500
3000
2000
1000
1500
2000
1500
1000
2000
1500
2000
2000
1000
2000
2000
200
0
2000
1500
2000
2500
2500
1000
1000
2500
1500
1000
1000
1500
1500
1000
1000
2000
1000
1000
2000
2000
1500

Nationwide Master Plan Study on Storage-type Hydroelectric Power Development in Nepal
Therefore, the Study Team decided the evaluation criterion for risk of GLOF to evaluate the potential projects by the number of potentially critical glacial lakes upstream of the project site as Table 7.2-3.
The project where there is no potentially critical glacial lake upstream basin is considered as No Risk. Its score is 100.
The project where there is at least a potentially critical glacial lake upstream basin is considered as Risky. The 21 potentially critical glacial lakes are categorized into I, II, III. The project where the potentially critical glacial lake is category III is considered as Low Risk. Its score is 40. The project where the potentially critical glacial lake is category II is considered as Medium Risk. Its score is 20. The project where the potentially critical glacial lake is category I is considered as High Risk. Its score is 0.
Table 7.2-3 Evaluation Criterion for Risk of GLOF
Number of glacial lakes identified as “potentially critical” by ICIMOD located
along the upper reaches of the dam None
One or more
Low risk Medium risk High risk
Score 100 40 20 0
c. Sedimentation
Sediment phenomena progresses and it reduces effective storage capacity between FSL and MOL. In this stage, reservoir storage effect to regulate river water is reduced, and consequently the power plant cannot generate energy as expected at the planning stage. In the case the sediment reaches to the intake and the level reaches the intake sill, the power plant faces a problem to stop the generation because of intrusion of sediment to the waterway.
Life of reservoir is an index to show the sediment impact to reservoir. It means how long years the reservoir become full by sediment yield. Life reservoir is equal to storage of reservoir divided by mean annual sediment yield.
Since the expected life of power station is 50 years, life of reservoir is required to be more than 50 years. The project in which life of reservoir is less than 50 years is considered as High Risk. Its score is 0. The life of reservoir of Low Risk project is decided to be 100 years. Its score is 100. The life of reservoir in the Medium Risk project is more than 50 years and less than 100 years. The score is calculated by proration. Table 7.2-4 shows the evaluation criterion for sedimentation.
If the sediment yield of a project is estimated, the sediment yield was adopted. However, unless the sediment yield of a project is estimated, the sediment yield was calculated using the specific sediment yield of 3 areas of Nepal, such as the eastern area, the central area and the western area.
Final Report Appendix 3 SEA Report
51

Nationwide Master Plan Study on Storage-type Hydroelectric Power Development in Nepal
Table 7.2-4 Evaluation Criterion for Sedimentation
Life of Reservoir Less than 50 years 50 years - 100 years More than 100 years
Score 0 Linear interpolation 100
2) Geology
Here in this section describes the evaluation criteria for geology.
As discussed already, Nepal has numerous large active faults inside. Naturally earthquakes occur very frequent. Earth conditions including geology vary one area to another so rapidly. Storage hydroelectric power is 30-50 years structure that extreme cares should be paid to such Geology, Tectonic Faults, or Seismicity, in its site selection, as well as in its design. Hereby these geological evaluation criteria have been studied.
In the study, an each criterion is defined as “Geological conditions of the site,” “Natural hazard (earthquake)” and “Seismicity.” Each criterion is valued from “1” to “5” depending on each site condition. And thus “weighted percentage” determined by the Study Team is multiplied onto each “value,” giving the final total “geological evaluation point.”
Each criterion is determined based on the actual project sites conditions concerning these 3 categories thus the most appropriate “threshold” for each criterion is defined from the actual dataset of projects. The sites were selected for the long listed project sites proposed by the Counterpart for this Study.
The actual geologic and seismic dataset analyzed for all the sites are presented in Table 7.2-5.
Final Report Appendix 3 SEA Report
52
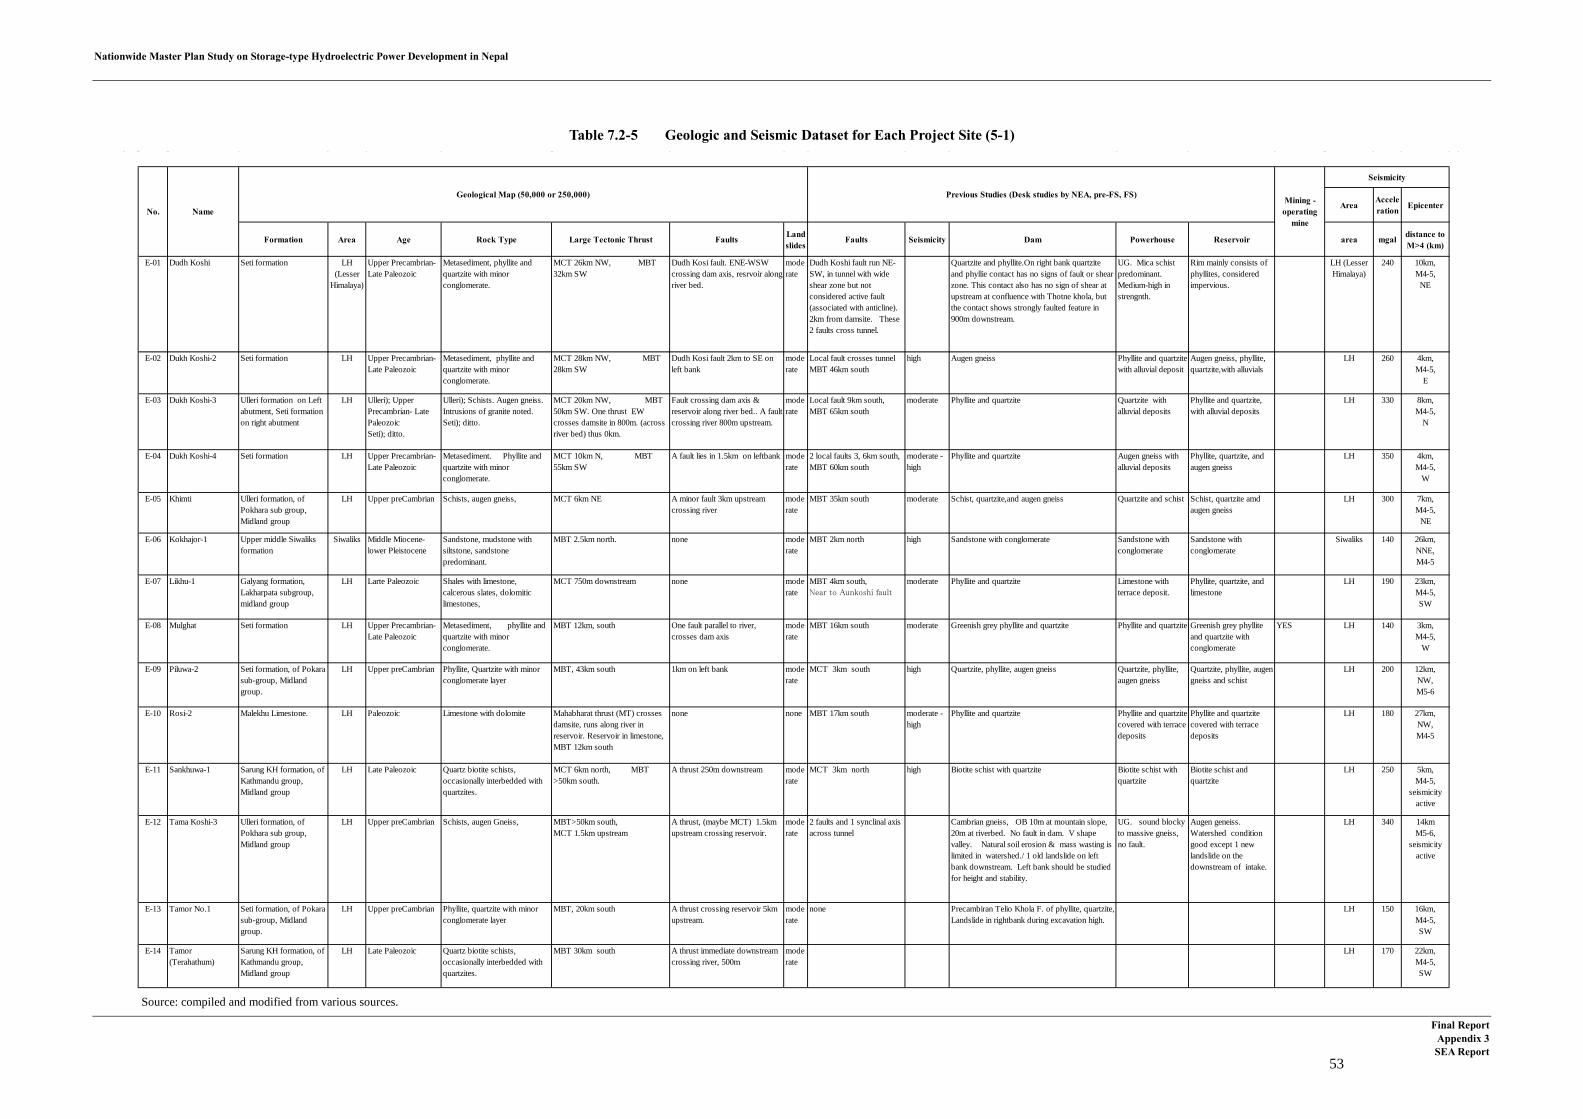
Nationwide Master Plan Study on Storage-type Hydroelectric Power Development in Nepal
Table 7.2-5 Geologic and Seismic Dataset for Each Project Site (5-1)
Source: compiled and modified from various sources.
Seismicity
AreaAcceleration Epicenter
Formation Area Age Rock Type Large Tectonic Thrust Faults Landslides
Faults Seismicity Dam Powerhouse Reservoir area mgal distance toM>4 (km)
E-01 Dudh Koshi Seti formation LH(Lesser
Himalaya)
Upper Precambrian-Late Paleozoic
Metasediment, phyllite andquartzite with minorconglomerate.
MCT 26km NW, MBT32km SW
Dudh Kosi fault. ENE-WSWcrossing dam axis, resrvoir alongriver bed.
moderate
Dudh Koshi fault run NE-SW, in tunnel with wideshear zone but notconsidered active fault(associated with anticline).2km from damsite. These2 faults cross tunnel.
Quartzite and phyllite.On right bank quartziteand phyllie contact has no signs of fault or shearzone. This contact also has no sign of shear atupstream at confluence with Thotne khola, butthe contact shows strongly faulted feature in900m downstream.
UG. Mica schistpredominant.Medium-high instrengnth.
Rim mainly consists ofphyllites, consideredimpervious.
LH (LesserHimalaya)
240 10km,M4-5,
NE
E-02 Dukh Koshi-2 Seti formation LH Upper Precambrian-Late Paleozoic
Metasediment, phyllite andquartzite with minorconglomerate.
MCT 28km NW, MBT28km SW
Dudh Kosi fault 2km to SE onleft bank
moderate
Local fault crosses tunnelMBT 46km south
high Augen gneiss Phyllite and quartzitewith alluvial deposit
Augen gneiss, phyllite,quartzite,with alluvials
LH 260 4km,M4-5,
E
E-03 Dukh Koshi-3 Ulleri formation on Leftabutment, Seti formationon right abutment
LH Ulleri); UpperPrecambrian- LatePaleozoicSeti); ditto.
Ulleri); Schists. Augen gneiss.Intrusions of granite noted.Seti); ditto.
MCT 20km NW, MBT50km SW. One thrust EWcrosses damsite in 800m. (acrossriver bed) thus 0km.
Fault crossing dam axis &reservoir along river bed.. A faultcrossing river 800m upstream.
moderate
Local fault 9km south,MBT 65km south
moderate Phyllite and quartzite Quartzite withalluvial deposits
Phyllite and quartzite,with alluvial deposits
LH 330 8km,M4-5,
N
E-04 Dukh Koshi-4 Seti formation LH Upper Precambrian-Late Paleozoic
Metasediment. Phyllite andquartzite with minorconglomerate.
MCT 10km N, MBT55km SW
A fault lies in 1.5km on leftbank moderate
2 local faults 3, 6km south,MBT 60km south
moderate -high
Phyllite and quartzite Augen gneiss withalluvial deposits
Phyllite, quartzite, andaugen gneiss
LH 350 4km,M4-5,
W
E-05 Khimti Ulleri formation, ofPokhara sub group,Midland group
LH Upper preCambrian Schists, augen gneiss, MCT 6km NE A minor fault 3km upstreamcrossing river
moderate
MBT 35km south moderate Schist, quartzite,and augen gneiss Quartzite and schist Schist, quartzite amdaugen gneiss
LH 300 7km,M4-5,
NE
E-06 Kokhajor-1 Upper middle Siwaliksformation
Siwaliks Middle Miocene-lower Pleistocene
Sandstone, mudstone withsiltstone, sandstonepredominant.
MBT 2.5km north. none moderate
MBT 2km north high Sandstone with conglomerate Sandstone withconglomerate
Sandstone withconglomerate
Siwaliks 140 26km,NNE,M4-5
E-07 Likhu-1 Galyang formation,Lakharpata subgroup,midland group
LH Larte Paleozoic Shales with limestone,calcerous slates, dolomiticlimestones,
MCT 750m downstream none moderate
MBT 4km south,Near to Aunkoshi fault
moderate Phyllite and quartzite Limestone withterrace deposit.
Phyllite, quartzite, andlimestone
LH 190 23km,M4-5,SW
E-08 Mulghat Seti formation LH Upper Precambrian-Late Paleozoic
Metasediment, phyllite andquartzite with minorconglomerate.
MBT 12km, south One fault parallel to river,crosses dam axis
moderate
MBT 16km south moderate Greenish grey phyllite and quartzite Phyllite and quartzite Greenish grey phylliteand quartzite withconglomerate
YES LH 140 3km,M4-5,
W
E-09 Piluwa-2 Seti formation, of Pokarasub-group, Midlandgroup.
LH Upper preCambrian Phyllite, Quartzite with minorconglomerate layer
MBT, 43km south 1km on left bank moderate
MCT 3km south high Quartzite, phyllite, augen gneiss Quartzite, phyllite,augen gneiss
Quartzite, phyllite, augengneiss and schist
LH 200 12km,NW,M5-6
E-10 Rosi-2 Malekhu Limestone. LH Paleozoic Limestone with dolomite Mahabharat thrust (MT) crossesdamsite, runs along river inreservoir. Reservoir in limestone,MBT 12km south
none none MBT 17km south moderate -high
Phyllite and quartzite Phyllite and quartzitecovered with terracedeposits
Phyllite and quartzitecovered with terracedeposits
LH 180 27km,NW,M4-5
E-11 Sankhuwa-1 Sarung KH formation, ofKathmandu group,Midland group
LH Late Paleozoic Quartz biotite schists,occasionally interbedded withquartzites.
MCT 6km north, MBT>50km south.
A thrust 250m downstream moderate
MCT 3km north high Biotite schist with quartzite Biotite schist withquartzite
Biotite schist andquartzite
LH 250 5km,M4-5,
seismicityactive
E-12 Tama Koshi-3 Ulleri formation, ofPokhara sub group,Midland group
LH Upper preCambrian Schists, augen Gneiss, MBT>50km south,MCT 1.5km upstream
A thrust, (maybe MCT) 1.5kmupstream crossing reservoir.
moderate
2 faults and 1 synclinal axisacross tunnel
Cambrian gneiss, OB 10m at mountain slope,20m at riverbed. No fault in dam. V shapevalley. Natural soil erosion & mass wasting islimited in watershed./ 1 old landslide on leftbank downstream. Left bank should be studiedfor height and stability.
UG. sound blockyto massive gneiss,no fault.
Augen geneiss.Watershed conditiongood except 1 newlandslide on thedownstream of intake.
LH 340 14kmM5-6,
seismicityactive
E-13 Tamor No.1 Seti formation, of Pokarasub-group, Midlandgroup.
LH Upper preCambrian Phyllite, quartzite with minorconglomerate layer
MBT, 20km south A thrust crossing reservoir 5kmupstream.
moderate
none Precambiran Telio Khola F. of phyllite, quartzite,Landslide in rightbank during excavation high.
LH 150 16km,M4-5,SW
E-14 Tamor(Terahathum)
Sarung KH formation, ofKathmandu group,Midland group
LH Late Paleozoic Quartz biotite schists,occasionally interbedded withquartzites.
MBT 30km south A thrust immediate downstreamcrossing river, 500m
moderate
LH 170 22km,M4-5,SW
Previous Studies (Desk studies by NEA, pre-FS, FS)Mining -
operatingmine
No. Name
Geological Map (50,000 or 250,000)
Final Report Appendix 3 SEA Report
53

Nationwide Master Plan Study on Storage-type Hydroelectric Power Development in Nepal
Table 7.2-5 Geologic and Seismic Dataset for Each Project Site (5-2)
Source: compiled and modified from various sources.
E-15 Sun koshi No.1 Sarung KH formation, ofKathmandu group,Midland group
LH Late Paleozoic Quartz biotite schists,occasionally interbedded withquartzites.
MBT 9km SW none moderate
Cambrian, Bhimphedi F. (biotite schist). Alluvialdeposit 26m thick.. Right bank steep, left bankgentle slope. No fault.
LH 190 6km,M4-5,
S
E-16 Sun koshi No.2 Twaa Khola formation,of Kathmandu group,Midland group
LH Late Paleozoic Biotite quartz schists, withintercalation of quartzite,amphibolites.
MBT 12km, south A fault parallel to MBT 1kmdownstream.
moderate
Syncline to S along axis, granite intrusion,Cambrian Bhimphedi Towakhola F. biotiteschist. riverbed 29m thick. CH at 19-22m atdrillings of banks. No geological problem.extermeley attractive.
LH 190 26km,NNE,M4-5
E-17 Sun koshi No.3,Kosi MP(Multipurpose)
Kunchha formation,Lower Nawakot group
LH PreCambrian Phyllites, metasandstones,gritstones
MBT 16km south none moderate
Small fault crosses damaxis, thrust 5km W.
Precambrian Kuncha F. of sandstone. right banksteep, left bank steep cliff. Riverbed max 40m.
LH 190 28km, M4-5,
NW
E-18 Sun koshi No.3,Kosi MP
Kunchha formation,Lower Nawakot group
LH PreCambrian Phyllites, metasandstones,gritstones
MBT 16km south none moderate
LH 190 28km,M4-5,NW
E-19 Sun koshi No.3 Ranimatta formation,Midland group,
LH Uppe preCambrian-Late Paleozoic
Phyllite gritstone withconglomerate, and quartzite
MBT 22km south A fault along river in reservoir in2km
moderate
LH 225 25km,M4-5,NW
E-20 Indrawati Ranimatta formation,Midland group,
LH Upper preCambrian-Late Paleozoic
Phyllite gritstone wthconglomerate,and quartzite
MCT 15km north, MBT30km south
A fault crosses damsite alongriver
moderate
MBT 10km south, MCT16km north. Sun koshi fault3km south.
Lesser Himalaya, m-l grade metamorphics. Thearea is in Ranimatta formation of phyllite.Banks stable. Right bank more gentle withdeposit 10-15m thick, left bank steeper. Soft-medium hard phyllite. River deposits 15-20mthick.
Surface PH. OB<10m but 15-20maway from slope.No geologicalhazards expected.
Mainly phyllite withsome quartzite. Nomajor instabilitiesincluding faults,landslides. Phyllitesexpected imperviousthat water tightnessexpected.
YES, butminor affects
LH 225 14km,M4-5,
W
E-21 Kankai Upper middle Siwalik,Siwalik group
Siwaliks Middle Miocene-Upper Pleistocene
Sandstones, pebby sandstoneswith siltstones, mudstones.
MBT 13km north A fault parallel to MBT 7kmupstream.
moderate
Major fault with brecciaruns in left abutment.
Alternation of sandstone, shale and siltstone ofmiddle-upper Siwaliks formation. In plio-pleistocene. Soft and weathered easily. Shalepredominant on left bank, sandstonepredominant on right bank. Riverbedthick 17-19m. Talus on left bank. Banks rathersteep 40deg.
Siwaliks 130 18km,M5-6,
N
C-01 Kaligandaki-Modi Thick Alluvium,Kunchha formation(right), KuushmaQuartzite (left)
LH PreCambrian Phyllite, phyllitic quartzite(right), quartzite (left)
MCT 25km south, MBT50km south
none moderate
MCT 15km south moderate Conglomerate Conglomerate Phyllite quartziteconglomerate
LH 200 23km,M4-5,
N
C-02 Lower Badigad Bennnighat Slate, UpperNuwakot group
LH PreCambrian Slate, carboneceous slate withlimestone and quartzite
MBT 25km south Some faults in reservoir, 3.5km moderate
Badigad fault passesthrough project area.MCT 20km north
moderate-high
Limestone and slate Limestone Limestone, dolomite,slate,and phyllite
LH 170 30km,M4-5,
N
C-03 Lower Daraudi Ranimatta formation,Midland group,
LH Upper preCambrian-Late Paleozoic
Phyllite gritstone withconglomerate, and quartzite
MBT 17km south none moderate
MBT 20km south moderate Phyllite Phyllite Phyllite, quartzite andgritty phyllite
LH 250 24km,M4-5,
E
C-04 Seti-Trisuli(FS)
Benighat Slates, ofNawakot group
LH Upper Paleozoic Shales, phyllites, carboneceousslates
MBT 7km south A fault parallel to river crossesdam axis,
moderate
No major geologicalhazards.
Dandagaon phyllites of Lesser Himalaya.Damsite comprises slaty phyllite, quartzite, int.limestone. Banks are m. strong to strongcalcerous phyllite and quartzite. River runs alonganticline axis. Fair-good rock mass.
Surface PH.quartzite, phyllite,dolomite of Nourpulformation, LH.Alluvials 15-20mthick. Fair.
Covered by alluvial-colluvials. Rareoutcrops with weatheredand calecerous rocks.Potential massmovements, kalsticphenomena. Major faultscross.
LH 190 27km,M5-6,
NE
C-05 Upper Daraudi Ranimatta formation,Midland group,
LH Upper preCambrian-Late Paleozoic
Phyllite gritstone withconglomerate, and quartzite
MCT 8km north A fault immediately upstreamcrossing river, 500m
moderate
MCT 12km north moderate Phyllite and quartzite Phyllite Phyllite and micaquartzite
LH 300 28km,M5-6,
NE
C-06 Kaligandaki-2 Lower Nourpulformation, Nawakotgroup
LH Upper Paleozoic Quartzite, with phylliteintercalation
MBT, 2.9km south Some parallel faults to MBTcrossing river close at damsite,at 800m upsttream, and 500mdownstream.
moderate
MBT 8km south Nuwakot complex of late cambrian-Paleozoic.Phyllite, intercallation of quartzite and phyllte.
Surface PH.Basement onintercalation ofphyllite andquartzite. Riverbedthick as 2-10m nearPH.
Phyllite, slate, quartzite.Number of faults pass.Biggest is Kaligandakifault
LH 180 16km,M4-5,
N
C-07 Budhi Gandaki Sangram formation, orsequences of Midlandgroup
LH Upper preCambrian-Late Paleozoic
Shales intercallatd withlimestone, quartzite orquartzite, calcerous quartzite
MBT 18km south Some parallel faults crossingriver close at damsite100m.
moderate
Late Cambrian, phyllite. LH 270 13km,M5-6,
N
Final Report Appendix 3 SEA Report
55

Nationwide Master Plan Study on Storage-type Hydroelectric Power Development in Nepal
Table 7.2-5 Geologic and Seismic Dataset for Each Project Site (5-3)
Source: compiled and modified from various sources.
C-08 Andhi Khola Benighat Slates, ofNawakot group
LH Upper Paleozoic Shales, phyllites, carboneceousslates
MBT 25km south none moderate
MCT 70km N, MBT 20kmS. Andhikhola F.(active F)is 500m downstream ofconfluence with Kaligandakiand Andhikhola river.
Late Cambrian-early Paleozoic, metamorphics/predominantly phyllite of Andhikhola slatesmember. Right bank steep with thin OB. Leftbank steep with thick terrace >100m on top. Nofaults. River deposit 1-5m. Phyllite mediumstrong to strong. Fair to good.
Semi-UG. Phllyte.Terrace 45m thick.
LH 200 40km,M4-5,
NE
C-09 Langrang Khola Himal Group, HH(Higher
Himalaya)
PreCambrian Biotite gneiss MCT 10km east Unknown as map does notcover the areaa
moderate
Traversed by MCT Relocated 20km upstream with a higher dam.Fresh to slightly weathered gneiss with fairRQD.
U/G PHrecommended asrock is good.Quartzite andgarnetifferous micaschist with fairRMR
HH (HigherHimalaya)
250 16km,M5-6,SW
C-10 Uttar Ganga Lakharpata formation, ofMidlandgroup
LH Late Paleozoic Limestone, dolomitic limestone(quartzite, shales )
MCT 22km N none moderate
Surrounded by MCT butconsidered inactive.MBT 50km south,Phalebas thrust anticipatedbut not confirmed.
Lesser Himalaya. Metasedimentary rocks, ofDhorpatan phyllite zone. Dominantlycalcarerous, of phyllites-schists-quartzite-limestone. No karstic features but needsinvestigation. Dam site river channel in line withUttara Ganga anticline. Banks steep.
Surface PH/extension of BariGad Fault maycross PH.Limestone, phyllite.Slope steep,Colluvials 20-30m.
Phyllite, calcerousrocks. Covered byglacial deposits to causepotentialmassmovement. UttaraGanga anticline mayaffect water tightness.No instabilities.
LH 400 4 events<5km, 2km
closest.M4-5, 5-6,seisimicity
large
C-11 Madi- Ishaneshor Kunchha formation, ofNawakot group
LH Upper Cambrian-Precambrian
Phyllite, phyllitic quartzite,quartztic phyllite,
MCT 10km north One lineament just downstream,250m.
moderate
MBT 50km south,MCT 30km north
Lesser Himalaya, Kunchha formation ofNawakot complex, metasedimentary rocks.Medium hard phylllitic quartzite. ConsideredFair. River bed at channel 5-10m thick.
3 surface PHoptions. Quartzite-phyllite. Riverbed10m->30m. Slopesare stable.
Quartzite-phyllite.Considered impervious.No landslides, no karsticconditions. No majorfaults, considered watertight.
LH 400 5km,M4-5, SE,seisimicistyrather large
C-12 Kali Gandaki No.1 Benighat slate, of UpperNuwakot group,
LH preCambrian Slate, carboneceous slate withlimestone, quartzite bands
MBT 25km south 1 fault crossing river 500mupsream.
moderate
Upper Proterozoic-Cambrian dolomiticlimestone, phyllite, slate, chert, etc. Low-interm.thick terrace widely spread. 16m max.Limestone upstream & at right bank. Phyllite inleft bank. Limestone not weathered but solutioncavities in limestone. 200m shear zone alongdam axis. Some instabilities on steep leftbank.
Low level alluvialterrace,considerableinstabilites alonghillside above PH.
Limestone upstream ofdamsite. Phyllite atconfluence with AndhiKola. Faults zone 100mat confluence.
LH 170 40km,M4-5,NW
C-13 Marsyangdi Ranimatta formation,Midland group,
LH Upper preCambrian-Late Paleozoic
Phyllite gritstone wthconglomerate, and quartzite
MCT 37km north,MBT 11km south
A fault 1km on left bank moderate
LH 220 25km,M5-6,
NE
C-14 Seti (Gandaki) Kunchha formation, ofNawakot group,
LH Upper preCambrian-Cambrian
Phyllite, phyllitic quartzite,quartztic phyllite,
MCT 20km north none moderate
MBT 8km to south moderate Slate Slate and limestone Slate, limestone, phylliteand quartzite
LH 400 3km,M4-5,
SE
C-15 Dev Ghat Middle Siwalik, ofSiwalik group
Siwaliks Neogene Sandstones, with shale andsiltstone
MBT 6km south Some faults parallel to MBT,3km upstream, 200mdownstreamm, etc.
moderate
Old metamorphic rocks with banks 45degslopes
LH 160 39km,M4-5,
N
C-16 Bhomichok Ranimatta formation,Midland group,
LH Upper preCambrian-Late Paleozoic
Phyllite gritstone withconglomerate, and quartzite
MBT 14km south A fault along river in reservoir, afault 1km on right bank
moderate
Midland metasediment of metamorphic rocks ofsandstone, slate, quartzite, siliceous mica schist,green schist, graphite chlorite quartz schist, micagneiss, granitic gneiss of late Cambrian. Banksform 35-45deg. River deposits 1-5m.
LH 240 17km,M5-6,
NE
C-17 Trishulganga Ranimatta formation,Midland group,
LH Upper preCambrian-Late Paleozoic
Phyllite gritstone withconglomerate, and quartzite
MBT 12km south 2 faults with 1.2km upstream,500m downstream, crossingriver
moderate
Late preCambrian metamorphic rock ofsandstone, slate, quartzite, schist, gneiss.Alluvials thin. Abutments relatively steep. Goodfor damsite.
LH 210 20km,M4-5,
NE
C-18 Ridi Khola Dhading dolomite, ofUpper Nuwakot group
LH PreCambrian Dolomite, silicious dolomite MBT, 11km south none high A thrust fault runs parallelto river
Both banks stable. Riverbed 16-20m. Left bankconsisted of fractured rocks with loose rockshanging over. Right bank is stable dolomite.
Initial surface PHwas not suitable as abig landslideimmediate upstream.Changed location to100m upstream withwith rocky sloperecommended. UGat fresh - slightlyweatheredlimestone.
Dolomite and phyllitewith slaty phyllite. Majorlandslides, rock flow,debris flow slump areasnot anticipated.
LH 180 30km,M4-5,NW
Final Report Appendix 3 SEA Report
57

Nationwide Master Plan Study on Storage-type Hydroelectric Power Development in Nepal
Table 7.2-5 Geologic and Seismic Dataset for Each Project Site (5-4)
Source: and modified from various sources.
C-19 BagmatiMultiporpose
Middle Siwaliks Siwaliks Upper preCambrian -Late Paleozoic
Sandstone, with clays,conglomerates
MCT 19km north A fault 1km leftbank moderate
Siwaliks 110 33km,M4-5,
S
W-01 Barbung Khola Himal group (1,000,000scale map only available)
HH preCambrian Gneiss? MCT 20km east none? moderate
MCT 25km south moderate Gneiss Gneiss and schist HH 200 24km,M4-5,
E
W-02 Chera-1 Kushma formation, ofLakharpata subgroup,Midland group
LH Upper Cambrian-latePaleozoic
Quartzites intercalated withphyllites.
MBT 30km SW A fault 2km upsteream moderate
MBT 30km south moderate Quartzite Quartzite coveredby alluvial deposits
Phyllite, quartzite andslate
LH 250 10km,M4-5, NE
W-03 Chera-2 Ranimatta formation, ofLakharpata sub-group,Midland group
LH Upper Cambrian-latePaleozoic
Phyllites, phyllitic quartzite,metasandstones, conglomeratebeds
MBT 27km SW A fault immeadiate upstream500m
moderate
MBT 20km south moderate Phyllite and quartzite Quartzite coveredby alluvial deposits
Phyllite, quartzite andslate
LH 200 10km,M4-5,
NE
W-04 Humla-Karnali Himal group (1,000,000scale map only available)
HH preCambrian Biotite gneiss, mica schists,augen gneiss, micaceousquaurtzites.
MCT very close, 1km south unknown moderate
MCT 10km south low-moderate
Schist and gneiss Quartzite Gneiss, schist andquartzite
HH 250 7km,M4-5,
N,frequent
seismicity
W-05 Lower Jhimruk Syanga formation, ofPokhara subgroup,Midland group
LH Upper preCambrian Quartzite, quartztic limestone,with shales and calcareousquartztic beds etc.
MBT immediate close todamsite. 2km south
none moderate
MBT 3km south moderate-high
Quartzite Limestone coveredby alluvium
Limestone, shale,quartzite and schist
LH 150 34km,M4-5,
NE
W-06 Madi Ranimatta formation, ofDailekh group, Midlandgroup
LH PreCambrian Shales, shaly phyllite, quartzitewith carbonate beds.
MBT 25km, south A fault 1km upstream crossingriver
moderate
MBT 25km south moderate-high
Phyllite Phyllite Phyllite, limestone andquartzite
LH 160 35km,M4-5,
NE
W-07 Mugu Karnali Nawakot group, Jaljalagroup (1,000,000 scalemap only available)
LH PreCambrian Marine sediments; Lower partsclastic (phyllites,sandstones,quartzites,calcareous sandstones)
MCT 23km NE unknown moderate
MCT 10km north moderate Phyllite and schist Schist Phyllite, schist,dolomite, limestone
LH 350 0km,M4-5,
very muchfrequent
seismicity
W-08 Sani Bhari - 1 Lakharpata formation, ofMidlandgroup
LH Late Paleozoic Limestone, dolomitic limestone,(quartzite, shales)
MCT 46km, north none moderate
MBT 75km southRanimatta thrust 35kmsouth
moderate Limestone Dolomite Phyllite, limestone,dolomite and quartzite
LH 200 16km,M5-6,
W
W-09 Sani Bhari - 2 Lakharpata formation, ofMidlandgroup
LH Late Paleozoic Limestone, dolomitic limestone,with intercalation of shales.
MBT 46km south A fault 2km upstream crossingriver
moderate
MBT 55km south moderate Limestone Dolomite Phyllite, limestone,dolomite
LH 170 3km,M5-6,
E
W-10 Sharada - 2 Lower middle Siwaliks Siwaliks Middle Miocene-lower Pleistocene
Sandstone, interbedded withsiltstone, mudstone
MBT, 6km south A fault in 2km upstream crossingriver
moderate
MBT 3km north moderate-high
Sandstone and conglomerate Conglomerate andclaystone
Sandstone, mudstone,siltstone
Siwaliks 120 30km,M4-5,
N
W-11 Thuli Gad - 2 Middle Siwaliks Siwaliks Middle Miocene-Pleistocene
Sandstone, interbedded withshales, conglomerates,mudstones.
MBT, 3km north Some faults in 1-2km moderate
Thuligad active fault acrossdam axis
high Sandstone and shale Sandstone andalluvial deposits
Quartzite, dolomiteshale, and limestone
Siwaliks 220 very close,1km,M4-5
W-12 Tila - 1 Kalikot formation,Dadeldhura group,Jaljara group
LH preCambrian Schists, quartzite, carbonates,augen gneiss, crystallinelimestone
MBT 50km south unknown/none? moderate
MBT 50km southReanimatta thrust 25kmsouth
moderate Gneiss Gneiss Gneiss, granite andpegmatite
LH 330 6km,M4-5,
SE
W-13 Tila - 3 Kalikot formation,Dadeldhura group,Jaljara group
LH preCambrian Schists, quartzite, carbonates,augen gneiss, crystallinelimestone
MBT 36km south A fault crossing river in 4kmdownstream
moderate
MBT 45km south,Ranimata thrust 10km north
moderate Schist and gneiss Schist Gneiss, limestone, schist LH 350 18km,M4-5,SW
W-14 Thuli Gad Middle Siwaliks Siwaliks Middle Miocene-Pleistocene
Sandstone, interbedded withshales, conglomerates,mudstones.
MBT, 3km north Some faults in 1-2km moderate
MBT across dam site very high Sandstone, dolomite and limestone Sandstone andalluvial deposits
Sandstone, mudstone,dolomitic limestone
Siwaliks 220 very close,1km,M4-5
W-15 LR-1 Ranimatta formation, ofLakharpata sub-group,Midland group
LH Upper Cambrian-latePaleozoic
Phyllites, phyllitic quartzite,metasandstones, conglomeratebeds
MBT 18km south A low angle thrust crosses bothbanks of reservoir (location of athrust not neccessarily accurate)500m
moderate
2 dam axes/ Midland group metasediment ofphyllite. MCT crosses both abutments paralell toriver at boundary of phyllite and gneiss above.Axis2 is not favorable as MCT crosses damabutment. And MCT crosses above axis1 damabutment. Axis1left bank covered with thickmudflow deposit and terrace. Mudflow youngerthan terrace deposit. Active landslides observed.Rightbank steep with phyllite. Axis2 rightabutment steep and considered good. Axis 1fair. Axis2 poor-fair
Surface PH. Active landslide. Thickmudflow on left bankupstream/ MCT causederosion.
LH 300 10km,M4-5,
N
Final Report Appendix 3 SEA Report
59
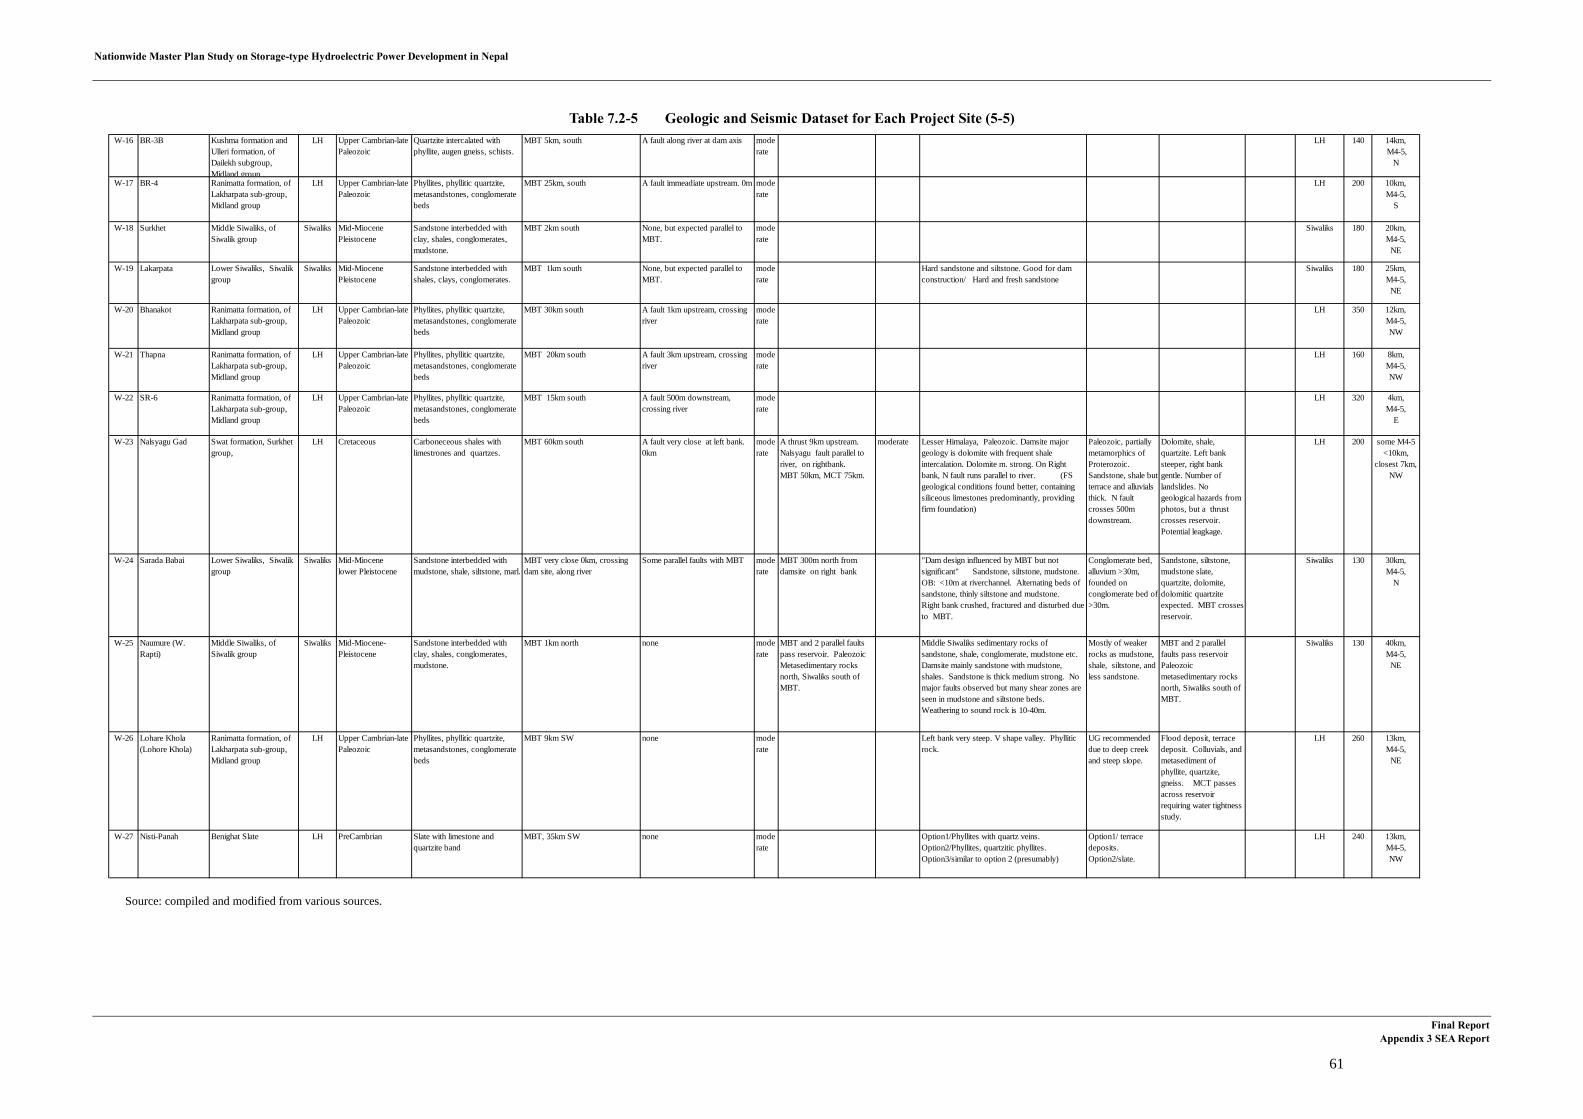
Nationwide Master Plan Study on Storage-type Hydroelectric Power Development in Nepal
Table 7.2-5 Geologic and Seismic Dataset for Each Project Site (5-5)
Source: compiled and modified from various sources.
W-16 BR-3B Kushma formation andUlleri formation, ofDailekh subgroup,Midland group
LH Upper Cambrian-latePaleozoic
Quartzite intercalated withphyllite, augen gneiss, schists.
MBT 5km, south A fault along river at dam axis moderate
LH 140 14km, M4-5,
N
W-17 BR-4 Ranimatta formation, ofLakharpata sub-group,Midland group
LH Upper Cambrian-latePaleozoic
Phyllites, phyllitic quartzite,metasandstones, conglomeratebeds
MBT 25km, south A fault immeadiate upstream. 0m moderate
LH 200 10km,M4-5,
S
W-18 Surkhet Middle Siwaliks, ofSiwalik group
Siwaliks Mid-MiocenePleistocene
Sandstone interbedded withclay, shales, conglomerates,mudstone.
MBT 2km south None, but expected parallel toMBT.
moderate
Siwaliks 180 20km,M4-5,
NE
W-19 Lakarpata Lower Siwaliks, Siwalikgroup
Siwaliks Mid-MiocenePleistocene
Sandstone interbedded withshales, clays, conglomerates.
MBT 1km south None, but expected parallel toMBT.
moderate
Hard sandstone and siltstone. Good for damconstruction/ Hard and fresh sandstone
Siwaliks 180 25km,M4-5,
NE
W-20 Bhanakot Ranimatta formation, ofLakharpata sub-group,Midland group
LH Upper Cambrian-latePaleozoic
Phyllites, phyllitic quartzite,metasandstones, conglomeratebeds
MBT 30km south A fault 1km upstream, crossingriver
moderate
LH 350 12km,M4-5,NW
W-21 Thapna Ranimatta formation, ofLakharpata sub-group,Midland group
LH Upper Cambrian-latePaleozoic
Phyllites, phyllitic quartzite,metasandstones, conglomeratebeds
MBT 20km south A fault 3km upstream, crossingriver
moderate
LH 160 8km,M4-5,NW
W-22 SR-6 Ranimatta formation, ofLakharpata sub-group,Midland group
LH Upper Cambrian-latePaleozoic
Phyllites, phyllitic quartzite,metasandstones, conglomeratebeds
MBT 15km south A fault 500m downstream,crossing river
moderate
LH 320 4km,M4-5,
E
W-23 Nalsyagu Gad Swat formation, Surkhetgroup,
LH Cretaceous Carboneceous shales withlimestrones and quartzes.
MBT 60km south A fault very close at left bank.0km
moderate
A thrust 9km upstream.Nalsyagu fault parallel toriver, on rightbank.MBT 50km, MCT 75km.
moderate Lesser Himalaya, Paleozoic. Damsite majorgeology is dolomite with frequent shaleintercalation. Dolomite m. strong. On Rightbank, N fault runs parallel to river. (FSgeological conditions found better, containingsiliceous limestones predominantly, providingfirm foundation)
Paleozoic, partiallymetamorphics ofProterozoic.Sandstone, shale butterrace and alluvialsthick. N faultcrosses 500mdownstream.
Dolomite, shale,quartzite. Left banksteeper, right bankgentle. Number oflandslides. Nogeological hazards fromphotos, but a thrustcrosses reservoir.Potential leagkage.
LH 200 some M4-5<10km,
closest 7km,NW
W-24 Sarada Babai Lower Siwaliks, Siwalikgroup
Siwaliks Mid-Miocenelower Pleistocene
Sandstone interbedded withmudstone, shale, siltstone, marl.
MBT very close 0km, crossingdam site, along river
Some parallel faults with MBT moderate
MBT 300m north fromdamsite on right bank
"Dam design influenced by MBT but notsignificant" Sandstone, siltstone, mudstone.OB: <10m at riverchannel. Alternating beds ofsandstone, thinly siltstone and mudstone.Right bank crushed, fractured and disturbed dueto MBT.
Conglomerate bed,alluvium >30m,founded onconglomerate bed of>30m.
Sandstone, siltstone,mudstone slate,quartzite, dolomite,dolomitic quartziteexpected. MBT crossesreservoir.
Siwaliks 130 30km,M4-5,
N
W-25 Naumure (W.Rapti)
Middle Siwaliks, ofSiwalik group
Siwaliks Mid-Miocene-Pleistocene
Sandstone interbedded withclay, shales, conglomerates,mudstone.
MBT 1km north none moderate
MBT and 2 parallel faultspass reservoir. PaleozoicMetasedimentary rocksnorth, Siwaliks south ofMBT.
Middle Siwaliks sedimentary rocks ofsandstone, shale, conglomerate, mudstone etc.Damsite mainly sandstone with mudstone,shales. Sandstone is thick medium strong. Nomajor faults observed but many shear zones areseen in mudstone and siltstone beds.Weathering to sound rock is 10-40m.
Mostly of weakerrocks as mudstone,shale, siltstone, andless sandstone.
MBT and 2 parallelfaults pass reservoirPaleozoicmetasedimentary rocksnorth, Siwaliks south ofMBT.
Siwaliks 130 40km,M4-5,
NE
W-26 Lohare Khola(Lohore Khola)
Ranimatta formation, ofLakharpata sub-group,Midland group
LH Upper Cambrian-latePaleozoic
Phyllites, phyllitic quartzite,metasandstones, conglomeratebeds
MBT 9km SW none moderate
Left bank very steep. V shape valley. Phylliticrock.
UG recommendeddue to deep creekand steep slope.
Flood deposit, terracedeposit. Colluvials, andmetasediment ofphyllite, quartzite,gneiss. MCT passesacross reservoirrequiring water tightnessstudy.
LH 260 13km,M4-5,
NE
W-27 Nisti-Panah Benighat Slate LH PreCambrian Slate with limestone andquartzite band
MBT, 35km SW none moderate
Option1/Phyllites with quartz veins.Option2/Phyllites, quartzitic phyllites.Option3/similar to option 2 (presumably)
Option1/ terracedeposits.Option2/slate.
LH 240 13km,M4-5,NW
Final Report Appendix 3 SEA Report
61
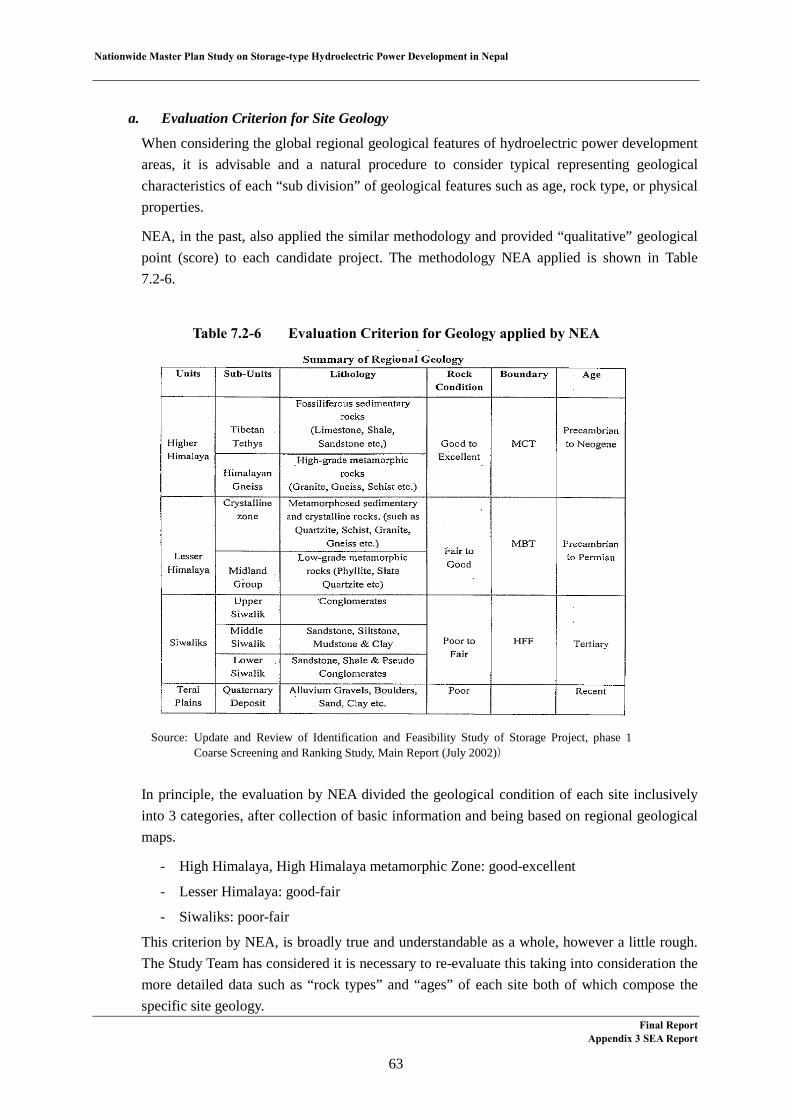
Nationwide Master Plan Study on Storage-type Hydroelectric Power Development in Nepal
a. Evaluation Criterion for Site Geology
When considering the global regional geological features of hydroelectric power development areas, it is advisable and a natural procedure to consider typical representing geological characteristics of each “sub division” of geological features such as age, rock type, or physical properties.
NEA, in the past, also applied the similar methodology and provided “qualitative” geological point (score) to each candidate project. The methodology NEA applied is shown in Table 7.2-6.
Table 7.2-6 Evaluation Criterion for Geology applied by NEA
Source: Update and Review of Identification and Feasibility Study of Storage Project, phase 1 Coarse Screening and Ranking Study, Main Report (July 2002))
In principle, the evaluation by NEA divided the geological condition of each site inclusively into 3 categories, after collection of basic information and being based on regional geological maps.
- High Himalaya, High Himalaya metamorphic Zone: good-excellent
- Lesser Himalaya: good-fair
- Siwaliks: poor-fair
This criterion by NEA, is broadly true and understandable as a whole, however a little rough. The Study Team has considered it is necessary to re-evaluate this taking into consideration the more detailed data such as “rock types” and “ages” of each site both of which compose the specific site geology.
Final ReportAppendix 3 SEA Report
63
Nationwide Master Plan Study on Storage-type Hydroelectric Power Development in Nepal
After collecting various geological data on all candidate sites, the Study Team has come to apply “matrix” evaluation criterion for “Geological conditions of the site” shown below, after the discussion with NEA. The both parties discussed this based on the actual geologic and seismic dataset of the whole project sites. In other words, this criterion matrix is the outcome after it has been “tuned” so that the both parties have agreed upon.
For instance, there is a case that the criterion was revised after the discussion. Initially “limestone” was put inferior “point” as it was generally interpreted as one of problematic rocks. However, it has been suggested that a certain limestone in Nepal is less problematic when it is being “Siliceous dolomite- limestone.” The evaluation matrix has been revised accordingly.
The details of the Evaluation Criterion on Site Geology are described as below.
(a) Criterion of “Age” and “Rock type”
Based on the concept above, The “Matrix” on Table 7.2-7 has been proposed and applied.
The idea is to represent the general feature of the site geology by the combination (Matrix) of “Age” and “Rock type” thus representing the qualitative evaluation scores (ranks) for each site in terms of, from the perspective of the “general geologic feature.”
(b) Modification (Subtraction of points) by “Landslides” or “Mines in operations”
i) Landslides
As landslides in reservoir or dam axes have negative impacts from safety points of view as well as it may bring potential increases of development cost. The Comparative and relative “screening” on landslides considering their scales, as well as their activities must be conducted. Risks by landslides when noted will be valued as subtraction of “20 point” from above (a) Criterion Matrix.
ii) Mines in Operations
The impacts of natural resource developments nearby on the potential planning (planned) sites of hydroelectric power are not geological issues but rather, they have much more political aspects of Nepal government’s capabilities of coordination between two contradicting parties.
Naturally the individual elements of such mining activities for all potential sites must be considered to evaluate any impact from such activities. However, in this study, the conditions of having mining activities or development plans nearby is classified as equally “disadvantageous” and is valued subtraction “20 point”.
Thus, the modification is:
Final Report Appendix 3 SEA Report
64
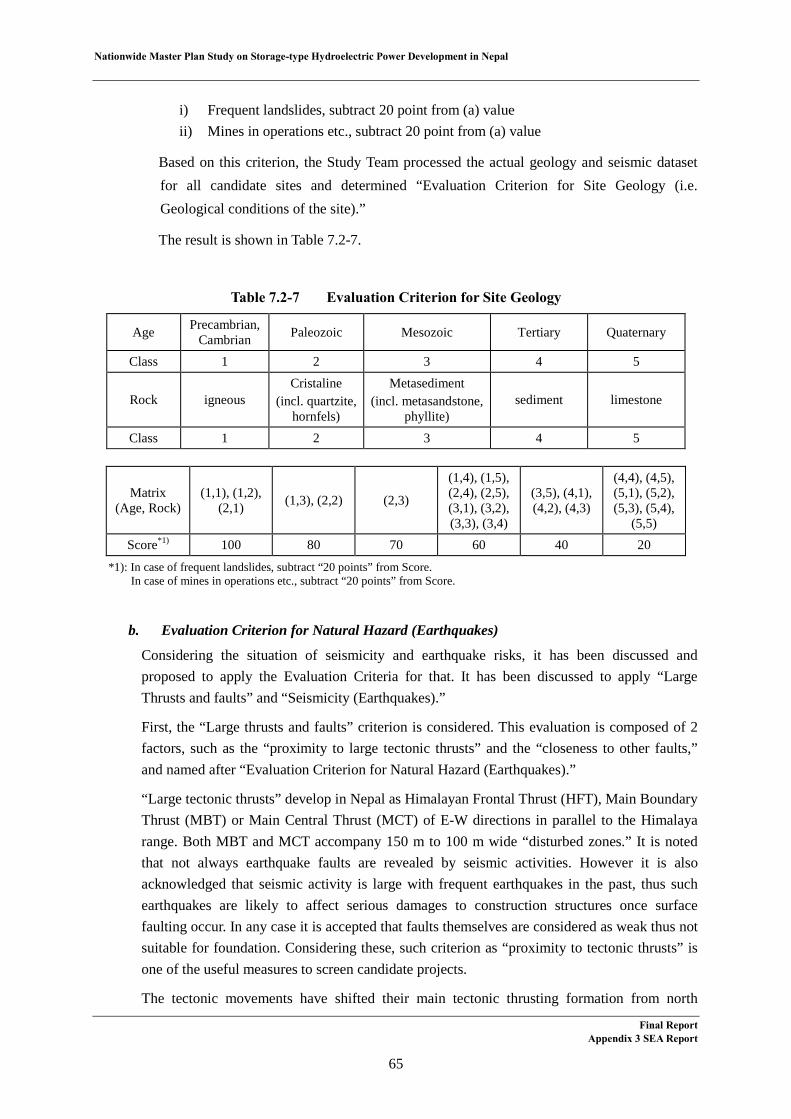
Nationwide Master Plan Study on Storage-type Hydroelectric Power Development in Nepal
i) Frequent landslides, subtract 20 point from (a) value ii) Mines in operations etc., subtract 20 point from (a) value
Based on this criterion, the Study Team processed the actual geology and seismic dataset for all candidate sites and determined “Evaluation Criterion for Site Geology (i.e. Geological conditions of the site).”
The result is shown in Table 7.2-7.
Table 7.2-7 Evaluation Criterion for Site Geology
Age Precambrian, Cambrian Paleozoic Mesozoic Tertiary Quaternary
Class 1 2 3 4 5
Rock igneous Cristaline
(incl. quartzite, hornfels)
Metasediment (incl. metasandstone,
phyllite) sediment limestone
Class 1 2 3 4 5
Matrix (Age, Rock)
(1,1), (1,2), (2,1) (1,3), (2,2) (2,3)
(1,4), (1,5), (2,4), (2,5), (3,1), (3,2), (3,3), (3,4)
(3,5), (4,1), (4,2), (4,3)
(4,4), (4,5), (5,1), (5,2), (5,3), (5,4),
(5,5) Score*1) 100 80 70 60 40 20
*1): In case of frequent landslides, subtract “20 points” from Score. In case of mines in operations etc., subtract “20 points” from Score.
b. Evaluation Criterion for Natural Hazard (Earthquakes)
Considering the situation of seismicity and earthquake risks, it has been discussed and proposed to apply the Evaluation Criteria for that. It has been discussed to apply “Large Thrusts and faults” and “Seismicity (Earthquakes).”
First, the “Large thrusts and faults” criterion is considered. This evaluation is composed of 2 factors, such as the “proximity to large tectonic thrusts” and the “closeness to other faults,” and named after “Evaluation Criterion for Natural Hazard (Earthquakes).”
“Large tectonic thrusts” develop in Nepal as Himalayan Frontal Thrust (HFT), Main Boundary Thrust (MBT) or Main Central Thrust (MCT) of E-W directions in parallel to the Himalaya range. Both MBT and MCT accompany 150 m to 100 m wide “disturbed zones.” It is noted that not always earthquake faults are revealed by seismic activities. However it is also acknowledged that seismic activity is large with frequent earthquakes in the past, thus such earthquakes are likely to affect serious damages to construction structures once surface faulting occur. In any case it is accepted that faults themselves are considered as weak thus not suitable for foundation. Considering these, such criterion as “proximity to tectonic thrusts” is one of the useful measures to screen candidate projects.
The tectonic movements have shifted their main tectonic thrusting formation from north
Final Report Appendix 3 SEA Report
65

Nationwide Master Plan Study on Storage-type Hydroelectric Power Development in Nepal
toward south, thus at present MBT can be more active causing large earthquakes over M8 than MCT which was once active in earlier stages of Himalayan orogenic movement. This indicates MCT and MBT are at present not equal in their effects. However, in considering the purpose of “screening” projects, the closeness to such tectonic thrusts (or accompanying faults) was decided to be evaluated equally.
It is also necessary to collect and evaluate risks of such faults other than large tectonic thrusts in general. Figure 7.2-3 shows the example of such faults map.
Source: Detailed mapping on active fault in developing region and its significance: A case study of Nepal, 2005.
Figure 7.2-3 Example of Active Faults in Nepal
However, after collection of such data, it was found there were no such compiled data like “Active Faults of Japan” in Nepal, although Nepal has suffered many earthquakes and bears many faults till present. Thus, it is concluded that evaluation of “activeness” for such faults are not to be conducted, but that the “closeness to those faults” are to be used.
The evaluation value for “Natural Hazard (Earthquake)” is determined as a sum of points for “proximity to tectonic thrusts” and the points for “closeness to other faults” shown below.
As an agreed methodology, the “threshold” used for the proximity to tectonic thrusts (in Table 7.2-8) is decided from the distribution of actual data from the actual geologic and seismic dataset for all the project sites (Figure 7.2-4). “Threshold” used for closeness to other faults shown inTable 7.2-9 is decided through the discussions with NEA.
Final Report Appendix 3 SEA Report
66

Nationwide Master Plan Study on Storage-type Hydroelectric Power Development in Nepal
Table 7.2-8 Evaluation Criterion for Proximity to Large Tectonic Thrusts
Distance Score > 12.8 km 5 < 12.8 km 3 < 3.2 km 1 < 1.6 km 0
Figure 7.2-4 Actual Distribution of Proximity to Large Tectonic Thrusts
for all Project Sites
Table 7.2-9 Closeness to Other Faults
Distance Score > 1 km 0 < 1 km -1
< 100 m -2
Based on this criterion, the Study Team processed the actual geology and seismic dataset for all candidate sites (Table 7.2-5) and determined “Evaluation Criterion for Natural Hazard (Earthquakes),” i.e., the criterion on the proximity and closeness to large tectonic thrusts and faults.
The result is shown in Table 7.2-10.
Table 7.2-10 Evaluation Criterion for Natural Hazard (Earthquakes)
Distance to large tectonic thrusts > 12.8 km 12.8 km >
> 3.2 km 3.2 km > > 1.6 km 1.6 km >
Score*1) 100 60 20 0
*1): In case of the closeness to other faults < 1 km, subtract 20. In case of the closeness < 100 m, subtract 40.
0
5
10
15
20
25
30
0.2 0.4 0.8 1.6 3.2 6.4 12.8
25.6
51.210
2.4
proximity (km)
freq
uenc
y
0%
20%
40%
60%
80%
100%
Threshold
1 2 3
Final Report Appendix 3 SEA Report
67
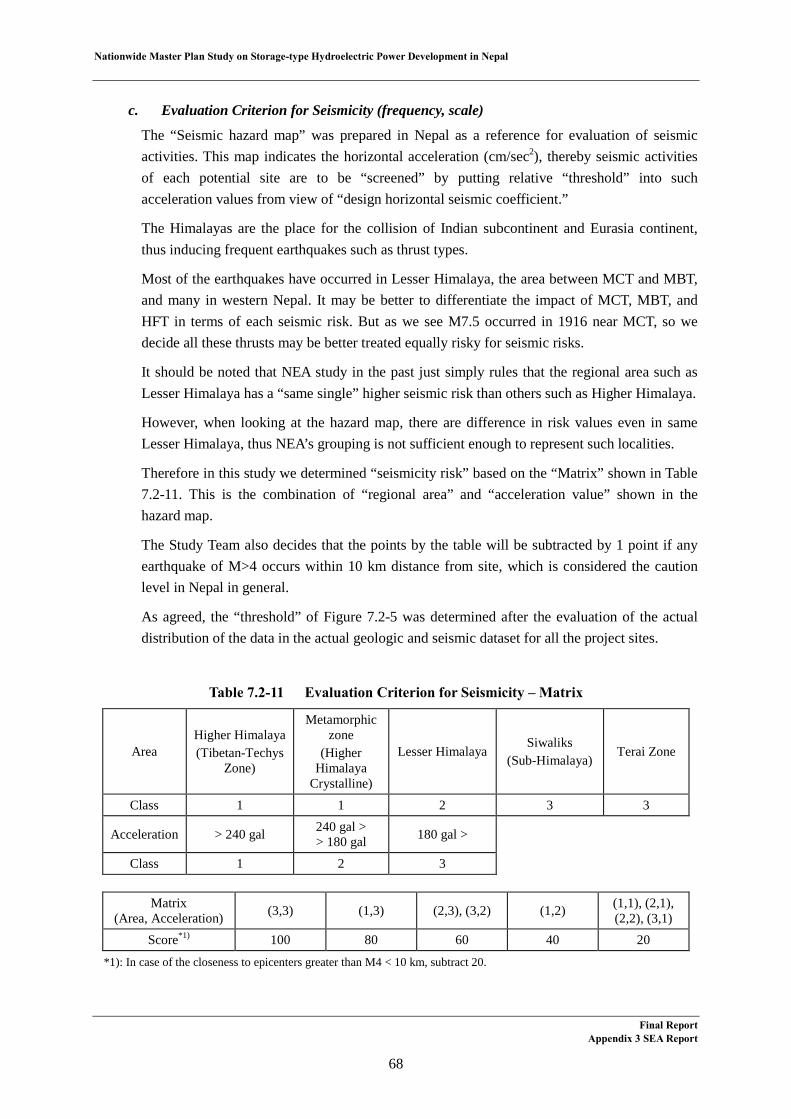
Nationwide Master Plan Study on Storage-type Hydroelectric Power Development in Nepal
c. Evaluation Criterion for Seismicity (frequency, scale)
The “Seismic hazard map” was prepared in Nepal as a reference for evaluation of seismic activities. This map indicates the horizontal acceleration (cm/sec2), thereby seismic activities of each potential site are to be “screened” by putting relative “threshold” into such acceleration values from view of “design horizontal seismic coefficient.”
The Himalayas are the place for the collision of Indian subcontinent and Eurasia continent, thus inducing frequent earthquakes such as thrust types.
Most of the earthquakes have occurred in Lesser Himalaya, the area between MCT and MBT, and many in western Nepal. It may be better to differentiate the impact of MCT, MBT, and HFT in terms of each seismic risk. But as we see M7.5 occurred in 1916 near MCT, so we decide all these thrusts may be better treated equally risky for seismic risks.
It should be noted that NEA study in the past just simply rules that the regional area such as Lesser Himalaya has a “same single” higher seismic risk than others such as Higher Himalaya.
However, when looking at the hazard map, there are difference in risk values even in same Lesser Himalaya, thus NEA’s grouping is not sufficient enough to represent such localities.
Therefore in this study we determined “seismicity risk” based on the “Matrix” shown in Table 7.2-11. This is the combination of “regional area” and “acceleration value” shown in the hazard map.
The Study Team also decides that the points by the table will be subtracted by 1 point if any earthquake of M>4 occurs within 10 km distance from site, which is considered the caution level in Nepal in general.
As agreed, the “threshold” of Figure 7.2-5 was determined after the evaluation of the actual distribution of the data in the actual geologic and seismic dataset for all the project sites.
Table 7.2-11 Evaluation Criterion for Seismicity – Matrix
Area Higher Himalaya (Tibetan-Techys
Zone)
Metamorphic zone
(Higher Himalaya
Crystalline)
Lesser Himalaya Siwaliks
(Sub-Himalaya) Terai Zone
Class 1 1 2 3 3
Acceleration > 240 gal 240 gal > > 180 gal 180 gal >
Class 1 2 3
Matrix (Area, Acceleration) (3,3) (1,3) (2,3), (3,2) (1,2) (1,1), (2,1),
(2,2), (3,1) Score*1) 100 80 60 40 20
*1): In case of the closeness to epicenters greater than M4 < 10 km, subtract 20.
Final Report Appendix 3 SEA Report
68

Nationwide Master Plan Study on Storage-type Hydroelectric Power Development in Nepal
Figure 7.2-5 Actual Distribution of Acceleration for All Project Sites
All the outcome and result using these three criteria are compiled in Figure 7.2-6.
Source: based on the simple summation of all three criteria with equal weight.
Figure 7.2-6 Geology Evaluation Outcome from All three Criteria for All Project Sites
The discussion with NEA has concluded that the results above, in general, bear no problem. However, we found several issues to be solved so it is advisable to note such issues as below for the next stage.
- Incompleteness of geological maps
- Unavailability of aerophotographs (Lack of landslides data)
It is also noted each “weighted percentage” for “Site Geology,” “Natural Hazard (Earthquakes)” and “Seismicity” is defined by the Study Team as discussed later. This is basically rooted upon the stakeholders, NEA, etc. But the weighted ratio is the present evaluation value and is
02468
1012141618
60 120
180
240
300
360
420
acceleration (mgal)
frequ
ency
0%
20%
40%
60%
80%
100%
120%
0
50
100
150
200
250
Dudh K
oshi
Dukh K
oshi-
2
Dukh K
oshi-
3
Dukh K
oshi-
4Khim
ti
Kokha
jor-1
Likhu
-1
Mulgha
t
Piluwa-2Ros
i-2
Sankhu
wa-1
Tama K
oshi-3
Tamor
No.1
Tamor
(Terah
athum)
Sun ko
shi N
o.1
Sun ko
shi N
o.2
Sun ko
shi N
o.3, K
osi M
P (Multi
purpo
se)
Sun ko
shi N
o.3, K
osi M
P
Sun ko
shi N
o.3
Indraw
ati
Kankai
Kaligand
aki-M
odi
Lower
Badigad
Lower
Daraud
i
Seti-Tr
isuli (
FS)
Upper
Daraud
i
Kaligand
aki-2
Budhi G
anda
ki
Andhi K
hola
Lang
rang Kho
la
Uttar G
anga
Madi- I
shanesh
or
Kali Gan
daki N
o.1
Marsyan
gdi
Seti (G
anda
ki)
Dev Gha
t
Bhomich
ok
Trishulg
anga
Ridi Kho
la
Bagmati
Multipo
rpose
Barbun
g Kho
la
Chera-
1
Chera-
2
Humla-
Karnali
Lower
JhimrukMad
i
Mugu Karn
ali
Sani B
hari - 1
Sani B
hari - 2
Sharad
a - 2
Thuli G
ad - 2Tila
- 1
Tila - 3
Thuli G
adLR
-1BR-3BBR-4
Surkhe
t
Laka
rpata
Bhana
kot
Thapn
aSR-6
Nalsya
gu G
ad
Sarada
Babai
Naumure
(W. R
apti)
Loha
re Kho
la (Loho
re Khola)
Nisti-Pana
h
Score
Threshold
1 2
Final Report Appendix 3 SEA Report
69
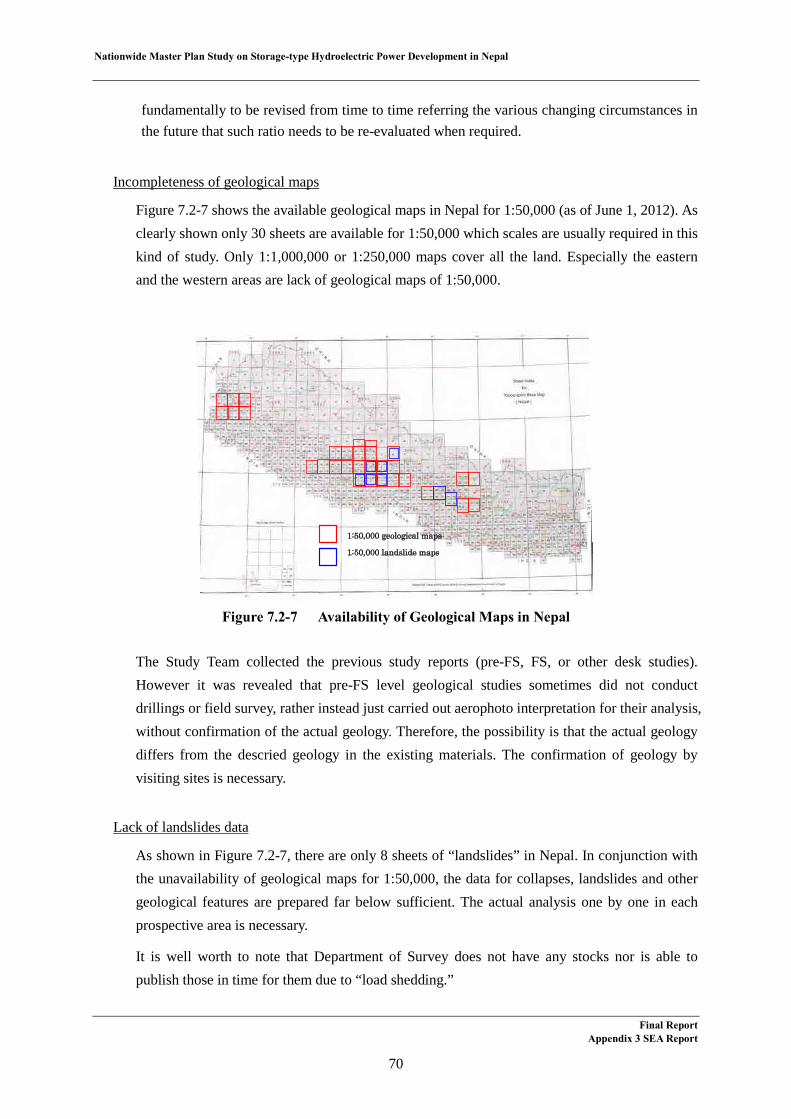
Nationwide Master Plan Study on Storage-type Hydroelectric Power Development in Nepal
fundamentally to be revised from time to time referring the various changing circumstances in the future that such ratio needs to be re-evaluated when required.
Incompleteness of geological maps
Figure 7.2-7 shows the available geological maps in Nepal for 1:50,000 (as of June 1, 2012). As clearly shown only 30 sheets are available for 1:50,000 which scales are usually required in this kind of study. Only 1:1,000,000 or 1:250,000 maps cover all the land. Especially the eastern and the western areas are lack of geological maps of 1:50,000.
Figure 7.2-7 Availability of Geological Maps in Nepal
The Study Team collected the previous study reports (pre-FS, FS, or other desk studies). However it was revealed that pre-FS level geological studies sometimes did not conduct drillings or field survey, rather instead just carried out aerophoto interpretation for their analysis, without confirmation of the actual geology. Therefore, the possibility is that the actual geology differs from the descried geology in the existing materials. The confirmation of geology by visiting sites is necessary.
Lack of landslides data
As shown in Figure 7.2-7, there are only 8 sheets of “landslides” in Nepal. In conjunction with the unavailability of geological maps for 1:50,000, the data for collapses, landslides and other geological features are prepared far below sufficient. The actual analysis one by one in each prospective area is necessary.
It is well worth to note that Department of Survey does not have any stocks nor is able to publish those in time for them due to “load shedding.”
1:50,000 geological maps
1:50,000 landslide maps
Final ReportAppendix 3 SEA Report
70

Nationwide Master Plan Study on Storage-type Hydroelectric Power Development in Nepal
3) Lead Time
a. Length of Access Road
The length of access road newly to be built for a project could influence at its construction period significantly. The length of access road for each project was extracted from the existing study. In case that no information was found in the study, the length from a major road to project site was measured on a topographical map. All the data were compared relatively. Evaluation points were prorated between 100 points set as the minimum length of 0 km and 0 points set as the maximum length of 65 km. (See Table 7.2-12)
Table 7.2-12 Evaluation Criterion for Length of Access Road
Length of access road (km) 0 (Min.) 0 - 65 65 (Max.)
Score (points) 100 Linear interpolation 0
b. Difficulty level of financing
In general, the larger project requires the higher cost as well as the longer construction period. It takes longer time for financing for such project. Therefore, the difficulty level of financing could be estimated with the cost of each project. The cost of each project estimated in the existing study at the various point of time was adjusted to the present cost in consideration to price escalation, and compared relatively. Evaluation points were allocated between 100 points set as the minimum project cost of 173.8 million US$ and 0 points set as the maximum project cost of 1,728.8 million US$ on quadratic interpolation in consultation with NEA. (See Table 7.2-13)
Table 7.2-13 Evaluation Criterion for Difficulty Level of Financing
Project Cost (MUS$) 173.8 (Min.) 173.8 - 1,728.8 1,728.8 (Max.) Score (points) 100 Quadratic interpolation 0
c. Reliability of Development Plan
In general, the more advanced study level a project has, the higher reliability the project has. Therefore, the reliability of develop plan was to be evaluated with study level of each project. The portions of study levels of 65 potential projects in the long list provided by NEA are as shown in Table 7.2-14.
Table 7.2-14 Study Level of Candidate Projects on the Long List
Study Level Number of Projects Desk Study 54 Pre-Feasibility Study 4 Feasibility Study 7
Final Report Appendix 3 SEA Report
71
Nationwide Master Plan Study on Storage-type Hydroelectric Power Development in Nepal
The difference about the geological information on each above-mentioned study level is classified in the long list as follows:
- Desk Study: Based on regional maps and other relevant information without a site visit
- Prefeasibility Study: Geological mapping with site visit
- Feasibility Study: with drilling and seismic and construction material survey
With reference to the classification of study levels in the long list, all projects were classified into 6 categories depending on the study level considering the all collected information related to the studies for the projects. (See Table 7.2-15)
Table 7.2-15 Classification of Study Level for Evaluation of Reliability
Study Level Application FS completed Feasibility Study has been completed. FS on going* Feasibility Study is ongoing. Pre-FS Pre-Feasibility Study has been completed.
Preliminary Study Additional investigations such as site reconnaissance, etc. have been conducted after desk study.
Desk Study Desk study has been conducted. Desk Study (few data) Few data is available though Desk study has been conducted.
*: Only the Nalsyau Gad Project is on this study level. See Clause 10.1.3 (1).
In general, a Feasibility Study is conducted to objectively determine the viability of the project from the standpoint of technical, economic, financial, and social and natural environment. A Feasibility Study report is used for the nations’ policy makers to determine whether to implement the project. It is also used for international financial institutions to examine and determine the viability of the project. Pre-Feasibility Study is classified as Feasibility Study of which accuracy is beyond the required level to achieve above-mentioned purpose. The Desk Study is defined as a study conducted on available topographical maps without site survey. Further, a study for which additional survey such as site reconnaissance, etc. were conducted after Desk Study prior to conduct Pre-Feasibility Study is defined as Preliminary Study.
Evaluation points were prorated between 100 points set as the highest study level of FS completed and 0 points set as the lowest study level of Desk study (few data) depending on study levels as shown in Table 7.2-16.
Table 7.2-16 Evaluation Criterion for Reliability of Development Plan
Study Level FS completed FS on going Pre-FS Preliminary
Study Desk Study Desk Study (few data)
Score 100 80 60 40 20 0
The projects for which feasibility study or pre-feasibility study were conducted at the time of this study were excluded from the evaluation.
Final Report Appendix 3 SEA Report
72
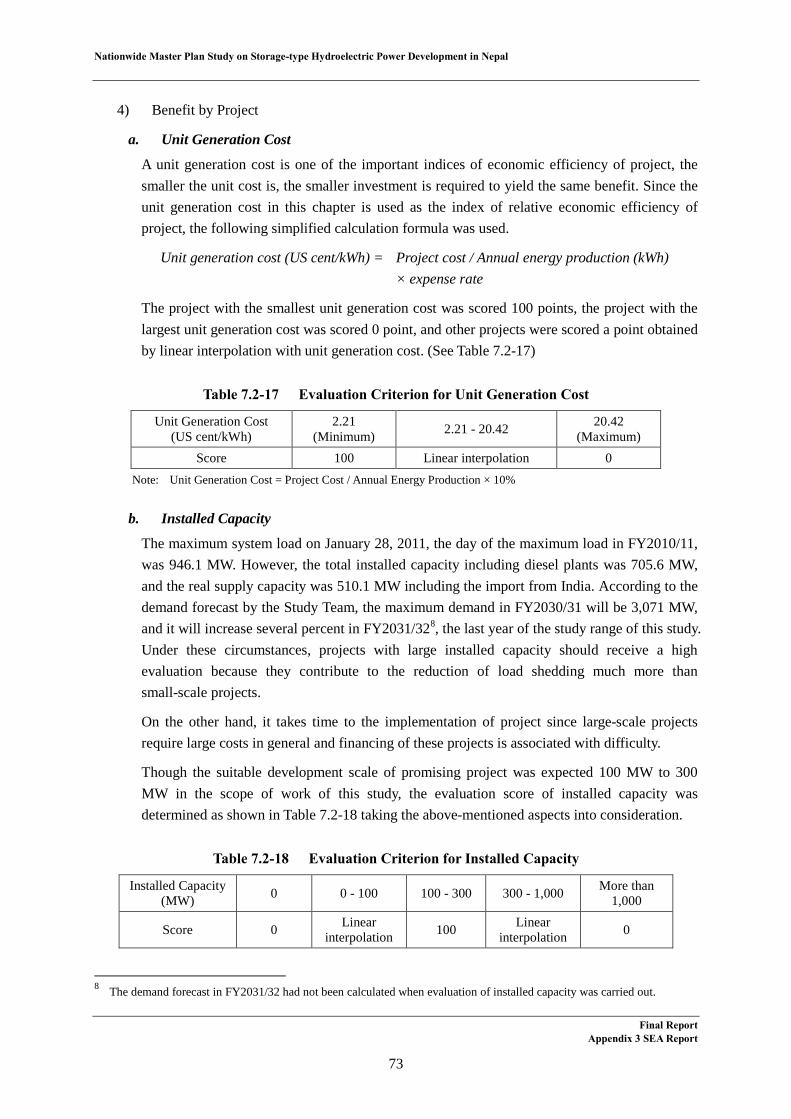
Nationwide Master Plan Study on Storage-type Hydroelectric Power Development in Nepal
4) Benefit by Project
a. Unit Generation Cost
A unit generation cost is one of the important indices of economic efficiency of project, the smaller the unit cost is, the smaller investment is required to yield the same benefit. Since the unit generation cost in this chapter is used as the index of relative economic efficiency of project, the following simplified calculation formula was used.
Unit generation cost (US cent/kWh) = Project cost / Annual energy production (kWh) × expense rate
The project with the smallest unit generation cost was scored 100 points, the project with the largest unit generation cost was scored 0 point, and other projects were scored a point obtained by linear interpolation with unit generation cost. (See Table 7.2-17)
Table 7.2-17 Evaluation Criterion for Unit Generation Cost
Unit Generation Cost (US cent/kWh)
2.21 (Minimum) 2.21 - 20.42 20.42
(Maximum) Score 100 Linear interpolation 0
Note: Unit Generation Cost = Project Cost / Annual Energy Production × 10%
b. Installed Capacity
The maximum system load on January 28, 2011, the day of the maximum load in FY2010/11, was 946.1 MW. However, the total installed capacity including diesel plants was 705.6 MW, and the real supply capacity was 510.1 MW including the import from India. According to the demand forecast by the Study Team, the maximum demand in FY2030/31 will be 3,071 MW, and it will increase several percent in FY2031/328, the last year of the study range of this study. Under these circumstances, projects with large installed capacity should receive a high evaluation because they contribute to the reduction of load shedding much more than small-scale projects.
On the other hand, it takes time to the implementation of project since large-scale projects require large costs in general and financing of these projects is associated with difficulty.
Though the suitable development scale of promising project was expected 100 MW to 300 MW in the scope of work of this study, the evaluation score of installed capacity was determined as shown in Table 7.2-18 taking the above-mentioned aspects into consideration.
Table 7.2-18 Evaluation Criterion for Installed Capacity
Installed Capacity (MW) 0 0 - 100 100 - 300 300 - 1,000 More than
1,000
Score 0 Linear interpolation 100 Linear
interpolation 0
8 The demand forecast in FY2031/32 had not been calculated when evaluation of installed capacity was carried out.
Final Report Appendix 3 SEA Report
73

Nationwide Master Plan Study on Storage-type Hydroelectric Power Development in Nepal
c. Annual Energy Production
Same as installed capacity, annual energy production also indicates a project scale. The annual energy production of each project is described in the existing report of each project. However, since calculation conditions may be different project by project, the Study Team calculated the annual energy productions of all candidate projects with same calculation conditions.
In general, projects with large energy production are more preferable than those with smaller energy production. On the other hand, these projects have a tendency of having large installed capacity, and in some cases this may be contradictory to the evaluation of installed capacity described in the above. To avoid this contradiction, the score was determined that it linearly proportionate to annual energy production until 2,000 GWh and a constant value, the perfect score, for more than 2,000 GWh. (See Table 7.2-19)
Table 7.2-19 Evaluation Criterion for Annual Energy Production
Annual Energy Production (GWh) 0 0 - 2,000 More than 2,000
Score 0 Linear interpolation 100 Note: “2,000 GWh” is about 1.5 times of the average of annual energy production of all candidate projects.
d. Energy Production in Dry Season
One of the important roles of storage-type hydroelectric power project is energy production in the dry season. Same as the above-mentioned evaluation of annual energy production, the score was determined that it linearly proportionate to energy production until 850 GWh, the perfect score for more than that. (See Table 7.2-20)
Table 7.2-20 Evaluation Criterion for Energy Production in the Dry Season
Energy Production in Dry Season (GWh) 0 0 - 850 More than 850
Score 0 Linear interpolation 100 Note: “850 GWh” is about 1.5 times of the average of energy production in the dry season of the all projects.
5) Natural Environment
a. Impact on Forest Area
Impact on the forest area is evaluated by the size of the affected forest area per unit output. Evaluation points are given by the value obtained by the following calculation (forest area inside of reservoir area / energy production of power station), 0 point for the maximum value (11.24 ha/MW), 100 points for the minimum value (0.10 ha/MW) and between them, the evaluation points are given by proportional distribution. In case many small projects are developed, the total lost forest area may be larger than the lost forest area by one project with large project area. Therefore, affected area per unit output is used for evaluation in order to minimize the total lost forest area to meet the demand. (See Table 7.2-21)
Final Report Appendix 3 SEA Report
74

Nationwide Master Plan Study on Storage-type Hydroelectric Power Development in Nepal
Table 7.2-21 Evaluation Criterion for Impact on the Forest Area
Inundated Forest Area (ha/MW) 0.10 (Min) 0.10 - 11.24 11.24 (Max)
Score 100 Linear interpolation 0
b. Impact on Protected Area
The impact on the protected area is evaluated by the direct or indirect impact of reservoir area for the six protected areas described in Table 7.2-22. In downstream of reservoir area, according to the operation of reservoir, the flow rate may be increased in dry season and reduced during the rainy season. To account for this effect, one point is given for each category if the World Heritage, National Park including its buffer zone, Wildlife Reserve, Ramsar Convention or Key Biodiversity Area is located in the downstream of reservoir area. If the Key Biodiversity Area or one part of this area is located in the reservoir area, it counts 2 points. The total score of each project is the sum of the points of each category, the highest score is 3 and the lowest score is 0. Regarding these scores, the evaluation points are given for each project, 0 evaluation point for score of 3, 100 evaluation points for score of 0 and between them, the evaluation points are given by proportional distribution. (See Table 7.2-23)
Table 7.2-22 Points for the Impact on Protected Area
Category Description Point a) World Heritage Indirect impact (located downstream of the reservoir) 1 b) National Park - ditto - 1 c) Ditto (Buffer zone) - ditto - 1 d) Wildlife Reserve - ditto - 1 e) Ramsar Convention - ditto - 1 f) Key Biodiversity Area Direct impact (located in the reservoir area) 2
Note: Candidate projects which have direct impact on a) to e) have been already excluded.
Table 7.2-23 Evaluation Criterion for Impact on Protected Area
Total Point 0 0 - 3 3 Score 100 Linear interpolation 0
c. Impact on Fishes
The impact on fishes is evaluated by the impact to water system where the following 18 species in Table 7.2-24 nominated in the IUCN Red List are living. The number of inhabitant fish of each water system corresponds to the score of projects located in its water system, the highest score is 10 and the lowest score is 0. Regarding these scores, the evaluation points are given for each project, 0 evaluation point for score of 0, 100 evaluation points for score of 10 and between them, the evaluation points are given by proportional distribution. (See Table 7.2-25)
Final Report Appendix 3 SEA Report
75

Nationwide Master Plan Study on Storage-type Hydroelectric Power Development in Nepal
Table 7.2-24 List of Fishes used in the Evaluation
Scientific Name English Name Criteria Lake and River system9, 10 Schizothorax nepalensis Snow Trout CR Rara lake Schizothorax raraensis Rara Snowtrout CR Rara lake Himantura fluviatilis Ganges Stingray EN Clarias magur Wagur EN Kosi, Gandaki, Karnali, Mahakali, Tor putitora Putitor Mahseer EN Kosi, Gandaki, Karnali, Mahakali, Cyprinion semiplotum Assamese Kingfish VU Kosi, Gandaki, Karnali, Mahakali,
and their feeder streams Puntius chelynoides Dark mahseer VU Schizothorax richardsonii Snow Trout VU Kosi, Gandaki, Karnali, Mahakali,
and their feeder streams Carcharhinus leucas Bull Shark NT Ailia coila Gangetic ailia NT Bagarius bagarius NT Kosi, Gandaki, Karnali, Mahakali,
and their feeder streams Bagarius yarrelli NT Kosi, Gandaki, Karnali, Mahakali,
and their feeder streams Chitala chitala NT Kosi, Gandaki, Karnali, Mahakali,
and their feeder streams Labeo pangusia Pangusia labeo NT Kosi, Gandaki, Karnali, Mahakali,
and their feeder streams Neolissochilus hexagonolepis Katli NT Kosi, Gandaki, Karnali, Mahakali,
and their feeder streams Schistura devdevi NT Tor tor mahseer NT Kosi, Gandaki, Karnali, Mahakali,
Also in Phewa lake, Begnas lake Wallago attu NT Kosi, Gandaki, Karnali, Mahakali, Note: CR = Critically endangered, EN = Endangered, VU = Vulnerable, NT = Near threatened
Table 7.2-25 Evaluation Criterion for Impact on Fishes
Precious fish (species) 0 (Min) 0 - 10 10 (Max) Score 100 Linear interpolation 0
d. Impact on Conservation Species
The impact on conservation species is evaluated by the impact to the seven rare land species shown in Table 7.2-26 for which the distribution map are available. If there is overlap in the distribution of rare species and the reservoir area, point of five levels is given by the habitat density. Total score of each project is the sum of scores of every seven species, the highest score is 18 and the lowest score is 7. Regarding these scores, the evaluation points are given for each project, 0 evaluation point for the highest score of 18, 100 evaluation points for the lowest score of 7 and between them, the evaluation points are given by proportional distribution. (See Table 7.2-27)
9 Coldwater fisheries in the trans-Himalayan countries (FAO, 2002) 10 Coldwater Fish and Fisheries in Nepal (Jiwan Shrestha)
Final Report Appendix 3 SEA Report
76

Nationwide Master Plan Study on Storage-type Hydroelectric Power Development in Nepal
Table 7.2-26 List of Species and Points for Impact on Conservation Species
Conservation species Point
Panthera tigris (EN) No habitat Habitat
0 5
Lutra Lutra (NT) No habitat Habitat
0 5
Macaca assamensis (NT) No habitat Habitat
0 5
Panthera pardus (NT) No habitat (Low) ← Habitat density → (High)
0 1 2 4 5
Melursus ursinus (VU) No habitat (Low) ← Habitat density → (High)
0 1 2 5
Neofelis nebulosa (VU) No habitat Habitat
0 5
Ursus thibetanus (VU) No habitat (Low) ← Habitat density → (High)
0 1 2 4 5 Note: EN = Endangered, VU = Vulnerable, NT = Near threatened
Presence Code: 1 = The species is known or thought very likely to occur presently in the area, usually encompassing current or recent (post 1980) localities where suitable habitat at appropriate altitudes (or depths) remains. 2 = The species’ presence is considered probable, either based on extrapolations of known records, or realistic inferences (e.g., based on distribution of suitable habitat at appropriate altitudes and proximity to areas where it is known or thought very likely to remain Extant). ‘Probably Extant’ ranges often extend beyond areas where the species is Extant, or may fall between them. 3 = The species may possibly occur, and should be searched for, but there are no known records and less than probably occurrence. ‘Possibly Extant’ ranges often extend beyond areas where the species is Extant or Probably Extant, or may fall between them. 4 = The species was formerly known or thought very likely to occur in the area, but it is most likely now extirpated from the area because habitat loss/other threats are thought likely to have extirpated the species and/or owing to a lack of records in the last 30 years. 5 = The species was formerly known or thought very likely to occur in the area, but there have been no records in the last 30 years and it is almost certain that the species no longer occurs, and/or habitat loss/other threats have almost certainly extirpated the species. 6 = The species was formerly known or thought very likely to occur in the area but it is no longer known whether it still occurs (usually because there have been no recent surveys). (Source: IUCN 2012. IUCN Red List of Threatened Species. Version 2012.1.)
Table 7.2-27 Evaluation Criterion for Conservation Species
Total Pont of Habitat Density 7 (Min.) 7 - 18 18 (Max.) Score 100 Linear interpolation 0
6) Social Environment
a. Impact of Construction for Transmission Line to the Social Environment
As for the impact to the social environment by construction of new transmission line, longer transmission line has much influence to the scenery, acquisition of right of way and surrounding residents. Therefore, evaluation points were prorated between 100 points set as length of 30 km or less and 0 points set as length of 100 km or more. (See Table 7.2-28)
Table 7.2-28 Evaluation Criterion for Impact of Construction for Transmission Line
to the Social Environment
Length of Transmission Line (km) Less than 30 30 - 100 More than 100 Score 100 Linear interpolation 0
Note: Length to the nearest 400 kV substation
Final Report
Appendix 3 SEA Report
77
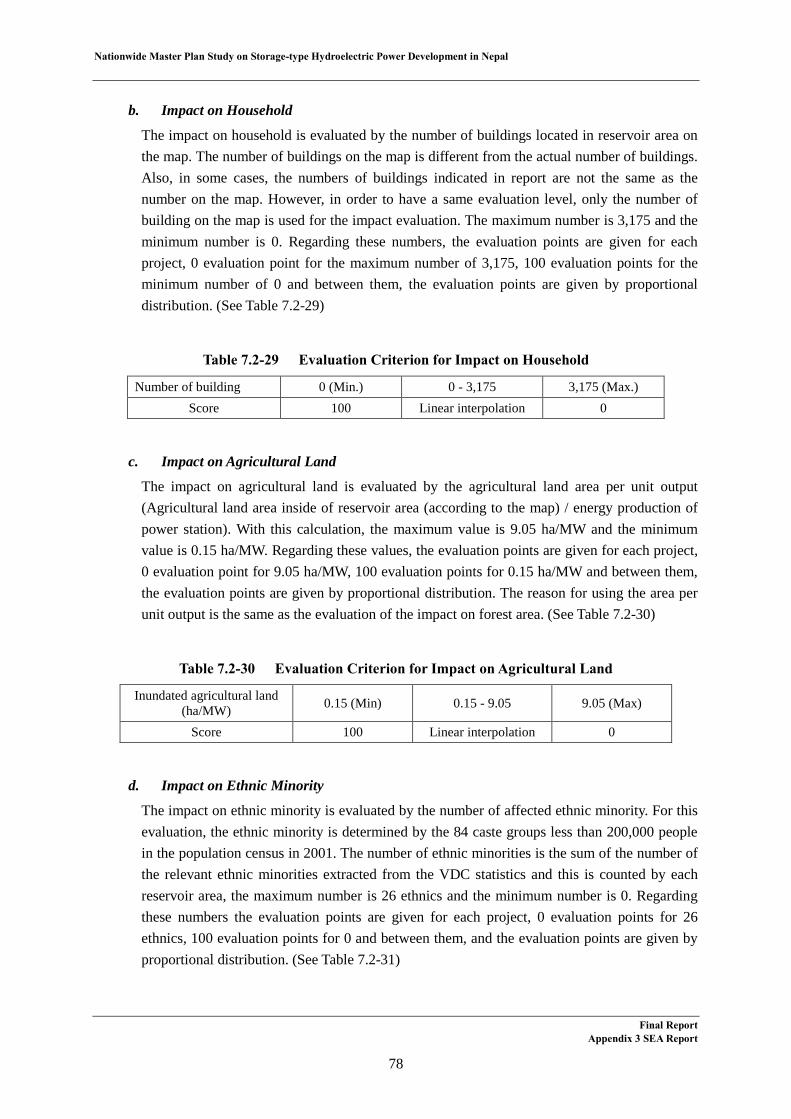
Nationwide Master Plan Study on Storage-type Hydroelectric Power Development in Nepal
b. Impact on Household
The impact on household is evaluated by the number of buildings located in reservoir area on the map. The number of buildings on the map is different from the actual number of buildings. Also, in some cases, the numbers of buildings indicated in report are not the same as the number on the map. However, in order to have a same evaluation level, only the number of building on the map is used for the impact evaluation. The maximum number is 3,175 and the minimum number is 0. Regarding these numbers, the evaluation points are given for each project, 0 evaluation point for the maximum number of 3,175, 100 evaluation points for the minimum number of 0 and between them, the evaluation points are given by proportional distribution. (See Table 7.2-29)
Table 7.2-29 Evaluation Criterion for Impact on Household
Number of building 0 (Min.) 0 - 3,175 3,175 (Max.) Score 100 Linear interpolation 0
c. Impact on Agricultural Land
The impact on agricultural land is evaluated by the agricultural land area per unit output (Agricultural land area inside of reservoir area (according to the map) / energy production of power station). With this calculation, the maximum value is 9.05 ha/MW and the minimum value is 0.15 ha/MW. Regarding these values, the evaluation points are given for each project, 0 evaluation point for 9.05 ha/MW, 100 evaluation points for 0.15 ha/MW and between them, the evaluation points are given by proportional distribution. The reason for using the area per unit output is the same as the evaluation of the impact on forest area. (See Table 7.2-30)
Table 7.2-30 Evaluation Criterion for Impact on Agricultural Land
Inundated agricultural land (ha/MW) 0.15 (Min) 0.15 - 9.05 9.05 (Max)
Score 100 Linear interpolation 0
d. Impact on Ethnic Minority
The impact on ethnic minority is evaluated by the number of affected ethnic minority. For this evaluation, the ethnic minority is determined by the 84 caste groups less than 200,000 people in the population census in 2001. The number of ethnic minorities is the sum of the number of the relevant ethnic minorities extracted from the VDC statistics and this is counted by each reservoir area, the maximum number is 26 ethnics and the minimum number is 0. Regarding these numbers the evaluation points are given for each project, 0 evaluation points for 26 ethnics, 100 evaluation points for 0 and between them, and the evaluation points are given by proportional distribution. (See Table 7.2-31)
Final Report Appendix 3 SEA Report
78
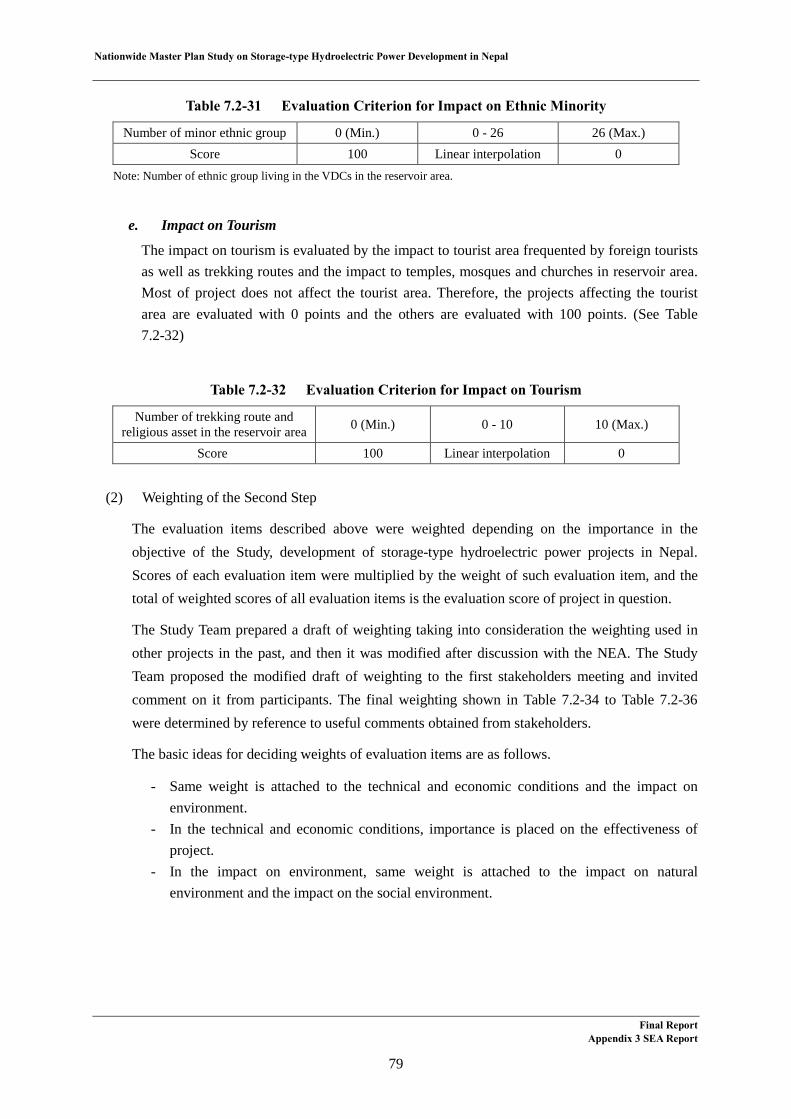
Nationwide Master Plan Study on Storage-type Hydroelectric Power Development in Nepal
Table 7.2-31 Evaluation Criterion for Impact on Ethnic Minority
Number of minor ethnic group 0 (Min.) 0 - 26 26 (Max.) Score 100 Linear interpolation 0
Note: Number of ethnic group living in the VDCs in the reservoir area.
e. Impact on Tourism
The impact on tourism is evaluated by the impact to tourist area frequented by foreign tourists as well as trekking routes and the impact to temples, mosques and churches in reservoir area. Most of project does not affect the tourist area. Therefore, the projects affecting the tourist area are evaluated with 0 points and the others are evaluated with 100 points. (See Table 7.2-32)
Table 7.2-32 Evaluation Criterion for Impact on Tourism
Number of trekking route and religious asset in the reservoir area 0 (Min.) 0 - 10 10 (Max.)
Score 100 Linear interpolation 0
(2) Weighting of the Second Step
The evaluation items described above were weighted depending on the importance in the objective of the Study, development of storage-type hydroelectric power projects in Nepal. Scores of each evaluation item were multiplied by the weight of such evaluation item, and the total of weighted scores of all evaluation items is the evaluation score of project in question.
The Study Team prepared a draft of weighting taking into consideration the weighting used in other projects in the past, and then it was modified after discussion with the NEA. The Study Team proposed the modified draft of weighting to the first stakeholders meeting and invited comment on it from participants. The final weighting shown in Table 7.2-34 to Table 7.2-36 were determined by reference to useful comments obtained from stakeholders.
The basic ideas for deciding weights of evaluation items are as follows.
- Same weight is attached to the technical and economic conditions and the impact on environment.
- In the technical and economic conditions, importance is placed on the effectiveness of project.
- In the impact on environment, same weight is attached to the impact on natural environment and the impact on the social environment.
Final Report Appendix 3 SEA Report
79

Nationwide Master Plan Study on Storage-type Hydroelectric Power Development in Nepal
Table 7.2-33 Evaluation Items and Weight at the Second Stage (Base Case)
Category % Subcategory % Evaluation Item % Point
Technical and Economical Conditions
50
Hydrological Conditions
25 Reliability of flow data 25 3.13 Risk of GLOF 40 5.00 Sedimentation 35 4.37
Geological Conditions 25 Seismicity 30 3.75 Geological conditions of the site 40 5.00 Natural hazard (earthquake) 30 3.75
Lead Time 20 Length of access road 25 2.50 Difficulty level of funding 35 3.50 Reliability of development plan 40 4.00
Effectiveness of Project
30
Unit generation cost 25 3.75 Installed capacity 20 3.00 Annual energy production 20 3.00 Energy production in the dry season 35 5.25
Impact on Environment
50
Impact on Natural Environment
50
Impact on forest 25 6.25 Impact on protected area 30 7.50 Impact on fishes 20 5.00 Impact on conservation species 25 6.25
Impact on Social Environment
50
Impact on locality by construction of transmission line
20 5.00
Impact on household 25 6.25 Impact on agriculture 20 5.00 Impact on ethnic minority 20 5.00 Impact on tourism 15 3.75
Total 100
In the first stake-holder meeting, some attendees made comments that the technical and economical conditions were more important than the impact on environment when the power condition of Nepal was considered. Taking these comments into consideration, two other cases of weighting were prepared, Case 1 that put more importance on the technical and economical conditions (60%) and Case 2 that put more importance on the impact on environment (60%), and effects of difference in weighting on evaluation result were studied.
Final Report Appendix 3 SEA Report
80
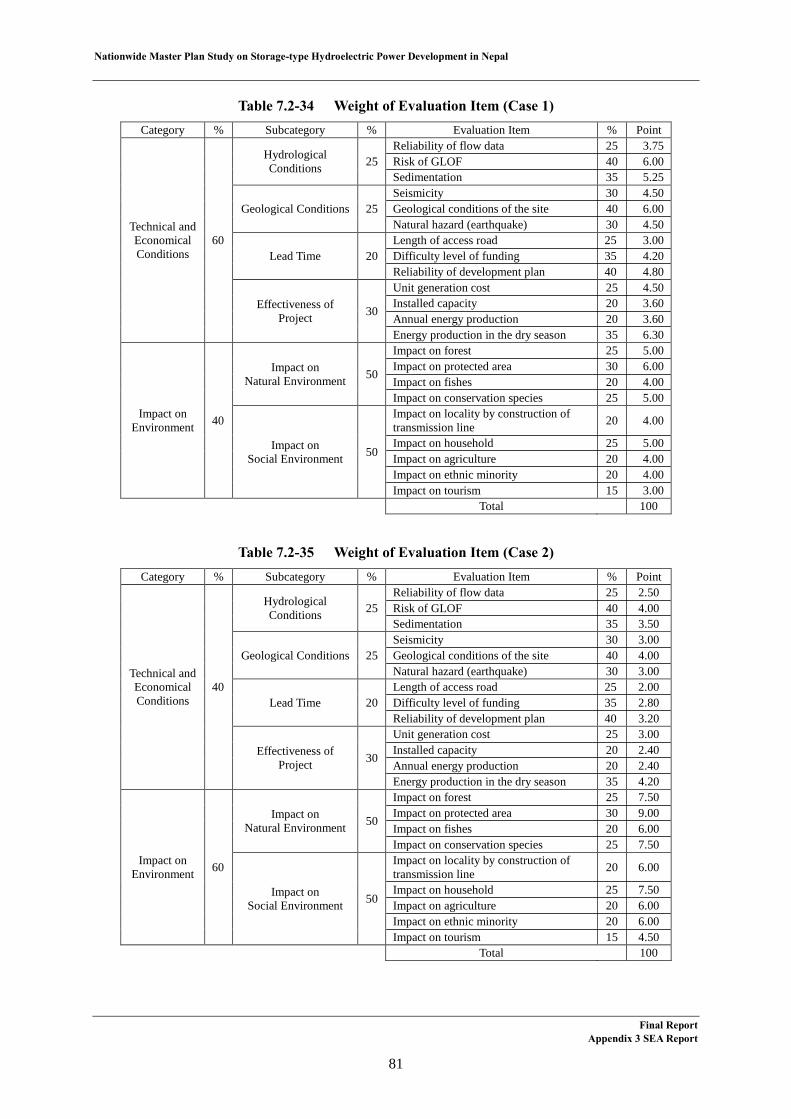
Nationwide Master Plan Study on Storage-type Hydroelectric Power Development in Nepal
Table 7.2-34 Weight of Evaluation Item (Case 1)
Category % Subcategory % Evaluation Item % Point
Technical and Economical Conditions
60
Hydrological Conditions 25
Reliability of flow data 25 3.75 Risk of GLOF 40 6.00 Sedimentation 35 5.25
Geological Conditions 25 Seismicity 30 4.50 Geological conditions of the site 40 6.00 Natural hazard (earthquake) 30 4.50
Lead Time 20 Length of access road 25 3.00 Difficulty level of funding 35 4.20 Reliability of development plan 40 4.80
Effectiveness of Project 30
Unit generation cost 25 4.50 Installed capacity 20 3.60 Annual energy production 20 3.60 Energy production in the dry season 35 6.30
Impact on Environment 40
Impact on Natural Environment 50
Impact on forest 25 5.00 Impact on protected area 30 6.00 Impact on fishes 20 4.00 Impact on conservation species 25 5.00
Impact on Social Environment 50
Impact on locality by construction of transmission line 20 4.00
Impact on household 25 5.00 Impact on agriculture 20 4.00 Impact on ethnic minority 20 4.00 Impact on tourism 15 3.00
Total 100
Table 7.2-35 Weight of Evaluation Item (Case 2) Category % Subcategory % Evaluation Item % Point
Technical and Economical Conditions
40
Hydrological Conditions 25
Reliability of flow data 25 2.50 Risk of GLOF 40 4.00 Sedimentation 35 3.50
Geological Conditions 25 Seismicity 30 3.00 Geological conditions of the site 40 4.00 Natural hazard (earthquake) 30 3.00
Lead Time 20 Length of access road 25 2.00 Difficulty level of funding 35 2.80 Reliability of development plan 40 3.20
Effectiveness of Project 30
Unit generation cost 25 3.00 Installed capacity 20 2.40 Annual energy production 20 2.40 Energy production in the dry season 35 4.20
Impact on Environment 60
Impact on Natural Environment 50
Impact on forest 25 7.50 Impact on protected area 30 9.00 Impact on fishes 20 6.00 Impact on conservation species 25 7.50
Impact on Social Environment 50
Impact on locality by construction of transmission line 20 6.00
Impact on household 25 7.50 Impact on agriculture 20 6.00 Impact on ethnic minority 20 6.00 Impact on tourism 15 4.50
Total 100
Final Report Appendix 3 SEA Report
81
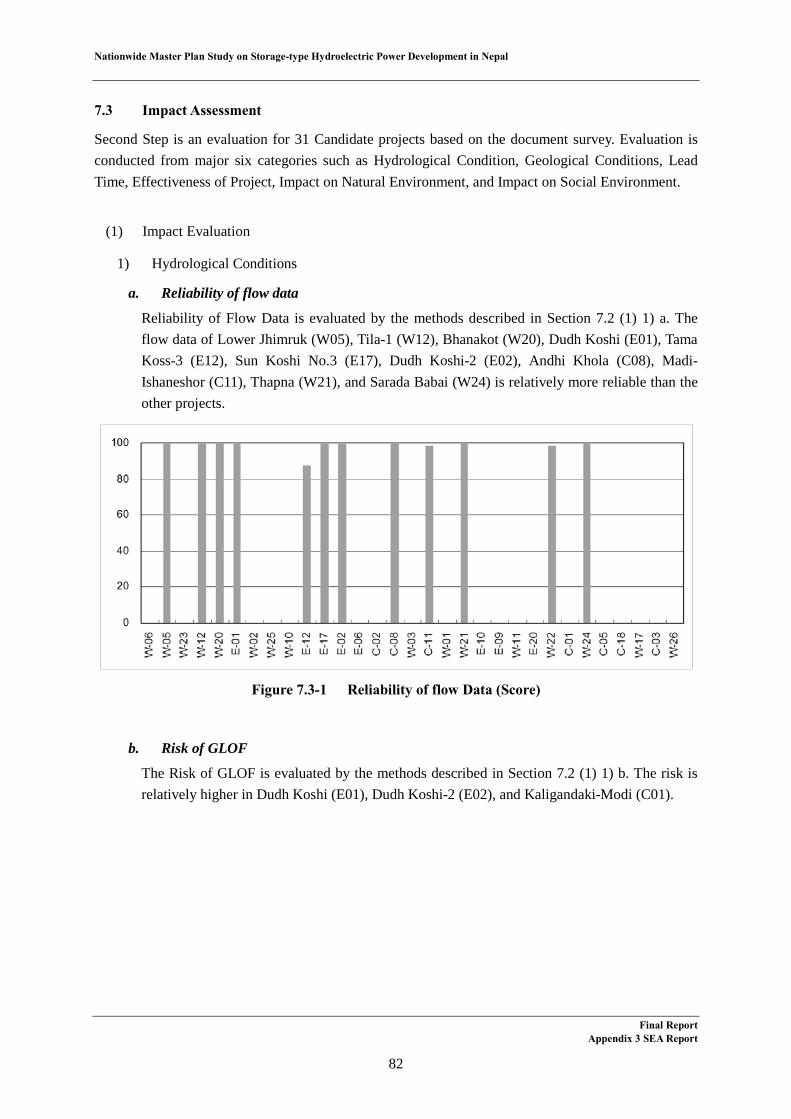
Nationwide Master Plan Study on Storage-type Hydroelectric Power Development in Nepal
Impact Assessment7.3
Second Step is an evaluation for 31 Candidate projects based on the document survey. Evaluation is conducted from major six categories such as Hydrological Condition, Geological Conditions, Lead Time, Effectiveness of Project, Impact on Natural Environment, and Impact on Social Environment.
(1) Impact Evaluation
1) Hydrological Conditions
a. Reliability of flow data
Reliability of Flow Data is evaluated by the methods described in Section 7.2 (1) 1) a. The flow data of Lower Jhimruk (W05), Tila-1 (W12), Bhanakot (W20), Dudh Koshi (E01), Tama Koss-3 (E12), Sun Koshi No.3 (E17), Dudh Koshi-2 (E02), Andhi Khola (C08), Madi-Ishaneshor (C11), Thapna (W21), and Sarada Babai (W24) is relatively more reliable than the other projects.
Figure 7.3-1 Reliability of flow Data (Score)
b. Risk of GLOF
The Risk of GLOF is evaluated by the methods described in Section 7.2 (1) 1) b. The risk is relatively higher in Dudh Koshi (E01), Dudh Koshi-2 (E02), and Kaligandaki-Modi (C01).
Final ReportAppendix 3 SEA Report
82

Nationwide Master Plan Study on Storage-type Hydroelectric Power Development in Nepal
Figure 7.3-2 Risk of GLOF (Score)
c. Sedimentation
The sedimentation risk is evaluated by the methods described in Section 7.2 (1) 1) c. Kokhajor-1 (E06), Piluwa-2 (E09), Upper Daraudi (C05), Lower Daraudi (C03), and Andhi Khola (C08) has relatively higher risk than the other projects.
Figure 7.3-3 Sedimentation (Life Time of Reservoir: Year)
Final ReportAppendix 3 SEA Report
83
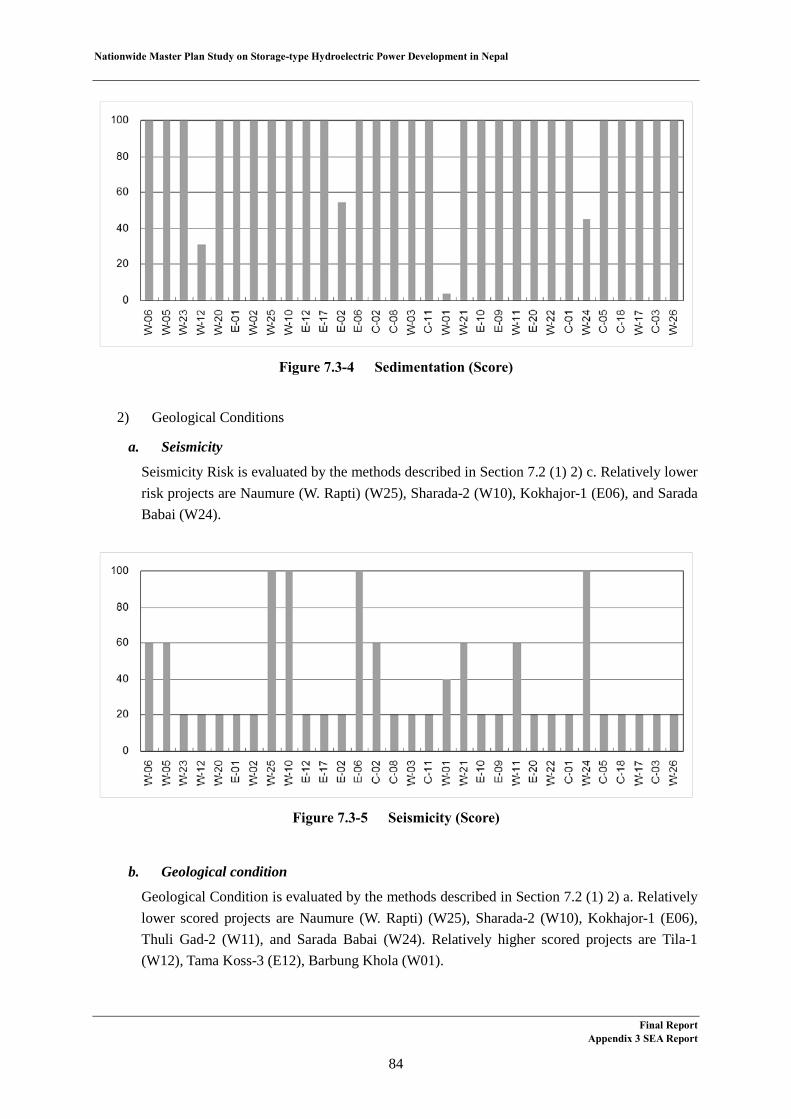
Nationwide Master Plan Study on Storage-type Hydroelectric Power Development in Nepal
Figure 7.3-4 Sedimentation (Score)
2) Geological Conditions
a. Seismicity
Seismicity Risk is evaluated by the methods described in Section 7.2 (1) 2) c. Relatively lower risk projects are Naumure (W. Rapti) (W25), Sharada-2 (W10), Kokhajor-1 (E06), and Sarada Babai (W24).
Figure 7.3-5 Seismicity (Score)
b. Geological condition
Geological Condition is evaluated by the methods described in Section 7.2 (1) 2) a. Relatively lower scored projects are Naumure (W. Rapti) (W25), Sharada-2 (W10), Kokhajor-1 (E06), Thuli Gad-2 (W11), and Sarada Babai (W24). Relatively higher scored projects are Tila-1(W12), Tama Koss-3 (E12), Barbung Khola (W01).
Final ReportAppendix 3 SEA Report
84

Nationwide Master Plan Study on Storage-type Hydroelectric Power Development in Nepal
Figure 7.3-6 Geological Condition of Site (Score)
c. Natural hazard
Natural Hazard is evaluated by the methods described in Section 7.2 (1) 2) b. Relatively lower scored projects are Lower Jhimruk (W05), Naumure (W25), Tama Koss-3 (E12), Kokhajor-1(E06), Thuli Gad-2 (W11), and Sarada Babai (W24).
Figure 7.3-7 Natural Hazard (Earthquake) (Score)
3) Lead Time
a. Length of access road
Length of Access Road is evaluated by the methods described in Section 7.2 (1) 3) a. relatively lower scored projects are Dudh Koshi (E01), Barbung Khola (W01), and Tila-1 (W12).
Final ReportAppendix 3 SEA Report
85

Nationwide Master Plan Study on Storage-type Hydroelectric Power Development in Nepal
Figure 7.3-8 Length of Access Road (km)
Figure 7.3-9 Length of Access Road (Score)
b. Difficulty level of funding
Difficulty Level of Funding is evaluated by the methods described in section 7.2 (1) 3) b. Relatively lower scored projects are BR-4 (W17), Bhanakot (W20), and Thapna (W21).
Final ReportAppendix 3 SEA Report
86
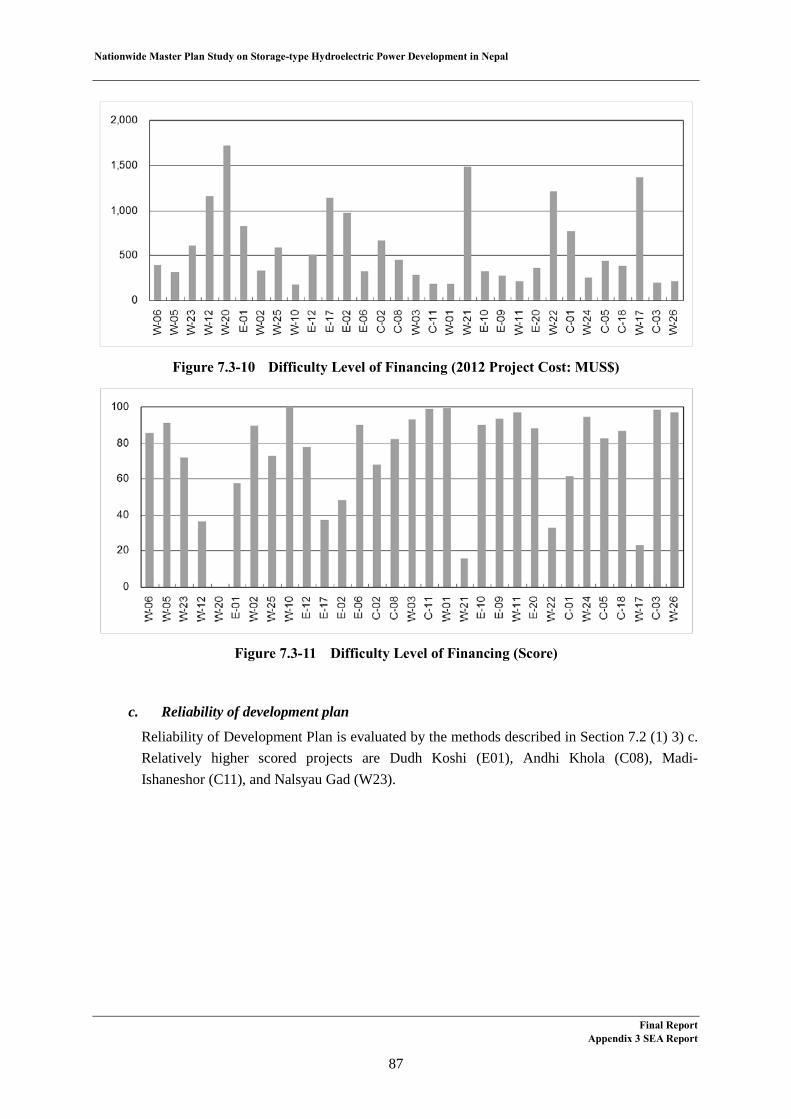
Nationwide Master Plan Study on Storage-type Hydroelectric Power Development in Nepal
Figure 7.3-10 Difficulty Level of Financing (2012 Project Cost: MUS$)
Figure 7.3-11 Difficulty Level of Financing (Score)
c. Reliability of development plan
Reliability of Development Plan is evaluated by the methods described in Section 7.2 (1) 3) c. Relatively higher scored projects are Dudh Koshi (E01), Andhi Khola (C08), Madi-Ishaneshor (C11), and Nalsyau Gad (W23).
Final ReportAppendix 3 SEA Report
87
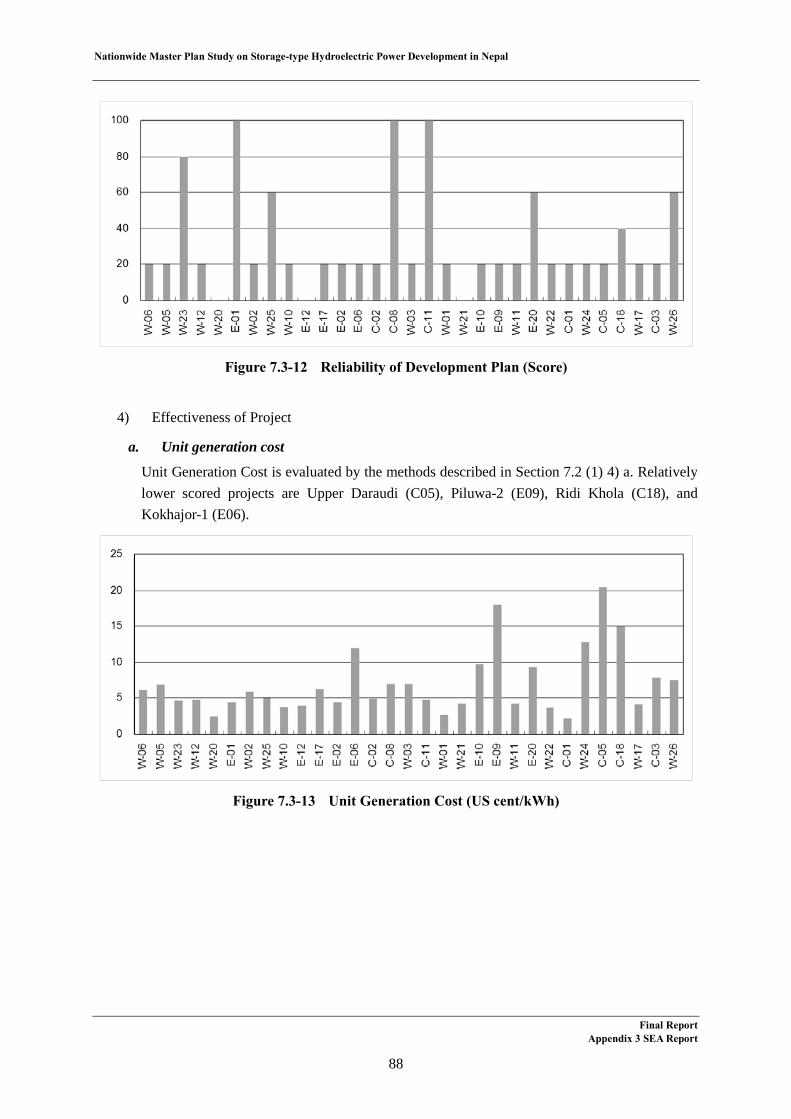
Nationwide Master Plan Study on Storage-type Hydroelectric Power Development in Nepal
Figure 7.3-12 Reliability of Development Plan (Score)
4) Effectiveness of Project
a. Unit generation cost
Unit Generation Cost is evaluated by the methods described in Section 7.2 (1) 4) a. Relatively lower scored projects are Upper Daraudi (C05), Piluwa-2 (E09), Ridi Khola (C18), and Kokhajor-1 (E06).
Figure 7.3-13 Unit Generation Cost (US cent/kWh)
Final ReportAppendix 3 SEA Report
88

Nationwide Master Plan Study on Storage-type Hydroelectric Power Development in Nepal
Figure 7.3-14 Unit Generation Cost (Score)
b. Installed capacity
Installed Capacity is evaluated by the methods described in Section 7.2 (1) 4) b. Relatively lower scored projects are Bhanakot (W20), Kaligandaki-Modi (C01), BR-4 (W17), SR-6(W22), and Tila-1 (W12).
Figure 7.3-15 Installed Capacity (MW)
Final ReportAppendix 3 SEA Report
89

Nationwide Master Plan Study on Storage-type Hydroelectric Power Development in Nepal
Figure 7.3-16 Installed Capacity (Score)
c. Annual energy production
Annual Energy Production is evaluated by the methods described in Section 7.2 (1) 4) c. Relatively lower scored projects are Piluwa-2 (E09), Sarada Babai (W24), Upper Daraudi (C05), Ridi Khola (C18), Lower Daraudi (C03), Lohare Khola (W26), Kokhajor-1 (E06), Rosi-2 (E10), and Indrawati (E20).
Figure 7.3-17 Annual Energy Production (GWh)
Final ReportAppendix 3 SEA Report
90

Nationwide Master Plan Study on Storage-type Hydroelectric Power Development in Nepal
Figure 7.3-18 Annual Energy Production (Score)
d. Energy production in the dry season
Energy Production in Dry Season is evaluated by the methods described in Section 7.2 (1) 4) d. Bhanakot (W20), Dudh Koshi (E01), Thapna (W21), SR-6 (W22), BR-4 (W17) are relatively higher scores than the other projects.
Figure 7.3-19 Energy Production in the Dry Season (GWh)
Final ReportAppendix 3 SEA Report
91

Nationwide Master Plan Study on Storage-type Hydroelectric Power Development in Nepal
Figure 7.3-20 Energy Production in the Dry Season (Score)
5) Impact on Natural Environment
a. Impact on forest
Impact on forest is evaluated by the methods described in Section 7.2. BR-4 (W17), Thapna (W21), SR-6 (W22), Bhanakot (W20) are more than 1,000 ha which is relatively larger than the other projects. When it comes to unit forest are per MW, Lohare Khola (W26), BR-4(W17), Kokhajor-1 (E06), Thapna (W21) are relatively bigger impact than the other projects.
Figure 7.3-21 Impact on Forest (Inundated Forest Area: ha)
Final ReportAppendix 3 SEA Report
92
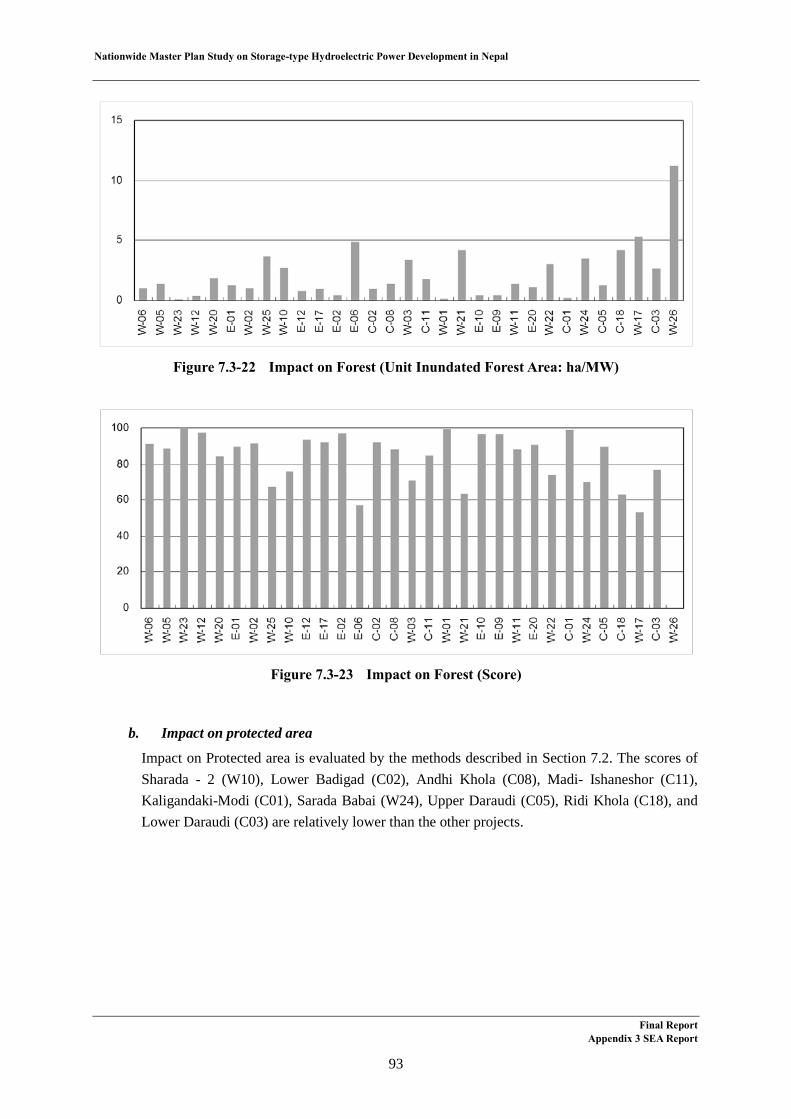
Nationwide Master Plan Study on Storage-type Hydroelectric Power Development in Nepal
Figure 7.3-22 Impact on Forest (Unit Inundated Forest Area: ha/MW)
Figure 7.3-23 Impact on Forest (Score)
b. Impact on protected area
Impact on Protected area is evaluated by the methods described in Section 7.2. The scores of Sharada - 2 (W10), Lower Badigad (C02), Andhi Khola (C08), Madi- Ishaneshor (C11), Kaligandaki-Modi (C01), Sarada Babai (W24), Upper Daraudi (C05), Ridi Khola (C18), and Lower Daraudi (C03) are relatively lower than the other projects.
Final ReportAppendix 3 SEA Report
93

Nationwide Master Plan Study on Storage-type Hydroelectric Power Development in Nepal
Figure 7.3-24 Impact on Protected Area (Score)
Table 7.3-1 Impact on Protected Area
c. Impact on fishes
Impacts on fishes are evaluated by the methods described in Section 7.2. Relatively higher score projects are Madi (W06), Lower Jhimruk (W05), Naumure (W. Rapti) (W25), and Sarada Babai (W24).
No. Project Name WorldHeritage
NationalPark
National Park(Buffer Zone)
WildlifeReserve Ramsar
KeyBiodiversity
AreaTotal Point
E-01 Dudh Koshi 1 1 2E-02 Dukh Koshi-2 1 1 2E-06 Kokhajor-1 0E-09 Piluwa-2 1 1 2E-10 Rosi-2 1 1 2E-12 Tama Koss-3 1 1 2E-17 Sunkosi No.3 1 1 2E-20 Indrawati 1 1 2C-01 Kaligandaki-Modi 1 1 1 3C-02 Lower Badigad 1 1 1 3C-03 Lower Daraudi 1 1 1 3C-05 Upper Daraudi 1 1 1 3C-08 Andhi Khola 1 1 1 3C-11 Madi-Ishaneshor 1 1 1 3C-18 Ridi Khola 1 1 1 3W-01 Barbung Khola 1 1W-02 Chera-1 1 1W-03 Chera-2 1 1W-05 Lower Jhimruk 1 1W-06 Madi 1 1W-10 Sharada-2 1 1 2 3W-11 Thuli Gad-2 1 1W-12 Tila-1 1 1W-17 BR-4 1 1W-20 Bhanakot 1 1W-21 Thapna 1 1W-22 SR-6 1 1W-23 Nalsyagu Gad 1 1W-24 Sarada Babai 1 1 2 3W-25 Naumure (W. Rapti) 1 1W-26 Lohare Khola 1 1
Final ReportAppendix 3 SEA Report
94
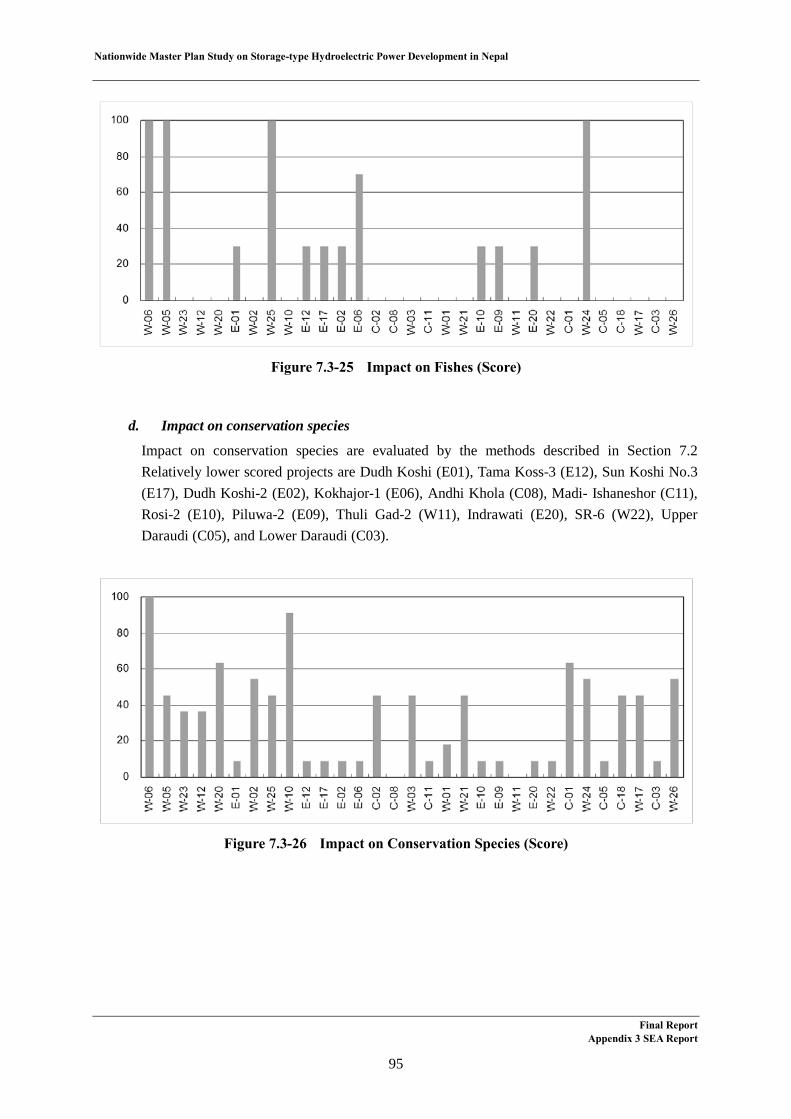
Nationwide Master Plan Study on Storage-type Hydroelectric Power Development in Nepal
Figure 7.3-25 Impact on Fishes (Score)
d. Impact on conservation species
Impact on conservation species are evaluated by the methods described in Section 7.2Relatively lower scored projects are Dudh Koshi (E01), Tama Koss-3 (E12), Sun Koshi No.3 (E17), Dudh Koshi-2 (E02), Kokhajor-1 (E06), Andhi Khola (C08), Madi- Ishaneshor (C11), Rosi-2 (E10), Piluwa-2 (E09), Thuli Gad-2 (W11), Indrawati (E20), SR-6 (W22), Upper Daraudi (C05), and Lower Daraudi (C03).
Figure 7.3-26 Impact on Conservation Species (Score)
Final ReportAppendix 3 SEA Report
95

N
ationwide M
aster Plan Study on Storage-type Hydroelectric Power D
evelopment in N
epal
Final Report
Appendix 3 SE
A Report
96
Table 7.3-2 Impact on Conservation Species
Habitat Point Habitat Point Habitat Point Habitat Point Habitat Point Habitat Point Habitat PointE-01 Dudh Koshi 1 5 1 5 1 5 5 2 17E-02 Dukh Koshi-2 1 5 1 5 1 5 5 2 17E-06 Kokhajor-1 1 5 1 5 1 5 5 2 17E-09 Piluwa-2 1 5 1 5 1 5 5 2 17E-10 Rosi-2 1 5 1 5 1 5 5 2 17E-12 Tama Koss-3 1 5 1 5 1 5 5 2 17E-17 Sunkosi No.3 1 5 1 5 1 5 5 2 17E-20 Indrawati 1 5 1 5 1 5 5 2 17C-01 Kaligandaki-Modi 1 5 1 5 6 1 11C-02 Lower Badigad 1 5 1 5 5 1 5 2 13C-03 Lower Daraudi 1 5 1 5 1 5 5 2 17C-05 Upper Daraudi 1 5 1 5 1 5 5 2 17C-08 Andhi Khola 1 5 1 5 5 1 1 5 5 2 18C-11 Madi-Ishaneshor 1 5 1 5 1 5 5 2 17C-18 Ridi Khola 1 5 1 5 5 1 5 2 13W-01 Barbung Khola 1 5 1 5 1 5 6 1 16W-02 Chera-1 1 5 1 5 5 1 6 1 12W-03 Chera-2 1 5 1 5 5 1 5 2 13W-05 Lower Jhimruk 1 5 1 5 5 1 5 2 13W-06 Madi 1 5 5 1 6 1 7W-10 Sharada-2 1 5 5 1 5 2 8W-11 Thuli Gad-2 1 5 1 5 1 5 5 1 5 2 18W-12 Tila-1 1 5 1 5 2 4 14W-17 BR-4 1 5 1 5 5 1 5 2 13W-20 Bhanakot 1 5 1 5 6 1 11W-21 Thapna 1 5 1 5 5 1 5 2 13W-22 SR-6 1 5 1 5 1 5 5 2 17W-23 Nalsyagu Gad 1 5 1 5 2 4 14W-24 Sarada Babai 1 5 1 5 5 2 12W-25 Naumure (W. Rapti) 1 5 1 5 5 1 5 2 13W-26 Lohare Khola 1 5 1 5 5 1 6 1 12
TotalPointNo.
Melursus ursinus(VU)
Neofelis nebulosa(VU)
Ursus thibetanus(VU)Project Name
Panthera tigris(EN)
Lutra lutra(NT)
Macaca assamensis(NT)
Panthera pardus(NT)
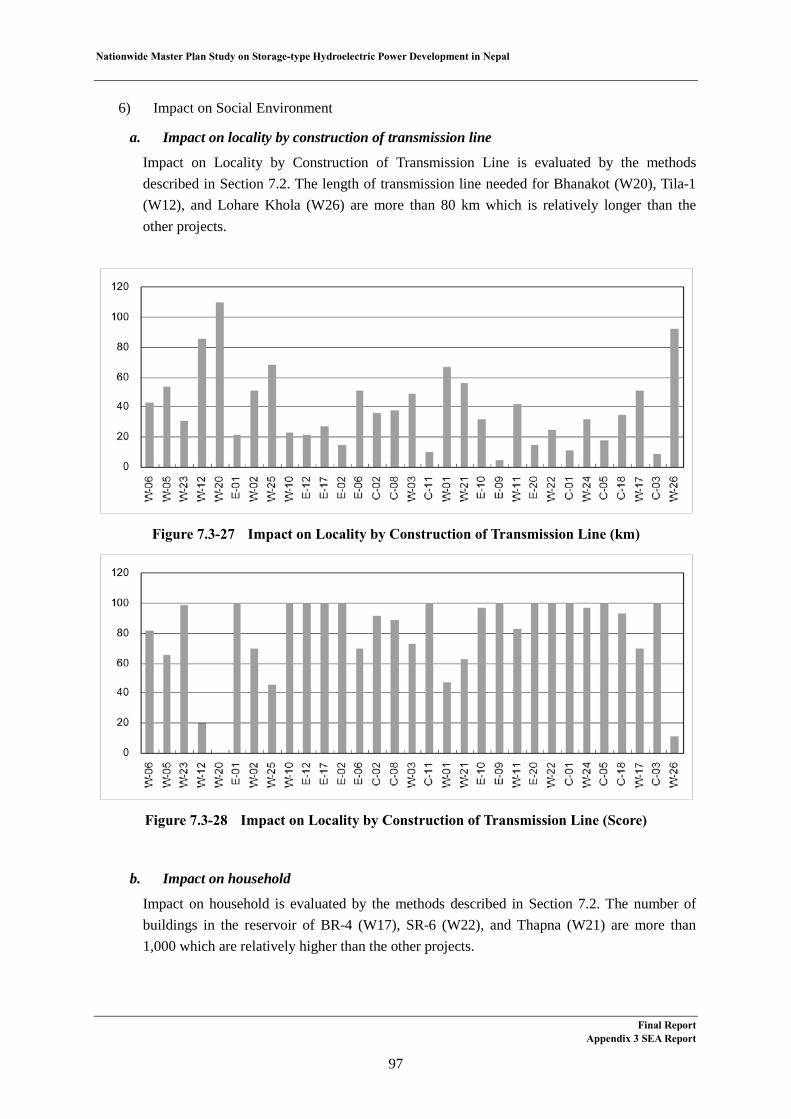
Nationwide Master Plan Study on Storage-type Hydroelectric Power Development in Nepal
6) Impact on Social Environment
a. Impact on locality by construction of transmission line
Impact on Locality by Construction of Transmission Line is evaluated by the methods described in Section 7.2. The length of transmission line needed for Bhanakot (W20), Tila-1(W12), and Lohare Khola (W26) are more than 80 km which is relatively longer than the other projects.
Figure 7.3-27 Impact on Locality by Construction of Transmission Line (km)
Figure 7.3-28 Impact on Locality by Construction of Transmission Line (Score)
b. Impact on household
Impact on household is evaluated by the methods described in Section 7.2. The number of buildings in the reservoir of BR-4 (W17), SR-6 (W22), and Thapna (W21) are more than 1,000 which are relatively higher than the other projects.
Final ReportAppendix 3 SEA Report
97
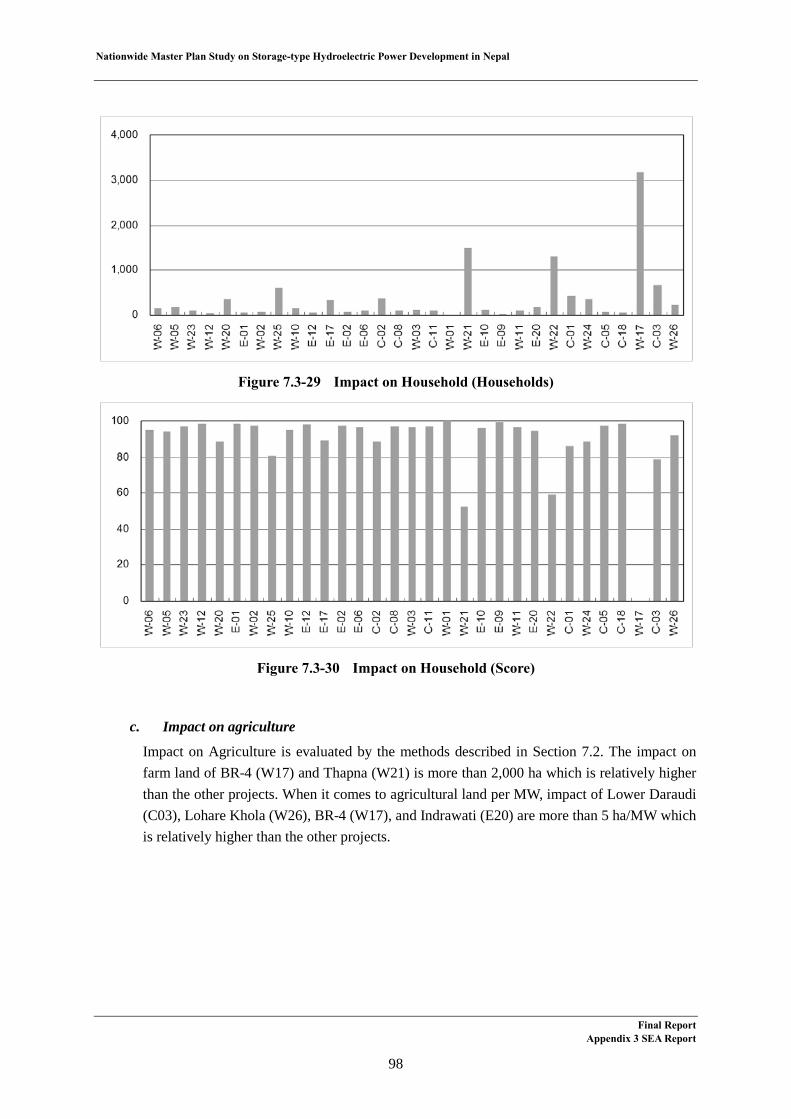
Nationwide Master Plan Study on Storage-type Hydroelectric Power Development in Nepal
Figure 7.3-29 Impact on Household (Households)
Figure 7.3-30 Impact on Household (Score)
c. Impact on agriculture
Impact on Agriculture is evaluated by the methods described in Section 7.2. The impact on farm land of BR-4 (W17) and Thapna (W21) is more than 2,000 ha which is relatively higher than the other projects. When it comes to agricultural land per MW, impact of Lower Daraudi (C03), Lohare Khola (W26), BR-4 (W17), and Indrawati (E20) are more than 5 ha/MW which is relatively higher than the other projects.
Final ReportAppendix 3 SEA Report
98

Nationwide Master Plan Study on Storage-type Hydroelectric Power Development in Nepal
Figure 7.3-31 Impact on Agriculture (Inundated Agricultural Land: ha)
Figure 7.3-32 Impact on Agriculture (Unit inundated Agricultural Land: ha/MW)
Figure 7.3-33 Impact on Agriculture (Score)
Final ReportAppendix 3 SEA Report
99

Nationwide Master Plan Study on Storage-type Hydroelectric Power Development in Nepal
d. Impact on ethnic minority
Impact on ethnic minority is evaluated by a method described in Section 7.2. SR-6 (W22), Thapna (W21), Kaligandaki-Modi (C01), and Tama Koss-3 (E12) are located in the VDCs which contains relatively higher number of ethnic minority groups.
Figure 7.3-34 Impact on Ethnic Minority (Number of Ethnic Minority Groups)
Figure 7.3-35 Impact on Ethnic Minority (Score)
e. Impact on tourism
Impact on tourism is evaluated by a method described in Section 7.2. Relatively many temples are located in the reservoir of C01 Kaligandaki-Modi, W17 BR-4, W21 Thapna, and W22 SR-6. Then the scores of these projects are lower.
Final ReportAppendix 3 SEA Report
100
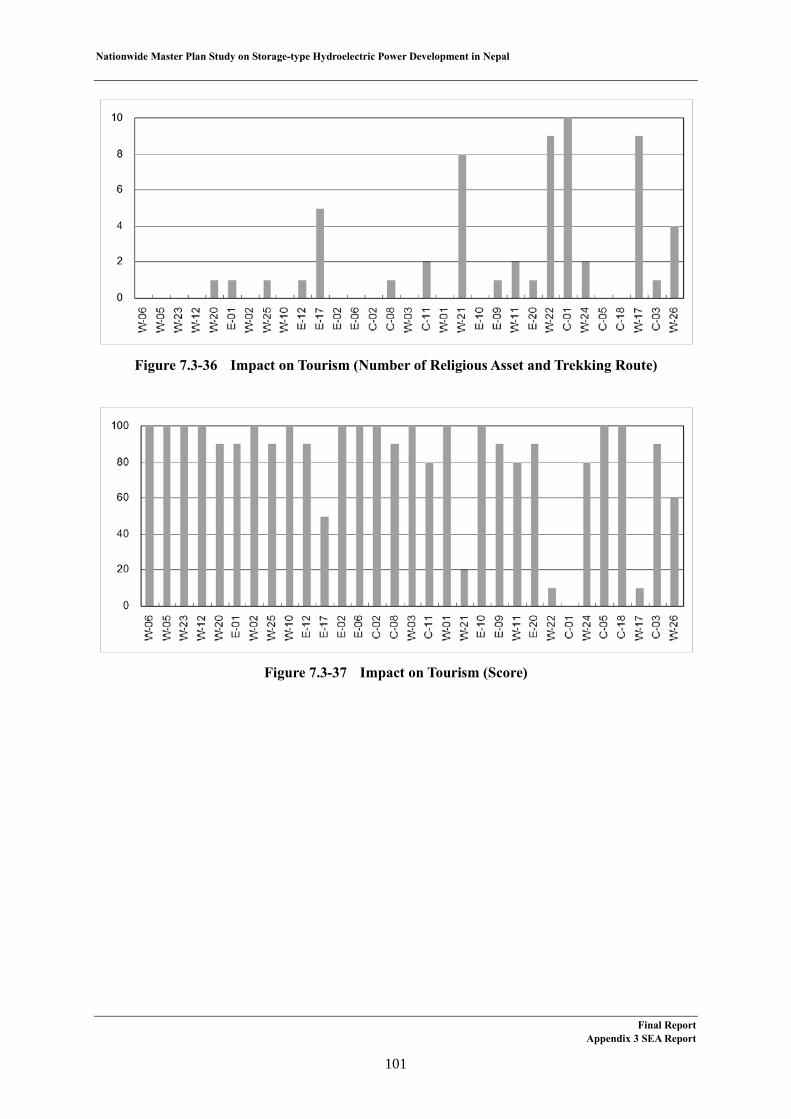
Nationwide Master Plan Study on Storage-type Hydroelectric Power Development in Nepal
Figure 7.3-36 Impact on Tourism (Number of Religious Asset and Trekking Route)
Figure 7.3-37 Impact on Tourism (Score)
Final ReportAppendix 3 SEA Report
101

Nationwide Master Plan Study on Storage-type Hydroelectric Power Development in Nepal
Table 7.3-3 Impact on Tourism
(2) Sensitivity Analysis
The 31 candidate projects selected in Second Step (See Section 7.1) were evaluated by the evaluation method described in Section 7.2 (1), then the evaluation scores of each evaluation item were weighted with the weight described in Section 7.2 (2) and summed up, and evaluation scores of each candidate project were obtained. Numerical value or information of each evaluation item was obtained from existing project reports, topographical and geological maps, and other literature.
Table 7.3-4 shows the evaluation score and ranking of candidate projects, Table 7.3-5 shows the ranking of each case and Table 7.3-6 shows the detail of evaluation results.
No. Project Name Church Monument Mosque Temple Trecking TotalE-01 Dudh Koshi 1 1E-02 Dukh Koshi-2 0E-06 Kokhajor-1 0E-09 Piluwa-2 1 1E-10 Rosi-2 0E-12 Tama Koss-3 1 1E-17 Sunkosi No.3 5 5E-20 Indrawati 1 1C-01 Kaligandaki-Modi 10 10C-02 Lower Badigad 0C-03 Lower Daraudi 1 1C-05 Upper Daraudi 0C-08 Andhi Khola 1 1C-11 Madi- Ishaneshor 2 2C-18 Ridi Khola 0W-01 Barbung Khola 0W-02 Chera-1 0W-03 Chera-2 0W-05 Lower Jhimruk 0W-06 Madi 0W-10 Sharada-2 0W-11 Thuli Gad - 2 1 1 2W-12 Tila-1 0W-17 BR-4 9 9W-20 Bhanakot 1 1W-21 Thapna 8 8W-22 SR-6 9 9W-23 Nalsyagu Gad 0W-24 Sarada Babai 2 2W-25 Naumure (W. Papti) 1 1W-26 Lohare Khola 3 1 4
Final Report Appendix 3 SEA Report
102

Nationwide Master Plan Study on Storage-type Hydroelectric Power Development in Nepal
Table 7.3-4 Evaluation Score and Ranking
Score Ranking Score Ranking Score RankingE-01 Dudh Koshi 300.0 65 6 65 5 65 9E-02 Dukh Koshi-2 456.6 62 12 61 17 63 12E-06 Kokhajor-1 111.5 62 13 60 20 64 10E-09 Piluwa-2 107.3 59 21 57 25 60 19E-10 Rosi-2 106.5 60 20 58 21 61 17E-12 Tama Koss-3 287.0 63 10 63 13 63 13E-17 Sunkosi No.3 536.0 63 11 64 8 62 15E-20 Indrawati 91.2 58 23 58 24 58 24C-01 Kaligandaki-Modi 816.4 57 25 58 23 56 25C-02 Lower Badigad 380.3 62 14 63 14 62 16C-03 Lower Daraudi 120.2 50 30 52 29 49 31C-05 Upper Daraudi 111.4 53 27 51 30 54 27C-08 Andhi Khola 180.0 62 15 64 9 61 18C-11 Madi- Ishaneshor 86.0 61 17 62 15 59 21C-18 Ridi Khola 97.0 53 28 53 28 53 28W-01 Barbung Khola 122.9 61 18 60 19 63 14W-02 Chera-1 148.7 65 7 64 7 66 4W-03 Chera-2 104.3 62 16 61 16 63 11W-05 Lower Jhimruk 142.5 71 2 69 2 73 2W-06 Madi 199.8 76 1 73 1 78 1W-10 Sharada-2 96.8 64 9 63 12 65 7W-11 Thuli Gad-2 119.7 59 22 58 22 60 20W-12 Tila-1 617.2 66 4 65 6 66 5W-17 BR-4 667.0 51 29 53 27 49 30W-20 Bhanakot 810.0 66 5 66 4 65 8W-21 Thapna 500.0 61 19 64 10 58 23W-22 SR-6 642.0 58 24 61 18 56 26W-23 Nalsyagu Gad 400.0 68 3 67 3 70 3W-24 Sarada Babai 75.0 57 26 55 26 59 22W-25 Naumure (W. Rapti) 245.0 65 8 64 11 66 6W-26 Lohare Khola 67.0 50 31 51 31 49 29
E: Eastern River Basin, C: Central River Basin, W: Western River Basin.
Base Case: Technical point 50%, Environmental point 50%Case 1: Technical point 60%, Environmental point 40%Case 2: Technical point 40%, Environmental point 60%
Base Case Case 1 Case 2No. Project Name P (MW)
Final Report Appendix 3 SEA Report
103
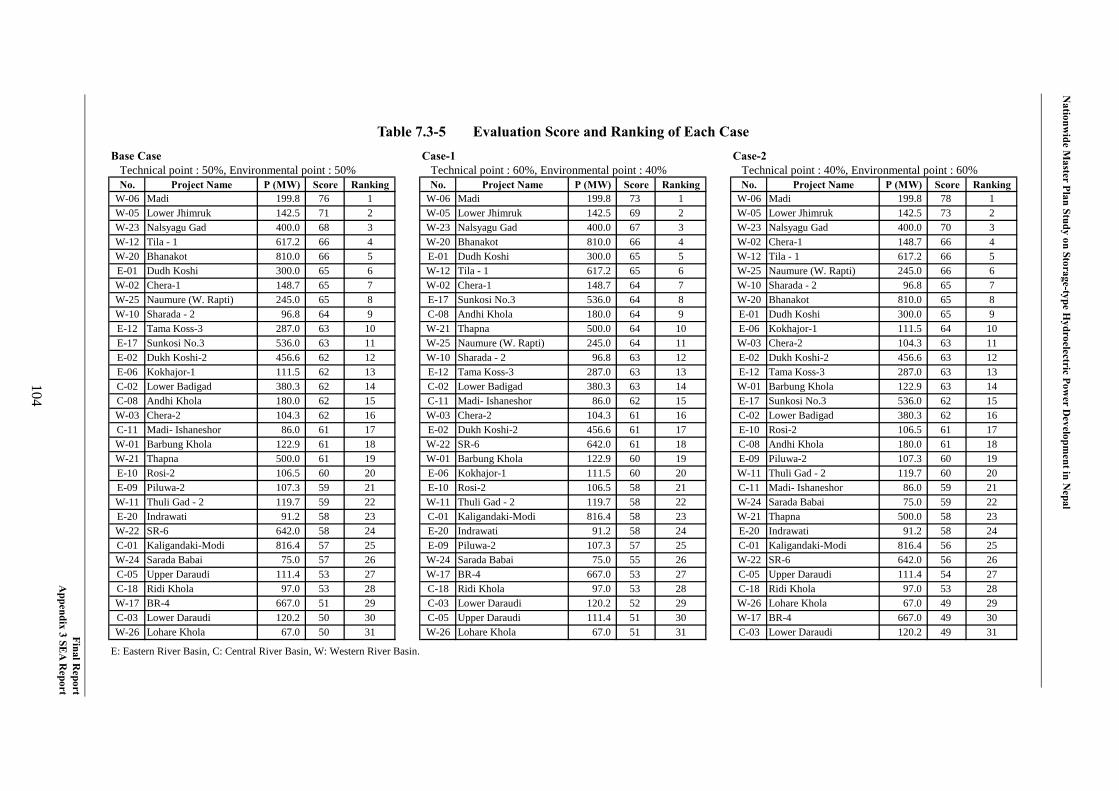
N
ationwide M
aster Plan Study on Storage-type Hydroelectric Pow
er Developm
ent in Nepal
Final Report
Appendix 3 SE
A Report
104
Table 7.3-5 Evaluation Score and Ranking of Each Case
Base Case Case-1 Case-2 Technical point : 50%, Environmental point : 50% Technical point : 60%, Environmental point : 40% Technical point : 40%, Environmental point : 60%
No. Project Name P (MW) Score Ranking No. Project Name P (MW) Score Ranking No. Project Name P (MW) Score RankingW-06 Madi 199.8 76 1 W-06 Madi 199.8 73 1 W-06 Madi 199.8 78 1W-05 Lower Jhimruk 142.5 71 2 W-05 Lower Jhimruk 142.5 69 2 W-05 Lower Jhimruk 142.5 73 2W-23 Nalsyagu Gad 400.0 68 3 W-23 Nalsyagu Gad 400.0 67 3 W-23 Nalsyagu Gad 400.0 70 3W-12 Tila - 1 617.2 66 4 W-20 Bhanakot 810.0 66 4 W-02 Chera-1 148.7 66 4W-20 Bhanakot 810.0 66 5 E-01 Dudh Koshi 300.0 65 5 W-12 Tila - 1 617.2 66 5E-01 Dudh Koshi 300.0 65 6 W-12 Tila - 1 617.2 65 6 W-25 Naumure (W. Rapti) 245.0 66 6W-02 Chera-1 148.7 65 7 W-02 Chera-1 148.7 64 7 W-10 Sharada - 2 96.8 65 7W-25 Naumure (W. Rapti) 245.0 65 8 E-17 Sunkosi No.3 536.0 64 8 W-20 Bhanakot 810.0 65 8W-10 Sharada - 2 96.8 64 9 C-08 Andhi Khola 180.0 64 9 E-01 Dudh Koshi 300.0 65 9E-12 Tama Koss-3 287.0 63 10 W-21 Thapna 500.0 64 10 E-06 Kokhajor-1 111.5 64 10E-17 Sunkosi No.3 536.0 63 11 W-25 Naumure (W. Rapti) 245.0 64 11 W-03 Chera-2 104.3 63 11E-02 Dukh Koshi-2 456.6 62 12 W-10 Sharada - 2 96.8 63 12 E-02 Dukh Koshi-2 456.6 63 12E-06 Kokhajor-1 111.5 62 13 E-12 Tama Koss-3 287.0 63 13 E-12 Tama Koss-3 287.0 63 13C-02 Lower Badigad 380.3 62 14 C-02 Lower Badigad 380.3 63 14 W-01 Barbung Khola 122.9 63 14C-08 Andhi Khola 180.0 62 15 C-11 Madi- Ishaneshor 86.0 62 15 E-17 Sunkosi No.3 536.0 62 15W-03 Chera-2 104.3 62 16 W-03 Chera-2 104.3 61 16 C-02 Lower Badigad 380.3 62 16C-11 Madi- Ishaneshor 86.0 61 17 E-02 Dukh Koshi-2 456.6 61 17 E-10 Rosi-2 106.5 61 17W-01 Barbung Khola 122.9 61 18 W-22 SR-6 642.0 61 18 C-08 Andhi Khola 180.0 61 18W-21 Thapna 500.0 61 19 W-01 Barbung Khola 122.9 60 19 E-09 Piluwa-2 107.3 60 19E-10 Rosi-2 106.5 60 20 E-06 Kokhajor-1 111.5 60 20 W-11 Thuli Gad - 2 119.7 60 20E-09 Piluwa-2 107.3 59 21 E-10 Rosi-2 106.5 58 21 C-11 Madi- Ishaneshor 86.0 59 21W-11 Thuli Gad - 2 119.7 59 22 W-11 Thuli Gad - 2 119.7 58 22 W-24 Sarada Babai 75.0 59 22E-20 Indrawati 91.2 58 23 C-01 Kaligandaki-Modi 816.4 58 23 W-21 Thapna 500.0 58 23W-22 SR-6 642.0 58 24 E-20 Indrawati 91.2 58 24 E-20 Indrawati 91.2 58 24C-01 Kaligandaki-Modi 816.4 57 25 E-09 Piluwa-2 107.3 57 25 C-01 Kaligandaki-Modi 816.4 56 25W-24 Sarada Babai 75.0 57 26 W-24 Sarada Babai 75.0 55 26 W-22 SR-6 642.0 56 26C-05 Upper Daraudi 111.4 53 27 W-17 BR-4 667.0 53 27 C-05 Upper Daraudi 111.4 54 27C-18 Ridi Khola 97.0 53 28 C-18 Ridi Khola 97.0 53 28 C-18 Ridi Khola 97.0 53 28W-17 BR-4 667.0 51 29 C-03 Lower Daraudi 120.2 52 29 W-26 Lohare Khola 67.0 49 29C-03 Lower Daraudi 120.2 50 30 C-05 Upper Daraudi 111.4 51 30 W-17 BR-4 667.0 49 30W-26 Lohare Khola 67.0 50 31 W-26 Lohare Khola 67.0 51 31 C-03 Lower Daraudi 120.2 49 31
E: Eastern River Basin, C: Central River Basin, W: Western River Basin.
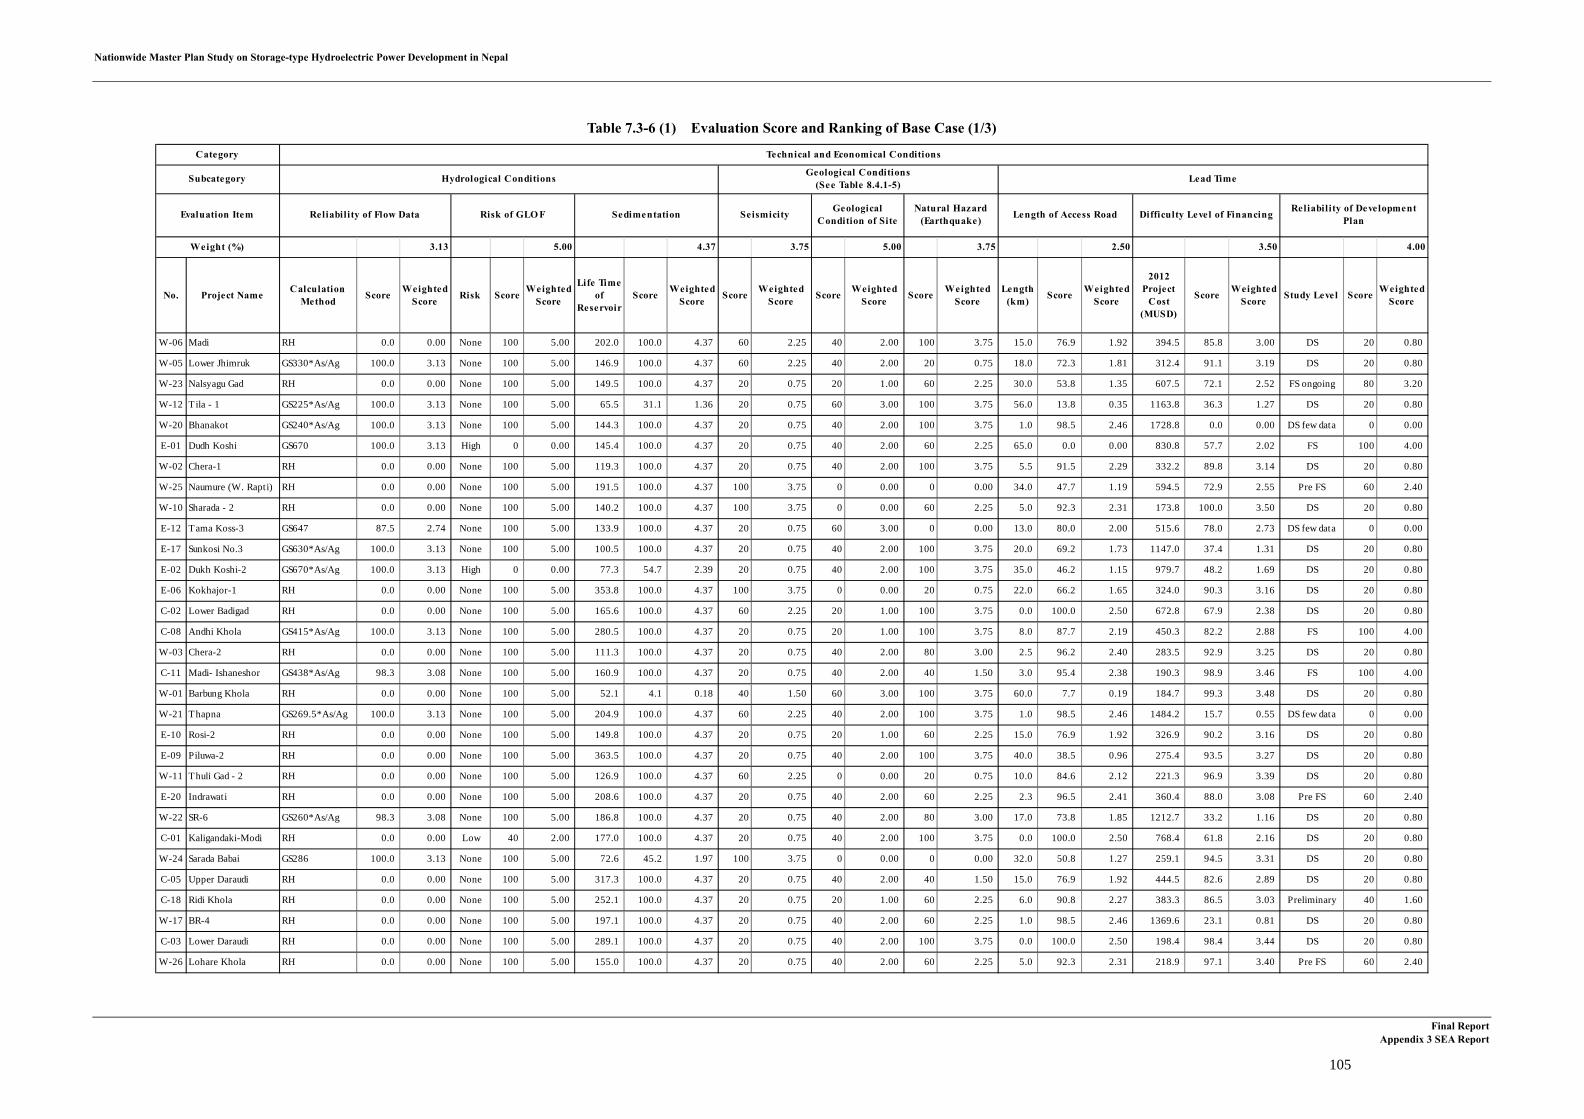
Nationwide Master Plan Study on Storage-type Hydroelectric Power Development in Nepal
Final Report Appendix 3 SEA Report
105
Table 7.3-6 (1) Evaluation Score and Ranking of Base Case (1/3)
3.13 5.00 4.37 3.75 5.00 3.75 2.50 3.50 4.00
No. Project Name CalculationMethod Score Weighted
Score Risk Score WeightedScore
Life Timeof
ReservoirScore Weighted
Score Score WeightedScore Score Weighted
Score Score WeightedScore
Length(km) Score Weighted
Score
2012Project
Cost(MUSD)
Score WeightedScore Study Level Score Weighted
Score
W-06 Madi RH 0.0 0.00 None 100 5.00 202.0 100.0 4.37 60 2.25 40 2.00 100 3.75 15.0 76.9 1.92 394.5 85.8 3.00 DS 20 0.80
W-05 Lower Jhimruk GS330*As/Ag 100.0 3.13 None 100 5.00 146.9 100.0 4.37 60 2.25 40 2.00 20 0.75 18.0 72.3 1.81 312.4 91.1 3.19 DS 20 0.80
W-23 Nalsyagu Gad RH 0.0 0.00 None 100 5.00 149.5 100.0 4.37 20 0.75 20 1.00 60 2.25 30.0 53.8 1.35 607.5 72.1 2.52 FS ongoing 80 3.20
W-12 Tila - 1 GS225*As/Ag 100.0 3.13 None 100 5.00 65.5 31.1 1.36 20 0.75 60 3.00 100 3.75 56.0 13.8 0.35 1163.8 36.3 1.27 DS 20 0.80
W-20 Bhanakot GS240*As/Ag 100.0 3.13 None 100 5.00 144.3 100.0 4.37 20 0.75 40 2.00 100 3.75 1.0 98.5 2.46 1728.8 0.0 0.00 DS few data 0 0.00
E-01 Dudh Koshi GS670 100.0 3.13 High 0 0.00 145.4 100.0 4.37 20 0.75 40 2.00 60 2.25 65.0 0.0 0.00 830.8 57.7 2.02 FS 100 4.00
W-02 Chera-1 RH 0.0 0.00 None 100 5.00 119.3 100.0 4.37 20 0.75 40 2.00 100 3.75 5.5 91.5 2.29 332.2 89.8 3.14 DS 20 0.80
W-25 Naumure (W. Rapti) RH 0.0 0.00 None 100 5.00 191.5 100.0 4.37 100 3.75 0 0.00 0 0.00 34.0 47.7 1.19 594.5 72.9 2.55 Pre FS 60 2.40
W-10 Sharada - 2 RH 0.0 0.00 None 100 5.00 140.2 100.0 4.37 100 3.75 0 0.00 60 2.25 5.0 92.3 2.31 173.8 100.0 3.50 DS 20 0.80
E-12 Tama Koss-3 GS647 87.5 2.74 None 100 5.00 133.9 100.0 4.37 20 0.75 60 3.00 0 0.00 13.0 80.0 2.00 515.6 78.0 2.73 DS few data 0 0.00
E-17 Sunkosi No.3 GS630*As/Ag 100.0 3.13 None 100 5.00 100.5 100.0 4.37 20 0.75 40 2.00 100 3.75 20.0 69.2 1.73 1147.0 37.4 1.31 DS 20 0.80
E-02 Dukh Koshi-2 GS670*As/Ag 100.0 3.13 High 0 0.00 77.3 54.7 2.39 20 0.75 40 2.00 100 3.75 35.0 46.2 1.15 979.7 48.2 1.69 DS 20 0.80
E-06 Kokhajor-1 RH 0.0 0.00 None 100 5.00 353.8 100.0 4.37 100 3.75 0 0.00 20 0.75 22.0 66.2 1.65 324.0 90.3 3.16 DS 20 0.80
C-02 Lower Badigad RH 0.0 0.00 None 100 5.00 165.6 100.0 4.37 60 2.25 20 1.00 100 3.75 0.0 100.0 2.50 672.8 67.9 2.38 DS 20 0.80
C-08 Andhi Khola GS415*As/Ag 100.0 3.13 None 100 5.00 280.5 100.0 4.37 20 0.75 20 1.00 100 3.75 8.0 87.7 2.19 450.3 82.2 2.88 FS 100 4.00
W-03 Chera-2 RH 0.0 0.00 None 100 5.00 111.3 100.0 4.37 20 0.75 40 2.00 80 3.00 2.5 96.2 2.40 283.5 92.9 3.25 DS 20 0.80
C-11 Madi- Ishaneshor GS438*As/Ag 98.3 3.08 None 100 5.00 160.9 100.0 4.37 20 0.75 40 2.00 40 1.50 3.0 95.4 2.38 190.3 98.9 3.46 FS 100 4.00
W-01 Barbung Khola RH 0.0 0.00 None 100 5.00 52.1 4.1 0.18 40 1.50 60 3.00 100 3.75 60.0 7.7 0.19 184.7 99.3 3.48 DS 20 0.80
W-21 Thapna GS269.5*As/Ag 100.0 3.13 None 100 5.00 204.9 100.0 4.37 60 2.25 40 2.00 100 3.75 1.0 98.5 2.46 1484.2 15.7 0.55 DS few data 0 0.00
E-10 Rosi-2 RH 0.0 0.00 None 100 5.00 149.8 100.0 4.37 20 0.75 20 1.00 60 2.25 15.0 76.9 1.92 326.9 90.2 3.16 DS 20 0.80
E-09 Piluwa-2 RH 0.0 0.00 None 100 5.00 363.5 100.0 4.37 20 0.75 40 2.00 100 3.75 40.0 38.5 0.96 275.4 93.5 3.27 DS 20 0.80
W-11 Thuli Gad - 2 RH 0.0 0.00 None 100 5.00 126.9 100.0 4.37 60 2.25 0 0.00 20 0.75 10.0 84.6 2.12 221.3 96.9 3.39 DS 20 0.80
E-20 Indrawati RH 0.0 0.00 None 100 5.00 208.6 100.0 4.37 20 0.75 40 2.00 60 2.25 2.3 96.5 2.41 360.4 88.0 3.08 Pre FS 60 2.40
W-22 SR-6 GS260*As/Ag 98.3 3.08 None 100 5.00 186.8 100.0 4.37 20 0.75 40 2.00 80 3.00 17.0 73.8 1.85 1212.7 33.2 1.16 DS 20 0.80
C-01 Kaligandaki-Modi RH 0.0 0.00 Low 40 2.00 177.0 100.0 4.37 20 0.75 40 2.00 100 3.75 0.0 100.0 2.50 768.4 61.8 2.16 DS 20 0.80
W-24 Sarada Babai GS286 100.0 3.13 None 100 5.00 72.6 45.2 1.97 100 3.75 0 0.00 0 0.00 32.0 50.8 1.27 259.1 94.5 3.31 DS 20 0.80
C-05 Upper Daraudi RH 0.0 0.00 None 100 5.00 317.3 100.0 4.37 20 0.75 40 2.00 40 1.50 15.0 76.9 1.92 444.5 82.6 2.89 DS 20 0.80
C-18 Ridi Khola RH 0.0 0.00 None 100 5.00 252.1 100.0 4.37 20 0.75 20 1.00 60 2.25 6.0 90.8 2.27 383.3 86.5 3.03 Preliminary 40 1.60
W-17 BR-4 RH 0.0 0.00 None 100 5.00 197.1 100.0 4.37 20 0.75 40 2.00 60 2.25 1.0 98.5 2.46 1369.6 23.1 0.81 DS 20 0.80
C-03 Lower Daraudi RH 0.0 0.00 None 100 5.00 289.1 100.0 4.37 20 0.75 40 2.00 100 3.75 0.0 100.0 2.50 198.4 98.4 3.44 DS 20 0.80
W-26 Lohare Khola RH 0.0 0.00 None 100 5.00 155.0 100.0 4.37 20 0.75 40 2.00 60 2.25 5.0 92.3 2.31 218.9 97.1 3.40 Pre FS 60 2.40
Subcategory
Category
Reliability of Flow Data Risk of GLO F
Hydrological Conditions
Sedimentation
Technical and Economical Conditions
Geological Conditions(See Table 8.4.1-5) Lead Time
Difficulty Level of Financing
Weight (%)
Evaluation Item GeologicalCondition of Site Length of Access RoadNatural Hazard
(Earthquake)Seismicity Reliability of DevelopmentPlan
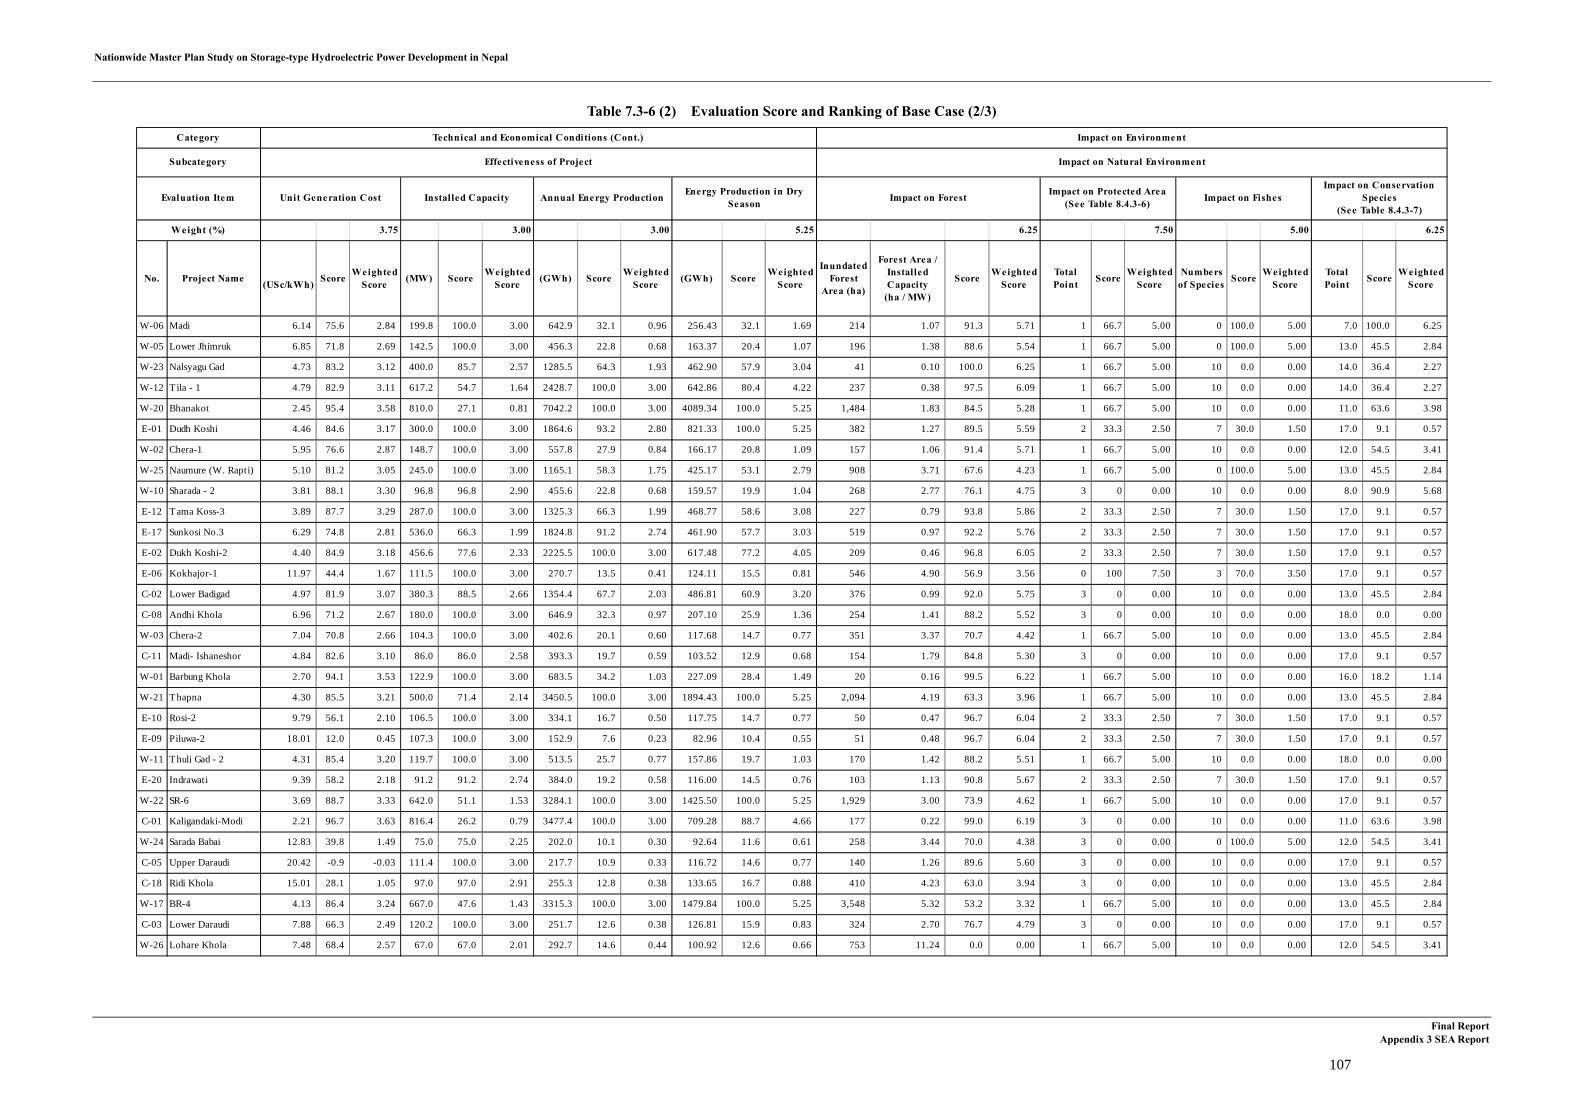
Nationwide Master Plan Study on Storage-type Hydroelectric Power Development in Nepal
Final Report Appendix 3 SEA Report
107
Table 7.3-6 (2) Evaluation Score and Ranking of Base Case (2/3)
3.75 3.00 3.00 5.25 6.25 7.50 5.00 6.25
No. Project Name (USc/kWh) Score WeightedScore (MW) Score Weighted
Score (GWh) Score WeightedScore (GWh) Score Weighted
Score
InundatedForest
Area (ha)
Forest Area /InstalledCapacity
(ha / MW)
Score WeightedScore
TotalPoint Score Weighted
ScoreNumbers
of Species Score WeightedScore
TotalPoint Score Weighted
Score
W-06 Madi 6.14 75.6 2.84 199.8 100.0 3.00 642.9 32.1 0.96 256.43 32.1 1.69 214 1.07 91.3 5.71 1 66.7 5.00 0 100.0 5.00 7.0 100.0 6.25
W-05 Lower Jhimruk 6.85 71.8 2.69 142.5 100.0 3.00 456.3 22.8 0.68 163.37 20.4 1.07 196 1.38 88.6 5.54 1 66.7 5.00 0 100.0 5.00 13.0 45.5 2.84
W-23 Nalsyagu Gad 4.73 83.2 3.12 400.0 85.7 2.57 1285.5 64.3 1.93 462.90 57.9 3.04 41 0.10 100.0 6.25 1 66.7 5.00 10 0.0 0.00 14.0 36.4 2.27
W-12 Tila - 1 4.79 82.9 3.11 617.2 54.7 1.64 2428.7 100.0 3.00 642.86 80.4 4.22 237 0.38 97.5 6.09 1 66.7 5.00 10 0.0 0.00 14.0 36.4 2.27
W-20 Bhanakot 2.45 95.4 3.58 810.0 27.1 0.81 7042.2 100.0 3.00 4089.34 100.0 5.25 1,484 1.83 84.5 5.28 1 66.7 5.00 10 0.0 0.00 11.0 63.6 3.98
E-01 Dudh Koshi 4.46 84.6 3.17 300.0 100.0 3.00 1864.6 93.2 2.80 821.33 100.0 5.25 382 1.27 89.5 5.59 2 33.3 2.50 7 30.0 1.50 17.0 9.1 0.57
W-02 Chera-1 5.95 76.6 2.87 148.7 100.0 3.00 557.8 27.9 0.84 166.17 20.8 1.09 157 1.06 91.4 5.71 1 66.7 5.00 10 0.0 0.00 12.0 54.5 3.41
W-25 Naumure (W. Rapti) 5.10 81.2 3.05 245.0 100.0 3.00 1165.1 58.3 1.75 425.17 53.1 2.79 908 3.71 67.6 4.23 1 66.7 5.00 0 100.0 5.00 13.0 45.5 2.84
W-10 Sharada - 2 3.81 88.1 3.30 96.8 96.8 2.90 455.6 22.8 0.68 159.57 19.9 1.04 268 2.77 76.1 4.75 3 0 0.00 10 0.0 0.00 8.0 90.9 5.68
E-12 Tama Koss-3 3.89 87.7 3.29 287.0 100.0 3.00 1325.3 66.3 1.99 468.77 58.6 3.08 227 0.79 93.8 5.86 2 33.3 2.50 7 30.0 1.50 17.0 9.1 0.57
E-17 Sunkosi No.3 6.29 74.8 2.81 536.0 66.3 1.99 1824.8 91.2 2.74 461.90 57.7 3.03 519 0.97 92.2 5.76 2 33.3 2.50 7 30.0 1.50 17.0 9.1 0.57
E-02 Dukh Koshi-2 4.40 84.9 3.18 456.6 77.6 2.33 2225.5 100.0 3.00 617.48 77.2 4.05 209 0.46 96.8 6.05 2 33.3 2.50 7 30.0 1.50 17.0 9.1 0.57
E-06 Kokhajor-1 11.97 44.4 1.67 111.5 100.0 3.00 270.7 13.5 0.41 124.11 15.5 0.81 546 4.90 56.9 3.56 0 100 7.50 3 70.0 3.50 17.0 9.1 0.57
C-02 Lower Badigad 4.97 81.9 3.07 380.3 88.5 2.66 1354.4 67.7 2.03 486.81 60.9 3.20 376 0.99 92.0 5.75 3 0 0.00 10 0.0 0.00 13.0 45.5 2.84
C-08 Andhi Khola 6.96 71.2 2.67 180.0 100.0 3.00 646.9 32.3 0.97 207.10 25.9 1.36 254 1.41 88.2 5.52 3 0 0.00 10 0.0 0.00 18.0 0.0 0.00
W-03 Chera-2 7.04 70.8 2.66 104.3 100.0 3.00 402.6 20.1 0.60 117.68 14.7 0.77 351 3.37 70.7 4.42 1 66.7 5.00 10 0.0 0.00 13.0 45.5 2.84
C-11 Madi- Ishaneshor 4.84 82.6 3.10 86.0 86.0 2.58 393.3 19.7 0.59 103.52 12.9 0.68 154 1.79 84.8 5.30 3 0 0.00 10 0.0 0.00 17.0 9.1 0.57
W-01 Barbung Khola 2.70 94.1 3.53 122.9 100.0 3.00 683.5 34.2 1.03 227.09 28.4 1.49 20 0.16 99.5 6.22 1 66.7 5.00 10 0.0 0.00 16.0 18.2 1.14
W-21 Thapna 4.30 85.5 3.21 500.0 71.4 2.14 3450.5 100.0 3.00 1894.43 100.0 5.25 2,094 4.19 63.3 3.96 1 66.7 5.00 10 0.0 0.00 13.0 45.5 2.84
E-10 Rosi-2 9.79 56.1 2.10 106.5 100.0 3.00 334.1 16.7 0.50 117.75 14.7 0.77 50 0.47 96.7 6.04 2 33.3 2.50 7 30.0 1.50 17.0 9.1 0.57
E-09 Piluwa-2 18.01 12.0 0.45 107.3 100.0 3.00 152.9 7.6 0.23 82.96 10.4 0.55 51 0.48 96.7 6.04 2 33.3 2.50 7 30.0 1.50 17.0 9.1 0.57
W-11 Thuli Gad - 2 4.31 85.4 3.20 119.7 100.0 3.00 513.5 25.7 0.77 157.86 19.7 1.03 170 1.42 88.2 5.51 1 66.7 5.00 10 0.0 0.00 18.0 0.0 0.00
E-20 Indrawati 9.39 58.2 2.18 91.2 91.2 2.74 384.0 19.2 0.58 116.00 14.5 0.76 103 1.13 90.8 5.67 2 33.3 2.50 7 30.0 1.50 17.0 9.1 0.57
W-22 SR-6 3.69 88.7 3.33 642.0 51.1 1.53 3284.1 100.0 3.00 1425.50 100.0 5.25 1,929 3.00 73.9 4.62 1 66.7 5.00 10 0.0 0.00 17.0 9.1 0.57
C-01 Kaligandaki-Modi 2.21 96.7 3.63 816.4 26.2 0.79 3477.4 100.0 3.00 709.28 88.7 4.66 177 0.22 99.0 6.19 3 0 0.00 10 0.0 0.00 11.0 63.6 3.98
W-24 Sarada Babai 12.83 39.8 1.49 75.0 75.0 2.25 202.0 10.1 0.30 92.64 11.6 0.61 258 3.44 70.0 4.38 3 0 0.00 0 100.0 5.00 12.0 54.5 3.41
C-05 Upper Daraudi 20.42 -0.9 -0.03 111.4 100.0 3.00 217.7 10.9 0.33 116.72 14.6 0.77 140 1.26 89.6 5.60 3 0 0.00 10 0.0 0.00 17.0 9.1 0.57
C-18 Ridi Khola 15.01 28.1 1.05 97.0 97.0 2.91 255.3 12.8 0.38 133.65 16.7 0.88 410 4.23 63.0 3.94 3 0 0.00 10 0.0 0.00 13.0 45.5 2.84
W-17 BR-4 4.13 86.4 3.24 667.0 47.6 1.43 3315.3 100.0 3.00 1479.84 100.0 5.25 3,548 5.32 53.2 3.32 1 66.7 5.00 10 0.0 0.00 13.0 45.5 2.84
C-03 Lower Daraudi 7.88 66.3 2.49 120.2 100.0 3.00 251.7 12.6 0.38 126.81 15.9 0.83 324 2.70 76.7 4.79 3 0 0.00 10 0.0 0.00 17.0 9.1 0.57
W-26 Lohare Khola 7.48 68.4 2.57 67.0 67.0 2.01 292.7 14.6 0.44 100.92 12.6 0.66 753 11.24 0.0 0.00 1 66.7 5.00 10 0.0 0.00 12.0 54.5 3.41
Evaluation Item Impact on Protected Area(See Table 8.4.3-6)
Category Technical and Economical Conditions (Cont.) Impact on Environment
Subcategory Effectiveness of Project Impact on Natural Environment
Unit Generation Cost Installed Capacity
Weight (%)
Impact on FishesImpact on Conservation
Species(See Table 8.4.3-7)
Annual Energy Production Energy Production in DrySeason Impact on Forest
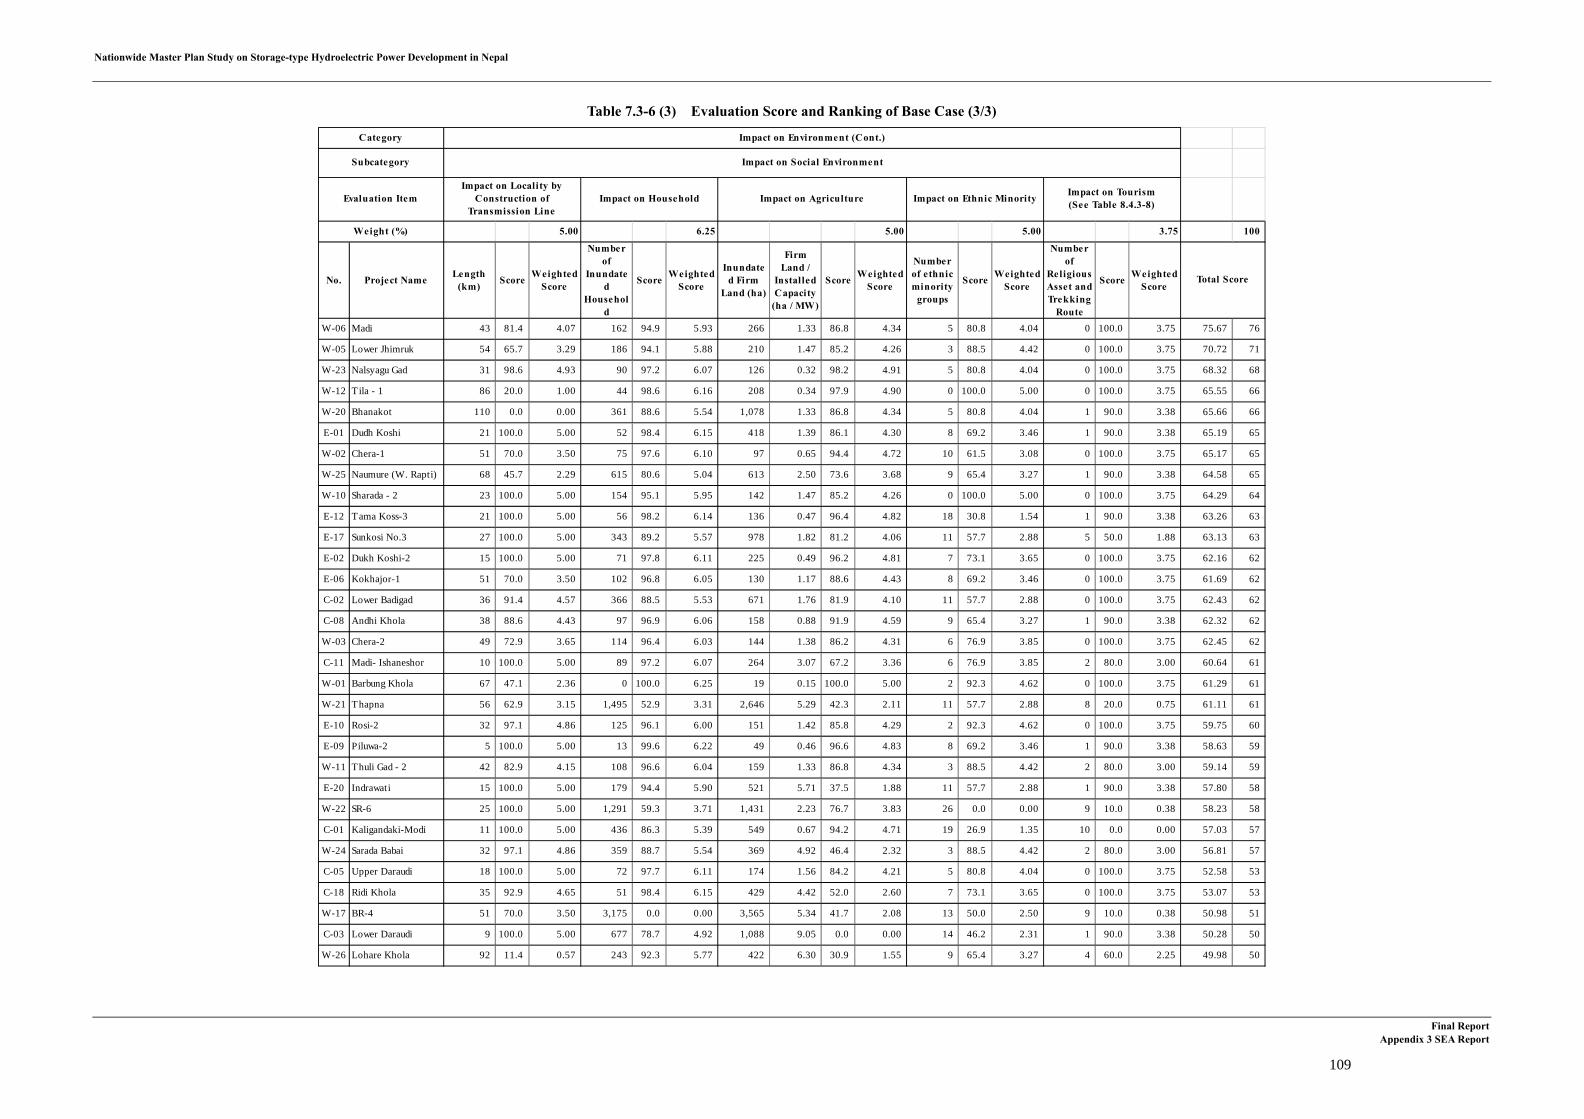
Nationwide Master Plan Study on Storage-type Hydroelectric Power Development in Nepal
Final Report Appendix 3 SEA Report
109
Table 7.3-6 (3) Evaluation Score and Ranking of Base Case (3/3)
5.00 6.25 5.00 5.00 3.75 100
No. Project Name Length(km) Score Weighted
Score
Numberof
Inundated
Household
Score WeightedScore
Inundated Firm
Land (ha)
FirmLand /
InstalledCapacity
(ha / MW)
Score WeightedScore
Numberof ethnicminority
groups
Score WeightedScore
Numberof
ReligiousAsset andTrekking
Route
Score WeightedScore
W-06 Madi 43 81.4 4.07 162 94.9 5.93 266 1.33 86.8 4.34 5 80.8 4.04 0 100.0 3.75 75.67 76
W-05 Lower Jhimruk 54 65.7 3.29 186 94.1 5.88 210 1.47 85.2 4.26 3 88.5 4.42 0 100.0 3.75 70.72 71
W-23 Nalsyagu Gad 31 98.6 4.93 90 97.2 6.07 126 0.32 98.2 4.91 5 80.8 4.04 0 100.0 3.75 68.32 68
W-12 Tila - 1 86 20.0 1.00 44 98.6 6.16 208 0.34 97.9 4.90 0 100.0 5.00 0 100.0 3.75 65.55 66
W-20 Bhanakot 110 0.0 0.00 361 88.6 5.54 1,078 1.33 86.8 4.34 5 80.8 4.04 1 90.0 3.38 65.66 66
E-01 Dudh Koshi 21 100.0 5.00 52 98.4 6.15 418 1.39 86.1 4.30 8 69.2 3.46 1 90.0 3.38 65.19 65
W-02 Chera-1 51 70.0 3.50 75 97.6 6.10 97 0.65 94.4 4.72 10 61.5 3.08 0 100.0 3.75 65.17 65
W-25 Naumure (W. Rapti) 68 45.7 2.29 615 80.6 5.04 613 2.50 73.6 3.68 9 65.4 3.27 1 90.0 3.38 64.58 65
W-10 Sharada - 2 23 100.0 5.00 154 95.1 5.95 142 1.47 85.2 4.26 0 100.0 5.00 0 100.0 3.75 64.29 64
E-12 Tama Koss-3 21 100.0 5.00 56 98.2 6.14 136 0.47 96.4 4.82 18 30.8 1.54 1 90.0 3.38 63.26 63
E-17 Sunkosi No.3 27 100.0 5.00 343 89.2 5.57 978 1.82 81.2 4.06 11 57.7 2.88 5 50.0 1.88 63.13 63
E-02 Dukh Koshi-2 15 100.0 5.00 71 97.8 6.11 225 0.49 96.2 4.81 7 73.1 3.65 0 100.0 3.75 62.16 62
E-06 Kokhajor-1 51 70.0 3.50 102 96.8 6.05 130 1.17 88.6 4.43 8 69.2 3.46 0 100.0 3.75 61.69 62
C-02 Lower Badigad 36 91.4 4.57 366 88.5 5.53 671 1.76 81.9 4.10 11 57.7 2.88 0 100.0 3.75 62.43 62
C-08 Andhi Khola 38 88.6 4.43 97 96.9 6.06 158 0.88 91.9 4.59 9 65.4 3.27 1 90.0 3.38 62.32 62
W-03 Chera-2 49 72.9 3.65 114 96.4 6.03 144 1.38 86.2 4.31 6 76.9 3.85 0 100.0 3.75 62.45 62
C-11 Madi- Ishaneshor 10 100.0 5.00 89 97.2 6.07 264 3.07 67.2 3.36 6 76.9 3.85 2 80.0 3.00 60.64 61
W-01 Barbung Khola 67 47.1 2.36 0 100.0 6.25 19 0.15 100.0 5.00 2 92.3 4.62 0 100.0 3.75 61.29 61
W-21 Thapna 56 62.9 3.15 1,495 52.9 3.31 2,646 5.29 42.3 2.11 11 57.7 2.88 8 20.0 0.75 61.11 61
E-10 Rosi-2 32 97.1 4.86 125 96.1 6.00 151 1.42 85.8 4.29 2 92.3 4.62 0 100.0 3.75 59.75 60
E-09 Piluwa-2 5 100.0 5.00 13 99.6 6.22 49 0.46 96.6 4.83 8 69.2 3.46 1 90.0 3.38 58.63 59
W-11 Thuli Gad - 2 42 82.9 4.15 108 96.6 6.04 159 1.33 86.8 4.34 3 88.5 4.42 2 80.0 3.00 59.14 59
E-20 Indrawati 15 100.0 5.00 179 94.4 5.90 521 5.71 37.5 1.88 11 57.7 2.88 1 90.0 3.38 57.80 58
W-22 SR-6 25 100.0 5.00 1,291 59.3 3.71 1,431 2.23 76.7 3.83 26 0.0 0.00 9 10.0 0.38 58.23 58
C-01 Kaligandaki-Modi 11 100.0 5.00 436 86.3 5.39 549 0.67 94.2 4.71 19 26.9 1.35 10 0.0 0.00 57.03 57
W-24 Sarada Babai 32 97.1 4.86 359 88.7 5.54 369 4.92 46.4 2.32 3 88.5 4.42 2 80.0 3.00 56.81 57
C-05 Upper Daraudi 18 100.0 5.00 72 97.7 6.11 174 1.56 84.2 4.21 5 80.8 4.04 0 100.0 3.75 52.58 53
C-18 Ridi Khola 35 92.9 4.65 51 98.4 6.15 429 4.42 52.0 2.60 7 73.1 3.65 0 100.0 3.75 53.07 53
W-17 BR-4 51 70.0 3.50 3,175 0.0 0.00 3,565 5.34 41.7 2.08 13 50.0 2.50 9 10.0 0.38 50.98 51
C-03 Lower Daraudi 9 100.0 5.00 677 78.7 4.92 1,088 9.05 0.0 0.00 14 46.2 2.31 1 90.0 3.38 50.28 50
W-26 Lohare Khola 92 11.4 0.57 243 92.3 5.77 422 6.30 30.9 1.55 9 65.4 3.27 4 60.0 2.25 49.98 50
Impact on Environment (Cont.)
Subcategory Impact on Social Environment
Category
Impact on Tourism(See Table 8.4.3-8)
Weight (%)
Total Score
Impact on Locality byConstruction of
Transmission LineImpact on Household Impact on Agriculture Impact on Ethnic MinorityEvaluation Item
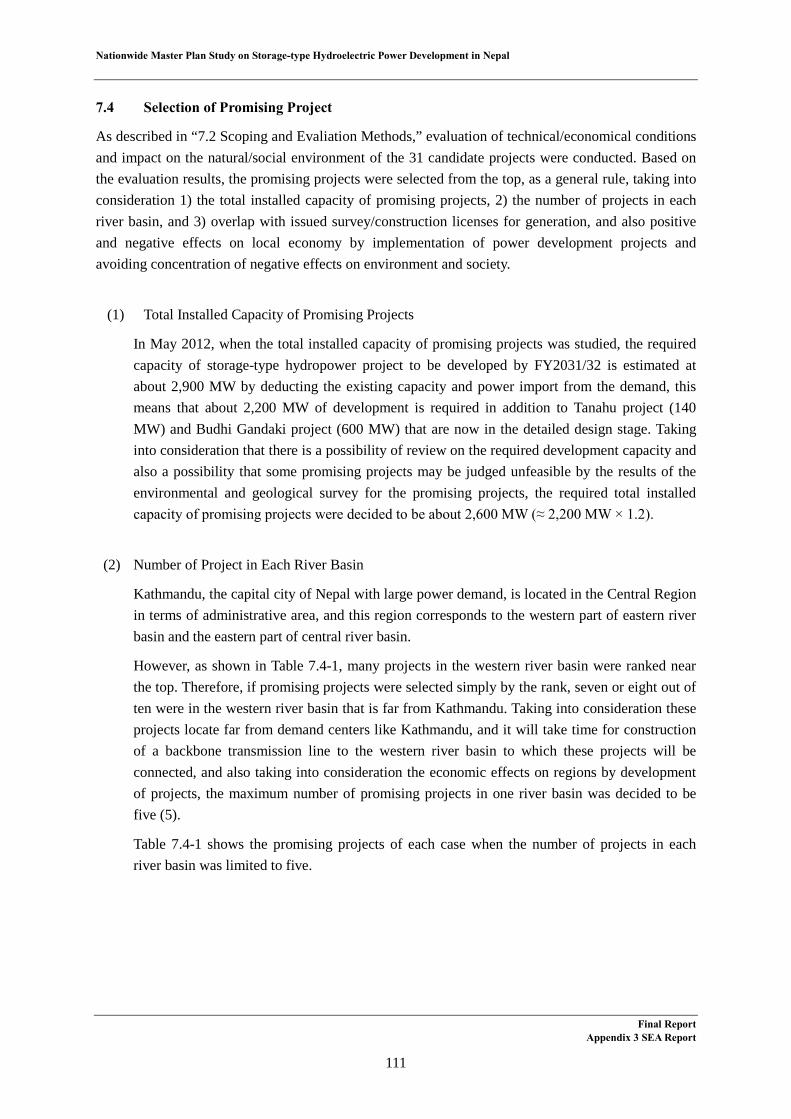
Nationwide Master Plan Study on Storage-type Hydroelectric Power Development in Nepal
Selection of Promising Project 7.4
As described in “7.2 Scoping and Evaliation Methods,” evaluation of technical/economical conditions and impact on the natural/social environment of the 31 candidate projects were conducted. Based on the evaluation results, the promising projects were selected from the top, as a general rule, taking into consideration 1) the total installed capacity of promising projects, 2) the number of projects in each river basin, and 3) overlap with issued survey/construction licenses for generation, and also positive and negative effects on local economy by implementation of power development projects and avoiding concentration of negative effects on environment and society.
(1) Total Installed Capacity of Promising Projects
In May 2012, when the total installed capacity of promising projects was studied, the required capacity of storage-type hydropower project to be developed by FY2031/32 is estimated at about 2,900 MW by deducting the existing capacity and power import from the demand, this means that about 2,200 MW of development is required in addition to Tanahu project (140 MW) and Budhi Gandaki project (600 MW) that are now in the detailed design stage. Taking into consideration that there is a possibility of review on the required development capacity and also a possibility that some promising projects may be judged unfeasible by the results of the environmental and geological survey for the promising projects, the required total installed capacity of promising projects were decided to be about 2,600 MW (≈ 2,200 MW × 1.2).
(2) Number of Project in Each River Basin
Kathmandu, the capital city of Nepal with large power demand, is located in the Central Region in terms of administrative area, and this region corresponds to the western part of eastern river basin and the eastern part of central river basin.
However, as shown in Table 7.4-1, many projects in the western river basin were ranked near the top. Therefore, if promising projects were selected simply by the rank, seven or eight out of ten were in the western river basin that is far from Kathmandu. Taking into consideration these projects locate far from demand centers like Kathmandu, and it will take time for construction of a backbone transmission line to the western river basin to which these projects will be connected, and also taking into consideration the economic effects on regions by development of projects, the maximum number of promising projects in one river basin was decided to be five (5).
Table 7.4-1 shows the promising projects of each case when the number of projects in each river basin was limited to five.
Final Report Appendix 3 SEA Report
111
N
ationwide M
aster Plan Study on Storage-type Hydroelectric Pow
er Developm
ent in Nepal
Final Report
Appendix 3 SE
A Report
112
Table 7.4-1 Promising Projects (Number of promising projects in each river basin is five or less)
Base Case Case-1 Case-2 Technical : 50%, Environmental : 50% Technical : 60%, Environmental : 40% Technical : 40%, Environmental : 60%
No. Project Name P (MW) Ranking No. Project Name P (MW) Ranking No. Project Name P (MW) RankingW-06 Madi 199.8 1 (W1) W-06 Madi 199.8 1 (W1) W-06 Madi 199.8 1 (W1)W-05 Lower Jhimruk 142.5 2 (W2) W-05 Lower Jhimruk 142.5 2 (W2) W-05 Lower Jhimruk 142.5 2 (W2)W-23 Nalsyagu Gad 400.0 3 (W3) W-23 Nalsyagu Gad 400.0 3 (W3) W-23 Nalsyagu Gad 400.0 3 (W3)W-12 Tila - 1 617.2 4 (W4) W-20 Bhanakot 810.0 4 (W4) W-02 Chera-1 148.7 4 (W4)W-20 Bhanakot 810.0 5 (W5) E-01 Dudh Koshi 300.0 5 (E1) W-12 Tila - 1 617.2 5 (W5)E-01 Dudh Koshi 300.0 6 (E1) W-12 Tila - 1 617.2 6 (W5) W-25 Naumure (W. Rapti) 245.0 ––W-02 Chera-1 148.7 –– W-02 Chera-1 148.7 –– W-10 Sharada - 2 96.8 ––W-25 Naumure (W. Rapti) 245.0 –– E-17 Sunkosi No.3 536.0 7 (E2) W-20 Bhanakot 810.0 ––W-10 Sharada - 2 96.8 –– C-08 Andhi Khola 180.0 8 (C1) E-01 Dudh Koshi 300.0 6 (E1)E-12 Tama Koss-3 287.0 7 (E2) W-21 Thapna 500.0 –– E-06 Kokhajor-1 111.5 7 (E2)E-17 Sunkosi No.3 536.0 8 (E3) W-25 Naumure (W. Rapti) 245.0 –– W-03 Chera-2 104.3 ––E-02 Dukh Koshi-2 456.6 9 (E4) W-10 Sharada - 2 96.8 –– E-02 Dukh Koshi-2 456.6 8 (E3)E-06 Kokhajor-1 111.5 10 (E5) E-12 Tama Koss-3 287.0 9 (E3) E-12 Tama Koss-3 287.0 9 (E4)C-02 Lower Badigad 380.3 C-02 Lower Badigad 380.3 10 (C2) W-01 Barbung Khola 122.9 ––C-08 Andhi Khola 180.0 C-11 Madi- Ishaneshor 86.0 E-17 Sunkosi No.3 536.0 10 (E5)W-03 Chera-2 104.3 W-03 Chera-2 104.3 C-02 Lower Badigad 380.3C-11 Madi- Ishaneshor 86.0 E-02 Dukh Koshi-2 456.6 E-10 Rosi-2 106.5W-01 Barbung Khola 122.9 W-22 SR-6 642.0 C-08 Andhi Khola 180.0W-21 Thapna 500.0 W-01 Barbung Khola 122.9 E-09 Piluwa-2 107.3E-10 Rosi-2 106.5 E-06 Kokhajor-1 111.5 W-11 Thuli Gad - 2 119.7E-09 Piluwa-2 107.3 E-10 Rosi-2 106.5 C-11 Madi- Ishaneshor 86.0W-11 Thuli Gad - 2 119.7 W-11 Thuli Gad - 2 119.7 W-24 Sarada Babai 75.0E-20 Indrawati 91.2 C-01 Kaligandaki-Modi 816.4 W-21 Thapna 500.0
W-22 SR-6 642.0 E-20 Indrawati 91.2 E-20 Indrawati 91.2C-01 Kaligandaki-Modi 816.4 E-09 Piluwa-2 107.3 C-01 Kaligandaki-Modi 816.4W-24 Sarada Babai 75.0 W-24 Sarada Babai 75.0 W-22 SR-6 642.0C-05 Upper Daraudi 111.4 W-17 BR-4 667.0 C-05 Upper Daraudi 111.4C-18 Ridi Khola 97.0 C-18 Ridi Khola 97.0 C-18 Ridi Khola 97.0W-17 BR-4 667.0 C-03 Lower Daraudi 120.2 W-26 Lohare Khola 67.0C-03 Lower Daraudi 120.2 C-05 Upper Daraudi 111.4 W-17 BR-4 667.0W-26 Lohare Khola 67.0 W-26 Lohare Khola 67.0 C-03 Lower Daraudi 120.2
E: Eastern River Basin, C: Central River Basin, W: Western River Basin.

Nationwide Master Plan Study on Storage-type Hydroelectric Power Development in Nepal
(3) Overlap with Issued Survey and Construction License for Generation
As shown in Table 7.4-2, a large number of survey and construction licenses for generation have been issued by the Department of Electricity Development (DOED) under the Ministry of Energy to promote development of hydroelectric power by private sector.
Table 7.4-2 Issued Survey and Construction License for Generation (As of May 13, 2012)
Item Number Total Capacity (MW) Remarks
Survey License
Below 1 MW 202 148.405 1 to 25 MW 175 1,087.899
25 to 100 MW 52 2,766.600 Above 100 MW 29 8,470.000
Construction License 74 1,777.556 Including existing and under construction Source: DOED’s website
NEA and the Study Team checked the locations of projects ranked near the top against the survey and construction licenses (1 MW or more) issued as of May 13, 2012, and found that the locations of following four projects overlapped with the project areas of issued licenses. NEA and the Study Team sought a comment from the DOED on the likelihood of implementation of the projects selected in this study in the project area of issued license.
Tila-1 (W-12, 617.2 MW) Bhanakot (W-20, 810 MW) Tama Koshi-3 (E-12, 287 MW) Dudh Koshi-2 (E-02, 156.6 MW)
According to the DOED, even if storage-type projects make effective use of river water more than ROR type projects, it is difficult to develop storage-type projects at the site where licenses have already been issued to another agency/company, and it is better not to include these projects in the promising projects of the Study. Taking this into consideration, NEA and the Study Team decided that these four projects should not be selected as the promising projects.
In the column “Ranking (1)” in Table 7.4-3, the promising projects excluding the above-mentioned four projects (shaded projects) are shown.
Final Report Appendix 3 SEA Report
113
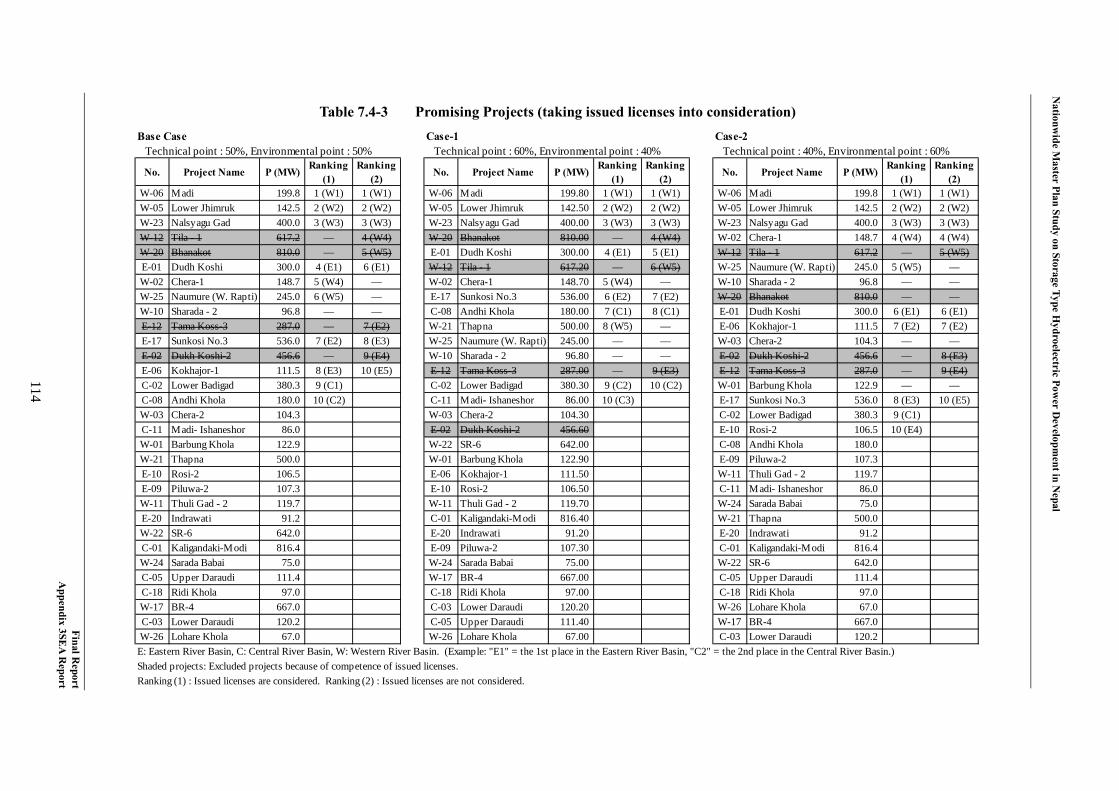
N
ationwide M
aster Plan Study on Storage Type Hydroelectric Pow
er Developm
ent in Nepal
Final Report
Appendix 3SE
A Report
114
Table 7.4-3 Promising Projects (taking issued licenses into consideration)
Base Case Case-1 Case-2 Technical point : 50%, Environmental point : 50% Technical point : 60%, Environmental point : 40% Technical point : 40%, Environmental point : 60%
No. Project Name P (MW)Ranking
(1)Ranking
(2)No. Project Name P (MW)
Ranking(1)
Ranking(2)
No. Project Name P (MW)Ranking
(1)Ranking
(2)W-06 Madi 199.8 1 (W1) 1 (W1) W-06 Madi 199.80 1 (W1) 1 (W1) W-06 Madi 199.8 1 (W1) 1 (W1)W-05 Lower Jhimruk 142.5 2 (W2) 2 (W2) W-05 Lower Jhimruk 142.50 2 (W2) 2 (W2) W-05 Lower Jhimruk 142.5 2 (W2) 2 (W2)W-23 Nalsyagu Gad 400.0 3 (W3) 3 (W3) W-23 Nalsyagu Gad 400.00 3 (W3) 3 (W3) W-23 Nalsyagu Gad 400.0 3 (W3) 3 (W3)W-12 Tila - 1 617.2 –– 4 (W4) W-20 Bhanakot 810.00 –– 4 (W4) W-02 Chera-1 148.7 4 (W4) 4 (W4)W-20 Bhanakot 810.0 –– 5 (W5) E-01 Dudh Koshi 300.00 4 (E1) 5 (E1) W-12 Tila - 1 617.2 –– 5 (W5)E-01 Dudh Koshi 300.0 4 (E1) 6 (E1) W-12 Tila - 1 617.20 –– 6 (W5) W-25 Naumure (W. Rapti) 245.0 5 (W5) ––W-02 Chera-1 148.7 5 (W4) –– W-02 Chera-1 148.70 5 (W4) –– W-10 Sharada - 2 96.8 –– ––W-25 Naumure (W. Rapti) 245.0 6 (W5) –– E-17 Sunkosi No.3 536.00 6 (E2) 7 (E2) W-20 Bhanakot 810.0 –– ––W-10 Sharada - 2 96.8 –– –– C-08 Andhi Khola 180.00 7 (C1) 8 (C1) E-01 Dudh Koshi 300.0 6 (E1) 6 (E1)E-12 Tama Koss-3 287.0 –– 7 (E2) W-21 Thapna 500.00 8 (W5) –– E-06 Kokhajor-1 111.5 7 (E2) 7 (E2)E-17 Sunkosi No.3 536.0 7 (E2) 8 (E3) W-25 Naumure (W. Rapti) 245.00 –– –– W-03 Chera-2 104.3 –– ––E-02 Dukh Koshi-2 456.6 –– 9 (E4) W-10 Sharada - 2 96.80 –– –– E-02 Dukh Koshi-2 456.6 –– 8 (E3)E-06 Kokhajor-1 111.5 8 (E3) 10 (E5) E-12 Tama Koss-3 287.00 –– 9 (E3) E-12 Tama Koss-3 287.0 –– 9 (E4)C-02 Lower Badigad 380.3 9 (C1) C-02 Lower Badigad 380.30 9 (C2) 10 (C2) W-01 Barbung Khola 122.9 –– ––C-08 Andhi Khola 180.0 10 (C2) C-11 Madi- Ishaneshor 86.00 10 (C3) E-17 Sunkosi No.3 536.0 8 (E3) 10 (E5)W-03 Chera-2 104.3 W-03 Chera-2 104.30 C-02 Lower Badigad 380.3 9 (C1)C-11 Madi- Ishaneshor 86.0 E-02 Dukh Koshi-2 456.60 E-10 Rosi-2 106.5 10 (E4)W-01 Barbung Khola 122.9 W-22 SR-6 642.00 C-08 Andhi Khola 180.0W-21 Thapna 500.0 W-01 Barbung Khola 122.90 E-09 Piluwa-2 107.3E-10 Rosi-2 106.5 E-06 Kokhajor-1 111.50 W-11 Thuli Gad - 2 119.7E-09 Piluwa-2 107.3 E-10 Rosi-2 106.50 C-11 Madi- Ishaneshor 86.0W-11 Thuli Gad - 2 119.7 W-11 Thuli Gad - 2 119.70 W-24 Sarada Babai 75.0E-20 Indrawati 91.2 C-01 Kaligandaki-Modi 816.40 W-21 Thapna 500.0W-22 SR-6 642.0 E-20 Indrawati 91.20 E-20 Indrawati 91.2C-01 Kaligandaki-Modi 816.4 E-09 Piluwa-2 107.30 C-01 Kaligandaki-Modi 816.4W-24 Sarada Babai 75.0 W-24 Sarada Babai 75.00 W-22 SR-6 642.0C-05 Upper Daraudi 111.4 W-17 BR-4 667.00 C-05 Upper Daraudi 111.4C-18 Ridi Khola 97.0 C-18 Ridi Khola 97.00 C-18 Ridi Khola 97.0W-17 BR-4 667.0 C-03 Lower Daraudi 120.20 W-26 Lohare Khola 67.0C-03 Lower Daraudi 120.2 C-05 Upper Daraudi 111.40 W-17 BR-4 667.0W-26 Lohare Khola 67.0 W-26 Lohare Khola 67.00 C-03 Lower Daraudi 120.2E: Eastern River Basin, C: Central River Basin, W: Western River Basin. (Example: "E1" = the 1st place in the Eastern River Basin, "C2" = the 2nd place in the Central River Basin.)Shaded projects: Excluded projects because of competence of issued licenses.Ranking (1) : Issued licenses are considered. Ranking (2) : Issued licenses are not considered.

Nationwide Master Plan Study on Storage-type Hydroelectric Power Development in Nepal
(4) Selection of Promising Projects
As shown in Table 7.4-4, for all cases, the total installed capacity of the promising projects was about 2,600 MW, 1.2 time of the required total installed capacity of promising projects.
There were 13 projects were selected in total, and seven projects were selected as the promising projects in all cases, three projects in two cases, and three projects in one case.
Taking this into consideration, seven projects selected in all cases and three projects selected in two cases (with “” in Table 7.4-4) were selected as the promising projects.
Table 7.4-4 Selection of Promising Projects
Table 7.4-5 shows the promising projects that were finally selected.
Table 7.4-5 Promising Projects
No. Project Name P (MW) Base Case Case-1 Case-2Number of
selectedproject
PromisingProject
E-01 Dudh Koshi 300.0 E1 E1 E1 3 E-06 Kokhajor-1 111.5 E3 –– E2 2 E-10 Rosi-2 106.5 –– –– E4 1E-17 Sunkosi No.3 536.0 E2 E2 E3 3 C-02 Lower Badigad 380.3 C1 C2 C1 3 C-08 Andhi Khola 180.0 C2 C1 –– 2 C-11 Madi- Ishaneshor 86.0 –– C3 –– 1W-02 Chera-1 148.7 W4 W4 W4 3 W-05 Lower Jhimruk 142.5 W2 W2 W2 3 W-06 Madi 199.8 W1 W1 W1 3 W-21 Thapna 500.0 –– W5 –– 1W-23 Nalsyagu Gad 400.0 W3 W3 W3 3 W-25 Naumure (W. Rapti) 245.0 W5 –– W5 2
2,643.8 2,873.3 2,570.3 –– 2,643.8E: Eastern River Basin, C: Central River Basin, W: Western River Basin. Example: "E1" = the 1st place in the Eastern River Basin, "C2" = the 2nd place in the Central River Basin.
Total Installed Capacity (MW)
No. Project Name P (MW)E-01 Dudh Koshi 300.0E-06 Kokhajor-1 111.5E-17 Sunkosi No.3 536.0C-02 Lower Badigad 380.3C-08 Andhi Khola 180.0W-02 Chera-1 148.7W-05 Lower Jhimruk 142.5W-06 Madi 199.8W-23 Nalsyagu Gad 400.0W-25 Naumure (W. Rapti) 245.0
2,643.8Total Installed Capacity (MW)
Final Report Appendix 3 SEA Report
115

Nationwide Master Plan Study on Storage-type Hydroelectric Power Development in Nepal
Chapter 8 Third Step
Project Description 8.1
At the third step 10 Promising Projects (See Table 8.1-1 and Figure 8.1-1) are examined. These 10 projects were selected from 31 Candidate Projects. These are examined based on the data obtained by brief site survey.
Table 8.1-1 Promising Projects on the third Step (10 projects)
Project District Installed Capacity
(MW)
Dam Height
(m)
Full Supply Level (m)
Reservoir Area (km2)
Annual Energy (GWh)
Project Cost
(MUS$)
E-01 Dudh Koshi Okhaldhunga, Khotang, Solukhumbu
300.0 180 580 11.1 1,910 1,144
E-06 Kokhajor-1 Sinduli, Kabhrepalanchok
111.5 107 437 4.6 279 477
E-17 Sun Koshi No.3 Ramechhap, Kabhrepalanchok, Sindhupalchok
536.0 140 700 30.1 1,884 1,691
C-02 Lower Badigad Gulmi 380.3 191 688 13.7 1,366 1,210 C-08 Andhi Khola Syangja 180.0 157 675 5.5 649 666 W-02 Chera-1 Jajarkot 148.7 186 866 4.0 563 577 W-05 Lower Jhimruk Arghakhachi,
Pyuthan 142.5 167 597 6.0 455 521
W-06 Madi Rolpa 199.8 190 1,090 7.7 621 637 W-23 Nalsyau Gad Jajarkot 410.0 200 1,570 6.3 1,406 967 W-25 Naumure
(W. Rapti) Argakhanchi, Pyuthan
245.0 190 517 19.8 1,158 955
Final Report Appendix 3 SEA Report
116

Nationwide Master Plan Study on Storage-type Hydroelectric Power Development in Nepal
Figure 8.1-1 Location of Promising Projects on the third Step
The locations of promising projects are plotted in the isohyetal map and seismic hazard map of Nepal as follows. (See Figure 8.1-2 and Figure 8.1-3)
Figure 8.1-2 Locations of Promising Projects in Isohyetal Map
Final ReportAppendix 3 SEA Report
117
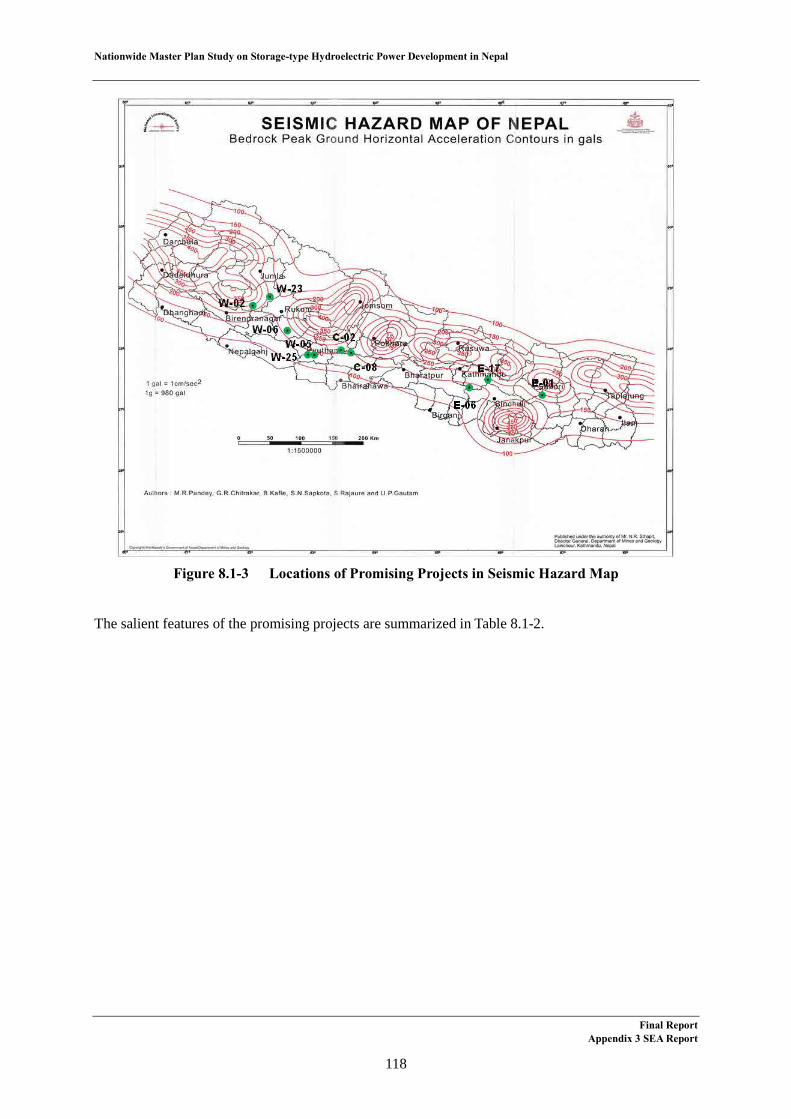
Nationwide Master Plan Study on Storage-type Hydroelectric Power Development in Nepal
Figure 8.1-3 Locations of Promising Projects in Seismic Hazard Map
The salient features of the promising projects are summarized in Table 8.1-2.
Final ReportAppendix 3 SEA Report
118

Nationwide Master Plan Study on Storage-type Hydroelectric Power Development in Nepal
Table 8.1-2 Salient Features of Promising Projects
No. Unit E-01 E-06 E-17 C-02 C-08 W-02 W-05 W-06 W-23 W-25
Project NameDudhKoshi
Kokhajor-1
Sun KoshiNo.3
LowerBadigad
AndhiKhola
Chera-1Lower
JhimrukMadi
NalsyauGad
Naumure (W. Rapti)
Installed Capacity MW 300.0 111.5 536.0 380.3 180.0 148.7 142.5 199.8 410.0 245.0
Catchment Area km2 4,100.0 281.0 5,520.0 2,050.0 475.0 809.0 995.0 674.0 571.5 3,430.0
Dam Height m 180.0 107.0 140.0 191.0 157.0 186.0 167.0 190.0 200.0 190.0
Total StorageVolume
MCM 687.4 218.7 1,220.0 995.9 336.5 254.9 386.0 359.5 419.6 1,021.0
Effective StorageVolume
MCM 442.1 166.1 555.0 505.5 238.7 141.1 211.6 235.1 296.3 580.0
Reservoir Area km2 11.1 4.6 30.1 13.7 5.5 4.0 6.0 7.7 6.3 19.8
Full Supply Level m 580.0 437.0 700.0 688.0 675.0 866.0 597.0 1,090.0 1,570.0 517.0
Minimum OperatingLevel
m 530.0 390.0 674.0 654.0 626.7 814.0 557.0 1,030.0 1,498.0 474.2
Tail Water Level m 303.4 200.0 575.0 475.0 368.5 640.0 390.0 800.0 872.0 358.0
Rated Gross Head m 275.0 226.3 116.3 196.0 307.0 220.0 194.6 280.8 649.3 162.6
Rated Net Head m 249.3 205.6 109.3 192.5 286.3 217.6 190.4 277.0 635.5 154.5
Rated PowerDischarge m3/sec 136.0 63.9 570.0 232.6 81.4 80.5 88.1 84.9 75.0 185.6
Total Energy GWh 1,909.6 278.9 1,883.6 1,366.0 648.7 563.2 454.7 621.1 1,406.1 1,157.5
Dry Energy GWh 523.3 94.1 335.9 354.7 137.1 120.6 94.4 170.7 581.8 309.9
Length of AccessRoad
km 65.0 22.0 20.0 0 8.0 5.5 18.0 15.0 25.0 34.0
Length ofTransmission Line
km 43.0 62.0 35.0 49.0 49.0 66.0 75.0 62.0 112.0 79.0
Project Cost MUS$ 1,144.0 476.5 1,690.5 1,209.8 665.8 576.9 520.9 637.3 966.9 954.5
Unit GenerationCost
¢/kWh 6.0 17.1 9.0 8.9 10.3 10.2 11.5 10.3 6.9 8.2
EIRR (8% of InterestRate, 12NRs/kWh) % 17.6 7.6 13.1 13.2 13.0 12.6 10.9 12.3 15.6 15.2
FIRR (8% of InterestRate, 12NRs/kWh) % 30.0 n.a. 19.4 19.8 19.1 17.8 11.5 16.8 25.8 25.3
Forest Land to besubmerged km2 4.1 2.9 8.2 3.3 1.5 1.5 1.9 1.6 0.8 7.9
DownstreamProtected Area
nos 2 1 2 3 3 3 2 2 3 2
Protected Species inthe Project Area
nos 20 11 18 17 15 16 19 15 8 20
Dewatering Area km 60 21 1 4 60 7 8 10 11 1
Reported Fishspecies
nos 24 7 21 12 6 11 11 8 8 16
Resettlement(Household)
nos 63 92 1,599 1,606 542 566 229 336 263 456
Cultivated land to besubmerged km2 3.3 1.7 9.4 5.9 1.7 1.1 2.0 1.9 2.5 6.1
Fishermen nos 154 - 712 217 156 25 254 100 115 43
Road to besubmerged
km 5 - 39 26 3 4 3 11 - 2
Final Report Appendix 3 SEA Report
119

Nationwide Master Plan Study on Storage-type Hydroelectric Power Development in Nepal
The source reports of the promising projects are shown in Table 8.1-3.
Table 8.1-3 Source Reports of Promising Projects
No. Project Name Source Report E-01 Dudh Koshi Dudh Koshi Hydroelectric Project Feasibility Study, 1998, CIWEC
(Canadian International Water and Energy Consultants) E-06 Kokhajor-1 Update and Review of Identification and Feasibility Study of Storage
Project, 2002, NEA E-17 Sun Koshi No.3 Master Plan Study on the Koshi River Water Resources Development,
1985, JICA C-02 Lower Badigad Update and Review of Identification and Feasibility Study of Storage
Project, 2002, NEA C-08 Andhi Khola Feasibility Study on Andhi Khola Hydroelectric Project, 1998, NEA W-02 Chera-1 Update and Review of Identification and Feasibility Study of Storage
Project, 2002, NEA W-05 Lower Jhimruk Update and Review of Identification and Feasibility Study of Storage
Project, 2002, NEA W-06 Madi Update and Review of Identification and Feasibility Study of Storage
Project, 2002, NEA W-23 Nalsyau Gad Nalsyau Gad Storage Hydroelctric Project Feasibility Study,
Executive Summary, 2012, NEA W-25 Naumure (W.Rapti) Naumure (W.Rapti) Hydroelectric Project Pre-Feasibility Study,
1990, NEA
In addition to above, the following master plan studies have been conducted in terms of storage-type hydroelectric power projects.
• Identification and Feasibility Study of Project, 2000-2004, NEA
• Master Plan of Hydroelectric Development in Nepal, 1974, JICA
• Gandaki River Basin Power Study, Basin Study, Basin Master Plan, 1979, UNDP
• Master Plan Study for Water Resource Development of the Upper River and Mahakali River Basin, 1993, JICA
• Medium Hydropower Study Project, Power Sector Efficiency Project, 1997, World Bank and CIWEC
Furthermore, the following studies such as Pre-FS, FS, etc. have been conducted for storage-type hydroelectric power projects.
• FS and DD on Budhi Gandaki Project, since 2012, GON
• Review of Indrawati Hydroelectric Project, 2011, NEA
• Detailed Survey on Tamor (Terathum) Project, 2010, NEA
• FS on Seti-Trisuli Project, 2005, NEA
• FS on -Ishaneshore Hydroelectric Project, 2002, NEA
Final Report Appendix 3 SEA Report
120

Nationwide Master Plan Study on Storage-type Hydroelectric Power Development in Nepal
• Pre-FS on Utter Ganga Project, 2004, NEA
• Detailed Engineering on West Seti Project, 1997, GON
• FS on Kankai Project 1985, NEA
• Pre-FS on Kali Gandaki-2 Hydroelectric Project, 1985, NEA
• Preliminary Study on Thuligad, Seti-SR1 and Sarda -Kalleri, MOWR
• Bag-Mati Multipurpose Project, 1981, GON
The general layout and salient features of each promising project is shown from next page.
Final Report Appendix 3 SEA Report
121
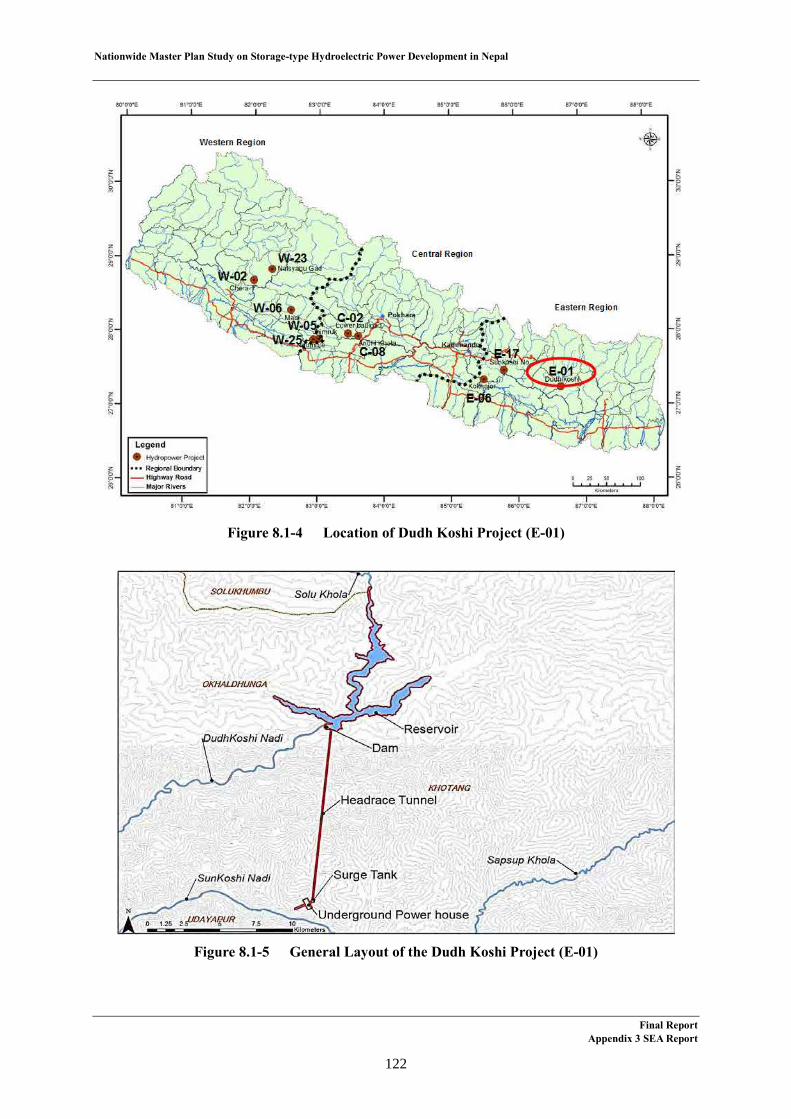
Nationwide Master Plan Study on Storage-type Hydroelectric Power Development in Nepal
Figure 8.1-4 Location of Dudh Koshi Project (E-01)
Figure 8.1-5 General Layout of the Dudh Koshi Project (E-01)
Final ReportAppendix 3 SEA Report
122

Nationwide Master Plan Study on Storage-type Hydroelectric Power Development in Nepal
Table 8.1-4 Salient Features of the Dudh Koshi Project (E-01)
Item Unit Dudh Koshi Project
Installed Capacity MW 300.0
Catchment Area km2 4,100.0
Dam Height m 180.0
Total Storage Volume MCM 687.4
Effective Storage Volume MCM 442.1
Reservoir Area km2 11.1
Full Supply Level m 580.0
Minimum Operating Level m 530.0
Tail Water Level m 303.4
Rated Gross Head m 275.0
Rated Net Head m 249.3
Rated Power Discharge m3/sec 136.0
Total Energy GWh 1,909.6
Dry Energy GWh 523.3
Length of Access Road km 65.0
Length of Transmission Line km 43.0
Project Cost MUS$ 1,144.0
Unit Generation Cost ¢/kWh 6.0
EIRR (8% of Interest Rate, 12NRs/kWh) % 17.6
FIRR (8% of Interest Rate, 12NRs/kWh) % 30.0
Forest Land to be submerged km2 4.1
Downstream Protected Area nos 2
Protected Species in the Project Area nos 20
Dewatering Area km 60
Reported Fish species nos 24
Resettlement (Household) nos 63
Cultivated land to be submerged km2 3.30
Fishermen nos 154
Road to be submerged km 5
Final Report Appendix 3 SEA Report
123
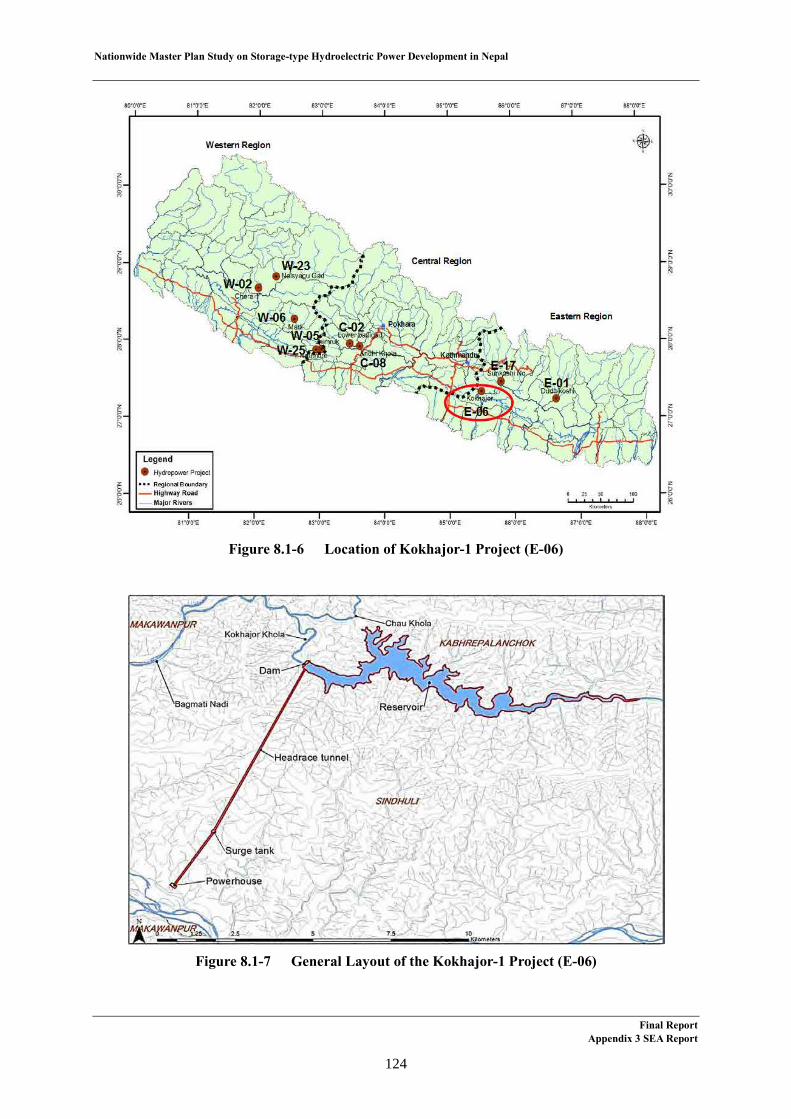
Nationwide Master Plan Study on Storage-type Hydroelectric Power Development in Nepal
Figure 8.1-6 Location of Kokhajor-1 Project (E-06)
Figure 8.1-7 General Layout of the Kokhajor-1 Project (E-06)
Final ReportAppendix 3 SEA Report
124
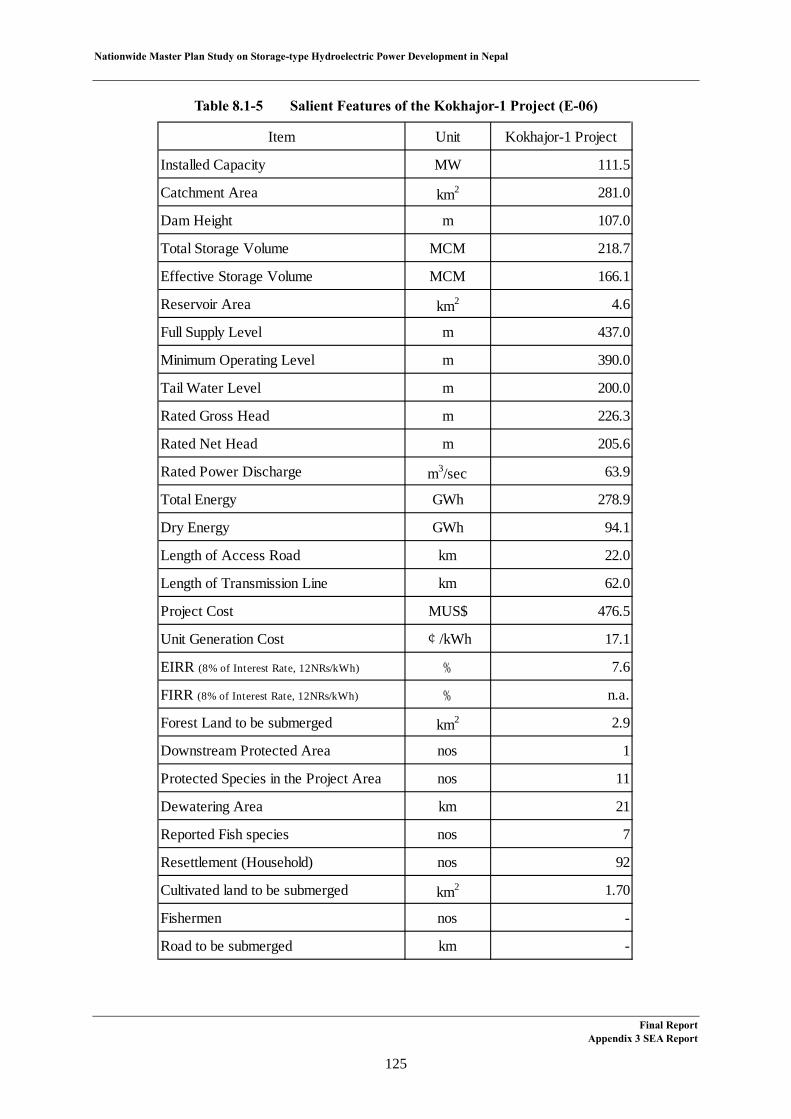
Nationwide Master Plan Study on Storage-type Hydroelectric Power Development in Nepal
Table 8.1-5 Salient Features of the Kokhajor-1 Project (E-06)
Item Unit Kokhajor-1 Project
Installed Capacity MW 111.5
Catchment Area km2 281.0
Dam Height m 107.0
Total Storage Volume MCM 218.7
Effective Storage Volume MCM 166.1
Reservoir Area km2 4.6
Full Supply Level m 437.0
Minimum Operating Level m 390.0
Tail Water Level m 200.0
Rated Gross Head m 226.3
Rated Net Head m 205.6
Rated Power Discharge m3/sec 63.9
Total Energy GWh 278.9
Dry Energy GWh 94.1
Length of Access Road km 22.0
Length of Transmission Line km 62.0
Project Cost MUS$ 476.5
Unit Generation Cost ¢/kWh 17.1
EIRR (8% of Interest Rate, 12NRs/kWh) % 7.6
FIRR (8% of Interest Rate, 12NRs/kWh) % n.a.
Forest Land to be submerged km2 2.9
Downstream Protected Area nos 1
Protected Species in the Project Area nos 11
Dewatering Area km 21
Reported Fish species nos 7
Resettlement (Household) nos 92
Cultivated land to be submerged km2 1.70
Fishermen nos -
Road to be submerged km -
Final Report Appendix 3 SEA Report
125

Nationwide Master Plan Study on Storage-type Hydroelectric Power Development in Nepal
Figure 8.1-8 Location of Sun Koshi No.3 Project (E-17)
Figure 8.1-9 General Layout of the Sun Koshi No.3 Project (E-17)
Final ReportAppendix 3 SEA Report
126

Nationwide Master Plan Study on Storage-type Hydroelectric Power Development in Nepal
Table 8.1-6 Salient Features of the Sun Koshi No.3 Project (E-17)
Item Unit Sun Koshi No.3 Project
Installed Capacity MW 536.0
Catchment Area km2 5,520.0
Dam Height m 140.0
Total Storage Volume MCM 1,220.0
Effective Storage Volume MCM 555.0
Reservoir Area km2 30.1
Full Supply Level m 700.0
Minimum Operating Level m 674.0
Tail Water Level m 575.0
Rated Gross Head m 116.3
Rated Net Head m 109.3
Rated Power Discharge m3/sec 570.0
Total Energy GWh 1,883.6
Dry Energy GWh 335.9
Length of Access Road km 20.0
Length of Transmission Line km 35.0
Project Cost MUS$ 1,690.5
Unit Generation Cost ¢/kWh 9.0
EIRR (8% of Interest Rate, 12NRs/kWh) % 13.1
FIRR (8% of Interest Rate, 12NRs/kWh) % 19.4
Forest Land to be submerged km2 8.2
Downstream Protected Area nos 2
Protected Species in the Project Area nos 18
Dewatering Area km 1
Reported Fish species nos 21
Resettlement (Household) nos 1,599
Cultivated land to be submerged km2 9.40
Fishermen nos 712
Road to be submerged km 39
Final Report Appendix 3 SEA Report
127

Nationwide Master Plan Study on Storage-type Hydroelectric Power Development in Nepal
Figure 8.1-10 Location of Lower Badigad Project (C-02)
Figure 8.1-11 General Layout of the Lower Badigad Project (C-02)
Final ReportAppendix 3 SEA Report
128
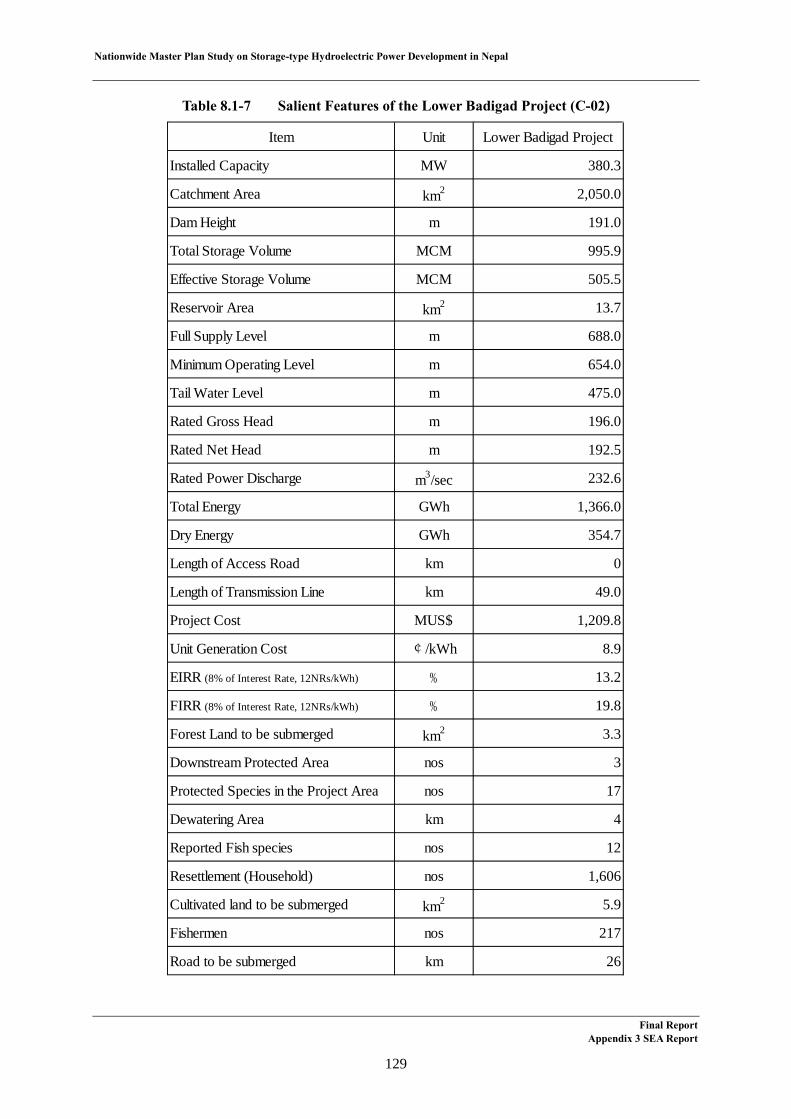
Nationwide Master Plan Study on Storage-type Hydroelectric Power Development in Nepal
Table 8.1-7 Salient Features of the Lower Badigad Project (C-02)
Item Unit Lower Badigad Project
Installed Capacity MW 380.3
Catchment Area km2 2,050.0
Dam Height m 191.0
Total Storage Volume MCM 995.9
Effective Storage Volume MCM 505.5
Reservoir Area km2 13.7
Full Supply Level m 688.0
Minimum Operating Level m 654.0
Tail Water Level m 475.0
Rated Gross Head m 196.0
Rated Net Head m 192.5
Rated Power Discharge m3/sec 232.6
Total Energy GWh 1,366.0
Dry Energy GWh 354.7
Length of Access Road km 0
Length of Transmission Line km 49.0
Project Cost MUS$ 1,209.8
Unit Generation Cost ¢/kWh 8.9
EIRR (8% of Interest Rate, 12NRs/kWh) % 13.2
FIRR (8% of Interest Rate, 12NRs/kWh) % 19.8
Forest Land to be submerged km2 3.3
Downstream Protected Area nos 3
Protected Species in the Project Area nos 17
Dewatering Area km 4
Reported Fish species nos 12
Resettlement (Household) nos 1,606
Cultivated land to be submerged km2 5.9
Fishermen nos 217
Road to be submerged km 26
Final Report Appendix 3 SEA Report
129

Nationwide Master Plan Study on Storage-type Hydroelectric Power Development in Nepal
Figure 8.1-12 Location of Andhi Khola Project (C-08)
Figure 8.1-13 General Layout of the Andhi Khola Project (C-08)
Final ReportAppendix 3 SEA Report
130

Nationwide Master Plan Study on Storage-type Hydroelectric Power Development in Nepal
Table 8.1-8 Salient Features of the Andhi Khola Project (C-08)
Item Unit Andhi Khola Project
Installed Capacity MW 180.0
Catchment Area km2 475.0
Dam Height m 157.0
Total Storage Volume MCM 336.5
Effective Storage Volume MCM 238.7
Reservoir Area km2 5.5
Full Supply Level m 675.0
Minimum Operating Level m 626.7
Tail Water Level m 368.5
Rated Gross Head m 307.0
Rated Net Head m 286.3
Rated Power Discharge m3/sec 81.4
Total Energy GWh 648.7
Dry Energy GWh 137.1
Length of Access Road km 8.0
Length of Transmission Line km 49.0
Project Cost MUS$ 665.8
Unit Generation Cost ¢/kWh 10.3
EIRR (8% of Interest Rate, 12NRs/kWh) % 13.0
FIRR (8% of Interest Rate, 12NRs/kWh) % 19.1
Forest Land to be submerged km2 1.5
Downstream Protected Area nos 3
Protected Species in the Project Area nos 15
Dewatering Area km 60
Reported Fish species nos 6
Resettlement (Household) nos 542
Cultivated land to be submerged km2 1.7
Fishermen nos 156
Road to be submerged km 3
Final Report Appendix 3 SEA Report
131
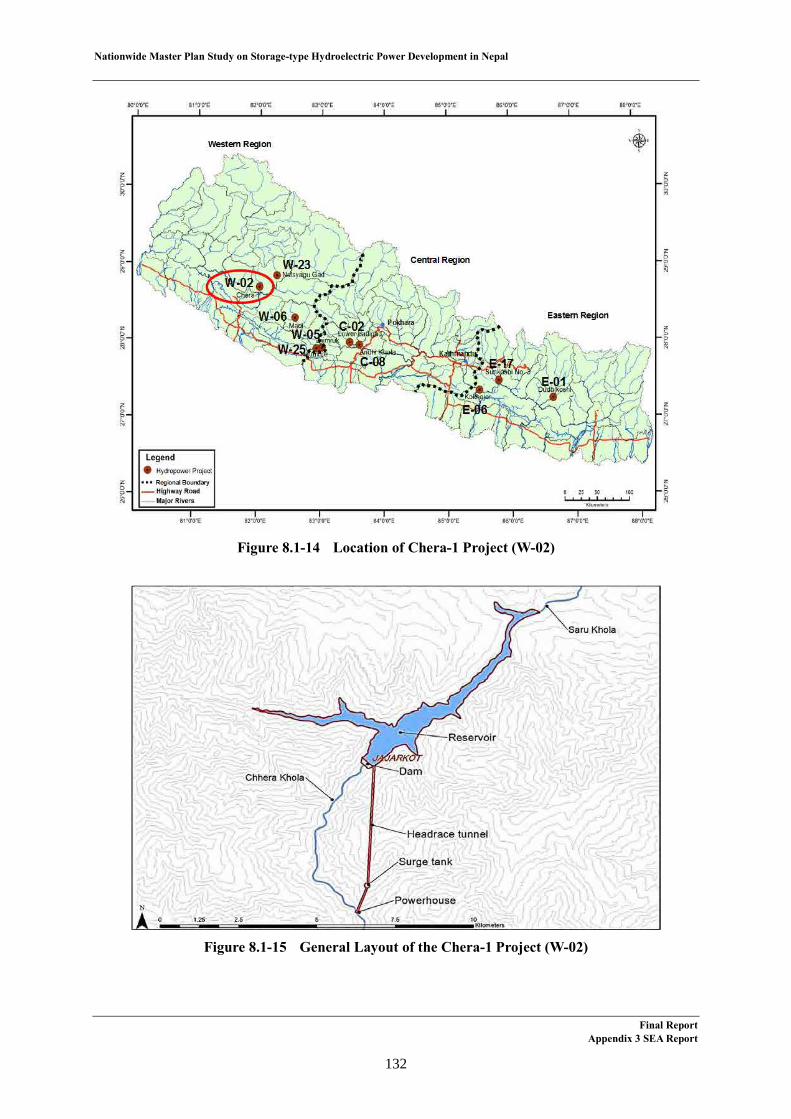
Nationwide Master Plan Study on Storage-type Hydroelectric Power Development in Nepal
Figure 8.1-14 Location of Chera-1 Project (W-02)
Figure 8.1-15 General Layout of the Chera-1 Project (W-02)
Final ReportAppendix 3 SEA Report
132

Nationwide Master Plan Study on Storage-type Hydroelectric Power Development in Nepal
Table 8.1-9 Salient Features of the Chera-1 Project (W-02)
Item Unit Chera-1 Project
Installed Capacity MW 148.7
Catchment Area km2 809.0
Dam Height m 186.0
Total Storage Volume MCM 254.9
Effective Storage Volume MCM 141.1
Reservoir Area km2 4.0
Full Supply Level m 866.0
Minimum Operating Level m 814.0
Tail Water Level m 640.0
Rated Gross Head m 220.0
Rated Net Head m 217.6
Rated Power Discharge m3/sec 80.5
Total Energy GWh 563.2
Dry Energy GWh 120.6
Length of Access Road km 5.5
Length of Transmission Line km 66.0
Project Cost MUS$ 576.9
Unit Generation Cost ¢/kWh 10.2
EIRR (8% of Interest Rate, 12NRs/kWh) % 12.6
FIRR (8% of Interest Rate, 12NRs/kWh) % 17.8
Forest Land to be submerged km2 1.5
Downstream Protected Area nos 3
Protected Species in the Project Area nos 16
Dewatering Area km 7
Reported Fish species nos 11
Resettlement (Household) nos 566
Cultivated land to be submerged km2 1.1
Fishermen nos 25
Road to be submerged km 4
Final Report Appendix 3 SEA Report
133
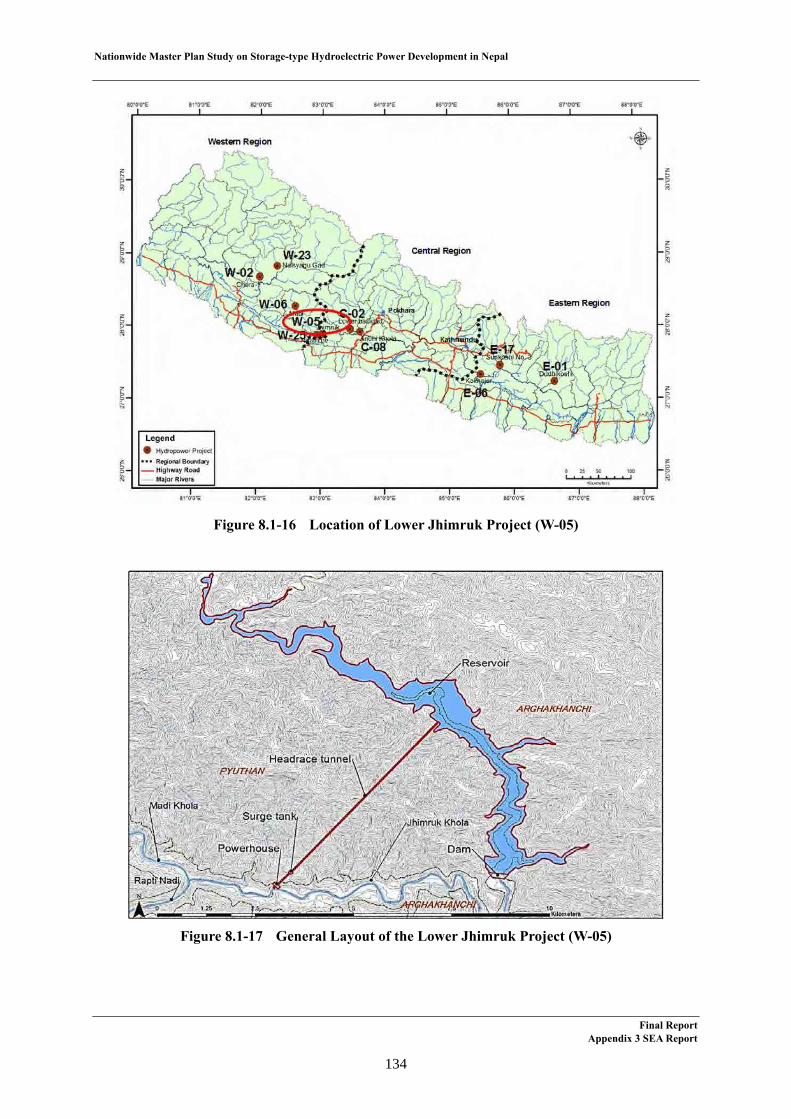
Nationwide Master Plan Study on Storage-type Hydroelectric Power Development in Nepal
Final Report Appendix 3 SEA Report
134
Figure 8.1-16 Location of Lower Jhimruk Project (W-05)
Figure 8.1-17 General Layout of the Lower Jhimruk Project (W-05)

Nationwide Master Plan Study on Storage-type Hydroelectric Power Development in Nepal
Table 8.1-10 Salient Features of the Lower Jhimruk Project (W-05)
Item Unit Lower Jhimruk Project
Installed Capacity MW 142.5
Catchment Area km2 995.0
Dam Height m 167.0
Total Storage Volume MCM 386.0
Effective Storage Volume MCM 211.6
Reservoir Area km2 6.0
Full Supply Level m 597.0
Minimum Operating Level m 557.0
Tail Water Level m 390.0
Rated Gross Head m 194.6
Rated Net Head m 190.4
Rated Power Discharge m3/sec 88.1
Total Energy GWh 454.7
Dry Energy GWh 94.4
Length of Access Road km 18.0
Length of Transmission Line km 75.0
Project Cost MUS$ 520.9
Unit Generation Cost ¢/kWh 11.5
EIRR (8% of Interest Rate, 12NRs/kWh) % 10.9
FIRR (8% of Interest Rate, 12NRs/kWh) % 11.5
Forest Land to be submerged km2 1.9
Downstream Protected Area nos 2
Protected Species in the Project Area nos 19
Dewatering Area km 8
Reported Fish species nos 11
Resettlement (Household) nos 229
Cultivated land to be submerged km2 2.0
Fishermen nos 254
Road to be submerged km 3
Final Report Appendix 3 SEA Report
135
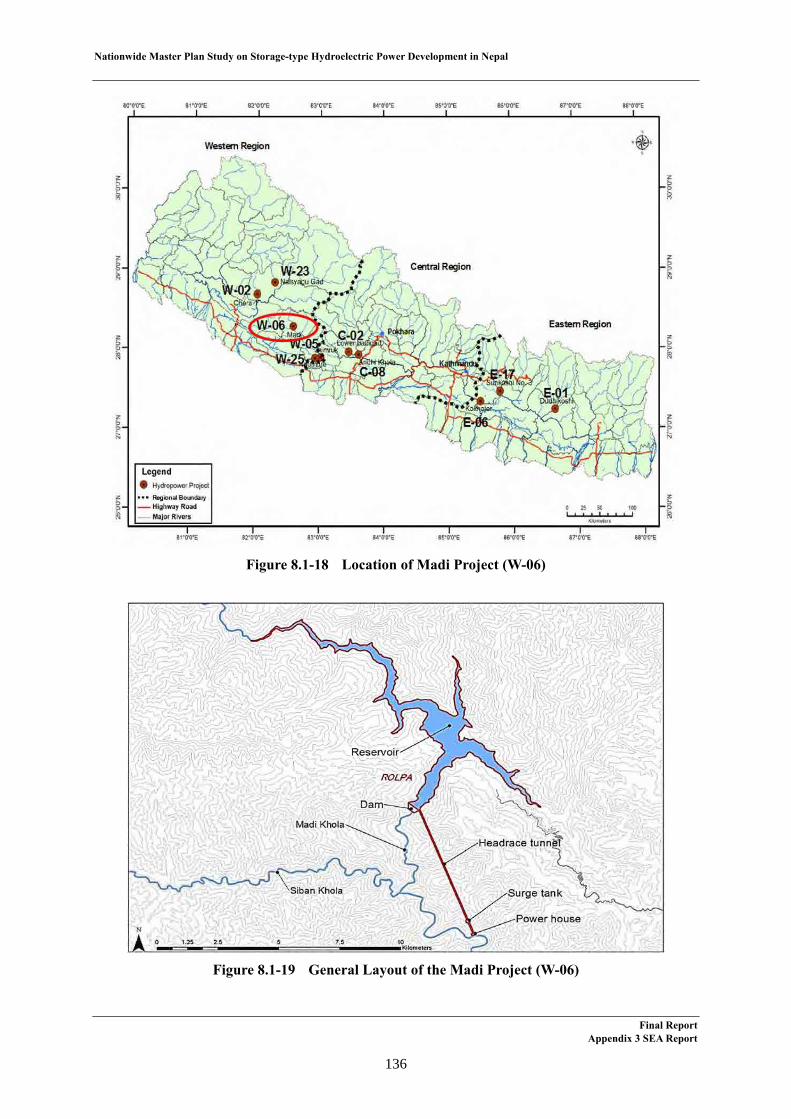
Nationwide Master Plan Study on Storage-type Hydroelectric Power Development in Nepal
Final Report Appendix 3 SEA Report
136
Figure 8.1-18 Location of Madi Project (W-06)
Figure 8.1-19 General Layout of the Madi Project (W-06)

Nationwide Master Plan Study on Storage-type Hydroelectric Power Development in Nepal
Table 8.1-11 Salient Features of the Madi Project (W-06)
Item Unit Madi Project
Installed Capacity MW 199.8
Catchment Area km2 674.0
Dam Height m 190.0
Total Storage Volume MCM 359.5
Effective Storage Volume MCM 235.1
Reservoir Area km2 7.7
Full Supply Level m 1,090.0
Minimum Operating Level m 1,030.0
Tail Water Level m 800.0
Rated Gross Head m 280.8
Rated Net Head m 277.0
Rated Power Discharge m3/sec 84.9
Total Energy GWh 621.1
Dry Energy GWh 170.7
Length of Access Road km 15.0
Length of Transmission Line km 62.0
Project Cost MUS$ 637.3
Unit Generation Cost ¢/kWh 10.3
EIRR (8% of Interest Rate, 12NRs/kWh) % 12.3
FIRR (8% of Interest Rate, 12NRs/kWh) % 16.8
Forest Land to be submerged km2 1.6
Downstream Protected Area nos 2
Protected Species in the Project Area nos 15
Dewatering Area km 10
Reported Fish species nos 8
Resettlement (Household) nos 336
Cultivated land to be submerged km2 1.9
Fishermen nos 100
Road to be submerged km 11
Final Report Appendix 3 SEA Report
137

Nationwide Master Plan Study on Storage-type Hydroelectric Power Development in Nepal
Figure 8.1-20 Location of Nalsyau Gad Project (W-23)
Figure 8.1-21 General Layout of the Nalsyau Gad Project (W-23)
Final ReportAppendix 3 SEA Report
138

Nationwide Master Plan Study on Storage-type Hydroelectric Power Development in Nepal
Table 8.1-12 Salient Features of the Nalsyau Gad Project (W-23)
Item Unit Nalsyau Gad Project
Installed Capacity MW 410.0
Catchment Area km2 571.5
Dam Height m 200.0
Total Storage Volume MCM 419.6
Effective Storage Volume MCM 296.3
Reservoir Area km2 6.3
Full Supply Level m 1,570.0
Minimum Operating Level m 1,498.0
Tail Water Level m 872.0
Rated Gross Head m 649.3
Rated Net Head m 635.5
Rated Power Discharge m3/sec 75.0
Total Energy GWh 1,406.1
Dry Energy GWh 581.8
Length of Access Road km 25.0
Length of Transmission Line km 112.0
Project Cost MUS$ 966.9
Unit Generation Cost ¢/kWh 6.9
EIRR (8% of Interest Rate, 12NRs/kWh) % 15.6
FIRR (8% of Interest Rate, 12NRs/kWh) % 25.8
Forest Land to be submerged km2 0.8
Downstream Protected Area nos 3
Protected Species in the Project Area nos 8
Dewatering Area km 11
Reported Fish species nos 8
Resettlement (Household) nos 263
Cultivated land to be submerged km2 2.5
Fishermen nos 115
Road to be submerged km -
Final Report Appendix 3 SEA Report
139

Nationwide Master Plan Study on Storage-type Hydroelectric Power Development in Nepal
Figure 8.1-22 Location of Naumure (W. Rapti) Project (W-25)
Figure 8.1-23 General Layout of the Naumure (W. Rapti) Project (W-25)
Final ReportAppendix 3 SEA Report
140

Nationwide Master Plan Study on Storage-type Hydroelectric Power Development in Nepal
Table 8.1-13 Salient Features of the Naumure (W. Rapti) Project (W-25)
Item Unit Naumure Project
Installed Capacity MW 245.0
Catchment Area km2 3,430.0
Dam Height m 190.0
Total Storage Volume MCM 1,021.0
Effective Storage Volume MCM 580.0
Reservoir Area km2 19.8
Full Supply Level m 517.0
Minimum Operating Level m 474.2
Tail Water Level m 358.0
Rated Gross Head m 162.6
Rated Net Head m 154.5
Rated Power Discharge m3/sec 185.6
Total Energy GWh 1,157.5
Dry Energy GWh 309.9
Length of Access Road km 34.0
Length of Transmission Line km 79.0
Project Cost MUS$ 954.5
Unit Generation Cost ¢/kWh 8.2
EIRR (8% of Interest Rate, 12NRs/kWh) % 15.2
FIRR (8% of Interest Rate, 12NRs/kWh) % 25.3
Forest Land to be submerged km2 7.9
Downstream Protected Area nos 2
Protected Species in the Project Area nos 20
Dewatering Area km 1
Reported Fish species nos 16
Resettlement (Household) nos 456
Cultivated land to be submerged km2 6.1
Fishermen nos 43
Road to be submerged km 2
Final Report Appendix 3 SEA Report
141
Nationwide Master Plan Study on Storage-type Hydroelectric Power Development in Nepal
Scoping 8.2
The third step aims to evaluate 10 Promising projects from various points of view. Sixty three evaluation items are explained in this section.
(1) Evaluation Items and Methods
The evaluation items and evaluation criteria are basically similar to the items and criteria that were used for the evaluation of candidate projects as mentioned in Clause 7.2. However, taking into account the comments obtained in the stakeholder meeting, some evaluation items were added and some modification was made in the evaluation criteria as described below.
Technical and Economical Conditions
Hydrological Conditions
- Reliability of flow data, risk of glacier lake outburst flood (GLOF), and sedimentation.
Geological Conditions
- Geological conditions of project site, thrust and fault 1), and seismicity. 1): The name of “Natural hazard (earthquake)” in Clause 7.2 was changed.
Time to commencement of commercial operation 2) 2): In Clause 7.2, this item was evaluated as “Lead Time to Implementation of Project” by “Length
of access road,” “Difficulty level of funding,” and “Reliability of development plan (current stage of study).”
Effectiveness of Project
- Unit generation cost, installed capacity, annual energy production, and energy production in the dry season.
Impact on the Environment
Impact on the Natural Environment
- Impact on forest, impact on flora 3), impact on terrestrial fauna 3), impact on protected area, impact on aquatic fauna, and impact of transmission line 4).
3): Added items. 4): This item was moved from “Impact on social environment.”
Impact on the Social Environment
- Impact on household, etc., impact on ethnic minority, impact on agriculture, impact of fishery 5), impact on tourism, impact on infrastructure 5), and impact on rural economy and development plan 5).
5): Added items.
1) Hydrology
Same as the evaluation of candidate projects, evaluation items for hydrology are “Reliability of Final Report
Appendix 3 SEA Report
142
Nationwide Master Plan Study on Storage-type Hydroelectric Power Development in Nepal
flow data,” “Risk of glacier lake outburst flood (GLOF),” and “Sedimentation.”
a. Reliability of flow data
Evaluation method and point allocation of reliability of flow data are same as those that were used for evaluation of candidate projects, and the detail is described in Section 7.2 (1) 1) a.
The evaluation criterion for reliability of flow data is shown in Table 8.2-1.
Table 8.2-1 Evaluation Criterion for Reliability of Flow Data
Flow Data Estimated by the formula derived from the flow data gauged in the all gauging stations of Nepal
Gauged at the site but there are some missing data
Gauged at the site for 10 years
Score 0 100 × Number of existing data / (12 months × 10 years) 100
b. Risk of GLOF
Evaluation method and point allocation of risk of GLOF are same as those that were used for evaluation of candidate projects, and the detail is described in Section 7.2 (1) 1) b.
The evaluation criterion for reliability of flow data is shown in Table 8.2-2.
Table 8.2-2 Evaluation Criterion for Risk of GLOF
Number of glacial lakes identified as “potentially critical” by ICIMOD located along the upper reaches of the dam
None One or more
Low risk Medium risk High risk
Score 100 40 20 0
c. Sedimentation
Evaluation method and point allocation of sedimentation are basically same as those that were used for evaluation of candidate projects, and the detail is described in Section 7.2 (1) 1) c. However, since nine out of ten projects have same score if the same point allocation is used, the point allocation was modified to obtain appropriate evaluation result.
The evaluation criterion for sedimentation is shown in Table 8.2-3.
Table 8.2-3 Evaluation Criterion for Sedimentation
Life of Reservoir 78 (Min.) Min. - 300 years More than 300 years Score 0 Linear interpolation 100
2) Geology
Evaluation items for geology are “Geological conditions of the site,” “Natural hazard (earthquake),” and “Seismicity.” The name of “Natural hazard (earthquake)” was changed to
Final Report Appendix 3 SEA Report
143

Nationwide Master Plan Study on Storage-type Hydroelectric Power Development in Nepal
“Thrust and fault.” The detail of each evaluation method was described in Section 7.2 (1) 2).
a. Geological conditions of the site
For promising projects other than the Dudh Koshi Project and the Nalsyau Gad Project that are in FS stage, geological site survey of promising projects was conducted by a Nepalese consulting company by subcontract. Based on the survey results, geological conditions of reservoir, dam, headrace tunnel and powerhouse were separately evaluated.
Evaluation criterion for site geology is shown in Table 8.2-4.
.
Final Report Appendix 3 SEA Report
144

N
ationwide M
aster Plan Study on Storage-type Hydroelectric Pow
er Developm
ent in Nepal
Final Report
Appendix 3 SE
A Report
145
Table 8.2-4 Evaluation Criteria for Geological Conditions of Site (Basic Evaluation)
Structure Item Score State Reference*
Reservoir
100 Impervious Not karstified and most joints are tight. Water tightness 60 Medium Weakly karstified or some joints are open.
20 Pervious Karstified or most joints are open. 100 Stable Few landslides and area of dip slope is limited.
Slope Stability 60 Medium Some landslides or area of dip slopes is moderately wide. 20 Unstable Many landslides or area of dip slope is wide.
Dam
100 Hard and compact Ordinal Quartzite, Limestone, Sandstone, Phyllite and Slate. Soundness 60 Medium Ordinal Mudstone
20 Soft Softer than ordinal Mudstone
Water tightness 100 Impervious Not karstified and most joints are tight. 60 Medium Weakly karstified or some joints are open. 20 Pervious Karstified or most joints are open.
Headrace Tunnel 100 Strong Ordinal Quartzite, Limestone and Sandstone.
Soundness 60 Medium Ordinal Phyllite and Slate under thick overburden. Ordinal Mudstone or weak rocks. 20 Weak Ordinal Mudstone or weak rocks, under thick overburden.
Power House
100 Hard and compact Ordinal Quartzite, Limestone, Sandstone, Phyllite and Slate. Soundness 60 Medium Ordinal Mudstone
20 Soft Softer than ordinal Mudstone 100 Stable Few landslides and area of dip slope is limited.
Slope Stability 60 Medium Some landslides or area of dip slopes is moderately wide. 20 Unstable Many landslides or area of dip slope is wide.
* In reference of soundness, ordinal rocks are shown for example. Observed rock and its condition should be described.
N
ationwide M
aster Plan Study on Storage-type Hydroelectric Pow
er Developm
ent in Nepal
Final Report
Appendix 3 SE
A Report
146
Table 8.2-5 Evaluation Criteria for Geological Conditions of Site (Deduction of point)
Item Reference and Score of Subtract
Fault This item is applied for all structure sites. In case of existence of large or active fault, subtract 20 points. Large fault are those with > 1m thick sheared zone.
Thick deposit This item is applied for dam site and power house site. In case of existence of alluvium and colluvium >30m in the vicinity of valley bottom, subtract 20 points.
Table 8.2-6 Evaluation Criteria for Geological Conditions of Site (Score)
Structure site Reservoir Dam Headrace Tunnel Power House
Item Water tightness Slope stability Soundness Water tightness Soundness Soundness Slope stability Basic evaluation A B E F J M N Subtract by fault C (negative) G (negative) K (negative) O (negative)
Subtract by thick deposits --- H (negative) ---- P (negative) Score of each site D = (A + B) / 2 + C I = (E + F) / 2 + G + H L = J + K Q = (M + N) / 2 + O + P
Score of project area R = (D + I + L + Q) / 4

Nationwide Master Plan Study on Storage-type Hydroelectric Power Development in Nepal
b. Thrust and fault
Evaluation method and point allocation of risk of thrust and fault are same as “Natural hazard (earthquake)” used for evaluation of candidate projects, and the detail is described in Section 7.2 (1) 2) b.
The evaluation criterion for reliability of flow data is shown in Table 8.2-7.
Table 8.2-7 Evaluation Criterion for Large Tectonic Thrust and Fault
Distance to large tectonic thrusts > 12.8 km 12.8 km >
> 3.2 km 3.2 km > > 1.6 km 1.6 km >
Score*1) 100 60 20 0
*1): In case of the closeness to other faults < 1 km, subtract 20. In case of the closeness < 100 m, subtract 40.
c. Seismicity
Evaluation method and point allocation of risk of thrust and fault are same as those that were used for evaluation of candidate projects, and the detail is described in Section 7.2 (1) 2) c.
The evaluation criterion for reliability of flow data is shown in Table 8.2-8 to Table 8.2-10.
Table 8.2-8 Evaluation Criterion for Seismicity (Class by Area)
Area Higher Himalaya (Tibetan-Techys
Zone)
Metamorphic zone
(Higher Himalaya
Crystalline)
Lesser Himalaya Siwaliks
(Sub-Himalaya) Terai Zone
Class 1 1 2 3 3
Table 8.2-9 Evaluation Criterion for Seismicity (Class by Acceleration)
Acceleration > 240 gal 240 gal > > 180 gal 180 gal >
Class 1 2 3
Table 8.2-10 Evaluation Criterion for Seismicity (Matrix of Score)
Area 1 2 3 Acceleration 1 20 20 20 2 40 20 60 3 80 60 100
3) Time to Commencement of Commercial Operation
In the evaluation of candidate projects, this evaluation item was evaluated by length of access
Final Report Appendix 3 SEA Report
147
Nationwide Master Plan Study on Storage-type Hydroelectric Power Development in Nepal
road, difficulty level of funding, and reliability of development plan as shown in Table 8.2-11. In the evaluation of promising projects, lead time to commercial operation was estimated and the required time was directly evaluated, instead of these three items.
The lead time consists of seven stages, “Pre-FS,” “FS,” “Financial arrangement,” “Tendering (selection of consultant),” “Detailed design,” “Tendering (selection of contractor),” and “Construction” as shown in Table 8.2-11.
Table 8.2-11 Time required for Each Stage
Stage Time (Year) Remark Pre FS 1.0 Study prior to FS FS 1.5 Financial arrangement 2.0 (Commencement of access road construction) Tendering 1.0 Selection of consultant Detailed design 2.0 Including preparation of tender documents Tendering 1.0 Selection of contractor Construction 4.5 – 6.0 Depending on project (without access road construction)
For example, lead time of a project in desk-study level is the total time from pre-FS to construction, lead time of a project in pre-FS level is the total time from FS to construction.
The project with 10 years in lead time was scored 100 points, the project with 20 years in lead time was scored 0 points, and other projects were scored a point obtained by linear interpolation with lead time. (See Table 8.2-12)
Table 8.2-12 Evaluation Criterion for Lead Time to Commencement of Commercial Operation
Time to commencement of commercial operation (Year) 10 10 – 20 20
Score (points) 100 Linear interpolation 0
4) Effectiveness of Project
a. Unit generation cost
Evaluation method is basically same one that was used for evaluation of candidate projects; the following simplified calculation formula was used.
Unit generation cost (US cent/kWh) = Project cost / Annual energy production (kWh) × expense rate
The project with the smallest unit generation cost was scored 100 points, the project with the largest unit generation cost was scored 0 point, and other projects were scored a point obtained by linear interpolation with unit generation cost.
Final Report Appendix 3 SEA Report
148

Nationwide Master Plan Study on Storage-type Hydroelectric Power Development in Nepal
Since the number of projects was changed from 31 candidate projects to 10 promising projects, and also their project costs of promising projects were reviewed, the minimum unit generation cost changed from 2.21 USc/kWh to 4.57 USc/kWh and the maximum changed from 20.42 USc/kWh to 13.58 USc/kWh as shown in Table 8.2-13.
Table 8.2-13 Evaluation Criterion for Unit Generation Cost
Unit Generation Cost (US cent/kWh)
4.57 (Minimum) 2.21 - 20.42 13.58
(Maximum) Score 100 Linear interpolation 0
Note: Unit Generation Cost = Project Cost / Annual Energy Production × 10%
b. Installed Capacity
In the evaluation of candidate projects described in Table 8.2-14, since the suitable development scale was expected 100 MW to 300 MW in the Scope of Work of this Study, the evaluation point was gradually decreased for projects more than 300 MW.
In the evaluation of promising projects, importance was put on large installed capacity because of its effect on mitigating load shedding. And since the maximum installed capacity among the promising projects is 536 MW, though there might be some minor difficulty of financing, etc., development of this scale of projects seems to have sufficient probability. Therefore, point allocation for evaluation of installed capacity was modified as shown in Table 8.2-14.
Table 8.2-14 Evaluation Criterion for Installed Capacity
Installed Capacity (MW) 0 0 – 300 300 More than 300 Score 0 Linear interpolation 100 100
c. Annual Energy Production
In the evaluation of candidate projects described in Section Table 8.2-15, the evaluation point was proportional to annual energy production up to 2,000 GWh and it is constant (full score) to 2,000 GWh and over.
In the evaluation of promising projects, since the maximum among the promising projects was 1,920 GWh, the evaluation point was determined proportional to annual energy production up to 1,910 GWh, the maximum value, as shown in Table 8.2-15.
Table 8.2-15 Evaluation Criterion for Annual Energy Production
Annual Energy Production (GWh) 0 0 - 1,910 1,910 (Max.)
Score 0 Linear interpolation 100
Final Report Appendix 3 SEA Report
149
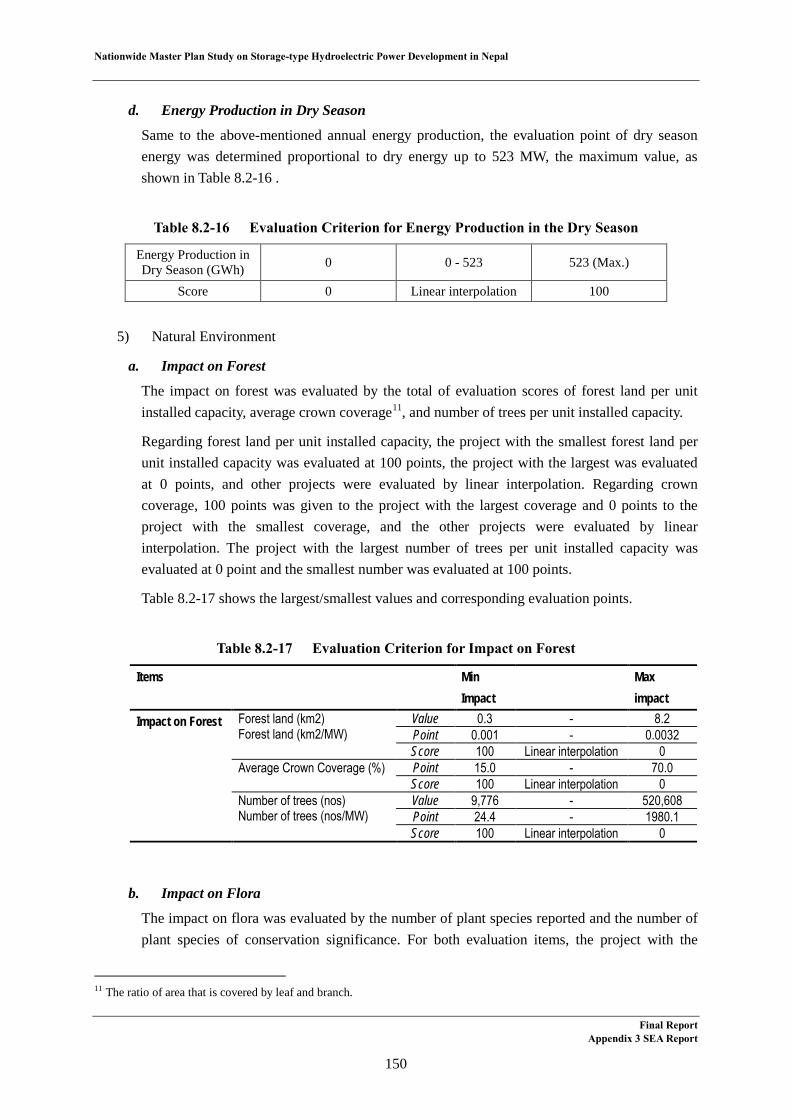
Nationwide Master Plan Study on Storage-type Hydroelectric Power Development in Nepal
d. Energy Production in Dry Season
Same to the above-mentioned annual energy production, the evaluation point of dry season energy was determined proportional to dry energy up to 523 MW, the maximum value, as shown in Table 8.2-16 .
Table 8.2-16 Evaluation Criterion for Energy Production in the Dry Season
Energy Production in Dry Season (GWh) 0 0 - 523 523 (Max.)
Score 0 Linear interpolation 100
5) Natural Environment
a. Impact on Forest
The impact on forest was evaluated by the total of evaluation scores of forest land per unit installed capacity, average crown coverage11, and number of trees per unit installed capacity.
Regarding forest land per unit installed capacity, the project with the smallest forest land per unit installed capacity was evaluated at 100 points, the project with the largest was evaluated at 0 points, and other projects were evaluated by linear interpolation. Regarding crown coverage, 100 points was given to the project with the largest coverage and 0 points to the project with the smallest coverage, and the other projects were evaluated by linear interpolation. The project with the largest number of trees per unit installed capacity was evaluated at 0 point and the smallest number was evaluated at 100 points.
Table 8.2-17 shows the largest/smallest values and corresponding evaluation points.
Table 8.2-17 Evaluation Criterion for Impact on Forest
b. Impact on Flora
The impact on flora was evaluated by the number of plant species reported and the number of plant species of conservation significance. For both evaluation items, the project with the
11 The ratio of area that is covered by leaf and branch.
Items Min Impact
Max impact
Impact on Forest Forest land (km2) Forest land (km2/MW)
Value 0.3 - 8.2 Point 0.001 - 0.0032 Score 100 Linear interpolation 0
Average Crown Coverage (%) Point 15.0 - 70.0 Score 100 Linear interpolation 0
Number of trees (nos) Number of trees (nos/MW)
Value 9,776 - 520,608 Point 24.4 - 1980.1 Score 100 Linear interpolation 0
Final Report Appendix 3 SEA Report
150
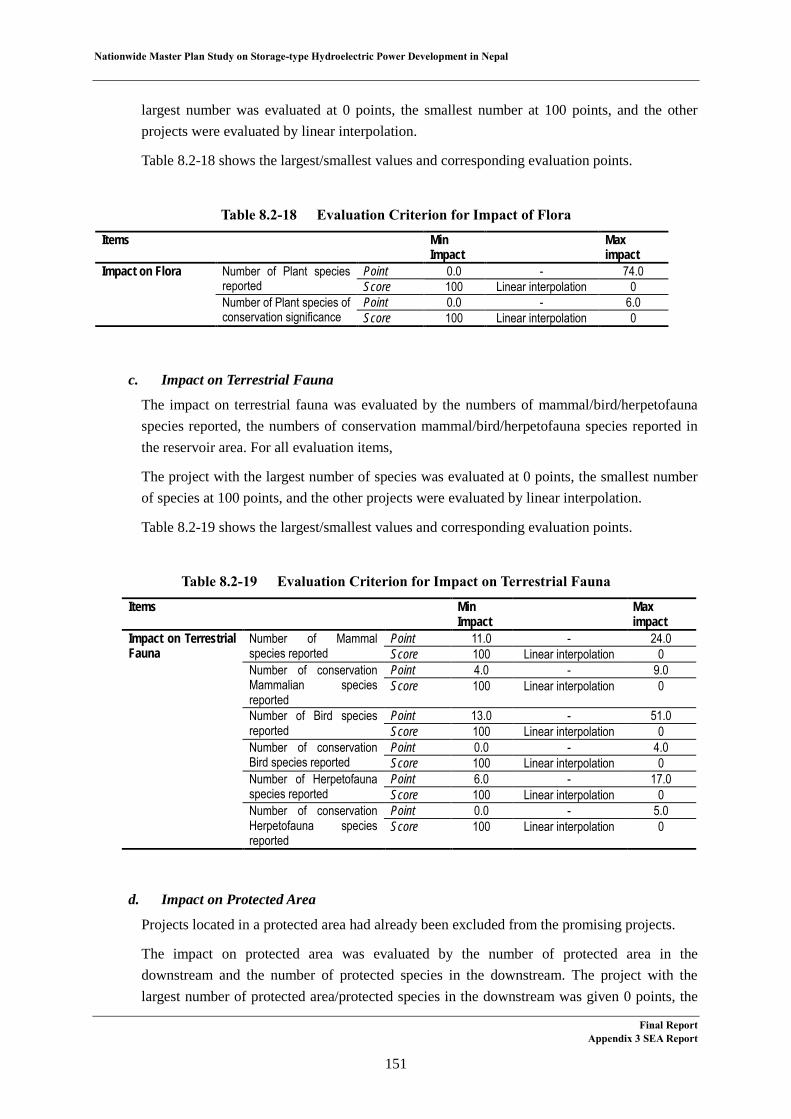
Nationwide Master Plan Study on Storage-type Hydroelectric Power Development in Nepal
largest number was evaluated at 0 points, the smallest number at 100 points, and the other projects were evaluated by linear interpolation.
Table 8.2-18 shows the largest/smallest values and corresponding evaluation points.
Table 8.2-18 Evaluation Criterion for Impact of Flora
c. Impact on Terrestrial Fauna
The impact on terrestrial fauna was evaluated by the numbers of mammal/bird/herpetofauna species reported, the numbers of conservation mammal/bird/herpetofauna species reported in the reservoir area. For all evaluation items,
The project with the largest number of species was evaluated at 0 points, the smallest number of species at 100 points, and the other projects were evaluated by linear interpolation.
Table 8.2-19 shows the largest/smallest values and corresponding evaluation points.
Table 8.2-19 Evaluation Criterion for Impact on Terrestrial Fauna
d. Impact on Protected Area
Projects located in a protected area had already been excluded from the promising projects.
The impact on protected area was evaluated by the number of protected area in the downstream and the number of protected species in the downstream. The project with the largest number of protected area/protected species in the downstream was given 0 points, the
Items Min Impact
Max impact
Impact on Flora Number of Plant species reported
Point 0.0 - 74.0 Score 100 Linear interpolation 0
Number of Plant species of conservation significance
Point 0.0 - 6.0 Score 100 Linear interpolation 0
Items Min Impact
Max impact
Impact on Terrestrial Fauna
Number of Mammal species reported
Point 11.0 - 24.0 Score 100 Linear interpolation 0
Number of conservation Mammalian species reported
Point 4.0 - 9.0 Score 100 Linear interpolation 0
Number of Bird species reported
Point 13.0 - 51.0 Score 100 Linear interpolation 0
Number of conservation Bird species reported
Point 0.0 - 4.0 Score 100 Linear interpolation 0
Number of Herpetofauna species reported
Point 6.0 - 17.0 Score 100 Linear interpolation 0
Number of conservation Herpetofauna species reported
Point 0.0 - 5.0 Score 100 Linear interpolation 0
Final Report Appendix 3 SEA Report
151
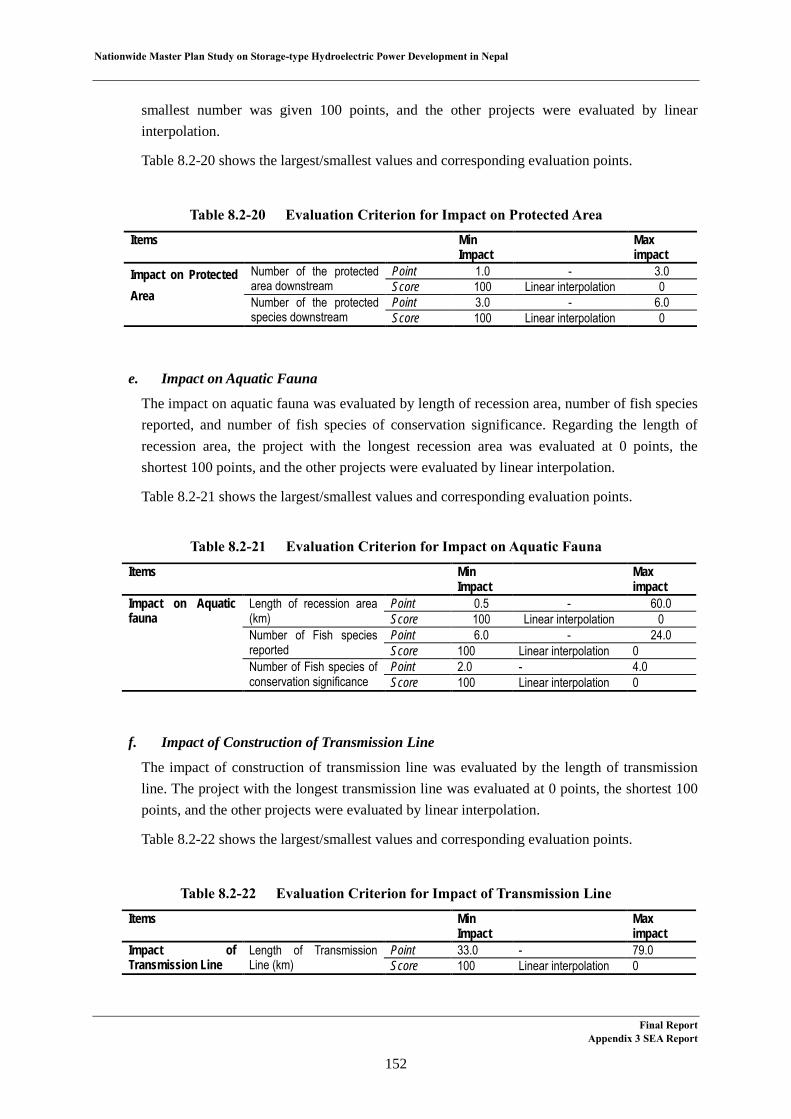
Nationwide Master Plan Study on Storage-type Hydroelectric Power Development in Nepal
smallest number was given 100 points, and the other projects were evaluated by linear interpolation.
Table 8.2-20 shows the largest/smallest values and corresponding evaluation points.
Table 8.2-20 Evaluation Criterion for Impact on Protected Area
e. Impact on Aquatic Fauna
The impact on aquatic fauna was evaluated by length of recession area, number of fish species reported, and number of fish species of conservation significance. Regarding the length of recession area, the project with the longest recession area was evaluated at 0 points, the shortest 100 points, and the other projects were evaluated by linear interpolation.
Table 8.2-21 shows the largest/smallest values and corresponding evaluation points.
Table 8.2-21 Evaluation Criterion for Impact on Aquatic Fauna
f. Impact of Construction of Transmission Line
The impact of construction of transmission line was evaluated by the length of transmission line. The project with the longest transmission line was evaluated at 0 points, the shortest 100 points, and the other projects were evaluated by linear interpolation.
Table 8.2-22 shows the largest/smallest values and corresponding evaluation points.
Table 8.2-22 Evaluation Criterion for Impact of Transmission Line
Items Min Impact
Max impact
Impact on Protected Area
Number of the protected area downstream
Point 1.0 - 3.0 Score 100 Linear interpolation 0
Number of the protected species downstream
Point 3.0 - 6.0 Score 100 Linear interpolation 0
Items Min Impact
Max impact
Impact on Aquatic fauna
Length of recession area (km)
Point 0.5 - 60.0 Score 100 Linear interpolation 0
Number of Fish species reported
Point 6.0 - 24.0 Score 100 Linear interpolation 0
Number of Fish species of conservation significance
Point 2.0 - 4.0 Score 100 Linear interpolation 0
Items Min Impact
Max impact
Impact of Transmission Line
Length of Transmission Line (km)
Point 33.0 - 79.0 Score 100 Linear interpolation 0
Final Report Appendix 3 SEA Report
152
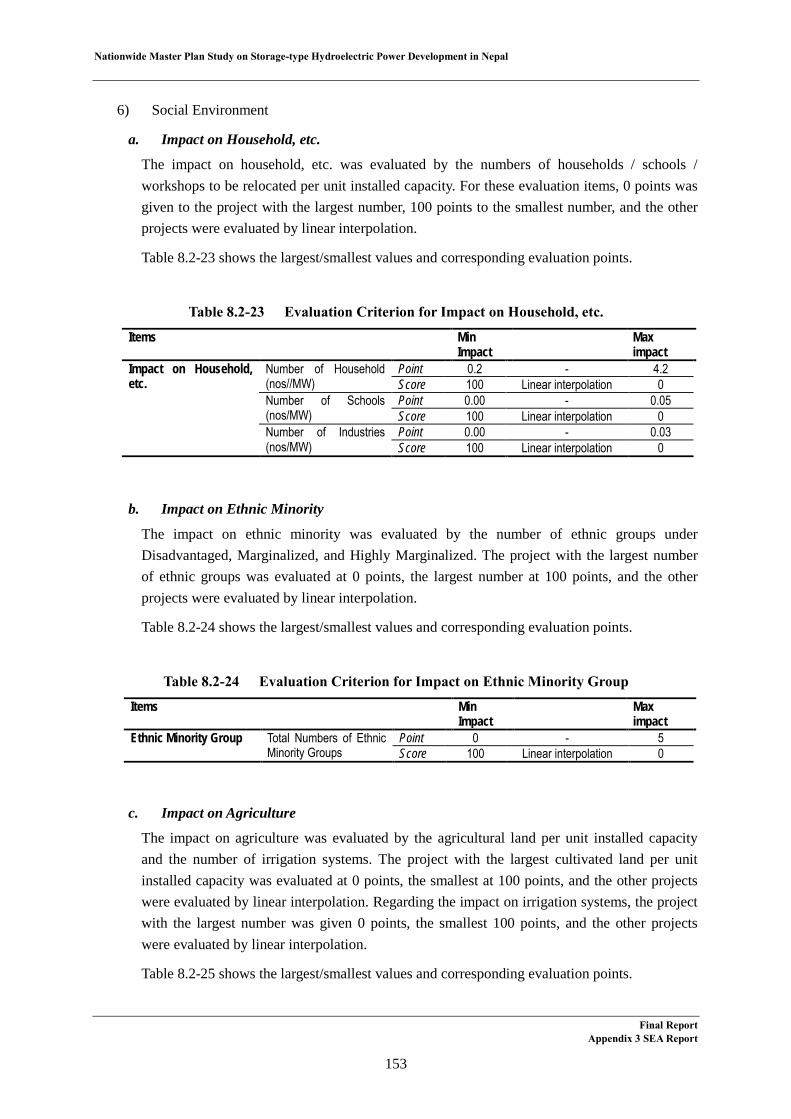
Nationwide Master Plan Study on Storage-type Hydroelectric Power Development in Nepal
6) Social Environment
a. Impact on Household, etc.
The impact on household, etc. was evaluated by the numbers of households / schools / workshops to be relocated per unit installed capacity. For these evaluation items, 0 points was given to the project with the largest number, 100 points to the smallest number, and the other projects were evaluated by linear interpolation.
Table 8.2-23 shows the largest/smallest values and corresponding evaluation points.
Table 8.2-23 Evaluation Criterion for Impact on Household, etc.
b. Impact on Ethnic Minority
The impact on ethnic minority was evaluated by the number of ethnic groups under Disadvantaged, Marginalized, and Highly Marginalized. The project with the largest number of ethnic groups was evaluated at 0 points, the largest number at 100 points, and the other projects were evaluated by linear interpolation.
Table 8.2-24 shows the largest/smallest values and corresponding evaluation points.
Table 8.2-24 Evaluation Criterion for Impact on Ethnic Minority Group
c. Impact on Agriculture
The impact on agriculture was evaluated by the agricultural land per unit installed capacity and the number of irrigation systems. The project with the largest cultivated land per unit installed capacity was evaluated at 0 points, the smallest at 100 points, and the other projects were evaluated by linear interpolation. Regarding the impact on irrigation systems, the project with the largest number was given 0 points, the smallest 100 points, and the other projects were evaluated by linear interpolation.
Table 8.2-25 shows the largest/smallest values and corresponding evaluation points.
Items Min Impact
Max impact
Impact on Household, etc.
Number of Household (nos//MW)
Point 0.2 - 4.2 Score 100 Linear interpolation 0
Number of Schools (nos/MW)
Point 0.00 - 0.05 Score 100 Linear interpolation 0
Number of Industries (nos/MW)
Point 0.00 - 0.03 Score 100 Linear interpolation 0
Items Min Impact
Max impact
Ethnic Minority Group Total Numbers of Ethnic Minority Groups
Point 0 - 5 Score 100 Linear interpolation 0
Final Report Appendix 3 SEA Report
153
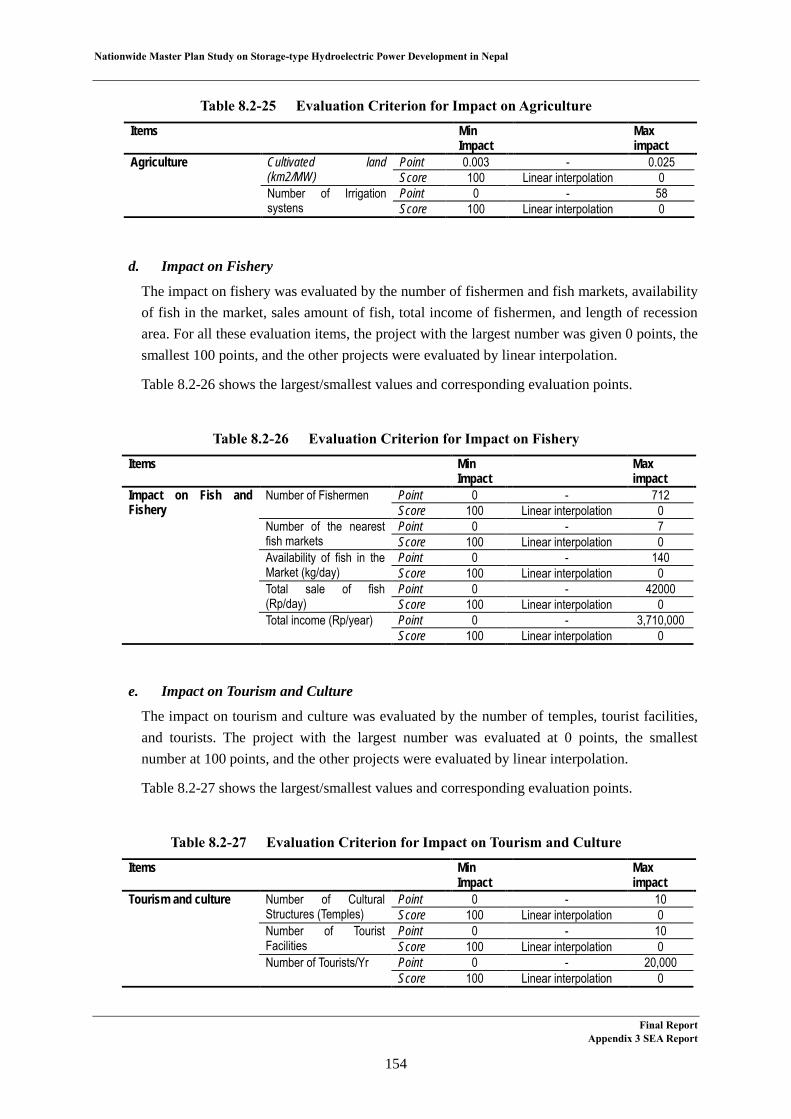
Nationwide Master Plan Study on Storage-type Hydroelectric Power Development in Nepal
Table 8.2-25 Evaluation Criterion for Impact on Agriculture
d. Impact on Fishery
The impact on fishery was evaluated by the number of fishermen and fish markets, availability of fish in the market, sales amount of fish, total income of fishermen, and length of recession area. For all these evaluation items, the project with the largest number was given 0 points, the smallest 100 points, and the other projects were evaluated by linear interpolation.
Table 8.2-26 shows the largest/smallest values and corresponding evaluation points.
Table 8.2-26 Evaluation Criterion for Impact on Fishery
e. Impact on Tourism and Culture
The impact on tourism and culture was evaluated by the number of temples, tourist facilities, and tourists. The project with the largest number was evaluated at 0 points, the smallest number at 100 points, and the other projects were evaluated by linear interpolation.
Table 8.2-27 shows the largest/smallest values and corresponding evaluation points.
Table 8.2-27 Evaluation Criterion for Impact on Tourism and Culture
Items Min Impact
Max impact
Agriculture Cultivated land (km2/MW)
Point 0.003 - 0.025 Score 100 Linear interpolation 0
Number of Irrigation systens
Point 0 - 58 Score 100 Linear interpolation 0
Items Min Impact
Max impact
Impact on Fish and Fishery
Number of Fishermen Point 0 - 712 Score 100 Linear interpolation 0
Number of the nearest fish markets
Point 0 - 7 Score 100 Linear interpolation 0
Availability of fish in the Market (kg/day)
Point 0 - 140 Score 100 Linear interpolation 0
Total sale of fish (Rp/day)
Point 0 - 42000 Score 100 Linear interpolation 0
Total income (Rp/year) Point 0 - 3,710,000 Score 100 Linear interpolation 0
Items Min Impact
Max impact
Tourism and culture Number of Cultural Structures (Temples)
Point 0 - 10 Score 100 Linear interpolation 0
Number of Tourist Facilities
Point 0 - 10 Score 100 Linear interpolation 0
Number of Tourists/Yr Point 0 - 20,000 Score 100 Linear interpolation 0
Final Report Appendix 3 SEA Report
154
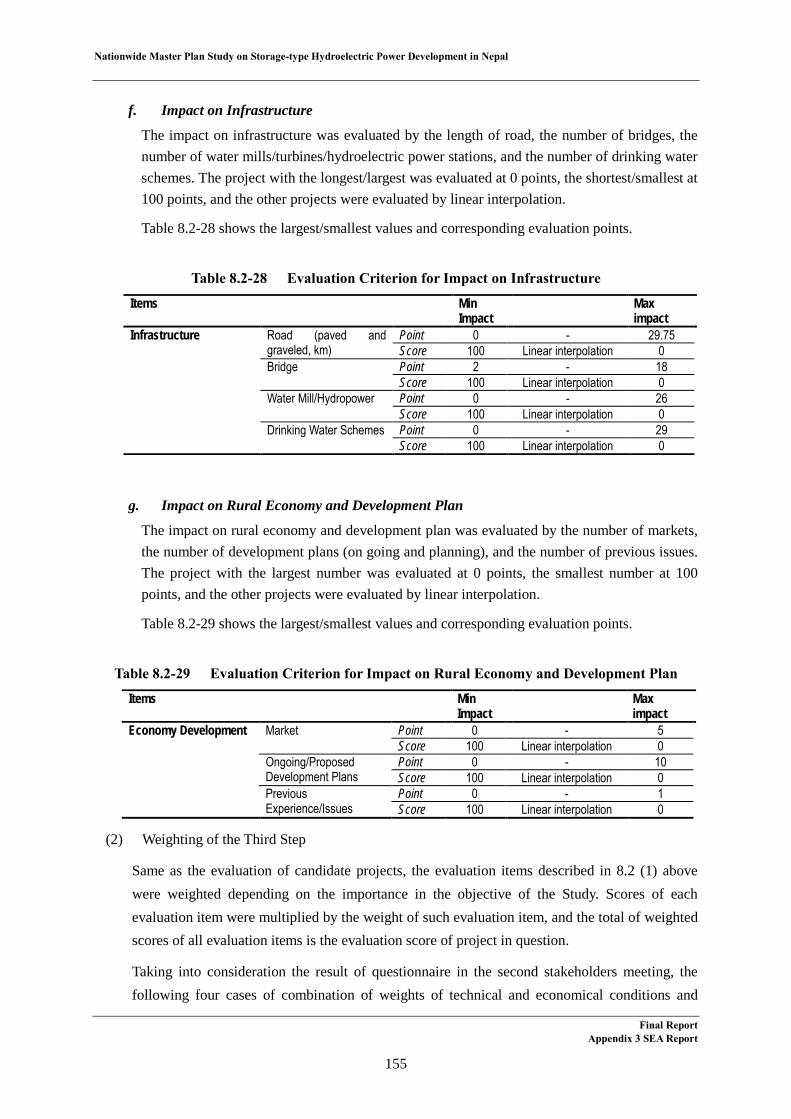
Nationwide Master Plan Study on Storage-type Hydroelectric Power Development in Nepal
f. Impact on Infrastructure
The impact on infrastructure was evaluated by the length of road, the number of bridges, the number of water mills/turbines/hydroelectric power stations, and the number of drinking water schemes. The project with the longest/largest was evaluated at 0 points, the shortest/smallest at 100 points, and the other projects were evaluated by linear interpolation.
Table 8.2-28 shows the largest/smallest values and corresponding evaluation points.
Table 8.2-28 Evaluation Criterion for Impact on Infrastructure
g. Impact on Rural Economy and Development Plan
The impact on rural economy and development plan was evaluated by the number of markets, the number of development plans (on going and planning), and the number of previous issues. The project with the largest number was evaluated at 0 points, the smallest number at 100 points, and the other projects were evaluated by linear interpolation.
Table 8.2-29 shows the largest/smallest values and corresponding evaluation points.
Table 8.2-29 Evaluation Criterion for Impact on Rural Economy and Development Plan
(2) Weighting of the Third Step
Same as the evaluation of candidate projects, the evaluation items described in 8.2 (1) above were weighted depending on the importance in the objective of the Study. Scores of each evaluation item were multiplied by the weight of such evaluation item, and the total of weighted scores of all evaluation items is the evaluation score of project in question.
Taking into consideration the result of questionnaire in the second stakeholders meeting, the following four cases of combination of weights of technical and economical conditions and
Items Min Impact
Max impact
Infrastructure Road (paved and graveled, km)
Point 0 - 29.75 Score 100 Linear interpolation 0
Bridge Point 2 - 18 Score 100 Linear interpolation 0
Water Mill/Hydropower Point 0 - 26 Score 100 Linear interpolation 0
Drinking Water Schemes Point 0 - 29 Score 100 Linear interpolation 0
Items Min Impact
Max impact
Economy Development Market Point 0 - 5 Score 100 Linear interpolation 0
Ongoing/Proposed Development Plans
Point 0 - 10 Score 100 Linear interpolation 0
Previous Experience/Issues
Point 0 - 1 Score 100 Linear interpolation 0
Final Report Appendix 3 SEA Report
155

Nationwide Master Plan Study on Storage-type Hydroelectric Power Development in Nepal
impact of environment were prepared.
Case 1: Same importance on technical and economical conditions and impact on environment (50% for technical and economical conditions, 50% for impact on environment)
Case 2: Technically and economically oriented (60% for technical and economical conditions, 40% for impact on environment)
Case 3: Environmentally oriented (40% for technical and economical conditions, 60% for impact on environment)
Case 4: Extremely technically and economically oriented (the average of questionnaire result. 75% for technical and economical conditions, 25% for impact on environment)
Regarding the subcategories in technical and environmental conditions, also taking into consideration the result of questionnaire, the weight of hydrological conditions was increased from 25% to 30% and that of lead time was decreased from 25% to 20%. In the impact on environment, the weight of social environment was increased from 50% to 60% and that of natural environment was decreased from 50% to 40%.
The weights of each evaluation item were determined by reference to other projects and based on knowledge of the study team.
Table 8.2-30 shows the weights and point allocations of each case.
Final Report Appendix 3 SEA Report
156
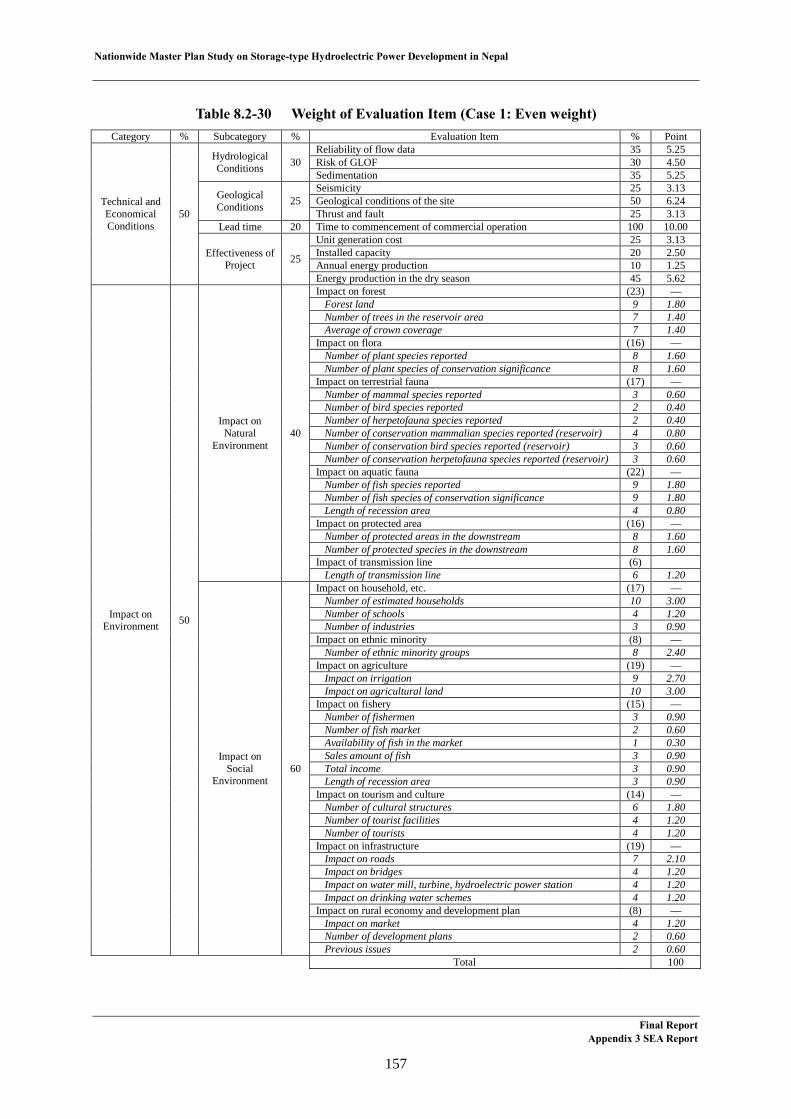
Nationwide Master Plan Study on Storage-type Hydroelectric Power Development in Nepal
Table 8.2-30 Weight of Evaluation Item (Case 1: Even weight) Category % Subcategory % Evaluation Item % Point
Technical and Economical Conditions
50
Hydrological Conditions 30
Reliability of flow data 35 5.25 Risk of GLOF 30 4.50 Sedimentation 35 5.25
Geological Conditions 25
Seismicity 25 3.13 Geological conditions of the site 50 6.24 Thrust and fault 25 3.13
Lead time 20 Time to commencement of commercial operation 100 10.00
Effectiveness of Project 25
Unit generation cost 25 3.13 Installed capacity 20 2.50 Annual energy production 10 1.25 Energy production in the dry season 45 5.62
Impact on Environment 50
Impact on Natural
Environment 40
Impact on forest (23) –– Forest land 9 1.80 Number of trees in the reservoir area 7 1.40 Average of crown coverage 7 1.40 Impact on flora (16) –– Number of plant species reported 8 1.60 Number of plant species of conservation significance 8 1.60 Impact on terrestrial fauna (17) –– Number of mammal species reported 3 0.60 Number of bird species reported 2 0.40 Number of herpetofauna species reported 2 0.40 Number of conservation mammalian species reported (reservoir) 4 0.80 Number of conservation bird species reported (reservoir) 3 0.60 Number of conservation herpetofauna species reported (reservoir) 3 0.60 Impact on aquatic fauna (22) –– Number of fish species reported 9 1.80 Number of fish species of conservation significance 9 1.80 Length of recession area 4 0.80 Impact on protected area (16) –– Number of protected areas in the downstream 8 1.60 Number of protected species in the downstream 8 1.60 Impact of transmission line (6) Length of transmission line 6 1.20
Impact on Social
Environment 60
Impact on household, etc. (17) –– Number of estimated households 10 3.00 Number of schools 4 1.20 Number of industries 3 0.90 Impact on ethnic minority (8) –– Number of ethnic minority groups 8 2.40 Impact on agriculture (19) –– Impact on irrigation 9 2.70 Impact on agricultural land 10 3.00 Impact on fishery (15) –– Number of fishermen 3 0.90 Number of fish market 2 0.60 Availability of fish in the market 1 0.30 Sales amount of fish 3 0.90 Total income 3 0.90 Length of recession area 3 0.90 Impact on tourism and culture (14) –– Number of cultural structures 6 1.80 Number of tourist facilities 4 1.20 Number of tourists 4 1.20 Impact on infrastructure (19) –– Impact on roads 7 2.10 Impact on bridges 4 1.20 Impact on water mill, turbine, hydroelectric power station 4 1.20 Impact on drinking water schemes 4 1.20 Impact on rural economy and development plan (8) –– Impact on market 4 1.20 Number of development plans 2 0.60 Previous issues 2 0.60
Total 100
Final Report Appendix 3 SEA Report
157

Nationwide Master Plan Study on Storage-type Hydroelectric Power Development in Nepal
Table 8.2-31 Weight of Evaluation Item (Case 2: Technical conditions oriented) Category % Subcategory % Evaluation Item % Point
Technical and Economical Conditions
60
Hydrological Conditions 30
Reliability of flow data 35 6.30 Risk of GLOF 30 5.40 Sedimentation 35 6.30
Geological Conditions 25
Seismicity 25 3.75 Geological conditions of the site 50 7.50 Thrust and fault 25 3.75
Lead time 20 Time to commencement of commercial operation 100 12.00
Effectiveness of Project 25
Unit generation cost 25 3.75 Installed capacity 20 3.00 Annual energy production 10 1.50 Energy production in the dry season 45 6.75
Impact on Environment 40
Impact on Natural
Environment 40
Impact on forest (23) –– Forest land 9 1.44 Number of trees in the reservoir area 7 1.12 Average of crown coverage 7 1.12 Impact on flora (16) –– Number of plant species reported 8 1.28 Number of plant species of conservation significance 8 1.28 Impact on terrestrial fauna (17) –– Number of mammal species reported 3 0.48 Number of bird species reported 2 0.32 Number of herpetofauna species reported 2 0.32 Number of conservation mammalian species reported (reservoir) 4 0.64 Number of conservation bird species reported (reservoir) 3 0.48 Number of conservation herpetofauna species reported (reservoir) 3 0.48 Impact on aquatic fauna (22) –– Number of fish species reported 9 1.44 Number of fish species of conservation significance 9 1.44 Length of recession area 4 0.64 Impact on protected area (16) –– Number of protected areas in the downstream 8 1.28 Number of protected species in the downstream 8 1.28 Impact of transmission line (6) Length of transmission line 6 0.96
Impact on Social Environment 60
Impact on household, etc. (17) –– Number of estimated households 10 2.40 Number of schools 4 0.96 Number of industries 3 0.72 Impact on ethnic minority (8) –– Number of ethnic minority groups 8 1.92 Impact on agriculture (19) –– Impact on irrigation 9 2.16 Impact on agricultural land 10 2.40 Impact on fishery (15) –– Number of fishermen 3 0.72 Number of fish market 2 0.48 Availability of fish in the market 1 0.24 Sales amount of fish 3 0.72 Total income 3 0.72 Length of recession area 3 0.72 Impact on tourism and culture (14) –– Number of cultural structures 6 1.44 Number of tourist facilities 4 0.96 Number of tourists 4 0.96 Impact on infrastructure (19) –– Impact on roads 7 1.68 Impact on bridges 4 0.96 Impact on water mill, turbine, hydroelectric power station 4 0.96 Impact on drinking water schemes 4 0.96 Impact on rural economy and development plan (8) –– Impact on market 4 0.96 Number of development plans 2 0.48 Previous issues 2 0.48
Total 100
Final Report Appendix 3 SEA Report
158
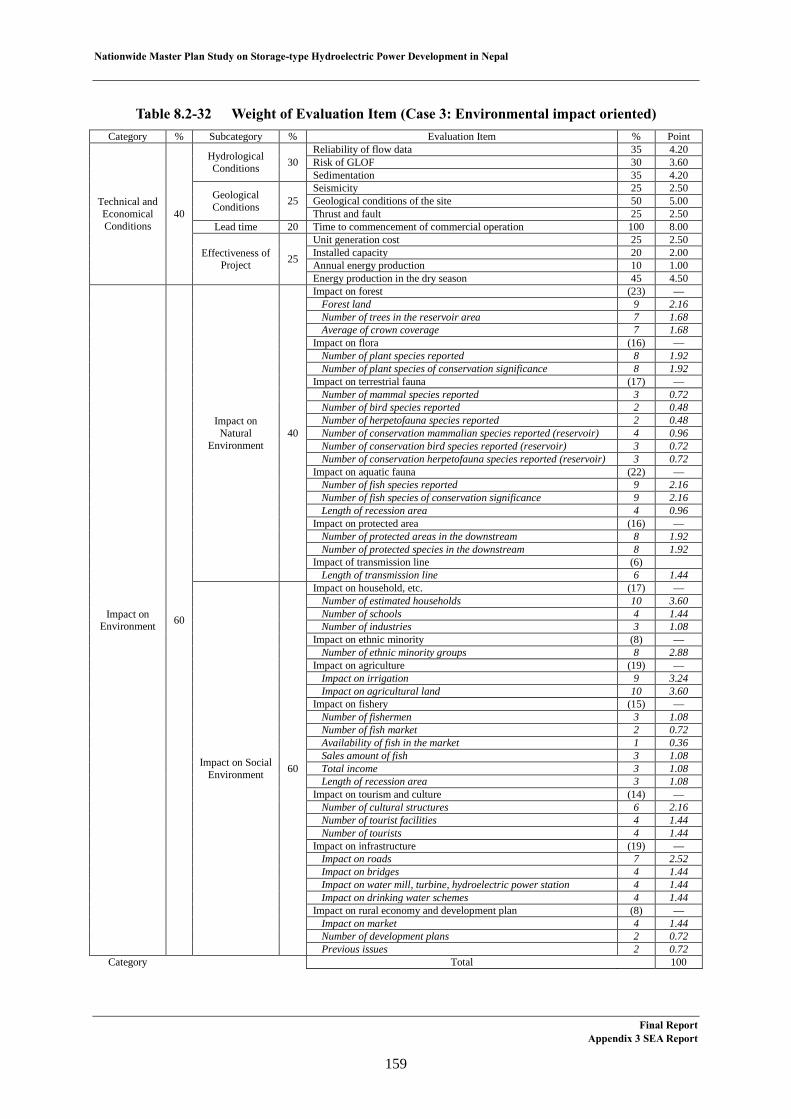
Nationwide Master Plan Study on Storage-type Hydroelectric Power Development in Nepal
Table 8.2-32 Weight of Evaluation Item (Case 3: Environmental impact oriented) Category % Subcategory % Evaluation Item % Point
Technical and Economical Conditions
40
Hydrological Conditions 30
Reliability of flow data 35 4.20 Risk of GLOF 30 3.60 Sedimentation 35 4.20
Geological Conditions 25
Seismicity 25 2.50 Geological conditions of the site 50 5.00 Thrust and fault 25 2.50
Lead time 20 Time to commencement of commercial operation 100 8.00
Effectiveness of Project 25
Unit generation cost 25 2.50 Installed capacity 20 2.00 Annual energy production 10 1.00 Energy production in the dry season 45 4.50
Impact on Environment 60
Impact on Natural
Environment 40
Impact on forest (23) –– Forest land 9 2.16 Number of trees in the reservoir area 7 1.68 Average of crown coverage 7 1.68 Impact on flora (16) –– Number of plant species reported 8 1.92 Number of plant species of conservation significance 8 1.92 Impact on terrestrial fauna (17) –– Number of mammal species reported 3 0.72 Number of bird species reported 2 0.48 Number of herpetofauna species reported 2 0.48 Number of conservation mammalian species reported (reservoir) 4 0.96 Number of conservation bird species reported (reservoir) 3 0.72 Number of conservation herpetofauna species reported (reservoir) 3 0.72 Impact on aquatic fauna (22) –– Number of fish species reported 9 2.16 Number of fish species of conservation significance 9 2.16 Length of recession area 4 0.96 Impact on protected area (16) –– Number of protected areas in the downstream 8 1.92 Number of protected species in the downstream 8 1.92 Impact of transmission line (6) Length of transmission line 6 1.44
Impact on Social Environment 60
Impact on household, etc. (17) –– Number of estimated households 10 3.60 Number of schools 4 1.44 Number of industries 3 1.08 Impact on ethnic minority (8) –– Number of ethnic minority groups 8 2.88 Impact on agriculture (19) –– Impact on irrigation 9 3.24 Impact on agricultural land 10 3.60 Impact on fishery (15) –– Number of fishermen 3 1.08 Number of fish market 2 0.72 Availability of fish in the market 1 0.36 Sales amount of fish 3 1.08 Total income 3 1.08 Length of recession area 3 1.08 Impact on tourism and culture (14) –– Number of cultural structures 6 2.16 Number of tourist facilities 4 1.44 Number of tourists 4 1.44 Impact on infrastructure (19) –– Impact on roads 7 2.52 Impact on bridges 4 1.44 Impact on water mill, turbine, hydroelectric power station 4 1.44 Impact on drinking water schemes 4 1.44 Impact on rural economy and development plan (8) –– Impact on market 4 1.44 Number of development plans 2 0.72 Previous issues 2 0.72
Category Total 100
Final Report Appendix 3 SEA Report
159
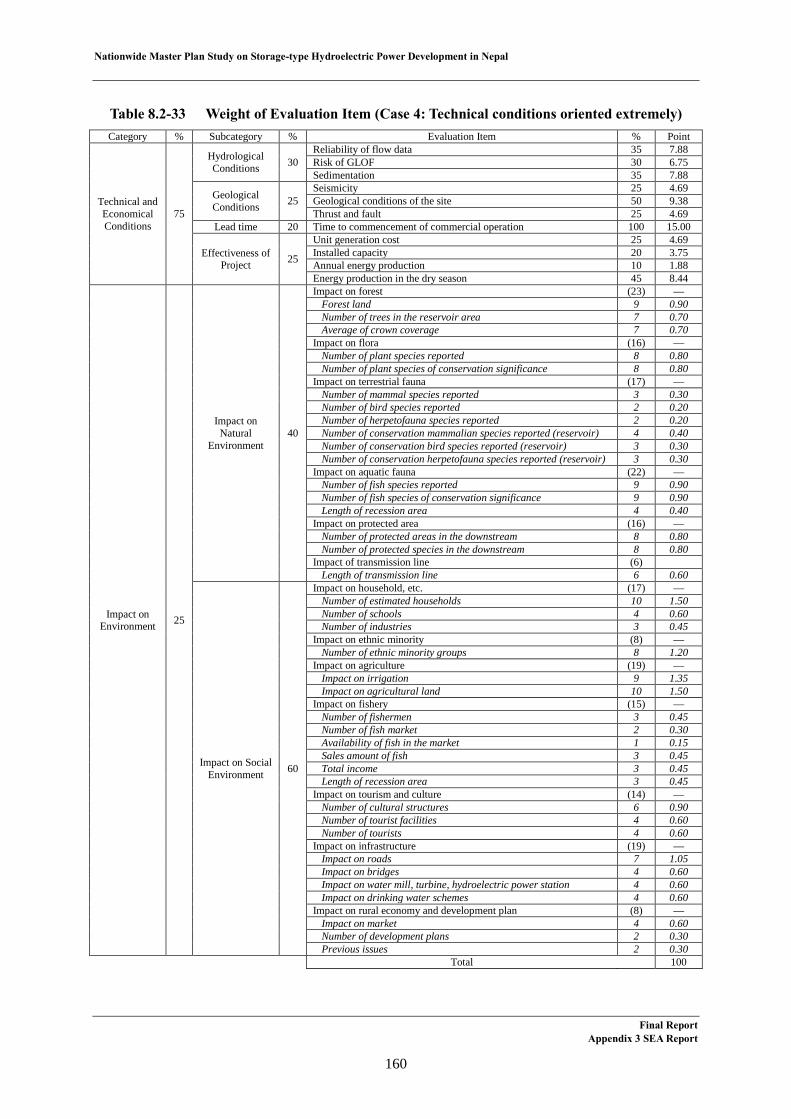
Nationwide Master Plan Study on Storage-type Hydroelectric Power Development in Nepal
Table 8.2-33 Weight of Evaluation Item (Case 4: Technical conditions oriented extremely) Category % Subcategory % Evaluation Item % Point
Technical and Economical Conditions
75
Hydrological Conditions 30
Reliability of flow data 35 7.88 Risk of GLOF 30 6.75 Sedimentation 35 7.88
Geological Conditions 25
Seismicity 25 4.69 Geological conditions of the site 50 9.38 Thrust and fault 25 4.69
Lead time 20 Time to commencement of commercial operation 100 15.00
Effectiveness of Project 25
Unit generation cost 25 4.69 Installed capacity 20 3.75 Annual energy production 10 1.88 Energy production in the dry season 45 8.44
Impact on Environment 25
Impact on Natural
Environment 40
Impact on forest (23) –– Forest land 9 0.90 Number of trees in the reservoir area 7 0.70 Average of crown coverage 7 0.70 Impact on flora (16) –– Number of plant species reported 8 0.80 Number of plant species of conservation significance 8 0.80 Impact on terrestrial fauna (17) –– Number of mammal species reported 3 0.30 Number of bird species reported 2 0.20 Number of herpetofauna species reported 2 0.20 Number of conservation mammalian species reported (reservoir) 4 0.40 Number of conservation bird species reported (reservoir) 3 0.30 Number of conservation herpetofauna species reported (reservoir) 3 0.30 Impact on aquatic fauna (22) –– Number of fish species reported 9 0.90 Number of fish species of conservation significance 9 0.90 Length of recession area 4 0.40 Impact on protected area (16) –– Number of protected areas in the downstream 8 0.80 Number of protected species in the downstream 8 0.80 Impact of transmission line (6) Length of transmission line 6 0.60
Impact on Social Environment 60
Impact on household, etc. (17) –– Number of estimated households 10 1.50 Number of schools 4 0.60 Number of industries 3 0.45 Impact on ethnic minority (8) –– Number of ethnic minority groups 8 1.20 Impact on agriculture (19) –– Impact on irrigation 9 1.35 Impact on agricultural land 10 1.50 Impact on fishery (15) –– Number of fishermen 3 0.45 Number of fish market 2 0.30 Availability of fish in the market 1 0.15 Sales amount of fish 3 0.45 Total income 3 0.45 Length of recession area 3 0.45 Impact on tourism and culture (14) –– Number of cultural structures 6 0.90 Number of tourist facilities 4 0.60 Number of tourists 4 0.60 Impact on infrastructure (19) –– Impact on roads 7 1.05 Impact on bridges 4 0.60 Impact on water mill, turbine, hydroelectric power station 4 0.60 Impact on drinking water schemes 4 0.60 Impact on rural economy and development plan (8) –– Impact on market 4 0.60 Number of development plans 2 0.30 Previous issues 2 0.30
Total 100
Final Report Appendix 3 SEA Report
160

Nationwide Master Plan Study on Storage-type Hydroelectric Power Development in Nepal
Impact Assessment 8.3
Third Step is an evaluation for the ten Promising Projects based on the site survey. 50 evaluation items of six categories are examined in detail. After Impact Evaluation, Sensitivity Analysis was conducted. Followings are the result of the Impact Evaluation and the Sensitivity Analysis.
(1) Impact Evaluation
1) Hydrological Data and Energy
a. Hydrology
As for hydrological data of the 10 promising projects, 3 items, namely, reliability of flow data, risk of GLOF, sedimentation of were researched and evaluated.
(a) Reliability of Flow Data
Flow data is indispensable for energy calculation and has a decisive influence on economical efficiency of a project. As for 10 promising projects, the study result on reliability of flow data of each project is summarized in the following table.
Table 8.3-1 Summary of Study Result for Reliability on Flow Data
No. Project Name Reliability of Flow Data
E-01 Dudh Koshi The gauging station 670 is located at 1.5 km upstream from the dam axis. The reliability of flow data of the project is relatively higher.
E-06 Kokhajor-1 Since there is no gauging station near the project site, the flow of the project is calculated by Regional Analysis. The reliability of flow data of the project is relatively lower.
E-17 Sun Koshi No.3
The gauging station 630 is located at 8 km upstream from the dam axis. Multiplying the flow data of the gauging station by the rate of catchment area of the project site to one of gauging station gives the flow data of the project. The reliability of flow data of the project is relatively higher.
C-02 Lower Badigad Since there is no gauging station near the project site, the flow of the project is calculated by Regional Analysis. The reliability of flow data of the project is relatively lower.
C-08 Andhi Khola
The gauging station 415 is located at 1.5 km upstream from the dam axis. Multiplying the flow data of the gauging station by the rate of catchment area of the project site to one of gauging station gives the flow data of the project. The reliability of flow data of the project is relatively higher.
W-02 Chera-1 Since there is no gauging station near the project site, the flow of the project is calculated by Regional Analysis. The reliability of flow data of the project is relatively lower.
W-05 Lower Jhimruk
The gauging station 330 is located at 27 km upstream from the dam axis. Multiplying the flow data of the gauging station by the rate of catchment area of the project site to one of gauging station gives the flow data of the project. The reliability of flow data of the project is relatively higher.
W-06 Madi Since there is no gauging station near the project site, the flow of the project is calculated by Regional Analysis. The reliability of flow data of the project is relatively lower.
Final Report Appendix 3 SEA Report
161
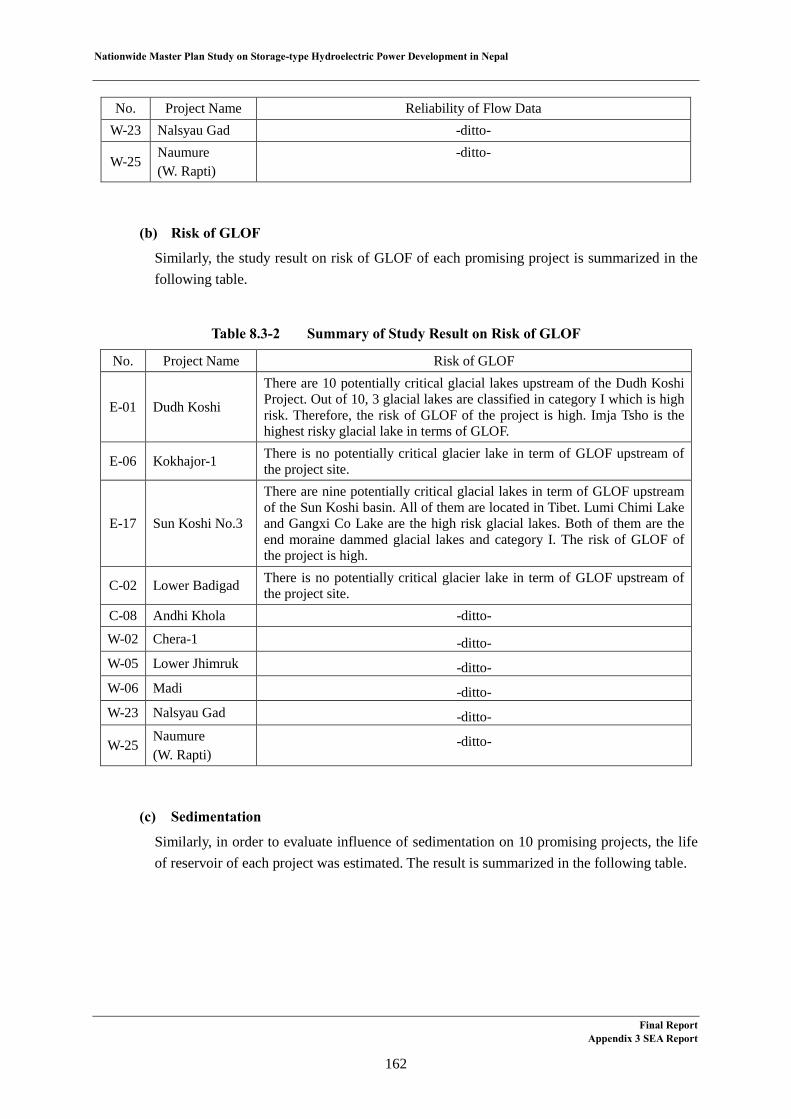
Nationwide Master Plan Study on Storage-type Hydroelectric Power Development in Nepal
No. Project Name Reliability of Flow Data W-23 Nalsyau Gad -ditto-
W-25 Naumure (W. Rapti)
-ditto-
(b) Risk of GLOF
Similarly, the study result on risk of GLOF of each promising project is summarized in the following table.
Table 8.3-2 Summary of Study Result on Risk of GLOF
No. Project Name Risk of GLOF
E-01 Dudh Koshi
There are 10 potentially critical glacial lakes upstream of the Dudh Koshi Project. Out of 10, 3 glacial lakes are classified in category I which is high risk. Therefore, the risk of GLOF of the project is high. Imja Tsho is the highest risky glacial lake in terms of GLOF.
E-06 Kokhajor-1 There is no potentially critical glacier lake in term of GLOF upstream of the project site.
E-17 Sun Koshi No.3
There are nine potentially critical glacial lakes in term of GLOF upstream of the Sun Koshi basin. All of them are located in Tibet. Lumi Chimi Lake and Gangxi Co Lake are the high risk glacial lakes. Both of them are the end moraine dammed glacial lakes and category I. The risk of GLOF of the project is high.
C-02 Lower Badigad There is no potentially critical glacier lake in term of GLOF upstream of the project site.
C-08 Andhi Khola -ditto-
W-02 Chera-1 -ditto- W-05 Lower Jhimruk -ditto- W-06 Madi -ditto- W-23 Nalsyau Gad -ditto-
W-25 Naumure (W. Rapti)
-ditto-
(c) Sedimentation
Similarly, in order to evaluate influence of sedimentation on 10 promising projects, the life of reservoir of each project was estimated. The result is summarized in the following table.
Final Report Appendix 3 SEA Report
162

Nationwide Master Plan Study on Storage-type Hydroelectric Power Development in Nepal
Table 8.3-3 Summary of Study Result on Life of Reservoir
No. Project Name
Specific Sediment
Yield (t/km2/yr)
Sediment Yield (106m3/yr)
Total Storage Volume (106 m3)
Life time of Storage (years)
E-01 Dudh Koshi 2,540 6.9 687.4 100 E-06 Kokhajor-1 5,900 1.1 218.7 199 E-17 Sun Koshi No.3 1,871 6.9 1,220.0 177 C-02 Lower Badigad 2,526 5.2 995.9 192 C-08 Andhi Khola 2,526 1.2 336.5 280 W-02 Chera-1 1,000 0.5 254.9 510 W-05 Lower Jhimruk 5,750 3.8 386.0 102 W-06 Madi 5,750 2.6 359.5 138 W-23 Nalsyau Gad 3,960 1.5 419.6 280 W-25 Naumure (W. Rapti) 5,750 13.1 1,021.0 78
b. Energy Calculation
The energy calculation was conducted by using flow data obtained from the hydrological study and planning features in order to evaluate annual energy production of 10 promising projects.
(a) Calculation Method
The energy calculation for each project was conducted by using “Energy Calculation based on Dynamic Programming Ver.1.70” which is a computer program developed by J-POWER. The program enables to estimate maximized annual energy by optimizing reservoir operation rule of a project based on the concept of optimization by Dynamic Program (DP).
The Dynamic Program’s mathematical meaning is to determine the control vector which can make the evaluating function value maximum or minimum under given restraint conditions, which is based upon the optimum principal. The optimum principal is the optimized plan which can make its decision the optimum on conditions from primary decision to result for whatever primary conditions and decision of the system.
In the case of reservoir operation rule optimization, evaluating function corresponds to annual energy, outflow discharge from reservoir and reservoir volume on given inflow discharge to reservoir correspond to restriction conditions, and control vector against above issues corresponds to reservoir operation rule.
(b) Data for Calculation
The project parameters required for energy calculation such as Full Supply Level (FSL), Minimum Operational Level (MOL) and Water Level-Storage Volume Curve of reservoir, effective head, power discharge, etc. were excerpted from the source reports.
However, since turbine efficiency and generator efficiency have been improved in recent
Final Report Appendix 3 SEA Report
163

Nationwide Master Plan Study on Storage-type Hydroelectric Power Development in Nepal
years, the design review for electromechanical equipment of promising projects was carried out by using HD Wiz which is a computer program developed by J-POWER based on existing hydroelectric power station data around world. The installed capacities obtained from the result of this design review were used for the energy calculation.
The peak hour was established as 12 hours for energy calculation in consultation with NEA.
As for flow data, the data estimated in the hydrological analysis were used. The following table shows average monthly flows at dam sites of promising projects.
Table 8.3-4 Summary of Flow Data for Promising Projects
(c) Calculation Result
The results of annual energy calculation for promising projects are summarized in the following table. Where, only for the Nalsyau Gad Project, the energy estimated in the feasibility study report is adopted as result since the feasibility study has just completed in 2012 in consultation with NEA.
(Unit: m3/s)
No. Project Name JAN. FEB. MAR. APR. MAY JUN. JUL. AUG. SEP. OCT. NOV. DEC. AverageDischarge
E-01 Dudh Koshi 45.6 35.8 33.8 45.7 84.0 282.5 651.6 652.3 519.5 188.7 89.5 59.9 224.1
E-06 Kokhajor-1 3.7 3.1 2.9 3.2 4.6 16.1 45.0 53.2 38.3 17.4 8.2 5.2 16.7
E-17 Sun Koshi No.3 62.5 55.8 52.8 58.6 90.0 211.7 574.8 701.0 440.0 208.3 106.7 78.7 220.1
C-02 Lower Badigad 21.2 18.3 17.5 20.3 31.8 85.1 216.7 261.6 184.1 82.1 39.7 26.3 83.7
C-08 Andhi Khola 4.7 3.9 3.2 3.0 6.3 33.3 99.8 94.1 67.2 26.7 9.9 6.1 30.1
W-02 Chera-1 9.3 8.0 7.6 8.5 12.8 34.2 88.6 108.2 77.1 35.0 16.8 11.0 34.8
W-05 Lower Jhimruk 9.4 7.9 6.6 6.7 6.9 20.5 68.9 115.7 97.4 39.6 16.1 10.5 33.9
W-06 Madi 7.9 6.8 6.4 7.2 10.8 30.0 78.9 95.8 68.4 31.0 14.8 9.7 30.6
W-23 Nalsyau Gad 6.8 5.8 5.5 6.1 9.1 25.7 68.0 82.6 59.1 26.9 12.8 8.3 26.4
W-25 Naumure(W. Rapti) 33.4 28.9 27.9 32.8 52.5 143.6 363.6 434.9 303.9 134.2 65.1 43.3 138.7
Final Report Appendix 3 SEA Report
164

Nationwide Master Plan Study on Storage-type Hydroelectric Power Development in Nepal
Final Report Appendix 3 SEA Report
165
Table 8.3-5 Summary of Energy Calculation Result for Promising Projects
2) Project Cost and Lead Time to Commencement of Operation
a. Project Cost
There were some differences among the project costs of ten promising projects in terms of time point of estimation and accuracy. In order to evaluate them as equally as possible, each project cost was escalated to the present price level and made necessary adjustments such as increase of contingency depending on the study level, etc.
b. Revision of Project Cost
In order to evaluate the project costs on the same level, each project cost was escalated from the time point of estimation in the source report to the present (Year 2013) price level with the escalation rate established based on Inflation Rate of Consumer Price of Major advanced economies (G7) published in database of International Monetary Fund (IMF), “World Economic Outlook Database, October 2012”.
On that basis, the environmental mitigation costs were replaced by the latest ones estimated from the result of site investigation. The costs of electromechanical equipment were also replaced by the latest ones estimated from the international market price.
The cost for civil works was divided into 3 parts, namely, cost for dam & reservoir, cost for waterway tunnel, cost for powerhouse. The ratio of contingency for cost of each work was determined based on the study level and the result of the geological investigation at site.
The idea for contingency ratios established for the FS or Pre FS-level projects in the source reports, such as 10% for open works, 15% for underground works, etc. were maintained as they were. While the contingency ratios for desk study-level projects was basically established
(Unit: GWh)
No. Project Name JAN. FEB. MAR. APR. MAY JUN. JUL. AUG. SEP. OCT. NOV. DEC.Total
EnergyDry
Energy
E-01 Dudh Koshi 103.0 90.7 97.1 123.5 165.2 190.4 220.7 225.5 218.3 222.4 143.8 109.0 1,909.6 523.3
E-06 Kokhajor-1 19.9 17.6 18.8 17.6 16.3 15.1 18.4 35.6 57.6 21.8 19.9 20.3 278.9 94.1
E-17 Sun Koshi No.3 71.3 63.6 67.4 61.6 61.7 134.4 358.2 404.3 325.2 182.6 81.3 72.0 1,883.6 335.9
C-02 Lower Badigad 73.9 66.7 72.5 67.6 67.4 65.7 151.2 294.0 261.6 100.0 71.5 73.9 1,366.0 354.7
C-08 Andhi Khola 37.1 33.0 18.0 0.0 14.6 28.8 89.4 146.5 130.3 52.5 49.4 49.1 648.7 137.1
W-02 Chera-1 26.4 22.7 23.5 21.2 20.7 20.8 98.6 114.2 110.5 51.6 26.3 26.9 563.2 120.6
W-05 Lower Jhimruk 19.7 17.6 19.0 18.2 20.7 47.1 73.9 61.7 70.7 66.2 20.0 19.9 454.8 94.4
W-06 Madi 36.0 32.2 34.4 31.9 31.6 30.4 34.7 136.2 125.4 56.9 35.1 36.2 621.1 170.7
W-23 Nalsyau Gad 152.5 126.3 114.4 61.5 25.4 24.6 25.4 250.5 294.2 139.4 64.8 127.1 1,406.1 581.8
W-25Naumure(W. Rapti) 68.8 58.1 59.3 52.1 47.3 79.5 152.7 185.2 179.2 133.9 69.8 71.7 1,157.5 309.9

Nationwide Master Plan Study on Storage-type Hydroelectric Power Development in Nepal
as 25% of civil cost in the source reports. They were revised depending on the geological evaluation of dam & reservoir site, waterway tunnel site and powerhouse site based on the result of site investigations. Only for the Sun Koshi No.3 Project, the largest contingency ratio was applied because there was very limited information about civil structures though the geological evaluation was relatively good.
Table 8.3-6 Physical Contingency Ratio of Civil Works for Desk Study-Level Projects
No. Project Name Dam (%)
Waterway (%)
Powerhouse (%)
E-06 Kokhajor-1 27.5 27.5 25.0 Geological Condition Poor Poor Fair
E-17 Sun Koshi No.3 30.0 30.0 30.0 Geological Condition Fair Fair Fair
C-02 Lower Badigad 30.0 25.0 25.0 Geological Condition Very Poor Fair Fair
W-02 Chera-1 25.0 25.0 25.0 Geological Condition Fair Fair Fair
W-05 Lower Jhimruk 27.5 25.0 25.0 Geological Condition Poor Fair Fair
W-06 Madi 27.5 25.0 25.0 Geological Condition Poor Fair Fair
3) Cost of Promising Project
A price contingency established as 10% of each construction cost estimated with above-mentioned revision and an interest during construction established with the interest ratio of 8% were added in the construction cost to estimate total project cost. The costs of 10 promising projects are summarized in the following table.
Where, only for the Nalsyau Gad Project, the construction cost estimated in the feasibility study report is used as it is except this price contingency and interest during construction since the feasibility study has just completed in 2012.
Final Report Appendix 3 SEA Report
166

Nationwide Master Plan Study on Storage-type Hydroelectric Power Development in Nepal
Final Report Appendix 3 SEA Report
167
Table 8.3-7 Summary of Project Cost for Promising Projects
Table 8.3-8 Evaluation of Unit Generation Cost
a. Lead Time to Commencement of Operation
The required lead time to the commencement of operation was estimated from each project stage and construction period.
4) Project Stage
The required times to the commencement of construction differ depending on project. The time to be required on each stage was empirically established as follows:
(Unit: Million US$)
No. E-01 E-06 E-17 C-02 C-08 W-02 W-05 W-06 W-23 W-25
Project Name Dudh Koshi Kokhajor-1Sun Koshi
No.3Lower
BadigadAndhiKhola
Chera-1Lower
JhimrukMadi
NalsyauGad
Naumure
Installed Capacity (MW) 300 111.5 536 380.3 180 148.7 142.5 199.8 410 245
1. Preliminary works and access road 69 15 11 41 2 27 23 24 70 15
2. Environmental mitigation cost 60 18 269 180 51 18 59 54 12 184
3. Civil Works 449 191 543 369 274 231 171 220 369 287
3.1 Dam 302 74 491 267 229 155 108 146 283 260
3.2 Waterway 121 112 28 85 41 68 56 65 69 15
3.3 Powerhouse 25 5 23 17 4 7 7 9 16 12
4. Hydromechanical-Equipment 21 11 27 23 43 12 11 14 31 14
5. Electro-mechanical Equipment 118 55 155 141 80 69 67 86 115 101
6. Transmission Line 9 12 11 13 9 13 14 12 23 15
7. Base Cost 726 302 1,016 766 460 369 344 410 620 617
8. Administration & Engineering service 68 15 92 32 31 16 15 18 61 49
9. Physical Contingency 79 61 181 125 39 68 55 71 57 63
9.1 Contingency for Civil Works 65 52 163 106 29 58 45 59 48 48
9.2 Contingency for E&M equipment 14 9 18 19 10 10 10 12 8 14
10. Price Contingency (10% of above) 87 38 129 92 53 45 41 50 74 73
11. Interest during Construction (i=8%) 184 60 272 195 84 80 66 88 156 154
10. Project Cost 1,144 476 1,691 1,210 666 577 521 637 967 955
No. Project P (MW) E (GWh)Project cost
(US$)Expense
rate
Unit generationcost
(USC/kWh)Score
E-01 Dudh Koshi 300.0 1,909.6 1,144,039,000 0.10 5.99 100.0E-06 kokhajor-1 111.5 278.9 476,468,000 0.10 17.08 0.0E-17 Sun Koshi No.3 536.0 1,883.6 1,690,504,000 0.10 8.97 73.1C-02 Lower Badigad 380.3 1,366.0 1,209,838,000 0.10 8.86 74.1C-08 Andhi Khola 180.0 648.7 665,805,000 0.10 10.26 61.5W-02 Chara-1 148.7 563.2 576,856,000 0.10 10.24 61.7W-05 Lower Jhimruk 142.5 454.7 520,860,000 0.10 11.46 50.7W-06 Madi 199.8 621.1 637,310,000 0.10 10.26 61.5W-23 Nalsyau Gad 410.0 1,406.1 966,869,000 0.10 6.88 92.0W-25 Naumure 245.0 1,157.5 954,512,000 0.10 8.25 79.6

Nationwide Master Plan Study on Storage-type Hydroelectric Power Development in Nepal
Table 8.3-9 Summary of Required Time to Commencement of Construction
Stage Time (Year) Remark Pre FS 1.0 Study prior to FS FS 1.5 - Financial Arrangement 2.0 (Commencement of access road construction) Tendering 1.0 Selection of consultant Detailed Design 2.0 Including preparation of tender documents Tendering 1.0 Selection of contractor Commencement of Construction - -
5) Construction Period
The construction periods differ depending on project. The construction period of FS of Pre FS-level project established in the source report was maintained as it was. The construction period of desk study-level project was established considering the scale of dam and the length of waterway tunnel as major structure of project, and result of geological investigation at site as shown in the following table. Where, construction time for preparatory works such as construction of access road, camp, etc. is not included in the construction period since they are normally implemented during the time between financial arrangement and commencement of construction in Nepal.
Table 8.3-10 Summary of Construction Period for Promising Projects
o. Project Name Installed Capacity
(MW)
Dam Height
(m)
Dam Type
Dam Volume (MCM)
Tunnel Length (km)
Construction Period (Year)
E-01 Dudh Koshi 300.0 180 Rockfill 9.2 13.3 6.0 E-06 Kokhajor-1 111.5 107 Rockfill 4.7 6.6 4.5 E-17 Sun Koshi No.3 536.0 140 Concrete
Gravity 1.9 - 6.0
C-02 Lower Badigad 380.3 191 Rockfill 16.9 4.4 6.0 C-08 Andhi Khola 180.0 157 Concrete
Faced Rockfill 8.2 3.4 4.5
W-02 Chera-1 148.7 186 Rockfill 9.8 4.3 5.0 W-05 Lower Jhimruk 142.5 167 Rockfill 6.8 5.8 4.5 W-06 Madi 199.8 190 Rockfill 9.2 5.7 5.0 W-23 Nalsyau Gad 410.0 200 Rockfill 17.9 8.2 6.0 W-25 Naumure
(W.Rapti) 245.0 190 Rockfill 13.2 - 6.0
6) Lead Time to Commencement of Operation
As a result of study mentioned above, the lead time to commencement of operation for each project is summarized in the following table.
Final Report Appendix 3 SEA Report
168

Nationwide Master Plan Study on Storage-type Hydroelectric Power Development in Nepal
Final Report Appendix 3 SEA Report
169
Table 8.3-11 Summary of Lead Time to COD for Promising Projects
Table 8.3-12 Evaluation of Time to Commencement of Commercial Operation
7) Geological Issues
a. Geological Investigation
Study level of promising projects vary from Desk Study to FS. To increase the topographic and geological data of projects which remain in Desk Study level, subcontract work was conducted for promising projects from July 2012 to February 2013. Among 10 promising projects, geological and engineering geological review was conducted for the Dudh Koshi Project and the Nalsyau Gad Project which study level is FS. For remaining 8 projects, satellite image interpretation and geological field survey were conducted. Geological field survey of each project was conducted for some 5 days.
b. Evaluation Method for Site Geology
At the stage of evaluating promising project, evaluation for geology consists of 3 criteria, namely “Geological conditions of the site”, “Thrust and fault” and “Seismicity.” Evaluation method of “Geological conditions of the site” is changed according to abovementioned geological investigation and described in this section. The content of criterion of “Thrust and fault” is same of “Natural hazard (earthquake)” which was applied for selecting promising projects .There is no change in sub-criterion “Seismicity” which was also applied for selecting
(Unit: Year)No. E-01 E-06 E-17 C-02 C-08 W-02 W-05 W-06 W-23 W-25
Project Name DudhKoshi
Kokhajor-1
Sun KoshiNo.3
LowerBadigad
AndhiKhola
Chera-1 LowerJhimruk
Madi NalsyauGad
Naumure
Installed Capacity (MW) 300 111.5 536 380.3 180 148.7 142.5 199.8 410 245
Pre-Feasibility Study - 1.0 1.0 1.0 - 1.0 1.0 1.0 - -
Feasibility Study - 1.5 1.5 1.5 1.5 1.5 1.5 1.5 - 1.5
Financial Arrangement 2.0 2.0 2.0 2.0 2.0 2.0 2.0 2.0 2.0 2.0
Selection of Consultant 1.0 1.0 1.0 1.0 1.0 1.0 1.0 1.0 1.0 1.0
Detailed Design 2.0 2.0 2.0 2.0 2.0 2.0 2.0 2.0 2.0 2.0
Selection of Contractor 1.0 1.0 1.0 1.0 1.0 1.0 1.0 1.0 1.0 1.0
Construction 6.0 4.5 6.0 6.0 4.5 5.0 4.5 5.0 6.0 6.0
Total (Year) 12.0 13.0 14.5 14.5 12.0 13.5 13.0 13.5 12.0 13.5
No. Project P (MW)Pre-FS
FSFinancial
ArrangementSelection ofConsultant
DDSelection ofContractor
ConstructionTotal(Year)
Score(point)
E-01 Dudh Koshi 300.0 2.0 1.0 2.0 1.0 6.0 12.0 80E-06 kokhajor-1 111.5 1.0 1.5 2.0 1.0 2.0 1.0 4.5 13.0 70E-17 Sun Koshi No.3 536.0 1.0 1.5 2.0 1.0 2.0 1.0 6.0 14.5 55C-02 Lower Badigad 380.3 1.0 1.5 2.0 1.0 2.0 1.0 6.0 14.5 55C-08 Andhi Khola 180.0 1.5 2.0 1.0 2.0 1.0 4.5 12.0 80W-02 Chara-1 148.7 1.0 1.5 2.0 1.0 2.0 1.0 5.0 13.5 65W-05 Lower Jhimruk 142.5 1.0 1.5 2.0 1.0 2.0 1.0 4.5 13.0 70W-06 Madi 199.8 1.0 1.5 2.0 1.0 2.0 1.0 5.0 13.5 65W-23 Nalsyau Gad 400.0 2.0 1.0 2.0 1.0 6.0 12.0 80W-25 Naumure 245.0 1.5 2.0 1.0 2.0 1.0 6.0 13.5 65
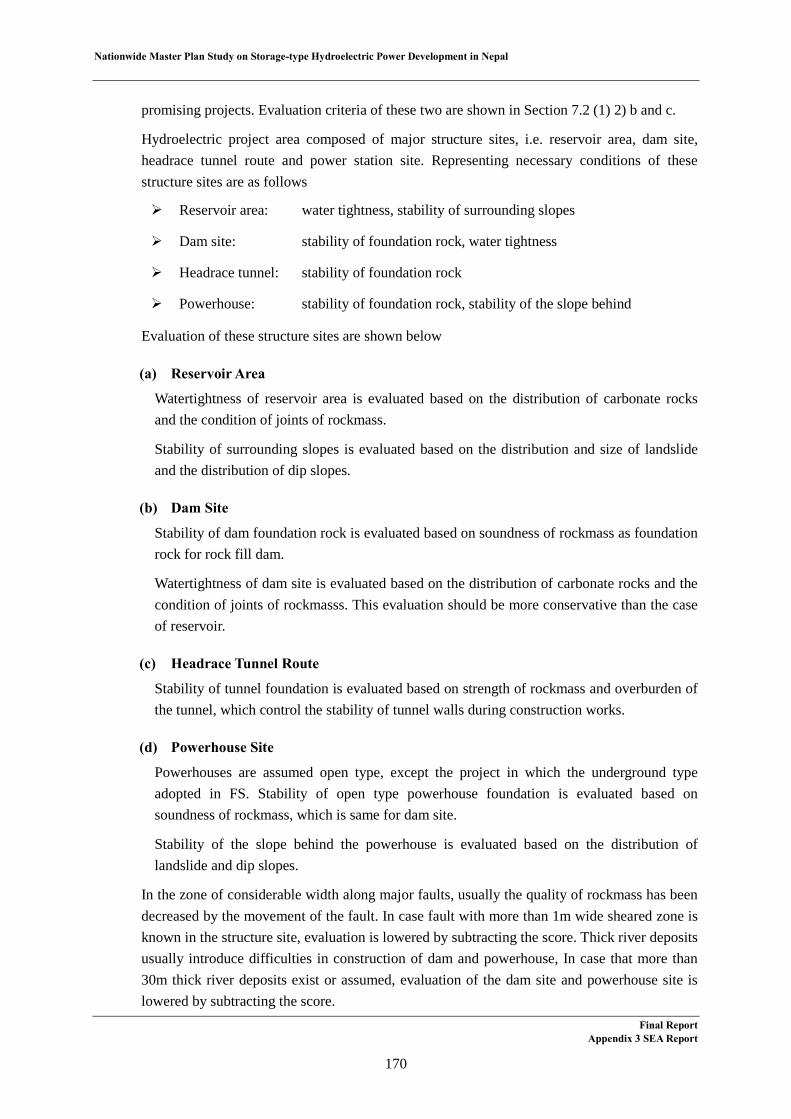
Nationwide Master Plan Study on Storage-type Hydroelectric Power Development in Nepal
promising projects. Evaluation criteria of these two are shown in Section 7.2 (1) 2) b and c.
Hydroelectric project area composed of major structure sites, i.e. reservoir area, dam site, headrace tunnel route and power station site. Representing necessary conditions of these structure sites are as follows
Reservoir area: water tightness, stability of surrounding slopes
Dam site: stability of foundation rock, water tightness
Headrace tunnel: stability of foundation rock
Powerhouse: stability of foundation rock, stability of the slope behind
Evaluation of these structure sites are shown below
(a) Reservoir Area
Watertightness of reservoir area is evaluated based on the distribution of carbonate rocks and the condition of joints of rockmass.
Stability of surrounding slopes is evaluated based on the distribution and size of landslide and the distribution of dip slopes.
(b) Dam Site
Stability of dam foundation rock is evaluated based on soundness of rockmass as foundation rock for rock fill dam.
Watertightness of dam site is evaluated based on the distribution of carbonate rocks and the condition of joints of rockmasss. This evaluation should be more conservative than the case of reservoir.
(c) Headrace Tunnel Route
Stability of tunnel foundation is evaluated based on strength of rockmass and overburden of the tunnel, which control the stability of tunnel walls during construction works.
(d) Powerhouse Site
Powerhouses are assumed open type, except the project in which the underground type adopted in FS. Stability of open type powerhouse foundation is evaluated based on soundness of rockmass, which is same for dam site.
Stability of the slope behind the powerhouse is evaluated based on the distribution of landslide and dip slopes.
In the zone of considerable width along major faults, usually the quality of rockmass has been decreased by the movement of the fault. In case fault with more than 1m wide sheared zone is known in the structure site, evaluation is lowered by subtracting the score. Thick river deposits usually introduce difficulties in construction of dam and powerhouse, In case that more than 30m thick river deposits exist or assumed, evaluation of the dam site and powerhouse site is lowered by subtracting the score.
Final Report Appendix 3 SEA Report
170

Nationwide Master Plan Study on Storage-type Hydroelectric Power Development in Nepal
Evaluation criterion for site geology is compiled in Section 7.2 (1) 2) a.
c. Result of Evaluation for Site Geology
Geological outline and result of evaluation of site geology are shown in Table 8.3-13~Table 8.3-22.
Score for each sub-item and that of structure site are shown with red letters in Table 8.3-13.Sub-items of low scores and with subtracts are those with disadvantages in engineering geological point of view.
Table 8.3-13 Evaluation of Site Geology of the Dudh Koshi Project
a, b, c = 100 or 60 or 20 (60 and 20 show disadvantage)d, e = 0 or -20 or lower score (-20 and lower score show disadvantage)A=(b+c)/2+d B=(a+b)/2+d+e C=a+d D= (a+c)/2+d+e
Geology Soundness Water Tightness Slope Stability ScoreFormation Lithology Fault Rivere dep.
-20 100 100 80OkhaidungaPhyllite Zoneand DudhKoshi DomeZone
phyllite90%,quartzite10%
2 major localfaults(EkuluadeFault,Vichalo F,)
watertightsmall scaleslides
0 0 100 60 80
OkhaidungaPhyllite Zone
quartzite onthe left bank,phyllite on theright bank
no majorfault
20mRQD<30-66%,RMR:40-60, Qvalue:4-6
groundwater levelis slightly higherthan river level onthe left bank
a fewinstabilities
-20 60 40OkhaidungaPhyllite Zone
phyllite andquartzite
ManebhanjyugPhyllite-LimestoneZone
limestone andcarbonatiousphyllite
MahabharatZone
Sch andgneiss
0 0 100 100 100
MahabharatZone
schistosegneiss
no majorfault
-
(Fair to Good:RQD 72%,RMR:50-70, Qvalue:5-12, )
-
ReservoirArea
Dam Site
HeadraceTunnelRoute
PowerhouseSite(underground)
3 majorlocal faults(Dudh KoshiFault, HalesiF. Sun KoshiF.)
Fair (RMR:40-60, Q value:4-9,),maximum rockcover 1250mand about 4kmlong section ismore than1000m
100b 100 80A100c-20 2 major local
d
80B
RMR:40-
a
groundwater levelb
d
0e
-20d
100
RQD<30-66%,
a
40C
100 100D100(Fair to Good:
a c0e
Vichalo F,)d
Final ReportAppendix 3 SEA Report
171

Nationwide Master Plan Study on Storage-type Hydroelectric Power Development in Nepal
Table 8.3-14 Evaluation of Site Geology of the Kokhajor-1 Project
Table 8.3-15 Evaluation of Site Geology of the Sun Koshi No.3 Project
Geology Soundness Water Tightness Slope Stability Score
Formation Lithology FaultRiveredeposits
0 60 60 60
UpperSiwaliks:
conglomeratewithsandstone andmudstone
soft(sometimeshard)
poorly-cementedconglomerates ofthe Upper Siwaliksare quite pervious
vulnerable toerosion (erodeeasily) andmany shallowslumps,
MiddleSiwaliks:
sandstone
moderatelyhard, andrelativelystrong.
relativelyimpervious
generally stableand a fewrockslides
0 0 100 60 80
MiddleSiwaliks:
sandstone andmudstone
no majorfault
10 tosome30mthick
relatively softmoderately toslightly pervious
0 60 60
MiddleSiwaliks:
sandstoneinterbeddedwithmudstone
moderatelystrong
Lower Siwalikssandstone andmudstone
relatively soft,maximumoverburden600m
0 0 100 100 100
Lower Siwalikssandstone andmudstone
no majorfault
10-20mthick
relatively softbedding planesdip towards themountain
ReservoirArea
Dam Site
no majorfault
no majorfault
HeadraceTunnelRoute
PowerhouseSite
Geology Soundness Water Tightness Slope Stability Score
Formation Lithology FaultRiveredeposits
-20 100 60 60
KunchaFormation
quartzite withschist
widedesrtibution ofcolluviums
Benighat Slateslate withlimestone
limestone may bepeamiable,butdestributed inmiddle stream ofthe reservoir area
0 0 100 100 100KunchaFormation
quartzite withthin phyllite
no majorfault
not thick hard impervious
0 100 100
KunchaFormation
quartzite withthin phyllite
no majorfault
hard, maximumoverburden300m
0 0 100 100 100
KunchaFormation
quartzite withfew bands ofphyllite
no majorfault
not thick medium hard stable
ReservoirArea
Dam Site
a faultpassing alongthe IndrawatiRiver
HeadraceTunnel Route
PowerhouseSite
Final Report Appendix 3 SEA Report
172
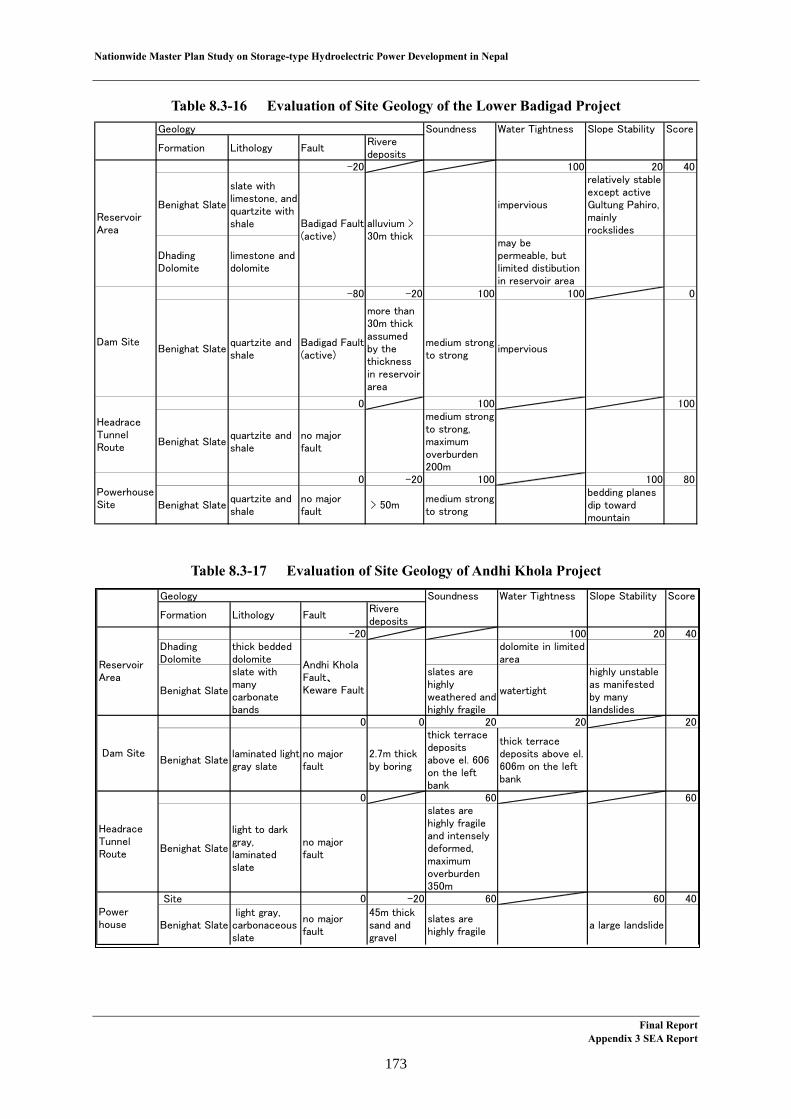
Nationwide Master Plan Study on Storage-type Hydroelectric Power Development in Nepal
Table 8.3-16 Evaluation of Site Geology of the Lower Badigad Project
Table 8.3-17 Evaluation of Site Geology of Andhi Khola Project
Geology Soundness Water Tightness Slope Stability Score
Formation Lithology FaultRiveredeposits
-20 100 20 40
Benighat Slate
slate withlimestone, andquartzite withshale
impervious
relatively stableexcept activeGultung Pahiro,mainlyrockslides
DhadingDolomite
limestone anddolomite
may bepermeable, butlimited distibutionin reservoir area
-80 -20 100 100 0
Benighat Slatequartzite andshale
Badigad Fault(active)
more than30m thickassumedby thethicknessin reservoirarea
medium strongto strong
impervious
0 100 100
Benighat Slatequartzite andshale
no majorfault
medium strongto strong,maximumoverburden200m
0 -20 100 100 80
Benighat Slatequartzite andshale
no majorfault
> 50mmedium strongto strong
bedding planesdip towardmountain
PowerhouseSite
Badigad Fault(active)
alluvium >30m thick
HeadraceTunnelRoute
ReservoirArea
Dam Site
Geology Soundness Water Tightness Slope Stability Score
Formation Lithology FaultRiveredeposits
-20 100 20 40DhadingDolomite
thick beddeddolomite
dolomite in limitedarea
Benighat Slate
slate withmanycarbonatebands
slates arehighlyweathered andhighly fragile
watertight
highly unstableas manifestedby manylandslides
0 0 20 20 20
Benighat Slatelaminated lightgray slate
no majorfault
2.7m thickby boring
thick terracedepositsabove el. 606on the leftbank
thick terracedeposits above el.606m on the leftbank
0 60 60
Benighat Slate
light to darkgray,laminatedslate
no majorfault
slates arehighly fragileand intenselydeformed,maximumoverburden350m
Site 0 -20 60 60 40
Benighat Slate light gray,carbonaceousslate
no majorfault
45m thicksand andgravel
slates arehighly fragile
a large landslide
ReservoirArea
Andhi KholaFault、Keware Fault
Dam Site
HeadraceTunnelRoute
Powerhouse
Final Report Appendix 3 SEA Report
173

Nationwide Master Plan Study on Storage-type Hydroelectric Power Development in Nepal
Table 8.3-18 Evaluation of Site Geology of the Chera-1 Project
Table 8.3-19 Evaluation of Site Geology of the Lower Jhimruk Project
Geology Soundness Water Tightness Slope Stability Score
Formation Lithology FaultRiveredeposits
0 60 100 80
Meta-diamictite
meta-diamictiteincludingcalcareousclasts
dissolutioncavities ofcalcareous clasts
LowerQuartzite
quartzite withschist
Lower Schistphyllite orgarnet schistand quartzite
0 0 100 60 80
Meta-diamictite
meta-diamictiteincludingcalcareousclasts
no majorfault
categorised asgood or fair
impervious,howevercalcareous natureof the meta-diamictite shouldbe studied inmore detail
0 100 100
Meta-diamictite
meta-diamictiteincludingcalcareousclasts
UpperQuartzite
quartzite withschist andphyllite
Upper Schistgarnet schistswith quartzite
0 0 100 100 100
Upper Schist
thick-bandedquartzite withsporadicschistpartings
no majorfault
assumedsame asreservoirarea i.e.less than25m thick
comparativelystrong
gentle dippingbedding plane
major landslidesare limited
ReservoirArea
PowerhouseSite
no majorfault
alluvialdepositsare limitedindistributionand theyare lessthan 25 mthick
Dam Site
HeadraceTunnelRoute
no majorfault
comparativelystrong, tunnelalignmentmakes anacute anglewith thefoliation、overburden <500m
Geology Soundness Water Tightness Slope Stability Score
Formation Lithology FaultRiveredeposits
-20 60 100 60KhamariFormation,Eocene Beds,DhurbangKhola F.
shale,sandstone anddolomite
a major faultdistribution ofdolomite
mass-wastingphenomena arenot abundant,relatively stable
0 0 100 100 100
KhamariFormation
shale andsandstone
no majorfault
not thick sound impervious relatively stable
-20 100 80Khamari F,Eocene Beds,DhurbangKhola F.Ranagaon F.
shale,sandstone
a major faultmaximunoverburden700m
0 0 100 60 80RanagaonFormation
shaleno majorfault
thicksheared bedrock
sheared bedrock
Dam site
HeadraceTunnelRoute
PowerhouseSite
ReservoirArea
Final Report Appendix 3 SEA Report
174

Nationwide Master Plan Study on Storage-type Hydroelectric Power Development in Nepal
Table 8.3-20 Evaluation of Site Geology of the Madi Project
Table 8.3-21 Evaluation of Site Geology of the Nalsyau Gad Project
Geology Soundness Water Tightness Slope Stability Score
Formation Lithology FaultRiveredeposits
-20 60 60 40Garnet SchistUnit
chlorite togarnet schist
SattinFormation
sandstone andshale withsome coalseams
SrichaurFormation
shale, phylliteand thin-beddedlimestone
RanibasFormation
medium-tothick-beddedlimestone withfew bands ofblack slate
limestone presentin the most partof the project willcreate someproblem.
0 0 100 100 100
RanibasFormation
slate andlimestone
no majorfault
supposedto be thick
limestone issiliceous andshows noevidence of anycavern structurefrom the surface
0 100 100
RanibasFormation
supposed tobe slate andlimestone
no majorfault
maximumoverburdenabout 400m
0 0 100 100 100
RanibasFormation
supposed tobe slate andlimestone
no majorfault
supposedto be thick
supposed tobe sound
supposed to bestable
ReservoirArea
one faultbetweenGarnetSchist Unitand SattinFormation,and anotherfaultbetweenSattinFormationand SrichaurFormation
most area iscovered withcolluvium, majorslides areobserved alongthe DhansiKhola (along afault)
Dam Site
HeadraceTunnelRoute
PowerhouseSite
Geology Soundness Water Tightness Slope Stability Score
Formation Lithology FaultRiveredeposits
-20 60 100 60
slate imperviousno majorlandslids
dolomitefurtherinvestigations areneeded
0 0 100 60 80
dolomiteno majorfault
10m thickby a boring
fairfurtherinvestigations areneeded
-20 100 80
dolomite75%,remainingsare quartzite,phyllite andslate
2 largeshearedzones
bedding planeperpendicularto tonnel axis,max.overburden500m
0 0 100 100 100
phyllite,quartzite andshale
no majorfault
infered 15mthick
sound
strikes ofbedding planeare aboutperpendicularto slope
Dam Site
HeadraceTunnelRoute
PowerhouseSite
Nalsyau GadFault
ReservoirArea
Final Report Appendix 3 SEA Report
175

Nationwide Master Plan Study on Storage-type Hydroelectric Power Development in Nepal
Table 8.3-22 Evaluation of Site Geology of the Naumure (W. Rapti) Project
Geology Soundness Water Tightness Slope Stability Score
Formation Lithology FaultRiveredeposits
-20 100 60 60
MiddleSiwaliks
sandston andsiltstone
slightly perviousand could posethreat of minorseepage
Lower Siwalikssandstonewith shale
SangramFormation
black shale weakest unit
SyangjaFormation
calcareousquartzites andquartziticlimestpne withshale
.
LakharpattaFormation
limestone anddolomites withthin shalesand quartizes
possible leakagethrough thisFormation will beblocked bySiwaliksdistributed to thesouth of MBT
0 0 100 60 80
MiddleSiwaliks
sandstone andsiltstones
no majorfault
20m thickby a boring
good to fair
slightly perviousand could posethreat of minorseepage、thinkcareful for damsite
0 100 100MiddleSiwaliks
sandstoneno majorfault
overburden<60m
0 0 100 100 100
MiddleSiwaliks
mudstonewithsandstone
no majorfault
about 20mthick
sound
strikes ofbedding planeare aboutperpendicularto slope
MBT
rocks near MBTare sheared andeasily becomeunstable
PowerhouseSite
ReservoirArea
Dam Site
HeadraceTunnelRoute
Final Report Appendix 3 SEA Report
176
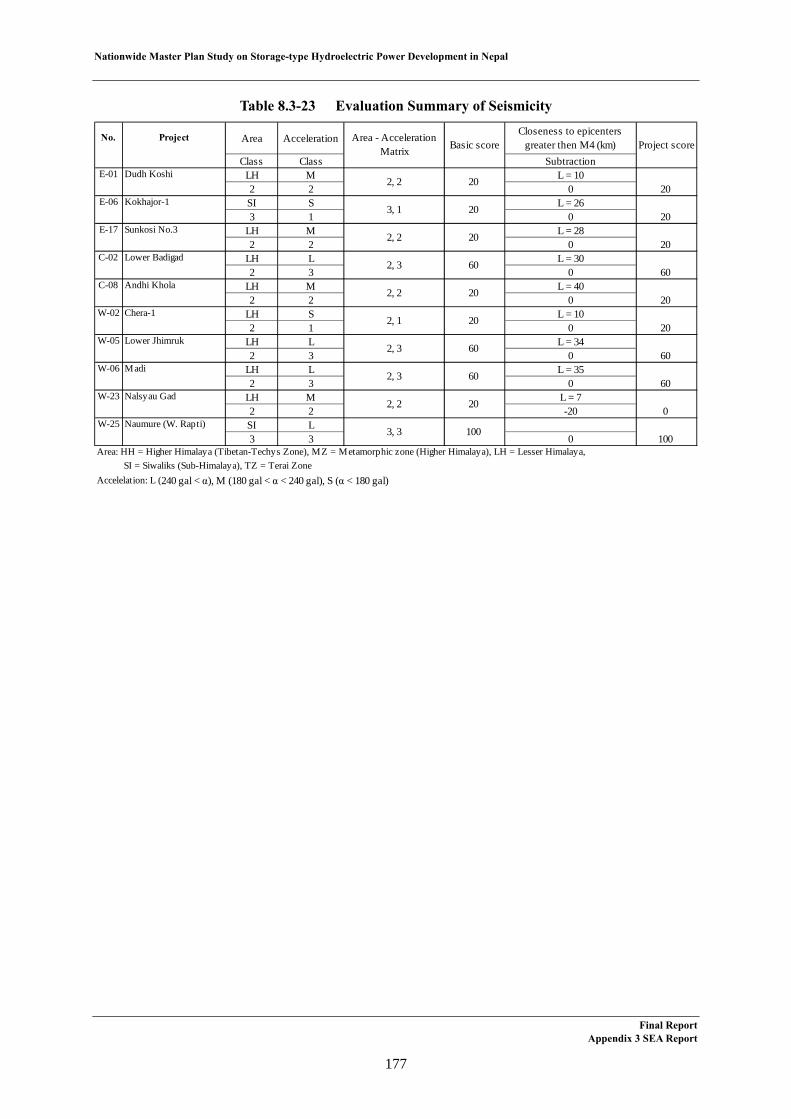
Nationwide Master Plan Study on Storage-type Hydroelectric Power Development in Nepal
Final Report Appendix 3 SEA Report
177
Table 8.3-23 Evaluation Summary of Seismicity
No. Project Area AccelerationCloseness to epicenters
greater then M4 (km)Class Class Subtraction
E-01 Dudh Koshi LH M L = 102 2 0 20
E-06 Kokhajor-1 SI S L = 263 1 0 20
E-17 Sunkosi No.3 LH M L = 282 2 0 20
C-02 Lower Badigad LH L L = 302 3 0 60
C-08 Andhi Khola LH M L = 402 2 0 20
W-02 Chera-1 LH S L = 102 1 0 20
W-05 Lower Jhimruk LH L L = 342 3 0 60
W-06 Madi LH L L = 352 3 0 60
W-23 Nalsyau Gad LH M L = 72 2 -20 0
W-25 Naumure (W. Rapti) SI L3 3 0 100
Area: HH = Higher Himalaya (Tibetan-Techys Zone), MZ = Metamorphic zone (Higher Himalaya), LH = Lesser Himalaya, SI = Siwaliks (Sub-Himalaya), TZ = Terai ZoneAccelelation: L (240 gal < α), M (180 gal < α < 240 gal), S (α < 180 gal)
2, 1
2, 3
2, 3
2, 2
3, 3
2, 2
Basic score
20
20
20
60
20
Area - AccelerationMatrix
2, 2
3, 1
2, 2
2, 3
100
Project score
20
60
60
20

Nationw
ide Master Plan Study on Storage-type H
ydroelectric Power D
evelopment in N
epal
Final Report
Appendix 3 SE
A R
eport
178
Table 8.3-24 Evaluation Summary of Geological Condition of Site
Reservoir Dam Headrace Tunnel Power HouseNo. Project Water
tightnessSlope
stabilityFault Score Soundness Water
tightnessFault Thick
depositScore Soundness Fault Score Soundness Site
stabilityFault Thick
depositScore Project
scoreE-01 Dudh Koshi Impervious Stable Hard Medium Medium Hard Stable
100 100 -20 80 100 60 0 0 80 60 -20 40 100 100 0 0 100 75E-06 Kokhajor-1 Pervious Medium Hard Medium Medium Hard Stable
60 60 0 60 100 60 0 0 80 60 0 60 100 100 0 0 100 75E-17 Sunkosi No.3 Impervious Medium Hard Impervious Strong Hard Stable
100 60 -20 60 100 100 0 0 100 100 0 100 100 100 0 0 100 90C-02 Lower Badigad Impervious Unstable Hard Medium Active Strong Hard Stable
100 20 -20 40 100 60 -80 -20 0 100 0 100 100 100 0 -20 80 55C-08 Andhi Khola Impervious Unstable Soft Pervious Medium Hard Stable
100 20 -20 40 20 20 0 0 20 60 0 60 60 60 0 -20 40 40W-02 Chera-1 Medium Stable Hard Medium Strong Hard Stable
60 100 0 80 100 60 0 0 80 100 0 100 100 100 0 0 100 90W-05 Lower Jhimruk Medium Stable Hard Impervious Strong Hard Stable
60 100 -20 60 100 100 0 0 100 100 -20 80 100 60 0 0 80 80W-06 Madi Medium Medium Hard Impervious Strong Hard Stable
60 60 -20 40 100 100 0 0 100 100 0 100 100 100 0 0 100 85W-23 Nalsyau Gad Medium Stable Hard Medium Strong Hard Stable
60 100 -20 60 100 60 0 0 80 100 -20 80 100 100 0 0 100 80W-25 Naumure (W. Rapti) Impervious Medium Hard Medium Strong Hard Stable
100 60 -20 60 100 60 0 0 80 100 0 100 100 100 0 0 100 85

Nationwide Master Plan Study on Storage-type Hydroelectric Power Development in Nepal
Table 8.3-25 Evaluation Summary of Thrust and Fault
8) Natural Environment
The main subjects of the natural environmental survey were: forest, flora, terrestrial fauna, aquatic fauna, protected area in the downstream and rare species in the downstream. The land use was also analyzed using the topographic maps of 1996. These maps were updated based on the satellite images taken from 2010 to 2012 and was analyzed in order to observe the tendency of changes of land use.
a. Impact on Forest
Comparing the forest area submerged in reservoir area, the impact on the Sun Koshi and the Naumure Projects are significant with more than 7 square kilometers of submerged forest area. More than 400,000 trees will be also affected. On the other hand, the submerged forest area of the Nalsyau Gad and the Chera-1 Projects are less than 1 square kilometers and the affected trees will be less than 40,000. Regarding the crown coverage, for the Kohajor-1 and the Dudh Koshi Projects are relatively high with more than 50%. I contrast, for the Madi and the Nalsyau Gad Projects are relatively low with less than 20 %. In comparison with the land use map of 1996 and the satellite image taken in 2010/2011, the forest land of the Naumure and the Andhi Khola Projects have decreased more than 1 square kilometer. By contrast, about the Sun Koshi Project, increase of forest land more the 3 square kilometers has been observed (see Table 8.3-26).
MBT MCT MinimumE-01 Dudh Koshi 32.0 26.0 26.0 100 0.5 -20 80E-06 Kokhajor-1 2.5 2.5 20 > 1 0 20E-17 Sunkosi No.3 16.0 16.0 100 > 1 0 100C-02 Lower Badigad 25.0 25.0 100 0.0 -40 60C-08 Andhi Khola 25.0 25.0 100 < 1 -20 80W-02 Chera-1 30.0 25.0 100 > 1 0 100W-05 Lower Jhimruk 2.0 2.0 20 > 1 0 20W-06 Madi 25.0 25.0 100 > 1 0 100W-23 Nalsyau Gad 60.0 60.0 100 0.5 -20 80W-25 Naumure (W. Rapti) 3.0 3.0 20 > 1 0 20
Projectscore
Distance to large techtonic thrusts (km)No. Project Closseness to
other faults (km)Basicscore
Subtruction
Final Report Appendix 3 SEA Report
179
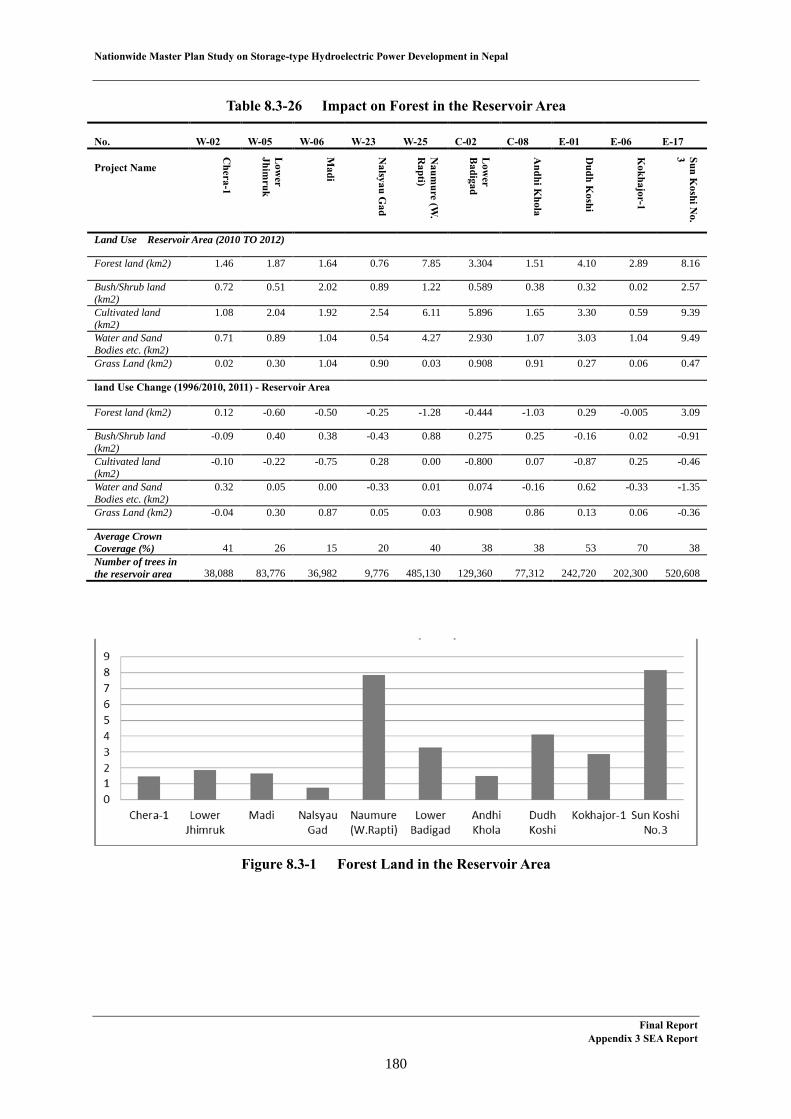
Nationwide Master Plan Study on Storage-type Hydroelectric Power Development in Nepal
Table 8.3-26 Impact on Forest in the Reservoir Area
No. W-02 W-05 W-06 W-23 W-25 C-02 C-08 E-01 E-06 E-17
Project Name
Chera-1
Low
er Jhim
ruk
Madi
Nalsyau G
ad
Naum
ure (W.
Rapti)
Low
er B
adigad
Andhi K
hola
Dudh K
oshi
Kokhajor-1
Sun Koshi N
o. 3
Land Use Reservoir Area (2010 TO 2012)
Forest land (km2) 1.46 1.87 1.64 0.76 7.85 3.304 1.51 4.10 2.89 8.16
Bush/Shrub land (km2)
0.72 0.51 2.02 0.89 1.22 0.589 0.38 0.32 0.02 2.57
Cultivated land (km2)
1.08 2.04 1.92 2.54 6.11 5.896 1.65 3.30 0.59 9.39
Water and Sand Bodies etc. (km2)
0.71 0.89 1.04 0.54 4.27 2.930 1.07 3.03 1.04 9.49
Grass Land (km2) 0.02 0.30 1.04 0.90 0.03 0.908 0.91 0.27 0.06 0.47
land Use Change (1996/2010, 2011) - Reservoir Area
Forest land (km2) 0.12 -0.60 -0.50 -0.25 -1.28 -0.444 -1.03 0.29 -0.005 3.09
Bush/Shrub land (km2)
-0.09 0.40 0.38 -0.43 0.88 0.275 0.25 -0.16 0.02 -0.91
Cultivated land (km2)
-0.10 -0.22 -0.75 0.28 0.00 -0.800 0.07 -0.87 0.25 -0.46
Water and Sand Bodies etc. (km2)
0.32 0.05 0.00 -0.33 0.01 0.074 -0.16 0.62 -0.33 -1.35
Grass Land (km2) -0.04 0.30 0.87 0.05 0.03 0.908 0.86 0.13 0.06 -0.36
Average Crown Coverage (%) 41 26 15 20 40 38 38 53 70 38Number of trees in the reservoir area 38,088 83,776 36,982 9,776 485,130 129,360 77,312 242,720 202,300 520,608
Figure 8.3-1 Forest Land in the Reservoir Area
Final ReportAppendix 3 SEA Report
180

Nationwide Master Plan Study on Storage-type Hydroelectric Power Development in Nepal
Figure 8.3-2 Number of Trees in the Reservoir Area
Figure 8.3-3 Average of Crown Coverage in the Reservoir Area (%)
b. Impact on Flora
The vegetation composition of each project site belong to a upper sub-tropical or sub-tropical and the dominant trees in these areas are: Khyar and Hill sal forest, Mixed hardwood forest, Pine forest, Sisso forest and Mixed broad leaved forest and etc. Regarding the community forest which used by surrounding residents to collect firewood, there are 25 places for the Naumure (W. Rapti) Project, 24 places for Madi Project and only less than 4 places for the Andhi Khola Project, the Dudh Koshi Project and the Sun Koshi No.3 Project.
Regarding the plant species, there are many reported plants for the Madi Project (74 species) and for the Dudh Koshi Project (67 species). In contrast, there are relatively few reported species for the Kokhajor-1 Project (10 species), and the Chera-1 Project (35 species). The largest number of the reported species of conservation significance is for the Madi Project as 6 species and the smallest number is for the Nalsyau Gad Project as 1 species.
Final ReportAppendix 3 SEA Report
181

Nationw
ide Master Plan Study on Storage-type H
ydroelectric Power D
evelopment in N
epal
Final Report
Appendix 3 SE
A Report
182
Table 8.3-27 Impact on Flora in the Reservoir Area
No. Project Name
W-02 Chera-1
W-05 Lower Jhimruk
W-06 Madi
W-23 Nalsyau Gad
W-25 Naumure (W. Rapti)
C-02 Lower Badigad
C-08 Andhi Khola
E-01 Dudh Koshi
E-06 Kokhajor-1
E-17 Sun Koshi No. 3
VEGETATION COMPOSITION
Upper Sub-tropical species
Sub-tropical species
Subtropical species
Upper Sub-tropical species
Sub-tropical species
Upper Sub-tropical species
Sub-tropical species
Upper Sub-tropical species
Sub-tropical Species
Sub-tropical species
FOREST TYPE Mainly Hill sal Forest
Mainly hill sal
Hill Sal Forest and Pine Forest
Mixed hardwood forest and Pine forest
Mainly Hill sal forest
. Khayar /Sisso forest, Hill sal forest and Mixed broad leaved forest
Khyar and Hill sal forest
Mixed broad leaved forests and Hill sal Forest.
Hill Sal forest
Khyar and Hill sal forest
DOMINANT TREE SPECIES
Shoera robusta (Sal)
Shoera robusta (Sal)
Shorea robusta and Pinus roxburgii
Bombax ceiba , : Celtis australis , Pinus roxburgii
Shoera robusta (Sal)
Acacia catechu (Khayar), Bombax ceibia (Simal),Shoera robusta (Sal) and Schima wallichii (chilaune)
Acacia catechu (Khayar), Bombax ceibia (Simal),Shoera robusta (Sal) and Schima wallichii (chilaune)
Shoera robusta (Sal)
Shorea robusta, Acacia catechu, Adina cardifolia, Terminalia alata, Bombax ceiba
Acacia catechu (Khayar), Bombax ceibia (Simal),Shoera robusta (Sal) and Schima wallichii (chilaune)
NO OF COMMUNITY FOREST IN RESERVOIR AREA
12 6 24 9 25 12 3 11 4 4
NO OF GOVERNMENT FOREST IN RESERVOIR AREA
0 3 0 0 2 2 1 2 1 0
NO OF LEASEHOLD FOREST IN RESERVOIR AREA
1 0 0 0 0 0 0 0 0 0
No OF PRIVATE FOREST IN RESERVOIR
0 0 0 0 1 0 0
AVERAGE TREE NOS PER HECTOR OF FOREST
529 426 225 323 618 392 521 592 700 638
AVERAGE CROWN COVERAGE
41 26 15 20 40 38 38 53 70 38
NO OF TREES IN THE RESERVOIR AREA
38088 83776 36982 24580 485130 129360 77312 242720 202300 520608

Nationw
ide Master Plan Study on Storage-type H
ydroelectric Power D
evelopment in N
epal
Final Report
Appendix 3 SE
A Report
183
No. Project Name
W-02 Chera-1
W-05 Lower Jhimruk
W-06 Madi
W-23 Nalsyau Gad
W-25 Naumure (W. Rapti)
C-02 Lower Badigad
C-08 Andhi Khola
E-01 Dudh Koshi
E-06 Kokhajor-1
E-17 Sun Koshi No. 3
No OF PLANT SPECIES REPORTED
35 55 74 59 55 >45 41 67 10 46
NO OF SPECIES OF CONSERVATION SIGNIFICANCE
3 4 6 1 4 5 5 3 3 5
NO OF IUCN CONSERVATION SPECIES IN RESERVOIR
0 0 0 0 0 0 0 0 0 0
NO OF CITES CONSERVATION SPECIES IN RESERVOIR
0 1(II) 1 (II) 0 1(II) 1(II) 1 (II) 0 0 0
NO OF GOVERNMENT PROTECTED SPECIES IN RESERVOIR
3 4 5 1 4 4 5 3 3 5

Nationwide Master Plan Study on Storage-type Hydroelectric Power Development in Nepal
Figure 8.3-4 Number of Plant Species Reported in the Reservoir Area
Figure 8.3-5 Number of Plant Species of Conservation Significance in the Reservoir Area
c. Impact on Terrestrial Fauna
Regarding the terrestrial fauna, the Naumure and the Lower Jhimruk Projects conserve relatively well their habitat. On the other hand, the habitat of terrestrial fauna is divided by farmland, houses and collecting firewood place in the other project sites. The quality of habitat has been decreased. Reflecting these habitats conditions, the number of mammal species and herpetofauna species are relatively large in the Lower Jhimruk, the Naumure (W. Rapti) and the Dudh Koshi Projects, and relatively small in the Nalsyau Gad, the Andhi Khola and theSun Koshi No. 3 Projects. Meanwhile, the number of birds’ species has a tendency to increase even in a large impact area, 51 species for the Dudh Koshi Project and 50 species for the Sun Koshi No.3 Project have been reported.
Final ReportAppendix 3 SEA Report
184
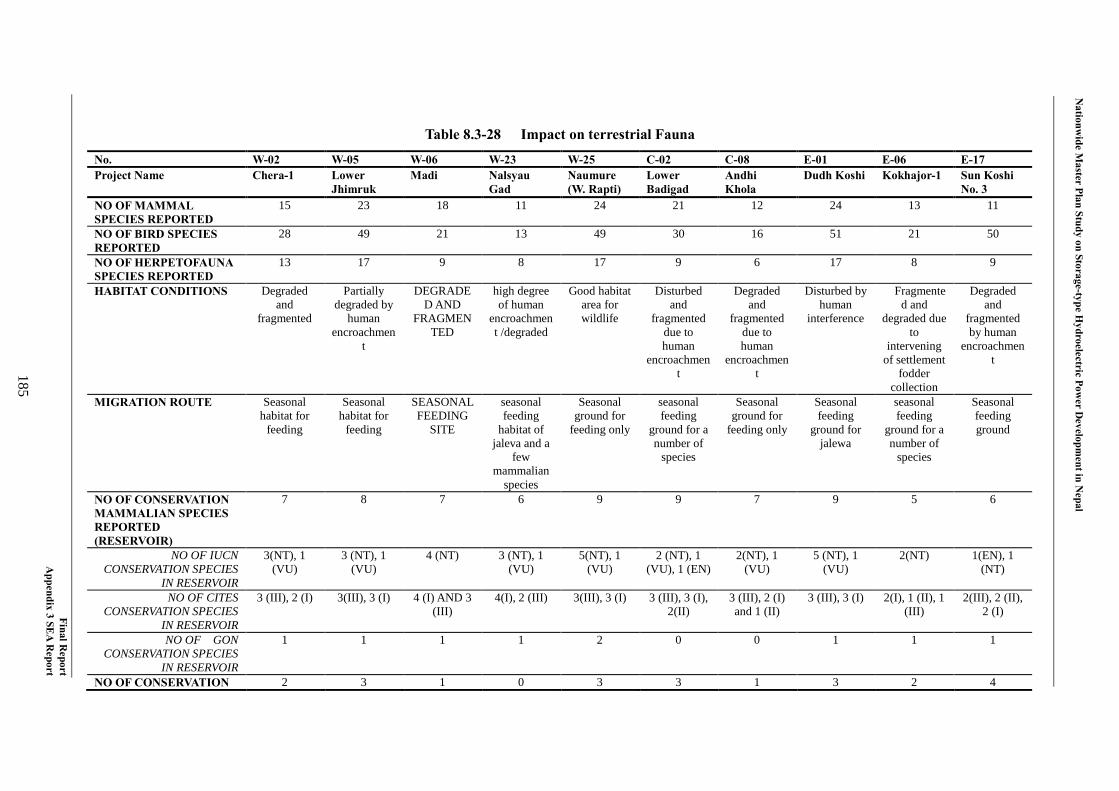
N
ationwide M
aster Plan Study on Storage-type Hydroelectric Pow
er Developm
ent in Nepal
Final Report
Appendix 3 SE
A Report
185
Table 8.3-28 Impact on terrestrial Fauna
No. W-02 W-05 W-06 W-23 W-25 C-02 C-08 E-01 E-06 E-17 Project Name Chera-1 Lower
Jhimruk Madi Nalsyau
Gad Naumure (W. Rapti)
Lower Badigad
Andhi Khola
Dudh Koshi Kokhajor-1 Sun Koshi No. 3
NO OF MAMMAL SPECIES REPORTED
15 23 18 11 24 21 12 24 13 11
NO OF BIRD SPECIES REPORTED
28 49 21 13 49 30 16 51 21 50
NO OF HERPETOFAUNA SPECIES REPORTED
13 17 9 8 17 9 6 17 8 9
HABITAT CONDITIONS Degraded and
fragmented
Partially degraded by
human encroachmen
t
DEGRADED AND
FRAGMENTED
high degree of human
encroachment /degraded
Good habitat area for wildlife
Disturbed and
fragmented due to human
encroachment
Degraded and
fragmented due to human
encroachment
Disturbed by human
interference
Fragmented and
degraded due to
intervening of settlement
fodder collection
Degraded and
fragmented by human
encroachment
MIGRATION ROUTE Seasonal habitat for
feeding
Seasonal habitat for
feeding
SEASONAL FEEDING
SITE
seasonal feeding
habitat of jaleva and a
few mammalian
species
Seasonal ground for
feeding only
seasonal feeding
ground for a number of
species
Seasonal ground for
feeding only
Seasonal feeding
ground for jalewa
seasonal feeding
ground for a number of
species
Seasonal feeding ground
NO OF CONSERVATION MAMMALIAN SPECIES REPORTED (RESERVOIR)
7 8 7 6 9 9 7 9 5 6
NO OF IUCN CONSERVATION SPECIES
IN RESERVOIR
3(NT), 1 (VU)
3 (NT), 1 (VU)
4 (NT) 3 (NT), 1 (VU)
5(NT), 1 (VU)
2 (NT), 1 (VU), 1 (EN)
2(NT), 1 (VU)
5 (NT), 1 (VU)
2(NT) 1(EN), 1 (NT)
NO OF CITES CONSERVATION SPECIES
IN RESERVOIR
3 (III), 2 (I) 3(III), 3 (I) 4 (I) AND 3 (III)
4(I), 2 (III) 3(III), 3 (I) 3 (III), 3 (I), 2(II)
3 (III), 2 (I) and 1 (II)
3 (III), 3 (I) 2(I), 1 (II), 1 (III)
2(III), 2 (II), 2 (I)
NO OF GON CONSERVATION SPECIES
IN RESERVOIR
1 1 1 1 2 0 0 1 1 1
NO OF CONSERVATION 2 3 1 0 3 3 1 3 2 4

N
ationwide M
aster Plan Study on Storage-type Hydroelectric Pow
er Developm
ent in Nepal
Final Report
Appendix 3 SE
A Report
186
No. W-02 W-05 W-06 W-23 W-25 C-02 C-08 E-01 E-06 E-17 Project Name Chera-1 Lower
Jhimruk Madi Nalsyau
Gad Naumure (W. Rapti)
Lower Badigad
Andhi Khola
Dudh Koshi Kokhajor-1 Sun Koshi No. 3
BIRD SPECIES REPORTED (RESERVOIR)
NO OF IUCN CONSERVATION SPECIES
IN RESERVOIR
1 (EN) 1(EN) 0 0 1 (EN) 1(CR), 1(EN), 1
(VU)
0 1(EN) 1(VU) 2(VU), 1(CR), 1
(NT) NO OF CITES
CONSERVATION SPECIES IN RESERVOIR
1(I) 1(I), 1 (II) 1 (I) 0 1(I), 1 (II) 0 I(I) 1(I), 1 (II) 1(I), 1 (III) 1 (I)
NO OF GON CONSERVATION SPECIES
IN RESERVOIR
1 0 1 0 0 0 1 1 1 0
NO OF CONSERVATION HERPETOFAUNA SPECIES REPORTED (RESERVOIR)
4 4 1 1 4 0 2 5 1 3
NO OF IUCN CONSERVATION SPECIES
IN RESERVOIR
0 0 0 0 0 0 0 0 0 1(VU)
NO OF CITES CONSERVATION SPECIES
IN RESERVOIR
2(III), 2 (II) 2(II), 1 (III), 1 (I)
1 (II) 1 (I) 3(II), 1 (III) 0 1(I) AND 1 (II)
3(II), 1 (III), 1 (I)
1 (I) 2(II), 1 (I)
NO OF GON CONSERVATION SPECIES
IN RESERVOIR
0 1 1 1 1 0 1 1 1 1

Nationwide Master Plan Study on Storage-type Hydroelectric Power Development in Nepal
Figure 8.3-6 Number of Mammal Species Reported in the Reservoir Area
Figure 8.3-7 Number of Bird Species Reported in the Reservoir Area
Figure 8.3-8 Number of Herpetofauna Species Reported in the Reservoir Area
Final ReportAppendix 3 SEA Report
187
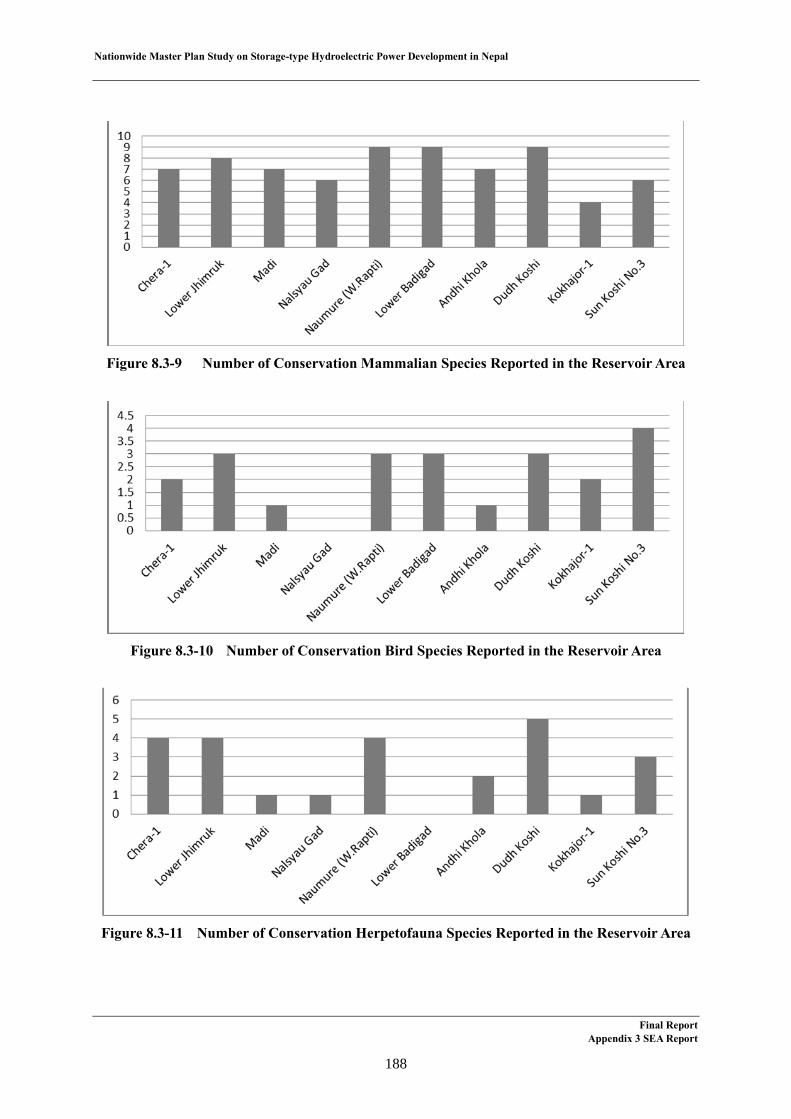
Nationwide Master Plan Study on Storage-type Hydroelectric Power Development in Nepal
Figure 8.3-9 Number of Conservation Mammalian Species Reported in the Reservoir Area
Figure 8.3-10 Number of Conservation Bird Species Reported in the Reservoir Area
Figure 8.3-11 Number of Conservation Herpetofauna Species Reported in the Reservoir Area
Final ReportAppendix 3 SEA Report
188

Nationwide Master Plan Study on Storage-type Hydroelectric Power Development in Nepal
d. Impact on Fish
The impact on aquatic fauna has been evaluated taking into account fish species, number of fish species of conservation significance and the length or recession area. At the filed, interview with fisherman was conducted to collect the information and the length of recession area was measured on topographic maps. Regarding the number of fish species, the largest number of fish as 24 species was reported for the Dudh Koshi Project, relatively small number of fish species as 6 for the Andhi Khola Project and as 7 for the Kokhajor-1 Project were reported.
The Andhi Khola and the Dudh Koshi Projects have the longest recession area as 60 km. In contrast, the Sun Koshi No.3 and the Naumure (W. Rapti) Projects have the short recession are as less than 1 km. Table 8.3-29 show the results of Impact on aquatic fauna.
Table 8.3-29 Impact on Fish
No. W-02 W-05 W-06 W-23 W-25 C-02 C-08 E-01 E-06 E-17
Project Name Chera-1
Low
er Jhim
ruk
Madi
Nalsyau G
ad
Naum
ure (W
. Rapti)
Low
er B
adigad
Andhi K
hola
Dudh K
oshi
Kokhajor-1
Sun Koshi
No. 3
NO OF FISH SPECIES REPORTED
11 11 8 8 16 12 6 24 7 21
NO OF FISH SPECIES OF CONSERVATION SIGNIFICANCE
2 2 3 2 2 4 2 3 2 3
NO OF IUCN CONSERVATION SPECIES IN RESERVOIR
2 (NT) 2(NT) 2(NT) , 1(VU)
1 (NT),
1 (VU)
2 (NT) 2 (NT),
1 (VU), 1 (EN)
1 (NT),
1 (VU)
3 (NT) 2(NT) 3 (NT)
NO OF CITES CONSERVATION SPECIES IN RESERVOIR
0 0 0 0 0 0 0 0 0 0
NO OF GON CONSERVATION SPECIES IN RESERVOIR
0 0 0 0 0 0 0 0 0 0
Length of Recession Area (km) 7 8 10 11 0.5 4 60 60 21 0.5
Final Report Appendix 3 SEA Report
189
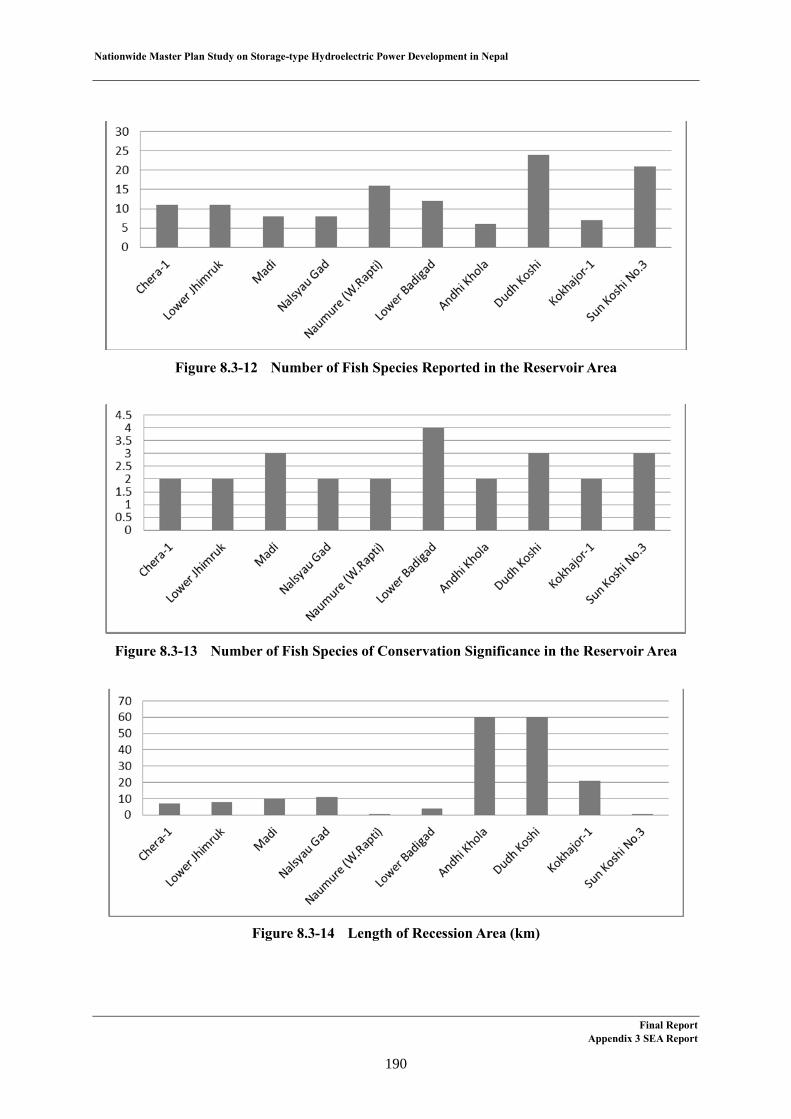
Nationwide Master Plan Study on Storage-type Hydroelectric Power Development in Nepal
Figure 8.3-12 Number of Fish Species Reported in the Reservoir Area
Figure 8.3-13 Number of Fish Species of Conservation Significance in the Reservoir Area
Figure 8.3-14 Length of Recession Area (km)
Final ReportAppendix 3 SEA Report
190
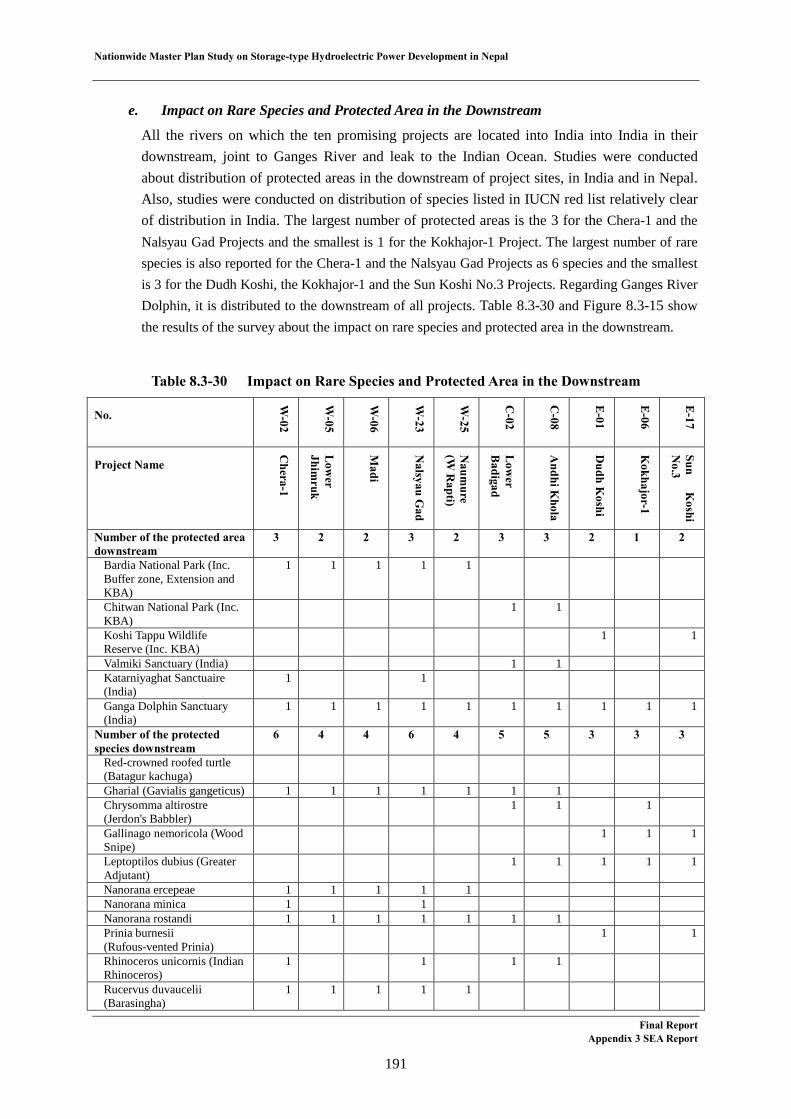
Nationwide Master Plan Study on Storage-type Hydroelectric Power Development in Nepal
e. Impact on Rare Species and Protected Area in the Downstream
All the rivers on which the ten promising projects are located into India into India in their downstream, joint to Ganges River and leak to the Indian Ocean. Studies were conducted about distribution of protected areas in the downstream of project sites, in India and in Nepal. Also, studies were conducted on distribution of species listed in IUCN red list relatively clear of distribution in India. The largest number of protected areas is the 3 for the Chera-1 and the Nalsyau Gad Projects and the smallest is 1 for the Kokhajor-1 Project. The largest number of rare species is also reported for the Chera-1 and the Nalsyau Gad Projects as 6 species and the smallest is 3 for the Dudh Koshi, the Kokhajor-1 and the Sun Koshi No.3 Projects. Regarding Ganges River Dolphin, it is distributed to the downstream of all projects. Table 8.3-30 and Figure 8.3-15 show the results of the survey about the impact on rare species and protected area in the downstream.
Table 8.3-30 Impact on Rare Species and Protected Area in the Downstream
No.
W-02
W-05
W-06
W-23
W-25
C-02
C-08
E-01
E-06
E-17
Project Name
Chera-1
Low
er Jhim
ruk
Madi
Nalsyau G
ad
Naum
ure (W
Rapti)
Low
er B
adigad
Andhi K
hola
Dudh K
oshi
Kokhajor-1
Sun K
oshi N
o.3
Number of the protected area downstream
3 2 2 3 2 3 3 2 1 2
Bardia National Park (Inc. Buffer zone, Extension and KBA)
1 1 1 1 1
Chitwan National Park (Inc. KBA)
1 1
Koshi Tappu Wildlife Reserve (Inc. KBA)
1 1
Valmiki Sanctuary (India) 1 1 Katarniyaghat Sanctuaire (India)
1 1
Ganga Dolphin Sanctuary (India)
1 1 1 1 1 1 1 1 1 1
Number of the protected species downstream
6 4 4 6 4 5 5 3 3 3
Red-crowned roofed turtle (Batagur kachuga)
Gharial (Gavialis gangeticus) 1 1 1 1 1 1 1 Chrysomma altirostre (Jerdon's Babbler)
1 1 1
Gallinago nemoricola (Wood Snipe)
1 1 1
Leptoptilos dubius (Greater Adjutant)
1 1 1 1 1
Nanorana ercepeae 1 1 1 1 1 Nanorana minica 1 1 Nanorana rostandi 1 1 1 1 1 1 1 Prinia burnesii (Rufous-vented Prinia)
1 1
Rhinoceros unicornis (Indian Rhinoceros)
1 1 1 1
Rucervus duvaucelii (Barasingha)
1 1 1 1 1
Final Report Appendix 3 SEA Report
191
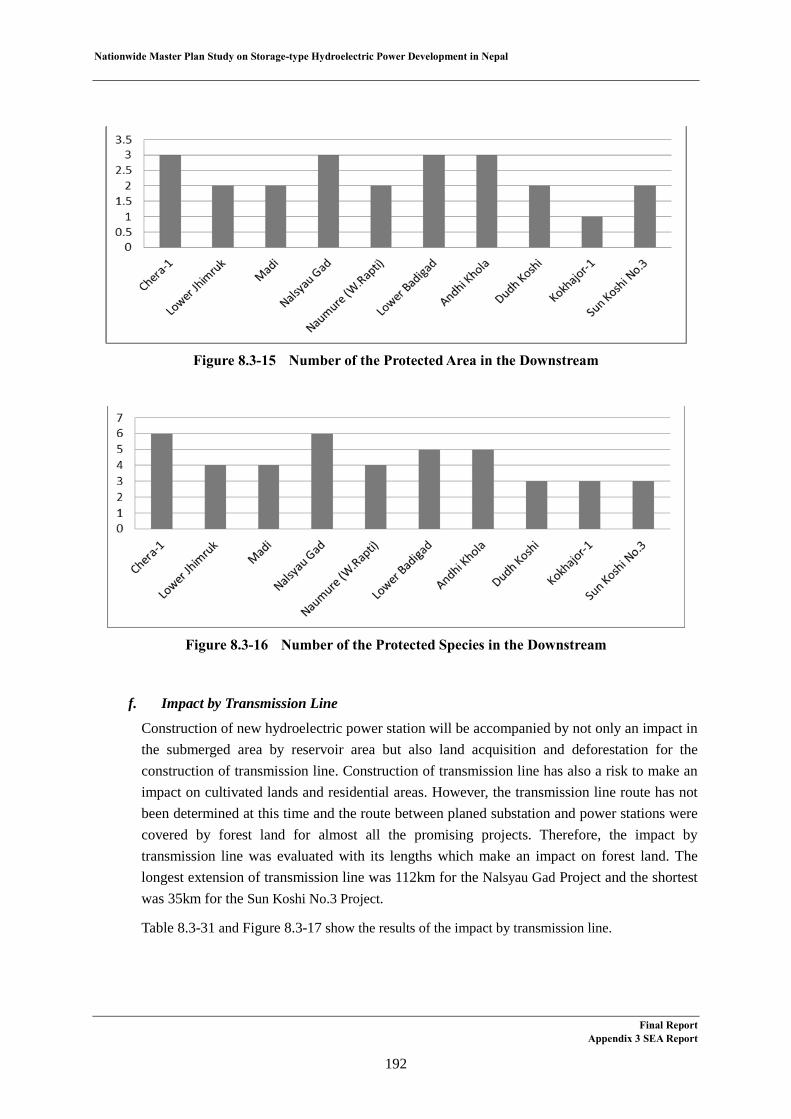
Nationwide Master Plan Study on Storage-type Hydroelectric Power Development in Nepal
Figure 8.3-15 Number of the Protected Area in the Downstream
Figure 8.3-16 Number of the Protected Species in the Downstream
f. Impact by Transmission Line
Construction of new hydroelectric power station will be accompanied by not only an impact in the submerged area by reservoir area but also land acquisition and deforestation for the construction of transmission line. Construction of transmission line has also a risk to make an impact on cultivated lands and residential areas. However, the transmission line route has not been determined at this time and the route between planed substation and power stations were covered by forest land for almost all the promising projects. Therefore, the impact by transmission line was evaluated with its lengths which make an impact on forest land. The longest extension of transmission line was 112km for the Nalsyau Gad Project and the shortest was 35km for the Sun Koshi No.3 Project.
Table 8.3-31 and Figure 8.3-17 show the results of the impact by transmission line.
Final ReportAppendix 3 SEA Report
192

Nationwide Master Plan Study on Storage-type Hydroelectric Power Development in Nepal
Table 8.3-31 Length of Transmission Line
No.W-02 W-05 W-06 W-23 W-25 C-02 C-08 E-01 E-06 E-17
Project Name
Chera-1
Low
er Jhim
ruk
Madi
Nalsyau G
ad
Naum
ure(W
.Rapti)
Low
er B
adigad
Andhi K
hola
Dudh K
oshi
Kokhajor-1
Sun K
oshi N
o.3
Length of Transmission Line (km) 66 75 62 112 79 49 49 43 62 35
Figure 8.3-17 Impact on Forest by Transmission Line
9) Social Environment
The impact on social and environment was evaluated mainly by the impact on the buildings, ethnic minority groups, agriculture, fisheries, tourism and culture, existing infrastructure, and development plan for other sectors. The brief summary of each survey results are as follows.
a. Impact on Buildings
The impact on buildings was evaluated by the number of households, schools and industries in the reservoir area. The number of households was basically estimated based on the number of structure that was counted from satellite image and placement and usage of households observed in the field. Regarding the number of schools and industries, these were studied by interview survey in the field. The estimated number of household is more than 1,500 in the place relatively close to the capital such as the Sun Koshi No.3 and the Lower BadigadProjects. On the other hand, only 63 household have reported for the Dudh Koshi Project. The number of schools and industries shows the similar trend.
Table 8.3-32, Figure 8.3-18, Figure 8.3-19 and Figure 8.3-20 shows the results of the impact on buildings.
Final ReportAppendix 3 SEA Report
193
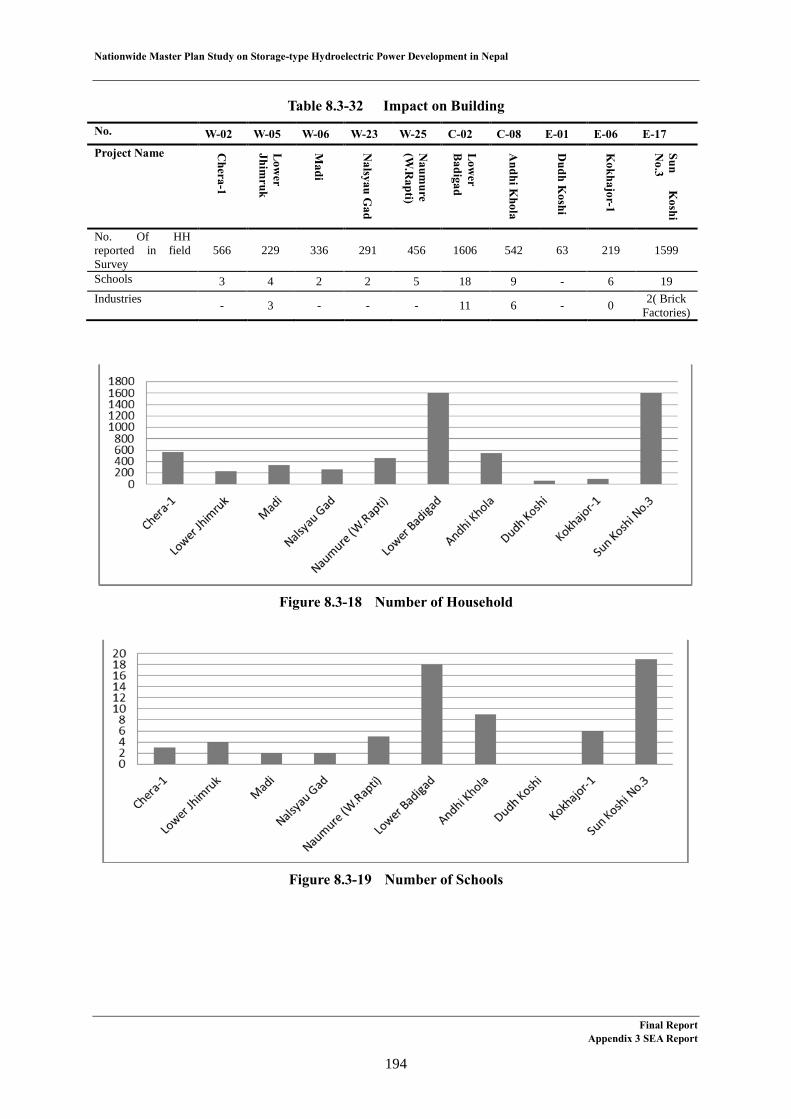
Nationwide Master Plan Study on Storage-type Hydroelectric Power Development in Nepal
Table 8.3-32 Impact on BuildingNo. W-02 W-05 W-06 W-23 W-25 C-02 C-08 E-01 E-06 E-17Project Name C
hera-1
Low
er Jhim
ruk
Madi
Nalsyau G
ad
Naum
ure(W
.Rapti)
Low
er B
adigad
Andhi K
hola
Dudh K
oshi
Kokhajor-1
Sun K
oshi N
o.3
No. Of HH reported in field Survey
566 229 336 291 456 1606 542 63 219 1599
Schools 3 4 2 2 5 18 9 - 6 19Industries - 3 - - - 11 6 - 0 2( Brick
Factories)
Figure 8.3-18 Number of Household
Figure 8.3-19 Number of Schools
Final ReportAppendix 3 SEA Report
194
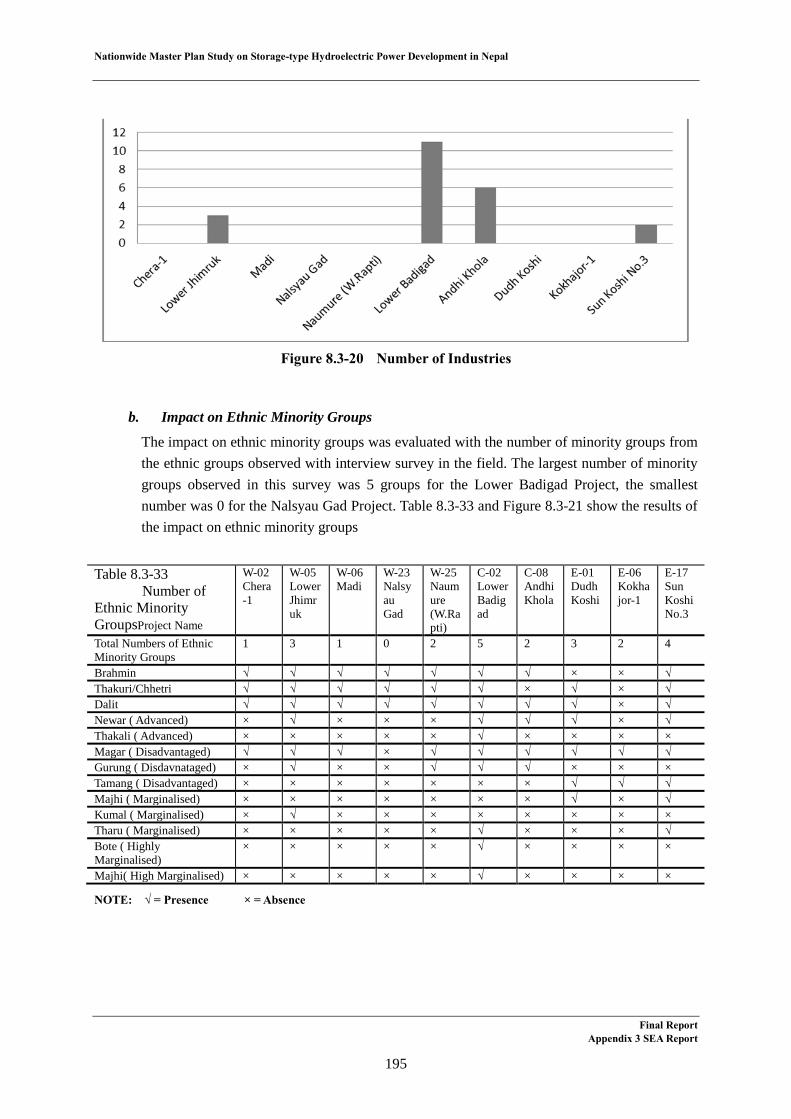
Nationwide Master Plan Study on Storage-type Hydroelectric Power Development in Nepal
Figure 8.3-20 Number of Industries
b. Impact on Ethnic Minority Groups
The impact on ethnic minority groups was evaluated with the number of minority groups from the ethnic groups observed with interview survey in the field. The largest number of minority groups observed in this survey was 5 groups for the Lower Badigad Project, the smallestnumber was 0 for the Nalsyau Gad Project. Table 8.3-33 and Figure 8.3-21 show the results of the impact on ethnic minority groups
Table 8.3-33Number of
Ethnic Minority GroupsProject Name
W-02Chera-1
W-05Lower Jhimruk
W-06Madi
W-23Nalsyau Gad
W-25Naumure (W.Rapti)
C-02Lower Badigad
C-08Andhi Khola
E-01Dudh Koshi
E-06Kokhajor-1
E-17Sun Koshi No.3
Total Numbers of Ethnic Minority Groups
1 3 1 0 2 5 2 3 2 4
Brahmin √ √ √ √ √ √ √ × × √Thakuri/Chhetri √ √ √ √ √ √ × √ × √Dalit √ √ √ √ √ √ √ √ × √Newar ( Advanced) × √ × × × √ √ √ × √Thakali ( Advanced) × × × × × √ × × × ×Magar ( Disadvantaged) √ √ √ × √ √ √ √ √ √Gurung ( Disdavnataged) × √ × × √ √ √ × × ×Tamang ( Disadvantaged) × × × × × × × √ √ √Majhi ( Marginalised) × × × × × × × √ × √Kumal ( Marginalised) × √ × × × × × × × ×Tharu ( Marginalised) × × × × × √ × × × √Bote ( Highly Marginalised)
× × × × × √ × × × ×
Majhi( High Marginalised) × × × × × √ × × × ×
NOTE: √ = Presence × = Absence
Final ReportAppendix 3 SEA Report
195

Nationwide Master Plan Study on Storage-type Hydroelectric Power Development in Nepal
Figure 8.3-21 Total Numbers of Ethnic Minority Groups
c. Impact on Agriculture
The impact on agriculture was evaluated by the cultivated land in the reservoir area estimated based on the satellite image analysis and the number of irrigation systems observed with the interview survey. Regarding the cultivated land, the impact on the Sun Koshi No. 3 Project was the biggest as 9.4 km2, the smallest was 1.1 km2 for the Chera-1 Project. About the number of irrigation systems, relatively large number of irrigation systems were observed for the projects in a narrow valley such as the Lower Badigad, the Naumure (W. Rapti) and the Andhi Khola Projects. Relatively small for the Nalsyau Gad, the Dudh Koshi and the Kokhajor-1 Projects. Table 8.3-34, Figure 8.3-22 and show the results of the impact onagriculture.
Table 8.3-34 Impact on Agriculture
No. W-02 W-05 W-06 W-23 W-25 C-02 C-08 E-01 E-06 E-17
Project Name Chera-1
Low
er Jhim
ruk
Madi
Nalsyau G
ad
Naum
ure(W
. Rapti)
Low
er B
adigad
Andhi K
hola
Dudh K
oshi
Kokhajor-1
Sun K
oshi N
o.3
Cultivated land (km2) 1.1 2.0 1.9 2.5 6.1 5.9 1.7 3.3 1.7 9.4land Use Change (1996-2010/2011) -Cultivated land (km2)
0.10 -0.22 -0.75 0.13 0.00 -0.80 0.07 -0.87 0.25 -0.46
Irrigation 7 3 16 0 25 58 23 1 2 20
Final ReportAppendix 3 SEA Report
196
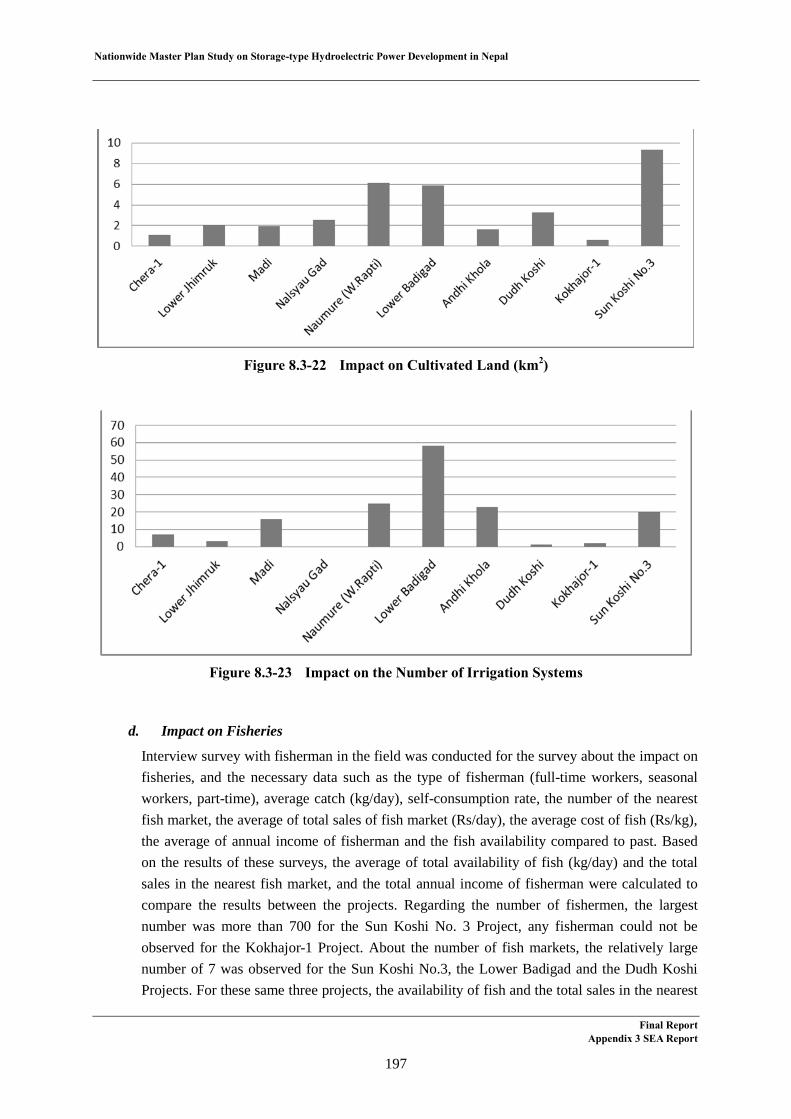
Nationwide Master Plan Study on Storage-type Hydroelectric Power Development in Nepal
Figure 8.3-22 Impact on Cultivated Land (km2)
Figure 8.3-23 Impact on the Number of Irrigation Systems
d. Impact on Fisheries
Interview survey with fisherman in the field was conducted for the survey about the impact on fisheries, and the necessary data such as the type of fisherman (full-time workers, seasonal workers, part-time), average catch (kg/day), self-consumption rate, the number of the nearest fish market, the average of total sales of fish market (Rs/day), the average cost of fish (Rs/kg), the average of annual income of fisherman and the fish availability compared to past. Based on the results of these surveys, the average of total availability of fish (kg/day) and the total sales in the nearest fish market, and the total annual income of fisherman were calculated to compare the results between the projects. Regarding the number of fishermen, the largest number was more than 700 for the Sun Koshi No. 3 Project, any fisherman could not be observed for the Kokhajor-1 Project. About the number of fish markets, the relatively large number of 7 was observed for the Sun Koshi No.3, the Lower Badigad and the Dudh KoshiProjects. For these same three projects, the availability of fish and the total sales in the nearest
Final ReportAppendix 3 SEA Report
197

Nationwide Master Plan Study on Storage-type Hydroelectric Power Development in Nepal
fish market, and the total annual income of fisherman have tended to large. Regarding the length of recession area, the Project and the Naumure Project are as short as 0.5 km, meanwhile the Dudu Project and the Project are as long as 60 km. Table 8.3-35, Figure 8.3-24, Figure 8.3-25, Figure 8.3-26, Figure 8.3-27 and Figure 8.3-28 show the above mentioned results. The amount of fish in recent years have shown basically decline by an increase in fishing pressure with the exception of the Lower Badigad Project which had shown the tendency of increase. Regarding the situation of the Lower Badigad Project, there are two reasons assumed: 1) the fishery regulation was enhanced about the fishing with dynamite and poison, 2) fish were run-up bypassing the block of run-up by Karigandaki A hydroelectric power plant.
Final Report Appendix 3 SEA Report
198
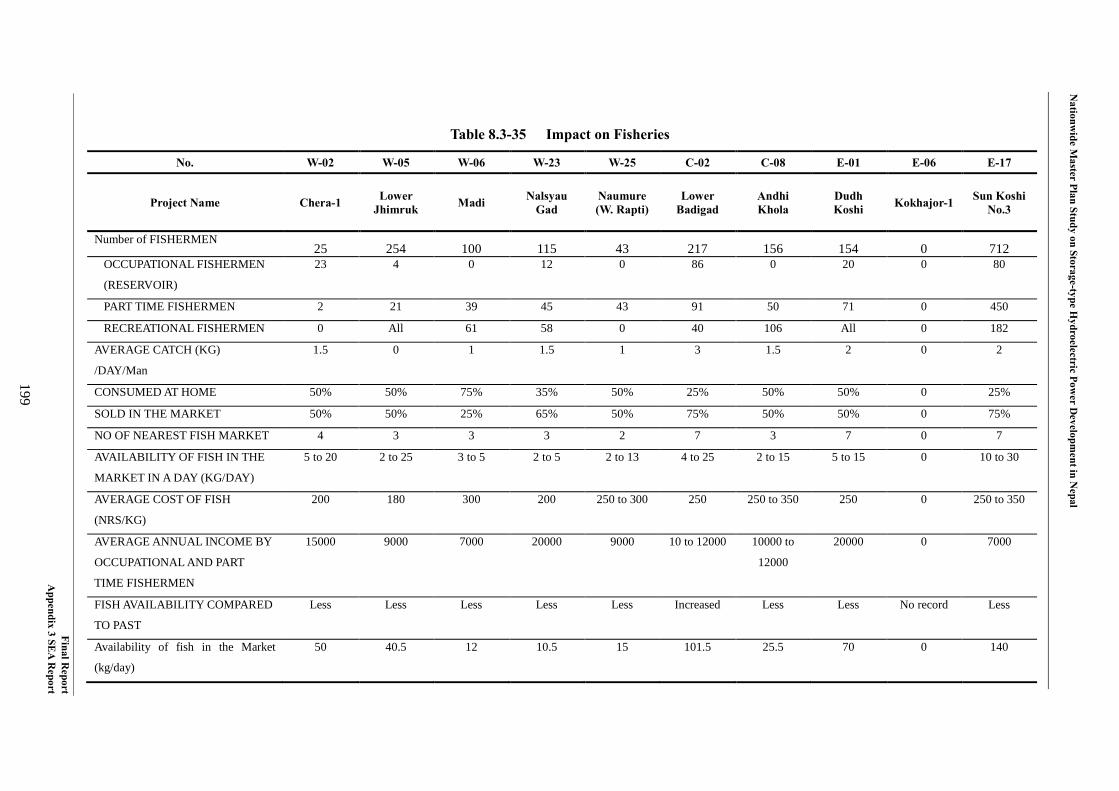
N
ationwide M
aster Plan Study on Storage-type Hydroelectric Pow
er Developm
ent in Nepal
Final Report
Appendix 3 SE
A Report
199
Table 8.3-35 Impact on Fisheries
No. W-02 W-05 W-06 W-23 W-25 C-02 C-08 E-01 E-06 E-17
Project Name Chera-1 Lower Jhimruk Madi Nalsyau
Gad Naumure (W. Rapti)
Lower Badigad
Andhi Khola
Dudh Koshi Kokhajor-1 Sun Koshi
No.3
Number of FISHERMEN 25 254 100 115 43 217 156 154 0 712
OCCUPATIONAL FISHERMEN
(RESERVOIR)
23 4 0 12 0 86 0 20 0 80
PART TIME FISHERMEN 2 21 39 45 43 91 50 71 0 450
RECREATIONAL FISHERMEN 0 All 61 58 0 40 106 All 0 182
AVERAGE CATCH (KG)
/DAY/Man
1.5 0 1 1.5 1 3 1.5 2 0 2
CONSUMED AT HOME 50% 50% 75% 35% 50% 25% 50% 50% 0 25%
SOLD IN THE MARKET 50% 50% 25% 65% 50% 75% 50% 50% 0 75%
NO OF NEAREST FISH MARKET 4 3 3 3 2 7 3 7 0 7
AVAILABILITY OF FISH IN THE
MARKET IN A DAY (KG/DAY)
5 to 20 2 to 25 3 to 5 2 to 5 2 to 13 4 to 25 2 to 15 5 to 15 0 10 to 30
AVERAGE COST OF FISH
(NRS/KG)
200 180 300 200 250 to 300 250 250 to 350 250 0 250 to 350
AVERAGE ANNUAL INCOME BY
OCCUPATIONAL AND PART
TIME FISHERMEN
15000 9000 7000 20000 9000 10 to 12000 10000 to
12000
20000 0 7000
FISH AVAILABILITY COMPARED
TO PAST
Less Less Less Less Less Increased Less Less No record Less
Availability of fish in the Market
(kg/day)
50 40.5 12 10.5 15 101.5 25.5 70 0 140

N
ationwide M
aster Plan Study on Storage-type Hydroelectric Pow
er Developm
ent in Nepal
Final Report
Appendix 3 SE
A Report
200
No. W-02 W-05 W-06 W-23 W-25 C-02 C-08 E-01 E-06 E-17
Project Name Chera-1 Lower Jhimruk Madi Nalsyau
Gad Naumure (W. Rapti)
Lower Badigad
Andhi Khola
Dudh Koshi Kokhajor-1 Sun Koshi
No.3
Total sale of fish (Rs./day) 10000 7290 3600 2100 4125 25375 7650 17500 0 42000
Total income (Rs./year) 375,000 225,000 273,000 1,140,000 387,000 1,062,885 550,000 1,820,000 0 3,710,000
Length of Recession Area 7 8 10 11 0.5 4 60 60 21 0.5

Nationwide Master Plan Study on Storage-type Hydroelectric Power Development in Nepal
Figure 8.3-24 Impact on Number of Fishermen
Figure 8.3-25 Number of the Nearest Fish Markets
Figure 8.3-26 Availability of Fish in the Market (kg/day)
Final ReportAppendix 3 SEA Report
201
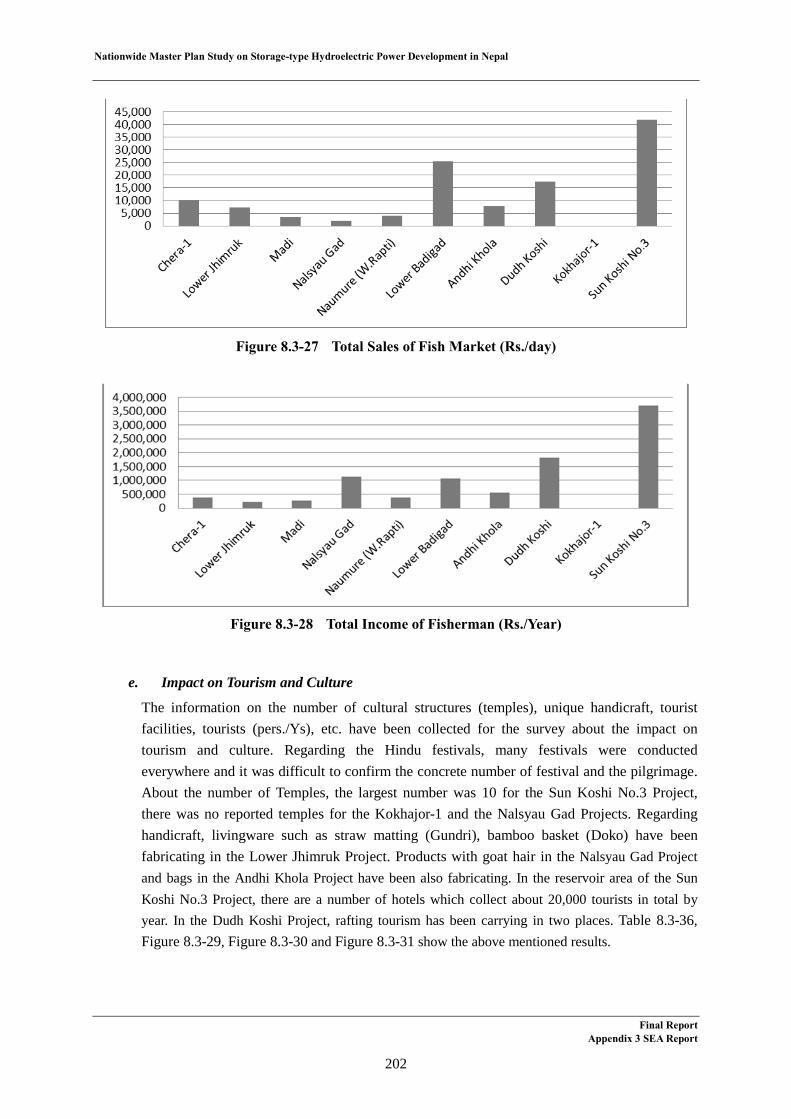
Nationwide Master Plan Study on Storage-type Hydroelectric Power Development in Nepal
Figure 8.3-27 Total Sales of Fish Market (Rs./day)
Figure 8.3-28 Total Income of Fisherman (Rs./Year)
e. Impact on Tourism and Culture
The information on the number of cultural structures (temples), unique handicraft, tourist facilities, tourists (pers./Ys), etc. have been collected for the survey about the impact on tourism and culture. Regarding the Hindu festivals, many festivals were conducted everywhere and it was difficult to confirm the concrete number of festival and the pilgrimage. About the number of Temples, the largest number was 10 for the Sun Koshi No.3 Project,there was no reported temples for the Kokhajor-1 and the Nalsyau Gad Projects. Regarding handicraft, livingware such as straw matting (Gundri), bamboo basket (Doko) have been fabricating in the Lower Jhimruk Project. Products with goat hair in the Nalsyau Gad Project and bags in the Andhi Khola Project have been also fabricating. In the reservoir area of the Sun Koshi No.3 Project, there are a number of hotels which collect about 20,000 tourists in total by year. In the Dudh Koshi Project, rafting tourism has been carrying in two places. Table 8.3-36,Figure 8.3-29, Figure 8.3-30 and Figure 8.3-31 show the above mentioned results.
Final ReportAppendix 3 SEA Report
202

Nationw
ide Master Plan Study on Storage-type H
ydroelectric Power D
evelopment in N
epal
Final Report
Appendix 3 SE
A Report
203
Table 8.3-36 Impact on Tourism and Culture
Project Name
W-02
Chera-1
W-05 Low
er Jhim
ruk
W-06 M
adi
W-23
Nalsyau G
ad
W-25
Naum
ure (W
. Rapti)
C-02 Low
er B
adigad
C-08 A
ndhi K
hola
E-01 D
udh K
oshi
E-06
Kokhajor-1
E-17 Sun
Koshi N
o.3
Cultural Aspects
Number of Cultural Structures (Temples)
1 1 4 - 2 9 5 2 0 >10
Type of Cultural Festivals Hindu Culture (Dasain, Tihar, Teeja, Manghe Sankrati) and Magar Diwas, Lhosar, Sonam Losar, Bisket Sankrati, Ekadashi, Pitri Puja, Ghatu Nach, Lakhe, Botre (Barki, Dhanya Purne), and Purnima among Janjati/Adivasi in all the project sites.
Unique Handicraft - Gundri/Doko/Mandro for
self-use
- Bakral from Goat wool
Mandal as per need
- Nepali Bag and Woollen
Products
- - -
Tourism
Number of Tourist Facilities
None - - - - - None 2 (Rafting) - 10
Number of Tourists/Yr none - - - - - None 10
- 20,000
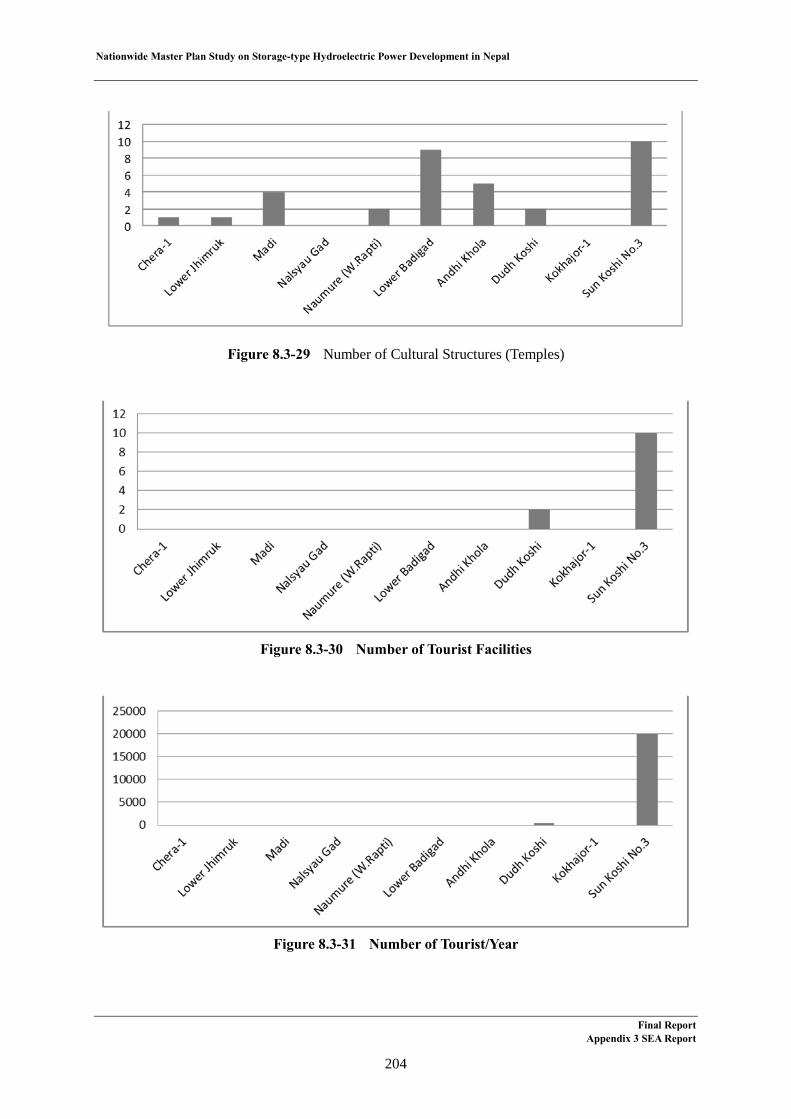
Nationwide Master Plan Study on Storage-type Hydroelectric Power Development in Nepal
Figure 8.3-29 Number of Cultural Structures (Temples)
Figure 8.3-30 Number of Tourist Facilities
Figure 8.3-31 Number of Tourist/Year
Final ReportAppendix 3 SEA Report
204

Nationwide Master Plan Study on Storage-type Hydroelectric Power Development in Nepal
f. Impact on Infrastructures
Regarding the survey about the impact on infrastructures, it was conducted mainly about the length and type of road (paving road, gravel road), the number of bridges (suspension bridges, motorable bridges), existing water mill/turbine and drinking water schemes. The road length was measured on maps based on the information collected in the field. The number of bridges and water schemes were confirmed with hearing survey in the field. Regarding the impact on roads, the Sun Koshi No.3 Project where the national road leading to China will be submerged shows the impact relatively significant. Also the impact on the Lower Badigad Project will be significant because 20km of motorable road will be affected. On the other hand, the Nalsyau Gad and the Kokhajor-1 Projects will be almost unaffected. The Sun Koshi No.3 and the Lower Badigad Projects have more than 10 bridges which will be also affected. In the Lower Badigad and the Nalsyau Gad Projects, there are more than 20 micro hydro and small water turbine for agriculture will be affected. About the Andhi Khola Project, hydroelectric power plant with 5 MW exists in the reservoir area. The number of drinking water schemes were relatively large for the Lower Badigad, the Madi and the Sun Koshi No.3 Projects. Table 8.3-37, Figure 8.3-32, Figure 8.3-33, Figure 8.3-34 and Figure 8.3-35¥ show the above mentioned results.
Table 8.3-37 Impact on Infrastructures
Project Name W-02 C
hera-1
W-05 Low
er Jhim
ruk W
-06 Madi
W-23
Nalsyau
Gad
W-25 N
aumure
(W. R
apti)
C-02 Low
er B
adigad C
-08 A
ndhi K
hola
E-01 D
udh K
oshi
E-06
Kokhajor-1
E-17
Sun K
oshi No.3
Black Topped Motorable Road (km)
0.0 0.0 0.0 0.0 0.0 0.0 0.0 0.0 0.0 15.0
Gravel motorable road (km)
3.8 3.3 11.2 0.0 1.8 26.1 3.4 5.0 0.0 24.4
Main Foot Trail (km)
0.3 0.0 13.6 2.0 9.8 2.5 0.0 3.2 0.0 2.5
Local Foot trail (km)
4.6 19.5 14.6 20.9 50.5 16.1 13.0 17.9 5.2 16.1
Suspension Bridges
1 3 6 4 11 11 11 5 0 13
Motorable Bridges
0 0 0 0 2 1 0 0 0 1
Fords 2 0 2 5 3 0 2 1 32 Water Mill/Turbine
9 - 2 20 - 24 - -- 10 15
Hydroelectric power
- 4(0.23 MW)
- - 2 (28 kw & 0.7
MW)
1(11MW)
1(1.5 kw)
-
Drinking Water Schemes
2 7 22 - 17 29 10 5 10 22
Final Report Appendix 3 SEA Report
205

Nationwide Master Plan Study on Storage-type Hydroelectric Power Development in Nepal
Figure 8.3-32 Impact on Roads
Figure 8.3-33 Impact on Bridges
Figure 8.3-34 Impact on Water Mill / Hydroelectric power
Final ReportAppendix 3 SEA Report
206
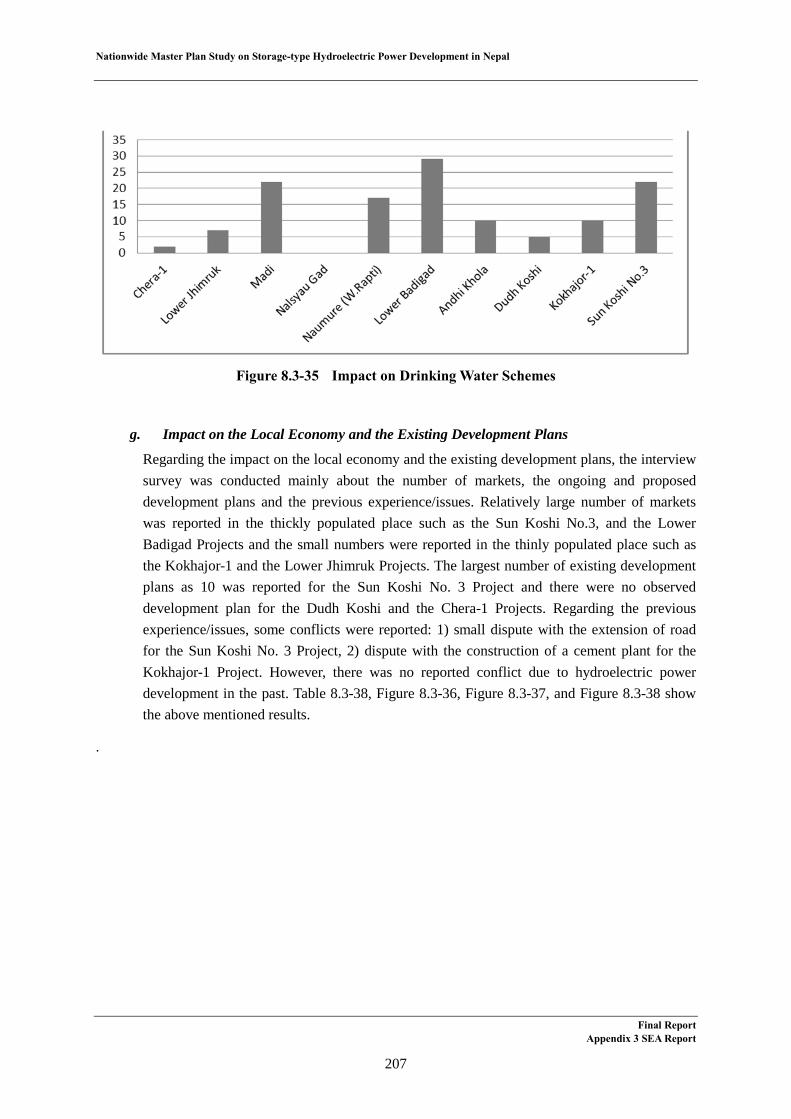
Nationwide Master Plan Study on Storage-type Hydroelectric Power Development in Nepal
Figure 8.3-35 Impact on Drinking Water Schemes
g. Impact on the Local Economy and the Existing Development Plans
Regarding the impact on the local economy and the existing development plans, the interviewsurvey was conducted mainly about the number of markets, the ongoing and proposed development plans and the previous experience/issues. Relatively large number of markets was reported in the thickly populated place such as the Sun Koshi No.3, and the Lower Badigad Projects and the small numbers were reported in the thinly populated place such as the Kokhajor-1 and the Lower Jhimruk Projects. The largest number of existing development plans as 10 was reported for the Sun Koshi No. 3 Project and there were no observed development plan for the Dudh Koshi and the Chera-1 Projects. Regarding the previous experience/issues, some conflicts were reported: 1) small dispute with the extension of road for the Sun Koshi No. 3 Project, 2) dispute with the construction of a cement plant for the Kokhajor-1 Project. However, there was no reported conflict due to hydroelectric powerdevelopment in the past. Table 8.3-38, Figure 8.3-36, Figure 8.3-37, and Figure 8.3-38 show the above mentioned results.
.
Final ReportAppendix 3 SEA Report
207
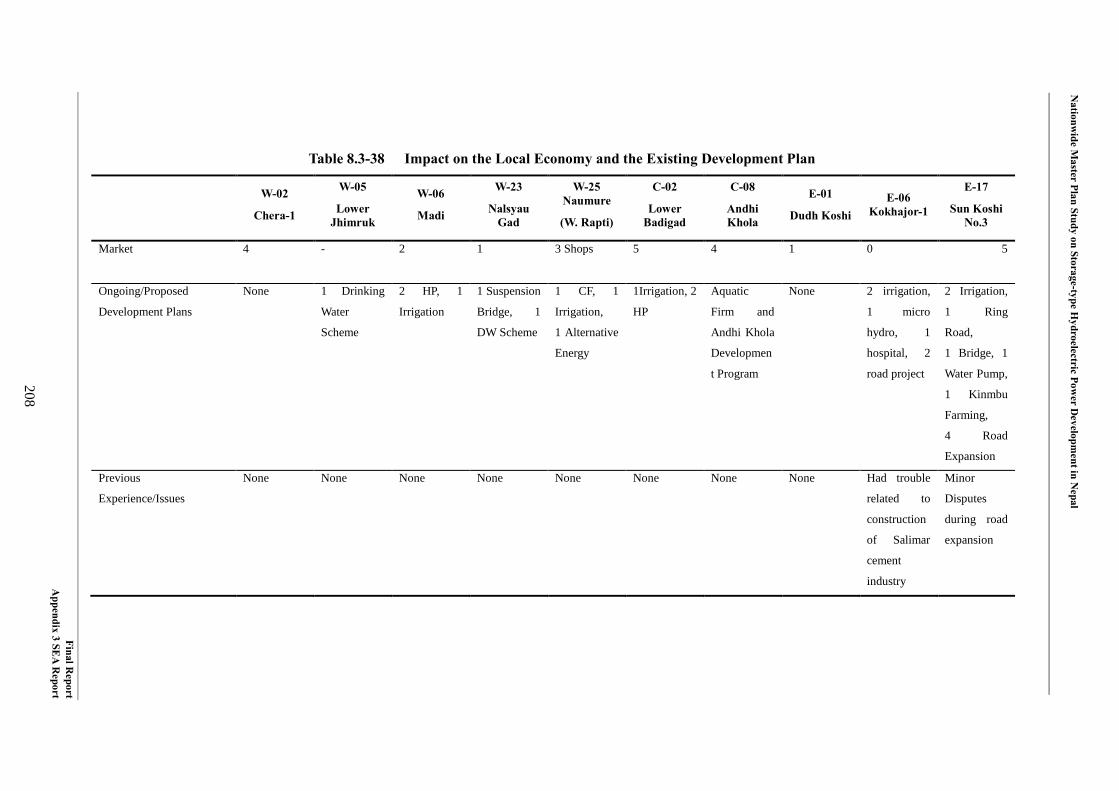
N
ationwide M
aster Plan Study on Storage-type Hydroelectric Pow
er Developm
ent in Nepal
Final Report
Appendix 3 SE
A Report
208
Table 8.3-38 Impact on the Local Economy and the Existing Development Plan
W-02
Chera-1
W-05
Lower Jhimruk
W-06
Madi
W-23
Nalsyau Gad
W-25 Naumure
(W. Rapti)
C-02
Lower Badigad
C-08
Andhi Khola
E-01
Dudh Koshi E-06
Kokhajor-1
E-17
Sun Koshi No.3
Market
4 - 2 1 3 Shops 5 4 1 0 5
Ongoing/Proposed
Development Plans
None 1 Drinking
Water
Scheme
2 HP, 1
Irrigation
1 Suspension
Bridge, 1
DW Scheme
1 CF, 1
Irrigation,
1 Alternative
Energy
1Irrigation, 2
HP
Aquatic
Firm and
Andhi Khola
Developmen
t Program
None 2 irrigation,
1 micro
hydro, 1
hospital, 2
road project
2 Irrigation,
1 Ring
Road,
1 Bridge, 1
Water Pump,
1 Kinmbu
Farming,
4 Road
Expansion
Previous
Experience/Issues
None None None None None None None None Had trouble
related to
construction
of Salimar
cement
industry
Minor
Disputes
during road
expansion

Nationwide Master Plan Study on Storage-type Hydroelectric Power Development in Nepal
Figure 8.3-36 Number of Markets
Figure 8.3-37 Number of Existing Plans
Figure 8.3-38 Number of Previous Experience / Issues
Final ReportAppendix 3 SEA Report
209

Nationwide Master Plan Study on Storage-type Hydroelectric Power Development in Nepal
(2) Sensitivity Analysis
Ten promising projects selected in “7.4 Selection of Promising Projects” were evaluated by the evaluation method described in “8.2 (1) Evaluation Items and Methods”, and each evaluation point was weighted by the weight described in “8.2 (2) Weighting of the Third Step”, then evaluation score of each project was obtained by summing up all weighted points. The numerical values and information, etc. of evaluation items were obtained from existing study reports, topographical and geological maps, and other reference literature, and also from the results of site surveys conducted by the study team and a Nepalese consulting firm.
As the result of evaluation, though the evaluation score is different case by case, the Nalsyau Gad Project obtained the highest score in the all cases. The Dudu , the Andhi Khola, the Chera-1, the Lower Jhimruk, and the Madi Projects obtained the second to the sixth scores. The Kokhajor-1, the Naumure (W. Rapti), the Sun Koshi No.3, and the Lower Badigad Projects were the seventh to the tenth places.
The difference in score between the Nalsyau Gad Project and the second-ranked project was 9 to 14 points, the difference between the sixth-ranked project and the seventh-ranked project was 2 to 5 points.
Table 8.3-39 shows the evaluation score and ranking of each project, their details are shown in Table 8.3-40. The characteristics of each subcategory of each project are shown in Figure 8.3-39 by setting the full score of each subcategory at 100 points.
Table 8.3-39 Evaluation Score and Ranking (Summary)
No. Project Name P (MW) Case-1 Case-2 Case-3 Case-4
Score Ranking Score Ranking Score Ranking Score Ranking
W-23 Nalsyau Gad 410 77 1 76 1 78 1 75 1
E-01 Dudh Koshi 300 65 2 65 2 64 3 66 2
W-02 Chera-1 148.7 65 2 64 3 66 2 63 4
C-08 Andhi Khola 180 64 4 64 3 63 6 65 3
W-06 Madi 199.8 63 5 62 5 64 3 60 5
W-05 Lower Jhimruk 142.5 63 5 62 5 64 3 60 5
E-06 Kokhajor-1 111.5 60 7 57 7 63 6 52 10
W-25 Naumure (W. Rapti) 245 56 8 56 8 56 8 56 8
E-17 Sun Koshi No.3 536 50 9 53 9 47 9 57 7
C-02 Lower Badigad 380.3 47 10 49 10 45 10 53 9
Case 1: Technical and Economic Conditions = 50%, Impact on Environment = 50% Case 2: Technical and Economic Conditions = 60%, Impact on Environment = 40% Case 3: Technical and Economic Conditions = 40%, Impact on Environment = 60% Case 4: Technical and Economic Conditions = 75%, Impact on Environment = 25%
Final Report Appendix 3 SEA Report
210
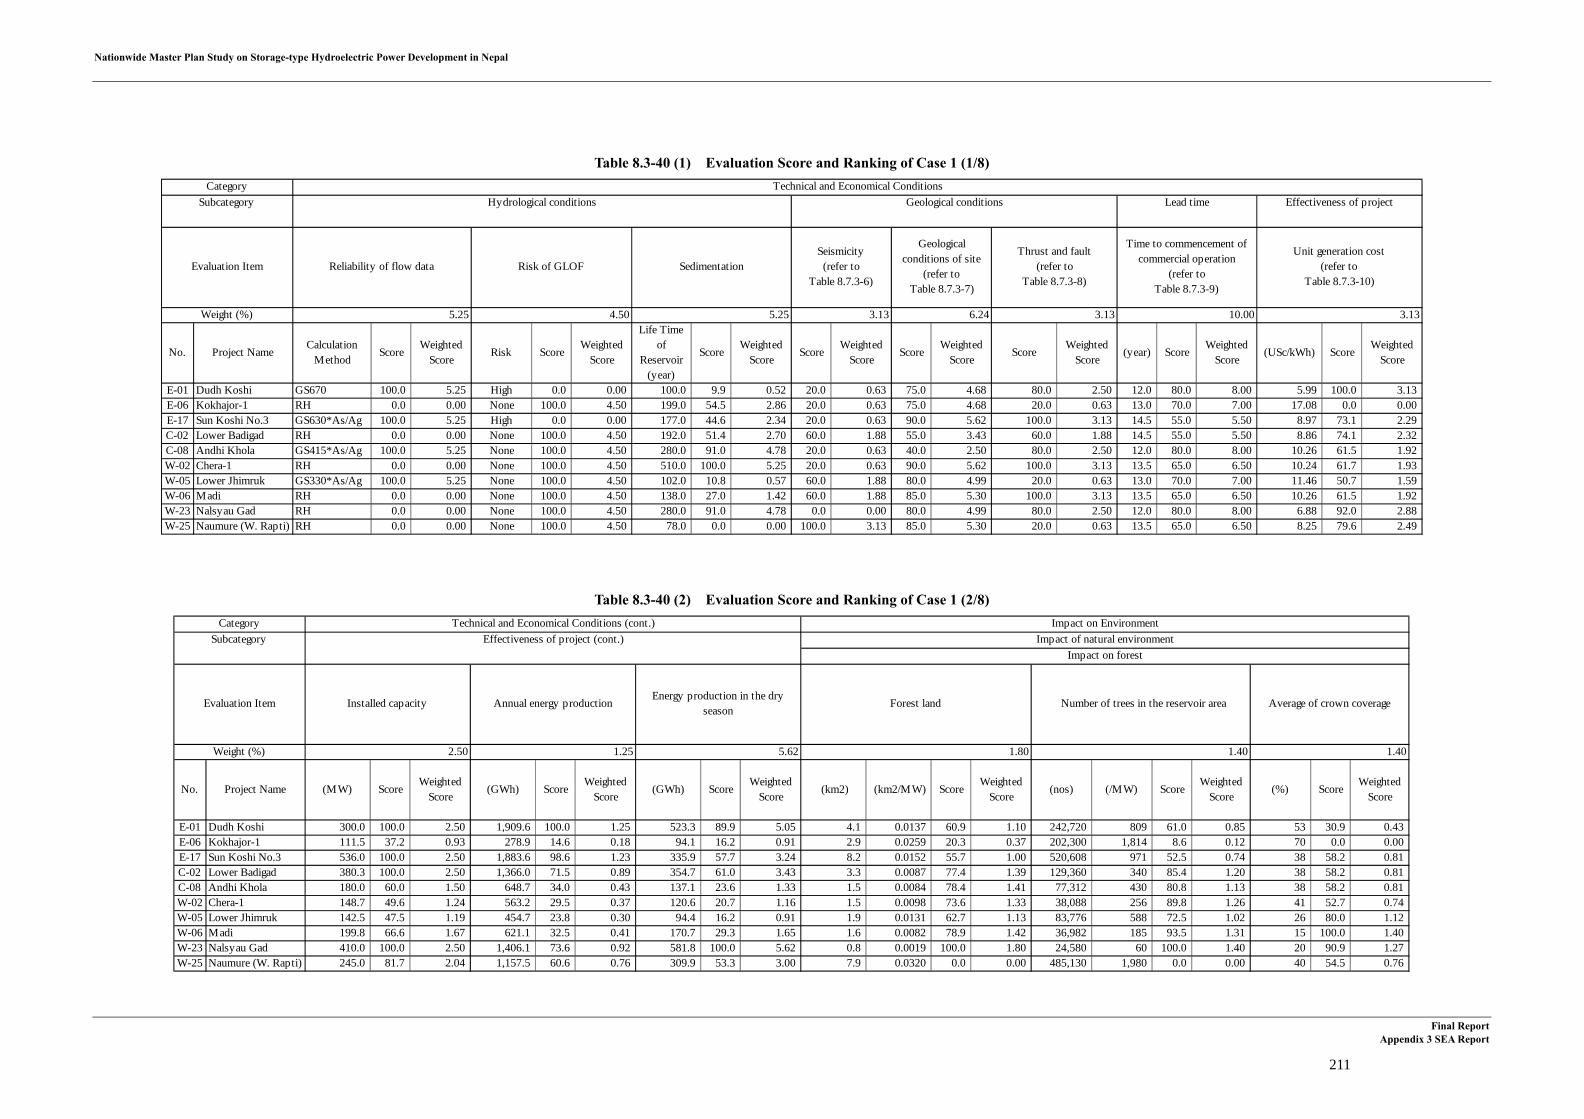
Nationwide Master Plan Study on Storage-type Hydroelectric Power Development in Nepal
Final Report Appendix 3 SEA Report
211
Table 8.3-40 (1) Evaluation Score and Ranking of Case 1 (1/8)
Table 8.3-40 (2) Evaluation Score and Ranking of Case 1 (2/8)
5.25 4.50 5.25 3.13 6.24 3.13 10.00 3.13
No. Project NameCalculation
MethodScore
WeightedScore
Risk ScoreWeighted
Score
Life Timeof
Reservoir(year)
ScoreWeighted
ScoreScore
WeightedScore
ScoreWeighted
ScoreScore
WeightedScore
(year) ScoreWeighted
Score(USc/kWh) Score
WeightedScore
E-01 Dudh Koshi GS670 100.0 5.25 High 0.0 0.00 100.0 9.9 0.52 20.0 0.63 75.0 4.68 80.0 2.50 12.0 80.0 8.00 5.99 100.0 3.13E-06 Kokhajor-1 RH 0.0 0.00 None 100.0 4.50 199.0 54.5 2.86 20.0 0.63 75.0 4.68 20.0 0.63 13.0 70.0 7.00 17.08 0.0 0.00E-17 Sun Koshi No.3 GS630*As/Ag 100.0 5.25 High 0.0 0.00 177.0 44.6 2.34 20.0 0.63 90.0 5.62 100.0 3.13 14.5 55.0 5.50 8.97 73.1 2.29C-02 Lower Badigad RH 0.0 0.00 None 100.0 4.50 192.0 51.4 2.70 60.0 1.88 55.0 3.43 60.0 1.88 14.5 55.0 5.50 8.86 74.1 2.32C-08 Andhi Khola GS415*As/Ag 100.0 5.25 None 100.0 4.50 280.0 91.0 4.78 20.0 0.63 40.0 2.50 80.0 2.50 12.0 80.0 8.00 10.26 61.5 1.92W-02 Chera-1 RH 0.0 0.00 None 100.0 4.50 510.0 100.0 5.25 20.0 0.63 90.0 5.62 100.0 3.13 13.5 65.0 6.50 10.24 61.7 1.93W-05 Lower Jhimruk GS330*As/Ag 100.0 5.25 None 100.0 4.50 102.0 10.8 0.57 60.0 1.88 80.0 4.99 20.0 0.63 13.0 70.0 7.00 11.46 50.7 1.59W-06 Madi RH 0.0 0.00 None 100.0 4.50 138.0 27.0 1.42 60.0 1.88 85.0 5.30 100.0 3.13 13.5 65.0 6.50 10.26 61.5 1.92W-23 Nalsyau Gad RH 0.0 0.00 None 100.0 4.50 280.0 91.0 4.78 0.0 0.00 80.0 4.99 80.0 2.50 12.0 80.0 8.00 6.88 92.0 2.88W-25 Naumure (W. Rapti) RH 0.0 0.00 None 100.0 4.50 78.0 0.0 0.00 100.0 3.13 85.0 5.30 20.0 0.63 13.5 65.0 6.50 8.25 79.6 2.49
CategorySubcategory Hydrological conditions Geological conditions Lead time
Evaluation Item Reliability of flow data Risk of GLOF SedimentationSeismicity(refer to
Table 8.7.3-6)
Geologicalconditions of site
(refer toTable 8.7.3-7)
Thrust and fault(refer to
Table 8.7.3-8)
Time to commencement ofcommercial operation
(refer toTable 8.7.3-9)
Unit generation cost(refer to
Table 8.7.3-10)
Weight (%)
Technical and Economical ConditionsEffectiveness of project
2.50 1.25 5.62 1.80 1.40 1.40
No. Project Name (MW) ScoreWeighted
Score(GWh) Score
WeightedScore
(GWh) ScoreWeighted
Score (km2) (km2/MW) Score
WeightedScore
(nos) (/MW) ScoreWeighted
Score(%) Score
WeightedScore
E-01 Dudh Koshi 300.0 100.0 2.50 1,909.6 100.0 1.25 523.3 89.9 5.05 4.1 0.0137 60.9 1.10 242,720 809 61.0 0.85 53 30.9 0.43E-06 Kokhajor-1 111.5 37.2 0.93 278.9 14.6 0.18 94.1 16.2 0.91 2.9 0.0259 20.3 0.37 202,300 1,814 8.6 0.12 70 0.0 0.00E-17 Sun Koshi No.3 536.0 100.0 2.50 1,883.6 98.6 1.23 335.9 57.7 3.24 8.2 0.0152 55.7 1.00 520,608 971 52.5 0.74 38 58.2 0.81C-02 Lower Badigad 380.3 100.0 2.50 1,366.0 71.5 0.89 354.7 61.0 3.43 3.3 0.0087 77.4 1.39 129,360 340 85.4 1.20 38 58.2 0.81C-08 Andhi Khola 180.0 60.0 1.50 648.7 34.0 0.43 137.1 23.6 1.33 1.5 0.0084 78.4 1.41 77,312 430 80.8 1.13 38 58.2 0.81W-02 Chera-1 148.7 49.6 1.24 563.2 29.5 0.37 120.6 20.7 1.16 1.5 0.0098 73.6 1.33 38,088 256 89.8 1.26 41 52.7 0.74W-05 Lower Jhimruk 142.5 47.5 1.19 454.7 23.8 0.30 94.4 16.2 0.91 1.9 0.0131 62.7 1.13 83,776 588 72.5 1.02 26 80.0 1.12W-06 Madi 199.8 66.6 1.67 621.1 32.5 0.41 170.7 29.3 1.65 1.6 0.0082 78.9 1.42 36,982 185 93.5 1.31 15 100.0 1.40W-23 Nalsyau Gad 410.0 100.0 2.50 1,406.1 73.6 0.92 581.8 100.0 5.62 0.8 0.0019 100.0 1.80 24,580 60 100.0 1.40 20 90.9 1.27W-25 Naumure (W. Rapti) 245.0 81.7 2.04 1,157.5 60.6 0.76 309.9 53.3 3.00 7.9 0.0320 0.0 0.00 485,130 1,980 0.0 0.00 40 54.5 0.76
Impact on forest
Average of crown coverageInstalled capacity Annual energy productionEnergy production in the dry
seasonForest land Number of trees in the reservoir areaEvaluation Item
Weight (%)
Category Technical and Economical Conditions (cont.) Impact on EnvironmentSubcategory Effectiveness of project (cont.) Impact of natural environment

Nationwide Master Plan Study on Storage-type Hydroelectric Power Development in Nepal
Final Report Appendix 3 SEA Report
213
Table 8.3-40 (3) Evaluation Score and Ranking of Case 1 (3/8)
Table 8.3-40 (4) Evaluation Score and Ranking of Case 1 (4/8)
1.60 1.60 0.60 0.40 0.40 0.80 0.60 0.60
No. Project Name ScoreWeighted
ScoreScore
WeightedScore
ScoreWeighted
ScoreScore
WeightedScore
ScoreWeighted
ScoreScore
WeightedScore
ScoreWeighted
ScoreScore
WeightedScore
E-01 Dudh Koshi 67 10.9 0.18 3 60.0 0.96 24 0.0 0.00 51 0.0 0.00 17 0.0 0.00 9 0.0 0.00 3 25.0 0.15 5 0.0 0.00E-06 Kokhajor-1 10 100.0 1.60 3 60.0 0.96 13 84.6 0.51 21 78.9 0.32 8 81.8 0.33 5 100.0 0.80 2 50.0 0.30 1 80.0 0.48E-17 Sun Koshi No.3 46 43.8 0.70 5 20.0 0.32 11 100.0 0.60 50 2.6 0.01 9 72.7 0.29 6 75.0 0.60 4 0.0 0.00 3 40.0 0.24C-02 Lower Badigad 45 45.3 0.73 5 20.0 0.32 21 23.1 0.14 30 55.3 0.22 9 72.7 0.29 9 0.0 0.00 3 25.0 0.15 0 100.0 0.60C-08 Andhi Khola 41 51.6 0.83 5 20.0 0.32 12 92.3 0.55 16 92.1 0.37 6 100.0 0.40 7 50.0 0.40 1 75.0 0.45 2 60.0 0.36W-02 Chera-1 35 60.9 0.98 3 60.0 0.96 15 69.2 0.42 28 60.5 0.24 13 36.4 0.15 7 50.0 0.40 2 50.0 0.30 4 20.0 0.12W-05 Lower Jhimruk 55 29.7 0.48 4 40.0 0.64 23 7.7 0.05 49 5.3 0.02 17 0.0 0.00 8 25.0 0.20 3 25.0 0.15 4 20.0 0.12W-06 Madi 74 0.0 0.00 6 0.0 0.00 18 46.2 0.28 21 78.9 0.32 9 72.7 0.29 7 50.0 0.40 1 75.0 0.45 1 80.0 0.48W-23 Nalsyau Gad 59 23.4 0.38 1 100.0 1.60 11 100.0 0.60 13 100.0 0.40 8 81.8 0.33 6 75.0 0.60 0 100.0 0.60 1 80.0 0.48W-25 Naumure (W. Rapti) 55 29.7 0.48 4 40.0 0.64 24 0.0 0.00 49 5.3 0.02 17 0.0 0.00 9 0.0 0.00 3 25.0 0.15 4 20.0 0.12
Impact on flora Impact on terrestrial fauna
Number of plant species reportedNumber of plant species of
conservation significanceNumber of mammal species
reportedNumber of bird species reported
Number of herpetofauna speciesreported
Number of conservationmammalian species reported
(reservoir)
Number of conservation birdspecies reported (reservoir)
Number of conservationherpetofauna species reported
(reservoir)Evaluation Item
Weight (%)
Category Impact on Environment (cont.)Subcategory Impact of natural environment (cont.)
1.80 1.80 0.80 1.60 1.60 1.20
No. Project Name ScoreWeighted
ScoreScore
WeightedScore
(km) ScoreWeighted
ScoreScore
WeightedScore
ScoreWeighted
Score(km) Score
WeightedScore
E-01 Dudh Koshi 24 0.0 0.00 3 50.0 0.90 60 0.0 0.00 2 50.0 0.80 3 100.0 1.60 43 89.6 1.08E-06 Kokhajor-1 7 94.4 1.70 2 100.0 1.80 21 65.5 0.52 1 100.0 1.60 3 100.0 1.60 62 64.9 0.78E-17 Sun Koshi No.3 21 16.7 0.30 3 50.0 0.90 1 100.0 0.80 2 50.0 0.80 3 100.0 1.60 35 100.0 1.20C-02 Lower Badigad 12 66.7 1.20 4 0.0 0.00 4 94.1 0.75 3 0.0 0.00 5 33.3 0.53 49 81.8 0.98C-08 Andhi Khola 6 100.0 1.80 2 100.0 1.80 60 0.0 0.00 3 0.0 0.00 5 33.3 0.53 49 81.8 0.98W-02 Chera-1 11 72.2 1.30 2 100.0 1.80 7 89.1 0.71 3 0.0 0.00 6 0.0 0.00 66 59.7 0.72W-05 Lower Jhimruk 11 72.2 1.30 2 100.0 1.80 8 87.4 0.70 2 50.0 0.80 4 66.7 1.07 75 48.1 0.58W-06 Madi 8 88.9 1.60 3 50.0 0.90 10 84.0 0.67 2 50.0 0.80 4 66.7 1.07 62 64.9 0.78W-23 Nalsyau Gad 8 88.9 1.60 2 100.0 1.80 11 82.4 0.66 3 0.0 0.00 6 0.0 0.00 112 0.0 0.00W-25 Naumure (W. Rapti) 16 44.4 0.80 2 100.0 1.80 1 100.0 0.80 2 50.0 0.80 4 66.7 1.07 79 42.9 0.51
Impact of transmission lineImpact on aquatic fauna Impact on protected area
Length of transmission lineNumber of fish species reportedNumber of fish species ofconservation significance
Length of recession areaEvaluation Item
Weight (%)
Number of protected areas in thedownstream
Number of protected species inthe downstream
Category Impact on Environment (cont.)Subcategory Impact of natural environment (cont.)

Nationwide Master Plan Study on Storage-type Hydroelectric Power Development in Nepal
Final Report Appendix 3 SEA Report
215
Table 8.3-40 (5) Evaluation Score and Ranking of Case 1 (5/8)
Table 8.3-40 (6) Evaluation Score and Ranking of Case 1 (6/8)
3.00 1.20 0.90 2.40 2.70 3.00
No. Project Name (/MW) ScoreWeighted
Score(/MW) Score
WeightedScore
(/MW) ScoreWeighted
ScoreScore
WeightedScore
(facilities) ScoreWeighted
Score (km2) (km2/MW) Score
WeightedScore
E-01 Dudh Koshi 63 0.21 100.0 3.00 0 0.0000 100.0 1.20 0 0.0000 100.0 0.90 3 40.0 0.96 1 98.3 2.65 3.3 0.0110 74.0 2.22E-06 Kokhajor-1 92 0.83 84.7 2.54 6 0.0538 0.0 0.00 0 0.0000 100.0 0.90 2 60.0 1.44 2 96.6 2.61 1.7 0.0154 50.5 1.51E-17 Sun Koshi No.3 1,599 2.98 30.9 0.93 19 0.0354 34.1 0.41 2 0.0037 88.8 0.80 4 20.0 0.48 20 65.5 1.77 9.4 0.0175 39.4 1.18C-02 Lower Badigad 1,606 4.22 0.0 0.00 18 0.0473 12.0 0.14 11 0.0289 13.2 0.12 5 0.0 0.00 58 0.0 0.00 5.9 0.0155 50.1 1.50C-08 Andhi Khola 542 3.01 30.2 0.91 9 0.0500 7.1 0.09 6 0.0333 0.0 0.00 2 60.0 1.44 23 60.3 1.63 1.7 0.0092 83.7 2.51W-02 Chera-1 566 3.81 10.4 0.31 3 0.0202 62.5 0.75 0 0.0000 100.0 0.90 1 80.0 1.92 7 87.9 2.37 1.1 0.0073 93.8 2.81W-05 Lower Jhimruk 229 1.61 65.2 1.96 4 0.0281 47.8 0.57 3 0.0211 36.8 0.33 3 40.0 0.96 3 94.8 2.56 2.0 0.0143 56.4 1.69W-06 Madi 336 1.68 63.3 1.90 2 0.0100 81.4 0.98 0 0.0000 100.0 0.90 1 80.0 1.92 16 72.4 1.96 1.9 0.0096 81.4 2.44W-23 Nalsyau Gad 263 0.64 89.2 2.68 2 0.0049 90.9 1.09 0 0.0000 100.0 0.90 0 100.0 2.40 0 100.0 2.70 2.5 0.0061 100.0 3.00W-25 Naumure (W. Rapti) 456 1.86 58.9 1.77 5 0.0204 62.1 0.74 0 0.0000 100.0 0.90 2 60.0 1.44 25 56.9 1.54 6.1 0.0249 0.0 0.00
Impact on household, etc. Impact on ethnic minority Impact on agriculture
Number of estimated households Number of schools Number of industriesNumber of ethnic minority
groupsEvaluation Item
Weight (%)
Impact on irrigation Impact on agricultural land
Category Impact on Environment (cont.)Subcategory Impact on social environment
0.90 0.60 0.30 0.90 0.90 0.90
No. Project Name ScoreWeighted
ScoreScore
WeightedScore
(kg/day) ScoreWeighted
Score(Rs/day) Score
WeightedScore
(Rs/year) ScoreWeighted
Score(km) Score
WeightedScore
E-01 Dudh Koshi 154 78.4 0.71 7 0.0 0.00 70.0 50.0 0.15 17,500 58.3 0.53 1,820,000 50.9 0.46 60 0.0 0.00E-06 Kokhajor-1 0 100.0 0.90 0 100.0 0.60 0.0 100.0 0.30 0 100.0 0.90 0 100.0 0.90 21 65.5 0.59E-17 Sun Koshi No.3 712 0.0 0.00 7 0.0 0.00 140.0 0.0 0.00 42,000 0.0 0.00 3,710,000 0.0 0.00 1 100.0 0.90C-02 Lower Badigad 217 69.5 0.63 7 0.0 0.00 101.5 27.5 0.08 25,375 39.6 0.36 1,062,885 71.4 0.64 4 94.1 0.85C-08 Andhi Khola 156 78.1 0.70 3 57.1 0.34 25.5 81.8 0.25 7,650 81.8 0.74 550,000 85.2 0.77 60 0.0 0.00W-02 Chera-1 25 96.5 0.87 4 42.9 0.26 37.5 73.2 0.22 7,500 82.1 0.74 375,000 89.9 0.81 7 89.1 0.80W-05 Lower Jhimruk 254 64.3 0.58 3 57.1 0.34 40.5 71.1 0.21 7,290 82.6 0.74 225,000 93.9 0.85 8 87.4 0.79W-06 Madi 100 86.0 0.77 3 57.1 0.34 12.0 91.4 0.27 3,600 91.4 0.82 273,000 92.6 0.83 10 84.0 0.76W-23 Nalsyau Gad 115 83.8 0.75 3 57.1 0.34 10.5 92.5 0.28 2,100 95.0 0.86 1,140,000 69.3 0.62 11 82.4 0.74W-25 Naumure (W. Rapti) 43 94.0 0.85 2 71.4 0.43 15.0 89.3 0.27 4,125 90.2 0.81 387,000 89.6 0.81 1 100.0 0.90
Impact on fishery
Sales amount of fish Total income Length of recession area
Subcategory
Evaluation Item
Weight (%)
Number of fishermen (reservoir) Number of fish market Availability of fish in the market
Impact on social environment (cont.)Category Impact on Environment (cont.)
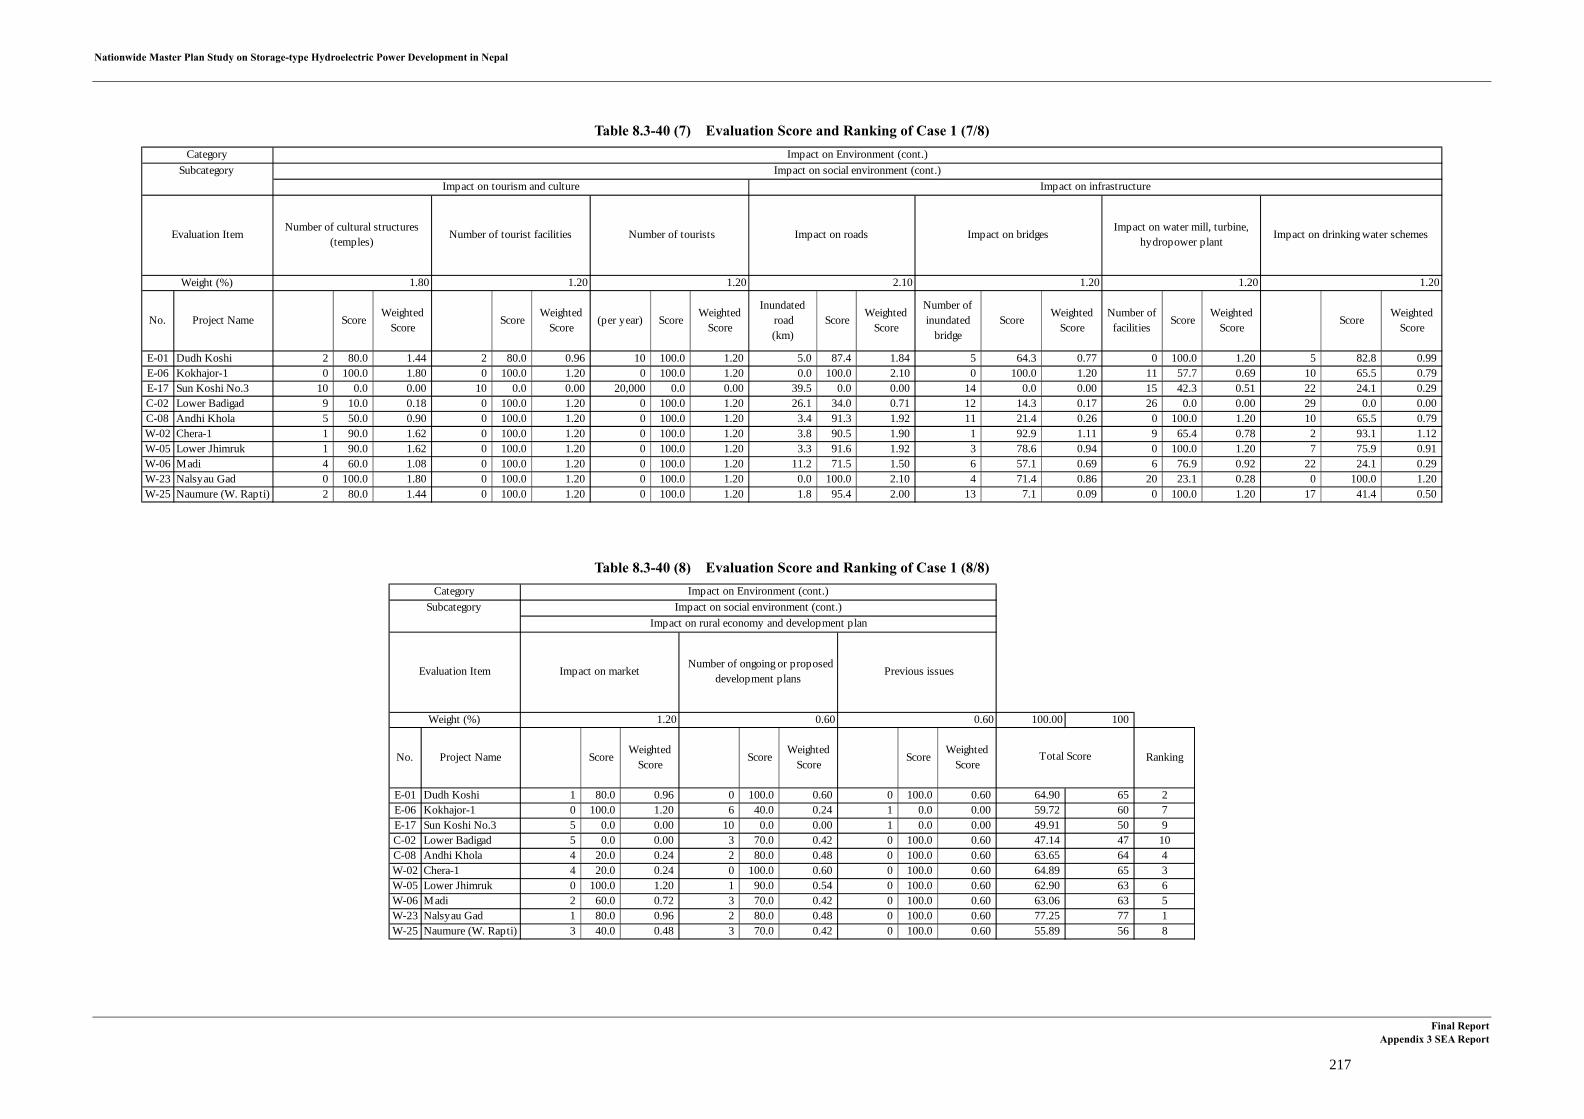
Nationwide Master Plan Study on Storage-type Hydroelectric Power Development in Nepal
Final Report Appendix 3 SEA Report
217
Table 8.3-40 (7) Evaluation Score and Ranking of Case 1 (7/8)
Table 8.3-40 (8) Evaluation Score and Ranking of Case 1 (8/8)
1.80 1.20 1.20 2.10 1.20 1.20 1.20
No. Project Name ScoreWeighted
ScoreScore
WeightedScore
(per year) ScoreWeighted
Score
Inundated road(km)
ScoreWeighted
Score
Number ofinundated
bridgeScore
WeightedScore
Number offacilities
ScoreWeighted
ScoreScore
WeightedScore
E-01 Dudh Koshi 2 80.0 1.44 2 80.0 0.96 10 100.0 1.20 5.0 87.4 1.84 5 64.3 0.77 0 100.0 1.20 5 82.8 0.99E-06 Kokhajor-1 0 100.0 1.80 0 100.0 1.20 0 100.0 1.20 0.0 100.0 2.10 0 100.0 1.20 11 57.7 0.69 10 65.5 0.79E-17 Sun Koshi No.3 10 0.0 0.00 10 0.0 0.00 20,000 0.0 0.00 39.5 0.0 0.00 14 0.0 0.00 15 42.3 0.51 22 24.1 0.29C-02 Lower Badigad 9 10.0 0.18 0 100.0 1.20 0 100.0 1.20 26.1 34.0 0.71 12 14.3 0.17 26 0.0 0.00 29 0.0 0.00C-08 Andhi Khola 5 50.0 0.90 0 100.0 1.20 0 100.0 1.20 3.4 91.3 1.92 11 21.4 0.26 0 100.0 1.20 10 65.5 0.79W-02 Chera-1 1 90.0 1.62 0 100.0 1.20 0 100.0 1.20 3.8 90.5 1.90 1 92.9 1.11 9 65.4 0.78 2 93.1 1.12W-05 Lower Jhimruk 1 90.0 1.62 0 100.0 1.20 0 100.0 1.20 3.3 91.6 1.92 3 78.6 0.94 0 100.0 1.20 7 75.9 0.91W-06 Madi 4 60.0 1.08 0 100.0 1.20 0 100.0 1.20 11.2 71.5 1.50 6 57.1 0.69 6 76.9 0.92 22 24.1 0.29W-23 Nalsyau Gad 0 100.0 1.80 0 100.0 1.20 0 100.0 1.20 0.0 100.0 2.10 4 71.4 0.86 20 23.1 0.28 0 100.0 1.20W-25 Naumure (W. Rapti) 2 80.0 1.44 0 100.0 1.20 0 100.0 1.20 1.8 95.4 2.00 13 7.1 0.09 0 100.0 1.20 17 41.4 0.50
Impact on infrastructureImpact on tourism and culture
Weight (%)
Category
Impact on roads Impact on bridgesImpact on water mill, turbine,
hydropower plantImpact on drinking water schemes
Number of cultural structures(temples)
Number of tourist facilities Number of touristsEvaluation Item
Impact on Environment (cont.)Subcategory Impact on social environment (cont.)
1.20 0.60 0.60 100.00 100
No. Project Name ScoreWeighted
ScoreScore
WeightedScore
ScoreWeighted
ScoreRanking
E-01 Dudh Koshi 1 80.0 0.96 0 100.0 0.60 0 100.0 0.60 64.90 65 2E-06 Kokhajor-1 0 100.0 1.20 6 40.0 0.24 1 0.0 0.00 59.72 60 7E-17 Sun Koshi No.3 5 0.0 0.00 10 0.0 0.00 1 0.0 0.00 49.91 50 9C-02 Lower Badigad 5 0.0 0.00 3 70.0 0.42 0 100.0 0.60 47.14 47 10C-08 Andhi Khola 4 20.0 0.24 2 80.0 0.48 0 100.0 0.60 63.65 64 4W-02 Chera-1 4 20.0 0.24 0 100.0 0.60 0 100.0 0.60 64.89 65 3W-05 Lower Jhimruk 0 100.0 1.20 1 90.0 0.54 0 100.0 0.60 62.90 63 6W-06 Madi 2 60.0 0.72 3 70.0 0.42 0 100.0 0.60 63.06 63 5W-23 Nalsyau Gad 1 80.0 0.96 2 80.0 0.48 0 100.0 0.60 77.25 77 1W-25 Naumure (W. Rapti) 3 40.0 0.48 3 70.0 0.42 0 100.0 0.60 55.89 56 8
Impact on rural economy and development plan
Previous issues
Total Score
Impact on market Number of ongoing or proposed
development plansEvaluation Item
Weight (%)
Category Impact on Environment (cont.)Subcategory Impact on social environment (cont.)

Nationwide Master Plan Study on Storage-type Hydroelectric Power Development in Nepal
Final Report Appendix 3 SEA Report
219
Table 8.3-41 (1) Evaluation Score and Ranking of Case 2 (1/8)
Table 8.3-41 (2) Evaluation Score and Ranking of Case 2 (2/8)
6.30 5.40 6.30 3.75 7.50 3.75 12.00 3.75
No. Project NameCalculation
MethodScore
WeightedScore
Risk ScoreWeighted
Score
Life Timeof
Reservoir(year)
ScoreWeighted
ScoreScore
WeightedScore
ScoreWeighted
ScoreScore
WeightedScore
(year) ScoreWeighted
Score(USc/kWh) Score
WeightedScore
E-01 Dudh Koshi GS670 100.0 6.30 High 0.0 0.00 100.0 9.9 0.62 20.0 0.75 75.0 5.63 80.0 3.00 12.0 80.0 9.60 5.99 100.0 3.75E-06 Kokhajor-1 RH 0.0 0.00 None 100.0 5.40 199.0 54.5 3.43 20.0 0.75 75.0 5.63 20.0 0.75 13.0 70.0 8.40 17.08 0.0 0.00E-17 Sun Koshi No.3 GS630*As/Ag 100.0 6.30 High 0.0 0.00 177.0 44.6 2.81 20.0 0.75 90.0 6.75 100.0 3.75 14.5 55.0 6.60 8.97 73.1 2.74C-02 Lower Badigad RH 0.0 0.00 None 100.0 5.40 192.0 51.4 3.24 60.0 2.25 55.0 4.13 60.0 2.25 14.5 55.0 6.60 8.86 74.1 2.78C-08 Andhi Khola GS415*As/Ag 100.0 6.30 None 100.0 5.40 280.0 91.0 5.73 20.0 0.75 40.0 3.00 80.0 3.00 12.0 80.0 9.60 10.26 61.5 2.31W-02 Chera-1 RH 0.0 0.00 None 100.0 5.40 510.0 100.0 6.30 20.0 0.75 90.0 6.75 100.0 3.75 13.5 65.0 7.80 10.24 61.7 2.31W-05 Lower Jhimruk GS330*As/Ag 100.0 6.30 None 100.0 5.40 102.0 10.8 0.68 60.0 2.25 80.0 6.00 20.0 0.75 13.0 70.0 8.40 11.46 50.7 1.90W-06 Madi RH 0.0 0.00 None 100.0 5.40 138.0 27.0 1.70 60.0 2.25 85.0 6.38 100.0 3.75 13.5 65.0 7.80 10.26 61.5 2.31W-23 Nalsyau Gad RH 0.0 0.00 None 100.0 5.40 280.0 91.0 5.73 0.0 0.00 80.0 6.00 80.0 3.00 12.0 80.0 9.60 6.88 92.0 3.45W-25 Naumure (W. Rapti) RH 0.0 0.00 None 100.0 5.40 78.0 0.0 0.00 100.0 3.75 85.0 6.38 20.0 0.75 13.5 65.0 7.80 8.25 79.6 2.99
Effectiveness of projectTechnical and Economical Conditions
Weight (%)
Unit generation cost(refer to
Table 8.7.3-10)
CategorySubcategory Hydrological conditions Geological conditions Lead time
Evaluation Item Reliability of flow data Risk of GLOF SedimentationSeismicity(refer to
Table 8.7.3-6)
Geologicalconditions of site
(refer toTable 8.7.3-7)
Thrust and fault(refer to
Table 8.7.3-8)
Time to commencement ofcommercial operation
(refer toTable 8.7.3-9)
3.00 1.50 6.75 1.44 1.12 1.12
No. Project Name (MW) ScoreWeighted
Score(GWh) Score
WeightedScore
(GWh) ScoreWeighted
Score (km2) (km2/MW) Score
WeightedScore
(nos) (/MW) ScoreWeighted
Score(%) Score
WeightedScore
E-01 Dudh Koshi 300.0 100.0 3.00 1,909.6 100.0 1.50 523.3 89.9 6.07 4.1 0.0137 60.9 0.88 242,720 809 61.0 0.68 53 30.9 0.35E-06 Kokhajor-1 111.5 37.2 1.12 278.9 14.6 0.22 94.1 16.2 1.09 2.9 0.0259 20.3 0.29 202,300 1,814 8.6 0.10 70 0.0 0.00E-17 Sun Koshi No.3 536.0 100.0 3.00 1,883.6 98.6 1.48 335.9 57.7 3.89 8.2 0.0152 55.7 0.80 520,608 971 52.5 0.59 38 58.2 0.65C-02 Lower Badigad 380.3 100.0 3.00 1,366.0 71.5 1.07 354.7 61.0 4.12 3.3 0.0087 77.4 1.11 129,360 340 85.4 0.96 38 58.2 0.65C-08 Andhi Khola 180.0 60.0 1.80 648.7 34.0 0.51 137.1 23.6 1.59 1.5 0.0084 78.4 1.13 77,312 430 80.8 0.90 38 58.2 0.65W-02 Chera-1 148.7 49.6 1.49 563.2 29.5 0.44 120.6 20.7 1.40 1.5 0.0098 73.6 1.06 38,088 256 89.8 1.01 41 52.7 0.59W-05 Lower Jhimruk 142.5 47.5 1.43 454.7 23.8 0.36 94.4 16.2 1.09 1.9 0.0131 62.7 0.90 83,776 588 72.5 0.81 26 80.0 0.90W-06 Madi 199.8 66.6 2.00 621.1 32.5 0.49 170.7 29.3 1.98 1.6 0.0082 78.9 1.14 36,982 185 93.5 1.05 15 100.0 1.12W-23 Nalsyau Gad 410.0 100.0 3.00 1,406.1 73.6 1.10 581.8 100.0 6.75 0.8 0.0019 100.0 1.44 24,580 60 100.0 1.12 20 90.9 1.02W-25 Naumure (W. Rapti) 245.0 81.7 2.45 1,157.5 60.6 0.91 309.9 53.3 3.60 7.9 0.0320 0.0 0.00 485,130 1,980 0.0 0.00 40 54.5 0.61
Subcategory Effectiveness of project (cont.) Impact of natural environmentCategory Technical and Economical Conditions (cont.) Impact on Environment
Evaluation Item
Weight (%)
Installed capacity Annual energy productionEnergy production in the dry
seasonForest land Number of trees in the reservoir area Average of crown coverage
Impact on forest

Nationwide Master Plan Study on Storage-type Hydroelectric Power Development in Nepal
Final Report Appendix 3 SEA Report
221
Table 8.3-41 (3) Evaluation Score and Ranking of Case 2 (3/8)
Table 8.3-41 (4) Evaluation Score and Ranking of Case 2 (4/8)
1.28 1.28 0.48 0.32 0.32 0.64 0.48 0.48
No. Project Name ScoreWeighted
ScoreScore
WeightedScore
ScoreWeighted
ScoreScore
WeightedScore
ScoreWeighted
ScoreScore
WeightedScore
ScoreWeighted
ScoreScore
WeightedScore
E-01 Dudh Koshi 67 10.9 0.14 3 60.0 0.77 24 0.0 0.00 51 0.0 0.00 17 0.0 0.00 9 0.0 0.00 3 25.0 0.12 5 0.0 0.00E-06 Kokhajor-1 10 100.0 1.28 3 60.0 0.77 13 84.6 0.41 21 78.9 0.25 8 81.8 0.26 5 100.0 0.64 2 50.0 0.24 1 80.0 0.38E-17 Sun Koshi No.3 46 43.8 0.56 5 20.0 0.26 11 100.0 0.48 50 2.6 0.01 9 72.7 0.23 6 75.0 0.48 4 0.0 0.00 3 40.0 0.19C-02 Lower Badigad 45 45.3 0.58 5 20.0 0.26 21 23.1 0.11 30 55.3 0.18 9 72.7 0.23 9 0.0 0.00 3 25.0 0.12 0 100.0 0.48C-08 Andhi Khola 41 51.6 0.66 5 20.0 0.26 12 92.3 0.44 16 92.1 0.29 6 100.0 0.32 7 50.0 0.32 1 75.0 0.36 2 60.0 0.29W-02 Chera-1 35 60.9 0.78 3 60.0 0.77 15 69.2 0.33 28 60.5 0.19 13 36.4 0.12 7 50.0 0.32 2 50.0 0.24 4 20.0 0.10W-05 Lower Jhimruk 55 29.7 0.38 4 40.0 0.51 23 7.7 0.04 49 5.3 0.02 17 0.0 0.00 8 25.0 0.16 3 25.0 0.12 4 20.0 0.10W-06 Madi 74 0.0 0.00 6 0.0 0.00 18 46.2 0.22 21 78.9 0.25 9 72.7 0.23 7 50.0 0.32 1 75.0 0.36 1 80.0 0.38W-23 Nalsyau Gad 59 23.4 0.30 1 100.0 1.28 11 100.0 0.48 13 100.0 0.32 8 81.8 0.26 6 75.0 0.48 0 100.0 0.48 1 80.0 0.38W-25 Naumure (W. Rapti) 55 29.7 0.38 4 40.0 0.51 24 0.0 0.00 49 5.3 0.02 17 0.0 0.00 9 0.0 0.00 3 25.0 0.12 4 20.0 0.10
Subcategory Impact of natural environment (cont.)Category Impact on Environment (cont.)
Evaluation Item
Weight (%)
Number of conservationmammalian species reported
(reservoir)
Number of conservation birdspecies reported (reservoir)
Number of conservationherpetofauna species reported
(reservoir)
Impact on flora Impact on terrestrial fauna
Number of plant species reportedNumber of plant species of
conservation significanceNumber of mammal species
reportedNumber of bird species reported
Number of herpetofauna speciesreported
1.44 1.44 0.64 1.28 1.28 0.96
No. Project Name ScoreWeighted
ScoreScore
WeightedScore
(km) ScoreWeighted
ScoreScore
WeightedScore
ScoreWeighted
Score(km) Score
WeightedScore
E-01 Dudh Koshi 24 0.0 0.00 3 50.0 0.72 60 0.0 0.00 2 50.0 0.64 3 100.0 1.28 43 89.6 0.86E-06 Kokhajor-1 7 94.4 1.36 2 100.0 1.44 21 65.5 0.42 1 100.0 1.28 3 100.0 1.28 62 64.9 0.62E-17 Sun Koshi No.3 21 16.7 0.24 3 50.0 0.72 1 100.0 0.64 2 50.0 0.64 3 100.0 1.28 35 100.0 0.96C-02 Lower Badigad 12 66.7 0.96 4 0.0 0.00 4 94.1 0.60 3 0.0 0.00 5 33.3 0.43 49 81.8 0.79C-08 Andhi Khola 6 100.0 1.44 2 100.0 1.44 60 0.0 0.00 3 0.0 0.00 5 33.3 0.43 49 81.8 0.79W-02 Chera-1 11 72.2 1.04 2 100.0 1.44 7 89.1 0.57 3 0.0 0.00 6 0.0 0.00 66 59.7 0.57W-05 Lower Jhimruk 11 72.2 1.04 2 100.0 1.44 8 87.4 0.56 2 50.0 0.64 4 66.7 0.85 75 48.1 0.46W-06 Madi 8 88.9 1.28 3 50.0 0.72 10 84.0 0.54 2 50.0 0.64 4 66.7 0.85 62 64.9 0.62W-23 Nalsyau Gad 8 88.9 1.28 2 100.0 1.44 11 82.4 0.53 3 0.0 0.00 6 0.0 0.00 112 0.0 0.00W-25 Naumure (W. Rapti) 16 44.4 0.64 2 100.0 1.44 1 100.0 0.64 2 50.0 0.64 4 66.7 0.85 79 42.9 0.41
Category Impact on Environment (cont.)Subcategory Impact of natural environment (cont.)
Weight (%)
Number of protected areas in thedownstream
Number of protected species inthe downstream
Number of fish species reportedNumber of fish species ofconservation significance
Length of recession areaEvaluation Item Length of transmission line
Impact on aquatic fauna Impact on protected area Impact of transmission line

Nationwide Master Plan Study on Storage-type Hydroelectric Power Development in Nepal
Final Report Appendix 3 SEA Report
223
Table 8.3-41 (5) Evaluation Score and Ranking of Case 2 (5/8)
Table 8.3-41 (6) Evaluation Score and Ranking of Case 2 (6/8)
2.40 0.96 0.72 1.92 2.16 2.40
No. Project Name (/MW) ScoreWeighted
Score(/MW) Score
WeightedScore
(/MW) ScoreWeighted
ScoreScore
WeightedScore
(facilities) ScoreWeighted
Score (km2) (km2/MW) Score
WeightedScore
E-01 Dudh Koshi 63 0.21 100.0 2.40 0 0.0000 100.0 0.96 0 0.0000 100.0 0.72 3 40.0 0.77 1 98.3 2.12 3.3 0.0110 74.0 1.78E-06 Kokhajor-1 92 0.83 84.7 2.03 6 0.0538 0.0 0.00 0 0.0000 100.0 0.72 2 60.0 1.15 2 96.6 2.09 1.7 0.0154 50.5 1.21E-17 Sun Koshi No.3 1,599 2.98 30.9 0.74 19 0.0354 34.1 0.33 2 0.0037 88.8 0.64 4 20.0 0.38 20 65.5 1.42 9.4 0.0175 39.4 0.95C-02 Lower Badigad 1,606 4.22 0.0 0.00 18 0.0473 12.0 0.12 11 0.0289 13.2 0.10 5 0.0 0.00 58 0.0 0.00 5.9 0.0155 50.1 1.20C-08 Andhi Khola 542 3.01 30.2 0.72 9 0.0500 7.1 0.07 6 0.0333 0.0 0.00 2 60.0 1.15 23 60.3 1.30 1.7 0.0092 83.7 2.01W-02 Chera-1 566 3.81 10.4 0.25 3 0.0202 62.5 0.60 0 0.0000 100.0 0.72 1 80.0 1.54 7 87.9 1.90 1.1 0.0073 93.8 2.25W-05 Lower Jhimruk 229 1.61 65.2 1.56 4 0.0281 47.8 0.46 3 0.0211 36.8 0.27 3 40.0 0.77 3 94.8 2.05 2.0 0.0143 56.4 1.35W-06 Madi 336 1.68 63.3 1.52 2 0.0100 81.4 0.78 0 0.0000 100.0 0.72 1 80.0 1.54 16 72.4 1.56 1.9 0.0096 81.4 1.95W-23 Nalsyau Gad 263 0.64 89.2 2.14 2 0.0049 90.9 0.87 0 0.0000 100.0 0.72 0 100.0 1.92 0 100.0 2.16 2.5 0.0061 100.0 2.40W-25 Naumure (W. Rapti) 456 1.86 58.9 1.41 5 0.0204 62.1 0.60 0 0.0000 100.0 0.72 2 60.0 1.15 25 56.9 1.23 6.1 0.0249 0.0 0.00
Category Impact on Environment (cont.)Subcategory Impact on social environment
Evaluation Item
Weight (%)
Impact on irrigation Impact on agricultural landNumber of ethnic minority
groupsNumber of industriesNumber of estimated households Number of schools
Impact on household, etc. Impact on ethnic minority Impact on agriculture
0.72 0.48 0.24 0.72 0.72 0.72
No. Project Name ScoreWeighted
ScoreScore
WeightedScore
(kg/day) ScoreWeighted
Score(Rs/day) Score
WeightedScore
(Rs/year) ScoreWeighted
Score(km) Score
WeightedScore
E-01 Dudh Koshi 154 78.4 0.56 7 0.0 0.00 70.0 50.0 0.12 17,500 58.3 0.42 1,820,000 50.9 0.37 60 0.0 0.00E-06 Kokhajor-1 0 100.0 0.72 0 100.0 0.48 0.0 100.0 0.24 0 100.0 0.72 0 100.0 0.72 21 65.5 0.47E-17 Sun Koshi No.3 712 0.0 0.00 7 0.0 0.00 140.0 0.0 0.00 42,000 0.0 0.00 3,710,000 0.0 0.00 1 100.0 0.72C-02 Lower Badigad 217 69.5 0.50 7 0.0 0.00 101.5 27.5 0.07 25,375 39.6 0.29 1,062,885 71.4 0.51 4 94.1 0.68C-08 Andhi Khola 156 78.1 0.56 3 57.1 0.27 25.5 81.8 0.20 7,650 81.8 0.59 550,000 85.2 0.61 60 0.0 0.00W-02 Chera-1 25 96.5 0.69 4 42.9 0.21 37.5 73.2 0.18 7,500 82.1 0.59 375,000 89.9 0.65 7 89.1 0.64W-05 Lower Jhimruk 254 64.3 0.46 3 57.1 0.27 40.5 71.1 0.17 7,290 82.6 0.60 225,000 93.9 0.68 8 87.4 0.63W-06 Madi 100 86.0 0.62 3 57.1 0.27 12.0 91.4 0.22 3,600 91.4 0.66 273,000 92.6 0.67 10 84.0 0.61W-23 Nalsyau Gad 115 83.8 0.60 3 57.1 0.27 10.5 92.5 0.22 2,100 95.0 0.68 1,140,000 69.3 0.50 11 82.4 0.59W-25 Naumure (W. Rapti) 43 94.0 0.68 2 71.4 0.34 15.0 89.3 0.21 4,125 90.2 0.65 387,000 89.6 0.64 1 100.0 0.72
Impact on social environment (cont.)Category Impact on Environment (cont.)
Subcategory
Evaluation Item
Weight (%)
Number of fishermen (reservoir) Number of fish market Availability of fish in the market Sales amount of fish Total income Length of recession area
Impact on fishery

Nationwide Master Plan Study on Storage-type Hydroelectric Power Development in Nepal
Final Report Appendix 3 SEA Report
225
Table 8.3-41 (7) Evaluation Score and Ranking of Case 2 (7/8)
Table 8.3-41 (8) Evaluation Score and Ranking of Case 2 (8/8)
1.44 0.96 0.96 1.68 0.96 0.96 0.96
No. Project Name ScoreWeighted
ScoreScore
WeightedScore
(per year) ScoreWeighted
Score
Inundated road(km)
ScoreWeighted
Score
Number ofinundated
bridgeScore
WeightedScore
Number offacilities
ScoreWeighted
ScoreScore
WeightedScore
E-01 Dudh Koshi 2 80.0 1.15 2 80.0 0.77 10 100.0 0.96 5.0 87.4 1.47 5 64.3 0.62 0 100.0 0.96 5 82.8 0.79E-06 Kokhajor-1 0 100.0 1.44 0 100.0 0.96 0 100.0 0.96 0.0 100.0 1.68 0 100.0 0.96 11 57.7 0.55 10 65.5 0.63E-17 Sun Koshi No.3 10 0.0 0.00 10 0.0 0.00 20,000 0.0 0.00 39.5 0.0 0.00 14 0.0 0.00 15 42.3 0.41 22 24.1 0.23C-02 Lower Badigad 9 10.0 0.14 0 100.0 0.96 0 100.0 0.96 26.1 34.0 0.57 12 14.3 0.14 26 0.0 0.00 29 0.0 0.00C-08 Andhi Khola 5 50.0 0.72 0 100.0 0.96 0 100.0 0.96 3.4 91.3 1.53 11 21.4 0.21 0 100.0 0.96 10 65.5 0.63W-02 Chera-1 1 90.0 1.30 0 100.0 0.96 0 100.0 0.96 3.8 90.5 1.52 1 92.9 0.89 9 65.4 0.63 2 93.1 0.89W-05 Lower Jhimruk 1 90.0 1.30 0 100.0 0.96 0 100.0 0.96 3.3 91.6 1.54 3 78.6 0.75 0 100.0 0.96 7 75.9 0.73W-06 Madi 4 60.0 0.86 0 100.0 0.96 0 100.0 0.96 11.2 71.5 1.20 6 57.1 0.55 6 76.9 0.74 22 24.1 0.23W-23 Nalsyau Gad 0 100.0 1.44 0 100.0 0.96 0 100.0 0.96 0.0 100.0 1.68 4 71.4 0.69 20 23.1 0.22 0 100.0 0.96W-25 Naumure (W. Rapti) 2 80.0 1.15 0 100.0 0.96 0 100.0 0.96 1.8 95.4 1.60 13 7.1 0.07 0 100.0 0.96 17 41.4 0.40
Impact on Environment (cont.)Subcategory Impact on social environment (cont.)
Category
Impact on roads Impact on bridgesImpact on water mill, turbine,
hydropower plantImpact on drinking water schemes
Number of cultural structures(temples)
Number of tourist facilities Number of touristsEvaluation Item
Weight (%)
Impact on infrastructureImpact on tourism and culture
0.96 0.48 0.48 100.00 100
No. Project Name ScoreWeighted
ScoreScore
WeightedScore
ScoreWeighted
ScoreRanking
E-01 Dudh Koshi 1 80.0 0.77 0 100.0 0.48 0 100.0 0.48 65.33 65 2E-06 Kokhajor-1 0 100.0 0.96 6 40.0 0.19 1 0.0 0.00 56.69 57 7E-17 Sun Koshi No.3 5 0.0 0.00 10 0.0 0.00 1 0.0 0.00 52.62 53 9C-02 Lower Badigad 5 0.0 0.00 3 70.0 0.34 0 100.0 0.48 49.36 49 10C-08 Andhi Khola 4 20.0 0.19 2 80.0 0.38 0 100.0 0.48 64.21 64 3W-02 Chera-1 4 20.0 0.19 0 100.0 0.48 0 100.0 0.48 64.04 64 4W-05 Lower Jhimruk 0 100.0 0.96 1 90.0 0.43 0 100.0 0.48 61.83 62 5W-06 Madi 2 60.0 0.58 3 70.0 0.34 0 100.0 0.48 61.80 62 6W-23 Nalsyau Gad 1 80.0 0.77 2 80.0 0.38 0 100.0 0.48 76.45 76 1W-25 Naumure (W. Rapti) 3 40.0 0.38 3 70.0 0.34 0 100.0 0.48 56.04 56 8
Category Impact on Environment (cont.)Subcategory Impact on social environment (cont.)
Evaluation Item
Weight (%)
Total Score
Impact on market Number of ongoing or proposed
development plans Previous issues
Impact on rural economy and development plan
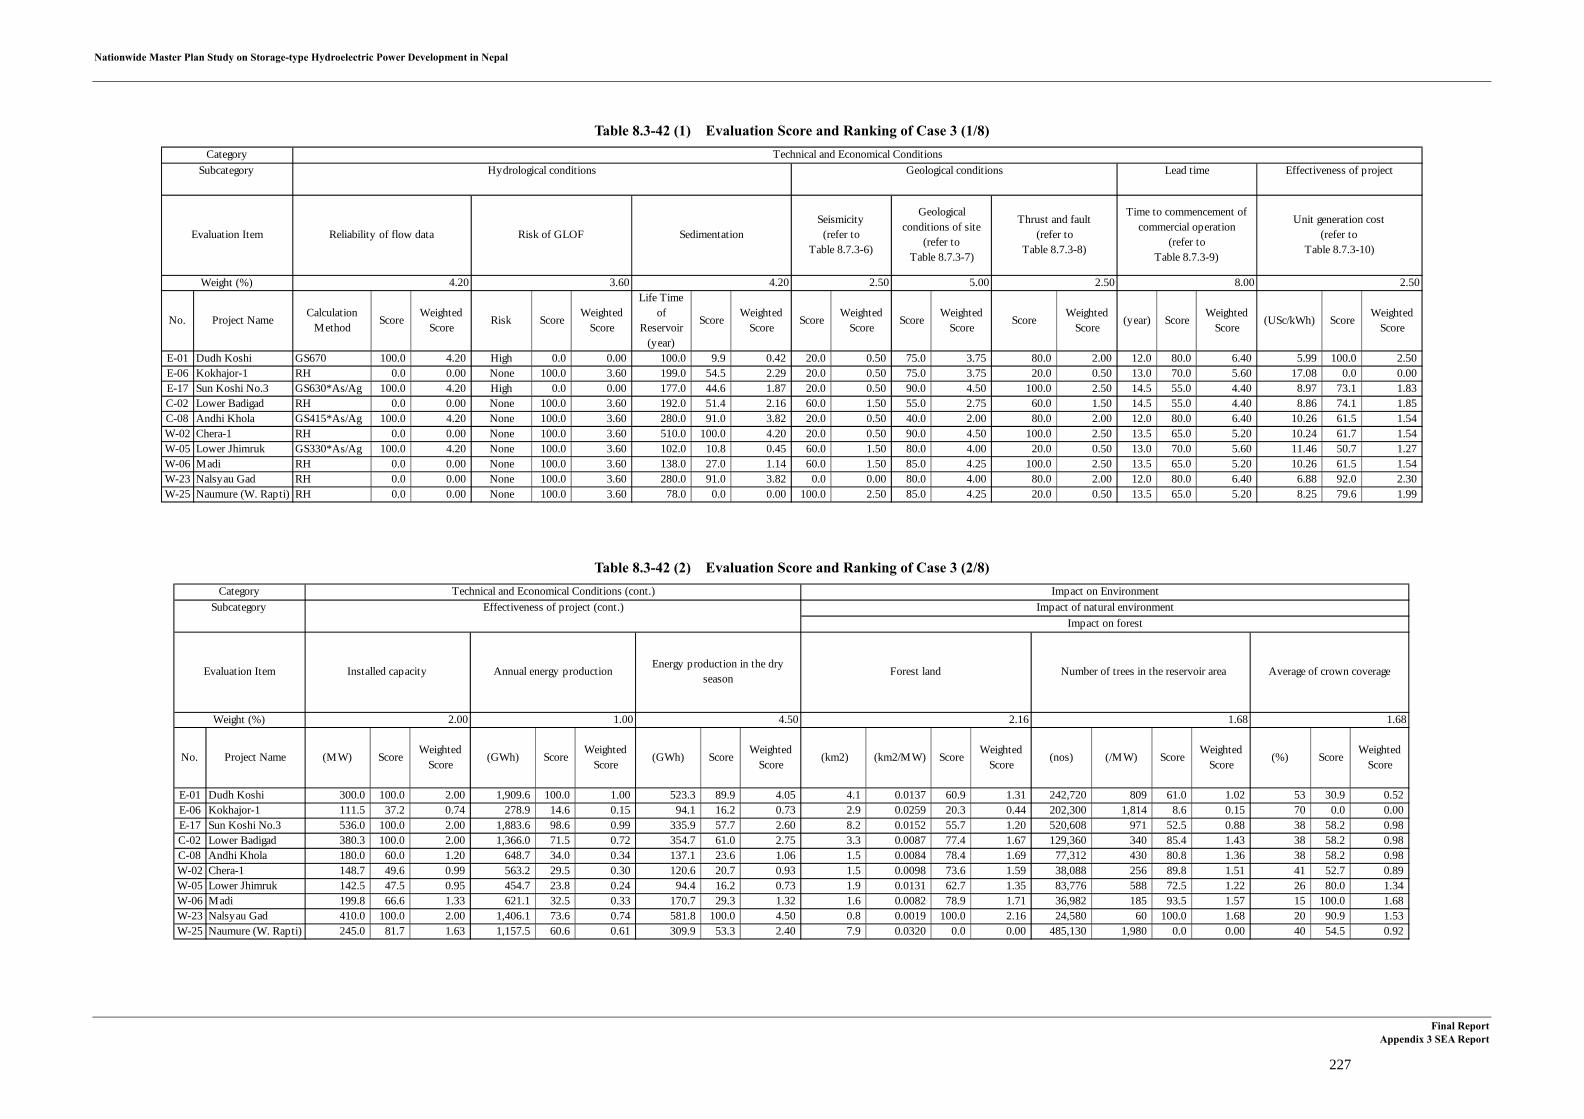
Nationwide Master Plan Study on Storage-type Hydroelectric Power Development in Nepal
Final Report Appendix 3 SEA Report
227
Table 8.3-42 (1) Evaluation Score and Ranking of Case 3 (1/8)
Table 8.3-42 (2) Evaluation Score and Ranking of Case 3 (2/8)
4.20 3.60 4.20 2.50 5.00 2.50 8.00 2.50
No. Project NameCalculation
MethodScore
WeightedScore
Risk ScoreWeighted
Score
Life Timeof
Reservoir(year)
ScoreWeighted
ScoreScore
WeightedScore
ScoreWeighted
ScoreScore
WeightedScore
(year) ScoreWeighted
Score(USc/kWh) Score
WeightedScore
E-01 Dudh Koshi GS670 100.0 4.20 High 0.0 0.00 100.0 9.9 0.42 20.0 0.50 75.0 3.75 80.0 2.00 12.0 80.0 6.40 5.99 100.0 2.50E-06 Kokhajor-1 RH 0.0 0.00 None 100.0 3.60 199.0 54.5 2.29 20.0 0.50 75.0 3.75 20.0 0.50 13.0 70.0 5.60 17.08 0.0 0.00E-17 Sun Koshi No.3 GS630*As/Ag 100.0 4.20 High 0.0 0.00 177.0 44.6 1.87 20.0 0.50 90.0 4.50 100.0 2.50 14.5 55.0 4.40 8.97 73.1 1.83C-02 Lower Badigad RH 0.0 0.00 None 100.0 3.60 192.0 51.4 2.16 60.0 1.50 55.0 2.75 60.0 1.50 14.5 55.0 4.40 8.86 74.1 1.85C-08 Andhi Khola GS415*As/Ag 100.0 4.20 None 100.0 3.60 280.0 91.0 3.82 20.0 0.50 40.0 2.00 80.0 2.00 12.0 80.0 6.40 10.26 61.5 1.54W-02 Chera-1 RH 0.0 0.00 None 100.0 3.60 510.0 100.0 4.20 20.0 0.50 90.0 4.50 100.0 2.50 13.5 65.0 5.20 10.24 61.7 1.54W-05 Lower Jhimruk GS330*As/Ag 100.0 4.20 None 100.0 3.60 102.0 10.8 0.45 60.0 1.50 80.0 4.00 20.0 0.50 13.0 70.0 5.60 11.46 50.7 1.27W-06 Madi RH 0.0 0.00 None 100.0 3.60 138.0 27.0 1.14 60.0 1.50 85.0 4.25 100.0 2.50 13.5 65.0 5.20 10.26 61.5 1.54W-23 Nalsyau Gad RH 0.0 0.00 None 100.0 3.60 280.0 91.0 3.82 0.0 0.00 80.0 4.00 80.0 2.00 12.0 80.0 6.40 6.88 92.0 2.30W-25 Naumure (W. Rapti) RH 0.0 0.00 None 100.0 3.60 78.0 0.0 0.00 100.0 2.50 85.0 4.25 20.0 0.50 13.5 65.0 5.20 8.25 79.6 1.99
Effectiveness of projectTechnical and Economical Conditions
Weight (%)
Unit generation cost(refer to
Table 8.7.3-10)
CategorySubcategory Hydrological conditions Geological conditions Lead time
Evaluation Item Reliability of flow data Risk of GLOF SedimentationSeismicity(refer to
Table 8.7.3-6)
Geologicalconditions of site
(refer toTable 8.7.3-7)
Thrust and fault(refer to
Table 8.7.3-8)
Time to commencement ofcommercial operation
(refer toTable 8.7.3-9)
2.00 1.00 4.50 2.16 1.68 1.68
No. Project Name (MW) ScoreWeighted
Score(GWh) Score
WeightedScore
(GWh) ScoreWeighted
Score (km2) (km2/MW) Score
WeightedScore
(nos) (/MW) ScoreWeighted
Score(%) Score
WeightedScore
E-01 Dudh Koshi 300.0 100.0 2.00 1,909.6 100.0 1.00 523.3 89.9 4.05 4.1 0.0137 60.9 1.31 242,720 809 61.0 1.02 53 30.9 0.52E-06 Kokhajor-1 111.5 37.2 0.74 278.9 14.6 0.15 94.1 16.2 0.73 2.9 0.0259 20.3 0.44 202,300 1,814 8.6 0.15 70 0.0 0.00E-17 Sun Koshi No.3 536.0 100.0 2.00 1,883.6 98.6 0.99 335.9 57.7 2.60 8.2 0.0152 55.7 1.20 520,608 971 52.5 0.88 38 58.2 0.98C-02 Lower Badigad 380.3 100.0 2.00 1,366.0 71.5 0.72 354.7 61.0 2.75 3.3 0.0087 77.4 1.67 129,360 340 85.4 1.43 38 58.2 0.98C-08 Andhi Khola 180.0 60.0 1.20 648.7 34.0 0.34 137.1 23.6 1.06 1.5 0.0084 78.4 1.69 77,312 430 80.8 1.36 38 58.2 0.98W-02 Chera-1 148.7 49.6 0.99 563.2 29.5 0.30 120.6 20.7 0.93 1.5 0.0098 73.6 1.59 38,088 256 89.8 1.51 41 52.7 0.89W-05 Lower Jhimruk 142.5 47.5 0.95 454.7 23.8 0.24 94.4 16.2 0.73 1.9 0.0131 62.7 1.35 83,776 588 72.5 1.22 26 80.0 1.34W-06 Madi 199.8 66.6 1.33 621.1 32.5 0.33 170.7 29.3 1.32 1.6 0.0082 78.9 1.71 36,982 185 93.5 1.57 15 100.0 1.68W-23 Nalsyau Gad 410.0 100.0 2.00 1,406.1 73.6 0.74 581.8 100.0 4.50 0.8 0.0019 100.0 2.16 24,580 60 100.0 1.68 20 90.9 1.53W-25 Naumure (W. Rapti) 245.0 81.7 1.63 1,157.5 60.6 0.61 309.9 53.3 2.40 7.9 0.0320 0.0 0.00 485,130 1,980 0.0 0.00 40 54.5 0.92
Subcategory Effectiveness of project (cont.) Impact of natural environmentCategory Technical and Economical Conditions (cont.) Impact on Environment
Evaluation Item
Weight (%)
Installed capacity Annual energy productionEnergy production in the dry
seasonForest land Number of trees in the reservoir area Average of crown coverage
Impact on forest

Nationwide Master Plan Study on Storage-type Hydroelectric Power Development in Nepal
Final Report Appendix 3 SEA Report
229
Table 8.3-42 (3) Evaluation Score and Ranking of Case 3 (3/8)
Table 8.3-42 (4) Evaluation Score and Ranking of Case 3 (4/8)
1.92 1.92 0.72 0.48 0.48 0.96 0.72 0.72
No. Project Name ScoreWeighted
ScoreScore
WeightedScore
ScoreWeighted
ScoreScore
WeightedScore
ScoreWeighted
ScoreScore
WeightedScore
ScoreWeighted
ScoreScore
WeightedScore
E-01 Dudh Koshi 67 10.9 0.21 3 60.0 1.15 24 0.0 0.00 51 0.0 0.00 17 0.0 0.00 9 0.0 0.00 3 25.0 0.18 5 0.0 0.00E-06 Kokhajor-1 10 100.0 1.92 3 60.0 1.15 13 84.6 0.61 21 78.9 0.38 8 81.8 0.39 5 100.0 0.96 2 50.0 0.36 1 80.0 0.58E-17 Sun Koshi No.3 46 43.8 0.84 5 20.0 0.38 11 100.0 0.72 50 2.6 0.01 9 72.7 0.35 6 75.0 0.72 4 0.0 0.00 3 40.0 0.29C-02 Lower Badigad 45 45.3 0.87 5 20.0 0.38 21 23.1 0.17 30 55.3 0.27 9 72.7 0.35 9 0.0 0.00 3 25.0 0.18 0 100.0 0.72C-08 Andhi Khola 41 51.6 0.99 5 20.0 0.38 12 92.3 0.66 16 92.1 0.44 6 100.0 0.48 7 50.0 0.48 1 75.0 0.54 2 60.0 0.43W-02 Chera-1 35 60.9 1.17 3 60.0 1.15 15 69.2 0.50 28 60.5 0.29 13 36.4 0.17 7 50.0 0.48 2 50.0 0.36 4 20.0 0.14W-05 Lower Jhimruk 55 29.7 0.57 4 40.0 0.77 23 7.7 0.06 49 5.3 0.03 17 0.0 0.00 8 25.0 0.24 3 25.0 0.18 4 20.0 0.14W-06 Madi 74 0.0 0.00 6 0.0 0.00 18 46.2 0.33 21 78.9 0.38 9 72.7 0.35 7 50.0 0.48 1 75.0 0.54 1 80.0 0.58W-23 Nalsyau Gad 59 23.4 0.45 1 100.0 1.92 11 100.0 0.72 13 100.0 0.48 8 81.8 0.39 6 75.0 0.72 0 100.0 0.72 1 80.0 0.58W-25 Naumure (W. Rapti) 55 29.7 0.57 4 40.0 0.77 24 0.0 0.00 49 5.3 0.03 17 0.0 0.00 9 0.0 0.00 3 25.0 0.18 4 20.0 0.14
Subcategory Impact of natural environment (cont.)Category Impact on Environment (cont.)
Evaluation Item
Weight (%)
Number of conservationmammalian species reported
(reservoir)
Number of conservation birdspecies reported (reservoir)
Number of conservationherpetofauna species reported
(reservoir)
Impact on flora Impact on terrestrial fauna
Number of plant species reportedNumber of plant species of
conservation significanceNumber of mammal species
reportedNumber of bird species reported
Number of herpetofauna speciesreported
2.16 2.16 0.96 1.92 1.92 1.44
No. Project Name ScoreWeighted
ScoreScore
WeightedScore
(km) ScoreWeighted
ScoreScore
WeightedScore
ScoreWeighted
Score(km) Score
WeightedScore
E-01 Dudh Koshi 24 0.0 0.00 3 50.0 1.08 60 0.0 0.00 2 50.0 0.96 3 100.0 1.92 43 89.6 1.29E-06 Kokhajor-1 7 94.4 2.04 2 100.0 2.16 21 65.5 0.63 1 100.0 1.92 3 100.0 1.92 62 64.9 0.94E-17 Sun Koshi No.3 21 16.7 0.36 3 50.0 1.08 1 100.0 0.96 2 50.0 0.96 3 100.0 1.92 35 100.0 1.44C-02 Lower Badigad 12 66.7 1.44 4 0.0 0.00 4 94.1 0.90 3 0.0 0.00 5 33.3 0.64 49 81.8 1.18C-08 Andhi Khola 6 100.0 2.16 2 100.0 2.16 60 0.0 0.00 3 0.0 0.00 5 33.3 0.64 49 81.8 1.18W-02 Chera-1 11 72.2 1.56 2 100.0 2.16 7 89.1 0.86 3 0.0 0.00 6 0.0 0.00 66 59.7 0.86W-05 Lower Jhimruk 11 72.2 1.56 2 100.0 2.16 8 87.4 0.84 2 50.0 0.96 4 66.7 1.28 75 48.1 0.69W-06 Madi 8 88.9 1.92 3 50.0 1.08 10 84.0 0.81 2 50.0 0.96 4 66.7 1.28 62 64.9 0.94W-23 Nalsyau Gad 8 88.9 1.92 2 100.0 2.16 11 82.4 0.79 3 0.0 0.00 6 0.0 0.00 112 0.0 0.00W-25 Naumure (W. Rapti) 16 44.4 0.96 2 100.0 2.16 1 100.0 0.96 2 50.0 0.96 4 66.7 1.28 79 42.9 0.62
Category Impact on Environment (cont.)Subcategory Impact of natural environment (cont.)
Weight (%)
Number of protected areas in thedownstream
Number of protected species inthe downstream
Number of fish species reportedNumber of fish species ofconservation significance
Length of recession areaEvaluation Item Length of transmission line
Impact on aquatic fauna Impact on protected area Impact of transmission line
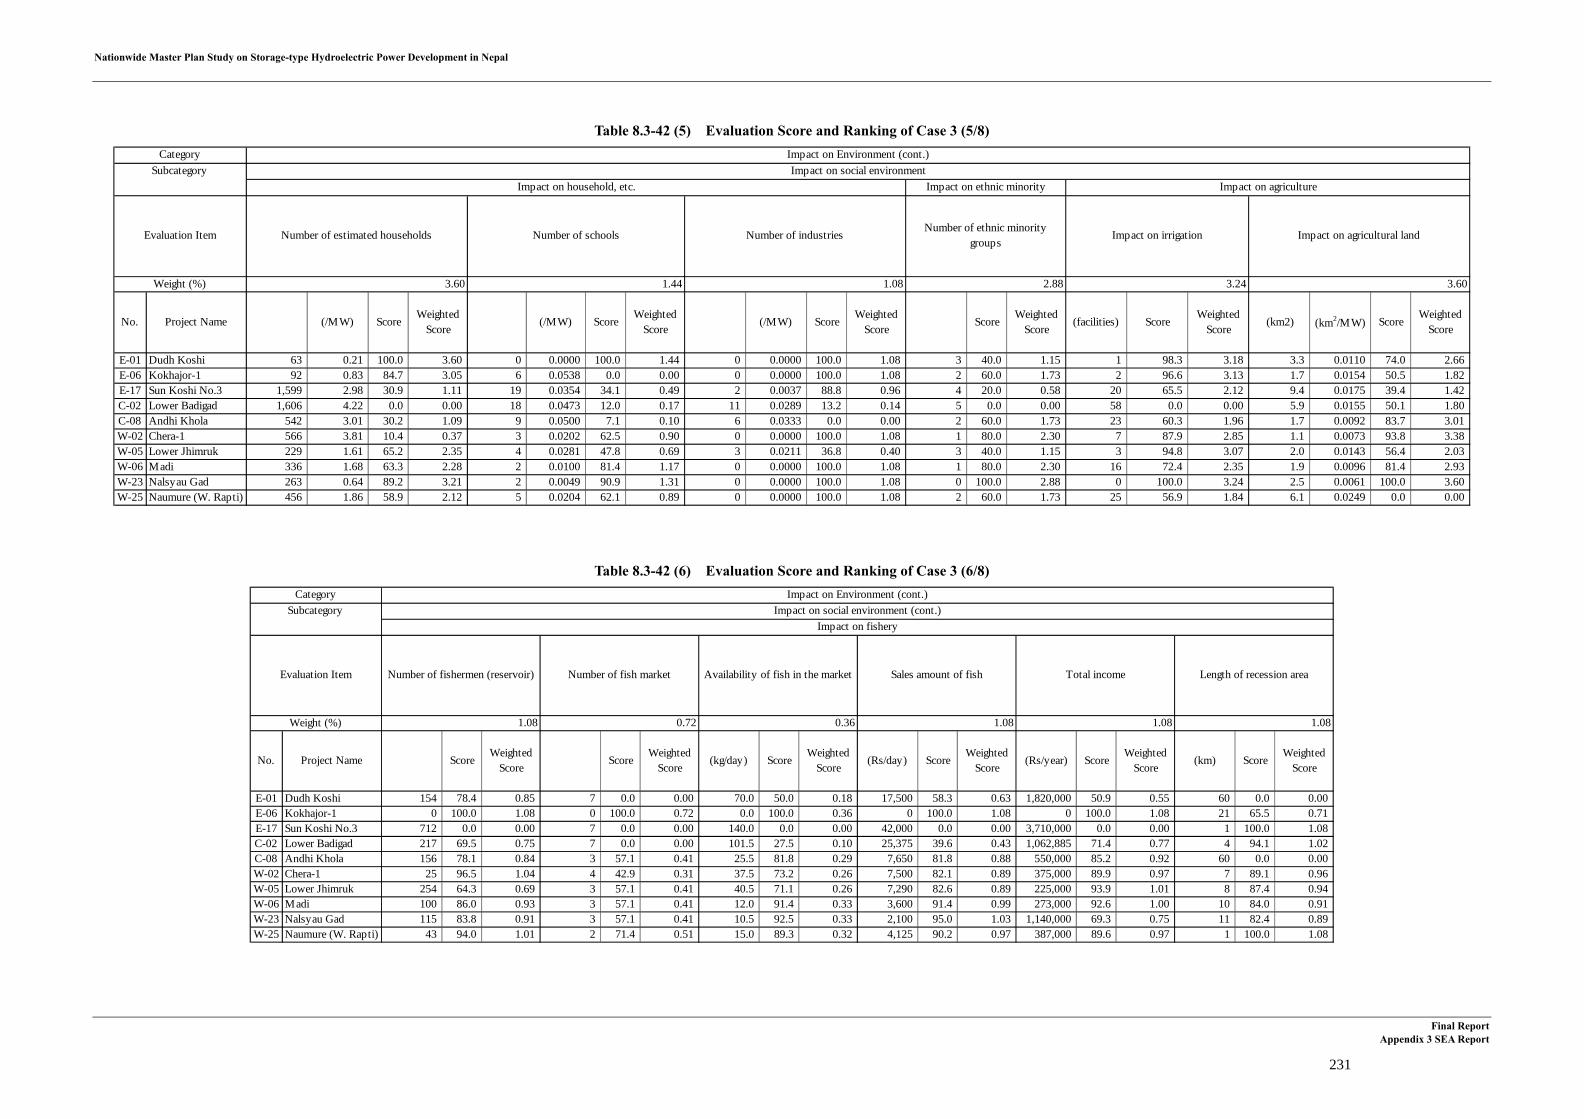
Nationwide Master Plan Study on Storage-type Hydroelectric Power Development in Nepal
Final Report Appendix 3 SEA Report
231
Table 8.3-42 (5) Evaluation Score and Ranking of Case 3 (5/8)
Table 8.3-42 (6) Evaluation Score and Ranking of Case 3 (6/8)
3.60 1.44 1.08 2.88 3.24 3.60
No. Project Name (/MW) ScoreWeighted
Score(/MW) Score
WeightedScore
(/MW) ScoreWeighted
ScoreScore
WeightedScore
(facilities) ScoreWeighted
Score (km2) (km2/MW) Score
WeightedScore
E-01 Dudh Koshi 63 0.21 100.0 3.60 0 0.0000 100.0 1.44 0 0.0000 100.0 1.08 3 40.0 1.15 1 98.3 3.18 3.3 0.0110 74.0 2.66E-06 Kokhajor-1 92 0.83 84.7 3.05 6 0.0538 0.0 0.00 0 0.0000 100.0 1.08 2 60.0 1.73 2 96.6 3.13 1.7 0.0154 50.5 1.82E-17 Sun Koshi No.3 1,599 2.98 30.9 1.11 19 0.0354 34.1 0.49 2 0.0037 88.8 0.96 4 20.0 0.58 20 65.5 2.12 9.4 0.0175 39.4 1.42C-02 Lower Badigad 1,606 4.22 0.0 0.00 18 0.0473 12.0 0.17 11 0.0289 13.2 0.14 5 0.0 0.00 58 0.0 0.00 5.9 0.0155 50.1 1.80C-08 Andhi Khola 542 3.01 30.2 1.09 9 0.0500 7.1 0.10 6 0.0333 0.0 0.00 2 60.0 1.73 23 60.3 1.96 1.7 0.0092 83.7 3.01W-02 Chera-1 566 3.81 10.4 0.37 3 0.0202 62.5 0.90 0 0.0000 100.0 1.08 1 80.0 2.30 7 87.9 2.85 1.1 0.0073 93.8 3.38W-05 Lower Jhimruk 229 1.61 65.2 2.35 4 0.0281 47.8 0.69 3 0.0211 36.8 0.40 3 40.0 1.15 3 94.8 3.07 2.0 0.0143 56.4 2.03W-06 Madi 336 1.68 63.3 2.28 2 0.0100 81.4 1.17 0 0.0000 100.0 1.08 1 80.0 2.30 16 72.4 2.35 1.9 0.0096 81.4 2.93W-23 Nalsyau Gad 263 0.64 89.2 3.21 2 0.0049 90.9 1.31 0 0.0000 100.0 1.08 0 100.0 2.88 0 100.0 3.24 2.5 0.0061 100.0 3.60W-25 Naumure (W. Rapti) 456 1.86 58.9 2.12 5 0.0204 62.1 0.89 0 0.0000 100.0 1.08 2 60.0 1.73 25 56.9 1.84 6.1 0.0249 0.0 0.00
Category Impact on Environment (cont.)Subcategory Impact on social environment
Evaluation Item
Weight (%)
Impact on irrigation Impact on agricultural landNumber of ethnic minority
groupsNumber of industriesNumber of estimated households Number of schools
Impact on household, etc. Impact on ethnic minority Impact on agriculture
1.08 0.72 0.36 1.08 1.08 1.08
No. Project Name ScoreWeighted
ScoreScore
WeightedScore
(kg/day) ScoreWeighted
Score(Rs/day) Score
WeightedScore
(Rs/year) ScoreWeighted
Score(km) Score
WeightedScore
E-01 Dudh Koshi 154 78.4 0.85 7 0.0 0.00 70.0 50.0 0.18 17,500 58.3 0.63 1,820,000 50.9 0.55 60 0.0 0.00E-06 Kokhajor-1 0 100.0 1.08 0 100.0 0.72 0.0 100.0 0.36 0 100.0 1.08 0 100.0 1.08 21 65.5 0.71E-17 Sun Koshi No.3 712 0.0 0.00 7 0.0 0.00 140.0 0.0 0.00 42,000 0.0 0.00 3,710,000 0.0 0.00 1 100.0 1.08C-02 Lower Badigad 217 69.5 0.75 7 0.0 0.00 101.5 27.5 0.10 25,375 39.6 0.43 1,062,885 71.4 0.77 4 94.1 1.02C-08 Andhi Khola 156 78.1 0.84 3 57.1 0.41 25.5 81.8 0.29 7,650 81.8 0.88 550,000 85.2 0.92 60 0.0 0.00W-02 Chera-1 25 96.5 1.04 4 42.9 0.31 37.5 73.2 0.26 7,500 82.1 0.89 375,000 89.9 0.97 7 89.1 0.96W-05 Lower Jhimruk 254 64.3 0.69 3 57.1 0.41 40.5 71.1 0.26 7,290 82.6 0.89 225,000 93.9 1.01 8 87.4 0.94W-06 Madi 100 86.0 0.93 3 57.1 0.41 12.0 91.4 0.33 3,600 91.4 0.99 273,000 92.6 1.00 10 84.0 0.91W-23 Nalsyau Gad 115 83.8 0.91 3 57.1 0.41 10.5 92.5 0.33 2,100 95.0 1.03 1,140,000 69.3 0.75 11 82.4 0.89W-25 Naumure (W. Rapti) 43 94.0 1.01 2 71.4 0.51 15.0 89.3 0.32 4,125 90.2 0.97 387,000 89.6 0.97 1 100.0 1.08
Impact on social environment (cont.)Category Impact on Environment (cont.)
Subcategory
Evaluation Item
Weight (%)
Number of fishermen (reservoir) Number of fish market Availability of fish in the market Sales amount of fish Total income Length of recession area
Impact on fishery

Nationwide Master Plan Study on Storage-type Hydroelectric Power Development in Nepal
Final Report Appendix 3 SEA Report
233
Table 8.3-42 (7) Evaluation Score and Ranking of Case 3 (7/8)
Table 8.3-42 (8) Evaluation Score and Ranking of Case 3 (8/8)
2.16 1.44 1.44 2.52 1.44 1.44 1.44
No. Project Name ScoreWeighted
ScoreScore
WeightedScore
(per year) ScoreWeighted
Score
Inundated road(km)
ScoreWeighted
Score
Number ofinundated
bridgeScore
WeightedScore
Number offacilities
ScoreWeighted
ScoreScore
WeightedScore
E-01 Dudh Koshi 2 80.0 1.73 2 80.0 1.15 10 100.0 1.44 5.0 87.4 2.20 5 64.3 0.93 0 100.0 1.44 5 82.8 1.19E-06 Kokhajor-1 0 100.0 2.16 0 100.0 1.44 0 100.0 1.44 0.0 100.0 2.52 0 100.0 1.44 11 57.7 0.83 10 65.5 0.94E-17 Sun Koshi No.3 10 0.0 0.00 10 0.0 0.00 20,000 0.0 0.00 39.5 0.0 0.00 14 0.0 0.00 15 42.3 0.61 22 24.1 0.35C-02 Lower Badigad 9 10.0 0.22 0 100.0 1.44 0 100.0 1.44 26.1 34.0 0.86 12 14.3 0.21 26 0.0 0.00 29 0.0 0.00C-08 Andhi Khola 5 50.0 1.08 0 100.0 1.44 0 100.0 1.44 3.4 91.3 2.30 11 21.4 0.31 0 100.0 1.44 10 65.5 0.94W-02 Chera-1 1 90.0 1.94 0 100.0 1.44 0 100.0 1.44 3.8 90.5 2.28 1 92.9 1.34 9 65.4 0.94 2 93.1 1.34W-05 Lower Jhimruk 1 90.0 1.94 0 100.0 1.44 0 100.0 1.44 3.3 91.6 2.31 3 78.6 1.13 0 100.0 1.44 7 75.9 1.09W-06 Madi 4 60.0 1.30 0 100.0 1.44 0 100.0 1.44 11.2 71.5 1.80 6 57.1 0.82 6 76.9 1.11 22 24.1 0.35W-23 Nalsyau Gad 0 100.0 2.16 0 100.0 1.44 0 100.0 1.44 0.0 100.0 2.52 4 71.4 1.03 20 23.1 0.33 0 100.0 1.44W-25 Naumure (W. Rapti) 2 80.0 1.73 0 100.0 1.44 0 100.0 1.44 1.8 95.4 2.40 13 7.1 0.10 0 100.0 1.44 17 41.4 0.60
Impact on Environment (cont.)Subcategory Impact on social environment (cont.)
Category
Impact on roads Impact on bridgesImpact on water mill, turbine,
hydropower plantImpact on drinking water schemes
Number of cultural structures(temples)
Number of tourist facilities Number of touristsEvaluation Item
Weight (%)
Impact on infrastructureImpact on tourism and culture
1.44 0.72 0.72 100.00 100
No. Project Name ScoreWeighted
ScoreScore
WeightedScore
ScoreWeighted
ScoreRanking
E-01 Dudh Koshi 1 80.0 1.15 0 100.0 0.72 0 100.0 0.72 64.45 64 3E-06 Kokhajor-1 0 100.0 1.44 6 40.0 0.29 1 0.0 0.00 62.75 63 7E-17 Sun Koshi No.3 5 0.0 0.00 10 0.0 0.00 1 0.0 0.00 47.20 47 9C-02 Lower Badigad 5 0.0 0.00 3 70.0 0.50 0 100.0 0.72 44.98 45 10C-08 Andhi Khola 4 20.0 0.29 2 80.0 0.58 0 100.0 0.72 63.00 63 6W-02 Chera-1 4 20.0 0.29 0 100.0 0.72 0 100.0 0.72 65.71 66 2W-05 Lower Jhimruk 0 100.0 1.44 1 90.0 0.65 0 100.0 0.72 63.92 64 5W-06 Madi 2 60.0 0.86 3 70.0 0.50 0 100.0 0.72 64.34 64 4W-23 Nalsyau Gad 1 80.0 1.15 2 80.0 0.58 0 100.0 0.72 78.03 78 1W-25 Naumure (W. Rapti) 3 40.0 0.58 3 70.0 0.50 0 100.0 0.72 55.70 56 8
Category Impact on Environment (cont.)Subcategory Impact on social environment (cont.)
Evaluation Item
Weight (%)
Total Score
Impact on market Number of ongoing or proposed
development plans Previous issues
Impact on rural economy and development plan
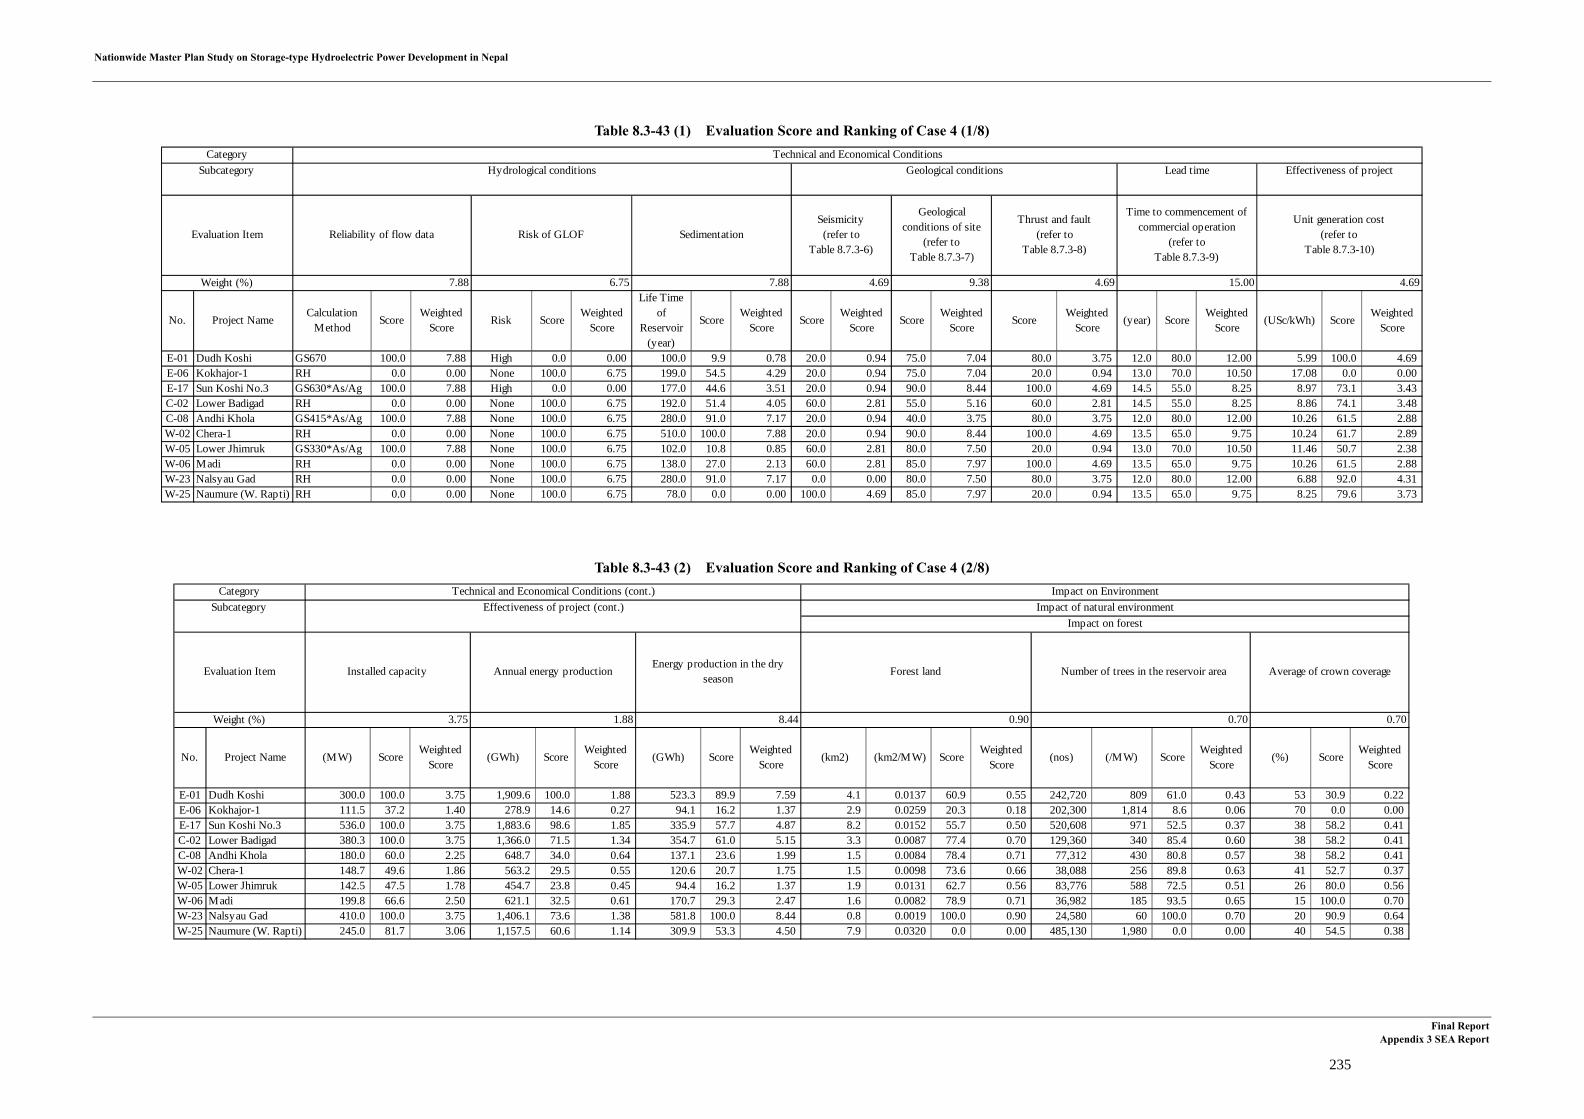
Nationwide Master Plan Study on Storage-type Hydroelectric Power Development in Nepal
Final Report Appendix 3 SEA Report
235
Table 8.3-43 (1) Evaluation Score and Ranking of Case 4 (1/8)
Table 8.3-43 (2) Evaluation Score and Ranking of Case 4 (2/8)
7.88 6.75 7.88 4.69 9.38 4.69 15.00 4.69
No. Project NameCalculation
MethodScore
WeightedScore
Risk ScoreWeighted
Score
Life Timeof
Reservoir(year)
ScoreWeighted
ScoreScore
WeightedScore
ScoreWeighted
ScoreScore
WeightedScore
(year) ScoreWeighted
Score(USc/kWh) Score
WeightedScore
E-01 Dudh Koshi GS670 100.0 7.88 High 0.0 0.00 100.0 9.9 0.78 20.0 0.94 75.0 7.04 80.0 3.75 12.0 80.0 12.00 5.99 100.0 4.69E-06 Kokhajor-1 RH 0.0 0.00 None 100.0 6.75 199.0 54.5 4.29 20.0 0.94 75.0 7.04 20.0 0.94 13.0 70.0 10.50 17.08 0.0 0.00E-17 Sun Koshi No.3 GS630*As/Ag 100.0 7.88 High 0.0 0.00 177.0 44.6 3.51 20.0 0.94 90.0 8.44 100.0 4.69 14.5 55.0 8.25 8.97 73.1 3.43C-02 Lower Badigad RH 0.0 0.00 None 100.0 6.75 192.0 51.4 4.05 60.0 2.81 55.0 5.16 60.0 2.81 14.5 55.0 8.25 8.86 74.1 3.48C-08 Andhi Khola GS415*As/Ag 100.0 7.88 None 100.0 6.75 280.0 91.0 7.17 20.0 0.94 40.0 3.75 80.0 3.75 12.0 80.0 12.00 10.26 61.5 2.88W-02 Chera-1 RH 0.0 0.00 None 100.0 6.75 510.0 100.0 7.88 20.0 0.94 90.0 8.44 100.0 4.69 13.5 65.0 9.75 10.24 61.7 2.89W-05 Lower Jhimruk GS330*As/Ag 100.0 7.88 None 100.0 6.75 102.0 10.8 0.85 60.0 2.81 80.0 7.50 20.0 0.94 13.0 70.0 10.50 11.46 50.7 2.38W-06 Madi RH 0.0 0.00 None 100.0 6.75 138.0 27.0 2.13 60.0 2.81 85.0 7.97 100.0 4.69 13.5 65.0 9.75 10.26 61.5 2.88W-23 Nalsyau Gad RH 0.0 0.00 None 100.0 6.75 280.0 91.0 7.17 0.0 0.00 80.0 7.50 80.0 3.75 12.0 80.0 12.00 6.88 92.0 4.31W-25 Naumure (W. Rapti) RH 0.0 0.00 None 100.0 6.75 78.0 0.0 0.00 100.0 4.69 85.0 7.97 20.0 0.94 13.5 65.0 9.75 8.25 79.6 3.73
Effectiveness of projectTechnical and Economical Conditions
Weight (%)
Unit generation cost(refer to
Table 8.7.3-10)
CategorySubcategory Hydrological conditions Geological conditions Lead time
Evaluation Item Reliability of flow data Risk of GLOF SedimentationSeismicity(refer to
Table 8.7.3-6)
Geologicalconditions of site
(refer toTable 8.7.3-7)
Thrust and fault(refer to
Table 8.7.3-8)
Time to commencement ofcommercial operation
(refer toTable 8.7.3-9)
3.75 1.88 8.44 0.90 0.70 0.70
No. Project Name (MW) ScoreWeighted
Score(GWh) Score
WeightedScore
(GWh) ScoreWeighted
Score (km2) (km2/MW) Score
WeightedScore
(nos) (/MW) ScoreWeighted
Score(%) Score
WeightedScore
E-01 Dudh Koshi 300.0 100.0 3.75 1,909.6 100.0 1.88 523.3 89.9 7.59 4.1 0.0137 60.9 0.55 242,720 809 61.0 0.43 53 30.9 0.22E-06 Kokhajor-1 111.5 37.2 1.40 278.9 14.6 0.27 94.1 16.2 1.37 2.9 0.0259 20.3 0.18 202,300 1,814 8.6 0.06 70 0.0 0.00E-17 Sun Koshi No.3 536.0 100.0 3.75 1,883.6 98.6 1.85 335.9 57.7 4.87 8.2 0.0152 55.7 0.50 520,608 971 52.5 0.37 38 58.2 0.41C-02 Lower Badigad 380.3 100.0 3.75 1,366.0 71.5 1.34 354.7 61.0 5.15 3.3 0.0087 77.4 0.70 129,360 340 85.4 0.60 38 58.2 0.41C-08 Andhi Khola 180.0 60.0 2.25 648.7 34.0 0.64 137.1 23.6 1.99 1.5 0.0084 78.4 0.71 77,312 430 80.8 0.57 38 58.2 0.41W-02 Chera-1 148.7 49.6 1.86 563.2 29.5 0.55 120.6 20.7 1.75 1.5 0.0098 73.6 0.66 38,088 256 89.8 0.63 41 52.7 0.37W-05 Lower Jhimruk 142.5 47.5 1.78 454.7 23.8 0.45 94.4 16.2 1.37 1.9 0.0131 62.7 0.56 83,776 588 72.5 0.51 26 80.0 0.56W-06 Madi 199.8 66.6 2.50 621.1 32.5 0.61 170.7 29.3 2.47 1.6 0.0082 78.9 0.71 36,982 185 93.5 0.65 15 100.0 0.70W-23 Nalsyau Gad 410.0 100.0 3.75 1,406.1 73.6 1.38 581.8 100.0 8.44 0.8 0.0019 100.0 0.90 24,580 60 100.0 0.70 20 90.9 0.64W-25 Naumure (W. Rapti) 245.0 81.7 3.06 1,157.5 60.6 1.14 309.9 53.3 4.50 7.9 0.0320 0.0 0.00 485,130 1,980 0.0 0.00 40 54.5 0.38
Subcategory Effectiveness of project (cont.) Impact of natural environmentCategory Technical and Economical Conditions (cont.) Impact on Environment
Evaluation Item
Weight (%)
Installed capacity Annual energy productionEnergy production in the dry
seasonForest land Number of trees in the reservoir area Average of crown coverage
Impact on forest
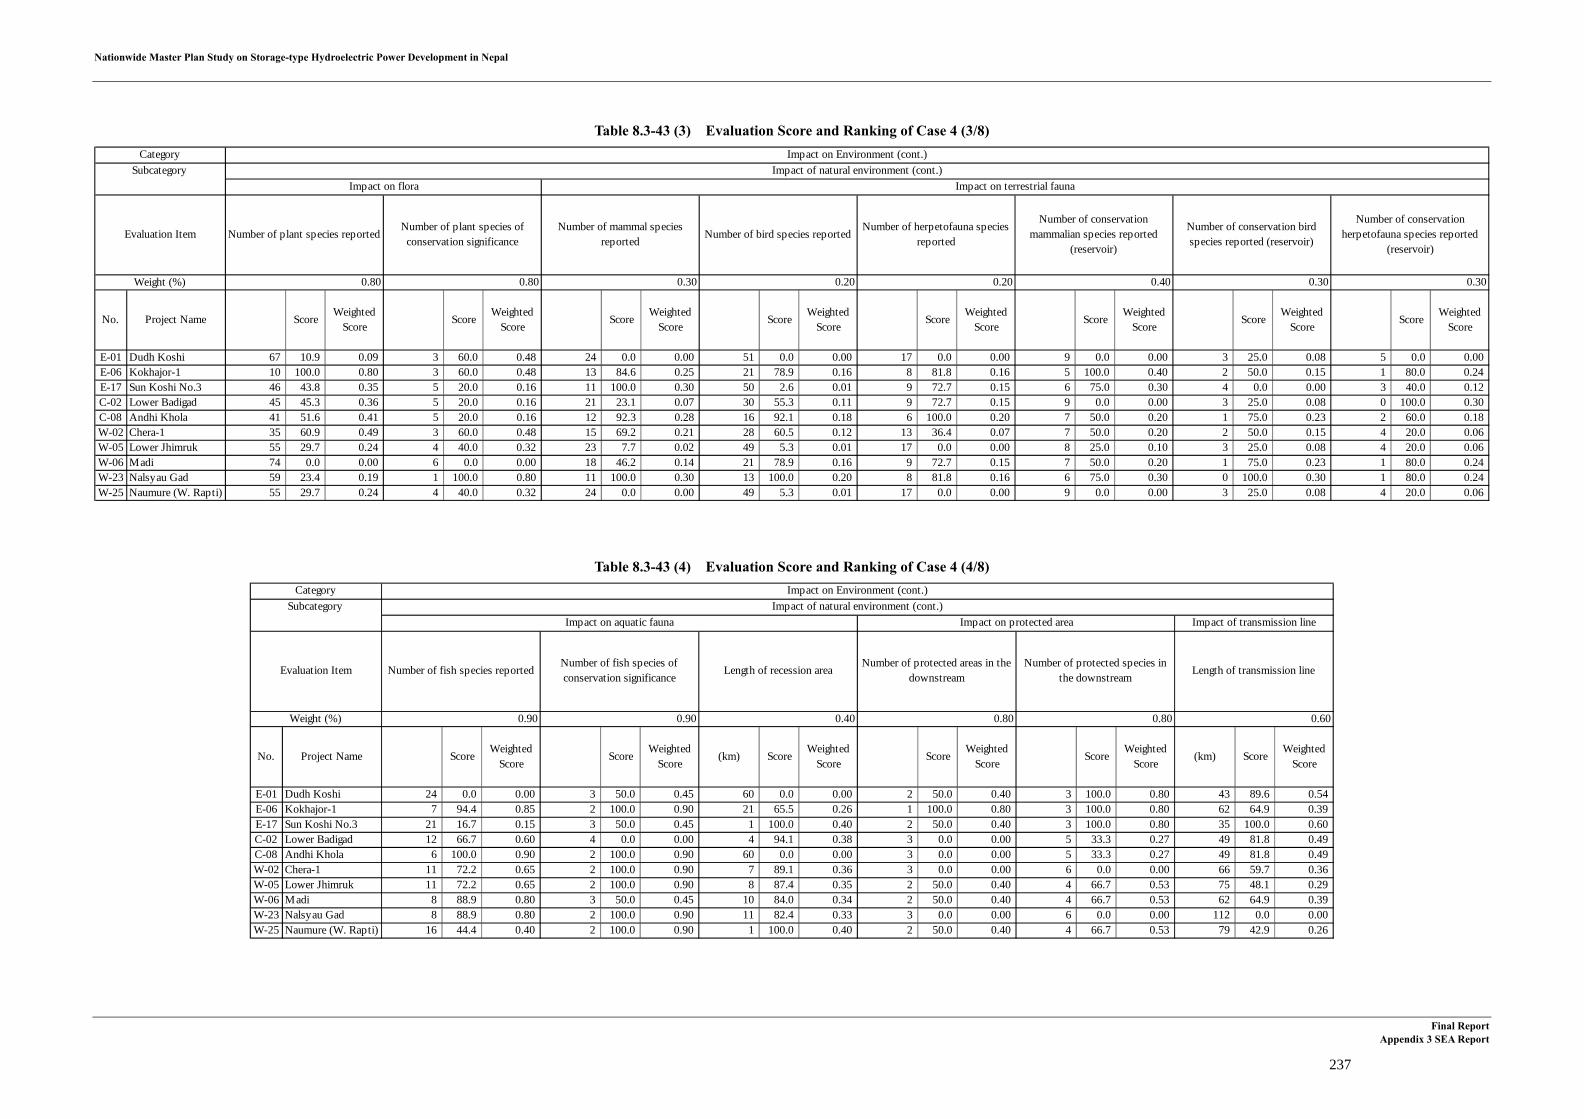
Nationwide Master Plan Study on Storage-type Hydroelectric Power Development in Nepal
Final Report Appendix 3 SEA Report
237
Table 8.3-43 (3) Evaluation Score and Ranking of Case 4 (3/8)
Table 8.3-43 (4) Evaluation Score and Ranking of Case 4 (4/8)
0.80 0.80 0.30 0.20 0.20 0.40 0.30 0.30
No. Project Name ScoreWeighted
ScoreScore
WeightedScore
ScoreWeighted
ScoreScore
WeightedScore
ScoreWeighted
ScoreScore
WeightedScore
ScoreWeighted
ScoreScore
WeightedScore
E-01 Dudh Koshi 67 10.9 0.09 3 60.0 0.48 24 0.0 0.00 51 0.0 0.00 17 0.0 0.00 9 0.0 0.00 3 25.0 0.08 5 0.0 0.00E-06 Kokhajor-1 10 100.0 0.80 3 60.0 0.48 13 84.6 0.25 21 78.9 0.16 8 81.8 0.16 5 100.0 0.40 2 50.0 0.15 1 80.0 0.24E-17 Sun Koshi No.3 46 43.8 0.35 5 20.0 0.16 11 100.0 0.30 50 2.6 0.01 9 72.7 0.15 6 75.0 0.30 4 0.0 0.00 3 40.0 0.12C-02 Lower Badigad 45 45.3 0.36 5 20.0 0.16 21 23.1 0.07 30 55.3 0.11 9 72.7 0.15 9 0.0 0.00 3 25.0 0.08 0 100.0 0.30C-08 Andhi Khola 41 51.6 0.41 5 20.0 0.16 12 92.3 0.28 16 92.1 0.18 6 100.0 0.20 7 50.0 0.20 1 75.0 0.23 2 60.0 0.18W-02 Chera-1 35 60.9 0.49 3 60.0 0.48 15 69.2 0.21 28 60.5 0.12 13 36.4 0.07 7 50.0 0.20 2 50.0 0.15 4 20.0 0.06W-05 Lower Jhimruk 55 29.7 0.24 4 40.0 0.32 23 7.7 0.02 49 5.3 0.01 17 0.0 0.00 8 25.0 0.10 3 25.0 0.08 4 20.0 0.06W-06 Madi 74 0.0 0.00 6 0.0 0.00 18 46.2 0.14 21 78.9 0.16 9 72.7 0.15 7 50.0 0.20 1 75.0 0.23 1 80.0 0.24W-23 Nalsyau Gad 59 23.4 0.19 1 100.0 0.80 11 100.0 0.30 13 100.0 0.20 8 81.8 0.16 6 75.0 0.30 0 100.0 0.30 1 80.0 0.24W-25 Naumure (W. Rapti) 55 29.7 0.24 4 40.0 0.32 24 0.0 0.00 49 5.3 0.01 17 0.0 0.00 9 0.0 0.00 3 25.0 0.08 4 20.0 0.06
Subcategory Impact of natural environment (cont.)Category Impact on Environment (cont.)
Evaluation Item
Weight (%)
Number of conservationmammalian species reported
(reservoir)
Number of conservation birdspecies reported (reservoir)
Number of conservationherpetofauna species reported
(reservoir)
Impact on flora Impact on terrestrial fauna
Number of plant species reportedNumber of plant species of
conservation significanceNumber of mammal species
reportedNumber of bird species reported
Number of herpetofauna speciesreported
0.90 0.90 0.40 0.80 0.80 0.60
No. Project Name ScoreWeighted
ScoreScore
WeightedScore
(km) ScoreWeighted
ScoreScore
WeightedScore
ScoreWeighted
Score(km) Score
WeightedScore
E-01 Dudh Koshi 24 0.0 0.00 3 50.0 0.45 60 0.0 0.00 2 50.0 0.40 3 100.0 0.80 43 89.6 0.54E-06 Kokhajor-1 7 94.4 0.85 2 100.0 0.90 21 65.5 0.26 1 100.0 0.80 3 100.0 0.80 62 64.9 0.39E-17 Sun Koshi No.3 21 16.7 0.15 3 50.0 0.45 1 100.0 0.40 2 50.0 0.40 3 100.0 0.80 35 100.0 0.60C-02 Lower Badigad 12 66.7 0.60 4 0.0 0.00 4 94.1 0.38 3 0.0 0.00 5 33.3 0.27 49 81.8 0.49C-08 Andhi Khola 6 100.0 0.90 2 100.0 0.90 60 0.0 0.00 3 0.0 0.00 5 33.3 0.27 49 81.8 0.49W-02 Chera-1 11 72.2 0.65 2 100.0 0.90 7 89.1 0.36 3 0.0 0.00 6 0.0 0.00 66 59.7 0.36W-05 Lower Jhimruk 11 72.2 0.65 2 100.0 0.90 8 87.4 0.35 2 50.0 0.40 4 66.7 0.53 75 48.1 0.29W-06 Madi 8 88.9 0.80 3 50.0 0.45 10 84.0 0.34 2 50.0 0.40 4 66.7 0.53 62 64.9 0.39W-23 Nalsyau Gad 8 88.9 0.80 2 100.0 0.90 11 82.4 0.33 3 0.0 0.00 6 0.0 0.00 112 0.0 0.00W-25 Naumure (W. Rapti) 16 44.4 0.40 2 100.0 0.90 1 100.0 0.40 2 50.0 0.40 4 66.7 0.53 79 42.9 0.26
Category Impact on Environment (cont.)Subcategory Impact of natural environment (cont.)
Weight (%)
Number of protected areas in thedownstream
Number of protected species inthe downstream
Number of fish species reportedNumber of fish species ofconservation significance
Length of recession areaEvaluation Item Length of transmission line
Impact on aquatic fauna Impact on protected area Impact of transmission line

Nationwide Master Plan Study on Storage-type Hydroelectric Power Development in Nepal
Final Report Appendix 3 SEA Report
239
Table 8.3-43 (5) Evaluation Score and Ranking of Case 4 (5/8)
Table 8.3-43 (6) Evaluation Score and Ranking of Case 4 (6/8)
1.50 0.60 0.45 1.20 1.35 1.50
No. Project Name (/MW) ScoreWeighted
Score(/MW) Score
WeightedScore
(/MW) ScoreWeighted
ScoreScore
WeightedScore
(facilities) ScoreWeighted
Score (km2) (km2/MW) Score
WeightedScore
E-01 Dudh Koshi 63 0.21 100.0 1.50 0 0.0000 100.0 0.60 0 0.0000 100.0 0.45 3 40.0 0.48 1 98.3 1.33 3.3 0.0110 74.0 1.11E-06 Kokhajor-1 92 0.83 84.7 1.27 6 0.0538 0.0 0.00 0 0.0000 100.0 0.45 2 60.0 0.72 2 96.6 1.30 1.7 0.0154 50.5 0.76E-17 Sun Koshi No.3 1,599 2.98 30.9 0.46 19 0.0354 34.1 0.20 2 0.0037 88.8 0.40 4 20.0 0.24 20 65.5 0.88 9.4 0.0175 39.4 0.59C-02 Lower Badigad 1,606 4.22 0.0 0.00 18 0.0473 12.0 0.07 11 0.0289 13.2 0.06 5 0.0 0.00 58 0.0 0.00 5.9 0.0155 50.1 0.75C-08 Andhi Khola 542 3.01 30.2 0.45 9 0.0500 7.1 0.04 6 0.0333 0.0 0.00 2 60.0 0.72 23 60.3 0.81 1.7 0.0092 83.7 1.26W-02 Chera-1 566 3.81 10.4 0.16 3 0.0202 62.5 0.38 0 0.0000 100.0 0.45 1 80.0 0.96 7 87.9 1.19 1.1 0.0073 93.8 1.41W-05 Lower Jhimruk 229 1.61 65.2 0.98 4 0.0281 47.8 0.29 3 0.0211 36.8 0.17 3 40.0 0.48 3 94.8 1.28 2.0 0.0143 56.4 0.85W-06 Madi 336 1.68 63.3 0.95 2 0.0100 81.4 0.49 0 0.0000 100.0 0.45 1 80.0 0.96 16 72.4 0.98 1.9 0.0096 81.4 1.22W-23 Nalsyau Gad 263 0.64 89.2 1.34 2 0.0049 90.9 0.55 0 0.0000 100.0 0.45 0 100.0 1.20 0 100.0 1.35 2.5 0.0061 100.0 1.50W-25 Naumure (W. Rapti) 456 1.86 58.9 0.88 5 0.0204 62.1 0.37 0 0.0000 100.0 0.45 2 60.0 0.72 25 56.9 0.77 6.1 0.0249 0.0 0.00
Category Impact on Environment (cont.)Subcategory Impact on social environment
Evaluation Item
Weight (%)
Impact on irrigation Impact on agricultural landNumber of ethnic minority
groupsNumber of industriesNumber of estimated households Number of schools
Impact on household, etc. Impact on ethnic minority Impact on agriculture
0.45 0.30 0.15 0.45 0.45 0.45
No. Project Name ScoreWeighted
ScoreScore
WeightedScore
(kg/day) ScoreWeighted
Score(Rs/day) Score
WeightedScore
(Rs/year) ScoreWeighted
Score(km) Score
WeightedScore
E-01 Dudh Koshi 154 78.4 0.35 7 0.0 0.00 70.0 50.0 0.08 17,500 58.3 0.26 1,820,000 50.9 0.23 60 0.0 0.00E-06 Kokhajor-1 0 100.0 0.45 0 100.0 0.30 0.0 100.0 0.15 0 100.0 0.45 0 100.0 0.45 21 65.5 0.29E-17 Sun Koshi No.3 712 0.0 0.00 7 0.0 0.00 140.0 0.0 0.00 42,000 0.0 0.00 3,710,000 0.0 0.00 1 100.0 0.45C-02 Lower Badigad 217 69.5 0.31 7 0.0 0.00 101.5 27.5 0.04 25,375 39.6 0.18 1,062,885 71.4 0.32 4 94.1 0.42C-08 Andhi Khola 156 78.1 0.35 3 57.1 0.17 25.5 81.8 0.12 7,650 81.8 0.37 550,000 85.2 0.38 60 0.0 0.00W-02 Chera-1 25 96.5 0.43 4 42.9 0.13 37.5 73.2 0.11 7,500 82.1 0.37 375,000 89.9 0.40 7 89.1 0.40W-05 Lower Jhimruk 254 64.3 0.29 3 57.1 0.17 40.5 71.1 0.11 7,290 82.6 0.37 225,000 93.9 0.42 8 87.4 0.39W-06 Madi 100 86.0 0.39 3 57.1 0.17 12.0 91.4 0.14 3,600 91.4 0.41 273,000 92.6 0.42 10 84.0 0.38W-23 Nalsyau Gad 115 83.8 0.38 3 57.1 0.17 10.5 92.5 0.14 2,100 95.0 0.43 1,140,000 69.3 0.31 11 82.4 0.37W-25 Naumure (W. Rapti) 43 94.0 0.42 2 71.4 0.21 15.0 89.3 0.13 4,125 90.2 0.41 387,000 89.6 0.40 1 100.0 0.45
Impact on social environment (cont.)Category Impact on Environment (cont.)
Subcategory
Evaluation Item
Weight (%)
Number of fishermen (reservoir) Number of fish market Availability of fish in the market Sales amount of fish Total income Length of recession area
Impact on fishery
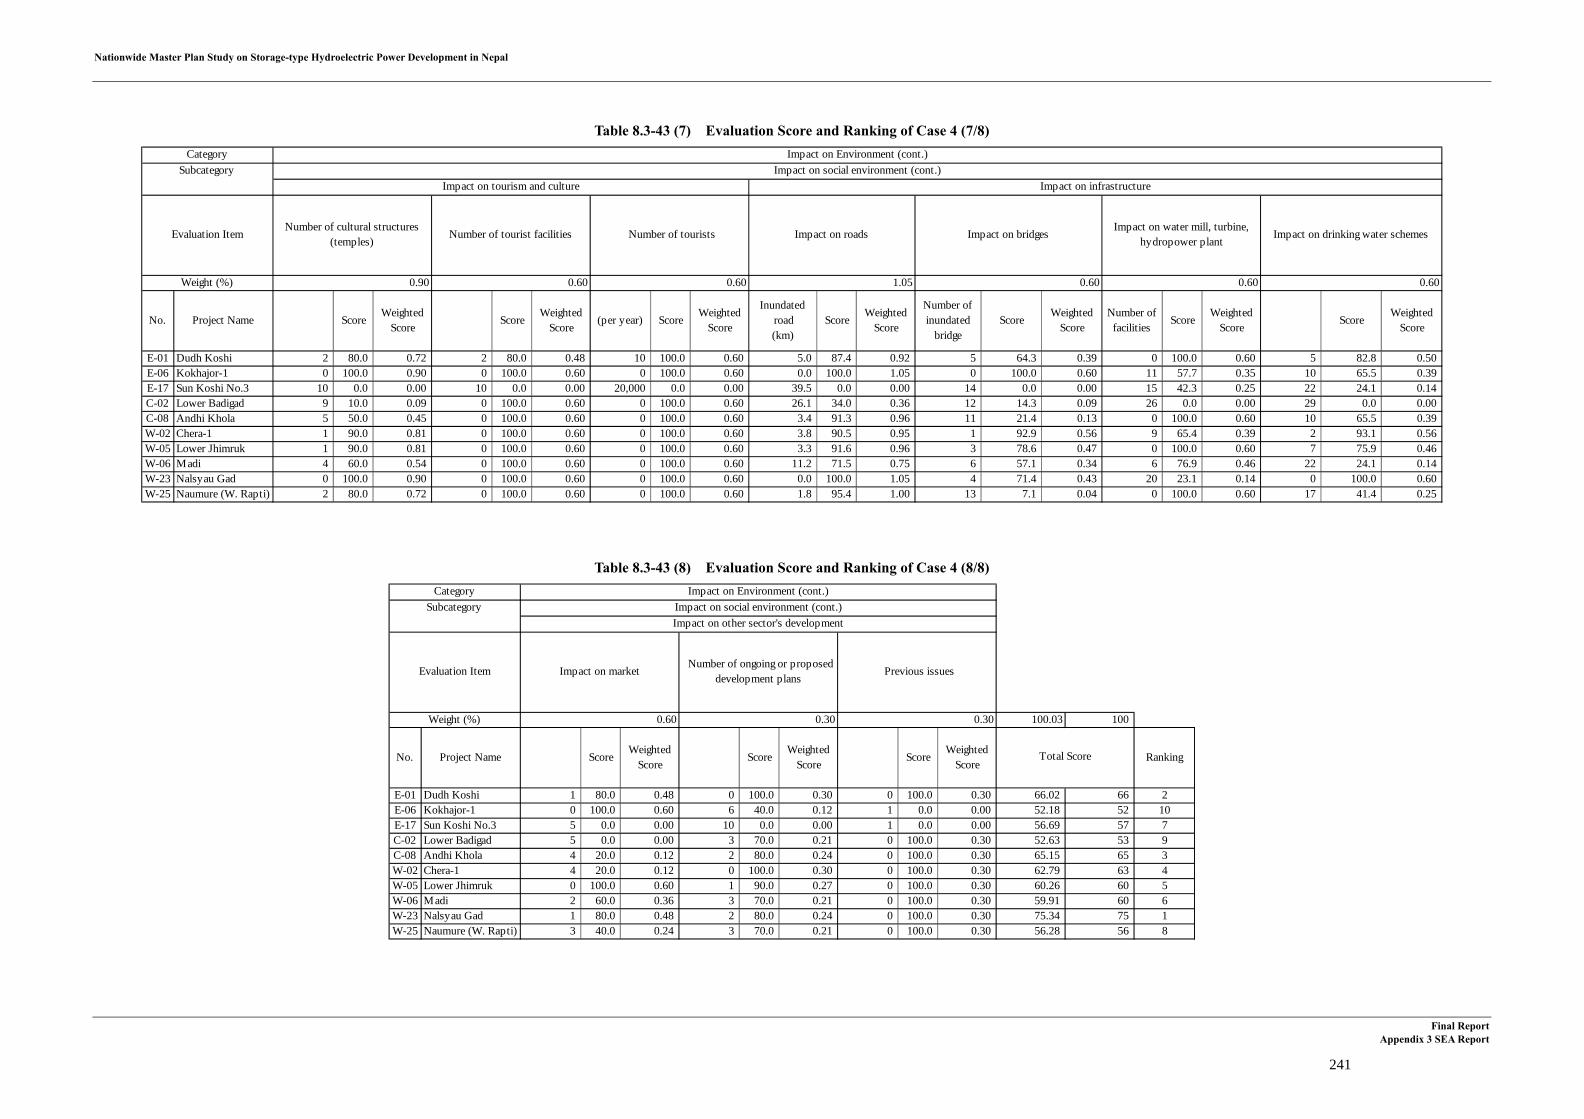
Nationwide Master Plan Study on Storage-type Hydroelectric Power Development in Nepal
Final Report Appendix 3 SEA Report
241
Table 8.3-43 (7) Evaluation Score and Ranking of Case 4 (7/8)
Table 8.3-43 (8) Evaluation Score and Ranking of Case 4 (8/8)
0.90 0.60 0.60 1.05 0.60 0.60 0.60
No. Project Name ScoreWeighted
ScoreScore
WeightedScore
(per year) ScoreWeighted
Score
Inundated road(km)
ScoreWeighted
Score
Number ofinundated
bridgeScore
WeightedScore
Number offacilities
ScoreWeighted
ScoreScore
WeightedScore
E-01 Dudh Koshi 2 80.0 0.72 2 80.0 0.48 10 100.0 0.60 5.0 87.4 0.92 5 64.3 0.39 0 100.0 0.60 5 82.8 0.50E-06 Kokhajor-1 0 100.0 0.90 0 100.0 0.60 0 100.0 0.60 0.0 100.0 1.05 0 100.0 0.60 11 57.7 0.35 10 65.5 0.39E-17 Sun Koshi No.3 10 0.0 0.00 10 0.0 0.00 20,000 0.0 0.00 39.5 0.0 0.00 14 0.0 0.00 15 42.3 0.25 22 24.1 0.14C-02 Lower Badigad 9 10.0 0.09 0 100.0 0.60 0 100.0 0.60 26.1 34.0 0.36 12 14.3 0.09 26 0.0 0.00 29 0.0 0.00C-08 Andhi Khola 5 50.0 0.45 0 100.0 0.60 0 100.0 0.60 3.4 91.3 0.96 11 21.4 0.13 0 100.0 0.60 10 65.5 0.39W-02 Chera-1 1 90.0 0.81 0 100.0 0.60 0 100.0 0.60 3.8 90.5 0.95 1 92.9 0.56 9 65.4 0.39 2 93.1 0.56W-05 Lower Jhimruk 1 90.0 0.81 0 100.0 0.60 0 100.0 0.60 3.3 91.6 0.96 3 78.6 0.47 0 100.0 0.60 7 75.9 0.46W-06 Madi 4 60.0 0.54 0 100.0 0.60 0 100.0 0.60 11.2 71.5 0.75 6 57.1 0.34 6 76.9 0.46 22 24.1 0.14W-23 Nalsyau Gad 0 100.0 0.90 0 100.0 0.60 0 100.0 0.60 0.0 100.0 1.05 4 71.4 0.43 20 23.1 0.14 0 100.0 0.60W-25 Naumure (W. Rapti) 2 80.0 0.72 0 100.0 0.60 0 100.0 0.60 1.8 95.4 1.00 13 7.1 0.04 0 100.0 0.60 17 41.4 0.25
Impact on Environment (cont.)Subcategory Impact on social environment (cont.)
Category
Impact on roads Impact on bridgesImpact on water mill, turbine,
hydropower plantImpact on drinking water schemes
Number of cultural structures(temples)
Number of tourist facilities Number of touristsEvaluation Item
Weight (%)
Impact on infrastructureImpact on tourism and culture
0.60 0.30 0.30 100.03 100
No. Project Name ScoreWeighted
ScoreScore
WeightedScore
ScoreWeighted
ScoreRanking
E-01 Dudh Koshi 1 80.0 0.48 0 100.0 0.30 0 100.0 0.30 66.02 66 2E-06 Kokhajor-1 0 100.0 0.60 6 40.0 0.12 1 0.0 0.00 52.18 52 10E-17 Sun Koshi No.3 5 0.0 0.00 10 0.0 0.00 1 0.0 0.00 56.69 57 7C-02 Lower Badigad 5 0.0 0.00 3 70.0 0.21 0 100.0 0.30 52.63 53 9C-08 Andhi Khola 4 20.0 0.12 2 80.0 0.24 0 100.0 0.30 65.15 65 3W-02 Chera-1 4 20.0 0.12 0 100.0 0.30 0 100.0 0.30 62.79 63 4W-05 Lower Jhimruk 0 100.0 0.60 1 90.0 0.27 0 100.0 0.30 60.26 60 5W-06 Madi 2 60.0 0.36 3 70.0 0.21 0 100.0 0.30 59.91 60 6W-23 Nalsyau Gad 1 80.0 0.48 2 80.0 0.24 0 100.0 0.30 75.34 75 1W-25 Naumure (W. Rapti) 3 40.0 0.24 3 70.0 0.21 0 100.0 0.30 56.28 56 8
Category Impact on Environment (cont.)Subcategory Impact on social environment (cont.)
Evaluation Item
Weight (%)
Total Score
Impact on market Number of ongoing or proposed
development plans Previous issues
Impact on other sector's development

Nationwide Master Plan Study on Storage-type Hydroelectric Power Development in Nepal
Note: The evaluation result of Case 1.
Figure 8.3-39 (1) Characteristics of Promising Projects (1)
Final ReportAppendix 3 SEA Report
243
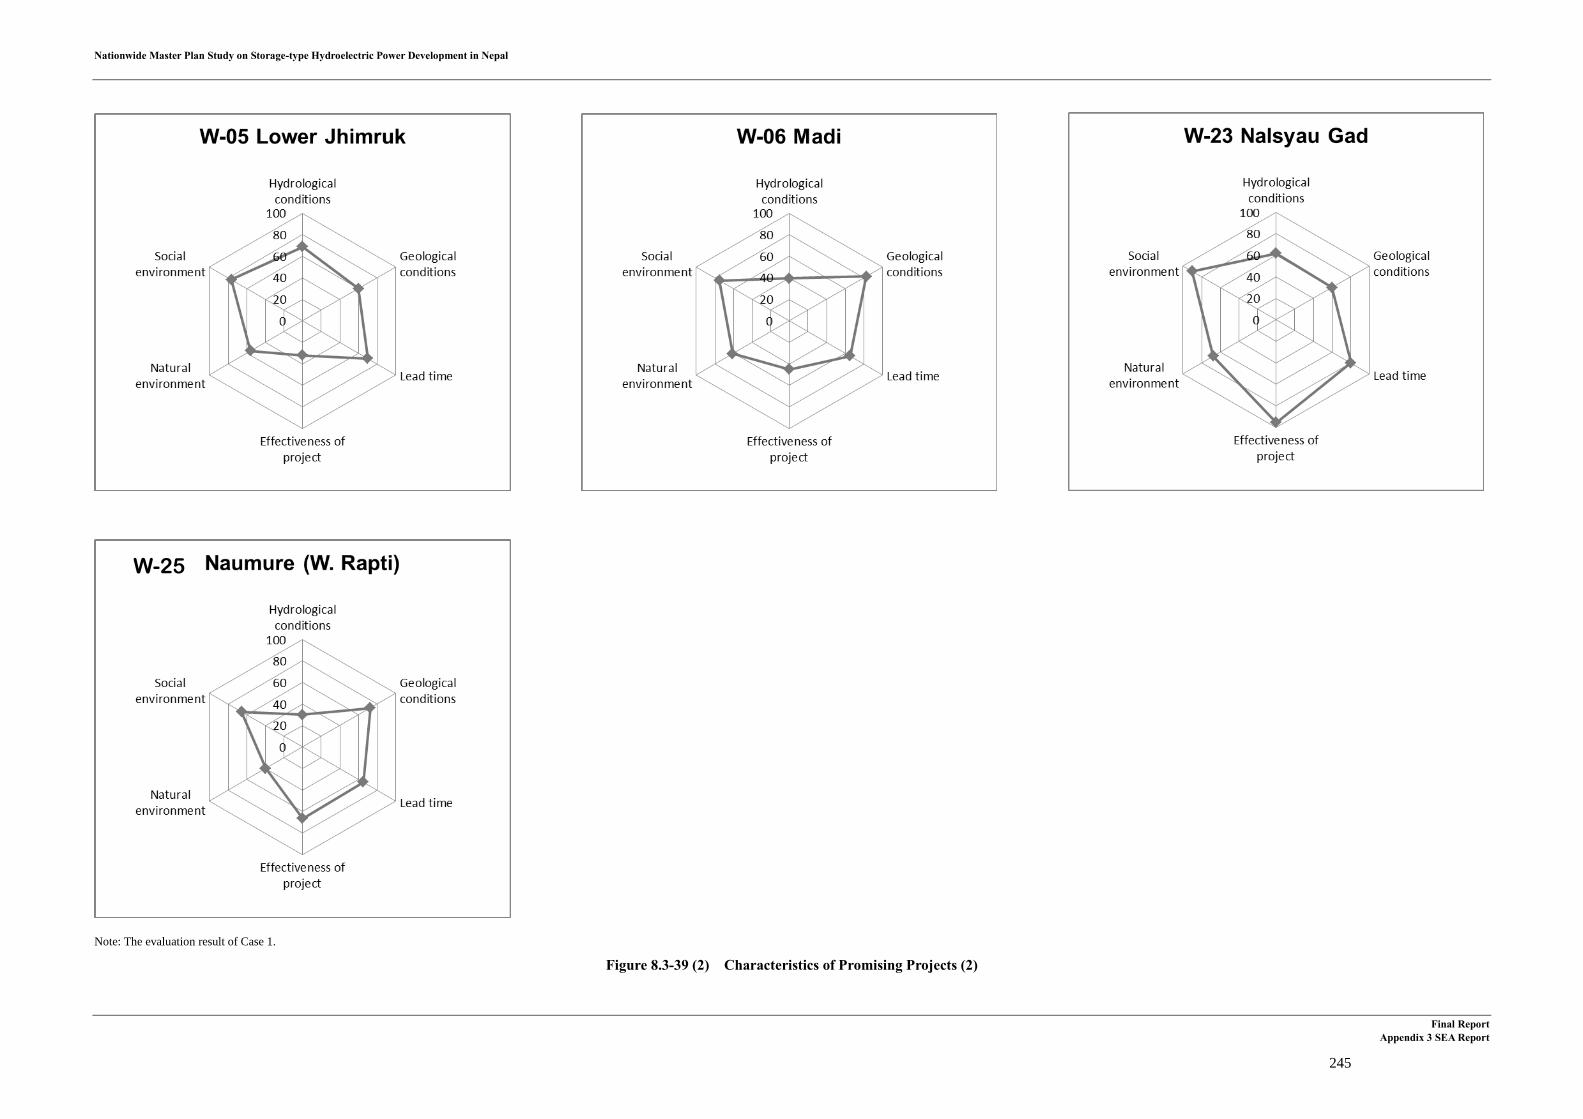
Nationwide Master Plan Study on Storage-type Hydroelectric Power Development in Nepal
Note: The evaluation result of Case 1.
Figure 8.3-39 (2) Characteristics of Promising Projects (2)
W-25
Final ReportAppendix 3 SEA Report
245

Nationwide Master Plan Study on Storage-type Hydroelectric Power Development in Nepal
Chapter 9 Cumulative Impact
Project Description 9.1
The information of the existing and planned Hydroelectric power plant, Irrigation, and Roads are collected to see the cumulative impact. In order to see the impact on downstream, the information in India are collected too.
(1) Existing Projects
1) Existing Hydroelectric Power stations and Irrigation Barrages
There are around 30 middle and large size hydroelectric power plants in Nepal. Five of them are under construction. Two of them are storage-type. 18 projects are in the Gandak river system, 7 projects are in Koshi river system, and 1 is in the Bagmati river system. Two of them are operating at the Irrigation barrages. The list is shown in Table 9.1-1 and the location is shown in Figure 9.1-1.
Table 9.1-1 Operating and Constructing Major Hydro Power plants in Nepal
No. Name River River System Owner Type Capacity
(KW) Condition
1 Chamelia Chamaliya Nadi
Chamaliya NEA ROR 30,000 Construction
2 Tinau (Butwal) Tinau River Danau NEA ROR 1,024 Operating 3 Jhimruk Khola Jhimruk
Khola Rapti Private ROR 12,000 Operating
4 Andhikhola Kali Gandaki Nadi
Gandaki Private ROR 5,100 Operating
5 Chilime Trishuli River
Gandaki Private ROR 22,000 Operating
6 Devighat Trishuli River
Gandaki NEA ROR 14,100 Operating
7 Gandak Narayani (Sapta Gandaki)
Gandaki NEA ROR 15,000 Operating with Irrigation
8 KaliGandaki "A" Kali Gandaki Nadi
Gandaki NEA ROR 144,000 Operating
9 Kulekhani III Headwork
Rapti Nadi Gandaki NEA Storage 14,000 Construction
10 Kulekhani No. 1 Bagmati Bagmati NEA Storage 60,000 Operating 11 Kulekhani No. 2 Rapti Nadi Gandaki NEA ROR 32,000 Operating 12 Marsyangdi Marsyandi
Nadi Gandaki NEA ROR 69,000 Operating
13 Middle Marsyandi Gandaki NEA PROR 70,000 Operating Final Report
Appendix 3 SEA Report
247

Nationwide Master Plan Study on Storage-type Hydroelectric Power Development in Nepal
No. Name River River System Owner Type Capacity
(KW) Condition
Marsyangdi Nadi 14 Modi Khola Modi Khola Gandaki NEA ROR 14,800 Operating 15 Phewa (Pokhara) Seti Nadi Gandaki NEA ROR 1,000 Operating 16 Rairang Thopal
Khola Gandaki Private ROR 500 Operating
17 Ridi Khola Ridi Khola Gandaki Private ROR 2,400 Operating 18 Seti (Pokhara) Seti Nadi Gandaki NEA ROR 1,500 Operating 19 Tatopani/Myagdi(i)
& (II) Kali Gandaki Nadi
Gandaki NEA ROR 2,000 Operating
20 Trisuli Trishuli River
Gandaki NEA ROR 24,000 Operating
21 Upper Trisuli 3A Trishuli River
Gandaki NEA ROR 60,000 Construction
22 Indrawati III Indrawati Nadi
Koshi Private ROR 7,500 Operating
23 Khimti Khimti Khola
Koshi Private ROR 60,000 Operating
24 Panauti Rosi Khola Koshi NEA ROR 2,400 Operating 25 Sunkosi SunKoshi
Nadi Koshi NEA ROR 10,050 Operating
26 Upper Bhotekoshi Bhotekoshi Nadi
Koshi Private ROR 36,000 Operating
27 Upper Tamakoshi Headworks
Tamakoshi Nadi
Koshi NEA ROR 456,000 Construction
28 Chatara Koshi Koshi NEA ROR 3,200 Operating with Irrigation
29 Puwakhola Puwa Khola Kankaimai NEA ROR 6,200 Operating 30 Mistri Mistri Gandaki NEA ROR 140,000 Construction
There are around 6 large Irrigation barrages in Nepal and 6 large Irrigation barrages at downstream of the rivers from Nepal in India. The quantities of water or irrigation areas of four barrages located in the border of Nepal and India are stipulated by the international treaty or agreements. The name of the irrigation barrages are listed in Table 9.2-1 and the locations of the barrages are shown in Figure 9.1-1.
Final Report Appendix 3 SEA Report
248
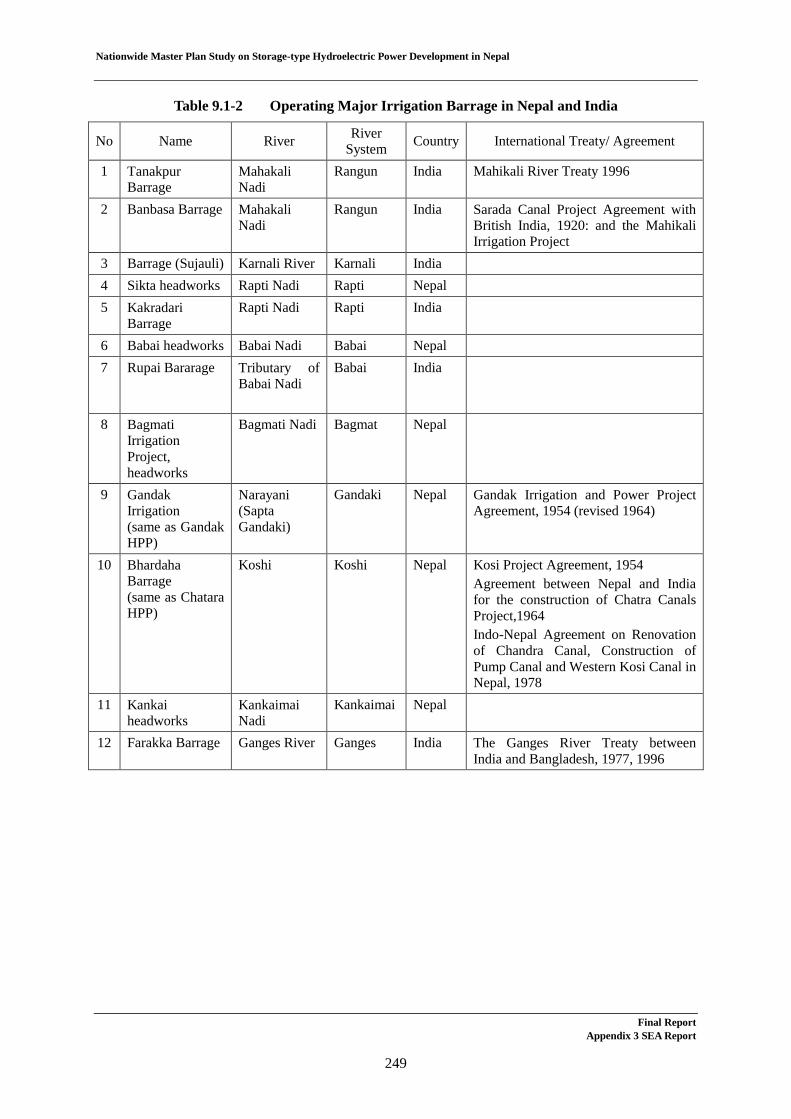
Nationwide Master Plan Study on Storage-type Hydroelectric Power Development in Nepal
Table 9.1-2 Operating Major Irrigation Barrage in Nepal and India
No Name River River System Country International Treaty/ Agreement
1 Tanakpur Barrage
Mahakali Nadi
Rangun India Mahikali River Treaty 1996
2 Banbasa Barrage Mahakali Nadi
Rangun India Sarada Canal Project Agreement with British India, 1920: and the Mahikali Irrigation Project
3 Barrage (Sujauli) Karnali River Karnali India 4 Sikta headworks Rapti Nadi Rapti Nepal 5 Kakradari
Barrage Rapti Nadi Rapti India
6 Babai headworks Babai Nadi Babai Nepal 7 Rupai Bararage Tributary of
Babai Nadi
Babai India
8 Bagmati Irrigation Project, headworks
Bagmati Nadi Bagmat Nepal
9 Gandak Irrigation (same as Gandak HPP)
Narayani (Sapta Gandaki)
Gandaki Nepal Gandak Irrigation and Power Project Agreement, 1954 (revised 1964)
10 Bhardaha Barrage (same as Chatara HPP)
Koshi Koshi Nepal Kosi Project Agreement, 1954 Agreement between Nepal and India for the construction of Chatra Canals Project,1964 Indo-Nepal Agreement on Renovation of Chandra Canal, Construction of Pump Canal and Western Kosi Canal in Nepal, 1978
11 Kankai headworks
Kankaimai Nadi
Kankaimai Nepal
12 Farakka Barrage Ganges River Ganges India The Ganges River Treaty between India and Bangladesh, 1977, 1996
Final Report Appendix 3 SEA Report
249

Nationwide Master Plan Study on Storage-type Hydroelectric Power Development in Nepal
Figure 9.1-1 Existing HPPs and Irrigation Barrage
2) Existing Road
Road network is stretching widely in Nepal. Based on the Road Statistics 2006/2007, Black topped road is 4,258 km, Gravel road is 2,062 km, and Earthen road is 3,079 km. Black topped roads are connected from west to south in low land. Road density around the capital city is higher than the rural areas. Figure 9.1-2 shows the existing roads in Nepal.
Final Report Appendix 3 SEA Report
250

Nationwide Master Plan Study on Storage-type Hydroelectric Power Development in Nepal
Figure 9.1-2 Existing road network in Nepal
Source: Strategic Road Network (2011/2012)
(2) Possible Projects
Possible Hydroelectric power plants, Irrigation Barrages and Roads in Nepal are examined.
1) Planned Hydroelectric Power Projects
There are many hydroelectric power development plans in Nepal both public and private. Accroding to the generation development plan in the main report, the major possible Hydroelectric power projects are categorized in two, such as Projects in preparation stage of construction and Candidate Projects. The projects in preparation stage of construction are 11 (See Figure 9.1-3) and Candidate projects are 9 (See Figure 9.1.4). 10 of them are a storage type project. 10 of them are in Gandak river system, 6 of them are in Koshi river system, and 2 of them are in Karnali river system.
In addition to that Ministry of Energy is issuing various types of licenses for possible HPPs, such as Construction licenses and Survey licenses. 74 Construction licenses, 29 Survey licenses above 100 MW, 52 Survey licenses for 25 to 100 MW, 175 Survey licenses for 1 to 25 MW, and 202 Survey licenses for below 1 MW are issued at the time of 2012 (See Figure 9.1-4). The valid periods of the licenses are limited. Then some licenses might be expired if no activities are taken for some time.
Final Report Appendix 3 SEA Report
251
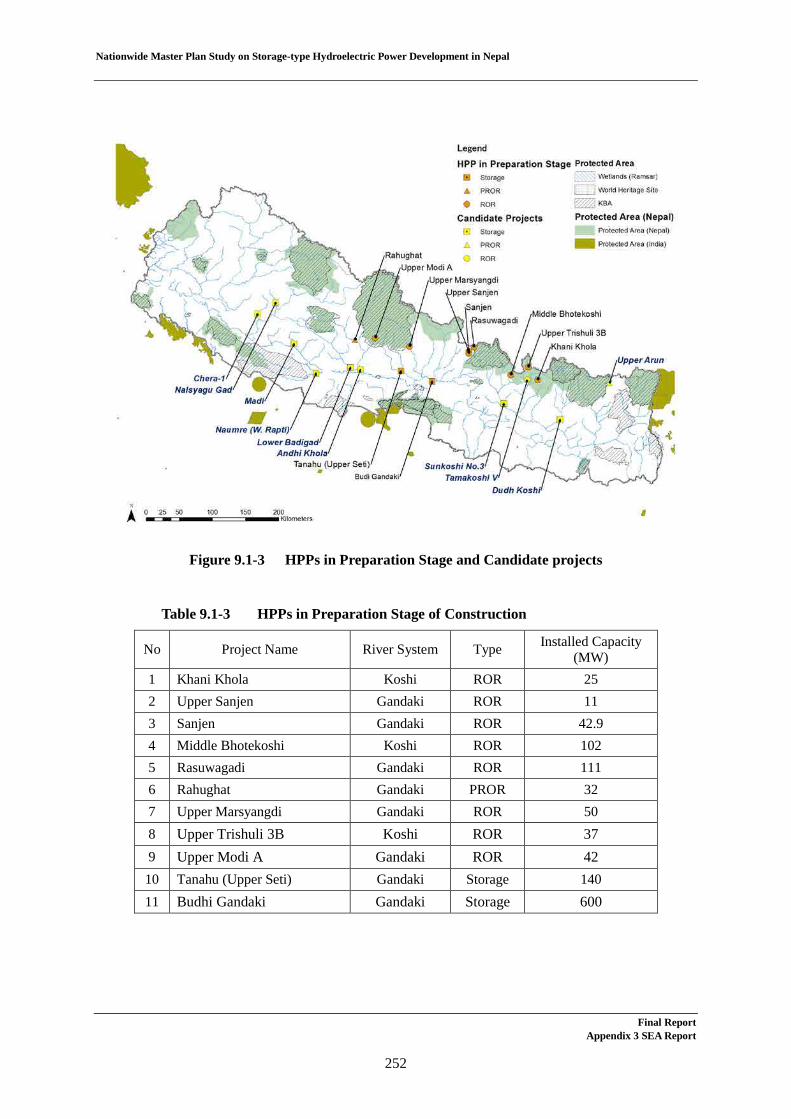
Nationwide Master Plan Study on Storage-type Hydroelectric Power Development in Nepal
Figure 9.1-3 HPPs in Preparation Stage and Candidate projects
Table 9.1-3 HPPs in Preparation Stage of Construction
No Project Name River System Type Installed Capacity (MW)
1 Khani Khola Koshi ROR 25 2 Upper Sanjen Gandaki ROR 11 3 Sanjen Gandaki ROR 42.9 4 Middle Bhotekoshi Koshi ROR 102 5 Rasuwagadi Gandaki ROR 111 6 Rahughat Gandaki PROR 32 7 Upper Marsyangdi Gandaki ROR 50 8 Upper Trishuli 3B Koshi ROR 37 9 Upper Modi A Gandaki ROR 42 10 Tanahu (Upper Seti) Gandaki Storage 140 11 Budhi Gandaki Gandaki Storage 600
Final Report Appendix 3 SEA Report
252
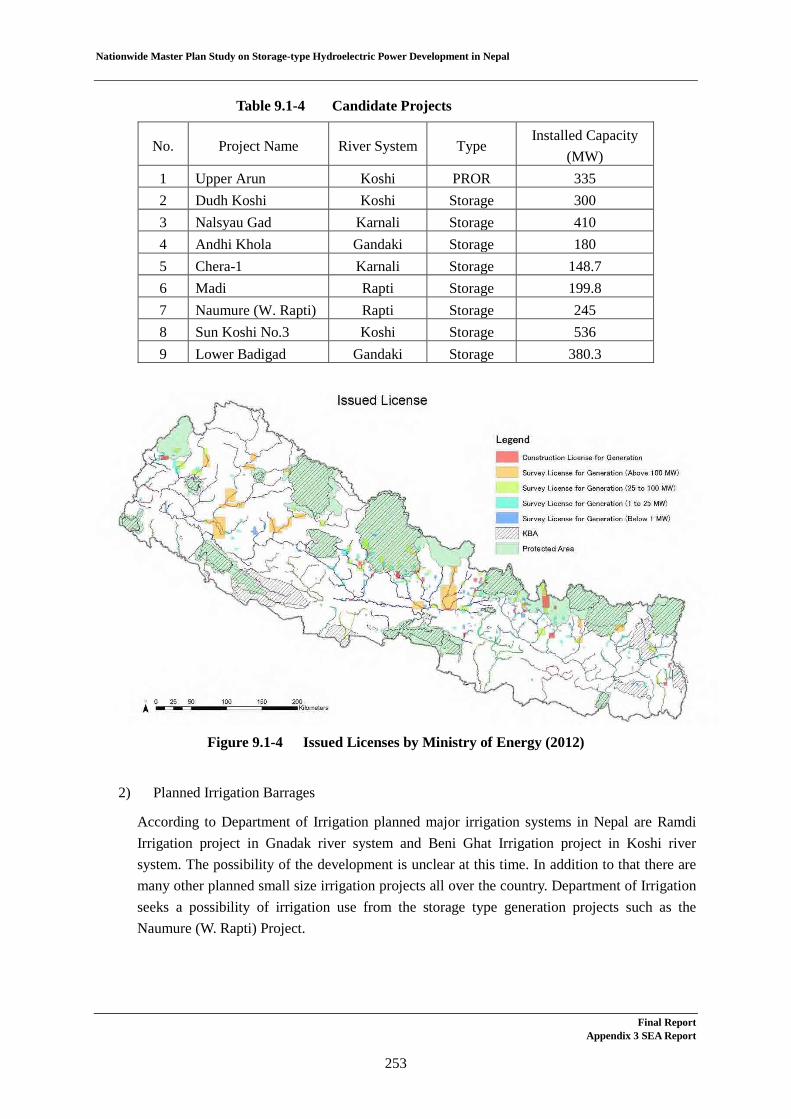
Nationwide Master Plan Study on Storage-type Hydroelectric Power Development in Nepal
Table 9.1-4 Candidate Projects
No. Project Name River System Type Installed Capacity
(MW) 1 Upper Arun Koshi PROR 335 2 Dudh Koshi Koshi Storage 300 3 Nalsyau Gad Karnali Storage 410 4 Andhi Khola Gandaki Storage 180 5 Chera-1 Karnali Storage 148.7 6 Madi Rapti Storage 199.8 7 Naumure (W. Rapti) Rapti Storage 245 8 Sun Koshi No.3 Koshi Storage 536 9 Lower Badigad Gandaki Storage 380.3
Figure 9.1-4 Issued Licenses by Ministry of Energy (2012)
2) Planned Irrigation Barrages
According to Department of Irrigation planned major irrigation systems in Nepal are Ramdi Irrigation project in Gnadak river system and Beni Ghat Irrigation project in Koshi river system. The possibility of the development is unclear at this time. In addition to that there are many other planned small size irrigation projects all over the country. Department of Irrigation seeks a possibility of irrigation use from the storage type generation projects such as the Naumure (W. Rapti) Project.
Final Report Appendix 3 SEA Report
253
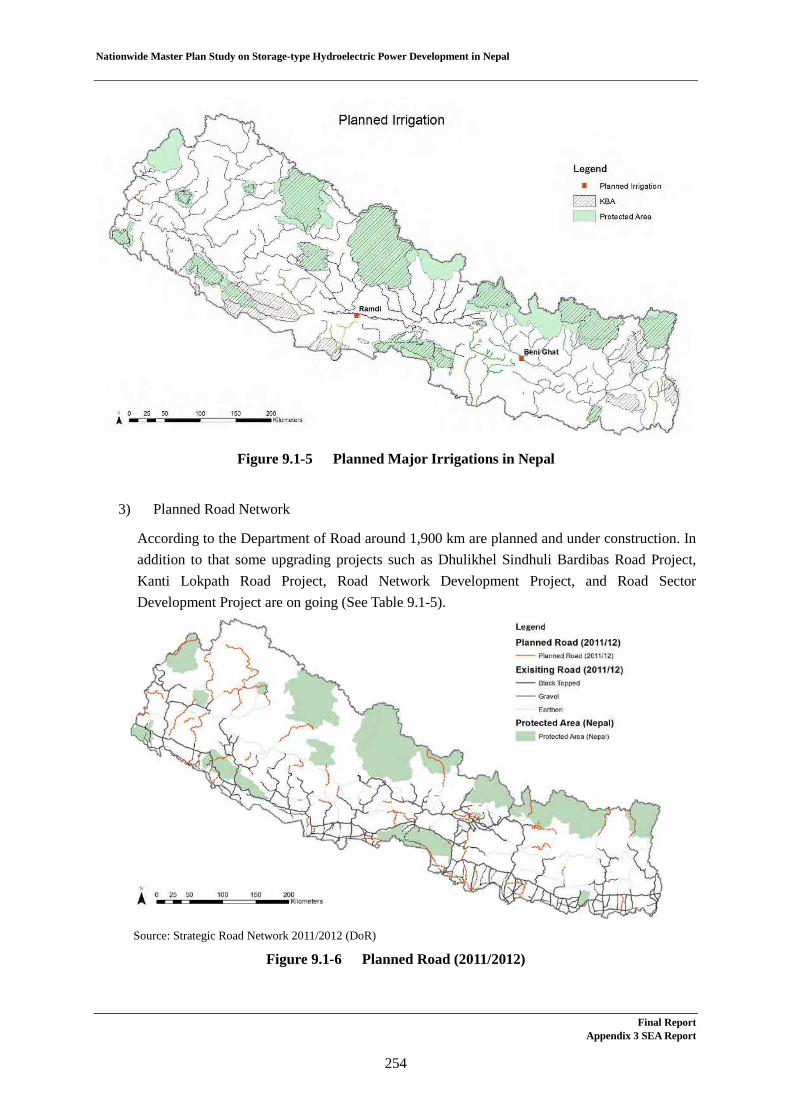
Nationwide Master Plan Study on Storage-type Hydroelectric Power Development in Nepal
Figure 9.1-5 Planned Major Irrigations in Nepal
3) Planned Road Network
According to the Department of Road around 1,900 km are planned and under construction. In addition to that some upgrading projects such as Dhulikhel Sindhuli Bardibas Road Project, Kanti Lokpath Road Project, Road Network Development Project, and Road Sector Development Project are on going (See Table 9.1-5).
Source: Strategic Road Network 2011/2012 (DoR)
Figure 9.1-6 Planned Road (2011/2012)
Final Report Appendix 3 SEA Report
254

Nationwide Master Plan Study on Storage-type Hydroelectric Power Development in Nepal
Table 9.1-5 Main road projects in Nepal
Name Region Length Dhulikhel Sindhuli Bardibas Road Project Central region 158 km Kanti Lokpath Road Project Central region 92 km Kathmandu Valley Road Improvement Project Central region 3.23 km Road Network Development Project
East West Highway Pavement Strengthening Component Road Improvement Component Feeder Road Construction Component
Eastern region 140 km 168 km 96 km
Road Sector Development Project Far western region and Mid western region
297 km
Source: Deartment of Roads
Scoping 9.2
Scoping table for the cumulative impact is prepared considering Hydroelectric power, Irrigation and road development. The Major impacts which would be accelerated by Hydroelectric power Projects are impact on water, forest, fishery and aquatic fauna (See Table 9.2-1). The water regulating effects accumulated by storage type HPP and Irrigations might cause serious impact on the wetland downstream. Because there are many protected area and protected species which depend on the wetland ecosystem near the Nepal and Indian border. The impact on migration fishes is also anxious by continued barriers in same river. Space crowning impact is also anxious because resettlement action itself might cause some impact on host communities and it will be accelerated by road construction. Noise and Global warming might be accelerated but they are excluded because main causes would come from road developments. Then (1) Water regulation effects, (2) Barrier effects on fish migration, and (3) Space crowning effects are selected for cumulative impact assessment.
Final Report Appendix 3 SEA Report
255

Nationwide Master Plan Study on Storage-type Hydroelectric Power Development in Nepal
Table 9.2-1 Scoping Table for Cumulative Impact
Items Existing Planned
Total Hydropower Road Irrigation Hydropower Road Irrigation
Air quality - + + ++ + + Noise, Vibration - + + +++ (+++) Water + + +++ +++ Soil - + + ++ (++) Waste - - + - + Global Warming - ++ - +++ (+++) Resettlement - - ++ + + ++ Agriculture - - ++ - + ++ Fishery and Aquatic Fauna
++ - + +++ - + +++
Tourism + - ++ - + ++ Forest - + ++ +++ + +++ Protected Area - + ++ ++ + ++ Terrestrial Fauna + + ++ ++ + ++ +++: Major impact, ++: Middle impact, +: Minor impact, -: No impact,
( ): Main impactors are not Hydropower
Impact Assessment 9.3
(1) Water Regulation Effects on Eetland Ecosystem
In order to see the cumulative effects on water regulation, all the existing and planned storage type hydroelectric power plants were identified and the catchment area was measured by river systems (See Table 9.3-1). The Karnali river system has two planned projects in different tributaries. If all the two projects are developed, the water flow from 3.2% of the river basin will be regulated. As a result, the Bardia National Park Buffer Zone located downstream and 28 protected species might be affected. The Rapti river system has two planned hydroelectric power plants. If two projects are developed, the water flow from 66.6% of the river basin will be regulated and the Banke National Park Buffer Zone and 15 protected species might be affected. The Gandaki river system has four existing storage type project and six planned storage type projects. If all the four projects are developed, the water flow from 64.6 % of the river basin will be regulated. It might infract the Gandaki Irrigation and Power Project Agreement (1959) (Table 9.3-2) signed between Nepal and India. In addition, the Chitwan National Park located downstream and 27 protected species might be affected. In the Koshi river system, there are two planned projects in different tributaries. If all the projects are developed, the water flow from 17.8 % of the river basin will be regulated. It might infract the Kosi Project Agreement signed between Nepal and India. The Koshi Tappu Wildlife Reserve and 15 protected species might be also affected.
Final Report Appendix 3 SEA Report
256

N
ationwide M
aster Plan Study on Storage-type Hydroelectric Pow
er Developm
ent in Nepal
Final Report
Appendix 3 SE
A Report
257
Table 9.3-1 Existing and Planned Storage-type Major Hydroelectric Power Projects
River System
Water Shed Area km2 (A)
Name Condition Catchment* Area (B) Rate (B/A) International
Treaty
Downstream Protected
area
Protected Species recorded downstream area
Kalnari 42,890 Chera-1 Candidate 809 1.9% 3.2% - Bardia National Park Buffer Zone
28 (CR 1, EN 7, VU 10, NT 10) Pygmy Hog (CR), Asian Elephant (EN), Hog Deer (EN), Ganges River Dolphin (EN), Dhole (EN), Royal Bengal Tiger (EN), Fishing Cat (EN), Hispid Hare (EN), Greater One-horned Rhino (VU), Swamp Deer (VU), Sambar (VU), Four-horned Antelope (VU), Clouded Leopard (VU), Sloth Bear (VU), Smooth-coated Otter (VU), Himalayan Black Bear (VU), Asian Small-clawed Otter (VU), Marbled Cat (VU)
Nalsyau Gad Candidate 572 1.3%
Rapti 5,150
Naumure (W. Rapti)
Candidate 3,430 66.6% 66.6% - Banke National Park Buffer Zone
15 (CR 0, EN 3, VU 4, NT 8) Asian Elephant (EN), Royal Bengal Tiger (EN), Fishing Cat (EN), Sambar (VU), Sloth Bear (VU), Smooth-coated Otter (VU), Himalayan Black Bear (VU)
5,150
Madi Candidate (764) (14.8%)
Gandaki 31,100 Kulekhani III Headwork
Construction 21 0.1% 64.6% Gandak Irrigation and Power Project Agreement
Chitwan National Park
27 (CR 1, EN 7, VU 9, NT 10) Pygmy Hog (CR), Asian Elephant (EN), Hog Deer (EN), Ganges River Dolphin (EN), Dhole (EN), Royal Bengal Tiger (EN), Fishing Cat (EN), Hispid Hare (EN), Greater One-horned Rhino (VU), Gaur (VU), Sambar (VU), Four-horned Antelope (VU), Clouded Leopard (VU), Sloth Bear (VU), Smooth-coated Otter (VU), Himalayan Black Bear (VU), Marbled Cat (VU)
Andhi Khola Candidate 475 1.5%
Lower Badigad Candidate 2,050 6.6%
Budi Gandaki Preparation Stage of Construction
16,066 51.7%
Tanahu Preparation Stage of Construction
1,474 4.7%
Bagmati 2,700 Kulekhani No.1 Existing 579 21.4% 21.4% - - 12 (CR 0, EN 2, VU 2, NT 8) Asian Elephant (EN), Chinese Pangolin (EN), Sambar (VU), Himalayan Black Bear (VU)
Koshi 54,100 Dudh Koshi Candidate 4,100 7.6% 17.8% Kosi Project Agreement
Koshi Tappu Wildlife Reserve
15 (CR 0, EN 5, VU 3, NT 7) Asian Elephant (EN), Wild Water Buffalo (EN), Ganges River Dolphin (EN), Dhole (EN), Fishing Cat (EN), Smooth-coated Otter (VU), Himalayan Black Bear (VU), Binturong (VU)
*: The figures in ( ) means that the area is included in Noumure’s catchmet area.

Nationwide Master Plan Study on Storage type Hydroelectric Power Development in Nepal
Table 9.3-2 Schedule of Water Requirements of the Gandak Project in Cumecs
(Vide clause 9 of the original agreement signed on December 4. 1959.)
Month Western Canal system and power house in Nepal
Eastern Canal system and power house in India Total
January 197 129 326 February 173 110 283 March 169 105 273 April 163 123 286 May 234 226 460 June 317 396 713 July 432 396 828 August 424 396 821 September 424 396 821 October 455 400 854 November 314 375 688 December 295 263 558
(2) Barrier Effects on Migration Fish
From ichthyological point of view, the rivers which have continuous barriers seem to be difficult for them to inhabit. Especially, the long distance migration fishes need access to the high mountain area with cold water that is suitable for spawning. Most of the IUCN red list fish species in Nepal are cold water migration fishes. Currently most of the existing major barriers are concentrated in the Gandaki and Koshi river systems. On the other hand, eight other main river systems are barrier free (See Table 9.3-3, Figure 9.3-1, Figure 9.3-2, and Figure 9.3-3). However, seven rivers of them are not reaching the high mountain area. Only the Karnali river system is reaching cold water area. Some of the existing barriers have fish ladders but some of them do not have any mitigation. Because of lack of data, actual barrier effects and mitigation effects are not clearly identified. But in case all the planned HPP and irrigation projects will be developed, it might cause serious impact on fish diversity in Nepal.
Final Report Appendix 3 SEA Report
258
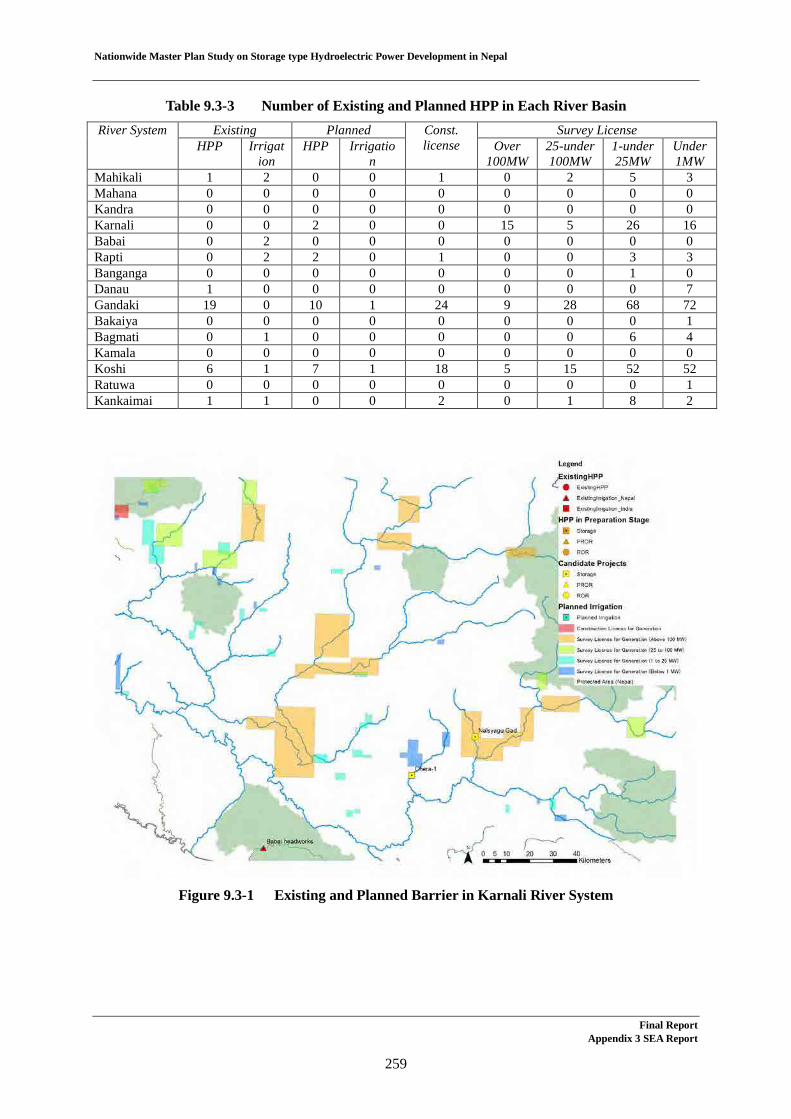
Nationwide Master Plan Study on Storage type Hydroelectric Power Development in Nepal
Table 9.3-3 Number of Existing and Planned HPP in Each River Basin
River System Existing Planned Const. license
Survey License HPP Irrigat
ion HPP Irrigatio
n Over
100MW 25-under 100MW
1-under 25MW
Under 1MW
Mahikali 1 2 0 0 1 0 2 5 3 Mahana 0 0 0 0 0 0 0 0 0 Kandra 0 0 0 0 0 0 0 0 0 Karnali 0 0 2 0 0 15 5 26 16 Babai 0 2 0 0 0 0 0 0 0 Rapti 0 2 2 0 1 0 0 3 3 Banganga 0 0 0 0 0 0 0 1 0 Danau 1 0 0 0 0 0 0 0 7 Gandaki 19 0 10 1 24 9 28 68 72 Bakaiya 0 0 0 0 0 0 0 0 1 Bagmati 0 1 0 0 0 0 0 6 4 Kamala 0 0 0 0 0 0 0 0 0 Koshi 6 1 7 1 18 5 15 52 52 Ratuwa 0 0 0 0 0 0 0 0 1 Kankaimai 1 1 0 0 2 0 1 8 2
Figure 9.3-1 Existing and Planned Barrier in Karnali River System
Final Report Appendix 3 SEA Report
259

Nationwide Master Plan Study on Storage type Hydroelectric Power Development in Nepal
Figure 9.3-2 Existing and Planned Barrier in Gandaki River System
Figure 9.3-3 Existing and Planned Barrier in Koshi River System
Final Report Appendix 3 SEA Report
260

Nationwide Master Plan Study on Storage type Hydroelectric Power Development in Nepal
(3) Space Crowning Impact on Forest Ecosystem
The impact on forest ecosystem will be accelerated by road construction together with HPP and irrigation projects. The high risk areas are the Bajhang District in the Far-Western region, Mugu District, Humla District, Kalikot District, Jajarkot District in Mid-Western region, Myagdi District, Kaski District, Lamjung District in Western region, Rasuwa District in Central region, and Solukhumbu District, Sangkhuwasabha District, Taplejung District in Eastern region. Without appropriate control, encroachment, irrigal logging, irrigal hunting, and irrigal fishing might expand around the projects concentrated area.
Figure 9.3-4 Land Use and Existing and Planned Projects (West)
Final Report Appendix 3 SEA Report
261
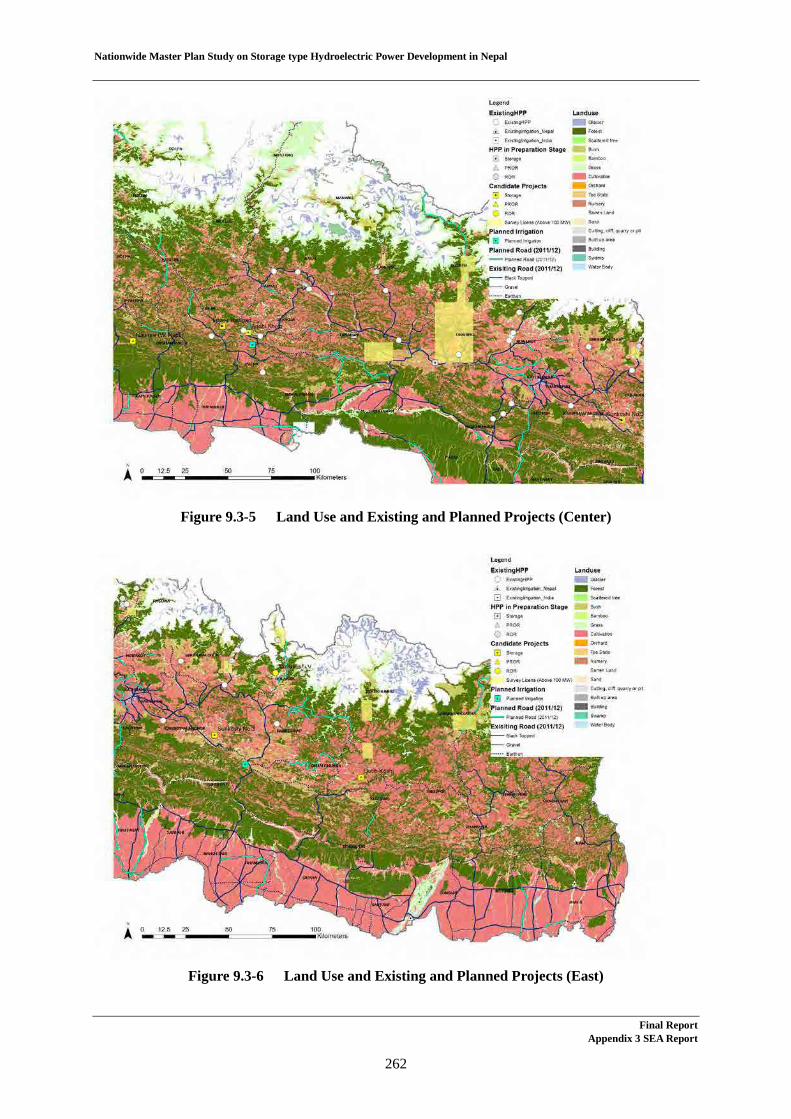
Nationwide Master Plan Study on Storage type Hydroelectric Power Development in Nepal
Figure 9.3-5 Land Use and Existing and Planned Projects (Center)
Figure 9.3-6 Land Use and Existing and Planned Projects (East)
Final Report Appendix 3 SEA Report
262
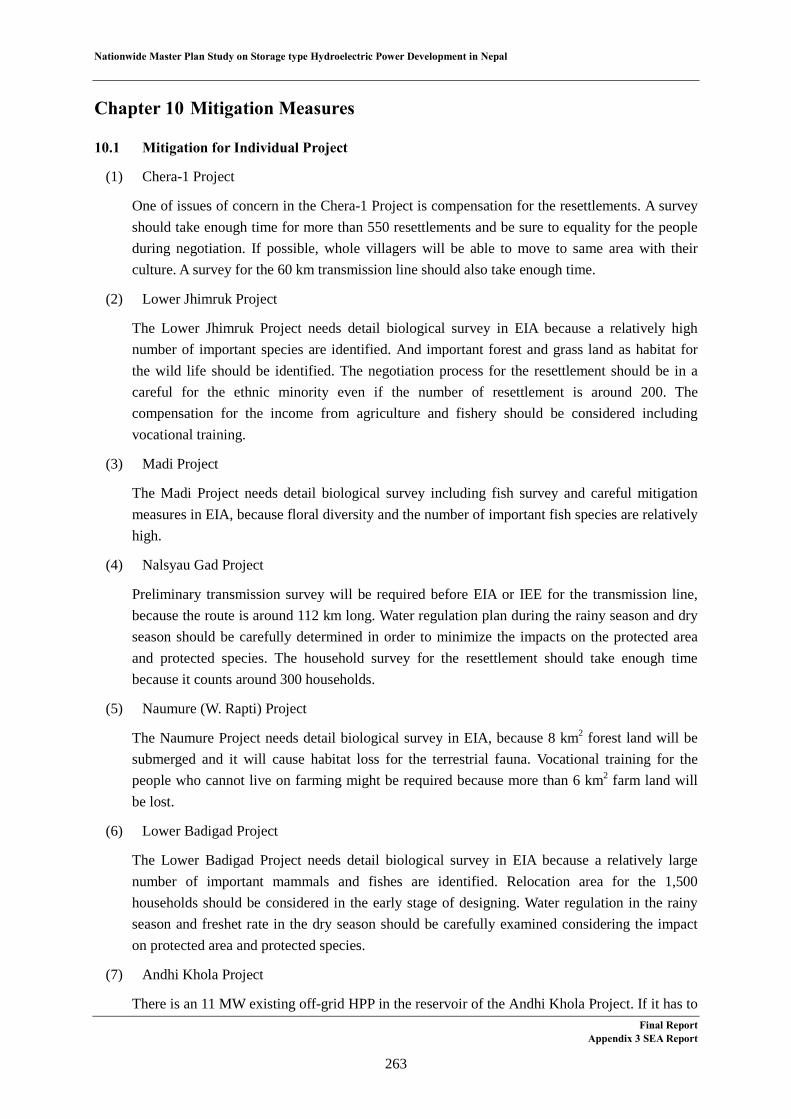
Nationwide Master Plan Study on Storage type Hydroelectric Power Development in Nepal
Chapter 10 Mitigation Measures
Mitigation for Individual Project 10.1
(1) Chera-1 Project
One of issues of concern in the Chera-1 Project is compensation for the resettlements. A survey should take enough time for more than 550 resettlements and be sure to equality for the people during negotiation. If possible, whole villagers will be able to move to same area with their culture. A survey for the 60 km transmission line should also take enough time.
(2) Lower Jhimruk Project
The Lower Jhimruk Project needs detail biological survey in EIA because a relatively high number of important species are identified. And important forest and grass land as habitat for the wild life should be identified. The negotiation process for the resettlement should be in a careful for the ethnic minority even if the number of resettlement is around 200. The compensation for the income from agriculture and fishery should be considered including vocational training.
(3) Madi Project
The Madi Project needs detail biological survey including fish survey and careful mitigation measures in EIA, because floral diversity and the number of important fish species are relatively high.
(4) Nalsyau Gad Project
Preliminary transmission survey will be required before EIA or IEE for the transmission line, because the route is around 112 km long. Water regulation plan during the rainy season and dry season should be carefully determined in order to minimize the impacts on the protected area and protected species. The household survey for the resettlement should take enough time because it counts around 300 households.
(5) Naumure (W. Rapti) Project
The Naumure Project needs detail biological survey in EIA, because 8 km2 forest land will be submerged and it will cause habitat loss for the terrestrial fauna. Vocational training for the people who cannot live on farming might be required because more than 6 km2 farm land will be lost.
(6) Lower Badigad Project
The Lower Badigad Project needs detail biological survey in EIA because a relatively large number of important mammals and fishes are identified. Relocation area for the 1,500 households should be considered in the early stage of designing. Water regulation in the rainy season and freshet rate in the dry season should be carefully examined considering the impact on protected area and protected species.
(7) Andhi Khola Project
There is an 11 MW existing off-grid HPP in the reservoir of the Andhi Khola Project. If it has to Final Report
Appendix 3 SEA Report
263
Nationwide Master Plan Study on Storage type Hydroelectric Power Development in Nepal
be stopped for the construction, alternative electricity supply to the local people should be considered. Not only provision of settlement area for more than 500 resettlements, but also some income compensation should be considered for the affected retailing store.
(8) Dudh Koshi Project
A bit wider area of mammals and birds survey will be required in order to identify the migration route in EIA study. The offset mitigation for fish should be considered at the early stage of the EIA study. The number of resettlement is low, but the farm land in the reservoir area is very fertile. It means income compensation for many farmers might be required. The existing EIA report was made based on the data of 1997 and it was not approved by the Ministry of Environment. Then EIA study should be conducted again and get certificate by the Ministry of Environment.
(9) Kokhajor-1 Project
Forest compensation should be considered carefully in EIA study. The study for resettlement should be taken care of each ethnic minority group, even if the number of resettlement is 200, which is relatively low.
(10) Sun Koshi No.3 Project
Compensation process would be critical for the Sun Koshi No.3 Project, because the number of resettlement will be more than 1,500. In addition, there are some accommodations for the tourists. The alternatives of the 15 km national highway which will be submerged in the reservoir area should be also prepared. Vocational supporting and entrepreneurial capability building might be needed for the farmers and fishermen who lose their income source.
Mitigation for Cumulative Impact 10.2
Mitigations for cumulative impact often involve a number of ministries and the mitigation that can be implemented on project-by-project basis is very few. Followings are the suggestions recommended for three impacts.
(1) Water Regulation Effects on Wetland Ecosystem
In case there are a number of projects in a same river system, the impact by water regulation will be significant even if the water regulation rate of each project is not so high. The following are some proposals to reduce even a little such effect.
1) Re-regulating Reservoir
Re-regulating reservoir is one of the solutions to average daily variation of water discharge. It will maintain downstream aquatic ecology and avoid risk to human and wildlife. But it might be another barrier for fishes and it cannot control annual variation.
Final Report Appendix 3 SEA Report
264

Nationwide Master Plan Study on Storage type Hydroelectric Power Development in Nepal
2) Coordinate Operation
Coordinated operation of several storage-type hydroelectric power plants in the same river system might be able to reduce the cumulative impact. In a place where accidents by sudden flooding are concerned, it careful control of water regulation timing and rate are recommended.
3) Strategic Watershed Development Control
Strategic watershed planning for each watershed with its conservation target is needed coordinating with the Ministry of Energy, Ministry of Irrigation, Department of Water Supply, Department of Soil Conservation and Watershed Management, Ministry of Forests and Soil Conservation and other sectors. The acceptable water regulating revel should be identified from the point of view of wildlife conservation. Then total volume control can be planned.
(2) Barrier Effects on Migration Fish
Hydropower, irrigation, and water supply will block the fish migration. Many planned barrier will accelerate higher risk. Followings are some suggested mitigations.
1) Minimizing the Number of Barrier
The fewer number of barriers are better for fishes. Even if fish ladder or other mitigations are installed, they are not perfect mitigation which restore rivers to the original condition. To minimize the number of barrier, constructing limited number of storage type HPPs seems better than the construction of many small ROR type projects.
2) Barrier Free River
Keep at least one or two tributary river corridors in each of west, center and east areas for the maintenance of the key Himalayan fish species. For example the Thuli Gad and Barun Khola in the Karnali system, the Lundri Khola in the Rapti system, the Badigad Khola and Budhi Khola in the Gandaki system might be candidate rivers. However it is recommended to identify these barrier free rivers once the fish conservation plan has been developed. This plan will be developed based on a nationwide fish census to be hereinafter described.
3) Fish Ladders and Hatchery
Fish ladders/hatchery are not perfect mitigations but it is better than doing nothing at all. Legalizing provision of fish ladders for projects with less than 30m high dams (hydropower, irrigation, or water supply projects) not only for new projects but also existing projects is recommended. Legalizing fish hatchery for delivering affected fish resources for all the projects with above 30 m high dams is also recommended. If possible, delivering fish resource system from existing and planned fish hatchery might be effective after detailed examination of the genetic lineage between the rivers.
Final Report Appendix 3 SEA Report
265
Nationwide Master Plan Study on Storage type Hydroelectric Power Development in Nepal
4) Fish Migrate-able Flashing Gate
Some new barrier will attach sediment flushing gates at the bottom to the middle level of the dam. If some additional device might be attached on the gate, fishes might be able to migrate after flushing.
5) Nationwide Fish Census
Conducting a nationwide fish census is recommended in Nepal. There is no reliable fish distribution database and it is difficult to see actual impact and effect of existing barriers. In order to identify hot spots for fish, a periodic nationwide fish census survey is highly recommended.
6) Fish Conservation Plan
Formulation of a fish conservation plan is required before Nepali fish diversity falls into critical situation. Not only the cumulative barrier effect but also invasion of exotic fishes to Nepal is anticipated. Based on the fish monitoring result, fish conservation plan should be prepared. This fish conservation plan might be useful for an appropriate watershed management. Formulating the fish conservation plan is necessary to accomplish sustainable development and the Directorate of Fisheries Development and international NGOs will take big roles for this formulation.
(3) Space Crowning Impact on Forest Ecosystem
1) Strategic Watershed Development Control
Strategic watershed development control is required before deregulated development and forest loss. Even if it is outside of the protected area, some forests used for migration corridor and some high grade ecosystem remain sometimes. Such kind of places should be identified and informed to the development department.
2) Assured Tree Planting
The forest norm in Nepal is giving options to the developer; planting trees or paying compensation fee to the Department of Forest. But sometimes, the compensation fee is not correctly used to planting trees, because of lack of planting area. In order to assure the planting trees, developer should be responsible for tree planting from start to finish.
3) Construction Road Management
Construction of road and access roads for hydropower plant might become a trigger of illegal logging. In case the roads connect to high value forests, it should be controlled carefully.
Final Report Appendix 3 SEA Report
266

Nationwide Master Plan Study on Storage type Hydroelectric Power Development in Nepal
4) Mitigation specialized organization
Installation of a mitigation organization might be useful. Many HPPs including small size will be developed in the few decades in Nepal. But it is a bit difficult to impose implementation of effective environmental mitigation on each project owner, because they are not a professional of biology. In some cases, not only the planning of mitigation measures but also monitoring and operation are not able to be expected by project owners. In order to solve these problems, establishment of organization specialized in mitigation which covers all the mitigation planning and monitoring works and which is paid by project owners is required. With this kind of organization, it can concentrate on rehabilitation of heavily damaged area effectively and efficiently.
Chapter 11 Monitoring Methods
Environmental Monitoring for Individual Project 11.1
Environmental monitoring for existing projects were planned to be conducted by the project owner and audited by Ministry of Environment, Ministry of Energy, DOED, and NEA. These monitoring plans are documented and scheduled in the EIA and EMP (Environmental Management Plan) approved by Ministry of Environment. But unfortunately the actual monitoring and audits during construction are not so fully conducted in Nepal. It is very rare to see environmental monitoring report during operation. Some new mechanisms for the compliance should be established.
Environmental Monitoring for Cumulative Impact 11.2
There is no plan for the monitoring system for cumulative impact in Nepal. But fortunately most of the main watersheds have national parks down end of the river. Then periodically monitoring system on river flow, water quality, aquatic fauna, and wetland species communicating with watershed development would be promised.
Chapter 12 Stakeholder Meeting
During the Study period, a total of three stakeholders meetings have been conducted at Kathmandu, inviting mass media, representatives of government agencies and political parties. At the second and third stakeholders meetings, holding of stakeholders meeting was informed to related districts in which promising projects are located. However, there were no participants from these districts.
In addition, interviews and hearing were conducted with a wide range of stakeholders such as the western regional office of Pokhara, ministries related to environment and forest, SEA report evaluation meeting members composed by NGOs, WWF, each related district offices and residents.
The 1st Stakeholders Meeting 12.1
On February 17, 2012, the first stakeholders meeting that was co-hosted by NEA and the Study Team
Final Report Appendix 3 SEA Report
267
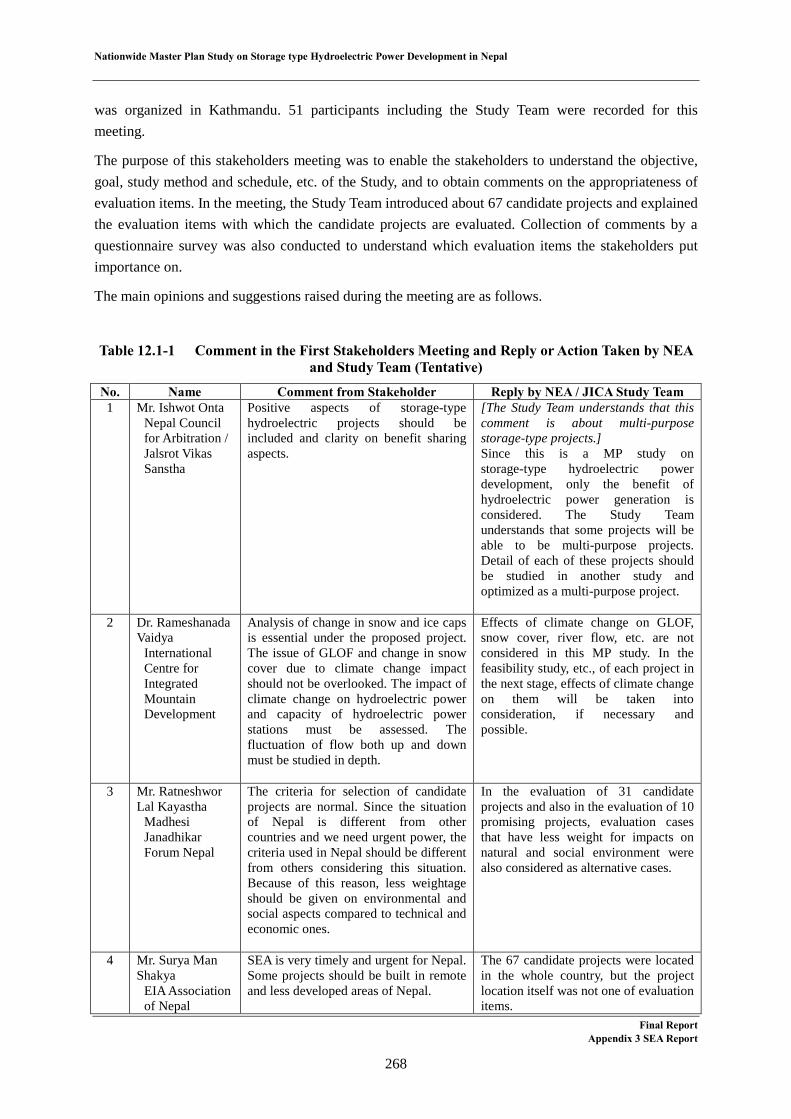
Nationwide Master Plan Study on Storage type Hydroelectric Power Development in Nepal
was organized in Kathmandu. 51 participants including the Study Team were recorded for this meeting.
The purpose of this stakeholders meeting was to enable the stakeholders to understand the objective, goal, study method and schedule, etc. of the Study, and to obtain comments on the appropriateness of evaluation items. In the meeting, the Study Team introduced about 67 candidate projects and explained the evaluation items with which the candidate projects are evaluated. Collection of comments by a questionnaire survey was also conducted to understand which evaluation items the stakeholders put importance on.
The main opinions and suggestions raised during the meeting are as follows.
Table 12.1-1 Comment in the First Stakeholders Meeting and Reply or Action Taken by NEA and Study Team (Tentative)
No. Name Comment from Stakeholder Reply by NEA / JICA Study Team 1 Mr. Ishwot Onta
Nepal Council for Arbitration / Jalsrot Vikas Sanstha
Positive aspects of storage-type hydroelectric projects should be included and clarity on benefit sharing aspects.
[The Study Team understands that this comment is about multi-purpose storage-type projects.] Since this is a MP study on storage-type hydroelectric power development, only the benefit of hydroelectric power generation is considered. The Study Team understands that some projects will be able to be multi-purpose projects. Detail of each of these projects should be studied in another study and optimized as a multi-purpose project.
2 Dr. Rameshanada Vaidya
International Centre for Integrated Mountain Development
Analysis of change in snow and ice caps is essential under the proposed project. The issue of GLOF and change in snow cover due to climate change impact should not be overlooked. The impact of climate change on hydroelectric power and capacity of hydroelectric power stations must be assessed. The fluctuation of flow both up and down must be studied in depth.
Effects of climate change on GLOF, snow cover, river flow, etc. are not considered in this MP study. In the feasibility study, etc., of each project in the next stage, effects of climate change on them will be taken into consideration, if necessary and possible.
3 Mr. Ratneshwor Lal Kayastha
Madhesi Janadhikar Forum Nepal
The criteria for selection of candidate projects are normal. Since the situation of Nepal is different from other countries and we need urgent power, the criteria used in Nepal should be different from others considering this situation. Because of this reason, less weightage should be given on environmental and social aspects compared to technical and economic ones.
In the evaluation of 31 candidate projects and also in the evaluation of 10 promising projects, evaluation cases that have less weight for impacts on natural and social environment were also considered as alternative cases.
4 Mr. Surya Man Shakya
EIA Association of Nepal
SEA is very timely and urgent for Nepal. Some projects should be built in remote and less developed areas of Nepal.
The 67 candidate projects were located in the whole country, but the project location itself was not one of evaluation items.
Final Report Appendix 3 SEA Report
268

Nationwide Master Plan Study on Storage type Hydroelectric Power Development in Nepal
No. Name Comment from Stakeholder Reply by NEA / JICA Study Team
As a result of evaluation, the locations of the ten promising projects are, one in the Eastern Region, two in the Central Region, two in the Western Region, two in both the Western and Mid-Western Regions, and three in the Mid-Western Region.
5-1 Mr. Rabin Shrestha
World Bank
The level of study in each stages varies, for example, some desk studies are more elaborative and in depth than feasibility study. So based on the level of study alone, criteria should not be fixed. The level and details of information in study are important aspect.
The level of study is used for evaluating the lead time to construction, not for evaluating the depth of study.
5-2 For different hydroelectric power projects system and operative perspectives must be taken in consideration.
[The gist of this comment is not clear.]
5-3 Export potential and power exchange between Nepal-India should also be taken for consideration.
Since the objective of this MP study is to meet the domestic demand, export to India is not considered. However, import from India is considered as one of power sources to meet the domestic demand.
5-4 Though the storage master plan is proposed, the ROR master plan is not existence and it is necessary to integrate this master plan with ROR master plan.
In this study, RORs that are under construction or that are already committed are considered as specific projects. But other RORs are not considered as specific projects like as the storage projects in this study. MP of ROR will be prepared by another study in the near future, and then that will be integrated with the results of this study.
5-5 Mr. Rabin Shrestha (cont.)
The other usage of reservoir projects like irrigation, navigation, etc., is missing in selection criteria.
The Study Team understands reservoirs are able to be used for other purposes. However, since this is a MP study on hydroelectric power generation, importance was put on power generation in the evaluation criteria. Possibility or detail of multi-purpose development of selected projects will be studied individually before the implementation of these projects, and they will be optimized as multi-purpose projects
6 Mr. Kul Man Ghising
Chilime Hydroelectric Project
Seasonal energy depends on the level of feasibility study, and plan load factor which should be taken in consideration by the Study Team for this study.
Monthly energy production was calculated, and then both the annual energy and the dry season energy were evaluated. In the demand forecast, the load factor was estimated at 52% by consultation with NEA.
Final Report Appendix 3 SEA Report
269

Nationwide Master Plan Study on Storage type Hydroelectric Power Development in Nepal
No. Name Comment from Stakeholder Reply by NEA / JICA Study Team
7 Mr. Sanjeev Raj
Rajbhandari NEA
Like master plan for storage hydroelectric projects, it is urgent to develop master plan for ROR.
[See 5-4]
8 Mr. Kiran Shrestha
Chilime Hydroelectric Project
Cumulative impact assessment is important in storage-type projects.
Cumulative impact is considered in the SEA.
9-1 Mr. Shambhu Ghimire
Ministry of Home Affairs
Safety and security are important aspects to be included in selection criteria.
Those of technical items like GLOF and geological conditions are considered in the criteria.
9-2 Projects to be completed in short time should also be taken as criteria.
Lead time to implementation or commercial operation is used as one of evaluation criteria.
The questionnaire survey was conducted on all participants about 1) criteria which were to exclude not appropriate project and to select the candidate projects and 2) the weightage of Evaluation Criteria with which candidate projects would be evaluated. Total of 32 participants answered to this questionnaire.
Regarding the criteria which were to exclude not appropriate project, the majority of respondents answered that all 7 items showed by Study Team were appropriate. In addition, impact on agriculture, on tourism and on other technical and economical criteria were suggested as criteria which should be considered.
Regarding the weightage of criteria with which candidate projects would be evaluated, the proportion between technical conditions, efficiency (economical conditions), natural environment and social environment were 38:25:16:15 respectively in response excluding NEA and the Study Team members. On the other hand, NEA assumed an appropriate proportion is as 42:23:14:16 respectively, it showed NEA put 65 % wight on technical and economical condition. The method of weightage was varied by respondents.
In response to the results described above, the Study Team decided to study about 3 cases putting different percent on technical/economical condition and natural/social environment. The sensitive analyses were conducted about the following three cases, 1) technical/economical condition: natural/social environment equal 50:50, 2) technical/economical condition: natural/social environment equal 60:40 and 3) technical/economical condition: natural/social environment equal 40:60.
Final Report Appendix 3 SEA Report
270
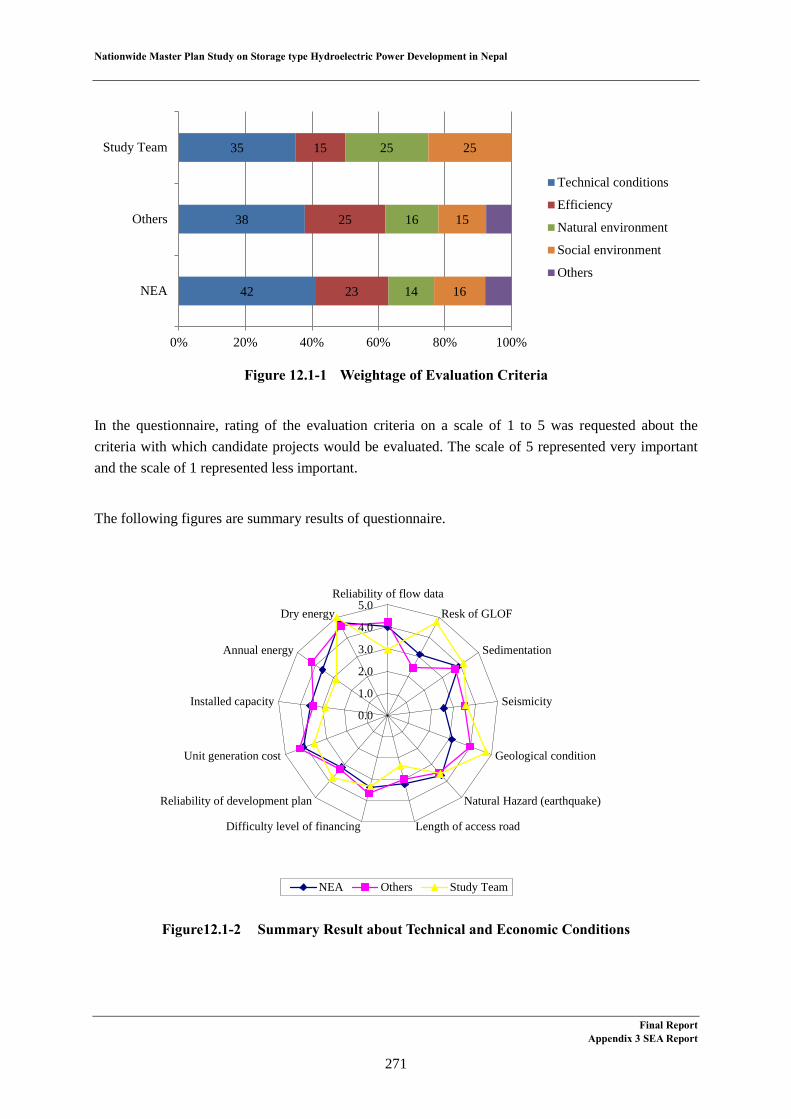
Nationwide Master Plan Study on Storage type Hydroelectric Power Development in Nepal
Figure 12.1-1 Weightage of Evaluation Criteria
In the questionnaire, rating of the evaluation criteria on a scale of 1 to 5 was requested about the criteria with which candidate projects would be evaluated. The scale of 5 represented very important and the scale of 1 represented less important.
The following figures are summary results of questionnaire.
Figure12.1-2 Summary Result about Technical and Economic Conditions
42
38
35
23
25
15
14
16
25
16
15
25
0% 20% 40% 60% 80% 100%
NEA
Others
Study Team
Technical conditions
Efficiency
Natural environment
Social environment
Others
0.0
1.0
2.0
3.0
4.0
5.0Reliability of flow data
Resk of GLOF
Sedimentation
Seismicity
Geological condition
Natural Hazard (earthquake)
Length of access roadDifficulty level of financing
Reliability of development plan
Unit generation cost
Installed capacity
Annual energy
Dry energy
NEA Others Study Team
Final Report Appendix 3 SEA Report
271
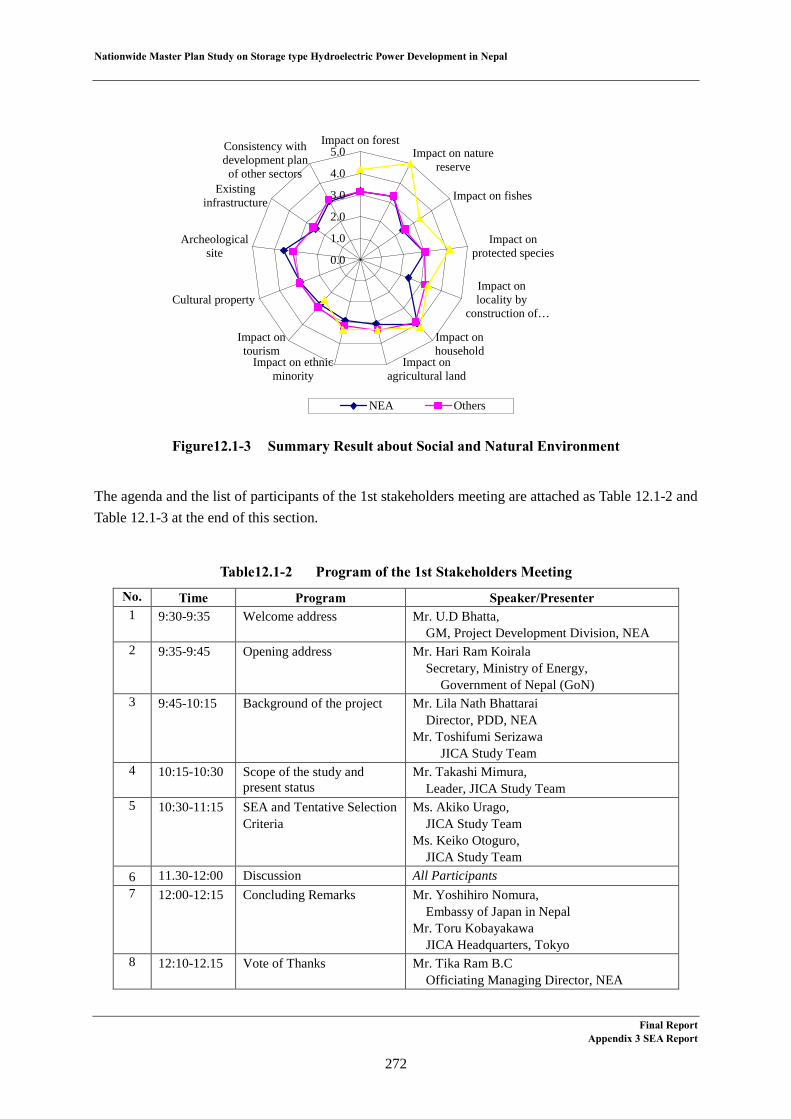
Nationwide Master Plan Study on Storage type Hydroelectric Power Development in Nepal
Figure12.1-3 Summary Result about Social and Natural Environment
The agenda and the list of participants of the 1st stakeholders meeting are attached as Table 12.1-2 and Table 12.1-3 at the end of this section.
Table12.1-2 Program of the 1st Stakeholders Meeting No. Time Program Speaker/Presenter 1 9:30-9:35
Welcome address Mr. U.D Bhatta,
GM, Project Development Division, NEA 2 9:35-9:45
Opening address Mr. Hari Ram Koirala
Secretary, Ministry of Energy, Government of Nepal (GoN)
3 9:45-10:15
Background of the project Mr. Lila Nath Bhattarai Director, PDD, NEA
Mr. Toshifumi Serizawa JICA Study Team
4 10:15-10:30
Scope of the study and present status
Mr. Takashi Mimura, Leader, JICA Study Team
5 10:30-11:15
SEA and Tentative Selection Criteria
Ms. Akiko Urago, JICA Study Team
Ms. Keiko Otoguro, JICA Study Team
6 11.30-12:00 Discussion All Participants 7 12:00-12:15
Concluding Remarks Mr. Yoshihiro Nomura,
Embassy of Japan in Nepal Mr. Toru Kobayakawa
JICA Headquarters, Tokyo 8 12:10-12.15
Vote of Thanks Mr. Tika Ram B.C
Officiating Managing Director, NEA
0.0
1.0
2.0
3.0
4.0
5.0Impact on forest
Impact on naturereserve
Impact on fishes
Impact onprotected species
Impact onlocality by
construction of…
Impact onhousehold
Impact onagricultural land
Impact on ethnicminority
Impact ontourism
Cultural property
Archeologicalsite
Existinginfrastructure
Consistency withdevelopment planof other sectors
NEA Others
Final Report Appendix 3 SEA Report
272
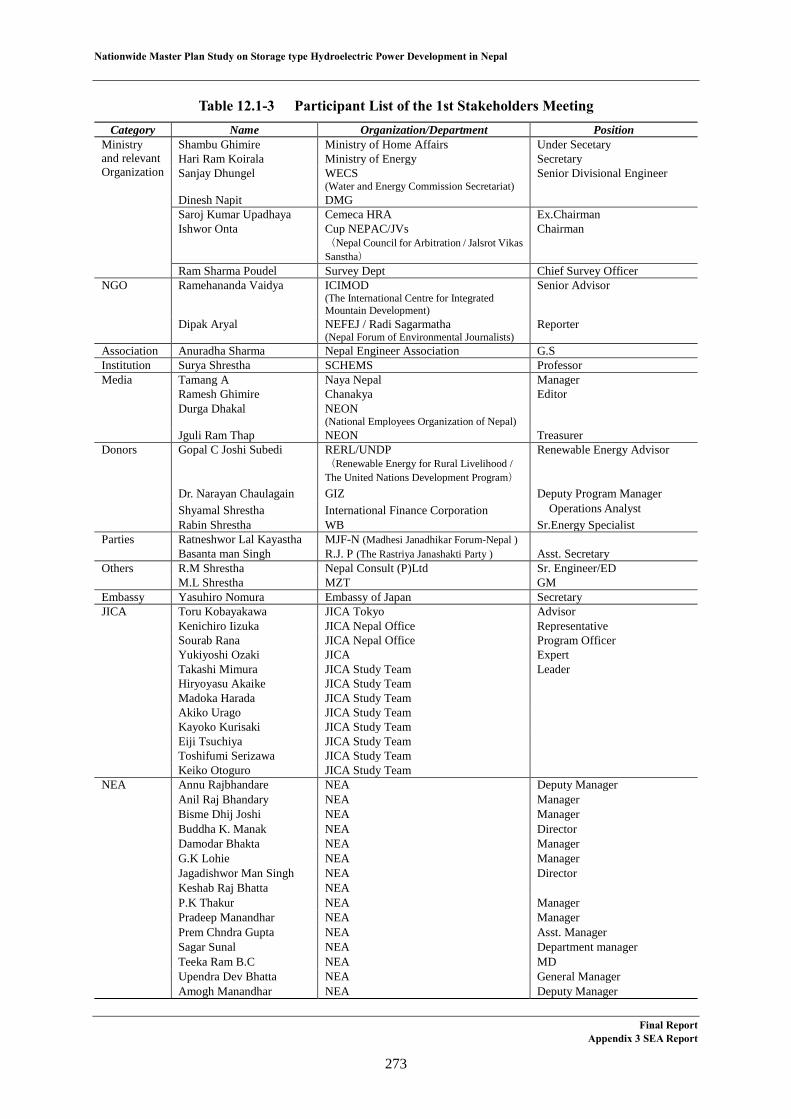
Nationwide Master Plan Study on Storage type Hydroelectric Power Development in Nepal
Table 12.1-3 Participant List of the 1st Stakeholders Meeting
Category Name Organization/Department Position Ministry and relevant Organization
Shambu Ghimire Ministry of Home Affairs Under Secetary Hari Ram Koirala Ministry of Energy Secretary Sanjay Dhungel WECS
(Water and Energy Commission Secretariat) Senior Divisional Engineer
Dinesh Napit DMG Saroj Kumar Upadhaya Cemeca HRA Ex.Chairman Ishwor Onta Cup NEPAC/JVs
(Nepal Council for Arbitration / Jalsrot Vikas Sanstha)
Chairman
Ram Sharma Poudel Survey Dept Chief Survey Officer NGO Ramehananda Vaidya ICIMOD
(The International Centre for Integrated Mountain Development)
Senior Advisor
Dipak Aryal NEFEJ / Radi Sagarmatha (Nepal Forum of Environmental Journalists)
Reporter
Association Anuradha Sharma Nepal Engineer Association G.S Institution Surya Shrestha SCHEMS Professor Media Tamang A Naya Nepal Manager
Ramesh Ghimire Chanakya Editor Durga Dhakal NEON
(National Employees Organization of Nepal)
Jguli Ram Thap NEON Treasurer Donors Gopal C Joshi Subedi RERL/UNDP
(Renewable Energy for Rural Livelihood / The United Nations Development Program)
Renewable Energy Advisor
Dr. Narayan Chaulagain GIZ Deputy Program Manager Shyamal Shrestha International Finance Corporation Operations Analyst Rabin Shrestha WB Sr.Energy Specialist
Parties Ratneshwor Lal Kayastha MJF-N (Madhesi Janadhikar Forum-Nepal ) Basanta man Singh R.J. P (The Rastriya Janashakti Party ) Asst. Secretary
Others R.M Shrestha Nepal Consult (P)Ltd Sr. Engineer/ED M.L Shrestha MZT GM
Embassy Yasuhiro Nomura Embassy of Japan Secretary JICA Toru Kobayakawa JICA Tokyo Advisor
Kenichiro Iizuka JICA Nepal Office Representative Sourab Rana JICA Nepal Office Program Officer Yukiyoshi Ozaki JICA Expert Takashi Mimura JICA Study Team Leader Hiryoyasu Akaike JICA Study Team Madoka Harada JICA Study Team Akiko Urago JICA Study Team Kayoko Kurisaki JICA Study Team Eiji Tsuchiya JICA Study Team Toshifumi Serizawa JICA Study Team Keiko Otoguro JICA Study Team
NEA Annu Rajbhandare NEA Deputy Manager Anil Raj Bhandary NEA Manager Bisme Dhij Joshi NEA Manager Buddha K. Manak NEA Director Damodar Bhakta NEA Manager G.K Lohie NEA Manager Jagadishwor Man Singh NEA Director Keshab Raj Bhatta NEA P.K Thakur NEA Manager Pradeep Manandhar NEA Manager Prem Chndra Gupta NEA Asst. Manager Sagar Sunal NEA Department manager Teeka Ram B.C NEA MD Upendra Dev Bhatta NEA General Manager Amogh Manandhar NEA Deputy Manager
Final Report Appendix 3 SEA Report
273

Nationwide Master Plan Study on Storage type Hydroelectric Power Development in Nepal
The 2nd Stakeholders Meeting 12.2
On November 28, 2012, the second stakeholders meeting that was co-hosted by NEA and the Study Team was organized in Kathmandu. 83 participants including the Study Team were recorded for this meeting.
In this second stakeholders meeting, the process of selecting 10 promising projects among the above 67 candidate projects and its results were explained. Preliminary reports of site survey of these 10 promising projects, draft of evaluation method of these projects were also explained. In the meeting, hearing and collecting the comments to understand the stakeholders’ opinions about the evaluation items with which promising projects are evaluated.
The main opinions and suggestions raised during the meeting were as follows.
Table 12.2-1 Comment in the Second Stakeholders Meeting and Reply or Action Taken by NEA and Study Team (Tentative)
No. Name Comment Reply or action by NEA / JICA Study Team 1-1 Mr. S. Lacoul
Ministry of Energy
How are the selected 67 projects justified? Are they from master plan studies of Koshi/Gandaki/Karnali-Mahakali basis? There seems to be additional projects as well. Are there any projects conflict with these master plan studies and/or conflict with the licensed projects?
The 65 projects were selected by NEA and two projects were added later. These MP studies in the past are some of sources. Some projects had conflicted with licensed projects, but they were excluded from this study.
1-2 Other uses of regulated flow from reservoir have been ignored. But on the other hand, minor impacts such as fishery/tourism have been considered. Why major use such as irrigation has been ignored? In case of the Dudh Koshi and the Naumure Projects, irrigation use may be determining factor for implement ability of the project.
The Study Team understands reservoirs are able to be used for other purposes. However, in addition to that this is the MP study on hydroelectric power generation, it is not easy to evaluate each project quantitatively by the total benefits of power generation and other uses in the MP stage because it requires a lot of data and information. Accordingly, the benefit of promising projects were evaluated based on only hydroelectric power generation. Possibility (or detail) of multi-purpose development of these projects will be studied individually by another study before implementation of these projects.
1-3 The proposed alternative of Dudh Koshi by-passes Sun Koshi-Kamala diversion. So this alternative may not be acceptable form the point of view of irrigation because the irrigation use is very critical in these sites.
This alternative was selected from the viewpoint of power generation. Another alternative does not conflict with irrigation purpose, but its output is smaller. Coordination between power generation and irrigation should be necessary in the early stage to implement this project.
1-4 Regional balance (in national development) has not been considered. No reservoir projects
The 67 candidate projects were located in the whole country, but the project location itself was not one of evaluation items.
Final Report Appendix 3 SEA Report
274
Nationwide Master Plan Study on Storage type Hydroelectric Power Development in Nepal
No. Name Comment Reply or action by NEA / JICA Study Team
in mid-western and far western region even by 2033.
As a result of evaluation, the locations of the ten promising projects are, one in the Eastern Region, two in the Central Region, two in the Western Region, two in both the Western and Mid-Western Regions, and three in the Mid-Western Region.
2 Mr. Sanjib Man Rajbhandari
NEA
It is important to include the watershed condition in the evaluation criteria since we are talking about the storage project. Individual ideas may be implemented but may not represent the overall watershed condition.
There are many items that form the watershed condition. In the evaluation of promising projects, the impact on rare species and protected area in the downstream were evaluated. They are part of consideration of the watershed condition.
3 Mr. Dilip K .Sadaula
Dept. of Forest and Soil Conservation
The study of watershed U/S of storage project is important and should be included in the evaluation criteria.
Effects of U/S watershed to the project like GLOF and sedimentation were included in the evaluation criteria.
4-1 Mr. Barna Bahadur Thapa
Dept. of National Parks and Wildlife Conservation
No PAS one inside 10 Pas. There is no impact.
[The gist of the comment is not clear.]
4-2 What types of method do you use to take data around conservation area?
Data and information on National Parks, Important Birds Areas (IBA), Key Biodiversity Areas (KBA), etc. were obtained from published documents including websites.
4-3 Monitoring is important during construction and operation phases.
[Since this is common knowledge, It is not necessary to respond to this comment.]
5-1 Mr. Jayandra Tamrakar
NEA
Seismicity and thrust/fault are interrelated. Therefore these can be taken as a single criterion.
Both the items are used for evaluating the effect of earthquake. Seismicity is evaluated by a matrix of area and seismic acceleration shown in the earthquake hazard map. Trust/fault is evaluated by the proximity to the location of project. In this study, the effect of earthquake is evaluated by these two criteria.
5-2 However, the proximity to the active regional and local faults is important. Make a classification range by project location from the point of view of distance from active faults, e.g., less than 5 km, 5-10 km, 10-15 km, etc., and give the weightage accordingly to these classification ranges.
The proximity to regional active faults were evaluated by classifying it into 4 classes, they are less than 1.6 km, 1.6 to 3.2 km, 3.2 km to 12.8 km, and more than 12.8 km. Regarding local active faults, the proximity was classified into 2 classes, they are less than 100 m and less than 1 km, then deduced points from the evaluation score.
5-3 Presence of calcareous rocks like limestone around the reservoir area should be considered. It can cause leakage from the reservoir.
Karstified calcareous rocks are permeable and cause leakage of reservoir water through reservoir area or dam site. In geotechnical evaluation of the 10 promising projects, water tightness was adopted as one of evaluation items for reservoir area and dam site. In
Final Report Appendix 3 SEA Report
275
Nationwide Master Plan Study on Storage type Hydroelectric Power Development in Nepal
No. Name Comment Reply or action by NEA / JICA Study Team
evaluation of water tightness, distribution and feature of calcareous rocks are so important that they were investigated by field survey. When presence of calcareous rocks is confirmed, evaluation of water tightness was decreased except in case they are distributed in limited area and not karstified.
5-4 Has distribution of landslide in the catchment area been considered? This can cause serious impact on the reservoir capacity.
Distribution of landslide in the catchment area was not considered in the evaluation. This should be studied in the next stage.
6-1 Mr. Rabin Shrestha
World Bank
The 10 promising projects should not be prioritizing problem in prioritize, but give an impression of good and bad.
Not only the ranking of projects themselves, but details of evaluation result of each evaluation item were described in the (draft) final report for all promising projects.
6-2 In these 10 projects, identify problem areas based on complexity in geology.
A project area is composed of sites such as reservoir, dam, headrace tunnel and power house. Important physical characteristics for those sites are water tightness and slope stability, etc., which are affected by geology such as faults, calcareous rocks. In the evaluation of the promising projects, each site was evaluated by selected physical characteristics. Problem areas based on complexity in geology mean potentially problem areas. These areas correspond to sites of low evaluation in this study. Physical characteristics of low evaluation indicate the kind of problems and geology to be studied in later stages.
6-3 Identify risk free projects and seek financial commitments.
The purpose of this evaluation is to identify projects with small risk. Seeking financial commitments is in the future stage of each project.
6-4 Order of development would create confusion.
[Since this is common issue in the implementation of projects of this kind, it is not necessary to respond to this comment.]
6-5 Financial plan of NEA in future revenue requirement.
[Since this is out of scope of this Study, it is not necessary to respond to this comment.]
7 Mr. Gyanendra Prasad Kayastha
NEA
On the screening criteria of exclusive of storage projects, the rating of sediment load must be mentioned and it should be one of the criteria to reject projects if annual sediment load exceeds the value of middle mountain and high mountain.
[Definitions of “middle mountain” and “high mountain” are not clear.] The effect of sediment load should be evaluated by the lime of reservoir, not by the (rate of) sediment load itself. In the screening stage of this study, the life of reservoir was not considered, but in the evaluation of candidate project, it was one of evaluation items.
8 Mr. Sitaram Thapa
National
Why the regulated water is not mentioned on evaluation items for project selection?
[Does “regulated water” mean the effects (both positive and negative) on the downstream area by regulating river flow, like
Final Report Appendix 3 SEA Report
276
Nationwide Master Plan Study on Storage type Hydroelectric Power Development in Nepal
No. Name Comment Reply or action by NEA / JICA Study Team
Employees Organization of NEA
effect on irrigation system and hydroelectric power stations (both existing and planned), on fishery, and other natural/social conditions?] Effects of regulated water on the downstream area should be considered when a storage-type project is implemented. However, since a variety of data/information is required to evaluate these effects quantitatively, it is not easy to evaluate these effects in the MP stage in which a lot of projects have to be evaluated to select promising projects. Accordingly, these effects were not considered in this MP study. In the next stage, in the FS study of each project for example, the effects of regulated water should be studied quantitatively in some degree, and the project will be optimized including the effects on the downstream area.
9-1 Mr. Jayandra Shrestha
NEA
Why regulating capacity of Naumure as 590 is taken as evaluation criteria for screening for storage project? River discharge is more than 1210 in dry season. Does not this mean against one basic purpose of storage project is making energy in dry season. The regulating capacity of 590 is less than river discharge and there is very few meaning as storage project.
[The unit of these two values is not clear. Is it MCM?] According to the result of our study, the effective storage capacity is 580 MCM and the annual inflow is 4,400 MCM, so the regulating capacity factor is 13%. The inflow for the four months (from mid-Dec. to mid-Apr. or from Paush to Chaitra) in the dry season is about 330 MCM.
9-2 Should not one legally of T/L be considered as one of the important evaluation items, considering its availability is importance.
[The gist of this comment is not clear.]
9-3 What is the purpose of considering three cases? How these case studies influence on selection or rating of projects?
There is no weight distribution which all people agree on. Accordingly, a technically oriented case and an environmentally oriented case were also considered. As a result, there was some difference in ranking but the effect was small for this degree of difference in weight distribution.
9-4 How the rating and weight are taken or determined in evaluation frame work?
[The gist of this comment is not clear.] The evaluation items and their weight were determined by discussion in the Study Team and with NEA by reference to those in the other studied in the pars.
9-5 It is suggested to have summary of socio economic parameters along with technical parameters.
[What do “summary of socio economic parameters” and “summary of technical economic parameters” mean?]
9-6 Construction period is also estimated the time of completion period for decision making.
[The gist of this comment is not clear.] In the selection of promising project, construction period is not considered. In the
Final Report Appendix 3 SEA Report
277

Nationwide Master Plan Study on Storage type Hydroelectric Power Development in Nepal
No. Name Comment Reply or action by NEA / JICA Study Team
evaluation of promising, however, the construction period of each project was estimated and used for estimation of lead time. Since time for decision making is required for all projects, it is not considered in the evaluation criteria.
The Study Team collected stakeholders’ opinions conducting a questionnaire survey. 45 participants answered to this questionnaire. According to its result, more than 75% of respondents confirmed that the evaluation criteria presented by the Study Team were appropriate.
In the questionnaire, rating of the evaluation criteria on a scale of 1 to 5 was also requested. The scale of 5 represented very important and the scale of 1 represented less important. In response to the results of the questionnaire, the rating was reviewed in the Study.
The following figures are summary results of rating.
Figure 12.2-1 Summary Result of Hydrology Rating
4 4
4 5 4 4
5 5
5
0
1
2
3
4
5
6
Flow data GLOF Sedimentation
Hydrology Rating
Original Questionnae result Revised
Final Report Appendix 3 SEA Report
278

Nationwide Master Plan Study on Storage type Hydroelectric Power Development in Nepal
Figure12.2-2 Summary Result of Geology Rating
Figure 12.2-3 Summary Result of Effectiveness Rating
3
6
3 4 4
4 3
6
3
01234567
Sesmicity Geological condition Thrust and fault
Geology Rating
Original Questionnae result Revised
3 3
1
6
5 4 4
5
3 3
1
6
0
1
2
3
4
5
6
Unit generation cost Installed capacity Annual energyproduction
Dry Season Energypro.
Effectiveness Rating
Original Questionnae result Revised
Final Report Appendix 3 SEA Report
279
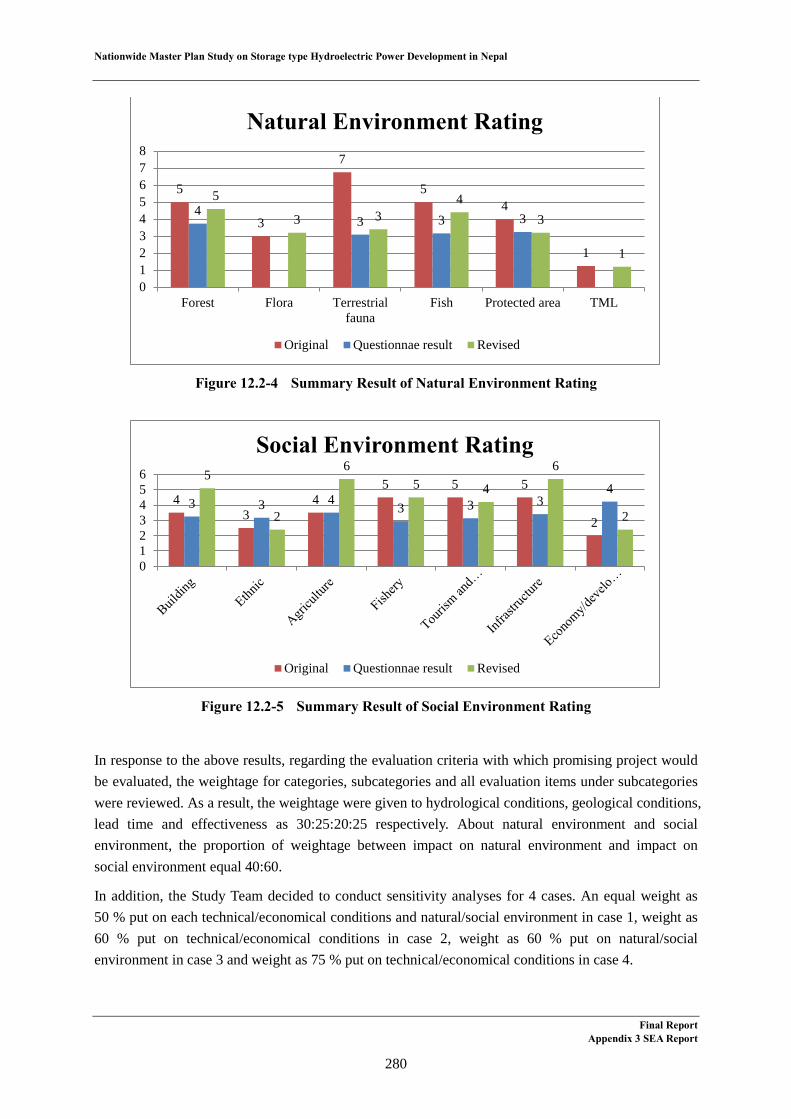
Nationwide Master Plan Study on Storage type Hydroelectric Power Development in Nepal
Figure 12.2-4 Summary Result of Natural Environment Rating
Figure 12.2-5 Summary Result of Social Environment Rating
In response to the above results, regarding the evaluation criteria with which promising project would be evaluated, the weightage for categories, subcategories and all evaluation items under subcategories were reviewed. As a result, the weightage were given to hydrological conditions, geological conditions, lead time and effectiveness as 30:25:20:25 respectively. About natural environment and social environment, the proportion of weightage between impact on natural environment and impact on social environment equal 40:60.
In addition, the Study Team decided to conduct sensitivity analyses for 4 cases. An equal weight as 50 % put on each technical/economical conditions and natural/social environment in case 1, weight as 60 % put on technical/economical conditions in case 2, weight as 60 % put on natural/social environment in case 3 and weight as 75 % put on technical/economical conditions in case 4.
5
3
7
5 4
1
4 3 3 3
5
3 3 4
3
1
012345678
Forest Flora Terrestrialfauna
Fish Protected area TML
Natural Environment Rating
Original Questionnae result Revised
4 3
4 5 5 5
2 3 3 4 3 3 3
4 5
2
6 5 4
6
2
0123456
Social Environment Rating
Original Questionnae result Revised
Final Report Appendix 3 SEA Report
280

Nationwide Master Plan Study on Storage type Hydroelectric Power Development in Nepal
Figure 12.2-6 Cases of Sensitive Analysis
The agenda and the list of participants of the 2nd stakeholders meeting are attached as Table 12.2-2 and Table 12.2-3 at the end of this section.
Table12.2-2 Program of the 2nd Stakeholders Meeting
No. Time Program Speaker/Presenter 1 9:30-9:35 Welcome address Mr. LilaNath Bhattarai
Director, NEA 2 9:35-9:40 Opening address Mr. Hari Ram Koirala
Chief Guest 3 9:40-9:55 Background of the project Mr. Sunil Kumar Dhungel
Project Development Division, NEA 4 9:55-10:15 Evaluation of potential
projects and selection of promising projects
Mr. Takashi Mimura JICA Study Team
5 10:15-10:55 Report on site survey at 10 promising projects
Mr. Hiroyasu Akaike, Mr. Nobuo Hoshino, and Ms. Akiko Urago
JICA Study Team 6 11:10-11:30 Assigning weightage of 10
promising projects Ms. Keiko Otoguro
JICA Study Team 7 11:30-12:00 Discussion All Participants 8 12:00-12:20 Concluding Remarks Mr. Hisashi Hoshino,
First Secretary, Embassy of Japan in Nepal Mr. Mitsuyoshi Kawasaki,
Chief Representative, JICA in Nepal 9 12.30-12.40 Vote of Thanks Mr. U.D. Bhatta,
GM, NEA
22.5
18.0
12.0
15.0
12.5
18.8
15.0
10.0
12.5
12.5
15.0
12.0
8.0
10.0
12.5
18.8
15.0
10.0
12.5
12.5
10.0
16.0
24.0
20.0
25.0
15.0
24.0
36.0
30.0
25.0
0% 10% 20% 30% 40% 50% 60% 70% 80% 90% 100%
Economy Heigh Weight(Case 4)
Economy Weight(Case 2)
Environmental Weight(Case 3)
Even weight(Case 1)
Original
Hydrology Geology Lead Time
Effectiveness Natural Environment Social Environment
Final Report Appendix 3 SEA Report
281

Nationwide Master Plan Study on Storage type Hydroelectric Power Development in Nepal
Table 12.2-3 Participant List of the 2nd Stakeholders Meeting
Category Name Organization/Department Position Ministry and relevant Organization
Hari Ram Koirala Ministry of Energy Secretary Moti B. Kunwar Ministry of Energy Joint. Secretary Srirajan Lamsal Ministry of Science, Technology and
Environment Asst. Secretary
Purna Ghimire Ministry of Defense Section Officer Jaya Kumar Katuwal Ministry of Local Development Account Officer
Saroj Kumar Uphadya Nepal Engineering Council Vice Chairman Dhanbir Yadav Department of Hydrology and
Meteorology Engineer
Anupa Upadhya Department of Electricity Development (DoED)
Director General
Barna Bahadur Thapa Department of National Park and Wildlife Conservation (DNPWC)
Under Secretory
Dilip Sadank Department of Soil Conservation and Watershed Management
SDEG
Krishna Bahadur Katwal Department of Local Infrastructure Development and Agriculture Roads
Engineer
Damodar Bhakta Trisuli 3B HEP Project Manager Shailendra Lal N/A Deputy Manager INGO Ramesh Adhikari World Wildlife Fund, Nepal PO Association Rohini Paudel Nepal Engineering Association Member Institutions Surya Man Shakya
School of Environmental Management and Sustainable Development (SchEMS)
Director
Media Dhurba Basnet NEFEJ (Nepal Forum of Environmental Journalist)
GS
Ashok Thapa The Kathmandu Post (newspaper) Sub – Editor Pitamber Sigdel Annapurna Post (newspaper) Sr Reporter Sitaram Bilashi Gorkhapatra Reporter Donors Dr. Narayan Chaulagain GIZ Deputy Program Manager Rabin Shrestha World Bank Sr. Energy Sp Shyamal Shrestha International Finance Corporation Operations Analyst Parties Basant Man Singh Adhikari Rastriya Janasakti Party (R.J.P.) Central committee member Others Ram Kumar Sharma Nepal Environmenal and Scientific
Services Socio Economist
Embassy Hisashi Hoshino Embassy of Japan First Secretary Kailash Man Pradhan Embassy of Japan Program Manager JICA Kenichiro Iizuka JICA Nepal Office Representative Sourab Rana JICA Nepal Office Program Officer Yukiyoshi Ozaki JICA Expert Takashi Mimura JICA Study Team Leader Hiroyasu Akaike JICA Study Team Nobuo Hoshino JICA Study Team Akiko Urago JICA Study Team Takatsugu Okabe JICA Study Team Toshifumi Serizawa JICA Study Team Keiko OTOGURO JICA Study Team NEA Biswa Dhoj Joshi NEA Manager Sunil Kumar Dhungel NEA Director Upendra Dev Bhatta NEA General Manager Rita Duwal NEA Civil Engineer Indra Prasad Neupane NEA Sr. Vice President Sagar Suwal NEA Dept. Manager Gyanendra P Kyastha NEA Manager Khagendra Shahi NEA Lila Nath Bhattarai NEA Director Hara Hansha Bajracharya NEA Asst. Manager D. S. Paudel NEA Director Birendra K. Pathak NEA General Manager Jayendra Shrestha NEA Director Pradeep Thike NEA Manager
Final Report Appendix 3 SEA Report
282

Nationwide Master Plan Study on Storage type Hydroelectric Power Development in Nepal
Category Name Organization/Department Position
Rajeev Sharma NEA Director Bipnnanda Bijracharya NEA D. Manager Nireshwor Prasai NEA Dept. Manager Jagadishwor M Singh NEA Director Mahesh M. Shrestha NEA Deputy. Director Jayandra Man Tamrakar NEA Manager Uttam Amatya NEA, Manager Shanti Laxmi Shakya NEA Act. Director Amogh Manandhar NEA Dep. Manager Mohan Raj Panta NEA BOD Bhupendra Raj Gorkhali NEA Deputy Manager G. K. Lohia NEA Manager Tika Ram Paudel NEA Asst. Manager Keshab Raj Bhatta NEA Asst. General Manager Bishnu Malla NEA D. Manager Manju Lal Shrestha NEA Asst. Engineer Ishwori Prasad Khatiwoda NEA Act. DMD Gosai K. C. NEA Director Anil Rajbhandari NEA Manager Govind Raj Khanal NEA Director Mohan Shakya NEA/ESSD
(Environmental and Social Studies Department)
Director
Raju Gyawali NEA/ ESSD Env. Specialist Lakshman Jha NEA/PDD
(Project Development Department) Deputy Manager
Ram Hari Gautam NEA/ PDD A.C. Officer Janak Mahat Chhetri NEA/PDD Asst. Admin Officer Ram Kumar Thebe NEA /Employee Union Vice President Rudra Bdr. Adhikari NEA/Engineering Services Assistant Director Durga Prasad Dhakal NEA/Nepal Rastriya Karmachari
Sangathan,
Sitaram Thapa NEA /Nation Employee Organization Chairman
The 2nd Stakeholders Meeting received press coverage at least by 8 different newspapers in the next day of the Meeting. The following is one example of the press release in English-language newspaper.
Final Report Appendix 3 SEA Report
283

Nationwide Master Plan Study on Storage type Hydroelectric Power Development in Nepal
Figure 12.2-7 Example of Press Release about 2nd Stakeholders Meeting
The 3rd Stakeholders Meeting 12.3
The Study team conducted the evaluation about the 10 promising project taking into consideration the comments raised in the 2nd stakeholders meeting and the result of site survey. With the purpose to sharing the results of the Study and the evaluation of 10 promising projects,
On February 13, 2013, the third stakeholders meeting that was co-hosted by NEA and the Study Team was held in Kathmandu. 107 participants including the Study Team were recorded for this meeting.
In this meeting, the result of power demand forecast and the evaluation results of promising projects taking into account the comments collected in the 2nd stakeholders meeting were explained. The opinions were collected from stakeholders about the points which should be carefully noted for making the master plan of storage type hydroelectric power development.
The main opinions and suggestions raised during the meeting were as follows.
Final Report Appendix 3 SEA Report
284
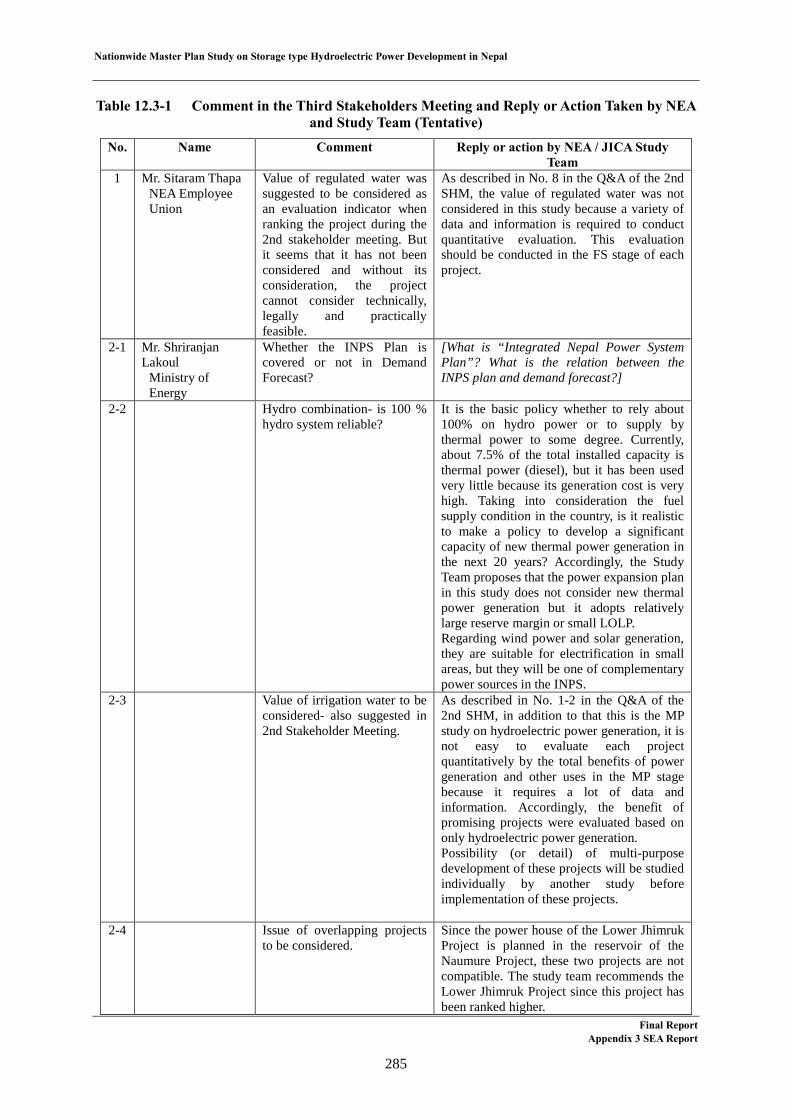
Nationwide Master Plan Study on Storage type Hydroelectric Power Development in Nepal
Table 12.3-1 Comment in the Third Stakeholders Meeting and Reply or Action Taken by NEA
and Study Team (Tentative) No. Name Comment Reply or action by NEA / JICA Study
Team 1 Mr. Sitaram Thapa
NEA Employee Union
Value of regulated water was suggested to be considered as an evaluation indicator when ranking the project during the 2nd stakeholder meeting. But it seems that it has not been considered and without its consideration, the project cannot consider technically, legally and practically feasible.
As described in No. 8 in the Q&A of the 2nd SHM, the value of regulated water was not considered in this study because a variety of data and information is required to conduct quantitative evaluation. This evaluation should be conducted in the FS stage of each project.
2-1 Mr. Shriranjan Lakoul
Ministry of Energy
Whether the INPS Plan is covered or not in Demand Forecast?
[What is “Integrated Nepal Power System Plan”? What is the relation between the INPS plan and demand forecast?]
2-2 Hydro combination- is 100 % hydro system reliable?
It is the basic policy whether to rely about 100% on hydro power or to supply by thermal power to some degree. Currently, about 7.5% of the total installed capacity is thermal power (diesel), but it has been used very little because its generation cost is very high. Taking into consideration the fuel supply condition in the country, is it realistic to make a policy to develop a significant capacity of new thermal power generation in the next 20 years? Accordingly, the Study Team proposes that the power expansion plan in this study does not consider new thermal power generation but it adopts relatively large reserve margin or small LOLP. Regarding wind power and solar generation, they are suitable for electrification in small areas, but they will be one of complementary power sources in the INPS.
2-3 Value of irrigation water to be considered- also suggested in 2nd Stakeholder Meeting.
As described in No. 1-2 in the Q&A of the 2nd SHM, in addition to that this is the MP study on hydroelectric power generation, it is not easy to evaluate each project quantitatively by the total benefits of power generation and other uses in the MP stage because it requires a lot of data and information. Accordingly, the benefit of promising projects were evaluated based on only hydroelectric power generation. Possibility (or detail) of multi-purpose development of these projects will be studied individually by another study before implementation of these projects.
2-4 Issue of overlapping projects to be considered.
Since the power house of the Lower Jhimruk Project is planned in the reservoir of the Naumure Project, these two projects are not compatible. The study team recommends the Lower Jhimruk Project since this project has been ranked higher.
Final Report Appendix 3 SEA Report
285
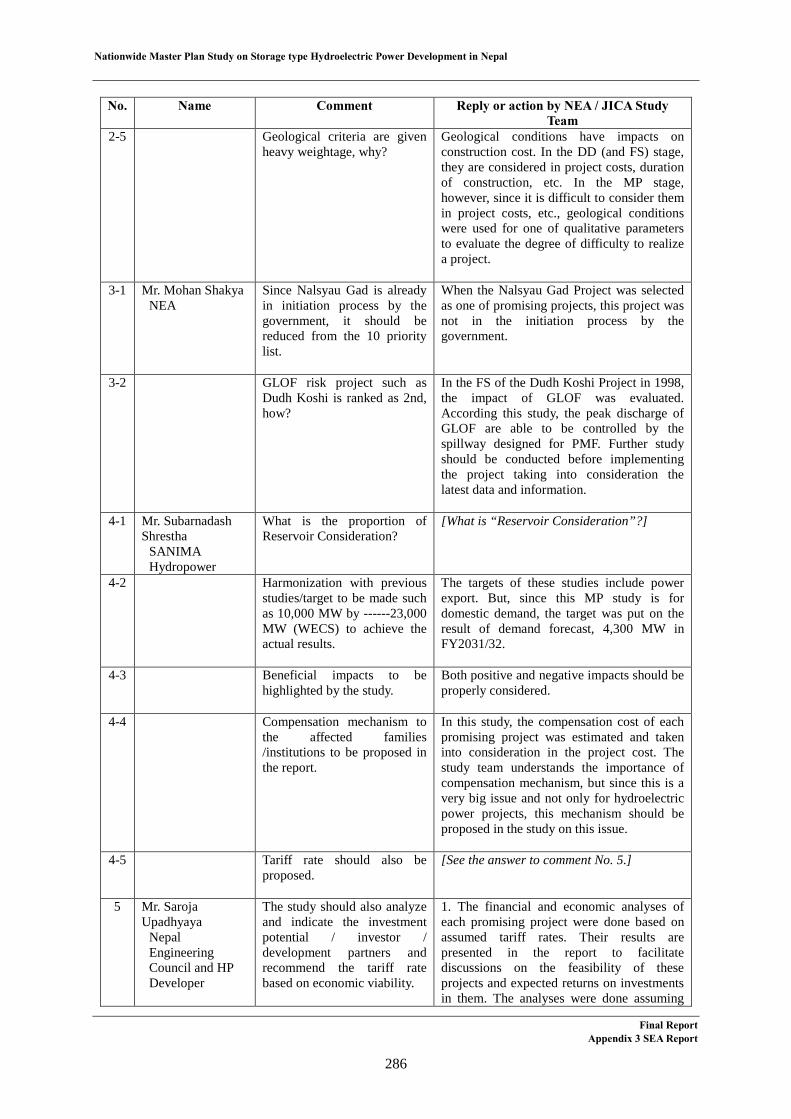
Nationwide Master Plan Study on Storage type Hydroelectric Power Development in Nepal
No. Name Comment Reply or action by NEA / JICA Study
Team 2-5 Geological criteria are given
heavy weightage, why? Geological conditions have impacts on construction cost. In the DD (and FS) stage, they are considered in project costs, duration of construction, etc. In the MP stage, however, since it is difficult to consider them in project costs, etc., geological conditions were used for one of qualitative parameters to evaluate the degree of difficulty to realize a project.
3-1 Mr. Mohan Shakya NEA
Since Nalsyau Gad is already in initiation process by the government, it should be reduced from the 10 priority list.
When the Nalsyau Gad Project was selected as one of promising projects, this project was not in the initiation process by the government.
3-2 GLOF risk project such as Dudh Koshi is ranked as 2nd, how?
In the FS of the Dudh Koshi Project in 1998, the impact of GLOF was evaluated. According this study, the peak discharge of GLOF are able to be controlled by the spillway designed for PMF. Further study should be conducted before implementing the project taking into consideration the latest data and information.
4-1 Mr. Subarnadash Shrestha
SANIMA Hydropower
What is the proportion of Reservoir Consideration?
[What is “Reservoir Consideration”?]
4-2 Harmonization with previous studies/target to be made such as 10,000 MW by ------23,000 MW (WECS) to achieve the actual results.
The targets of these studies include power export. But, since this MP study is for domestic demand, the target was put on the result of demand forecast, 4,300 MW in FY2031/32.
4-3 Beneficial impacts to be highlighted by the study.
Both positive and negative impacts should be properly considered.
4-4 Compensation mechanism to the affected families /institutions to be proposed in the report.
In this study, the compensation cost of each promising project was estimated and taken into consideration in the project cost. The study team understands the importance of compensation mechanism, but since this is a very big issue and not only for hydroelectric power projects, this mechanism should be proposed in the study on this issue.
4-5 Tariff rate should also be proposed.
[See the answer to comment No. 5.]
5 Mr. Saroja Upadhyaya
Nepal Engineering Council and HP Developer
The study should also analyze and indicate the investment potential / investor / development partners and recommend the tariff rate based on economic viability.
1. The financial and economic analyses of each promising project were done based on assumed tariff rates. Their results are presented in the report to facilitate discussions on the feasibility of these projects and expected returns on investments in them. The analyses were done assuming
Final Report Appendix 3 SEA Report
286

Nationwide Master Plan Study on Storage type Hydroelectric Power Development in Nepal
No. Name Comment Reply or action by NEA / JICA Study
Team that these projects would provide wholesale electricity to NEA. The rages of wholesale tariff rates for attractive returns on investments are calculated based on the financial analyses performed for all the promising projects. Regarding the setting of NEA's retail tariff rates, the study teams considers the rates are subjects of policy and political considerations based on, for example, the economic and financial analyses of the promising power development projects. However, the study team prefers subsidy free retail tariff rates securing the financial viability of NEA business. The subsidy free tariff rates and better performance of the Nepali's economy without distorted power markets were assumed in the demand forecasting model. 2. The identification of candidate investors for the ten promising projects should include the assessment of such candidates' imbedded risks and performances. The team considers that these assessments are not included in the terms of reference of this study.
6 Mr. Dipak Rauniyar
Hydroelectricity Investment & Development Co., Ltd.
Investment aspects in JICA master plan study should be considered and analyzed.
[See the answer to comment No. 5.]
Addition to the above mentioned opinion obtained during the meeting, some more comments were collected by questionnaire survey conducted in this meeting. 40 respondents gave their opinions about the points which should be carefully noted for making the master plan of storage type hydroelectric power development in their answer to the questionnaire. The respondents described various opinions, such as the necessity of urgent implementation of the selected project, the necessity of harmonization with other master plan or ongoing study and the necessity of the study about the impact in downstream of project area.
Considering all above comments in the Study, the Study Team decided to conduct more detailed study on cumulative impact and on mitigation for cumulative impact.
The agenda and the list of participants of the 3rd stakeholders meeting are attached as Table 12.3-2 and Table 12.3-3 at the end of this section.
Final Report Appendix 3 SEA Report
287

Nationwide Master Plan Study on Storage type Hydroelectric Power Development in Nepal
Table12.3-2 Program of the 3rd Stakeholders Meeting
No. Time Program Speaker/Presenter 1 10:00-10:10 Welcome address Mr. Birendra Kumar Pathak
General Manager, NEA 2 10:10-10:30 Background of project Mr. Biswa Dhoj Joshi
Manager, NEA 3 10:30-10:45 Power Demand Forecast Mr. Toshifumi Serizawa
JICA Study Team 4 10:45-11:05 Required Installed Capacity
of Storage-type Hydroelectric Power Generation
Mr. Takashi Mimura Leader, JICA Study Team
5 11:05-11:15 Evaluation Criteria and Weight
Ms. Keiko Otoguro JICA Study Team
6 11:30-12:20 Evaluation Results of 10 Promising Projects
Dr. Toran Sharma NESS Ms. Akiko Urago JICA Study Team
7 12:20-13:00 Discussion All Participants 8 13:00-13:10 Concluding Remarks Mr. Hisashi Hoshino
Embassy of Japan in Nepal Mr. Toru Kobayakawa JICA Tokyo
9 13:10- 13:15 Vote of Thanks Mr. Rameshwar Yadav Managing Director, NEA
Final Report Appendix 3 SEA Report
288

Nationwide Master Plan Study on Storage type Hydroelectric Power Development in Nepal
Table12.3-3 Participant List of the 3rd Stakeholders Meeting
Category Name Organization/Department Position Ministry and relevant Organization
Hari Ram Koirala Ministry of Energy Secretary Srijana Lama Ministry of Energy Ram Pd. Ghimire Ministry of Energy DMG Sect. Kabindra Karki Ministry of Urban Development SDE Divakar Kharel Water and Energy Commission Secretariat
(WECS) SDE
INGO/NGO Santim Nepal World Wildlife Fund, Nepal Director Dinesh Pariyar Society for Sustainable Development
(SSD) Chairman, Pasture and Fodder Expert
Association Subam Shah Independent Power Producers' Association, Nepal (IPPAN)
President
Narayan Parajuli Power Producers Association of Nepal (PPAN)
Treasure
Kumar Pandey IPPAN Institutions Kamala Kant Acharya TU Asst. Professor Subesh Ghimire TU Asst. Professor Sunil K. Dwivedi TU Asst. Professor Media Senchhelung Limbu Ujyoalo 90 FM Reporter Bishnu Belbase Abhiyan Reporter Bhavesh Adhikari Kantipur Journalist Bijaya Kantipur Journalist Rudra Pangeni The Himalayan Times Reporter Yogesh Pokharel TRN Reporter Ashok Thapa Kathamandu Post Sub Editor Laxaman Biyogi Nepal Samachar Patra Sr. Correspondent Sachen Gautam Naya Patrika Journalist Ram Pd. Pudasaini Aarthik Daily Reporter Others Sanjeeb Baral Hydroelectricity Investment &
Development Company Limited (HIDCL)
SDE
Deepak Rauniar HIDLC Salil Devkota NESS Managing Director Toran Sharma NESS Technical Director Ram Kumar Sharma NESS Socio Economist Madan Koirala NESS Environmentalist Megh Raj Dhital NESS Geologist Embassy Hisashi Hoshino Embassy of Japan First Secretary Kailash Man Pradhan Embassy of Japan Program Manager JICA Toru Kobayakawa JICA Tokyo Advisor Kenichiro lizuka JICA Nepal Office Representative Sourab Rana JICA Nepal Office Program Officer Yukiyoshi Ozaki JICA Expert Takashi Mimura JICA Study Team Leader Hiroyasu Akaike JICA Study Team Nobuo Hoshino JICA Study Team Akiko Urago JICA Study Team Takatsugu Okabe JICA Study Team Toshifumi Serizawa JICA Study Team Keiko OTOGURO JICA Study Team NEA Amogh s. Manandhar NEA Dep. Manager Bharat Pd. Mainar NEA Asst. Manager UD Bhatta NEA GM BiswaDhoj Joshi NEA Manager Rajesh Sapkota NEA Engineer Sunil Kumar Dhungel NEA Director Rameshwor Yadav NEA MD Bharat Pd. Mainar NEA PM Damodar BS NEA Hari R. Shreestha NEA Director Sanjib Jha NEA Manager Sagar NEA Manager Gyanendra P Kyastha NEA Manager Santosh Maharjan NEA Engineer
Final Report Appendix 3 SEA Report
289

Nationwide Master Plan Study on Storage type Hydroelectric Power Development in Nepal
Category Name Organization/Department Position
Bijaya Bajracharya NEA D. Manager Pradip Man Shrestha NEA Engineer Subindra Shrestha NEA Engineer Lila Nath Bhattarai NEA Director Krishna Pd. Ghimire NEA Engineer Surendra Chaudhary NEA Engineer Surya Narayan NEA Engineer Saroj Kumar NEA Vice Chairman D. S. Paudel NEA Director Preetam Pradhan NEA Dept. Manager Birendra K. Pathak NEA GM Shailendra NEA DM Deepak NEA Pradeep Kumar Thinke NEA Manager Rajeev Sharma NEA Director Tara Harsh Bajracharya NEA Asst. Manager Rajendra Thapa NEA A/c Officer Bikash Dongal NEA Engineer Lakshan Shah NEA Dept. Manager R.S Sayami NEA Surendra Acharya NEA Asst. Manager Jagadishwor M Singh NEA Director Mahesh M. Shrestha NEA Deputy. Director Pujan Piya NEA Asst. Manager Jayandra Man Tamrakar NEA Manager Lek Nath NEA Act. Director Shanti Laxmi Shakya NEA Act. Director Deepak Pd. Bhul NEA Engineer Mohan Shakey NEA Director Jhalak Ram Subedi NEA Asst. Manager G.opal Kumar Lohia NEA Manager Tika Ram Paudel NEA Asst. Manager Keshab Raj Bhatta NEA Director Lava Ghimire NEA Nass Man Pradhan NEA Manager Kuber lal Shrestha NEA Admn. Officer Pradeep Manandhar NEA Manager Anil Rajbhandari NEA Manager P.C Gupta NEA DM Dr. Dambar Bdr. Nepal NEA/BOD BOD Indra Prasad Neupane NEA/EA Sr. Vice President Amar Rajbhandari NEA/ESSD Deputy manager R. P Rimal NEA/EU President Ram Hari Gautam NEA/ PDD A.C. Officer Janak Mahat Chhetri NEA/PDD Asst. Admin. Bhupendra R. Gopal NEA/PDD D. Manager Puskar Amatya NEA/PDD Engineer Khagendra Shahi NEA /NEON President Kul Man Singh NEA/Chilime Managing Director Sitaram Thapa NEA /Nation Employee Organization Chairman
The 3rd Stakeholders Meeting received press coverage in the next day of the meeting at least by 3 different newspapers such as The Rising Nepal, Himalayan Times and 1 Nepal newspaper. The following is the press release in English-language newspaper.
Final Report Appendix 3 SEA Report
290

Nationwide Master Plan Study on Storage type Hydroelectric Power Development in Nepal
Figure 12.3-1 Example of Press Release about 3rd Stakeholders Meeting
Discussion at the Regional Office in Pokhara 12.4
Visit Report of the Regional Offices in Pokhara
Introduction
The main purpose of visiting regional offices at Pokhara was to get information regarding developmental planning in the Western Development Region of Nepal with particular focus on the proposed storage types Hydroelectric power Project locations and to identify whether there will be major developmental conflict with concerned offices during project implementation. The visit was conducted to Regional Irrigation Office, Regional Agricultural Office and Regional Road Office on 13th June 2012. The Team Leader, Sub-Leader and Environmental and Social experts of the study team made visit to those offices. During the visit, meeting was held with the officials of the concerned offices informing them about the proposed projects that have been under study.
Team Leader Mr. Mimura highlighted the need of storage type projects in Nepal in the context of current power shortage. He also described about the proposed storage type projects at Western Developmental Region of Nepal with regards to the site, locations and features. He briefed about the projects like the Lower Badigad Project at Gulmi, the Andhi Khola Project at Syangja, the Lower Jhimruk Project at Arghakhanchi/Pyuthan and the Naumure (W. Rapti) Project at Arghakhanchi/Pyuthan that are located at Western Developmental Region of Nepal. After then, the concerns and issues raised by the officials were discussed and information regarding the developmental planning at such project sites was collected.
Output of Visit
Visit at Regional Irrigation Office
During the visit at Regional Irrigation Office, meeting was held with Engineers Mr. Mahesh Yadav,
Final Report Appendix 3 SEA Report
291
Nationwide Master Plan Study on Storage type Hydroelectric Power Development in Nepal
and Mr. K.R. Baral. Mr. Baral and Mr. Yadav informed to the study team that the office is responsible mainly for construction and rehabilitation of irrigation projects. With regards to the irrigation plans at those project locations Mr. Baral informed that there are some farmers built small irrigation schemes in and around the Andhi Khola Project at Syangja. He also highlighted that there are no such major projects that are being planned in proposed project locations and added that although some minor irrigation schemes are there, the priority should be given to the storage type hydroelectric power development considering the current power shortage being faced by Nepal.
Regional Road Office
At regional road office, meeting was held with Mr. Subir Rai (Engg.), Mr. Bishwa Bijay Lal Shrestha (Engg.), Mr. Lilamani Sigdel and Ms. Ganga Kumari Thapa. They have informed to the team that under regional office there are five divisions. They suggested the study team to visit the respective division offices to get in depth information about the road development plans that are being proposed and under implementation at proposed storage hydroelectric power development sites. They also added that there are some road projects and RCC bridges that are planned and under construction at some locations of the proposed project sites. They also added that no major roads and bridges construction with the high national priority are being planned in the proposed storage hydroelectric power projects and emphasized for the development of mega hydroelectric power projects from rivers of Nepal in order to resolve the current energy crisis being faced by the nation.
Regional Agriculture Office
Meeting was held with Mr. Khem Narayan Chapagain (Agri. Extension Officer), Mr. Saroj Adhikari (Engg.), Mr. Matibar Yadav, Mr. Rammaya Kadariya and Ms. Menaka Liwali. Discussion was held regarding the proposed projects located at this region of Nepal. Mr. Chapagain highlighted that although small scale agricultural areas are available at some pocket areas of the proposed project sites of this region, no major large scale nationally important agricultural areas are available. He also informed that from the Regional Agriculture Office none of the mega agricultural development projects have been planned in such areas and also suggested the study team to visit the respective District Agricultural Offices to get in depth information about it. He added that District Agricultural Offices are responsible for preparation of the Agricultural Development Plans in coordination with the Regional Office. He made aware to the study team that Agricultural Service Center under respective District Agricultural Offices publishes a Pocket Profile mentioning about the agricultural productivity at various places of the district and suggested to collect that Profile in order to get the productivity status in the various project sites.
The team from the Regional Agriculture Office also provided the green signal for the development of proposed storage type hydroelectric power projects.
Conclusion
After meeting with the above mentioned regional offices located at Pokhara, it can be said that the proposed project sites are not having major nationally prioritized developmental plans with respect to
Final Report Appendix 3 SEA Report
292
Nationwide Master Plan Study on Storage type Hydroelectric Power Development in Nepal
irrigation, road, bridges and agriculture development that will create a major conflict for the development of proposed storage type hydroelectric power projects. All the officials that have been participated during the meeting were found positive for the development of proposed storage type hydroelectric power projects in Western Development Region in order to get rid from the power crisis being faced by Nepal.
SEA Report Evaluation Meeting 12.5
Minutes of Meeting
on Nationwide Master Plan Study on Storage-type Hydroelectric Power Development in Nepal
Strategic Environmental Assessment (SEA) Evaluation Meeting Date and Time: June 5, 2013, 11:30-13:30 Place: Ministry of Energy, Kathmandu, Nepal Participants (28) (see Attached-1 for detail):
SEA Evaluation Team Members (13): Ministry of Energy (6) Ministry of Agriculture Development (1) Ministry of Irrigation (1) Ministry of Forest and Soil Conservation (1) Ministry of Science, Technology, and Environment (1) Tribhuvan University (1) WWF (2)
Others (15): Nepal Electricity Authority (NEA) (4) JICA / NEA (1) JICA Study Team (6) Nepal Environmental and Scientific Services (P) Ltd (4)
The meeting was chaired by Mr. Hari Ram Koirala, secretary, Ministry of Energy. He has welcomed all the participants for the meeting and requested to provide their valuable comments in the report. He has mentioned that the valuable comments and suggestions received from the participants of meeting will become valuable for JICA study team in finalizing the report.
After the opening of the meeting by the secretary, Ministry of Energy, Mr. Takashi Mimura, team leader of JICA study team presents the thanks for holding this meeting.
After, Ms. Keiko Otoguro of JICA study team presented the composition of the draft SEA report, project screening and evaluation criteria. She has explained how projects were selected from a long list of 67 potential projects. During the first phase of study, 36 projects are excluded from 67 potential projects giving rations. She further explained in second step how 10 promising projects were selected out of 31 projects selected in the First step. The technical, economical, and environmental parameters
Final Report Appendix 3 SEA Report
293
Nationwide Master Plan Study on Storage type Hydroelectric Power Development in Nepal
used for evaluation and weightage given for each parameter were explained by her. While explain the Third step, she has shown location of promising project sites and site specific details of each of the selected 10 projects in one by one basis. She has explained sub category of all the 10 projects. The sub categories of project briefed by her includes hydrological conditions, geological conditions, lead time, effectiveness of project, impact on natural environment, impact on social environment, and different loss that is going to take place in 10 promising projects.
After the presentation by Ms. Otoguro, Dr. Toran Sharma presented the mitigation measures to be followed in those 10 promising projects. He has explained the basis of cost estimations for physical, biological and socio-economic environment. He has further explained the comparison of various losses and likely cost for mitigation for all the 10 promising projects.
After the presentation by Dr. Sharma, Ms. Akiko Urago presented the Cumulative Impact Assessment (CIA). She has covered basic information about CIA and why such assessment is necessary in the context of Nepal. She has explained a brief CIA covering physical, biological and socio-economic impacts of all project sites. After that she did scoping of all project sites of three main impacts namely water regulation effects on wetland ecosystem. The next impacts identified are barrier effects on fish migration. Another important impact is space crowning impact on forest ecosystem. She has presented scoping table for Cumulative impact giving items and comparing it with existing and planned hydroelectric power in Nepal.
After the presentation by Ms. Urago, the floor was open for discussion. The name of participants participated in the discussion along with response from JICA study team is highlighted below.
1. Mr. Ashish Bhadra Khanal, Senior Divisional Engineer, Department of Irrigation, Ministry of
Irrigation
In the maps shown by Ms. Urago, some of the ongoing projects are missing (example: Sikta Irrigation Project, Bheri-Babai Multipurpose Diversion Project).
Mr. Khanal has mentioned that the national water plan has emphasized in River Basin Development through Integrated Water Resource Management Plan. That is why his department is insisting JICA study team to use multiple use of water while evaluating projects.
Ms. Urago mentioned that she couldn’t get such information while preparing the report. Now she will include project sites of Bheri Babai and Sikta in final report. 2. Mr. Bishwo Dhoj Joshi, PDD, NEA
He has mentioned that the water balance table should use small scale and range for small river and it should be compared with same scale used for large river.
JICA study team acknowledges it. 3. Mr. Raju Gyawali, Environment Specialist, Environment and Social Studies Department, NEA
The report has highlighted all the negative or adverse impacts while developing 10 promising projects. However, the beneficial impacts of reservoir projects should also be highlighted in the report.
Final Report Appendix 3 SEA Report
294

Nationwide Master Plan Study on Storage type Hydroelectric Power Development in Nepal
JICA study team mentioned that the potential and likely benefits of storage project are known. 4. Mr. Ramesh Prasad Sapkota, Lecturer, Tribhuvan University
The report has identified flora and fauna in the upstream of dam. It is advisable that it should be considered downstream of dam and in other areas as well. Besides he further mentioned that Cumulative Impact Assessment (CIA) is an important tool that needs to be integrated at plan and policy level where as IEE/EIA is at project level. The CIA presented here is not detail and followed the standard format.
Ms. Urago acknowledges it and she further added that this CIA is prepared based on the secondary information and information obtained from site during the field survey. Ms. Urago further mentioned that it is now the time for the government to think for initiating CIA in Nepal. 5. Mr.Ashish Bhadra Khanal, Senior Divisional Engineer, Department of Irrigation, Ministry of
Irrigation
Mr. Khanal has mentioned that National Water Plan has given priority for irrigation sector development so master plan study of storage type hydroelectric power study should also give priority for multipurpose use of water.
Mr. Mimura has replied that irrigation sector development is important for the country. Benefit to irrigation is not taken in consideration during this study. We will mention this issue in a final report. 6. Dr. Prabhakar Pathak, Joint Secretary, Ministry of Agriculture and Development
Dr. Pathak mentioned that the government has given high priority for the development of energy, infrastructure, and agriculture sector. For the development of Agriculture sector, irrigation is essential and this is highest priority of water use in Nepal. In such promising projects, when irrigation components are not addressed, there might create some controversy among ministries. While constructing these promising projects, we are losing cultivated land and if irrigation facilities are not provided in remaining land, we might have to face the problem of food security. So this aspect needs to be considered in report.
Mr. Mimura acknowledges such issues will be dealt in a project selected for feasibility study. 7. Mr. Ashok Bhattarai, Scientific Officer, Ministry of Science, Technology, and Environment
Mr. Bhattarai has mentioned that, developing a reservoir means opportunities for creating new habitat, niches and other beneficial uses (like fisheries). The report should mention the sources of River like snow fed, rainfall etc. The report should also like with the present global issue of climate change not only about GLOF. He has suggested that protected areas in upstream of dam should be maintained. He further added that the protected flora and fauna from Government of Nepal’s list (National Report) should also be included in the report.
JICA study team acknowledges the comments and suggestions.
Final Report Appendix 3 SEA Report
295
Nationwide Master Plan Study on Storage type Hydroelectric Power Development in Nepal
8. Shuva Sharma, Consultant, WWF
Mr. Sharma asked environmental expert’s opinion of JICA study team regarding the ranking of 10 projects (if possible) from environmental and social perspective.
Before responding to Mr. Sharma’s question by the Study Team, secretary of Ministry of Energy Mr. Koirala announce the closing of the session.
At the end, Mr. Hari Ram Koirala, thanked everyone for actively participating in the meeting. He believes that JICA study team will address the comments and suggestions raised by the participants in the final report.
Participants
SEA Evaluation Team Members Ministry of Energy (6):
Mr. Hari Ram Koirala, Secretary Mr. Keshab dhoj Adhikari, Jt. Secretary Mr. Sriranjan Lakoul, Jt. Secretary Mr. Anup Kumar Upadhyay, Director General, Department of Electricity Development Mr. Chatur B. Shrestha, Senior Division Geologist, Environment Unit Mr. Shyam Kishor Yadav, Senior Division Engineer, Environment Unit
Ministry of Agriculture Development (1): Dr. Prabhakar Pathak, Jt. Secretary
Ministry of Irrigation (1): Mr. Ashish Bhadra Khanal, Senior Divisional Engineer, Department of Irrigation
Ministry of Forest and Soil Conservation (1): Mr. Madhu Ghimire, Environment Officer
Ministry of Science, Technology, and Environment (1): Mr. Ashok Pd. Bhattarai, Under Secretary
Tribhuvan University (1): Mr. Ramesh Sapkota, Lecturer
WWF (2): Mr. Shuva Sharma, Consultant Mr. Dipesh Joshi, Program Officer
Others Nepal Electricity Authority (NEA) (4):
Mr. Sunil Kumar Dhungel, Director Mr. Biswo Dhoj Joshi, Manager, Project Development Department Mr. Raju Gyawali, Environmental Specialist Mr. Gopal Kumar Lohia, Manager, Project Development Department
JICA / NEA (1): Mr. Yutaro Mizuhashi, Expert
JICA Study Team (6): Mr. Takashi Mimura, Team Leader Mr. Hiroyasu Akaike, Sub-Leader/Hydropower Engineer Mr. Nobuo Hoshino, Senior Consultant
Final Report Appendix 3 SEA Report
296

Nationwide Master Plan Study on Storage type Hydroelectric Power Development in Nepal
Ms. Akiko Urago, Environmental Consultant Mr. Takatsugu Okabe, Manager Ms. Keiko Otoguro, Coordinator/Sub-Environmental Consultant
Nepal Environmental and Scientific Services (P) Ltd (4): Mr. Salil Devkota, Managing Director Mr. Toran Sharma, Technical Director Mr. Ram Kumar sharma, Socio-Economist Mr. Ram Chandra Poudel, Officer
Discussion at Ministry of Forests and Soil Conservation 12.6
Minutes of Meeting
Meeting with Ministry of Forest and Soil Conservation in Nepal Date and Time: June 4, 2013 Place: Ministry of Forest and Soil Conservation (MFSC), Kathmandu, Nepal Participants (3):
MFSC (1): Mr. Babu Ram Yadav, Under Secretary
JICA Study Team (the Study Team) (2): Ms. Akiko Urago Ms. Keiko Otoguro
After explaining about the guideline of the “Nationwide Master Plan Study on Storage Type Hydroelectric Power Development in Nepal (hereinafter revered to as “the Study”)” by the Study Team, the MFSC and the Study Team discussed and verified about the following points. The MFSC requested to utilize a new National Parks boundary to the Study Team to at the Joint
Coordination Committee (JCC) Meeting held on 5th June 2013. MFSC and the Study Team confirmed that there is no Promising Projects of the Study in the new
National Parks boundary. The Study Team requested for digital data on the new National Park boundary by GIS format to
the MFSC, the MFSC introduced the contact address of the GIS personal to the Study Team. The Study Team asked about the revised proportion of forest compensation especially for
hydropower projects, but the MFSC did not recognize about this revision.
Discussion at the WWF Nepal 12.7
Minutes of Meeting
Meeting with WWF Nepal
Final Report Appendix 3 SEA Report
297

Nationwide Master Plan Study on Storage type Hydroelectric Power Development in Nepal
Date and Time: June 7, 2013, 10:45-11:30 Place: WWF, Kathmandu, Nepal Participants (7):
WWF (5): Mr. Santosh Mani Nepal, Director, Policy and Support Ms. Judy Oglethorpe, Chief of Party – Hariyo Ban Mr. Dipesh Joshi, Program Officer Mr. Shuva Sharma, Consultant Mr. RavindraTripathi, Research Assistant
JICA Stuey Team (2): Ms. Akiko Urago Ms. Keiko Otoguro
WWF explained their main activities such as about species conservation, forest conservation and protection of primary biodiversity. Closely related areas to the JCA Study Team’s study are as follows.
Chitwan: Important area for creation and conservation of corridor between Nepal and India, UNESCO World heritage site
Gandaki: High biodiversity area Babai river: National park in which there is already dry area
WWF’s concerns are as follows. WWF is concerned about the vegetation changes by the dam; tree invasion in the river bed by
flood control can be occurred downstream of the dam site. If the storage water in the reservoir is used for irrigation, it may affect the habitat of a rare species
in the downstream of the dam. Especially at Babai river, the flow has already become less at the end of the National Park in the downstream. If the flow reduces more, it will make a serious impact on the habitat.
By new access road made through development project, impact on environment never occurred before such as increase of illegal hunters in the involved area will be concerned.
WWF’s general suggestions are as follows. Developers consult government policy maker about their each development plan. It is also
important to take into account not only the impact of each development but also the cumulative impact within other developments for developers and Nepal Government. Rivers in Nepal are flowing to India. Also, there are corridors for species between Nepal and India. It should be concerned the impact on the Indian side.
New projects maybe create new possibility for development of ecosystem. Impact assessment should not stay only to evaluate whether the project is good or bad. It is also important to find an alternative plan (offset plan) if the serious impact is concerned.
It would be useful if the impact studies for hydroelectric power schemes also include other infrastructures associated with it, including access roads, irrigation schemes downstream of the dams etc.
Final Report Appendix 3 SEA Report
298
Nationwide Master Plan Study on Storage type Hydroelectric Power Development in Nepal
Assessment of factors associated with activities upstream of the dams (including roads,
deforestations, multiple water uses by communities etc.) would also be useful in better understanding impacts at landscape level.
Linkages with climate change factors will also be useful.
Others WWF Nepal has not worked specifically in fish diversity projects and programs whereas it has
updated information on river dolphins. WWF acknowledges that fish information for whole country of Nepal should be conducted. Otherwise, many fish species will extinct unknowingly.
The Study Team lacks of the development information of the other sectors and distribution information of the important species. The study team requested WWF to share such kinds of information.
WWF is now compiling a cumulative impact assessment through several projects conducted by them and this assessment will be finalized in a couple of months.
WWF will share its result with the Study Team once it finished.
Discussion at the IUCN Nepal 12.8
Minutes of Meeting
Meeting with IUCN Nepal Date and Time: December 17, 2013, 11:45-12:15 Place: IUCN, Kathmandu, Nepal Participants (5):
IUCN (2): Mr. Yam Malla PhD, Country Representative Mr. Rajendra Khanal, Programme Coordinator
JICA Stuey Team (2): Ms. Akiko Urago Ms. Keiko Otoguro
JICA Study Team explained the brief overview of National Master Plan Study on -type Hydroelectric Power Development in Nepal as well as the SEA conducted during the Study. Submitting the Draft SEA report to IUCN, JICA Study Team requested as follows.
Advices on the development of about 10 promising projects Sharing GIS data of distribution maps of National Red List Mammals in Nepal
IUCN accepted to give advices requested by JICA Study Team focusing on Social & Natural Environment which is their specialty. IUCN will give their brief comment about 10 promising projects and detailed comment on Dudh Koshi Project, Nalsyau Gad Project and Andhi Khola Project. IUCN promised to JICA Study Team to give the comments within about 1 month.
Final Report Appendix 3 SEA Report
299

Nationwide Master Plan Study on Storage type Hydroelectric Power Development in Nepal
IUCN also accepted to share the requested GIS data with JICA Study Team. IUCN introduced to JICA Study Team the person in charge of GIS data.
IUCN has an Ecosystem Base Adaptation (EbA) project near of the Andhi Khola Project. EbA is the use of biodiversity and ecosystem services, as part of an overall adaptation strategy, which helps people to adapt to the adverse effects of climate change. IUCN will analyze the Andhi Khola Project in consideration of the point of view or EbA.
Regarding the fish conservation, JICA Study Team explained the importance of overall fish survey in Nepal, also the intension of JICA to conduct the survey about fish distribution.
IUCN suggested to JICA Study Team to consult with Godabari Fishery Farm which is a fishery expert (government organization). This farm has detail information about distribution of fishes in Nepal.
Discussion at the Department of Forest under the Ministry of Forests and Soil 12.9Conservation
Draft SEA report was submitted to Department Forest for comments in December 2013. Department of Forest sent comments on January 2014. The comments are attached in Annex 22 in Appendix 5.
Minutes of Meeting
Meeting with the Department of Forests under the Ministry of Forests and Soil Conservation in Nepal
Date and Time: December 18, 2013, 13:00-13:30 Place: Ministry of Forests and Soil Conservation, Department of Forests, Kathmandu, Nepal Participants (5):
Department of Forests (3): Mr. Bishwa Nath Oli, Director General Mr. Bala Ram Adhikari, Programme Co-ordinator Mr. Kedarnath Sharma, Under Secretary
JICA Study Team (2): Ms. Akiko Urago Ms. Keiko Otoguro
JICA Study Team explained the brief overview of National Master Plan Study on -type Hydroelectric Power Development in Nepal. In the explanation, JICA Study Team added the following information. SEA was conducted during the Study. Stakeholders meetings were conducted three times during the Study in order to getting the
opinions by stakeholders.
Submitting the Draft SEA report to the Department of Forests under the Ministry of Forests and Soil Conservation, JICA Study Team requested the following.
Final Report Appendix 3 SEA Report
300
Nationwide Master Plan Study on Storage type Hydroelectric Power Development in Nepal
Comments and advices on the development of about 10 promising projects especially on Dudh
Koshi Project, Nalsyau Gad Project and Andhi Khola Project.
The Department of Forests principally accepted to give advices requested by JICA Study Team within about 1 month with a condition that NEA send an official letter to the Department of Forests which requests such kind of cooperation.
JICA Study Team apologized for the visit making an appointment without an official letter and promised to prepare the official letter through NEA.
The Department of Forests accepted the excuse from JICA Study Team and promised to give theirs comments by E-mail.
Discussion at the Directorate of Fisheries Development, National Inland Fisheries and 12.10Aquaculture Development Program
Minutes of Meeting
Meeting with Directorate of Fisheries Development, National Inland Fisheries and Aquaculture Development Program in Nepal
Date and Time: December 19, 2013, 13:45-14:15 Place: Central Fisheries Building, Kathmandu, Nepal Participants (4):
Directorate of Fisheries Development (2): Ms. Rama Nanda Mishra, National Program Chief Mr. Raj Kapur Napit, Fisheries Development Officer
JICA Study Team (2): Ms. Akiko Urago Ms. Keiko Otoguro
JICA Study Team explained the brief overview of National Master Plan Study on -type Hydroelectric Power Development in Nepal as well as the SEA conducted during the Study. Submitting the Draft SEA report to Directorate of Fisheries Development, JICA Study Team requested advices and comments on the development of about 10 promising projects by 26th January 2014.
Directorate of Fisheries Development accepted the above request by JICA Study Team and promised to send their comments to JICA Study Team by E-mail.
The comments by Directorate of Fisheries Development during the meeting are as follows.
In case there are a number of projects on 1 river, huge number of fish species might be affected. Mitigation measures should be important and carefully studied.
Final Report Appendix 3 SEA Report
301
Nationwide Master Plan Study on Storage type Hydroelectric Power Development in Nepal
Directorate of Fisheries Development agreed to the need for the Nationwide Fish census in the
Draft SEA report. Directorate of Fisheries Development was highly appreciated if JICA would conduct the
Nationwide Fish Study in the near term.
Chapter 13 Suggestions for EIAs in FS stage
Required documents for Environmental and Social consideration 13.1
(1) Environment Impact Assessment (EIA/IEE)
EIA procedures in Nepal are stipulated on the Amendment (January 27, 2010) of Environment Protection Regulation (1997) and National Environment Impact Assessment Guidelines (1993). Amendment (2010) requires IEE for transmission projects of more than 132 kV and hydropower projects whose output is from 1MW to 50 MW. EIA is required for hydropower projects which output is more than 50 MW. The matters to be mentioned in IEE/EIA are also stipulated in EPR 1997(See Section 4.4, Appendix 3 SEA report). Table 13.1-1 shows the required documents for hydropower and related projects.
Table 13.1-1 Required documents for Transmission line and Hydropower plant
Project Type Project size Required Document Transmission line 132 kV and more IEE Hydropower plant 1MW to 50 MW IEE
more than 50MW EIA Rural Electrification Projects - - Source: Environment Protection Regulation (1997) Amendment (2010)
(2) Environmental Management Plan
The JICA Guidelines for Environmental and Social Consideration 2010 (Here after referred to as JICA Guidelines) treat Environmental Management Plan (EMP) as a part of EIA. But if it requires updated EMP based on the detail design, it can be prepared independently.
(3) Resettlement Action Plan
JICA Guidelines are suggesting to follow OP 4.12, Annex A – Involuntary Resettlement Instruments when a large number of resettlement will happen. Table 13.1-2 shows the required information of RAP based on the OP 4.12, Annex A. All the possible projects for FS have to prepare RAP.
Final Report Appendix 3 SEA Report
302
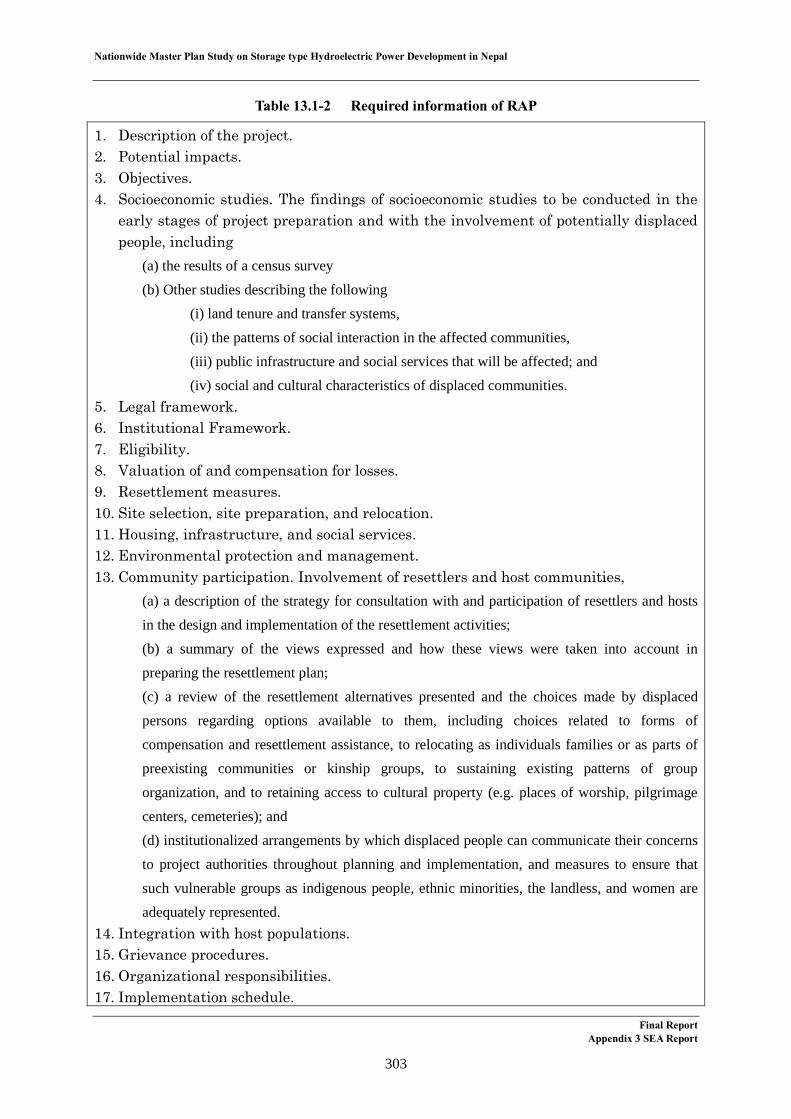
Nationwide Master Plan Study on Storage type Hydroelectric Power Development in Nepal
Table 13.1-2 Required information of RAP
1. Description of the project. 2. Potential impacts. 3. Objectives. 4. Socioeconomic studies. The findings of socioeconomic studies to be conducted in the
early stages of project preparation and with the involvement of potentially displaced people, including
(a) the results of a census survey (b) Other studies describing the following
(i) land tenure and transfer systems, (ii) the patterns of social interaction in the affected communities, (iii) public infrastructure and social services that will be affected; and (iv) social and cultural characteristics of displaced communities.
5. Legal framework. 6. Institutional Framework. 7. Eligibility. 8. Valuation of and compensation for losses. 9. Resettlement measures. 10. Site selection, site preparation, and relocation. 11. Housing, infrastructure, and social services. 12. Environmental protection and management. 13. Community participation. Involvement of resettlers and host communities,
(a) a description of the strategy for consultation with and participation of resettlers and hosts in the design and implementation of the resettlement activities; (b) a summary of the views expressed and how these views were taken into account in preparing the resettlement plan; (c) a review of the resettlement alternatives presented and the choices made by displaced persons regarding options available to them, including choices related to forms of compensation and resettlement assistance, to relocating as individuals families or as parts of preexisting communities or kinship groups, to sustaining existing patterns of group organization, and to retaining access to cultural property (e.g. places of worship, pilgrimage centers, cemeteries); and (d) institutionalized arrangements by which displaced people can communicate their concerns to project authorities throughout planning and implementation, and measures to ensure that such vulnerable groups as indigenous people, ethnic minorities, the landless, and women are adequately represented.
14. Integration with host populations. 15. Grievance procedures. 16. Organizational responsibilities. 17. Implementation schedule.
Final Report Appendix 3 SEA Report
303

Nationwide Master Plan Study on Storage type Hydroelectric Power Development in Nepal
18. Costs and budget. 19. Monitoring and evaluation. Source: OP 4.12, Annex A - Involuntary Resettlement Instruments, World Bank
(4) Indigenous People Plan
JICA Guidelines suggest Indigenous People Plan (IPP) which includes the contents in OP 4.10, Annex B – Indigenous People Plan, if the projects affect indigenous people. IPP should be prepared, when the existence of indigenous people are confirmed. Table 13.1-3 shows the main contents of IPP based on the OP 4.10, Annex B (World Bank).
Table 13.1-3 Required Information of IPP
(a) A summary of the information referred to in the followings. • A review, on a scale appropriate to the project, of the legal and institutional
framework applicable to Indigenous Peoples. • Gathering of baseline information on the demographic, social, cultural, and
political characteristics of the affected Indigenous Peoples’ communities, the land and territories that they have traditionally owned or customarily used or occupied, and the natural resources on which they depend.
(b) A summary of the social assessment. (c) A summary of results of the free, prior, and informed consultation with the affected Indigenous
Peoples’ communities that was carried out during project preparation and that led to broad community support for the project.
(d) A framework for ensuring free, prior, and informed consultation with the affected Indigenous Peoples’ communities during project implementation.
(e) An action plan of measures to ensure that the Indigenous Peoples receive social and economic benefits that are culturally appropriate, including, if necessary, measures to enhance the capacity of the project implementing agencies.
(f) When potential adverse effects on Indigenous Peoples are identified, an appropriate action plan of measures to avoid, minimize, mitigate, or compensate for these adverse effects.
(g) The cost estimates and financing plan for the IPP. (h) Accessible procedures appropriate to the project to address grievances by the affected Indigenous
Peoples' communities arising from project implementation. When designing the grievance procedures, the borrower takes into account the availability of judicial recourse and customary dispute settlement mechanisms among the Indigenous Peoples.
(i) Mechanisms and benchmarks appropriate to the project for monitoring, evaluating, and reporting on the implementation of the IPP. The monitoring and evaluation mechanisms should include arrangements for the free, prior, and informed consultation with the affected Indigenous Peoples’ communities.
Source: OP 4.10, Annex B - Indigenous Peoples Plan, World Bank
Final Report Appendix 3 SEA Report
304
Nationwide Master Plan Study on Storage type Hydroelectric Power Development in Nepal
Comprehensive Scoping in FS stage 13.2
It is difficult to conduct site specific scoping, because it is undecided which projects will be selected for next FS. Then comprehensive scoping for ten promising projects is conducted. The risk of land slide around the reservoir might be high, because most of the sites are located in precipitous terrain. Risk of water accident would rise if there is no re-regulating pond. The low late of water rotation might cause eutrophication and dams without sedimentation flushing gate raise the flood risk near the back water of the reservoir. All the dams block migration of fishes. If the construction of the transmission line divides the forest, it will have an impact on environment; the animal migration will be inhibited and the land use of the ground under the transmission line will be limited.
The Table 13.2-1 shows scoping for hydropower plant and Table 13.2-2 shows scoping on transmission line.
Final Report Appendix 3 SEA Report
305
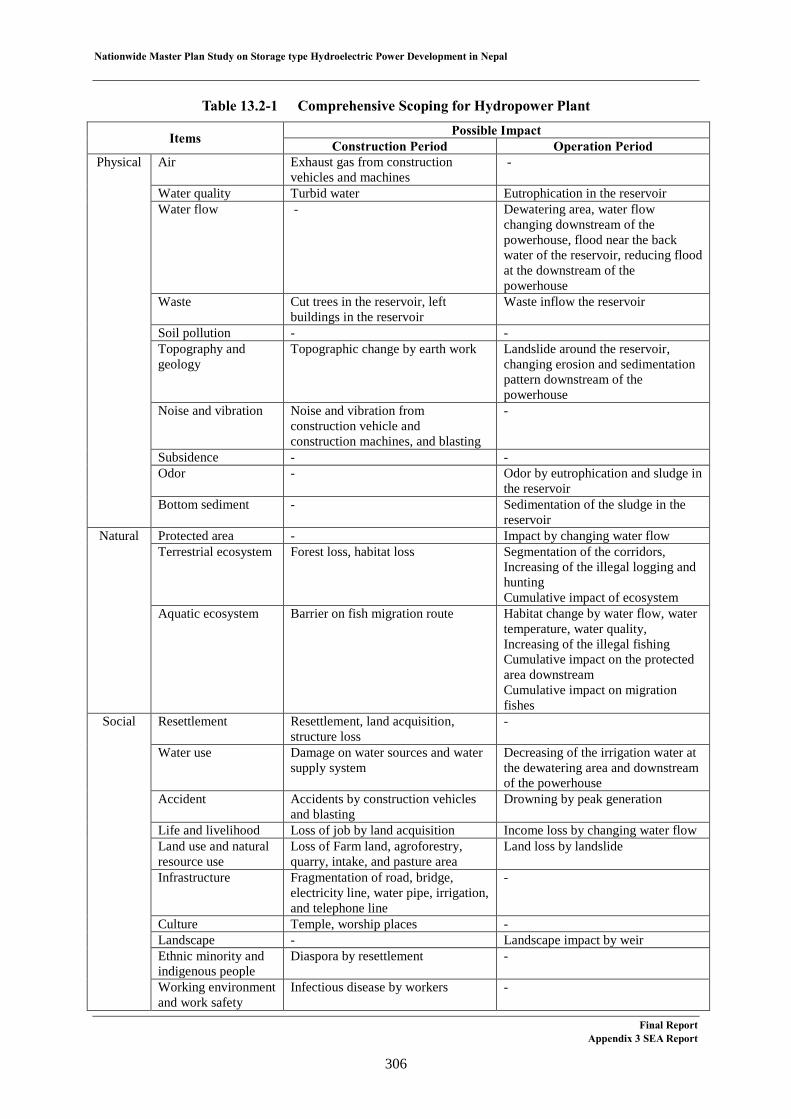
Nationwide Master Plan Study on Storage type Hydroelectric Power Development in Nepal
Table 13.2-1 Comprehensive Scoping for Hydropower Plant
Items Possible Impact Construction Period Operation Period
Physical Air Exhaust gas from construction vehicles and machines
-
Water quality Turbid water Eutrophication in the reservoir Water flow - Dewatering area, water flow
changing downstream of the powerhouse, flood near the back water of the reservoir, reducing flood at the downstream of the powerhouse
Waste Cut trees in the reservoir, left buildings in the reservoir
Waste inflow the reservoir
Soil pollution - - Topography and geology
Topographic change by earth work Landslide around the reservoir, changing erosion and sedimentation pattern downstream of the powerhouse
Noise and vibration Noise and vibration from construction vehicle and construction machines, and blasting
-
Subsidence - - Odor - Odor by eutrophication and sludge in
the reservoir Bottom sediment - Sedimentation of the sludge in the
reservoir Natural Protected area - Impact by changing water flow
Terrestrial ecosystem Forest loss, habitat loss Segmentation of the corridors, Increasing of the illegal logging and hunting Cumulative impact of ecosystem
Aquatic ecosystem Barrier on fish migration route Habitat change by water flow, water temperature, water quality, Increasing of the illegal fishing Cumulative impact on the protected area downstream Cumulative impact on migration fishes
Social Resettlement Resettlement, land acquisition, structure loss
-
Water use Damage on water sources and water supply system
Decreasing of the irrigation water at the dewatering area and downstream of the powerhouse
Accident Accidents by construction vehicles and blasting
Drowning by peak generation
Life and livelihood Loss of job by land acquisition Income loss by changing water flow Land use and natural resource use
Loss of Farm land, agroforestry, quarry, intake, and pasture area
Land loss by landslide
Infrastructure Fragmentation of road, bridge, electricity line, water pipe, irrigation, and telephone line
-
Culture Temple, worship places - Landscape - Landscape impact by weir Ethnic minority and indigenous people
Diaspora by resettlement -
Working environment and work safety
Infectious disease by workers -
Final Report Appendix 3 SEA Report
306
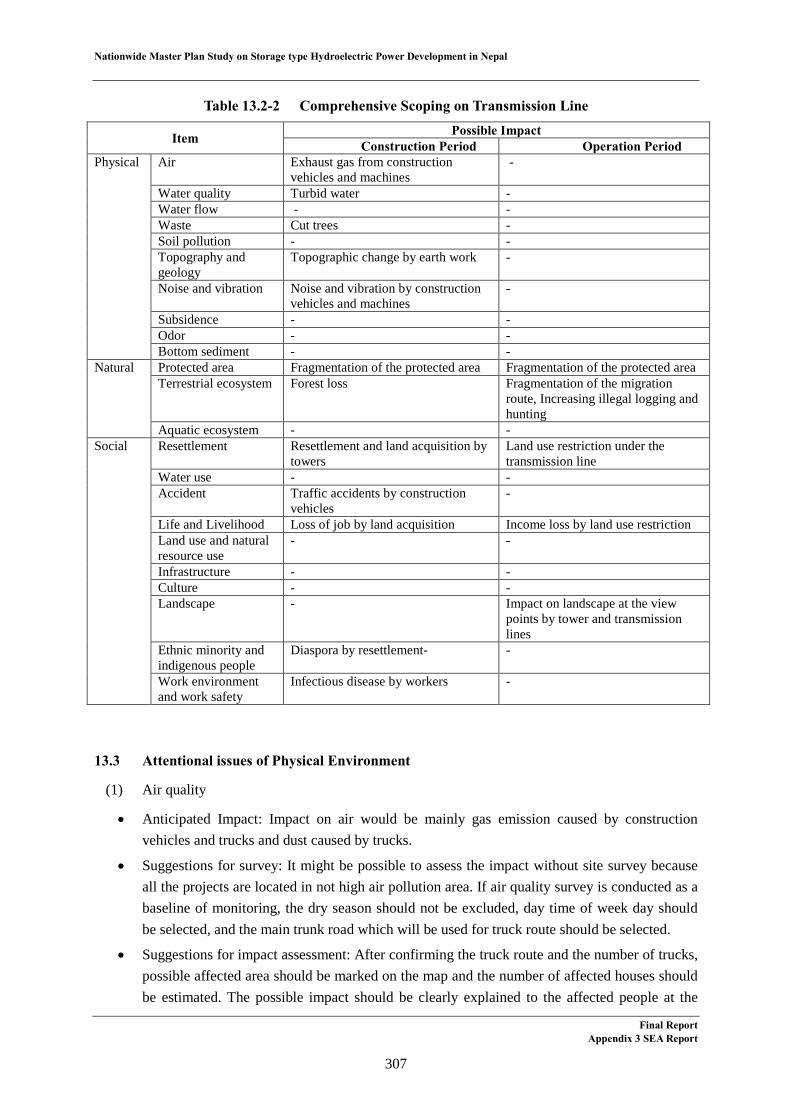
Nationwide Master Plan Study on Storage type Hydroelectric Power Development in Nepal
Table 13.2-2 Comprehensive Scoping on Transmission Line
Item Possible Impact Construction Period Operation Period
Physical Air Exhaust gas from construction vehicles and machines
-
Water quality Turbid water - Water flow - - Waste Cut trees - Soil pollution - - Topography and geology
Topographic change by earth work -
Noise and vibration Noise and vibration by construction vehicles and machines
-
Subsidence - - Odor - - Bottom sediment - -
Natural Protected area Fragmentation of the protected area Fragmentation of the protected area Terrestrial ecosystem Forest loss Fragmentation of the migration
route, Increasing illegal logging and hunting
Aquatic ecosystem - - Social Resettlement Resettlement and land acquisition by
towers Land use restriction under the transmission line
Water use - - Accident Traffic accidents by construction
vehicles -
Life and Livelihood Loss of job by land acquisition Income loss by land use restriction Land use and natural resource use
- -
Infrastructure - - Culture - - Landscape - Impact on landscape at the view
points by tower and transmission lines
Ethnic minority and indigenous people
Diaspora by resettlement- -
Work environment and work safety
Infectious disease by workers -
Attentional issues of Physical Environment 13.3
(1) Air quality
• Anticipated Impact: Impact on air would be mainly gas emission caused by construction vehicles and trucks and dust caused by trucks.
• Suggestions for survey: It might be possible to assess the impact without site survey because all the projects are located in not high air pollution area. If air quality survey is conducted as a baseline of monitoring, the dry season should not be excluded, day time of week day should be selected, and the main trunk road which will be used for truck route should be selected.
• Suggestions for impact assessment: After confirming the truck route and the number of trucks, possible affected area should be marked on the map and the number of affected houses should be estimated. The possible impact should be clearly explained to the affected people at the
Final Report Appendix 3 SEA Report
307
Nationwide Master Plan Study on Storage type Hydroelectric Power Development in Nepal
Stakeholder Meetings and EIA report.
• Suggestions for mitigation planning: Alternative truck route can be considered, if there is not any effective mitigation.
• Suggestions for monitoring planning: Monitoring items should be included both ambient air and vehicle gas emission. Monitoring points, items, timing, measuring methods, survey time, responsible organization, reporting format, target value, and audit timing should be identified. Penalty rules can be suggested for not fulfilled the target value.
(2) Water quality
• Anticipated impact: Discharge of turbid water during construction; turbid water, nutrient enrichment, anoxic water mass, and low water temperature layer generation in the reservoir; and impact on the river water quality by discharged water from the reservoir during operation. The risk would be high if it is expected population growth without sewage system. The impact on river water might affect not only on fish but also on water use downstream such as irrigation, drinking water supply, and/or industrial water supply.
• Suggestions for survey: Water sampling points should cover not only dam site and spillway but also future monitoring points and fish survey points. If possible the sampling timings should be same as fish survey hopefully four times a year, at least wet and dry seasons.
• Suggestions for impact assessment: The predicted water quality should be shown by water quality items, by locations, and by seasons. If possible the water quality before mitigation and after mitigation can explain the effectiveness of the mitigations. The predicted result should be sent to the biological expert and social expert for their predictions.
• Suggestions for mitigation planning: The mitigation should be designed with civil engineers and the implementability and maintenance capability in Nepal should be considered. If possible several alternatives can be compared.
• Suggestions for monitoring planning: Discharged water monitoring and river water monitoring should be planned respectively. River water monitoring should be planned with fish experts by analyzed items sampling points, sampling timing, sampling methods, reporting format, target value, and audit timing.
(3) Water flow
• Anticipated impact: Sedimentation in the reservoir might cause a rise in the river bed level at the upper reach of the reservoir. River water discharge will be extremely reduced downstream of a dam and spillway. Monthly average river discharge will be changed by water storage. If there is no reregulating reservoir, river water downstream of the spillway will be increase rapidly by peak generation. River water volume will be changed by sand flush operation. Reduction of ground water or spring by tunneling is anticipated too. If some activities, such as irrigation, drinking water intake, industrial water intake, fishery, river bathing, cloth washing, rafting, exist in the wafer flow impact area, they might be affected. If there are some storage type dams in the same river system, the impact will be cumulated after the confluences.
Final Report Appendix 3 SEA Report
308

Nationwide Master Plan Study on Storage type Hydroelectric Power Development in Nepal
• Suggestions for survey: River crossing measurements at the high risk points are suggested for correct impact assessment. Survey points should be carefully selected with the social survey expert.
• Suggestions for impact assessment: Water volume, water level and current velocity should be predicted by month and time considering peak generation and sand flush operation. If it required, prediction result of sedimentation, river bed degradation by topography and geology expert could be used. The prediction result of water flow should be shared with social expert and explained clearly to the affected people at the stakeholder meeting. If there are some irrigation dams or storage type power plants in the same river system, cumulative impact at the Indian border should be assessed to confirm the consistency of the Gandak Irrigation and Power Project Agreement and the Kosi Project Agreement.
• Suggestions for mitigation planning: Mitigations should be selected feasible and practical ones with civil engineers. If possible alternative mitigations could be compared by effectiveness and cost. Responsible organizations for mitigation, initial cost, maintenance cost should be examined too.
• Suggestions for monitoring planning: High risk points should be selected as monitoring points. Responsible organizations, monitoring timing, reporting format, target value, audit organizations, and audit timing should be planned.
(4) Waste
• Anticipated impact: Wreckage of building and removed plants in the reservoir area, waste oil, waste woods, waste metal, waste plastics, domestic waste from construction site might be produced during construction. Floating waste captured by screen will be generated during operation whole year.
• Suggestions for survey: The exact volume of generated waste should be surveyed, , treatment methods should be studied, and management cost at the similar projects should be estimated.
• Suggestions for impact assessment: The possible waste volume should be estimated considering the difference of project sizes.
• Suggestions for mitigation planning: The practical and effective measures should be suggested to avoid similar problems with other projects. Classification and recycling of waste should be considered for reduction of its volume.
• Suggestions for monitoring planning: Volume of generated waste and treatment ways should be periodically monitored during construction and operation respectively.
(5) Topography and geology
• Anticipated impact: Landform will be changed by quelling and dumping. The river bed level downstream of the spillway might be lowered by decreased sediment supply if there is no sand flush gate at the dam. The risk of land slide would be higher around the reservoir. Huge amount of sediment might flow in the reservoir when GLOF occurs. Landslides might be caused by Access road and/or Transmission line, if the civil works are inadequate.
• Suggestions for survey: Land slide survey should be done in the area above the minimum Final Report
Appendix 3 SEA Report
309

Nationwide Master Plan Study on Storage type Hydroelectric Power Development in Nepal
operation level and high risk area should be identified. The survey result should be recorded in a survey slip format with latitude and longitude, photo shooting direction in order to use monitoring survey in later stage.
• Suggestions for impact assessment: Predicted points with high risk of land slide should be sent to social expert and used for the impact assessment on land use. The predicted result should be explained clearly to the affected land owners at the stakeholders meeting or other ways.
• Suggestions for mitigation planning: Feasible and practical methods in Nepal should be taken based on land use and impact extent discussion with civil engineers.
• Suggestions for monitoring planning: Monitoring points, report format, frequency should be planned for each assessed impact.
(6) Noise and vibration
• Anticipated impact: Noise and vibration are the main issues during construction. Vibration on houses caused by transporter vehicle, noise from rock quarry and plant operation, and building crack caused by blasting work might draw complaint.
• Suggestions for survey: If the survey is re-commissioned, survey time, location, timing, measurement methods should be clearly instructed, because survey methods is not strictly stipulated by the Nepal government. Working area, truck route, blasting points, location of buildings should be confirmed. The existing cracking and leaning of the buildings can be recorded before construction start, if required.
• Suggestions for impact assessment: Impact area should be identified based on the work layout maps. If there are any schools/hospitals in the impact area, alternative truck route should be examined with civil engineers. The possible extent of the impact, timing, and duration should be clearly explained to the possible affected people at the stakeholders meeting.
• Suggestions for mitigation planning: Practical and sustainable mitigation measures in Nepal should be suggested. Several alternatives can be compared.
• Suggestions for monitoring planning: Survey points, timing, survey methods should be instructed in detail.
(7) Odor
• Anticipated impact: Odor might be generated when domestic waste and human waste are not treated appropriately. The reservoir without sand flushing gate might cause odor from sludge in the reservoir.
• Suggestions for survey: Distribution of the houses which might be affected by odor should be identified.
• Suggestions for impact assessment: It is a bit difficult to estimate exact impact area and extent of the impact of odor, but if the odor risk cannot be excluded, the risk should be explained to the possible affected people at the stakeholders meeting.
• Suggestions for mitigation planning: In order to reduce the odor risk, the layout of the working Final Report
Appendix 3 SEA Report
310

Nationwide Master Plan Study on Storage type Hydroelectric Power Development in Nepal
area can be examined with civil engineers for example domestic waste and human waste treatment facilities could be located as far as possible from the local houses.
• Suggestions for monitoring planning: Survey points, survey methods, reporting format should be instructed in detail.
(8) Sedimentation
• Anticipated impact: Reservoirs without sand flushing gate might be suffered from sedimentation.
• Suggestions for survey: Land use, terrain slope, land slide, water volume, rainfall in the river system will be gathered.
• Suggestions for impact assessment: Sediment volume and sedimentation speed will be estimated by civil engineers.
• Suggestions for mitigation planning: Practical and sustainable mitigation measures at the project site should be selected by comparing various types of mitigation measures.
• Suggestions for monitoring planning: Discussing with civil engineers, suitable monitoring points, monitoring methods and reporting format should be examined.
Attentional issues of Natural Environment 13.4
(1) Protected Area
• Anticipated impact: Candidate projects are not located in protected area but protected areas exist downstream. If there are several major irrigation systems and hydropower plants, reduction of river flow in the wet season, increase of river flow in the dry season, fewer floods, and deduction of yearly river flow might be cumulated. If it happens, the impact would affect the species and ecosystems in the protected area which depend on natural water flow and floods.
• Suggestions for survey: Major planned and existing irrigation facilities and storage type hydropower plant should be examined for their regulation rates.
• Suggestions for impact assessment: Monthly simulation of river water flow at the point in the protected area is recommended. The impact on protected area could be examined with the Department of National Parks and Wildlife Conservation and NGOs.
• Suggestions for mitigation planning: The mitigation by one project would be limited. Then cooperative mitigations with other projects would be recommended.
• Suggestions for monitoring planning: Monitoring plan should include compliance monitoring.
(2) Plants
• Anticipated impact: The vegetation loss around the river by hydropower project is inescapable. Even if the vegetation is common one but used by animals as migration route, the vegetation loss might affect the habitat of the migration species.
• Suggestions for survey: Not only the location of the protected species but also the vegetation Final Report
Appendix 3 SEA Report
311

Nationwide Master Plan Study on Storage type Hydroelectric Power Development in Nepal
used highly by protected animals should be identified. The area of invasive species, degraded vegetation and erosion area should be identified too. The survey should be conducted at least two times a year in wet and dry seasons. The survey area should include Reservoir, Dam, Generation plant, Camp site, Quarry, Damping site, Access road, Construction road, and Transmission route. It should be expanded to the tree planting area for mitigation.
• Suggestions for impact assessment: Loss of vegetation area should be predicted by the vegetation class. Predictions of disappearance should be done for protected plants.
• Suggestions for mitigation planning: Mitigation of planting and transplanting should be explained with its area, timing, and methods in detail.
• Suggestions for monitoring planning: Both compliance monitoring and impact monitoring should be included. Monitoring locations, timing and frequency should be instructed in detail.
(3) Terrestrial animals
• Anticipated impact: Vegetation along the river is likely to be used for migration route for some terrestrial animals. And reservoirs, access roads, transmission lines might be barriers for migrations.
• Suggestions for survey: In order to raise the survey accuracy, Japanese professional surveyors are hopefully installed by categories (mammal, bird, reptile, amphibian and insect). If there are any protected species in the project area, it is recommended to expand the survey area and identify the habitat position in whole habitat.
• Suggestions for impact assessment: Getting information about the vegetation change and land use change from plant expert and social expert, possible affected habitat should be identified.
• Suggestions for mitigation planning: Mitigation might include preservation of important habitat and defragmentation of the migration route. The exact location of the mitigation should be instructed in detail.
• Suggestions for monitoring planning: Monitoring plan should include monitoring points, timing, methods, and reporting format in detail.
(4) Aquatic species
• Anticipated impact: Construction of barrier will block migration of cold water fishes for spawning. If the river is the last river in the river system which has no barrier for the cold water fishes, the risk of extinction of the species would be extremely high. Changing of water environment such as water quality, water volume, and water temperature might cause serious impact on resident species too.
• Suggestions for survey: The wet season which is migration season should not be excluded from the survey time. If possible the other rivers in the same river system would be hopefully surveyed before detail survey at the project site. Effectiveness of the mitigation of other hydropower projects in Nepal can be surveyed.
• Suggestions for impact assessment: Getting the prediction result from the expert of water quality and water flow, the extent of impact should be estimated by locations and by species in
Final Report Appendix 3 SEA Report
312

Nationwide Master Plan Study on Storage type Hydroelectric Power Development in Nepal
detail.
• Suggestions for mitigation planning: Mitigation should be practical and sustainable one considering effectiveness of the other projects’ mitigations.
• Suggestions for monitoring planning: Monitoring should include both compliance monitoring and impact monitoring.
Attentional issues of Social Environment 13.5
(1) Resettlement and land acquisition
• Anticipated impact: All the projects might cause resettlement and land acquisition.
• Suggestions for survey: All the information in the survey area required for RAP should be gathered and arranged in GIS and database. In order to avoid deficiency of the survey, detail survey methods and arrangement methods should be taught to the re-commissioned survey company. Survey area should include a reservoir, power plant, quarry site, construction road, tentative working area, and resettlement area. In order to cover indirect impact, survey area should expand to houses and land around direct impact area. Not only house owners and land owners, but also tenant farmers, tenants of a house, servants, illegal land users, and non-registered land users should be surveyed. Elders, women, child, disabled, poverty household should be covered.
• Suggestions for impact assessment: The impact should be distinguished between direct impact, such as resettlement and land acquisition, and indirect impact, such as business degradation or access problems. Permanent impact and temporary impact, such as the land returned after construction, should be distinguished too. The rules of the buffer zone around the reservoir should be clearly defined and boundary should be marked on the map. The predicted impact should be clearly explained in the SHM and considered to the illiterates.
• Suggestions for mitigation planning: Entitlement matrix should be prepared for all anticipated social impact based on the format or RAP. Caution for the compensation rate should be not to be far different from that of the similar projects around the area. Selectable compensations such as land or money would be preferable than one option.
• Suggestions for monitoring planning: Compliance monitoring should be included.
(2) Water use
• Anticipated impact: Spring water use in the reservoir area and over the tunnel route, water use at the recession area, water use downstream of the spillway might be affected.
• Suggestions for survey: Locations and user location of the wells over the tunnel route and reservoir should be surveyed. Location, water right, of drinking water intake, irrigation water intake, industrial water intake, fish farming intake and their water discharge should be surveyed in the recession area. Fishery area, sand mining points, cloth washing, river bathing, river side camping site, rafting activity, religious activities should be surveyed at the dewatering area too. Water use timing should be examined too, because some activities might be done in only the wet season. The survey area would be up to the confluence with the bigger
Final Report Appendix 3 SEA Report
313

Nationwide Master Plan Study on Storage type Hydroelectric Power Development in Nepal
river. If serious impacts are predicted at some points, surveyor should ask the water flow expert to add prediction points for river water level.
• Suggestions for impact assessment: Based on the predicted water flow impact, impact value, location, timing should be examined. The people affected should be explained clearly at the SHM or other ways.
• Suggestions for mitigation planning: If any impact on water use is confirmed, it should be added in Entitlement Matrix in RAP and prepare the compensation rules.
• Suggestions for monitoring planning: Monitoring should include both compliance monitoring and impact monitoring.
(3) Accident
• Anticipated impact: Accidents might happen on the community roads by construction vehicles and industrial injury at the site during construction. Flushing water from a dam and exponential increase in river flow by peak generation might cause water accidents downstream of the dam, if there is not any re-regulating reservoir.
• Suggestions for survey: School road and commuting road, camping site along the river, and river bathing site should be surveyed. If possible previous accidents near the project site or similar projects should be surveyed with their reasons.
• Suggestions for impact assessment: The overlapped route between truck routes and school roads should be investigated. If any risks are predicted, it should be explained clearly to the affected people at the stakeholder meeting or other ways.
• Suggestions for mitigation planning: If serious impacts are predicted, alternative truck routs should be examined. Compliance of the Labor Act 2048 (1992), Some measures for workers environment such as Industrial accident prevention planning, Health and safety planning, and Safety education for workers should be prepared in the EMP.
• Suggestions for monitoring planning: Not only the monitoring for probable accidents but also compliance monitoring for mitigation should be planned.
(4) Life and Livelihood
• Anticipated impact: Not only the people affected by resettlement or land acquisition but also the people affected on only water use might have difficulty in their life and livelihood. The people who have to release their cultivation land and/or the business which lose their customer might be affected even if they do not need to be relocated. Fish farming, fishery, sand mining and rafting business might be also decreased their income.
• Suggestions for survey: All the information required for RAP should be surveyed such as current income, possible downturn in income and so on.
• Suggestions for impact assessment: Possible downturn in income, the necessity of changing the work should be assessed one by one.
• Suggestions for mitigation planning: Mitigations should be selectable for the affected people for example the mitigation for who would like to change their jobs or the mitigation for who
Final Report Appendix 3 SEA Report
314
Nationwide Master Plan Study on Storage type Hydroelectric Power Development in Nepal
would not like to change their jobs.
• Suggestions for monitoring planning: Monitoring plan should cover not only the monitoring life and livelihood but also compliance monitoring for monitoring.
(5) Use of land and natural resources
• Anticipated impact: Residential land, agricultural land, grazing ground, national forest, community forest, and private forest might be lost by submerging.
• Suggestions for survey: Precise maps which show national maps and community forest might not exist. Then forest boundary should be clarified by the District Forest Office or Community Forestry User Groups (CFUGs). Attention should be paid if the land category shows the exact land use. If possible alternative tree planting area for mitigation would be surveyed too. The number of users and actual usage should be surveyed on community forests.
• Suggestions for impact assessment: After identifying the impact area on the map, exact extent of the impact should be predicted.
• Suggestions for mitigation planning: Although forest mitigation methods are stipulated in the forest guideline (2006) and Forest Norms (2003) by the Ministry of Forest and Soil Conservation, there is a special rule (Shaskiya & Arthik Sudhar-AP 2069_Governance reform-30 Ashoj-2069) for hydropower plants which shows the rate as 1:2 for cutting and planting trees. The detail tree compensation plan can be started after issuance of construction license. Then compensation plan in EMP will be tentative one.
• Suggestions for monitoring planning: Monitoring plan should include compliance monitoring for the planned mitigation.
(6) Infrastructure
• Anticipated impact: Project might affect local infrastructures such as roads, suspension bridges, distribution lines, telephone lines, water supply facilities, sewerage systems, and so on. Impact on road might cause fragmentation of the communities.
• Suggestions for survey: The location of all the infrastructures on the map should be identified.
• Suggestions for impact assessment: The affected locations should be identified and the infrastructure maps and design maps renewed. The possible community fragmentation area should be identified.
• Suggestions for mitigation planning: Mitigation will reinstall equivalent value as a basic rule. But it can be added value based on the user request.
• Suggestions for monitoring planning: Compliance monitoring for planned mitigation should be included.
(7) Culture
• Anticipated impact: Traditional buildings, buried cultural property, festival and traditional arts might be lost by inundation.
Final Report Appendix 3 SEA Report
315

Nationwide Master Plan Study on Storage type Hydroelectric Power Development in Nepal
• Suggestions for survey: The survey area for intangible cultural properties should be expanded not only direct to impact area but also to whole village.
• Suggestions for impact assessment: Impact should be assessed whether the project might affect the sustainability of the traditional festival and/or traditional arts or not.
• Suggestions for mitigation planning: If serious cultural assets are identified, adequate mitigations including trans-building should be carefully examined.
• Suggestions for monitoring planning: Monitoring plan should include compliance monitoring.
(8) Landscape
• Anticipated impact: Landscape from viewpoints might be affected by existence of power plant facilities.
• Suggestions for survey: Viewpoints around the project area should be visited and the view, yearly users, and main view direction should be examined.
• Suggestions for impact assessment: The landscape after construction from the viewpoints should be simulated.
• Suggestions for mitigation planning: If serious impacts on landscapes are predicted, avoidance or minimization measures should be examined.
• Suggestions for monitoring planning: Compliance monitoring should be included.
(9) Ethnic minority and Indigenous people
• Anticipated impact: Ethnic minotiries are confirmed at all the candidate projects sites. Then impact on these people is anticipated.
• Suggestions for survey: Required information for IPP should be gathered. More attention should be paid to language, culture, festival, traditional architecture and traditional natural resources. Not only the affected indigenous people but also whole distribution of the groups and distribution center should be examined. Traditional practice for relocations such as direction, timing, relationship between other groups, and land conditions should be examined. If required, the meeting in the group should be supported. If there are any conflicts and problems among or between groups, actual conditions should be surveyed. Survey in dry season would be effective because of road fragmentation by land slide in wet season.
• Suggestions for impact assessment: Whether the center of the ethnic groups will be affected or not should be assessed. Not only the resource of livelihood but also resource of the festival or custom should be examined if they are affected. The result of assessment should be informed not only to the affected people but also to whole ethnic groups if required.
• Suggestions for mitigation planning: Mitigation measures should be considered to avoid diaspora and fragmentation of the ethnic groups, and to sustain the cultural inheritance. From selection of the resettlement area to compensation methods, they should not be provided in one way from project owner to the affected people. They should be decided in participatory way taking enough time. Take caution on the conflict and problems in the groups not be made worse.
Final Report Appendix 3 SEA Report
316

Nationwide Master Plan Study on Storage type Hydroelectric Power Development in Nepal
• Suggestions for monitoring planning: Monitoring plan should be divided in owner’s monitoring and audit monitoring. Adequacy of grievance adjustment should be monitored too.
(10) Working environment and work safety
• Anticipated impact: Labor accident, fight, food poisoning, communicable disease, and child labors are anticipated.
• Suggestions for survey: Hearing survey at near and similar projects are suggested and the previous work accident and diseases and their causes should be examined.
• Suggestions for impact assessment: Possibility of the occurrence of the similar problems should be predicted.
• Suggestions for mitigation planning: Precaution measures should be prepared especially for communicable diseases such as HIV/AIDS.
• Suggestions for monitoring planning: Monitoring plan should include both accident monitoring by project owners and compliance monitoring by audit organizations.
Final Report Appendix 3 SEA Report
317

Appendix 4
Power Development Plan and Development Plan of Storage-type Hydroelectric Power Projects taking into
consideration Candidate Projects proposed by NEA

Nationwide Master Plan Study on Storage-type Hydroelectric Power Development in Nepal
Table of Contents
Appendix 4 Power Development Plan and Development Plan of Storage-type
Hydroelectric Power Projects taking into consideration Candidate Projects
proposed by NEA A.4.1 Introduction ........................................................................................................................... 1
A.4.2 Power Development Plan ...................................................................................................... 1 A.4.2.1 Candidate Projects for Hydroelectric Power Generation .......................................... 1
A.4.2.1.1 Candidate Projects proposed by NEA ............................................................... 1 A.4.2.1.2 Development of ROR-type Hydroelectric Power Generation and Power
Imports from India ............................................................................................ 1 A.4.2.2 Key Parameters ......................................................................................................... 1 A.4.2.3 Power Development Plan taking into consideration Candidate Projects
proposed by the NEA ................................................................................................ 2 A.4.2.3.1 Practical Development Scenario ....................................................................... 2 A.4.2.3.2 Power Development plan .................................................................................. 2
A.4.3 Development Plan of Storage-type Hydroelectric Power Projects ........................................ 12 A.4.3.1 Storage-type Hydroelectric Power Projects to be Implemented ............................... 12
List of Tables
Table A.4.2.1-1 Candidate Hydroelectric Power Projects by the NEA ............................................ 1 Table A.4.2.3.2-1 Generation Expansion Plan (Base Case) (Candidates proposed by NEA are
considered) ............................................................................................................. 3 Table A.4.2.3.2-2 Generation Expansion Plan (High Case) (Candidates proposed by NEA are
considered) ............................................................................................................. 4 Table A.4.2.3.2-3 Generation Expansion Plan (Low Case) (Candidates proposed by NEA are
considered) ............................................................................................................. 5 Table A.4.2.3.2-4 Balance of Demand and Supply, LOLP, and Reserve Margin (Base Case)
(Candidates proposed by NEA are considered) ...................................................... 7 Table A.4.2.3.2-5 Balance of Demand and Supply, LOLP, and Reserve Margin (High Case)
(Candidates proposed by NEA are considered) ...................................................... 8 Table A.4.2.3.2-6 Balance of Demand and Supply, LOLP, and Reserve Margin (Low Case)
(Candidates proposed by NEA are considered) ...................................................... 8 Table A.4.3.1-1 Storage-type Projects to be Implemented (Candidates proposed by NEA are
considered) ............................................................................................................. 12 Table A.4.3.1-2 Commissioning Year of Commercial Operation (Candidates proposed by the
NEA are considered) .............................................................................................. 13
Final Report Appendix 4
i

Nationwide Master Plan Study on Storage-type Hydroelectric Power Development in Nepal
List of Figures
Figure A.4.2.3.2-1 Balance of Peak Demand and Supply Capacity (Base Case) (Candidates
proposed by NEA are considered) .......................................................................... 9 Figure A.4.2.3.2-2 Balance of Peak Demand and Supply Capacity (High Case) (Candidates
proposed by NEA are considered) .......................................................................... 9 Figure A.4.2.3.2-3 Balance of Peak Demand and Supply Capacity (Low Case) (Candidates
proposed by NEA are considered) .......................................................................... 10 Figure A.4.2.3.2-4 LOLP and Reserve Margin (Base Case) (Candidates proposed by NEA are
considered) ............................................................................................................. 10 Figure A.4.2.3.2-5 LOLP and Reserve Margin (High Case) (Candidates proposed by NEA are
considered) ............................................................................................................. 11 Figure A.4.2.3.2-6 LOLP and Reserve Margin (Low Case) (Candidates proposed by NEA are
considered) ............................................................................................................. 11
Final Report Appendix 4
ii

Nationwide Master Plan Study on Storage-type Hydroelectric Power Development in Nepal
Appendix 4 Power Development Plan and Development Plan of Storage-type Hydroelectric Power Projects taking into consideration Candidate Projects proposed by NEA
A.4.1 Introduction
The NEA proposes four projects listed in Table A.4.2.1-1 as candidate projects for the power development plan in addition to the candidate projects described in “8.9 Candidate Projects for Hydroelectric Power Generation” in the main report. In Appendix 4, these four projects were also considered as the candidate projects for “Power Development Plan” and “Development Plan of Storage-type Hydroelectric Power Projects.”
A.4.2 Power Development Plan
A.4.2.1 Candidate Projects for Hydroelectric Power Generation
A.4.2.1.1 Candidate Projects proposed by NEA
The Utter Ganga project was excluded from the candidate projects because it became clear that this projects is located in conservation areas.
Table A.4.2.1-1 Candidate Hydroelectric Power Projects by the NEA
Project Name Type Installed Capacity
(MW)
Annual Energy (GWh)
Project Cost*
(MUS$)
Commercial Operation**
(FY) Remarks
West Seti*** STO 750 3,636 1,483 2024
Utter Ganga STO 300 1,538 744 2027 Excluded from the candidates in this study. (Hunting reserve)
Kaligandaki-2 STO 680 3,470 1,347 2027 Tamor STO 530 2,406 1,538 2028
Source: NEA *: FY2012/13 price **: The earliest case. Estimated by the NEA and reviewed by the Study Team. ***: For power export.
A.4.2.1.2 Development of ROR-type Hydroelectric Power Generation and Power Imports from India
Development of ROR-type hydroelectric power generation and power imports from India were considered to be the same described in “8.9.2 Development of ROR-type Hydroelectric Power Generation” and “8.9.3 Power Import from India” in the main report.
A.4.2.2 Key Parameters
As for the values of key parameters for formulating the power development plan, the values described in “8.10 Key Parameters” in the main report were used.
Final Report Appendix 4
A.4 - 1
Nationwide Master Plan Study on Storage-type Hydroelectric Power Development in Nepal
A.4.2.3 Power Development Plan taking into consideration Candidate Projects proposed by
the NEA
A.4.2.3.1 Practical Development Scenario
The projects under construction or with a high probability of being constructed listed in Table 8.8-1 (in the main report) commence commercial operation according to schedule. The candidate projects to be developed after these projects are the promising storage-type HPPs selected by the Study Team listed in Table 8.9.1-1 of the main report, ROR-type HPPs listed in Table 8.9.2-1, and the projects proposed by the NEA listed in Table A.4.2.1-1 in this appendix.
With these candidate projects, a power development plan that is able to resolve the load shedding as early as possible and then secure the required LOLP with the least total costs of construction and O&M costs in terms of present value is formulated.
A.4.2.3.2 Power Development plan
(1) Commencement of commercial operation
Table A.4.2.3.2-1 to Table A.4.2.3.2-3 show the power plants to be constructed and their commencement year of commercial operation for the base case, the high case, and the low case of demand forecast, respectively
For the base case, the total installed capacity of generation facilities that are put into operation for the 20 years from FY2012/13 to FY2031/32 is 4,177 MW (the increment in imports from India is included), and 2,214 MW of this is storage-type hydroelectric power generation.
For the high case, the total installed capacity of generation facilities that are put into operation for the 20 years from FY 2012/13 to FY2031/32 is 5,186 MW, which is 1,009 MW larger than that for the base case. In these generation facilities, storage-type hydroelectric power generation is 3,223 MW, which is 1,090 MW larger than for the base case.
For the low case, the total installed capacity of generation facilities that are put into operation for the 20 years from FY 2012/13 to FY2031/32 is 4,177 MW, which is the same as for the base case. In these generation facilities, storage-type hydroelectric power generation is 2,414 MW, which is also the same as for the base case.
Final Report Appendix 4
A.4 - 2

Nationw
ide Master Plan Study on Storage-type H
ydroelectric Power D
evelopment in N
epal
Final Report
Appendix 4
A.4 -3
Table A.4.2.3.2-1 Generation Expansion Plan (Base Case) (Candidates proposed by NEA are considered)
*: Critical LOLP is 1.375%, equivalent to 5 days/year. Note: Projects in boldface are storage-type projects. The total install capacity includes the import from India.
FY 2011/12 2012/13 2013/14 2014/15 2015/16 2016/17 2017/18 2018/19 2019/20 2020/21 2021/22 2022/23 2023/24 2024/25 2025/26 2026/27 2027/28 2028/29 2029/30 2030/31 2031/32Existing –— 850.1 → → → → → → → → → → → → → → → → → → → →Kulekhani No. 3 STO 14.0 → → → → → → → → → → → → → → → →Chameliya PROR 30.0 → → → → → → → → → → → → → → → →Khani Khola ROR 25.0 → → → → → → → → → → → → → → → →Upper Sanjen ROR 11.0 → → → → → → → → → → → → → → →Sanjen ROR 42.9 → → → → → → → → → → → → → → →Upper Trishuli 3A ROR 60.0 → → → → → → → → → → → → → → →Upper Tamakoshi PROR 456.0 → → → → → → → → → → → → → → →Madhya (Middle) Bhotekosh ROR 102.0 → → → → → → → → → → → → → →Rasuwagadi ROR 111.0 → → → → → → → → → → → → → →Rahughat PROR 32.0 → → → → → → → → → → → → → →Upper Marsyangdi ROR 50.0 → → → → → → → → → → → → → →Mistri ROR 42.0 → → → → → → → → → → → → → →ROR-1 ROR 100.0 → → → → → → → → → → → → →Upper Trishuli 3B ROR 37.0 → → → → → → → → → → → →ROR-2 ROR 100.0 → → → → → → → → → → → →Tanahu STO 140.0 → → → → → → → → → → →Upper Mode A ROR 42.0 → → → → → → → → → → →ROR-3 ROR 100.0 → → → → → → → → → → →Tamakshi V ROR 87.0 → → → → → → → → → →Budhi Gandaki STO 600.0 → → → → → → → → →ROR-4 ROR 100.0 → → → → → → →ROR-5 ROR 100.0 → → → → → →Upper Arun PROR 335.0 → → → → → →Dudh Koshi STO 300.0 → → → → →Nalsyau Gad STO 410.0 → → →West Seti STO 750.0 →Import from India –— 12.0 → → → 162.0 → → → → → → → → → → → → → → → →
Added Installed Capacity (MW) –— 0.0 0.0 0.0 219.0 569.9 337.0 100.0 137.0 282.0 87.0 600.0 0.0 100.0 435.0 300.0 0.0 410.0 0.0 750.0 0.0Total Installed Capacity (MW) 862.1 862.1 862.1 862.1 1,081.1 1,651.0 1,988.0 2,088.0 2,225.0 2,507.0 2,594.0 3,194.0 3,194.0 3,294.0 3,729.0 4,029.0 4,029.0 4,439.0 4,439.0 5,189.0 5,189.0
LOLP* (%) –— 50.375 53.789 57.975 32.637 2.733 1.575 1.927 2.579 1.919 3.087 0.130 0.516 1.225 0.666 0.336 1.079 0.440 1.331 0.075 0.590
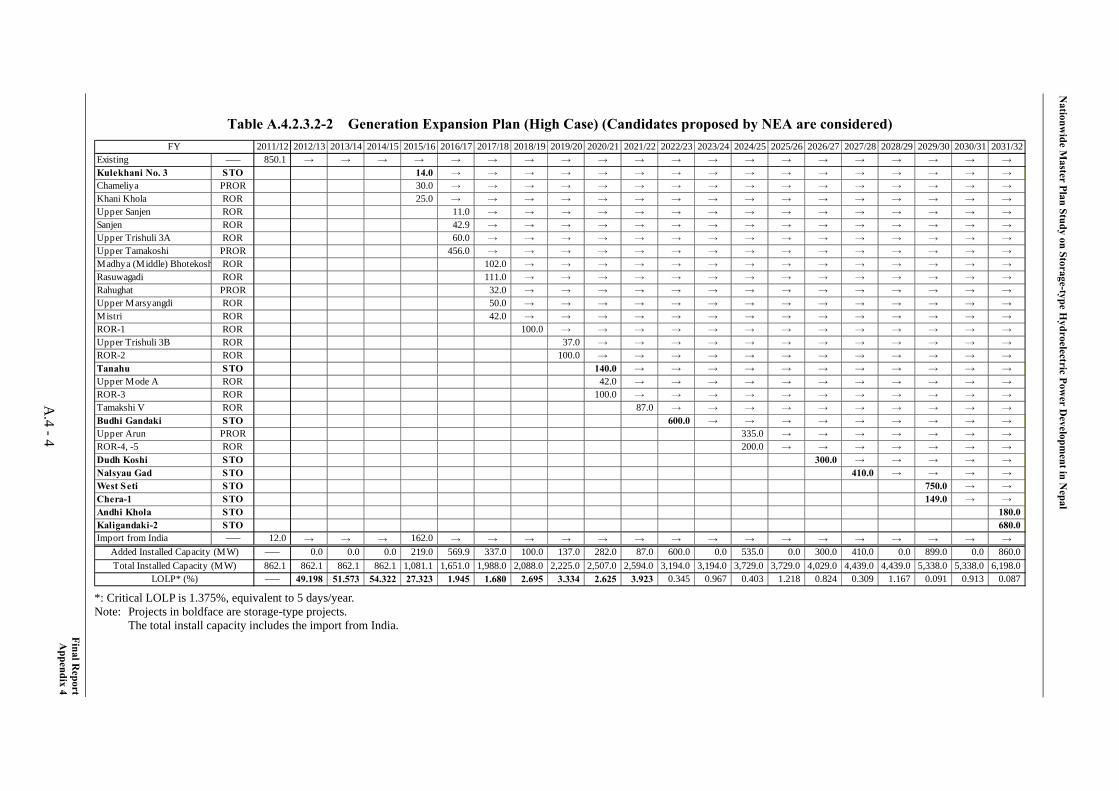
Nationw
ide Master Plan Study on Storage-type H
ydroelectric Power D
evelopment in N
epal
Final Report
Appendix 4
A.4 -4
Table A.4.2.3.2-2 Generation Expansion Plan (High Case) (Candidates proposed by NEA are considered)
*: Critical LOLP is 1.375%, equivalent to 5 days/year. Note: Projects in boldface are storage-type projects. The total install capacity includes the import from India.
FY 2011/12 2012/13 2013/14 2014/15 2015/16 2016/17 2017/18 2018/19 2019/20 2020/21 2021/22 2022/23 2023/24 2024/25 2025/26 2026/27 2027/28 2028/29 2029/30 2030/31 2031/32Existing –— 850.1 → → → → → → → → → → → → → → → → → → → →Kulekhani No. 3 STO 14.0 → → → → → → → → → → → → → → → →Chameliya PROR 30.0 → → → → → → → → → → → → → → → →Khani Khola ROR 25.0 → → → → → → → → → → → → → → → →Upper Sanjen ROR 11.0 → → → → → → → → → → → → → → →Sanjen ROR 42.9 → → → → → → → → → → → → → → →Upper Trishuli 3A ROR 60.0 → → → → → → → → → → → → → → →Upper Tamakoshi PROR 456.0 → → → → → → → → → → → → → → →Madhya (Middle) Bhotekosh ROR 102.0 → → → → → → → → → → → → → →Rasuwagadi ROR 111.0 → → → → → → → → → → → → → →Rahughat PROR 32.0 → → → → → → → → → → → → → →Upper Marsyangdi ROR 50.0 → → → → → → → → → → → → → →Mistri ROR 42.0 → → → → → → → → → → → → → →ROR-1 ROR 100.0 → → → → → → → → → → → → →Upper Trishuli 3B ROR 37.0 → → → → → → → → → → → →ROR-2 ROR 100.0 → → → → → → → → → → → →Tanahu STO 140.0 → → → → → → → → → → →Upper Mode A ROR 42.0 → → → → → → → → → → →ROR-3 ROR 100.0 → → → → → → → → → → →Tamakshi V ROR 87.0 → → → → → → → → → →Budhi Gandaki STO 600.0 → → → → → → → → →Upper Arun PROR 335.0 → → → → → → →ROR-4, -5 ROR 200.0 → → → → → → →Dudh Koshi STO 300.0 → → → → →Nalsyau Gad STO 410.0 → → → →West Seti STO 750.0 → →Chera-1 STO 149.0 → →Andhi Khola STO 180.0Kaligandaki-2 STO 680.0Import from India –— 12.0 → → → 162.0 → → → → → → → → → → → → → → → →
Added Installed Capacity (MW) –— 0.0 0.0 0.0 219.0 569.9 337.0 100.0 137.0 282.0 87.0 600.0 0.0 535.0 0.0 300.0 410.0 0.0 899.0 0.0 860.0Total Installed Capacity (MW) 862.1 862.1 862.1 862.1 1,081.1 1,651.0 1,988.0 2,088.0 2,225.0 2,507.0 2,594.0 3,194.0 3,194.0 3,729.0 3,729.0 4,029.0 4,439.0 4,439.0 5,338.0 5,338.0 6,198.0
LOLP* (%) –— 49.198 51.573 54.322 27.323 1.945 1.680 2.695 3.334 2.625 3.923 0.345 0.967 0.403 1.218 0.824 0.309 1.167 0.091 0.913 0.087
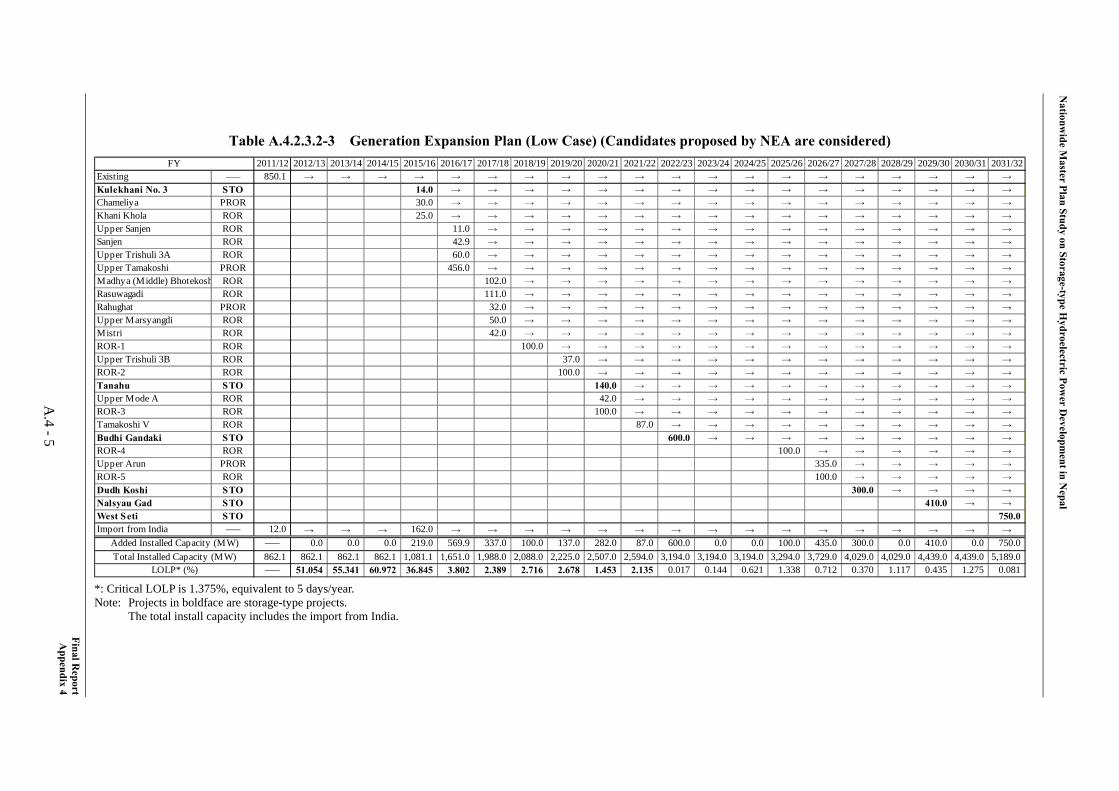
Nationw
ide Master Plan Study on Storage-type H
ydroelectric Power D
evelopment in N
epal
Final Report
Appendix 4
A.4 -5
Table A.4.2.3.2-3 Generation Expansion Plan (Low Case) (Candidates proposed by NEA are considered)
*: Critical LOLP is 1.375%, equivalent to 5 days/year. Note: Projects in boldface are storage-type projects. The total install capacity includes the import from India.
FY 2011/12 2012/13 2013/14 2014/15 2015/16 2016/17 2017/18 2018/19 2019/20 2020/21 2021/22 2022/23 2023/24 2024/25 2025/26 2026/27 2027/28 2028/29 2029/30 2030/31 2031/32Existing –— 850.1 → → → → → → → → → → → → → → → → → → → →Kulekhani No. 3 STO 14.0 → → → → → → → → → → → → → → → →Chameliya PROR 30.0 → → → → → → → → → → → → → → → →Khani Khola ROR 25.0 → → → → → → → → → → → → → → → →Upper Sanjen ROR 11.0 → → → → → → → → → → → → → → →Sanjen ROR 42.9 → → → → → → → → → → → → → → →Upper Trishuli 3A ROR 60.0 → → → → → → → → → → → → → → →Upper Tamakoshi PROR 456.0 → → → → → → → → → → → → → → →Madhya (Middle) Bhotekosh ROR 102.0 → → → → → → → → → → → → → →Rasuwagadi ROR 111.0 → → → → → → → → → → → → → →Rahughat PROR 32.0 → → → → → → → → → → → → → →Upper Marsyangdi ROR 50.0 → → → → → → → → → → → → → →Mistri ROR 42.0 → → → → → → → → → → → → → →ROR-1 ROR 100.0 → → → → → → → → → → → → →Upper Trishuli 3B ROR 37.0 → → → → → → → → → → → →ROR-2 ROR 100.0 → → → → → → → → → → → →Tanahu STO 140.0 → → → → → → → → → → →Upper Mode A ROR 42.0 → → → → → → → → → → →ROR-3 ROR 100.0 → → → → → → → → → → →Tamakoshi V ROR 87.0 → → → → → → → → → →Budhi Gandaki STO 600.0 → → → → → → → → →ROR-4 ROR 100.0 → → → → → →Upper Arun PROR 335.0 → → → → →ROR-5 ROR 100.0 → → → → →Dudh Koshi STO 300.0 → → → →Nalsyau Gad STO 410.0 → →West Seti STO 750.0Import from India –— 12.0 → → → 162.0 → → → → → → → → → → → → → → → →
Added Installed Capacity (MW) –— 0.0 0.0 0.0 219.0 569.9 337.0 100.0 137.0 282.0 87.0 600.0 0.0 0.0 100.0 435.0 300.0 0.0 410.0 0.0 750.0Total Installed Capacity (MW) 862.1 862.1 862.1 862.1 1,081.1 1,651.0 1,988.0 2,088.0 2,225.0 2,507.0 2,594.0 3,194.0 3,194.0 3,194.0 3,294.0 3,729.0 4,029.0 4,029.0 4,439.0 4,439.0 5,189.0
LOLP* (%) –— 51.054 55.341 60.972 36.845 3.802 2.389 2.716 2.678 1.453 2.135 0.017 0.144 0.621 1.338 0.712 0.370 1.117 0.435 1.275 0.081

Nationwide Master Plan Study on Storage-type Hydroelectric Power Development in Nepal
(2) Supply-demand balance
Table A.4.2.3.2-4, Table A.4.2.3.2-5 and Table A.4.2.3.2-6, and Figure A.4.2.3.2-1, Figure A.4.2.3.2-2 and Figure A.4.2.3.2-3 show the supply-demand balance for the base case, the high case, and the low case of demand forecast respectively.
In these tables, some peak supply capacities are smaller than peak demand even though LOLP is within the allowable range, which is less than 1.375% and equivalent to less than 5 days/year of shortage in the supply capacity in a year. In general, shortage in the supply capacity of ROR-type HPPs concentrates in the dry season, and energy supply by ROR-type HPPs decreases significantly. To cope with that, a part of the storage-type HPPs are operated at the output lower than the installed capacity for a long time to supply base demand. Therefore, the shortage of peak supply capacity occurs for some days within the above-mentioned allowable range. Regarding energy, on the other hand, nearly 100% is supplied in years when LOLP is within the allowable range.
For the base case, though the Kulekhani No. 3 HPP (14 MW), the Chameliya HPP (30 MW), and the Khani Khola HPP (25 MW) will be put into operation in FY2015/16, the supply capacity is not able to meet the peak demand. The LOLP is improved by comparison with previous years. It is, however, a significantly large value, 33%. In FY2016/17, the Upper Tamakoshi HPP (456 MW), the Upper Sanjen HPP (11 MW), the Sanjen HPP (42.9 MW), and the Upper Trishuli 3A HPP (60 MW) are put into operation, and the LOLP becomes lower than 3%, however it is larger than 1.375%, the allowable upper limit. After then, between FY2017/18 and FY2021/22, the Nadhya (Middle) Botekoshi HPP (102 MW), the Rasuwagad HPP (111 MW), the Rahughat HPP (32 MW), the Upper Marsyangdi HPP (50 MW), the Mistri HPP (42 MW), the Upper Trishuli 3B HPP (37 MW), the Tanahu HPP (140 MW), the Upper Modi A HPP, and the Tamakoshi V HPP (87 MW) are put into operation. Other than these HPPs, ROR-type HPPs totaling 300 MW are also put into operation, and the LOLP fluctuates in a range between 1.5% and 3%.
In FY2022/23, commissioning of the Budhi Gandaki HPP (600 MW) makes the power demand and supply balanced, and the LOLP becomes lower than the allowable upper limit, 1.375%. Then the Upper Arun HPP (335 MW: PROR type) is put into operation in FY2025/26, the Dudh Koshi HPP (300 MW) in FY2026/27, the Nalsyau Gad HPP (410 MW) in FY2028/29, and the West Seti HPP (750 MW) is put into operation in FY2030/31. Other than these HPPs, ROR-type HPPs totaling 200 MW are also put into operation, stable supply-demand situation continues until FY2031/32. (See Table A.4.2.3.2-1)
The power development plan for the high case of the demand forecast is much the same as that for the base case until commissioning of the Budhi Gandaki HPP in FY2022/23. After then, the Upper Arun (PROR type), the Nalsyau Gad, and the West Seti HPPs are put into operation in FY2024/25, FY2027/28, and FY2029/30 respectively. Their commissioning are one year earlier than the base case. In addition, the Chera-1 HPP (149 MW) is put into operation in FY2029/30, and the Andhi Khola HPP (180 MW) and the Kaligandaki-2 HPP (680 MW) are put into operation in FY2031/32. These three HPPs are not put into operation in and before FY2031/32 in the power development plan for the base case of demand forecast. (See Table A.4.2.3.2-2)
Final Report Appendix 4
A.4 - 6

Nationwide Master Plan Study on Storage-type Hydroelectric Power Development in Nepal
Final Report Appendix 4
A.4 - 7
The power development plan for the low case of demand forecast is also much the same as that for the base case until commissioning of the Budhi Gandaki HPP in FY2022/23. After then, commissioning of the Upper Arun, the Dudh Koshi, the Nalsyau Gad, and the West Seti HPPs are FY2026/27, FY2027/28, FY2029/30, and FY2031/32 respectively, one year later than for the base case of demand forecast. (See Table A.4.2.3.2-3)
Table A.4.2.3.2-4 Balance of Demand and Supply, LOLP, and Reserve Margin (Base Case)
(Candidates proposed by NEA are considered)
*: Critical LOLP is 1.375%, equivalent to 5 days/year.
InstalledCapacity
(MW)
PeakDemand(MW)
SupplyCapacity
(MW)
Supply –Demand(MW)
EnergyDemand(GWh)
SupplyEnergy(GWh)
Supply /Demand
(%)
LOLP(%)
ReserveMargin
(%)a b c d = c – b e f g = f / e h i = a / b – 1
2012/13 862 1,231 479 -752 5,607 4,707 84.0 50.375 -30.02013/14 862 1,277 477 -800 5,818 4,787 82.3 53.789 -32.52014/15 862 1,328 476 -852 6,049 4,865 80.4 57.975 -35.12015/16 1,081 1,382 696 -686 6,294 5,747 91.3 32.637 -21.82016/17 1,651 1,439 1,224 -215 6,556 6,527 99.6 2.733 14.72017/18 1,988 1,501 1,346 -155 6,836 6,819 99.8 1.575 32.52018/19 2,088 1,575 1,375 -200 7,176 7,154 99.7 1.927 32.52019/20 2,225 1,717 1,436 -281 7,823 7,788 99.6 2.579 29.62020/21 2,507 1,867 1,617 -250 8,504 8,481 99.7 1.919 34.32021/22 2,594 2,031 1,636 -395 9,252 9,198 99.4 3.087 27.72022/23 3,194 2,169 2,236 67 9,881 9,880 100.0 0.130 47.32023/24 3,194 2,321 2,236 -85 10,572 10,568 100.0 0.516 37.62024/25 3,294 2,513 2,265 -248 11,447 11,428 99.8 1.225 31.12025/26 3,729 2,714 2,537 -177 12,364 12,358 100.0 0.666 37.42026/27 4,029 2,925 2,837 -88 13,325 13,320 100.0 0.336 37.72027/28 4,029 3,158 2,837 -321 14,386 14,370 99.9 1.079 27.62028/29 4,439 3,410 3,247 -163 15,531 15,526 100.0 0.440 30.22029/30 4,439 3,676 3,247 -429 16,744 16,721 99.9 1.331 20.82030/31 5,189 3,966 3,997 31 18,066 18,066 100.0 0.075 30.82031/32 5,189 4,279 3,997 -282 19,493 19,484 100.0 0.590 21.3
FY
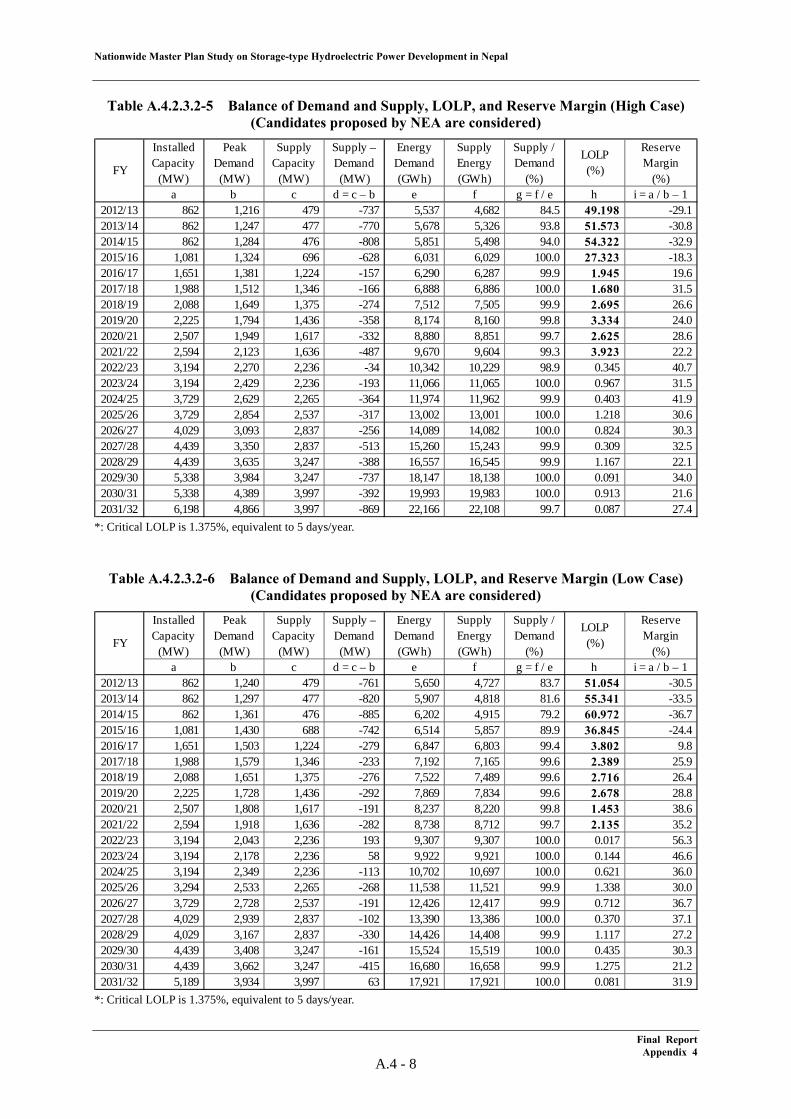
Nationwide Master Plan Study on Storage-type Hydroelectric Power Development in Nepal
Final Report Appendix 4
A.4 - 8
Table A.4.2.3.2-5 Balance of Demand and Supply, LOLP, and Reserve Margin (High Case) (Candidates proposed by NEA are considered)
*: Critical LOLP is 1.375%, equivalent to 5 days/year.
Table A.4.2.3.2-6 Balance of Demand and Supply, LOLP, and Reserve Margin (Low Case) (Candidates proposed by NEA are considered)
*: Critical LOLP is 1.375%, equivalent to 5 days/year.
InstalledCapacity
(MW)
PeakDemand(MW)
SupplyCapacity
(MW)
Supply –Demand(MW)
EnergyDemand(GWh)
SupplyEnergy(GWh)
Supply /Demand
(%)
LOLP(%)
ReserveMargin
(%)a b c d = c – b e f g = f / e h i = a / b – 1
2012/13 862 1,216 479 -737 5,537 4,682 84.5 49.198 -29.12013/14 862 1,247 477 -770 5,678 5,326 93.8 51.573 -30.82014/15 862 1,284 476 -808 5,851 5,498 94.0 54.322 -32.92015/16 1,081 1,324 696 -628 6,031 6,029 100.0 27.323 -18.32016/17 1,651 1,381 1,224 -157 6,290 6,287 99.9 1.945 19.62017/18 1,988 1,512 1,346 -166 6,888 6,886 100.0 1.680 31.52018/19 2,088 1,649 1,375 -274 7,512 7,505 99.9 2.695 26.62019/20 2,225 1,794 1,436 -358 8,174 8,160 99.8 3.334 24.02020/21 2,507 1,949 1,617 -332 8,880 8,851 99.7 2.625 28.62021/22 2,594 2,123 1,636 -487 9,670 9,604 99.3 3.923 22.22022/23 3,194 2,270 2,236 -34 10,342 10,229 98.9 0.345 40.72023/24 3,194 2,429 2,236 -193 11,066 11,065 100.0 0.967 31.52024/25 3,729 2,629 2,265 -364 11,974 11,962 99.9 0.403 41.92025/26 3,729 2,854 2,537 -317 13,002 13,001 100.0 1.218 30.62026/27 4,029 3,093 2,837 -256 14,089 14,082 100.0 0.824 30.32027/28 4,439 3,350 2,837 -513 15,260 15,243 99.9 0.309 32.52028/29 4,439 3,635 3,247 -388 16,557 16,545 99.9 1.167 22.12029/30 5,338 3,984 3,247 -737 18,147 18,138 100.0 0.091 34.02030/31 5,338 4,389 3,997 -392 19,993 19,983 100.0 0.913 21.62031/32 6,198 4,866 3,997 -869 22,166 22,108 99.7 0.087 27.4
FY
InstalledCapacity
(MW)
PeakDemand(MW)
SupplyCapacity
(MW)
Supply –Demand(MW)
EnergyDemand(GWh)
SupplyEnergy(GWh)
Supply /Demand
(%)
LOLP(%)
ReserveMargin
(%)a b c d = c – b e f g = f / e h i = a / b – 1
2012/13 862 1,240 479 -761 5,650 4,727 83.7 51.054 -30.52013/14 862 1,297 477 -820 5,907 4,818 81.6 55.341 -33.52014/15 862 1,361 476 -885 6,202 4,915 79.2 60.972 -36.72015/16 1,081 1,430 688 -742 6,514 5,857 89.9 36.845 -24.42016/17 1,651 1,503 1,224 -279 6,847 6,803 99.4 3.802 9.82017/18 1,988 1,579 1,346 -233 7,192 7,165 99.6 2.389 25.92018/19 2,088 1,651 1,375 -276 7,522 7,489 99.6 2.716 26.42019/20 2,225 1,728 1,436 -292 7,869 7,834 99.6 2.678 28.82020/21 2,507 1,808 1,617 -191 8,237 8,220 99.8 1.453 38.62021/22 2,594 1,918 1,636 -282 8,738 8,712 99.7 2.135 35.22022/23 3,194 2,043 2,236 193 9,307 9,307 100.0 0.017 56.32023/24 3,194 2,178 2,236 58 9,922 9,921 100.0 0.144 46.62024/25 3,194 2,349 2,236 -113 10,702 10,697 100.0 0.621 36.02025/26 3,294 2,533 2,265 -268 11,538 11,521 99.9 1.338 30.02026/27 3,729 2,728 2,537 -191 12,426 12,417 99.9 0.712 36.72027/28 4,029 2,939 2,837 -102 13,390 13,386 100.0 0.370 37.12028/29 4,029 3,167 2,837 -330 14,426 14,408 99.9 1.117 27.22029/30 4,439 3,408 3,247 -161 15,524 15,519 100.0 0.435 30.32030/31 4,439 3,662 3,247 -415 16,680 16,658 99.9 1.275 21.22031/32 5,189 3,934 3,997 63 17,921 17,921 100.0 0.081 31.9
FY
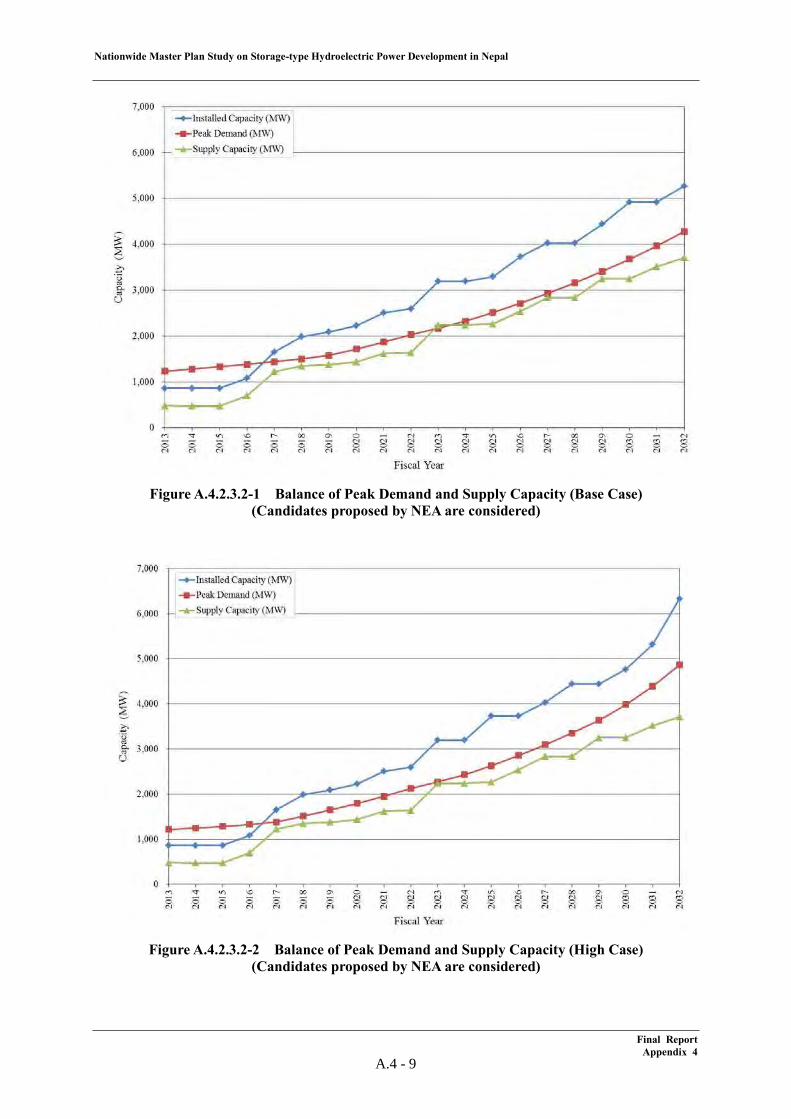
Nationwide Master Plan Study on Storage-type Hydroelectric Power Development in Nepal
Figure A.4.2.3.2-1 Balance of Peak Demand and Supply Capacity (Base Case)(Candidates proposed by NEA are considered)
Figure A.4.2.3.2-2 Balance of Peak Demand and Supply Capacity (High Case)(Candidates proposed by NEA are considered)
Final ReportAppendix 4
A.4 - 9
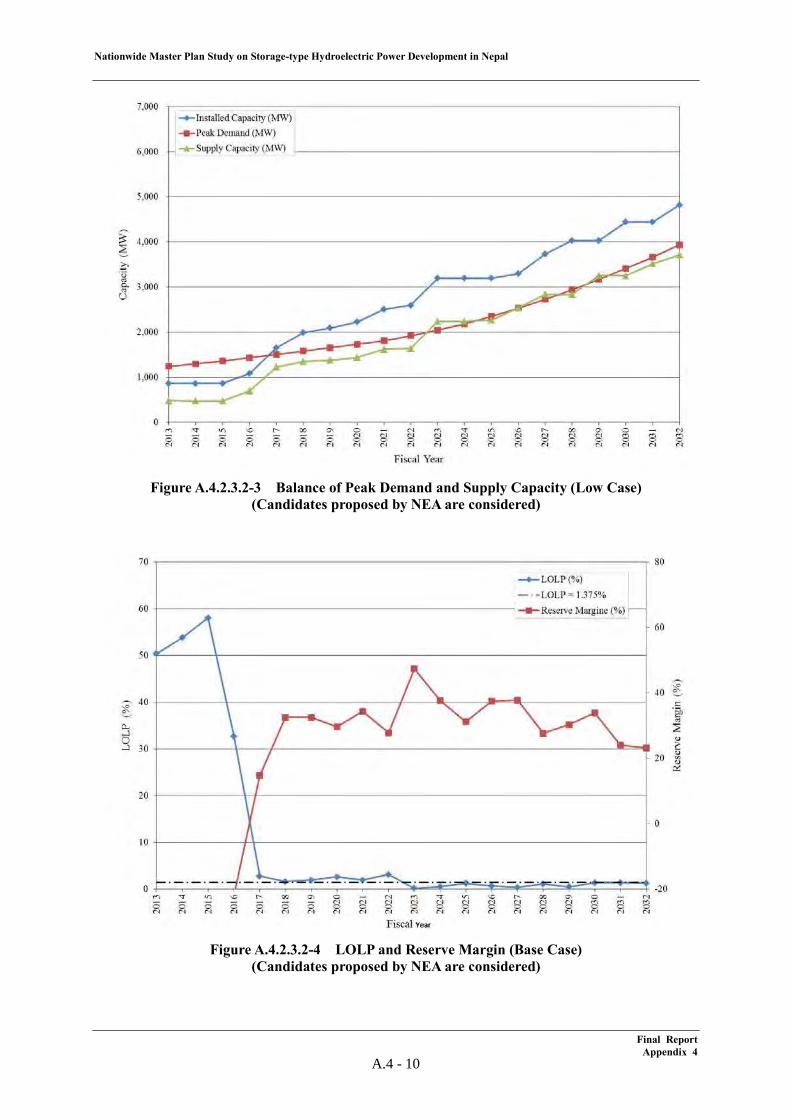
Nationwide Master Plan Study on Storage-type Hydroelectric Power Development in Nepal
Figure A.4.2.3.2-3 Balance of Peak Demand and Supply Capacity (Low Case)(Candidates proposed by NEA are considered)
Figure A.4.2.3.2-4 LOLP and Reserve Margin (Base Case)(Candidates proposed by NEA are considered)
Final ReportAppendix 4
A.4 - 10
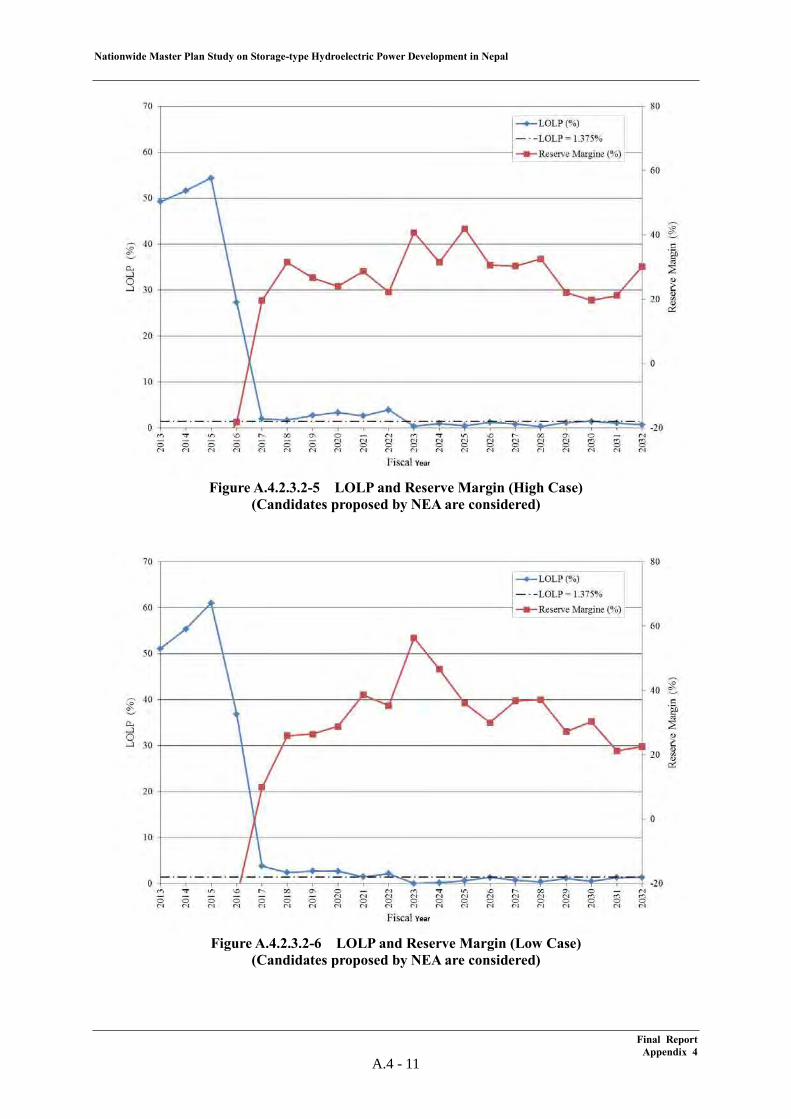
Nationwide Master Plan Study on Storage-type Hydroelectric Power Development in Nepal
Figure A.4.2.3.2-5 LOLP and Reserve Margin (High Case)(Candidates proposed by NEA are considered)
Figure A.4.2.3.2-6 LOLP and Reserve Margin (Low Case)(Candidates proposed by NEA are considered)
Final ReportAppendix 4
A.4 - 11
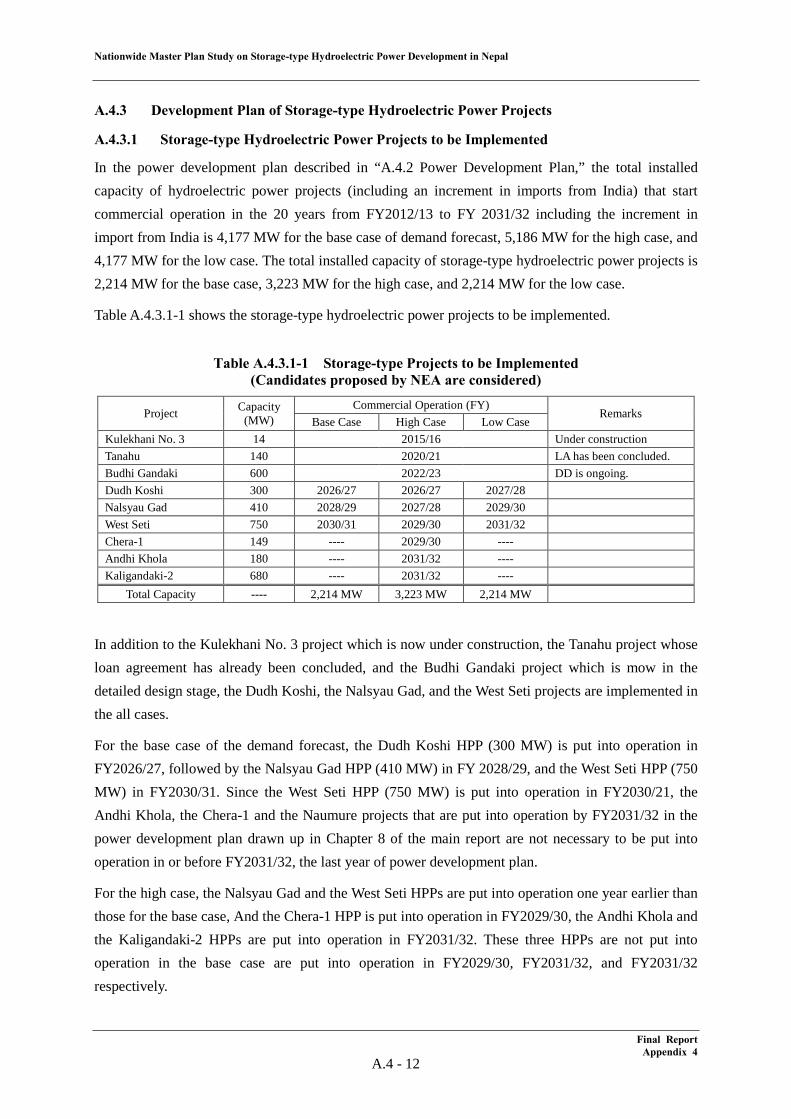
Nationwide Master Plan Study on Storage-type Hydroelectric Power Development in Nepal
A.4.3 Development Plan of Storage-type Hydroelectric Power Projects
A.4.3.1 Storage-type Hydroelectric Power Projects to be Implemented
In the power development plan described in “A.4.2 Power Development Plan,” the total installed capacity of hydroelectric power projects (including an increment in imports from India) that start commercial operation in the 20 years from FY2012/13 to FY 2031/32 including the increment in import from India is 4,177 MW for the base case of demand forecast, 5,186 MW for the high case, and 4,177 MW for the low case. The total installed capacity of storage-type hydroelectric power projects is 2,214 MW for the base case, 3,223 MW for the high case, and 2,214 MW for the low case.
Table A.4.3.1-1 shows the storage-type hydroelectric power projects to be implemented.
Table A.4.3.1-1 Storage-type Projects to be Implemented
(Candidates proposed by NEA are considered)
Project Capacity (MW)
Commercial Operation (FY) Remarks
Base Case High Case Low Case Kulekhani No. 3 14 2015/16 Under construction Tanahu 140 2020/21 LA has been concluded. Budhi Gandaki 600 2022/23 DD is ongoing. Dudh Koshi 300 2026/27 2026/27 2027/28 Nalsyau Gad 410 2028/29 2027/28 2029/30 West Seti 750 2030/31 2029/30 2031/32 Chera-1 149 ---- 2029/30 ---- Andhi Khola 180 ---- 2031/32 ---- Kaligandaki-2 680 ---- 2031/32 ----
Total Capacity ---- 2,214 MW 3,223 MW 2,214 MW
In addition to the Kulekhani No. 3 project which is now under construction, the Tanahu project whose loan agreement has already been concluded, and the Budhi Gandaki project which is mow in the detailed design stage, the Dudh Koshi, the Nalsyau Gad, and the West Seti projects are implemented in the all cases.
For the base case of the demand forecast, the Dudh Koshi HPP (300 MW) is put into operation in FY2026/27, followed by the Nalsyau Gad HPP (410 MW) in FY 2028/29, and the West Seti HPP (750 MW) in FY2030/31. Since the West Seti HPP (750 MW) is put into operation in FY2030/21, the Andhi Khola, the Chera-1 and the Naumure projects that are put into operation by FY2031/32 in the power development plan drawn up in Chapter 8 of the main report are not necessary to be put into operation in or before FY2031/32, the last year of power development plan.
For the high case, the Nalsyau Gad and the West Seti HPPs are put into operation one year earlier than those for the base case, And the Chera-1 HPP is put into operation in FY2029/30, the Andhi Khola and the Kaligandaki-2 HPPs are put into operation in FY2031/32. These three HPPs are not put into operation in the base case are put into operation in FY2029/30, FY2031/32, and FY2031/32 respectively.
Final Report Appendix 4
A.4 - 12
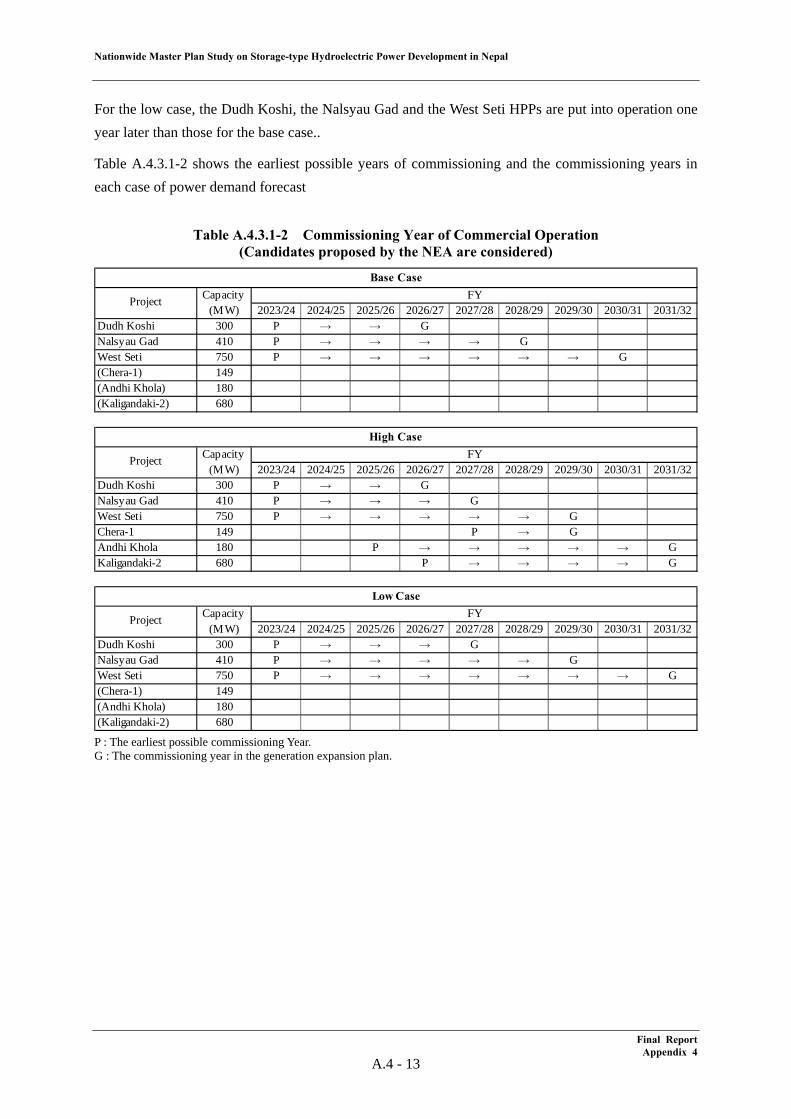
Nationwide Master Plan Study on Storage-type Hydroelectric Power Development in Nepal
Final Report Appendix 4
A.4 - 13
For the low case, the Dudh Koshi, the Nalsyau Gad and the West Seti HPPs are put into operation one year later than those for the base case..
Table A.4.3.1-2 shows the earliest possible years of commissioning and the commissioning years in each case of power demand forecast
Table A.4.3.1-2 Commissioning Year of Commercial Operation
(Candidates proposed by the NEA are considered)
P : The earliest possible commissioning Year. G : The commissioning year in the generation expansion plan.
Base CaseFY
2023/24 2024/25 2025/26 2026/27 2027/28 2028/29 2029/30 2030/31 2031/32Dudh Koshi 300 P → → GNalsyau Gad 410 P → → → → GWest Seti 750 P → → → → → → G(Chera-1) 149(Andhi Khola) 180(Kaligandaki-2) 680
High CaseFY
2023/24 2024/25 2025/26 2026/27 2027/28 2028/29 2029/30 2030/31 2031/32Dudh Koshi 300 P → → GNalsyau Gad 410 P → → → GWest Seti 750 P → → → → → GChera-1 149 P → GAndhi Khola 180 P → → → → → GKaligandaki-2 680 P → → → → G
Low CaseFY
2023/24 2024/25 2025/26 2026/27 2027/28 2028/29 2029/30 2030/31 2031/32Dudh Koshi 300 P → → → GNalsyau Gad 410 P → → → → → GWest Seti 750 P → → → → → → → G(Chera-1) 149(Andhi Khola) 180(Kaligandaki-2) 680
Project Capacity(MW)
Project Capacity(MW)
Project Capacity(MW)


