233
Appendix 4: CASTNET Laboratory Standard Operating Procedures

Appendix 4: CASTNET Laboratory Standard Operating Procedures

Clean Air Status and Trends Network
Quality Assurance Project Plan
Revision 9.1
Appendix 4:
CASTNET Laboratory Standard Operating Procedures
October 2017
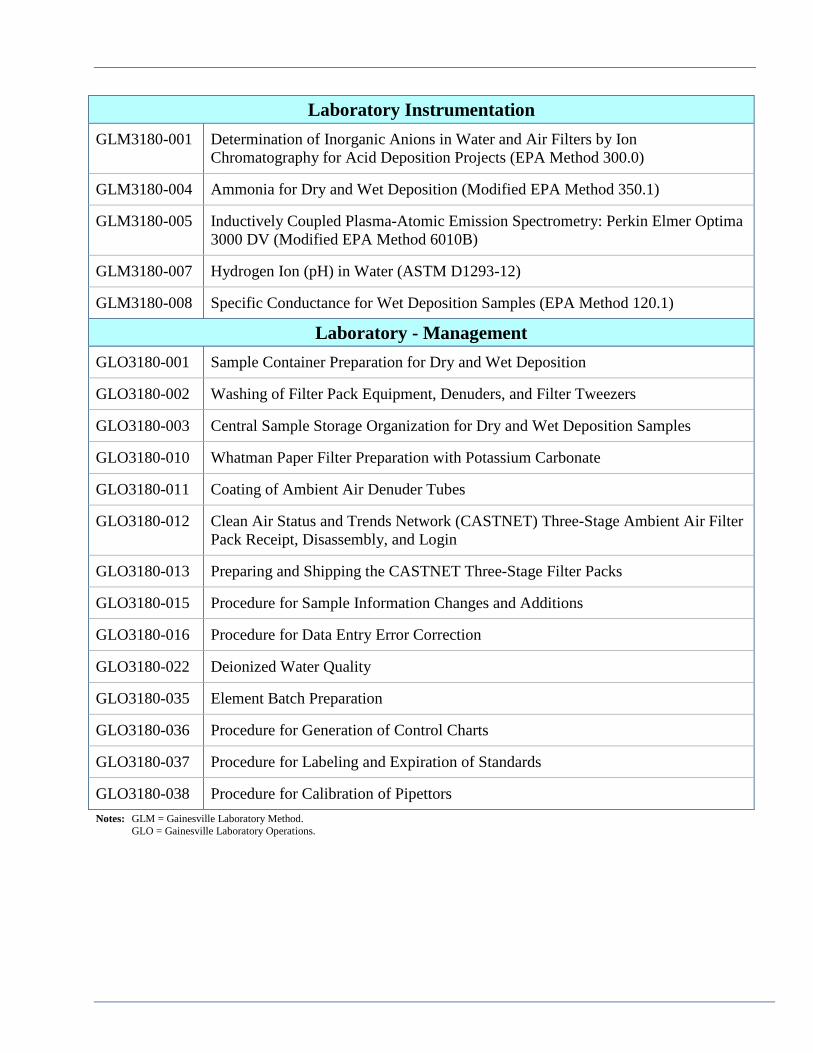
Laboratory Instrumentation
GLM3180-001 Determination of Inorganic Anions in Water and Air Filters by Ion Chromatography for Acid Deposition Projects (EPA Method 300.0)
GLM3180-004 Ammonia for Dry and Wet Deposition (Modified EPA Method 350.1)
GLM3180-005 Inductively Coupled Plasma-Atomic Emission Spectrometry: Perkin Elmer Optima 3000 DV (Modified EPA Method 6010B)
GLM3180-007 Hydrogen Ion (pH) in Water (ASTM D1293-12)
GLM3180-008 Specific Conductance for Wet Deposition Samples (EPA Method 120.1)
Laboratory - Management
GLO3180-001 Sample Container Preparation for Dry and Wet Deposition
GLO3180-002 Washing of Filter Pack Equipment, Denuders, and Filter Tweezers
GLO3180-003 Central Sample Storage Organization for Dry and Wet Deposition Samples
GLO3180-010 Whatman Paper Filter Preparation with Potassium Carbonate
GLO3180-011 Coating of Ambient Air Denuder Tubes
GLO3180-012 Clean Air Status and Trends Network (CASTNET) Three-Stage Ambient Air Filter Pack Receipt, Disassembly, and Login
GLO3180-013 Preparing and Shipping the CASTNET Three-Stage Filter Packs
GLO3180-015 Procedure for Sample Information Changes and Additions
GLO3180-016 Procedure for Data Entry Error Correction
GLO3180-022 Deionized Water Quality
GLO3180-035 Element Batch Preparation
GLO3180-036 Procedure for Generation of Control Charts
GLO3180-037 Procedure for Labeling and Expiration of Standards
GLO3180-038 Procedure for Calibration of Pipettors
Notes: GLM = Gainesville Laboratory Method. GLO = Gainesville Laboratory Operations.


GLM-3180-001
Revision No 14 May 2017
Page 2 of 19
GLM-3180-001_R14 Amec Foster Wheeler
DETERMINATION OF INORGANIC ANIONS IN WATER AND AIR FILTERS BY ION
CHROMATOGRAPHY FOR ACID DEPOSITION PROJECTS
(EPA METHOD 300.0, MODIFIED)
1.0 PURPOSE
The purpose of this standard operating procedure (SOP) is to provide consistent guidance to
Amec Foster Wheeler Environment & Infrastructure, Inc. (Amec Foster Wheeler) laboratory
personnel for the determination of inorganic anions in air filters, water, and annular denuders by
ion chromatography (IC). The anions of interest include particulate chloride (Cl-), particulate
nitrite (NO -
2), particulate nitrate (NO -
3), nitric acid (HNO
3); and gaseous sulfur dioxide (SO
2) as
particulate sulfate (SO2-
4), depending on filter type; and particulate sulfate (SO2-
4).
2.0 SCOPE
This method is used for acid deposition projects and covers the determination of selected
inorganic ions by IC in rainwater, cloud water, lake water, snow, and in various filter media as
dry deposition.
3.0 SUMMARY OF METHOD
An aliquot of a water sample or an aliquot of an extract (filter or denuder) is passed through a
series of ion exchangers. The anions of interest are separated on the basis of their relative
affinities for a strongly basic anion exchanger (analytical column) and then converted to their
highly conductive acid form by membrane suppression. Detection is accomplished by electrical
conductivity. The resulting chromatographic peaks are identified on the basis of retention time
compared to known standards. Quantitation is performed by the comparison of the peak area to
the calibration curve areas.
3.1 Method Interferences
Interferences can be caused by substances with retention times that are similar to and overlap
with those of the anion(s) of interest. Column overloading can lead to peak tailing, poor peak
resolution, and/or carryover into an adjacent downfield peak.
Method interferences may be caused by contaminants in the reagent water, reagents, glassware,
or other sample processing accessories that lead to discrete artifacts or an elevated baseline in
ion chromatograms.
Samples that contain particles larger than 0.45 micrometers (m) and reagent solutions that
contain particles larger than 0.20 m require filtration to prevent damage to instrument columns
and flow systems.

GLM-3180-001
Revision No 14 May 2017
Page 3 of 19
GLM-3180-001_R14 Amec Foster Wheeler
3.2 Deviations from the Method
A general overview of the steps described in this SOP is depicted in Figure 1. Deviations from
the analytical method described in this SOP are not permitted.
Figure 1 Overview – Laboratory Operations Procedures for Filter Packs
Teflon Filter in 30-mL Bottle
Stored at 4°C
(White label)
Nylon Filter in 30-mL Bottle
Stored at 4°C
(Orange label)
Cellulose Filter in 60-mL Bottle
Stored at 4°C
(Blue label)
Extract with 25 mL of Teflon
extraction solution.
Extract with 25 mL of nylon
extraction solution.
Extract with 50 mL of cellulose
extraction solution.
Store at 4°C, for not less than 8 hours.
Analyze by ICP-AES: Ca2+
, Mg2+
,
Na+
, K+
Analyze by IC: SO2-
4 and NO - 3
Analyze by AC: NH+
4
Analyze by IC: SO2-
4 and NO - 3 Analyze by IC: SO
2
Data Transfer to Network via DataTool to Element
QC Fails;
Need explanation or rerun samples
Verify acceptance criteria is
met for QC samples
QC Passes; Data Locked
in Element
Data Transmittal monthly to
DMC for calculation of
atmospheric concentrations

GLM-3180-001
Revision No 14 May 2017
Page 4 of 19
GLM-3180-001_R14 Amec Foster Wheeler
4.0 MATERIALS
4.1 Apparatus
Analytical balance capable of accurately weighing to the nearest 0.01 gram (g)
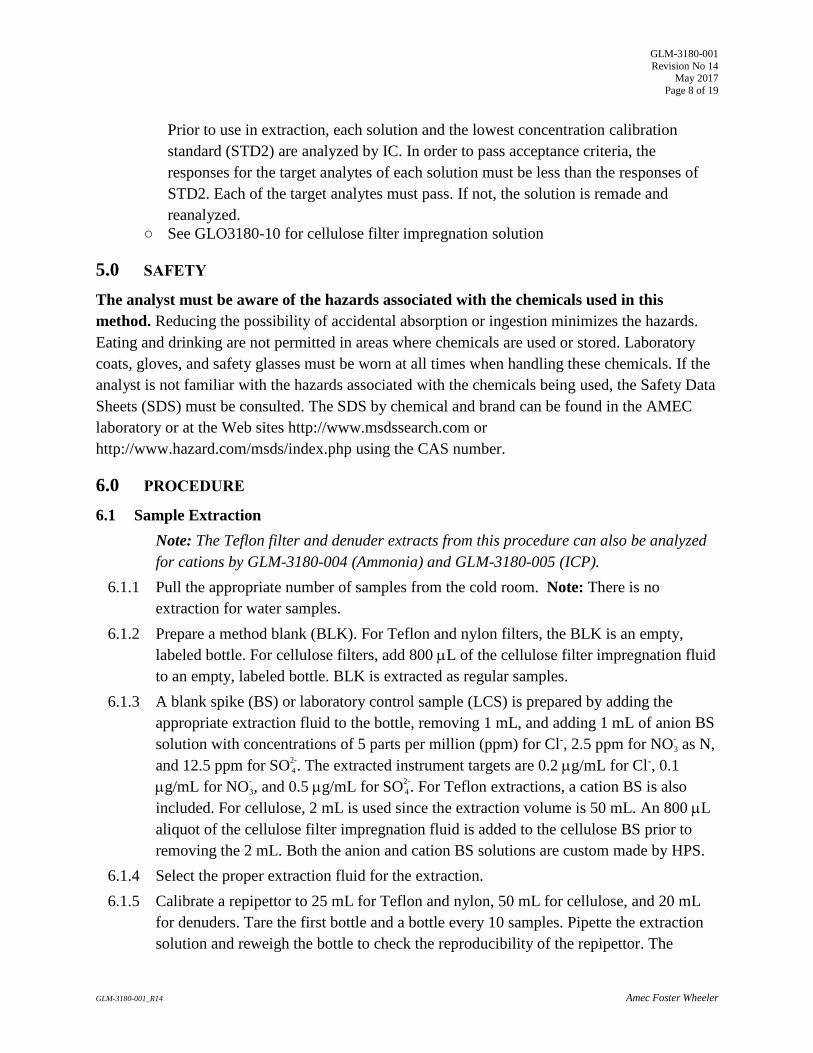
Ion chromatograph: Dionex ICS-1600 or equivalent (see Figure 2)
Anion guard column: Dionex AG14, AG22, AG22-Fast or equivalent
Anion analytical column: Dionex, AS14, AS22, AS22-Fast or equivalent
Anion self-regenerating suppressor: ASRS-300, or equivalent
Conductivity cell detector: Approximately 1.25 microliter (L)-internal volume or equivalent
Appropriate autosampler vials and caps
Eppendorf variable or fixed volume pipettors or equivalent with appropriate disposable tips
Disposable plastic beakers
Shaker tables
Ultrasonic baths
Figure 2 Dionex ICS-1600 Ion Chromatograph

GLM-3180-001
Revision No 14 May 2017
Page 5 of 19
GLM-3180-001_R14 Amec Foster Wheeler
4.2 Reagents
4.2.1 Water and Single Compounds
Reagent water: deionized (DI) water of resistivity of 15 mega ohms (M) or greater
derived from mixed bed ion exchangers, activated carbon filters, and polishing
exchangers. Water should contain particles no larger than 0.20 m.
Sodium hydroxide (NaOH) 2 normal (N) solution, American Chemical Society
(ACS) reagent grade or better. Chemical Abstracts Service Registry Number (CAS#)
1310-73-2
Sodium bicarbonate (NaHCO
3), ACS reagent grade or better. CAS# 144-55-8
Sodium carbonate (Na
2CO
3), ACS reagent grade or better. CAS# 497-19-8
Concentrated hydrochloric acid (HCl), ACS reagent grade or better. CAS# 7647-01-0
Hydrogen peroxide (H
2O
2), 30 percent volume-to-volume (v/v), ACS reagent grade or
better. CAS# 7722-84-1
4.2.2 Mixtures
Eluent (mobile phase) solutions: A solution of a suitable Na
2CO
3/NaHCO
3 buffer
prepared as determined by the choice of analytical column. The solutions used for the
AS22, AS22-Fast and AS14 columns follow.
AS22 and AS22-Fast concentrated eluent solution: 600 millimolar (mM) NaHCO
3
/400 mM
Na
2CO
3: Dissolve 100.59 g NaHCO
3 and 84.28 g Na
2CO
3 in reagent water and
dilute to 2 liters (L).
AS 14 concentrated eluent solution: 100 mM NaHCO
3/350 mM Na
2CO
3: Dissolve
16.78g NaHCO
3 and 73.96g Na
2CO
3 in reagent water and dilute to 2 L
Working eluent solutions: Dilute 40 milliliters (mL) of the appropriate concentrated
eluent solution to 4 L with reagent water. The final concentrations of the listed
working eluent solutions are as follows:
AS22 and AS22-Fast– 4.0/ 6.0 mM CO -
3/HCO -
3
AS14 #2- 3.5/1.0 mM CO -
3/HCO
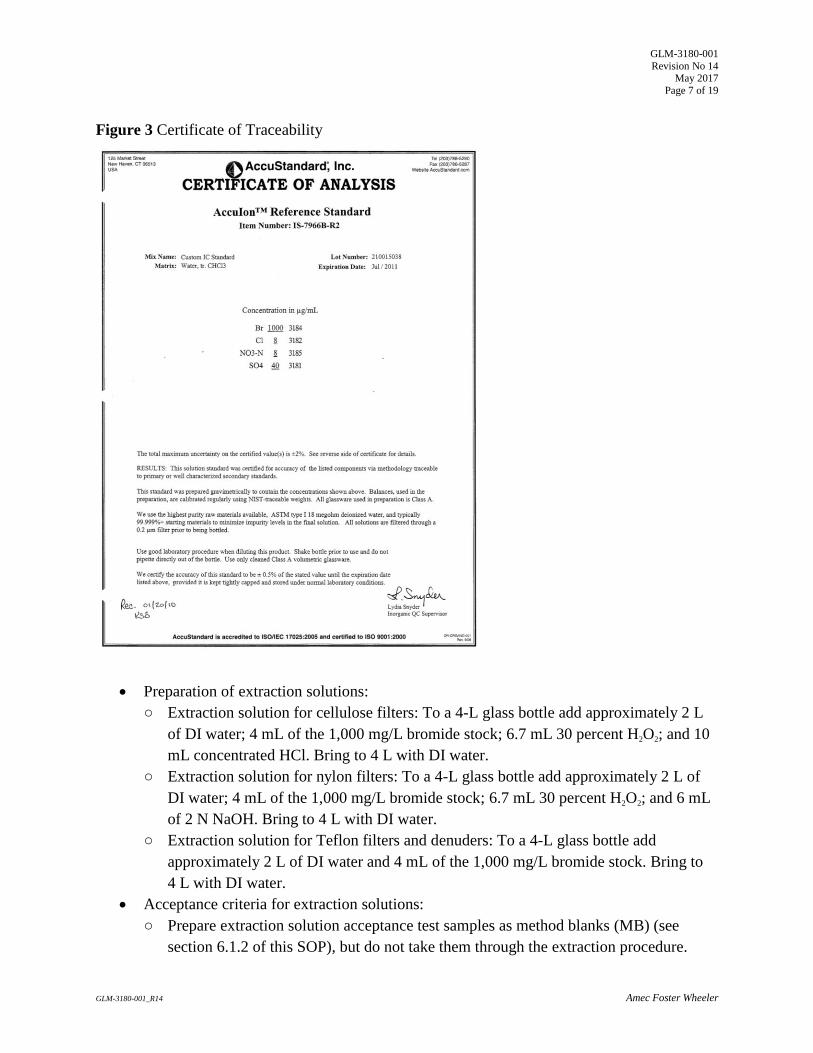
Calibration stock solutions are purchased as National institute of Standards and
Technology (NIST)-traceable solutions. A Certificate of Traceability (Figure 3) and
an expiration date will be provided with each stock. These solutions are purchased as
a set of nine from AccuStandard. NO-
2 and NO-
3 are expressed in terms of nitrogen. A
minimum of five points shall be used for each calibration curve. The concentrations
of the daily curve are listed in Table 1 in units of micrograms (g) per mL:
GLM-3180-001
Revision No 14 May 2017
Page 6 of 19
GLM-3180-001_R14 Amec Foster Wheeler
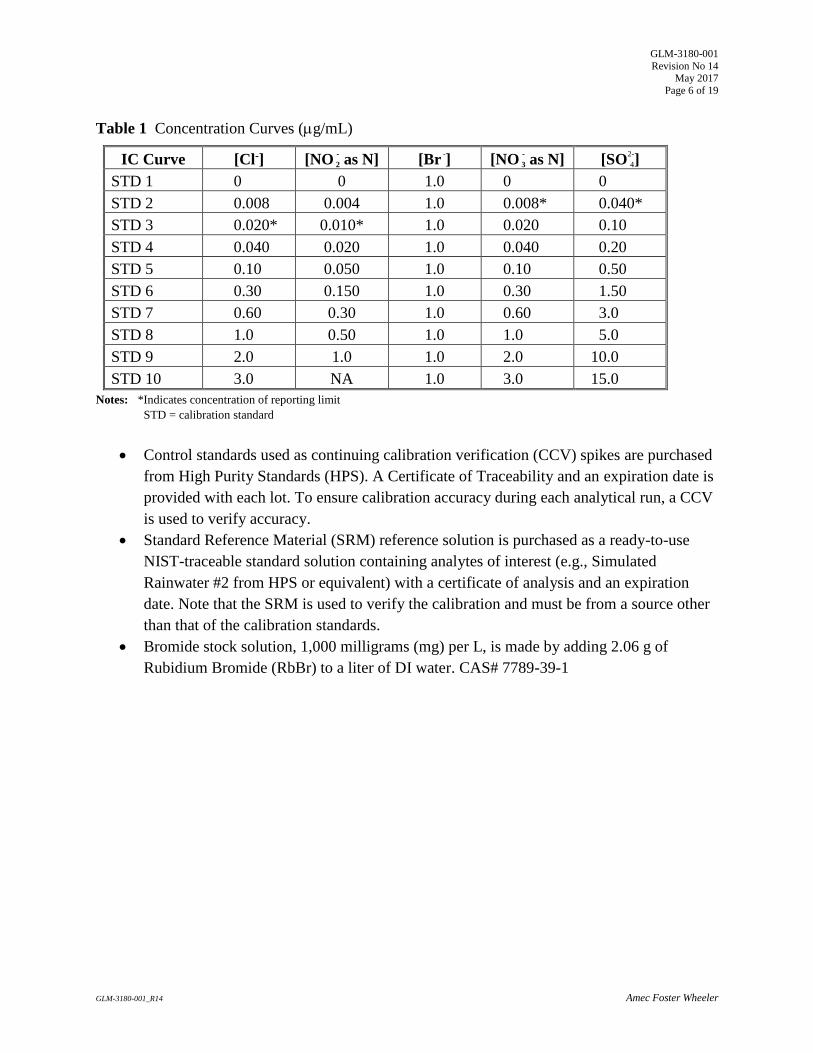
Table 1 Concentration Curves (g/mL)
IC Curve [Cl-] [NO -
2 as N] [Br -
] [NO -
3 as N] [SO2-
4]
STD 1 0 0 1.0 0 0
STD 2 0.008 0.004 1.0 0.008* 0.040*
STD 3 0.020* 0.010* 1.0 0.020 0.10
STD 4 0.040 0.020 1.0 0.040 0.20
STD 5 0.10 0.050 1.0 0.10 0.50
STD 6 0.30 0.150 1.0 0.30 1.50
STD 7 0.60 0.30 1.0 0.60 3.0
STD 8 1.0 0.50 1.0 1.0 5.0
STD 9 2.0 1.0 1.0 2.0 10.0
STD 10 3.0 NA 1.0 3.0 15.0
Notes: *Indicates concentration of reporting limit
STD = calibration standard
Control standards used as continuing calibration verification (CCV) spikes are purchased
from High Purity Standards (HPS). A Certificate of Traceability and an expiration date is
provided with each lot. To ensure calibration accuracy during each analytical run, a CCV
is used to verify accuracy.
Standard Reference Material (SRM) reference solution is purchased as a ready-to-use
NIST-traceable standard solution containing analytes of interest (e.g., Simulated
Rainwater #2 from HPS or equivalent) with a certificate of analysis and an expiration
date. Note that the SRM is used to verify the calibration and must be from a source other
than that of the calibration standards.
Bromide stock solution, 1,000 milligrams (mg) per L, is made by adding 2.06 g of
Rubidium Bromide (RbBr) to a liter of DI water. CAS# 7789-39-1
GLM-3180-001
Revision No 14 May 2017
Page 7 of 19
GLM-3180-001_R14 Amec Foster Wheeler
Figure 3 Certificate of Traceability
Preparation of extraction solutions:
Extraction solution for cellulose filters: To a 4-L glass bottle add approximately 2 L
of DI water; 4 mL of the 1,000 mg/L bromide stock; 6.7 mL 30 percent H
2O
2; and 10
mL concentrated HCl. Bring to 4 L with DI water.
Extraction solution for nylon filters: To a 4-L glass bottle add approximately 2 L of
DI water; 4 mL of the 1,000 mg/L bromide stock; 6.7 mL 30 percent H
2O
2; and 6 mL
of 2 N NaOH. Bring to 4 L with DI water.
Extraction solution for Teflon filters and denuders: To a 4-L glass bottle add
approximately 2 L of DI water and 4 mL of the 1,000 mg/L bromide stock. Bring to
4 L with DI water.
Acceptance criteria for extraction solutions:
Prepare extraction solution acceptance test samples as method blanks (MB) (see
section 6.1.2 of this SOP), but do not take them through the extraction procedure.
GLM-3180-001
Revision No 14 May 2017
Page 8 of 19
GLM-3180-001_R14 Amec Foster Wheeler
Prior to use in extraction, each solution and the lowest concentration calibration
standard (STD2) are analyzed by IC. In order to pass acceptance criteria, the
responses for the target analytes of each solution must be less than the responses of
STD2. Each of the target analytes must pass. If not, the solution is remade and
reanalyzed.
See GLO3180-10 for cellulose filter impregnation solution
5.0 SAFETY
The analyst must be aware of the hazards associated with the chemicals used in this
method. Reducing the possibility of accidental absorption or ingestion minimizes the hazards.
Eating and drinking are not permitted in areas where chemicals are used or stored. Laboratory
coats, gloves, and safety glasses must be worn at all times when handling these chemicals. If the
analyst is not familiar with the hazards associated with the chemicals being used, the Safety Data
Sheets (SDS) must be consulted. The SDS by chemical and brand can be found in the AMEC
laboratory or at the Web sites http://www.msdssearch.com or
http://www.hazard.com/msds/index.php using the CAS number.
6.0 PROCEDURE
6.1 Sample Extraction
Note: The Teflon filter and denuder extracts from this procedure can also be analyzed
for cations by GLM-3180-004 (Ammonia) and GLM-3180-005 (ICP).
6.1.1 Pull the appropriate number of samples from the cold room. Note: There is no
extraction for water samples.
6.1.2 Prepare a method blank (BLK). For Teflon and nylon filters, the BLK is an empty,
labeled bottle. For cellulose filters, add 800 L of the cellulose filter impregnation fluid
to an empty, labeled bottle. BLK is extracted as regular samples.
6.1.3 A blank spike (BS) or laboratory control sample (LCS) is prepared by adding the
appropriate extraction fluid to the bottle, removing 1 mL, and adding 1 mL of anion BS
solution with concentrations of 5 parts per million (ppm) for Cl-, 2.5 ppm for NO-
3 as N,
and 12.5 ppm for SO2-
4 . The extracted instrument targets are 0.2 g/mL for Cl-, 0.1
g/mL for NO-
3, and 0.5 g/mL for SO2-
4 . For Teflon extractions, a cation BS is also
included. For cellulose, 2 mL is used since the extraction volume is 50 mL. An 800 L
aliquot of the cellulose filter impregnation fluid is added to the cellulose BS prior to
removing the 2 mL. Both the anion and cation BS solutions are custom made by HPS.
6.1.4 Select the proper extraction fluid for the extraction.
6.1.5 Calibrate a repipettor to 25 mL for Teflon and nylon, 50 mL for cellulose, and 20 mL
for denuders. Tare the first bottle and a bottle every 10 samples. Pipette the extraction
solution and reweigh the bottle to check the reproducibility of the repipettor. The

GLM-3180-001
Revision No 14 May 2017
Page 9 of 19
GLM-3180-001_R14 Amec Foster Wheeler
acceptable limits are 25.00 0.10 g for Teflon and nylon, 50.00 0.20 g for cellulose,
and 20.00 0.10 g for denuders. Record the checked weights in the “Notes” section of
the run log.
6.1.6 Extract the samples according to filter type (see Figure 1). Visually confirm that the
proper filter type is in the bottle with each sample.
Teflon and cellulose: 15 minutes shake, 30 minutes sonication, and 15 minutes shake.
Teflon filters use the “high” shaker setting. Cellulose filters use the “low” setting.
Nylon: 30 minutes high-speed shake.
Denuders: 20 inversions and rotations (done by hand). After extraction, the denuder
extract is transferred to a 30-mL Nalgene bottle.
6.1.7 A peer review will be done to verify that the sample IDs on the extract bottles match
the extraction worksheet.
Note: Sample extracts must be stored at 4 ± 2 degrees Celsius (C) for at least 8 hours
prior to analysis. This step ensures the reaction between the extraction fluid and the
sample filter is complete.
6.2 Sample Analysis
6.2.1 Establish a stable baseline by pumping the mobile phase (Section 4.2.2 of this SOP)
through the instrument for at least 30 minutes. The operator’s manuals provided by the
manufacturer contain detailed information regarding optimization of instrument
performance and optimum operating criteria.
6.2.2 Load the auto-sampler vials beginning with the calibration curve followed by the
extracted method blank (BLK1), the initial control standard (CCV1), the initial reference
sample (SRM1), and extracted samples. Additional control standards (CCV2 through
CCV9, CCVA, and CCVB) should be run every 10 samples and at the end of the
analytical run. A second RF (SRM2) should also be run preceding the end-of-run CCVx.
Note: Verify that the run-log printout auto-sampler positions are correct and the extract
bottle IDs match the runlog; initial when complete.
6.2.3 Each auto-sampler vial cap is scored with a razor knife. The razor knife is rinsed with
Deionized water and wiped with a Kim wipe prior to scoring the cap. A number of auto-
sampler vial caps will be scored in advance and stored in a clean container for future use.
This additional step prevents the auto-sampler needle from getting bent causing a bad
injection/replacement. Samples that have responses exceeding the highest standard must
be diluted and reanalyzed in the next available run.

GLM-3180-001
Revision No 14 May 2017
Page 10 of 19
GLM-3180-001_R14 Amec Foster Wheeler
6.3 Data Analysis
6.3.1 Data files are processed using algorithms contained in the data collection software.
Thermo-Fisher Dionex Chromeleon 7.2 software is currently in use. Parameters are
adjusted as dictated by instrument performance.
6.3.2 Examine all chromatograms visually (Figure 4). Note any anomalies in the data batch
narrative.
Figure 4 IC Chromatogram
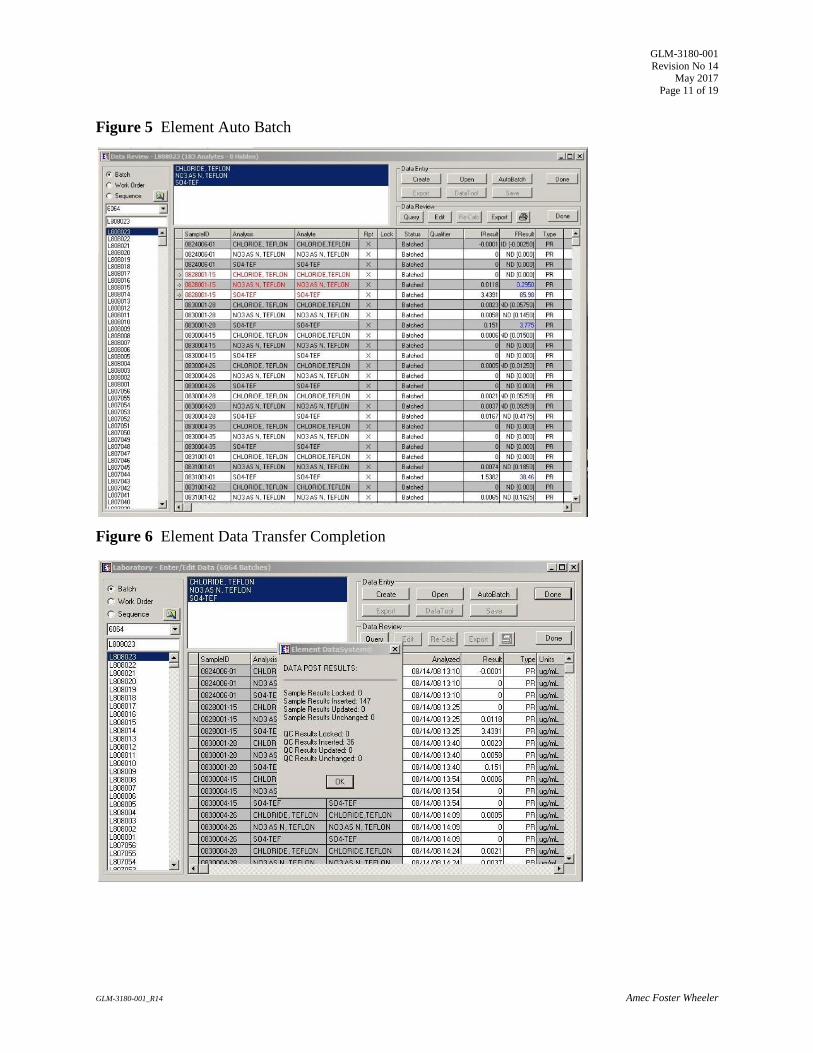
6.3.3 Prepare the Element upload file (Figure 5) using the batch processing feature of the
Chromeleon software, and generate an upload file in final concentration as described in
SOP GLO3180-35, Element Batch Preparation.
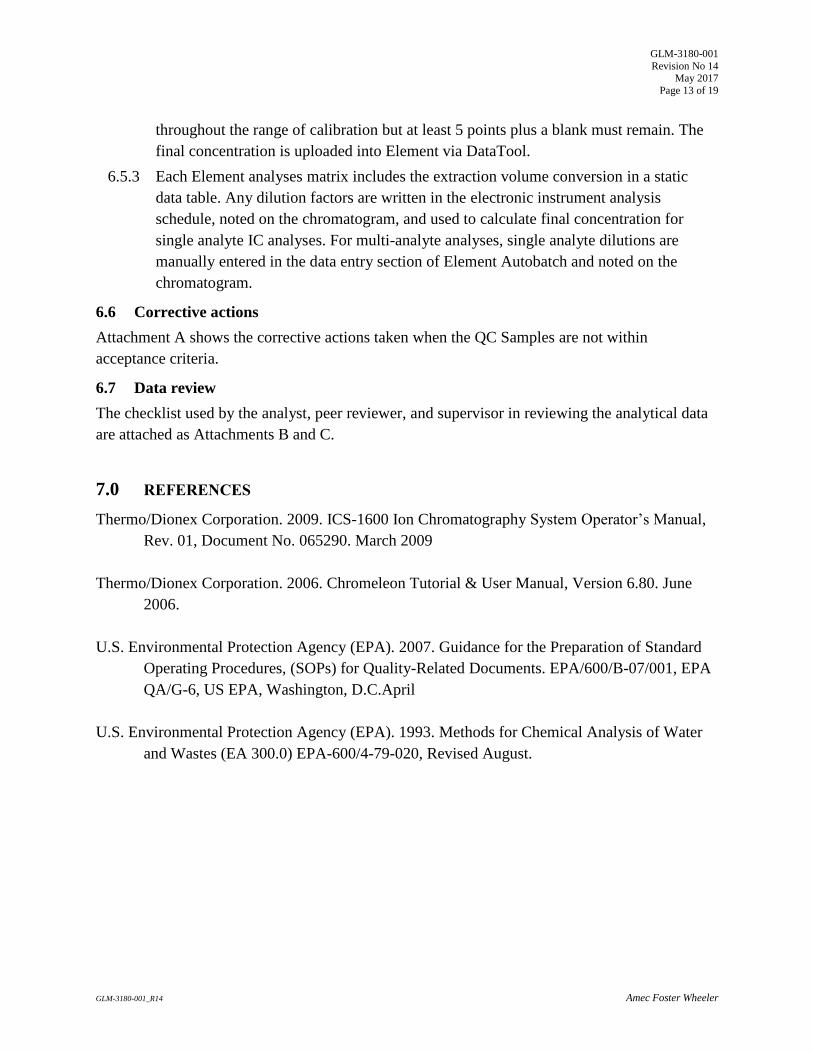
6.3.4 Generate data batch in Element and DataTool using the uploaded file (Figure 6). The
analyst can note any analytical anomalies in a separate batch narrative. Print a hard
copy of the data batch to be included in the data batch folder.
GLM-3180-001
Revision No 14 May 2017
Page 11 of 19
GLM-3180-001_R14 Amec Foster Wheeler
Figure 5 Element Auto Batch
Figure 6 Element Data Transfer Completion

GLM-3180-001
Revision No 14 May 2017
Page 12 of 19
GLM-3180-001_R14 Amec Foster Wheeler
6.3.5 Assemble the data batch folder, including the Element data batch, copies of all run logs,
certificates of analyses and processing methods, hard copies of each chromatogram, and
any other necessary documentation.
6.3.6 Complete the batch folder checklists (Attachments B and C), and submit it for review
and finalization.
6.3.7 Archive all electronic files generated from data collection and processing in condensed
form on the AMEC network located on P drive: \LAB\PROJECTS\ICDATA.
6.3.8 If data are exported to the Clean Air Status and Trends Network database, the BLK,
SRM, and DUP prefixes will be changed to MB, RF, and RP respectively upon
ingestion.
6.4 Quality Control
6.4.1 One BLK is analyzed with each extraction unless specified differently by a project. The
BLK is deionized water for wet deposition samples. The BLK for extracted samples is
the applicable volume of extraction solution followed by the appropriate extraction
procedure. The BLK results must be less than two times the reporting limit for the
analytes of concern.
6.4.2 A CCV is analyzed at a frequency of 10 percent for every analytical batch, unless
specified differently by a project, as well as at the beginning and end of the run. The
measured value of the CCV must be within ± 5 percent of the certified value.
6.4.3 A SRM is used for an initial and a final calibration verification. The measured value of
the reference sample must be within ± 5 percent of the certified value.
6.4.4 Sample replicates (DUP1, DUP2) are analyzed at a frequency of ± 5 percent. For
samples greater than five times the reporting limit, the relative percent difference
(RPD) of the replicate samples must be with ± 20 percent. For samples with
concentrations less than or equal to five times the reporting limit, the absolute
difference between sample and replicate must be less than the reporting limit.
6.4.5 All curves must contain a minimum of five points for quadratic calculations and have a
correlation coefficient greater than or equal to 0.995.
6.5 Calculations
6.5.1 All calculations are performed with data reduction algorithms that reside in the
instrument software.
6.5.2 Separate calibration curves are prepared for each anion of interest by plotting the
response (peak area) of standards against concentration values using quadratic
regression in the instrument software. Sample concentrations are calculated using the
quadratic equation for the curve. The analyst may eliminate points to improve accuracy
GLM-3180-001
Revision No 14 May 2017
Page 13 of 19
GLM-3180-001_R14 Amec Foster Wheeler
throughout the range of calibration but at least 5 points plus a blank must remain. The
final concentration is uploaded into Element via DataTool.
6.5.3 Each Element analyses matrix includes the extraction volume conversion in a static
data table. Any dilution factors are written in the electronic instrument analysis
schedule, noted on the chromatogram, and used to calculate final concentration for
single analyte IC analyses. For multi-analyte analyses, single analyte dilutions are
manually entered in the data entry section of Element Autobatch and noted on the
chromatogram.
6.6 Corrective actions
Attachment A shows the corrective actions taken when the QC Samples are not within
acceptance criteria.
6.7 Data review
The checklist used by the analyst, peer reviewer, and supervisor in reviewing the analytical data
are attached as Attachments B and C.
7.0 REFERENCES
Thermo/Dionex Corporation. 2009. ICS-1600 Ion Chromatography System Operator’s Manual,
Rev. 01, Document No. 065290. March 2009
Thermo/Dionex Corporation. 2006. Chromeleon Tutorial & User Manual, Version 6.80. June
2006.
U.S. Environmental Protection Agency (EPA). 2007. Guidance for the Preparation of Standard
Operating Procedures, (SOPs) for Quality-Related Documents. EPA/600/B-07/001, EPA
QA/G-6, US EPA, Washington, D.C.April
U.S. Environmental Protection Agency (EPA). 1993. Methods for Chemical Analysis of Water
and Wastes (EA 300.0) EPA-600/4-79-020, Revised August.

GLM-3180-001
Revision No 14 May 2017
Page 14 of 19
GLM-3180-001_R14 Amec Foster Wheeler
8.0 ATTACHMENTS
Attachment A – Corrective Actions
Attachment B – Batch Folder Checklist
Attachment C – Batch Peer Review Checklist
Attachment D – Revisions Table

GLM-3180-001
Revision No 14 May 2017
Page 15 of 19
GLM-3180-001_R14 Amec Foster Wheeler
ATTACHMENT A
Summary of Corrective Action Procedures for Ion Chromatography
Quality Control Acceptance Criteria Corrective Action
Calibration curve
correlation coefficient
≥ 0.995 Rerun calibration standards. If still out of
control, prepare new calibration standards
and recalibrate the instrument, or document
why data are acceptable.
Calibration curve
responses
Brackets all samples Dilute and reanalyze samples exceeding the
calibration curve range, or document why
data are acceptable.
Reference standard
(SRM)
± 5% of the certified
true value
Rerun standard. If still out of control,
recalibrate instrument and reanalyze
samples, or document why data are
acceptable.
Control standard
(CCV)
± 5% of the certified
true value
Rerun standard. If still out of control,
recalibrate instrument and reanalyze
samples run since last acceptable CCV, or
document why data are acceptable.
MB (BLK) < 2 times the RL Determine the cause of blank problem.
Reanalyze the sample, if necessary, or
document why data are acceptable.
Blank Spike (BS) ± 20% of target Not established
Sample Replicate
(DUP)
± 20% RPD if the
sample is greater than
5 times the RL
Determine the cause of the problem.
Reanalyze the sample, if necessary, or
document why data are acceptable.
Notes: RL = Detection limit
RPD = Replicate percent difference
Source: AMEC

GLM-3180-001
Revision No 14 May 2017
Page 16 of 19
GLM-3180-001_R14 Amec Foster Wheeler
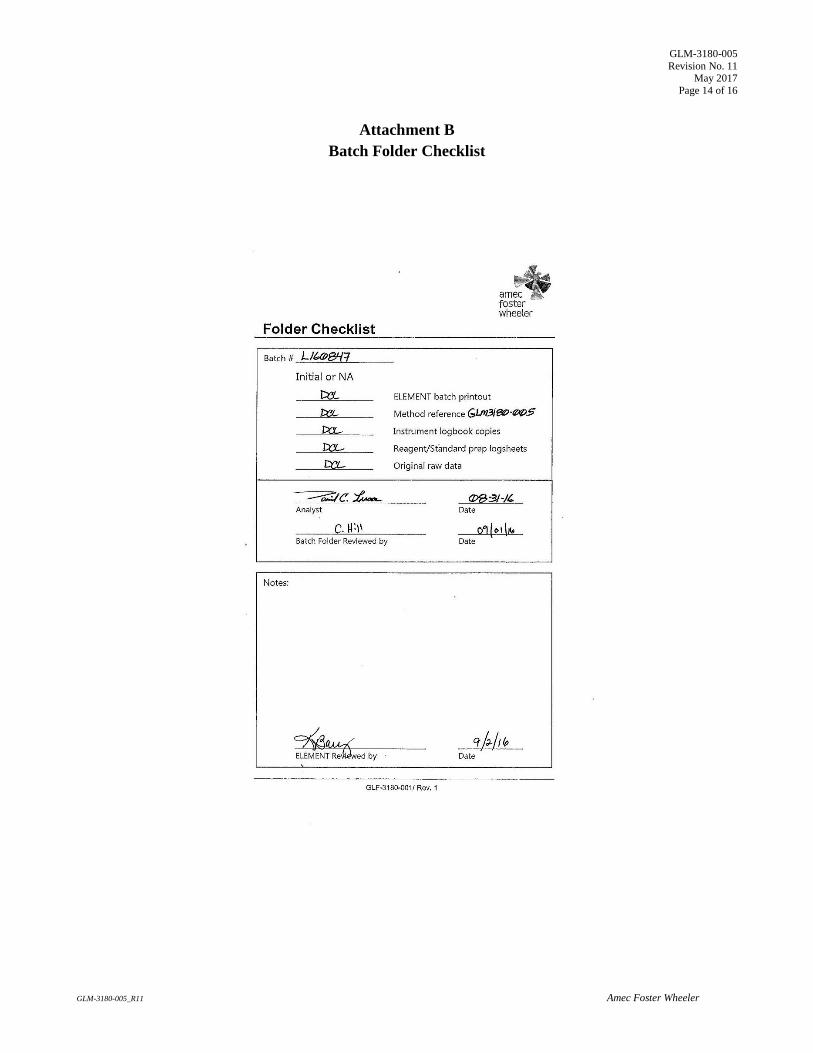
ATTACHMENT B
Batch Folder Checklist

GLM-3180-001
Revision No 14 May 2017
Page 17 of 19
GLM-3180-001_R14 Amec Foster Wheeler
ATTACHMENT C
Batch Peer review Checklist

GLM-3180-001
Revision No 14 May 2017
Page 18 of 19
GLM-3180-001_R14 Amec Foster Wheeler
ATTACHMENT D
Revisions Table
Table - Revisions
Document
Revision No.
Section Revision
11.0
Attachment D Addition of this table.
6.2.2 Inserted – “Note: Verify that the run-log printout auto-
sampler positions are correct; initial when complete.”
12.0
4.2.2 Added – “as N” to NO2 and NO3 on Table l. Also
updated standard numbers to 1 through 10.
6.1.7 Added new section: “A peer review will be done to
verify the sample IDs on the extract bottles match the
IDs recorded on the extraction worksheet.”
6.2.2 Added – “and the extract bottle IDs match the runlog.”
6.2.3 Inserted – “A number of auto-sampler vial caps will be
scored in advance and stored in a clean container for
future use.”
6.3.1 Inserted – “Thermo-Fisher Dionex Chromeleon 7.2
software is currently in use.”
6.3.7 Inserted – “… on the AMEC network located on P drive:
\LAB\PROJECTS\ICDATA”
13.0
1.0 Updated company name.
4.0 Replaced picture with old DX-500 instrument
4.1 Removed Anion micro-membrane suppressor
4.2.1 Removed concentrated sulfuric acid
4.2.2 Removed regeneration solution; AS14 60/480 & 0.6/4.8
eluents; Acceptance criteria for extractions solutions
updated to STD2.
5.0 Changed MSDS to SDS
7.0 Updated company name; removed QAPP reference;
added Thermo to Dionex; deleted DX-500 manual;
updated EPA Guidance Document.
Attachments Replaced Attachments B & C with new Amec Foster
Wheeler forms.

GLM-3180-001
Revision No 14 May 2017
Page 19 of 19
GLM-3180-001_R14 Amec Foster Wheeler
Table Revisions - continued
Document
Revision No.
Section Revision
14.0
6.0 Note added clarifying use of extracts for cation analysis.
6.4.1 Removed “or equal to” from BLK requirement. Should
just be “less than two times” .
Attachment A Acceptance criteria for Dup and Method Blank updated
from DL to RL.

GLM-3180-004
Revision No. 13 May 2017
Page 2 of 17
GLM-3180-004_R13 Amec Foster Wheeler
AMMONIA AS NITROGEN FOR DRY AND WET DEPOSITION
(MODIFIED EPA METHOD 350.1)
1.0 PURPOSE
The purpose of this standard operating procedure (SOP) is to provide consistent guidance to
Amec Foster Wheeler laboratory personnel for the determination of ammonia plus ammonium
(NH3 + NH+
4) as nitrogen (N) in air filter, denuder, and water samples.
2.0 SCOPE
This method is applicable to the determination of NH3 + NH+
4 in wet and dry deposition samples
for CASTNET and CASTNET-like projects. The method used to collect and handle samples will
determine the proportion of NH3 and NH+
4 . It is assumed that the CASTNET sampling method
collects particulate NH+
4 using an open-faced filter pack.
The analytical concentration range is 0.02 to 2.0 micrograms per milliliter (g/mL) of NH +
4 as
nitrogen (NH +
4-N). The upper concentration limit may be extended by sample dilution. The
reported detection limit is 0.02 g/mL NH +
4-N.
3.0 SUMMARY OF METHOD
This automated procedure for the determination of NH3 + NH+
4 as N uses the Berthelot Reaction,
where the formation of a blue-colored compound believed to be closely related to indophenol
forms after a solution of an ammonium salt is added to sodium phenoxide followed by the
addition of sodium hypochlorite. A solution of ethylenediamine tetraacetic acid (EDTA) is added
to the sample stream to eliminate the precipitation of the hydroxides of calcium and magnesium.
Sodium nitroprusside is added to intensify the blue color which is then measured colorimetrically.
Reduced volume versions of this method using the same reagents and the same molar ratios are
acceptable as long as all quality control (QC) and performance requirements outlined in this SOP
are met.
3.1 Method Interferences
Ammonia is ubiquitous in the environment and may easily contaminate samples. Floor strippers
and waxes commonly contain NH3 and are, therefore, a potential contamination source. Their use
should be prohibited in any laboratory area where NH3 + NH+
4 analyses are performed. To help
avoid contamination, wash sample cups with deionized water prior to use and rinse the cups
again with a portion of the standard or sample to be analyzed. Avoid allowing sample cups that
contain any solutions to sit for prolonged periods prior to analysis.
High concentrations of calcium and magnesium ions can cause precipitation problems. A
4 percent EDTA solution helps suppress precipitation by chelating these metal cations.
GLM-3180-004
Revision No. 13 May 2017
Page 3 of 17
GLM-3180-004_R13 Amec Foster Wheeler
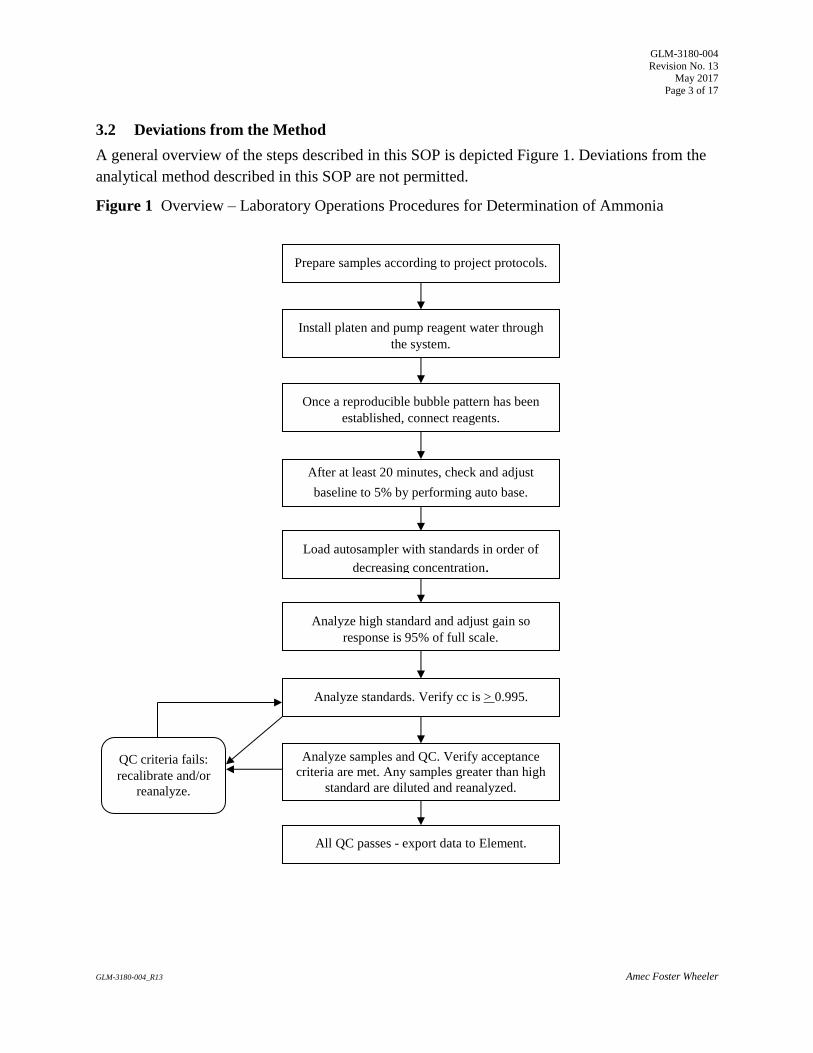
3.2 Deviations from the Method
A general overview of the steps described in this SOP is depicted Figure 1. Deviations from the
analytical method described in this SOP are not permitted.
Figure 1 Overview – Laboratory Operations Procedures for Determination of Ammonia
Prepare samples according to project protocols.
Install platen and pump reagent water through
the system.
Once a reproducible bubble pattern has been
established, connect reagents.
After at least 20 minutes, check and adjust
baseline to 5% by performing auto base.
Load autosampler with standards in order of
decreasing concentration.
Analyze high standard and adjust gain so
response is 95% of full scale.
Analyze standards. Verify cc is > 0.995.
Analyze samples and QC. Verify acceptance
criteria are met. Any samples greater than high
standard are diluted and reanalyzed.
All QC passes - export data to Element.
QC criteria fails:
recalibrate and/or
reanalyze.

GLM-3180-004
Revision No. 13 May 2017
Page 4 of 17
GLM-3180-004_R13 Amec Foster Wheeler
4.0 MATERIALS
4.1 Apparatus
Analytical balance, sensitive to 0.1 milligrams (mg).
Glassware: Class A volumetric flasks and pipettes as required.
Bran+Luebbe Auto Analyzer 3 (see Figure 2): automated continuous flow analysis
equipment designed to deliver and react sample and reagents in the required order and ratios.
With the following:
o Compact Auto-sampler with random access, PC or manually controlled.
o High precision pump with multi-speeds, PC or manually controlled.
o Chemistry module manifold with leak detector.
o High sensitivity digital colorimetric detector with 660 nanometer (nm) filter and
10.0 millimeter (mm) by 1.0 mm (inside diameter) flow cells
Autosampler vials, 4 mL and 5 mL.
Figure 2 Bran+Luebbe Auto Analyzer 3
4.2 Reagents
Reagent Water: Deionized (DI) water of resistivity of 15 mega Ohms (M) or greater,
derived from mixed bed ion exchangers, activated carbon filters and polishing exchangers.
Water should contain particles no larger than 0.20 micrometers .

GLM-3180-004
Revision No. 13 May 2017
Page 5 of 17
GLM-3180-004_R13 Amec Foster Wheeler
Sodium hydroxide (NaOH), 10 Normal: Purchased commercially as a certified solution.
NOTE: Highly caustic; use caution when handling. CAS# 1310-73-2
Sodium Phenolate: Add 67 milliliters (mL) of 10 Normal NaOH solution (see note for
NaOH) and 61.5 mL of liquefied phenol (commercially prepared reagent, approximately
89 percent phenol) to approximately 500 mL of reagent water. Allow the solution to cool,
then dilute to 1000 mL (1 L) with reagent water. Store in an amber glass bottle. CAS# for
Phenol is 108-95-2. Prepare every two weeks.
Brij-35: Commercial surfactant solution available from VWR Scientific as CAS
number 9002-92-0.
EDTA: Add 1 mL 10 Normal NaOH to about 650 mL of DI water in a 1-liter (L) volumetric
flask. While magnetically stirring, slowly add 33.6 grams (g) of EDTA. Add 2.0 mL of
Brij-35. Mix well. Final volume 1-liter . Highest consumption reagent. Make as needed or
every month.
Note: EDTA is known and sold under several names. Always crosscheck the Chemical Abstracts
Service (CAS) number for this reagent prior to ordering or using it. The CAS number is
6381-92-6.
Sodium Hypochlorite (NaOCl) solution (2.1%): Dilute a bleach solution (such as Clorox) to a
final volume of 1 L with reagent water. Store in an amber bottle, and prepare fresh every
week. Since Clorox is a proprietary product, its formulation is subject to change. The analyst
should verify the NaOCL concentration listed on the bleach bottle and dilute to a final
concentration of 2.1%. For example, for a bleach solution containing 6 percent NaOCl, the
analyst would dilute 350 mL to a final volume of 1L. Purchasing a sodium hypochlorite
solution from a laboratory reagent supply company is inadvisable due to the difficulty in
obtaining recently prepared solutions. CAS#7681-52-9.
Sodium Nitroprusside: Dissolve 3.5 g of sodium nitroprusside in 500 mL of reagent water
and dilute to 1 L. CAS# is 13755-38-9. Prepare monthly.
Sampler Wash: Add fresh DI water daily.
Reference Standard: WasteWtR Simple Nutrients Quality Control standard, catalog
number 505, from Environmental Resource Associates (ERA). Certified NH3-N value in the
parts-per-million (ppm) range. The reference standard (SRM) is analyzed to verify
calibration.
Control Standards are continuing calibration verification (CCV) standards. High Purity
Standards, certified value of 1 ppm. Non-cataloged product - special Amec Foster Wheeler
mix. Manufacturer’s lot is different from the 1-ppm calibration curve standard. To ensure
calibration accuracy throughout each analytical run, a CCV is used for continuing calibration
verification.
Calibration standards are purchased as National Institute of Standards and Technology
(NIST)-traceable solutions from High Purity Standards as a non-cataloged product - special
Amec Foster Wheeler mix. A certificate of analysis and expiration date is supplied with each

GLM-3180-004
Revision No. 13 May 2017
Page 6 of 17
GLM-3180-004_R13 Amec Foster Wheeler
solution (see Figure 3). They require no dilution and have the following concentrations in
g/mL: 0.00, 0.02, 0.05, 0.10, 0.25, 0.50, 1.00, and 2.00.
Figure 3 Certificate of Analysis

GLM-3180-004
Revision No. 13 May 2017
Page 7 of 17
GLM-3180-004_R13 Amec Foster Wheeler
5.0 SAFETY
The analyst must be aware of the hazards associated with the chemicals used in this method.
Reducing the possibility of accidental absorption or ingestion minimizes the hazards. Eating and
drinking are not permitted in areas where chemicals are used or stored. Laboratory coats, gloves,
and safety glasses must be worn at all times when handling these chemicals. If the analyst is not
familiar with the hazards associated with the chemicals being used, the Materials Safety Data
Sheets (MSDS) must be consulted. The MSDS by chemical and brand can be found in the Amec
Foster Wheeler laboratory or at the Web sites http://www.msdssearch.com or
http://www.hazard.com/msds/index.php using the CAS number.
6.0 PROCEDURE
6.1 Sample Extraction
See SOP GLM-3180-001, Section 6.1 for the extraction procedure.
6.2 Sample Analysis
6.2.1 Connect tubing as shown in Figure 4.
Figure 4 Pump Tubing and Coils for Auto Analyzer
GLM-3180-004
Revision No. 13 May 2017
Page 8 of 17
GLM-3180-004_R13 Amec Foster Wheeler
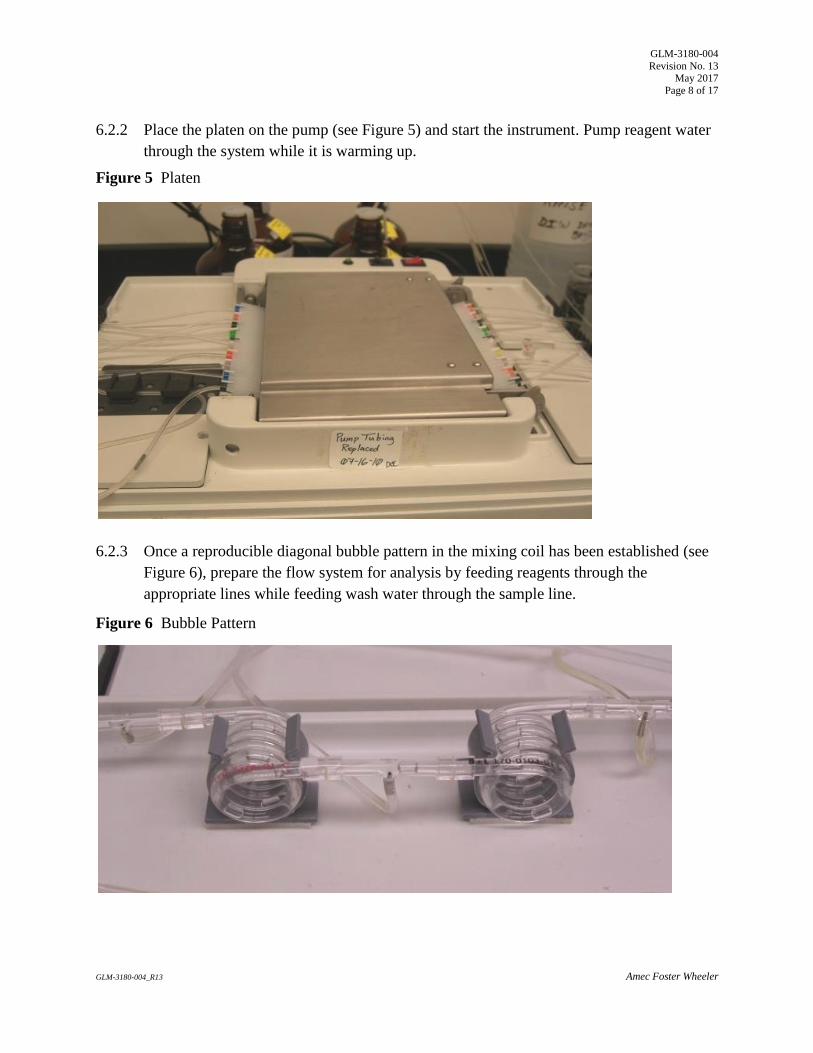
6.2.2 Place the platen on the pump (see Figure 5) and start the instrument. Pump reagent water
through the system while it is warming up.
Figure 5 Platen
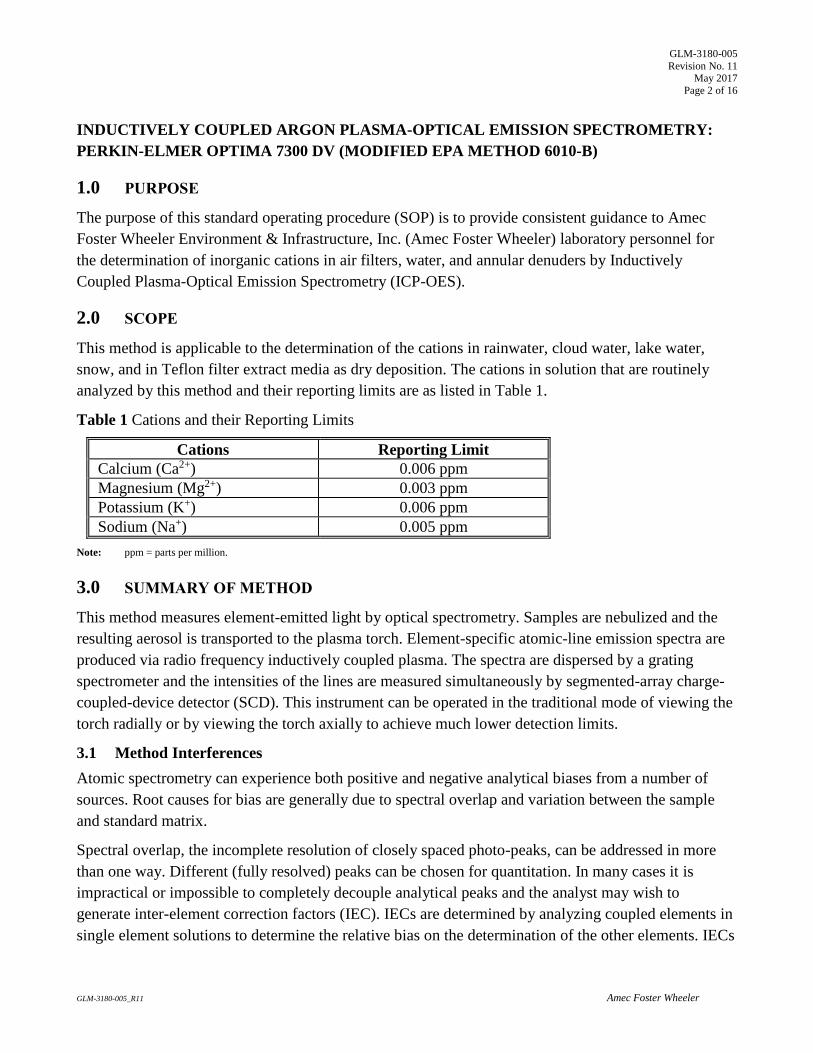
6.2.3 Once a reproducible diagonal bubble pattern in the mixing coil has been established (see
Figure 6), prepare the flow system for analysis by feeding reagents through the
appropriate lines while feeding wash water through the sample line.
Figure 6 Bubble Pattern

GLM-3180-004
Revision No. 13 May 2017
Page 9 of 17
GLM-3180-004_R13 Amec Foster Wheeler
6.2.4 After the reagents have been pumped through the instrument for at least 20 minutes,
check and adjust the baseline to 5 percent, if necessary. To adjust the baseline (while
pumping reagents only), right click on the screen then click ”Set Base”. Note that large
changes in the baseline reading may be an indication of contamination in the system or
the reagents. The system can be cleaned by pumping a 1:2 Clorox solution through
sample line for 10 minutes followed by 20 minute DI water rinse. Remake the reagents if
necessary.
6.2.5 Check and adjust the full-scale response, if necessary, by analyzing the high standard and
adjusting the gain such that its response is approximately 95 percent of the full scale of
the instrument.
6.2.6 Place standards in the sampler in order of decreasing concentration. The high standard is
analyzed twice, first as a primer then as a calibrant. Complete filling the sample tray with
unknown samples. Note: Use the 5 mL autosampler vials for the high standard, blank
calibrant and CCVs. The 4 mL vials are used for the remaining standards and samples.
Note: Verify that the run-log printout auto-sampler positions are correct; initial when
complete.
6.2.7 Begin analysis. See Bran+Luebbe AACE software operation manual for specific
instructions.
6.2.8 Verify the reasonableness of blank carryover immediately following analysis of the
standard curve. If carryover is determined to be unreasonable, investigate and correct the
problem before continuing.
6.2.9 Rerun any sample analyzed after a high sample for verification that there was not
carryover.
6.3 Data Analysis
6.3.1 Export the data to Element (see Figure 6) using the batch processing feature outlined in
SOP GLO3180-35 Element Batch Preparation (section 3.1.1.4).
6.3.2 The analyst should note any analytical anomalies in a separate batch narrative.
6.3.3 Assemble the data batch folder, including a hard copy of the Element data batch, copies
of all run logs, certificates of analyses and processing methods, and any other
necessary documentation.
6.3.4 Complete the batch folder checklists (Attachment B and C), and submit it for review
and finalization.

GLM-3180-004
Revision No. 13 May 2017
Page 10 of 17
GLM-3180-004_R13 Amec Foster Wheeler
Figure 6 Element Batch
6.4 Quality Control
6.4.1 Method blanks (BLK) must be analyzed at a frequency of one per daily extraction. BLK
concentrations should not exceed twice the reporting limit for the method. The reporting
limit is 0.02 g/mL.
6.4.2 Blank Spike (BS) will be analyzed at a frequency of one for every analytical run. Spikes
are prepared as outlined in SOP GLM3180-001. The target concentration in the extract is
0.2 g/mL.
6.4.3 A sample replicate (DUP) is analyzed at a frequency of 5 percent or every 20 samples.
The criterion is 20 percent if the sample concentration is at least 5 times the reporting
limit (> 0.1 g/mL); or + the reporting limit if the sample concentration is less than 5
times the reporting limit (< 0.1 g/mL).
6.4.4 The reference sample (SRM) must be run immediately following the daily calibration
curve and at the end of the analyses. All values must be within 10 percent of their

GLM-3180-004
Revision No. 13 May 2017
Page 11 of 17
GLM-3180-004_R13 Amec Foster Wheeler
respective true values or the analysis must be terminated, the problem corrected, the
instrument recalibrated, and the calibration re-verified prior to sample analyses.
6.4.5 The CCV must be run after every 10 samples and at the end of the sample run to verify
that the standard curve is still valid. The CCV is normally a 1.0 g/mL standard and must
be within 10 percent of expected value. If the CCV is not within the specified range,
reanalyze the CCV. If the recovery is still outside acceptable limits, the analysis must be
terminated and the instrument recalibrated. All samples following the last acceptable
CCV must be reanalyzed.
6.4.6 If data are uploaded to the Clean Air Status and Trends Network database, the BLK,
SRM, and DUP prefixes will be changed to MB, RF, and RP respectively upon ingestion.
6.5 Calculations
6.5.1 Calculations are performed with data reduction algorithms that reside in the
Bran+Luebbe AACE instrument software Version 5.45.
6.5.2 Sample concentrations are calculated using the quadratic equation for the curve. The final
concentration is uploaded into Element via DataTool.
6.5.3 Each Element analyses matrix includes the extraction volume conversion in a static data
table. Final results are corrected for any sample dilutions in the Data Entry/Review
section of Element.
6.6 Corrective actions
Attachment A shows the corrective actions taken when the QC samples are not within
acceptance criteria.
6.7 Data review
The checklists used by the analyst, peer reviewer, and supervisor in reviewing the analytical data
are shown in Attachments B and C.

GLM-3180-004
Revision No. 13 May 2017
Page 12 of 17
GLM-3180-004_R13 Amec Foster Wheeler
7.0 REFERENCES
Bran & Luebbe. 2006. Bran & Luebbe AACE Software 6.03 Rev. 2 No. MT7-60EN-03,
September 2006.
Bran & Luebbe. 1983. Technicon Auto Analyzer II Method No. 696-82W, Ammonia in Water
and Waste-Water, Technicon Industrial Systems, April 1983.
U.S. Environmental Protection Agency (EPA). 2007. Guidance for the Preparation of Standard
Operating Procedures, (SOPs) for Quality-Related Documents. EPA/600/B-0//001, EPA
QA/G-6, US EPA, Washington DC. April.
U.S. Environmental Protection Agency (EPA). 1993. Determination of Ammonia Nitrogen
by Semi-Automated Colorimetry (EPA 350.1) EPA-600/4-79-020, Revision 2.0,
August 1993.
U.S. Environmental Protection Agency (EPA). 1983. Methods for Chemical Analysis of Water
and Wastes (EPA 150.1), EPA 600/4-79-020, revised March 1983.

GLM-3180-004
Revision No. 13 May 2017
Page 13 of 17
GLM-3180-004_R13 Amec Foster Wheeler
8.0 ATTACHMENTS
Attachment A – Corrective Actions
Attachment B – Batch Folder Checklist
Attachment C – Batch Peer Review Checklist
Attachment D – Revisions Table

GLM-3180-004
Revision No. 13 May 2017
Page 14 of 17
GLM-3180-004_R13 Amec Foster Wheeler
ATTACHMENT A
Summary of Corrective Action Procedures for NH3 + NH+
4 as N
Quality Control Acceptance Criteria Corrective Action
Calibration curve
correlation coefficient
0.995 Rerun calibration standards. If still out of
control, prepare new calibration standards and
recalibrate the instrument, or document why
data are acceptable.
Calibration curve
responses
Brackets all samples Dilute and reanalyze samples within the
calibration curve range, or document why
data are acceptable.
Reference sample
(SRM)
10% of the
certified true value
Rerun SRM. If still out of control, recalibrate
instrument and reanalyze samples, or
document why data are acceptable.
Control standard
(CCV)
10% of the
certified true value
Rerun standard. If still out of control,
recalibrate instrument and reanalyze samples
run since last acceptable CCV, or document
why data are acceptable.
Method Blank (BLK) <2 times the RL Determine the cause of blank problem.
Reanalyze samples, if necessary, or document
why data are acceptable.
Blank Spike (BS) 20% No corrective action established yet.
Sample Replicate
(DUP)
20% RPD if the
sample is greater
than 5 times the RL
Determine the cause of the problem. Reanalyze
the sample, if necessary, or document why
data are acceptable. Note: RL = Detection limit. RPD = Relative percent difference.
Source: Amec Foster Wheeler

GLM-3180-004
Revision No. 12 October 2016
Page 15 of 17
GLM-3180-004_R13 Amec Foster Wheeler
ATTACHMENT B
Batch Folder Checklist

GLM-3180-004
Revision No. 12 October 2016
Page 16 of 17
GLM-3180-004_R13 Amec Foster Wheeler
ATTACHMENT C
Batch Peer Review Checklist

GLM-3180-004
Revision No. 12 October 2016
Page 17 of 17
GLM-3180-004_R13 Amec Foster Wheeler
ATTACHMENT D
Revisions Table
Table - Revisions
Document Revision
No.
Section Revision
11.0
Attachment D Addition of this table.
6.2.6 Inserted – “Note: Verify that the run-log printout
auto-sampler positions are correct; initial when
complete.”
12.0
Signature page Updated Laboratory Manager to Katherine Barry.
Removed Garry Price.
Entire SOP Changed company name to Amec Foster Wheeler
7.0 Updated SOP preparation reference
Attachment B Updated Figure
Attachment C Updated Figure
13.0
4.2 Updated NaOCL dilution instructions to add an
example calculation
6.0 Added statement to clarify extraction procedure:
“see GLM-3180-001 Section 6.1”.
Attachment A Corrected criteria for Dup and Method Blank
from “DL” to “ RL”.

GLM-3180-005
Revision No. 11 May 2017
Page 2 of 16
GLM-3180-005_R11 Amec Foster Wheeler
INDUCTIVELY COUPLED ARGON PLASMA-OPTICAL EMISSION SPECTROMETRY:
PERKIN-ELMER OPTIMA 7300 DV (MODIFIED EPA METHOD 6010-B)
1.0 PURPOSE
The purpose of this standard operating procedure (SOP) is to provide consistent guidance to Amec
Foster Wheeler Environment & Infrastructure, Inc. (Amec Foster Wheeler) laboratory personnel for
the determination of inorganic cations in air filters, water, and annular denuders by Inductively
Coupled Plasma-Optical Emission Spectrometry (ICP-OES).
2.0 SCOPE
This method is applicable to the determination of the cations in rainwater, cloud water, lake water,
snow, and in Teflon filter extract media as dry deposition. The cations in solution that are routinely
analyzed by this method and their reporting limits are as listed in Table 1.
Table 1 Cations and their Reporting Limits
Cations Reporting Limit
Calcium (Ca2+) 0.006 ppm
Magnesium (Mg2+) 0.003 ppm
Potassium (K+) 0.006 ppm
Sodium (Na+) 0.005 ppm
Note: ppm = parts per million.
3.0 SUMMARY OF METHOD
This method measures element-emitted light by optical spectrometry. Samples are nebulized and the
resulting aerosol is transported to the plasma torch. Element-specific atomic-line emission spectra are
produced via radio frequency inductively coupled plasma. The spectra are dispersed by a grating
spectrometer and the intensities of the lines are measured simultaneously by segmented-array charge-
coupled-device detector (SCD). This instrument can be operated in the traditional mode of viewing the
torch radially or by viewing the torch axially to achieve much lower detection limits.
3.1 Method Interferences
Atomic spectrometry can experience both positive and negative analytical biases from a number of
sources. Root causes for bias are generally due to spectral overlap and variation between the sample
and standard matrix.
Spectral overlap, the incomplete resolution of closely spaced photo-peaks, can be addressed in more
than one way. Different (fully resolved) peaks can be chosen for quantitation. In many cases it is
impractical or impossible to completely decouple analytical peaks and the analyst may wish to
generate inter-element correction factors (IEC). IECs are determined by analyzing coupled elements in
single element solutions to determine the relative bias on the determination of the other elements. IECs

GLM-3180-005
Revision No. 11 May 2017
Page 3 of 16
GLM-3180-005_R11 Amec Foster Wheeler
must be determined on a regular basis and verified prior to each analytical run. Data acquisition and
reduction software then generates a sample result by solving the systems of equations generated by the
analytical signal and the IEC.
Variation between the sample and standard matrix can also produce analytical bias. The most accepted
solution to the problem is to closely match the calibration and reference matrices to the sample matrix.
This approach can prove impractical or impossible when the sample matrix is unknown or when a
number of disparate sample matrices are encountered. One possible solution for this case is the
standard addition method of determining sample analyte concentration.
3.2 Deviations from the Method
A general overview of the steps described in this SOP is depicted in Figure 1. Deviations from the
analytical method described in this SOP are not permitted.

GLM-3180-005
Revision No. 11 May 2017
Page 4 of 16
GLM-3180-005_R11 Amec Foster Wheeler
Figure 1 Overview – Laboratory Operations Procedures for ICP-OES
Prepare samples according to project protocols.
Set up instrument in axial mode and align torch.
Calibrate using ACID RAIN method:
Cal Blank, STD1(0.010 ppm), STD2(0.500 ppm)
STD3(1.000 ppm), & STD4(2.000 ppm)
Correlation coefficient should be > 0.995.
Flush the system for at least one minute before
analyzing each sample.
Analyze SRM1 (± 10%)
Analyze Cal Blank as BLK1 (< 2x reporting limit).
Analyze Blank Spike (BS1) (± 20%)
All QC passes - export data to Element.
QC criteria fails:
recalibrate and/or
reanalyze. Analyze CCV1 (± 5%)
Analyze Teflon MB (< 2x reporting limit).
Analyze samples with a duplicate for every 20
samples. Any samples greater than the high
standard are diluted and reanalyzed.
Analyze a CCV after every 10 samples and at the
end of the run (± 5%).
Analyze SRM2 at the end of the run (± 10%)

GLM-3180-005
Revision No. 11 May 2017
Page 5 of 16
GLM-3180-005_R11 Amec Foster Wheeler
4.0 MATERIALS
4.1 Apparatus
Perkin-Elmer Optima 7300 DV ICP-OES Optical Emission Spectrometer-Plasma viewing axially
(see Figure 2).
S10 Autosampler
NESLAB CFT-33m refrigerated recirculator or equivalent.
Research Grade Argon.
Class A volumetric flasks [200 and 100 milliliter (mL)].
Adjustable Eppendorf micropipettes or equivalent.
Figure 2 Perkin-Elmer Optima 7300 DV ICP-OES
4.2 Reagents
Reagent Water: Deionized (DI) water of electrical resistivity of 15 mega Ohms (M) or greater,
derived from mixed bed ion exchangers, activated carbon filters, and polishing exchangers. Water
should contain particles no larger than 0.20 micrometers.
High Purity Standards/ESE Special Mix #1 and the low standard ESESimulated Rainwater (SR)
Mix (see Table 2). Certificates of Analysis are required for all stock solutions purchased and are
kept on file (see Figure 3). These are National Institute of Standards & Technology (NIST)-
traceable Solutions obtained from High Purity Standards, Inc. of Charleston, SC.
Mixed calibration standards made according to the outline in Table 2.
GLM-3180-005
Revision No. 11 May 2017
Page 6 of 16
GLM-3180-005_R11 Amec Foster Wheeler
Table 2 Acid Rain Standards
Acid rain standards are made using the High Purity "SM-405-012 ESE Special Mix #1"
100 micrograms per milliliter (g/mL) Ca2+, Mg2+, Na+, K+ stock solution.
Lot: XXXXXX Expiration: XX/XX
2.0 ppm 2.0 mL of stock solution is brought to a final volume of
100 mL with DI water.
1.0 ppm 1.0 mL of stock solution is brought to a
final volume of 100 mL with DI water.
0.5 ppm 1.0 mL of stock solution is brought to a
final volume of 200 mL with DI water.
0.010 ppm
This standard is not made daily – pre-made
SM-405-005 ESE SR Mix from High Purity at
10-microgram per liter (g/L) concentration.
Expiration is six months from shipping date.
Solutions diluted date XX/XX/XX expiration XX/XX/XX
All standards are dated upon receipt and preparation.
Simulated Rainwater SR-2 Reference Sample (SRM) (also obtained from High Purity Standards,
Inc.). The SRM is available in 250 mL, packaged as 5 x 50-mL bottles. The concentrations shown
in Table 3 are the targeted values for each component. Each lot from High Purity comes with a
certificate of analysis indicating the certified values. The SRM is used to verify the instrument
calibration.
Control Standards are continuing calibration verification (CCV) standards. The 0.5 ppm calibration
standard in Table 2 is used to ensure calibration accuracy throughout each analytical run.
Table 3 Simulated Rainwater
Components SR-2 Level (g/mL)
Sodium (Na+) 0.40
Potassium (K+) 0.10
Calcium (Ca2+) 0.05
Magnesium (Mg2+) 0.05
Note: g/mL = micrograms per milliliter

GLM-3180-005
Revision No. 11 May 2017
Page 7 of 16
GLM-3180-005_R11 Amec Foster Wheeler
Figure 3 Certificate of Analysis
5.0 SAFETY
The analyst must be aware of the hazards associated with the chemicals used in this method. Reducing
the possibility of accidental absorption or ingestion minimizes the hazards. Eating and drinking are not
permitted in areas where chemicals are used or stored. Laboratory coats, gloves, and safety glasses
must be worn at all times when handling these chemicals. If the analyst is not familiar with the hazards
associated with the chemicals being used, the Safety Data Sheets (SDS) must be consulted. The SDS
by chemical and brand can be found in the AMEC laboratory or at the Web sites
http://www.msdssearch.com or http://www.hazard.com/msds/index.php using the CAS number.
Liquid argon, a cryogenic gas, is used in this procedure to generate a plasma environment for atomic
spectra emission. The Chemical Abstracts System (CAS) number for argon is 7440-37-1. Argon is a
simple asphyxiant, it constitutes a danger by reducing the oxygen level in confined spaces to below the
concentration required to sustain life. This effect is particularly evident in the spills of liquid state

GLM-3180-005
Revision No. 11 May 2017
Page 8 of 16
GLM-3180-005_R11 Amec Foster Wheeler
argon. Each liter of liquid argon vaporizes to fill 0.78 normal cubic meters of volume. Skin and eye
contact with liquid argon is characterized by severe frostbite. Argon boils at (-) 185 degrees centigrade.
Care must be taken not to obstruct the overpressure vent on any cryogenic gas dewar. Obstructed vents
can lead to violent rupture of the container, rapid vaporization of the liquid, and direct exposure to the
cryogen.
6.0 PROCEDURE
6.1 Sample Extraction
See SOP GLM3180-001, Section 6.1 for the extraction procedure.
6.2 Sample Analysis
6.2.1 Set up the instrument according to the manufacturer's recommendations and optimize the
operating parameters. Select axial mode. Align the torch by using Tools, Spectrometer, then
click “Hg Realign”. If the torch was removed prior to the analysis, perform the “Hg Align” and
“Align View” by aspirating a 1 ppm manganese solution.
6.2.2 Calibrate with the standards listed in Table 2, using the method ACID RAIN in the instrument
software. Note: Verify that the run-log printout auto-sampler positions are correct; initial
when complete.
6.2.3 Flush the system with DI water for at least 1 minute before analyzing each sample.
6.2.4 NIST-traceable reference samples (SRM1 and SRM2) must be analyzed after calibration,
before any samples are analyzed, and at the end of the sample analysis. All values must be
within 10 percent of their respective certified values or the analysis must be terminated, the
problem corrected, the instrument recalibrated, and the calibration re-verified prior to sample
analyses.
6.2.5 Control standards (CCV1, CCV2… CCV9, CCVA) must be analyzed after every 10 samples
and at the end of the run. The measured concentrations of the elements for which calibration
was performed must be within 5 percent of their respective true values. If the CCV does not
pass these criteria, re-analyze the CCV. If the CCV still fails criteria, the analysis must be
terminated, the problem corrected, the instrument recalibrated, and the calibration re-verified
prior to continuing sample analyses. All samples run after the last acceptable CCV must be
reanalyzed.
6.2.6 The method blank (BLK1) is analyzed prior to the analysis of samples. The method blank fails
criteria if the results are greater than two times the reporting limit. If the method blank fails
criteria, re-calibrate with fresh DI water. The calibration blank (DI water) is analyzed as the
method blank. An extraction blank is also analyzed as a sample called a TMBxx (Teflon
Method Blank) xx representing the year.
6.2.7 Analyze the samples with two replicate readings per sample, making dilutions for any elements
that exceed the linear range. If the relative percent difference (RPD) between the replicate

GLM-3180-005
Revision No. 11 May 2017
Page 9 of 16
GLM-3180-005_R11 Amec Foster Wheeler
readings is greater than 20 percent for an element whose concentration is 10 times the
instrument reporting limit, repeat the analysis once. There is no criterion for samples whose
concentration is less than 10 times the reporting limit.
6.2.8 A replicate sample (DUP) is analyzed at a frequency of 5 percent (1 per 20). The acceptance
criteria is 20 percent for samples greater than five times the reporting limit and is the
reporting limit if the sample concentration is less than five times the reporting limit.
6.2.9 Aqueous samples are reported in final concentration by the instrument. If a dilution was
required, the concentration in the diluted sample and the dilution factor are reported in the data
batch.
6.2.10 A blank spike (BS1) equivalent to a Laboratory Control Sample (LCS) is created during the
extraction process as outlined in SOP GLM3180-001. The target concentration in the extract
for all four analytes is 0.1 g/mL.
6.3 Data Analysis
6.3.1 Prepare the Element upload file using the export feature of the Winlab software, and generate
an upload file in final concentration as described in SOP GLO3180-35, Element Batch
Preparation.
6.3.2 Generate data batch in Element and DataTool using the uploaded file (Figure 4). The analyst
can note any analytical anomalies in a separate batch narrative. Print a hard copy of the data
batch to be included in the data batch folder.
Figure 4 Element Data Transfer Completion

GLM-3180-005
Revision No. 11 May 2017
Page 10 of 16
GLM-3180-005_R11 Amec Foster Wheeler
6.3.3 Assemble the data batch folder, including the Element data batch, copies of all run logs,
certificates of analyses and processing methods, hard copies of raw data, and any other
necessary documentation.
6.3.4 Complete the batch folder check lists (Attachment B and C), and submit for review and
finalization.
6.3.5 Archive all electronic files generated from data collection and processing in condensed form on
the AMEC network.
6.3.6 If data are uploaded to the Clean Air Status and Trends Network database, the BLK, SRM, and
DUP prefixes will be changed to MB, RF, and RP respectively upon ingestion.
6.4 Quality Control
6.4.1 One MB is analyzed with each extraction unless specified differently by a project. The MB is
deionized water for wet deposition samples. The MB for extracted samples is the applicable
volume of extraction solution followed by the appropriate extraction procedure. The MB results
must be less than or equal to two times the reporting limit for the analytes of concern.
6.4.2 A CCV is analyzed at a frequency of 10 percent for every analytical batch, unless specified
differently by a project, as well as at the beginning and end of the run. The measured value of
the CCV must be within ± 5 percent of the certified value.
6.4.3 A SRM is used for an initial and a final calibration verification. The measured value of the
reference sample must be within ± 10 percent of the certified value.
6.4.4 Sample replicates (DUP) are analyzed at a frequency of ± 5 percent. For samples greater than
five times the reporting limit, the relative percent difference (RPD) of the replicate samples
must be with ± 20 percent. For samples with concentrations less than or equal to five times the
reporting limit, the absolute difference between sample and replicate must be less than the
reporting limit.
6.4.5 All curves must have a correlation coefficient greater than or equal to 0.995.
6.5 Calculations
6.5.1 All calculations are performed with data reduction algorithms that reside in the instrument’s
operating software (WINLAB).
6.5.2 Analytical signals from the calibration sources are used to generate a separate polynomial curve
for each cation of interest. These calculations include the slope, intercept, uncertainty, and
correlation coefficient of the curve. The calibration data is used to relate the sample’s analytical

GLM-3180-005
Revision No. 11 May 2017
Page 11 of 16
GLM-3180-005_R11 Amec Foster Wheeler
signal to a mass per volume concentration. The final concentration is uploaded into Element via
DataTool.
6.5.3 Each Element analyses matrix includes the extraction volume conversion in a static data table.
Any dilution factors are noted on the instrument analysis schedule and manually entered in the
data entry section of Element.
6.6 Corrective actions
Attachment A shows the corrective actions taken when the QC samples are not within acceptance
criteria. Most corrective actions within the scope of this SOP are responsive to failed QC parameters.
Generally, optimizing the instrument analytical parameters and regenerating the analytical standards
will alleviate these problems. Otherwise, a service technician should be consulted and the problem
remedied.
6.7 Data review
The checklists used by the analyst, peer reviewer, and supervisor in reviewing the analytical data are
attached as Attachments B and C.
7.0 REFERENCES
Perkin Elmer. 2000. Perkin Elmer Winlab 32, 0993-6335, January 2000.
Perkin Elmer. 2008. Perkin Elmer Optima 7300 Hardware Guide, 0993-6878, June.
U.S. Environmental Protection Agency (EPA). 2007. Guidance for the Preparation of Standard
Operating Procedures, (SOPs) for Quality-Related Documents. EPA/600/B-0//001, EPA QA/G-
6, US EPA, Washington, D.C.April.
U.S. Environmental Protection Agency (EPA). 1996. Method 6010B, 2nd Revision - Test Methods for
Evaluating Solid Wastes, EPA SW 846 3rd Edition, December.
U.S. Environmental Protection Agency (EPA). 1997. USEPA Contract Laboratory Program National
Functional Guidelines for Inorganic Data Review, EPA 540/R-94/013, February.

GLM-3180-005
Revision No. 11 May 2017
Page 12 of 16
GLM-3180-005_R11 Amec Foster Wheeler
8.0 ATTACHMENTS
Attachment A – Corrective Actions
Attachment B – Batch Folder Checklist
Attachment C – Batch Peer Review Checklist
Attachment D – Revisions Table

GLM-3180-005
Revision No. 11 May 2017
Page 13 of 16
GLM-3180-005_R11 Amec Foster Wheeler
Attachment A
Summary of Corrective Action Procedures for ICP
Quality Control Acceptance Criteria Corrective Action
Calibration curve
correlation coefficient
≥ 0.995 Rerun calibration standards. If still out of
control, prepare new calibration standards
and recalibrate the instrument, or document
why data are acceptable.
Calibration curve
responses
Brackets all samples Dilute and reanalyze samples within the
calibration curve range, or document why
data are acceptable.
Reference standard
(SRM)
± 10% of the certified
true value
Rerun standard. If still out of control,
recalibrate instrument and reanalyze samples,
or document why data are acceptable.
Control standard (CCV) ± 5% of the certified
true value
Rerun standard. If still out of control,
recalibrate instrument and reanalyze samples
run since last acceptable CCV, or document
why data are acceptable.
Method Blank (BLK) <2 times the RL Determine the cause of blank problem.
Reanalyze the sample, if necessary, or
document why data are acceptable.
Blank Spike (BS) ± 20% of target Not established
Sample Replicate
(DUP)
± 20% RPD if the
sample is greater than
5 times the RL
Determine the cause of the problem.
Reanalyze the sample, if necessary, or
document why data are acceptable. Note: RL = Detection limit. RPD = Relative percent difference.
Source: AMEC
GLM-3180-005
Revision No. 11 May 2017
Page 14 of 16
GLM-3180-005_R11 Amec Foster Wheeler
Attachment B
Batch Folder Checklist

GLM-3180-005
Revision No. 11 May 2017
Page 15 of 16
GLM-3180-005_R11 Amec Foster Wheeler
ATTACHMENT C
Batch Peer Review Checklist

GLM-3180-005
Revision No. 11 May 2017
Page 16 of 16
GLM-3180-005_R11 Amec Foster Wheeler
ATTACHMENT D
Revisions Table
Table - Revisions Document Revision No. Section Revision
9.0
Attachment D Addition of this table.
6.2.2 Inserted – “Note: Verify that the run-log printout auto-
sampler positions are correct; initial when complete.”
10.0
Title Changed “Atomic Emission” to “Optical Emission”
1.0 Updated company name. Changed Atomic Emission to
Optical Emission.
3.2 Added STD4 to Figure 1.
4.2 Added 2.0 ppm standard to Table 2.
5.0 Changed MSDS to SDS.
7.0 Deleted QAPP reference; updated EPA Guidance Document.
Attachments Replaced old versions of Attachment B & C with new Amec
Foster Wheeler forms.
11.0 Attachment A Acceptance criteria for Dups & Method Blank updated from
DL to RL.

GLM-3180-007
Revision No. 12 March 2017
Page 2 of 19
GLM3180-007_R12 Amec Foster Wheeler
DETERMINATION OF HYDROGEN ION (pH) IN WATER (ASTM D1293-12)
1.0 PURPOSE
The purpose of this standard operating procedure (SOP) is to provide consistent guidance to
Amec Foster Wheeler Environment & Infrastructure, Inc. laboratory personnel for the
determination of hydrogen ion (pH) in water.
2.0 SCOPE
This method is applicable to drinking, surface, and saline waters, domestic and industrial wastes,
and acid rain (atmospheric deposition).
3.0 SUMMARY OF METHOD
The pH of a sample is determined potentiometrically using a combination electrode.
3.1 Method Interferences
Samples with very low or very high pH may give incorrect readings on the meter. For samples
with a true pH of >10.0, the measured pH may be incorrectly low. Using a low-sodium error
electrode can minimize this error. Strongly acidic solutions with a true pH <1.0 may give
incorrectly high pH measurements. Strongly acidic or basic solutions are unlikely in atmospheric
deposition samples.
Temperature fluctuations will cause measurement errors including mechanical effects caused by
changes in the electrode properties as well as chemical effects caused by equilibrium changes.
Errors of this nature can be most effectively minimized by allowing all solutions to equilibrate to
the same temperature before beginning analysis. Always record the temperature at which pH
is measured.
Errors will occur when the electrode becomes coated with any type of adhering substance
(i.e., oil or particulate matter). If this occurs, follow the steps outlined in the User’s Guide to
clean the electrode.
3.2 Deviations from the Method
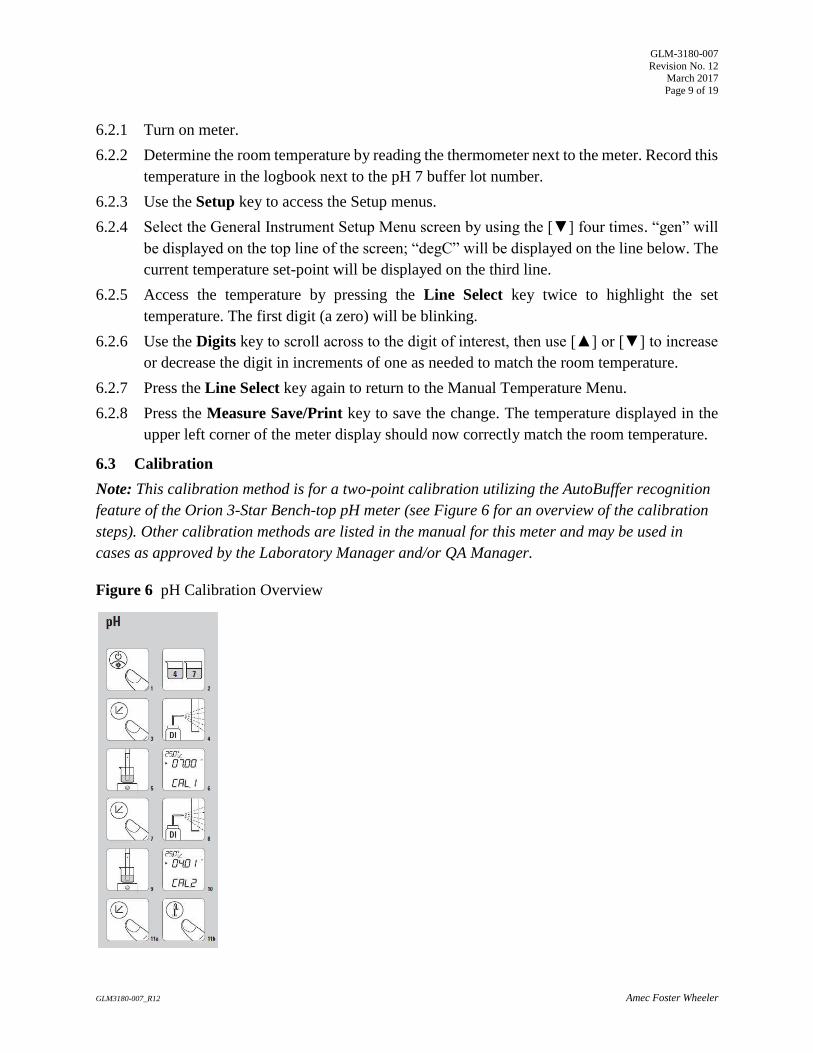
A general overview of the steps described in this SOP is depicted Figure 1. Deviations from the
analytical method described in this SOP are not permitted.

GLM-3180-007
Revision No. 12 March 2017
Page 3 of 19
GLM3180-007_R12 Amec Foster Wheeler
Figure 1 Overview – Laboratory Operations Procedures for pH Measurement
QC fails:
recalibrate or
replace electrode.
Remove samples from coldroom and
allow to reach room temperature.
Press Power key on meter and then
Calibrate key.
Rinse electrode with Dl, blot dry and
place first in first buffer.
When the icon starts flashing, press
Calibrate.
Rinse electrode with DI, blot dry and
place in second buffer.
When the icon starts flashing, press
Calibrate and then Measure.
Analyze Blank, CCV and SRM.
Analyze samples.
Analyze CCV after every 10 samples,
duplicate for every 20 and end with
SRM and CCV.
QC passes: enter data manually in
Element.

GLM-3180-007
Revision No. 12 March 2017
Page 4 of 19
GLM3180-007_R12 Amec Foster Wheeler
4.0 MATERIALS
4.1 Apparatus
pH meter with automatic temperature compensation (ATC) capabilities, Thermo Orion 3-Star
pH bench-top meter, PN: 1112000, or equivalent (see Figure 2).
Figure 2 pH Meter
Glass combination semi-micro electrode, Orion ROSS Ultra PN: 8103BNUWP, or
equivalent.
The electrode should be every six (6) months.
Analytical vessels capable of containing sufficient sample to cover the reference junction of
the probe (see Figure 3). Use the smallest vessel capable of allowing sufficient submersion of
the probe to obtain a reading.
Kimwipes.
Wash bottle filled with DI water for rinsing the probe between samples.
Thermometer, for ambient room temperature readings.
Digital scanning thermometer, for surface temperature readings of the solutions.

GLM-3180-007
Revision No. 12 March 2017
Page 5 of 19
GLM3180-007_R12 Amec Foster Wheeler
Figure 3 pH Electrode
4.2 Reagents
Reagent water: DI water with resistivity of 15 mega ohms (MΩ) or greater, derived from
mixed bed ion exchangers, activated carbon filters, and polishing exchangers. Water should
contain particles no larger than 0.20 micrometers (μm).
Standard buffer solutions of 4, 7, and 10 pH units, which are available from a commercial
vendor. Alternatively, standard buffer solutions of 3, 5, and 8 pH units (also available
commercially) may be used. A Certificate of Analysis and an expiration date is provided with
each lot (see Figure 4).
Note: pH 10 buffer solution is subject to contamination from microbial growth. Store out of the
light and away from heat to minimize the risk of contamination. Always have at least one extra
unopened bottle of this buffer on hand.
Electrode internal filling solution: 3 molar (M) potassium chloride (KCl) solution, or
alternate solution as appropriate to the sample type, available from the electrode
manufacturer or other vendor. See the probe User’s Guide for instructions regarding the
selection of an alternative filling solution.
Electrode storage solution: Available from the manufacturer or other vendor. Alternatively,
use a solution of 200 mL pH 7 buffer to which 1 g KCl has been added.
Standard Reference Material (SRM) is purchased as a ready-to-use NIST-traceable standard
solution (e.g., Simulated Rainwater #1 from High Purity Standards or equivalent) with a
Certificate of Analysis and an expiration date. Note that the SRM is used to verify the
calibration and must be from a source other than that of the calibration standards.
Continuing calibration verification (CCV) is purchased from commercial vendor. A
Certificate of Analysis and an expiration date is provided with each lot. The CCV is used to
ensure calibration accuracy and check for drift during each analysis.

GLM-3180-007
Revision No. 12 March 2017
Page 6 of 19
GLM3180-007_R12 Amec Foster Wheeler
Figure 4 Certificate of Analysis

GLM-3180-007
Revision No. 12 March 2017
Page 7 of 19
GLM3180-007_R12 Amec Foster Wheeler
5.0 SAFETY
The analyst must be aware of the hazards associated with the chemicals used in this method.
Reducing the possibility of accidental absorption or ingestion minimizes the hazards. Eating and
drinking are not permitted in areas where chemicals are used or stored. Laboratory coats, gloves,
and safety glasses must be worn at all times when handling these chemicals. If the analyst is not
familiar with the hazards associated with the chemicals being used, the Materials Safety Data
Sheets (MSDS) must be consulted. The MSDS by chemical and brand can be found in the Amec
Foster Wheeler laboratory or at the Web sites http://www.msdssearch.com or
http://www.hazard.com/msds/index.php using the CAS number.
6.0 PROCEDURE
6.1 Electrode Preparation
6.1.1 Remove the electrode from the storage solution and rinse any salt deposits from the exterior
with DI water.
6.1.2 Check the level of the filling solution. The filling solution should be at least at the end of
the coil and no higher than to the bottom of the filling hole.
6.1.3 If the probe has been unused for longer than a week, drain the solution using a syringe
fitted with a plastic pipette tip and refill the chamber with fresh solution.
6.1.4 If KCl deposits are noted on the interior of the probe, rinse with several successive portions
of filling solution, or in extreme cases, DI water followed by filling solution, until no
deposits are observed floating in the filled reservoir.
Note: The deposits on the interior of the probe do not interfere with analysis, but if crystals
break free of the inner walls and become suspended in the reference solution, changes in
calibration can result requiring recalibration and subsequent reanalysis of affected samples.
These deposits appear to be linked to prolonged periods of idleness. The probe should therefore
be checked at least once a week to maintain optimum performance. See the User’s Guide for
directions on cleaning the probe.
6.1.5 Keep the filling hole uncovered during analysis.
6.2 Set displayed meter temperature to match room temperature
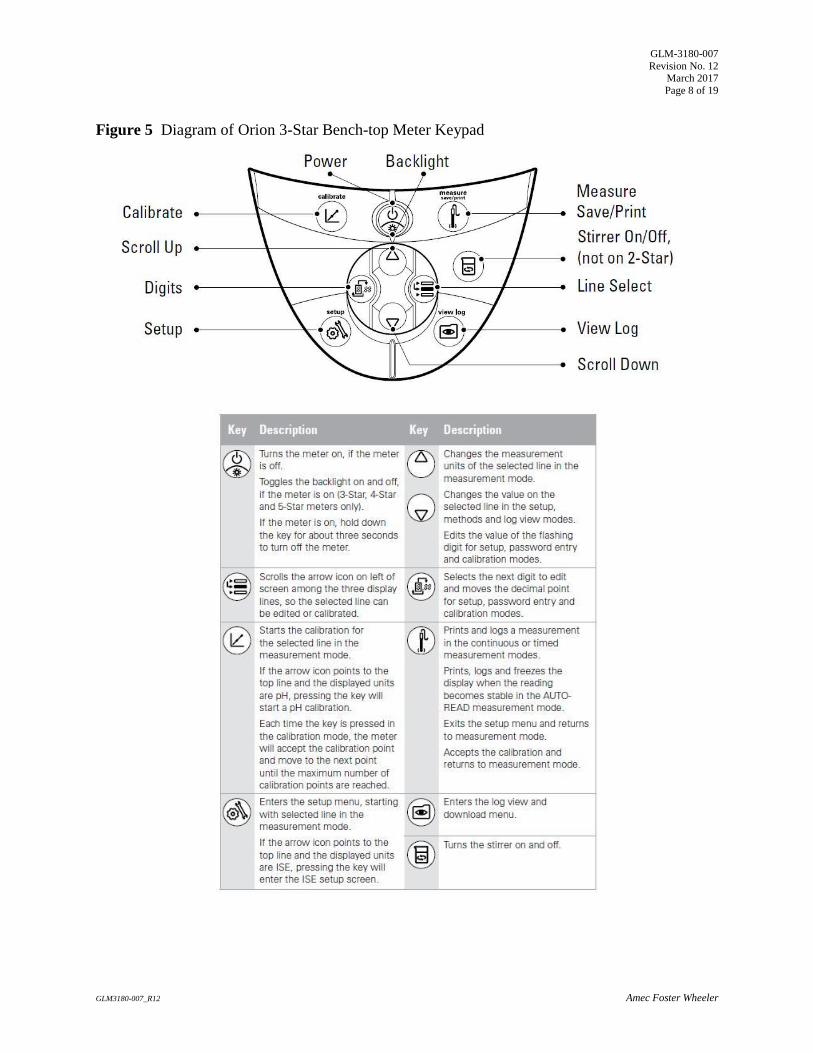
See Figure 5 for a diagram of the keypad for the Orion 3-Star Bench-top pH Meter.
GLM-3180-007
Revision No. 12 March 2017
Page 8 of 19
GLM3180-007_R12 Amec Foster Wheeler
Figure 5 Diagram of Orion 3-Star Bench-top Meter Keypad
GLM-3180-007
Revision No. 12 March 2017
Page 9 of 19
GLM3180-007_R12 Amec Foster Wheeler
6.2.1 Turn on meter.
6.2.2 Determine the room temperature by reading the thermometer next to the meter. Record this
temperature in the logbook next to the pH 7 buffer lot number.
6.2.3 Use the Setup key to access the Setup menus.
6.2.4 Select the General Instrument Setup Menu screen by using the [] four times. “gen” will
be displayed on the top line of the screen; “degC” will be displayed on the line below. The
current temperature set-point will be displayed on the third line.
6.2.5 Access the temperature by pressing the Line Select key twice to highlight the set
temperature. The first digit (a zero) will be blinking.
6.2.6 Use the Digits key to scroll across to the digit of interest, then use [] or [] to increase
or decrease the digit in increments of one as needed to match the room temperature.
6.2.7 Press the Line Select key again to return to the Manual Temperature Menu.
6.2.8 Press the Measure Save/Print key to save the change. The temperature displayed in the
upper left corner of the meter display should now correctly match the room temperature.
6.3 Calibration
Note: This calibration method is for a two-point calibration utilizing the AutoBuffer recognition
feature of the Orion 3-Star Bench-top pH meter (see Figure 6 for an overview of the calibration
steps). Other calibration methods are listed in the manual for this meter and may be used in
cases as approved by the Laboratory Manager and/or QA Manager.
Figure 6 pH Calibration Overview

GLM-3180-007
Revision No. 12 March 2017
Page 10 of 19
GLM3180-007_R12 Amec Foster Wheeler
6.3.1 Stir or gently agitate all buffers and standards prior to aliquoting and making
measurements. Record the lot numbers of all buffers and standards used.
6.3.2 Fill two vessels with a portion of the pH 7 buffer (or alternately, the middle value buffer
if points other than 4, 7, and 10 are being used). See Figure 6-2.
6.3.3 Press the Calibrate key to enter Calibration mode (see Figure 6-3). The “Calibrate”
symbol will appear in the upper left corner of the display; “pH” and “CAL” will be
displayed on two lines in the center of the screen for several seconds before displaying
the measured pH.
6.3.4 Rinse the electrode with DI water and gently blot the probe free of drops with a Kimwipe
(see Figure 6-4). Use care to not rub or wipe the surface of the probe when drying as
static electric build-up could interfere with subsequent measurements.
6.3.5 Wait for the display to change to measure and immerse the probe in the first vessel (see
Figure 6-5). Note: The pH of DI water is in the range of 5.6 – 5.8 pH units. The best
sample results are obtained when the measured pH value displayed prior to immersing
the probe in a new sample aliquot falls in this range. Avoid beginning a new
measurement if the probe shows signs of drifting.
6.3.6 Swirl the probe gently to rinse before moving to the second aliquot. Stop swirling the
probe and allow the electrode to equilibrate in the second aliquot.
6.3.7 When the meter recognizes the buffer the display will change to show the recognized
value, and the first digit (a zero) will blink (see Figure 6-6).
6.3.8 Use the Digits key followed by [] or [] as needed to adjust the value to match the
true value of the buffer. The true value of the buffer at various ambient temperatures
should be listed on the side of the buffer bottle.
6.3.9 Press Calibrate (see Figure 6-7) to accept the value and move on to the second
calibration point. “Cal 2” should now be displayed at the bottom of the screen.
6.3.10 Repeat steps 6.3.2 through 6.3.8 for the second buffer, usually pH 4 (see Figure 6-8 thru
6-11a).
6.3.11 Press Measure Save/Print (see Figure 6-11b) to accept the value and end the calibration
procedure. The meter will automatically calculate the slope before proceeding to
GLM-3180-007
Revision No. 12 March 2017
Page 11 of 19
GLM3180-007_R12 Amec Foster Wheeler
Measurement mode. Enter the slope in the logbook next to the lot number for the pH
4 buffer.
6.4 Verify Calibration
6.4.1 Fill two vessels with a portion of the pH 10 buffer.
6.4.2 Rinse the electrode with DI water and gently blot the probe free of drops with a
Kimwipe. Wait for the display to change to measure and immerse the probe in the
first vessel.
6.4.3 Swirl the probe gently to rinse before moving to the next aliquot. Stop swirling the probe
and allow the electrode to equilibrate in the second aliquot.
6.4.4 A small “pH” will be blinking to the right of the measured value on the meter display
when the electrode is equilibrating. This icon will stop blinking when a stable reading has
been reached. Record the value of the stable reading.
6.4.5 A reading of 10.00 ± 0.05 pH units indicates that the electrode has been properly
calibrated, and sample analysis can begin (6.6). If the reading is outside of the accepted
range, proceed to 6.5.
6.5 Calibration Verification Failure
6.5.1 Repeat step 6.4.1 through 6.4.4 using a new bottle of pH 10 buffer. If the measurement of
the new buffer falls within the accepted range, proceed with sample analysis (6.6).
6.5.2 If the measurement of the new buffer does not fall within the accepted range repeat
Calibration (6.3) with fresh aliquots of buffer solutions. Use a scanning thermometer to
verify the temperatures of the solutions if temperature differences are suspected.
Solutions should be ± 1 °C of the recorded temperature.
6.5.3 If after recalibrating the value still falls outside of the accepted range, empty and refill the
filling solution chamber before calibrating and verifying the calibration again.
6.5.4 If steps 6.5.1 through 6.5.3 do not correct the problem, see Users Guide and follow the
directions for cleaning the pH probe.
6.5.5 If steps 6.5.1 through 6.5.4 do not correct the problem, check with the Laboratory
Manager.
6.5.6 Re-equilibrate the electrode by placing the probe back into the pH 4 buffer until the
reading reaches the value recorded in the logbook.
6.6 Sample Analysis
Note: Acid rain samples should not be stirred. Instead, swirl the samples gently for a few
seconds after the introduction of the electrode. Allow the electrode to equilibrate. The air-water
interface should not be disturbed while measurements are being made.

GLM-3180-007
Revision No. 12 March 2017
Page 12 of 19
GLM3180-007_R12 Amec Foster Wheeler
6.6.1 Fill two vessels with a portion of the sample.
6.6.2 Rinse the electrode with DI water and gently blot the probe free of drops with a Kimwipe
and immerse the probe in the first vessel.
6.6.3 Swirl the probe gently to rinse before moving to the next aliquot. Stop swirling the probe
and allow the electrode to equilibrate in the second aliquot.
6.6.4 Record the value in the logbook once the reading has stabilized. Ignore any drifting of the
displayed values unless the “pH” icon beings to blink again, in which case wait until
stability returns before recording the value.
6.7 Data Analysis
6.7.1 Enter the data in Element (see Figure 7) using the manual batch processing feature outlined
in SOP GLO3180-35 Element Batch Preparation (section 3.3).
6.7.2 The analyst should note any analytical anomalies in a separate batch narrative.
6.7.3 Assemble the data batch folder, including a hard copy of the Element data batch, copies of
all run logs, certificates of analyses and processing methods, and any other
necessary documentation.
6.7.4 Complete the batch folder checklists (see Attachments B and C), and submit it for
review and finalization.
Figure 7 Element Manual Batch

GLM-3180-007
Revision No. 12 March 2017
Page 13 of 19
GLM3180-007_R12 Amec Foster Wheeler
6.8 Quality Control
6.8.1 Method blanks (BLK), consisting of DI water, must be analyzed at the beginning of each
day’s analysis unless specified differently by a project.
6.8.2 Reference samples (SRM) must be analyzed at the beginning and at the end of each run.
Acceptance criteria are ± 0.05 pH units of the certified value.
6.8.3 Control standards (CCV) must be analyzed at the beginning and end of each run, as well
as at a frequency of 10 percent. Acceptance criteria are ± 0.05 pH units of the known value.
6.8.4 Duplicate samples (DUP) must be performed at a frequency of 20 percent. Reading should
be ± 0.05 pH units of the original value.
6.8.5 If data are uploaded to the Clean Air Status and Trends Network database, the BLK, SRM,
and DUP prefixes will be changed to MB, RF, and RP respectively upon ingestion.
6.9 Calculations
All calculations are performed internally by the pH meter including the determination of the
calibration curve from the potentiometric values (in milivolts – mV) obtained during the two-
step calibration procedure outlined in section 6.3. Sample results are displayed directly as pH
values by the meter. No external calculations are performed.
6.10 Corrective actions
Attachment A shows the corrective actions taken when the QC samples are not within
acceptance criteria.
6.11 Data review
The checklists used by the analyst, peer reviewer, and supervisor in reviewing the analytical data
are shown in Attachments B and C.

GLM-3180-007
Revision No. 12 March 2017
Page 14 of 19
GLM3180-007_R12 Amec Foster Wheeler
7.0 REFERENCES
Clesceri, L.S., Greenberg, A.E., Trussel, R.R. (eds) 1992. Standard Methods for the Examination
of Water and Wastewater, 18th edition. APHA-AWWA-WPCF, Washington D.C.
Thermo Scientific. 2008. Orion Star Meter Users Guide. DN 257250-001 Revision B.
Thermo Scientific Orion Electrode User’s Guide.
U.S. Environmental Protection Agency (EPA). 2007. Guidance for the Preparation of Standard
Operating Procedures, (SOPs) for Quality-Related Documents. EPA/600/B-0//001, EPA
QA/G-6, US EPA, Washington DC. April.
ASTM International D 1293 – 12 Standard Test Methods for pH of Water January 2012

GLM-3180-007
Revision No. 12 March 2017
Page 15 of 19
GLM3180-007_R12 Amec Foster Wheeler
8.0 ATTACHMENTS
Attachment A – Corrective Actions
Attachment B – Batch Folder Checklist
Attachment C – Batch Peer Review Checklist
Attachment D – Revisions Table
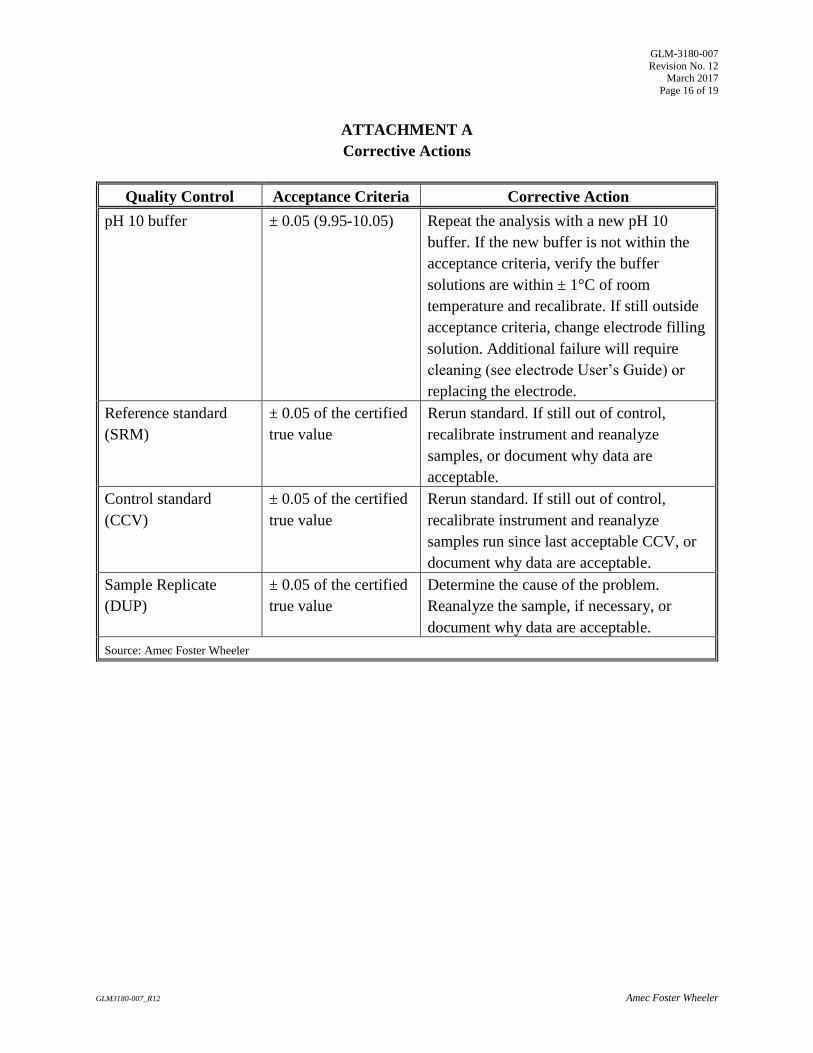
GLM-3180-007
Revision No. 12 March 2017
Page 16 of 19
GLM3180-007_R12 Amec Foster Wheeler
ATTACHMENT A
Corrective Actions
Quality Control Acceptance Criteria Corrective Action
pH 10 buffer ± 0.05 (9.95-10.05) Repeat the analysis with a new pH 10
buffer. If the new buffer is not within the
acceptance criteria, verify the buffer
solutions are within ± 1°C of room
temperature and recalibrate. If still outside
acceptance criteria, change electrode filling
solution. Additional failure will require
cleaning (see electrode User’s Guide) or
replacing the electrode.
Reference standard
(SRM)
± 0.05 of the certified
true value
Rerun standard. If still out of control,
recalibrate instrument and reanalyze
samples, or document why data are
acceptable.
Control standard
(CCV)
± 0.05 of the certified
true value
Rerun standard. If still out of control,
recalibrate instrument and reanalyze
samples run since last acceptable CCV, or
document why data are acceptable.
Sample Replicate
(DUP)
± 0.05 of the certified
true value
Determine the cause of the problem.
Reanalyze the sample, if necessary, or
document why data are acceptable.
Source: Amec Foster Wheeler
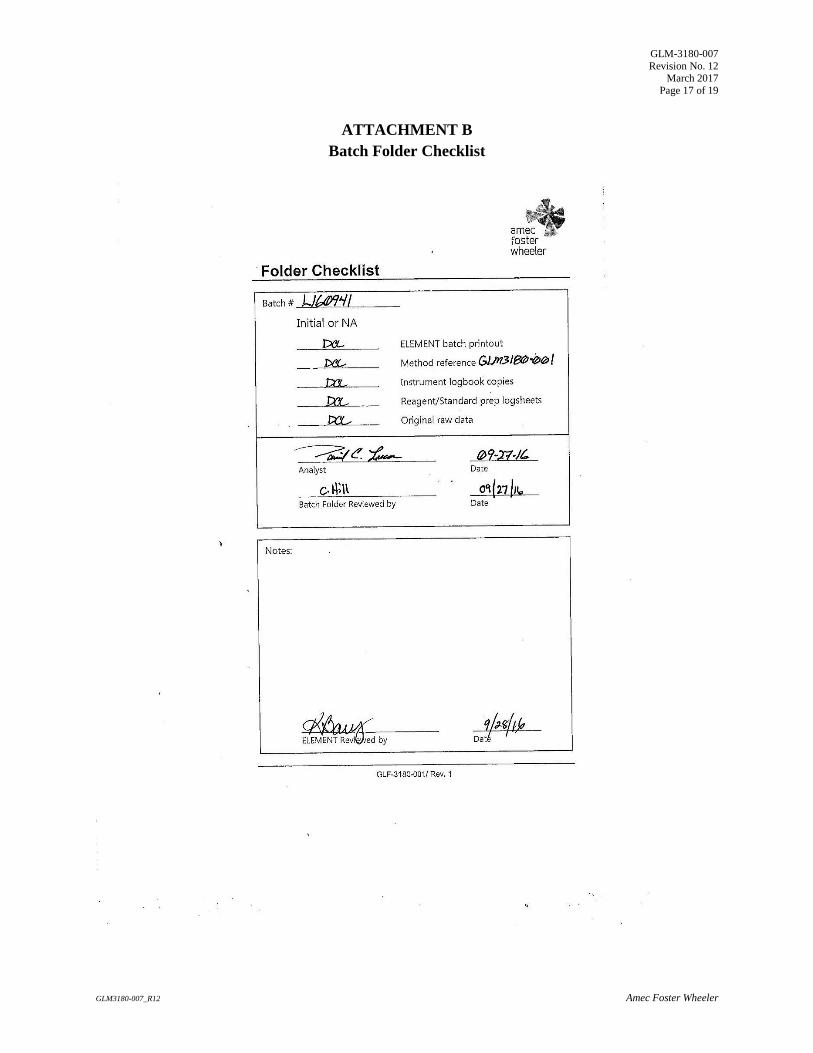
GLM-3180-007
Revision No. 12 March 2017
Page 17 of 19
GLM3180-007_R12 Amec Foster Wheeler
ATTACHMENT B
Batch Folder Checklist

GLM-3180-007
Revision No. 12 March 2017
Page 18 of 19
GLM3180-007_R12 Amec Foster Wheeler
ATTACHMENT C
Batch Peer Review Checklist

GLM-3180-007
Revision No. 12 March 2017
Page 19 of 19
GLM3180-007_R12 Amec Foster Wheeler
ATTACHMENT D
Revisions Table
Table - Revisions
Document Revision
No.
Section Revision
11.0
Attachment D Addition of this table.
Attachment B Updated figure
Attachment C Updated figure
Document title Updated reference method from EPA 150.1 to
ASTM D1293-12
Signature page Updated Laboratory Manager to Katherine Barry.
Removed Garry Price.
Entire SOP Changed company name to Amec Foster Wheeler
7.0 Updated SOP preparation reference
12.0 7.0 Updated Standard Methods for the Examination of
Water & Wastewater from 17th edition to 18th.


GLM-3180-008
Revision No. 12 May 2017
Page 2 of 22
GLM-3180-008_R12 Amec Foster Wheeler
DETERMINATION OF SPECIFIC CONDUCTANCE FOR WET
DEPOSITION SAMPLES (EPA METHOD 120.1)
1.0 PURPOSE
The purpose of this standard operating procedure (SOP) is to provide consistent guidance to
Amec Foster Wheeler laboratory personnel for the determination of the conductivity of water
samples.
2.0 SCOPE
This method is applicable to drinking, surface, and saline waters, domestic and industrial wastes,
and acid rain (atmospheric wet deposition).
3.0 SUMMARY OF METHOD
The specific conductance of a sample is measured by the use of a self-contained conductivity
meter, Wheatstone bridge-type, or equivalent.
Samples are preferably analyzed at 25 degrees Celsius (C). Automatic Temperature
Compensation (ATC) is used by the instrument to make temperature corrections to report the
results at 25 C.
3.1 Method Interferences
Electrolytic conductivity increases with temperature approximately 2.1 percent per C.
Significant differences exist between the temperature coefficients of conductivity when
comparing different ions. Therefore, temperature variations and corrections represent the largest
source of potential error. Dirty conductivity cells can cause erroneous readings.
Dissolved carbon dioxide (CO2) and ammonia (NH3) from the atmosphere increase the
conductivity of samples. Protect all solutions and samples from the atmosphere as much
as possible.
3.2 Deviations from the Method
A general overview of the steps described in this SOP is depicted Figure 1. Deviations from the
analytical method described in this SOP are not permitted.

GLM-3180-008
Revision No. 12 May 2017
Page 3 of 22
GLM-3180-008_R12 Amec Foster Wheeler
Figure 1 Overview – Laboratory Operations Procedures for Specific Conductance of Range 1
Samples (0-300 µS/cm)
Remove samples from coldroom and
allow to reach room temperature.
Insert conductivity probe into the 100
µS/cm standard.
Press Calibrate key.
Wait for the µS/cm icon to stop flashing
and the icon to start flashing. The
meter will display the conductivity
standard value at 25 oC.
Press the measure key to save the
calibration. Record the displayed
cell constant.
Analyze samples. Any samples > 300
µS/cm must be reanalyzed on Range 2.
Verify calibration by analyzing the low,
mid and high calibration check
solutions and the CCV and SRM.
Analyze a CCV after every 10 samples,
a duplicate for every 20 samples and
end with a SRM and CCV.
QC passes: enter data manually
in Element.
QC fails:
Recalibrate or
replace electrode.
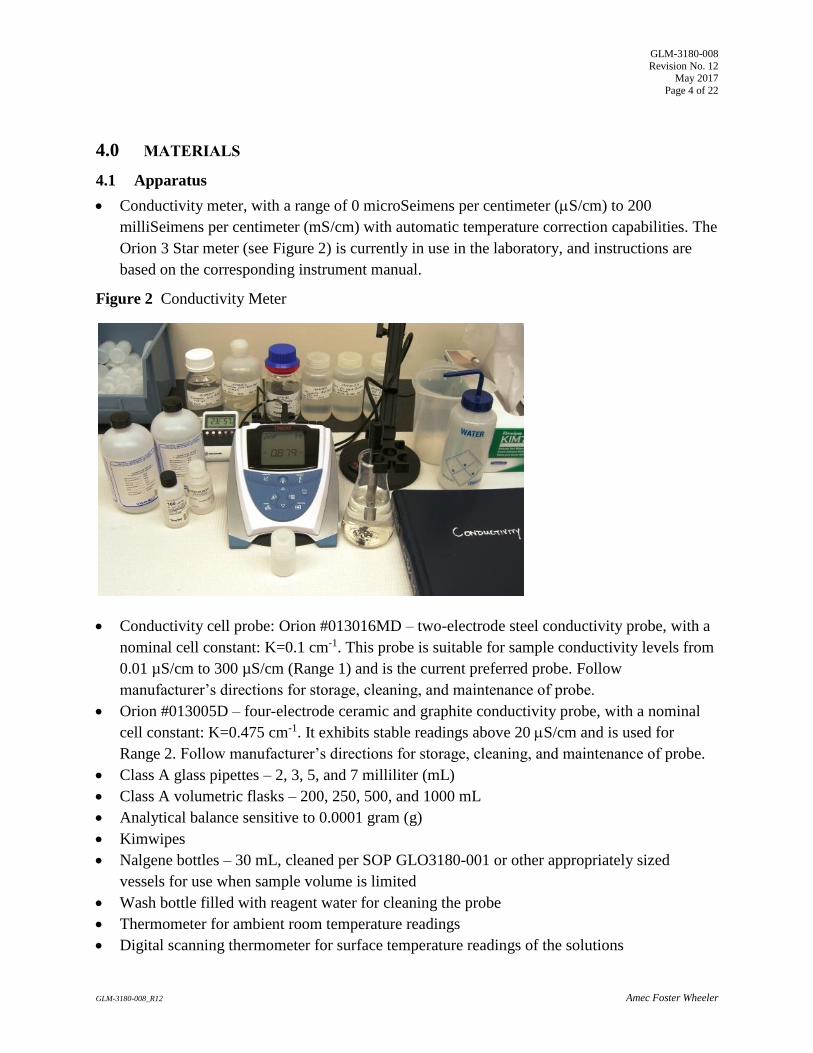
GLM-3180-008
Revision No. 12 May 2017
Page 4 of 22
GLM-3180-008_R12 Amec Foster Wheeler
4.0 MATERIALS
4.1 Apparatus
Conductivity meter, with a range of 0 microSeimens per centimeter (S/cm) to 200
milliSeimens per centimeter (mS/cm) with automatic temperature correction capabilities. The
Orion 3 Star meter (see Figure 2) is currently in use in the laboratory, and instructions are
based on the corresponding instrument manual.
Figure 2 Conductivity Meter
Conductivity cell probe: Orion #013016MD – two-electrode steel conductivity probe, with a
nominal cell constant: K=0.1 cm-1. This probe is suitable for sample conductivity levels from
0.01 µS/cm to 300 µS/cm (Range 1) and is the current preferred probe. Follow
manufacturer’s directions for storage, cleaning, and maintenance of probe.
Orion #013005D – four-electrode ceramic and graphite conductivity probe, with a nominal
cell constant: K=0.475 cm-1. It exhibits stable readings above 20 S/cm and is used for
Range 2. Follow manufacturer’s directions for storage, cleaning, and maintenance of probe.
Class A glass pipettes – 2, 3, 5, and 7 milliliter (mL)
Class A volumetric flasks – 200, 250, 500, and 1000 mL
Analytical balance sensitive to 0.0001 gram (g)
Kimwipes
Nalgene bottles – 30 mL, cleaned per SOP GLO3180-001 or other appropriately sized
vessels for use when sample volume is limited
Wash bottle filled with reagent water for cleaning the probe
Thermometer for ambient room temperature readings
Digital scanning thermometer for surface temperature readings of the solutions

GLM-3180-008
Revision No. 12 May 2017
Page 5 of 22
GLM-3180-008_R12 Amec Foster Wheeler
4.2 Reagents
Reagent Water: Deionized (DI) water of resistivity of 15 mega ohms (M) or greater,
derived from mixed bed ion exchangers, activated carbon filters, and polishing exchangers.
Water should contain particles no larger than 0.20 micrometers.
Laboratory-prepared Calibration Standards: If laboratory-prepared calibration standards are
used, a commercially available control standard should be used for verification. Substituting
a laboratory-prepared standard for a commercially unavailable conductivity level is
acceptable. See Attachment A for conductivity target calculation procedure. Class A
volumetric flasks and pipettes must be used for preparation of all solutions.
Potassium Chloride (KCl) Stock Solutions
o KCl Stock Solution I (0.050 Molar [M]) KCl: Dissolve 0.932 (g) of pre-dried (minimum
of two hours at 105 C) KCl in 250 mL of DI water. Conductivity of this solution should
be 6668 S/cm. Expiration is one year from preparation date.
o KCl Stock Solution II (0.500 M KCl): Dissolve 9.32 (g) of pre-dried (minimum of two
hours at 105 C) KCl in 250 mL of DI water. Conductivity of this solution should be
58.64 mS/cm. Expiration is one year from preparation date.
o KCl Stock Solution III (0.100 M KCl): Dissolve 1.864 (g) of pre-dried (minimum of twp
hours at 105 C) KCl in 250 mL of DI water. Conductivity of this solution should be
12.90mS/cm. Expiration is one year from preparation date.
Calibration Standards, Range 1 (0-300 S/cm):
o Calibration Standard I – (0.500 millimolar mM KCl): Dilute 5.0 mL KCl Stock Solution I
(0.050 M KCl) to 500 mL with DI water. Conductivity of the solution is 73.90 S/cm.
This standard may also be used as a Mid-level Calibration Check Standard for this range.
Expiration is six months from preparation date.
o High Calibration Check Standard I – (2.0 mM KCl): Dilute 2.0 mL Stock Solution II
(0.500 M KCl) to 500 mL with DI water. Conductivity of the solution should be 289.7
S/cm. This solution is also used as the Mid-level Calibration Check Standard for Range
2. Expiration is six months from preparation date.
Calibration Standards, Range 2 (> 100 S/cm):
o Calibration Standard II – Range 2 (5.00 mM KCl): Dilute 2.0 mL KCl Stock Solution II
(0.500 M KCl) to 200 mL with DI water. Conductivity of the solution should be 717.8
S/cm. Expiration is six months from preparation date.
o Low Calibration Check Standard – Range 2 (1.5 mM KCl): Dilute 3.0 mL of Stock
Solution III (0.100 M KCl) to 200 mL with DI water. Conductivity of the solution should
be 218.4 S/cm. Expiration is six months from preparation date.
o High Calibration Check Standard II– Range 2 (14.0 mM KCl): Dilute 7.0 mL Stock
Solution II (0.500 M KCl) to 250 mL with DI water. Conductivity of the solution should
be 1955 S/cm. Expiration is six months from preparation date.

GLM-3180-008
Revision No. 12 May 2017
Page 6 of 22
GLM-3180-008_R12 Amec Foster Wheeler
Control Standard Solutions:
o Control Standard Solution II – Range 2 (7.5 mM KCl): Dilute 3.0 mL of Stock Solution
II (0.500 M KCl) to 200 mL DI water. Conductivity of the solution should be 1065
S/cm. Expiration is six months from preparation date.
Commercial Solutions - commercial National Institute of Standards and Technology (NIST)
traceable calibration, reference and calibration standards from different manufacturers are all
acceptable for usage. A Certificate of Analysis and expiration date must be supplied with all
commercial standards and reference solutions (see Figure 3).
o Commercial Calibration Standard I – Range 1: Thermo Scientific 100 S/cm standard
conductivity solution, or equivalent.
o Commercial Calibration Standard II – Range 2: Thermo Scientific 1413 S/cm standard
conductivity solution, or equivalent.
o Commercial Low Calibration Check Standard I – Range 1: Commercial NIST traceable
standard conductivity solution of approximately 10 S/cm.
o Commercial Low Calibration Check Standard II – Range 1: Commercial NIST traceable
standard conductivity solution of approximately 5 S/cm.
o Commercial Reference Solution I – Range 1: High-Purity Standards Simulated Rainwater
1, or equivalent. This standard should be in the range of 20-30 S/cm.
o Commercial Reference Solution II – Range 2: Commercial mid-range NIST traceable
standard conductivity solution in the range of 200-500 S/cm.
o Commercial Control Solution – Range 1: Commercial NIST traceable standard solution
of approximately 15 μS/cm concentration.
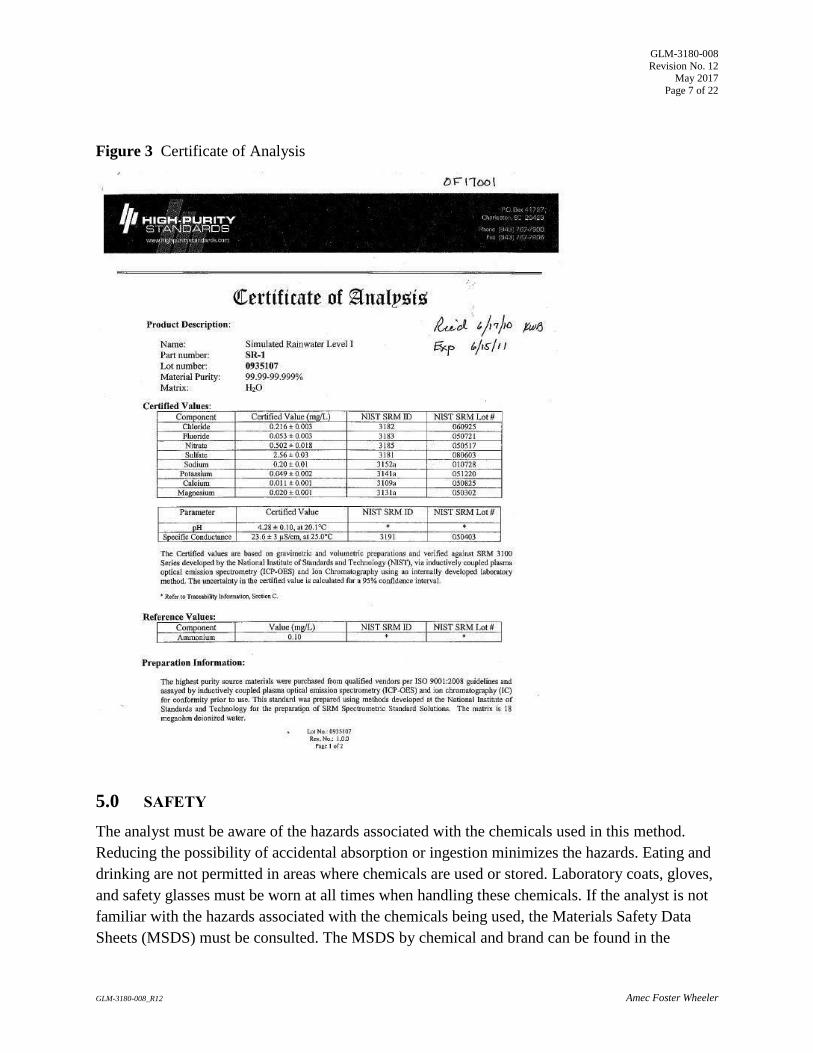
GLM-3180-008
Revision No. 12 May 2017
Page 7 of 22
GLM-3180-008_R12 Amec Foster Wheeler
Figure 3 Certificate of Analysis
5.0 SAFETY
The analyst must be aware of the hazards associated with the chemicals used in this method.
Reducing the possibility of accidental absorption or ingestion minimizes the hazards. Eating and
drinking are not permitted in areas where chemicals are used or stored. Laboratory coats, gloves,
and safety glasses must be worn at all times when handling these chemicals. If the analyst is not
familiar with the hazards associated with the chemicals being used, the Materials Safety Data
Sheets (MSDS) must be consulted. The MSDS by chemical and brand can be found in the

GLM-3180-008
Revision No. 12 May 2017
Page 8 of 22
GLM-3180-008_R12 Amec Foster Wheeler
AMEC FOSTER WHEELER laboratory or at the Web sites http://www.msdssearch.com or
http://www.hazard.com/msds/index.php using the CAS number.
6.0 PROCEDURE
6.1 Calibration
Figure 4 Diagram of Orion 3-Star Conductivity Bench-top Meter Keypad

GLM-3180-008
Revision No. 12 May 2017
Page 9 of 22
GLM-3180-008_R12 Amec Foster Wheeler
Note: This calibration method is for Range 1- a one-point calibration utilizing the AutoBuffer
recognition feature of the Orion 3-Star Bench-top conductivity meter (see Figure 4 for a diagram
of the keypad and Figure 5 for an overview of the calibration steps). Other calibration methods
are listed in the manual for this meter and may be used in cases as approved by the Laboratory
Manager and/or QA Manager.
Figure 5 Conductivity Calibration Overview
6.1.1 Turn the on the meter (see Fig 5-1). The
display will show the room temperature (see
Fig 5-2).
6.1.2 Select the Thermo Scientific Orion
conductivity standard for Range 1: 100
µS/cm (see Fig 5-3).
6.1.3 In the Setup Mode enter the nominal cell
constant value for the conductivity probe
(0.102) (see Fig 5-4).
6.1.4 Rinse the conductivity probe with DI and blot
dry with a Kimwipe (see Fig 5-5) and insert
into the 100 µS/cm standard (see Fig 5-6).
Probe should be inserted in the liquid far
enough to cover the ports (see Figure 6).
6.1.5 Press the Calibrate key (see Fig 5-7). The
meter will show the manual calibration
display for about five seconds. Do not press
any keys. The meter will then proceed to the
autocalibration display (see Fig 5-8).
6.1.6 Wait for the µS/cm icon to stop flashing and
the icon to start flashing. The meter will
display the conductivity standard value at 25 oC (see Fig 5-9). The displayed value should
be within + 5% of the certified value. If the
displayed value is not within acceptable
limits, use a fresh standard and recalibrate.
6.1.7 Press the Measure key (see Fig 5-10) to save
and end the calibration. The calculated cell
constant will be displayed and then the meter
will proceed to the measurement mode.
Record the cell constant.

GLM-3180-008
Revision No. 12 May 2017
Page 10 of 22
GLM-3180-008_R12 Amec Foster Wheeler

GLM-3180-008
Revision No. 12 May 2017
Page 11 of 22
GLM-3180-008_R12 Amec Foster Wheeler
Figure 6 Immersion Depth for Probe
6.2 Verify Calibration
6.2.1 The meter is typically in AUTO-READ mode. Press the Measure key to take a
measurement. Once the reading stabilizes, the AR icon will stop flashing and the display
will freeze. Press the Measure key again to take a new measurement.
6.2.2 Rinse the probe with DI water and blot excess water from the outside surfaces with a
Kimwipe prior to immersing the probe in the next sample. Store the probe in DI water
between samples.
6.2.3 Check the calibration using the low, mid, and high calibration check solutions. The
acceptance criterion is 10 percent of the certified or calculated value. If the calibration
check standards do not fall within range, re-calibrate the meter. If the readings are within
the acceptance range, record the values and temperature on the Conductivity Calibration
logbook page (see Attachment B).
6.2.4 Analyze a control and reference sample. The values must be within 15 percent of the
certified or calculated value or the meter must be recalibrated.
6.2.5 If re-calibrating the meter does not give conductivity readings within the acceptable
criteria, clean the conductivity cell following the manufacturer’s instructions.
6.2.6 If cleaning the conductivity cell does not give conductivity readings within the acceptable
criteria, consult the Analytical Laboratory Manager. The conductivity cell may need to be
replaced or replatinized.

GLM-3180-008
Revision No. 12 May 2017
Page 12 of 22
GLM-3180-008_R12 Amec Foster Wheeler
6.3 Sample Analysis
Note: Acid rain samples should not be stirred. Instead, swirl the samples gently for a few
seconds after the introduction of the probe.
6.3.1 Allow the unpreserved samples to come to room temperature, prior to analyses.
6.3.2 Fill a vessel with the sample. The 30 mL Nalgene bottles require a minimum of 20 mL of
sample to properly immerse the probe. If there is insufficient sample available, 7 mL
scintillation vials may be used (the minimum sample volume for the vial is 3 mL). If the
smaller vial is used a note should be made in the instrument logbook (see Attachment C).
6.3.3 Follow the analysis procedure detailed in Verify Calibration (section 6.2).
6.3.4 Record the results, temperature, and any pertinent comments in the appropriate place in
the Conductivity Logbook.
6.3.5 If any samples are found to be outside of Range 1, recalibrate the meter using the
alternate probe and Range 2 standards. Reanalyze the high sample. Include the data from
any reanalysis and the QC with the initial analysis.
6.3.6 For overnight or long-term storage, the conductivity cell should be thoroughly rinsed and
stored dry.
6.4 Data Analysis
6.4.1 Enter the data in Element (see Figure 7) using the manual batch processing feature
outlined in SOP GLO3180-35 Element Batch Preparation (section 3.3).
6.4.2 The analyst should note any analytical anomalies in a separate batch narrative.
6.4.3 Assemble the data batch folder, including a hard copy of the Element data batch, copies
of all logbooks, certificates of analyses and processing methods, and any other necessary
documentation.
6.4.4 Complete the batch folder checklists (Attachment E and F), and submit it for review and
finalization.
6.5 Quality Control
6.5.1 A method blank (BLK) must be analyzed at the beginning of each run. BLK consists of
DI water. A method blank should also be analyzed with any samples reanalyzed at a
different calibration range.
6.5.2 Replicate samples (DUP) must be analyzed at a frequency of 5 percent for every
analytical batch unless specified differently by a project. Value must be within
15 percent.

GLM-3180-008
Revision No. 12 May 2017
Page 13 of 22
GLM-3180-008_R12 Amec Foster Wheeler
6.5.3 Reference samples (SRM) are analyzed at the beginning and end of each run. Value must
be within 15 percent of the certified value. Additional reference samples are analyzed
with any samples reanalyzed at a different calibration range.
6.5.4 Control standards are continuing calibration verification (CCV) standards that are
analyzed every 10 samples. Values must be within 15 percent of the certified value.
Additional control standards are analyzed with any samples reanalyzed at a different
calibration range.
6.5.5 If data are uploaded to the Clean Air Status and Trends Network database, the BLK,
SRM, and DUP prefixes will be changed to MB, RF, and RP respectively upon ingestion.
Figure 7 Element Manual Batch
6.6 Calculations
Calculations are performed internally by the conductivity meter from the calibration obtained
during the autocalibration procedure outlined in section 6.1 and include temperature correction
based on the stored temperature coefficient (2.1 percent). Sample results are displayed directly as
specific conductance, S/cm at 25 C by the meter. No external calculations are performed.
GLM-3180-008
Revision No. 12 May 2017
Page 14 of 22
GLM-3180-008_R12 Amec Foster Wheeler
6.7 Corrective actions
Attachment D shows the corrective actions taken when the QC Samples are not within
acceptance criteria.
6.8 Data review
The checklists used by the analyst, peer reviewer, and supervisor in reviewing the analytical data
are shown in Attachments E and F.

GLM-3180-008
Revision No. 12 May 2017
Page 15 of 22
GLM-3180-008_R12 Amec Foster Wheeler
7.0 REFERENCES
Clesceri, L.S., Greenberg, A.E., Trussel, R.R. (eds). 1992. Standard Methods for the
Examination of Water and Wastewater, 18th edition APHA-AWWA-WPCF,
Washington DC.
Thermo Scientific. Orion Star Meter Users Guide. DN 257250-001 Revision B 10-08.
Thermo Scientific. 2007. Orion Electrode User’s Guide. DN 25478.001 Revision A.
U.S. Environmental Protection Agency (EPA). 2007. Guidance for the Preparation of Standard
Operating Procedures, (SOPs) for Quality-Related Documents. EPA/600/B-0//001, EPA
QA/G-6, US EPA, Washington DC. April.
U.S. Environmental Protection Agency (EPA). 1983. Methods for Chemical Analysis of Water
and Wastes (EPA 120.1), EPA 600/4-79-020, revised March 1983.

GLM-3180-008
Revision No. 12 May 2017
Page 16 of 22
GLM-3180-008_R12 Amec Foster Wheeler
8.0 ATTACHMENTS
Attachment A – Calculating Conductivity Targets
Attachment B – Conductivity Logbook page
Attachment C – Corrective Actions
Attachment D – Batch Folder Checklist
Attachment E – Batch Peer Review Checklist
Attachment F – Revisions Table

GLM-3180-008
Revision No. 12 May 2017
Page 17 of 22
GLM-3180-008_R12 Amec Foster Wheeler
ATTACHMENT A
Calculating Conductivity Targets
Conductivity of KCl Solutions at 25 C
Concentration
8.1 M
Equivalent Conductivity
mho/cm/equiv.
Conductivity
S/cm
0 149.85
0.0001 149.43 14.94
0.0005 147.81 73.90
0.001 146.95 147.0
0.005 143.55 717.8
0.01 141.27 1413
0.02 138.34 2767
0.05 133.37 6668
0.1 128.96 12900
0.2 124.08 24820
0.5 117.27 58640
1 111.87 111900
Standard Methods for the Examination of Water and Wastewater, 17th edition, 1989.
Edited by Clesceri, L.S., Greenberg, A.E., Trussel, R.R. APHA-AWWA-WPCF, Washington D.C.
p. 2-60
To calculate conductivity for a solution:
k = c103 where k is measured conductivity in S/cm
is equivalent conductivity in mho/cm/equiv.
and c is equivalent concentration (molar concentration
for KCl)
Use closest equivalent conductivity for calculation.

GLM-3180-008
Revision No. 12 May 2017
Page 18 of 22
GLM-3180-008_R12 Amec Foster Wheeler
ATTACHMENT B
Sample Conductivity Logbook Page
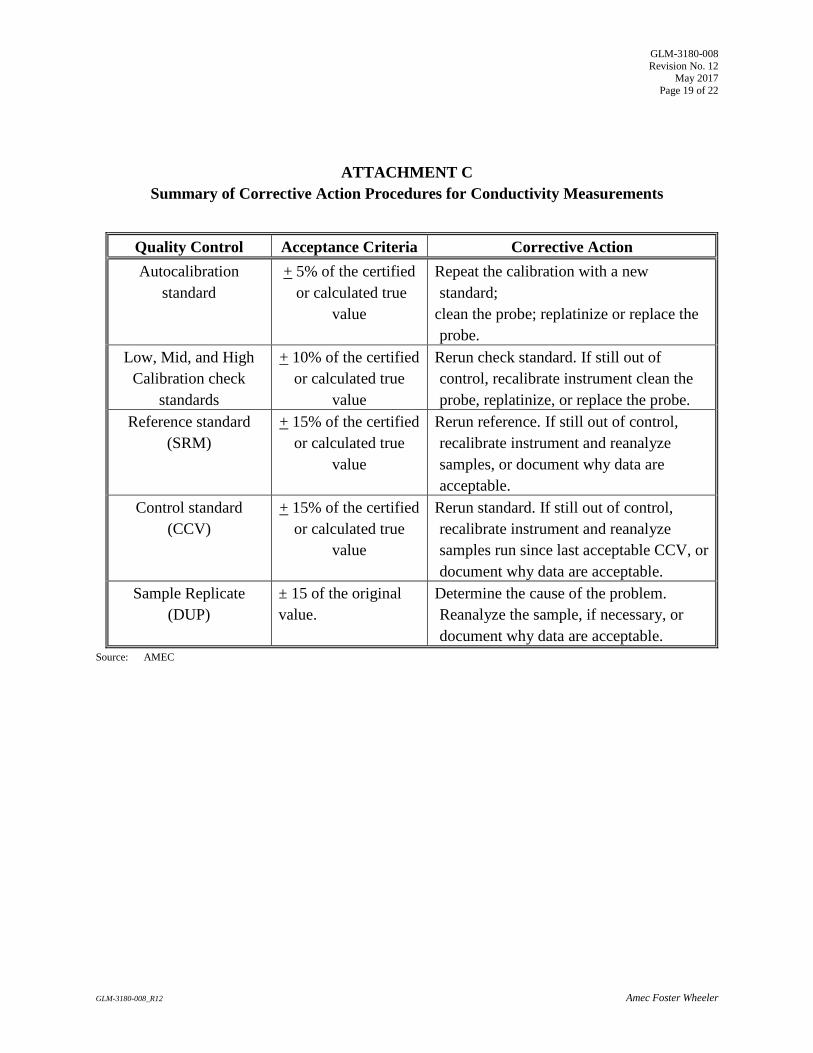
GLM-3180-008
Revision No. 12 May 2017
Page 19 of 22
GLM-3180-008_R12 Amec Foster Wheeler
ATTACHMENT C
Summary of Corrective Action Procedures for Conductivity Measurements
Quality Control Acceptance Criteria Corrective Action
Autocalibration
standard
+ 5% of the certified
or calculated true
value
Repeat the calibration with a new
standard;
clean the probe; replatinize or replace the
probe.
Low, Mid, and High
Calibration check
standards
+ 10% of the certified
or calculated true
value
Rerun check standard. If still out of
control, recalibrate instrument clean the
probe, replatinize, or replace the probe.
Reference standard
(SRM)
+ 15% of the certified
or calculated true
value
Rerun reference. If still out of control,
recalibrate instrument and reanalyze
samples, or document why data are
acceptable.
Control standard
(CCV)
+ 15% of the certified
or calculated true
value
Rerun standard. If still out of control,
recalibrate instrument and reanalyze
samples run since last acceptable CCV, or
document why data are acceptable.
Sample Replicate
(DUP)
± 15 of the original
value.
Determine the cause of the problem.
Reanalyze the sample, if necessary, or
document why data are acceptable.
Source: AMEC

GLM-3180-008
Revision No. 12 May 2017
Page 20 of 22
GLM-3180-008_R12 Amec Foster Wheeler
ATTACHMENT D
Batch Folder Checklist

GLM-3180-008
Revision No. 12 May 2017
Page 21 of 22
GLM-3180-008_R12 Amec Foster Wheeler
ATTACHMENT E
Batch Peer Review Checklist

GLM-3180-008
Revision No. 12 May 2017
Page 22 of 22
GLM-3180-008_R12 Amec Foster Wheeler
ATTACHMENT F
Revisions Table
Table - Revisions
Document Revision
No.
Section Revision
10.0
Signature page Updated Laboratory Manager to Katherine Barry.
Removed Garry Price.
Entire SOP Changed company name to Amec Foster Wheeler
7.0 Updated SOP preparation reference
Attachment E Updated figure
Attachment F Updated figure
Attachment G Addition of this table
11.0 7.0 Updated Standard Methods for the Examination of
Water & Wastewater from 17th Edition to 18th.
12.0
Attachment B Deleted. Information is now in instrument
logbook.
Attachment C Replaced outdated version with new logbook
page.
Attachment
C-G
Renumbered B-F due to deletion of original
Attachment B

GLO-3180-001 Revision No. 6
October 2011 Page 2 of 5
GLO3180-001_R6_V-2.docx AMEC E&I, Inc.
SAMPLE CONTAINER PREPARATION FOR DRY AND WET DEPOSITION
1.0 PURPOSE
The purpose of this standard operating procedure (SOP) is to provide consistent guidance to the AMEC E&I, Inc. (AMEC) laboratory personnel for the cleaning of bottles, buckets, and bucket lids used to store dry and wet deposition samples.
2.0 SCOPE
This SOP applies to all extraction bottles, wet deposition filtration bottles, cloud bottles, one liter (L) field sample bottles, and wet deposition buckets and bucket lids that are used to collect, store and extract Clean Air Status and Trends Network (CASTNET) samples.
3.0 MATERIALS
Powder-free gloves. Resealable plastic bags. Bottles - high density polyethylene (HDPE), various sizes. Wet deposition bottle labels. Sponge. Large plastic bags. Plastic-backed absorbent paper. Deionized (DI) water of resistivity of 15 MΩ or greater, derived from mixed bed ion exchangers, activated carbon filters, and polishing exchangers. Water should contain particles no larger than 0.20 microns. Large plastic tubs. Aluminum foil. Drying oven.

GLO-3180-001 Revision No. 6
October 2011 Page 3 of 5
GLO3180-001_R6_V-2.docx AMEC E&I, Inc.
Figure 1. Sample Containers
4.0 PROCEDURE
Note: Powder-free gloves are to be worn throughout all steps of this procedure. 4.1 4.1 Cleaning of bottles 4.1.1 Line a large plastic tub with aluminum foil.
4.1.2 Use only new polyethylene bottles and discard any bottles that appear to have defects (cracks, bad threading, abraded interior surfaces).
4.1.3 Rinse each bottle and cap a minimum of three times with DI water.
4.1.4 Shake out excess water with each rinse. Once the 8-ounce filtration sample bottle and cap are shaken dry, they are ready to use for sample filtration.
4.1.5 Place the extraction bottles, cloud bottles and caps in the foil lined trays and place in the designated oven at 70 degrees Celsius (°C) for approximately 2 hours.
4.1.6 When the bottles/caps are dry, remove from oven.
4.1.7 Cover the bottles with foil and allow to cool.
4.1.8 Once the bottles are cool, attach caps to the bottles and store in the designated box.
4.1.9 For cloud bottles, attach one cloud bottle label (see Figure 2) to each bottle and store in the large plastic bags.

GLO-3180-001 Revision No. 6
October 2011 Page 4 of 5
GLO3180-001_R6_V-2.docx AMEC E&I, Inc.
Figure 2. Cloud Bottle Label
4.2 Cleaning of 1-L wet deposition field sample bottles. 4.2.1 4.2.1 Prior to cleaning, remove any sample labels attached to the outside of the bottle. Any
bottles that are showing sign of wear (cracks, bad threading, abraded interior surfaces) should be discarded.
4.2.2 4.2.2 Line the counter top with the plastic-backed absorbent paper or line the bottom of the large plastic tub.
4.2.3 Rinse each bottle and cap a minimum of three times with DI water.
4.2.4 Shake out excess water each time.
4.2.5 Place bottle/cap upside down but slightly tilted to dry on the absorbent paper.
4.2.6 The next day, when the items are dry, place caps back on bottles.
4.2.7 Attach one wet deposition bottle label (see Figure 3) to each bottle.
4.2.8 Store cleaned field bottles in resealable plastic bags in designated area.
Figure 3. Wet Deposition Bottle Label

GLO-3180-001 Revision No. 6
October 2011 Page 5 of 5
GLO3180-001_R6_V-2.docx AMEC E&I, Inc.
4.3 Cleaning of wet deposition buckets and bucket lids. 4.3.1 Line the drying area with the plastic-backed absorbent paper.
4.3.2 Rinse the sponge thoroughly with DI water. Wash the bucket/lid very well both inside and out using the sponge. Rinse the inside of the bucket/lid two or three times by swirling DI water.
4.3.3 Hit the bucket on the absorbent paper to knock off the excess water and place upside down to dry. The lids only need a good shake to get the excess water off and are placed upside down to dry.
4.3.4 The next day, when the items are dry, wrap each bucket and lid in a new plastic bag (with the open end of the bucket facing downward), tie the bag closed, and store in the designated area. If the bucket is identified as a Dry Fall Bucket, attach one "Dry Fall Bucket" label (see Figure 4) to the bucket prior to wrapping in a plastic bag.
Figure 4. Dry Fall Bucket Label
5.0 REFERENCES
AMEC E&I, Inc. (AMEC). 2011. Clean Air Status and Trends Network (CASTNET) Quality Assurance Project Plan, Revision 8.0. Prepared for U.S. Environmental Protection Agency (EPA), Washington, DC. Contract No. EP-W-09-028. Gainesville, FL.
U.S. Environmental Protection Agency (EPA). 1995. Guidance for the Preparation of Standard
Operating Procedures, (SOPs) for Quality-Related Documents. EPA/600/R-96/027, November.


GLO-3180-002
Revision No. 7 October 2016
Page 2 of 5
GLO3180-002_R7_V1.docx Amec Foster Wheeler
WASHING OF FILTER PACK EQUIPMENT AND DENUDERS
1.0 PURPOSE
The purpose of this standard operating procedure (SOP) is to provide consistent guidance to the
Amec Foster Wheeler laboratory personnel for the cleaning of filter pack equipment and denuders
to minimize any contamination.
2.0 SCOPE
This SOP applies to all types of filter packs and denuders (Savillex, National Oceanic and
Atmospheric Administration, and University Research Glassware-URG) used for Clean Air Status
and Trends Network (CASTNET) and other projects.
3.0 MATERIALS
Powder-free gloves
Various sizes of plastic tubs
Brushes dedicated to this procedure
Resealable plastic bags
Resealable plastic containers
Squeeze bottle.
Aluminum foil
Drying oven
Deionized (DI) water of resistivity of 15 mega ohms (M) or greater, derived from mixed bed ion
exchangers, activated carbon filters, and polishing exchangers. Water should contain particles no
larger than 0.20 micrometers.
Methanol (MeOH), ACS reagent grade or better, CAS No. 67-56-1.
4.0 SAFETY
The analyst must be aware of the hazards associated with the chemicals used in this method.
Reducing the possibility of accidental absorption or ingestion minimizes the hazards. Eating and
drinking are not permitted in areas where chemicals are used or stored. Laboratory coats, gloves,
and safety glasses must be worn at all times when handling these chemicals. If the analyst is not
familiar with the hazards associated with the chemicals being used, the Safety Data Sheets (SDS)
must be consulted. The SDS by chemical and brand can be found in the Amec Foster Wheeler
laboratory or at the Web sites http://www.msdssearch.com or
http://www.hazard.com/msds/index.php using the CAS number.

GLO-3180-002
Revision No. 7 October 2016
Page 3 of 5
GLO3180-002_R7_V1.docx Amec Foster Wheeler
5.0 PROCEDURE
Note: Powder-free gloves are to be worn throughout all steps of this procedure. These procedures
are performed in the washroom where all required components are available.
5.1 Filter Pack Equipment
5.1.1 Take the filter pack apart. Any parts which appear worn, damaged, or broken are to be
replaced.
5.1.2 Place the filter support rings, grids, end caps and forceps in separate precleaned tubs filled
with DI water. Agitate the items by hand for a few minutes and then allow to soak as
needed.
5.1.3 Line large plastic tubs with aluminum foil as necessary.
5.1.4 Wash the filter collar and bottom support under a continuous flow of DI water. Scrub these
parts clean using brushes. Make sure all grooves and places where particulate matter may
collect are thoroughly cleaned.
5.1.5 Rinse the filter support rings, grids, end caps and forceps a minimum of three times with DI
water. Shake as much excess water from these parts as possible before placing them in a
foil-lined tub (see Figure 1).
Figure 1 Foil lined tubs with parts for drying.
5.1.6 Place the tubs in the project drying oven at 70 degrees Celsius (C) for approximately two
hours or until dry.
5.1.7 Once dry, remove the tubs and immediately cover them with aluminum foil. Filter packs can
be stored this way for up to three days.
5.1.8 Store the forceps in resealable plastic bags until used.
5.1.9 For long-term storage, the filter packs or various parts are placed in resealable plastic bags
and then stored in large resealable plastic containers.

GLO-3180-002
Revision No. 7 October 2016
Page 4 of 5
GLO3180-002_R7_V1.docx Amec Foster Wheeler
5.2 Denuders
5.2.1 Remove end caps from the denuder
5.2.2 Rinse each cap with DI water, filling, swishing, and dumping three times.
5.2.3 Using a properly labeled squeeze bottle, rinse the denuder with MeOH over the labeled
denuder waste container.
5.2.4 Rinse the denuder, running DI water through the channels for approximately 10 seconds on
each side. Rinse the outside threads of both ends.
5.2.5 Put the denuder into a large wash tub and fill with DI water.
5.2.6 Soak for approximately 24 hours.
5.2.7 Shake water out of the denuder and caps and place in an aluminum foil lined heat resistant
tray (see Figure 2). Cover with aluminum foil and dry in the oven for about two hours at
60º C.
Figure 2 Foil lined tubs with denuders for drying.
5.2.8 Once cool, cap the denuders and store in a foil lined and covered tub.

GLO-3180-002
Revision No. 7 October 2016
Page 5 of 5
GLO3180-002_R7_V1.docx Amec Foster Wheeler
6.0 REFERENCES
U.S. Environmental Protection Agency (EPA). 2007. Guidance for the Preparation of Standard
Operating Procedures, (SOPs) for Quality-Related Documents. EPA/600/B-0//001, EPA
QA/G-6, US EPA, Washington DC. April.
7.0 ATTACHMENTS
Attachment A – Revisions Table

GLO-3180-002
Revision No. 7 October 2016
Page 6 of 5
GLO3180-002_R7_V1.docx Amec Foster Wheeler
ATTACHMENT A
Revisions Table
Table - Revisions
Document Revision No. Section Revision
7.0
Signature page Updated Laboratory Manager to Katherine Barry.
Removed Garry Price.
Entire SOP Changed company name to Amec Foster Wheeler
4.0 Update Materials Safety Data Sheets to Safety Data
Sheets
6.0 Updated SOP preparation reference
7.0 Addition of this table


GLO-3180-003
Revision No. 10 March 2017
Page 2 of 9
GLO3180-003_R10 Amec Foster Wheeler
CENTRAL SAMPLE STORAGE ORGANIZATION FOR DRY AND WET
DEPOSITION SAMPLES
1.0 PURPOSE
The purpose of this standard operating procedure (SOP) is to provide consistent guidance to the
Amec Foster Wheeler laboratory personnel for the storage of samples at the Gainesville Laboratory.
2.0 SCOPE
This SOP applies to all dry deposition filters, denuders, extracts, and wet deposition for Clean Air
Status and Trends Network (CASTNET) and other project samples.
3.0 MATERIALS
Samples, pre- and post-extraction
Standard refrigerators
Walk-in Coldrooms
Traceable/ISO Calibrated Thermometers
Temperature log books
4.0 SAFETY
The analyst must be aware of the hazards associated with the chemicals used in this method.
Reducing the possibility of accidental absorption or ingestion minimizes the hazards. Eating and
drinking are not permitted in areas where chemicals are used or stored. Laboratory coats, gloves,
and safety glasses must be worn at all times when handling these chemicals. If the analyst is not
familiar with the hazards associated with the chemicals being used, the Safety Data Sheets (SDS)
must be consulted. The SDS by chemical and brand can be found in the Amec Foster Wheeler
laboratory or at the Web sites http://www.msdssearch.com or
http://www.hazard.com/msds/index.php using the CAS number.
5.0 PROCEDURE
5.1 Short-term Storage Areas
5.1.1 Extracted samples are stored overnight, prior to analysis, in refrigerators in the analytical
area of the laboratory (see Figure 1). The boxes of extracted samples are labeled with field
groups, extraction and analysis dates, and the appropriate initials. After analysis, the
samples are transferred to the main coldroom (see Figure 2).

GLO-3180-003
Revision No. 10 March 2017
Page 3 of 9
GLO3180-003_R10 Amec Foster Wheeler
Figure 1 Laboratory Refrigerator Figure 2 Laboratory Walk-in Coldroom
5.1.2 The main laboratory walk-in coldroom, located in Room 1912, is used for storage of
analyzed extracts and all other samples. The shelves are organized as follows (see Figure 3):
5.1.2.1 Filters to be extracted are stored in the appropriate box (Teflon, nylon, or cellulose)
immediately inside the coldroom on the right-hand side of the door.
5.1.2.2 Citric Acid filters, denuder samples, and gray-label nylon samples are stored on the
right side of the coldroom.
5.1.2.3 Wet deposition samples are placed in large plastic tubs on the floor or shelves
immediately inside the coldroom on the left-hand side of the door.
5.1.2.4 Performance Evaluation Environment Canada (ECAN) and US Geological Survey
(USGS) samples are placed on the shelves immediately inside the coldroom on the left-
hand side of the door.
5.1.2.5 Analyzed Teflon and nylon samples are stored on the left-hand side, with Teflon
samples closest to the door.
5.1.2.6 Analyzed cellulose samples are stored along the back of the coldroom.

GLO-3180-003
Revision No. 10 March 2017
Page 4 of 9
GLO3180-003_R10 Amec Foster Wheeler
Figure 3 Sample Organization in Walk-in Coldroom
5.2 Long-term Storage
5.2.1 Samples are transferred from the main laboratory coldroom to the outside coldroom on an
approximately quarterly basis and are stored for one year past the end of the sampling year.
5.2.2 After one year in the outside coldroom, samples are transferred to an on-site storage trailer
for an additional year. This storage is not under climate control.
5.3 Temperature Monitoring
5.3.1 Monitoring of all sample storage refrigerators and the inside walk-in coldroom is done on a
daily basis, excluding weekends and holidays. The outside walk-in coldroom is checked
weekly. The temperature displayed on the thermometer (see Figure 4) is recorded in the
appropriate logbook.
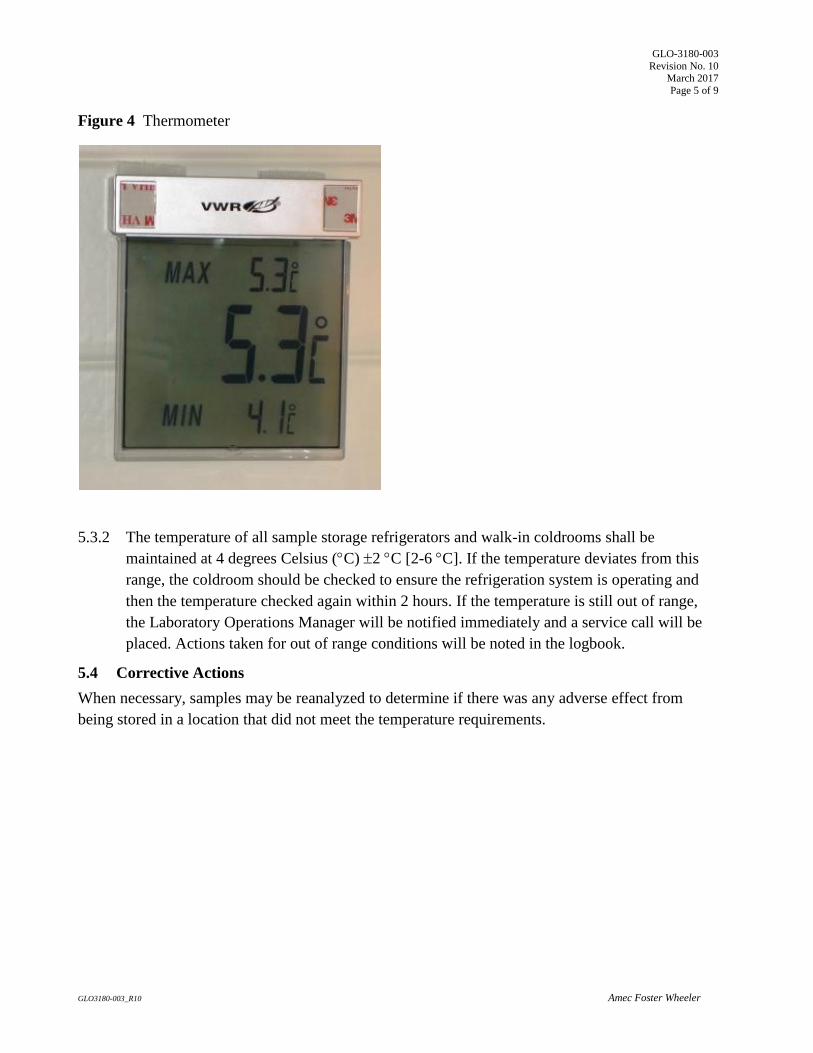
GLO-3180-003
Revision No. 10 March 2017
Page 5 of 9
GLO3180-003_R10 Amec Foster Wheeler
Figure 4 Thermometer
5.3.2 The temperature of all sample storage refrigerators and walk-in coldrooms shall be
maintained at 4 degrees Celsius (C) 2 C [2-6 C]. If the temperature deviates from this
range, the coldroom should be checked to ensure the refrigeration system is operating and
then the temperature checked again within 2 hours. If the temperature is still out of range,
the Laboratory Operations Manager will be notified immediately and a service call will be
placed. Actions taken for out of range conditions will be noted in the logbook.
5.4 Corrective Actions
When necessary, samples may be reanalyzed to determine if there was any adverse effect from
being stored in a location that did not meet the temperature requirements.

GLO-3180-003
Revision No. 10 March 2017
Page 6 of 9
GLO3180-003_R10 Amec Foster Wheeler
6.0 REFERENCES
Clesceri, L.S., Greenberg, A.E., Trussel, R.R. (eds). 1992. Standard Methods for the Examination
of Water and Wastewater, 18th edition. APHA-AWWA-WPCF, Washington, DC.
U.S. Environmental Protection Agency (EPA). 2007. Guidance for the Preparation of Standard
Operating Procedures, (SOPs) for Quality-Related Documents. EPA/600/B-0//001, EPA
QA/G-6, US EPA, Washington DC. April.
U.S. Environmental Protection Agency (EPA). 1983. Methods for Chemical Analysis of Water and
Wastes, EPA-600/4-79-020, Revised March 1983.

GLO-3180-003
Revision No. 10 March 2017
Page 7 of 9
GLO3180-003_R10 Amec Foster Wheeler
7.0 ATTACHMENTS
Attachment A – Temperature Log
Attachment B – Revisions Table

GLO-3180-003
Revision No. 10 March 2017
Page 8 of 9
GLO3180-003_R10 Amec Foster Wheeler
ATTACHMENT A
Temperature Log

GLO-3180-003
Revision No. 10 March 2017
Page 9 of 9
GLO3180-003_R10 Amec Foster Wheeler
ATTACHMENT B
Revisions Table
Table - Revisions
Document Revision No. Section Revision
9.0
Signature page Updated Laboratory Manager to Katherine Barry.
Removed Garry Price.
Entire SOP Changed company name to Amec Foster Wheeler
4.0 Update Materials Safety Data Sheets to Safety Data
Sheets
6.0 Updated SOP preparation reference
7.0 Addition of this table
10.0
7.0 Updated Standard Methods for the Examination of
Water & Wastewater from 17th Edition to 18th.
7.0 Removed method reference 305.2 from Methods for
Chemical Analysis of Water & Wastes


GLO-3180-010
Revision No. 6 October 2016
Page 2 of 17
GLO3180-010_R6_V1.docx Amec Foster Wheeler
WHATMAN CELLULOSE FILTER PREPARATION WITH
POTASSIUM CARBONATE
1.0 PURPOSE
The purpose of this standard operating procedure (SOP) is to provide consistent guidance to
Amec Foster Wheeler Environment & Infrastructure, Inc. (Amec Foster Wheeler) laboratory
personnel for the preparation of Whatman #41 cellulose filters for Clean Air Status and Trends
Network (CASTNET) filter packs.
2.0 SCOPE
This method is applicable to all prepared Whatman cellulose filters used to capture sulfur dioxide
(SO2) in the atmosphere.
3.0 SUMMARY
Whatman #41 cellulose filters are rinsed to remove potential sulfate and nitrate contamination
and then impregnated with a potassium carbonate solution.
3.1 Method Interferences
Reagents from new vendors and those without a Certificate of Analysis listing the sulfate
concentration should be tested for the presence of sulfate prior to use in the impregnation solution.
3.2 Deviations from the Method
A general overview of the steps described in this SOP is depicted in Figure 1. Deviations from
the analytical method described in this SOP are not permitted.
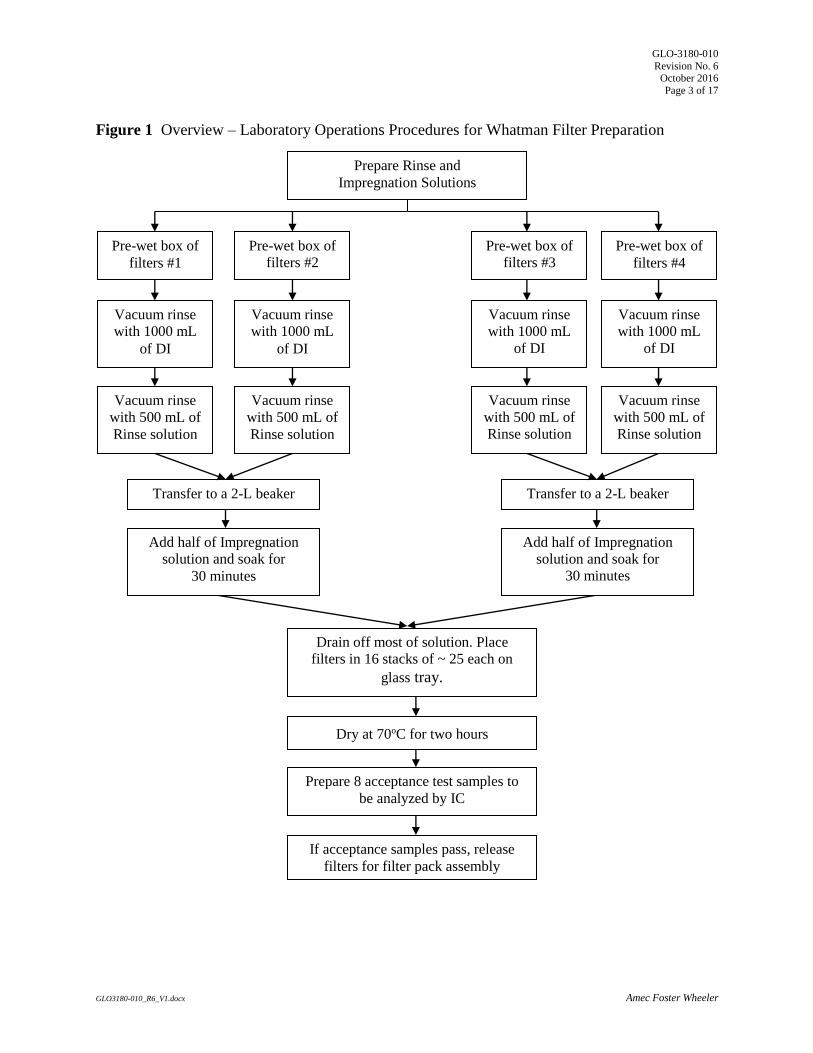
GLO-3180-010
Revision No. 6 October 2016
Page 3 of 17
GLO3180-010_R6_V1.docx Amec Foster Wheeler
Figure 1 Overview – Laboratory Operations Procedures for Whatman Filter Preparation
Prepare Rinse and
Impregnation Solutions
Pre-wet box of
filters #1
Pre-wet box of
filters #2
Pre-wet box of
filters #3
Pre-wet box of
filters #4
Vacuum rinse
with 1000 mL
of DI
Vacuum rinse
with 1000 mL
of DI
Vacuum rinse
with 1000 mL
of DI
Vacuum rinse
with 1000 mL
of DI
Vacuum rinse
with 500 mL of
Rinse solution
Vacuum rinse
with 500 mL of
Rinse solution
Vacuum rinse
with 500 mL of
Rinse solution
Vacuum rinse
with 500 mL of
Rinse solution
Transfer to a 2-L beaker Transfer to a 2-L beaker
Drain off most of solution. Place
filters in 16 stacks of ~ 25 each on
glass tray.
Dry at 70oC for two hours
Prepare 8 acceptance test samples to
be analyzed by IC
If acceptance samples pass, release
filters for filter pack assembly
Add half of Impregnation
solution and soak for
30 minutes
Add half of Impregnation
solution and soak for
30 minutes

GLO-3180-010
Revision No. 6 October 2016
Page 4 of 17
GLO3180-010_R6_V1.docx Amec Foster Wheeler
4.0 MATERIALS (SUFFICIENT FOR ONE IMPREGNATION GROUP)
4.1 Apparatus (see Figure 2)
Two 2-liter (L) Class A volumetric flasks
Glass trays
Two 2-L glass beakers
100-milliliter (mL) graduated cylinder
Large weighing boats
Powder-free gloves
Plastic forceps
Drying oven
Parafilm paraffin/polyethelyene material
Buchner funnel
Timer
Three high-density polyethylene (HDPE) wash bottles
Whatman Grade No. 41, 47-millimeter (mm) -diameter ashless cellulose filters
Resealable plastic bags and appropriate labels
Plastic-backed absorbent paper
KimWipes, large and small sizes
Vacuum apparatus, pump, side-arm vacuum flask, and appropriate tubing
Filter Impregnation Logbook
60-mL Nalgene bottle
4.2 Reagents
Reagent water: DI water with resistivity of 15 mega ohms (MΩ) or greater, derived from mixed
bed ion exchangers, activated carbon filters, and polishing exchangers. Water should contain
particles no larger than 0.20 micrometer (μm).
Anhydrous Potassium Carbonate (K2CO3) granular CAS#584-08-7
Glycerol, American Chemical Society (ACS) reagent or better grade CAS# 56-81-5 with
Certificate of Analysis (see Figure 3)
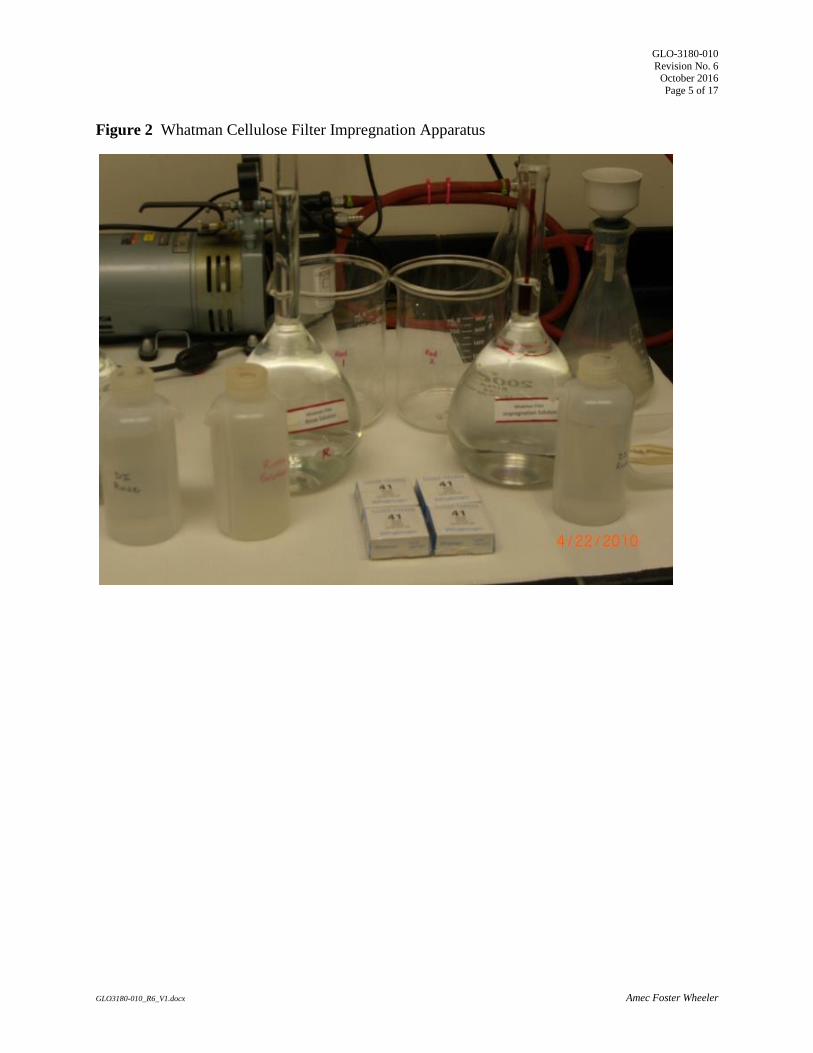
GLO-3180-010
Revision No. 6 October 2016
Page 5 of 17
GLO3180-010_R6_V1.docx Amec Foster Wheeler
Figure 2 Whatman Cellulose Filter Impregnation Apparatus

GLO-3180-010
Revision No. 6 October 2016
Page 6 of 17
GLO3180-010_R6_V1.docx Amec Foster Wheeler
Figure 3 Glycerol Certificate of Analysis

GLO-3180-010
Revision No. 6 October 2016
Page 7 of 17
GLO3180-010_R6_V1.docx Amec Foster Wheeler
5.0 SAFETY
The analyst must be aware of the hazards associated with the chemicals used in this method.
Reducing the possibility of accidental absorption or ingestion minimizes the hazards. Eating and
drinking are not permitted in areas where chemicals are used or stored. Laboratory coats, gloves,
and safety glasses must be worn at all times when handling these chemicals. If the analyst is not
familiar with the hazards associated with the chemicals being used, the Safety Data Sheets (SDS)
must be consulted. The SDS by chemical and brand can be found in the Amec Foster Wheeler
laboratory or at the Web sites http://www.msdssearch.com or
http://www.hazard.com/msds/index.php using the CAS number.
6.0 PROCEDURE
6.1 Filter Impregnation Solution
6.1.1 Add 300 – 500 mL DI water to a 2-L volumetric flask.
6.1.2 Weigh 250 grams (g) of K2CO3 into a weighing boat. Quantitatively transfer the K2CO3
to the volumetric flask and swirl to dissolve. Vent the stopper on the flask frequently
since some effervescence will occur.
6.1.3 Repeat step 6.1.2 (for a total of 500 g of K2CO3 in the flask).
6.1.4 Measure 100 mL of glycerol and then carefully pour the glycerol into the flask. Cap and
shake the solution carefully to ensure thorough mixing, being sure to vent the flask often
during this process.
6.1.5 Bring up to volume with DI water. Cap securely and invert at least 10 times to ensure
thorough mixing, being sure to vent the flask periodically.
6.2 Filter Rinse Solution
6.2.1 Weigh 28 g of K2CO3 into a weighing boat.
6.2.2 Add 300-500 mL DI water to a 2-L volumetric flask. Quantitatively transfer the K2CO3 to
the volumetric flask and swirl to dissolve. Vent the stopper on the flask periodically since
some effervescence will occur.
6.2.3 Cap and shake the solution carefully to ensure thorough mixing, being sure to vent the
flask often during this process.
6.2.4 Bring up to volume with DI water. Cap securely and invert at least 10 times to ensure
thorough mixing. Vent periodically.
6.3 Impregnation Procedure
6.3.1 Pre-wet one box of Whatman cellulose filters (approximately 100 filters) under a stream
of DI water. Use plastic forceps (see Figure 4).

GLO-3180-010
Revision No. 6 October 2016
Page 8 of 17
GLO3180-010_R6_V1.docx Amec Foster Wheeler
Figure 4 Rinsing Filters
6.3.2 Wearing powder-free plastic gloves, place one box of Whatman filters (approximately
100 filters) in a small Buchner funnel inserted into the vacuum flask. Using vacuum
aspiration, rinse the filters with approximately 1000 mL of DI water (see Figure 5).
Note: A wash bottle works well (contains 500 mL) and allows the analyst to direct the water
stream around and between the filters. Proper washing is required to remove potential sulfate
and nitrate contamination.

GLO-3180-010
Revision No. 6 October 2016
Page 9 of 17
GLO3180-010_R6_V1.docx Amec Foster Wheeler
Figure 5 Buchner Funnel Rinse
6.3.3 Aspirate filters to near dryness.
6.3.4 Rinse the filters with approximately 500 mL of the Filter Rinse solution. Aspirate to
near dryness.
6.3.5 Carefully transfer filters into a 2-L beaker. Cover with Parafilm.
6.3.6 Repeat this procedure with another set of 100 filters until a total of 200 filters are in the
2-L beaker. Use another 2-L beaker for the remaining 200 filters.
6.3.7 Fill a 60-mL Nalgene bottle with approximately 50 mL of the Impregnation Solution
before proceeding.
6.3.8 Carefully divide the Impregnation Solution between the two large 2-L beakers (see
Figure 6). Swirl the filters gently in the solution and the cover the beaker with Parafilm.
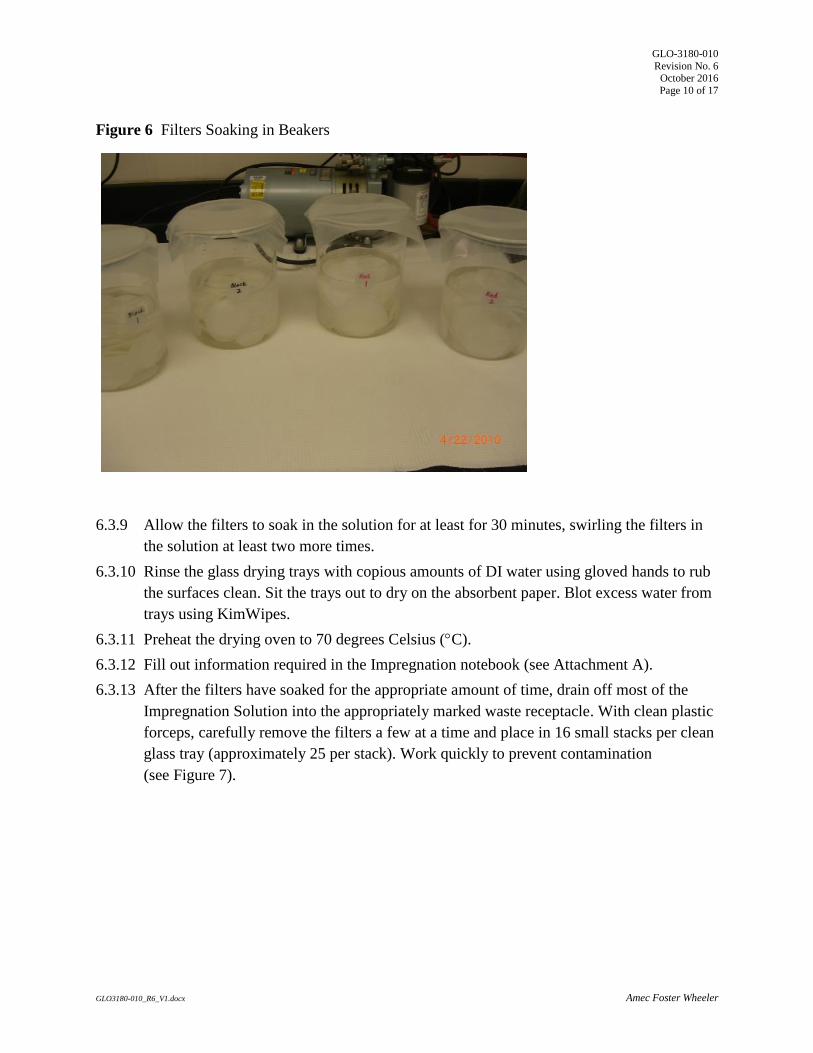
GLO-3180-010
Revision No. 6 October 2016
Page 10 of 17
GLO3180-010_R6_V1.docx Amec Foster Wheeler
Figure 6 Filters Soaking in Beakers
6.3.9 Allow the filters to soak in the solution for at least for 30 minutes, swirling the filters in
the solution at least two more times.
6.3.10 Rinse the glass drying trays with copious amounts of DI water using gloved hands to rub
the surfaces clean. Sit the trays out to dry on the absorbent paper. Blot excess water from
trays using KimWipes.
6.3.11 Preheat the drying oven to 70 degrees Celsius (C).
6.3.12 Fill out information required in the Impregnation notebook (see Attachment A).
6.3.13 After the filters have soaked for the appropriate amount of time, drain off most of the
Impregnation Solution into the appropriately marked waste receptacle. With clean plastic
forceps, carefully remove the filters a few at a time and place in 16 small stacks per clean
glass tray (approximately 25 per stack). Work quickly to prevent contamination
(see Figure 7).

GLO-3180-010
Revision No. 6 October 2016
Page 11 of 17
GLO3180-010_R6_V1.docx Amec Foster Wheeler
Figure 7 Filters Stacked and Drying
6.3.14 Place the trays in the oven for two hours to dry, checking on the filters periodically.
6.3.15 Remove the trays from the oven. Continue working quickly to prevent contamination.
6.3.16 Eight acceptance test samples are prepared for each impregnation group. Each sample
consists of two filters. The necessary labels are kept in the extraction area.
Label the appropriate number of 60-mL Nalgene bottles with preprinted sample
labels: 9 bottles total per Impregnation group (8 bottles for filters and one empty
bottle to test 600 L of the Impregnation Solution).
Label a resealable plastic bag and the reserved bottle of impregnation fluid with
impregnation labels (see Attachment B).
Discard the top two filters of each stack. Place one filter from the middle of each
stack into the bottles, two filters per bottle. The middle filters of two stacks comprise
one sample. Place the remaining filters from each stack, discarding the two bottom
filters, in the resealable plastic bag.
After all filters are bagged and bottled, place the acceptance test samples, the bagged
filters, and the reserved impregnation fluid in the extraction area to be tested.
Submit the date of impregnation and the sample names of the acceptance tests to data
services via e-mail for sample log-in.
6.3.17 Rinse all used equipment with DI water and return to designated storage area.
GLO-3180-010
Revision No. 6 October 2016
Page 12 of 17
GLO3180-010_R6_V1.docx Amec Foster Wheeler
6.4 Corrective actions
Cellulose filters are acceptance tested after the impregnation procedure. Between 400 and 800
filters are prepared at one time. The filters are assigned to an impregnation group of 400 filters
that is uniquely associated both with the impregnation date and a group of acceptance test
samples. Each impregnation group is isolated throughout the entire impregnation procedure and
is stored separately before use. Acceptance testing is performed on 4 percent of the filters
contained in each impregnation group. The acceptance test samples are prepared with two
cellulose filters per sample and are extracted and analyzed according to normal procedures.
Acceptance test results for an impregnation group are considered satisfactory if no more than one
sample in the group shows sulfate contamination above 3.83 micrograms (μg) (equivalent to an
approximate ambient concentration of 0.17 μg per cubic meter [μg/m3] as SO2). All cellulose
filter acceptance test results are stored in Element. The impregnation group used for each filter
pack is referenced in the filter pack preparation logbook. If the analytical results fail the
acceptance limits, the batch is discarded.

GLO-3180-010
Revision No. 6 October 2016
Page 13 of 17
GLO3180-010_R6_V1.docx Amec Foster Wheeler
7.0 REFERENCES
U.S. Environmental Protection Agency (EPA). 2007. Guidance for the Preparation of Standard
Operating Procedures, (SOPs) for Quality-Related Documents. EPA/600/B-0//001, EPA
QA/G-6, US EPA, Washington, D.C. April.

GLO-3180-010
Revision No. 6 October 2016
Page 14 of 17
GLO3180-010_R6_V1.docx Amec Foster Wheeler
8.0 ATTACHMENTS
Attachment A – Potassium Carbonate Filter Impregnation Log
Attachment B – Impregnation Label
Attachment C – Revisions Table
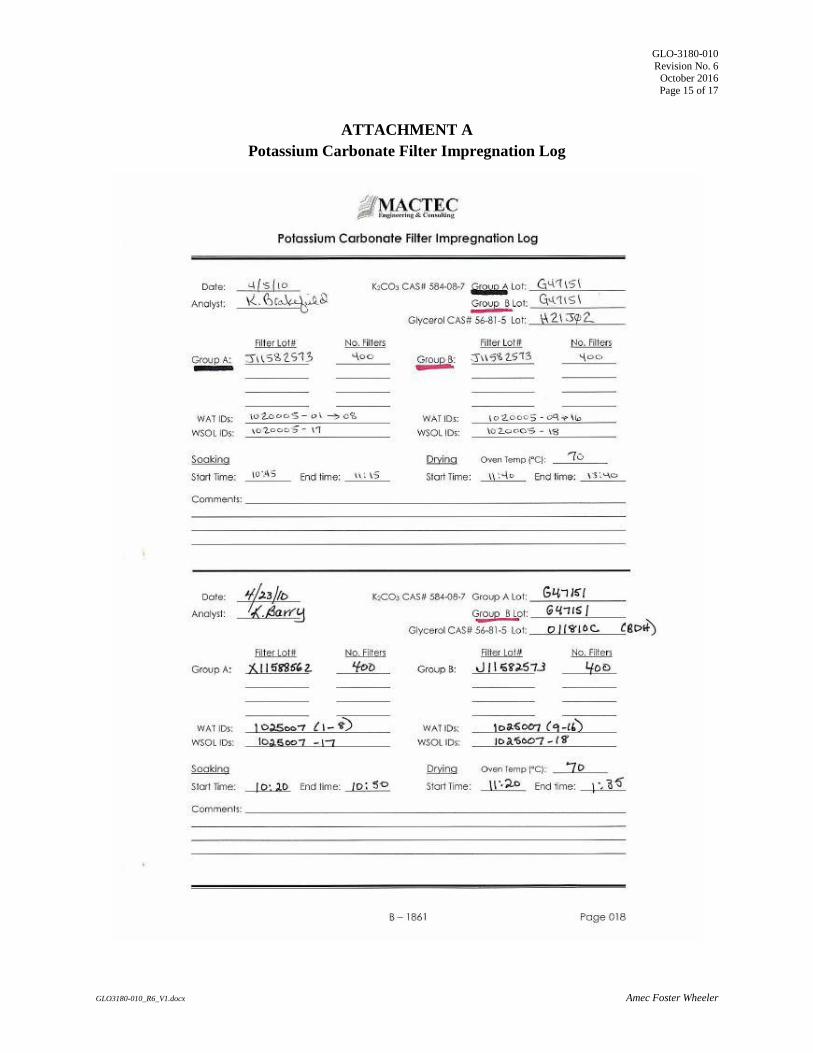
GLO-3180-010
Revision No. 6 October 2016
Page 15 of 17
GLO3180-010_R6_V1.docx Amec Foster Wheeler
ATTACHMENT A
Potassium Carbonate Filter Impregnation Log

GLO-3180-010
Revision No. 6 October 2016
Page 16 of 17
GLO3180-010_R6_V1.docx Amec Foster Wheeler
ATTACHMENT B
Impregnation Label
This is a copy of a recent actual label. Red and black marks are used to differentiate between the
impregnation groups when more than one group is prepared on a given day. (This label is for the
black group for that day.)
1025007 (1-8) Refers to the range of Element identification (ID) numbers of the filter acceptance test
samples for these filters.
1025007-17 Refers to the Element IDs of the impregnation fluid acceptance test sample for these
filters. This sample is prepared in the same manner as the Method Blank for cellulose
filters (GLM3180-001).

GLO-3180-010
Revision No. 6 October 2016
Page 17 of 17
GLO3180-010_R6_V1.docx Amec Foster Wheeler
ATTACHMENT C
Revisions Table
Table - Revisions
Document Revision
No.
Section Revision
6.0
Signature page Remove Garry Price and add Katherine Barry as
Laboratory Operations Manager
All Update company name to Amec Foster Wheeler
5.0 Update Materials Safety Data Sheets to Safety
Data Sheets
7.0 Update references
Attachment C Addition of this table.
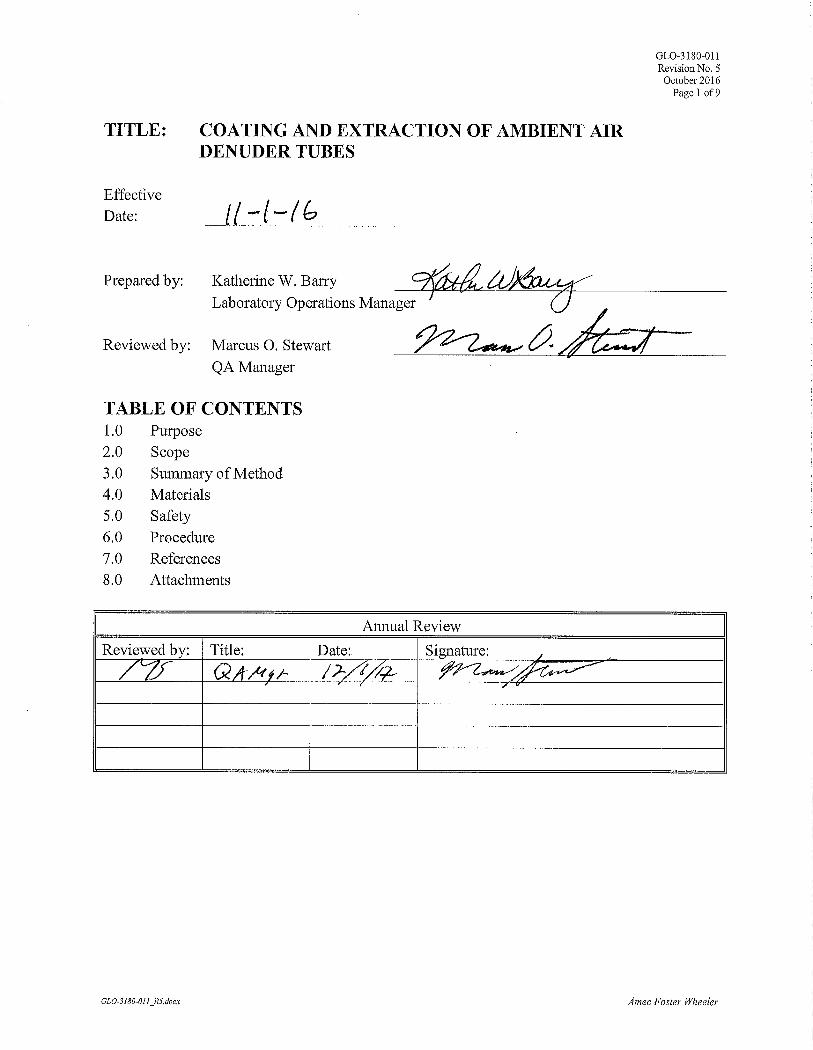
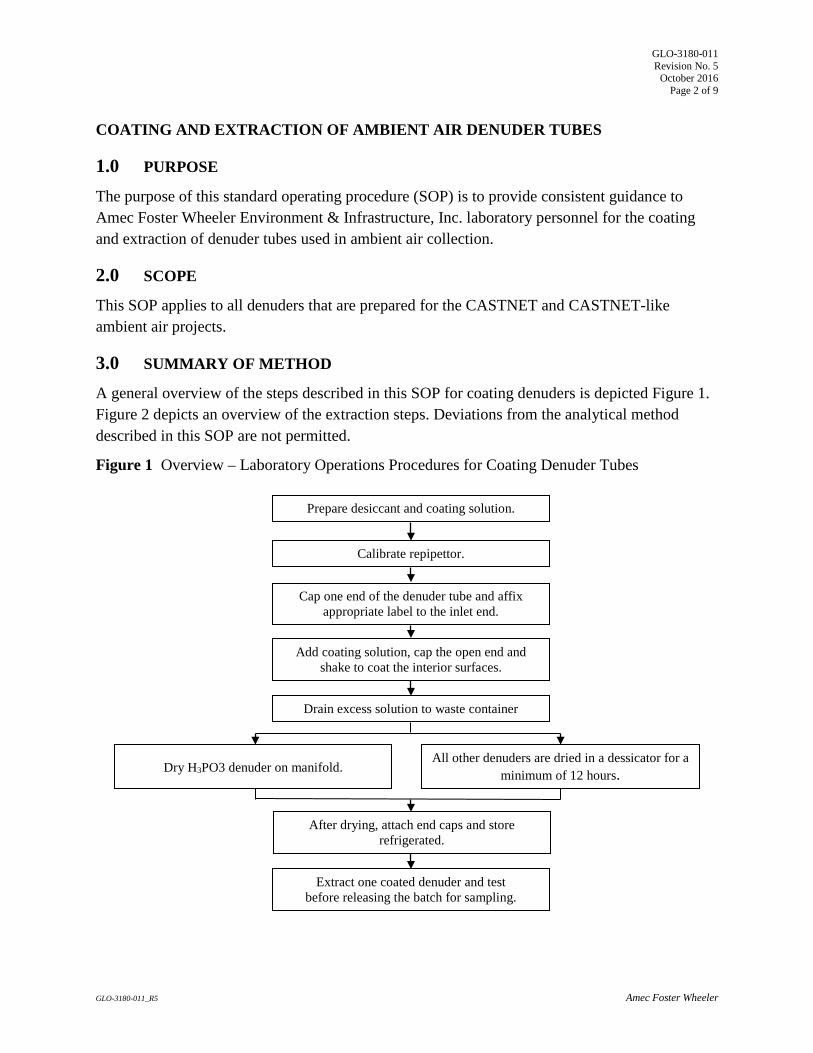
GLO-3180-011 Revision No. 5
October 2016 Page 2 of 9
GLO-3180-011_R5 Amec Foster Wheeler
COATING AND EXTRACTION OF AMBIENT AIR DENUDER TUBES
1.0 PURPOSE
The purpose of this standard operating procedure (SOP) is to provide consistent guidance to Amec Foster Wheeler Environment & Infrastructure, Inc. laboratory personnel for the coating and extraction of denuder tubes used in ambient air collection.
2.0 SCOPE
This SOP applies to all denuders that are prepared for the CASTNET and CASTNET-like ambient air projects.
3.0 SUMMARY OF METHOD
A general overview of the steps described in this SOP for coating denuders is depicted Figure 1. Figure 2 depicts an overview of the extraction steps. Deviations from the analytical method described in this SOP are not permitted.
Figure 1 Overview – Laboratory Operations Procedures for Coating Denuder Tubes
Prepare desiccant and coating solution.
Calibrate repipettor.
Cap one end of the denuder tube and affix appropriate label to the inlet end.
Add coating solution, cap the open end and shake to coat the interior surfaces.
Drain excess solution to waste container
Dry H3PO3 denuder on manifold.
After drying, attach end caps and store refrigerated.
All other denuders are dried in a dessicator for a minimum of 12 hours.
Extract one coated denuder and test before releasing the batch for sampling.

GLO-3180-011 Revision No. 5
October 2016 Page 3 of 9
GLO-3180-011_R5 Amec Foster Wheeler
Figure 2 Overview – Laboratory Operations Procedures for Extracting Exposed Denuder Tubes
4.0 MATERIALS
4.1 Apparatus
Desiccator Coating labels for tubes Repipettors Powder-free gloves Desiccant Pre-cleaned denuders Large metal trays Drying oven Class A volumetric flasks, 1000 mL Nitrogen cylinder Nalgene extract bottles, 30 mL
4.2 Reagents
• Reagent Water: Deionized (DI) water of resistivity of 15 mega Ohms (MΩ) or greater, derived from mixed bed ion exchangers, activated carbon filters and polishing exchangers. Water should contain particles no larger than 0.20 micrometers.
• Methanol (MeOH), ACS reagent grade or better, CAS # 67-56-1. • Glycerol, ACS reagent grade or better, CAS # 56-81-5. • Citric Acid, ACS reagent grade or better, CAS # 5949-29-1. • Sodium Carbonate(Na2CO3), ACS reagent grade or better, CAS # 497-19-8 • Potassium Chloride(KCl), ACS reagent grade or better, CAS # 7447-40-7 • Phosphorus Acid (H3PO3), ACS reagent grade or better, CAS #13598-36-2 • Citric Acid Coating Solution (1 percent): Dissolve 10 g of citric acid in 900 mL of MeOH in
a 1000 mL volumetric flask. Dilute to volume with DI.
Remove top cap of denuder and add 20 mL of DI. Recap tightly.
Invert the denuder 20 times.
Decant the extract carefully from top end of denuder into sample bottle.
Refrigerate until analysis.

GLO-3180-011 Revision No. 5
October 2016 Page 4 of 9
GLO-3180-011_R5 Amec Foster Wheeler
• Sodium Carbonate Coating Solution (1 percent): Dissolve 10 g of Na2CO3 and 10 g of glycerol in 500 mL of DI in a 1000mL volumetric flask. Dilute to volume with MeOH.
• Potassium Chloride Coating Solution (1 percent): Dissolve 10 g of KCl in 500 ml of DI in a 1000 mL volumetric flask. Dilute to volume with MeOH.
• Phosphorus Acid Coating Solution (1 percent): Dissolve 10 g of H3PO3 in 500 mL of MeOH in a 1000 mL volumetric flask. Add another 400 mL of MeOH and dilute to volume with DI.
5.0 SAFETY
The analyst must be aware of the hazards associated with the chemicals used in this method. Reducing the possibility of accidental absorption or ingestion minimizes the hazards. Eating and drinking are not permitted in areas where chemicals are used or stored. Laboratory coats, gloves, and safety glasses must be worn at all times when handling these chemicals. If the analyst is not familiar with the hazards associated with the chemicals being used, the Safety Data Sheets (SDS) must be consulted. The SDS by chemical and brand can be found in the Amec Foster Wheeler laboratory or at the Web sites http://www.msdssearch.com or http://www.hazard.com/msds/index.php using the CAS number.
6.0 PROCEDURE
6.1 Denuder Coating
6.1.1 Prepare the desiccant by drying it 2-4 hours or until dry at 105 degrees Celsius (°C). Pour the dried desiccant into the metal trays and place in the desiccator.
6.1.2 Obtain the appropriate coating solution. Coating solutions are made in the laboratory and are given to the CASTNET technician responsible for coating the denuders.
6.1.3 Calibrate the repipettors (see Figure 3) prior to each day’s use by determining the mass of deionized water delivered. Adjust the repipettor to deliver 10.0 ±0.5 g.
Figure 3 Repipettors

GLO-3180-011 Revision No. 5
October 2016 Page 5 of 9
GLO-3180-011_R5 Amec Foster Wheeler
6.1.4 Securely cap the bottom of the denuder tube. The quartz inner tube is recessed approximately one inch on the top end (inlet side) of the denuder. On the bottom (outlet) of the denuder, the inner quartz tube is recessed about ⅛ inch from the end of the aluminum tube (see Figure 4 and 5).
Figure 4 Denuder top (inlet) Figure 5 Denuder bottom (outlet)
6.1.5 Affix a denuder coating identification label to the outside of the denuder tube at the inlet end (see Figure 6). Labels are color-coded to aid in identification: citric acid – yellow, sodium carbonate – green, potassium chloride – orange, phosphorous acid – red.
Figure 6 Denuder tubes with labels
6.1.6 Using the repipettor, deliver 10 mL of the coating solution directly into the top of the denuder tube. Securely cap the open end of the denuder. Invert the denuder 20 times, alternately using a figure eight motion and vertical shaking to thoroughly coat the interior surfaces of the denuder.

GLO-3180-011 Revision No. 5
October 2016 Page 6 of 9
GLO-3180-011_R5 Amec Foster Wheeler
6.1.7 Carefully open both ends of the denuder and drain the excess solution out into an appropriate waste container. Note: never dispose of coating solutions (or any chemicals) in laboratory sinks.
6.1.8 Phosphorous acid denuders are screwed securely into the URG drying manifold so that the direction of flow is downward (see Figure 7). Dry for approximately 20 minutes with a 5 liter per minute nitrogen purge. The “honeycomb” quartz inside the URG denuder will cloud when dry.
Figure 7 URG Drying Manifold.
6.1.9 Citric acid, carbonate and potassium chloride denuders and end caps are placed inside the assigned desiccator to dry for a minimum of 12 hours (see Figure 8).

GLO-3180-011 Revision No. 5
October 2016 Page 7 of 9
GLO-3180-011_R5 Amec Foster Wheeler
Figure 8 Dessicator
6.1.10 Once dry, attach the end caps and refrigerate until shipment.
6.1.11 For each coating batch, one denuder will be extracted following the procedure outlined in section 6.2. The results must be less than or equal to two times the reporting limit for the batch to be used.
6.1.12 Prior to shipment, a color coded Lab sample identification label will be attached to the denuder.
6.2 Extracting Exposed Denuders.
6.2.1 Ensure the bottom cap of the denuder is attached firmly and remove the top cap.
6.2.2 Using a repipettor, add 20 mL of DI water into the denuder and cap tightly. Invert the denuder 20 times.
6.2.3 Tap the top cap a couple of times. Unscrew the top cap and set aside.
6.2.4 Decant the extract carefully from top end of the denuder into the sample extract bottle.
6.2.5 Remove the color coded Lab sample identification label from the denuder and attach it to the sample extract bottle.
6.2.6 Refrigerate until analysis.

GLO-3180-011 Revision No. 5
October 2016 Page 8 of 9
GLO-3180-011_R5 Amec Foster Wheeler
7.0 REFERENCES
U.S. Environmental Protection Agency (EPA). 2007. Guidance for the Preparation of Standard Operating Procedures, (SOPs) for Quality-Related Documents. EPA/600/B-0//001, EPA QA/G-6, US EPA, Washington, D.C. April.
8.0 ATTACHMENTS
Attachment A – Revisions Table

GLO-3180-011 Revision No. 5
October 2016 Page 9 of 9
GLO-3180-011_R5 Amec Foster Wheeler
ATTACHMENT A Revisions Table
Table - Revisions
Document Revision No.
Section Revision
5.0
Signature page Remove Garry Price and add Katherine Barry as Laboratory Operations Manager
All Update company name to Amec Foster Wheeler 5.0 Update Materials Safety Data Sheets to Safety
Data Sheets 7.0 Update references
Attachment A Addition of this table.


GLO-3180-012
Revision No. 8 December 2017
Page 2 of 14
GLO-3180-012_R8_V-0_changes accepted.docx Amec Foster Wheeler
CLEAN AIR STATUS AND TRENDS NETWORK (CASTNET) THREE-STAGE
AMBIENT AIR FILTER PACK RECEIPT, DISASSEMBLY AND LOGIN
1.0 PURPOSE
The purpose of this standard operating procedure (SOP) is to provide consistent guidance to
Amec Foster WheelerAmec Foster Wheeler laboratory personnel for receiving and unpacking the
three-stage filter packs, and logging the samples into the Laboratory Information Management System
(LIMS).
2.0 SCOPE
This SOP applies to all filter packs that are prepared for the CASTNET and CASTNET-like
ambient air projects.
3.0 SUMMARY OF METHOD
A general overview of the steps described in this SOP is depicted Figure 1. Deviations from the
analytical method described in this SOP are not permitted.
4.0 MATERIALS
Powder-free gloves
Clean forceps
Clean high-density polyethylene (HDPE) bottles (30 mL, 60 mL)
Large plastic trays
Filter packing/unpacking stand
Filter pack wrench
Kimwipes
Field group folder with fraction labels (see Attachment A):
o S - Sample Log-in, white label
o T - Teflon filter, white label
o N - Nylon filter, orange label
o W – Cellulose (K2CO3 impregnated) filter, blue label
Large tubs
Filter packing notebook
Site Status Report Form (SSRF)

GLO-3180-012
Revision No. 8 December 2017
Page 3 of 14
GLO-3180-012_R8_V-0_changes accepted.docx Amec Foster Wheeler
Figure 1 Overview – Laboratory Operations Procedures for Filter Pack Disassembly
Post Do Not Enter Sign.
With gloves on, clean work area. Assemble
items needed for filter unpacking.
Remove filter pack from plastic bag. Remove
top and bottom end caps and place in stand.
Label bottles with fraction labels. Verify sample
ID on bottles matches SSRF.
Begin label comparison page – record received
and unpack dates at top. Attach filter pack label
and matching S label.
Remove Teflon cap. Using clean forceps for
each filter type, place filters in correct bottle.
Note any filter or filter pack problems on the
comparison page using comment codes.
Place sample bottles in the correct bins in the
cold room.
Update status in LIMS.
Review On/Off date and time.
Record sample ID, receiving tech’s name and
any problems on SSRF.
Inspect shipping tube and contents for damage.
Verify filter ID matches SSRF.

GLO-3180-012
Revision No. 8 December 2017
Page 4 of 14
GLO-3180-012_R8_V-0_changes accepted.docx Amec Foster Wheeler
5.0 PROCEDURE
5.1 Receipt, Initial Inspection, and Assignment of Sample Number to CASTNET
Filter Packs
5.1.1 The filter pack shipping tubes are received at the designated Amec Foster Wheeler
shipping/receiving area. The tubes are normally shipped to Amec Foster Wheeler by the
U.S. Postal Service using Merchandise Return Labels. Other shipping providers are
acceptable.
5.1.2 The filter pack shipping tubes are then delivered by the Amec Foster Wheeler
shipping/receiving technician directly to the CASTNET filter pack receiving area and are
placed into the custody of the CASTNET filter pack technician.
5.1.3 Examine the shipping container for damage from shipping and note any variances in the
filter-packing notebook.
5.1.4 Open the shipping tube and remove the filter pack and Site Status Report Form (SSRF)
(see Figure 2). Verify that the filter identification (ID) number on the filter pack agrees
with the filter ID number stated on the chain of custody label on the SSRF. The site
number listed on the chain of custody label is also verified with the site number entered
by the site operator in the top left corner of the form. If these are not in agreement or not
completed, note it in the shaded Comments area of the form (see Figure 3).
Figure 2 Shipping tubes and filter pack.
5.1.5 Initial and date the SSRF form in the shaded box labeled “Lab Use Only” (see Figure 3).

GLO-3180-012
Revision No. 8 December 2017
Page 5 of 14
GLO-3180-012_R8_V-0_changes accepted.docx Amec Foster Wheeler
Figure 3 SSRF
5.1.6 Review the filter pack On/Off Date and Time, for completeness and correctness. If these
data are incomplete or inconsistencies exist, note it on the form and initial and date. If
there are extensive problems with the SSRF, notify the Project Manager.
5.1.7 Assign the Amec Foster Wheeler sample number according to the recorded filter On
Date. Each Tuesday is assigned a CASTNET sample week number. The On Date on the
SSRF corresponds to a sample week number on the CASTNET calendar. This sample
week number is used to determine the correct field group folder to use.
The field group setup follows this example:
XXYY001-Z, Where: XX = year,
YY = week number, and
Z = assigned number for each site.
The last digit "1" denotes the Element project. This number represents the
CASTNET base program
Clearly write the Amec Foster Wheeler sample number in the shaded box labeled “Lab
Use Only” on the SSRF.

GLO-3180-012
Revision No. 8 December 2017
Page 6 of 14
GLO-3180-012_R8_V-0_changes accepted.docx Amec Foster Wheeler
5.2 Unpacking Procedure:
5.2.1 Prior to unpacking, post the Do Not Enter sign (see Figure 4).
Figure 4 Do Not Enter Sign
5.2.2 Powder-free gloves must be worn when performing this procedure.
5.2.3 Clean the work area and packing/unpacking stand with Kimwipes. Items needed in the
work area for unpacking are as follows: a bag of clean forceps; 30 and 60 mL bottles;
Teflon, nylon, and K2CO3-impregnated cellulose fraction and sample tracking labels (T,
N, W, S labels); a large plastic tub; and paper for the label comparison sheet.
5.2.4 Label the bottles with the preprinted computer fraction labels. Attach the blue W fraction
label to the 60 mL bottle. The other fraction labels are for the 30 mL bottles. Verify that
the sample numbers on the bottles match the sample number recorded on the SSRF form.
5.2.5 Remove the filter pack from the resealable plastic bag, and remove the top and bottom
end caps.
5.2.6 Begin the label comparison page by removing the Filter Pack ID label from the filter
pack and attaching it to one side of a sheet of paper. Next to the Filter Pack ID label,
attach the corresponding S label. The S label should agree with the sample fraction labels
attached to the small sample bottles in Step 5.2.4. Record the received date and the
unpacking date at the top of the label comparison page (see Figure 5).

GLO-3180-012
Revision No. 8 December 2017
Page 7 of 14
GLO-3180-012_R8_V-0_changes accepted.docx Amec Foster Wheeler
Figure 5 Label Comparison Page
5.2.7 Put the gray clamp nut on the packing/unpacking stand (see Figure 6). Loosen the filter
pack with the green vinyl packing wrench. Remove the clear Teflon cap, and place it in
the plastic tub to be washed later. Be careful not to let the filter stick to the Teflon cap
during removal.

GLO-3180-012
Revision No. 8 December 2017
Page 8 of 14
GLO-3180-012_R8_V-0_changes accepted.docx Amec Foster Wheeler
Figure 6 Unpacking Stand
5.2.8 Using clean forceps for each filter type and each sample, remove the filters one at a time.
The first filter removed is the Teflon filter; it is placed in the white T fraction label bottle.
The second filter removed is the nylon filter; it is placed in the orange-label N fraction
bottle. The last two filters are the cellulose filters, both filters are placed in one bottle
with a blue W fraction label.
5.2.9 During the unpacking process, observe the filters for possible filter, or filter pack
problems. Possible problems include the following: torn/ripped filters, excessively dirty
filters, extremely wet filters, raised grids, bugs or anything else that is not normally
observed. Record on the label comparison page any observations noted, using the
CASTNET Comment Codes (Attachment B) as a guide.
5.2.10 Place all filter parts and used forceps in a pan to be washed.
5.2.11 Put caps securely on the bottles and place samples in the appropriate sample box in the
cold room.
5.2.12 After the unpacking is completed, the Label Comparison page and SSRF are given to the
sample log-in technician.
5.3 Sample Log In:
5.3.1 Scanning arriving samples into Element (LIMS).
5.3.1.1 Select Sample Control, select Custody
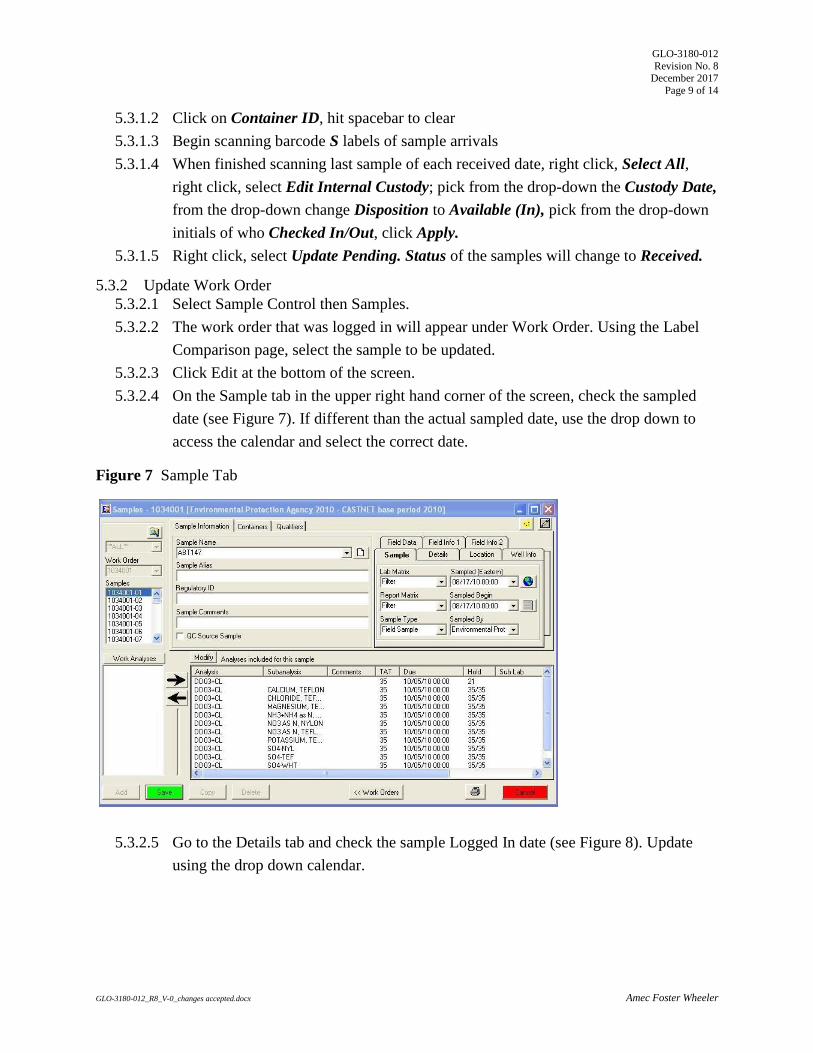
GLO-3180-012
Revision No. 8 December 2017
Page 9 of 14
GLO-3180-012_R8_V-0_changes accepted.docx Amec Foster Wheeler
5.3.1.2 Click on Container ID, hit spacebar to clear
5.3.1.3 Begin scanning barcode S labels of sample arrivals
5.3.1.4 When finished scanning last sample of each received date, right click, Select All,
right click, select Edit Internal Custody; pick from the drop-down the Custody Date,
from the drop-down change Disposition to Available (In), pick from the drop-down
initials of who Checked In/Out, click Apply.
5.3.1.5 Right click, select Update Pending. Status of the samples will change to Received.
5.3.2 Update Work Order
5.3.2.1 Select Sample Control then Samples.
5.3.2.2 The work order that was logged in will appear under Work Order. Using the Label
Comparison page, select the sample to be updated.
5.3.2.3 Click Edit at the bottom of the screen.
5.3.2.4 On the Sample tab in the upper right hand corner of the screen, check the sampled
date (see Figure 7). If different than the actual sampled date, use the drop down to
access the calendar and select the correct date.
Figure 7 Sample Tab
5.3.2.5 Go to the Details tab and check the sample Logged In date (see Figure 8). Update
using the drop down calendar.

GLO-3180-012
Revision No. 8 December 2017
Page 10 of 14
GLO-3180-012_R8_V-0_changes accepted.docx Amec Foster Wheeler
Figure 8 Details Tab Figure 9 Comments Menu
5.3.2.6 Check Received By and update by using the drop down and selecting the
correct name.
5.3.2.7 Check Sample Logged In by and update by using the drop down and selecting the
correct name.
5.3.2.8 For each succeeding sample, highlight and roll the center of the mouse to enter the
correct information.
5.3.2.9 To enter filter pack comment codes, select the filter type and hold down the CTRL
key until all have been highlighted. Right click and select Comment from the list
(see Figure 9). “Analysis Properties” pop-up will appear (see Figure 10). Type in the
correct code(s) from the Label Comparison page and click Apply then Save.
Figure 10 Analysis Properties
5.3.3 When all samples have been updated, select Done.
5.3.4 Print Custody Log.
5.3.4.1 Under the Print tab, select Custody Log.
5.3.4.2 Print the Internal Chains of Custody (see Figure 11) for samples just entered using
ico_AMEC.rpt.
5.3.5 The Label Comparison page is stored with the field group folder in the filter pack
prep area.

GLO-3180-012
Revision No. 8 December 2017
Page 11 of 14
GLO-3180-012_R8_V-0_changes accepted.docx Amec Foster Wheeler
Figure 11 Internal Chain of Custody

GLO-3180-012
Revision No. 8 December 2017
Page 12 of 14
GLO-3180-012_R8_V-0_changes accepted.docx Amec Foster Wheeler
6.0 REFERENCES
U.S. Environmental Protection Agency (EPA). 2007. Guidance for the Preparation of Standard
Operating Procedures, (SOPs) For Quality-Related Documents. EPA/600/B-0//001, EPA
QA/G-6, US EPA, Washington, D.C. April.
7.0 ATTACHMENTS
Attachment A – Labels
Attachment B – CASTNET Filter Pack Comment Codes

GLO-3180-012
Revision No. 8 December 2017
Page 13 of 14
GLO-3180-012_R8_V-0_changes accepted.docx Amec Foster Wheeler
ATTACHMENT A
Labels
S Label
Filter Pack Label
Teflon Label
Nylon Label
Cellulose Label

GLO-3180-012
Revision No. 8 December 2017
Page 14 of 14
GLO-3180-012_R8_V-0_changes accepted.docx Amec Foster Wheeler
ATTACHMENT B
CASTNET Filter Pack Comment Codes
1 – Unidentified debris or particles on filter. 2 – Torn, hole, or ripped filter noted during unpacking. 3 – Excessively wet filter noted during unpacking. 4 – Excessively dirty filter noted during unpacking. 5 – Filter pack loose upon arrival, possible leakage during sampling period. 6 – Apparent solenoid problem. 7 – Filter pack end caps cracked or missing upon receipt. 8 – Outside of filter pack excessively dirty upon receipt. 9 – Support screen raised up, noted during unpacking. 10 – Insect inside filter pack, noted during unpacking. 11 – Laboratory accident. 12 – Filter pack on tower incorrect length of time. 13 – Filter pack not run in field. 14 – Unusual odor noticed during unpacking. 15 – Low extraction efficiency off filter. 16 – On/off dates and times are assumed. 17 – Filter given to EPA for analysis. 18 – Field accident. 19 – Field equipment problem. 20 – Filter used for special study. 21 – Forest fire or agricultural activity in area. 22 – Site closed down. 23 – Site Status Report Form (SSRF) not received with filter pack. 24 – Chain of Custody incomplete or incorrect. 25 – Filter pack run on wrong week. T – Teflon filter N – Nylon filter W – K2CO3 impregnated filter


GLO-3180-013 Revision No. 8
October 2016 Page 2 of 14
GLO-3180-013_R8 Amec Foster Wheeler
PREPARING AND SHIPPING THE CLEAN AIR STATUS AND TRENDS NETWORK (CASTNET) THREE-STAGE FILTER PACKS
1.0 PURPOSE
The purpose of this standard operating procedure (SOP) is to provide consistent guidance to Amec Foster Wheeler Environment & Infrastructure, Inc. (Amec Foster Wheeler) laboratory personnel for the preparing and shipping of three-stage filter packs and associated use of the laboratory information management system (LIMS).
2.0 SCOPE
This SOP applies to all three-stage filter packs prepared for CASTNET and CASTNET-like ambient air projects.
3.0 SUMMARY OF METHOD
A general overview of the steps described in this SOP is depicted Figure 1. Deviations from the analytical method described in this SOP are not permitted.
4.0 MATERIALS
• Powder-free gloves
• Pre-cleaned plastic forceps
• Filter packing assembly/ disassembly device
• Clean filter packs, support rings with grid, Teflon filter support ring and end caps
• Field group folder (see Attachment A): o Site Status Report Form (SSRF) Chain of Custody label o Filter pack identification (ID) label o Shipping Tube/FedEx Site ID Label
• CASTNET calendar
• Resealable plastic bags
• Polyvinyl chloride (PVC) and cardboard shipping tubes
• Packing notebook
• Filters: o Teflon filters that have passed acceptance testing o Nylon filters that have passed acceptance testing o Potassium carbonate (K2CO3)-impregnated Whatman cellulose No. 41 filters that have
passed acceptance testing
• SSRF
• United States Postal Service (USPS) prepaid return label
• Kimwipes

GLO-3180-013 Revision No. 8
October 2016 Page 3 of 14
GLO-3180-013_R8 Amec Foster Wheeler
Figure 1 Overview – Laboratory Operations Procedures for Preparing Filter Packs
Review CASTNET calendar to determine correct label folder to use.
Post Do Not Enter sign.
With gloves on, clean work area. Assemble items needed for filter packing.
Place small red end cap on filter base with gray collar and put in filter packing stand.
Using forceps, transfer two cellulose filters onto the filter support grid. Place next support grid
over filters.
Use another pair of forceps to insert one nylon filter on the second support grid. Place another
support grid over the nylon filter.
Use another pair of forceps to insert one Teflon filter on the third support grid.
Add the support ring, white final stage and tighten securely. Attach the black end cap.
Attach filter ID label to gray collar and then place in resealable plastic bag.
Record information in CASTNET filter packing notebook. Update status in LIMS.
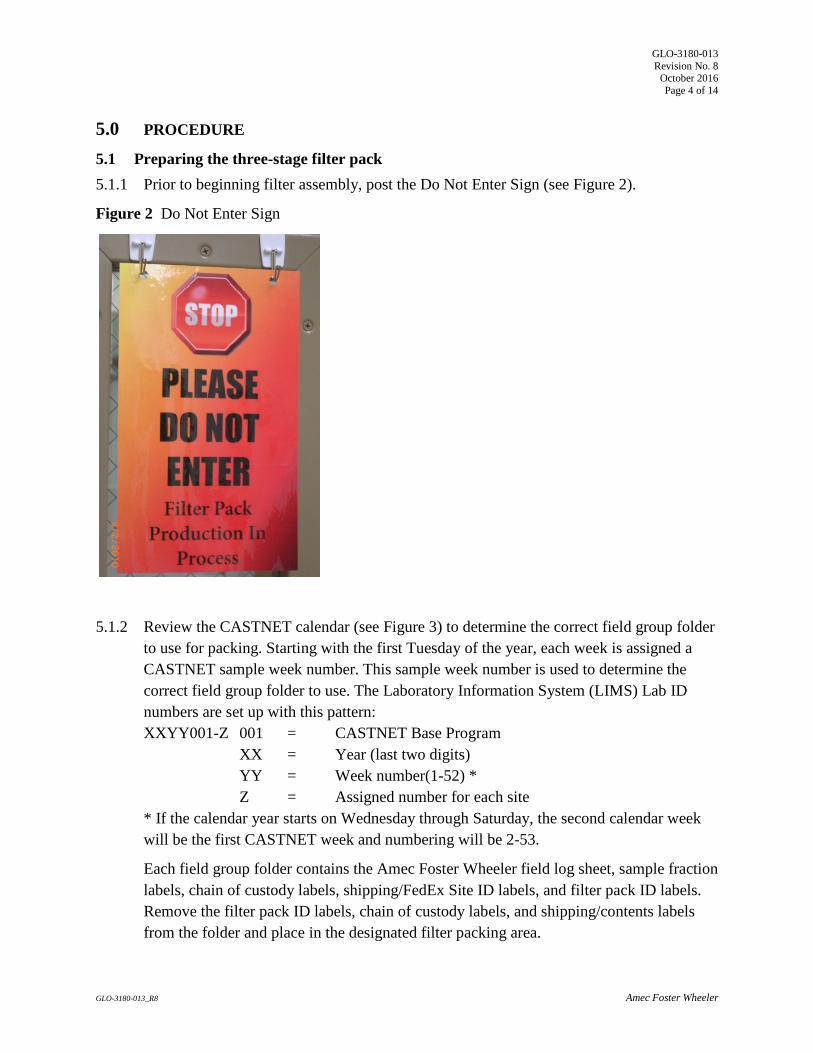
GLO-3180-013 Revision No. 8
October 2016 Page 4 of 14
GLO-3180-013_R8 Amec Foster Wheeler
5.0 PROCEDURE
5.1 Preparing the three-stage filter pack
5.1.1 Prior to beginning filter assembly, post the Do Not Enter Sign (see Figure 2).
Figure 2 Do Not Enter Sign
5.1.2 Review the CASTNET calendar (see Figure 3) to determine the correct field group folder to use for packing. Starting with the first Tuesday of the year, each week is assigned a CASTNET sample week number. This sample week number is used to determine the correct field group folder to use. The Laboratory Information System (LIMS) Lab ID numbers are set up with this pattern: XXYY001-Z 001 = CASTNET Base Program XX = Year (last two digits) YY = Week number(1-52) * Z = Assigned number for each site * If the calendar year starts on Wednesday through Saturday, the second calendar week will be the first CASTNET week and numbering will be 2-53.
Each field group folder contains the Amec Foster Wheeler field log sheet, sample fraction labels, chain of custody labels, shipping/FedEx Site ID labels, and filter pack ID labels. Remove the filter pack ID labels, chain of custody labels, and shipping/contents labels from the folder and place in the designated filter packing area.

GLO-3180-013 Revision No. 8
October 2016 Page 5 of 14
GLO-3180-013_R8 Amec Foster Wheeler
Figure 3 CASTNET Calendar
5.1.3 Attach one chain of custody label to the SSRF in the designated location (see Figure 4).
Figure 4 SSRF with Chain of Custody Label Attached

GLO-3180-013 Revision No. 8
October 2016 Page 6 of 14
GLO-3180-013_R8 Amec Foster Wheeler
5.1.4 Keep forms, labels, and filter packs in order to avoid any mix-ups.
5.1.5 With gloves on, clean off the filter-packing stand and surrounding work area using Kimwipes. Organize all items needed around the packing area, including filters, filter packs, screens, forceps, resealable plastic bags, laboratory cart, filter pack end caps, and notebook (see Figure 5).
Figure 5 Filter Pack Components
5.1.6 Verify the orientation of the Teflon filters by manually tearing the top filter in the box. Also, re-verify the Teflon orientation halfway through the packing procedure.
5.1.7 As each filter pack is assembled, inspect each part for physical damage that could permit air leaks (cracks, thread damage, etc.). If there is any filter part damage, send the part to the Laboratory Operations Manager.
Note: Pay particular attention to the filter pack outlet near the threaded quick connector. This plastic part is prone to stress fatigue damage. The damage may appear as tiny cracks. Inspect this part carefully. Discard this part at the first indication of damage or impending failure. 5.1.8 Begin the filter packing process by removing one filter base and gray collar from the
storage container. Place a small red end cap on the base fitting and place the filter base into the filter packing stand (see Figure 6).

GLO-3180-013 Revision No. 8
October 2016 Page 7 of 14
GLO-3180-013_R8 Amec Foster Wheeler
Figure 6 Filter Packing Stand
5.1.9 Prior to placing each filter in the filter pack, inspect it for physical defects (pinholes, thin or thick areas, tears, and abnormal color) Discard any filters with defects. Care must be taken to avoid contamination during the inspection.
5.1.10 Using clean forceps, carefully transfer two K2CO3-impregnated cellulose filters into the filter support ring with grid. Place the next support ring with grid over the filters, ensuring that it has mated properly with the stage below.
5.1.11 Using another pair of clean forceps, insert one nylon filter on the second support grid. Place the next support grid on top, ensuring that it has mated properly with the stage below.
5.1.12 Using another pair of clean forceps, insert one Teflon filter on the third support ring with grid. Ensure proper orientation of the Teflon filter - Teflon side (dull side) facing up, toward the ambient air (shiny surface should be facing down). An additional support ring for the Teflon filter is then added.
5.1.13 Place the white final stage of the filter assembly onto the base and tighten securely.
5.1.14 Remove the filter pack from the filter-packing stand and attach the black end cap.
5.1.15 Attach the filter ID label to the gray collar. Cover the label with tape to prevent damage due to rain. Place in a resealable plastic bag.
5.1.16 Record the required information in the CASTNET Filter Packing Notebook (see Figure 7).

GLO-3180-013 Revision No. 8
October 2016 Page 8 of 14
GLO-3180-013_R8 Amec Foster Wheeler
Figure 7 CASTNET Filter Pack Notebook

GLO-3180-013 Revision No. 8
October 2016 Page 9 of 14
GLO-3180-013_R8 Amec Foster Wheeler
5.2 Preparation of Laboratory Blanks
5.2.1 Prepare two laboratory blanks weekly for each filter type. The laboratory blank LIMS Lab ID follows the same format as the filter pack field groups: XXYY002 - 01, 02 002 = Laboratory Blank XX = Year (last two digits) YY = Week number(1-52) 01 = First Laboratory Blank 02 = Second Laboratory Blank
5.2.2 Place one Teflon, one nylon, and two cellulose acceptance tested filters into the appropriate bottles labeled correctly for each filter type and the corresponding week number. Use filters from the same lots as were used in packing the filter packs for that week.
5.2.3 Record the date of preparation on the field log sheet. Record the required information in the CASTNET Filter Packing Notebook.
5.2.4 Store the bottles at 4 degrees Celsius (°C) until the samples for that week are ready for extraction.
5.3 Preparing the Shipping Tubes for Shipment
5.3.1 Each cardboard shipping tube must contain the PVC sleeve, filter pack, an SSRF, and a USPS prepaid return label. Foam end-pieces or bubble wrap are used to prevent damage to the filter pack and to the shipping tube. Attach the end-caps securely to both tubes to prevent the filter pack from falling out during shipment (see Figure 8).

GLO-3180-013 Revision No. 8
October 2016 Page 10 of 14
GLO-3180-013_R8 Amec Foster Wheeler
Figure 8 Filter Shipping Tubes
5.3.2 Attach the shipping tube/FedEx Site ID label to the outside of the tube. This label identifies the destination of the tube to the shipping technician. FedEx is used to ship the tubes to the site operators.
5.3.3 Keep the filter packs, SSRF, and shipping/contents labels in a set order to ensure that the correct filter pack is matched up with the correct SSRF and that the PVC shipping tube is sent to the correct site according to the shipping/contents label.
5.3.4 The date the shipment is given to the shipping technician is recorded at the bottom of the CASTNET Filter Packing Notebook.
5.4 Update status of schedule samples in LIMS when shipped
5.4.1 Select Sample Control, select Custody
5.4.2 Highlight the first sample ID of the work order being shipped, hold the Shift Key and highlight the last one
5.4.3 Click the arrow pointing to the right moving samples to that section, right click, Select-All.
5.4.4 Right click, select Edit Internal Custody; pick the Custody Date shipped from the drop-down; from the drop-down change Disposition to Active (Out), pick from the drop-down the initials of shipper in Checked In/Out, click Apply.
5.4.5 Print Sample Custody (see Figure 9).
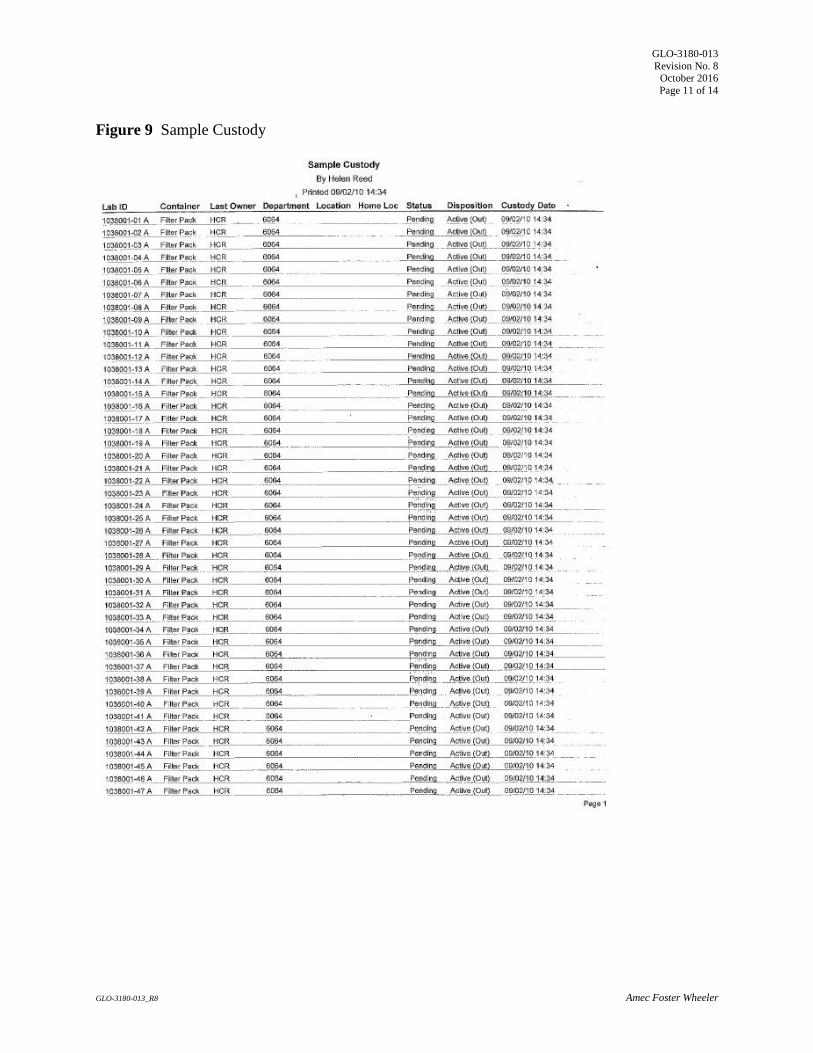
GLO-3180-013 Revision No. 8
October 2016 Page 11 of 14
GLO-3180-013_R8 Amec Foster Wheeler
Figure 9 Sample Custody

GLO-3180-013 Revision No. 8
October 2016 Page 12 of 14
GLO-3180-013_R8 Amec Foster Wheeler
6.0 REFERENCES
U.S. Environmental Protection Agency (EPA). 2007. Guidance for the Preparation of Standard Operating Procedures, (SOPs) for Quality-Related Documents. EPA/600/B-07/001, EPA QA/G-6, US EPA, Washington, D.C. April
7.0 ATTACHMENTS
Attachment A – Labels
Attachment B – Revisions Table
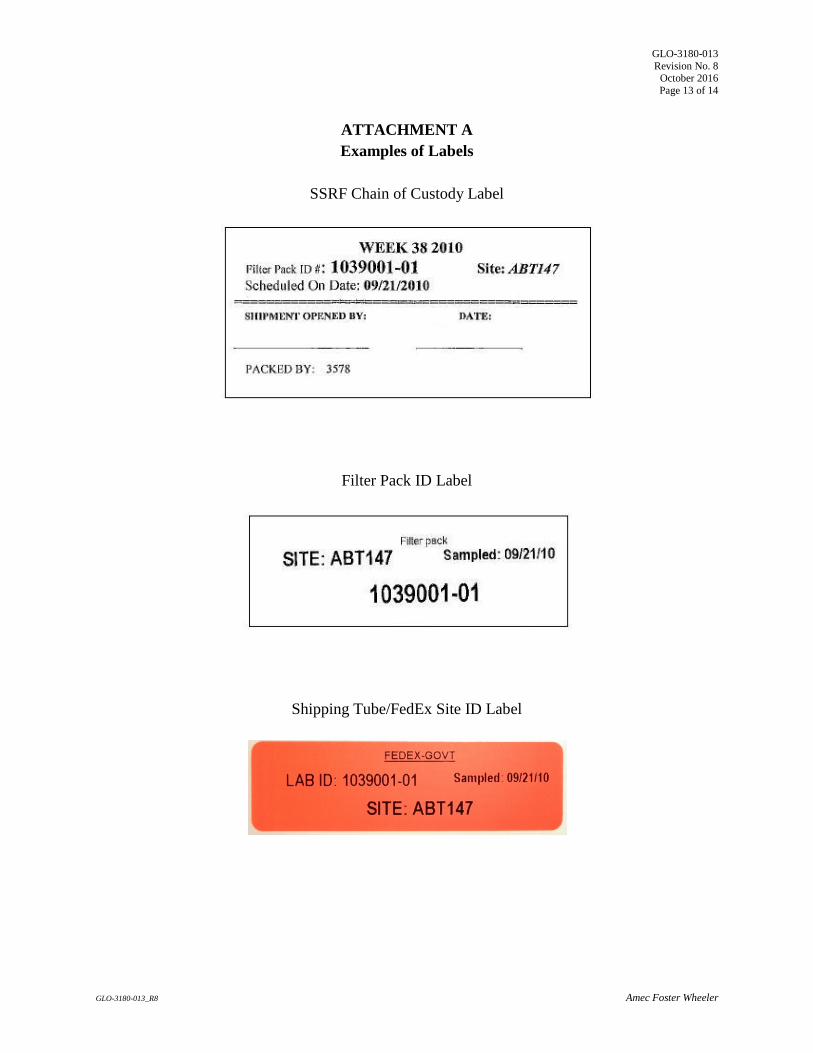
GLO-3180-013 Revision No. 8
October 2016 Page 13 of 14
GLO-3180-013_R8 Amec Foster Wheeler
ATTACHMENT A Examples of Labels
SSRF Chain of Custody Label
Filter Pack ID Label
Shipping Tube/FedEx Site ID Label

GLO-3180-013 Revision No. 8
October 2016 Page 14 of 14
GLO-3180-013_R8 Amec Foster Wheeler
ATTACHMENT B Revisions Table
Table - Revisions
Document Revision No.
Section Revision
8.0
Signature page Remove Garry Price and add Kathy Barry as Laboratory Operations Manager
All Update company name to Amec Foster Wheeler 6.0 Update references
Attachment B Addition of this table.


GLO-3180-015 Revision No. 9
October 2016 Page 2 of 3
GLO3180-015_R9 Amec Foster Wheeler
PROCEDURE FOR SAMPLE INFORMATION CHANGES AND ADDITIONS
1.0 PURPOSE
The purpose of this standard operating procedure (SOP) is to provide consistent guidance to the Amec Foster Wheeler Environment & Infrastructure, Inc. (Amec Foster Wheeler) laboratory personnel for changing or adding sample information in the Laboratory Information Management System (LIMS) Element by Promium.
2.0 SCOPE
This SOP applies to applies to all samples received by the Gainesville Laboratory and is used whenever changes and/or additions need to be made to existing sample information stored in the LIMS.
3.0 PROCEDURE
• A request for changes and additions to sample information is initiated by an e-mail request sent to the Laboratory Operations Manager (LOM), copying the QA Manager and login technician.
• All requests must be printed, dated, and signed. • The following items are required for each request: Project, lab identification (ID) number(s),
date of request, requestor’s name, and a clear description of the changes and/or additions to be made along with the reason for the request. Before changes are made, the LOM’s signature is required. If the changes affect a sample already reported, the QA Manager also needs to sign.
• After the appropriate changes have been made, the request is signed and dated by the data technician.
• The request is then filed in the appropriate Project File. • Communication of the change(s) is the responsibility of the person requesting the change(s).
4.0 REFERENCES
U.S. Environmental Protection Agency (EPA). 2007. Guidance for the Preparation of Standard Operating Procedures, (SOPs) for Quality-Related Documents. EPA/600/B-07/001, EPA QA/G-6, US EPA, Washington, D.C. April
5.0 ATTACHMENTS
Attachment A – Revisions Table

GLO-3180-015 Revision No. 9
October 2016 Page 3 of 3
GLO3180-015_R9 Amec Foster Wheeler
ATTACHMENT A Revisions Table
Table - Revisions
Document Revision No.
Section Revision
9.0
Signature page Remove Garry Price and add Kathy Barry as Laboratory Operations Manager
All Update company name to Amec Foster Wheeler 4.0 Update references
Attachment A Addition of this table.


GLO-3180-016 Revision No. 7
October 2016 Page 2 of 4
GLO3180-016_R7 Amec Foster Wheeler
PROCEDURE FOR DATA ENTRY ERROR CORRECTION
1.0 PURPOSE
The purpose of this standard operating procedure (SOP) is to provide consistent guidance to the Amec Foster Wheeler Environment & Infrastructure, Inc. (Amec Foster Wheeler) laboratory personnel for correcting errors made during documentation of procedures used in sample chain-of-custody, sample records, standard and spike preparation, data transcription, data reduction, and data reporting.
2.0 SCOPE
This SOP applies to all changes on data or data entries performed at the Gainesville Laboratory including studies conducted under the Good Laboratory Practice (GLP) guidelines specified in 40 Code of Federal Regulations (CFR), Parts 160 and 792.
3.0 PROCEDURE
When an error is made or discovered in the documentation, the personnel making the correction shall strike a single line through the error so as not to obscure the original entry, make the correction, and initial and date the correction and include the appropriate code (see Attachment A).
4.0 REFERENCES
CFR 40, Part 160, FIFRA - Good Laboratory Practice Standards (7/01/90). CFR 40, Part 792, TSCA - Good Laboratory Practice Standards (7/01/90). U.S. Environmental Protection Agency (EPA). 2007. Guidance for the Preparation of Standard
Operating Procedures, (SOPs) for Quality-Related Documents. EPA/600/B-07/001, EPA QA/G-6, US EPA, Washington, D.C. April
5.0 ATTACHMENTS
Attachment A – Data Entry Error Correction Codes.
Attachment B – Revisions Table

GLO-3180-016 Revision No. 7
October 2016 Page 3 of 4
GLO3180-016_R7 Amec Foster Wheeler
ATTACHMENT A Data Entry Error Correction Codes

GLO-3180-016 Revision No. 7
October 2016 Page 4 of 4
GLO3180-016_R7 Amec Foster Wheeler
ATTACHMENT B Revisions Table
Table - Revisions
Document Revision No.
Section Revision
7.0
Signature page Remove Garry Price and add Kathy Barry as Laboratory Operations Manager
All Update company name to Amec Foster Wheeler 4.0 Update references
Attachment B Addition of this table.
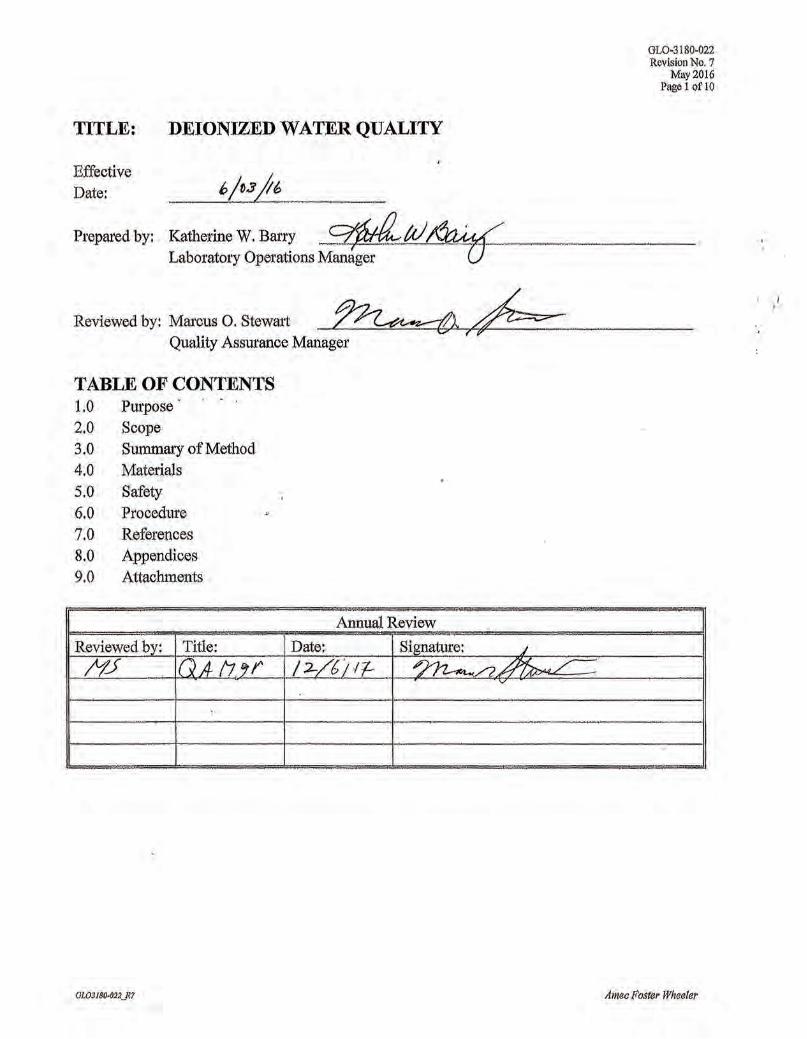
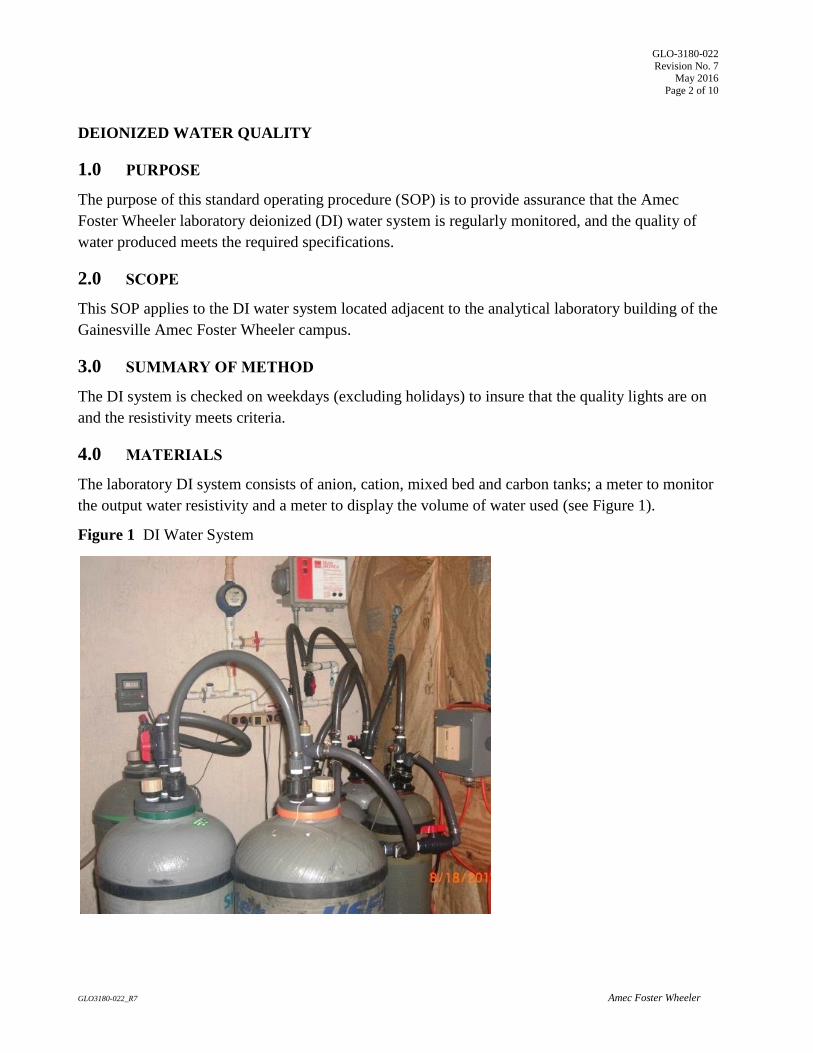
GLO-3180-022
Revision No. 7 May 2016
Page 2 of 10
GLO3180-022_R7 Amec Foster Wheeler
DEIONIZED WATER QUALITY
1.0 PURPOSE
The purpose of this standard operating procedure (SOP) is to provide assurance that the Amec
Foster Wheeler laboratory deionized (DI) water system is regularly monitored, and the quality of
water produced meets the required specifications.
2.0 SCOPE
This SOP applies to the DI water system located adjacent to the analytical laboratory building of the
Gainesville Amec Foster Wheeler campus.
3.0 SUMMARY OF METHOD
The DI system is checked on weekdays (excluding holidays) to insure that the quality lights are on
and the resistivity meets criteria.
4.0 MATERIALS
The laboratory DI system consists of anion, cation, mixed bed and carbon tanks; a meter to monitor
the output water resistivity and a meter to display the volume of water used (see Figure 1).
Figure 1 DI Water System

GLO-3180-022
Revision No. 7 May 2016
Page 3 of 10
GLO3180-022_R7 Amec Foster Wheeler
5.0 SAFETY
No chemicals are used in this method; however, laboratory personnel should exercise caution when
stepping up on the platform to take the daily readings.
6.0 PROCEDURE
6.1 Monitoring
6.1.1 Monitoring is done on a daily basis, excluding weekends and holidays, and recorded in the
DI Water System Operation Log (see Attachment A).
6.1.2 Verify that all of the tank quality lights are on (see Figure 2).
Figure 2 Tank Quality Lights
6.1.3 Open the valve next to the water meter (see Figures 3 and 4).
Figure 3 Valve Closed Figure 4 Valve Opened

GLO-3180-022
Revision No. 7 May 2016
Page 4 of 10
GLO3180-022_R7 Amec Foster Wheeler
6.1.4 After approximately 30 seconds, record the resistivity (see Figure 5). The resistivity should
be equal to or greater than 15 megohms per centimeter (Mohm/cm). Close the valve opened
in the previous step.
Figure 5 Resistivity Meter
6.1.5 Record the quantity of DI used (see Figure 6).
Figure 6 Water Meter
GLO-3180-022
Revision No. 7 May 2016
Page 5 of 10
GLO3180-022_R7 Amec Foster Wheeler
6.2 Quality Control
6.2.1 If one or more tank lights are off, but the resistivity is acceptable (> 15 Mohm/cm), the
tanks need to be replaced but the water may still be used. The Laboratory Operations
Manager (LOM) must be notified. The water system service company must be contacted
and requested to have the tanks changed within the next 24 hours. The time the service
company call was made must be marked in the DI Water System Operation Log. Once the
tanks are changed by the water system service company, the LOM must be notified. The
date and time that they were replaced must be noted in the DI Water System Operation Log.
6.2.2 If the tank lights are off and resistivity has dropped below the minimum specification
(< 15 Mohm/cm), it indicates the tanks have expired. The DI water system must be shut
down and the LOM must be notified immediately. The water system service company must
be contacted and requested to have the tanks changed immediately. The time of the service
company call must be marked in the DI Water System Operation Log. Once the tanks have
been changed by the water system company, all DI faucets in the building must be purged
for a minimum of 30 seconds. Once the water system has been purged and the resistivity is
greater than 15 Mohm/cm, the LOM must be notified that the water system is within criteria
and can now be used. The date and time that the DI water system is operational must be
noted in the DI Water System Operation Log.
6.3 Corrective Action
When the resistivity falls below 15 Mohm/cm, the water system must be purged after the tanks
are changed.
6.4 System Maintenance
The LOM must be notified immediately of any maintenance work to be done on the water system,
whether planned or unplanned. The time the system was brought down, what work was done, and
the time the system was brought back up must be recorded in the operating log. When any work is
performed on the system that could adversely affect water quality, the system must be purged.

GLO-3180-022
Revision No. 7 May 2016
Page 6 of 10
GLO3180-022_R7 Amec Foster Wheeler
7.0 REFERENCES
Amec Foster Wheeler E&I, Inc. (Amec Foster Wheeler). 2014. Clean Air Status and Trends
Network (CASTNET) Quality Assurance Project Plan, Revision 8.2. Prepared for U.S.
Environmental Protection Agency (EPA), Washington, DC. Contract No. EP-W-09-028.
Gainesville, FL.
U.S. Environmental Protection Agency (EPA). 2007. Guidance for the Preparation of Standard
Operating Procedures, (SOPs) for Quality-Related Documents. EPA/600/B-07/001, April.
ISO/IEC. 1987. Water for Analytical Laboratory Use — Specification and Test Methods. ISO
International Standard ISO/IEC 3696:1987
8.0 APPENDICES
Appendix 1 – Revisions Table
9.0 ATTACHMENTS
Attachment A – DI Water System Operation Log
Attachment B – ISO/IEC 3696:1987 Water Specifications

GLO-3180-022
Revision No. 7 May 2016
Page 7 of 10
GLO3180-022_R7 Amec Foster Wheeler
Appendix 1 – Revisions Table

GLO-3180-022
Revision No. 7 May 2016
Page 8 of 10
GLO3180-022_R7 Amec Foster Wheeler
Table – Revisions
Document Revision No. Section Revision
7.0 All Change name from AMEC E&I to Amec Foster
Wheeler
7.0 Cover Katherine W. Barry replaces Garry L. Price as
Laboratory Operations Manager
7.0 References Addition of ISO/IEC 3696:1987 Water Specifications
reference and an associated summary table as
Attachment B
7.0 Appendix 1 Addition appendix 1 for inclusion of this table

GLO-3180-022
Revision No. 7 May 2016
Page 9 of 10
GLO3180-022_R7 Amec Foster Wheeler
ATTACHMENT A
DI WATER SYSTEM OPERATION LOG

GLO-3180-022
Revision No. 7 May 2016
Page 10 of 10
GLO3180-022_R7 Amec Foster Wheeler
ATTACHMENT B
ISO/IEC 3696:1987 WATER SPECIFICATIONS
Grade Minimum Conductance
(Micro-Siemens per Centimeter)
Minimum Resistance
(Mega-Ohms per Centimeter)
1 0.1 10
2 1 1
3 5 0.2
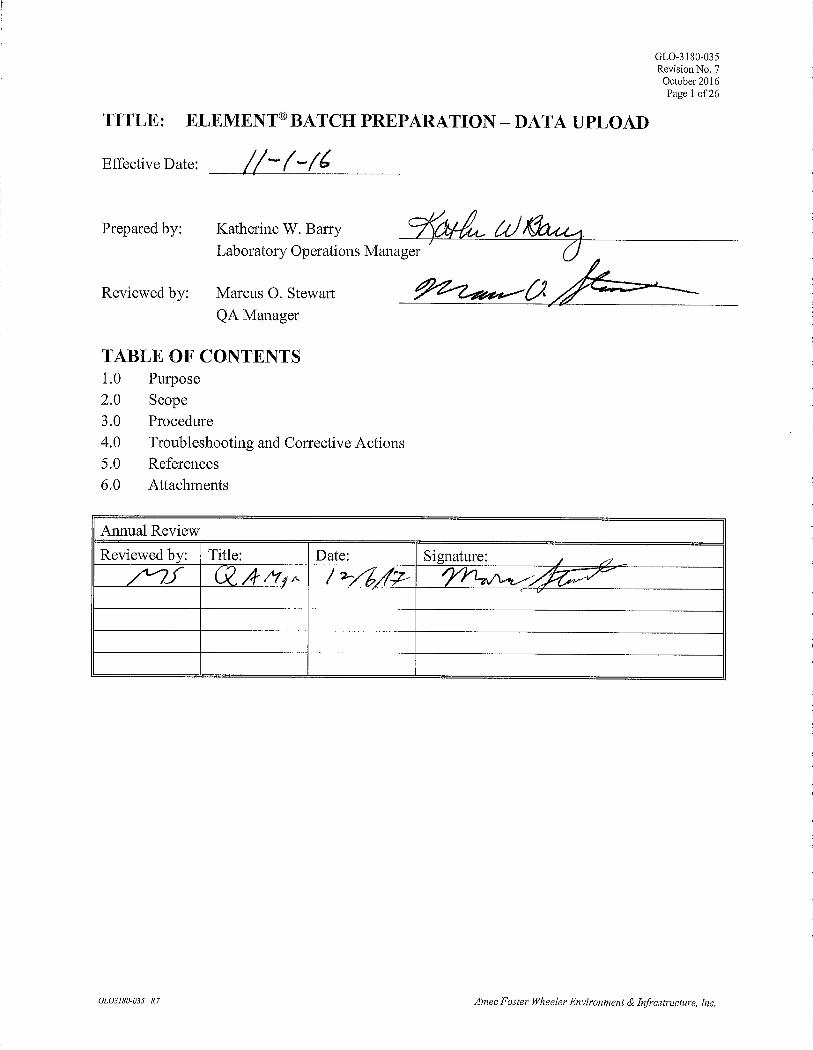

GLO-3180-035 Revision No. 7
October 2016 Page 2 of 26
GLO3180-035_ R7 Amec Foster Wheeler Environment & Infrastructure, Inc.
ELEMENT®BATCH PREPARATION
1.0 PURPOSE
The purpose of the SOP is to provide guidance for the preparation of electronic data batches in
Element DataSystem® Laboratory Information Management System (LIMS) for all laboratory
methods that require uploading instrument export files.
2.0 SCOPE
This SOP covers the automated upload data procedures for laboratory instrumentation,
troubleshooting and error correction steps.
3.0 PROCEDURE
3.1 Prepare to upload.
Prepare an export file. Do not include any samples requiring a dilution unless the diluted
sample has been analyzed. If any required dilutions have been performed and analyzed,
do not include any diluted values for samples in the automated upload file; all dilution
values must be entered manually.
Prepare export files only after the raw data has been printed and evaluated for errors,
including incorrect sample laboratory IDs. Be sure to check the entire file for correct
spelling and sample identification and correct any errors found before proceeding.
3.1.1 Chromeleon 7.2
A. On the Chromeleon console, select the Data section. Right click on the sequence to be
printed. Select Print. Print the checked items only, click OK to print.
B. At the bottom of the screen, open the Instrument Method. Left click on the Chromeleon
icon and select Quick Print. Repeat this for the Processing Method.
C. Open the Logbook Form. Go to the Sequence Printout tab and adjust the information to
fit the logbook page. Note: changes are made the same as in an Excel spreadsheet.
D. Highlight the samples for exporting. Do not include the calibration curve or shutdown
method.
E. Right click and select Export. The following screen (Figure 1) will open:
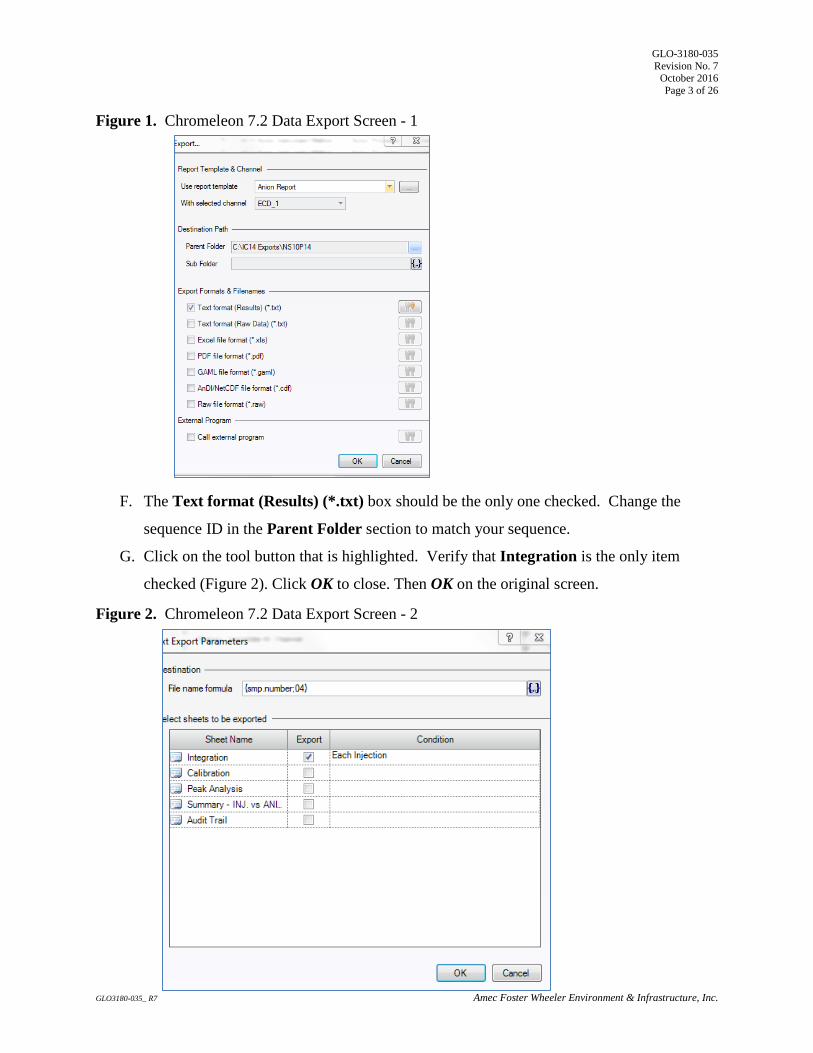
GLO-3180-035 Revision No. 7
October 2016 Page 3 of 26
GLO3180-035_ R7 Amec Foster Wheeler Environment & Infrastructure, Inc.
Figure 1. Chromeleon 7.2 Data Export Screen - 1
F. The Text format (Results) (*.txt) box should be the only one checked. Change the
sequence ID in the Parent Folder section to match your sequence.
G. Click on the tool button that is highlighted. Verify that Integration is the only item
checked (Figure 2). Click OK to close. Then OK on the original screen.
Figure 2. Chromeleon 7.2 Data Export Screen - 2

GLO-3180-035 Revision No. 7
October 2016 Page 4 of 26
GLO3180-035_ R7 Amec Foster Wheeler Environment & Infrastructure, Inc.
H. Click OK to create the export files. Each sample will have a corresponding text file and
will be created in a directory with the same name as the sequence file in item F
(extension.seq) located in an export folder on the instrument computer.
I. Transfer the entire export file to an Element®- enabled workstation via rewriteable
compact disc or USB thumb-drive to process your Element® AutoBatch.
3.1.2 Bran+Luebbe AACE 6.03
Figure 3. Bran+Luebbe AACE 6.03 Export Screen
A. From the main AACE 6.03 screen on the instrument PC select File and then choose
Export to from the drop-down list. Select ASCII File to open the Select Run screen.
B. On the Select Run screen, select the following data path: C:\Program
Files\Bran+Luebbe\Aace 6.03\Data\NH3+NH4.
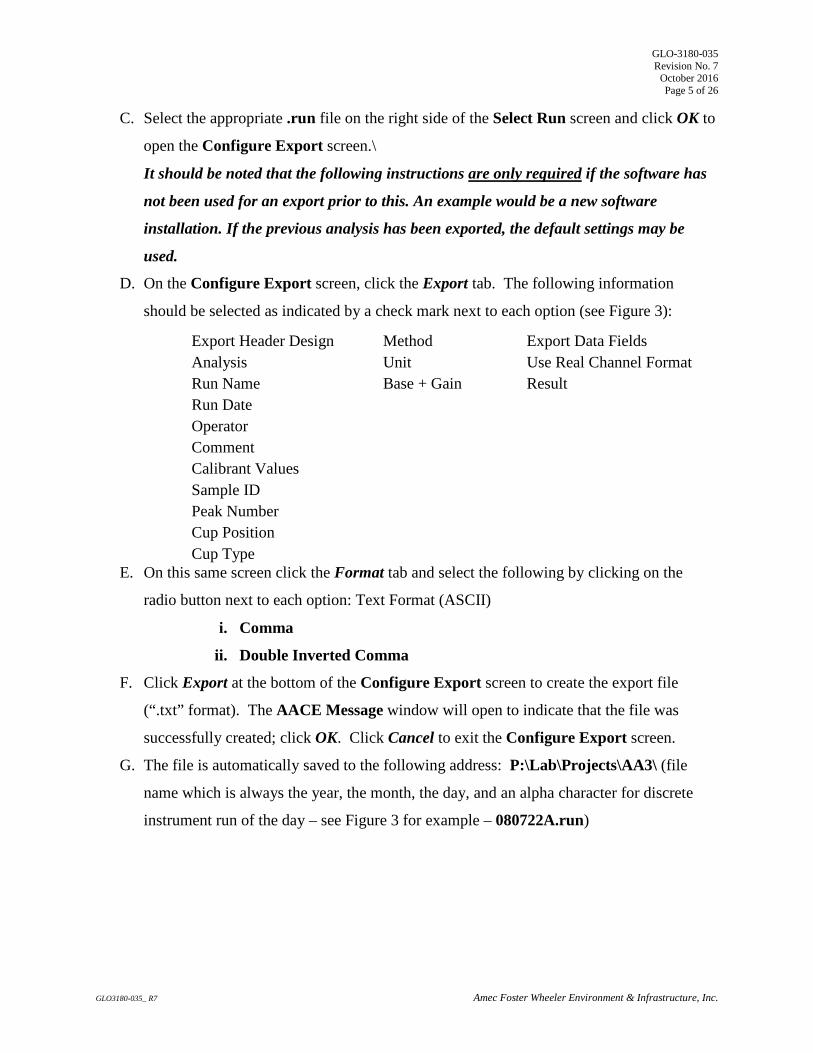
GLO-3180-035 Revision No. 7
October 2016 Page 5 of 26
GLO3180-035_ R7 Amec Foster Wheeler Environment & Infrastructure, Inc.
C. Select the appropriate .run file on the right side of the Select Run screen and click OK to
open the Configure Export screen.\
It should be noted that the following instructions are only required if the software has
not been used for an export prior to this. An example would be a new software
installation. If the previous analysis has been exported, the default settings may be
used.
D. On the Configure Export screen, click the Export tab. The following information
should be selected as indicated by a check mark next to each option (see Figure 3):
Export Header Design Method Export Data Fields Analysis Unit Use Real Channel Format Run Name Base + Gain Result Run Date Operator Comment Calibrant Values Sample ID Peak Number Cup Position Cup Type
E. On this same screen click the Format tab and select the following by clicking on the
radio button next to each option: Text Format (ASCII)
i. Comma
ii. Double Inverted Comma
F. Click Export at the bottom of the Configure Export screen to create the export file
(“.txt” format). The AACE Message window will open to indicate that the file was
successfully created; click OK. Click Cancel to exit the Configure Export screen.
G. The file is automatically saved to the following address: P:\Lab\Projects\AA3\ (file
name which is always the year, the month, the day, and an alpha character for discrete
instrument run of the day – see Figure 3 for example – 080722A.run)

GLO-3180-035 Revision No. 7
October 2016 Page 6 of 26
GLO3180-035_ R7 Amec Foster Wheeler Environment & Infrastructure, Inc.
3.1.3 Perkin Elmer WinLab32
Figure 4. Perkin Elmer WinLab32 Export Screen
A. From the main WinLab32 screen on the instrument PC click on File in the upper left
corner and select Utilities from the drop-down list.
B. Select Data Manager to open the screen. Choose the results file that contains the desired
data by clicking on the filename.
C. Select Export to open the Data Export Wizard (see Figure 4). Under Select Export
Design choose Use Existing Design and select Browse.
D. Choose element.xpt from the pop-up window and click Open to return to the Select
Export Design window. Click Next to open the Select Samples to Export screen.
E. To select or deselect sample data files, choose Enable/Disable on the Select Samples to
Export screen to open the Enable/Disable window. A red check mark in the Enable
column indicates that a particular sample will be included in the export file. Click in the
Enable column to add or remove the check marks.
F. Click OK once all samples have been selected to return to the Select Samples to Export
screen. Click on Next to open the Select Analytes to Export window.

GLO-3180-035 Revision No. 7
October 2016 Page 7 of 26
GLO3180-035_ R7 Amec Foster Wheeler Environment & Infrastructure, Inc.
G. Ensure that the all analytes of analysis are on the right. Select by clicking Add on the
Select Analytes to Export screen. When all analytes are selected, choose Next to open
the Select Export Options screen.
H. On the screen, the settings should be as follows:
Name – Same as data set file name, Extension - .prn, Directory is set to E:\ or D:\.
Use a USB thumb drive for drive E:\ and a CDRW for drive D:\.
Select Next to proceed.
It should be noted that the following instructions are only required if the software has
not been used for an export prior. An example would be a new software installation. If
the previous analysis has been exported, the default settings may be used.
I. On the Select Sample Parameters screen, choose Sample ID by highlighting and
clicking on Add to move the selection to the right side of the screen. Choose Next.
J. On the Select Mean-Related Parameters screen, select the following options by
highlighting and clicking Add to move the selections to the right side of the screen:
Analyte Name Data and Time
Concentration (Samp. Units) Element Symbol
Element Wavelength Reported Conc. (Samp.Units)
Concentration (Calibration Units) Units (Sample)
Units (Calibration)
Select Next.
K. On the Select Replicate-Related Parameters screen, repeat item J for the following
parameters:
Replicate Number and Date and Time
Click Next to open the Export Data Set window.
L. Select Export Data at the top of the Export Data Set window to create the export file on
the floppy disc. After the file is written select Finish.
M. Transfer the export file to an Element™-enabled workstation via floppy disk or
rewriteable CDRW.
N. The export file is archived at the following address:
P:\Lab\Projects\Optima\Results\Element

GLO-3180-035 Revision No. 7
October 2016 Page 8 of 26
GLO3180-035_ R7 Amec Foster Wheeler Environment & Infrastructure, Inc.
3.1.4 AutoWeight V36 – See also Section 7.5.14 in GLM3180-002
Figure 5. AutoWeight V36 Export Screen
A. From the Options menu in AutoWeight , select Export Data (see Figure 5).
B. Select a starting date and an ending date. Click the Update Report File button.
1) To edit the report, select Review and Edit Data from the Options form.
2) Select Initial/Final and Yesterday/Today. Press Start.
3) Edit the form. All fields except Analyst and Sample Weight are available for editing.
Save after every change.
4) Close form.
C. Print using the Print Form button.
D. Click the Export Data button. Enter a filename at the prompt; do not enter a file
extension. The file is automatically saved to the following address:
E. G:\GNVCASTNET\ELEMENT\AutoWeight Export files

GLO-3180-035 Revision No. 7
October 2016 Page 9 of 26
GLO3180-035_ R7 Amec Foster Wheeler Environment & Infrastructure, Inc.
3.2 Element® Login and Data Upload
3.2.1 Double click on the Element® icon on the pc desktop
3.2.2 Enter your analyst ID and password
3.2.3 Data Tool – Creating a Bench Sheet
A. From the Laboratory drop-down and open Data Tool.
B. Clear any data visible on the left side of the Data Tool – Main screen by clicking on the
Clear button for that side of the screen.
C. Select the Browse button on the right side of the screen to open the Select Data System
Files screen. Clear any data visible on the bottom left side of the screen by using the
Clear button.
D. From the drop-down list under File Type select as shown below:
Chromeleon711 (Chrom7.2) Chromeleon711 (*.txt)
Bran+Luebbe AACE 6.03 Braun + Luebbe (*.txt)
Perkin Elmer WinLab32 PE WinLab-Final (*.prn)
AutoWeight v36 Excel Spreadsheet (*.xls)
E. Select the appropriate drive and pathway.
F. Choose the correct export file from those displayed in the bottom right section of the
Select Data System Files screen by double-clicking on the filename. For
Chromeleon 7.2, chose the appropriate directory. The samples in that file or directory
should appear in the upper left section of the Select Data System Files screen.
G. Highlight all samples to be uploaded. Do not include any calibration standards that may
have inadvertently been exported with the sample data. Use the Include button to move
the highlighted samples to the lower left section of the Select Data System Files screen.
Verify that all desired samples have been included and any undesired samples excluded
before proceeding. See an example of DataTool in Figure 6 on the following page.

GLO-3180-035 Revision No. 7
October 2016 Page 10 of 26
GLO3180-035_ R7 Amec Foster Wheeler Environment & Infrastructure, Inc.
Figure 6. Element® DataTool Screen
H. Select Done to move the samples to the right side of the Data Tool – Main screen. If
any samples appear on the left side of this screen select Clear at the top of the left side of
the screen.
I. Verify that the CrossTable displayed at the bottom of the screen corresponds to the
correct instrument and/or analysis. Correct the CrossTable by selecting File followed by
Select Cross Table. Verify that the data path is C:\ELEMENT before selecting the
appropriate CrossTable.
Note: A pop-up will open stating “The selected filename does not match the expected name.
Are you sure you want to use it?” Choose Yes.

GLO-3180-035 Revision No. 7
October 2016 Page 11 of 26
GLO3180-035_ R7 Amec Foster Wheeler Environment & Infrastructure, Inc.
J. Click Merge Files once the CrossTable is correct to bring up the Data Transfer screen.
Select the Instrument Data tab to confirm that data has been entered. Save to the
following pathway with a unique filename: C:\ELEMENT\UserFiles
K. Click Done and close the Data Tool – Main screen by clicking on the [X] at the top right
corner of the screen.
3.2.4 AutoBatch d
3.2.4.1 Under Laboratory, select Data Entry/Review; under the Data Entry tab, choose the
yellow folder button as shown here . Select the appropriate merged
upload file saved from Data Tool and Open.
Figure 7. Data Entry/Review

GLO-3180-035 Revision No. 7
October 2016 Page 12 of 26
GLO3180-035_ R7 Amec Foster Wheeler Environment & Infrastructure, Inc.
3.2.4.2 Select the appropriate parameters from the Batch Analysis pop-up window by clicking in
the box to the left of each parameter name.
Note: Only the parameters available for the samples included in the upload file will be
available in the pop-up window.
Close this window by clicking on the [X] at the top right corner of the window to open the
Bench Sheet. Record the batch number.
Figure 8. Bench Sheet
3.2.4.3 On the Bench Sheet, select the Edit button to enter Edit Mode.
A. In the upper window (real samples), verify that all desired samples were included. If any
samples are missing, it is likely that they were misnamed. Check the Laboratory ID
against the label on the extract bottle and make any necessary corrections to the raw data
and upload files before proceeding.
B. Still in the upper window, highlight a sample, right click and choose Select All to

GLO-3180-035 Revision No. 7
October 2016 Page 13 of 26
GLO3180-035_ R7 Amec Foster Wheeler Environment & Infrastructure, Inc.
highlight all samples. Right click again and select Prepared to correct the extraction date
(if applicable). Repeat and select Prepared By to correct the extractor name if different
than that of the analyst preparing the data batch.
C. In the lower window (QC samples), repeat the steps in item B, correcting the Prepared
date to the date of extraction for the method blank (BLK1) and any other extracted QC
samples (such as BS1). Correct the Prepared date to the date of analysis for any non-
extracted QC samples such as CCV and SRM.
D. Highlight all CCV, right click and select Spike 1 ID. Select the appropriate Element®
Standard assigned ID by double-clicking. Repeat right-click while all CCV are still
highlighted and select Spike 1 Type. Right-click again and choose Static from the drop-
down list. Repeat right-click again and select Spike 1 Amount Set this value to 1
H. Repeat item D for SRM samples.
I. Repeat item D for BS1 sample. Choose Pre-Prep under Spike 1 Type and either 1000 or
2000 (the later for 50 mL extracts only) for Spike 1 Amount.
J. Highlight DUP1. Right click and select Source. Using the information from the run log,
choose the correct Laboratory ID for the duplicated sample. Repeat for the remaining
DUP samples in the batch.
K. Save the changes and select Done to open the Data Transfer screen.
3.2.4.4 Any unmatched parameters appearing in red in the upper left corner of the Data
Transfer screen must be added to the CrossTable.
A. Double-click the first unmatched analyte in red to open the CrossTable.
B. The CSAnalyte and ELMAnalyte columns must match for every entry in the table; the
ELMAnalysis column should be ignored.
C. To match, click in the unmatched ELMAnalyte column and select the correct match
from the drop-down list.
D. The CSAnalyte column must be either matched to the ELMAnalyte column or listed as
*Non-Target*.
E. Verify that the upper range of the method is correct.
F. Save and Close.

GLO-3180-035 Revision No. 7
October 2016 Page 14 of 26
GLO3180-035_ R7 Amec Foster Wheeler Environment & Infrastructure, Inc.
3.2.4.5 On the Data Entry/Review screen, select the Analyst column by clicking on the
appropriate header tab. Right click and choose Fill Cells. Select the appropriate analyst
initials from the drop-down list and click Apply and Save.
3.2.4.6 Click OK to close the Data Post Results pop-up window.
3.3 Review and Print Batch
3.3.1 From Laboratory in the Element® taskbar, select Data Entry/Review, highlight your
batch number, and under the Data Review tab choose Query.
3.3.2 Review all data for correctness. Verify that all desired samples are listed. Samples for
which the database detects an error or flag will be coded in red. The parameter in
question will also be coded red. Investigate all red-coded samples for corrections.
Note: If no red-coded parameters are initially viewable, reveal all details for the samples by
clicking on the grey square in the uppermost left corner of the data display to select all
samples, right click, and choose “View Details.” Scroll to the right until the red-coded
parameter comes into view.
Note: All flags and errors must be addressed in the batch checklist.
3.3.3 After all necessary corrections have been made, select all by clicking on the grey square
in the uppermost left corner of the data display. Right click and select Update Status
from drop-down and select Update to Analyzed.
3.3.4 Select Lock to lock the data from further editing.
3.3.5 Print the batch report using the correct report format as indicated below.
IC and ICP – rev_AMEC_R3.rpt
AA3 – rev_AMEC_NH4.rpt
Mass analyses – rev_AMEC_PM25.rpt / rev_AMEC_PMHiVol.rpt
3.4 Standard Update
3.4.1 Update the Standards table for QC used in analysis. This step only need be completed
when new standard solutions or masses are being used.

GLO-3180-035 Revision No. 7
October 2016 Page 15 of 26
GLO3180-035_ R7 Amec Foster Wheeler Environment & Infrastructure, Inc.
3.4.1.1 Under Laboratory on the main Element® screen, select Standards to open the Standards
table. On the left side of the table are the standard numbers assigned by Element®; on the
right are the descriptions of each standard.
3.4.1.2 Choose the number for a previous standard of the type required and click Copy to create
another entry of the same type. To create a standard from scratch click Add and specify
the type as follows:
For stocks (purchased or laboratory prepared), purchased standards, and mass standards:
1 – Specify each analyte and its concentration.
For diluted standards:
2 – Combine and/or dilute existing standards.
3.4.1.3 For copied standards, update the entry to reflect the correct information for the
standard.
A. For purchased stocks and standards:
1) The Prepared Date and the Reference Date should be changed to reflect the date the
stock or standard was made. If this date is not available from the manufacturer’s
documentation, use the received date. For masses, use the certification date.
2) The Expiration Date should reflect the date specified by the Certificate of Analysis.
If no expiration date is given, the solution expires one year from the date of receipt.
For masses, the Expiration Date is one year from the date of certification.
3) Select the radio button next to Purchased and enter the Received date and Opened
date in the appropriate fields.
4) Update Prepared By with **Vendor** and Vendor to the correct manufacturer
source.
5) Update the lot number both in the Vendor Lot field and in the Comment field.
B. For laboratory prepared stocks:
1) The Prepared Date and the Reference Date should be changed to reflect the date the
stock was made.
2) The Expiration Date is one year from the date the stock was prepared.
3) Select the Prepared radio button.
4) Update the Vendor Lot field and in the Comment field with the solution number.

GLO-3180-035 Revision No. 7
October 2016 Page 16 of 26
GLO3180-035_ R7 Amec Foster Wheeler Environment & Infrastructure, Inc.
Include a specific reference to the logbook and page number in the Comment field.
Note: Each laboratory prepared standard should be documented in an appropriate logbook
and assigned a unique solution number that references both the logbook and page number.
For example, 180701IA references the first solution documented in section I of page 01 in
logbook 1807. For logbooks designed to document only solution per page, the logbook
number followed by the page number should be sufficient, eg. 1857-01.
C. For diluted standard solutions:
1) The Prepared Date should be changed to reflect the date the diluted standard was
made.
2) The Reference Date should be changed to reflect the date the stock was made. If no
prepared date was supplied with a purchased stock, use the receipt date.
3) The Expiration Date is assigned as follows:
ICP standards: 1 month from date of dilution.
Most other standards: 3 months from date of dilution.
High-level standards: 6 months from date of dilution.
4) Select the Prepared radio button.
5) Update the Vendor Lot field and in the Comment field with the stock lot number for
standards diluted from purchased stocks or the diluted standard solution number for
standards diluted from prepared stocks. Include a specific reference to the logbook
and page number in the Comment field.
6) In the left-hand portion of the screen below the Comment field, right click on the
displayed Element® standard number and select Browse to open the list of all
Element® assigned standard ID numbers. Select the standard number of the stock
solution used for the dilution.
Note: Only the information in the Comment field is visible when selecting the correct “Spike 1
ID” in the Bench Sheet. Any information necessary to identify the correct standard – such as
lot number, expiration date, and/or preparation date – should be included in this field.

GLO-3180-035 Revision No. 7
October 2016 Page 17 of 26
GLO3180-035_ R7 Amec Foster Wheeler Environment & Infrastructure, Inc.
3.4.1.4 For newly created standards, update the entry to reflect the correct information for the
standard.
A. For purchased stocks and standards or standard masses (Type 1):
1) Edit the dates as in Section 3.5.1.3.1 – 3. 5.1.3.2.
2) Select the Vendor from the drop-down list or enter an unlisted vendor by hand. Enter
the Vendor Lot number.
3) Select the radio button next to Purchased and enter the Received date and Opened
date in the appropriate fields.
4) Enter the Volume of the standard and the Concentration Units. Set the
Concentration Units for masses to NA. The Solvent Lot# is also NA for masses.
5) Select the analytes. Highlight the desired parameters in the left-hand portion of the
screen below the Comment field and click the “→” button to move the selected
analyte to form an analyte table on the right side of the screen.
6) Enter the targets for each analyte in the column next to the parameter name. This
column will be named based on the Concentration Units. Verify that the correct
control limits have been entered.
7) Select the radio button next to Reference under Standard Type. Choose Other for
mass standards.
B. For laboratory prepared stocks (Type 1):
1) Edit the dates as in Sections 3.5.1.3.3.
2) Select the radio button next to Prepared.
3) Update the Vendor Lot field and in the Comment field with the solution number.
Include a specific reference to the logbook and page number in the Comment field.
4) Follow Sections 3.1.3.4.1.4 – 3.1.3.4.1.7.
C. For diluted standard solutions (Type 2):
1) Edit the dates as in Sections 3.1.3.3.3.1 – 3.1.3.3.3.2.
2) Select the radio button next to Prepared.
3) Update the Vendor Lot field and in the Comment field with the stock lot number
for standards diluted from purchased stocks or the diluted standard solution number
for standards diluted from prepared stocks. Include a specific reference to the

GLO-3180-035 Revision No. 7
October 2016 Page 18 of 26
GLO3180-035_ R7 Amec Foster Wheeler Environment & Infrastructure, Inc.
logbook and page number in the Comment field.
4) In the left-hand portion of the screen below the Comment field, right click on the
displayed Element® standard number and select Browse to open the list of all
Element® assigned standard ID numbers. Select the standard number of the stock
solution used for the dilution.
5) Select the radio button next to Reference under Standard Type.
3.4.1.5 Save the changes.
4.0 TROUBLESHOOTING AND CORRECTIVE ACTIONS
Most Element® errors occur because of misidentified samples. The Element® Laboratory IDs are
purely numeric and can be very similar for some samples. Careful attention is required at every
stage of analysis to ensure that each sample is correctly identified. It is strongly recommended
that instrument schedules be prepared directly from the samples and not from another schedule
or list as this creates an opportunity for errors to be introduced in manner that is extremely
difficult to detect.
4.1 Before submitting the batch, verify that every sample included in the export file has been
uploaded into Element®. If a sample field or QC is missing, check the instrument
schedule or run log for obvious errors, such as alphabetical characters interchanged with
numerals. If the schedule appears correct, check the export file for inadvertently
excluded samples. If this is correct, verify the schedule against the sample bottle labels.
4.2 If the missing sample is a misidentified QC sample, follow the procedure in Section 4.3,
but select the appropriate QC sample type instead of Client Sample (Container) as
specified in Section 4.3.3. See Section 3.3.2.2 for a list of the selection choices for each
QC sample type.
Note: Most often a sample will be misidentified as a sample for which the data has already
been locked in Element®. In this case a pop-up window will appear during upload indicating
that a sample already has data entered for the parameters included in the batch. The sample
will not be uploaded into Element®. The specific sample affected is not named and must be
identified by comparing the uploaded samples with the instrument run log.

GLO-3180-035 Revision No. 7
October 2016 Page 19 of 26
GLO3180-035_ R7 Amec Foster Wheeler Environment & Infrastructure, Inc.
4.3 If a misidentified sample is indicated, correct the export file and add it to the data batch.
4.3.1 Open the export file and make the appropriate correction, making sure to save the file.
Alternatively, the export file can be recreated after the sample identification has been
corrected.
Note: The raw data, both electronic (where possible) and the hard-copies must be corrected
before the batch can be submitted.
4.3.2 Open the Laboratory tab and select Data Entry/Review. Select the correct batch number
and Query. Make sure all data are locked. See Section 3.4.4. If data are left unlocked
it could be overwritten and additional compounding errors introduced.
4.3.3 Open the Bench Sheet and select the appropriate batch. Enter Edit Mode. Highlight any
sample that should not be in the batch and click Remove. Click Add to and select Client
Sample (Container) to bring up a list of available samples. Double-click the appropriate
sample and analysis to add it to the bench sheet. Close the window by clicking on the
[X] in the upper right corner of the screen.
4.3.4 Highlight the added sample and right-click. Select Prepared and change the prepared
date to match the rest of the samples in the batch. Save and Done to exit the Bench
Sheet.
4.3.5 Open Laboratory tab and select Data Entry/Review; select the appropriate batch. Under
the Data Entry tab, click Create and then Export as an Excel file. Assign the file a
unique name that is different from the original export file for this batch but is related.
Save to the following directory: C:\ELEMENT\UserFiles. Click Cancel and close the
screen.
4.3.6 Open Data Tool through Element®. Clear the left side of the screen of samples. Click
Browse on the left side of the Data Tool – Main window. Open the Excel file created in
Section 4.3.5 so that the samples are listed in the left pan of the window.
4.3.7 Click Browse on the right side of the window. Clear any existing samples displayed on
the Select Data System Files screen. Select the original export file so that the samples
are displayed in the upper left portion of the screen. Highlight the desired sample and
GLO-3180-035 Revision No. 7
October 2016 Page 20 of 26
GLO3180-035_ R7 Amec Foster Wheeler Environment & Infrastructure, Inc.
move it to the lower left portion of the screen using the ↓/Include button. Click Done to
return to the Data Tool – Main screen.
4.3.8 Click Merge Files. Click the Instrument tab on the Data Transfer screen to display the
instrument data.
4.3.9 Save as an Excel file to the same destination as in Section 4.3.5 with a new related
filename.
4.3.10 Open the Laboratory tab and select Data Entry/Review screen and select the correct
batch. Click Open and select the file saved in Section 4.3.9. Save and Query to review.
In cases where data have not been updated to Reviewed status, it is currently possible to
overwrite data for batched samples even if the data have been locked. When this
happens, the older sample will be deleted from its original batch. To correct this problem
it is therefore also necessary to add the erased sample back into its original batch as well
as correct the misidentified sample in the current batch.
4.3.11 If a misidentified sample has resulted in data from previous batches being erased, delete
the offending sample from the most recent batch from the Bench Sheet.
4.3.12 Replace the deleted sample in its original batch following the steps outlined in Sections
4.3.2 – 4.3.10. Resubmit the batch including a Batch Update Request Form. No status
change is required. See Attachment C.
4.3.13 Repeat the entirety of Section 4.3 for the most recent batch.
GLO-3180-035 Revision No. 7
October 2016 Page 21 of 26
GLO3180-035_ R7 Amec Foster Wheeler Environment & Infrastructure, Inc.
4.4 If a sample in the current batch is correctly identified but is excluded from the upload
because a sample in a previous batch has been misidentified with the same Laboratory
ID, the data in the older batch must be corrected before the current sample can be
uploaded properly.
4.4.1 Determine the original batch’s number and submit a Batch Update Request Form to have
the status changed back to “Analyzed” by the Laboratory Manager.
4.4.2 Using the archived data files, follow the steps in Section 4.3 for the original batch and
resubmit the batch, including the Batch Update Request Form.
4.4.3 Re-upload the current batch.
4.4.4 Using the archived data files, follow the steps in Section 4.3 for the original batch and
resubmit the batch, including the Batch Update Request Form.
4.4.5 Re-upload the current batch.
5.0 REFERENCES
U.S. Environmental Protection Agency (EPA). 2007. Guidance for the Preparation of Standard Operating Procedures, (SOPs) for Quality-Related Documents. EPA/600/B-07/001, EPA QA/G-6, US EPA, Washington, D.C. April

GLO-3180-035 Revision No. 7
October 2016 Page 22 of 26
GLO3180-035_ R7 Amec Foster Wheeler Environment & Infrastructure, Inc.
6.0 ATTACHMENTS
Attachment A – General Batch Narrative Format.
Attachment B – Mass Analyses Batch Format.
Attachment C – Example Batch Update Request Form.
Attachment D – Revisions Table

GLO-3180-035 Revision No. 7
October 2016 Page 23 of 26
GLO3180-035_ R7 Amec Foster Wheeler Environment & Infrastructure, Inc.
ATTACHMENT A General Batch Narrative Format
Batch Comments L802041 02/21/08 1. Comment 1. 2. Comment 2. Analyst Date Reviewer Date

GLO-3180-035 Revision No. 7
October 2016 Page 24 of 26
GLO3180-035_ R7 Amec Foster Wheeler Environment & Infrastructure, Inc.
ATTACHMENT B Mass Analyses Batch Format
(See also Attachment E of GLM3180-002 for PM2.5 analyses)
Batch: Date: Room Temp.: Humidity: Please note the following observations for filters in this batch: Sample Name (Filter #) Code and description (repeat this information for all samples identified with a code). Note: The following filters are field blanks: Sample Name (Filter #), …. Analyst Signature: Date: Reviewer Signatures: Date: Date: Date:

GLO-3180-035 Revision No. 7
October 2016 Page 25 of 26
GLO3180-035_ R7 Amec Foster Wheeler Environment & Infrastructure, Inc.
ATTACHMENT C Example Batch Update Request Form
Batch #: By: Date:
Request Justification:
Status Changed By: Date:
Changes Made By: Date:
Updates Reviewed By: Date:
Date:
Status Changed By: Date :

GLO-3180-035 Revision No. 7
October 2016 Page 26 of 26
GLO3180-035_ R7 Amec Foster Wheeler Environment & Infrastructure, Inc.
ATTACHMENT D Revisions Table
Table - Revisions Document Revision No. Section Revision
Appendix 1 Attachment D
Addition of this table
Figure 2 Updated Dionex Chromeleon 6.8 Data Export Screenshot
3.1.1.5 Text changed to: G:\GNVCASTNET\ELEMENT\AutoWeight Export files
4.0 3.2 (*.csv) changed to (*filename Dtool.xls) 3.4.5.1 Lowercase amec changed to AMEC 3.4.5.2 Lowercase amec changed to AMEC 3.4.5.3 Lowercase amec changed to AMEC 3.4.5.4 Lowercase amec changed to AMEC
5.0 Attachment D Corrected reference in revisions table row 1. All Chromeleon 6.8 references updated to 7.2 except
where references are to external processor function names instead of the actual software.
3.1.1.1 The section referencing PeakNet 5.1 was replaced by Chromeleon 7.2.
6.0 3.3 Manual Entry batches was removed and a separate SOP for manual entry Element® created
Figures 6, 7, and 8 added 7.0 Signature page Remove Garry Price and add Kathy Barry as
Laboratory Operations Manager Update References


GLO-3180-036
Revision No. 2 May 2017
Page 2 of 10
GLO-3180-036_R2 Amec Foster Wheeler
PROCEDURE FOR GENERATION OF CONTROL CHARTS
1.0 PURPOSE
The purpose of this standard operating procedure (SOP) is to provide consistent guidance to the
Amec Foster Wheeler Environment & Infrastructure, Inc. (Amec Foster Wheeler) laboratory
personnel for generation of control charts for CASTNET and CASTNET-like projects.
2.0 SCOPE
This SOP applies to Laboratory Control Samples (LCS), Continuing Calibration Standards (CCV)
and Standard Reference Materials (SRM) analyzed at the Gainesville Laboratory. The charts
generated will be used as a tool to assist in detection of trends, bias or other problems at the bench
and for estimating uncertainty.
3.0 PROCEDURE
3.1 Chart generation
Charts will be generated quarterly by the 15th of the month following the end of the previous quarter
using data in the Laboratory Information Management System (LIMS). For example, the fourth
quarter of 2010 will be generated by 1/15/2011. New charts will start where the previous set ended.
3.1.1 Log into Element and access “Control Charts” under QA Admin (see Figure 1).
3.1.2 Select the appropriate analyte from the list on the left side of the screen.
3.1.3 Set the dates to cover a three month range starting with the day after the end of the last set
generated.
3.1.4 Select “All” for Data Points.
3.1.5 Query.
3.1.6 Right click on the graph and print.
3.1.7 LCS %R, SRM %R and CCV %R are printed for each analyte.
3.1.8 Annually, the same procedure will be used to export a minimum of 20 data points for the
estimation of uncertainty. Uncertainty will be defined as two times the standard deviation
(2σ) for each analyte (see Attachment E).
Note: Moving averages will not be calculated and limits will not be continually adjusted.
3.2 Analyst review
Copies of the charts will be maintained in each laboratory. The analyst will compare batch results
with charts to check for situations including, but not limited to:
Excursions beyond three standard deviations from the mean;
Five or more consecutive points increasing or decreasing;

GLO-3180-036
Revision No. 2 May 2017
Page 3 of 10
GLO-3180-036_R2 Amec Foster Wheeler
Step function changes (see Attachments C & D for examples).
FIGURE 1 Control Chart Screen in Element
3.3 Corrective actions
Suspect results will be reported to the Laboratory Operations Manager (LOM). Justification will be
documented in the data batch comments as per the LOM’s direction.
4.0 REFERENCES
U.S. Environmental Protection Agency (EPA). 2007. Guidance for the Preparation of Standard
Operating Procedures, (SOPs) for Quality-Related Documents. EPA/600/B-07/001, EPA
QA/G-6, US EPA, Washington, D.C. April

GLO-3180-036
Revision No. 2 May 2017
Page 4 of 10
GLO-3180-036_R2 Amec Foster Wheeler
5.0 ATTACHMENTS
Attachment A – SO4 Cellulose CCV
Attachment B – SO4 Cellulose LCS
Attachment C – SO4 Cellulose SRM
Attachment D – NO3 as N Teflon SRM
Attachment E - Uncertainty
Attachment F – Revisions Table

GLO-3180-036
Revision No. 2 May 2017
Page 5 of 10
GLO-3180-036_R2 Amec Foster Wheeler
ATTACHMENT A
SO4 Cellulose CCV

GLO-3180-036
Revision No. 2 May 2017
Page 6 of 10
GLO-3180-036_R2 Amec Foster Wheeler
ATTACHMENT B
SO4 Cellulose LCS

GLO-3180-036
Revision No. 2 May 2017
Page 7 of 10
GLO-3180-036_R2 Amec Foster Wheeler
ATTACHMENT C
SO4 Cellulose SRM

GLO-3180-036
Revision No. 2 May 2017
Page 8 of 10
GLO-3180-036_R2 Amec Foster Wheeler
ATTACHMENT D
NO3 as N Teflon SRM

GLO-3180-036
Revision No. 2 May 2017
Page 9 of 10
GLO-3180-036_R2 Amec Foster Wheeler
ATTACHMENT E
Uncertainty Values

GLO-3180-036
Revision No. 2 May 2017
Page 10 of 10
GLO-3180-036_R2 Amec Foster Wheeler
ATTACHMENT F
Revisions Table
Table - Revisions
Document Revision
No.
Section Revision
1.0
Signature page Remove Garry Price and add Kathy Barry as
Laboratory Operations Manager
All Update company name to Amec Foster Wheeler
4.0 Update references
Attachment B Addition of this table.
2.0
2.0 Added: “and estimation of uncertainty”
3.1 Added: 3.1.8 Exporting data for estimation of
uncertainty.
Attachment E Added: Uncertainty Values
Attachment F Revisions Table is now Attachment F


GLO-3180-037
Revision No. 2 May 2017
Page 2 of 5
GLO-3180-037_R2(labeling stds)R2 Amec Foster Wheeler
PROCEDURE FOR LABELING AND EXPIRATION OF STANDARDS
1.0 PURPOSE
The purpose of this standard operating procedure (SOP) is to provide consistent guidance to the
Amec Foster Wheeler Environment & Infrastructure, Inc. (Amec Foster Wheeler) laboratory
personnel for labeling and determining expiration dates for standards and reagents used in sample
preparation and quantitative sample analysis.
2.0 SCOPE
This SOP is a general guideline for determining expiration dates for standards, all dilutions of
standards, and reagents. This includes standards and reagents purchased or prepared for use on all
projects at Amec Foster Wheeler.
3.0 PROCEDURE
3.1 Vendor prepared standards and reagents
Standards and reagents purchased from vendors should have an expiration date on the label or
certificate of analysis. If the vendor does not supply an expiration date for a reagent, the lab will
use a date of five years from receipt.
All reagents received from vendors must have a Certificate of Analysis (see Attachment A). The
date received and receiving analyst initials will be recorded on the original certificate. If applicable,
the new standard will be entered in the Element DataSystem® (see GLO-3180-035 section 3.4) and
assigned a unique Element ID. The Element ID is also recorded on the original certificate.
3.2 Lab prepared solutions
Inorganic analyte calibration and quality control solutions for Ion Chromatography (IC) and
Inductively Coupled Argon Plasma-Optical Emission Spectrometry (ICP-OES) will have an
expiration date one month after preparation.
Stock conductivity solutions with a concentration of 0.05 molar (M), or greater, will have an
expiration date of one year from preparation.
Working conductivity solutions with a concentration less than 0.05 M will have an expiration date
of six months from preparation.
Concentrated eluents will have an expiration of one year from preparation.
Extraction solutions and working eluents will have an expiration of one month from preparation.

GLO-3180-037
Revision No. 2 May 2017
Page 3 of 5
GLO-3180-037_R2(labeling stds)R2 Amec Foster Wheeler
3.3 Labeling
All vendor prepared standards and reagents and lab prepared solutions will be labeled with date
received/prepared, date opened and expiration date. The analyst receiving/preparing and opening
should also include their initials. See Figure 1 for an example of the label that can be affixed to the
bottle.
Figure 1 Bottle Label
4.0 REFERENCES
U.S. Environmental Protection Agency (EPA). 2007. Guidance for the Preparation of Standard
Operating Procedures, (SOPs) for Quality-Related Documents. EPA/600/B-0//001, EPA
QA/G-6, US EPA, Washington, D.C. April.
6.0 ATTACHMENTS
Attachment A – Certificate of Analysis
Attachment B – Revisions Table

GLO-3180-037
Revision No. 2 May 2017
Page 4 of 5
GLO-3180-037_R2(labeling stds)R2 Amec Foster Wheeler
ATTACHMENT A
Certificate of Analysis

GLO-3180-037
Revision No. 2 May 2017
Page 5 of 5
GLO-3180-037_R2(labeling stds)R2 Amec Foster Wheeler
ATTACHMENT B
Revisions Table
Table - Revisions
Document Revision
No.
Section Revision
1.0
Signature page Remove Garry Price and add Kathy Barry as
Laboratory Operations Manager
All Update company name to Amec Foster Wheeler
Update “atomic emission” to “optical emission”
4.0 Update references
Attachment B Addition of this table.
2.0
3.1 Added requirement for Certificate of Analysis
3.2 Added expiration requirements for extraction
solutions and eluents.
Attachment A Added Certificate of Analysis
Attachment B Revisions Table is now Attachment B


GLO-3180-038 Revision No. 2
October 2016 Page 2 of 5
GLO3180-038_R2 Amec Foster Wheeler
PROCEDURE FOR CALIBRATION OF PIPETTORS
1.0 PURPOSE
The purpose of this standard operating procedure (SOP) is to provide consistent guidance to the Amec Foster Wheeler Environment & Infrastructure, Inc. (Amec Foster Wheeler) laboratory personnel for calibrating pipettors.
2.0 SCOPE
This SOP is applicable to all pipettors which are used to prepare solutions used by the laboratory.
3.0 MATERIALS
• Pipettor, adjustable or fixed. • Analytical balance capable of accurately weighing to the nearest 0.0001 gram (g) • Weigh boat or disposable beaker.
4.0 PROCEDURE
4.1 Pipettors must be calibrated each day of use. 4.2 Calibration is performed as follows: 4.2.1 Place a weigh boat or disposable cup on the analytical balance and tare the balance. 4.2.2 Using the pipettor to be calibrated, draw the needed volume of deionized water. 4.2.3 Release the deionized water into the tared weigh boat. Record the weight in the appropriate notebook for the balance (see Attachment A). 4.2.4 Tare the weight again and repeat steps 4.2.2 and 4.2.3 two more times, recording the weight each time. 4.2.5 Three consecutive weights must be within criteria for the pipettor to be considered calibrated. 4.3 The pipettor is acceptable if the calibration shows that they can deliver within a +/- 1% accuracy. For example, a pipettor calibrated to one mL, must deliver a volume between 0.9900 and 1.0100 mL to be acceptable. 4.4 If the pipettor fails criteria and is adjustable, it should be adjusted and the procedure repeated until the three weights are within criteria. 4.5 If the pipettor is not adjustable and fails criteria or an adjustable pipettor that can not be properly calibrated, it must be removed from service.
GLO-3180-038 Revision No. 2
October 2016 Page 3 of 5
GLO3180-038_R2 Amec Foster Wheeler
5.0 REFERENCES
U.S. Environmental Protection Agency (EPA). 2007. Guidance for the Preparation of Standard Operating Procedures, (SOPs) for Quality-Related Documents. EPA/600/B-07/001, EPA QA/G-6, US EPA, Washington, D.C. April
6.0 ATTACHMENTS
Attachment A – Example Logbook Page
Attachment B – Revisions Table
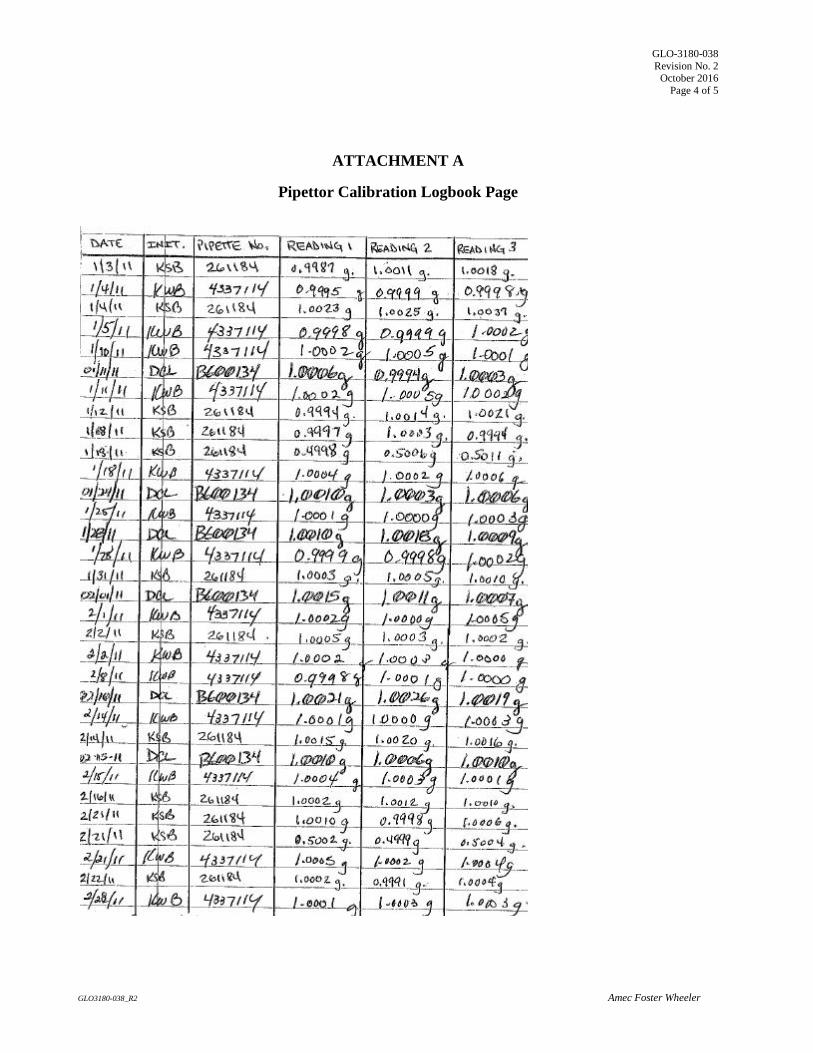
GLO-3180-038 Revision No. 2
October 2016 Page 4 of 5
GLO3180-038_R2 Amec Foster Wheeler
ATTACHMENT A
Pipettor Calibration Logbook Page

GLO-3180-038 Revision No. 2
October 2016 Page 5 of 5
GLO3180-038_R2 Amec Foster Wheeler
ATTACHMENT B Revisions Table
Table - Revisions
Document Revision No.
Section Revision
2.0
Signature page Remove Garry Price and add Kathy Barry as Laboratory Operations Manager
All Update company name to Amec Foster Wheeler 5.0 Update references
Attachment B Addition of this table.


![HYBRID PARTICLE-FINITE ELEMENT …...century [1,2], liquid crystals have generated a widespread interest from physical scientists involved in areas such as soft condensed matter, cosmology](https://static.documents.pub/doc/80x56/5f0c6cf77e708231d43556c7/hybrid-particle-finite-element-century-12-liquid-crystals-have-generated.jpg)


![Welcome [] · Fonts: Helvetica, Zapf Chancery, Zapf Dingbats, Garamond Ultra, Garamond Bold Condensed, Garamond Book Condensed, Garamond Bold Condensed Italic, Garamond Book Condensed](https://static.documents.pub/doc/80x56/6012d296ce02d15e58711fea/welcome-fonts-helvetica-zapf-chancery-zapf-dingbats-garamond-ultra-garamond.jpg)
