423
APPENDIX 4.2 AIR QUALITY AND HUMAN HEALTH RISK ASSESSMENT

APPENDIX 4.2 AIR QUALITY AND HUMAN HEALTH RISK ASSESSMENT

APPENDIX 4.2.1 Air Quality and Health Risk Assessment Technical Report
for the Inglewood Transit Connector Project, RCH Group, September 2020

Air Quality and Heath Risk Assessment Technical Report for the Inglewood Transit Connector Project
PREPARED BY:
RCH Group 11060 White Rock Road, Suite 150-A
Rancho Cordova, CA 95670 Contact: Mike Ratte, Senior Air Quality Scientist
PREPARED FOR:
Meridian Consultants, LLC 920 Hampshire Road, Suite A5
Westlake Village, CA 91361
November 17, 2020

TABLE OF CONTENTS
Section Page
1.0 Introduction ..................................................................................................................................... 1 2.0 Project Overview .............................................................................................................................. 2 3.0 Analysis Methodology ...................................................................................................................... 6 4.0 Existing Conditions ........................................................................................................................... 7 5.0 Regulatory Context ........................................................................................................................ 11 6.0 Thresholds of Significance ............................................................................................................. 19 7.0 Mitigation Measures ...................................................................................................................... 21 8.0 Construction Emissions Inventory ................................................................................................. 25 9.0 Ambient Air Concentration Impacts .............................................................................................. 38 10.0 Health Risk Assessment ................................................................................................................. 46 11.0 Greenhouse Gas Emissions ............................................................................................................ 57 12.0 Operational Emissions Inventory ................................................................................................... 65 13.0 Summary ........................................................................................................................................ 76
Attachments
Attachment A: Air Quality Dispersion Modeling Methodology and Assumptions
Attachment B: Health Risk Assessment Methodology and Assumptions
Attachment C: Supplemental Health Impact Information (Friant Ranch Case)
Attachment D: TIRCP GHG Benefits Calculator Tool Memo
Attachment E: Operational Air Emissions Inventory

RCH Group Page 1 of 76 November 17, 2020
AIR QUALITY AND HEALTH RISK ASSESSMENT TECHNICAL REPORT
1.0 INTRODUCTION
This document presents the Air Quality and Health Risk Assessment Technical Report associated with the
proposed Inglewood Transit Connector (proposed Project) in Inglewood, California.
To support the Inglewood Transit Connector Environmental Impact Report (EIR), three analyses were
conducted: construction emissions inventories, dispersion modeling to support an ambient air quality
standards analysis, and a health risk assessment (HRA). The ambient air quality standards analysis and HRA
results are presented for both the Morning/Evening and Morning/Night construction scenarios (as
described in the ITC Construction Scenario, June 2020). The analyses provide an estimate of the air
emissions associated with the construction (off-road equipment along the proposed Project’s alignment
including the guideway, stations, and support facility sites, and off-site truck travel for the removal of
debris and soils excavated during demolition and construction along nearby roadways) of the proposed
Project. The potential air quality and health impacts that would result construction of the proposed Project
have also been identified.
The supporting information, methodology, and assumptions used in the construction air emissions
inventory, air quality dispersion modeling, HRA, and operational air emissions inventory are provided in:
• Attachment A: Air Quality Dispersion Modeling Methodology and Assumptions,
• Attachment B: Health Risk Assessment Methodology and Assumptions,
• Attachment C: Supplemental Health Impact Information,
• Attachment D: TIRCP GHG Benefits Calculator Tool Memo, and
• Attachment E: Operational Air Emissions Inventory.
Air quality impacts were determined for United States Environmental Protection Agency (USEPA) criteria
pollutants such as carbon monoxide (CO), nitrogen dioxide (NO2), sulfur dioxide (SO2), particulate matter
less than 10 micrometers (coarse particulate or PM10), and particulate matter less than 2.5 micrometers
(fine particulate or PM2.5). The air quality analysis was developed based on the South Coast Air Quality
Management District (SCAQMD) Modeling Guidance for AERMOD,1 the USEPA Guideline on Air Quality
1 South Coast Air Quality Management District, SCAQMD Modeling Guidance for AERMOD, Accessed July 7, 2020 at: https://www.aqmd.gov/home/air-quality/meteorological-data/modeling-guidance.

Air Quality and Health Risk Assessment Technical Report
RCH Group Page 2 of 76 November 17, 2020
Models,2 and the SCAQMD Air Quality Handbook.3 The air quality analyses were conducted to determine
the air quality impacts, in terms of ambient pollutant concentrations, using the significance levels
identified by SCAQMD.4
The HRA focuses on impacts on existing residences and other sensitive populations from emissions of toxic
air contaminants (TAC)5 such as diesel particulate matter (DPM)6 emissions from construction equipment
and haul trucks associated with the proposed Project construction activities. The HRA was conducted to
determine the health impacts, in terms of excess cancer risk and noncancer hazards, using the significance
levels identified by the SCAQMD.7 The HRA was prepared based on the California Office of Environmental
Health Hazard Assessment (OEHHA)’s Air Toxics Hot Spots Program Guidance Manual for Preparation of
Health Risk Assessments8 and SCAQMD’s Risk Assessment Procedures for Rule 1401, 1401.1 and 212.9
2.0 PROJECT OVERVIEW
The proposed Project would provide a transit connection from the Metro Crenshaw/LAX Line in Downtown
Inglewood to the Los Angeles Stadium and Entertainment District (LASED) area and would be designed to
integrate with local economic activity, transit-oriented development, and other initiatives in the area. Up
to three stations are proposed at the following locations: (1) Market Street near Florence Avenue in the
vicinity of the Metro Crenshaw/LAX Line Downtown Inglewood Station; (2) near The Forum at Prairie
Avenue and Pincay Street; and (3) near the LASED at Hollywood Park at Prairie Avenue and Hardy Street
2 United States Environmental Protection Agency, Guideline on Air Quality Models (Revised), 40 Code of Federal Regulations, Part 51, Appendix W, November 2005, Accessed July 6, 2020 at: https://www3.epa.gov/scram001/guidance/guide/appw_05.pdf.
3 South Coast Air Quality Management District, CEQA Air Quality Handbook, Accessed July 6, 2020 at: http://www.aqmd.gov/home/rules-compliance/ceqa/air-quality-analysis-handbook.
4 South Coast Air Quality Management District, SCAQMD Air Quality Significance Thresholds, April 2019, Accessed July 6, 2020 at: http://www.aqmd.gov/ceqa/hdbk.html.
5 Toxic air contaminants (TAC) are a broad class of compounds known to cause morbidity or mortality. TAC are found in ambient air, especially in urban areas, and are caused by industry, agriculture, fuel combustion, and commercial operations (e.g., gasoline service stations, dry cleaners). TAC are typically found in low concentrations, even near their source (e.g., diesel particulate matter near a freeway). Because chronic exposure can result in adverse health effects, TAC are regulated at the regional, state, and Federal level.
6 In 1998, the California Air Resources Board classified diesel particulate matter as a toxic air contaminant, citing its potential to cause cancer and other health problems. The United States Environmental Protection Agency concluded that long-term exposure to diesel engine exhaust is likely to pose a lung cancer hazard to humans and can also contribute to other acute and chronic health effects.
7 South Coast Air Quality Management District, SCAQMD Air Quality Significance Thresholds, April 2019, Accessed July 6, 2020 at: http://www.aqmd.gov/ceqa/hdbk.html.
8 Office of Environmental Health Hazard Assessment, Air Toxics Hot Spots Program Guidance Manual for Preparation of Health Risk Assessments, February 2015, Accessed July 6, 2020 at: http://oehha.ca.gov/air/hot_spots/hotspots2015.html.
9 South Coast Air Quality Management District, Risk Assessment Procedures for Rule 1401, 1401.1 and 212, September 1, 2017, Accessed July 6, 2020 at: http://www.aqmd.gov/docs/default-source/permitting/rule-1401-risk-assessment/riskassessproc-v8-1.pdf?sfvrsn=12.

Air Quality and Health Risk Assessment Technical Report
RCH Group Page 3 of 76 November 17, 2020
The proposed Project would consist of an elevated, automated people mover (APM) system with dual
guideways to allow for continuous trains to travel in each direction. The Project extends from the
intersection with the Metro Crenshaw/LAX Line north of downtown Inglewood, southwest for
approximately a quarter of a mile to the intersection of Market Street and Regent Street, continue south
on Market Street, then east on Manchester Boulevard, turning south on Prairie Avenue until its
intersection with Hardy Street. Potential sites for Project support facilities are adjacent to the APM
alignment. Figure 1: Project Location Map shows the Project location and surrounding area. Construction
activities are expected to commence in the early 2022 and be completed in mid-2026.
The first phase would include the demolition of property acquisitions, building demolitions, utility
relocations, cast-in-place (CIP) columns and slabs, and foundations for the initial construction of the
Maintenance and Storage Facility (MSF). The first phase of construction would be the demolition of the
commercial property for the Market Street/Florence Avenue Station at the existing commercial center at
on the southeast corner of Market Street and Florence Avenue (approximately 137,525 SF), the existing
commercial plaza at 500 and 510 Manchester Boulevard (the Vons store and gas station; approximately
76,604 SF), and the commercial building at 150 South Market Street on the southeast corner of
Manchester and Market Street (approximately SF). Additional work in the area will commence in Phases
2 and 3 4for the completion of the aerial guideway construction of the APM and the three stations.
After the demolition, the remaining asphalt flatwork area within the lot will provide suitable space for
construction staging including but not limited to space for equipment storage, material staging and
storage, temporary concrete batch plants, if needed, contractor jobsite trailers, and on-site parking for
construction staff throughout the entire project duration. The first phase of construction would occur
between the early 2022 and the end of 2023 (including site preparation, staging, and cleanup).
The second phase would include enabling the construction sequence of the APM guideway along Prairie
Avenue from the Hardy Street intersection to Manchester Boulevard. This phase includes demolition,
utility relocations, foundations, CIP columns, straddle bents and the precast trapezoidal troughs and
girders, and the construction of the MSF. The second phase of construction would occur between early
2023 and early 2025 (including site preparation, staging, and cleanup).

Air Quality and Health Risk Assessment Technical Report
RCH Group Page 4 of 76 November 17, 2020
Figure 1 Project Location Map

Air Quality and Health Risk Assessment Technical Report
RCH Group Page 5 of 76 November 17, 2020
The third phase would include enabling the construction sequence of the APM guideway along
Manchester Boulevard from Prairie Avenue to Market Street, and Market Street from Manchester
Boulevard to Florence Avenue. The work will include an above-ground pedestrian access walkway to the
Metro Crenshaw/LAX Line’s Downtown Inglewood Station, property acquisitions, building demolition,
utility relocation, foundations, CIP columns, straddle bents and the precast trapezoidal troughs and
girders. This phase includes site work completion to the MSF. The third phase of construction would occur
between early 2024 and early 2026 (including site preparation, staging, and cleanup).
The fourth phase would include enabling the completion of the aerial construction elements including the
installation of the APM system’s operations, track work, station platform equipment and systems,
completion of the traction power substations, testing and commissioning of the full APM system,
completion of all surface construction activities including but not limited to all electrical, mechanical and
utilities energizations. Additional work in the area will commence in Phase 4 for the APM system
installation, testing and commissioning of the system. The fourth phase of construction would occur
between late 2025 and mid-2026 (including site preparation, staging, and cleanup).
The following presents the schedule under which use of construction equipment and haul trucks would
occur:
• Phase 1 (Demolition): April 15, 2022 – March 15, 2023
• Phase 1 (MSF Construction): February 2, 2023 – December 18, 2023
• Phase 2: March 24, 2023 – February 10, 2025
• Phase 3: February 14, 2024 – February 2, 2026
• Phase 4: October 31, 2025 – May 28, 2026
Construction activity would primarily occur over a 16 hour / day schedule with two shifts, both a morning
shift from approximately 7:00 AM to 3:00 PM and an evening shift from approximately 3:00 PM to 11:00
PM, or a morning shift from approximately 7:00 AM to 3:00 PM and a night shift from approximately 11:00
PM to 7:00 AM. Other minimal construction work could occur during other hours at a reduced intensity.
Delivery of construction materials would occur during the night shift, as would most lane closures. These
shifts are intended to minimize impacts to daily commuter traffic and potential event traffic. Delivery of
construction materials would occur during the night shift, as would most lane closures.
Pursuant to Section 5-41 of the Inglewood Municipal Code, construction between the hours of 8:00 PM.
and 7:00 AM of the next day will require a permit from the Permits and License Committee of the City. The
proposed Project would secure a permit(s) from the Permits and License Committee to allow for

Air Quality and Health Risk Assessment Technical Report
RCH Group Page 6 of 76 November 17, 2020
construction work activities to occur between the hours of 8:00 PM and 7:00 AM. The ambient air quality
standards analysis and HRA results are presented for both the Morning/Evening and Morning/Night
construction scenarios.
3.0 ANALYSIS METHODOLGY
Intermittent, short-term construction emissions that occur from activities such as demolition, site-grading,
and concrete construction were evaluated. Regulatory models used to estimate air quality and health
impacts include:
• California Air Resources Board’s (CARB) EMFAC201710 emissions inventory model. EMFAC2017 is the latest emission inventory model that calculates emission inventories and emission rates for motor vehicles operating on roads in California. This model reflects CARB’s current understanding of how vehicles travel and how much they emit. EMFAC2017 can be used to show how California motor vehicle emissions have changed over time and are projected to change in the future.
• CARB OFFROAD201711 emissions inventory model. OFFROAD is the latest emission inventory model that calculates emission inventories and emission rates for off-road equipment such as loaders, excavators, and off-road haul trucks operating in California. This model reflects CARB’s current understanding of how equipment operates and how much they emit. OFFROAD can be used to show how California off-road equipment emissions have changed over time and are projected to change in the future.
• American Meteorological Society/USEPA Regulatory Model (AERMOD). AERMOD (Version 19191) is an atmospheric dispersion model which can simulate point, area, volume, and line emissions sources and has the capability to include simple, intermediate, and complex terrain along with meteorological conditions and multiple receptor locations.12,13 AERMOD is commonly executed to yield 1-hour maximum and annual average concentrations (in parts per million or ppm and micrograms per cubic meter or µg/m3) at each receptor. AERMOD is used to estimate air concentrations at nearby receptors resulting from the activities associated with an air emission source (such as construction equipment).
10 California Air Resources Board, EMFAC2017 User’s Guide, March 1, 2018, Accessed July 6, 2020 at: https://ww3.arb.ca.gov/msei/downloads/emfac2017-volume-i-users-guide.pdf and https://www.arb.ca.gov/emfac/2017/
11 California Air Resources Board, OFFROAD Instructions, Accessed July 6, 2020 at: http://www.arb.ca.gov/msprog/ordiesel/info_1085/oei_write_up.pdf and https://www.arb.ca.gov/orion/
12 United States Environmental Protection Agency Preferred/Recommended Models, AERMOD Modeling System, Accessed July 6, 2020 at: https://www.epa.gov/scram/air-quality-dispersion-modeling-preferred-and-recommended-models#aermod.
13 Title 40 CFR Part 51, Revision to the Guideline on Air Quality Models: Adoption of a Preferred General Purpose (Flat and Complex Terrain) Dispersion Model and Other Revisions; Final Rule, Accessed July 6, 2020 at: http://www.epa.gov/ttn/scram/guidance/guide/appw_05.pdf.

Air Quality and Health Risk Assessment Technical Report
RCH Group Page 7 of 76 November 17, 2020
4.0 EXISTING CONDITIONS
The proposed Project is located in Los Angeles County (County) within the South Coast Air Basin (SCAB or
Basin). The Basin is bounded by the Pacific Ocean to the west and the San Gabriel, San Bernardino, and
San Jacinto Mountains to the north and east. The Basin includes all of Orange County and the non-desert
portions of Los Angeles, Riverside, and San Bernardino counties.
Regional Meteorology
Air quality is affected by the rate, amount, and location of pollutant emissions and the associated
meteorological conditions that influence pollutant movement and dispersal. Atmospheric conditions,
including wind speed, wind direction, stability, and air temperature, in combination with local surface
topography (i.e., geographic features such as mountains, valleys, and Pacific Ocean), determine the effect
of air pollutant emissions on local air quality.
In general, Southern California has a warm, dry Mediterranean climate; hot in the summer and mild in the
winter. Temperatures are cooler near the coast and hotter near inland areas. Most of the precipitation
occurs as rain during the winter months, although rain showers are common during the summer in higher-
elevation desert areas. Average annual precipitation is approximately 19 inches and temperatures reach
90 degrees Fahrenheit 100 days of the year on average. August daily highs average 95 degrees while daily
lows average 64 degrees Fahrenheit. January typically exhibits average daily highs of 68 degrees and
average daily lows of 43 degrees Fahrenheit. The predominant wind directions are either out of the
northwest or southeast. Gusts greater than 15 miles per hour occur infrequently, less than two percent of
the time.
Basin climate increases the potential to create air pollution problems. Air quality within the Basin generally
rates from fair to poor. Sinking or subsiding air from the Pacific High-Pressure System creates a
temperature inversion (known as a subsidence inversion), which acts as a lid to vertical movement of air
masses and dispersion of pollutants. The lower bound of this inversion at any given time is known as the
“mixing height.” Restricted maximum mixing heights are 3,500 feet above sea level or less. Weak
summertime pressure gradients suppress winds and further limit horizontal dispersion of pollutants in the
mixed layer below the subsidence inversion. Poorly dispersed anthropogenic (human-made) emissions,
combined with strong sunshine, lead to photochemical reactions that create ozone (O3) in this surface
layer. Daytime onshore air flow (i.e., sea breeze) and nighttime offshore flow (i.e., land breeze) are quite
common in Southern California. The sea breeze helps to moderate daytime temperatures and leads to air
pollutants being blown out to sea at night and returning to land the following day.

Air Quality and Health Risk Assessment Technical Report
RCH Group Page 8 of 76 November 17, 2020
Nearby Sensitive Receptors
Land uses such as schools, children’s daycare centers, hospitals, and convalescent homes are considered
to be more sensitive than the general public to poor air quality because the population groups associated
with these uses have increased susceptibility to respiratory distress. Persons engaged in strenuous work
or exercise also have increased sensitivity to poor air quality. The CARB and SCAQMD has identified the
following people as most likely to be affected by air pollution: children less than 14 years of age, the elderly
over 65 years of age, athletes, and those with cardiovascular and chronic respiratory diseases. These
groups are classified as sensitive population groups.
Residential areas are considered more sensitive to air quality conditions than commercial and industrial
areas because people generally spend longer periods of time at their residences, resulting in greater
exposure to ambient air quality conditions. Recreational uses are also considered sensitive, due to the
greater exposure to ambient air quality conditions and because the presence of pollution detracts from
the recreational experience. Off-site workers are also considered sensitive receptors by the SCAQMD.
Local Air Quality
The SCAQMD maintains a network of monitoring stations within the Air Basin that monitor air quality and
compliance with applicable ambient standards. The nearest air monitoring station which measures CO,
NO2, SO2, and PM10 is located near Los Angeles International Airport (7201 West Westchester Parkway,
Southwest Coastal LA County, Station 820), four miles to the west of the Project alignment. The nearest
air monitoring station which measures PM2.5 is located in central Los Angeles (1630 North Main Street,
Central LA, Station 087), ten miles to the northeast of the Project alignment.
Table 1: Air Quality Data Summary summarizes the most recent three years of data (2017 through 2019)
from the nearby air monitoring stations. The ozone standard was not exceeded. The State annual PM10
standard was exceeded in 2018 and the State 24-hour PM10 standard was exceeded in 2019. The State
annual PM2.5 standard was exceeded in 2018 and the State 24-hour PM2.5 standard was exceeded in 2019.
No other exceedances were observed at the nearby air monitoring stations in 2017 through 2019.

Air Quality and Health Risk Assessment Technical Report
RCH Group Page 9 of 76 November 17, 2020
Table 1 Air Quality Data Summary (2017 - 2019)
Pollutant
Monitoring Data by Year
Standards 2017 2018 2019
Ozone Highest 1 Hour Average (ppm) 0.09 0.086 0.074 0.082 Days over State Standard — 0 0 0 Highest 8 Hour Average (ppm) 0.070 0.070 0.065 0.067 Days over National Standard — 0 0 0 Days over State Standard — 0 0 0 Nitrogen Dioxide Highest 1 Hour Average (ppm) 0.180/0.100 0.072 0.060 0.057 Days over State Standard — 0 0 0 Annual Average (ppm) 0.030/0.053 0.009 0.009 0.010 Carbon Monoxide Highest 1 Hour Average (ppm) 20.0 2.1 1.8 1.8 Days over State Standard — 0 0 0 Highest 8 Hour Average (ppm) 9.0 1.6 1.5 1.3 Days over State Standard — 0 0 0 Particulate Matter (PM10) Highest 24 Hour Average (µg/m3) 50 46 45 62 Days over State Standard — 0 0 2 State Annual Average (µg/m3) 20 19.8 20.5 19.2 Particulate Matter (PM2.5) Highest 24 Hour Average (µg/m3) 35 27.8 30.5 43.5 Days over National Standard — 0 0 1 State Annual Average (µg/m3) 12 11.9 12.6 10.9
Notes: Values in bold are in excess of at least one applicable standard. Generally, State and national standards are not to be exceeded more than once per year. ppm = parts per million; µg/m3 = micrograms per cubic meter. PM10 is not measured every day of the year. Number of estimated days over the standard is based on 365 days per year. Source: South Coast Air Quality Management District, Annual Air Quality Summaries, Accessed July 7, 2020 at:
http://www.aqmd.gov/home/air-quality/air-quality-data-studies/historical-data-by-year.

Air Quality and Health Risk Assessment Technical Report
RCH Group Page 10 of 76 November 17, 2020
Adjusted Baseline
The Hollywood Park Specific Plan (HPSP) project is located adjacent to the project site. Related to air
quality, the changes associated with the HPSP Adjusted Baseline, currently under development and/or
operational, include operational air emissions associated with new uses in the HPSP area. The HPSP
Adjusted Baseline would emit air pollutants associated with vehicle trips, maintenance operations, energy
consumption from all of its operational land uses. Specifically, vehicle trips associated with activities at
the HPSP began taking place during 2020 when the NFL Stadium began operations and uses are operating
on the site and have an impact on local and regional air quality. Accordingly, the air pollutant emissions
associated with the HPSP area were considered as part of an Adjusted Baseline.
Regional air emissions from the Proposed Project were assessed based on the incremental increase in
emissions compared to existing conditions (that is, project-related), consistent with SCAQMD
methodology. This methodology measures the incremental project contributions only and compares to
project-level significance thresholds and so the Adjusted Baseline conditions are not relevant to the mass
emissions threshold (Section 8).
The localized air quality analysis includes the Proposed Project impacts on local air quality concentrations
of PM10 and PM2.5. However, given the regional nonattainment status, the significance threshold is also
only a project-related impact analysis. Thus, the Adjusted Baseline is not relevant to the PM10 and PM2.5
localized air quality analysis for the Proposed Project (Section 9).
However, the localized air quality analysis includes the Proposed Project impacts on local air quality
concentrations of CO, SO2, and NO2. The project-related concentrations would be added to the existing
concentration from a nearby monitoring station. The Adjusted Baseline would emit air pollutants
associated with vehicle trips, maintenance operations, energy consumption from all of its operational land
uses concurrently during Proposed Project construction. Specifically, Adjusted Baseline activities would
begin taking place during 2020 when the NFL Stadium begins operations and uses are operating on the
site and would have an impact on local and regional air quality (which would not be accounted for in the
existing monitoring data). Therefore, the project-related concentrations would be added to the existing
concentration from a nearby monitoring station plus the concentrations associated with the Adjusted
Baseline and the total would be compared to the CO, SO2, and NO2 NAAQS and CAAQS (Section 9).
The health impacts are also based on the maximum project-level incremental impact compared to a
project-level significance thresholds (that is, does the project itself contributed significantly to the local
health of nearby receptors). For this reason, the Adjusted Baseline is not relevant to the health impact
analysis for the Proposed Project (Section 10).

Air Quality and Health Risk Assessment Technical Report
RCH Group Page 11 of 76 November 17, 2020
Similarly, although the Adjusted Baseline has been constructed and in operation prior to start of
construction of the Proposed Project, its potential impact on global emissions would not affect the
threshold of significance or the impact analysis regarding GHG emissions from the Proposed Project
(which is also based on project-level incremental contribution). For this reason, the Adjusted Baseline is
not relevant to the GHG impact analysis for the Proposed Project (Section 11).
5.0 REGULATORY CONTEXT
USEPA has established the National Ambient Air Quality Standards (NAAQS) under the Clean Air Act (CAA)
for six common air pollutants known as “criteria pollutants.”14 These air pollutants consist of CO, NO2,
ozone (O3), particulate matter (PM10 and PM2.5), SO2, and lead (Pb). An ambient air quality standard
establishes the concentration above which the pollutant is known to cause adverse health effects to
sensitive groups within the population such as children and the elderly. Ambient air quality standards are
classified as either “primary” or “secondary” standards. Primary standards define levels of air quality,
including an adequate margin of safety, necessary to protect the public health. Secondary ambient air
quality standards define levels of air quality necessary to protect the public welfare from any known or
anticipated adverse effects of a pollutant. The ambient air quality standards are shown in Table 2: State
and National Criteria Air Pollutant Standards, Effects, and Sources.
Under the federal CAA, USEPA designate air basins where NAAQS are exceeded as “nonattainment” areas.
If standards are met, the area is designated as an “attainment” area. If there are inadequate or
inconclusive data to make a definitive attainment designation, they are considered “unclassified.” Areas
where air pollution levels persistently exceed the State or national ambient air quality standards are
designated "nonattainment.” Federal nonattainment areas are further designated as marginal, moderate,
serious, severe, or extreme as a function of deviation from standards. The South Coast Air Basin portion
of the County is in nonattainment status for the federal ozone, lead, and PM2.5; and in attainment for the
federal CO, NO2, SO2, and PM10.15
CARB manages air quality, regulates mobile emissions sources, and oversees the activities of county and
regional Air Pollution Control Districts and Air Quality Management Districts. CARB regulates local air
quality indirectly by establishing State ambient air quality standards and vehicle emissions and fuel
standards; and by conducting research, planning and coordinating activities. California has adopted
ambient standards (known as California Ambient Air Quality Standards or CAAQS) that are more stringent
14 United States Environmental Protection Agency, Six Common Air Pollutants, Accessed July 6, 2020 at: https://www.epa.gov/criteria-air-pollutants.
15 United States Environmental Protection Agency, The Green Book Nonattainment Areas for Criteria Pollutants, Accessed July 6, 2020 at: https://www.epa.gov/green-book.

Air Quality and Health Risk Assessment Technical Report
RCH Group Page 12 of 76 November 17, 2020
than the federal standards for some criteria air pollutants. Under the California Clean Air Act patterned
after the CAA, areas have been designated as attainment or nonattainment with respect to the State
standards. The South Coast Air Basin portion of the County is in nonattainment status for the State ozone,
PM10, and PM2.5; and is in attainment status for CO, NO2, and SO2.16, 17
The SCAQMD has jurisdiction over an area of approximately 10,743 square miles. The South Coast Air
Basin is a sub-region of the SCAQMD jurisdiction. While air quality in this area has improved, the Basin
requires continued diligence to meet air quality standards. The SCAQMD has adopted a series of Air
Quality Management Plans to meet the CAAQS and NAAQS. These plans require control technology for
existing sources, control programs for area sources and indirect sources, a SCAQMD permitting system
designed to allow no net increase in emissions from any new or modified permitted emission sources and
transportation control measures.
On March 3, 2017, the SCAQMD adopted the 2016 Air Quality Management Plan (AQMP) which includes
strategies and measures needed to meet the NAAQS. The AQMP demonstrates attainment of the ozone
NAAQS as well as the latest PM2.5 standards.18 The SCAQMD also adopts rules and regulations to
implement portions of the AQMP. On October 1, 2015, the USEPA strengthened the NAAQS for ground-
level ozone, lowering the primary and secondary ozone standard levels to 70 ppb. The South Coast Air
Basin is classified as an “extreme” nonattainment area and the Coachella Valley is classified as a “severe-
15” nonattainment area for the 2015 Ozone NAAQS. The upcoming 2022 AQMP will be developed to
address the requirements for meeting this standard. For the proposed Project, the relevant SCAQMD rules
and regulations include:
• Rules 201 and 203 (Permits to Construct and Operate): These rules require that owners of applicable construction or operation equipment obtain written permits from the SCAQMD prior to construction and operation.
16 California Air Resources Board, Area Designations Maps/State and National, Accessed July 6, 2020 at: http://www.arb.ca.gov/desig/adm/adm.htm.
17 South Coast Air Quality Management District, NAAQS and CAAQS Attainment Status for the South Coast Air Basin, February 2016, Accessed July 6, 2020 at: http://www.aqmd.gov/docs/default-source/clean-air-plans/air-quality-management-plans/naaqs-caaqs-feb2016.pdf.
18 South Coast Air Quality Management District, 2016 Air Quality Management Plan, March 1, 2017, Accessed July 6, 2020 at: http://www.aqmd.gov/home/air-quality/clean-air-plans/air-quality-mgt-plan.

Air Quality and Health Risk Assessment Technical Report
RCH Group Page 13 of 76 November 17, 2020
Table 2 State and National Criteria Air Pollutant Standards, Effects, and Sources
_______________ Source: Air Quality Standards, https://ww2.arb.ca.gov/resources/background-air-quality-standards.
Pollutant Averaging
Time State
Standard National Standard Pollutant Health and Atmospheric Effects Major Pollutant Sources
Ozone 1 Hour 8 Hour
0.09 ppm 0.07 ppm
– 0.070 ppm
High concentrations can directly affect lungs, causing irritation. Long–term exposure may cause damage to lung tissue.
Formed when reactive organic gases and nitrogen oxides react in the presence of sunlight. Major sources include on–road motor vehicles, solvent evaporation, and commercial / industrial mobile equipment.
Carbon Monoxide
(CO)
1 Hour 8 Hour
20 ppm 9.0 ppm
35 ppm 9.0 ppm
Classified as a chemical asphyxiant, carbon monoxide interferes with the transfer of fresh oxygen to the blood and deprives sensitive tissues of oxygen.
Internal combustion engines, primarily gasoline–powered motor vehicles.
Nitrogen Dioxide (NO2)
1 Hour Annual
0.18 ppm 0.03 ppm
0.10 ppm 0.053 ppm
Irritating to eyes and respiratory tract. Colors atmosphere reddish–brown.
Motor vehicles, petroleum–refining operations, industrial sources, aircraft, ships, and railroads.
Sulfur Dioxide
(SO2)
1 Hour 3 Hour 24 Hour Annual
0.25 ppm – 0.04 ppm –
0.075 ppm 0.5 ppm 0.14 ppm 0.030 ppm
Irritates upper respiratory tract; injurious to lung tissue. Can yellow the leaves of plants, destructive to marble, iron, and steel. Limits visibility and reduces sunlight.
Fuel combustion, chemical plants, sulfur recovery plants, and metal processing.
Respirable Particulate
Matter (PM10)
24 Hour Annual
50 µg/m3 20 µg/m3
150 µg/m3 –
May irritate eyes and respiratory tract, decreases in lung capacity, cancer and increased mortality. Produces haze and limits visibility.
Dust and fume–producing industrial and agricultural operations, combustion, atmospheric photochemical reactions, and natural activities (e.g., wind–raised dust and ocean sprays).
Fine Particulate
Matter (PM2.5)
24 Hour Annual
– 12 µg/m3
35.0 µg/m3 12.0 µg/m3
Increases respiratory disease, lung damage, cancer, and premature death. Reduces visibility and results in surface soiling.
Fuel combustion in motor vehicles, equipment, and industrial sources; residential and agricultural burning; Also, formed from photochemical reactions of other pollutants, including nitrogen oxides, sulfur oxides, and organics.
Lead (Pb) Month Rolling 3 Month
1.5 µg/m3 –
– 0.15 µg/m3
Disturbs gastrointestinal system, and causes anemia, kidney disease, and neuromuscular and neurological dysfunction.
Present sources: lead smelters, battery manufacturing & recycling facilities. Past source: combustion of leaded gasoline.

Air Quality and Health Risk Assessment Technical Report
RCH Group Page 14 of 76 November 17, 2020
• Rule 402 (Nuisance): This rule states that a person shall not discharge from any source whatsoever such quantities of air contaminants or other material which cause injury, detriment, nuisance, or annoyance to any considerable number of persons or to the public, or which endanger the comfort, repose, health or safety of any such persons or the public, or which cause, or have a natural tendency to cause, injury or damage to business or property.
• Rule 403 (Fugitive Dust): This rule requires fugitive dust sources to implement Best Available Control Measures for all sources, and all forms of visible particulate matter are prohibited from crossing any property line. SCAQMD Rule 403 is intended to reduce PM10 emissions from any transportation, handling, construction, or storage activity that has the potential to generate fugitive dust.
• Rule 1113 (Architectural Coatings): This rule requires manufacturers, distributors, and end-users of architectural and industrial maintenance coatings to reduce VOC emissions from the use of these coatings, primarily by placing limits on the VOC content of various coating categories.
• Rule 2202 (Employee Commute Reduction Program Guidelines): This rule is designed to assist employers in understanding the development and implementation requirements of the Employee Commute Reduction Program (ECRP) at their worksites. The ECRP focuses on reducing work related vehicle trips and vehicle miles traveled to a worksite with the purpose of achieving and maintaining the employers’ designated average vehicle ridership targets.
A fugitive dust control program pursuant to the provisions of SCAQMD Rules 402 and 403 shall be
implemented. This program shall include, but not be limited to the following:
• Prior to start of the initial on-site construction, the City Engineer shall confirm that the proposed construction plan is in compliance with SCAQMD Rule 403, fugitive dust shall be controlled by the applicable best available control measures listed in Table 1 of Rule 403.
• Water or a stabilizing agent shall be applied at least three times daily, preferably in the mid-morning, afternoon, and after work is done for the day, to exposed surfaces including graded and disturbed areas in sufficient quantity to prevent generation of dust plumes.
• Track-out shall not extend 25 feet or more from an active operation and track-out shall be removed at the conclusion of each workday. The contractor shall use a gravel apron, 25 feet long by road width, or a pipe-grid track-out control device to reduce mud/dirt track-out from active operations and unpaved truck exit routes.
• A wheel washing system shall be installed and used to remove bulk material from tires and vehicle undercarriages before vehicles exit the Project alignment.
• All trucks hauling dirt, sand, soil, or other loose materials are to be covered (e.g., with fabric tarps or other enclosures that would reduce fugitive dust emissions) and maintain a freeboard height of 12 inches, in accordance with California Vehicle Code Section 23114 (freeboard means vertical space between the top of the load and top of the trailer).
• Traffic speeds on unpaved roads shall be limited to 15 miles per hour.

Air Quality and Health Risk Assessment Technical Report
RCH Group Page 15 of 76 November 17, 2020
• Operations on unpaved surfaces shall be suspended when winds exceed 25 miles per hour.
• On-site stockpiles shall be covered or watered at least twice per day.
Criteria Air Pollutants
The following provides a brief summary of the potential health and welfare effects and typical sources of
each of the criteria air pollutants and air toxics.
Ozone
Ozone is a respiratory irritant and an oxidant that increases susceptibility to respiratory infections and that
can cause substantial damage to vegetation and other materials. O3 is not emitted directly into the
atmosphere but is a secondary air pollutant produced in the atmosphere through a complex series of
photochemical reactions involving volatile organic compounds (VOC) and NOx. VOC and NOx are known as
precursor compounds for O3. Substantial ozone production generally requires O3 precursors to be present
in a stable atmosphere with strong sunlight for approximately three hours. O3 is a regional air pollutant
because it is not emitted directly by sources but is formed downwind of sources of VOC and NOx under
the influence of wind and sunlight. O3 concentrations tend to be higher in the late spring, summer, and
fall, when long sunny days combine with regional air subsidence inversions to create conditions conducive
to the formation and accumulation of secondary photochemical compounds.
Carbon Monoxide
CO is a nonreactive pollutant that is a product of incomplete combustion of organic material, and is mostly
associated with motor vehicle traffic, and in wintertime, with wood–burning stoves and fireplaces. High
CO concentrations develop primarily during winter when periods of light winds combine with the
formation of ground–level temperature inversions (typically from the evening through early morning).
These conditions result in reduced dispersion of vehicle emissions. Motor vehicles also exhibit increased
CO emission rates at low air temperatures.
When inhaled at high concentrations, CO combines with hemoglobin in the blood and reduces its oxygen-
carrying capacity, resulting in reduced levels of oxygen reaching the brain, heart, and other body tissues.
This condition is especially critical for people with cardiovascular diseases, chronic lung disease, or anemia.
CO measurements and modeling were important in the early 1980s when CO levels were regularly
exceeded throughout California, but in more recent years, CO measurements and modeling are not a
priority in most California air districts due to the retirement of older vehicles, fewer emissions from new
vehicles, and improvements to fuels.

Air Quality and Health Risk Assessment Technical Report
RCH Group Page 16 of 76 November 17, 2020
Nitrogen Oxides
When combustion temperatures are extremely high, as in aircraft, truck and automobile engines,
atmospheric nitrogen combines with oxygen to form various oxides of nitrogen. Nitric oxide (NO) and NO2
are the most significant air pollutants generally referred to as NOx. Nitric oxide is a colorless and odorless
gas that is relatively harmless to humans, quickly converts to NO2 and can be measured. Nitrogen dioxide
has been found to be a lung irritant capable of producing pulmonary edema. Inhaling NO2 can lead to
respiratory illnesses such as bronchitis and pneumonia.
Volatile Organic Compounds
VOC means any compound of carbon, excluding carbon monoxide, carbon dioxide (CO2), carbonic acid,
metallic carbides or carbonates, and ammonium carbonate, which participates in atmospheric
photochemical reactions and thus, a precursor of ozone formation. VOC are any reactive compounds of
carbon, excluding methane, CO, CO2, carbonic acid, metallic carbides or carbonates, ammonium
carbonate, and other exempt compounds.
VOC include a variety of chemicals, some of which may have short- and long-term adverse health effects.
VOC are emitted by a wide array of products numbering in the thousands. Examples include paints and
lacquers, paint strippers, cleaning supplies, building materials and furnishings, as well as fuel storage and
use.
VOC can cause eye, nose, and throat irritation; headaches, loss of coordination, nausea; and damage to
liver, kidney, and central nervous system. Some organics can cause cancer in animals; some are suspected
or known to cause cancer in humans. The ability of organic chemicals to cause health effects varies greatly
from those that are highly toxic, to those with no known health effect. As with other pollutants, the extent
and nature of the health effect will depend on many factors including level of exposure and length of time
exposed. Eye and respiratory tract irritation, headaches, dizziness, visual disorders, and memory
impairment are among the immediate symptoms that some people have experienced soon after exposure
to some organics.
Particulate Matter
PM10 and PM2.5 consist of airborne particles that measure 10 micrometers or less in diameter and 2.5
micrometers or less in diameter, respectively. PM10 and PM2.5 represent fractions of particulate matter that
can be inhaled into the air passages and the lungs, causing adverse health effects. Particulate matter in
the atmosphere results from many kinds of dust- and fume-producing industrial and agricultural
operations, fuel combustion, wood burning stoves and fireplaces, and atmospheric photochemical
reactions. Some sources of particulate matter, such as demolition, construction activities and mining, are

Air Quality and Health Risk Assessment Technical Report
RCH Group Page 17 of 76 November 17, 2020
more local in nature, while others such as vehicular traffic and wood burning stoves and fireplaces, have
a more regional effect.
Very small particles of certain substances (e.g., sulfates and nitrates) can cause lung damage directly, or
can contain adsorbed gases (e.g., chlorides or ammonium) that may be injurious to health. Particulates
can also damage materials and reduce visibility. Dust comprised of large particles (diameter greater than
10 micrometers) settles out rapidly and is easily filtered by human breathing passages. This dust is of
concern more as a soiling nuisance rather than a health hazard. The remaining fractions, PM10 and PM2.5,
are a health concern particularly at levels above the federal and California ambient air quality standards.
PM2.5 (including diesel exhaust particles) is thought to have greater effects on health, because these
particles are so small and thus penetrate to the deepest parts of the lungs.
Acute and chronic health effects associated with high particulate levels include the aggravation of chronic
respiratory diseases, heart and lung disease, coughing, bronchitis, and respiratory illnesses in children.
Mortality studies since the 1990s have shown a statistically significant direct association between
mortality (premature deaths) and daily concentrations of particulate matter in the air. Despite important
gaps in scientific knowledge and continued reasons for some skepticism, a comprehensive evaluation of
the research findings provides persuasive evidence that exposure to fine particulate air pollution has
adverse effects on cardiopulmonary health. The CARB has estimated that achieving the ambient air quality
standards for PM10 could reduce premature mortality rates by 6,500 cases per year.
Sulfur Dioxide
SO2 is a combustion product of sulfur or sulfur–containing fuels such as coal and diesel. SO2 is also a
precursor to the formation of atmospheric sulfate and particulate matter and contributes to potential
atmospheric sulfuric acid formation that could precipitate downwind as acid rain.
Lead
Ambient lead concentrations meet both the federal and State standards in the Project area. Lead has a
range of adverse neurotoxin health effects and was released into the atmosphere via leaded gasoline
products. The phase-out of leaded gasoline in California has resulted in dramatically decreased levels of
atmospheric lead. Metal processing is currently the primary source of lead emissions in the SCAB. The
highest concentrations of lead in air are generally found near lead smelters and general aviation airports;
where piston aircraft use leaded fuel. Other stationary sources that generate lead emissions include waste
incinerators, utilities, and lead-acid battery manufacturers. The maximum lead concentrations recorded
in the Project area is below federal and California standards. Notably, diesel fuel does not contain lead
emissions and gasoline fuel is unleaded.

Air Quality and Health Risk Assessment Technical Report
RCH Group Page 18 of 76 November 17, 2020
Toxic Air Contaminants
Non-criteria air pollutants or toxic air contaminants (TAC) are airborne substances that are capable of
causing short-term (acute) and/or long-term (chronic or carcinogenic, i.e., cancer causing) adverse human
health effects (i.e., injury or illness). TAC include both organic and inorganic chemical substances. They
may be emitted from a variety of common sources including gasoline stations, automobiles, dry cleaners,
industrial operations, and painting operations. The current California list of TAC includes approximately
240 compounds, including particulate emissions from diesel-fueled engines and asbestos.
In August of 1998, CARB identified particulate emissions from diesel-fueled engines as TAC. CARB developed
the Risk Reduction Plan to Reduce Particulate Matter Emissions from Diesel-Fueled Engines and Vehicles19
and Risk Management Guidance for the Permitting of New Stationary Diesel-Fueled Engines.20 The
document represents a proposal to reduce diesel particulate emissions, with the goal to reduce emissions
and the associated health risk by 75 percent in 2010 and 85 percent in 2020.21 The program aims to require
the use of state-of-the-art catalyzed diesel particulate filters and ultra-low sulfur diesel fuel on diesel-fueled
engines.
Diesel particulate matter (DPM) is the most complex of diesel emissions. Diesel particulates, as defined by
most emission standards, are sampled from diluted and cooled exhaust gases. This definition includes both
solid and liquid material that condenses during the dilution process. The basic fractions of DPM are
elemental carbon; heavy hydrocarbons derived from the fuel and lubricating oil and hydrated sulfuric acid
derived from the fuel sulfur. DPM contains a large portion of the polycyclic aromatic hydrocarbons (PAH)
found in diesel exhaust. Diesel particulates include small nuclei particles of diameters below 0.04
micrometers (µm) and their agglomerates of diameters up to 1 µm. DPM is a major factor in total TAC
exposure in California.
California State law defines TAC as air pollutants having carcinogenic effects. A total of 243 substances
have been designated as TAC under California law; they include the 187 (federal) hazardous air pollutants
(HAP) adopted in accordance with AB 2728. The Air Toxics “Hot Spots” Information and Assessment Act of
1987 (AB 2588) seeks to identify and evaluate risk from air toxics sources but AB 2588 does not regulate
air toxics emissions. TAC emissions from individual facilities are quantified and prioritized. Depending on
the risk levels, emitting facilities are required to implement varying levels of risk reduction measures.
19 California Air Resources Board, Risk Reduction Plan to Reduce Particulate Matter Emissions from Diesel-Fueled Engines and Vehicles, October 2000. Accessed July 6, 2020 at http://www.arb.ca.gov/diesel/documents/rrpfinal.pdf.
20 California Air Resources Board, Risk Management Guidance for the Permitting of New Stationary Diesel-Fueled Engines, October 2000. Accessed July 6, 2020 at https://www.arb.ca.gov/diesel/documents/rmgFinal.pdf.
21 Generally, there was a 60 percent reduction in health risks from 2005 through 2015, based on the SCAQMD Multiple Air Toxics Exposure Study.

Air Quality and Health Risk Assessment Technical Report
RCH Group Page 19 of 76 November 17, 2020
In 2005, the SCAQMD conducted a comprehensive study on air toxics in the SCAB called the Multiple Air
Toxics Exposure Study (MATES-III). The monitoring program measured more than 30 air pollutants,
including both gas and particulates. The monitoring study was accompanied by a computer modeling study
in which SCAQMD estimated the risk of cancer from breathing toxic air pollution throughout the region
based on emissions and weather data. MATES-III found that the average cancer risk in the region from
carcinogenic air pollutants ranges from approximately 870 in a million to 1,400 in a million, with an average
regional risk of approximately 1,200 in a million.22
In 2015, the Multiple Air Toxics Exposure Study IV (MATES IV) is a follow up to previous air toxics studies
in the Basin. The MATES IV Study includes an updated emissions inventory of toxic air contaminants and a
modeling effort to characterize risk across the SCAB. The study focuses on the carcinogenic risk from
exposure to air toxics but does not estimate mortality or other health effects from particulate exposures.
An additional focus of MATES IV is the inclusion of measurements of ultrafine particle concentrations.
Results for MATES-IV show that trends in monitored levels air toxics continue to decline, modeled
exposures and risks were substantially lower compared to MATES III (approximately 60 percent decrease),
and DPM remains the largest component of air toxics estimated risk, at approximately 68 percent of the
South Coast Air Basin wide cancer risk of 418 per million persons, ranging from 320 to 480 per million
persons. Based on data within MATES-IV, the proposed Project is within an area with an estimated cancer
risk of 1,001 to 1,200 per million persons.23
6.0 THRESHOLDS OF SIGNIFICANCE
Because of the SCAQMD’s regulatory role in the Basin, the significance thresholds and analysis
methodologies in the SCAQMD’s CEQA Air Quality Handbook are used in evaluating project impacts for
construction, operations, and air toxics.24 These significance thresholds, under which the proposed
Project was evaluated, are described within the following section. The proposed Project would result in a
significant construction air quality impact if the Project exceeds the concentration significance thresholds
set forth in Table 3: Ambient Air Quality Significance Thresholds for Criteria Pollutants. Per SCAQMD
guidance, the evaluated concentrations of CO, NO2, and SO2 included both the Project contribution plus
background concentrations. The total concentration is then compared to the significance thresholds. For
CO, NO2, and SO2, these significance thresholds are reflective of the CAAQS and NAAQS. Background
22 South Coast Air Quality Management District, Multiple Air Toxics Exposure Study (MATES-III) in the South Coast Air Basin, September 2008, Accessed July 6, 2020 at: https://www.aqmd.gov/home/air-quality/air-quality-studies/health-studies/mates-iii.
23 South Coast Air Quality Management District, Multiple Air Toxics Exposure Study (MATES-IV) in the South Coast Air Basin, May 1, 2015, Accessed July 6, 2020 at: http://www.aqmd.gov/home/air-quality/air-quality-studies/health-studies/mates-iv.
24 South Coast Air Quality Management District, SCAQMD Air Quality Significance Thresholds, April 2019, Accessed July 6, 2020 at: http://www.aqmd.gov/ceqa/hdbk.html.

Air Quality and Health Risk Assessment Technical Report
RCH Group Page 20 of 76 November 17, 2020
concentration were based on existing air monitoring stations near the Project alignment and represent
existing air emissions sources within the Air Basin. Further information on the background concentrations
is provided in Attachment A: Air Quality Dispersion Modeling Methodology and Assumptions. Per
SCAQMD guidance, the Project contribution of PM10 and PM2.5 is compared to the significance thresholds
without adding background concentrations.
The proposed Project would also result in a significant health impact if the carcinogenic or toxic air
contaminants individually or cumulatively are equal to or exceed the maximum individual cancer risk of
ten in one million persons or an chronic and acute hazard index of 1.0 or the cancer burden of 0.5 excess
cancer cases (in areas greater than or equal to one in one million).25
Table 3 Ambient Air Quality Significance Thresholds for Criteria Pollutants
Pollutant Averaging Period Pollutant Concentration Threshold
CO 1-hour /8-hour SCAQMD is in attainment (federal and State); project is significant if it causes or contributes to an exceedance of the attainment standards of 20 ppm (1-hour) and 9 ppm (8-hour)
NO2
1-hour SCAQMD is in attainment (federal and State); project is significant if it causes or contributes to an exceedance of the following attainment standard 0.18 ppm (State) and 0.10 ppm (federal)
Annual 0.03 ppm (state) and 0.0534 ppm (federal)
PM10
24-hour 10.4 µg/m3 (construction) and 2.5 µg/m
3 (operation)
Annual 1.0 µg/m3 (construction and operation)
PM2.5 24-hour 10.4 µg/m3 (construction) and 2.5 µg/m
3 (operation)
SO2
1-hour 0.25 ppm (State) and 0.075 ppm (federal)
24-hour 0.04 ppm (State)
Lead 30-day Average 1.5 µg/m
3 (State)
Rolling 3-month Average 0.15 µg/m3 (federal)
Source: South Coast Air Quality Management District, SCAQMD Air Quality Significance Thresholds, April 2019, Accessed July 6, 2020 at:
http://www.aqmd.gov/ceqa/hdbk.html
25 Cancer burden is the total cancer risk for all receptors divided by the estimated population within the modeling domain.

Air Quality and Health Risk Assessment Technical Report
RCH Group Page 21 of 76 November 17, 2020
7.0 MITIGATION MEASURES
The following mitigation measures describe a number of specific actions to reduce construction NOx
emissions from on-road vehicles and off-road equipment used in construction activities. MM AQ-1
through MM AQ-4 were incorporated into the post-mitigation modeling (see Sections 8, 9, and 10 for
unmitigated and mitigated air quality and health risk assessment results). However, the extent to which
the remaining measures would reduce air quality impacts is not quantifiable. Nevertheless, the following
mitigation measures are required to reduce the air quality and health impacts for cumulatively
considerable construction emissions of ozone precursor of NOx:
MM AQ-1: Construction contractors shall, at a minimum, use equipment that meets the USEPA’s Final
Tier 4 emissions standards for off-road diesel-powered construction equipment with 50
horsepower (hp) or greater, for all phases of construction activity, unless it can be
demonstrated to the City of Inglewood Planning Division with substantial evidence that
such equipment is not available. To ensure that Final Tier 4 construction equipment or
better shall be used during the proposed Project’s construction, the City of Inglewood
shall include this requirement in applicable bid documents, purchase orders, and
contracts. The City of Inglewood shall also require periodic reporting and provision of
written construction documents by construction contractor(s) and conduct regular
inspections to the maximum extent feasible to ensure and enforce compliance.
Such equipment will be outfitted with Best Available Control Technology devices including
a CARB certified Level 3 Diesel Particulate Filters (DPF). Level 3 DPF are capable of
achieving at least 85 percent reduction in particulate matter emissions. Any emissions
control device used by the contractor shall achieve emissions reductions that are no less
than what could be achieved by Final Tier 4 emissions standards for a similarly sized
engine, as defined by the CARB’s regulations. Successful contractors must demonstrate
the ability to supply the compliant construction equipment for use prior to any ground
disturbing and construction activities. The proposed Project representative will make
available to the lead agency and SCAQMD a comprehensive inventory of all off-road
construction equipment, equal to or greater than 50 horsepower, that will be used during
construction. The inventory will include the horsepower rating, engine production year,
and certification of the specified Tier standard. A copy of each unit’s certified tier
specification, BACT documentation, and CARB or SCAQMD operating permit shall be
maintained on site at the time of mobilization for each applicable piece of construction
equipment.

Air Quality and Health Risk Assessment Technical Report
RCH Group Page 22 of 76 November 17, 2020
If any of the following circumstances listed below exist and the Contractor provides
written documentation consistent with project contract requirements, the Contractor
shall submit an alternative compliance plan that identifies operational changes or other
strategies that can reduce a comparable level of NOx emissions as Tier 4-certified engines
during construction activities.
• The Contractor does not have the required type of off-road construction equipment
within its current available inventory as to a particular vehicle or equipment by leasing
or short-term rent, and the Contractor has attempted in good faith and with due
diligence to lease or short-term rent the equipment or vehicle, but the equipment or
vehicle is not available for lease or short-term rent within 120 miles of the Project
alignment, and the Contractor has submitted documentation to the City of Inglewood
showing that the requirements of this exception provision apply.
• The Contractor has been awarded funding by SCAQMD or another agency that would
provide some or all of the cost to retrofit, repower, or purchase a piece of equipment
or vehicle, but the funding has not yet been provided due to circumstances beyond
the Contractor’s control, and the Contractor has attempted in good faith and with due
diligence to lease or short-term rent the equipment or vehicle that would comply, but
the equipment or vehicle is not available for lease or short-term rent within 120 miles
of the Project alignment, and the Contractor has submitted documentation to the City
of Inglewood showing that the requirements of this exception provision apply.
• Contractor has ordered equipment or vehicle to be used on the construction project
in compliance at least 60 days before that equipment or vehicle is needed at the
Project alignment, but that equipment or vehicle has not yet arrived due to
circumstances beyond the Contractor’s control, and the Contractor has attempted in
good faith and with due diligence to lease or short-term rent the equipment or vehicle
that would comply, but the equipment or vehicle is not available for lease or short-
term rent within 120 miles of the project site, and the Contractor has submitted
documentation to the City of Inglewood showing that the requirements of this
exception provision apply.
• Construction-related diesel equipment or vehicle will be used on the Project
alignment for fewer than 20 calendar days per calendar year. The Contractor shall not
consecutively use different equipment or vehicles that perform the same or a

Air Quality and Health Risk Assessment Technical Report
RCH Group Page 23 of 76 November 17, 2020
substantially similar function in an attempt to use this exception to circumvent the
intent of this mitigation measure.
• Documentation of good faith efforts and due diligence regarding the previous
exceptions shall include written record(s) of inquiries (i.e., phone logs) to at least three
leasing/rental companies that provide construction on-road trucks and off-road
equipment, documenting the availability/unavailability of the required types of
truck/equipment. The City of Inglewood will, from time-to-time, conduct independent
audit of the availability of such vehicles and equipment for lease/rent within a 120
mile radius of the project site, which may be used in reviewing the acceptability of the
Contractor’s good faith efforts and due diligence.
MM AQ-2: Equipment such as concrete/industrial saws, pumps, aerial lifts, light stands, air
compressors, and forklifts shall be electric or alternative-fueled (i.e., non-diesel). Pole
power shall be utilized at the earliest feasible point in time, and shall be used to the
maximum extent feasible in lieu of generators. If stationary construction equipment, such
as diesel-powered generators, must be operated continuously, such equipment must be
Final Tier 4 construction equipment or better and located at least 100 feet from air quality
sensitive land uses (e.g., residences, schools, childcare centers, hospitals, parks, or similar
uses), whenever possible.
MM AQ-3: At a minimum, require that construction vendors, contractors, and/or haul truck operators
commit to using 2010 model year trucks (e.g., material delivery trucks and soil
import/export with a gross vehicle weight rating of at least 14,001 pounds), or best
commercially available equipment, that meet CARB’s 2010 engine emissions standards at
0.01 g/hp-hour of particulate matter and 0.20 g/hp-hour of NOx emissions or newer,
cleaner trucks, unless the Contractor provides written documentation consistent with
project contract requirements the circumstances identified in MM AQ-1 exist and the
Contractor submits an alternative compliance plan. Operators shall maintain records of all
trucks associated with Project construction to document that each truck used meets these
emission standards. The City of Inglewood shall include this requirement in applicable bid
documents, purchase orders, and contracts. Operators shall maintain records of all trucks
associated with Project construction to document that each truck used meets these
emission standards and make the records available for inspection.
MM AQ-4: Require the use of electric or alternatively fueled (e.g., natural gas) sweepers with HEPA
filters.

Air Quality and Health Risk Assessment Technical Report
RCH Group Page 24 of 76 November 17, 2020
MM AQ-5: A publicly visible sign shall be posted with the telephone number and person to contact
at the City of Inglewood regarding dust complaints. This person shall respond and take
corrective action with 24 hours. The Air District’s phone number shall also be visible to
ensure compliance with applicable regulations.
MM AQ-6: All roadways, driveways, sidewalks, etc., being installed as part of the project should be
completed as soon as practical; in addition, building pads should be laid as soon as
practical after grading.
MM AQ-7: To the extent feasible, allow construction employees to commute during off-peak hours.
MM AQ-8: Make access available for on-site lunch trucks during construction, as feasible, to
minimize off-site construction employee vehicle trips.
MM AQ-9: Every effort shall be made to utilize grid-based electric power at any construction site,
where feasible. Grid-based power can be from a direct hookup or a tie into electricity
from power poles.
MM AQ-10: Contractors shall maintain and operate construction equipment to minimize exhaust
emissions. All construction equipment must be properly tuned and maintained in
accordance with the manufacturer’s specifications and documentation demonstrating
proper maintenance, in accordance with the manufacturer’s specifications, shall be
maintained on site. Tampering with construction equipment to increase horsepower or to
defeat emission control devices must be prohibited.
MM AQ-11: Enter into applicable bid documents, purchase orders, and contracts to notify all
construction vendors, contractors, and/or haul truck operators that vehicle and
construction equipment idling time will be limited to no longer than five minutes,
consistent with the CARB’s policy. For any idling that is expected to take longer than five
minutes, the engine should be shut off. Notify construction vendors, contractors, and/or
haul truck operators of these idling requirements at the time that the purchase order is
issued and again when vehicles enter the Project alignment. To further ensure that drivers
understand the vehicle idling requirement, post signs at the proposed Project entry gates
and throughout the Project alignment, where appropriate, stating that idling longer than
five minutes is not permitted.

Air Quality and Health Risk Assessment Technical Report
RCH Group Page 25 of 76 November 17, 2020
In addition to these mitigation measures, the following recommendations are provided for certain
school/daycare centers:
• Indoor air filtration systems should meet or exceed an efficiency standard of Minimum Efficiency Reporting Value (MERV) 13 or higher (i.e., a filter efficiency of approximately 80 percent of fine particulates in the range of 1.0 to 3.0 micrometers) to limit DPM exposure at school/daycare sensitive receptors in which the health impacts using MM AQ-1 through MM AQ-11 potentially exceed the significance thresholds. MERV-13 air filters may reduce concentrations of DPM from mobile sources by approximately 53 percent and cancer risk by 42 percent. An ongoing maintenance plan for building air filtration systems would be implemented. Ventilation systems should meet the following minimal design standards:
− A MERV-13, or higher, rating that represents a minimum of 80 percent efficiency to capture fine particulates;
− At least one air exchange(s) per hour of fresh outside filtered air;
− At least four air exchange(s) / hour recirculation; and
− At least 0.25 air exchange(s) per hour in unfiltered infiltration; and26
− Where appropriate, install passive electrostatic filtering systems, especially those with low air velocities (i.e., one mph).
The presence of a noise barrier often leads to pollutant concentration reductions behind the barrier during
meteorological conditions with winds directionally from the project site. PM2.5 concentrations generally
decrease between 15 and 50 percent behind a noise barrier. However, conditions may also occur when
pollutant concentrations are greater behind the barrier than when no barrier is present. These results
imply that the presence of a noise barrier can lead to higher pollutant concentrations during certain wind
conditions.27
8.0 CONSTRUCTION EMISSIONS INVENTORY
The proposed Project would consist of an elevated APM system with dual guideways to allow for
continuous trains to travel in each direction. The proposed Project is designed as an aerial APM system
that runs approximately 1.8 miles along Market Street between Florence Avenue and Manchester
Boulevard, where it transitions east along Manchester Boulevard for approximately half a mile to Prairie
Avenue for approximately one mile.
26 San Francisco Department of Public Health. Assessment and Mitigation of Air Pollutant Health Effects from Intra-Urban Roadways: Guidance for Land Use Planning and Environmental Review, May 2008, Accessed July 7, 2020 at: https://www.gsweventcenter.com/Draft_SEIR_References/2008_0501_SFDPH.pdf
27 Atmospheric Environment. Impacts of Noise Barriers on Near-road Air Quality, May 2008, Accessed August 25, 2020 at: https://escholarship.org/content/qt1ch1q6wx/qt1ch1q6wx.pdf.

Air Quality and Health Risk Assessment Technical Report
RCH Group Page 26 of 76 November 17, 2020
Construction activities are expected to commence in early 2022 and be completed in mid-2026.
Construction activity would primarily occur over a 24 hour per day schedule with three shifts as follows:
• a morning shift from approximately 7:00 AM to 3:00 PM (Morning Shift), and
• an evening shift from approximately 3:00 PM to 11:00 PM (Evening Shift), or
• a night shift from approximately 11:00 PM to 7:00 AM (Night Shift).
Combinations of these shifts would be referred to “Moring/Night” or “Night/ Morning.” Section 2 provides
additional Project information. The AAQS analysis and HRA results are presented for both the
Morning/Evening and Morning/Night construction scenarios.
Intermittent (short-term) construction emissions that occur from activities related to the proposed Project
were evaluated. The air quality analysis focuses on daily emissions from construction (mobile, area,
stationary, and fugitive sources) activities and compares the emission estimates to thresholds of
significance. The air quality analysis was developed based on the SCAQMD Air Quality Handbook.28 The
air quality analysis was conducted to determine the air quality impacts, using the significance levels
identified by the SCAQMD.29 Assumption for the air construction emission estimates were based on the
Inglewood Transit Connector: Construction Scenarios for the Environmental Impact Report by Pacifica
Services (dated June 27, 2020).
Table 4: Daily Unmitigated Construction Emissions for Proposed Project shows the estimated daily
unmitigated emissions for construction related emissions (including combustion engine and fugitive dust
emissions) for the proposed Project. The grand total construction emissions as well as the contribution
from employee vehicle trips, pickup/delivery trucks, haul trucks, and off-road equipment are presented.
The off-road equipment represents the largest contribution to the total construction emissions. The daily
unmitigated NOx construction emissions would potentially exceed the SCAQMD thresholds of significance
during 2022 through 2025. Therefore, appropriate mitigation measures (such as requiring USEPA Tier 4
emissions standards for off-road diesel-powered construction equipment with more than 50 horsepower)
was evaluated in conjunction with the ambient air quality analysis (Section 9) and the health risk
assessment (Section 10).
28 South Coast Air Quality Management District, CEQA Air Quality Handbook, Accessed July 6 ,2020 at: http://www.aqmd.gov/home/rules-compliance/ceqa/air-quality-analysis-handbook.
29 South Coast Air Quality Management District, SCAQMD Air Quality Significance Thresholds, April 2019, Accessed July 6, 2020 at: http://www.aqmd.gov/ceqa/hdbk.html.

Air Quality and Health Risk Assessment Technical Report
RCH Group Page 27 of 76 November 17, 2020
Table 4 Daily Unmitigated Construction Emissions (pounds) for Proposed Project
Construction Year VOC CO NOx PM10 PM2.5 SO2 Grand Total
2022 10.2 107 128 7.76 5.15 0.50 2023 17.3 203 191 12.5 8.23 0.88 2024 17.0 198 179 11.4 7.63 0.82 2025 18.5 218 186 11.5 7.74 0.86 2026 10.6 124 100 6.13 4.17 0.46
Significance Thresholds 75 550 100 150 55 150 Employee Vehicles
2022 0.18 5.76 0.56 0.31 0.13 0.02 2023 0.42 13.1 1.22 0.76 0.32 0.05 2024 0.30 9.22 0.82 0.57 0.24 0.03 2025 0.42 12.8 1.09 0.84 0.35 0.05 2026 0.13 3.89 0.32 0.27 0.11 0.01
Pickup/Delivery Trucks 2022 0.34 8.36 4.23 0.69 0.30 0.05 2023 0.70 16.8 8.41 1.54 0.68 0.10 2024 0.73 17.6 8.28 1.73 0.76 0.11 2025 0.53 13.5 5.71 1.39 0.60 0.09 2026 0.49 12.5 5.04 1.39 0.60 0.09
Haul Trucks 2022 1.29 4.58 48.6 3.66 1.86 0.19 2023 0.35 2.53 44.3 4.64 2.09 0.26 2024 0.28 2.02 35.2 3.67 1.65 0.21 2025 0.27 2.04 35.4 3.73 1.67 0.21 2026 0.10 0.77 13.3 1.41 0.63 0.08
Off-road Equipment 2022 8.38 88.1 74.4 3.10 2.85 0.24 2023 15.8 171 137 5.59 5.15 0.47 2024 15.7 169 135 5.41 4.98 0.46 2025 17.3 190 144 5.55 5.11 0.51 2026 9.88 107 81.2 3.07 2.82 0.29
Note: Values in bold are in excess of applicable standard. Source: RCH Group, 2020
The off-road equipment represents the largest contribution to the total construction emissions;
approximately 91 percent of the VOC emissions, approximately 85 percent of the CO emissions,
approximately 73 percent of the NOx emissions, approximately 46 percent of the PM10 emissions,
approximately 64 percent of the PM2.5 emissions, and approximately 56 percent of the SO2 emissions.
Cranes, backhoes/loaders, air compressors, and compactors contribute the greatest amounts to the daily
total NOx emissions.
Table 5: Daily Mitigated Construction Emissions for Proposed Project shows the estimated daily mitigated
emissions for construction related emissions (including combustion engine and fugitive dust emissions)
for the proposed Project.

Air Quality and Health Risk Assessment Technical Report
RCH Group Page 28 of 76 November 17, 2020
Table 5 Daily Mitigated Construction Emissions (pounds) for Proposed Project
Construction Year VOC CO NOx PM10 PM2.5 SO2 Grand Total
2022 7.07 223 95.1 5.31 2.95 0.43 2023 11.6 443 141 8.21 4.35 0.75 2024 11.2 443 138 7.21 3.88 0.68 2025 11.7 478 149 7.23 3.90 0.68 2026 6.26 260 80.2 3.72 2.01 0.35
Significance Thresholds 75 550 100 150 55 150 Employee Vehicles
2022 0.18 5.76 0.56 0.31 0.13 0.02 2023 0.42 13.1 1.22 0.76 0.32 0.05 2024 0.30 9.22 0.82 0.57 0.24 0.03 2025 0.42 12.8 1.09 0.84 0.35 0.05 2026 0.13 3.89 0.32 0.27 0.11 0.01
Pickup/Delivery Trucks 2022 0.34 8.36 4.23 0.69 0.30 0.05 2023 0.70 16.8 8.41 1.54 0.68 0.10 2024 0.73 17.6 8.28 1.73 0.76 0.11 2025 0.53 13.5 5.71 1.39 0.60 0.09 2026 0.49 12.5 5.04 1.39 0.60 0.09
Haul Trucks 2022 1.29 4.58 48.6 3.66 1.86 0.19 2023 0.35 2.53 44.3 4.64 2.09 0.26 2024 0.28 2.02 35.2 3.67 1.65 0.21 2025 0.27 2.04 35.4 3.73 1.67 0.21 2026 0.10 0.77 13.3 1.41 0.63 0.08
Off-road Equipment 2022 5.25 205 41.7 0.65 0.65 0.17 2023 10.1 411 86.7 1.26 1.26 0.33 2024 9.93 415 93.2 1.23 1.23 0.32 2025 10.4 450 107 1.28 1.27 0.33 2026 5.54 243 61.6 0.66 0.66 0.17
Note: Values in bold are in excess of applicable standard. Source: RCH Group, 2020
The total construction emissions including the contribution from employee vehicle trips, pickup/delivery trucks, haul trucks, and off-road equipment are presented. The daily mitigated NOx construction emissions would potentially exceed the SCAQMD thresholds of significance during 2023 through 2025. However, as presented in Section 9, the ambient air concentration impacts due to Project construction would be less than significant at all nearby receptors for all pollutants. Therefore, although the daily emissions for NOx would potentially exceed the SCAQMD significance thresholds, the resultant air concentrations would not likely exceed the SCAQMD significance thresholds.
The mitigation measures represent a reduction of approximately 23 percent of the NOx emissions, approximately 36 percent of the PM10 emissions, and approximately 48 percent of the PM2.5 emissions.

Air Quality and Health Risk Assessment Technical Report
RCH Group Page 29 of 76 November 17, 2020
Air Emission Calculation Methodology
Air emission sources include combustion exhaust from on-road vehicles such as construction worker vehicles, pickup/delivery trucks, haul trucks, and construction equipment such as backhoes, loaders, and graders.
On-Road Vehicles
Vehicular emissions were computed using the CARB’s emission factor model, EMFAC, to estimate on-road emissions. Construction worker trips were modeled using the light-duty auto/truck classification. Construction worker trips are a composite of gasoline and diesel vehicles. Foreman trucks used on-site were modeled as gasoline and diesel light heavy-duty trucks. Haul trucks were modeled using the diesel combination long-haul truck classification, which is a heavy-heavy duty truck emission factor for public vehicles. Construction worker vehicles usage were assumed to be 12 miles per one way trip per day.30
Distance traveled is assumed to be 20 miles per one way trip per day for dump trucks, delivery trucks, and concrete trucks.31 Distance traveled is assumed to be 29 miles per one way trip per day for asphalt removal trucks, asphalt pavement trucks, and soil spoils dump trucks.32 A conservative estimate of 10 percent of the total truck trips within each phase were assumed to occur on any given day. The usage factor for haul trucks is approximately 25 percent. Paved road dust, brake wear, and tire wear particulate emissions were also accounted for and included in the analysis using EMFAC emission factors and methodologies. For haul trucks, exhaust particulate emissions is approximately 14 percent of the total particulate emissions.
Criteria pollutant emissions associated with on-road vehicles were calculated by combining the activity information with emissions factors, in grams per mile, derived using the EMFAC emissions model. Emissions calculations were based on Equation 1. The EMFAC emissions factors are summarized on Table 6: Emissions Factors (g/mile) for On-Road Vehicles for employee vehicles, pickup trucks, delivery trucks, and haul trucks for 2022 through 2026.
Equation 1
Emission Rate (tons/year) = Emission Factor (gram/mile) * trips per day * miles per trip * days/year * (453.59/2000 tons/gram)
30 California Emissions Estimator Model (CalEEMod) Version 2016.3.2 31 The maximum distance from four supporting facilities: CalPortland, Catalina Pacifica Concrete, Cemex-Inglewood, and
Robertson's Read Mix. 32 The distance to Whittier Landfill.

Air Quality and Health Risk Assessment Technical Report
RCH Group Page 30 of 76 November 17, 2020
Table 6 Emissions Factors (g/mile) for On-Road Vehicles
Vehicle Type VOC CO NOx CO2 CH4 N2O PM10 PM2.5 SO2 Calendar Year 2022
Employee 0.03 0.89 0.09 299 0.01 0.01 0.05 0.02 0.003 Pickup Truck 0.02 1.07 0.09 331 0.01 0.01 0.05 0.02 0.003 Delivery Truck 0.05 0.59 0.82 660 0.01 0.04 0.10 0.04 0.01 Haul Truck 0.06 0.22 2.30 973 0.003 0.15 0.17 0.09 0.01 Calendar Year 2023
Employee 0.03 0.83 0.08 290 0.01 0.01 0.05 0.02 0.003 Pickup Truck 0.02 0.98 0.08 319 0.01 0.01 0.05 0.02 0.003 Delivery Truck 0.05 0.52 0.73 648 0.01 0.04 0.10 0.04 0.01 Haul Truck 0.01 0.08 1.46 928 0.001 0.15 0.15 0.07 0.01 Calendar Year 2024
Employee 0.03 0.78 0.07 281 0.01 0.01 0.05 0.02 0.003 Pickup Truck 0.02 0.91 0.07 309 0.004 0.01 0.05 0.02 0.003 Delivery Truck 0.04 0.47 0.64 637 0.004 0.04 0.10 0.04 0.01 Haul Truck 0.01 0.08 1.46 919 0.001 0.14 0.15 0.07 0.01 Calendar Year 2025
Employee 0.02 0.73 0.06 272 0.004 0.01 0.05 0.02 0.003 Pickup Truck 0.02 0.84 0.06 298 0.004 0.01 0.05 0.02 0.003 Delivery Truck 0.04 0.42 0.57 624 0.004 0.04 0.10 0.04 0.01 Haul Truck 0.01 0.08 1.45 909 0.001 0.14 0.15 0.07 0.01 Calendar Year 2026
Employee 0.02 0.70 0.06 264 0.004 0.01 0.05 0.02 0.003 Pickup Truck 0.01 0.79 0.05 289 0.003 0.01 0.05 0.02 0.003 Delivery Truck 0.04 0.38 0.50 612 0.003 0.04 0.10 0.04 0.01 Haul Truck 0.01 0.08 1.44 901 0.0005 0.14 0.15 0.07 0.01
Source: CARB EMFAC Emissions Model.
Off-Road Equipment
Construction of the proposed Project would require the use of heavy-duty equipment, such as excavators,
loaders, forklifts, and off-road haul trucks. This equipment would be used to load and unload material and
otherwise sort and handle material. Composite emission factors from the OFFROAD emissions model were
used. Emissions from construction activities were estimated based on the projected construction activity
schedule, the number of vehicles/pieces of equipment, the types of equipment/type of fuel used,
vehicle/equipment utilization rates, equipment horsepower, and the construction year. This data were
based on the Inglewood Transit Connector: Construction Scenarios for the Environmental Impact Report

Air Quality and Health Risk Assessment Technical Report
RCH Group Page 31 of 76 November 17, 2020
by Pacifica Services (dated June 27, 2020). Emissions from construction activities were also estimated
based on load factor (throttle setting)33 and usage factor.34 For the daily emission estimates and short-
term ambient concentration analysis (1-hour to 24-hour averaging periods), the usage factor of 100
percent was applied (i.e., full-time operation). For the long-term ambient concentration analyses and the
health risk assessment, the usage factor of less than 100 percent was applied by equipment type, as not
all of the equipment can be used every hour of the day and every day of the year due to safety issues and
manpower constraints. That is, the short-term impacts are based on worst-case construction activity but
the long-term impacts are based on average construction activity.
This information was applied to criteria pollutant emissions factors, in grams per horsepower-hour,
primarily derived using the OFFROAD emissions model. Equation 2 outlines how off-road construction
equipment emissions were computed, and the emissions factors used in this assessment are summarized,
by equipment type within Table 7 through Table 11: Emissions Factors (g/hp-hour) for Off-Road
Equipment for 2022 through 2026, respectively.
Equation 2
Emission Rate (tons/year) = Emission Factor (gram/hp-hour) * size (hp) * hours of operation * Load Factor * usage factor * (453.59/2000 tons/gram)
Emission Rate (pounds/day) = Emission Factor (gram/hp-hour) * size (hp) * hours of operation * Load Factor * (1/453.59 pounds/gram)
33 Load factor (or throttle setting) are the engine performance demands, as a percent of maximum power; based on values within OFFROAD and typically ranging from 30 to 80 percent depending on equipment type.
34 Activity level (or usage factor) are defined as the percent of operation for a piece of equipment over a given time.

Air Quality and Health Risk Assessment Technical Report
RCH Group Page 32 of 76 November 17, 2020
Table 7 Emissions Factors (g/hp-hour) for Off-Road Equipment for 2022
Equipment HP ROG CO NOX SO2 PM10 PM2.5 CO2 Impact Pile Driver 700 0.04 0.49 0.32 0.002 0.01 0.01 268
Crane 270 0.09 0.52 1.08 0.001 0.04 0.04 152 Backhoe 127 0.07 1.14 0.65 0.002 0.03 0.03 193 Loader 164 0.07 1.14 0.65 0.002 0.03 0.03 193
Auger Drill Rig 600 0.04 0.49 0.32 0.002 0.01 0.01 268 Air Compressor 150 0.03 0.87 0.35 0.001 0.01 0.01 158
Excavator 396 0.05 0.40 0.39 0.002 0.01 0.01 201 Bobcat 72.9 0.16 1.39 1.37 0.002 0.10 0.09 189
Generator 15 0.41 2.16 3.29 0.006 0.14 0.13 421 Drum Mixer 3.5 0.31 1.82 2.35 0.005 0.09 0.08 318
Drill Rig Truck 600 0.04 0.49 0.32 0.002 0.01 0.01 268 Concrete Saw 24 0.41 1.71 3.17 0.005 0.12 0.11 416
Compactor 80 0.11 1.29 1.17 0.002 0.07 0.06 198 Man Lift 45.9 0.45 2.85 3.40 0.007 0.13 0.12 466 Welder 23 0.05 0.96 0.90 0.002 0.01 0.01 181
Street Sweeper 240 0.27 1.28 2.00 0.004 0.09 0.08 256 Source: CARB OFFROAD Emissions Model.

Air Quality and Health Risk Assessment Technical Report
RCH Group Page 33 of 76 November 17, 2020
Table 8 Emissions Factors (g/hp-hour) for Off-Road Equipment for 2023
Equipment HP ROG CO NOX SO2 PM10 PM2.5 CO2 Impact Pile Driver 700 0.04 0.49 0.30 0.002 0.01 0.01 268
Crane 270 0.09 0.52 1.00 0.001 0.04 0.04 152 Backhoe 127 0.07 1.14 0.56 0.002 0.03 0.03 194 Loader 164 0.07 1.14 0.56 0.002 0.03 0.03 194
Auger Drill Rig 600 0.04 0.49 0.30 0.002 0.01 0.01 268 Air Compressor 150 0.03 0.88 0.29 0.001 0.01 0.01 160
Excavator 396 0.05 0.40 0.34 0.002 0.01 0.01 201 Bobcat 72.9 0.15 1.38 1.26 0.002 0.08 0.08 189
Generator 15 0.41 2.14 3.26 0.006 0.14 0.13 421 Drum Mixer 3.5 0.31 1.82 2.35 0.005 0.09 0.08 318
Drill Rig Truck 600 0.04 0.49 0.30 0.002 0.01 0.01 268 Concrete Saw 24 0.42 1.72 3.18 0.005 0.12 0.11 417
Compactor 80 0.10 1.28 1.09 0.002 0.06 0.05 198 Man Lift 45.9 0.45 2.85 3.40 0.007 0.13 0.12 466 Welder 23 0.05 0.96 0.89 0.002 0.01 0.01 181
Street Sweeper 240 0.27 1.28 1.99 0.004 0.09 0.08 256 Source: CARB OFFROAD Emissions Model.

Air Quality and Health Risk Assessment Technical Report
RCH Group Page 34 of 76 November 17, 2020
Table 9 Emissions Factors (g/hp-hour) for Off-Road Equipment for 2024
Equipment HP ROG CO NOX SO2 PM10 PM2.5 CO2 Impact Pile Driver 700 0.04 0.49 0.28 0.002 0.01 0.01 268
Crane 270 0.08 0.49 0.91 0.001 0.04 0.03 152 Backhoe 127 0.06 1.14 0.51 0.002 0.03 0.02 194 Loader 164 0.06 1.14 0.51 0.002 0.03 0.02 194
Auger Drill Rig 600 0.04 0.49 0.28 0.002 0.01 0.01 268 Air Compressor 150 0.03 0.89 0.26 0.001 0.01 0.01 161
Excavator 396 0.05 0.40 0.32 0.002 0.01 0.01 201 Bobcat 72.9 0.14 1.39 1.19 0.002 0.08 0.07 189
Generator 15 0.40 2.13 3.24 0.006 0.13 0.12 421 Drum Mixer 3.5 0.31 1.82 2.35 0.005 0.09 0.08 318
Drill Rig Truck 600 0.04 0.49 0.28 0.002 0.01 0.01 268 Concrete Saw 24 0.42 1.72 3.18 0.005 0.12 0.11 417
Compactor 80 0.10 1.28 1.03 0.002 0.05 0.05 198 Man Lift 45.9 0.45 2.85 3.40 0.007 0.13 0.12 466 Welder 23 0.05 0.96 0.89 0.002 0.01 0.01 181
Street Sweeper 240 0.26 1.27 1.98 0.004 0.08 0.08 256 Source: CARB OFFROAD Emissions Model.

Air Quality and Health Risk Assessment Technical Report
RCH Group Page 35 of 76 November 17, 2020
Table 10 Emissions Factors (g/hp-hour) for Off-Road Equipment for 2025
Equipment HP ROG CO NOX SO2 PM10 PM2.5 CO2 Impact Pile Driver 700 0.04 0.48 0.21 0.002 0.01 0.01 266
Crane 270 0.08 0.44 0.80 0.001 0.03 0.03 152 Backhoe 127 0.06 1.14 0.44 0.002 0.02 0.02 194 Loader 164 0.06 1.14 0.44 0.002 0.02 0.02 194
Auger Drill Rig 600 0.04 0.48 0.21 0.002 0.01 0.01 266 Air Compressor 150 0.03 0.90 0.21 0.002 0.01 0.01 163
Excavator 396 0.04 0.40 0.27 0.002 0.01 0.01 201 Bobcat 72.9 0.13 1.37 1.07 0.002 0.06 0.06 189
Generator 15 0.40 2.12 3.22 0.006 0.13 0.12 421 Drum Mixer 3.5 0.31 1.82 2.34 0.005 0.09 0.08 318
Drill Rig Truck 600 0.04 0.48 0.21 0.002 0.01 0.01 266 Concrete Saw 24 0.42 1.73 3.20 0.005 0.12 0.11 420
Compactor 80 0.09 1.28 0.98 0.002 0.05 0.04 198 Man Lift 45.9 0.45 2.85 3.40 0.007 0.13 0.12 466 Welder 23 0.05 0.95 0.89 0.002 0.01 0.01 181
Street Sweeper 240 0.26 1.26 1.96 0.004 0.08 0.07 256 Source: CARB OFFROAD Emissions Model.

Air Quality and Health Risk Assessment Technical Report
RCH Group Page 36 of 76 November 17, 2020
Table 11 Emissions Factors (g/hp-hour) for Off-Road Equipment for 2026
Equipment HP ROG CO NOX SO2 PM10 PM2.5 CO2 Impact Pile Driver 700 0.04 0.48 0.21 0.002 0.01 0.01 267
Crane 270 0.07 0.43 0.72 0.001 0.03 0.03 152 Backhoe 127 0.06 1.14 0.40 0.002 0.02 0.02 194 Loader 164 0.06 1.14 0.40 0.002 0.02 0.02 194
Auger Drill Rig 600 0.04 0.48 0.21 0.002 0.01 0.01 267 Air Compressor 150 0.03 0.91 0.19 0.002 0.01 0.01 165
Excavator 396 0.04 0.403 0.26 0.002 0.01 0.01 201 Bobcat 72.9 0.12 1.37 0.98 0.002 0.06 0.05 189
Generator 15 0.40 2.12 3.20 0.006 0.13 0.12 421 Drum Mixer 3.5 0.31 1.82 2.34 0.005 0.09 0.08 318
Drill Rig Truck 600 0.04 0.48 0.21 0.002 0.01 0.01 267 Concrete Saw 24 0.42 1.73 3.19 0.005 0.12 0.11 419
Compactor 80 0.09 1.28 0.93 0.002 0.04 0.04 198 Man Lift 45.9 0.45 2.85 3.40 0.007 0.13 0.12 466 Welder 23 0.05 0.95 0.89 0.002 0.01 0.01 181
Street Sweeper 240 0.26 1.26 1.95 0.004 0.08 0.07 256 Source: CARB OFFROAD Emissions Model.

Air Quality and Health Risk Assessment Technical Report
RCH Group Page 37 of 76 November 17, 2020
Fugitive Dust from Project Alignment Activities
Fugitive dust emissions from site preparation, grading equipment passes, soil movement,
unloading/loading of materials, and other construction related activities is based on work performed by
Midwest Research Institute (MRI).35 Generally, the emission factor used is 0.11 tons PM10 per acre-month
of activity. This emission factor is based on MRI’s observation of the types, quantity, and duration of
operations at eight construction sites (three in Las Vegas and five in California). The bulk of the operations
observed were site preparation-related activities. The observed activity data were then combined with
operation-specific emission factors provided in USEPA’s AP-42 to produce emissions estimates.36
The construction emission factor is assumed to include the effects of typical control measures such as
routine watering. A dust control effectiveness of 75 percent is assumed from these measures, which is
based on the estimated control effectiveness of watering. The MRI also includes an emission factor for
worst-case emissions of 0.42 tons PM10 per acre-month.37 This emission factor is appropriate for large-
scale construction operations, which involve substantial earthmoving operations. The ratio of PM2.5 to
PM10 was assumed to be 21 percent.
The MRI also includes an emission factor for typical conditions of 0.22-ton PM10 per acre-month without
control measures. This emission factor is based on MRI’s observation of the types, quantity, and duration
of operations at eight construction sites (three in Las Vegas and five in California). The bulk of the
operations observed were site preparation-related activities. The observed activity data were then
combined with operation-specific emission factors provided in USEPA’s AP-42 to produce emissions
estimates.
The SCAQMD estimated that 25 percent of their construction projects under the jurisdiction of the District
involve substantial earthmoving operations (worst case conditions) and applied recommended application
of the larger emission factor of 0.42-ton PM10 per acre-month for those types of construction projects. For
the remainder of the construction projects, the average emission factor of 0.22-ton PM10 per acre-month
was recommended.
Therefore, given the larger size of the proposed Project, the 0.42 ton PM10 per acre-month emission factor
was used along with the dust control effectiveness of 75 percent, which is based on the estimated control
35 Midwest Research Institute, Inventory of Agricultural Tilling, Unpaved Roads and Airstrips and Construction Sites, November 1974.
36 Environmental Protection Agency. Compilation of Air Pollutant Emission Factors, AP-42, Fifth Edition, Volume I: Stationary Point and Area Sources, Section 13.2.3 Heavy Construction Operations, January, 1995, Accessed July 6, 2020 at: https://www3.epa.gov/ttn/chief/ap42/ch13/final/c13s02-3.pdf
37 Worst-case refers to construction sites with active large-scale earth moving operations.

Air Quality and Health Risk Assessment Technical Report
RCH Group Page 38 of 76 November 17, 2020
effectiveness of watering, reducing vehicle speed on unpaved surface, and other measures.38
Mitigated Combustion Emission Factors for Off-road Equipment
Table 12: Emissions Factors for Off-Road Equipment by Engine Tier presents the mitigated emission factors for off-road construction equipment. The CO, NOx, and CO2 emission factors for the natural gas sweepers would be 4.1, 1.2, and 342 g/hp-hour, respectively.
Table 12 Emissions Factors (g/hp-hour) for Off-Road Equipment by Engine Tier
Tier Low HP High HP CO NOX PM10 PM2.5 ROG
Tier 3
25 49 4.1 4.63 0.28 0.28 0.29 50 74 3.7 2.74 0.192 0.192 0.12 75 119 3.7 2.74 0.192 0.192 0.12
120 174 3.7 2.32 0.112 0.112 0.12 175 299 2.6 2.32 0.088 0.088 0.12 300 599 2.6 2.32 0.088 0.088 0.12 600 750 2.6 2.32 0.088 0.088 0.12 751 2000 2.6 2.32 0.088 0.088 0.12
Tier 4 Final
25 49 4.1 2.75 0.008 0.008 0.12 50 74 3.7 2.74 0.008 0.008 0.12 75 119 3.7 0.26 0.008 0.008 0.06
120 174 3.7 0.26 0.008 0.008 0.06 175 299 2.2 0.26 0.008 0.008 0.06 300 599 2.2 0.26 0.008 0.008 0.06 600 750 2.2 0.26 0.008 0.008 0.06 751 2000 2.6 2.24 0.016 0.016 0.06
Source: CARB OFFROAD Emissions Model.
9.0 AMBIENT AIR CONCENTRATION IMPACTS
A dispersion modeling analysis was also conducted to assess Project-related impacts to air concentrations
of CO, NO2, PM10, PM2.5, and SO2. Concentrations were compared to SCAQMD’s significance thresholds
and California/federal ambient air quality standards. The proposed Project would result in a significant
construction air quality impact if concentration impacts from the proposed Project exceed the significance
38 SCAQMD Air Quality Management Handbook Mitigation Measures Fugitive Dust, Accessed July 6, 2020 at: http://www.aqmd.gov/home/rules-compliance/ceqa/air-quality-analysis-handbook/mitigation-measures-and-control-efficiencies/fugitive-dust.

Air Quality and Health Risk Assessment Technical Report
RCH Group Page 39 of 76 November 17, 2020
concentration thresholds set forth in Table 2: Ambient Air Quality Standards for Criteria Pollutants (see
Attachment C: Supplemental Health Impact Information for further information.39
Table 15: Estimated Unmitigated Concentration Impacts from Construction Activities provides the
unmitigated proposed Project air concentrations from construction activities for nearby receptors.
Table 16: Estimated Mitigated Concentration Impacts from Construction Activities provides the mitigated
proposed Project air concentrations from construction activities for nearby receptors.
Ambient Air Quality Concentrations Due To Construction Activities
Attachment A: Air Quality Dispersion Modeling Methodology and Assumptions provides detailed
information about the location of air quality receptors used in the dispersion modeling analysis of criteria
pollutants (NO2, CO, SO2, PM10, and PM2.5). There are a total of 1,954 air quality receptors.40 These
39 The recent Sierra Club v. County of Fresno California Supreme Court case held, in part, that the Friant Ranch Specific Plan EIR (Friant Ranch EIR) was deficient in the informational discussion of air quality impacts as they connect to adverse human health effects. The Supreme Court concluded that an EIR’s discussion must “make [ ] a reasonable effort to substantively connect a project’s air quality impacts to likely health consequences.” For the proposed Project, daily construction emissions of NOx (a precursor to the formation of ozone) would exceed significance thresholds resulting in a significant and unavoidable impact even with mitigation. The proposed Project would contribute to regional ozone contributions but determining potential health impacts caused directly by the construction activities is not feasible. According to the San Joaquin Valley Air Pollution Control District, it is not possible to determine ozone concentrations or make a direct correlation to human health impacts, because project-focused modeling cannot feasibly predict ozone formation and resulting regional ozone concentrations. SCAQMD has indicated that applicable methods do exist but are not applicable or feasible in most cases. The Court did not rule on whether health impacts of the named pollutants were scientifically feasible to predict, but it did state that: “if it is not scientifically possible to do more than has already been done to connect air quality effects with potential human health impacts, the Friant Ranch EIR itself must explain why, in a manner reasonably calculated to inform the public of the scope of what is and is not yet known about the project’s impacts.” The current modeling tools are not equipped to provide meaningful analysis of the correlation between a project's criteria pollutant or pollutant precursor emissions and specific health impacts. Air dispersion modeling is available, such as the American Meteorological Society/ Environmental Protection Agency Regulatory Model (AERMOD), but these models cannot accurately estimate dispersion of ozone. Ozone concentrations are dependent upon a variety of complex factors, including the presence of sunlight and precursor pollutants, natural topography, atmospheric stability, and wind patterns. Because of the dynamic nature of ozone formation and the complexities of predicting ground-level ozone concentrations in relation to ambient standards, air districts instead generally develop mass emissions thresholds for NOx that are used to make significance determinations. In summary, modeling of the proposed Project’s ozone emissions is not feasible and would not provide meaningful information given the number of variables that affect ozone formation (e.g., location of activity and weather on that day that results in conversion of precursor emissions into ozone). However, as shown in Section 9, the resultant air concentrations for the proposed Project would be below the significance thresholds and thus, the air quality health impacts due to the construction criteria air pollutant emissions would be expected to be less than significant. Nevertheless, the health impacts due to diesel particulate emissions would be potentially above the significance thresholds and would potentially be significant. Lastly, daily operational emissions would potentially exceed the SCAQMD significance thresholds during an NFL event. However, once operational in 2026, the proposed Project will increase transit ridership throughout the region, reduce vehicle miles traveled and criteria air pollutants, GHG emissions, and improve air quality throughout the South Coast Air Basin (see Section 12). Therefore, short-term construction-related and operational–related air quality impacts would occur but long-term operational-related air quality benefits would follow.
40 There are a total of 669 air quality criteria pollutant receptors plus the 1,285 sensitive receptors.

Air Quality and Health Risk Assessment Technical Report
RCH Group Page 40 of 76 November 17, 2020
receptors are designed to represent off-site locations where a person has access and can be situated for
an hour or longer at a time (which is different from the HRA receptors which are designed to represent
specific residences, schools, daycares, off-site worker locations). The ambient air quality standards analysis
results are presented for both the Morning/Evening and Morning/Night construction scenarios.
Morning/Evening Construction Activities
As shown in Table 13: Estimated Unmitigated Concentration Impacts from Construction Activities for
Morning/Evening Scenario, for the air quality receptors during Project construction, the incremental 1-hour NO2 impacts to a sensitive receptor, including background concentrations and Adjusted Baseline,
would be a maximum of 0.16 ppm (see Attachment A: Air Quality Dispersion Modeling Methodology and
Assumptions), which is below the State threshold of 0.18 ppm. The maximum incremental 98th percentile 1-hour NO2 impacts to a sensitive receptor, including background concentrations, would be 0.12 ppm,
which is potentially above the federal threshold of 0.10 ppm. The maximum Project construction
incremental annual NO2 impacts to a sensitive receptor, including background concentrations and
Adjusted Baseline, would be 0.01 ppm, which is below the thresholds of 0.03 ppm (State) and below the
threshold of 0.0534 ppm (federal). Therefore, unmitigated construction activities would potentially exceed
the 1-hour and would result in a potentially significant air quality impact of 1-hour NO2 on nearby receptors
due to construction activities but would not exceed the annual NO2 thresholds and would result in a less
than significant air quality impact of annual NO2 on nearby receptors due to construction activities.
As shown in Table 13: Estimated Unmitigated Concentration Impacts from Construction Activities for Morning/Evening Scenario, for the air quality receptors during Project construction, the maximum
incremental 24-hour and annual PM10 impacts to a sensitive receptor would be 3.02 µg/m3 and 0.23
µg/m3, respectively; impacts would be below the 24-hour PM10 threshold of 10.4 µg/m3 and below the
annual PM10 threshold of 1.0 µg/m3. The Project construction maximum incremental 24-hour PM2.5
impacts to a sensitive receptor would be 2.78 µg/m3, which would be below the 24-hour PM2.5 threshold
of 10.4 µg/m3. Therefore, unmitigated construction activities would result in a less than significant air
quality impact of PM10 and PM2.5 on nearby receptors due to construction activities.
As shown in Table 14: Estimated Mitigated Concentration Impacts from Construction Activities for
Morning/Evening Scenario, for the air quality receptors during Project construction, the maximum incremental 1-hour NO2 impacts to a sensitive receptor, including background concentrations and
Adjusted Baseline, would be 0.14 ppm, which is below the State threshold of 0.18 ppm. The maximum
incremental 98th percentile 1-hour NO2 impacts to a sensitive receptor, including background
concentrations and Adjusted Baseline, would be 0.10 ppm, which is within the federal threshold of 0.10
ppm. The maximum Project construction incremental annual NO2 impacts including background

Air Quality and Health Risk Assessment Technical Report
RCH Group Page 41 of 76 November 17, 2020
concentrations would be 0.01 ppm, which is below the thresholds of 0.03 ppm (state) and below the
threshold of 0.0534 ppm (federal). Therefore, mitigated construction activities would not exceed the 1-
hour and annual NO2 thresholds and would be a less than significant air quality impact of NO2 on nearby
receptors due to construction activities.
As shown in Table 14: Estimated Mitigated Concentration Impacts from Construction Activities for Morning/Evening Scenario, for the air quality receptors during Project construction, the maximum
incremental 24-hour and annual PM10 impacts would be 0.65 µg/m3 and 0.06 µg/m3, respectively. Impacts
would be below the 24-hour PM10 threshold of 10.4 µg/m3 and the annual PM10 threshold of 1.0 µg/m3.
The Project construction maximum incremental 24-hour PM2.5 impacts would be 0.65 µg/m3, which would
be below the 24-hour PM2.5 threshold of 10.4 µg/m3. Therefore, mitigated construction activities would
result in a less than significant air quality impact of PM10 and PM2.5 on nearby receptors due to construction
activities.
Additionally, as shown in Table 14: Estimated Mitigated Concentration Impacts from Construction
Activities for Morning/Evening Scenario, for the air quality receptors during Project construction, the maximum incremental SO2 and CO impacts including background concentrations and Adjusted Baseline
would be well below the significance thresholds and would be a less than significant air quality impact of
SO2 and CO on all nearby receptors due to construction activities.

Air Quality and Health Risk Assessment Technical Report
RCH Group Page 42 of 76 November 17, 2020
Table 13 Estimated Unmitigated Concentration Impacts from Construction Activities for Morning/Evening Scenario
(Approximately 7:00 AM to 3:00 PM and 3:00 PM to 11:00 PM)
Criteria
Maximum 1-Hour
NO2 (ppm)
98% 1-Hour
NO2 (ppm)
CAAQS Annual
NO2 (ppm)
NAAQS Annual
NO2 (ppm)
24-Hour PM10
(µg/m3)
Annual PM10
(µg/m3)
24-Hour PM2.5
(µg/m3)
CAAQS 1-Hour
SO2 (ppm)
NAAQS 1-Hour
SO2 (ppm)
24-Hour SO2
(ppm)
1-Hour CO
(ppm)
8-Hour CO
(ppm) Off-site Receptor (Project Increment) 0.06 0.05 <0.01 <0.01 3.02 0.23 2.78 <0.01 <0.01 <0.01 0.29 0.03 Background Concentration 0.07 0.05 0.01 0.01 0.01 0.01 <0.01 2.10 1.60 Adjusted Baseline Concentrations 0.03 0.02 <0.01 <0.01 <0.01 <0.01 <0.01 1.80 0.80 Total Concentration 0.16 0.12 0.01 0.01 3.02 0.23 2.78 0.01 0.01 <0.01 4.19 2.43 Significance Threshold 0.18 0.10 0.03 0.0534 10.4 1.00 10.4 0.25 0.075 0.04 20.0 9.00 Potentially Significant (Yes or No)? No Yes No No No No No No No No No No
Source: RCH Group, 2020 Total concentrations reflect rounding of values (Project Increment plus background concentration plus Adjusted Baseline). Per SCAQMD guidance, PM10 and PM2.5 impacts do not include background
concentrations.
Table 14 Estimated Mitigated Concentration Impacts from Construction Activities for Morning/Evening Scenario
(Approximately 7:00 AM to 3:00 PM and 3:00 PM to 11:00 PM)
Criteria
Maximum 1-Hour
NO2 (ppm)
98% 1-Hour
NO2 (ppm)
CAAQS Annual
NO2 (ppm)
NAAQS Annual
NO2 (ppm)
24-Hour PM10
(µg/m3)
Annual PM10
(µg/m3)
24-Hour PM2.5
(µg/m3)
CAAQS 1-Hour
SO2 (ppm)
NAAQS 1-Hour
SO2 (ppm)
24-Hour SO2
(ppm)
1-Hour CO
(ppm)
8-Hour CO
(ppm) Off-site Receptor (Project Increment) 0.04 0.03 <0.01 <0.01 0.65 0.06 0.65 <0.01 <0.01 <0.01 0.68 0.08 Background Concentration 0.07 0.05 0.01 0.01 0.01 0.01 <0.01 2.10 1.60 Adjusted Baseline Concentrations 0.03 0.02 <0.01 <0.01 <0.01 <0.01 <0.01 1.80 0.80 Total Concentration 0.14 0.10 0.01 0.01 0.65 0.06 0.65 0.01 0.01 <0.01 4.58 2.48 Significance Threshold 0.18 0.10 0.03 0.0534 10.4 1.00 10.4 0.25 0.075 0.04 20.0 9.00 Potentially Significant (Yes or No)? No No No No No No No No No No No No
Source: RCH Group, 2020 Total concentrations reflect rounding of values (Project Increment plus background concentration plus Adjusted Baseline). Per SCAQMD guidance, PM10 and PM2.5 impacts do not include background
concentrations.

Air Quality and Health Risk Assessment Technical Report
RCH Group Page 43 of 76 November 17, 2020
As previously noted, construction activities are expected to commence in the end of 2021 and be
completed in mid-2026. Construction activity would primarily occur over a 24 hour per day schedule with
three shifts as follows:
• a morning shift from approximately 7:00 AM to 3:00 PM (Morning Shift), and
• an evening shift from approximately 3:00 PM to 11:00 PM (Evening Shift), or
• a night shift from approximately 11:00 PM to 7:00 AM (Night Shift).
Combinations of these shifts would be referred to “Morning/Night” or “Night/Morning.”
Morning/Night Construction Activities
As shown in Table 15: Estimated Unmitigated Concentration Impacts from Construction Activities for Morning/Night Scenario, for the air quality receptors, the maximum Project construction incremental 1-
hour NO2 impacts to a sensitive receptor, including background concentrations and Adjusted Baseline,
would be 0.16 ppm (see Attachment A: Air Quality Dispersion Modeling Methodology and Assumptions),
which is below the State threshold of 0.18 ppm. The maximum incremental 98th percentile 1-hour NO2 impacts to a sensitive receptor, including background concentrations and Adjusted Baseline, would be 0.12
ppm, which is potentially above the federal threshold of 0.10 ppm. The maximum Project construction
incremental annual NO2 impacts including background concentrations and Adjusted Baseline would be
0.01 ppm, which is below the thresholds of 0.03 ppm (State) and 0.0534 ppm (federal). Therefore,
unmitigated construction activities would potentially exceed the 1-hour and would result in a potentially
significant air quality impact of 1-hour NO2 on nearby receptors due to construction activities but would
not exceed the annual NO2 thresholds and would result in a less than significant air quality impact of
annual NO2 on nearby receptors due to construction activities.
As shown in Table 15: Estimated Unmitigated Concentration Impacts from Construction Activities for Morning/Night Scenario, for the air quality receptors, the Project construction maximum incremental 24-
hour and annual PM10 impacts to a sensitive receptor would be 2.79 µg/m3 and 0.22 µg/m3, respectively.
Impacts would be below the 24-hour PM10 threshold of 10.4 µg/m3 and below the annual PM10 threshold
of 1.0 µg/m3. The Project construction maximum incremental 24-hour PM2.5 impacts would be 2.56 µg/m3,
which would be below the 24-hour PM2.5 threshold of 10.4 µg/m3. Therefore, unmitigated construction
activities would result in a less than significant air quality impact of PM10 and PM2.5 on nearby receptors
due to construction activities.
As shown in Table 16: Estimated Mitigated Concentration Impacts from Construction Activities for Morning/Night Scenario, for the air quality receptors, the maximum Project construction incremental 1-
hour NO2 impacts to a sensitive receptor, including background concentrations and Adjusted Baseline,
would be 0.13 ppm, which is below the State threshold of 0.18 ppm. The maximum incremental 98th

Air Quality and Health Risk Assessment Technical Report
RCH Group Page 44 of 76 November 17, 2020
percentile 1-hour NO2 impacts to a sensitive receptor, including background concentrations and Adjusted
Baseline, would be 0.10 ppm, which is within the federal threshold of 0.10 ppm. The maximum Project
construction incremental annual NO2 impacts to a sensitive receptor, including background concentrations
and Adjusted Baseline, would be 0.01 ppm, which is below the thresholds of 0.03 ppm (State) and 0.0534
ppm (federal). Therefore, mitigated construction activities would not the 1-hour and annual NO2
thresholds and would be a less than significant air quality impact of NO2 on nearby receptors due to
construction activities.
As shown in Table 16: Estimated Mitigated Concentration Impacts from Construction Activities for Morning/Night Scenario, for the air quality receptors, the Project construction maximum incremental 24-
hour and annual PM10 impacts to a sensitive receptor would be 0.62 µg/m3 and 0.06 µg/m3, respectively.
Impacts would be below the 24-hour PM10 threshold of 10.4 µg/m3 and the annual PM10 threshold of 1.0
µg/m3. The Project construction maximum incremental 24-hour PM2.5 impacts would be 0.60 µg/m3,
which would be below the 24-hour PM2.5 threshold of 10.4 µg/m3. Therefore, mitigated construction
activities would result in a less than significant air quality impact of PM10 and PM2.5 on nearby receptors
due to construction activities.
Additionally, as shown in Table 16: Estimated Mitigated Concentration Impacts from Construction Activities for Morning/Night Scenario, for the air quality receptors, the proposed Project construction
incremental SO2 and CO impacts, including background concentrations and Adjusted Baseline, would be
well below the significance thresholds and would be a less than significant air quality impact of SO2 and
CO on all nearby receptors due to construction activities.

Air Quality and Health Risk Assessment Technical Report
RCH Group Page 45 of 76 November 17, 2020
Table 15 Estimated Unmitigated Concentration Impacts from Construction Activities for Morning/Night Scenario
(Approximately 7:00 AM to 3:00 PM and 11:00 PM to 7:00 AM)
Criteria
Maximum 1-Hour
NO2 (ppm)
98% 1-Hour
NO2 (ppm)
CAAQS Annual
NO2 (ppm)
NAAQS Annual
NO2 (ppm)
24-Hour PM10
(µg/m3)
Annual PM10
(µg/m3)
24-Hour PM2.5
(µg/m3)
CAAQS 1-Hour
SO2 (ppm)
NAAQS 1-Hour
SO2 (ppm)
24-Hour SO2
(ppm)
1-Hour CO
(ppm)
8-Hour CO
(ppm) Off-site Receptor (Project Increment) 0.06 0.05 <0.01 <0.01 2.79 0.22 2.56 <0.01 <0.01 <0.01 0.29 0.03 Background Concentration 0.07 0.05 0.01 0.01 0.01 0.01 <0.01 2.10 1.60 Adjusted Baseline Concentrations 0.03 0.02 <0.01 <0.01 <0.01 <0.01 <0.01 1.80 0.80 Total Concentration 0.16 0.12 0.01 0.01 2.79 0.22 2.56 0.02 0.02 <0.01 4.19 2.43 Significance Threshold 0.18 0.10 0.03 0.0534 10.4 1.00 10.4 0.25 0.075 0.04 20.0 9.00 Potentially Significant (Yes or No)? No Yes No No No No No No No No No No
Source: RCH Group, 2020 Total concentrations reflect rounding of values (Project Increment plus background concentration plus Adjusted Baseline). Per SCAQMD guidance, PM10 and PM2.5 impacts do not include background
concentrations.
Table 16 Estimated Mitigated Concentration Impacts from Construction Activities for Morning/Night Scenario
(Approximately 7:00 AM to 3:00 PM and 11:00 PM to 7:00 AM)
Criteria
Maximum 1-Hour
NO2 (ppm)
98% 1-Hour
NO2 (ppm)
CAAQS Annual
NO2 (ppm)
NAAQS Annual
NO2 (ppm)
24-Hour PM10
(µg/m3)
Annual PM10
(µg/m3)
24-Hour PM2.5
(µg/m3)
CAAQS 1-Hour
SO2 (ppm)
NAAQS 1-Hour
SO2 (ppm)
24-Hour SO2
(ppm)
1-Hour CO
(ppm)
8-Hour CO
(ppm) Off-site Receptor (Project Increment) 0.04 0.03 <0.01 <0.01 0.62 0.06 0.60 <0.01 <0.01 <0.01 0.67 0.07 Background Concentration 0.07 0.05 0.01 0.01 0.01 0.01 <0.01 2.10 1.60 Adjusted Baseline Concentrations 0.03 0.02 <0.01 <0.01 <0.01 <0.01 <0.01 1.80 0.80 Total Concentration 0.13 0.10 0.01 0.01 0.62 0.06 0.60 0.02 0.02 <0.01 4.57 2.47 Significance Threshold 0.18 0.10 0.03 0.0534 10.4 1.00 10.4 0.25 0.075 0.04 20.0 9.00 Potentially Significant (Yes or No)? No No No No No No No No No No No No
Source: RCH Group, 2020 Total concentrations reflect rounding of values (Project Increment plus background concentration plus Adjusted Baseline). Per SCAQMD guidance, PM10 and PM2.5 impacts do not include background
concentrations.

Air Quality and Health Risk Assessment Technical Report
RCH Group Page 46 of 76 November 17, 2020
Summary of Air Quality Concentration Assessment Results
The following concluding statements can be made about the ambient air quality analysis results:
• The maximum concentrations of the 1-hour NO2 impacts would not exceed the significance threshold and would be a less than significant impact for all off-site receptors due to construction activities with mitigation.
• The maximum concentrations of the annual NO2 impacts would not exceed the significance threshold for the CAAQS and the NAAQS and would be a less than significant impact for all off-site receptors due to construction activities.
• The maximum concentrations of 24-hour and annual PM10 and 24-hour PM2.5 would not exceed the significance threshold and would be less than significant impact for all off-site receptors due to construction activities with mitigation.
• The maximum concentrations of SO2 and CO including background concentrations would be well below the significance thresholds and would be a less than significant air quality impact of SO2 and CO on all nearby receptors due to construction activities.
• Generally (it depends on receptor location and averaging period), the concentrations due to construction activities would be potentially greater for the morning/evening scenario compared to the morning/night scenario. This may have something to do with the morning/evening scenario having a greater intensity than the morning/night especially during overnight hours which tend to exhibit calm, stagnant air flow conditions and thus, higher pollutant concentrations.
10.0 HEALTH RISK ASSESSMENT
The HRA was conducted following methodologies in OEHHA’s Air Toxics Hot Spots Program Guidance
Manual for Preparation of Health Risk Assessments41 and SCAQMD’s Risk Assessment Procedures for Rule
1401, 1401.1 and 212.42 This was accomplished by applying the estimated concentrations at the receptors
analyzed to the established cancer risk estimates and acceptable reference concentrations for noncancer
health effects.
Recent OEHHA's revisions to its Guidance Manual were primarily designed to ensure that the greater
sensitivity of children to cancer and other health risks is reflected in the HRA. For example, OEHHA now
recommends that risks be analyzed separately for multiple age groups, focusing especially on young
children and teenagers, rather than the past practice of analyzing risks to the general population, without
41 Office of Environmental Health Hazard Assessment, Air Toxics Hot Spots Program Guidance Manual for Preparation of Health Risk Assessments, February 2015, Accessed July 6, 2020 at: http://oehha.ca.gov/air/hot_spots/hotspots2015.html.
42 South Coast Air Quality Management District, Risk Assessment Procedures for Rule 1401, 1401.1 and 212, September 1, 2017, Accessed July 6, 2020 at: http://www.aqmd.gov/docs/default-source/permitting/rule-1401-risk-assessment/riskassessproc-v8-1.pdf?sfvrsn=12.

Air Quality and Health Risk Assessment Technical Report
RCH Group Page 47 of 76 November 17, 2020
distinction by age. OEHHA also now recommends that statistical "age sensitivity factors" be incorporated
into an HRA, and that children's relatively high breathing rates be accounted for. On the other hand, the
Guidance Manual revisions also include some changes that would reduce calculated health risks. For
example, under the former guidance, OEHHA recommended that residential cancer risks be assessed by
assuming 70 years of exposure at a residential receptor; under the Guidance Manual, this assumption is
lessened to 30 years.
Attachment B: Health Risk Assessment Methodology and Assumptions provides additional
methodologies and assumptions used within the health risk assessment. Attachment C: Supplemental
Health Impact Information provides additional information on health impacts.
Health Impacts
The proposed Project would constitute a new emission source of DPM due to its construction activities.
Studies have demonstrated that DPM from diesel-fueled engines is a human carcinogen and that chronic
(long-term) inhalation exposure to DPM poses a chronic health impact. Health effects from carcinogenic
air toxics are usually described in terms of individual cancer risk. Individual cancer risk is the likelihood
that a person exposed to air toxic concentrations over a 70-year lifetime will contract cancer, based on the
use of standard risk-assessment methodology and a 30-year exposure duration. The maximally exposed
individual (MEI) represents the worst–case risk estimate, based on a theoretical person exposed for a
period of 30 years at the highest concentration. This is a highly conservative assumption since most people
do not remain in place all day and on average residents change residences every 11 to 12 years and do not
stay in the same place of work for 25 years. In addition, this assumes that individuals are experiencing
outdoor concentrations for the entire exposure period (even when indoors). A school child exposure
duration is between ages 2 and 16 years old, which again, is conservative because the elementary, middle,
and high school are not often located at the same location.
This HRA analyzes the incremental cancer risks to sensitive receptors in the vicinity of the proposed
Project, using emission rates (in pounds per hour) derived from CARB’s OFFROAD emission model. A
further description of the sensitive receptors included in the dispersion modeling analysis and HRA is
provided in Attachment A: Air Quality Dispersion Modeling Methodology and Assumptions.
Notably, peak daily emission estimates were used to estimate short-term air concentrations (1-hour, 8-
hour, and 24-hour) while annual emission estimates were used to estimate annual air concentrations. DPM
(reported as exhaust emissions of PM2.5) and other air toxics emission rates were utilized along with
derived concentrations from USEPA’s AERMOD atmospheric dispersion model (using a unit emission rate
of 1) to calculate air concentrations at receptors in the Project vicinity. This HRA is intended to provide a

Air Quality and Health Risk Assessment Technical Report
RCH Group Page 48 of 76 November 17, 2020
worst–case estimate of the increased exposure by employing a standard emission estimation program, an
accepted pollutant dispersion model, approved toxicity factors, and conservative exposure parameters.
In accordance with OEHHA Air Toxics Hot Spots Program Guidance Manual for Preparation of Health Risk
Assessments, this HRA was accomplished by applying the highest estimated concentrations of specific air
toxics at the receptors analyzed to the established cancer potency factors and acceptable reference
concentrations for noncancer health effects. Increased cancer risks were calculated using the modeled
concentrations and OEHHA-recommended methodologies for both a child exposure (3rd trimester through
two years of age and ages two through 16 years) and adult exposure (16 to 30 years). The cancer risk
calculations were based on applying the OEHHA-recommended age sensitivity factors and breathing rates,
as well as the fraction of time at home (100 percent for child and 73 percent for adult), and an exposure
duration of 30 years, to the concentration exposures; over a 70-year lifetime. As a conservative
assumption, children are assumed to attend a daycare or school in close proximity to their home and no
discount should be taken for time spent outside of the area (i.e., 100 percent fraction of time) affected by
the Project’s emissions. For worker exposures, it is assumed that the working age begins at 16 years, and
that exposures to Project emissions occur during the work shift which is typically up to eight hours per day
during workdays. Age-sensitivity factors reflect the greater sensitivity of infants and small children to
cancer causing air pollutants.
Per Education Code Section 17213 (School Site Selection And Approval Guide), a school shall only be
located where, “the health risks from the facilities or other pollution sources do not and will not constitute
an actual or potential endangerment of public health to persons who would attend or be employed at the
school.” Proposed projects located within ¼ mile of a school that involve the construction or alteration of
a facility that might reasonably be anticipated to emit hazardous air emissions, or the handling of an
extremely hazardous substance or mixture containing extremely hazardous substances in a quantity equal
to or greater than the state threshold quantity specified in subdivision (j) of HSC Section §25532, and that
may impose a health or safety hazard to persons who would attend or would be employed at the school,
must meet all requirements per CEQA Guidelines §15186 (b)(1)(2). Therefore, the HRA included nearby
schools as sensitive receptors. Section 7.0 of this document describes recommendations (such as Indoor
air filtration systems with MERV 13 or higher and MM AQ-1 through MM AQ-11) to reduce the health
impacts at certain schools/daycare centers.
These conservative methodologies overestimate both noncarcinogenic and carcinogenic health risk,
possibly by an order of magnitude or more. Therefore, for carcinogenic risks, the actual probabilities of
cancer formation in the populations of concern due to exposure to carcinogenic pollutants are likely to be
lower than the risks derived using the HRA methodology. The extrapolation of toxicity data in animals to
humans, the estimation of concentration prediction methods within dispersion models; and the variability

Air Quality and Health Risk Assessment Technical Report
RCH Group Page 49 of 76 November 17, 2020
in lifestyles, fitness and other confounding factors of the human population also contribute to the
overestimation of health impacts. Therefore, the results of this HRA, although conducted in accordance
with all regulatory agency protocols, are highly overstated.
SCAQMD currently does not require the evaluation of long-term cancer risk or chronic health impacts for
a short-term project.43 The proposed Project’s construction activities would occur over a six-year period
(2022 into 2026). The relatively short duration when compared to the 30-year exposure duration would
limit exposures to off-site receptors. Secondly, exhaust emissions associated with the construction
activities would not exceed the air concentrations significance thresholds (see Section 9) and thus, it is
anticipated that construction emissions would not pose a threat to health impacts at nearby receptors.
The SCAQMD thresholds of significance applied to assess project-level health impacts are the exposure of
persons to substantial levels of air toxics resulting in (a) a cancer risk level greater than 10 per one million
persons or (b) a noncancerous risk (chronic or acute) hazard index greater than 1 or (c) a cancer burden of
greater than 0.5 excess cancer cases.44 For this threshold, sensitive receptors include residential uses,
schools, daycare centers, nursing homes, medical centers, and off-site workers. A total of 1,285 sensitive
receptors were analyzed.
Construction Activities
Morning/Evening Construction Activities
Table 17: Estimated Unmitigated Health Impacts from Construction Activities for Morning/Evening
Scenario provides the proposed Project’s unmitigated health impacts from construction activities for
existing residences, schools, daycares, and off-site workers receptors. A large majority of the health
impacts are due to off-road construction equipment operating within the Project alignment with a minimal
contribution from off-site construction truck travel along nearby roadways.
Table 18: Estimated Mitigated Health Impacts from Construction Activities for Morning/Evening
Scenario provides the mitigated proposed Project health impacts from construction activities for existing
residences, schools, daycares, and off-site workers receptors. A large majority of the health impacts are
due to off-road construction equipment operating within the Project alignment with a minimal
contribution from off-site construction truck travel along nearby roadways.
43 SCAQMD is currently reviewing and developing guidance for the health risk assessment of construction activities. 44 Cancer burden is the total cancer risk for all receptors divided by the estimated population within the modeling domain.

Air Quality and Health Risk Assessment Technical Report
RCH Group Page 50 of 76 November 17, 2020
Table 17 Estimated Unmitigated Health Impacts from Construction Activities for Morning/Evening Scenario
(Approximately 7:00 AM to 3:00 PM and 3:00 PM to 11:00 PM)
Criteria Cancer Risk Chronic Impact Existing Residence 27.6 0.02 Significance Threshold 10 1.0 Potentially Significant (Yes or No)? Yes No Off-site School/Daycare 2.20 0.02 Significance Threshold 10 1.0 Potentially Significant (Yes or No)? No No Off-site Worker 0.76 0.03 Significance Threshold 10 1.0 Potentially Significant (Yes or No)? No No
Note: Values in bold are in excess of applicable standard. Source: RCH Group, 2020
Table 18 Estimated Mitigated Health Impacts from Construction Activities for Morning/Evening Scenario
(Approximately 7:00 AM to 3:00 PM and 3:00 PM to 11:00 PM)
Criteria Cancer Risk Chronic Impact Existing Residence 7.63 <0.01 Significance Threshold 10 1.0 Potentially Significant (Yes or No)? No No Off-site School/Daycare 0.60 0.01 Significance Threshold 10 1.0 Potentially Significant (Yes or No)? No No Off-site Worker 0.20 0.01 Significance Threshold 10 1.0 Potentially Significant (Yes or No)? No No
NOTES: Values in bold are in excess of applicable standard. Source: RCH Group, 2020
Health Impacts at Existing Residences Due To Construction Activities
As shown in Table 17: Estimated Unmitigated Health Impacts from Construction Activities for
Morning/Evening Scenario, the maximum cancer risk from unmitigated proposed Project construction
emissions for a residential receptor would be 27.6 per one million persons. The maximum cancer risks

Air Quality and Health Risk Assessment Technical Report
RCH Group Page 51 of 76 November 17, 2020
would occur at a residential receptor (also known as the maximum exposed individual or MEI). Thus, the
cancer risk for residential receptors due to construction activities would be potentially above the SCAQMD
threshold of 10 per one million persons and would be potentially significant for residential receptors due
to construction activities. The cancer burden due to construction activities would be 0.03 and below the
SCAQMD threshold of 0.5 excess cancer cases and would therefore be less than significant for all
residential receptors due to construction activities.
The unmitigated chronic health impact would be 0.02, based on a proposed Project-related maximum
annual diesel concentration of 0.08 µg/m3 (per dispersion modeling analysis) or 0.08 µg/m3/5.0 µ g/m3,
which is 0.02. The chronic health impact due to construction activities would be below the Project-level
threshold of 1 and would therefore be less than significant for all residential receptors due to construction
activities.
As shown in Table 18: Estimated Mitigated Health Impacts from Construction Activities for
Morning/Evening Scenario, the maximum cancer risk from mitigated proposed Project construction
emissions (see Section 7) for a residential receptor would be 7.6 per one million persons. The maximum
cancer risks would occur at a residential receptor. Thus, the cancer risk for residential receptors due to
construction activities would be less than significant for all residential receptors due to construction
activities. The cancer burden due to construction activities would be 0.01 and below the SCAQMD
threshold of 0.5 excess cancer cases and would therefore be less than significant for all residential
receptors due to construction activities.
The mitigated chronic health impact would be less than 0.01, based on a proposed Project-related
maximum annual diesel concentration of 0.02 µg/m3 (per dispersion modeling analysis) or 0.02 µg/m3/5.0
µ g/m3, which is 0.01. The chronic health impact due to construction activities would be below the Project-
level threshold of 1 and would therefore be less than significant for all residential receptors due to
construction activities.
Health Impacts at Off-site School/Daycare Due To Construction Activities
As shown in Table 17: Estimated Unmitigated Health Impacts from Construction Activities for
Morning/Evening Scenario, the maximum cancer risk from unmitigated proposed Project construction
emissions for a school/daycare receptor would be 2.2 per one million persons. Thus, the cancer risk for
school/daycare receptors due to construction activities would be potentially above the SCAQMD threshold
of 10 per one million persons and would be less than significant for all off-site school/daycare receptors
due to construction activities.

Air Quality and Health Risk Assessment Technical Report
RCH Group Page 52 of 76 November 17, 2020
The maximum unmitigated chronic health impact for an off-site school/daycare receptors would be 0.02
Thus, the chronic health impact due to construction activities for all off-site school/daycare receptors
would be below the Project-level threshold of 1 and the chronic health impact would be less than
significant for all off-site school/daycare receptors due to construction activities.
As shown in Table 18: Estimated Mitigated Health Impacts from Construction Activities for
Morning/Evening Scenario, the maximum cancer risk from mitigated proposed Project construction
emissions (see Section 7) for a school/daycare receptor would be 0.6 per one million persons (using
Mitigation Measures AQ-1 through AQ-12).45 In addition to the identified off-road equipment mitigation
measures, additional measures for ventilation systems at certain schools and daycare facilities is provided
to assist in maintaining adequate air quality. Thus, the cancer risk for school/daycare receptors due to
construction activities would be below the SCAQMD threshold of 10 per one million persons and would
be less than significant health impacts for all school/daycare receptors due to construction activities.
The maximum mitigated chronic health impact for a school/daycare receptor would be 0.01. Thus, the
chronic health impact due to construction activities for all school/daycare receptors would be below the
Project-level threshold of 1 and the chronic health impact would be less than significant for all
school/daycare receptors due to construction activities.
Health Impacts at Off-site Workers Due To Construction Activities
As shown in Table 17: Estimated Unmitigated Health Impacts from Construction Activities for
Morning/Evening Scenario, the maximum cancer risk from unmitigated proposed Project construction
emissions for an off-site worker receptor (such as office buildings, retail centers, hotels, hospitals) would
be 0.8 per one million persons. Thus, the cancer risk for off-site worker receptors due to construction
activities would be below the SCAQMD threshold of 10 per one million persons and would be less than
significant health impacts for all off-site worker receptors due to construction activities.
The maximum unmitigated chronic health impact modeled to occur at an off-site worker receptor would
be 0.03. Thus, the chronic health impact due to construction activities at all off-site worker receptors
would be below the Project-level threshold of 1 and would be less than significant for all off-site worker
receptors due to construction activities.
As shown in Table 18: Estimated Mitigated Health Impacts from Construction Activities for
Morning/Evening Scenario, the maximum cancer risk from mitigated proposed Project construction
emissions (see Section 7) for an off-site worker receptor would be 0.2 per one million persons. Thus, the
45 Primarily due to construction activities during year 3 and 4 associated with Phase 2 and 3.

Air Quality and Health Risk Assessment Technical Report
RCH Group Page 53 of 76 November 17, 2020
cancer risk for off-site worker receptors due to construction activities would be below the SCAQMD
threshold of 10 per one million persons and would be less than significant health impacts for all off-site
worker receptors due to construction activities.
The maximum mitigated chronic health impact modeled to occur at an off-site worker receptor would be
0.01. Thus, the chronic health impact due to construction activities at all off-site worker receptors would
be below the Project-level threshold of 1 and would be less than significant for all off-site worker receptors
due to construction activities.
Morning/Night Construction Activities
Table 19: Estimated Unmitigated Health Impacts from Construction Activities for Morning/Night
Scenario provides the proposed Project’s unmitigated health impacts from construction activities for
existing residences, schools, daycares, and off-site workers receptors. A large majority of the health
impacts are due to off-road construction equipment operating within the Project alignment with a minimal
contribution from off-site construction truck travel along nearby roadways.
Table 20: Estimated Mitigated Health Impacts from Construction Activities for Morning/Night Scenario
provides the mitigated proposed Project health impacts (see Section 7) from construction activities for
existing residences, schools, daycares, and off-site workers receptors. A large majority of the health
impacts are due to off-road construction equipment operating within the Project alignment with a minimal
contribution from off-site construction truck travel along nearby roadways.
Health Impacts at Existing Residences Due To Construction Activities
As shown in Table 19: Estimated Unmitigated Health Impacts from Construction Activities for
Morning/Night Scenario, the maximum cancer risk from unmitigated proposed Project construction
emissions for a residential receptor would be 33.8 per one million persons. Thus, the cancer risk for
residential receptors due to construction activities would be potentially above the SCAQMD threshold of
10 per one million persons and would be potentially significant for residential receptors due to construction
activities. The cancer burden due to construction activities would be 0.03 and below the SCAQMD
threshold of 0.5 excess cancer cases and would therefore be less than significant for all residential
receptors due to construction activities.
The unmitigated chronic health impact would be 0.02, based on a proposed Project-related maximum
annual diesel concentration of 0.10 µg/m3 (per dispersion modeling analysis) or 0.10 µg/m3/5.0 µ g/m3,
which is 0.02. The chronic health impact due to construction activities would be below the Project-level
threshold of 1 and would therefore be less than significant for all residential receptors due to construction
activities.
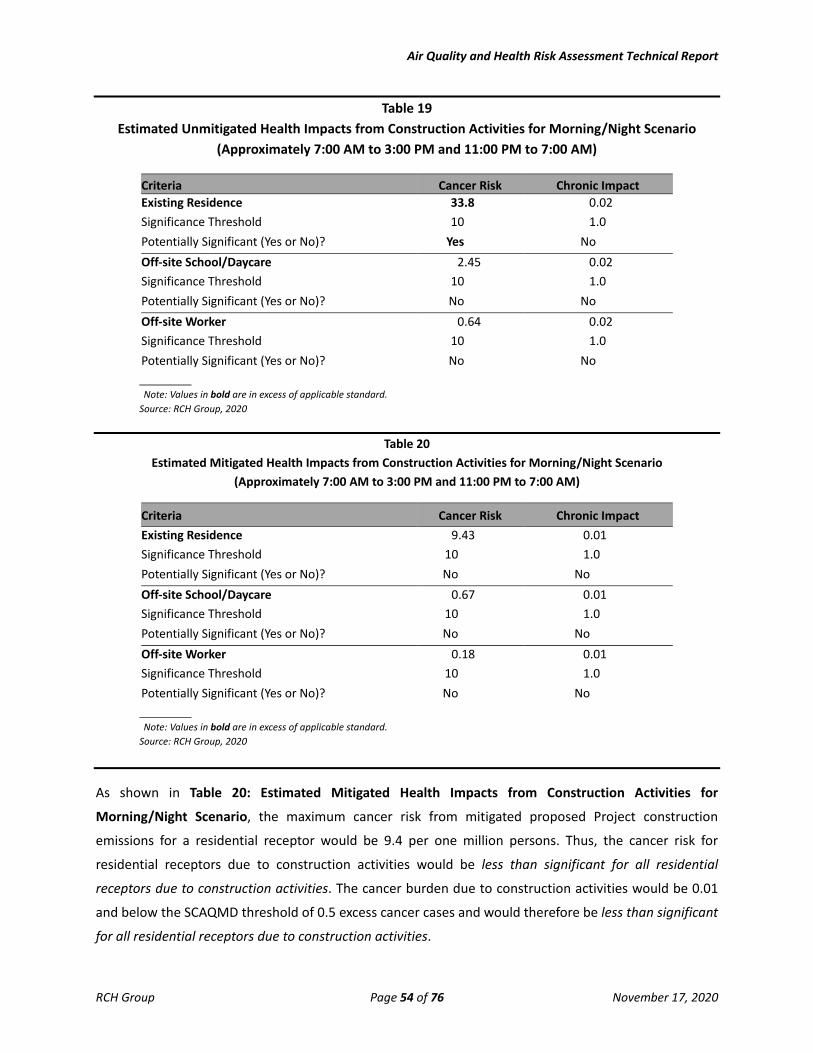
Air Quality and Health Risk Assessment Technical Report
RCH Group Page 54 of 76 November 17, 2020
Table 19 Estimated Unmitigated Health Impacts from Construction Activities for Morning/Night Scenario
(Approximately 7:00 AM to 3:00 PM and 11:00 PM to 7:00 AM)
Criteria Cancer Risk Chronic Impact Existing Residence 33.8 0.02 Significance Threshold 10 1.0 Potentially Significant (Yes or No)? Yes No Off-site School/Daycare 2.45 0.02 Significance Threshold 10 1.0 Potentially Significant (Yes or No)? No No Off-site Worker 0.64 0.02 Significance Threshold 10 1.0 Potentially Significant (Yes or No)? No No
Note: Values in bold are in excess of applicable standard. Source: RCH Group, 2020
Table 20 Estimated Mitigated Health Impacts from Construction Activities for Morning/Night Scenario
(Approximately 7:00 AM to 3:00 PM and 11:00 PM to 7:00 AM)
Criteria Cancer Risk Chronic Impact Existing Residence 9.43 0.01 Significance Threshold 10 1.0 Potentially Significant (Yes or No)? No No Off-site School/Daycare 0.67 0.01 Significance Threshold 10 1.0 Potentially Significant (Yes or No)? No No Off-site Worker 0.18 0.01 Significance Threshold 10 1.0 Potentially Significant (Yes or No)? No No
Note: Values in bold are in excess of applicable standard. Source: RCH Group, 2020
As shown in Table 20: Estimated Mitigated Health Impacts from Construction Activities for
Morning/Night Scenario, the maximum cancer risk from mitigated proposed Project construction
emissions for a residential receptor would be 9.4 per one million persons. Thus, the cancer risk for
residential receptors due to construction activities would be less than significant for all residential
receptors due to construction activities. The cancer burden due to construction activities would be 0.01
and below the SCAQMD threshold of 0.5 excess cancer cases and would therefore be less than significant
for all residential receptors due to construction activities.

Air Quality and Health Risk Assessment Technical Report
RCH Group Page 55 of 76 November 17, 2020
The mitigated chronic health impact would be 0.01, based on a proposed Project-related maximum annual
diesel concentration of 0.03 µg/m3 (per dispersion modeling analysis) or 0.03 µg/m3/5.0 µ g/m3, which is
0.01. The chronic health impact due to construction activities would be below the Project-level threshold
of 1 and would therefore be less than significant for all residential receptors due to construction activities.
Health Impacts at Off-site School/Daycare Due To Construction Activities
As shown in Table 19: Estimated Unmitigated Health Impacts from Construction Activities for
Morning/Night Scenario, the maximum cancer risk from unmitigated proposed Project construction
emissions for a school/daycare receptor would be 2.5 per one million persons. Thus, the cancer risk for
school/daycare receptors due to construction activities would be potentially above the SCAQMD threshold
of 10 per one million persons and would be less than significant for all off-site school/daycare receptors
due to construction activities.
The maximum unmitigated chronic health impact for an off-site school/daycare receptors would be 0.01.
Thus, the chronic health impact due to construction activities for all off-site school/daycare receptors
would be below the Project-level threshold of 1 and the chronic health impact would be less than
significant for all off-site school/daycare receptors due to construction activities.
As shown in Table 20: Estimated Mitigated Health Impacts from Construction Activities for
Morning/Night Scenario, the maximum cancer risk from mitigated proposed Project construction
emissions (see Section 7) for a school/daycare receptor would be 0.7 per one million persons (using
Mitigation Measures AQ-1 through AQ-13).46 In addition to the identified off-road equipment mitigation
measures, additional measures for ventilation systems at certain schools and daycare facilities is provided
to assist in maintaining adequate air quality. Thus, the cancer risk for school/daycare receptors due to
construction activities would be below the SCAQMD threshold of 10 per one million persons and would
be less than significant health impacts for all school/daycare receptors due to construction activities.
The maximum mitigated chronic health impact for all school/daycare receptors would be 0.01. Thus, the
chronic health impact due to construction activities for all school/daycare receptors would be below the
Project-level threshold of 1 and the chronic health impact would be less than significant for all
school/daycare receptors due to construction activities.
46 Primarily due to construction activities during year 3 and 4 associated with Phase 2 and 3.

Air Quality and Health Risk Assessment Technical Report
RCH Group Page 56 of 76 November 17, 2020
Health Impacts at Off-site Workers Due To Construction Activities
As shown in Table 19: Estimated Unmitigated Health Impacts from Construction Activities for
Morning/Night Scenario, the maximum cancer risk from unmitigated proposed Project construction
emissions for an off-site worker receptor (such as office buildings, retail centers, hotels, hospitals) would
be 0.6 per one million persons. Thus, the cancer risk for off-site worker receptors due to construction
activities would be below the SCAQMD threshold of 10 per one million persons and would be less than
significant health impacts for all off-site worker receptors due to construction activities.
The maximum unmitigated chronic health impact modeled to occur at an off-site worker receptor would
be 0.01. Thus, the chronic health impact due to construction activities at all off-site worker receptors
would be below the Project-level threshold of 1 and would be less than significant for all off-site worker
receptors due to construction activities.
As shown in Table 20: Estimated Mitigated Health Impacts from Construction Activities for
Morning/Night Scenario, the maximum cancer risk from mitigated proposed Project construction
emissions for an off-site worker receptor would be 0.2 per one million persons. Thus, the cancer risk for
off-site worker receptors due to construction activities would be below the SCAQMD threshold of 10 per
one million persons and would be less than significant health impacts for all off-site worker receptors due
to construction activities.
The maximum mitigated chronic health impact modeled to occur at an off-site worker receptor would be
0.01. Thus, the chronic health impact due to construction activities at all off-site worker receptors would
be below the Project-level threshold of 1 and would be less than significant for all off-site worker receptors
due to construction activities.
Summary of Health Risk Assessment Results
The following concluding statements can be made about the health risk assessment results:
• The cancer risk for residential receptors due to construction activities would be potentially above the SCAQMD threshold of 10 per one million persons and would be less than significant for residential receptors due to construction activities with mitigation.
• The cancer risk for all school/daycare receptors due to construction activities would be below the SCAQMD threshold of 10 per one million persons and would be less than significant for school/daycare receptors due to construction activities.
• The cancer risk for off-site worker receptors due to construction activities would be below the SCAQMD threshold of 10 per one million persons and would be less than significant health impacts for all off-site worker receptors due to construction activities.

Air Quality and Health Risk Assessment Technical Report
RCH Group Page 57 of 76 November 17, 2020
• Generally (it depends on receptor location), the cancer risk due to construction activities would be potentially greater for the morning/night scenario compared to the morning/evening scenario and those adverse impacts would extend over a larger area near the Project alignment. This may have something to do with the morning/night scenario having a greater intensity than the morning/evening especially during overnight hours which tend to exhibit calm, stagnant air flow conditions and thus, higher pollutant concentrations.
11.0 GREENHOUSE GAS EMISSIONS
“Global warming” and “global climate change” are the terms used to describe the increase in the average
temperature of the earth’s near-surface air and oceans since the mid-20th century and its projected
continuation. Warming of the climate system is now considered to be unequivocal (IPCC, 2007), with global
surface temperature increasing approximately 1.33 degrees Fahrenheit (°F) over the last 100 years.
Continued warming is projected to increase global average temperature between 2 and 11°F over the next
100 years.
Natural processes and human actions have been identified as the causes of this warming. The International
Panel on Climate Change (IPCC) concludes that variations in natural phenomena such as solar radiation
and volcanoes produced most of the warming from pre-industrial times to 1950 and had a small cooling
effect afterward. After 1950, however, increasing GHG concentrations resulting from human activity such
as fossil fuel burning and deforestation have been responsible for most of the observed temperature
increase. These basic conclusions have been endorsed by more than 45 scientific societies and academies
of science, including all of the national academies of science of the major industrialized countries. Since
2007, no scientific body of national or international standing has maintained a dissenting opinion.
Increases in GHG concentrations in the earth’s atmosphere are thought to be the main cause of human-
induced climate change. GHG naturally trap heat by impeding the exit of solar radiation that has hit the
earth and is reflected back into space. Some GHG occur naturally and are necessary for keeping the earth’s
surface inhabitable. However, increases in the concentrations of these gases in the atmosphere during the
last 100 years have decreased the amount of solar radiation that is reflected back into space, intensifying
the natural greenhouse effect and resulting in the increase of global average temperature.
Gases that trap heat in the atmosphere are referred to as GHG because they capture heat radiated from
the sun as it is reflected back into the atmosphere, much like a greenhouse does. The accumulation of
GHG has been implicated as the driving force for global climate change. The primary GHG are carbon
dioxide (CO2), methane (CH4), and nitrous oxide (N2O), ozone, and water vapor.
While the presence of the primary GHG in the atmosphere are naturally occurring, CO2, CH4, and N2O are
also emitted from human activities, accelerating the rate at which these compounds occur within earth’s

Air Quality and Health Risk Assessment Technical Report
RCH Group Page 58 of 76 November 17, 2020
atmosphere. Emissions of CO2 are largely by-products of fossil fuel combustion, whereas methane results
from off-gassing associated with agricultural practices and landfills. Other GHG include
hydrofluorocarbons, perfluorocarbons, and sulfur hexafluoride, and are generated in certain industrial
processes. Greenhouse gases are typically reported in “carbon dioxide-equivalent” measures (CO2e).47
There is international scientific consensus that human-caused increases in GHG have and will continue to
contribute to global warming. Potential global warming impacts may include, but are not limited to, loss
in snowpack, sea level rise, more extreme heat days per year, more high ozone days, more large forest
fires, and more drought years. Secondary effects are likely to include a global rise in sea level, impacts to
agriculture, changes in disease vectors, and changes in habitat and biodiversity.
Transit and Intercity Rail Capital Program (TIRCP)
The Transit and Intercity Rail Capital Program (TIRCP) was created by Senate Bill (SB) 862 (Chapter 36,
Statutes of 2014) and modified by Senate Bill 9 (Chapter 710, Statutes of 2015) to provide grants from the
Greenhouse Gas Reduction Fund to fund transformative capital improvements that will modernize
California’s intercity, commuter, and urban rail systems, and bus and ferry transit systems to reduce
emissions of greenhouse gases by reducing congestion and vehicle miles traveled throughout California.
The goal of the TIRCP is to provide monies to fund transformative capital improvements that modernize
California’s intercity rail, bus, ferry and rail transit systems to achieve the following objectives:
• Reduction in greenhouse gas emissions;
• Expand and improve rail service to increase ridership;
• Integrate the rail service of the State’s various rail operations, including integration with the high-speed rail system; and
• Improve safety
City of Inglewood Energy Efficiency Climate Action Plan
An Energy Efficiency Climate Action Plan (EECAP) has been developed by the City of Inglewood (City).48
The Inglewood EECAP serves as the roadmap for the City to reduce GHG emissions, create jobs, and
prepare for the impacts of climate change on public health, infrastructure, the economy, ecosystems, and
public spaces in the City. The EECAP builds on the goals and policies in the City’s General Plan to further
47 Because of the differential heat absorption potential of various GHG, GHG emissions are frequently measured in “carbon dioxide-equivalents,” which present a weighted average based on each gas’s heat absorption (or “global warming”) potential.
48 City of Inglewood, Climate Action Plan, December 2015, Accessed July 6, 2020 at: http://www.southbaycities.org/sites/default/files/EECAP_Inglewood_Final_20151218.pdf and https://www.cityofinglewood.org/225/Sustainability.

Air Quality and Health Risk Assessment Technical Report
RCH Group Page 59 of 76 November 17, 2020
the City’s efforts to build health equity through the reduction of local GHG emissions, and to
simultaneously ensure that the community is well prepared for the impacts of climate change.
The EECAP includes an inventory of the City’s emissions, establish an emissions reduction target, and
identifies City and community actions to reduce emissions. The City revised its existing 2005 GHG
emissions inventory (baseline) with better transportation and solid waste data and compiled a 2012
inventory updates that allows the City to start assessing emissions trends over time while the interim years
(2007 and 2010) provide context and may help identify trends or anomalies.
From 2005 to 2010, emissions decreased by over 2 percent. This reduction trend continued into the most
recent 2012 inventory update year, with total emissions having decreased an additional 2 percent between
2010 and 2012. The Transportation sector was the largest contributor to emissions in both 2005 (48
percent) and 2012 (52 percent) by producing 287,372 MT CO2e in 2005 and 294,376 MT CO2e in 2012. This
change represents a 2.4 percent increase in emissions from 2005 to 2012. Commercial/Industrial energy
is the second-largest contributor to emissions, adding 23 percent in 2005 and 20 percent in 2012. While
the proportion of emissions did not change significantly over time, the total emissions decreased by about
14 percent from 2005 to 2012, from 133,521 MT CO2e to 114,719 MT CO2e. The proportion of emissions
from the Residential sector was also steady, at 21 percent in 2005 and 22 percent in 2012, with total
emissions increased by less than 1 percent, from 124,844 MT CO2e in 2005 to 125,250 MT CO2e in 2012.
Solid waste comprised 4 percent of the total (26,385 MT CO2e) in 2005, but was reduced to 3 percent of
the total (17,889 MT CO2e) in 2012. Water, Wastewater, and Off-road sources made up the remaining
emissions in each year. Water, Wastewater, and Off-Road Sources emissions declined from 2005 to 2012.
Off-road sources comprise a very small percentage of overall emissions but are variable primarily due to
construction-related emissions, which are based on the level of development estimated in the City each
year. Other metrics used in the ECAP to evaluate emissions progress include emissions per resident and
per service population (residents + jobs); both metrics also show a declining emissions trend over time, of
about 3 percent between 2005 and 2012.
California Green Building Standards Code
The California Green Building Standards Code or CALGreen is a regulatory code for all residential,
commercial, and school buildings to meet uniform standards in building design intended to minimize
impacts on climate change.
CALGreen does not prevent a local jurisdiction from adopting a more stringent code, as State law provides
methods for local enhancements. CALGreen recognizes that many jurisdictions have developed existing
construction and demolition ordinances, and defers to them as the ruling guidance provided they provide
a minimum 50-percent diversion requirement. CALGreen also provides exemptions for areas not served

Air Quality and Health Risk Assessment Technical Report
RCH Group Page 60 of 76 November 17, 2020
by construction and demolition recycling infrastructure. State building code provides the minimum
standard, which buildings need to meet in order to be certified for occupancy. Enforcement is generally
done by the local building official.
The development of CALGreen is intended to cause a reduction in GHG emissions from buildings; promote
environmentally responsible, cost-effective, healthier places to live and work; reduce energy and water
consumption; and respond to directives issued by the Governor, such as Assembly Bill 32, calling for the
reduction of Statewide GHG emissions to 1990 levels by 2020. In short, CALGreen was established to
reduce construction waste; make buildings more efficient in the use of materials and energy; and reduce
environmental impacts during and after project construction.
CALGreen contains requirements for construction site selection, storm water control during construction,
construction waste reduction, indoor water use reduction, material selection, natural resource
conservation, site irrigation conservation, and more. CALGreen provides for design options allowing a
project designer to determine how best to achieve compliance for a given site or building condition.
CALGreen also requires building commissioning, which is a process for verifying that all building systems,
like heating and cooling equipment and lighting systems, are functioning at their maximum efficiency.
California Environmental Quality Act and Climate Change
Under CEQA, lead agencies are required to disclose the reasonably foreseeable adverse environmental
effects of projects they are considering for approval. GHG emissions have the potential to affect the
environment because they contribute to global climate change. In turn, global climate change has the
potential to cause sea level rise, alter rainfall and snowfall patterns, and affect habitat.
Executive Order S-3-05
Governor Schwarzenegger established Executive Order S-3-05 in 2005, in recognition of California’s
vulnerability to the effects of climate change. Executive Order S-3-05 set forth a series of target dates by
which Statewide emissions of GHG would be progressively reduced, as follows:
• By 2010, reduce GHG emissions to 2000 levels;
• By 2020, reduce GHG emissions to 1990 levels; and
• By 2050, reduce GHG emissions to 80 percent below 1990 levels.
The executive order directed the Secretary of the CalEPA to coordinate a multiagency effort to reduce GHG
emissions to the target levels. The Secretary will also submit biannual reports to the governor and
California Legislature describing the progress made toward the emissions targets, the impacts of global

Air Quality and Health Risk Assessment Technical Report
RCH Group Page 61 of 76 November 17, 2020
climate change on California’s resources, and mitigation and adaptation plans to combat these impacts.
To comply with the executive order, the secretary of CalEPA created the California Climate Action Team,
made up of members from various State agencies and commissions. The team released its first report in
March 2006. The report proposed to achieve the targets by building on the voluntary actions of California
businesses, local governments, and communities and through State incentive and regulatory programs.
Assembly Bill 32 (California Global Warming Solutions Act of 2006)
California passed the California Global Warming Solutions Act of 2006 (AB 32; California Health and Safety
Code Division 25.5, Sections 38500 - 38599). AB 32 establishes regulatory, reporting, and market
mechanisms to achieve quantifiable reductions in GHG emissions and establishes a cap on Statewide GHG
emissions. AB 32 requires that Statewide GHG emissions be reduced to 1990 levels by 2020. This reduction
will be accomplished by enforcing a Statewide cap on GHG emissions that will be phased in starting in
2012. To effectively implement the cap, AB 32 directs CARB to develop and implement regulations to
reduce Statewide GHG emissions from stationary sources. AB 32 specifies that regulations adopted in
response to AB 1493 should be used to address GHG emissions from vehicles. However, AB 32 also includes
language stating that if the AB 1493 regulations cannot be implemented, then CARB should develop new
regulations to control vehicle GHG emissions under the authorization of AB 32.
AB 32 requires CARB to adopt a quantified cap on GHG emissions representing 1990 emissions levels and
disclose how it arrived at the cap; institute a schedule to meet the emissions cap; and develop tracking,
reporting, and enforcement mechanisms to ensure that the State reduces GHG emissions enough to meet
the cap. AB 32 also includes guidance on instituting emissions reductions in an economically efficient
manner, along with conditions to ensure that businesses and consumers are not unfairly affected by the
reductions. Using these criteria to reduce Statewide GHG emissions to 1990 levels by 2020 would
represent an approximate 25 to 30 percent reduction in current emissions levels. However, CARB has
discretionary authority to seek greater reductions in more significant and growing GHG sectors, such as
transportation, as compared to other sectors that are not anticipated to significantly increase emissions.
Under AB 32, CARB must adopt regulations to achieve reductions in GHG to meet the 1990 emissions cap
by 2020.
Climate Change Scoping Plan
AB 32 required CARB to develop a Scoping Plan that describes the approach California will take to reduce
GHG to achieve the goal of reducing emissions to 1990 levels by 2020. The Scoping Plan was first approved
by CARB in 2008 and must be updated every five years. The initial AB 32 Scoping Plan contains the main
strategies California will use to reduce the GHG that cause climate change. The initial Scoping Plan has a
range of GHG reduction actions which include direct regulations, alternative compliance mechanisms,

Air Quality and Health Risk Assessment Technical Report
RCH Group Page 62 of 76 November 17, 2020
monetary and nonmonetary incentives, voluntary actions, market-based mechanisms such as a cap-and-
trade system, and an AB 32 program implementation fee regulation to fund the program. In August 2011,
the initial Scoping Plan was approved by CARB.
The 2013 Scoping Plan Update builds upon the initial Scoping Plan with new strategies and
recommendations. The 2013 Update identifies opportunities to leverage existing and new funds to further
drive GHG emission reductions through strategic planning and targeted low carbon investments. The 2013
Update defines CARB climate change priorities for the next five years and sets the groundwork to reach
California's long-term climate goals set forth in Executive Orders S-3-05 and B-16-2012. The 2013 Update
highlights California progress toward meeting the near-term 2020 GHG emission reduction goals defined
in the initial Scoping Plan. In the 2013 Update, nine key focus areas were identified (energy, transportation,
agriculture, water, waste management, and natural and working lands), along with short-lived climate
pollutants, green buildings, and the cap-and-trade program. On May 22, 2014, the First Update to the
Climate Change Scoping Plan was approved by the Board, along with the finalized environmental
documents. The 2017 Scoping Plan, approved on December 14, 2017, outlines options to meet California’s
aggressive goals to reduce GHGs by 40 percent below 1990 levels by 2030.
Executive Order No. B-30-15
On April 29, 2015, Executive Order No. B-30-15 was issued to establish a California GHG reduction target
of 40 percent below 1990 levels by 2030. Executive Order No. B-30-15 sets a new, interim, 2030 reduction
goal intended to provide a smooth transition to the existing ultimate 2050 reduction goal set by Executive
Order No. S-3-05 (signed by Governor Schwarzenegger in June 2005). It is designed so State agencies do
not fall behind the pace of reductions necessary to reach the existing 2050 reduction goal. Executive Order
No. B-30-15 orders “All State agencies with jurisdiction over sources of GHG emissions shall implement
measures, pursuant to statutory authority, to achieve reductions of GHG emissions to meet the 2030 and
2050 targets.” The Executive Order also states that “CARB shall update the Climate Change Scoping Plan
to express the 2030 target in terms of million metric tons of carbon dioxide equivalent.” The CARB is
currently moving forward with a second update to the Climate Change Scoping Plan to reflect the 2030
reduction target. The updated Scoping Plan will provide a framework for achieving the 2030 target. In
September of 2016, the AB 32 was extended to achieve reductions in GHG of 40 percent below 1990 levels
by 2030. The new plan, outlined in SB 32, involves increasing renewable energy use, putting more electric
cars on the road, improving energy efficiency, and curbing emissions from key industries.
Greenhouse Gas Regional Emission Estimates
In 2018, the United States emitted about 6,677 million metric tons of CO2. Emissions increased from 2017
to 2018 by 3.1 percent. Greenhouse gas emissions in 2018 (after accounting for sequestration from the

Air Quality and Health Risk Assessment Technical Report
RCH Group Page 63 of 76 November 17, 2020
land sector) were 10.2 percent below 2005 levels. This increase was largely driven by an increase in
emissions from fossil fuel combustion, which was a result of multiple factors, including more electricity
use greater due to greater heating and cooling needs due to a colder winter and hotter summer in 2018
in comparison to 2017.49
In 2017, California emitted approximately 424 million metric tons of CO2e, five million metric tons of CO2e
lower than 2016 levels and seven million metric tons of CO2e below the 2020 GHG Limit of 431 million
metric tons of CO2e. Consistent with recent years, these reductions have occurred while California’s
economy has continued to grow and generate jobs. Compared to 2016, California’s GDP grew 3.6 percent
while the carbon intensity of its economy declined by 4.5 percent.
The transportation sector remains the largest source of GHG emissions in the State, but saw a one percent
increase in emissions in 2017, the lowest growth rate over the past four years.50
The composition of GHG emissions in California (expressed as CO2e) were as follows:
• CO2 accounted for 83 percent;
• CH4 accounted for nine percent;
• N2O accounted for three percent; and
• Fluorinated gases (hydrofluorocarbons (HFCs), perfluorinated compounds (PFCs), and sulfur hexafluoride (SF6)) accounted for five percent.
Of these gases, the transportation is the source of approximately 40 percent of the State’s GHG emissions.
The annual increase in transportation emissions in 2017 has slowed down slightly compared to the
previous three years. Emissions from the electricity sector account for 15 percent of the inventory and
show another large drop in 2017 due to a large increase in renewable energy. For the first time since
California started to track GHG emissions, California uses more electricity from zero-GHG sources (for the
purpose of the GHG inventory, these include hydro, solar, wind, and nuclear energy) than from GHG-
emitting sources for both in-state generation and total (in-state plus imports) generation in 2017. The
industrial sector has seen a slight emissions decrease in the past few years, and remains at 21 percent of
the inventory.51
49 United States Environmental Protection Agency, Inventory of U.S. Greenhouse Gas Emissions and Sinks, Accessed July 6, 2020 at https://www.epa.gov/ghgemissions/inventory-us-greenhouse-gas-emissions-and-sinks.
50 California Air Resources Board, Emissions Trends Report 2000-2017, July 11, 2018, Accessed July 6, 2020 at:https://ww3.arb.ca.gov/cc/inventory/pubs/reports/2000_2017/ghg_inventory_trends_00-17.pdf
51 California Air Resources Board, Emissions Trends Report 2000-2017, July 11, 2018, Accessed July 6, 2020 at:https://ww3.arb.ca.gov/cc/inventory/pubs/reports/2000_2017/ghg_inventory_trends_00-17.pdf

Air Quality and Health Risk Assessment Technical Report
RCH Group Page 64 of 76 November 17, 2020
Thresholds of Significance
The standards of significance applied to the analysis of potential GHG impacts are based on Appendix G of
the CEQA Guidelines. According to Appendix G evaluation thresholds, the proposed Project would be
considered to have significant air quality impacts if it were to:
• Generate greenhouse gas emissions, either directly or indirectly, that may have a significant effect on the environment; or
• Conflict with an applicable plan, policy, or regulation adopted for the purpose of reducing the emissions of greenhouse gases.
For the proposed Project, the City is using the SCAQMD, 10,000 MT CO2e per year industrial project screening threshold as the significance threshold in addition to the qualitative thresholds of significance from Section VII of Appendix G to the CEQA Guidelines. However, this threshold has not been adopted by the SCAQMD for use in CEQA documents.
The estimated construction GHG emissions for the proposed Project are 14,348 metric tons of CO2e, which corresponds to 1,413,632 gallons of diesel fuel.52 Given the five year construction period, the annual construction GHG emissions for the proposed Project are 2,870 metric tons of CO2e, which corresponds to 282,726 gallons of diesel fuel per year. As indicated, 50-year amortized construction related GHG emissions would be approximately 287 metric tons of CO2e per year. The results of the comparison are presented in Table 21: Estimated Construction Greenhouse Gas Emissions for the Proposed Project.
Table 21 Estimated Construction Greenhouse Gas Emissions for the Proposed Project
Construction Year CO2e Metric Tons 2022 4,698 2023 4,328 2024 3,521 2025 1,361 2026 440
Total Construction Emissions 14,348 Total 50-Year Amortized Construction Emissions 287
Source: RCH Group, 2020
52 Fuel usage is estimated using the output for CO2 and a 10.15 kg-CO2/gallon conversion factor, as cited in the U.S. Energy Information Administration Voluntary Reporting of Greenhouse Gases Program, https://www.eia.gov/environment/pdfpages/0608s(2009)index.php.

Air Quality and Health Risk Assessment Technical Report
RCH Group Page 65 of 76 November 17, 2020
An Energy Efficiency Climate Action Plan, as discussed previously, has been developed by the City regarding
the reduction of GHG emissions.53 The City EECAP is designed to achieve the goal for GHG emissions
reductions by 40 percent before 2030 and thus, adhere to the AB 32 goals. The proposed Project would
result in a significant impact if it would be in conflict with AB 32 State goals.
The proposed Project would be subject to all applicable permit and planning requirements in place or
adopted by the City, the County, and the State of California at the time that building permits are issued.
The proposed Project would be consistent with City and County plans, policies, and regulations for
reduction of GHGs, and would therefore also be consistent with AB 32 and other Statewide goals for GHG
reduction. Thus, the proposed Project would have a less-than-significant impact related to a conflict with
a GHG reduction plan.
12.0 OPERATIONAL EMISSIONS INVENTORY
The proposed Project would consist of an automated people mover (APM) on an elevated guideway that
runs approximately 1.6 miles along Market Street between Florence Avenue and Manchester Boulevard,
where it transitions east along Manchester Boulevard for approximately half a mile to Prairie Avenue for
approximately one mile. The proposed Project will increase transit ridership throughout the region,
reduce vehicle miles traveled (VMT), criteria air pollutants, and GHG emissions, and improve air quality
throughout the South Coast Air Basin. The proposed Project would also include a MSF to provide regular
and preventive maintenance for the APM trains and well as for vehicle storage, and an operations control
center. The MSF building will be approximately 78,000 square feet (SF) and will be elevated (to match the
track elevation). Up to 300 vehicular parking spaces at-grade for public use will be available. Each of the
three stations will be 8,000 square feet. Components of the proposed Project (such as APM Propulsion
and Control Systems and Stations and parking facilities) would utilize electrical energy for a whole range
of function.
The air quality analysis of operations includes a review of criteria pollutant emissions such as CO, NOx,
SO2, VOC as ROG, coarse particulate or PM10, fine particulate or PM2.5, as well as GHG emissions.
Regulatory models used to estimate air quality impacts and GHG emissions include:
• CARB’s EMFAC54emissions inventory model. EMFAC is the latest emission inventory model that
calculates emission inventories and emission rates for motor vehicles operating on roads in
53 City of Inglewood, Climate Action Plan, December 2015, Accessed July 6, 2020 at: http://www.southbaycities.org/sites/default/files/EECAP_Inglewood_Final_20151218.pdf and https://www.cityofinglewood.org/225/Sustainability.
54 California Air Resources Board, EMFAC2017 User’s Guide, March 1, 2018, Accessed July 23, 2020 at: https://ww3.arb.ca.gov/msei/downloads/emfac2017-volume-i-users-guide.pdf and https://www.arb.ca.gov/emfac/2017/.

Air Quality and Health Risk Assessment Technical Report
RCH Group Page 66 of 76 November 17, 2020
California. This model reflects CARB’s current understanding of how vehicles travel and how much
they emit. EMFAC can be used to show how California motor vehicle emissions have changed over
time and are projected to change in the future.
• CalEEMod (California Emissions Estimator Model Version 2016.3.2)55 land use emissions model estimates construction emissions due to demolition and construction activities and operational emissions.
Operations are expected to commence in 2026. Regulatory models used to estimate air quality emissions
from proposed Project operations include the CARB EMFAC56 emissions inventory model. Six operational
scenarios were analyzed to evaluate the proposed Project operational emissions, as follows:
1. Adjusted Baseline (2016) Non-event Weekday without ITC Project
2. Adjusted Baseline (2016) Non-event Weekday with ITC Project
3. Year 2026 with Event Weekday without ITC Project
4. Year 2026 with Event Weekday with ITC Project
5. Year 2045 with Event Weekday without ITC Project
6. Year 2045 with Event Weekday with ITC Project
An Adjusted Baseline (2016) No Event and Existing Condition (2020) were also analyzed.
Supporting information for the operational emissions inventory are found in Attachment E: Operational
Air Emissions Inventory. Emission sources associated with the Adjusted Baseline and Existing Condition
include area sources (consumer products and landscaping), energy usage (natural gas), energy (electrical),
and motor vehicles. Emission sources associated with the proposed project include area sources
(consumer products and landscaping), energy usage (natural gas), energy (electrical for GHG only), standby
generators, and motor vehicles (employee trips, deliveries and general public).
Adjusted Baseline
The Hollywood Park Specific Plan (HPSP) Adjusted Baseline projects would emit air pollutants associated
with vehicle trips, maintenance operations, energy consumption, etc., from all of its operational land uses.
Specifically, vehicle trips associated with activities at the HPSP would begin taking place during mid-2020
when the NFL Stadium begins operations and uses are operating on the HPSP site, which would have an
impact on local and regional air quality. Accordingly, the air pollutant emissions associated with this
55 California Air Resources Board, California Emissions Estimator Model User’s Guide, November 9, 2017, Accessed August 25, 2020 at: http://www.caleemod.com/.
56 California Air Resources Board, EMFAC2017 User’s Guide, March 1, 2018, Accessed July 6, 2020 at: https://ww3.arb.ca.gov/msei/downloads/emfac2017-volume-i-users-guide.pdf and https://www.arb.ca.gov/emfac/2017/.

Air Quality and Health Risk Assessment Technical Report
RCH Group Page 67 of 76 November 17, 2020
development within the HPSP area are considered as part of the Adjusted Baseline. Table 22: Adjusted
Baseline Projects Characteristics presents the characteristics of the Adjusted Baseline.
Table 22 Adjusted Baseline Projects Characteristics
Land Use Adjusted Baseline Projects ADT Daily VMT Retail 518,077 SF 18,400 362,480
General Office 466,000 SF 4,721 93,004 Multifamily Residential 314 units 1,708 33,648
NFL Stadium 70,240 seats (2,772,304 SF) NA NA Perform. Venue 6,000 seats (40,800 SF) NA NA
Open Space 11.89 acre NA NA Civic Use 4 acre NA NA
Source: Hollywood Park Specific Plan and Raju Associates, Inc., 2020 Based on trip distance of 19.7 miles; average within South Coast Air Basin
Table 23: Estimated Daily Emissions (pounds) for Adjusted Baseline Land Uses presents the daily criteria
pollutant emissions for the Adjusted Baseline.
Table 23 Estimated Daily Emissions (pounds) for Adjusted Baseline Land Uses
Source VOC CO NOx PM10 PM2.5 SO2 Area (Consumer Products, Landscaping) 112 186 6.82 24.1 24.1 0.41
Energy (Natural Gas) 0.26 1.58 2.33 0.18 0.18 0.01 Motor Vehicles 36.9 1,258 134 52.9 22.4 3.58
Total 149 1,445 143 77.2 46.7 4.00 Source: RCH Group, 2020 Notes: Area sources and energy (natural gas) values based on CalEEMod and data within Table 22. Motor vehicle values based EMFAC and
data within Table 22.
Table 24: Estimated Annual GHG Emissions (metric tons) for Adjusted Baseline Land Uses presents the
annual GHG emissions for the Adjusted Baseline. The Adjusted Baseline emits 67,589 MT of CO2e annually.

Air Quality and Health Risk Assessment Technical Report
RCH Group Page 68 of 76 November 17, 2020
Table 24 Estimated Annual GHG Emissions (metric tons) for Adjusted Baseline Land Uses
Source CO2e Area (Consumer Products, Landscaping) 106
Energy (Natural Gas) 477 Energy (Electrical) 4,379
Solid Waste 564 Water and Waste Water 1,092
Motor Vehicles 60,971 Total 67,589
Source: RCH Group, 2020 Notes: Area sources, water, waste, and energy (natural gas and electrical) values based on CalEEMod and data within Table 22. Motor
vehicle values based EMFAC and data within Table 22.
Existing Condition For the proposed Project, the first phase of construction would be the demolition of the commercial property for the Market Street Station, for the Vons Supermarket and gas station on Manchester, and for the commercial building on the southeast corner of Manchester and Market Street. Table 25: Existing Condition Land Uses Characteristics presents the characteristics of the Existing Condition.
Operation of these existing on-site businesses result in the emission of air pollutants associated with vehicle trips to and from the proposed Project, on-site combustion of natural gas for heating and cooking, and fugitive emissions of VOC from the use of aerosol products and coatings and landscaping. However, data with respect to the exact activity level (i.e., utility consumptions) at each business may not be obtainable, so existing emissions were based on land use characteristics and default values.
Table 25 Existing Condition Land Uses Characteristics
Property Address Use Type Quantity ADT Daily VMT 310 East Florence Ave Restaurant 1,200 SF 101 1,990 300 East Florence Ave Restaurant 4,762 SF 399 7,860 254 North Market St Restaurant 4,608 SF 386 7,604 250 North Market St Auto Service 44,000 SF 2,435 47,970 240 North Market St Shopping Center 12,300 SF 492 9,692 230 North Market St Store 22,194 SF 1,474 29,038 224 North Market St Store 5,000 SF 3,811 75,077 222 North Market St Shopping Center 25,500 SF 2,297 45,251 210 North Market St Shopping Center 7,348 SF 294 5,792 150 South Market St Store 16,575 SF 1,101 21,690
500 East Manchester Blvd Supermarket 76,402 SF 8,158 160,713 510 East Manchester Blvd Gas Station 202 SF 1,376 27,107
Source: Meridian Consultants, 2020

Air Quality and Health Risk Assessment Technical Report
RCH Group Page 69 of 76 November 17, 2020
Table 26: Estimated Daily Emissions (pounds) for Existing Condition Land Uses presents the daily criteria
pollutant emissions for the Existing Condition, which will be eliminated as a result of the proposed Project.
Table 26 Estimated Daily Emissions (pounds) for Existing Condition Land Uses
Source VOC CO NOx PM10 PM2.5 SO2 Area (Consumer Products, Landscaping) 4.92 0.02 <0.01 <0.01 <0.01 <0.01
Energy (Natural Gas) 0.16 1.22 1.45 0.11 0.11 0.01 Motor Vehicles 33.2 1,131 120 47.6 20.1 3.22
Total 38.3 1,132 122 47.7 20.2 3.23 Source: RCH Group, 2020 Notes: Area sources and energy (natural gas and electrical) values based on CalEEMod and data within Table 25. Motor vehicle values based
EMFAC and data within Table 25.
Table 27: Estimated Annual GHG Emissions (metric tons) for Existing Condition Land Uses presents the
annual GHG emissions for the Existing Condition, which will be eliminated as a result of the proposed
Project. The Existing Condition emits 57,262 MT of CO2e annually.
Table 27 Estimated Annual GHG Emissions (metric tons) for Existing Condition Land Uses
Source CO2e Area (Consumer Products, Landscaping) <1
Energy (Natural Gas) 291 Energy (Electrical) 1,511
Solid Waste 485 Water and Waste Water 155
Motor Vehicles 54,819 Total 57,262
Source: RCH Group, 2020 Notes: Area sources, water, waste, and energy (natural gas and electrical) values based on CalEEMod and data within Table 25. Motor
vehicle values based EMFAC and data within Table 25.
Proposed Project
Table 28: Daily and Annual VMT for the Six Operational Scenarios presents the daily and annual VMT for
the six operational scenarios with and without the proposed Project. As shown, the proposed Project daily
and annual VMT are less than the daily and annual VMT without the proposed Project.

Air Quality and Health Risk Assessment Technical Report
RCH Group Page 70 of 76 November 17, 2020
Table 28 Daily and Annual VMT for the Six Operational Scenarios
Scenario Daily VMT Annual VMT Adjusted Baseline (2016) Non-event Weekday without ITC Project 3,159,055 1,007,356,937
Adjusted Baseline (2016) Non-event Weekday with ITC Project 3,138,289 1,000,735,086 Year 2026 with Event Weekday without ITC Project 5,275,088 1,346,432,106
Year 2026 with Event Weekday with ITC Project 5,047,349 1,316,518,609 Year 2045 with Event Weekday without ITC Project 5,662,297 1,469,905,139
Year 2045 with Event Weekday with ITC Project 5,365,217 1,433,075,931 Source: Raju Associates, Inc., 2020
Table 29: Estimated Daily Operational Emissions (pounds) for Proposed Project for Motor Vehicles
presents the daily criteria air pollutant emissions for the six operational scenarios with and without the
proposed Project. As shown, the proposed Project daily criteria air pollutant emissions are less than the
daily criteria air pollutant emissions without the proposed Project.
Table 29 Estimated Daily Operational Emissions (pounds) for Proposed Project for Motor Vehicles
Scenario VOC CO NOx PM10 PM2.5 SO2 Adjusted Baseline (2016) Non-event Weekday without ITC Project 477 12,420 3,114 407 195 28.6
Adjusted Baseline (2016) Non-event Weekday with ITC Project 474 12,339 3,094 404 194 28.4 Year 2026 with Event Weekday without ITC Project 252 8,738 1,748 610 256 36.4
Year 2026 with Event Weekday with ITC Project 241 8,361 1,672 584 245 34.9 Year 2045 with Event Weekday without ITC Project 185 6,728 1,532 653 269 31.5
Year 2045 with Event Weekday with ITC Project 175 6,375 1,452 618 255 29.8 Incremental Change VOC CO NOx PM10 PM2.5 SO2
Adjusted Baseline Non-event Weekday with ITC Project vs Adjusted Baseline Non-event Weekday without ITC Project (3.14) (81.6) (20.5) (2.67) (1.28) (0.19)
Year 2026 with Event Weekday with ITC Project vs Year 2026 with Event Weekday without ITC Project (10.9) (377) (75.5) (26.3) (11.1) (1.57)
Year 2045 with Event Weekday with ITC Project vs Year 2045 with Event Weekday without ITC Project (9.71) (353) (80.4) (34.2) (14.1) (1.65)
Significance Threshold 55 550 55 150 55 150 Source: RCH Group, 2020 Note: Based on EMFAC and data within Table 28
Table 30: Estimated Daily Emissions (pounds) for Proposed Project presents the daily criteria air pollutant operational emissions under normal operations including the standby generators, employee trips, deliveries, area sources, energy sources (natural gas), motor vehicle, while accounting for the reduction in motor vehicle as a result of the proposed Project and elimination of Existing sources. Table 30 presents the typical daily emissions associated with the proposed Project operations (e.g., 1.53 pounds of NOx). Table 30 also presents the typical daily emissions plus O&M for the standby generators (one generator

Air Quality and Health Risk Assessment Technical Report
RCH Group Page 71 of 76 November 17, 2020
tested per day for 2 hours) associated with the proposed Project operations (e.g., 126 pounds of NOx). Table 30 also presents the daily emissions plus O&M while accounting for the reduction in air emissions due to the reduction in motor vehicle (see Table 29: Estimated Daily Operational Emissions (pounds) for Proposed Project for Motor Vehicles) resulting from the proposed Project (e.g., 50.7 pounds of NOx). Lastly, Table 30 presents the daily emissions plus O&M while accounting for the reduction in air emissions due to the reduction in motor vehicle and the elimination of existing emission sources (see Table 26: Estimated Daily Emissions (pounds) for Existing Condition Land Uses) resulting from the proposed Project (e.g., a reduction of 71.1 pounds of NOx). Therefore, the proposed Project operations would have a less than significant (and beneficial) impact on air quality.
Table 30 Estimated Daily Emissions (pounds) for Proposed Project
Source VOC CO NOx PM10 PM2.5 SO2 Employee Trips 0.29 9.23 0.52 0.60 0.25 0.03
Deliveries 0.03 0.33 0.43 0.08 0.04 0.01 Area (Consumer Products, Landscaping) 2.33 0.04 <0.01 <0.01 <0.01 <0.01
Energy Source (Natural Gas) 0.06 0.48 0.57 0.04 0.04 <0.01 Subtotal Project (Typical Operations) 2.72 10.1 1.53 0.73 0.33 0.04
Emergency Generators 4.26 11.8 125 0.95 0.95 8.68 Subtotal Project (Typical Operations + O&M) 6.98 21.9 126 1.67 1.28 8.72
Motor Vehicles -10.9 -377 -75.5 -26.3 -11.1 -1.57 Subtotal (Project with Motor Vehicle Reductions) -3.89 -355 50.7 -24.7 -9.79 7.15
Existing Condition -38.3 -1,132 -122 -47.7 -20.1 -3.23 Grand Total (Project) -42.1 -1,488 -71.1 -72.3 -29.9 3.92 Significance Threshold 55 550 55 150 55 150
Exceeds Threshold? No No No No No No Source: RCH Group, 2020 Notes: Standby generator values based on vender specifications. Employee trips and deliveries values based on EMFAC. Area sources and
energy (natural gas) values based on CalEEMod. Motor vehicle values based on Table 29. Existing Condition values based on Table 26.
Table 31: Estimated Annual Operational GHG Emissions (metric tons) for Proposed Project for Motor
Vehicles presents the annual GHG emissions for the six operational scenarios with and without the
proposed Project. As shown, the proposed Project annual GHG emissions are less than the daily criteria
air pollutant emissions without the proposed Project.
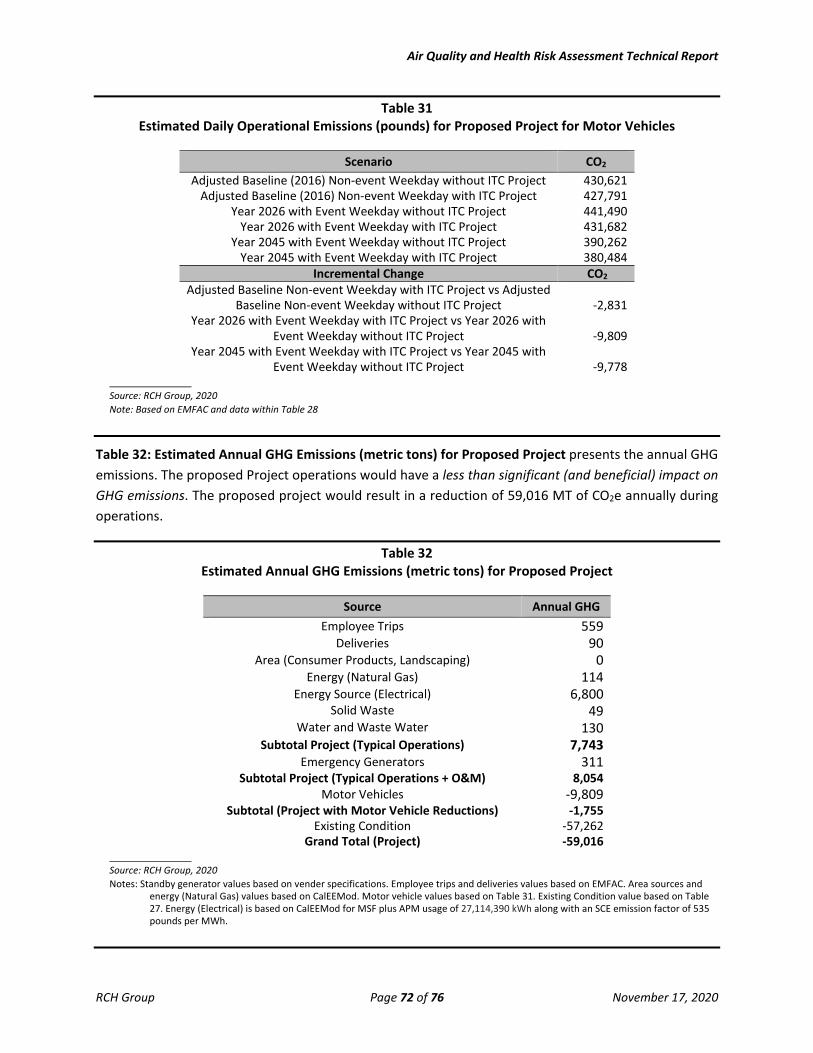
Air Quality and Health Risk Assessment Technical Report
RCH Group Page 72 of 76 November 17, 2020
Table 31 Estimated Daily Operational Emissions (pounds) for Proposed Project for Motor Vehicles
Scenario CO2 Adjusted Baseline (2016) Non-event Weekday without ITC Project 430,621
Adjusted Baseline (2016) Non-event Weekday with ITC Project 427,791 Year 2026 with Event Weekday without ITC Project 441,490
Year 2026 with Event Weekday with ITC Project 431,682 Year 2045 with Event Weekday without ITC Project 390,262
Year 2045 with Event Weekday with ITC Project 380,484 Incremental Change CO2
Adjusted Baseline Non-event Weekday with ITC Project vs Adjusted Baseline Non-event Weekday without ITC Project -2,831
Year 2026 with Event Weekday with ITC Project vs Year 2026 with Event Weekday without ITC Project -9,809
Year 2045 with Event Weekday with ITC Project vs Year 2045 with Event Weekday without ITC Project -9,778
Source: RCH Group, 2020 Note: Based on EMFAC and data within Table 28
Table 32: Estimated Annual GHG Emissions (metric tons) for Proposed Project presents the annual GHG emissions. The proposed Project operations would have a less than significant (and beneficial) impact on GHG emissions. The proposed project would result in a reduction of 59,016 MT of CO2e annually during operations.
Table 32 Estimated Annual GHG Emissions (metric tons) for Proposed Project
Source Annual GHG Employee Trips 559
Deliveries 90 Area (Consumer Products, Landscaping) 0
Energy (Natural Gas) 114 Energy Source (Electrical) 6,800
Solid Waste 49 Water and Waste Water 130
Subtotal Project (Typical Operations) 7,743 Emergency Generators 311
Subtotal Project (Typical Operations + O&M) 8,054 Motor Vehicles -9,809
Subtotal (Project with Motor Vehicle Reductions) -1,755 Existing Condition -57,262
Grand Total (Project) -59,016 Source: RCH Group, 2020 Notes: Standby generator values based on vender specifications. Employee trips and deliveries values based on EMFAC. Area sources and
energy (Natural Gas) values based on CalEEMod. Motor vehicle values based on Table 31. Existing Condition value based on Table 27. Energy (Electrical) is based on CalEEMod for MSF plus APM usage of 27,114,390 kWh along with an SCE emission factor of 535 pounds per MWh.

Air Quality and Health Risk Assessment Technical Report
RCH Group Page 73 of 76 November 17, 2020
The City has developed a set of broad sustainability strategies included as part of the Design Guidelines
to be incorporated into the design, construction, and operations of each proposed Project component.
These guidelines align with Inglewood’s commitment to sustainability City-wide, as outlined in the City’s
Energy and Climate Action Plan and Energy Efficiency Climate Action Plan. These sustainability guidelines
serve as a mechanism to promote the City’s commitment to reduce its environmental footprint and
promote energy efficient design requirements, water conservation and water quality improvement
projects, natural resource protection efforts, waste reduction and recycling, and numerous air quality
emissions reduction policies and programs.
For operational impacts, the proposed Project would comply with the requirements of California Green
Building Standards Code (CALGreen) and be consistent with the City of Inglewood Energy Efficiency
Climate Action Plan involving policies and programs related to sustainability, energy efficiency, and
reduction in GHG emissions. The City has committed to taking an active role in promoting energy
conservation and environmentally-friendly initiatives to improve the environment and realize the co-
benefits, which include energy independence, cost savings for energy not used, water saved, improved
air quality, and public health benefits from improved air quality.
The City has an ongoing commitment to increasing energy efficiency and implementing energy
conservation measures to reduce wasteful, inefficient, and unnecessary consumption. The proposed
Project would incorporate a number of sustainability features as listed in Proposed Sustainability
Guidelines within the Project Description. These guidelines are intended to integrate the design of new
and existing facilities and to create a passenger experience that reflects the City’s history and architecture,
while providing design guidance for new construction or modernization of the proposed Project. The City
has committed to implementing, if feasible, various sustainability measures for different proposed Project
elements that meet or exceed CALGreen requirements, including energy and water conservation
measures, for each of the follow proposed Project components: an elevated guideway and stations and
the MSF. The sustainability strategies relate to planning and design; energy efficiency and renewable
energy; water efficiency and conservation; materials conservation and resource efficiency; and
environmental quality.
Standby Generators Additionally, the proposed Project would include up to two stationary standby generators with an estimated total capacity rated at approximately 4,000 kilowatts (kW) to provide emergency power primarily for lighting and other emergency building systems. Emergency generator emissions were calculated based on compliance with applicable federal emissions standards and compliance with SCAQMD Rule 1470 (Requirements for Stationary Diesel-Fueled Internal Combustion and Other Compression Ignition Engines) mandated emission limits and operating hour constraints. This analysis also assumed that the standby generators would operate up to two hours per day and a total of 50 hours per

Air Quality and Health Risk Assessment Technical Report
RCH Group Page 74 of 76 November 17, 2020
year for testing and maintenance (per SCAQMD Rule 1470 limit). SCAQMD requires that all internal combustion engines (ICE) greater than 50 brake horsepower (bhp) and gas turbines greater than 2,975,000 Btu per hour obtain a permit to construct prior to installation of the engines at a site.
SCAQMD defines a standby ICE or turbine for non-utility power generation as one that does not operate more than 200 hours a year and is only operated in the event of an emergency power failure or for routine testing and maintenance is considered a standby backup generator for power generation. Operators should petition the SCAQMD's Hearing Board for a variance to operate in excess of the allowed 200 hours before it is anticipated that the hours may be exceeded.
• The internal combustion engines must meet SCAQMD's Best Available Control Technology (BACT) requirements.
• It is advisable before purchasing any equipment to consult with the SCAQMD and apply for approval of a Permit to Construct from the SCAQMD prior to installation of the engine. Typically, the SCAQMD either issues a Permit to Construct or a Permit to Construct/Operate.
The Project Applicant will implement the following operational equipment requirements and operation protocols for equipment operating at the proposed Project. These features would be included in applicable bid documents, and successful contractor(s) must demonstrate the ability to supply such equipment and comply with such protocols. Operational features would include the following:
• All standby generators used for proposed Project operations shall be selected from the SCAQMD certified generators list and meet applicable federal standards for diesel emissions. For after-treatment of engine exhaust air, a diesel particulate filter shall be provided to meet the emission level requirements of SCAQMD. The proposed Project would have two standby generators, each could operate up to two hours per day and a total of 50 hours per year for testing and maintenance (per SCAQMD Rule 1470 limit) to ensure reliability in the case of a power outage.
• The Applicant shall conduct maintenance and/or testing on the two standby generators on separate days.
Therefore, each standby generators would operates for 2 hours per day during 25 days per year for a total
of 50 hours per year. Each standby generator shall be tested during different days. For emergency
operation both generators would operate up to 2 hours each and could occur simultaneously.
Vender specifications were used to determine air pollutants emission factors for the standby generators. Emission factors are 5.27 g/hp-hour for NOx, 0.5 g/hp-hour for CO, 0.18 g/hp-hour for VOC, and 0.4 g/hp-hour for PM10/PM2.5. The estimated annual fuel usage assuming each generator operates of 50 hours per year (2 hours per day) is 27,440 gallons of diesel fuel.57
57 Vender Specifications for Standby Generator, Accessed August 25, 2020 at: https://www.cat.com/en_US/products/new/power-systems/electric-power.html

Air Quality and Health Risk Assessment Technical Report
RCH Group Page 75 of 76 November 17, 2020
Electrical Usage
Components of the proposed Project would utilize electrical energy for a whole range of function. During
normal operation of the proposed TPSS at the MSF Site (TPSS 1) is estimated to have a peak power load
flow of 2,008 kilowatts (kW) and normal operation of the proposed TPSS at the Transit Center TPSS (TPSS
2) is estimated to have a peak power load flow of 2,119 kW for a total of 4,127 kW. The proposed Project
would operate for 18 hours per day which would generate a total electricity demand of 74,286 kWh per
day or 27,114,390 kWh (27,114 Megawatts-hour or MWh) per year.58 In the event TPSS 1 is unable to
operate, TPSS 2 is estimated to have a peak power load of 4,152 kW which would generate a total
electricity demand of 74,736 kWh per day or 27,278,640 kWh (27,279 MWh) per year. Similarly, in the
event TPSS 2 is unable to operate, TPSS 1 is estimated to have a peak power load of 4,353 kW which would
generate a total electricity demand of 78,354 kWh per day or 28,599,210 kWh (28,599 MWh) per year.
The electrical demand from the existing (but to be removed as part of the proposed Project) commercial,
restaurant, and retail uses at the current commercial plaza at Florence and Market Street (proposed
Market Street/Florence Avenue Station site) and the commercial plaza at 500 East Manchester Boulevard
(proposed MSF site) is 5,110,987 kWh per year. Therefore, during normal operation, the electricity
demand for the proposed Project results in a net increase of 22,003,403 kWh (22,003 MWh) per year. In
the event TPSS-1 is unable to operate, the electricity demand for the proposed Project results in a net
increase of 22,167,653 kWh (22,168 MWh) per year. In the event TPSS-1 is unable to operate, the
electricity demand for the proposed Project results in a net increase of 23,488,223 kWh (23,488 MWh)
per year. The electrical demand associated with the Adjusted Baseline is 16,507,545 kWh (16,508 MWh)
per year.
Southern California Edison average CO2e intensity factors for its total electricity mix is projected to be
0.173 MTCO2e/MWh (or 535 pounds per MWh) and was used to determine the GHG emissions from the
APM. Estimated GHG emissions from APM operations are the average CO2e intensity factor (535 pounds
per MWh) times the electrical usage (for example, 27,114 MWh for the proposed Project), which equals
6,580 metric tons.
13.0 SUMMARY
In summary, daily mitigated construction emissions would exceed the SCAQMD significance thresholds for
NOx during 2023 through 2025, as described in Section 8. These impacts are largely due to off-road
construction equipment and to a much lesser degree due to off-site construction haul trucks. However,
58 Lea+Elliott, Inc. Inglewood Transit Connector EIR Operating Systems Conceptual Planning EIR Project Definition DRAFT - June 2020 (See Appendix 3.0.1).

Air Quality and Health Risk Assessment Technical Report
RCH Group Page 76 of 76 November 17, 2020
during mitigated construction activities as presented in Section 9, the ambient air concentration impacts
due to Project construction would be less than significant at all nearby receptors for all pollutants.
Therefore, although the daily construction emissions for NOx would potentially exceed the SCAQMD
significance thresholds, but the resultant air concentrations would not likely exceed the SCAQMD
significance thresholds. As shown in Section 10, during mitigated construction activities, incremental
cancer risks would not exceed significance thresholds at existing residence, existing daycare/school and
off-site worker locations. As shown in Section 11, the GHG emissions associated with construction
activities would not likely exceed the SCAQMD significance thresholds. Daily operational emissions would
less than significant compared to the SCAQMD significance thresholds. Once operational, the proposed
Project will increase transit ridership throughout the region, reduce vehicle miles traveled and criteria air
pollutants, GHG emissions, and improve air quality throughout the South Coast Air Basin (see Section 12).
Therefore, short-term construction-related air quality impacts would occur but long-term operational-
related air quality benefits would follow.

A-1
Attachment A
Dispersion Modeling Methodology and Assumptions
Dispersion is the process by which atmospheric pollutants disseminate due to wind and vertical
atmospheric stability. The results of a dispersion analysis are used to assess pollutant
concentrations at or near an emission source. The results of an analysis allow predicted
concentrations of pollutants to be compared directly to air quality standards and other criteria
such as health risks based on modeled concentrations.
A rising pollutant plume reacts with the environment in several ways before it levels off. First,
the plume’s own turbulence interacts with atmospheric turbulence to entrain ambient air. This
mixing process reduces and eventually eliminates the density and momentum differences that
cause the plume to rise. Second, the wind transports the plume during its rise and entrainment
process. Higher winds mix the plume more rapidly, resulting in a lower final rise. Third, the
plume interacts with the vertical temperature stratification of the atmosphere, rising as a result
of buoyancy in the unstable-to-neutrally stratified mixed layer. However, after the plume
encounters the mixing lid and the stably stratified air above, its vertical motion is dampened.
Molecules of gas or small particles injected into the atmosphere will separate from each other as
they are acted on by turbulent eddies. The Gaussian mathematical model such as AERMOD
simulates the dispersion of the gas or particles within the atmosphere. The formulation of the
Gaussian model is based on the following assumptions:
The predictions are not time-dependent (all conditions remain unchanged with time)
The wind speed and direction are uniform, both horizontally and vertically,
throughout the region of concern
The rate of diffusion is not a function of position
Diffusion in the direction of the transporting wind is negligible when compared to
the transport flow
Air quality impacts were determined for United States Environmental Protection Agency
(USEPA) criteria pollutants such as carbon monoxide (CO), nitrogen dioxide (NO2), sulfur
dioxide (SO2), particulate matter less than 10 micrometers (coarse or PM10), and particulate
matter less than 2.5 micrometers (fine or PM2.5).
Dispersion Modeling Approach
Air dispersion modeling was performed to estimate the downwind dispersion of exhaust
emissions resulting from construction activities and operations. The following sections present
the fundamental components of an air dispersion modeling analysis including air dispersion

A-2
model selection and options, receptor locations, meteorological data, source exhaust
parameters, nitrogen oxides (NOx) to NO2 conversion, and building downwash.
Model Selection and Options
AERMOD (Version 19191)1 was used for the dispersion analysis. AERMOD is the USEPA
preferred atmospheric dispersion modeling system for general industrial sources. The model
can simulate point, area, volume, and line sources. AERMOD is the appropriate model for this
analysis based on the coverage of simple, intermediate, and complex terrain. It also predicts
both short-term and long-term (annual) average concentrations. The model was executed using
the regulatory default options (stack-tip downwash, buoyancy-induced dispersion, and final
plume rise), default wind speed profile categories, default potential temperature gradients, and
assuming no pollutant decay.
The selection of the appropriate dispersion coefficients depends on the land use within three
kilometers (km) of the project site. The types of land use were based on the classification
method defined by Auer (1978); using pertinent United States Geological Survey (USGS)
1:24,000 scale (7.5 minute) topographic maps of the area. If the Auer land use types of heavy
industrial, light-to-moderate industrial, commercial, and compact residential account for 50
percent or more of the total area, the USEPA Guideline on Air Quality Models2 recommends using
urban dispersion coefficients; otherwise, the appropriate rural coefficients can be used. Per
South Coast Air Quality Management District (SCAQMD) guidance, urban dispersion
coefficients were applied within AERMOD. For this project, all emissions sources were modeled
with urban effects using the population of 9,818,605 for Los Angeles County.3
Receptor Locations
Some receptors are considered more sensitive to air pollutants than others, because of
preexisting health problems, proximity to the emissions source, or duration of exposure to air
pollutants. Land uses such as primary and secondary schools, hospitals, and convalescent
homes are considered to be relatively sensitive to poor air quality because the very young, the
old, and the infirm are more susceptible to respiratory infections and other air quality-related
health problems than the general public. Residential areas are also considered sensitive to poor
air quality because people in residential areas are often at home for extended periods.
Recreational land uses are moderately sensitive to air pollution because vigorous exercise
1 United States Environmental Protection Agency, AERMOD Modeling System, Accessed July 7, 2020 at:
https://www.epa.gov/scram/air-quality-dispersion-modeling-preferred-and-recommended-models. 2 United States Environmental Protection Agency, Guideline on Air Quality Models (Revised), 40 Code of Federal
Regulations, Part 51, Appendix W, November 2005, Accessed July 6, 2020 at:
https://www3.epa.gov/scram001/guidance/guide/appw_05.pdf. 3 South Coast Air Quality Management District, SCAQMD Modeling Guidance for AERMOD, Accessed July 7, 2020 at:
https://www.aqmd.gov/home/air-quality/meteorological-data/modeling-guidance.

A-3
associated with recreation places having a high demand on respiratory system function. The
CARB has identified the following people as most likely to be affected by air pollution: children
less than 14 years of age, the elderly over 65 years of age, athletes, and those with
cardiovascular and chronic respiratory diseases. These groups are classified as sensitive
population groups.
In accordance with SCAQMD guidance4, modeled receptors for the health risk assessment
(HRA) were placed at locations in which people are typically located for a period of time. The
receptors for the HRA within a quarter-mile of the project site are as follows:
Single- and multi-family residences along the project length.
Off-site workers within industrial and commercial areas surrounding the project site.
Recreational facilities such as Queen Park.
Medical facilities such as Hillcrest Medical Center and Centinela Hospital Medical
Center.
Educational facilities such as Inglewood High School, Inglewood Junior Academy,
George W Crozier Middle School, and Kelso Elementary School.
Off-site daycare/childcare such as South Bay Child Development Center, Tender Care
Child Development Center, A Bright Beginning Child Development Center, and
Debbie’s Child Development Center.
Figure A-1 displays the location of the nearby residential receptors. offsite workers, and other
sensitive receptors used in the HRA. There are a total of 1,287 residential, offsite workers, and
other sensitive receptors. Figure A-2 displays the specific sensitive receptors within the
northern portion of the project site. Figure A-3 displays the specific sensitive receptors within
the central portion of the project site. Figure A-4 displays the specific sensitive receptors within
the southern portion of the project site. Figure A-5 displays the location of the receptors used in
the air quality analysis for the criteria pollutants impacts. There are a total of 667 air quality
criteria pollutant receptors plus the 1,287 sensitive receptors (see Figure A-1).
All receptors were set so that only ground-level concentrations were analyzed. Flagpole
receptors are only necessary for analyses that have instances where sensitive receptors are
located on patios/decks at nearby high-rise buildings.5 Generally, the modeled concentrations
would be highest at the ground-level due to the ground-level emissions associated with
construction activities.
4 South Coast Air Quality Management District, SCAQMD Modeling Guidance for AERMOD, Accessed July 7, 2020 at:
https://www.aqmd.gov/home/air-quality/meteorological-data/modeling-guidance. 5 South Coast Air Quality Management District, SCAQMD Modeling Guidance for AERMOD, Accessed July 7, 2020 at:
https://www.aqmd.gov/home/air-quality/meteorological-data/modeling-guidance.

A-4
FIGURE A-1
HEALTH RISK ASSESSMENT SENSITIVE RECEPTORS

A-5
FIGURE A-2
HEALTH RISK ASSESSMENT SPECIFIC SENSITIVE RECEPTORS (NORTH)

A-6
FIGURE A-3
HEALTH RISK ASSESSMENT SPECIFIC SENSITIVE RECEPTORS (CENTRAL)

A-7
FIGURE A-4
HEALTH RISK ASSESSMENT SPECIFIC SENSITIVE RECEPTORS (SOUTHERN)

A-8
FIGURE A-5
AMBIENT AIR CONCENTRATION IMPACT RECEPTORS

A-9
The air quality analysis for the criteria pollutants (NO2, CO, SO2, PM10, and PM2.5) were
evaluated at receptors where a person has access and can be situated for an hour or longer at a
time. To identify the maximum impacted receptors, a uniform Cartesian grid with a spacing of
50 meters was used for all distances less than 500 meters and with a spacing of 100 meters for all
distances less than 1,500 meters. The size of the modeling domain and placement of the
receptors was at such a distance and resolution to identify the maximum impacts to the
surrounding areas and the significant concentration gradients from the project emission
sources.6
The AERMOD modeling system includes AERMAP (Version 11103)7, which is a terrain data
pre-processor. Terrain data, available from the United States Geological Survey (USGS), was
used by AERMAP to produce terrain base elevations for each receptor and source and a hill
height scale value for each receptor. The National Elevation Dataset (NED) data in GeoTIFF
format was used as input into AERMAP instead of Digital Elevation Model (DEM) data. A
resolution of one-arc-second (approximately 30 meters) or 1/3 arc-second (approximately 10
meters) was used. Elevations were imported for all emission sources, receptors, and buildings
in the modeling analysis.
Meteorological Data
Air quality is a function of both the rate and location of pollutant emissions under the influence
of meteorological conditions and topographic features affecting pollutant movement and
dispersal. Atmospheric conditions such as wind speed, wind direction, atmospheric stability,
and air temperature gradients interact with the physical features of the landscape to determine
the movement and dispersal of air pollutants, and consequently affect air quality.
Hourly meteorological data from Los Angeles International Airport, located approximately four
miles to the west-southwest of the proposed project was used in the dispersion modeling
analysis and health risk assessment. Meteorological data from 2012 through 2016 were used.8
Figure A-6 displays the annual wind rose. Wind directions are predominately from the west
with a large frequency of light or moderate wind speed conditions, as shown in Figure A-7. The
average annual wind speed is 7.8 miles per hour (3.5 meters per second).
6 South Coast Air Quality Management District, SCAQMD Modeling Guidance for AERMOD, Accessed July 7, 2020 at:
https://www.aqmd.gov/home/air-quality/meteorological-data/modeling-guidance. 7 United States Environmental Protection Agency, AERMAP, Accessed July 7, 2020 at:
https://www.epa.gov/scram/air-quality-dispersion-modeling-preferred-and-recommended-models. 8 South Coast Air Quality Management District, Meteorological Data for AERMOD, Accessed July 7, 2020 at:
https://www.aqmd.gov/home/air-quality/air-quality-data-studies/meteorological-data/data-for-aermod.

A-10
FIGURE A-6
WINDROSE FOR LOS ANGELES INTERNATIONAL AIRPORT

A-11
FIGURE A-7
WIND SPEED DISTRIBUTION FOR LOS ANGELES INTERNATIONAL AIRPORT

A-12
Source Release Characteristics
Construction equipment activities were treated as an area source. The release height of the off-
road equipment exhaust was set to 3.05 meters and an initial vertical dimension of 4.15 meters.
Offsite construction trucks were treated as a line source (i.e., volume sources placed at regular
intervals) located along nearby roadways. The off-site construction trucks were assigned a
release height of 3.05 meters and an initial vertical dimension of 4.15 meters, which accounts for
dispersion from the movement of vehicles.9 Terrain elevations for emission source locations
were based on AERMAP (Version 11103).10
The primary delivery routes would utilize Florence Avenue, Manchester Boulevard, Prairie
Avenue, and Century Boulevard which are currently in use by nearby projects within the two
mile radius. For materials delivered to and stored at designated construction staging areas, the
contractor haul routes to and from the project area would be generally on public streets. Some
excavated dirt materials may be hauled at night, where possible, due to the congested freeways
and surface streets around or near the excavation site during daytime hours. The contractor
would develop an excavation plan that define haul routes, dust control, sweeping and disposal
site.
Construction activity would primarily occur over a 16 hour / day schedule with two shifts,
either a morning shift from approximately 7:00 a.m. to 3:00 p.m. or an evening shift from
approx. 3:00 p.m. to 11:00 p.m., or a morning shift from approximately 7:00 a.m. to 3:00 p.m.
and a night shift from approximately 11:00 p.m. to 7:00 a.m. Other minimal construction work
could occur during other hours at a reduced intensity. Delivery of construction materials would
occur during the night shift, as would most lane closures.
Temporal factors were used to describe the relationship of one period of time to another (i.e.,
the relationship of activity during one hour to activity in a 24-hour period). In AERMOD,
temporal factors are applied to represent varying levels of activity as a fraction of a peak period.
Using temporal factors gives the model the ability to more accurately reflect real world
conditions. Table A-1 shows the hourly construction profile which represents the construction
intensity for each hour of the day relative to the peak hour. Construction activities would occur
Monday through Sunday.
9 While haul truck emissions contribute minimally to overall project construction emissions, they also are spread over
many miles. Hence, the portion of trucking emissions that would impact one receptor is much smaller than the
emissions that the clustered off-road activity at the project site would impact a receptor near the site. 10
United States Environmental Protection Agency, AERMAP, Accessed July 7, 2020 at:
https://www.epa.gov/scram/air-quality-dispersion-modeling-preferred-and-recommended-models.

A-13
TABLE A-1
HOURLY CONSTRUCTION PROFILE
Hour Morning/Evening
Hourly Work
Intensity
Morning/Night
Hourly Work
Intensity
Nighttime 12:00 AM – 1:00 AM 25% 50%
1:00 AM – 2:00 AM 25% 50%
2:00 AM – 3:00 AM 25% 50%
3:00 AM – 4:00 AM 25% 50%
4:00 AM – 5:00 AM 25% 50%
5:00 AM – 6:00 AM 25% 50%
6:00 AM – 7:00 AM 25% 50%
Daytime 7:00 AM – 8:00 AM 100% 100%
8:00 AM – 9:00 AM 100% 100%
9:00 AM – 10:00 AM 100% 100%
10:00 AM – 11:00 AM 100% 100%
11:00 AM – 12:00 PM 100% 100%
12:00 PM – 1:00 PM 100% 100%
1:00 PM – 2:00 PM 100% 100%
2:00 PM – 3:00 PM 100% 100%
3:00 PM – 4:00 PM 100% 50%
4:00 PM – 5:00 PM 100% 50%
5:00 PM – 6:00 PM 100% 50%
6:00 PM – 7:00 PM 100% 50%
Evening 7:00 PM – 8:00 PM 75% 38%
8:00 PM – 9:00 PM 75% 38%
9:00 PM – 10:00 PM 75% 38%
Night 10:00 PM – 11:00 PM 50% 25%
11:00 PM – 12:00 AM 25% 50%
Nitrogen Dioxide to Nitrogen Oxides Conversion
According to USEPA, dispersion modeling results provide predicted concentrations of NOx
which, for comparison to ambient air quality standards, can be converted to concentrations of
NO2. While AERMOD is generally considered a non-chemistry model, it offers three methods
for modeling NO2 formation from NOx emissions: (i) the Ambient Ratio Method (ARM and
ARM tier 2), (ii) the Ozone Limiting Method (OLM), and (iii) the Plume Volume Molar Ratio
Method (PVMRM). Moreover, USEPA’s Guideline on Air Quality Models recommends a three-
tiered screening approach to estimate ambient concentrations of NO2:
Tier 1 – Assumes complete (100 percent) conversion of all emitted NOx to NO2 based on
application of an appropriate refined modeling technique under Section 4.2.2 of Appendix

A-14
W (of the USEPA’s Guideline on Air Quality Models) to estimate ambient NOx
concentrations.
Tier 2 – Ambient Ratio Method (ARM-2), in which model-predicted NOx concentrations
are multiplied by a NO2/NOx ambient ratio derived from ambient monitoring data. ARM-
2 incorporates a variable ambient ratio—a function of model predicted one-hour NOx
concentration—based on an analysis of nationwide hourly ambient NOx monitoring data
from approximately 580 stations from 2001 through 2010.
Tier 3 – Performs a detailed analysis on a case-by-case basis by employing the OLM or
PVMRM. These methods require the most detailed analysis and produce the least
conservative and presumably most representative results. Tier 3 requires information
such as in-stack NO2/NOx ratio and ambient ozone concentrations.
The air quality dispersion modeling analysis employed the ARM-2 approach. It was determined
that 100 percent conversion (tier 2) was not appropriate for this air quality analysis and the use
of ARM-2 provides a conservative analysis compared to the use of OLM/PVMRM (tier 3).
Background Concentrations
Background concentrations, as described in the USEPA Guideline on Air Quality Models11
refers to the “…portion of the background attributable to natural sources, other unidentified
sources in the vicinity of the project, and regional transport contributions from more distant
sources” where “…the ambient concentrations from these sources are typically accounted for
through use of ambient monitoring data…”.
Generally, the closest upwind monitor should be selected, with preference to the monitor that
has the most similar characteristics to the area for the source under consideration. The
SCAQMD maintains a network of monitoring stations within the Air Basin that monitor air
quality and compliance with applicable ambient standards. The nearest air monitoring station
which measures CO, NO2, SO2, and PM10 is located near Los Angeles International Airport (7201
West Westchester Parkway, Southwest Coastal LA County, Station 820), four miles to the west
of the project site. The nearest air monitoring station which measures PM2.5 is located in central
Los Angeles (1630 North Main Street, Central LA, Station 087), ten miles to the northeast of the
project site. Table A-2 summarizes the most recent three years of data (2017 through 2019) from
the nearby air monitoring stations.
Consistent with SCAQMD guidance, the maximum background concentrations (in bold) were
used in the air quality analysis. The most recent three years of available monitoring data have
11
United States Environmental Protection Agency, Guideline on Air Quality Models (Revised), 40 Code of Federal
Regulations, Part 51, Appendix W, November 2005, Accessed July 7, 2020 at:
https://www3.epa.gov/scram001/guidance/guide/appw_05.pdf.

A-15
been used to develop background concentration values. For all CAAQS and most NAAQS
pollutants, the maximum value from the most recent three years was used. The exceptions to
this includes 1-hour NO2 (three year average of the 98th percentile of the daily maximum 1-hour
average) and 1-hour SO2 (three year average of the 99th percentile of the daily maximum 1-hour
average).12
The exceptions for including background concentrations is the PM10 CAAQS and
PM2.5 NAAQS and CAAQS, due to the nonattainment status for the South Coast Air Basin.
Modeled maximum 24-hour and annual concentrations were compared directly to the
significant thresholds.
TABLE A-2
BACKGROUND CONCENTRATIONS (PPM)
Pollutant Monitoring Data by Year
2017 2018 2019
Nitrogen Dioxide (NO2)
Highest 1 Hour Average (ppm)b- CAAQS 0.072 0.060 0.070
Highest 1 Hour Average (ppm)b- NAAQS 0.055 0.050 0.049
Annual Average (g/m3) 0.009 0.009 0.010
Carbon Monoxide (CO)
Highest 1 Hour Average (ppm) 2.1 1.8 1.8
Highest 8 Hour Average (ppm) 1.6 1.5 1.3
Sulfur Dioxide (SO2)
Highest 1 Hour Average (ppm) - CAAQS 0.010 0.012 0.008
Highest 1 Hour Average (ppm) - NAAQS 0.007 0.005 0.004
Highest 24 Hour Average (ppm) 0.004 0.005 0.003
Source: South Coast Air Quality Management District, Annual Air Quality Summaries, Accessed July 7, 2020 at:
http://www.aqmd.gov/home/air-quality/air-quality-data-studies/historical-data-by-year.
12
South Coast Air Quality Management District, SCAQMD Modeling Guidance for AERMOD, Accessed July 7, 2020 at:
https://www.aqmd.gov/home/air-quality/meteorological-data/modeling-guidance.

B-1
Attachment B
Health Risk Assessment Methodology and Assumptions
A health risk assessment (HRA) is accomplished in four steps: 1) hazards identification, 2)
exposure assessment, 3) toxicity assessment, and 4) risk characterization. These steps cover the
estimation of air emissions, the estimation of the air concentrations resulting from a dispersion
analysis, the incorporation of the toxicity of the pollutants emitted, and the characterization of
the risk based on exposure parameters such as breathing rate, age adjustment factors, and
exposure duration; each depending on receptor type (i.e., residence, school, daycare centers,
hospitals, senior care facilities, recreational areas, adult, infant, child).
This HRA was conducted in accordance with technical guidelines developed by federal, state,
and regional agencies, including United States Environmental Protection Agency (USEPA)
Guideline on Air Quality Models1, California Office of Environmental Health Hazard Assessment
(OEHHA) Air Toxics Hot Spots Program Guidance Manual for Preparation of Health Risk
Assessments2, the South Coast Air Quality Management District (SCAQMD) AB 2588 and Rule
1402 Supplemental Guidelines for Preparing Risk Assessments for the Air Toxics “Hot Spots”
Information and Assessment Act,3 and SCAQMD’s Risk Assessment Procedures for Rule 1401, 1401.1
and 212.4 This HRA addresses the emissions from construction activities (nonroad equipment at
the project site and off-site truck travel along nearby roadways). Specific focus is on diesel
particulate matter (DPM) emissions.
An HRA should not be interpreted as the expected rates of cancer or other potential human
health effects, but rather as estimates of potential risk or likelihood of adverse effects based on
current knowledge, under a number of highly conservative assumptions and the best
assessment tools currently available. Attachment C: Supplemental Health Impact Information
provides further information on health impacts.
1 United States Environmental Protection Agency, Guideline on Air Quality Models (Revised), 40 Code of Federal
Regulations, Part 51, Appendix W, November 2005, Accessed July 7, 2020 at:
https://www3.epa.gov/scram001/guidance/guide/appw_05.pdf. 2 Office of Environmental Health Hazard Assessment, Air Toxics Hot Spots Program Guidance Manual for Preparation of
Health Risk Assessments, March 6, 2015, Accessed July 7, 2020 at:
http://oehha.ca.gov/air/hot_spots/hotspots2015.html. 3 South Coast Air Quality Management District, AB 2588 and Rule 1402 Supplemental Guidelines for Preparing Risk
Assessments for the Air Toxics “Hot Spots” Information and Assessment Act, September 2018, Accessed July 7, 2020 at:
http://www.aqmd.gov/docs/default-source/planning/risk-assessment/ab-2588-supplemental-guidelines-201809.pdf?sfvrsn=6. 4 South Coast Air Quality Management District, Risk Assessment Procedures for Rule 1401, 1401.1 and 212, September 1,
2017, Accessed July 7, 2020 at: http://www.aqmd.gov/docs/default-source/permitting/rule-1401-risk-
assessment/riskassessproc-v8-1.pdf?sfvrsn=12.

B-2
TERMS AND DEFINITIONS
As the practice of conducting an HRA is particularly complex and involves concepts that are
not altogether familiar to most people, several terms and definitions are provided that are
considered essential to the understanding of the approach, methodology and results:
Acute effect – a health effect (non-cancer) produced within a short period of time (few
minutes to several days) following an exposure to toxic air contaminants (TAC).
Cancer risk – the probability of an individual contracting cancer from a lifetime (i.e., 70
year) exposure to TAC such as DPM in the ambient air based on an exposure duration of
30 years.
Chronic effect – a health effect (non-cancer) produced from a continuous exposure
occurring over an extended period of time (weeks, months, years).
Hazard Index (HI) – the unitless ratio of an exposure level over the acceptable reference
dose. The HI can be applied to multiple compounds in an additive manner.
Hazard Quotient (HQ) – the unitless ratio of an exposure level over the acceptable
reference dose. The HQ is applied to individual compounds.
Toxic Air Contaminants – any air pollutant that is capable of causing short-term (acute)
and/or long-term (chronic or carcinogenic, i.e., cancer causing) adverse human health
effects (i.e., injury or illness). The current California list of TAC identify approximately
200 compounds, including particulate emissions from diesel-fueled engines.
Human Health Effects - comprise disorders such as eye watering, respiratory or heart
ailments, and other (i.e., non-cancer) related diseases.
Health Risk Assessment – an analysis designed to predict the generation and dispersion of
TAC in the outdoor environment, evaluate the potential for exposure of human
populations, and to assess and quantify both the individual and population-wide health
risks associated with those levels of exposure.
Incremental – under CEQA, the net difference (or change) in conditions or impacts when
comparing the baseline to future year project conditions.
Maximum exposed individual (MEI) – an individual assumed to be located at the point
where the highest concentrations of TAC, and therefore, health risks are predicted to
occur.
Non-cancer risks – health risks such as eye watering, respiratory or heart ailments, and
other non-cancer related diseases.
Receptors – the locations where potential health impacts or risks are predicted (i.e.,
schools, residences, and recreational sites).

B-3
LIMITATIONS AND UNCERTAINTIES
There are a number of important limitations and uncertainties commonly associated with a
HRA due to the wide variability of human exposures to TAC, the extended timeframes over
which the exposures are evaluated, and the inability to verify the results. Limitations and
uncertainties associated with a HRA include: (a.) lack of reliable monitoring data; (b.)
extrapolation of toxicity data in animals to humans; (c.) estimation errors in calculating TAC
emissions; (d.) concentration prediction errors with dispersion models; and (e.) the variability in
lifestyles, fitness and other confounding factors of the human population. This HRA was
performed in accordance with USEPA, OEHHA, and SCAQMD guidance and requirements,
notwithstanding the following uncertainties:
There are uncertainties associated with the estimation of emissions from project
activities. Where project-specific data, such as emission factors, are not available, default
assumptions in emission models were used.
The limitations of the air dispersion model provide a source of uncertainty in the
estimation of exposure concentrations. According to USEPA, errors due to the limitation
of the algorithms implemented in the air dispersion model in the highest estimated
concentrations of +/- 10 percent to 40 percent are typical.5
The source parameters used to model emission sources add uncertainty. For all emission
sources, the source parameters used source-specific, recommended as defaults, or
expected to produce more conservative results. Discrepancies might exist in actual
emissions characteristics of an emission source and its representation in the dispersion
model.
The exposure duration estimates do not take into account that people do not usually
reside at the same location for 30 years and that other exposures (i.e., school children)
are also of much shorter durations than was assumed in this HRA. This exposure
duration is a highly conservative assumption, since most people do not remain at home
all day and on average residents change residences every 11 to 12 years. In addition, this
assumption adopts that residents are experiencing outdoor concentrations for the entire
exposure period. A school child exposure duration is between ages 2 and 16 years old,
which again is conservative because the elementary, middle, and high school are not
often located at the same location.
For the risk and hazards calculations as well as the cumulative health impact, numerous
assumptions must be made in order to estimate human exposure to pollutants. These
5 United States Environmental Protection Agency, Guideline on Air Quality Models (Revised), 40 Code of Federal
Regulations, Part 51, Appendix W, November 2005, Accessed July 7, 2020 at:
https://www3.epa.gov/scram001/guidance/guide/appw_05.pdf.

B-4
assumptions include parameters such as breathing rates, exposure time and frequency,
exposure duration, and human activity patterns. While a mean value derived from
scientifically defensible studies is the best estimate of central tendency, most of the
exposure variables used in this HRA are high-end estimates. The combination of several
high-end estimates used as exposure parameters may substantially overestimate
pollutant intake. The excess lifetime cancer risks calculated in this HRA are therefore
likely to be higher than may be required to be protective of public health.
The OEHHA cancer potency factor for DPM was used to estimate cancer risks associated
with exposure to DPM emissions from construction activities. However, the cancer
potency factor derived by OEHHA for DPM is highly uncertain in both the estimation of
response and dose. In the past, due to inadequate animal test data and epidemiology
data on diesel exhaust, the International Agency for Research on Cancer (IARC), a
branch of the World Health Organization, had classified DPM as Probably Carcinogenic
to Humans (Group 2); the USEPA had also concluded that the existing data did not
provide an adequate basis for quantitative risk assessment.6 However, based on two
recent scientific studies,7 IARC recently re-classified DPM as Carcinogenic to Humans to
Group 1,8 which means that the agency has determined that there is “sufficient evidence
of carcinogenicity” of a substance in humans and represents the strongest weight-of-
evidence rating in IARC’s carcinogen classification scheme. This determination by the
IARC may provide additional impetus for the USEPA to identify a quantitative dose-
response relationship between exposure to DPM and cancer.
In summary, the estimated health impacts are based primarily on a series of conservative
assumptions related to predicted environmental concentrations, exposure, and chemical
toxicity. The use of conservative assumptions tends to produce upper-bound estimates of risk.
The USEPA notes that the conservative assumptions used in a HRA are intended to assure that
the estimated risks do not underestimate the actual risks posed by a site and that the estimated
risks do not necessarily represent actual risks experienced by populations at or near a site.9
6 United States Environmental Protection Agency, Health Assessment Document for Diesel Engine Exhaust, May 2002,
Accessed July 7, 2020 at: https://cfpub.epa.gov/si/si_public_record_report.cfm?dirEntryId=29060. 7 Attfield MD, Schleiff PL, Lubin JH, Blair A, Stewart PA, Vermeulen R, Coble JB, Silverman DT, The Diesel Exhaust in
Miners Study: A Nested Case-Control Study of Lung Cancer and Diesel Exhaust, June 2012, Accessed July 7, 2020 at:
https://www.ncbi.nlm.nih.gov/pmc/articles/PMC3369553/. 8 International Agency for Research on Cancer, Diesel Engine Exhaust Carcinogenic, June 2012, Accessed July 7, 2020 at:
https://www.iarc.fr/en/media-centre/pr/2012/pdfs/pr213_E.pdf. 9 United States Environmental Protection Agency, Risk Assessment Guidance for Superfund Human Health Risk
Assessment, December 1989, Accessed July 7, 2020 at: https://www.epa.gov/sites/production/files/2015-
09/documents/rags_a.pdf.

B-5
HAZARDS IDENTIFICATION
Diesel exhaust is a complex mixture of numerous individual gaseous and particulate
compounds emitted from diesel-fueled combustion engines. Diesel particulate matter is formed
primarily through the incomplete combustion of diesel fuel. DPM is removed from the
atmosphere through physical processes including atmospheric fall-out and washout by rain.
Humans can be exposed to airborne DPM by deposition on water, soil, and vegetation;
although the main pathway of exposure is inhalation. Cal/EPA has concluded that potential
cancer risk from inhalation exposure to whole diesel exhaust outweigh the multi-pathway
cancer risk from the speciated components.
In August 1998, the CARB identified DPM as an air toxic. CARB developed the Risk Reduction
Plan to Reduce Particulate Matter Emissions from Diesel- Fueled Engines and Vehicles and Risk
Management Guidance for the Permitting of New Stationary Diesel-Fueled Engines and approved
these documents on September 28, 2000.10,11
The documents represent proposals to reduce DPM
emissions, with the goal of reducing emissions and the associated health risk by requiring the
use of state-of-the-art catalyzed DPM filters and ultra-low-sulfur diesel fuel.
In 2001, CARB assessed the state-wide health risks from exposure to diesel exhaust and to other
toxic air contaminants. It is difficult to distinguish the health risks of diesel emissions from
those of other air toxics, since diesel exhaust contains approximately 40 different TAC. The
CARB study detected diesel exhaust by using ambient air carbon soot measurements as a
surrogate for diesel emissions. The study reported that the state-wide cancer risk from exposure
to diesel exhaust was about 540 per million population as compared to a total risk for exposure
to all ambient air toxics of 760 per million. This estimate, which accounts for about 70 percent of
the total risk from TAC, included both urban and rural areas in the state. The estimate can also
be considered an average worst-case for the state, since it assumes constant exposure to outdoor
concentrations of diesel exhaust and does not account for expected lower concentrations
indoors, where most of time is spent. DPM is estimated to increase statewide cancer risk by 520
cancers per million residents exposed over a lifetime.12
Exposure to DPM results in a greater incidence of chronic non-cancer health effects, such as
cough, labored breathing, chest tightness, wheezing, and bronchitis. Individuals particularly
vulnerable to DPM are children, whose lung tissue is still developing, the elderly and people
with illnesses who may have other serious health problems that can be aggravated by exposure
10
California Air Resources Board, Risk Reduction Plan to Reduce Particulate Matter Emissions from Diesel-Fueled Engines and
Vehicles, October 2000, Accessed July 7, 2020 at: http://www.arb.ca.gov/diesel/documents/rrpfinal.pdf. 11
California Air Resources Board, Risk Management Guidance for the Permitting of New Stationary Diesel-Fueled Engines,
October 2000, Accessed July 7, 2020 at: https://www.arb.ca.gov/diesel/documents/rmgFinal.pdf. 12
California Air Resources Board, Summary: Diesel Particulate Matter Health Impacts, April 12, 2016, Accessed July 7,
2020 at: https://www.arb.ca.gov/research/diesel/diesel-health_summ.htm.

B-6
to DPM. In general, children are more vulnerable than adults to air pollutants because they
have higher inhalation rates, narrower airways, and less mature immune systems. In addition,
children with allergies may have an enhanced allergic response when exposed to diesel exhaust.
EXPOSURE PARAMETERS
Exposure to airborne chemicals occurs through inhalation and subsequent absorption into the
body, potentially resulting in adverse health effects depending on toxicological properties of the
chemical and other exposure parameters. This HRA was conducted in accordance with
technical guidelines developed by federal, state, and regional agencies, including U.S.
Environmental Protection Agency (USEPA), California Environmental Protection Agency
(CalEPA), California Office of Environmental Health Hazard Assessment (OEHHA) Air Toxics
Hot Spots Program Guidance Manual for Preparation of Health Risk Assessments13, the SCAQMD AB
2588 and Rule 1402 Supplemental Guidelines for Preparing Risk Assessments for the Air Toxics “Hot
Spots” Information and Assessment Act,14
and SCAQMD’s Risk Assessment Procedures for Rule 1401,
1401.1 and 212.15
OEHHA's revisions to its Guidance Manual were primarily designed to ensure that the greater
sensitivity of children to cancer and other health risks is reflected in HRAs. For example,
OEHHA now recommends that risks be analyzed separately for multiple age groups, focusing
especially on young children and teenagers, rather than the past practice of analyzing risks to
the general population, without distinction by age. OEHHA also now recommends that
statistical "age sensitivity factors" be incorporated into a HRA, and that children's relatively
high breathing rates be accounted for. On the other hand, the Guidance Manual revisions also
include some changes that would reduce calculated health risks. For example, under the former
guidance, OEHHA recommended that residential cancer risks be assessed by assuming 70 years
of exposure at a residential receptor; under the Guidance Manual, this assumption is lessened to
30 years. This is based on studies showing that 30 years is a reasonable estimate of the 90th to
95th percentile of residency duration in the population. Therefore, the health risk assessment
provides that a receptor’s exposure to a project’s emissions for up to 30 years and that the
cancer rick is then determined based on a 70 year lifetime for that receptor.
13
Office of Environmental Health Hazard Assessment, Air Toxics Hot Spots Program Guidance Manual for Preparation of
Health Risk Assessments, March 6, 2015, Accessed July 7, 2020 at:
http://oehha.ca.gov/air/hot_spots/hotspots2015.html. 14
South Coast Air Quality Management District, AB 2588 and Rule 1402 Supplemental Guidelines for Preparing Risk
Assessments for the Air Toxics “Hot Spots” Information and Assessment Act, September 2018, Accessed July 7, 2020 at:
http://www.aqmd.gov/docs/default-source/planning/risk-assessment/ab-2588-supplemental-guidelines-201809.pdf?sfvrsn=6. 15
South Coast Air Quality Management District, Risk Assessment Procedures for Rule 1401, 1401.1 and 212, September 1,
2017, Accessed July 7, 2020 at: http://www.aqmd.gov/docs/default-source/permitting/rule-1401-risk-
assessment/riskassessproc-v8-1.pdf?sfvrsn=12.

B-7
Scientific data have shown that young animals are more sensitive than adult animals to
exposure to many carcinogens. Therefore, OEHHA developed age sensitivity factors (ASF) to
take into account the increased sensitivity to carcinogens during early-in-life exposures.
OEHHA recommends that cancer risks be weighted by a factor of 10 for exposures that occur
from the third trimester of pregnancy to 2 years of age, by a factor of 3 for exposures from 2
years through 16 years of age, and by a factor of 1 for exposures from 16 years through 30 years
of age.
OEHHA and SCAQMD has developed exposure factors (e.g., daily breathing rates) for four age
groups including the third trimester to birth, birth to 2 years, 2 to 16 years, and 16 to 30 years.
These age bins allow for more refined exposure information to be used when estimating
exposure and the potential for developing cancer over a lifetime. This means that exposure
variates are needed for the third trimester, ages zero to less than two, ages two to than 16, and
ages 16 to 30. Residential receptors utilize the 95th percentile breathing rate values. For
residential exposures, the high end daily breathing rates (e.g., 95th percentile) for children from
the third trimester through age 2, and 80th percentile daily breathing rates for all other ages is
recommended. The age-specific breathing rates for the four age groups are 361 liters per
kilogram-day for third trimester, 1,060 liters per kilogram-day for ages less than 2 years, 572
liters per kilogram-day for ages 2 to 16 years, and 261 liters per kilogram-day for ages 16 to 30
years. A school child (age 2 to 9 years) breathing rate is 631 liters per kilogram-day and an off-
site and onsite worker breathing rate is 230 liters per kilogram-day.16 17
Based on OEHHA recommendations, the cancer risk to residential receptors assumes exposure
occurs 24 hours per day for 350 days per year while accounting for a percentage of time at
home. OEHHA evaluated information from activity pattern databases to estimate the fraction of
time at home (FAH) during the day.
This information is used to adjust cancer risk from a project’s emissions, assuming that
exposure to the project’s emissions are not occurring away from home. A FAH factor of 0.5
applies for the offsite workers since the offsite worker is assumed to be present for a typical
eight hour work day compared to the 16 hour construction schedule. In general, the FAH
factors are age-specific and are 0.85 for ages less than 2 years, 0.72 for ages 2 to 16 years, and
0.73 for ages 16 to 30 years. However, SCAQMD recommends the FAH is assumed to be 1 for
ages third trimester to age 16. As a conservative assumption, children are assumed to attend a
16
Office of Environmental Health Hazard Assessment, Air Toxics Hot Spots Program Guidance Manual for Preparation of
Health Risk Assessments, March 6, 2015, Accessed July 7, 2020 at:
http://oehha.ca.gov/air/hot_spots/hotspots2015.html. 17
South Coast Air Quality Management District, Risk Assessment Procedures for Rule 1401, 1401.1 and 212, September 1,
2017, Accessed July 7, 2020 at: http://www.aqmd.gov/docs/default-source/permitting/rule-1401-risk-
assessment/riskassessproc-v8-1.pdf?sfvrsn=12.

B-8
daycare or school in close proximity to their home and no discount should be taken for time
spent outside of the area affected by the project’s emissions.18 19
Based on OEHHA recommendations, for children at school sites, exposure is assumed to occur
10 hours per day for 180 days (or 36 weeks) per year. Cancer risk estimates for children at
school sites are calculated based on nine year exposure duration. School sites also include
teachers and other adult staff which are treated as off-site workers. For occupational receptors,
SCAQMD guidance suggests that the exposure be based on 8 hours per day, 5 days per week,
250 working days per year, and a 25-year working lifetime. This is a conservative assumption,
since most people do not remain at the same job for 25 years. For worker exposures, it is
assumed that the working age begins at 16 years, and that exposures to project emissions occur
during the work shift which is typically up to eight hours per day during work days. Given the
exposure durations of less than 24 hours, sensitive recreational receptors were evaluated for
acute impacts only.20 21 Table B-1 presents a summary of the health risk assessment exposure
factors.
Table B-1: Health Risk Assessment Exposure Factors
Receptor Age Age
Specific
Factor
Breathing
Rate
(L/kg-day)
Fraction
of Time
Daily
Exposure
Annual
Exposure
Worker 16 to 41 1 230 1 8 hours 250 days
Residential Third Trimester 10 361 1 24 hours 350 days
0 to 2 10 1,090 1 24 hours 350 days
2 to 16 3 572 1 24 hours 350 days
16 to 30 1 261 0.73 24 hours 350 days
School Child 2 to 16 3 581 1 10 hours 180 days
Source: Office of Environmental Health Hazard Assessment, Air Toxics Hot Spots Program Guidance Manual for
Preparation of Health Risk Assessments, March 6, 2015, http://oehha.ca.gov/air/hot_spots/hotspots2015.html and South
Coast Air Quality Management District, Risk Assessment Procedures for Rule 1401, 1401.1 and 212, September 1, 2017,
http://www.aqmd.gov/docs/default-source/permitting/rule-1401-risk-assessment/riskassessproc-v8-1.pdf?sfvrsn=12.
18
Office of Environmental Health Hazard Assessment, Air Toxics Hot Spots Program Guidance Manual for Preparation of
Health Risk Assessments, March 6, 2015, Accessed July 7, 2020 at:
http://oehha.ca.gov/air/hot_spots/hotspots2015.html. 19
South Coast Air Quality Management District, Risk Assessment Procedures for Rule 1401, 1401.1 and 212, September 1,
2017, Accessed July 7, 2020 at: http://www.aqmd.gov/docs/default-source/permitting/rule-1401-risk-
assessment/riskassessproc-v8-1.pdf?sfvrsn=12. 20
Office of Environmental Health Hazard Assessment, Air Toxics Hot Spots Program Guidance Manual for Preparation of
Health Risk Assessments, March 6, 2015, Accessed July 7, 2020 at:
http://oehha.ca.gov/air/hot_spots/hotspots2015.html. 21
South Coast Air Quality Management District, Risk Assessment Procedures for Rule 1401, 1401.1 and 212, September 1,
2017, Accessed July 7, 2020 at: http://www.aqmd.gov/docs/default-source/permitting/rule-1401-risk-
assessment/riskassessproc-v8-1.pdf?sfvrsn=12.

B-9
RISK CHARACTERIZATION
Cancer risk is defined as the lifetime probability of developing cancer from exposure to
carcinogenic substances. Cancer risks are expressed as the chance in one million of getting
cancer (i.e., number of cancer cases among one million people exposed). The cancer risks are
assumed to occur exclusively through the inhalation pathway. The cancer risk can be estimated
by using the cancer potency factor (milligrams per kilogram of body weight per day [mg/kg-
day]), the 70-year annual average concentration (microgram per cubic meter [µg/m3]), and the
lifetime exposure adjustment based on a 30-year exposure duration.
Following guidelines established by OEHHA, the incremental cancer risks attributable to the
proposed project were calculated by applying exposure parameters to modeled DPM
concentrations in order to determine the inhalation dose (mg/kg-day) or the amount of
pollutants inhaled per body weight mass per day. The cancer risks occur exclusively through
the inhalation pathway; therefore, the cancer risks can be estimated from the following
equation:
Dose-inh = Cair * {DBR} * A * ASF * FAH * EF * ED * 10-6
AT
where:
Dose-inh = Dose of the toxic substance through inhalation in mg/kg-day
10-6 = Micrograms to milligrams conversion, Liters to cubic meters
conversion
Cair = Concentration in air in microgram (μg)/cubic meter (m3)
DBR = Daily breathing rate in liter (L)/kg body weight – day
A = Inhalation absorption factor, 1.0
ASF = Age Sensitivity Factor
EF = Exposure frequency (days/year)
ED = Exposure duration (years)
FAH = Fraction of Time at Home
AT = Averaging time period over which exposure is averaged in days
(25,550 days for a 70 year lifetime based on a 30-year exposure
duration)
To determine incremental cancer risk, the estimated inhalation dose attributed to the proposed
project was multiplied by the cancer potency slope factor (cancer risk per mg/kg-day). The
cancer potency slope factor is the upper bound on the increased cancer risk from a lifetime
exposure to a pollutant. These slope factors are based on epidemiological studies and are

B-10
different values for different pollutants. This allows the estimated inhalation dose to be equated
to a cancer risk.
Non-cancer adverse health impacts, acute (short-term) and chronic (long-term), are measured
against a hazard index (HI), which is defined as the ratio of the predicted incremental exposure
concentration from the proposed project to a published reference exposure level (REL) that
could cause adverse health effects as established by OEHHA. The ratio (referred to as the
Hazard Quotient [HQ]) of each non-carcinogenic substance that affects a certain organ system is
added to produce an overall HI for that organ system. The overall HI is calculated for each
organ system. If the overall HI for the highest-impacted organ system is greater than one, then
the impact is considered to be significant.
The HI is an expression used for the potential for non-cancer health effects. The relationship for
the non-cancer health effects is given by the annual concentration (in µg/m3) and the REL (in
µg/m3). The acute hazard index was determined using the “simple” concurrent maximum
approach, which tends to be conservative (i.e., overpredicts).
The relationship for the non-cancer health effects is given by the following equation:
HI = C/REL
Where:
HI = Hazard index; an expression of the potential for non-cancer health effects.
C = Annual average concentration (g/m3) during the 70 year exposure period.
REL = Concentration at which no adverse health effects are anticipated.
The concentration level at or below which no adverse non-cancer health effects are anticipated
for a specified exposure duration is termed the REL. REL are based on the most sensitive,
relevant, adverse health effect reported in the medical and toxicological literature. REL are
designed to protect the most sensitive individuals in the population by the inclusion of margins
of safety. Since margins of safety are incorporated to address data gaps and uncertainties,
exceeding the REL does not automatically indicate an adverse health impact.22 The chronic REL
for DPM was established by the California OEHHA as 5 g/m3.23
22 Office of Environmental Health Hazards Assessment - Consolidated Health Values Table, August 20, 2018,
Accessed July 7, 2020 at: https://www.arb.ca.gov/toxics/healthval/contable.pdf. 23
Office of Environmental Health Hazards Assessment - Acute, 8-hour, and Chronic Reference Exposure Levels, June
2014, Accessed July 7, 2020 at: http://www.oehha.ca.gov/air/allrels.html.

Health Risk Assessment Assumptions
5 Chronic Reference Exposure Level (ug/m3) for DPM Project: Inglewood Transit
1.1 Cancer Potency Slope Factor (cancer risk per mg/kg-day) for DPM Date:
250 days per year Condition: Unmitigated
25,550 days per lifetime Receptor: Offsite Workers
Scenario: Morning/Evening
230 80th Percentile Daily Breathing Rates (L/kg-day) 16<41 Years
0.67 fraction of time at work 16<41 Years
Exposure Calender Annual PM2.5 Daily Breathing Rates Exposure fraction of time
Year Year Concentration (ug/m3) (L/kg-day) Factor at work Cancer Risk 0.03 Chronic Hazard Impact
1 2021 - 230 1.00 0.73 - 1 Significance Threshold
2 2022 0.14 230 1.00 0.73 0.25 No Significant?
3 2023 0.17 230 1.00 0.73 0.30
4 2024 0.05 230 1.00 0.73 0.10 0.76 Cancer Risk (Adult)
5 2025 0.06 230 1.00 0.73 0.10 10 Significance Threshold
6 2026 0.01 230 1.00 0.73 0.01 No Significant?
4-Aug-20

Health Risk Assessment Assumptions
5 Chronic Reference Exposure Level (ug/m3) for DPM Project: Inglewood Transit
1.1 Cancer Potency Slope Factor (cancer risk per mg/kg-day) for DPM Date:
250 days per year Condition: Mitigated
25,550 days per lifetime Receptor: Offsite Workers
Scenario: Morning/Evening
230 80th Percentile Daily Breathing Rates (L/kg-day) 16<41 Years
0.67 fraction of time at work 16<41 Years
Exposure Calender Annual PM2.5 Daily Breathing Rates Exposure fraction of time
Year Year Concentration (ug/m3) (L/kg-day) Factor at work Cancer Risk 0.01 Chronic Hazard Impact
1 2021 - 230 1.00 0.73 - 1 Significance Threshold
2 2022 0.02 230 1.00 0.73 0.03 No Significant?
3 2023 0.02 230 1.00 0.73 0.04
4 2024 0.03 230 1.00 0.73 0.06 0.20 Cancer Risk (Adult)
5 2025 0.04 230 1.00 0.73 0.07 10 Significance Threshold
6 2026 0.00 230 1.00 0.73 0.01 No Significant?
4-Aug-20

Health Risk Assessment Assumptions
5 Chronic Reference Exposure Level (ug/m3) for DPM Project: Inglewood Transit
1.1 Cancer Potency Slope Factor (cancer risk per mg/kg-day) for DPM Date:
250 days per year Condition: Unmitigated
25,550 days per lifetime Receptor: Offsite Workers
Scenario: Morning/Night
230 80th Percentile Daily Breathing Rates (L/kg-day) 16<41 Years
0.67 fraction of time at work 16<41 Years
Exposure Calender Annual PM2.5 Daily Breathing Rates Exposure fraction of time
Year Year Concentration (ug/m3) (L/kg-day) Factor at work Cancer Risk 0.02 Chronic Hazard Impact
1 2021 - 230 1.00 0.73 - 1 Significance Threshold
2 2022 0.05 230 1.00 0.73 0.09 No Significant?
3 2023 0.06 230 1.00 0.73 0.11
4 2024 0.11 230 1.00 0.73 0.20 0.64 Cancer Risk (Adult)
5 2025 0.12 230 1.00 0.73 0.21 10 Significance Threshold
6 2026 0.02 230 1.00 0.73 0.03 No Significant?
4-Aug-20

Health Risk Assessment Assumptions
5 Chronic Reference Exposure Level (ug/m3) for DPM Project: Inglewood Transit
1.1 Cancer Potency Slope Factor (cancer risk per mg/kg-day) for DPM Date:
250 days per year Condition: Mitigated
25,550 days per lifetime Receptor: Offsite Workers
Scenario: Morning/Night
230 80th Percentile Daily Breathing Rates (L/kg-day) 16<41 Years
0.67 fraction of time at work 16<41 Years
Exposure Calender Annual PM2.5 Daily Breathing Rates Exposure fraction of time
Year Year Concentration (ug/m3) (L/kg-day) Factor at work Cancer Risk 0.01 Chronic Hazard Impact
1 2021 - 230 1.00 0.73 - 1 Significance Threshold
2 2022 0.01 230 1.00 0.73 0.02 No Significant?
3 2023 0.02 230 1.00 0.73 0.03
4 2024 0.03 230 1.00 0.73 0.05 0.18 Cancer Risk (Adult)
5 2025 0.03 230 1.00 0.73 0.06 10 Significance Threshold
6 2026 0.00 230 1.00 0.73 0.01 No Significant?
4-Aug-20

Health Risk Assessment Assumptions
5 Chronic Reference Exposure Level (ug/m3) for DPM Project: Inglewood Transit
1.1 Cancer Potency Slope Factor (cancer risk per mg/kg-day) for DPM Date:
350 days per year Condition: Unmitigated
25,550 days per lifetime Receptor: Existing Residence
Year: 2021
1,090 95th Percentile Daily Breathing Rates (L/kg-day) 0<2 Years Scenario: Morning/Evening
572 80th Percentile Daily Breathing Rates (L/kg-day) 2<16 Years
261 80th Percentile Daily Breathing Rates (L/kg-day) 16<30 Years
1 fraction of time at home 0<2 Years
1 fraction of time at home 2<16 Years
0.73 fraction of time at home 16<70 Years
Exposure Calender Annual PM2.5 Daily Breathing Rates Exposure fraction of time
Year Year Concentration (ug/m3) (L/kg-day) Factor at home Cancer Risk 0.02 Chronic Hazard Impact
1 2021 - 1,090 10.0 1.00 - 1 Significance Threshold
2 2022 0.06 1,090 10.0 1.00 9.87 No Significant?
3 2023 0.08 572 4.75 1.00 3.15
4 2024 0.07 572 3.00 1.00 1.85 17.0 Cancer Risk (Child)
5 2025 0.07 572 3.00 1.00 1.85 10 Significance Threshold
6 2026 0.01 572 3.00 1.00 0.27 Yes Significant?
7 2027 572 3.00 1.00
8 2028 572 3.00 1.00 1.42 Cancer Risk (Adult)
9 2029 572 3.00 1.00 10 Significance Threshold
10 2030 572 3.00 1.00 No Significant?
11 2031 572 3.00 1.00
12 2032 572 3.00 1.00
13 2033 572 3.00 1.00
14 2034 572 3.00 1.00
15 2035 572 3.00 1.00
16 2036 572 3.00 1.00
17 2037 261 1.70 0.73
18 2038 261 1.00 0.73
19 2039 261 1.00 0.73
20 2040 261 1.00 0.73
21 2041 261 1.00 0.73
22 2042 261 1.00 0.73
23 2043 261 1.00 0.73
24 2044 261 1.00 0.73
25 2045 261 1.00 0.73
26 2046 261 1.00 0.73
27 2047 261 1.00 0.73
28 2048 261 1.00 0.73
29 2049 261 1.00 0.73
30 2050 261 1.00 0.73
4-Aug-20

Health Risk Assessment Assumptions
5 Chronic Reference Exposure Level (ug/m3) for DPM Project: Inglewood Transit
1.1 Cancer Potency Slope Factor (cancer risk per mg/kg-day) for DPM Date:
350 days per year Condition: Unmitigated
25,550 days per lifetime Receptor: Existing Residence
Year: 2022
1,090 95th Percentile Daily Breathing Rates (L/kg-day) 0<2 Years Scenario: Morning/Evening
572 80th Percentile Daily Breathing Rates (L/kg-day) 2<16 Years
261 80th Percentile Daily Breathing Rates (L/kg-day) 16<30 Years
1 fraction of time at home 0<2 Years
1 fraction of time at home 2<16 Years
0.73 fraction of time at home 16<70 Years
Exposure Calender Annual PM2.5 Daily Breathing Rates Exposure fraction of time
Year Year Concentration (ug/m3) (L/kg-day) Factor at home Cancer Risk 0.02 Chronic Hazard Impact
1 2022 0.06 1,090 10.0 1.00 9.87 1 Significance Threshold
2 2023 0.08 1,090 10.0 1.00 12.6 No Significant?
3 2024 0.07 572 4.75 1.00 2.93
4 2025 0.07 572 3.00 1.00 1.85 27.6 Cancer Risk (Child)
5 2026 0.01 572 3.00 1.00 0.27 10 Significance Threshold
6 2027 572 3.00 1.00 Yes Significant?
7 2028 572 3.00 1.00
8 2029 572 3.00 1.00 1.42 Cancer Risk (Adult)
9 2030 572 3.00 1.00 10 Significance Threshold
10 2031 572 3.00 1.00 No Significant?
11 2032 572 3.00 1.00
12 2033 572 3.00 1.00
13 2034 572 3.00 1.00
14 2035 572 3.00 1.00
15 2036 572 3.00 1.00
16 2037 572 3.00 1.00
17 2038 261 1.70 0.73
18 2039 261 1.00 0.73
19 2040 261 1.00 0.73
20 2041 261 1.00 0.73
21 2042 261 1.00 0.73
22 2043 261 1.00 0.73
23 2044 261 1.00 0.73
24 2045 261 1.00 0.73
25 2046 261 1.00 0.73
26 2047 261 1.00 0.73
27 2048 261 1.00 0.73
28 2049 261 1.00 0.73
29 2050 261 1.00 0.73
30 2051 261 1.00 0.73
4-Aug-20

Health Risk Assessment Assumptions
5 Chronic Reference Exposure Level (ug/m3) for DPM Project: Inglewood Transit
1.1 Cancer Potency Slope Factor (cancer risk per mg/kg-day) for DPM Date:
350 days per year Condition: Unmitigated
25,550 days per lifetime Receptor: Existing Residence
Year: 2023
1,090 95th Percentile Daily Breathing Rates (L/kg-day) 0<2 Years Scenario: Morning/Evening
572 80th Percentile Daily Breathing Rates (L/kg-day) 2<16 Years
261 80th Percentile Daily Breathing Rates (L/kg-day) 16<30 Years
1 fraction of time at home 0<2 Years
1 fraction of time at home 2<16 Years
0.73 fraction of time at home 16<70 Years
Exposure Calender Annual PM2.5 Daily Breathing Rates Exposure fraction of time
Year Year Concentration (ug/m3) (L/kg-day) Factor at home Cancer Risk 0.02 Chronic Hazard Impact
1 2023 0.08 1,090 10.0 1.00 12.6 1 Significance Threshold
2 2024 0.07 1,090 10.0 1.00 11.8 No Significant?
3 2025 0.07 572 4.75 1.00 2.94
4 2026 0.01 572 3.00 1.00 0.27 27.6 Cancer Risk (Child)
5 2027 572 3.00 1.00 10 Significance Threshold
6 2028 572 3.00 1.00 Yes Significant?
7 2029 572 3.00 1.00
8 2030 572 3.00 1.00 1.13 Cancer Risk (Adult)
9 2031 572 3.00 1.00 10 Significance Threshold
10 2032 572 3.00 1.00 No Significant?
11 2033 572 3.00 1.00
12 2034 572 3.00 1.00
13 2035 572 3.00 1.00
14 2036 572 3.00 1.00
15 2037 572 3.00 1.00
16 2038 572 3.00 1.00
17 2039 261 1.70 0.73
18 2040 261 1.00 0.73
19 2041 261 1.00 0.73
20 2042 261 1.00 0.73
21 2043 261 1.00 0.73
22 2044 261 1.00 0.73
23 2045 261 1.00 0.73
24 2046 261 1.00 0.73
25 2047 261 1.00 0.73
26 2048 261 1.00 0.73
27 2049 261 1.00 0.73
28 2050 261 1.00 0.73
29 2051 261 1.00 0.73
30 2052 261 1.00 0.73
4-Aug-20

Health Risk Assessment Assumptions
5 Chronic Reference Exposure Level (ug/m3) for DPM Project: Inglewood Transit
1.1 Cancer Potency Slope Factor (cancer risk per mg/kg-day) for DPM Date:
350 days per year Condition: Unmitigated
25,550 days per lifetime Receptor: Existing Residence
Year: 2024
1,090 95th Percentile Daily Breathing Rates (L/kg-day) 0<2 Years Scenario: Morning/Evening
572 80th Percentile Daily Breathing Rates (L/kg-day) 2<16 Years
261 80th Percentile Daily Breathing Rates (L/kg-day) 16<30 Years
1 fraction of time at home 0<2 Years
1 fraction of time at home 2<16 Years
0.73 fraction of time at home 16<70 Years
Exposure Calender Annual PM2.5 Daily Breathing Rates Exposure fraction of time
Year Year Concentration (ug/m3) (L/kg-day) Factor at home Cancer Risk 0.01 Chronic Hazard Impact
1 2024 0.07 1,090 10.0 1.00 11.8 1 Significance Threshold
2 2025 0.07 1,090 10.0 1.00 11.8 No Significant?
3 2026 0.01 572 4.75 1.00 0.43
4 2027 572 3.00 1.00 24.0 Cancer Risk (Child)
5 2028 572 3.00 1.00 10 Significance Threshold
6 2029 572 3.00 1.00 Yes Significant?
7 2030 572 3.00 1.00
8 2031 572 3.00 1.00 0.75 Cancer Risk (Adult)
9 2032 572 3.00 1.00 10 Significance Threshold
10 2033 572 3.00 1.00 No Significant?
11 2034 572 3.00 1.00
12 2035 572 3.00 1.00
13 2036 572 3.00 1.00
14 2037 572 3.00 1.00
15 2038 572 3.00 1.00
16 2039 572 3.00 1.00
17 2040 261 1.70 0.73
18 2041 261 1.00 0.73
19 2042 261 1.00 0.73
20 2043 261 1.00 0.73
21 2044 261 1.00 0.73
22 2045 261 1.00 0.73
23 2046 261 1.00 0.73
24 2047 261 1.00 0.73
25 2048 261 1.00 0.73
26 2049 261 1.00 0.73
27 2050 261 1.00 0.73
28 2051 261 1.00 0.73
29 2052 261 1.00 0.73
30 2053 261 1.00 0.73
4-Aug-20

Health Risk Assessment Assumptions
5 Chronic Reference Exposure Level (ug/m3) for DPM Project: Inglewood Transit
1.1 Cancer Potency Slope Factor (cancer risk per mg/kg-day) for DPM Date:
350 days per year Condition: Unmitigated
25,550 days per lifetime Receptor: Existing Residence
Year: 2025
1,090 95th Percentile Daily Breathing Rates (L/kg-day) 0<2 Years Scenario: Morning/Evening
572 80th Percentile Daily Breathing Rates (L/kg-day) 2<16 Years
261 80th Percentile Daily Breathing Rates (L/kg-day) 16<30 Years
1 fraction of time at home 0<2 Years
1 fraction of time at home 2<16 Years
0.73 fraction of time at home 16<70 Years
Exposure Calender Annual PM2.5 Daily Breathing Rates Exposure fraction of time
Year Year Concentration (ug/m3) (L/kg-day) Factor at home Cancer Risk 0.01 Chronic Hazard Impact
1 2025 0.07 1,090 10.0 1.00 11.8 1 Significance Threshold
2 2026 0.01 1,090 10.0 1.00 1.71 No Significant?
3 2027 572 4.75 1.00
4 2028 572 3.00 1.00 13.5 Cancer Risk (Child)
5 2029 572 3.00 1.00 10 Significance Threshold
6 2030 572 3.00 1.00 Yes Significant?
7 2031 572 3.00 1.00
8 2032 572 3.00 1.00 0.40 Cancer Risk (Adult)
9 2033 572 3.00 1.00 10 Significance Threshold
10 2034 572 3.00 1.00 No Significant?
11 2035 572 3.00 1.00
12 2036 572 3.00 1.00
13 2037 572 3.00 1.00
14 2038 572 3.00 1.00
15 2039 572 3.00 1.00
16 2040 572 3.00 1.00
17 2041 261 1.70 0.73
18 2042 261 1.00 0.73
19 2043 261 1.00 0.73
20 2044 261 1.00 0.73
21 2045 261 1.00 0.73
22 2046 261 1.00 0.73
23 2047 261 1.00 0.73
24 2048 261 1.00 0.73
25 2049 261 1.00 0.73
26 2050 261 1.00 0.73
27 2051 261 1.00 0.73
28 2052 261 1.00 0.73
29 2053 261 1.00 0.73
30 2054 261 1.00 0.73
4-Aug-20

Health Risk Assessment Assumptions
5 Chronic Reference Exposure Level (ug/m3) for DPM Project: Inglewood Transit
1.1 Cancer Potency Slope Factor (cancer risk per mg/kg-day) for DPM Date:
350 days per year Condition: Unmitigated
25,550 days per lifetime Receptor: Existing Residence
Year: 2026
1,090 95th Percentile Daily Breathing Rates (L/kg-day) 0<2 Years Scenario: Morning/Evening
572 80th Percentile Daily Breathing Rates (L/kg-day) 2<16 Years
261 80th Percentile Daily Breathing Rates (L/kg-day) 16<30 Years
1 fraction of time at home 0<2 Years
1 fraction of time at home 2<16 Years
0.73 fraction of time at home 16<70 Years
Exposure Calender Annual PM2.5 Daily Breathing Rates Exposure fraction of time
Year Year Concentration (ug/m3) (L/kg-day) Factor at home Cancer Risk 0.00 Chronic Hazard Impact
1 2026 0.01 1,090 10.0 1.00 1.71 1 Significance Threshold
2 2027 1,090 10.0 1.00 No Significant?
3 2028 572 4.75 1.00
4 2029 572 3.00 1.00 1.71 Cancer Risk (Child)
5 2030 572 3.00 1.00 10 Significance Threshold
6 2031 572 3.00 1.00 No Significant?
7 2032 572 3.00 1.00
8 2033 572 3.00 1.00 0.05 Cancer Risk (Adult)
9 2034 572 3.00 1.00 10 Significance Threshold
10 2035 572 3.00 1.00 No Significant?
11 2036 572 3.00 1.00
12 2037 572 3.00 1.00
13 2038 572 3.00 1.00
14 2039 572 3.00 1.00
15 2040 572 3.00 1.00
16 2041 572 3.00 1.00
17 2042 261 1.70 0.73
18 2043 261 1.00 0.73
19 2044 261 1.00 0.73
20 2045 261 1.00 0.73
21 2046 261 1.00 0.73
22 2047 261 1.00 0.73
23 2048 261 1.00 0.73
24 2049 261 1.00 0.73
25 2050 261 1.00 0.73
26 2051 261 1.00 0.73
27 2052 261 1.00 0.73
28 2053 261 1.00 0.73
29 2054 261 1.00 0.73
30 2055 261 1.00 0.73
4-Aug-20

Health Risk Assessment Assumptions
5 Chronic Reference Exposure Level (ug/m3) for DPM Project: Inglewood Transit
1.1 Cancer Potency Slope Factor (cancer risk per mg/kg-day) for DPM Date:
350 days per year Condition: Mitigated
25,550 days per lifetime Receptor: Existing Residence
Year: 2021
1,090 95th Percentile Daily Breathing Rates (L/kg-day) 0<2 Years Scenario: Morning/Evening
572 80th Percentile Daily Breathing Rates (L/kg-day) 2<16 Years
261 80th Percentile Daily Breathing Rates (L/kg-day) 16<30 Years
1 fraction of time at home 0<2 Years
1 fraction of time at home 2<16 Years
0.73 fraction of time at home 16<70 Years
Exposure Calender Annual PM2.5 Daily Breathing Rates Exposure fraction of time
Year Year Concentration (ug/m3) (L/kg-day) Factor at home Cancer Risk 0.00 Chronic Hazard Impact
1 2021 - 1,090 10.0 1.00 - 1 Significance Threshold
2 2022 0.02 1,090 10.0 1.00 2.57 No Significant?
3 2023 0.02 572 4.75 1.00 0.89
4 2024 0.02 572 3.00 1.00 0.50 4.54 Cancer Risk (Child)
5 2025 0.02 572 3.00 1.00 0.54 10 Significance Threshold
6 2026 0.00 572 3.00 1.00 0.06 No Significant?
7 2027 572 3.00 1.00
8 2028 572 3.00 1.00 0.39 Cancer Risk (Adult)
9 2029 572 3.00 1.00 10 Significance Threshold
10 2030 572 3.00 1.00 No Significant?
11 2031 572 3.00 1.00
12 2032 572 3.00 1.00
13 2033 572 3.00 1.00
14 2034 572 3.00 1.00
15 2035 572 3.00 1.00
16 2036 572 3.00 1.00
17 2037 261 1.70 0.73
18 2038 261 1.00 0.73
19 2039 261 1.00 0.73
20 2040 261 1.00 0.73
21 2041 261 1.00 0.73
22 2042 261 1.00 0.73
23 2043 261 1.00 0.73
24 2044 261 1.00 0.73
25 2045 261 1.00 0.73
26 2046 261 1.00 0.73
27 2047 261 1.00 0.73
28 2048 261 1.00 0.73
29 2049 261 1.00 0.73
30 2050 261 1.00 0.73
4-Aug-20

Health Risk Assessment Assumptions
5 Chronic Reference Exposure Level (ug/m3) for DPM Project: Inglewood Transit
1.1 Cancer Potency Slope Factor (cancer risk per mg/kg-day) for DPM Date:
350 days per year Condition: Mitigated
25,550 days per lifetime Receptor: Existing Residence
Year: 2022
1,090 95th Percentile Daily Breathing Rates (L/kg-day) 0<2 Years Scenario: Morning/Evening
572 80th Percentile Daily Breathing Rates (L/kg-day) 2<16 Years
261 80th Percentile Daily Breathing Rates (L/kg-day) 16<30 Years
1 fraction of time at home 0<2 Years
1 fraction of time at home 2<16 Years
0.73 fraction of time at home 16<70 Years
Exposure Calender Annual PM2.5 Daily Breathing Rates Exposure fraction of time
Year Year Concentration (ug/m3) (L/kg-day) Factor at home Cancer Risk 0.00 Chronic Hazard Impact
1 2022 0.02 1,090 10.0 1.00 2.57 1 Significance Threshold
2 2023 0.02 1,090 10.0 1.00 3.55 No Significant?
3 2024 0.02 572 4.75 1.00 0.79
4 2025 0.02 572 3.00 1.00 0.54 7.50 Cancer Risk (Child)
5 2026 0.00 572 3.00 1.00 0.06 10 Significance Threshold
6 2027 572 3.00 1.00 No Significant?
7 2028 572 3.00 1.00
8 2029 572 3.00 1.00 0.39 Cancer Risk (Adult)
9 2030 572 3.00 1.00 10 Significance Threshold
10 2031 572 3.00 1.00 No Significant?
11 2032 572 3.00 1.00
12 2033 572 3.00 1.00
13 2034 572 3.00 1.00
14 2035 572 3.00 1.00
15 2036 572 3.00 1.00
16 2037 572 3.00 1.00
17 2038 261 1.70 0.73
18 2039 261 1.00 0.73
19 2040 261 1.00 0.73
20 2041 261 1.00 0.73
21 2042 261 1.00 0.73
22 2043 261 1.00 0.73
23 2044 261 1.00 0.73
24 2045 261 1.00 0.73
25 2046 261 1.00 0.73
26 2047 261 1.00 0.73
27 2048 261 1.00 0.73
28 2049 261 1.00 0.73
29 2050 261 1.00 0.73
30 2051 261 1.00 0.73
4-Aug-20

Health Risk Assessment Assumptions
5 Chronic Reference Exposure Level (ug/m3) for DPM Project: Inglewood Transit
1.1 Cancer Potency Slope Factor (cancer risk per mg/kg-day) for DPM Date:
350 days per year Condition: Mitigated
25,550 days per lifetime Receptor: Existing Residence
Year: 2023
1,090 95th Percentile Daily Breathing Rates (L/kg-day) 0<2 Years Scenario: Morning/Evening
572 80th Percentile Daily Breathing Rates (L/kg-day) 2<16 Years
261 80th Percentile Daily Breathing Rates (L/kg-day) 16<30 Years
1 fraction of time at home 0<2 Years
1 fraction of time at home 2<16 Years
0.73 fraction of time at home 16<70 Years
Exposure Calender Annual PM2.5 Daily Breathing Rates Exposure fraction of time
Year Year Concentration (ug/m3) (L/kg-day) Factor at home Cancer Risk 0.00 Chronic Hazard Impact
1 2023 0.02 1,090 10.0 1.00 3.55 1 Significance Threshold
2 2024 0.02 1,090 10.0 1.00 3.16 No Significant?
3 2025 0.02 572 4.75 1.00 0.86
4 2026 0.00 572 3.00 1.00 0.06 7.63 Cancer Risk (Child)
5 2027 572 3.00 1.00 10 Significance Threshold
6 2028 572 3.00 1.00 No Significant?
7 2029 572 3.00 1.00
8 2030 572 3.00 1.00 0.31 Cancer Risk (Adult)
9 2031 572 3.00 1.00 10 Significance Threshold
10 2032 572 3.00 1.00 No Significant?
11 2033 572 3.00 1.00
12 2034 572 3.00 1.00
13 2035 572 3.00 1.00
14 2036 572 3.00 1.00
15 2037 572 3.00 1.00
16 2038 572 3.00 1.00
17 2039 261 1.70 0.73
18 2040 261 1.00 0.73
19 2041 261 1.00 0.73
20 2042 261 1.00 0.73
21 2043 261 1.00 0.73
22 2044 261 1.00 0.73
23 2045 261 1.00 0.73
24 2046 261 1.00 0.73
25 2047 261 1.00 0.73
26 2048 261 1.00 0.73
27 2049 261 1.00 0.73
28 2050 261 1.00 0.73
29 2051 261 1.00 0.73
30 2052 261 1.00 0.73
4-Aug-20

Health Risk Assessment Assumptions
5 Chronic Reference Exposure Level (ug/m3) for DPM Project: Inglewood Transit
1.1 Cancer Potency Slope Factor (cancer risk per mg/kg-day) for DPM Date:
350 days per year Condition: Mitigated
25,550 days per lifetime Receptor: Existing Residence
Year: 2024
1,090 95th Percentile Daily Breathing Rates (L/kg-day) 0<2 Years Scenario: Morning/Evening
572 80th Percentile Daily Breathing Rates (L/kg-day) 2<16 Years
261 80th Percentile Daily Breathing Rates (L/kg-day) 16<30 Years
1 fraction of time at home 0<2 Years
1 fraction of time at home 2<16 Years
0.73 fraction of time at home 16<70 Years
Exposure Calender Annual PM2.5 Daily Breathing Rates Exposure fraction of time
Year Year Concentration (ug/m3) (L/kg-day) Factor at home Cancer Risk 0.00 Chronic Hazard Impact
1 2024 0.02 1,090 10.0 1.00 3.16 1 Significance Threshold
2 2025 0.02 1,090 10.0 1.00 3.43 No Significant?
3 2026 0.00 572 4.75 1.00 0.09
4 2027 572 3.00 1.00 6.68 Cancer Risk (Child)
5 2028 572 3.00 1.00 10 Significance Threshold
6 2029 572 3.00 1.00 No Significant?
7 2030 572 3.00 1.00
8 2031 572 3.00 1.00 0.21 Cancer Risk (Adult)
9 2032 572 3.00 1.00 10 Significance Threshold
10 2033 572 3.00 1.00 No Significant?
11 2034 572 3.00 1.00
12 2035 572 3.00 1.00
13 2036 572 3.00 1.00
14 2037 572 3.00 1.00
15 2038 572 3.00 1.00
16 2039 572 3.00 1.00
17 2040 261 1.70 0.73
18 2041 261 1.00 0.73
19 2042 261 1.00 0.73
20 2043 261 1.00 0.73
21 2044 261 1.00 0.73
22 2045 261 1.00 0.73
23 2046 261 1.00 0.73
24 2047 261 1.00 0.73
25 2048 261 1.00 0.73
26 2049 261 1.00 0.73
27 2050 261 1.00 0.73
28 2051 261 1.00 0.73
29 2052 261 1.00 0.73
30 2053 261 1.00 0.73
4-Aug-20
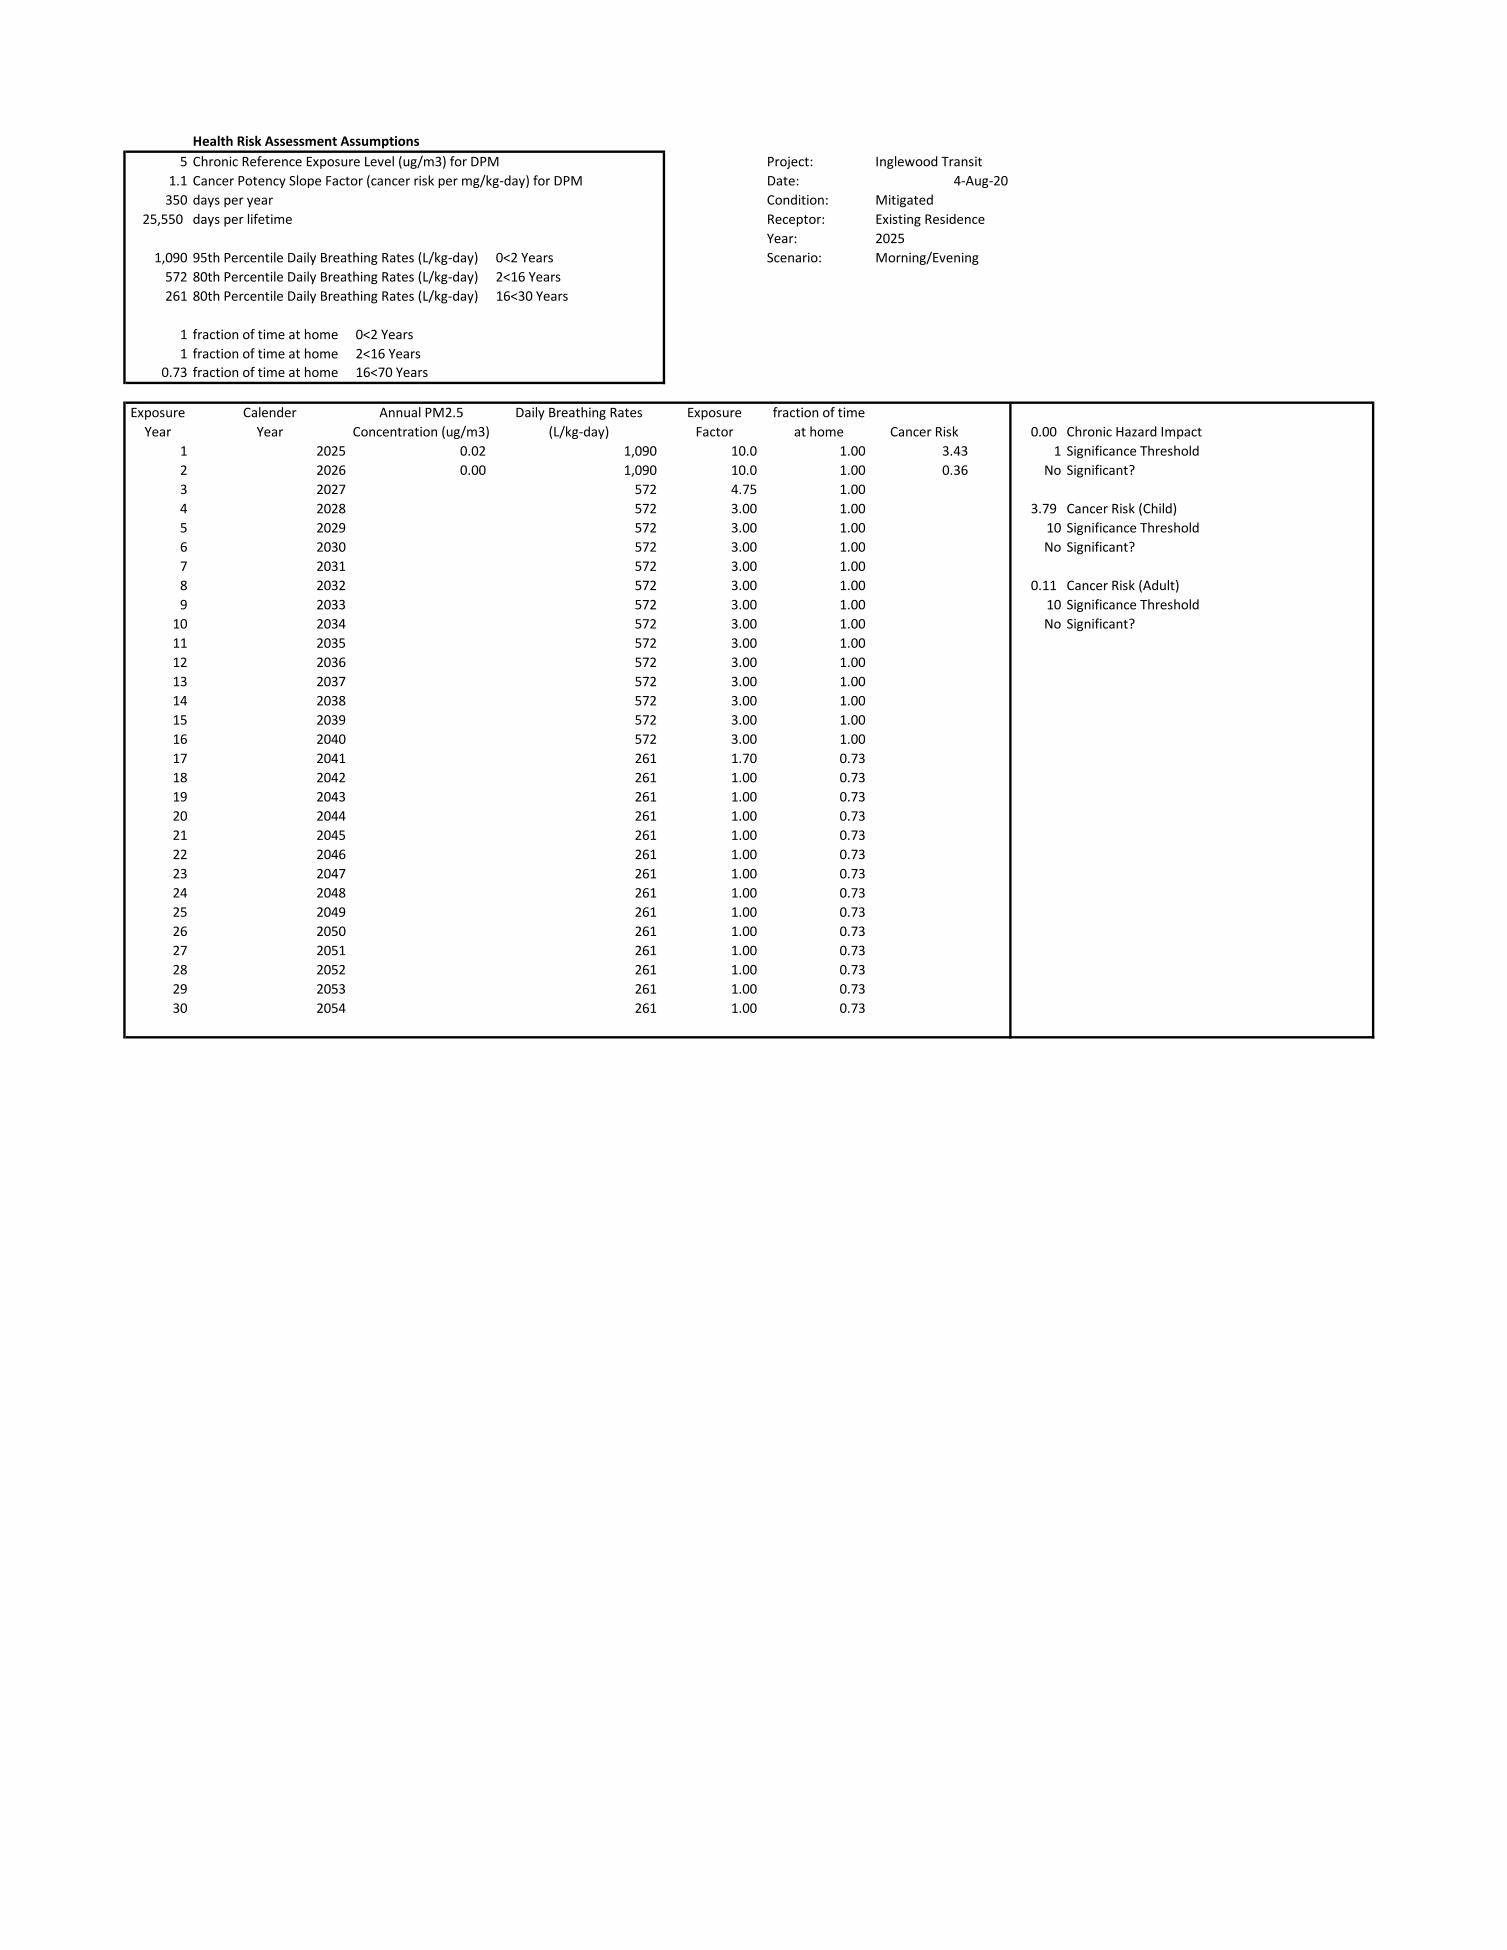
Health Risk Assessment Assumptions
5 Chronic Reference Exposure Level (ug/m3) for DPM Project: Inglewood Transit
1.1 Cancer Potency Slope Factor (cancer risk per mg/kg-day) for DPM Date:
350 days per year Condition: Mitigated
25,550 days per lifetime Receptor: Existing Residence
Year: 2025
1,090 95th Percentile Daily Breathing Rates (L/kg-day) 0<2 Years Scenario: Morning/Evening
572 80th Percentile Daily Breathing Rates (L/kg-day) 2<16 Years
261 80th Percentile Daily Breathing Rates (L/kg-day) 16<30 Years
1 fraction of time at home 0<2 Years
1 fraction of time at home 2<16 Years
0.73 fraction of time at home 16<70 Years
Exposure Calender Annual PM2.5 Daily Breathing Rates Exposure fraction of time
Year Year Concentration (ug/m3) (L/kg-day) Factor at home Cancer Risk 0.00 Chronic Hazard Impact
1 2025 0.02 1,090 10.0 1.00 3.43 1 Significance Threshold
2 2026 0.00 1,090 10.0 1.00 0.36 No Significant?
3 2027 572 4.75 1.00
4 2028 572 3.00 1.00 3.79 Cancer Risk (Child)
5 2029 572 3.00 1.00 10 Significance Threshold
6 2030 572 3.00 1.00 No Significant?
7 2031 572 3.00 1.00
8 2032 572 3.00 1.00 0.11 Cancer Risk (Adult)
9 2033 572 3.00 1.00 10 Significance Threshold
10 2034 572 3.00 1.00 No Significant?
11 2035 572 3.00 1.00
12 2036 572 3.00 1.00
13 2037 572 3.00 1.00
14 2038 572 3.00 1.00
15 2039 572 3.00 1.00
16 2040 572 3.00 1.00
17 2041 261 1.70 0.73
18 2042 261 1.00 0.73
19 2043 261 1.00 0.73
20 2044 261 1.00 0.73
21 2045 261 1.00 0.73
22 2046 261 1.00 0.73
23 2047 261 1.00 0.73
24 2048 261 1.00 0.73
25 2049 261 1.00 0.73
26 2050 261 1.00 0.73
27 2051 261 1.00 0.73
28 2052 261 1.00 0.73
29 2053 261 1.00 0.73
30 2054 261 1.00 0.73
4-Aug-20

Health Risk Assessment Assumptions
5 Chronic Reference Exposure Level (ug/m3) for DPM Project: Inglewood Transit
1.1 Cancer Potency Slope Factor (cancer risk per mg/kg-day) for DPM Date:
350 days per year Condition: Mitigated
25,550 days per lifetime Receptor: Existing Residence
Year: 2026
1,090 95th Percentile Daily Breathing Rates (L/kg-day) 0<2 Years Scenario: Morning/Evening
572 80th Percentile Daily Breathing Rates (L/kg-day) 2<16 Years
261 80th Percentile Daily Breathing Rates (L/kg-day) 16<30 Years
1 fraction of time at home 0<2 Years
1 fraction of time at home 2<16 Years
0.73 fraction of time at home 16<70 Years
Exposure Calender Annual PM2.5 Daily Breathing Rates Exposure fraction of time
Year Year Concentration (ug/m3) (L/kg-day) Factor at home Cancer Risk 0.00 Chronic Hazard Impact
1 2026 0.00 1,090 10.0 1.00 0.36 1 Significance Threshold
2 2027 1,090 10.0 1.00 No Significant?
3 2028 572 4.75 1.00
4 2029 572 3.00 1.00 0.36 Cancer Risk (Child)
5 2030 572 3.00 1.00 10 Significance Threshold
6 2031 572 3.00 1.00 No Significant?
7 2032 572 3.00 1.00
8 2033 572 3.00 1.00 0.01 Cancer Risk (Adult)
9 2034 572 3.00 1.00 10 Significance Threshold
10 2035 572 3.00 1.00 No Significant?
11 2036 572 3.00 1.00
12 2037 572 3.00 1.00
13 2038 572 3.00 1.00
14 2039 572 3.00 1.00
15 2040 572 3.00 1.00
16 2041 572 3.00 1.00
17 2042 261 1.70 0.73
18 2043 261 1.00 0.73
19 2044 261 1.00 0.73
20 2045 261 1.00 0.73
21 2046 261 1.00 0.73
22 2047 261 1.00 0.73
23 2048 261 1.00 0.73
24 2049 261 1.00 0.73
25 2050 261 1.00 0.73
26 2051 261 1.00 0.73
27 2052 261 1.00 0.73
28 2053 261 1.00 0.73
29 2054 261 1.00 0.73
30 2055 261 1.00 0.73
4-Aug-20

Health Risk Assessment Assumptions
5 Chronic Reference Exposure Level (ug/m3) for DPM Project: Inglewood Transit
1.1 Cancer Potency Slope Factor (cancer risk per mg/kg-day) for DPM Date:
350 days per year Condition: Unmitigated
25,550 days per lifetime Receptor: Existing Residence
Year: 2021
1,090 95th Percentile Daily Breathing Rates (L/kg-day) 0<2 Years Scenario: Morning/Night
572 80th Percentile Daily Breathing Rates (L/kg-day) 2<16 Years
261 80th Percentile Daily Breathing Rates (L/kg-day) 16<30 Years
1 fraction of time at home 0<2 Years
1 fraction of time at home 2<16 Years
0.73 fraction of time at home 16<70 Years
Exposure Calender Annual PM2.5 Daily Breathing Rates Exposure fraction of time
Year Year Concentration (ug/m3) (L/kg-day) Factor at home Cancer Risk 0.02 Chronic Hazard Impact
1 2021 - 1,090 10.0 1.00 - 1 Significance Threshold
2 2022 0.02 1,090 10.0 1.00 3.48 No Significant?
3 2023 0.03 572 4.75 1.00 1.13
4 2024 0.10 572 3.00 1.00 2.58 10.2 Cancer Risk (Child)
5 2025 0.10 572 3.00 1.00 2.65 10 Significance Threshold
6 2026 0.02 572 3.00 1.00 0.39 Yes Significant?
7 2027 572 3.00 1.00
8 2028 572 3.00 1.00 1.30 Cancer Risk (Adult)
9 2029 572 3.00 1.00 10 Significance Threshold
10 2030 572 3.00 1.00 No Significant?
11 2031 572 3.00 1.00
12 2032 572 3.00 1.00
13 2033 572 3.00 1.00
14 2034 572 3.00 1.00
15 2035 572 3.00 1.00
16 2036 572 3.00 1.00
17 2037 261 1.70 0.73
18 2038 261 1.00 0.73
19 2039 261 1.00 0.73
20 2040 261 1.00 0.73
21 2041 261 1.00 0.73
22 2042 261 1.00 0.73
23 2043 261 1.00 0.73
24 2044 261 1.00 0.73
25 2045 261 1.00 0.73
26 2046 261 1.00 0.73
27 2047 261 1.00 0.73
28 2048 261 1.00 0.73
29 2049 261 1.00 0.73
30 2050 261 1.00 0.73
4-Aug-20

Health Risk Assessment Assumptions
5 Chronic Reference Exposure Level (ug/m3) for DPM Project: Inglewood Transit
1.1 Cancer Potency Slope Factor (cancer risk per mg/kg-day) for DPM Date:
350 days per year Condition: Unmitigated
25,550 days per lifetime Receptor: Existing Residence
Year: 2022
1,090 95th Percentile Daily Breathing Rates (L/kg-day) 0<2 Years Scenario: Morning/Night
572 80th Percentile Daily Breathing Rates (L/kg-day) 2<16 Years
261 80th Percentile Daily Breathing Rates (L/kg-day) 16<30 Years
1 fraction of time at home 0<2 Years
1 fraction of time at home 2<16 Years
0.73 fraction of time at home 16<70 Years
Exposure Calender Annual PM2.5 Daily Breathing Rates Exposure fraction of time
Year Year Concentration (ug/m3) (L/kg-day) Factor at home Cancer Risk 0.02 Chronic Hazard Impact
1 2022 0.02 1,090 10.0 1.00 3.48 1 Significance Threshold
2 2023 0.03 1,090 10.0 1.00 4.53 No Significant?
3 2024 0.10 572 4.75 1.00 4.09
4 2025 0.10 572 3.00 1.00 2.65 15.1 Cancer Risk (Child)
5 2026 0.02 572 3.00 1.00 0.39 10 Significance Threshold
6 2027 572 3.00 1.00 Yes Significant?
7 2028 572 3.00 1.00
8 2029 572 3.00 1.00 1.30 Cancer Risk (Adult)
9 2030 572 3.00 1.00 10 Significance Threshold
10 2031 572 3.00 1.00 No Significant?
11 2032 572 3.00 1.00
12 2033 572 3.00 1.00
13 2034 572 3.00 1.00
14 2035 572 3.00 1.00
15 2036 572 3.00 1.00
16 2037 572 3.00 1.00
17 2038 261 1.70 0.73
18 2039 261 1.00 0.73
19 2040 261 1.00 0.73
20 2041 261 1.00 0.73
21 2042 261 1.00 0.73
22 2043 261 1.00 0.73
23 2044 261 1.00 0.73
24 2045 261 1.00 0.73
25 2046 261 1.00 0.73
26 2047 261 1.00 0.73
27 2048 261 1.00 0.73
28 2049 261 1.00 0.73
29 2050 261 1.00 0.73
30 2051 261 1.00 0.73
4-Aug-20

Health Risk Assessment Assumptions
5 Chronic Reference Exposure Level (ug/m3) for DPM Project: Inglewood Transit
1.1 Cancer Potency Slope Factor (cancer risk per mg/kg-day) for DPM Date:
350 days per year Condition: Unmitigated
25,550 days per lifetime Receptor: Existing Residence
Year: 2023
1,090 95th Percentile Daily Breathing Rates (L/kg-day) 0<2 Years Scenario: Morning/Night
572 80th Percentile Daily Breathing Rates (L/kg-day) 2<16 Years
261 80th Percentile Daily Breathing Rates (L/kg-day) 16<30 Years
1 fraction of time at home 0<2 Years
1 fraction of time at home 2<16 Years
0.73 fraction of time at home 16<70 Years
Exposure Calender Annual PM2.5 Daily Breathing Rates Exposure fraction of time
Year Year Concentration (ug/m3) (L/kg-day) Factor at home Cancer Risk 0.02 Chronic Hazard Impact
1 2023 0.03 1,090 10.0 1.00 4.53 1 Significance Threshold
2 2024 0.10 1,090 10.0 1.00 16.4 No Significant?
3 2025 0.10 572 4.75 1.00 4.19
4 2026 0.02 572 3.00 1.00 0.39 25.5 Cancer Risk (Child)
5 2027 572 3.00 1.00 10 Significance Threshold
6 2028 572 3.00 1.00 Yes Significant?
7 2029 572 3.00 1.00
8 2030 572 3.00 1.00 1.20 Cancer Risk (Adult)
9 2031 572 3.00 1.00 10 Significance Threshold
10 2032 572 3.00 1.00 No Significant?
11 2033 572 3.00 1.00
12 2034 572 3.00 1.00
13 2035 572 3.00 1.00
14 2036 572 3.00 1.00
15 2037 572 3.00 1.00
16 2038 572 3.00 1.00
17 2039 261 1.70 0.73
18 2040 261 1.00 0.73
19 2041 261 1.00 0.73
20 2042 261 1.00 0.73
21 2043 261 1.00 0.73
22 2044 261 1.00 0.73
23 2045 261 1.00 0.73
24 2046 261 1.00 0.73
25 2047 261 1.00 0.73
26 2048 261 1.00 0.73
27 2049 261 1.00 0.73
28 2050 261 1.00 0.73
29 2051 261 1.00 0.73
30 2052 261 1.00 0.73
4-Aug-20

Health Risk Assessment Assumptions
5 Chronic Reference Exposure Level (ug/m3) for DPM Project: Inglewood Transit
1.1 Cancer Potency Slope Factor (cancer risk per mg/kg-day) for DPM Date:
350 days per year Condition: Unmitigated
25,550 days per lifetime Receptor: Existing Residence
Year: 2024
1,090 95th Percentile Daily Breathing Rates (L/kg-day) 0<2 Years Scenario: Morning/Night
572 80th Percentile Daily Breathing Rates (L/kg-day) 2<16 Years
261 80th Percentile Daily Breathing Rates (L/kg-day) 16<30 Years
1 fraction of time at home 0<2 Years
1 fraction of time at home 2<16 Years
0.73 fraction of time at home 16<70 Years
Exposure Calender Annual PM2.5 Daily Breathing Rates Exposure fraction of time
Year Year Concentration (ug/m3) (L/kg-day) Factor at home Cancer Risk 0.02 Chronic Hazard Impact
1 2024 0.10 1,090 10.0 1.00 16.4 1 Significance Threshold
2 2025 0.10 1,090 10.0 1.00 16.8 No Significant?
3 2026 0.02 572 4.75 1.00 0.62
4 2027 572 3.00 1.00 33.8 Cancer Risk (Child)
5 2028 572 3.00 1.00 10 Significance Threshold
6 2029 572 3.00 1.00 Yes Significant?
7 2030 572 3.00 1.00
8 2031 572 3.00 1.00 1.06 Cancer Risk (Adult)
9 2032 572 3.00 1.00 10 Significance Threshold
10 2033 572 3.00 1.00 No Significant?
11 2034 572 3.00 1.00
12 2035 572 3.00 1.00
13 2036 572 3.00 1.00
14 2037 572 3.00 1.00
15 2038 572 3.00 1.00
16 2039 572 3.00 1.00
17 2040 261 1.70 0.73
18 2041 261 1.00 0.73
19 2042 261 1.00 0.73
20 2043 261 1.00 0.73
21 2044 261 1.00 0.73
22 2045 261 1.00 0.73
23 2046 261 1.00 0.73
24 2047 261 1.00 0.73
25 2048 261 1.00 0.73
26 2049 261 1.00 0.73
27 2050 261 1.00 0.73
28 2051 261 1.00 0.73
29 2052 261 1.00 0.73
30 2053 261 1.00 0.73
4-Aug-20

Health Risk Assessment Assumptions
5 Chronic Reference Exposure Level (ug/m3) for DPM Project: Inglewood Transit
1.1 Cancer Potency Slope Factor (cancer risk per mg/kg-day) for DPM Date:
350 days per year Condition: Unmitigated
25,550 days per lifetime Receptor: Existing Residence
Year: 2025
1,090 95th Percentile Daily Breathing Rates (L/kg-day) 0<2 Years Scenario: Morning/Night
572 80th Percentile Daily Breathing Rates (L/kg-day) 2<16 Years
261 80th Percentile Daily Breathing Rates (L/kg-day) 16<30 Years
1 fraction of time at home 0<2 Years
1 fraction of time at home 2<16 Years
0.73 fraction of time at home 16<70 Years
Exposure Calender Annual PM2.5 Daily Breathing Rates Exposure fraction of time
Year Year Concentration (ug/m3) (L/kg-day) Factor at home Cancer Risk 0.02 Chronic Hazard Impact
1 2025 0.10 1,090 10.0 1.00 16.8 1 Significance Threshold
2 2026 0.02 1,090 10.0 1.00 2.48 No Significant?
3 2027 572 4.75 1.00
4 2028 572 3.00 1.00 19.3 Cancer Risk (Child)
5 2029 572 3.00 1.00 10 Significance Threshold
6 2030 572 3.00 1.00 Yes Significant?
7 2031 572 3.00 1.00
8 2032 572 3.00 1.00 0.57 Cancer Risk (Adult)
9 2033 572 3.00 1.00 10 Significance Threshold
10 2034 572 3.00 1.00 No Significant?
11 2035 572 3.00 1.00
12 2036 572 3.00 1.00
13 2037 572 3.00 1.00
14 2038 572 3.00 1.00
15 2039 572 3.00 1.00
16 2040 572 3.00 1.00
17 2041 261 1.70 0.73
18 2042 261 1.00 0.73
19 2043 261 1.00 0.73
20 2044 261 1.00 0.73
21 2045 261 1.00 0.73
22 2046 261 1.00 0.73
23 2047 261 1.00 0.73
24 2048 261 1.00 0.73
25 2049 261 1.00 0.73
26 2050 261 1.00 0.73
27 2051 261 1.00 0.73
28 2052 261 1.00 0.73
29 2053 261 1.00 0.73
30 2054 261 1.00 0.73
4-Aug-20

Health Risk Assessment Assumptions
5 Chronic Reference Exposure Level (ug/m3) for DPM Project: Inglewood Transit
1.1 Cancer Potency Slope Factor (cancer risk per mg/kg-day) for DPM Date:
350 days per year Condition: Unmitigated
25,550 days per lifetime Receptor: Existing Residence
Year: 2026
1,090 95th Percentile Daily Breathing Rates (L/kg-day) 0<2 Years Scenario: Morning/Night
572 80th Percentile Daily Breathing Rates (L/kg-day) 2<16 Years
261 80th Percentile Daily Breathing Rates (L/kg-day) 16<30 Years
1 fraction of time at home 0<2 Years
1 fraction of time at home 2<16 Years
0.73 fraction of time at home 16<70 Years
Exposure Calender Annual PM2.5 Daily Breathing Rates Exposure fraction of time
Year Year Concentration (ug/m3) (L/kg-day) Factor at home Cancer Risk 0.00 Chronic Hazard Impact
1 2026 0.02 1,090 10.0 1.00 2.48 1 Significance Threshold
2 2027 1,090 10.0 1.00 No Significant?
3 2028 572 4.75 1.00
4 2029 572 3.00 1.00 2.48 Cancer Risk (Child)
5 2030 572 3.00 1.00 10 Significance Threshold
6 2031 572 3.00 1.00 No Significant?
7 2032 572 3.00 1.00
8 2033 572 3.00 1.00 0.07 Cancer Risk (Adult)
9 2034 572 3.00 1.00 10 Significance Threshold
10 2035 572 3.00 1.00 No Significant?
11 2036 572 3.00 1.00
12 2037 572 3.00 1.00
13 2038 572 3.00 1.00
14 2039 572 3.00 1.00
15 2040 572 3.00 1.00
16 2041 572 3.00 1.00
17 2042 261 1.70 0.73
18 2043 261 1.00 0.73
19 2044 261 1.00 0.73
20 2045 261 1.00 0.73
21 2046 261 1.00 0.73
22 2047 261 1.00 0.73
23 2048 261 1.00 0.73
24 2049 261 1.00 0.73
25 2050 261 1.00 0.73
26 2051 261 1.00 0.73
27 2052 261 1.00 0.73
28 2053 261 1.00 0.73
29 2054 261 1.00 0.73
30 2055 261 1.00 0.73
4-Aug-20

Health Risk Assessment Assumptions
5 Chronic Reference Exposure Level (ug/m3) for DPM Project: Inglewood Transit
1.1 Cancer Potency Slope Factor (cancer risk per mg/kg-day) for DPM Date:
350 days per year Condition: Mitigated
25,550 days per lifetime Receptor: Existing Residence
Year: 2021
1,090 95th Percentile Daily Breathing Rates (L/kg-day) 0<2 Years Scenario: Morning/Night
572 80th Percentile Daily Breathing Rates (L/kg-day) 2<16 Years
261 80th Percentile Daily Breathing Rates (L/kg-day) 16<30 Years
1 fraction of time at home 0<2 Years
1 fraction of time at home 2<16 Years
0.73 fraction of time at home 16<70 Years
Exposure Calender Annual PM2.5 Daily Breathing Rates Exposure fraction of time
Year Year Concentration (ug/m3) (L/kg-day) Factor at home Cancer Risk 0.01 Chronic Hazard Impact
1 2021 - 1,090 10.0 1.00 - 1 Significance Threshold
2 2022 0.01 1,090 10.0 1.00 0.94 No Significant?
3 2023 0.01 572 4.75 1.00 0.32
4 2024 0.03 572 3.00 1.00 0.69 2.80 Cancer Risk (Child)
5 2025 0.03 572 3.00 1.00 0.77 10 Significance Threshold
6 2026 0.00 572 3.00 1.00 0.08 No Significant?
7 2027 572 3.00 1.00
8 2028 572 3.00 1.00 0.36 Cancer Risk (Adult)
9 2029 572 3.00 1.00 10 Significance Threshold
10 2030 572 3.00 1.00 No Significant?
11 2031 572 3.00 1.00
12 2032 572 3.00 1.00
13 2033 572 3.00 1.00
14 2034 572 3.00 1.00
15 2035 572 3.00 1.00
16 2036 572 3.00 1.00
17 2037 261 1.70 0.73
18 2038 261 1.00 0.73
19 2039 261 1.00 0.73
20 2040 261 1.00 0.73
21 2041 261 1.00 0.73
22 2042 261 1.00 0.73
23 2043 261 1.00 0.73
24 2044 261 1.00 0.73
25 2045 261 1.00 0.73
26 2046 261 1.00 0.73
27 2047 261 1.00 0.73
28 2048 261 1.00 0.73
29 2049 261 1.00 0.73
30 2050 261 1.00 0.73
4-Aug-20

Health Risk Assessment Assumptions
5 Chronic Reference Exposure Level (ug/m3) for DPM Project: Inglewood Transit
1.1 Cancer Potency Slope Factor (cancer risk per mg/kg-day) for DPM Date:
350 days per year Condition: Mitigated
25,550 days per lifetime Receptor: Existing Residence
Year: 2022
1,090 95th Percentile Daily Breathing Rates (L/kg-day) 0<2 Years Scenario: Morning/Night
572 80th Percentile Daily Breathing Rates (L/kg-day) 2<16 Years
261 80th Percentile Daily Breathing Rates (L/kg-day) 16<30 Years
1 fraction of time at home 0<2 Years
1 fraction of time at home 2<16 Years
0.73 fraction of time at home 16<70 Years
Exposure Calender Annual PM2.5 Daily Breathing Rates Exposure fraction of time
Year Year Concentration (ug/m3) (L/kg-day) Factor at home Cancer Risk 0.01 Chronic Hazard Impact
1 2022 0.01 1,090 10.0 1.00 0.94 1 Significance Threshold
2 2023 0.01 1,090 10.0 1.00 1.29 No Significant?
3 2024 0.03 572 4.75 1.00 1.10
4 2025 0.03 572 3.00 1.00 0.77 4.18 Cancer Risk (Child)
5 2026 0.00 572 3.00 1.00 0.08 10 Significance Threshold
6 2027 572 3.00 1.00 No Significant?
7 2028 572 3.00 1.00
8 2029 572 3.00 1.00 0.36 Cancer Risk (Adult)
9 2030 572 3.00 1.00 10 Significance Threshold
10 2031 572 3.00 1.00 No Significant?
11 2032 572 3.00 1.00
12 2033 572 3.00 1.00
13 2034 572 3.00 1.00
14 2035 572 3.00 1.00
15 2036 572 3.00 1.00
16 2037 572 3.00 1.00
17 2038 261 1.70 0.73
18 2039 261 1.00 0.73
19 2040 261 1.00 0.73
20 2041 261 1.00 0.73
21 2042 261 1.00 0.73
22 2043 261 1.00 0.73
23 2044 261 1.00 0.73
24 2045 261 1.00 0.73
25 2046 261 1.00 0.73
26 2047 261 1.00 0.73
27 2048 261 1.00 0.73
28 2049 261 1.00 0.73
29 2050 261 1.00 0.73
30 2051 261 1.00 0.73
4-Aug-20

Health Risk Assessment Assumptions
5 Chronic Reference Exposure Level (ug/m3) for DPM Project: Inglewood Transit
1.1 Cancer Potency Slope Factor (cancer risk per mg/kg-day) for DPM Date:
350 days per year Condition: Mitigated
25,550 days per lifetime Receptor: Existing Residence
Year: 2023
1,090 95th Percentile Daily Breathing Rates (L/kg-day) 0<2 Years Scenario: Morning/Night
572 80th Percentile Daily Breathing Rates (L/kg-day) 2<16 Years
261 80th Percentile Daily Breathing Rates (L/kg-day) 16<30 Years
1 fraction of time at home 0<2 Years
1 fraction of time at home 2<16 Years
0.73 fraction of time at home 16<70 Years
Exposure Calender Annual PM2.5 Daily Breathing Rates Exposure fraction of time
Year Year Concentration (ug/m3) (L/kg-day) Factor at home Cancer Risk 0.01 Chronic Hazard Impact
1 2023 0.01 1,090 10.0 1.00 1.29 1 Significance Threshold
2 2024 0.03 1,090 10.0 1.00 4.41 No Significant?
3 2025 0.03 572 4.75 1.00 1.22
4 2026 0.00 572 3.00 1.00 0.08 7.01 Cancer Risk (Child)
5 2027 572 3.00 1.00 10 Significance Threshold
6 2028 572 3.00 1.00 No Significant?
7 2029 572 3.00 1.00
8 2030 572 3.00 1.00 0.33 Cancer Risk (Adult)
9 2031 572 3.00 1.00 10 Significance Threshold
10 2032 572 3.00 1.00 No Significant?
11 2033 572 3.00 1.00
12 2034 572 3.00 1.00
13 2035 572 3.00 1.00
14 2036 572 3.00 1.00
15 2037 572 3.00 1.00
16 2038 572 3.00 1.00
17 2039 261 1.70 0.73
18 2040 261 1.00 0.73
19 2041 261 1.00 0.73
20 2042 261 1.00 0.73
21 2043 261 1.00 0.73
22 2044 261 1.00 0.73
23 2045 261 1.00 0.73
24 2046 261 1.00 0.73
25 2047 261 1.00 0.73
26 2048 261 1.00 0.73
27 2049 261 1.00 0.73
28 2050 261 1.00 0.73
29 2051 261 1.00 0.73
30 2052 261 1.00 0.73
4-Aug-20

Health Risk Assessment Assumptions
5 Chronic Reference Exposure Level (ug/m3) for DPM Project: Inglewood Transit
1.1 Cancer Potency Slope Factor (cancer risk per mg/kg-day) for DPM Date:
350 days per year Condition: Mitigated
25,550 days per lifetime Receptor: Existing Residence
Year: 2024
1,090 95th Percentile Daily Breathing Rates (L/kg-day) 0<2 Years Scenario: Morning/Night
572 80th Percentile Daily Breathing Rates (L/kg-day) 2<16 Years
261 80th Percentile Daily Breathing Rates (L/kg-day) 16<30 Years
1 fraction of time at home 0<2 Years
1 fraction of time at home 2<16 Years
0.73 fraction of time at home 16<70 Years
Exposure Calender Annual PM2.5 Daily Breathing Rates Exposure fraction of time
Year Year Concentration (ug/m3) (L/kg-day) Factor at home Cancer Risk 0.01 Chronic Hazard Impact
1 2024 0.03 1,090 10.0 1.00 4.41 1 Significance Threshold
2 2025 0.03 1,090 10.0 1.00 4.90 No Significant?
3 2026 0.00 572 4.75 1.00 0.13
4 2027 572 3.00 1.00 9.43 Cancer Risk (Child)
5 2028 572 3.00 1.00 10 Significance Threshold
6 2029 572 3.00 1.00 No Significant?
7 2030 572 3.00 1.00
8 2031 572 3.00 1.00 0.29 Cancer Risk (Adult)
9 2032 572 3.00 1.00 10 Significance Threshold
10 2033 572 3.00 1.00 No Significant?
11 2034 572 3.00 1.00
12 2035 572 3.00 1.00
13 2036 572 3.00 1.00
14 2037 572 3.00 1.00
15 2038 572 3.00 1.00
16 2039 572 3.00 1.00
17 2040 261 1.70 0.73
18 2041 261 1.00 0.73
19 2042 261 1.00 0.73
20 2043 261 1.00 0.73
21 2044 261 1.00 0.73
22 2045 261 1.00 0.73
23 2046 261 1.00 0.73
24 2047 261 1.00 0.73
25 2048 261 1.00 0.73
26 2049 261 1.00 0.73
27 2050 261 1.00 0.73
28 2051 261 1.00 0.73
29 2052 261 1.00 0.73
30 2053 261 1.00 0.73
4-Aug-20

Health Risk Assessment Assumptions
5 Chronic Reference Exposure Level (ug/m3) for DPM Project: Inglewood Transit
1.1 Cancer Potency Slope Factor (cancer risk per mg/kg-day) for DPM Date:
350 days per year Condition: Mitigated
25,550 days per lifetime Receptor: Existing Residence
Year: 2025
1,090 95th Percentile Daily Breathing Rates (L/kg-day) 0<2 Years Scenario: Morning/Night
572 80th Percentile Daily Breathing Rates (L/kg-day) 2<16 Years
261 80th Percentile Daily Breathing Rates (L/kg-day) 16<30 Years
1 fraction of time at home 0<2 Years
1 fraction of time at home 2<16 Years
0.73 fraction of time at home 16<70 Years
Exposure Calender Annual PM2.5 Daily Breathing Rates Exposure fraction of time
Year Year Concentration (ug/m3) (L/kg-day) Factor at home Cancer Risk 0.01 Chronic Hazard Impact
1 2025 0.03 1,090 10.0 1.00 4.90 1 Significance Threshold
2 2026 0.00 1,090 10.0 1.00 0.51 No Significant?
3 2027 572 4.75 1.00
4 2028 572 3.00 1.00 5.41 Cancer Risk (Child)
5 2029 572 3.00 1.00 10 Significance Threshold
6 2030 572 3.00 1.00 No Significant?
7 2031 572 3.00 1.00
8 2032 572 3.00 1.00 0.16 Cancer Risk (Adult)
9 2033 572 3.00 1.00 10 Significance Threshold
10 2034 572 3.00 1.00 No Significant?
11 2035 572 3.00 1.00
12 2036 572 3.00 1.00
13 2037 572 3.00 1.00
14 2038 572 3.00 1.00
15 2039 572 3.00 1.00
16 2040 572 3.00 1.00
17 2041 261 1.70 0.73
18 2042 261 1.00 0.73
19 2043 261 1.00 0.73
20 2044 261 1.00 0.73
21 2045 261 1.00 0.73
22 2046 261 1.00 0.73
23 2047 261 1.00 0.73
24 2048 261 1.00 0.73
25 2049 261 1.00 0.73
26 2050 261 1.00 0.73
27 2051 261 1.00 0.73
28 2052 261 1.00 0.73
29 2053 261 1.00 0.73
30 2054 261 1.00 0.73
4-Aug-20

Health Risk Assessment Assumptions
5 Chronic Reference Exposure Level (ug/m3) for DPM Project: Inglewood Transit
1.1 Cancer Potency Slope Factor (cancer risk per mg/kg-day) for DPM Date:
350 days per year Condition: Mitigated
25,550 days per lifetime Receptor: Existing Residence
Year: 2026
1,090 95th Percentile Daily Breathing Rates (L/kg-day) 0<2 Years Scenario: Morning/Night
572 80th Percentile Daily Breathing Rates (L/kg-day) 2<16 Years
261 80th Percentile Daily Breathing Rates (L/kg-day) 16<30 Years
1 fraction of time at home 0<2 Years
1 fraction of time at home 2<16 Years
0.73 fraction of time at home 16<70 Years
Exposure Calender Annual PM2.5 Daily Breathing Rates Exposure fraction of time
Year Year Concentration (ug/m3) (L/kg-day) Factor at home Cancer Risk 0.00 Chronic Hazard Impact
1 2026 0.00 1,090 10.0 1.00 0.51 1 Significance Threshold
2 2027 1,090 10.0 1.00 No Significant?
3 2028 572 4.75 1.00
4 2029 572 3.00 1.00 0.51 Cancer Risk (Child)
5 2030 572 3.00 1.00 10 Significance Threshold
6 2031 572 3.00 1.00 No Significant?
7 2032 572 3.00 1.00
8 2033 572 3.00 1.00 0.02 Cancer Risk (Adult)
9 2034 572 3.00 1.00 10 Significance Threshold
10 2035 572 3.00 1.00 No Significant?
11 2036 572 3.00 1.00
12 2037 572 3.00 1.00
13 2038 572 3.00 1.00
14 2039 572 3.00 1.00
15 2040 572 3.00 1.00
16 2041 572 3.00 1.00
17 2042 261 1.70 0.73
18 2043 261 1.00 0.73
19 2044 261 1.00 0.73
20 2045 261 1.00 0.73
21 2046 261 1.00 0.73
22 2047 261 1.00 0.73
23 2048 261 1.00 0.73
24 2049 261 1.00 0.73
25 2050 261 1.00 0.73
26 2051 261 1.00 0.73
27 2052 261 1.00 0.73
28 2053 261 1.00 0.73
29 2054 261 1.00 0.73
30 2055 261 1.00 0.73
4-Aug-20
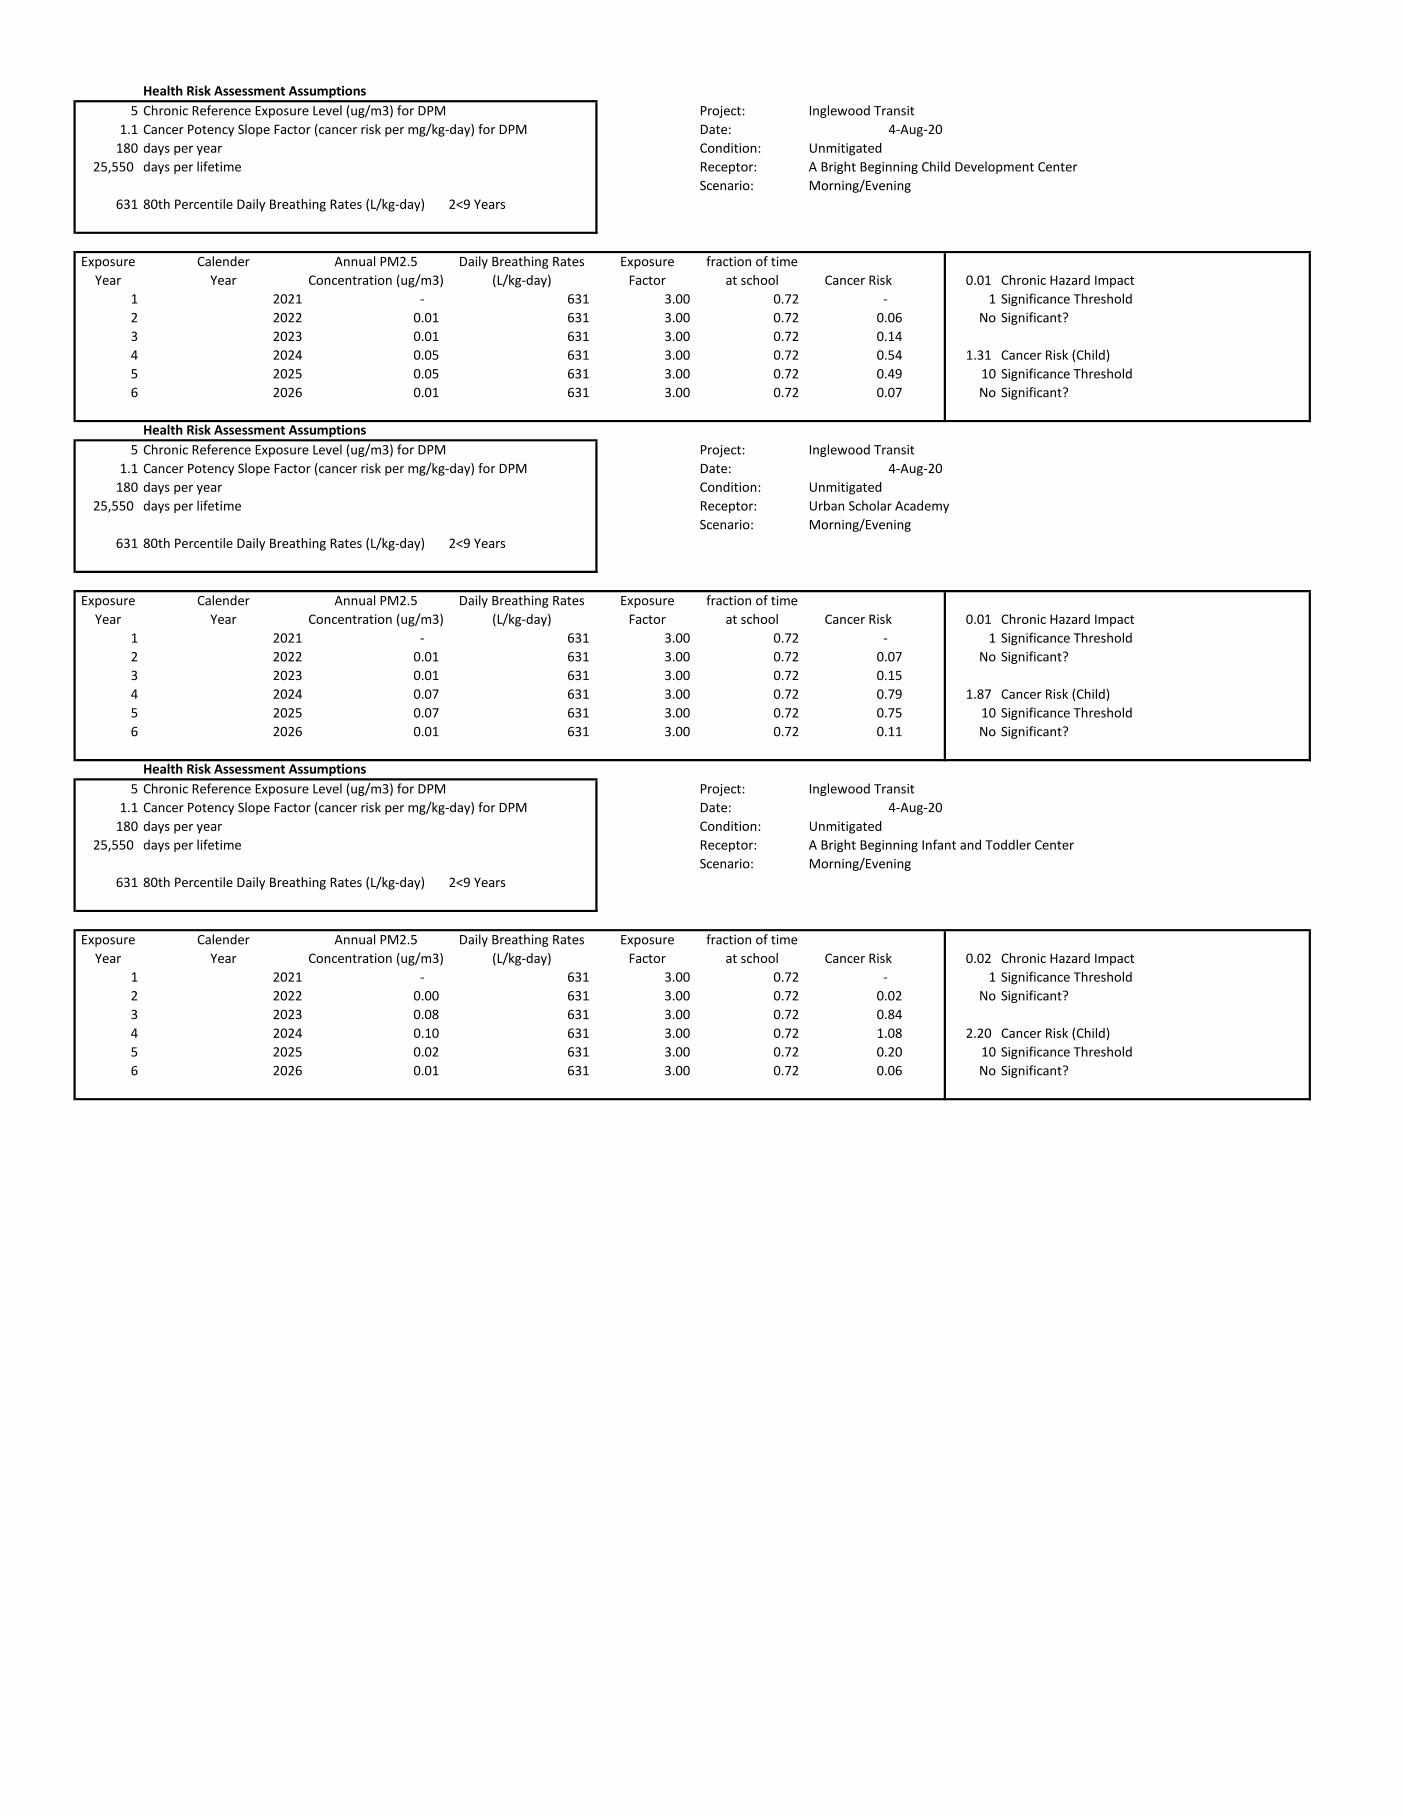
Health Risk Assessment Assumptions
5 Chronic Reference Exposure Level (ug/m3) for DPM Project: Inglewood Transit
1.1 Cancer Potency Slope Factor (cancer risk per mg/kg-day) for DPM Date:
180 days per year Condition: Unmitigated
25,550 days per lifetime Receptor: A Bright Beginning Child Development Center
Scenario: Morning/Evening
631 80th Percentile Daily Breathing Rates (L/kg-day) 2<9 Years
Exposure Calender Annual PM2.5 Daily Breathing Rates Exposure fraction of time
Year Year Concentration (ug/m3) (L/kg-day) Factor at school Cancer Risk 0.01 Chronic Hazard Impact
1 2021 - 631 3.00 0.72 - 1 Significance Threshold
2 2022 0.01 631 3.00 0.72 0.06 No Significant?
3 2023 0.01 631 3.00 0.72 0.14
4 2024 0.05 631 3.00 0.72 0.54 1.31 Cancer Risk (Child)
5 2025 0.05 631 3.00 0.72 0.49 10 Significance Threshold
6 2026 0.01 631 3.00 0.72 0.07 No Significant?
Health Risk Assessment Assumptions
5 Chronic Reference Exposure Level (ug/m3) for DPM Project: Inglewood Transit
1.1 Cancer Potency Slope Factor (cancer risk per mg/kg-day) for DPM Date:
180 days per year Condition: Unmitigated
25,550 days per lifetime Receptor: Urban Scholar Academy
Scenario: Morning/Evening
631 80th Percentile Daily Breathing Rates (L/kg-day) 2<9 Years
Exposure Calender Annual PM2.5 Daily Breathing Rates Exposure fraction of time
Year Year Concentration (ug/m3) (L/kg-day) Factor at school Cancer Risk 0.01 Chronic Hazard Impact
1 2021 - 631 3.00 0.72 - 1 Significance Threshold
2 2022 0.01 631 3.00 0.72 0.07 No Significant?
3 2023 0.01 631 3.00 0.72 0.15
4 2024 0.07 631 3.00 0.72 0.79 1.87 Cancer Risk (Child)
5 2025 0.07 631 3.00 0.72 0.75 10 Significance Threshold
6 2026 0.01 631 3.00 0.72 0.11 No Significant?
Health Risk Assessment Assumptions
5 Chronic Reference Exposure Level (ug/m3) for DPM Project: Inglewood Transit
1.1 Cancer Potency Slope Factor (cancer risk per mg/kg-day) for DPM Date:
180 days per year Condition: Unmitigated
25,550 days per lifetime Receptor: A Bright Beginning Infant and Toddler Center
Scenario: Morning/Evening
631 80th Percentile Daily Breathing Rates (L/kg-day) 2<9 Years
Exposure Calender Annual PM2.5 Daily Breathing Rates Exposure fraction of time
Year Year Concentration (ug/m3) (L/kg-day) Factor at school Cancer Risk 0.02 Chronic Hazard Impact
1 2021 - 631 3.00 0.72 - 1 Significance Threshold
2 2022 0.00 631 3.00 0.72 0.02 No Significant?
3 2023 0.08 631 3.00 0.72 0.84
4 2024 0.10 631 3.00 0.72 1.08 2.20 Cancer Risk (Child)
5 2025 0.02 631 3.00 0.72 0.20 10 Significance Threshold
6 2026 0.01 631 3.00 0.72 0.06 No Significant?
4-Aug-20
4-Aug-20
4-Aug-20

Health Risk Assessment Assumptions
5 Chronic Reference Exposure Level (ug/m3) for DPM Project: Inglewood Transit
1.1 Cancer Potency Slope Factor (cancer risk per mg/kg-day) for DPM Date:
180 days per year Condition: Mitigated
25,550 days per lifetime Receptor: A Bright Beginning Child Development Center
Scenario: Morning/Evening
631 80th Percentile Daily Breathing Rates (L/kg-day) 2<9 Years
Exposure Calender Annual PM2.5 Daily Breathing Rates Exposure fraction of time
Year Year Concentration (ug/m3) (L/kg-day) Factor at school Cancer Risk 0.00 Chronic Hazard Impact
1 2021 - 631 3.00 0.72 - 1 Significance Threshold
2 2022 0.00 631 3.00 0.72 0.02 No Significant?
3 2023 0.00 631 3.00 0.72 0.04
4 2024 0.01 631 3.00 0.72 0.15 0.36 Cancer Risk (Child)
5 2025 0.01 631 3.00 0.72 0.14 10 Significance Threshold
6 2026 0.00 631 3.00 0.72 0.01 No Significant?
Health Risk Assessment Assumptions
5 Chronic Reference Exposure Level (ug/m3) for DPM Project: Inglewood Transit
1.1 Cancer Potency Slope Factor (cancer risk per mg/kg-day) for DPM Date:
180 days per year Condition: Mitigated
25,550 days per lifetime Receptor: Urban Scholar Academy
Scenario: Morning/Evening
631 80th Percentile Daily Breathing Rates (L/kg-day) 2<9 Years
Exposure Calender Annual PM2.5 Daily Breathing Rates Exposure fraction of time
Year Year Concentration (ug/m3) (L/kg-day) Factor at school Cancer Risk 0.00 Chronic Hazard Impact
1 2021 - 631 3.00 0.72 - 1 Significance Threshold
2 2022 0.00 631 3.00 0.72 0.02 No Significant?
3 2023 0.00 631 3.00 0.72 0.04
4 2024 0.02 631 3.00 0.72 0.21 0.50 Cancer Risk (Child)
5 2025 0.02 631 3.00 0.72 0.22 10 Significance Threshold
6 2026 0.00 631 3.00 0.72 0.01 No Significant?
Health Risk Assessment Assumptions
5 Chronic Reference Exposure Level (ug/m3) for DPM Project: Inglewood Transit
1.1 Cancer Potency Slope Factor (cancer risk per mg/kg-day) for DPM Date:
180 days per year Condition: Mitigated
25,550 days per lifetime Receptor: A Bright Beginning Infant and Toddler Center
Scenario: Morning/Evening
631 80th Percentile Daily Breathing Rates (L/kg-day) 2<9 Years
Exposure Calender Annual PM2.5 Daily Breathing Rates Exposure fraction of time
Year Year Concentration (ug/m3) (L/kg-day) Factor at school Cancer Risk 0.01 Chronic Hazard Impact
1 2021 - 631 3.00 0.72 - 1 Significance Threshold
2 2022 0.00 631 3.00 0.72 0.01 No Significant?
3 2023 0.02 631 3.00 0.72 0.23
4 2024 0.03 631 3.00 0.72 0.30 0.60 Cancer Risk (Child)
5 2025 0.01 631 3.00 0.72 0.06 10 Significance Threshold
6 2026 0.00 631 3.00 0.72 0.01 No Significant?
4-Aug-20
4-Aug-20
4-Aug-20

Health Risk Assessment Assumptions
5 Chronic Reference Exposure Level (ug/m3) for DPM Project: Inglewood Transit
1.1 Cancer Potency Slope Factor (cancer risk per mg/kg-day) for DPM Date:
180 days per year Condition: Unmitigated
25,550 days per lifetime Receptor: A Bright Beginning Child Development Center
Scenario: Morning/Night
631 80th Percentile Daily Breathing Rates (L/kg-day) 2<9 Years
Exposure Calender Annual PM2.5 Daily Breathing Rates Exposure fraction of time
Year Year Concentration (ug/m3) (L/kg-day) Factor at school Cancer Risk 0.01 Chronic Hazard Impact
1 2021 - 631 3.00 0.72 - 1 Significance Threshold
2 2022 0.01 631 3.00 0.72 0.06 No Significant?
3 2023 0.01 631 3.00 0.72 0.15
4 2024 0.06 631 3.00 0.72 0.61 1.44 Cancer Risk (Child)
5 2025 0.05 631 3.00 0.72 0.54 10 Significance Threshold
6 2026 0.01 631 3.00 0.72 0.08 No Significant?
Health Risk Assessment Assumptions
5 Chronic Reference Exposure Level (ug/m3) for DPM Project: Inglewood Transit
1.1 Cancer Potency Slope Factor (cancer risk per mg/kg-day) for DPM Date:
180 days per year Condition: Unmitigated
25,550 days per lifetime Receptor: Urban Scholar Academy
Scenario: Morning/Night
631 80th Percentile Daily Breathing Rates (L/kg-day) 2<9 Years
Exposure Calender Annual PM2.5 Daily Breathing Rates Exposure fraction of time
Year Year Concentration (ug/m3) (L/kg-day) Factor at school Cancer Risk 0.02 Chronic Hazard Impact
1 2021 - 631 3.00 0.72 - 1 Significance Threshold
2 2022 0.01 631 3.00 0.72 0.06 No Significant?
3 2023 0.01 631 3.00 0.72 0.15
4 2024 0.08 631 3.00 0.72 0.88 2.04 Cancer Risk (Child)
5 2025 0.08 631 3.00 0.72 0.83 10 Significance Threshold
6 2026 0.01 631 3.00 0.72 0.12 No Significant?
Health Risk Assessment Assumptions
5 Chronic Reference Exposure Level (ug/m3) for DPM Project: Inglewood Transit
1.1 Cancer Potency Slope Factor (cancer risk per mg/kg-day) for DPM Date:
180 days per year Condition: Unmitigated
25,550 days per lifetime Receptor: A Bright Beginning Infant and Toddler Center
Scenario: Morning/Night
631 80th Percentile Daily Breathing Rates (L/kg-day) 2<9 Years
Exposure Calender Annual PM2.5 Daily Breathing Rates Exposure fraction of time
Year Year Concentration (ug/m3) (L/kg-day) Factor at school Cancer Risk 0.02 Chronic Hazard Impact
1 2021 - 631 3.00 0.72 - 1 Significance Threshold
2 2022 0.00 631 3.00 0.72 0.02 No Significant?
3 2023 0.09 631 3.00 0.72 0.94
4 2024 0.11 631 3.00 0.72 1.20 2.45 Cancer Risk (Child)
5 2025 0.02 631 3.00 0.72 0.22 10 Significance Threshold
6 2026 0.01 631 3.00 0.72 0.07 No Significant?
4-Aug-20
4-Aug-20
4-Aug-20

Health Risk Assessment Assumptions
5 Chronic Reference Exposure Level (ug/m3) for DPM Project: Inglewood Transit
1.1 Cancer Potency Slope Factor (cancer risk per mg/kg-day) for DPM Date:
180 days per year Condition: Mitigated
25,550 days per lifetime Receptor: A Bright Beginning Child Development Center
Scenario: Morning/Night
631 80th Percentile Daily Breathing Rates (L/kg-day) 2<9 Years
Exposure Calender Annual PM2.5 Daily Breathing Rates Exposure fraction of time
Year Year Concentration (ug/m3) (L/kg-day) Factor at school Cancer Risk 0.00 Chronic Hazard Impact
1 2021 - 631 3.00 0.72 - 1 Significance Threshold
2 2022 0.00 631 3.00 0.72 0.02 No Significant?
3 2023 0.00 631 3.00 0.72 0.04
4 2024 0.02 631 3.00 0.72 0.16 0.40 Cancer Risk (Child)
5 2025 0.02 631 3.00 0.72 0.16 10 Significance Threshold
6 2026 0.00 631 3.00 0.72 0.02 No Significant?
Health Risk Assessment Assumptions
5 Chronic Reference Exposure Level (ug/m3) for DPM Project: Inglewood Transit
1.1 Cancer Potency Slope Factor (cancer risk per mg/kg-day) for DPM Date:
180 days per year Condition: Mitigated
25,550 days per lifetime Receptor: Urban Scholar Academy
Scenario: Morning/Night
631 80th Percentile Daily Breathing Rates (L/kg-day) 2<9 Years
Exposure Calender Annual PM2.5 Daily Breathing Rates Exposure fraction of time
Year Year Concentration (ug/m3) (L/kg-day) Factor at school Cancer Risk 0.00 Chronic Hazard Impact
1 2021 - 631 3.00 0.72 - 1 Significance Threshold
2 2022 0.00 631 3.00 0.72 0.02 No Significant?
3 2023 0.00 631 3.00 0.72 0.04
4 2024 0.02 631 3.00 0.72 0.24 0.55 Cancer Risk (Child)
5 2025 0.02 631 3.00 0.72 0.24 10 Significance Threshold
6 2026 0.00 631 3.00 0.72 0.01 No Significant?
Health Risk Assessment Assumptions
5 Chronic Reference Exposure Level (ug/m3) for DPM Project: Inglewood Transit
1.1 Cancer Potency Slope Factor (cancer risk per mg/kg-day) for DPM Date:
180 days per year Condition: Mitigated
25,550 days per lifetime Receptor: A Bright Beginning Infant and Toddler Center
Scenario: Morning/Night
631 80th Percentile Daily Breathing Rates (L/kg-day) 2<9 Years
Exposure Calender Annual PM2.5 Daily Breathing Rates Exposure fraction of time
Year Year Concentration (ug/m3) (L/kg-day) Factor at school Cancer Risk 0.01 Chronic Hazard Impact
1 2021 - 631 3.00 0.72 - 1 Significance Threshold
2 2022 0.00 631 3.00 0.72 0.01 No Significant?
3 2023 0.02 631 3.00 0.72 0.25
4 2024 0.03 631 3.00 0.72 0.34 0.67 Cancer Risk (Child)
5 2025 0.01 631 3.00 0.72 0.06 10 Significance Threshold
6 2026 0.00 631 3.00 0.72 0.01 No Significant?
4-Aug-20
4-Aug-20
4-Aug-20

C-1
Attachment C
Supplemental Health Impact Information (Friant Ranch Case)
The proposed Project is located in Los Angeles County within the South Coast Air Basin. The
Basin is bounded by the Pacific Ocean to the west and the San Gabriel, San Bernardino, and San
Jacinto Mountains to the north and east. The Basin includes all of Orange County and the non-
desert portions of Los Angeles, Riverside, and San Bernardino counties.
The South Coast Air Quality Management District (SCAQMD) has jurisdiction over an area of
approximately 10,743 square miles. This area includes all of Orange County, all of Los Angeles
County except for the Antelope Valley, the non-desert portion of western San Bernardino
County, and the western and Coachella Valley portions of Riverside County. The Basin is a
subregion of the SCAQMD jurisdiction. While air quality in this area has improved compared to
past decades, the Basin requires continued diligence to meet air quality standards. The
SCAQMD has adopted a series of Air Quality Management Plans (AQMP) to meet the
California Ambient Air Quality Standards (CAAQS) and National Ambient Air Quality
Standards (NAAQS). These plans require control technology for existing sources, control
programs for area sources and indirect sources, a SCAQMD permitting system designed to
allow no net increase in emissions from any new or modified permitted emission sources, and
transportation control measures.
In March of 2017, the SCAQMD adopted the 2016 AQMP which includes strategies and
measures needed to meet the NAAQS. The AQMP demonstrates attainment of the ozone
NAAQS as well as the latest PM2.5 standards.1 The SCAQMD also adopts rules and regulations
to implement portions of the AQMP.
Part of the control process of the SCAQMD’s duty to improve the air quality in the Basin is the
uniform CEQA review procedures required by SCAQMD’s CEQA Handbook. The thresholds of
significance used to assess a project’s direct and cumulative impacts have contributed to
improving air quality within the Basin over the past decades. The District’s thresholds of
significance are based on factual and scientific data and are therefore appropriate thresholds of
significance to use for the proposed Inglewood Transit Project.
The recent Sierra Club v. County of Fresno California Supreme Court case held, in part, that the
Friant Ranch Specific Plan EIR (Friant Ranch EIR) was deficient in the informational discussion
of air quality impacts as they connect to adverse human health effects. The Supreme Court
concluded that an EIR’s discussion must “make [ ] a reasonable effort to substantively connect a
project’s air quality impacts to likely health consequences.”
1 South Coast Air Quality Management District, 2016 Air Quality Management Plan, March 1, 2017, Accessed July 7,
2020 at: http://www.aqmd.gov/home/air-quality/clean-air-plans/air-quality-mgt-plan

C-2
For the proposed Project, daily construction emissions of NOx (a precursor to the formation of
ozone) would exceed significance thresholds resulting in a significant and unavoidable impact
even with mitigation. Thus, the proposed Project would contribute to regional ozone
contributions but determining potential health impacts caused directly by the construction
activities is not feasible.
According to the San Joaquin Valley Air Pollution Control District (SJVAPCD), it is not possible
to determine ozone concentrations or make a direct correlation to human health impacts,
because project-focused modeling cannot feasibly predict ozone formation and resulting
regional ozone concentrations. South Coast Air Quality Management District (SCAQMD) has
indicated that applicable methods do exist but are not applicable or feasible in most cases. The
Court did not rule on whether health impacts of the named pollutants were scientifically
feasible to predict, but it did state that: “if it is not scientifically possible to do more than has
already been done to connect air quality effects with potential human health impacts, the Friant
Ranch EIR itself must explain why, in a manner reasonably calculated to inform the public of
the scope of what is and is not yet known about the project’s impacts.”
The current modeling tools are not equipped to provide meaningful analysis of the correlation
between a project's criteria pollutant or pollutant precursor emissions and specific health
impacts. Air dispersion modeling is available, such as the American Meteorological Society/
Environmental Protection Agency Regulatory Model (AERMOD), but these models cannot
accurately estimate dispersion of ozone. Ozone concentrations are dependent upon a variety of
complex factors, including the presence of sunlight and precursor pollutants, natural
topography, atmospheric stability, and wind patterns. Because of the dynamic nature of ozone
formation and the complexities of predicting ground-level ozone concentrations in relation to
ambient standards, air districts instead generally develop mass emissions thresholds for NOx
that are used to make significance determinations.
In summary, modeling of the proposed Project’s ozone emissions is not feasible and would not
provide meaningful information given the number of variables that affect ozone formation (e.g.,
location of activity and weather on that day that results in conversion of precursor emissions
into ozone). However, as shown in Section 9, the resultant air concentrations for the proposed
Project would be below the significance thresholds and thus, the air quality health impacts due
to the construction criteria air pollutant emissions would be expected to be less than significant.
Nevertheless, the health impacts due to diesel particulate emissions would be potentially above
the significance thresholds and would potentially be significant.
As stated by the California Supreme Court, an EIR should relate the expected adverse air
quality impacts to likely health consequences or explain in meaningful detail why it is not
feasible to provide such an analysis. In its Friant Ranch decision, the California Supreme
Court conceded that an explanation of the connection between an individual project’s air

C-3
pollutant emissions in excess of thresholds and human health effects may not be possible
given the current state of environmental science modeling. However, the California
Supreme Court concluded that the Friant Ranch Project EIR itself must explain, in a manner
reasonably calculated to inform the public, the scope of what is and is not yet known about
the effect of the Project’s significant and unavoidable air quality impacts on human health.
As explained within the following, modeling of the Inglewood Transit Project’s ozone emissions
is not feasible and would not provide meaningful information given the magnitude of the
emissions and the number of variables that affect ozone formation (e.g., mass of precursor
emissions, background concentrations for all other emission sources in the air basin, location of
activity and weather on that day that results in conversion of precursor emissions into ozone).
Consistent with the California Supreme Court’s Friant Ranch decision, the analyses presented
provides additional details regarding the potential health effects from the proposed Inglewood
Transit’s significant and unavoidable criteria pollutant construction emissions of NOx. It also
explains why it is not scientifically feasible to substantively connect this individual Proposed
Project’s air quality impacts to likely health consequences. The criteria air pollutant construction
emissions of NOx for the project are too small to model and obtain meaningful regional
concentrations of criteria air pollutants and ozone.
The following information is intended to fulfil the requirements of the Superior Court
decision related to the health impacts from significant and unavoidable air pollutant emissions
of NOx, and related ozone. This attachment describes, in a manner intended to inform the
public, why additional modeling is not feasible or meaningful given the details of the proposed
Project and current state of air quality modeling.
Criteria Air Quality Pollutant Emissions and Health Impacts
In response to the California Supreme Court’s Sierra Club v. County of Fresno decision (issued
on December 24, 2018, and commonly referred to as the “Friant Ranch” decision), this response
addresses the potential for adverse health effects from the emissions of criteria air pollutants
associated with the proposed Inglewood Transit, based on scientific information and
technological methods available at this time. The Friant Ranch decision addresses the
relationship between significant and unavoidable pollutant emissions to specific health
consequences, where “The EIR must provide an adequate analysis to inform the public how its bare
numbers translate to create potential adverse impacts or it must explain what the agency does know and
why, given existing scientific constraints, it cannot translate potential health impacts further.” (Sierra
Club v. County of Fresno, 2018).
Given that the air quality analysis for the proposed Project identifies a significant and
unavoidable project level impacts with regard to nitrogen oxides (NOx) emissions, the
following serves to address the requirements imposed under the Friant Ranch decision. Per

C-4
SCAQMD significance guidance, these impacts at the project level are also considered
cumulatively significant and could occur during the construction period. NOx is an ozone
precursor and emissions of NOx have the potential to contribute to existing ozone non-
attainment conditions within the South Coast Air Basin (Air Basin).
Criteria Air Pollutant Health Impacts
“Criteria” air pollutants refer to those air pollutants for which the USEPA has established
NAAQS under the Federal Clean Air Act, including Carbon monoxide (CO), nitrogen dioxide
(NO2), ozone (O3), particulate matter equal to or greater than 10 micrometers (coarse particulate
or PM10), and particulate matter equal to or greater than 2.5 micrometers (fine particulate or
PM2.5). California has adopted ambient standards (known as CAAQS) that are more stringent
than the federal standards for some criteria air pollutants. The following provides a brief
summary of the potential health and welfare effects and typical sources of each of the criteria air
pollutants and air toxics.
Numerous scientific studies published over the past 50 years point to the harmful effects of air
pollution. The AAQS are designed to prevent these effects. The adverse health effects associated
with air pollution are diverse and include2:
Premature mortality
Cardiovascular effects
Increased health care utilization (hospitalization, physician and emergency room visits)
Increased respiratory illness and other morbidity (symptoms, infections, and asthma
exacerbation
Decreased lung function (breathing capacity)
Lung inflammation
Potential immunological changes
Increased airway reactivity to a known pharmacological agent exposure - a method used
in laboratories to evaluate the tendency of airways to have an increased possibility of
developing an asthmatic response
A decreased tolerance for exercise
Adverse birth outcomes such as low birth weights
2 South Coast Air Quality Management District, 2016 Air Quality Management Plan Appendix I, Health Effects,
March 2017, Accessed July 9, 2020 at: https://www.aqmd.gov/docs/default-source/clean-air-plans/air-quality-
management-plans/2016-air-quality-management-plan/final-2016-aqmp/appendix-i.pdf?sfvrsn=14

C-5
The evidence linking these effects to air pollutants is derived from population-based
observational and field studies (epidemiological) as well as controlled laboratory studies
involving human subjects and animals. There have been an increasing number of studies
focusing on the mechanisms (that is, on learning how specific organs, cell types, and biomarkers
are involved in the human body’s response to air pollution) and specific pollutants responsible
for individual effects. Yet the underlying biological pathways for these effects are not always
clearly understood.3
Although individuals inhale pollutants as a mixture under ambient conditions, the regulatory
framework and the control measures developed are pollutant-specific for six major outdoor
pollutants covered under Sections 108 and 109 of the Clean Air Act. This is appropriate, in that
different pollutants usually differ in their sources, their times and places of occurrence, the
kinds of health effects they may cause, and their overall levels of health risk. Different
pollutants, from the same or different sources, oftentimes occur together. Evidence for more
than additive effects has not been strong and, as a practical matter, health scientists, as well as
regulatory officials, usually must deal with one pollutant at a time in adopting AAQS.4
Health effects associated with criteria air pollutants are discussed within the following:
Ozone (O3)
O3 is a respiratory irritant and an oxidant that increases susceptibility to respiratory infections
and that can cause substantial damage to vegetation and other materials. O3 is not emitted
directly into the atmosphere but is a secondary air pollutant produced in the atmosphere
through a complex series of photochemical reactions involving ROG and NOx. ROG and NOx
are therefore known as precursor compounds for O3. Substantial ozone production generally
requires O3 precursors to be present in a stable atmosphere with strong sunlight for
approximately three hours. O3 is defined as a regional air pollutant because it is not emitted
directly by specific sources but is formed downwind of sources of ROG and NOx under the
influence of wind and sunlight. O3 concentrations tend to be higher in the late spring, summer,
and fall, when long sunny days combine with regional air subsidence inversions to create
conditions conducive to the formation and accumulation of secondary photochemical
compounds.
Inhalation of O3 causes inflammation and irritation of the tissues lining human airways, causing
and worsening a variety of symptoms. Exposure to O3 can reduce the volume of air that the
3 South Coast Air Quality Management District, 2016 Air Quality Management Plan Appendix I, Health Effects,
March 2017, Accessed July 9, 2020 at: https://www.aqmd.gov/docs/default-source/clean-air-plans/air-quality-
management-plans/2016-air-quality-management-plan/final-2016-aqmp/appendix-i.pdf?sfvrsn=14
4 South Coast Air Quality Management District, 2016 Air Quality Management Plan Appendix I, Health Effects,
March 2017, Accessed July 9, 2020 at: https://www.aqmd.gov/docs/default-source/clean-air-plans/air-quality-
management-plans/2016-air-quality-management-plan/final-2016-aqmp/appendix-i.pdf?sfvrsn=14

C-6
lungs breathe in and cause shortness of breath. O3 in sufficient doses increases the permeability
of lung cells, rendering them more susceptible to toxins and microorganisms. The occurrence
and severity of health effects from O3 exposure vary widely among individuals, even when the
dose and the duration of exposure are the same. Research shows adults and children who spend
more time outdoors participating in vigorous physical activities are at greater risk from the
harmful health effects of O3 exposure.
While there are relatively few studies of ozone’s effects on children, the available studies show
that children are no more or less likely to suffer harmful effects than adults. However, there are
a number of reasons why children may be more susceptible to O3 and other pollutants. Children
and teens spend nearly twice as much time outdoors and engaged in vigorous activities as
adults. Children breathe more rapidly than adults and inhale more pollution per pound of their
body weight than adults. Also, children are less likely than adults to notice their own symptoms
and avoid harmful exposures. Further research may be able to better distinguish between health
effects in children and adults. Children, adolescents and adults who exercise or work outdoors,
where O3 concentrations are the highest, are at the greatest risk of harm from this pollutant.5
A number of population groups are potentially at increased risk for O3 exposure effects. In the
ongoing review of O3, the USEPA has identified populations as having adequate evidence for
increased risk from O3 exposures include individuals with asthma, younger and older age
groups, individuals with reduced intake of certain nutrients such as Vitamins C and E, and
outdoor workers. There is suggestive evidence for other potential factors, such as variations in
genes related to oxidative metabolism or inflammation, gender, socioeconomic status, and
obesity. However further evidence is needed.6 The adverse effects reported with short-term O3
exposure are greater with increased activity because activity increases the breathing rate and
the volume of air reaching the lungs, resulting in an increased amount of O3 reaching the
lungs.7
Carbon Monoxide (CO)
CO is a non–reactive pollutant that is a product of incomplete combustion of organic material,
and is mostly associated with motor vehicle traffic, and in wintertime, with wood–burning
stoves and fireplaces. High CO concentrations develop primarily during winter when periods
of light winds combine with the formation of ground–level temperature inversions (typically
5 California Air Resources Board, Ozone & Health, 2019, Accessed July 9, 2020 at:
https://ww2.arb.ca.gov/resources/ozone-and-health
6 South Coast Air Quality Management District, 2016 Air Quality Management Plan Appendix I, Health Effects,
March 2017, July 9, 2020 at: https://www.aqmd.gov/docs/default-source/clean-air-plans/air-quality-management-
plans/2016-air-quality-management-plan/final-2016-aqmp/appendix-i.pdf?sfvrsn=14
7 South Coast Air Quality Management District, 2016 Air Quality Management Plan Appendix I, Health Effects,
March 2017, Accessed July 9, 2020 at: https://www.aqmd.gov/docs/default-source/clean-air-plans/air-quality-
management-plans/2016-air-quality-management-plan/final-2016-aqmp/appendix-i.pdf?sfvrsn=14

C-7
from the evening through early morning). These conditions result in reduced dispersion of
vehicle emissions. Motor vehicles also exhibit increased CO emission rates at low air
temperatures.
When inhaled at high concentrations, CO combines with hemoglobin in the blood and reduces
its oxygen–carrying capacity, resulting in reduced levels of oxygen reaching the brain, heart,
and other body tissues. This condition is especially critical for people with cardiovascular
diseases, chronic lung disease, or anemia. CO measurements and modeling were important in
the early 1980s when CO levels were regularly exceeded throughout California, but in more
recent years, CO measurements and modeling are not a priority in most California air districts
due to the retirement of older vehicles, fewer emissions from new vehicles, and improvements
to fuels.8
Nitrogen Oxides (NOx)
When combustion temperatures are extremely high, as in aircraft, truck and automobile
engines, atmospheric nitrogen combines with oxygen to form various oxides of nitrogen. Nitric
oxide (NO) and nitrogen dioxide (NO2) are the most significant air pollutants generally referred
to as NOx. Nitric oxide is a colorless and odorless gas that is relatively harmless to humans,
quickly converts to NO2 and can be measured. Nitrogen dioxide has been found to be a lung
irritant capable of producing pulmonary edema. Inhaling NO2 can lead to respiratory illnesses
such as bronchitis and pneumonia. Nitrate particles and NO2 can also block the transmission of
light, reducing visibility in urban areas.
A large body of health science literature indicates that exposure to NO2 can induce adverse
health effects. The strongest health evidence, and the health basis for the AAQS for NO2, results
from controlled human exposure studies that show that NO2 exposure can intensify responses
to allergens in allergic asthmatics. In addition, a number of epidemiological studies have
demonstrated associations between NO2 exposure and premature death, cardiopulmonary
effects, decreased lung function growth in children, respiratory symptoms, emergency room
visits for asthma, and intensified allergic responses.
As with other pollutants, infants and children are particularly at risk because they have
disproportionately higher exposure to NO2 than adults due to their greater breathing rate for
their body weight and their typically greater outdoor exposure duration. Several studies have
shown that long-term NO2 exposure during childhood, the period of rapid lung growth, can
lead to smaller lungs at maturity in children with higher compared to lower levels of exposure.
In addition, children with asthma have a greater degree of airway responsiveness compared
8 California Air Resources Board, 2019, Carbon Monoxide & Health, Accessed July 9, 2020 at:
https://ww2.arb.ca.gov/resources/carbon-monoxide-and-health

C-8
with adult asthmatics. In adults, the greatest risk is to people who have chronic respiratory
diseases, such as asthma and chronic obstructive pulmonary disease.9
Particulate Matter (PM10 and PM2.5)
PM10 and PM2.5 represent fractions of particulate matter that can be inhaled into the air passages
and the lungs, causing adverse health effects. Particulate matter in the atmosphere results from
many kinds of dust– and fume–producing industrial and agricultural operations, fuel
combustion, wood burning stoves and fireplaces, and atmospheric photochemical reactions.
Some sources of particulate matter, such as demolition, construction activities and mining, are
more local in nature, while others, such as vehicular traffic and wood burning stoves and
fireplaces, have a more regional effect.
For PM2.5, short-term exposures (up to 24-hours duration) have been associated with premature
mortality, increased hospital admissions for heart or lung causes, acute and chronic bronchitis,
asthma attacks, emergency room visits, respiratory symptoms, and restricted activity days.
These adverse health effects have been reported primarily in infants, children, and older adults
with preexisting heart or lung diseases. In addition, of all of the common air pollutants, PM2.5 is
associated with the greatest proportion of adverse health effects related to air pollution, both in
the United States and world-wide based on the World Health Organization’s Global Burden of
Disease Project. Short-term exposures to PM10 have been associated primarily with worsening of
respiratory diseases, including asthma and chronic obstructive pulmonary disease, leading to
hospitalization and emergency room visits.10
Long-term (months to years) exposure to PM2.5 has been linked to premature death, particularly
in people who have chronic heart or lung diseases, and reduced lung function growth in
children. The effects of long-term exposure to PM10 are less clear, although several studies
suggest a link between long-term PM10 exposure and respiratory mortality. The International
Agency for Research on Cancer published a review in 2015 that concluded that PM in outdoor
air pollution causes lung cancer.11
People with influenza, people with chronic respiratory and cardiovascular diseases, and older
adults may suffer worsening illness and premature death as a result of breathing PM. People
with bronchitis can expect aggravated symptoms from breathing PM. Children may experience
a decline in lung function due to breathing in PM10 and PM2.5.
9 California Air Resources Board, 2019, Nitrogen Dioxide & Health, Accessed July 9, 2020 at:
https://ww2.arb.ca.gov/resources/nitrogen-dioxide-and-health
10 California Air Resources Board, 2019, Inhalable Particulate Matter Health, Accessed July 9, 2020 at:
https://ww2.arb.ca.gov/resources/inhalable-particulate-matter-and-health
11 California Air Resources Board, 2019, Inhalable Particulate Matter Health, Accessed July 9, 2020 at:
https://ww2.arb.ca.gov/resources/inhalable-particulate-matter-and-health

C-9
Very small particles of certain substances (e.g., sulfates and nitrates) can cause lung damage
directly, or can contain adsorbed gases (e.g., chlorides or ammonium) that may be injurious to
health. Particulates can also damage materials and reduce visibility. Dust comprised of large
particles settles out rapidly and is easily filtered by human breathing passages. This dust is of
concern more as a soiling nuisance rather than a health hazard. The remaining fractions, PM10
and PM2.5, are a health concern particularly at levels above the Federal and State ambient air
quality standards. PM2.5 (including diesel exhaust particles) is thought to have greater effects on
health, because these particles are so small and thus are able to penetrate to the deepest parts of
the lungs.
Acute and chronic health effects associated with high particulate levels include the aggravation
of chronic respiratory diseases, heart and lung disease, and coughing, bronchitis, and
respiratory illnesses in children. Mortality studies since the 1990s have shown a statistically
significant direct association between mortality (premature deaths) and daily concentrations of
particulate matter in the air. Despite important gaps in scientific knowledge and continued
reasons for some skepticism, a comprehensive evaluation of the research findings provides
persuasive evidence that exposure to fine particulate air pollution has adverse effects on
cardiopulmonary health. The CARB has estimated that achieving the ambient air quality
standards for PM10 could reduce premature mortality rates by 6,500 cases per year.12
Sulfur Dioxide (SO2)
A colorless gas, SO2 is formed when fuels containing sulfur compounds are combusted. SO2 can
cause irritation and inflammation of tissues with which it comes in contact. Inhaling elevated
concentrations can irritate mucous membranes, cause bronchial damage, and exacerbate pre-
existing respiratory diseases such as asthma, bronchitis, and emphysema. Sulfate particles are
the major cause of reduced visibility in many areas of the United States. When combined with
other substances in the air, this pollutant can fall to the earth as rain, fog, snow, or dry particles
(commonly referred to as “acid rain”). SO2 can also accelerate the decay of building materials
and certain types of paint.
SO2 is a combustion product of sulfur or sulfur–containing fuels such as coal and diesel. SO2 is
also a precursor to the formation of atmospheric sulfate and particulate matter, and contributes
to potential atmospheric sulfuric acid formation that could precipitate downwind as acid rain.
The maximum SO2 concentrations recorded in the project area are well below federal and State
standards; as a result, the area is in attainment status with both federal and State SO2 standards.
Controlled human exposure and epidemiological studies show that children and adults with
asthma are more likely to experience adverse responses with SO2 exposure, compared with the
12 California Air Resources Board, 2019, Inhalable Particulate Matter Health, Accessed July 9, 2020 at:
https://ww2.arb.ca.gov/resources/inhalable-particulate-matter-and-health

C-10
non-asthmatic population. Effects at levels near the one-hour standard are those of asthma
exacerbation, including bronchoconstriction accompanied by symptoms of respiratory irritation
such as wheezing, shortness of breath and chest tightness, especially during exercise or physical
activity. Also, exposure at elevated levels of SO2 (above 1 ppm) results in increased incidence of
pulmonary symptoms and disease, decreased pulmonary function, and increased risk of
mortality. The elderly and people with cardiovascular disease or chronic lung disease (such as
bronchitis or emphysema) are most likely to experience these adverse effects.13
Lead
People and animals can be exposed to Pb by breathing or ingesting it in food, water, soil, or
dust. Historically, the majority of Pb has come from the combustion of leaded fuels. However,
the use of unleaded fuels since 1975 has reduced mobile source Pb emissions by more than 90
percent. Unlike unleaded automobile gasoline, aviation gasoline (commonly known as Avgas,
or 100LL, for 100 octane low-lead) still contains Pb as an antiknock agent.
Ambient lead concentrations meet both the federal and State standards in the project area. Lead
has a range of adverse neurotoxin health effects, and was released into the atmosphere via
leaded gasoline products. The phase–out of leaded gasoline in California has resulted in
dramatically decreased levels of atmospheric lead. Ambient lead concentrations meet both the
federal and State standards in the project area. Lead has a range of adverse neurotoxin health
effects, and was released into the atmosphere via leaded gasoline products. The phase–out of
leaded gasoline in California has resulted in dramatically decreased levels of atmospheric lead.
Metal processing is currently the primary source of lead emissions in the SCAB. The highest
concentrations of lead in air are generally found near lead smelters and general aviation
airports; where piston aircraft use leaded fuel. Other stationary sources that generate lead
emissions include waste incinerators, utilities, and lead-acid battery manufacturers.
Reactive Organic Gases (ROGs) / Volatile Organic Compounds (VOCs)
The terms ROG and VOC are often used interchangeably, and the terminology will vary from
air district to air district. Volatile organic compounds (VOC) means any compound of carbon,
excluding carbon monoxide, carbon dioxide (CO2), carbonic acid, metallic carbides or
carbonates, and ammonium carbonate, which participates in atmospheric photochemical
reactions and thus, a precursor of ozone formation. ROGs are any reactive compounds of
carbon, excluding methane, CO, CO2 carbonic acid, metallic carbides or carbonates, ammonium
carbonate, and other exempt compounds.
ROGs include a variety of chemicals, some of which may have short- and long-term adverse
health effects. ROGs are emitted by a wide array of products numbering in the thousands.
13 California Air Resources Board, 2019. Sulfur Dioxide & Health, Accessed July 9, 2020 at:
https://ww2.arb.ca.gov/resources/sulfur-dioxide-and-health

C-11
Examples include paints and lacquers, paint strippers, cleaning supplies, building materials and
furnishings as well as fuel storage and use.
ROGs can cause eye, nose, and throat irritation; headaches, loss of coordination, nausea, and
damage to liver, kidney, and central nervous system. Some organics can cause cancer in
animals; some are suspected or known to cause cancer in humans. The ability of organic
chemicals to cause health effects varies greatly from those that are highly toxic, to those with no
known health effect. As with other pollutants, the extent and nature of the health effect will
depend on many factors including level of exposure and length of time exposed. Eye and
respiratory tract irritation, headaches, dizziness, visual disorders, and memory impairment are
among the immediate symptoms that some people have experienced soon after exposure to
some organics.
Existing Air Quality in the Inglewood Vicinity
The SCAQMD maintains a network of monitoring stations within Los Angeles County that
monitor air quality and compliance with applicable ambient standards. The nearest air
monitoring station which measures CO, NO2, SO2, and PM10 is located near Los Angeles
International Airport (7201 West Westchester Parkway, Southwest Coastal LA County, Station
820), four miles to the west of the Project site. The nearest air monitoring station which
measures PM2.5 is located in central Los Angeles (1630 North Main Street, Central LA, Station
087), ten miles to the northeast of the Project site. This monitoring data for 2017 through 2019
from the nearby monitoring stations is summarized in Table C-1.
Regional Air Quality Trends
While air quality has improved, the Basin requires continued diligence to meet air quality
standards. The SCAQMD has adopted a series of AQMP to meet the CAAQS and NAAQS.
These plans require control technology for existing sources, control programs for area sources
and indirect sources, a SCAQMD permitting system designed to allow no net increase in
emissions from any new or modified permitted emission sources and transportation control
measures.
SCAQMD rule development through the 1970s and 1980s resulted in dramatic improvement in
Basin air quality. Nearly all control programs developed through the early 1990s relied on (i)
the development and application of cleaner technology; (ii) add-on emission controls, and (iii)
uniform CEQA review throughout the Basin. Industrial emission sources have been
significantly reduced by this approach and vehicular emissions have been reduced by
technologies implemented at the state level by CARB.
Ozone, NOx, VOC, and CO have been decreasing in the Basin since 1975 and are projected to
continue to decrease. These decreases result primarily from motor vehicle controls and
reductions in evaporative emissions. Although vehicle miles traveled in the Basin continue to

C-12
increase, NOx and VOC levels are decreasing because of the mandated controls on motor
vehicles and the replacement of older polluting vehicles with lower-emitting vehicles. NOx
emissions from electric utilities have also decreased due to use of cleaner fuels and renewable
energy.
Table C-1
Air Quality Data Summary (2017 - 2019)
Pollutant
Monitoring Data by Year
Standards 2017 2018 2019
Ozone
Highest 1 Hour Average (ppm)b 0.09 0.086 0.074 0.082
Days over State Standard — 0 0 0
Highest 8 Hour Average (ppm)b 0.070 0.070 0.065 0.067
Days over National Standard — 0 0 0
Highest 8 Hour Average (ppm)b 0.070 0.070 0.060 0.060
Days over State Standard — 0 0 0
Nitrogen Dioxide
Highest 1 Hour Average (ppm)b 0.180/0.100 0.072 0.060 0.057
Days over State Standard — 0 0 0
Annual Average (ppm) b 0.030/0.053 0.009 0.009 0.010
Carbon Monoxide
Highest 1 Hour Average (ppm)b 20.0 2.1 1.8 1.8
Days over State Standard — 0 0 0
Highest 8 Hour Average (ppm)b 9.0 1.6 1.5 1.3
Days over State Standard — 0 0 0
Particulate Matter (PM10)
Highest 24 Hour Average (g/m3)b 50 46 45 62
Days over State Standard — 0 0 2
State Annual Average (g/m3) b 20 19.8 20.5 19.2
Particulate Matter (PM2.5)
Highest 24 Hour Average (g/m3)b 35 27.8 30.5 43.5
Days over National Standard — 0 0 1
State Annual Average (g/m3)b 12 11.9 12.6 10.9
NOTES: Values in bold are in excess of at least one applicable standard.
Generally, State and national standards are not to be exceeded more than once per year.
ppm = parts per million; g/m3 = micrograms per cubic meter.
PM10 is not measured every day of the year. Number of estimated days over the standard is based on 365 days per year.
Source: South Coast Air Quality Management District, Annual Air Quality Summaries, Accessed July 7, 2020 at:
http://www.aqmd.gov/home/air-quality/air-quality-data-studies/historical-data-by-year
The overall trends of PM10 and PM2.5 levels in the air (not emissions) show an overall
improvement since 1975. Direct emissions of PM10 have remained somewhat constant in the

C-13
Basin and direct emissions of PM2.5 have decreased slightly since 1975. Area wide sources
(fugitive dust from roads, dust from construction and demolition, and other sources) contribute
the greatest amount of direct particulate matter emissions.
The nearest air monitoring station which measures CO, NO2, SO2, and PM10 is located near Los
Angeles International Airport (7201 West Westchester Parkway, Southwest Coastal LA County,
Station 820), four miles to the west of the Project site. The nearest air monitoring station which
measures PM2.5 is located in central Los Angeles (1630 North Main Street, Central LA, Station
087), ten miles to the northeast of the Project site. Figures C-1 through C-11 show the trend in
ambient concentrations of PM10, PM2.5, CO, NO2, and ozone at closest monitoring station.
Recent PM10 statistics (2000 through 2019) in the Basin show overall improvement as illustrated
in Figures C-1 through C-2. As shown in Figure C-1, the maximum 24-hour average
concentration for PM10 decreased by approximately 17 percent, from 74 µg/m³ in 2000 to 62
µg/m³ in 2019, with a peak of 121 µg/m³ in 2002. Although the values are above the State
standard of 50 µg/m³, there were only 10 days in 2018 where the 24-hour maximum
measurement exceeded the state standard (approximately 17 percent of the number of days of
recorded data [60]). As shown in Figure C-1, from 2010 through 2019, Maximum 24-Hour PM10
concentrations were below the state standard. As shown in Figure C-2, the annual average for
PM10 has decreased by approximately 47 percent, from 36.1 µg/m³ in 2000 to 19.2 µg/m³ in 2019,
with a peak of 37.4 µg/m³ in 2002. The annual average for PM10 was above the state standard of
20 µg/m³ from 2000 through 2011, 2013 through 2016 and in 2018.

C-14
Figure C-1: Maximum 24-Hour PM10 Concentration (µg/m3) Compared to State Standard
Source: SCAQMD, Historical Data By Year, http://www.aqmd.gov/home/air-quality/historical-air-quality-
data/historical-data-by-year
Figure C-2: Annual Average PM10 Concentration (µg/m3)
Source: SCAQMD, Historical Data By Year, http://www.aqmd.gov/home/air-quality/historical-air-quality-
data/historical-data-by-year

C-15
Figures C-3 and C-4 show the most recent 24-hour average PM2.5 concentrations in the Basin
(2000 through 2019). As shown in Figure C-3, the 24-hour (98th percentile) concentration has
decreased 47 percent from 53.2 µg/m³ in 2005 to 28.3 µg/m³ in 2019. As shown in Figure C-4, the
annual average trend has decreased by 50 percent from 22 µg/m³ in 2000 to 10.9 µg/m³ in 2019.
The SCAB is currently designated as nonattainment for the State and federal PM2.5 standards.
Figure C-3: 24-Hour PM2.5 Concentration (µg/m3)
Source: SCAQMD, Historical Data By Year, http://www.aqmd.gov/home/air-quality/historical-air-quality-
data/historical-data-by-year

C-16
Figure C-4: Annual Average PM2.5 Concentration (µg/m3)
Source: SCAQMD, Historical Data By Year, http://www.aqmd.gov/home/air-quality/historical-air-quality-
data/historical-data-by-year
Figure C-5 shows the most recent maximum 8-hour CO concentrations in the SCAB (2000-2019).
The 2019 maximum 8-hour CO concentration in the SCAB has decreased approximately 81
percent from 2000 concentration. The entire SCAB is now designated as attainment for both the
state and national CO standards. Ongoing reductions from motor vehicle control programs
should continue the downward trend in ambient CO concentrations.

C-17
Figure C-5: Maximum 8-Hour CO Concentration (ppm)
Source: SCAQMD, Historical Data By Year, http://www.aqmd.gov/home/air-quality/historical-air-quality-
data/historical-data-by-year
The most recent NO2 data for the SCAB is shown in Figure C-6. Over the last 50 years, NO2
values have decreased significantly; the peak 1-hour national and state averages for 2017 is
approximately 77 percent lower than what it was during 1963. The SCAB attained the State 1-
hour NO2 standard in 1994, bringing the entire State into attainment. NO2 is formed from NOx
emissions, which also contribute to ozone. As a result, the majority of the future emission
control measures will be implemented as part of the overall ozone control strategy. Many of
these control measures will target mobile sources, which account for more than three-quarters
of California’s NOx emissions. These measures are expected to bring the South Coast into
attainment of the State annual average standard.
Recent NO2 data (2000 through 2019) indicate decreasing NO2 emissions. As shown in Figure C-
6, there was a 54 percent decrease from 130 parts per billion (ppb) in 2000 to 60 ppb in 2019 for
maximum 1-hour concentrations of NO2. Records indicate the lowest NO2 1-hour maximum
concentrations in the past 19 years (56.6 ppb) occurred in 2019.

C-18
Figure C-6: Maximum 1-Hour NO2 Concentration (ppm)
Source: SCAQMD, Historical Data By Year, http://www.aqmd.gov/home/air-quality/historical-air-quality-
data/historical-data-by-year
The American Lung Association website includes data collected from State air quality monitors
that are used to compile an annual State of the Air. As noted in this report, air quality in the
Basin has significantly improved in terms of both pollution levels and high pollution days over
the past three decades. The area’s average number of high ozone days dropped from 230 days
regionally in 2000 to 142 days in the 2017 and continues to decrease the number of days. The
region has also seen dramatic reduction in particle pollution from 107 days regionally in 2004 to
14 days in the 2017.
The 2016 AQMP14 includes the integrated strategies and measures needed to meet the NAAQS.
The 2016 AQMP that demonstrates attainment of the 1-hour and 8-hour ozone. Recent Ozone
concentration data (2000 through 2019) for 1-hour and 8-hour trends are shown in Figures C-7
and C-8. As shown in Figure C-7, an 18 percent decrease in the maximum 1-hour ozone trend
from 0.1 parts per million (ppm) to 0.082 ppm occurred. Figure C-8 illustrates an 11 percent
decrease in the maximum 8-hour ozone trend that decreased from 0.075ppm to 0.067 ppm.
14 South Coast Air Quality Management District, 2016 Air Quality Management Plan, March 1, 2017, Accessed July 9,
2020 at: http://www.aqmd.gov/home/air-quality/clean-air-plans/air-quality-mgt-plan
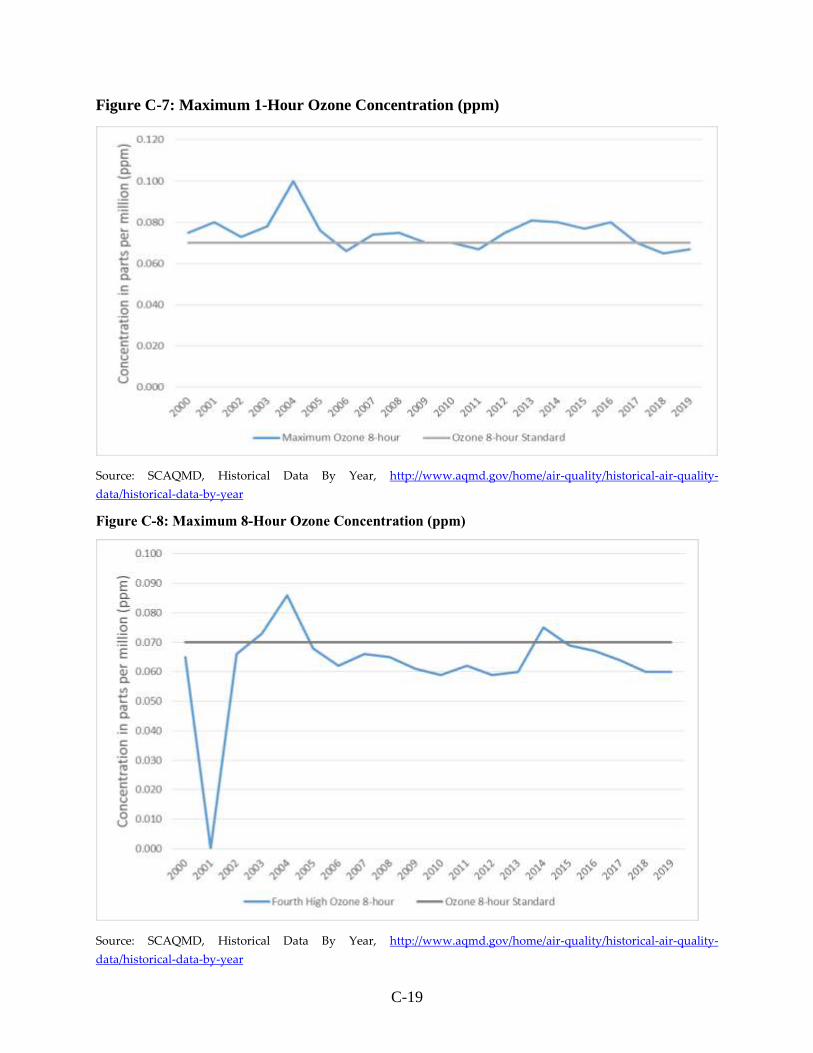
C-19
Figure C-7: Maximum 1-Hour Ozone Concentration (ppm)
Source: SCAQMD, Historical Data By Year, http://www.aqmd.gov/home/air-quality/historical-air-quality-
data/historical-data-by-year
Figure C-8: Maximum 8-Hour Ozone Concentration (ppm)
Source: SCAQMD, Historical Data By Year, http://www.aqmd.gov/home/air-quality/historical-air-quality-
data/historical-data-by-year

C-20
Since 1980, the Basin has experienced a decrease in 1- and 8-hour Ozone exceedances and in 1-
hour Ozone advisories. Figures C-9, C-10 and C-11 show reductions in these historical Ozone
air quality trends. As shown in Figure C-9, the number of Basin-days exceeding the 1-hour
ozone exceedances decreased from 167 days to 11 days (approximately 93 percent). As shown in
Figure C-11, the number of Basin-days exceeding health standard levels for 8-hour ozone
exceedances decreased from 211 days to 141 days (approximately 33 percent). As shown in
Figure C-11, the number of Basin-days exceeding 1-hour health advisories and 1-hour stage one
episodes were both zero for 2018
Ozone contour maps show that the number of days exceeding the national 8-hour standard has
decreased between 1997 and 2007. In the 2007 period, there was an overall decrease in
exceedance days compared with the 1997 period. Ozone levels in the SCAB have decreased
substantially over the last 30 years. Today, the maximum measured concentrations are
approximately one-third of concentrations within the late 70’s.
Figure C-9: Trend in 1-Hour Ozone Exceedances
Source: SCAQMD, Historic Ozone Air Quality Trends, https://www.aqmd.gov/home/air-quality/historical-air-
quality-data/historic-ozone-air-quality-trends
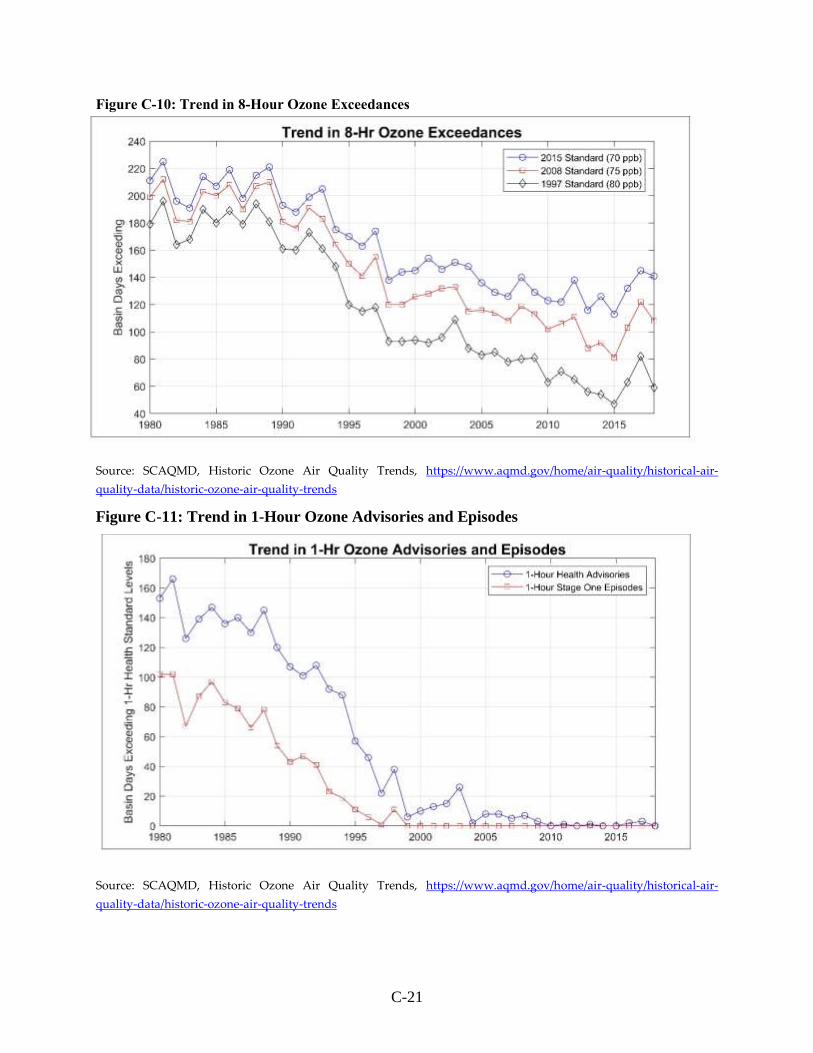
C-21
Figure C-10: Trend in 8-Hour Ozone Exceedances
Source: SCAQMD, Historic Ozone Air Quality Trends, https://www.aqmd.gov/home/air-quality/historical-air-
quality-data/historic-ozone-air-quality-trends
Figure C-11: Trend in 1-Hour Ozone Advisories and Episodes
Source: SCAQMD, Historic Ozone Air Quality Trends, https://www.aqmd.gov/home/air-quality/historical-air-
quality-data/historic-ozone-air-quality-trends

C-22
Toxic Air Contaminants (TAC)
Non-criteria air pollutants or toxic air contaminants (TAC) are airborne substances that are
capable of causing short-term (acute) and/or long-term (chronic or carcinogenic, i.e., cancer
causing) adverse human health effects (i.e., injury or illness). TAC include both organic and
inorganic chemical substances. They may be emitted from a variety of common sources
including gasoline stations, automobiles, dry cleaners, industrial operations, and painting
operations. The current California list of TAC includes approximately 200 compounds,
including particulate emissions from diesel-fueled engines and asbestos.
In August of 1998, CARB identified particulate emissions from diesel-fueled engines as TAC.15
The document represents a proposal to reduce diesel particulate emissions, with the goal to
reduce emissions and the associated health risk by 75 percent in 2010 and by 85 percent in 2020.
The program aims to require the use of state-of-the-art catalyzed diesel particulate filters and
ultra-low sulfur diesel fuel on diesel-fueled engines.
Diesel particulate matter (DPM) is the most complex of diesel emissions. Diesel particulates, as
defined by most emission standards, are sampled from diluted and cooled exhaust gases. This
definition includes both solid and liquid material that condenses during the dilution process.
The basic fractions of DPM are elemental carbon; heavy hydrocarbons derived from the fuel
and lubricating oil and hydrated sulfuric acid derived from the fuel sulfur. DPM contains a
large portion of the polycyclic aromatic hydrocarbons (PAH) found in diesel exhaust. Diesel
particulates include small nuclei particles of diameters below 0.04 µm and their agglomerates of
diameters up to 1 µm. DPM is a major factor in total TAC exposure in California.
California State law defines TAC as air pollutants having carcinogenic effects. A total of 243
substances have been designated as TAC under California law; they include the 187 (federal)
Hazardous Air Pollutants (HAP) adopted in accordance with AB 2728. The Air Toxics “Hot
Spots” Information and Assessment Act of 1987 (AB 2588) seeks to identify and evaluate risk
from air toxics sources but AB 2588 does not regulate air toxics emissions. Toxic air contaminant
emissions from individual facilities are quantified and prioritized. Depending on the risk levels,
emitting facilities are required to implement varying levels of risk reduction measures.
In 2001, CARB assessed the state-wide health risks from exposure to diesel exhaust and to other
toxic air contaminants. It is difficult to distinguish the health risks of diesel emissions from
those of other air toxics, since diesel exhaust contains approximately 40 different TAC. The
CARB study detected diesel exhaust by using ambient air carbon soot measurements as a
surrogate for diesel emissions. The study reported that the state-wide cancer risk from exposure
to diesel exhaust was about 540 per million population as compared to a total risk for exposure
15 California Air Resources Board, Risk Reduction Plan to Reduce Particulate Matter Emissions from Diesel-Fueled Engines
and Vehicles, October 2000, Accessed July 9, 2020 at: http://www.arb.ca.gov/diesel/documents/rrpfinal.pdf

C-23
to all ambient air toxics of 760 per million. This estimate, which accounts for about 70 percent of
the total risk from TAC, included both urban and rural areas in the state. The estimate can also
be considered an average worst-case for the state, since it assumes constant exposure to outdoor
concentrations of diesel exhaust and does not account for expected lower concentrations
indoors, where most of time is spent. Based on 2012 estimates of statewide exposure, DPM is
estimated to increase statewide cancer risk by 520 cancers per million residents exposed over a
lifetime.16
Exposure to DPM results in a greater incidence of chronic non-cancer health effects, such as
cough, labored breathing, chest tightness, wheezing, and bronchitis. Individuals particularly
vulnerable to DPM are children, whose lung tissue is still developing, the elderly and people
with illnesses who may have other serious health problems that can be aggravated by exposure
to DPM. In general, children are more vulnerable than adults to air pollutants because they
have higher inhalation rates, narrower airways, and less mature immune systems. In addition,
children with allergies may have an enhanced allergic response when exposed to diesel
exhaust).
CARB published the Air Quality and Land Use Handbook: A Community Health Perspective in 2005.
The primary goal in developing the Handbook was to provide information that would help keep
California’s children and other vulnerable populations out of harm’s way with respect to
nearby sources of air pollution. The Handbook highlights recent studies that have shown that
public exposure to air pollution can be substantially elevated near freeways and certain other
facilities. However, the health risk is greatly reduced with distance. For that reason, CARB
provided some general recommendations aimed at keeping appropriate distances between
sources of air pollution and sensitive land uses, such as residences.
In 2005, the SCAQMD conducted a comprehensive study on air toxics in the SCAB called the
Multiple Air Toxics Exposure Study (MATES-III). The monitoring program measured more
than 30 air pollutants, including both gas and particulates. The monitoring study was
accompanied by a computer modeling study in which SCAQMD estimated the risk of cancer
from breathing toxic air pollution throughout the region based on emissions and weather data.
MATES-III found that the average cancer risk in the region from carcinogenic air pollutants
ranges from approximately 870 in a million to 1,400 in a million, with an average regional risk
of approximately 1,200 in a million.17
16 California Air Resources Board, Summary: Diesel Particulate Matter Health Impacts, April 12, 2016, Accessed July 9,
2020 at: https://www.arb.ca.gov/research/diesel/diesel-health_summ.htm
17 South Coast Air Quality Management District, Multiple Air Toxics Exposure Study (MATES-III) in the South
Coast Air Basin, September 2008, Accessed July 9, 2020 at: https://www.aqmd.gov/home/air-quality/air-quality-
studies/health-studies/mates-iii

C-24
In 2015, the Multiple Air Toxics Exposure Study IV (MATES IV) is a follow up to previous air
toxics studies in the Basin. The MATES IV Study includes an updated emissions inventory of
toxic air contaminants and a modeling effort to characterize risk across the SCAB. The study
focuses on the carcinogenic risk from exposure to air toxics but does not estimate mortality or
other health effects from particulate exposures. An additional focus of MATES IV is the
inclusion of measurements of ultrafine particle concentrations. Results for MATES-IV show that
trends in monitored levels air toxics continue to decline, modeled exposures and risks were
substantially lower compared to MATES III (approximately 60 percent decrease), and DPM
remains the largest component of air toxics estimated risk, at approximately 68 percent of the
South Coast Air Basin wide cancer risk of 418 per million persons, ranging from 320 to 480 per
million persons. Based on data within MATES-IV, the proposed Project is within an area with
an estimated cancer risk of 400 to 450 per million persons.18
South Coast Air Quality Management District (SCAQMD) Amicus Brief19
The proposed Inglewood Transit is in the South Coast Air Basin, under the jurisdiction of the
SCAQMD. The following in information from the SCAQMD is included because it is the legal
brief on the Friant Ranch decision from the local air district for the proposed Inglewood Transit.
The SCAQMD brief describes why it is not feasible to accurately model changes in regional air
quality concentrations resulting from specific projects or accurately correlate predicted minor
air quality changes with specific health outcomes.
As noted in the SCAQMD brief, SCAQMD has among the most sophisticated air quality
modeling and health impact evaluation capability of any of the air districts in the State, and
thus it is uniquely situated to express an opinion on how lead agencies should correlate air
quality impacts with specific health outcomes. SCAQMD receives as many as 60 or more CEQA
documents each month (around 500 per year) in its role as commenting agency or an agency
with "jurisdiction by law" over air quality. The SCAQMD staff provides comments on as many
as 25 or 30 such documents each month (SCAQMD brief, p. 7). Therefore, the Inglewood Transit
EIR air quality analysis appropriately relied on SCAQMD expertise, significance thresholds,
and guidance to disclose the proposed Project's air quality impacts.
The SCAQMD brief makes it clear that SCAQMD does not believe that there must be a
quantification of a project's health risks in all CEQA documents prepared for individual
projects, and in fact, the SCAQMD brief is clear that for individual projects the results of such
an assessment would be meaningless. Also, the proposed Project would not generate anywhere
18 South Coast Air Quality Management District, Multiple Air Toxics Exposure Study (MATES-IV) in the South
Coast Air Basin, May 1, 2015, Accessed July 9, 2020 at: http://www.aqmd.gov/home/air-quality/air-quality-
studies/health-studies/mates-iv
19 South Coast Air Quality Management District Amicus Brief, April 13, 2015, Accessed July 9, 2020 at:
https://www.courts.ca.gov/documents/9-s219783-ac-south-coast-air-quality-mgt-dist-041315.pdf

C-25
near 6,620 pounds per day of NOx or 89,180 pounds per day of ROG emissions, which
SCAQMD stated was a large enough emission to quantify ozone-related health impacts.
(SCAQMD brief, page 12) Therefore, the emissions from the proposed Project are not
sufficiently high to use a regional modeling program to correlate health effects on a basin-wide
level.
The SCAQMD’s numeric regional thresholds of significance are based in part on Section 180 (e)
of the federal Clean Air Act (CAA). The numeric regional mass daily thresholds have not
changed since their adoption as part of the CEQA Air Quality Handbook published by
SCAQMD in 1993 (over 20 years ago). The numeric regional mass daily significance thresholds
are also intended to provide a means of consistency in significance determination within the
environmental review process.
Simply exceeding the SCAQMD’s numeric regional mass daily thresholds does not constitute a
particular health impact to an individual receptor. The reason for this is that the mass daily
thresholds are in pounds per day (pounds/day) emitted into the air whereas health effects are
determined based on the concentration of emissions in the air at a particular receptor (e.g., parts
per million by volume of air, or micrograms per cubic meter of air) and usually over a longer
duration such a one year of an 70-year lifetime. State and federal ambient air quality standards
(CAAQS & NAAQS) were developed to protect the most susceptible population groups from
adverse health effects and were established in terms of parts per million or micrograms per
cubic meter for the applicable emissions.
With regard to the analysis of air quality-related health impacts, the SCAQMD, the air quality
authority for the South Coast Air Basin, has stated that “EIRs must generally quantify a project’s
pollutant emissions, but in some cases it is not feasible to correlate these emissions to specific, quantifiable
health impacts (e.g., premature mortality; hospital admissions).” In such cases, a general description
of the adverse health impacts resulting from the pollutants at issue may be sufficient.
(SCAQMD brief, page 1)
The SCAQMD has further stated that from a scientific standpoint,
“…it takes a large amount of additional precursor emissions to cause a modeled increase in
ambient ozone levels over an entire region. For example, the SCAQMD’s 2012 AQMP showed
that reducing NOx by 432 tons per day and reducing VOC by 187 tons per day would only
reduce ozone levels at the SCAQMD’s monitor site with the highest levels by 9 parts per
billion.20” (SCAQMD brief, page 11)
20 South Coast Air Quality Management District, Final 2012 AQMP, February 2013, Accessed July 9, 2020 at:
www.aqmd.gov/home/library/clean-air-plans/air-quality-mgt-plan/final-20212-air-quality-management-plan; then
follow “Appendix V: Modelling & Attainment Demonstrations” hyperlink, pp. v-4-2, v-7-4, v-7-24

C-26
A few comparisons to this SCAQMD brief and the Inglewood Transit are appropriate. The
Inglewood Transit calculated maximum unmitigated daily NOx construction emissions are 238
pounds/day or approximately 0.028 percent of the 432 tons per day.
A ratio comparison helps add perspective. Using the 0.028 percent value for the change in
ozone levels at the SCAQMD’s monitor site with the highest levels would change by (0.00028 x
9 parts per billion) or 0.0025 parts per billion of ozone. The lowest ozone standard is the
California 8-hour standard of 0.070 ppm or 70 ppb. So, if there were a direct ratio correlation
given the Inglewood Transit daily construction emissions, those emissions would change ozone
levels by 0.0025 ppb compared to the most stringent 70 ppb California 8-hour standard or 0.0035
percent (0.0025/70).
The extremely small change in the ozone numbers (0.0035 percent of the standard) from this
approximated calculation is an indication of why the SCAQMD does not require relatively
small projects to undertake regional modeling. Even if it were a valid ozone change calculation,
the correlation to health impacts from the change would be more impossible to determine.
SCAQMD staff does not currently know of a way to accurately quantify ozone-related health
impacts caused by NOx or VOC precursor emissions from relatively small projects such as the
proposed Inglewood Transit. (SCAQMD brief, page 12)
Current scientific, technological, and modeling limitations prevent the relation of expected
adverse air quality impacts to likely health consequences. Since SCAQMD staff does not
currently know of a way to accurately quantify ozone-related health impacts caused by NOx or
ROG emissions from relatively small projects like the proposed Project, then a general
description of the adverse health impacts resulting from the criteria and toxics pollutants (as
previously described) is all that can be meaningfully provided at this time.
San Joaquin Valley Air Pollution Control District Amicus Brief21
The proposed Friant Specific Plan is in the San Joaquin Valley Air Basin, under the jurisdiction
of the SJVAPCD. The SJVAPCD Amicus Brief addresses whether it is scientifically feasible to
correlate an individual project’s air quality emissions of criteria air pollutants to specific health
impacts. Human health impacts associated with criteria air pollutants are analyzed and taken
into consideration when the USEPA sets the NAAQS for each criteria pollutant. The health
impact of a particular criteria pollutant is analyzed on a regional, not a facility level, based on
how close the area is to complying with (attaining) the NAAQS. As discussed in the SJVAPCD
brief, it is not feasible to conduct a criteria air pollutant analysis detailing health impacts, as
currently available computer modeling tools are not equipped for this task.
21 San Joaquin Valley Air Pollution Control District Amicus Brief, April 13, 2015, Accessed July 9, 2020 at:
https://www.courts.ca.gov/documents/7-s219783-ac-san-joaquin-valley-unified-air-pollution-control-dist-041315.pdf

C-27
In requiring a health risk type analysis for criteria air pollutants, it is important to understand
how the relevant criteria pollutants (ozone and particulate matter) are formed, dispersed and
regulated. Ground level ozone (smog) is not directly emitted into the air but is instead formed
when precursor pollutants such as NOx and ROG are emitted into the atmosphere and undergo
complex chemical reactions driven by sunlight. Once formed, ozone can be transported long
distances by wind. Because of the complexity of ozone formation, a specific tonnage amount of
NOx or ROG emitted in a particular area does not equate to a particular concentration of ozone
in that area. In fact, even rural areas that have relatively low tonnages of emissions of NOx or
ROG can have high levels of ozone concentrations simply due to wind transport. Conversely,
areas that have substantially more NOx and ROG emissions could experience lower
concentrations of ozone simply because sea breezes disperse the emissions.22 Secondary PM,
like ozone, is formed via complex chemicals such as SOx and NOx.23 Because of the complexity
of secondary PM formation, the tonnage of PM-forming precursor emissions in an area does not
necessarily result in an equivalent concentration of secondary PM in that area.
The disconnect between the tonnage of precursor pollutants and the concentration of ozone or
PM formed is important because it is not necessarily the tonnage of precursor pollutants that
causes health effects; rather, it is the concentration of resulting ozone or PM that causes these
effects. As such, the NAAQS, which are statutorily required to be set by USEPA at levels that
are requisite to protect the public health, are established as concentrations of ozone and not as
tonnages of their precursor pollutants. Because the NAAQS are focused on achieving a
particular concentration region-wide, the SJVAPCD’s tools and plans for attaining the NAAQS
are regional in nature.
In regard to regional concentrations and air basin attainment, the SJVAPCD emphasized that
attempting to identify a change in background pollutant concentrations that can be attributed to
a single project, even one as large as the entire Friant Ranch Specific Plan, is a theoretical
exercise. The SJVAPCD brief noted that it “would be extremely difficult to model the impact on
NAAQS attainment that the emissions from the Friant Ranch project may have”. The situation is
further complicated by the fact that background concentrations of regional pollutants are not
uniform either temporally or geographically throughout an air basin but are constantly
fluctuating based upon wind speed and direction, precipitation, and topography. The currently
available modeling tools are equipped to model the impact of all emission sources in the San
Joaquin Valley Air Basin on attainment. The SJVAPCD indicated that, “Running the
photochemical grid model used for predicting O3 attainment with the emissions solely from the Friant
22 San Joaquin Valley Air Pollution Control District, 2007 Ozone Plan, Accessed July 9, 2020 at:
www.valleyair.org/Air_Quality_Plans/AQ_Final_Adopted_Ozone2007.htm
23 USEPA, Particulate Matter: Basic Information, Accessed July 9, 2020 at:
www.epa.gov/airquality/pariclepollution/basic.html

C-28
Ranch project (which equate to less than one-tenth of one percent of the total NOx and VOC [ROG] in
the Valley) is not likely to yield valid information given the relative scale involved”. (SQVAPCD brief,
p. 9-10)
The computer models used to simulate and predict an attainment date for ozone are based on
regional inventories of precursor pollutants, atmospheric chemistry and meteorology within the
air basin. At a very basic level, the models simulate future ozone levels based on predicted
changes in precursor emissions basin wide. The computer models are not designed to
determine whether the emissions generated by an individual development project will affect the
date that the air basin attains the NAAQS. Instead, the models help inform regional planning
strategies based on the extent to which all of the emission-generating sources within the air
basin must be controlled in order to reach attainment.
Conclusions
In the case of the Inglewood Transit, construction emissions exceed the SCAQMD’s
recommended daily significance thresholds for NOx. However, this does not determine the
concentration of ozone that will be occur at or near the Project Site or within the region on a
particular day or month of the year, or the specific health impacts that may occur as a result of
that concentration. Wind speed and direction, and the presence or absence of sunlight, and
other complex chemical factors all combine to determine the ultimate concentrations and
locations of ozone. This is especially true for a project like the Inglewood Transit, where the
criteria pollutant emissions derive not from a single “point source,” but from mobile sources
driving to, from and around the Project Site.
The air quality analysis for the Inglewood Transit included a site-specific localized impact
analysis which found less than significant impacts. The localized impact analysis was focused
on the impacts locally on receptors adjacent to the Project site. Models such a USEPA’s
AERMOD have been used for years to estimate local concentrations for air permitting and
environmental planning. However, even these dispersion models are not suited for the chemical
transformation related to the formation of ozone due to emissions of NOx and ROG and the
interaction with sunlight. Ozone concentrations are dependent upon a variety of complex
factors, including the presence of sunlight and precursor pollutants, natural topography,
atmospheric stability, atmospheric chemistry and wind patterns. Because of the dynamic nature
of ozone formation and the complexities of predicting ground-level ozone concentrations in
relation to ambient standards, air districts instead develop mass emissions thresholds for ROG
and NOx that are used to make significance determinations. Air districts also recommend
mitigation measures for projects that exceed the significance thresholds.
On a regional scale, it would not be possible to accurately model the impact on AAQS
attainment that emissions from the Inglewood Transit may have. The currently available tools

C-29
are equipped to model the impact of all emission sources in the air basin on attainment, not to
evaluate an individual project. Both the SCAQMD and SJVAPCD have expressed serious
concerns that the regional modeling for individual projects, such as the Inglewood Transit
project, will not generate meaningful results.
In summary, modeling of the Inglewood Transit Proposed Project’s ozone emissions is not
feasible and would not provide meaningful information given the magnitude of the emissions
and the number of variables that affect ozone formation (e.g., mass of precursor emissions,
background concentrations for all other emission sources in the air basin, location of activity
and weather on that day that results in conversion of precursor emissions into ozone).
Consistent with the California Supreme Court’s Friant Ranch decision, the information and
analyses provides additional details regarding the potential health effects from the proposed
Inglewood Transit’s significant and unavoidable criteria pollutant construction emissions of
NOx. It also explains why it is not scientifically feasible to substantively connect this individual
Proposed Project’s air quality impacts to likely health consequences. The criteria air pollutant
emissions of NOx for the proposed Project are too small to model and obtain meaningful
regional concentrations of criteria air pollutants and ozone.

Attachment D
TIRCP GHG Benefits Calculator Tool Memo

Inglewood Transit Connector TIRCP Benefits Calculator Tool Memorandum
Page 1 of 6
Date: January 14, 2020
To: City of Inglewood Cc: Omar Pulido, Senior Project Director, Trifiletti Consulting, Inc
Lisa Trifiletti, Principal, Trifiletti Consulting, Inc From: Michael Ratte, Senior Air Quality Scientist, RCH Group
Joe Gibson, Partner, Meridian Consultants LLC Re: Inglewood Transit Connector TIRCP Benefits Calculator Tool Memorandum _____________________________________________________________________________
Introduction
The Inglewood Transit Connector Project (proposed Project) will provide a transit connection from the Metro
Crenshaw/LAX Line in Downtown Inglewood to the Los Angeles Stadium and Entertainment District area and would
be designed to integrate with local economic activity, transit-oriented development, and other initiatives in the area.
The Project would consist of an elevated, automated people mover system with dual guideways to allow for
continuous trains to travel in each direction.
As part of the City’s effort, they are seeking to apply for a TIRCP grant from the CALSTA Transit and Intercity Rail Capital
Program. The grant application requires that the City demonstrate the effectiveness of the proposed Project to reduce
greenhouse gas (GHG) emissions using the TIRCP Benefits Calculator.
The California Air Resources Board (CARB) developed the TIRCP Benefits Calculator Tool to estimate the GHG
emissions and selected co-benefits of eligible grant applications. The Benefits Calculator Tool estimates GHG emissions
and air pollutant emission co-benefits using methods described in CARB’s Co-Benefit Assessment Methodologies
(dated October 19, 2019). Grant Applicants must use this calculator to estimate the GHG emission reductions, air
pollutant emissions, and other co-benefits associated with the quantification methodology.
Purpose
This memorandum provides an overview of the technical information associated with the development of the CALSTA
TIRCP Benefits Calculator Tool based on provided data related to increased ridership, vehicle miles traveled (VMT)
reductions, vehicle trips reductions, and average miles traveled as a result of the Inglewood Transit Connector Project.
The benefits were estimated over the project lifetime from 2026 through 2076 or 50 years.
Benefits Calculator Tool Description
The TIRCP Benefits Calculator Tool utilizes motor vehicle emission factors (in grams per mile) to estimate GHG
emissions (reported as carbon dioxide or CO2 in metric tons).1 The TIRCP Benefits Calculator Tool also reports reactive
1 There is international scientific consensus that human-caused increases in GHG have and will continue to contribute to global
warming. Potential global warming impacts in California may include, but are not limited to, loss in snow pack, sea level rise, more extreme heat days per year, more high ozone days, more large forest fires, and more drought years. Secondary effects

Inglewood Transit Connector TIRCP Benefits Calculator Tool Memorandum
Page 2 of 6
organic compounds (ROG), nitrogen oxides (NOx), particulates matter equal to or less than 2.5 micrometers (PM2.5 or
fine particulate), and diesel particulate emissions (in pounds). The emission factors are based on the California Air
Resources Board’s (CARB) EMFAC20172 emissions inventory model. EMFAC2017 is the latest emission inventory model
that calculates emission inventories and emission rates for motor vehicles operating on roads in California. This
emission factor model reflects CARB’s current understanding of how vehicles travel and how much they emit.
EMFAC2017 can be used to show how California motor vehicle emissions have changed over time and are projected
to change in the future. Emission factors are based on information associated with Los Angeles County and the City of
Inglewood within the South Coast Air Basin.
The TIRCP Benefits Calculator Tool estimates the following co-benefits and key variables:
GHG (as CO2) emission reductions (metric tons or MT)
ROG emission reductions (pounds)
NOx emission reductions (pounds)
PM2.5 emission reductions (pounds),
Diesel PM emission reductions (pounds)
Passenger VMT reductions (miles)
Passenger travel cost savings ($)
Energy and fuel cost savings ($)
Notably, projects may claim additional ridership through increased transfers of passengers to adjoining systems and
may be reflected in the quantification of GHG benefits if the project also documents the ability of the connected
corridor to provide capacity sufficient to accommodate the riders. As such, six transit mode systems (or Quantifiable
Components) were included in TIRCP Benefits Calculator Tool: Metrolink, Metro Heavy Rail (HR), Metro Light Rail (LR),
Metro Bus Rapid Transit/Rapid Bus (BRT/RB), Metro Municipal Bus (MB), and Inglewood Transit Connector (ITC).
Benefits Calculator Tool Input Data
The TIRCP Benefits Calculator Tool input information includes the following parameters:
The type of region that best encompasses the geographic location for the proposed project type: Los Angeles
County within South Coast Air Basin
TIRCP Funds Requested ($)/Total amount of TIRCP GGRF funds requested from this solicitation to implement
the project: $90 million
Total Project Cost ($) or Total amount of funding required to implement the project: $1.016 billion
The first year of service or the first year the facility or rolling stock will be in use: 2026
The final year of service or the final year the facility or rolling stock's useful life: 2076
The increase in unlinked passenger trips directly associated with the proposed project in the first year:
6,959,998
are likely to include a global rise in sea level, impacts to agriculture, changes in disease vectors, and changes in habitat and biodiversity.
2 California Air Resources Board, EMFAC2017 User’s Guide, March 1, 2018, https://ww3.arb.ca.gov/msei/downloads/emfac2017-volume-i-users-guide.pdf and https://www.arb.ca.gov/emfac/2017/

Inglewood Transit Connector TIRCP Benefits Calculator Tool Memorandum
Page 3 of 6
The increase in unlinked passenger trips directly associated with the proposed project in the final year:
13,906,110
Discount factor applied to annual ridership to account for transit-dependent riders: 0.720
Annual passenger miles over unlinked trips directly associated with the proposed project: 6.24 miles
Data was input into the TIRCP Benefits Calculator Tool by transit mode. The TIRCP Benefits Calculator Tool Input and
Output are provided at the end of this document.
Results
Table 1 provides the increased ridership, vehicle miles traveled reductions, vehicle trips reductions, and average miles
traveled for 2026 and 2076 by transit mode. The vehicle trips reductions are a function of the increased ridership
times the adjustment factor. The vehicle miles traveled reductions are a function of the vehicle trips reductions times
the average miles traveled.
Table 1: Estimated VMT Reductions by Mode for First Year and Final Year
Year Parameter Metrolink Metro HR Metro LR Metro
BRT/RB Metro MB ITC Total
2026
VMT Reduction 23,229,237 2,954,199 1,190,852 2,649,387 30,023,675
Increased Ridership 3,335,781 482,220 226,288 2,915,709 6,959,998
Vehicle Trip Reduction 2,447,706 330,238 156,013 1,937,720 4,871,677
Length of Average Trip 9.49 8.95 7.63 1.37 6.16
Adjustment Factor 0.734 0.685 0.689 0.665 0.700
2076
VMT Reduction 7,497,044 2,942,523 45,011,104 4,923,445 1,891,274 5,169,161 67,434,551
Increased Ridership 305,991 431,878 6,372,441 814,252 371,676 5,609,872 13,906,110
Vehicle Trip Reduction 257,339 351,041 4,888,502 574,791 264,952 3,808,777 10,145,402
Length of Average Trip 29.13 8.38 9.21 8.57 7.14 1.36 6.65
Adjustment Factor 0.841 0.813 0.767 0.706 0.713 0.679 0.730
Overall
Length of Average Trip 29.13 8.38 9.30 8.70 7.32 1.36 6.24
Adjustment Factor 0.841 0.813 0.756 0.698 0.704 0.674 0.720
Note: The Green Line Eastern Extension (Norwalk) Project connects Green Line and Metrolink has an expected opening date of 2052. For Metro Heavy Rail, the Crenshaw Line Extension that connects the LAX/Crenshaw Line with Purple Line and Red Line has an expected opening date of 2047. The Sepulveda Pass Transit Corridor Phase III that connects Sepulveda Pass and Green Line at Aviation-96 Street Station has an expected opening date of 2057. The unlinked trips are two-way (includes the inbound and outbound trips) and the trip lengths are one-way. Therefore, the VMT (unlinked trips x trip length) represent a round trip distance. Source: Raju Associates, TIRCP Unlinked Trips Tables, January 7, 2020.
Table 2 displays the number of jobs supported by the Inglewood Transit Connector Project. California Climate
Investments facilitate GHG emission reductions and deliver a suite of economic, environmental, and public health co-
benefits, including job co-benefits. A different mix of spending on materials, equipment, and labor is expected across
various California Climate Investments project types and match funding arrangements. As such, some project types

Inglewood Transit Connector TIRCP Benefits Calculator Tool Memorandum
Page 4 of 6
will support more jobs than others. The Job Co-Benefits Tool Input and Output are provided at the end of this
document.
Table 2: Estimated Job Co-Benefit Results
Parameter Total
Total Full-Time Equivalent Jobs Supported by the Project Budget 9,759
Total Full-Time Equivalent Jobs Supported by the Project GGRF Funds 878
Full-time Equivalent Jobs Directly Supported by the Project GGRF Funds 413
Full-time Equivalent Jobs Indirectly Supported by the Project GGRF Funds 190
Full-time Equivalent Induced Jobs Supported by the Project GGRF Funds 276
Table 3 displays the CO2 vehicle emission factors used to determine the GHG emission reductions. The GHG emission
reductions (in metric tons) are determined as the VMT reductions times the CO2 emission factor divided by 453.592
gram/pound divided by 2000 pounds/short ton times 0.907185 metric tons/short ton. The calculation is completed
by year and transit mode and summed over the project lifetime.
Table 4 displays the estimated GHG emissions reductions by mode over the project lifetime. The total estimated GHG
emissions reductions are 768,922 metric tons of CO2 which is a function of 2,322,426,448 VMT reductions with an
average vehicle emission factor of 332 grams per vehicle mile. Based on TIRCP GGRF funds requested of $90,000,000,3
this equates to $117 per metric ton of CO2.
3 Based on the TICRP GGRF funding contribution only ($90 million), not the full TIRCP grant request amount ($200 million).

Inglewood Transit Connector TIRCP Benefits Calculator Tool Memorandum
Page 5 of 6
Table 3: Estimated CO2 Emission Factors
Year CO2 Emission Factor (g/mile)
2026 383
2027 373
2028 364
2029 356
2030 349
2031 344
2032 338
2033 333
2034 329
2035 325
2036 322
2037 319
2038 317
2039 315
2040 313
2041 312
2042 311
2043 310
2044 309
2045 308
2046 308
2047 307
2048 307
2049 307
2050 306
Source: California Air Resources Board, EMFAC2017 User’s Guide, March 1, 2018, https://ww3.arb.ca.gov/msei/downloads/emfac2017-volume-i-users-guide.pdf and https://www.arb.ca.gov/emfac/2017/ and California Air Resources Board California Climate Investments Quantification Emission factor database (cci_emissionfactordatabase_111419.xls).

Inglewood Transit Connector TIRCP Benefits Calculator Tool Memorandum
Page 6 of 6
Table 4: Estimated GHG Emission Reductions by Mode for Project Lifetime
Parameter Metrolink Metro HR Metro LR
Metro BRT/RB Metro MB ITC Total
Total GHG Emission Reductions (MTCO2) 33,292 11,715 567,221 65,906 25,824 64,965 768,922
Passenger VMT Reductions (miles) 108,707,174 38,252,799 1,706,008,525 196,941,100 77,053,150 195,463,700 2,322,426,448
Fossil Fuel Use Reductions (gallons) 2,712,433 954,474 48,194,707 5,617,165 2,202,509 5,518,828 65,200,116
ROG Emission Reductions (pounds) 587 207 19,764 2,382 941 2,259 26,139
NOx Emission Reductions (pounds) 4,266 1,501 97,512 11,548 4,544 11,156 130,527
PM2.5 Emission Reductions (pounds) 4,395 1,547 70,164 8,111 3,174 8,038 95,430
Diesel PM Emission Reductions (pounds) 5.00 1.76 121 14.4 5.67 13.9 162
Source: RCH Group based on TIRCP Benefits Calculator Tool and Raju Associates, TIRCP Unlinked Trips Tables, January 7, 2020.

Attachment E
Operational Emissions CalEEMod Output Files
Adjusted Baseline
- Annual
- Summer
- Winter
Existing Conditions
- Annual
- Summer
- Winter
MSF Building and APM Stations
- Annual
- Summer
- Winter

Project Characteristics -
Land Use -
Construction Phase - Adjusted Baseline, no construction
Vehicle Trips - Using EMFAC for motor vehicle emissions
Grading -
1.1 Land Usage
Land Uses Size Metric Lot Acreage Floor Surface Area Population
General Office Building 466.00 1000sqft 10.70 466,000.00 0
Apartments Mid Rise 314.00 Dwelling Unit 8.26 314,000.00 898
Regional Shopping Center 518.08 1000sqft 11.89 518,080.00 0
1.2 Other Project Characteristics
Urbanization
Climate Zone
Urban
8
Wind Speed (m/s) Precipitation Freq (Days)2.2 31
1.3 User Entered Comments & Non-Default Data
1.0 Project Characteristics
Utility Company Southern California Edison
2020Operational Year
CO2 Intensity (lb/MWhr)
702.44 0.029CH4 Intensity (lb/MWhr)
0.006N2O Intensity (lb/MWhr)
ITC Adjusted BaselineSouth Coast Air Basin, Annual
CalEEMod Version: CalEEMod.2016.3.2 Date: 8/28/2020 12:02 PMPage 1 of 31
ITC Adjusted Baseline - South Coast Air Basin, Annual

2.0 Emissions Summary
Table Name Column Name Default Value New Value
tblConstructionPhase NumDays 30.00 0.00
tblConstructionPhase NumDays 20.00 0.00
tblConstructionPhase NumDays 45.00 0.00
tblConstructionPhase NumDays 500.00 0.00
tblConstructionPhase NumDays 35.00 0.00
tblConstructionPhase NumDays 35.00 0.00
tblVehicleTrips HO_TL 8.70 0.00
tblVehicleTrips HO_TTP 40.60 0.00
tblVehicleTrips HS_TL 5.90 0.00
tblVehicleTrips HS_TTP 19.20 0.00
tblVehicleTrips HW_TL 14.70 0.00
tblVehicleTrips HW_TTP 40.20 0.00
tblVehicleTrips ST_TR 6.39 0.00
tblVehicleTrips ST_TR 2.46 0.00
tblVehicleTrips ST_TR 49.97 0.00
tblVehicleTrips SU_TR 5.86 0.00
tblVehicleTrips SU_TR 1.05 0.00
tblVehicleTrips SU_TR 25.24 0.00
tblVehicleTrips WD_TR 6.65 0.00
tblVehicleTrips WD_TR 11.03 0.00
tblVehicleTrips WD_TR 42.70 0.00
CalEEMod Version: CalEEMod.2016.3.2 Date: 8/28/2020 12:02 PMPage 2 of 31
ITC Adjusted Baseline - South Coast Air Basin, Annual

2.1 Overall Construction
ROG NOx CO SO2 Fugitive PM10
Exhaust PM10
PM10 Total
Fugitive PM2.5
Exhaust PM2.5
PM2.5 Total
Bio- CO2 NBio- CO2 Total CO2 CH4 N2O CO2e
Year tons/yr MT/yr
2018 0.0000 0.0000 0.0000 0.0000 0.0000 0.0000 0.0000 0.0000 0.0000 0.0000 0.0000 0.0000 0.0000 0.0000 0.0000 0.0000
2021 0.0000 0.0000 0.0000 0.0000 0.0000 0.0000 0.0000 0.0000 0.0000 0.0000 0.0000 0.0000 0.0000 0.0000 0.0000 0.0000
2027 0.0000 0.0000 0.0000 0.0000 0.0000 0.0000 0.0000 0.0000 0.0000 0.0000 0.0000 0.0000 0.0000 0.0000 0.0000 0.0000
2086 0.0000 0.0000 0.0000 0.0000 0.0000 0.0000 0.0000 0.0000 0.0000 0.0000 0.0000 0.0000 0.0000 0.0000 0.0000 0.0000
2090 0.0000 0.0000 0.0000 0.0000 0.0000 0.0000 0.0000 0.0000 0.0000 0.0000 0.0000 0.0000 0.0000 0.0000 0.0000 0.0000
Maximum 0.0000 0.0000 0.0000 0.0000 0.0000 0.0000 0.0000 0.0000 0.0000 0.0000 0.0000 0.0000 0.0000 0.0000 0.0000 0.0000
Unmitigated Construction
CalEEMod Version: CalEEMod.2016.3.2 Date: 8/28/2020 12:02 PMPage 3 of 31
ITC Adjusted Baseline - South Coast Air Basin, Annual

2.1 Overall Construction
ROG NOx CO SO2 Fugitive PM10
Exhaust PM10
PM10 Total
Fugitive PM2.5
Exhaust PM2.5
PM2.5 Total
Bio- CO2 NBio- CO2 Total CO2 CH4 N2O CO2e
Year tons/yr MT/yr
2018 0.0000 0.0000 0.0000 0.0000 0.0000 0.0000 0.0000 0.0000 0.0000 0.0000 0.0000 0.0000 0.0000 0.0000 0.0000 0.0000
2021 0.0000 0.0000 0.0000 0.0000 0.0000 0.0000 0.0000 0.0000 0.0000 0.0000 0.0000 0.0000 0.0000 0.0000 0.0000 0.0000
2027 0.0000 0.0000 0.0000 0.0000 0.0000 0.0000 0.0000 0.0000 0.0000 0.0000 0.0000 0.0000 0.0000 0.0000 0.0000 0.0000
2086 0.0000 0.0000 0.0000 0.0000 0.0000 0.0000 0.0000 0.0000 0.0000 0.0000 0.0000 0.0000 0.0000 0.0000 0.0000 0.0000
2090 0.0000 0.0000 0.0000 0.0000 0.0000 0.0000 0.0000 0.0000 0.0000 0.0000 0.0000 0.0000 0.0000 0.0000 0.0000 0.0000
Maximum 0.0000 0.0000 0.0000 0.0000 0.0000 0.0000 0.0000 0.0000 0.0000 0.0000 0.0000 0.0000 0.0000 0.0000 0.0000 0.0000
Mitigated Construction
ROG NOx CO SO2 Fugitive PM10
Exhaust PM10
PM10 Total
Fugitive PM2.5
Exhaust PM2.5
PM2.5 Total
Bio- CO2 NBio-CO2 Total CO2 CH4 N20 CO2e
Percent Reduction
0.00 0.00 0.00 0.00 0.00 0.00 0.00 0.00 0.00 0.00 0.00 0.00 0.00 0.00 0.00 0.00
Quarter Start Date End Date Maximum Unmitigated ROG + NOX (tons/quarter) Maximum Mitigated ROG + NOX (tons/quarter)
Highest
CalEEMod Version: CalEEMod.2016.3.2 Date: 8/28/2020 12:02 PMPage 4 of 31
ITC Adjusted Baseline - South Coast Air Basin, Annual

2.2 Overall Operational
ROG NOx CO SO2 Fugitive PM10
Exhaust PM10
PM10 Total
Fugitive PM2.5
Exhaust PM2.5
PM2.5 Total
Bio- CO2 NBio- CO2 Total CO2 CH4 N2O CO2e
Category tons/yr MT/yr
Area 6.3736 0.1191 5.2576 5.2600e-003
0.3177 0.3177 0.3177 0.3177 33.3528 69.4065 102.7593 0.1047 2.2600e-003
106.0511
Energy 0.0479 0.4249 0.2884 2.6100e-003
0.0331 0.0331 0.0331 0.0331 0.0000 4,837.3993
4,837.3993
0.1892 0.0460 4,855.8264
Mobile 0.0000 0.0000 0.0000 0.0000 0.0000 0.0000 0.0000 0.0000 0.0000 0.0000 0.0000 0.0000 0.0000 0.0000 0.0000 0.0000
Waste 0.0000 0.0000 0.0000 0.0000 227.7153 0.0000 227.7153 13.4576 0.0000 564.1549
Water 0.0000 0.0000 0.0000 0.0000 44.9415 896.3168 941.2582 4.6529 0.1167 1,092.3424
Total 6.4215 0.5441 5.5460 7.8700e-003
0.0000 0.3508 0.3508 0.0000 0.3508 0.3508 306.0095 5,803.1226
6,109.1322
18.4044 0.1649 6,618.3749
Unmitigated Operational
CalEEMod Version: CalEEMod.2016.3.2 Date: 8/28/2020 12:02 PMPage 5 of 31
ITC Adjusted Baseline - South Coast Air Basin, Annual

2.2 Overall Operational
ROG NOx CO SO2 Fugitive PM10
Exhaust PM10
PM10 Total
Fugitive PM2.5
Exhaust PM2.5
PM2.5 Total
Bio- CO2 NBio- CO2 Total CO2 CH4 N2O CO2e
Category tons/yr MT/yr
Area 6.3736 0.1191 5.2576 5.2600e-003
0.3177 0.3177 0.3177 0.3177 33.3528 69.4065 102.7593 0.1047 2.2600e-003
106.0511
Energy 0.0479 0.4249 0.2884 2.6100e-003
0.0331 0.0331 0.0331 0.0331 0.0000 4,837.3993
4,837.3993
0.1892 0.0460 4,855.8264
Mobile 0.0000 0.0000 0.0000 0.0000 0.0000 0.0000 0.0000 0.0000 0.0000 0.0000 0.0000 0.0000 0.0000 0.0000 0.0000 0.0000
Waste 0.0000 0.0000 0.0000 0.0000 227.7153 0.0000 227.7153 13.4576 0.0000 564.1549
Water 0.0000 0.0000 0.0000 0.0000 44.9415 896.3168 941.2582 4.6529 0.1167 1,092.3424
Total 6.4215 0.5441 5.5460 7.8700e-003
0.0000 0.3508 0.3508 0.0000 0.3508 0.3508 306.0095 5,803.1226
6,109.1322
18.4044 0.1649 6,618.3749
Mitigated Operational
3.0 Construction Detail
Construction Phase
ROG NOx CO SO2 Fugitive PM10
Exhaust PM10
PM10 Total
Fugitive PM2.5
Exhaust PM2.5
PM2.5 Total
Bio- CO2 NBio-CO2 Total CO2 CH4 N20 CO2e
Percent Reduction
0.00 0.00 0.00 0.00 0.00 0.00 0.00 0.00 0.00 0.00 0.00 0.00 0.00 0.00 0.00 0.00
CalEEMod Version: CalEEMod.2016.3.2 Date: 8/28/2020 12:02 PMPage 6 of 31
ITC Adjusted Baseline - South Coast Air Basin, Annual

Phase Number
Phase Name Phase Type Start Date End Date Num Days Week
Num Days Phase Description
1 Demolition Demolition 1/1/2015 12/31/2014 5 0
2 Site Preparation Site Preparation 11/1/2018 10/31/2018 5 0
3 Grading Grading 2/18/2021 2/17/2021 5 0
4 Building Construction Building Construction 1/28/2027 1/27/2027 5 0
5 Paving Paving 6/27/2086 6/26/2086 5 0
6 Architectural Coating Architectural Coating 9/14/2090 9/13/2090 5 0
OffRoad Equipment
Residential Indoor: 635,850; Residential Outdoor: 211,950; Non-Residential Indoor: 1,476,120; Non-Residential Outdoor: 492,040; Striped Parking Area: 0 (Architectural Coating – sqft)
Acres of Grading (Site Preparation Phase): 0
Acres of Grading (Grading Phase): 0
Acres of Paving: 0
CalEEMod Version: CalEEMod.2016.3.2 Date: 8/28/2020 12:02 PMPage 7 of 31
ITC Adjusted Baseline - South Coast Air Basin, Annual

Phase Name Offroad Equipment Type Amount Usage Hours Horse Power Load Factor
Demolition Concrete/Industrial Saws 1 8.00 81 0.73
Demolition Excavators 3 8.00 158 0.38
Demolition Rubber Tired Dozers 2 8.00 247 0.40
Site Preparation Rubber Tired Dozers 3 8.00 247 0.40
Site Preparation Tractors/Loaders/Backhoes 4 8.00 97 0.37
Grading Excavators 2 8.00 158 0.38
Grading Graders 1 8.00 187 0.41
Grading Rubber Tired Dozers 1 8.00 247 0.40
Grading Scrapers 2 8.00 367 0.48
Grading Tractors/Loaders/Backhoes 2 8.00 97 0.37
Building Construction Cranes 1 7.00 231 0.29
Building Construction Forklifts 3 8.00 89 0.20
Building Construction Generator Sets 1 8.00 84 0.74
Building Construction Tractors/Loaders/Backhoes 3 7.00 97 0.37
Building Construction Welders 1 8.00 46 0.45
Paving Pavers 2 8.00 130 0.42
Paving Paving Equipment 2 8.00 132 0.36
Paving Rollers 2 8.00 80 0.38
Architectural Coating Air Compressors 1 6.00 78 0.48
Trips and VMT
CalEEMod Version: CalEEMod.2016.3.2 Date: 8/28/2020 12:02 PMPage 8 of 31
ITC Adjusted Baseline - South Coast Air Basin, Annual

3.3 Site Preparation - 2018
ROG NOx CO SO2 Fugitive PM10
Exhaust PM10
PM10 Total
Fugitive PM2.5
Exhaust PM2.5
PM2.5 Total
Bio- CO2 NBio- CO2 Total CO2 CH4 N2O CO2e
Category tons/yr MT/yr
Fugitive Dust 0.0000 0.0000 0.0000 0.0000 0.0000 0.0000 0.0000 0.0000 0.0000 0.0000 0.0000 0.0000 0.0000 0.0000 0.0000 0.0000
Off-Road 0.0000 0.0000 0.0000 0.0000 0.0000 0.0000 0.0000 0.0000 0.0000 0.0000 0.0000 0.0000 0.0000 0.0000 0.0000 0.0000
Total 0.0000 0.0000 0.0000 0.0000 0.0000 0.0000 0.0000 0.0000 0.0000 0.0000 0.0000 0.0000 0.0000 0.0000 0.0000 0.0000
Unmitigated Construction On-Site
3.1 Mitigation Measures Construction
Phase Name Offroad Equipment Count
Worker Trip Number
Vendor Trip Number
Hauling Trip Number
Worker Trip Length
Vendor Trip Length
Hauling Trip Length
Worker Vehicle Class
Vendor Vehicle Class
Hauling Vehicle Class
Demolition 6 15.00 0.00 0.00 14.70 6.90 20.00 LD_Mix HDT_Mix HHDT
Site Preparation 7 18.00 0.00 0.00 14.70 6.90 20.00 LD_Mix HDT_Mix HHDT
Grading 8 20.00 0.00 0.00 14.70 6.90 20.00 LD_Mix HDT_Mix HHDT
Building Construction 9 541.00 195.00 0.00 14.70 6.90 20.00 LD_Mix HDT_Mix HHDT
Paving 6 15.00 0.00 0.00 14.70 6.90 20.00 LD_Mix HDT_Mix HHDT
Architectural Coating 1 108.00 0.00 0.00 14.70 6.90 20.00 LD_Mix HDT_Mix HHDT
CalEEMod Version: CalEEMod.2016.3.2 Date: 8/28/2020 12:02 PMPage 9 of 31
ITC Adjusted Baseline - South Coast Air Basin, Annual

3.3 Site Preparation - 2018
ROG NOx CO SO2 Fugitive PM10
Exhaust PM10
PM10 Total
Fugitive PM2.5
Exhaust PM2.5
PM2.5 Total
Bio- CO2 NBio- CO2 Total CO2 CH4 N2O CO2e
Category tons/yr MT/yr
Hauling 0.0000 0.0000 0.0000 0.0000 0.0000 0.0000 0.0000 0.0000 0.0000 0.0000 0.0000 0.0000 0.0000 0.0000 0.0000 0.0000
Vendor 0.0000 0.0000 0.0000 0.0000 0.0000 0.0000 0.0000 0.0000 0.0000 0.0000 0.0000 0.0000 0.0000 0.0000 0.0000 0.0000
Worker 0.0000 0.0000 0.0000 0.0000 0.0000 0.0000 0.0000 0.0000 0.0000 0.0000 0.0000 0.0000 0.0000 0.0000 0.0000 0.0000
Total 0.0000 0.0000 0.0000 0.0000 0.0000 0.0000 0.0000 0.0000 0.0000 0.0000 0.0000 0.0000 0.0000 0.0000 0.0000 0.0000
Unmitigated Construction Off-Site
ROG NOx CO SO2 Fugitive PM10
Exhaust PM10
PM10 Total
Fugitive PM2.5
Exhaust PM2.5
PM2.5 Total
Bio- CO2 NBio- CO2 Total CO2 CH4 N2O CO2e
Category tons/yr MT/yr
Fugitive Dust 0.0000 0.0000 0.0000 0.0000 0.0000 0.0000 0.0000 0.0000 0.0000 0.0000 0.0000 0.0000 0.0000 0.0000 0.0000 0.0000
Off-Road 0.0000 0.0000 0.0000 0.0000 0.0000 0.0000 0.0000 0.0000 0.0000 0.0000 0.0000 0.0000 0.0000 0.0000 0.0000 0.0000
Total 0.0000 0.0000 0.0000 0.0000 0.0000 0.0000 0.0000 0.0000 0.0000 0.0000 0.0000 0.0000 0.0000 0.0000 0.0000 0.0000
Mitigated Construction On-Site
CalEEMod Version: CalEEMod.2016.3.2 Date: 8/28/2020 12:02 PMPage 10 of 31
ITC Adjusted Baseline - South Coast Air Basin, Annual

3.3 Site Preparation - 2018
ROG NOx CO SO2 Fugitive PM10
Exhaust PM10
PM10 Total
Fugitive PM2.5
Exhaust PM2.5
PM2.5 Total
Bio- CO2 NBio- CO2 Total CO2 CH4 N2O CO2e
Category tons/yr MT/yr
Hauling 0.0000 0.0000 0.0000 0.0000 0.0000 0.0000 0.0000 0.0000 0.0000 0.0000 0.0000 0.0000 0.0000 0.0000 0.0000 0.0000
Vendor 0.0000 0.0000 0.0000 0.0000 0.0000 0.0000 0.0000 0.0000 0.0000 0.0000 0.0000 0.0000 0.0000 0.0000 0.0000 0.0000
Worker 0.0000 0.0000 0.0000 0.0000 0.0000 0.0000 0.0000 0.0000 0.0000 0.0000 0.0000 0.0000 0.0000 0.0000 0.0000 0.0000
Total 0.0000 0.0000 0.0000 0.0000 0.0000 0.0000 0.0000 0.0000 0.0000 0.0000 0.0000 0.0000 0.0000 0.0000 0.0000 0.0000
Mitigated Construction Off-Site
3.4 Grading - 2021
ROG NOx CO SO2 Fugitive PM10
Exhaust PM10
PM10 Total
Fugitive PM2.5
Exhaust PM2.5
PM2.5 Total
Bio- CO2 NBio- CO2 Total CO2 CH4 N2O CO2e
Category tons/yr MT/yr
Fugitive Dust 0.0000 0.0000 0.0000 0.0000 0.0000 0.0000 0.0000 0.0000 0.0000 0.0000 0.0000 0.0000 0.0000 0.0000 0.0000 0.0000
Off-Road 0.0000 0.0000 0.0000 0.0000 0.0000 0.0000 0.0000 0.0000 0.0000 0.0000 0.0000 0.0000 0.0000 0.0000 0.0000 0.0000
Total 0.0000 0.0000 0.0000 0.0000 0.0000 0.0000 0.0000 0.0000 0.0000 0.0000 0.0000 0.0000 0.0000 0.0000 0.0000 0.0000
Unmitigated Construction On-Site
CalEEMod Version: CalEEMod.2016.3.2 Date: 8/28/2020 12:02 PMPage 11 of 31
ITC Adjusted Baseline - South Coast Air Basin, Annual

3.4 Grading - 2021
ROG NOx CO SO2 Fugitive PM10
Exhaust PM10
PM10 Total
Fugitive PM2.5
Exhaust PM2.5
PM2.5 Total
Bio- CO2 NBio- CO2 Total CO2 CH4 N2O CO2e
Category tons/yr MT/yr
Hauling 0.0000 0.0000 0.0000 0.0000 0.0000 0.0000 0.0000 0.0000 0.0000 0.0000 0.0000 0.0000 0.0000 0.0000 0.0000 0.0000
Vendor 0.0000 0.0000 0.0000 0.0000 0.0000 0.0000 0.0000 0.0000 0.0000 0.0000 0.0000 0.0000 0.0000 0.0000 0.0000 0.0000
Worker 0.0000 0.0000 0.0000 0.0000 0.0000 0.0000 0.0000 0.0000 0.0000 0.0000 0.0000 0.0000 0.0000 0.0000 0.0000 0.0000
Total 0.0000 0.0000 0.0000 0.0000 0.0000 0.0000 0.0000 0.0000 0.0000 0.0000 0.0000 0.0000 0.0000 0.0000 0.0000 0.0000
Unmitigated Construction Off-Site
ROG NOx CO SO2 Fugitive PM10
Exhaust PM10
PM10 Total
Fugitive PM2.5
Exhaust PM2.5
PM2.5 Total
Bio- CO2 NBio- CO2 Total CO2 CH4 N2O CO2e
Category tons/yr MT/yr
Fugitive Dust 0.0000 0.0000 0.0000 0.0000 0.0000 0.0000 0.0000 0.0000 0.0000 0.0000 0.0000 0.0000 0.0000 0.0000 0.0000 0.0000
Off-Road 0.0000 0.0000 0.0000 0.0000 0.0000 0.0000 0.0000 0.0000 0.0000 0.0000 0.0000 0.0000 0.0000 0.0000 0.0000 0.0000
Total 0.0000 0.0000 0.0000 0.0000 0.0000 0.0000 0.0000 0.0000 0.0000 0.0000 0.0000 0.0000 0.0000 0.0000 0.0000 0.0000
Mitigated Construction On-Site
CalEEMod Version: CalEEMod.2016.3.2 Date: 8/28/2020 12:02 PMPage 12 of 31
ITC Adjusted Baseline - South Coast Air Basin, Annual

3.4 Grading - 2021
ROG NOx CO SO2 Fugitive PM10
Exhaust PM10
PM10 Total
Fugitive PM2.5
Exhaust PM2.5
PM2.5 Total
Bio- CO2 NBio- CO2 Total CO2 CH4 N2O CO2e
Category tons/yr MT/yr
Hauling 0.0000 0.0000 0.0000 0.0000 0.0000 0.0000 0.0000 0.0000 0.0000 0.0000 0.0000 0.0000 0.0000 0.0000 0.0000 0.0000
Vendor 0.0000 0.0000 0.0000 0.0000 0.0000 0.0000 0.0000 0.0000 0.0000 0.0000 0.0000 0.0000 0.0000 0.0000 0.0000 0.0000
Worker 0.0000 0.0000 0.0000 0.0000 0.0000 0.0000 0.0000 0.0000 0.0000 0.0000 0.0000 0.0000 0.0000 0.0000 0.0000 0.0000
Total 0.0000 0.0000 0.0000 0.0000 0.0000 0.0000 0.0000 0.0000 0.0000 0.0000 0.0000 0.0000 0.0000 0.0000 0.0000 0.0000
Mitigated Construction Off-Site
3.5 Building Construction - 2027
ROG NOx CO SO2 Fugitive PM10
Exhaust PM10
PM10 Total
Fugitive PM2.5
Exhaust PM2.5
PM2.5 Total
Bio- CO2 NBio- CO2 Total CO2 CH4 N2O CO2e
Category tons/yr MT/yr
Off-Road 0.0000 0.0000 0.0000 0.0000 0.0000 0.0000 0.0000 0.0000 0.0000 0.0000 0.0000 0.0000 0.0000 0.0000 0.0000 0.0000
Total 0.0000 0.0000 0.0000 0.0000 0.0000 0.0000 0.0000 0.0000 0.0000 0.0000 0.0000 0.0000 0.0000 0.0000 0.0000 0.0000
Unmitigated Construction On-Site
CalEEMod Version: CalEEMod.2016.3.2 Date: 8/28/2020 12:02 PMPage 13 of 31
ITC Adjusted Baseline - South Coast Air Basin, Annual

3.5 Building Construction - 2027
ROG NOx CO SO2 Fugitive PM10
Exhaust PM10
PM10 Total
Fugitive PM2.5
Exhaust PM2.5
PM2.5 Total
Bio- CO2 NBio- CO2 Total CO2 CH4 N2O CO2e
Category tons/yr MT/yr
Hauling 0.0000 0.0000 0.0000 0.0000 0.0000 0.0000 0.0000 0.0000 0.0000 0.0000 0.0000 0.0000 0.0000 0.0000 0.0000 0.0000
Vendor 0.0000 0.0000 0.0000 0.0000 0.0000 0.0000 0.0000 0.0000 0.0000 0.0000 0.0000 0.0000 0.0000 0.0000 0.0000 0.0000
Worker 0.0000 0.0000 0.0000 0.0000 0.0000 0.0000 0.0000 0.0000 0.0000 0.0000 0.0000 0.0000 0.0000 0.0000 0.0000 0.0000
Total 0.0000 0.0000 0.0000 0.0000 0.0000 0.0000 0.0000 0.0000 0.0000 0.0000 0.0000 0.0000 0.0000 0.0000 0.0000 0.0000
Unmitigated Construction Off-Site
ROG NOx CO SO2 Fugitive PM10
Exhaust PM10
PM10 Total
Fugitive PM2.5
Exhaust PM2.5
PM2.5 Total
Bio- CO2 NBio- CO2 Total CO2 CH4 N2O CO2e
Category tons/yr MT/yr
Off-Road 0.0000 0.0000 0.0000 0.0000 0.0000 0.0000 0.0000 0.0000 0.0000 0.0000 0.0000 0.0000 0.0000 0.0000 0.0000 0.0000
Total 0.0000 0.0000 0.0000 0.0000 0.0000 0.0000 0.0000 0.0000 0.0000 0.0000 0.0000 0.0000 0.0000 0.0000 0.0000 0.0000
Mitigated Construction On-Site
CalEEMod Version: CalEEMod.2016.3.2 Date: 8/28/2020 12:02 PMPage 14 of 31
ITC Adjusted Baseline - South Coast Air Basin, Annual

3.5 Building Construction - 2027
ROG NOx CO SO2 Fugitive PM10
Exhaust PM10
PM10 Total
Fugitive PM2.5
Exhaust PM2.5
PM2.5 Total
Bio- CO2 NBio- CO2 Total CO2 CH4 N2O CO2e
Category tons/yr MT/yr
Hauling 0.0000 0.0000 0.0000 0.0000 0.0000 0.0000 0.0000 0.0000 0.0000 0.0000 0.0000 0.0000 0.0000 0.0000 0.0000 0.0000
Vendor 0.0000 0.0000 0.0000 0.0000 0.0000 0.0000 0.0000 0.0000 0.0000 0.0000 0.0000 0.0000 0.0000 0.0000 0.0000 0.0000
Worker 0.0000 0.0000 0.0000 0.0000 0.0000 0.0000 0.0000 0.0000 0.0000 0.0000 0.0000 0.0000 0.0000 0.0000 0.0000 0.0000
Total 0.0000 0.0000 0.0000 0.0000 0.0000 0.0000 0.0000 0.0000 0.0000 0.0000 0.0000 0.0000 0.0000 0.0000 0.0000 0.0000
Mitigated Construction Off-Site
3.6 Paving - 2086
ROG NOx CO SO2 Fugitive PM10
Exhaust PM10
PM10 Total
Fugitive PM2.5
Exhaust PM2.5
PM2.5 Total
Bio- CO2 NBio- CO2 Total CO2 CH4 N2O CO2e
Category tons/yr MT/yr
Off-Road 0.0000 0.0000 0.0000 0.0000 0.0000 0.0000 0.0000 0.0000 0.0000 0.0000 0.0000 0.0000 0.0000 0.0000 0.0000 0.0000
Paving 0.0000 0.0000 0.0000 0.0000 0.0000 0.0000 0.0000 0.0000 0.0000 0.0000 0.0000 0.0000 0.0000 0.0000 0.0000 0.0000
Total 0.0000 0.0000 0.0000 0.0000 0.0000 0.0000 0.0000 0.0000 0.0000 0.0000 0.0000 0.0000 0.0000 0.0000 0.0000 0.0000
Unmitigated Construction On-Site
CalEEMod Version: CalEEMod.2016.3.2 Date: 8/28/2020 12:02 PMPage 15 of 31
ITC Adjusted Baseline - South Coast Air Basin, Annual

3.6 Paving - 2086
ROG NOx CO SO2 Fugitive PM10
Exhaust PM10
PM10 Total
Fugitive PM2.5
Exhaust PM2.5
PM2.5 Total
Bio- CO2 NBio- CO2 Total CO2 CH4 N2O CO2e
Category tons/yr MT/yr
Hauling 0.0000 0.0000 0.0000 0.0000 0.0000 0.0000 0.0000 0.0000 0.0000 0.0000 0.0000 0.0000 0.0000 0.0000 0.0000 0.0000
Vendor 0.0000 0.0000 0.0000 0.0000 0.0000 0.0000 0.0000 0.0000 0.0000 0.0000 0.0000 0.0000 0.0000 0.0000 0.0000 0.0000
Worker 0.0000 0.0000 0.0000 0.0000 0.0000 0.0000 0.0000 0.0000 0.0000 0.0000 0.0000 0.0000 0.0000 0.0000 0.0000 0.0000
Total 0.0000 0.0000 0.0000 0.0000 0.0000 0.0000 0.0000 0.0000 0.0000 0.0000 0.0000 0.0000 0.0000 0.0000 0.0000 0.0000
Unmitigated Construction Off-Site
ROG NOx CO SO2 Fugitive PM10
Exhaust PM10
PM10 Total
Fugitive PM2.5
Exhaust PM2.5
PM2.5 Total
Bio- CO2 NBio- CO2 Total CO2 CH4 N2O CO2e
Category tons/yr MT/yr
Off-Road 0.0000 0.0000 0.0000 0.0000 0.0000 0.0000 0.0000 0.0000 0.0000 0.0000 0.0000 0.0000 0.0000 0.0000 0.0000 0.0000
Paving 0.0000 0.0000 0.0000 0.0000 0.0000 0.0000 0.0000 0.0000 0.0000 0.0000 0.0000 0.0000 0.0000 0.0000 0.0000 0.0000
Total 0.0000 0.0000 0.0000 0.0000 0.0000 0.0000 0.0000 0.0000 0.0000 0.0000 0.0000 0.0000 0.0000 0.0000 0.0000 0.0000
Mitigated Construction On-Site
CalEEMod Version: CalEEMod.2016.3.2 Date: 8/28/2020 12:02 PMPage 16 of 31
ITC Adjusted Baseline - South Coast Air Basin, Annual

3.6 Paving - 2086
ROG NOx CO SO2 Fugitive PM10
Exhaust PM10
PM10 Total
Fugitive PM2.5
Exhaust PM2.5
PM2.5 Total
Bio- CO2 NBio- CO2 Total CO2 CH4 N2O CO2e
Category tons/yr MT/yr
Hauling 0.0000 0.0000 0.0000 0.0000 0.0000 0.0000 0.0000 0.0000 0.0000 0.0000 0.0000 0.0000 0.0000 0.0000 0.0000 0.0000
Vendor 0.0000 0.0000 0.0000 0.0000 0.0000 0.0000 0.0000 0.0000 0.0000 0.0000 0.0000 0.0000 0.0000 0.0000 0.0000 0.0000
Worker 0.0000 0.0000 0.0000 0.0000 0.0000 0.0000 0.0000 0.0000 0.0000 0.0000 0.0000 0.0000 0.0000 0.0000 0.0000 0.0000
Total 0.0000 0.0000 0.0000 0.0000 0.0000 0.0000 0.0000 0.0000 0.0000 0.0000 0.0000 0.0000 0.0000 0.0000 0.0000 0.0000
Mitigated Construction Off-Site
3.7 Architectural Coating - 2090
ROG NOx CO SO2 Fugitive PM10
Exhaust PM10
PM10 Total
Fugitive PM2.5
Exhaust PM2.5
PM2.5 Total
Bio- CO2 NBio- CO2 Total CO2 CH4 N2O CO2e
Category tons/yr MT/yr
Archit. Coating 0.0000 0.0000 0.0000 0.0000 0.0000 0.0000 0.0000 0.0000 0.0000 0.0000 0.0000 0.0000 0.0000 0.0000 0.0000 0.0000
Off-Road 0.0000 0.0000 0.0000 0.0000 0.0000 0.0000 0.0000 0.0000 0.0000 0.0000 0.0000 0.0000 0.0000 0.0000 0.0000 0.0000
Total 0.0000 0.0000 0.0000 0.0000 0.0000 0.0000 0.0000 0.0000 0.0000 0.0000 0.0000 0.0000 0.0000 0.0000 0.0000 0.0000
Unmitigated Construction On-Site
CalEEMod Version: CalEEMod.2016.3.2 Date: 8/28/2020 12:02 PMPage 17 of 31
ITC Adjusted Baseline - South Coast Air Basin, Annual

3.7 Architectural Coating - 2090
ROG NOx CO SO2 Fugitive PM10
Exhaust PM10
PM10 Total
Fugitive PM2.5
Exhaust PM2.5
PM2.5 Total
Bio- CO2 NBio- CO2 Total CO2 CH4 N2O CO2e
Category tons/yr MT/yr
Hauling 0.0000 0.0000 0.0000 0.0000 0.0000 0.0000 0.0000 0.0000 0.0000 0.0000 0.0000 0.0000 0.0000 0.0000 0.0000 0.0000
Vendor 0.0000 0.0000 0.0000 0.0000 0.0000 0.0000 0.0000 0.0000 0.0000 0.0000 0.0000 0.0000 0.0000 0.0000 0.0000 0.0000
Worker 0.0000 0.0000 0.0000 0.0000 0.0000 0.0000 0.0000 0.0000 0.0000 0.0000 0.0000 0.0000 0.0000 0.0000 0.0000 0.0000
Total 0.0000 0.0000 0.0000 0.0000 0.0000 0.0000 0.0000 0.0000 0.0000 0.0000 0.0000 0.0000 0.0000 0.0000 0.0000 0.0000
Unmitigated Construction Off-Site
ROG NOx CO SO2 Fugitive PM10
Exhaust PM10
PM10 Total
Fugitive PM2.5
Exhaust PM2.5
PM2.5 Total
Bio- CO2 NBio- CO2 Total CO2 CH4 N2O CO2e
Category tons/yr MT/yr
Archit. Coating 0.0000 0.0000 0.0000 0.0000 0.0000 0.0000 0.0000 0.0000 0.0000 0.0000 0.0000 0.0000 0.0000 0.0000 0.0000 0.0000
Off-Road 0.0000 0.0000 0.0000 0.0000 0.0000 0.0000 0.0000 0.0000 0.0000 0.0000 0.0000 0.0000 0.0000 0.0000 0.0000 0.0000
Total 0.0000 0.0000 0.0000 0.0000 0.0000 0.0000 0.0000 0.0000 0.0000 0.0000 0.0000 0.0000 0.0000 0.0000 0.0000 0.0000
Mitigated Construction On-Site
CalEEMod Version: CalEEMod.2016.3.2 Date: 8/28/2020 12:02 PMPage 18 of 31
ITC Adjusted Baseline - South Coast Air Basin, Annual

4.0 Operational Detail - Mobile
4.1 Mitigation Measures Mobile
3.7 Architectural Coating - 2090
ROG NOx CO SO2 Fugitive PM10
Exhaust PM10
PM10 Total
Fugitive PM2.5
Exhaust PM2.5
PM2.5 Total
Bio- CO2 NBio- CO2 Total CO2 CH4 N2O CO2e
Category tons/yr MT/yr
Hauling 0.0000 0.0000 0.0000 0.0000 0.0000 0.0000 0.0000 0.0000 0.0000 0.0000 0.0000 0.0000 0.0000 0.0000 0.0000 0.0000
Vendor 0.0000 0.0000 0.0000 0.0000 0.0000 0.0000 0.0000 0.0000 0.0000 0.0000 0.0000 0.0000 0.0000 0.0000 0.0000 0.0000
Worker 0.0000 0.0000 0.0000 0.0000 0.0000 0.0000 0.0000 0.0000 0.0000 0.0000 0.0000 0.0000 0.0000 0.0000 0.0000 0.0000
Total 0.0000 0.0000 0.0000 0.0000 0.0000 0.0000 0.0000 0.0000 0.0000 0.0000 0.0000 0.0000 0.0000 0.0000 0.0000 0.0000
Mitigated Construction Off-Site
CalEEMod Version: CalEEMod.2016.3.2 Date: 8/28/2020 12:02 PMPage 19 of 31
ITC Adjusted Baseline - South Coast Air Basin, Annual

ROG NOx CO SO2 Fugitive PM10
Exhaust PM10
PM10 Total
Fugitive PM2.5
Exhaust PM2.5
PM2.5 Total
Bio- CO2 NBio- CO2 Total CO2 CH4 N2O CO2e
Category tons/yr MT/yr
Mitigated 0.0000 0.0000 0.0000 0.0000 0.0000 0.0000 0.0000 0.0000 0.0000 0.0000 0.0000 0.0000 0.0000 0.0000 0.0000 0.0000
Unmitigated 0.0000 0.0000 0.0000 0.0000 0.0000 0.0000 0.0000 0.0000 0.0000 0.0000 0.0000 0.0000 0.0000 0.0000 0.0000 0.0000
4.2 Trip Summary Information
4.3 Trip Type Information
Average Daily Trip Rate Unmitigated Mitigated
Land Use Weekday Saturday Sunday Annual VMT Annual VMT
Apartments Mid Rise 0.00 0.00 0.00
General Office Building 0.00 0.00 0.00
Regional Shopping Center 0.00 0.00 0.00
Total 0.00 0.00 0.00
Miles Trip % Trip Purpose %
Land Use H-W or C-W H-S or C-C H-O or C-NW H-W or C-W H-S or C-C H-O or C-NW Primary Diverted Pass-by
Apartments Mid Rise 0.00 0.00 0.00 0.00 0.00 0.00 86 11 3
General Office Building 16.60 8.40 6.90 33.00 48.00 19.00 77 19 4
Regional Shopping Center 16.60 8.40 6.90 16.30 64.70 19.00 54 35 11
4.4 Fleet Mix
CalEEMod Version: CalEEMod.2016.3.2 Date: 8/28/2020 12:02 PMPage 20 of 31
ITC Adjusted Baseline - South Coast Air Basin, Annual

5.0 Energy Detail
ROG NOx CO SO2 Fugitive PM10
Exhaust PM10
PM10 Total
Fugitive PM2.5
Exhaust PM2.5
PM2.5 Total
Bio- CO2 NBio- CO2 Total CO2 CH4 N2O CO2e
Category tons/yr MT/yr
Electricity Mitigated
0.0000 0.0000 0.0000 0.0000 0.0000 4,363.3354
4,363.3354
0.1801 0.0373 4,378.9454
Electricity Unmitigated
0.0000 0.0000 0.0000 0.0000 0.0000 4,363.3354
4,363.3354
0.1801 0.0373 4,378.9454
NaturalGas Mitigated
0.0479 0.4249 0.2884 2.6100e-003
0.0331 0.0331 0.0331 0.0331 0.0000 474.0639 474.0639 9.0900e-003
8.6900e-003
476.8811
NaturalGas Unmitigated
0.0479 0.4249 0.2884 2.6100e-003
0.0331 0.0331 0.0331 0.0331 0.0000 474.0639 474.0639 9.0900e-003
8.6900e-003
476.8811
5.1 Mitigation Measures Energy
Land Use LDA LDT1 LDT2 MDV LHD1 LHD2 MHD HHD OBUS UBUS MCY SBUS MH
Apartments Mid Rise 0.550339 0.043800 0.200255 0.122233 0.016799 0.005871 0.020633 0.029727 0.002027 0.001932 0.004726 0.000704 0.000955
General Office Building 0.550339 0.043800 0.200255 0.122233 0.016799 0.005871 0.020633 0.029727 0.002027 0.001932 0.004726 0.000704 0.000955
Regional Shopping Center 0.550339 0.043800 0.200255 0.122233 0.016799 0.005871 0.020633 0.029727 0.002027 0.001932 0.004726 0.000704 0.000955
Historical Energy Use: N
CalEEMod Version: CalEEMod.2016.3.2 Date: 8/28/2020 12:02 PMPage 21 of 31
ITC Adjusted Baseline - South Coast Air Basin, Annual

5.2 Energy by Land Use - NaturalGas
NaturalGas Use
ROG NOx CO SO2 Fugitive PM10
Exhaust PM10
PM10 Total
Fugitive PM2.5
Exhaust PM2.5
PM2.5 Total
Bio- CO2 NBio- CO2 Total CO2 CH4 N2O CO2e
Land Use kBTU/yr tons/yr MT/yr
Apartments Mid Rise
3.58822e+006
0.0194 0.1653 0.0704 1.0600e-003
0.0134 0.0134 0.0134 0.0134 0.0000 191.4812 191.4812 3.6700e-003
3.5100e-003
192.6191
General Office Building
4.25924e+006
0.0230 0.2088 0.1754 1.2500e-003
0.0159 0.0159 0.0159 0.0159 0.0000 227.2893 227.2893 4.3600e-003
4.1700e-003
228.6399
Regional Shopping Center
1.03616e+006
5.5900e-003
0.0508 0.0427 3.0000e-004
3.8600e-003
3.8600e-003
3.8600e-003
3.8600e-003
0.0000 55.2934 55.2934 1.0600e-003
1.0100e-003
55.6220
Total 0.0479 0.4249 0.2884 2.6100e-003
0.0331 0.0331 0.0331 0.0331 0.0000 474.0639 474.0639 9.0900e-003
8.6900e-003
476.8810
Unmitigated
NaturalGas Use
ROG NOx CO SO2 Fugitive PM10
Exhaust PM10
PM10 Total
Fugitive PM2.5
Exhaust PM2.5
PM2.5 Total
Bio- CO2 NBio- CO2 Total CO2 CH4 N2O CO2e
Land Use kBTU/yr tons/yr MT/yr
Apartments Mid Rise
3.58822e+006
0.0194 0.1653 0.0704 1.0600e-003
0.0134 0.0134 0.0134 0.0134 0.0000 191.4812 191.4812 3.6700e-003
3.5100e-003
192.6191
General Office Building
4.25924e+006
0.0230 0.2088 0.1754 1.2500e-003
0.0159 0.0159 0.0159 0.0159 0.0000 227.2893 227.2893 4.3600e-003
4.1700e-003
228.6399
Regional Shopping Center
1.03616e+006
5.5900e-003
0.0508 0.0427 3.0000e-004
3.8600e-003
3.8600e-003
3.8600e-003
3.8600e-003
0.0000 55.2934 55.2934 1.0600e-003
1.0100e-003
55.6220
Total 0.0479 0.4249 0.2884 2.6100e-003
0.0331 0.0331 0.0331 0.0331 0.0000 474.0639 474.0639 9.0900e-003
8.6900e-003
476.8810
Mitigated
CalEEMod Version: CalEEMod.2016.3.2 Date: 8/28/2020 12:02 PMPage 22 of 31
ITC Adjusted Baseline - South Coast Air Basin, Annual

6.0 Area Detail
5.3 Energy by Land Use - Electricity
Electricity Use
Total CO2 CH4 N2O CO2e
Land Use kWh/yr MT/yr
Apartments Mid Rise
1.24824e+006
397.7173 0.0164 3.4000e-003
399.1402
General Office Building
6.51934e+006
2,077.2014
0.0858 0.0177 2,084.6327
Regional Shopping Center
5.92684e+006
1,888.4167
0.0780 0.0161 1,895.1725
Total 4,363.3354
0.1801 0.0373 4,378.9454
Unmitigated
Electricity Use
Total CO2 CH4 N2O CO2e
Land Use kWh/yr MT/yr
Apartments Mid Rise
1.24824e+006
397.7173 0.0164 3.4000e-003
399.1402
General Office Building
6.51934e+006
2,077.2014
0.0858 0.0177 2,084.6327
Regional Shopping Center
5.92684e+006
1,888.4167
0.0780 0.0161 1,895.1725
Total 4,363.3354
0.1801 0.0373 4,378.9454
Mitigated
CalEEMod Version: CalEEMod.2016.3.2 Date: 8/28/2020 12:02 PMPage 23 of 31
ITC Adjusted Baseline - South Coast Air Basin, Annual

6.1 Mitigation Measures Area
6.0 Area Detail
ROG NOx CO SO2 Fugitive PM10
Exhaust PM10
PM10 Total
Fugitive PM2.5
Exhaust PM2.5
PM2.5 Total
Bio- CO2 NBio- CO2 Total CO2 CH4 N2O CO2e
Category tons/yr MT/yr
Mitigated 6.3736 0.1191 5.2576 5.2600e-003
0.3177 0.3177 0.3177 0.3177 33.3528 69.4065 102.7593 0.1047 2.2600e-003
106.0511
Unmitigated 6.3736 0.1191 5.2576 5.2600e-003
0.3177 0.3177 0.3177 0.3177 33.3528 69.4065 102.7593 0.1047 2.2600e-003
106.0511
CalEEMod Version: CalEEMod.2016.3.2 Date: 8/28/2020 12:02 PMPage 24 of 31
ITC Adjusted Baseline - South Coast Air Basin, Annual

6.2 Area by SubCategory
ROG NOx CO SO2 Fugitive PM10
Exhaust PM10
PM10 Total
Fugitive PM2.5
Exhaust PM2.5
PM2.5 Total
Bio- CO2 NBio- CO2 Total CO2 CH4 N2O CO2e
SubCategory tons/yr MT/yr
Architectural Coating
0.5544 0.0000 0.0000 0.0000 0.0000 0.0000 0.0000 0.0000 0.0000 0.0000 0.0000
Consumer Products
4.6906 0.0000 0.0000 0.0000 0.0000 0.0000 0.0000 0.0000 0.0000 0.0000 0.0000
Hearth 1.0285 0.0814 1.9961 5.0900e-003
0.2998 0.2998 0.2998 0.2998 33.3528 64.0926 97.4454 0.0995 2.2600e-003
100.6066
Landscaping 0.1001 0.0377 3.2616 1.7000e-004
0.0179 0.0179 0.0179 0.0179 0.0000 5.3139 5.3139 5.2200e-003
0.0000 5.4445
Total 6.3736 0.1191 5.2577 5.2600e-003
0.3177 0.3177 0.3177 0.3177 33.3528 69.4065 102.7593 0.1047 2.2600e-003
106.0511
Unmitigated
CalEEMod Version: CalEEMod.2016.3.2 Date: 8/28/2020 12:02 PMPage 25 of 31
ITC Adjusted Baseline - South Coast Air Basin, Annual

7.1 Mitigation Measures Water
7.0 Water Detail
6.2 Area by SubCategory
ROG NOx CO SO2 Fugitive PM10
Exhaust PM10
PM10 Total
Fugitive PM2.5
Exhaust PM2.5
PM2.5 Total
Bio- CO2 NBio- CO2 Total CO2 CH4 N2O CO2e
SubCategory tons/yr MT/yr
Architectural Coating
0.5544 0.0000 0.0000 0.0000 0.0000 0.0000 0.0000 0.0000 0.0000 0.0000 0.0000
Consumer Products
4.6906 0.0000 0.0000 0.0000 0.0000 0.0000 0.0000 0.0000 0.0000 0.0000 0.0000
Hearth 1.0285 0.0814 1.9961 5.0900e-003
0.2998 0.2998 0.2998 0.2998 33.3528 64.0926 97.4454 0.0995 2.2600e-003
100.6066
Landscaping 0.1001 0.0377 3.2616 1.7000e-004
0.0179 0.0179 0.0179 0.0179 0.0000 5.3139 5.3139 5.2200e-003
0.0000 5.4445
Total 6.3736 0.1191 5.2577 5.2600e-003
0.3177 0.3177 0.3177 0.3177 33.3528 69.4065 102.7593 0.1047 2.2600e-003
106.0511
Mitigated
CalEEMod Version: CalEEMod.2016.3.2 Date: 8/28/2020 12:02 PMPage 26 of 31
ITC Adjusted Baseline - South Coast Air Basin, Annual
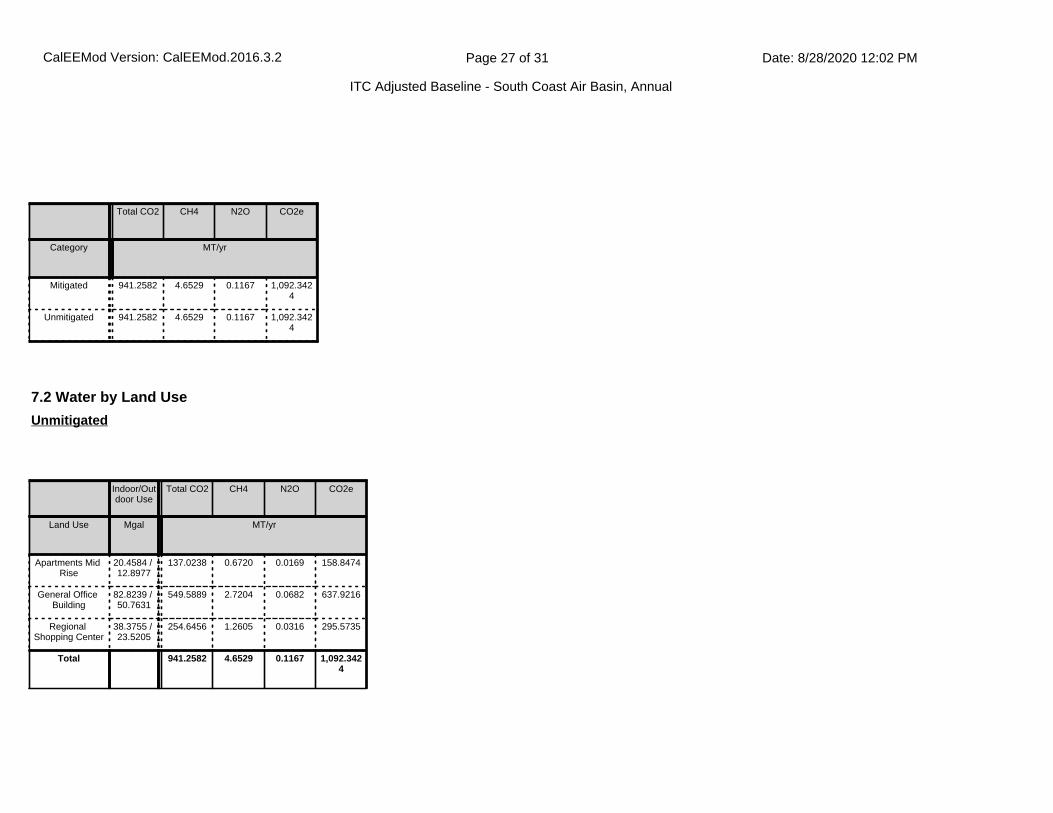
Total CO2 CH4 N2O CO2e
Category MT/yr
Mitigated 941.2582 4.6529 0.1167 1,092.3424
Unmitigated 941.2582 4.6529 0.1167 1,092.3424
7.2 Water by Land Use
Indoor/Outdoor Use
Total CO2 CH4 N2O CO2e
Land Use Mgal MT/yr
Apartments Mid Rise
20.4584 / 12.8977
137.0238 0.6720 0.0169 158.8474
General Office Building
82.8239 / 50.7631
549.5889 2.7204 0.0682 637.9216
Regional Shopping Center
38.3755 / 23.5205
254.6456 1.2605 0.0316 295.5735
Total 941.2582 4.6529 0.1167 1,092.3424
Unmitigated
CalEEMod Version: CalEEMod.2016.3.2 Date: 8/28/2020 12:02 PMPage 27 of 31
ITC Adjusted Baseline - South Coast Air Basin, Annual

8.1 Mitigation Measures Waste
7.2 Water by Land Use
Indoor/Outdoor Use
Total CO2 CH4 N2O CO2e
Land Use Mgal MT/yr
Apartments Mid Rise
20.4584 / 12.8977
137.0238 0.6720 0.0169 158.8474
General Office Building
82.8239 / 50.7631
549.5889 2.7204 0.0682 637.9216
Regional Shopping Center
38.3755 / 23.5205
254.6456 1.2605 0.0316 295.5735
Total 941.2582 4.6529 0.1167 1,092.3424
Mitigated
8.0 Waste Detail
CalEEMod Version: CalEEMod.2016.3.2 Date: 8/28/2020 12:02 PMPage 28 of 31
ITC Adjusted Baseline - South Coast Air Basin, Annual

Total CO2 CH4 N2O CO2e
MT/yr
Mitigated 227.7153 13.4576 0.0000 564.1549
Unmitigated 227.7153 13.4576 0.0000 564.1549
Category/Year
8.2 Waste by Land Use
Waste Disposed
Total CO2 CH4 N2O CO2e
Land Use tons MT/yr
Apartments Mid Rise
144.44 29.3200 1.7328 0.0000 72.6391
General Office Building
433.38 87.9722 5.1990 0.0000 217.9475
Regional Shopping Center
543.98 110.4230 6.5258 0.0000 273.5684
Total 227.7153 13.4576 0.0000 564.1549
Unmitigated
CalEEMod Version: CalEEMod.2016.3.2 Date: 8/28/2020 12:02 PMPage 29 of 31
ITC Adjusted Baseline - South Coast Air Basin, Annual

8.2 Waste by Land Use
Waste Disposed
Total CO2 CH4 N2O CO2e
Land Use tons MT/yr
Apartments Mid Rise
144.44 29.3200 1.7328 0.0000 72.6391
General Office Building
433.38 87.9722 5.1990 0.0000 217.9475
Regional Shopping Center
543.98 110.4230 6.5258 0.0000 273.5684
Total 227.7153 13.4576 0.0000 564.1549
Mitigated
9.0 Operational Offroad
Equipment Type Number Hours/Day Days/Year Horse Power Load Factor Fuel Type
10.0 Stationary Equipment
Fire Pumps and Emergency Generators
Equipment Type Number Hours/Day Hours/Year Horse Power Load Factor Fuel Type
Boilers
Equipment Type Number Heat Input/Day Heat Input/Year Boiler Rating Fuel Type
User Defined Equipment
Equipment Type Number
CalEEMod Version: CalEEMod.2016.3.2 Date: 8/28/2020 12:02 PMPage 30 of 31
ITC Adjusted Baseline - South Coast Air Basin, Annual

11.0 Vegetation
CalEEMod Version: CalEEMod.2016.3.2 Date: 8/28/2020 12:02 PMPage 31 of 31
ITC Adjusted Baseline - South Coast Air Basin, Annual

Project Characteristics -
Land Use -
Construction Phase - Adjusted Baseline, no construction
Vehicle Trips - Using EMFAC for motor vehicle emissions
Grading -
1.1 Land Usage
Land Uses Size Metric Lot Acreage Floor Surface Area Population
General Office Building 466.00 1000sqft 10.70 466,000.00 0
Apartments Mid Rise 314.00 Dwelling Unit 8.26 314,000.00 898
Regional Shopping Center 518.08 1000sqft 11.89 518,080.00 0
1.2 Other Project Characteristics
Urbanization
Climate Zone
Urban
8
Wind Speed (m/s) Precipitation Freq (Days)2.2 31
1.3 User Entered Comments & Non-Default Data
1.0 Project Characteristics
Utility Company Southern California Edison
2020Operational Year
CO2 Intensity (lb/MWhr)
702.44 0.029CH4 Intensity (lb/MWhr)
0.006N2O Intensity (lb/MWhr)
ITC Adjusted BaselineSouth Coast Air Basin, Summer
CalEEMod Version: CalEEMod.2016.3.2 Date: 8/28/2020 12:13 PMPage 1 of 25
ITC Adjusted Baseline - South Coast Air Basin, Summer

2.0 Emissions Summary
Table Name Column Name Default Value New Value
tblConstructionPhase NumDays 30.00 0.00
tblConstructionPhase NumDays 20.00 0.00
tblConstructionPhase NumDays 45.00 0.00
tblConstructionPhase NumDays 500.00 0.00
tblConstructionPhase NumDays 35.00 0.00
tblConstructionPhase NumDays 35.00 0.00
tblVehicleTrips HO_TL 8.70 0.00
tblVehicleTrips HO_TTP 40.60 0.00
tblVehicleTrips HS_TL 5.90 0.00
tblVehicleTrips HS_TTP 19.20 0.00
tblVehicleTrips HW_TL 14.70 0.00
tblVehicleTrips HW_TTP 40.20 0.00
tblVehicleTrips ST_TR 6.39 0.00
tblVehicleTrips ST_TR 2.46 0.00
tblVehicleTrips ST_TR 49.97 0.00
tblVehicleTrips SU_TR 5.86 0.00
tblVehicleTrips SU_TR 1.05 0.00
tblVehicleTrips SU_TR 25.24 0.00
tblVehicleTrips WD_TR 6.65 0.00
tblVehicleTrips WD_TR 11.03 0.00
tblVehicleTrips WD_TR 42.70 0.00
CalEEMod Version: CalEEMod.2016.3.2 Date: 8/28/2020 12:13 PMPage 2 of 25
ITC Adjusted Baseline - South Coast Air Basin, Summer

2.1 Overall Construction (Maximum Daily Emission)
ROG NOx CO SO2 Fugitive PM10
Exhaust PM10
PM10 Total
Fugitive PM2.5
Exhaust PM2.5
PM2.5 Total
Bio- CO2 NBio- CO2 Total CO2 CH4 N2O CO2e
Year lb/day lb/day
2018 0.0000 0.0000 0.0000 0.0000 0.0000 2.5785 0.0000 0.0000 2.3722 0.0000 0.0000 0.0000 0.0000 0.0000 0.0000 0.0000
2021 0.0000 0.0000 0.0000 0.0000 0.0000 1.9870 0.0000 0.0000 1.8280 0.0000 0.0000 0.0000 0.0000 0.0000 0.0000 0.0000
2027 0.0000 0.0000 0.0000 0.0000 0.0000 0.5794 0.0000 0.0000 0.5445 0.0000 0.0000 0.0000 0.0000 0.0000 0.0000 0.0000
2086 0.0000 0.0000 0.0000 0.0000 0.0000 0.1164 0.0000 0.0000 0.1164 0.0000 0.0000 0.0000 0.0000 0.0000 0.0000 0.0000
2090 0.0000 0.0000 0.0000 0.0000 0.0000 7.4300e-003
0.0000 0.0000 7.4300e-003
0.0000 0.0000 0.0000 0.0000 0.0000 0.0000 0.0000
Maximum 0.0000 0.0000 0.0000 0.0000 0.0000 2.5785 0.0000 0.0000 2.3722 0.0000 0.0000 0.0000 0.0000 0.0000 0.0000 0.0000
Unmitigated Construction
CalEEMod Version: CalEEMod.2016.3.2 Date: 8/28/2020 12:13 PMPage 3 of 25
ITC Adjusted Baseline - South Coast Air Basin, Summer

2.1 Overall Construction (Maximum Daily Emission)
ROG NOx CO SO2 Fugitive PM10
Exhaust PM10
PM10 Total
Fugitive PM2.5
Exhaust PM2.5
PM2.5 Total
Bio- CO2 NBio- CO2 Total CO2 CH4 N2O CO2e
Year lb/day lb/day
2018 0.0000 0.0000 0.0000 0.0000 0.0000 2.5785 0.0000 0.0000 2.3722 0.0000 0.0000 0.0000 0.0000 0.0000 0.0000 0.0000
2021 0.0000 0.0000 0.0000 0.0000 0.0000 1.9870 0.0000 0.0000 1.8280 0.0000 0.0000 0.0000 0.0000 0.0000 0.0000 0.0000
2027 0.0000 0.0000 0.0000 0.0000 0.0000 0.5794 0.0000 0.0000 0.5445 0.0000 0.0000 0.0000 0.0000 0.0000 0.0000 0.0000
2086 0.0000 0.0000 0.0000 0.0000 0.0000 0.1164 0.0000 0.0000 0.1164 0.0000 0.0000 0.0000 0.0000 0.0000 0.0000 0.0000
2090 0.0000 0.0000 0.0000 0.0000 0.0000 7.4300e-003
0.0000 0.0000 7.4300e-003
0.0000 0.0000 0.0000 0.0000 0.0000 0.0000 0.0000
Maximum 0.0000 0.0000 0.0000 0.0000 0.0000 2.5785 0.0000 0.0000 2.3722 0.0000 0.0000 0.0000 0.0000 0.0000 0.0000 0.0000
Mitigated Construction
ROG NOx CO SO2 Fugitive PM10
Exhaust PM10
PM10 Total
Fugitive PM2.5
Exhaust PM2.5
PM2.5 Total
Bio- CO2 NBio-CO2 Total CO2 CH4 N20 CO2e
Percent Reduction
0.00 0.00 0.00 0.00 0.00 0.00 0.00 0.00 0.00 0.00 0.00 0.00 0.00 0.00 0.00 0.00
CalEEMod Version: CalEEMod.2016.3.2 Date: 8/28/2020 12:13 PMPage 4 of 25
ITC Adjusted Baseline - South Coast Air Basin, Summer

2.2 Overall Operational
ROG NOx CO SO2 Fugitive PM10
Exhaust PM10
PM10 Total
Fugitive PM2.5
Exhaust PM2.5
PM2.5 Total
Bio- CO2 NBio- CO2 Total CO2 CH4 N2O CO2e
Category lb/day lb/day
Area 111.8199 6.8165 185.7779 0.4088 24.1292 24.1292 24.1292 24.1292 2,941.2124
5,698.8608
8,640.0732
8.8173 0.1996 8,919.9956
Energy 0.2625 2.3283 1.5803 0.0143 0.1814 0.1814 0.1814 0.1814 2,863.3755
2,863.3755
0.0549 0.0525 2,880.3911
Mobile 0.0000 0.0000 0.0000 0.0000 0.0000 0.0000 0.0000 0.0000 0.0000 0.0000 0.0000 0.0000 0.0000 0.0000
Total 112.0823 9.1448 187.3582 0.4231 0.0000 24.3106 24.3106 0.0000 24.3106 24.3106 2,941.2124
8,562.2363
11,503.4487
8.8722 0.2521 11,800.3867
Unmitigated Operational
ROG NOx CO SO2 Fugitive PM10
Exhaust PM10
PM10 Total
Fugitive PM2.5
Exhaust PM2.5
PM2.5 Total
Bio- CO2 NBio- CO2 Total CO2 CH4 N2O CO2e
Category lb/day lb/day
Area 111.8199 6.8165 185.7779 0.4088 24.1292 24.1292 24.1292 24.1292 2,941.2124
5,698.8608
8,640.0732
8.8173 0.1996 8,919.9956
Energy 0.2625 2.3283 1.5803 0.0143 0.1814 0.1814 0.1814 0.1814 2,863.3755
2,863.3755
0.0549 0.0525 2,880.3911
Mobile 0.0000 0.0000 0.0000 0.0000 0.0000 0.0000 0.0000 0.0000 0.0000 0.0000 0.0000 0.0000 0.0000 0.0000
Total 112.0823 9.1448 187.3582 0.4231 0.0000 24.3106 24.3106 0.0000 24.3106 24.3106 2,941.2124
8,562.2363
11,503.4487
8.8722 0.2521 11,800.3867
Mitigated Operational
CalEEMod Version: CalEEMod.2016.3.2 Date: 8/28/2020 12:13 PMPage 5 of 25
ITC Adjusted Baseline - South Coast Air Basin, Summer

3.0 Construction Detail
Construction Phase
Phase Number
Phase Name Phase Type Start Date End Date Num Days Week
Num Days Phase Description
1 Demolition Demolition 1/1/2015 12/31/2014 5 0
2 Site Preparation Site Preparation 11/1/2018 10/31/2018 5 0
3 Grading Grading 2/18/2021 2/17/2021 5 0
4 Building Construction Building Construction 1/28/2027 1/27/2027 5 0
5 Paving Paving 6/27/2086 6/26/2086 5 0
6 Architectural Coating Architectural Coating 9/14/2090 9/13/2090 5 0
OffRoad Equipment
ROG NOx CO SO2 Fugitive PM10
Exhaust PM10
PM10 Total
Fugitive PM2.5
Exhaust PM2.5
PM2.5 Total
Bio- CO2 NBio-CO2 Total CO2 CH4 N20 CO2e
Percent Reduction
0.00 0.00 0.00 0.00 0.00 0.00 0.00 0.00 0.00 0.00 0.00 0.00 0.00 0.00 0.00 0.00
Residential Indoor: 635,850; Residential Outdoor: 211,950; Non-Residential Indoor: 1,476,120; Non-Residential Outdoor: 492,040; Striped Parking Area: 0 (Architectural Coating – sqft)
Acres of Grading (Site Preparation Phase): 0
Acres of Grading (Grading Phase): 0
Acres of Paving: 0
CalEEMod Version: CalEEMod.2016.3.2 Date: 8/28/2020 12:13 PMPage 6 of 25
ITC Adjusted Baseline - South Coast Air Basin, Summer

Phase Name Offroad Equipment Type Amount Usage Hours Horse Power Load Factor
Demolition Concrete/Industrial Saws 1 8.00 81 0.73
Demolition Excavators 3 8.00 158 0.38
Demolition Rubber Tired Dozers 2 8.00 247 0.40
Site Preparation Rubber Tired Dozers 3 8.00 247 0.40
Site Preparation Tractors/Loaders/Backhoes 4 8.00 97 0.37
Grading Excavators 2 8.00 158 0.38
Grading Graders 1 8.00 187 0.41
Grading Rubber Tired Dozers 1 8.00 247 0.40
Grading Scrapers 2 8.00 367 0.48
Grading Tractors/Loaders/Backhoes 2 8.00 97 0.37
Building Construction Cranes 1 7.00 231 0.29
Building Construction Forklifts 3 8.00 89 0.20
Building Construction Generator Sets 1 8.00 84 0.74
Building Construction Tractors/Loaders/Backhoes 3 7.00 97 0.37
Building Construction Welders 1 8.00 46 0.45
Paving Pavers 2 8.00 130 0.42
Paving Paving Equipment 2 8.00 132 0.36
Paving Rollers 2 8.00 80 0.38
Architectural Coating Air Compressors 1 6.00 78 0.48
Trips and VMT
CalEEMod Version: CalEEMod.2016.3.2 Date: 8/28/2020 12:13 PMPage 7 of 25
ITC Adjusted Baseline - South Coast Air Basin, Summer

3.3 Site Preparation - 2018
ROG NOx CO SO2 Fugitive PM10
Exhaust PM10
PM10 Total
Fugitive PM2.5
Exhaust PM2.5
PM2.5 Total
Bio- CO2 NBio- CO2 Total CO2 CH4 N2O CO2e
Category lb/day lb/day
Fugitive Dust 0.0000 0.0000 0.0000 0.0000 0.0000 0.0000 0.0000 0.0000 0.0000 0.0000 0.0000 0.0000 0.0000 0.0000 0.0000 0.0000
Off-Road 0.0000 0.0000 0.0000 0.0000 0.0000 0.0000 0.0000 0.0000 0.0000 0.0000 0.0000 0.0000 0.0000 0.0000 0.0000 0.0000
Total 0.0000 0.0000 0.0000 0.0000 0.0000 0.0000 0.0000 0.0000 0.0000 0.0000 0.0000 0.0000 0.0000 0.0000 0.0000 0.0000
Unmitigated Construction On-Site
3.1 Mitigation Measures Construction
Phase Name Offroad Equipment Count
Worker Trip Number
Vendor Trip Number
Hauling Trip Number
Worker Trip Length
Vendor Trip Length
Hauling Trip Length
Worker Vehicle Class
Vendor Vehicle Class
Hauling Vehicle Class
Demolition 6 15.00 0.00 0.00 14.70 6.90 20.00 LD_Mix HDT_Mix HHDT
Site Preparation 7 18.00 0.00 0.00 14.70 6.90 20.00 LD_Mix HDT_Mix HHDT
Grading 8 20.00 0.00 0.00 14.70 6.90 20.00 LD_Mix HDT_Mix HHDT
Building Construction 9 541.00 195.00 0.00 14.70 6.90 20.00 LD_Mix HDT_Mix HHDT
Paving 6 15.00 0.00 0.00 14.70 6.90 20.00 LD_Mix HDT_Mix HHDT
Architectural Coating 1 108.00 0.00 0.00 14.70 6.90 20.00 LD_Mix HDT_Mix HHDT
CalEEMod Version: CalEEMod.2016.3.2 Date: 8/28/2020 12:13 PMPage 8 of 25
ITC Adjusted Baseline - South Coast Air Basin, Summer

3.3 Site Preparation - 2018
ROG NOx CO SO2 Fugitive PM10
Exhaust PM10
PM10 Total
Fugitive PM2.5
Exhaust PM2.5
PM2.5 Total
Bio- CO2 NBio- CO2 Total CO2 CH4 N2O CO2e
Category lb/day lb/day
Hauling 0.0000 0.0000 0.0000 0.0000 0.0000 0.0000 0.0000 0.0000 0.0000 0.0000 0.0000 0.0000 0.0000 0.0000 0.0000 0.0000
Vendor 0.0000 0.0000 0.0000 0.0000 0.0000 0.0000 0.0000 0.0000 0.0000 0.0000 0.0000 0.0000 0.0000 0.0000 0.0000 0.0000
Worker 0.0000 0.0000 0.0000 0.0000 0.0000 0.0000 0.0000 0.0000 0.0000 0.0000 0.0000 0.0000 0.0000 0.0000 0.0000 0.0000
Total 0.0000 0.0000 0.0000 0.0000 0.0000 0.0000 0.0000 0.0000 0.0000 0.0000 0.0000 0.0000 0.0000 0.0000 0.0000 0.0000
Unmitigated Construction Off-Site
ROG NOx CO SO2 Fugitive PM10
Exhaust PM10
PM10 Total
Fugitive PM2.5
Exhaust PM2.5
PM2.5 Total
Bio- CO2 NBio- CO2 Total CO2 CH4 N2O CO2e
Category lb/day lb/day
Fugitive Dust 0.0000 0.0000 0.0000 0.0000 0.0000 0.0000 0.0000 0.0000 0.0000 0.0000 0.0000 0.0000 0.0000 0.0000 0.0000 0.0000
Off-Road 0.0000 0.0000 0.0000 0.0000 0.0000 0.0000 0.0000 0.0000 0.0000 0.0000 0.0000 0.0000 0.0000 0.0000 0.0000 0.0000
Total 0.0000 0.0000 0.0000 0.0000 0.0000 0.0000 0.0000 0.0000 0.0000 0.0000 0.0000 0.0000 0.0000 0.0000 0.0000 0.0000
Mitigated Construction On-Site
CalEEMod Version: CalEEMod.2016.3.2 Date: 8/28/2020 12:13 PMPage 9 of 25
ITC Adjusted Baseline - South Coast Air Basin, Summer

3.3 Site Preparation - 2018
ROG NOx CO SO2 Fugitive PM10
Exhaust PM10
PM10 Total
Fugitive PM2.5
Exhaust PM2.5
PM2.5 Total
Bio- CO2 NBio- CO2 Total CO2 CH4 N2O CO2e
Category lb/day lb/day
Hauling 0.0000 0.0000 0.0000 0.0000 0.0000 0.0000 0.0000 0.0000 0.0000 0.0000 0.0000 0.0000 0.0000 0.0000 0.0000 0.0000
Vendor 0.0000 0.0000 0.0000 0.0000 0.0000 0.0000 0.0000 0.0000 0.0000 0.0000 0.0000 0.0000 0.0000 0.0000 0.0000 0.0000
Worker 0.0000 0.0000 0.0000 0.0000 0.0000 0.0000 0.0000 0.0000 0.0000 0.0000 0.0000 0.0000 0.0000 0.0000 0.0000 0.0000
Total 0.0000 0.0000 0.0000 0.0000 0.0000 0.0000 0.0000 0.0000 0.0000 0.0000 0.0000 0.0000 0.0000 0.0000 0.0000 0.0000
Mitigated Construction Off-Site
3.4 Grading - 2021
ROG NOx CO SO2 Fugitive PM10
Exhaust PM10
PM10 Total
Fugitive PM2.5
Exhaust PM2.5
PM2.5 Total
Bio- CO2 NBio- CO2 Total CO2 CH4 N2O CO2e
Category lb/day lb/day
Fugitive Dust 0.0000 0.0000 0.0000 0.0000 0.0000 0.0000 0.0000 0.0000 0.0000 0.0000 0.0000 0.0000 0.0000 0.0000 0.0000 0.0000
Off-Road 0.0000 0.0000 0.0000 0.0000 0.0000 0.0000 0.0000 0.0000 0.0000 0.0000 0.0000 0.0000 0.0000 0.0000 0.0000 0.0000
Total 0.0000 0.0000 0.0000 0.0000 0.0000 0.0000 0.0000 0.0000 0.0000 0.0000 0.0000 0.0000 0.0000 0.0000 0.0000 0.0000
Unmitigated Construction On-Site
CalEEMod Version: CalEEMod.2016.3.2 Date: 8/28/2020 12:13 PMPage 10 of 25
ITC Adjusted Baseline - South Coast Air Basin, Summer

3.4 Grading - 2021
ROG NOx CO SO2 Fugitive PM10
Exhaust PM10
PM10 Total
Fugitive PM2.5
Exhaust PM2.5
PM2.5 Total
Bio- CO2 NBio- CO2 Total CO2 CH4 N2O CO2e
Category lb/day lb/day
Hauling 0.0000 0.0000 0.0000 0.0000 0.0000 0.0000 0.0000 0.0000 0.0000 0.0000 0.0000 0.0000 0.0000 0.0000 0.0000 0.0000
Vendor 0.0000 0.0000 0.0000 0.0000 0.0000 0.0000 0.0000 0.0000 0.0000 0.0000 0.0000 0.0000 0.0000 0.0000 0.0000 0.0000
Worker 0.0000 0.0000 0.0000 0.0000 0.0000 0.0000 0.0000 0.0000 0.0000 0.0000 0.0000 0.0000 0.0000 0.0000 0.0000 0.0000
Total 0.0000 0.0000 0.0000 0.0000 0.0000 0.0000 0.0000 0.0000 0.0000 0.0000 0.0000 0.0000 0.0000 0.0000 0.0000 0.0000
Unmitigated Construction Off-Site
ROG NOx CO SO2 Fugitive PM10
Exhaust PM10
PM10 Total
Fugitive PM2.5
Exhaust PM2.5
PM2.5 Total
Bio- CO2 NBio- CO2 Total CO2 CH4 N2O CO2e
Category lb/day lb/day
Fugitive Dust 0.0000 0.0000 0.0000 0.0000 0.0000 0.0000 0.0000 0.0000 0.0000 0.0000 0.0000 0.0000 0.0000 0.0000 0.0000 0.0000
Off-Road 0.0000 0.0000 0.0000 0.0000 0.0000 0.0000 0.0000 0.0000 0.0000 0.0000 0.0000 0.0000 0.0000 0.0000 0.0000 0.0000
Total 0.0000 0.0000 0.0000 0.0000 0.0000 0.0000 0.0000 0.0000 0.0000 0.0000 0.0000 0.0000 0.0000 0.0000 0.0000 0.0000
Mitigated Construction On-Site
CalEEMod Version: CalEEMod.2016.3.2 Date: 8/28/2020 12:13 PMPage 11 of 25
ITC Adjusted Baseline - South Coast Air Basin, Summer

3.4 Grading - 2021
ROG NOx CO SO2 Fugitive PM10
Exhaust PM10
PM10 Total
Fugitive PM2.5
Exhaust PM2.5
PM2.5 Total
Bio- CO2 NBio- CO2 Total CO2 CH4 N2O CO2e
Category lb/day lb/day
Hauling 0.0000 0.0000 0.0000 0.0000 0.0000 0.0000 0.0000 0.0000 0.0000 0.0000 0.0000 0.0000 0.0000 0.0000 0.0000 0.0000
Vendor 0.0000 0.0000 0.0000 0.0000 0.0000 0.0000 0.0000 0.0000 0.0000 0.0000 0.0000 0.0000 0.0000 0.0000 0.0000 0.0000
Worker 0.0000 0.0000 0.0000 0.0000 0.0000 0.0000 0.0000 0.0000 0.0000 0.0000 0.0000 0.0000 0.0000 0.0000 0.0000 0.0000
Total 0.0000 0.0000 0.0000 0.0000 0.0000 0.0000 0.0000 0.0000 0.0000 0.0000 0.0000 0.0000 0.0000 0.0000 0.0000 0.0000
Mitigated Construction Off-Site
3.5 Building Construction - 2027
ROG NOx CO SO2 Fugitive PM10
Exhaust PM10
PM10 Total
Fugitive PM2.5
Exhaust PM2.5
PM2.5 Total
Bio- CO2 NBio- CO2 Total CO2 CH4 N2O CO2e
Category lb/day lb/day
Off-Road 0.0000 0.0000 0.0000 0.0000 0.0000 0.0000 0.0000 0.0000 0.0000 0.0000 0.0000 0.0000 0.0000 0.0000 0.0000 0.0000
Total 0.0000 0.0000 0.0000 0.0000 0.0000 0.0000 0.0000 0.0000 0.0000 0.0000 0.0000 0.0000 0.0000 0.0000 0.0000 0.0000
Unmitigated Construction On-Site
CalEEMod Version: CalEEMod.2016.3.2 Date: 8/28/2020 12:13 PMPage 12 of 25
ITC Adjusted Baseline - South Coast Air Basin, Summer

3.5 Building Construction - 2027
ROG NOx CO SO2 Fugitive PM10
Exhaust PM10
PM10 Total
Fugitive PM2.5
Exhaust PM2.5
PM2.5 Total
Bio- CO2 NBio- CO2 Total CO2 CH4 N2O CO2e
Category lb/day lb/day
Hauling 0.0000 0.0000 0.0000 0.0000 0.0000 0.0000 0.0000 0.0000 0.0000 0.0000 0.0000 0.0000 0.0000 0.0000 0.0000 0.0000
Vendor 0.0000 0.0000 0.0000 0.0000 0.0000 0.0000 0.0000 0.0000 0.0000 0.0000 0.0000 0.0000 0.0000 0.0000 0.0000 0.0000
Worker 0.0000 0.0000 0.0000 0.0000 0.0000 0.0000 0.0000 0.0000 0.0000 0.0000 0.0000 0.0000 0.0000 0.0000 0.0000 0.0000
Total 0.0000 0.0000 0.0000 0.0000 0.0000 0.0000 0.0000 0.0000 0.0000 0.0000 0.0000 0.0000 0.0000 0.0000 0.0000 0.0000
Unmitigated Construction Off-Site
ROG NOx CO SO2 Fugitive PM10
Exhaust PM10
PM10 Total
Fugitive PM2.5
Exhaust PM2.5
PM2.5 Total
Bio- CO2 NBio- CO2 Total CO2 CH4 N2O CO2e
Category lb/day lb/day
Off-Road 0.0000 0.0000 0.0000 0.0000 0.0000 0.0000 0.0000 0.0000 0.0000 0.0000 0.0000 0.0000 0.0000 0.0000 0.0000 0.0000
Total 0.0000 0.0000 0.0000 0.0000 0.0000 0.0000 0.0000 0.0000 0.0000 0.0000 0.0000 0.0000 0.0000 0.0000 0.0000 0.0000
Mitigated Construction On-Site
CalEEMod Version: CalEEMod.2016.3.2 Date: 8/28/2020 12:13 PMPage 13 of 25
ITC Adjusted Baseline - South Coast Air Basin, Summer

3.5 Building Construction - 2027
ROG NOx CO SO2 Fugitive PM10
Exhaust PM10
PM10 Total
Fugitive PM2.5
Exhaust PM2.5
PM2.5 Total
Bio- CO2 NBio- CO2 Total CO2 CH4 N2O CO2e
Category lb/day lb/day
Hauling 0.0000 0.0000 0.0000 0.0000 0.0000 0.0000 0.0000 0.0000 0.0000 0.0000 0.0000 0.0000 0.0000 0.0000 0.0000 0.0000
Vendor 0.0000 0.0000 0.0000 0.0000 0.0000 0.0000 0.0000 0.0000 0.0000 0.0000 0.0000 0.0000 0.0000 0.0000 0.0000 0.0000
Worker 0.0000 0.0000 0.0000 0.0000 0.0000 0.0000 0.0000 0.0000 0.0000 0.0000 0.0000 0.0000 0.0000 0.0000 0.0000 0.0000
Total 0.0000 0.0000 0.0000 0.0000 0.0000 0.0000 0.0000 0.0000 0.0000 0.0000 0.0000 0.0000 0.0000 0.0000 0.0000 0.0000
Mitigated Construction Off-Site
3.6 Paving - 2086
ROG NOx CO SO2 Fugitive PM10
Exhaust PM10
PM10 Total
Fugitive PM2.5
Exhaust PM2.5
PM2.5 Total
Bio- CO2 NBio- CO2 Total CO2 CH4 N2O CO2e
Category lb/day lb/day
Off-Road 0.0000 0.0000 0.0000 0.0000 0.0000 0.0000 0.0000 0.0000 0.0000 0.0000 0.0000 0.0000 0.0000 0.0000 0.0000 0.0000
Paving 0.0000 0.0000 0.0000 0.0000 0.0000 0.0000 0.0000 0.0000 0.0000 0.0000 0.0000 0.0000 0.0000 0.0000 0.0000 0.0000
Total 0.0000 0.0000 0.0000 0.0000 0.0000 0.0000 0.0000 0.0000 0.0000 0.0000 0.0000 0.0000 0.0000 0.0000 0.0000 0.0000
Unmitigated Construction On-Site
CalEEMod Version: CalEEMod.2016.3.2 Date: 8/28/2020 12:13 PMPage 14 of 25
ITC Adjusted Baseline - South Coast Air Basin, Summer

3.6 Paving - 2086
ROG NOx CO SO2 Fugitive PM10
Exhaust PM10
PM10 Total
Fugitive PM2.5
Exhaust PM2.5
PM2.5 Total
Bio- CO2 NBio- CO2 Total CO2 CH4 N2O CO2e
Category lb/day lb/day
Hauling 0.0000 0.0000 0.0000 0.0000 0.0000 0.0000 0.0000 0.0000 0.0000 0.0000 0.0000 0.0000 0.0000 0.0000 0.0000 0.0000
Vendor 0.0000 0.0000 0.0000 0.0000 0.0000 0.0000 0.0000 0.0000 0.0000 0.0000 0.0000 0.0000 0.0000 0.0000 0.0000 0.0000
Worker 0.0000 0.0000 0.0000 0.0000 0.0000 0.0000 0.0000 0.0000 0.0000 0.0000 0.0000 0.0000 0.0000 0.0000 0.0000 0.0000
Total 0.0000 0.0000 0.0000 0.0000 0.0000 0.0000 0.0000 0.0000 0.0000 0.0000 0.0000 0.0000 0.0000 0.0000 0.0000 0.0000
Unmitigated Construction Off-Site
ROG NOx CO SO2 Fugitive PM10
Exhaust PM10
PM10 Total
Fugitive PM2.5
Exhaust PM2.5
PM2.5 Total
Bio- CO2 NBio- CO2 Total CO2 CH4 N2O CO2e
Category lb/day lb/day
Off-Road 0.0000 0.0000 0.0000 0.0000 0.0000 0.0000 0.0000 0.0000 0.0000 0.0000 0.0000 0.0000 0.0000 0.0000 0.0000 0.0000
Paving 0.0000 0.0000 0.0000 0.0000 0.0000 0.0000 0.0000 0.0000 0.0000 0.0000 0.0000 0.0000 0.0000 0.0000 0.0000 0.0000
Total 0.0000 0.0000 0.0000 0.0000 0.0000 0.0000 0.0000 0.0000 0.0000 0.0000 0.0000 0.0000 0.0000 0.0000 0.0000 0.0000
Mitigated Construction On-Site
CalEEMod Version: CalEEMod.2016.3.2 Date: 8/28/2020 12:13 PMPage 15 of 25
ITC Adjusted Baseline - South Coast Air Basin, Summer

3.6 Paving - 2086
ROG NOx CO SO2 Fugitive PM10
Exhaust PM10
PM10 Total
Fugitive PM2.5
Exhaust PM2.5
PM2.5 Total
Bio- CO2 NBio- CO2 Total CO2 CH4 N2O CO2e
Category lb/day lb/day
Hauling 0.0000 0.0000 0.0000 0.0000 0.0000 0.0000 0.0000 0.0000 0.0000 0.0000 0.0000 0.0000 0.0000 0.0000 0.0000 0.0000
Vendor 0.0000 0.0000 0.0000 0.0000 0.0000 0.0000 0.0000 0.0000 0.0000 0.0000 0.0000 0.0000 0.0000 0.0000 0.0000 0.0000
Worker 0.0000 0.0000 0.0000 0.0000 0.0000 0.0000 0.0000 0.0000 0.0000 0.0000 0.0000 0.0000 0.0000 0.0000 0.0000 0.0000
Total 0.0000 0.0000 0.0000 0.0000 0.0000 0.0000 0.0000 0.0000 0.0000 0.0000 0.0000 0.0000 0.0000 0.0000 0.0000 0.0000
Mitigated Construction Off-Site
3.7 Architectural Coating - 2090
ROG NOx CO SO2 Fugitive PM10
Exhaust PM10
PM10 Total
Fugitive PM2.5
Exhaust PM2.5
PM2.5 Total
Bio- CO2 NBio- CO2 Total CO2 CH4 N2O CO2e
Category lb/day lb/day
Archit. Coating 0.0000 0.0000 0.0000 0.0000 0.0000 0.0000 0.0000 0.0000 0.0000 0.0000 0.0000 0.0000 0.0000 0.0000 0.0000 0.0000
Off-Road 0.0000 0.0000 0.0000 0.0000 0.0000 0.0000 0.0000 0.0000 0.0000 0.0000 0.0000 0.0000 0.0000 0.0000 0.0000 0.0000
Total 0.0000 0.0000 0.0000 0.0000 0.0000 0.0000 0.0000 0.0000 0.0000 0.0000 0.0000 0.0000 0.0000 0.0000 0.0000 0.0000
Unmitigated Construction On-Site
CalEEMod Version: CalEEMod.2016.3.2 Date: 8/28/2020 12:13 PMPage 16 of 25
ITC Adjusted Baseline - South Coast Air Basin, Summer

3.7 Architectural Coating - 2090
ROG NOx CO SO2 Fugitive PM10
Exhaust PM10
PM10 Total
Fugitive PM2.5
Exhaust PM2.5
PM2.5 Total
Bio- CO2 NBio- CO2 Total CO2 CH4 N2O CO2e
Category lb/day lb/day
Hauling 0.0000 0.0000 0.0000 0.0000 0.0000 0.0000 0.0000 0.0000 0.0000 0.0000 0.0000 0.0000 0.0000 0.0000 0.0000 0.0000
Vendor 0.0000 0.0000 0.0000 0.0000 0.0000 0.0000 0.0000 0.0000 0.0000 0.0000 0.0000 0.0000 0.0000 0.0000 0.0000 0.0000
Worker 0.0000 0.0000 0.0000 0.0000 0.0000 0.0000 0.0000 0.0000 0.0000 0.0000 0.0000 0.0000 0.0000 0.0000 0.0000 0.0000
Total 0.0000 0.0000 0.0000 0.0000 0.0000 0.0000 0.0000 0.0000 0.0000 0.0000 0.0000 0.0000 0.0000 0.0000 0.0000 0.0000
Unmitigated Construction Off-Site
ROG NOx CO SO2 Fugitive PM10
Exhaust PM10
PM10 Total
Fugitive PM2.5
Exhaust PM2.5
PM2.5 Total
Bio- CO2 NBio- CO2 Total CO2 CH4 N2O CO2e
Category lb/day lb/day
Archit. Coating 0.0000 0.0000 0.0000 0.0000 0.0000 0.0000 0.0000 0.0000 0.0000 0.0000 0.0000 0.0000 0.0000 0.0000 0.0000 0.0000
Off-Road 0.0000 0.0000 0.0000 0.0000 0.0000 0.0000 0.0000 0.0000 0.0000 0.0000 0.0000 0.0000 0.0000 0.0000 0.0000 0.0000
Total 0.0000 0.0000 0.0000 0.0000 0.0000 0.0000 0.0000 0.0000 0.0000 0.0000 0.0000 0.0000 0.0000 0.0000 0.0000 0.0000
Mitigated Construction On-Site
CalEEMod Version: CalEEMod.2016.3.2 Date: 8/28/2020 12:13 PMPage 17 of 25
ITC Adjusted Baseline - South Coast Air Basin, Summer

4.0 Operational Detail - Mobile
4.1 Mitigation Measures Mobile
3.7 Architectural Coating - 2090
ROG NOx CO SO2 Fugitive PM10
Exhaust PM10
PM10 Total
Fugitive PM2.5
Exhaust PM2.5
PM2.5 Total
Bio- CO2 NBio- CO2 Total CO2 CH4 N2O CO2e
Category lb/day lb/day
Hauling 0.0000 0.0000 0.0000 0.0000 0.0000 0.0000 0.0000 0.0000 0.0000 0.0000 0.0000 0.0000 0.0000 0.0000 0.0000 0.0000
Vendor 0.0000 0.0000 0.0000 0.0000 0.0000 0.0000 0.0000 0.0000 0.0000 0.0000 0.0000 0.0000 0.0000 0.0000 0.0000 0.0000
Worker 0.0000 0.0000 0.0000 0.0000 0.0000 0.0000 0.0000 0.0000 0.0000 0.0000 0.0000 0.0000 0.0000 0.0000 0.0000 0.0000
Total 0.0000 0.0000 0.0000 0.0000 0.0000 0.0000 0.0000 0.0000 0.0000 0.0000 0.0000 0.0000 0.0000 0.0000 0.0000 0.0000
Mitigated Construction Off-Site
CalEEMod Version: CalEEMod.2016.3.2 Date: 8/28/2020 12:13 PMPage 18 of 25
ITC Adjusted Baseline - South Coast Air Basin, Summer

ROG NOx CO SO2 Fugitive PM10
Exhaust PM10
PM10 Total
Fugitive PM2.5
Exhaust PM2.5
PM2.5 Total
Bio- CO2 NBio- CO2 Total CO2 CH4 N2O CO2e
Category lb/day lb/day
Mitigated 0.0000 0.0000 0.0000 0.0000 0.0000 0.0000 0.0000 0.0000 0.0000 0.0000 0.0000 0.0000 0.0000 0.0000
Unmitigated 0.0000 0.0000 0.0000 0.0000 0.0000 0.0000 0.0000 0.0000 0.0000 0.0000 0.0000 0.0000 0.0000 0.0000
4.2 Trip Summary Information
4.3 Trip Type Information
Average Daily Trip Rate Unmitigated Mitigated
Land Use Weekday Saturday Sunday Annual VMT Annual VMT
Apartments Mid Rise 0.00 0.00 0.00
General Office Building 0.00 0.00 0.00
Regional Shopping Center 0.00 0.00 0.00
Total 0.00 0.00 0.00
Miles Trip % Trip Purpose %
Land Use H-W or C-W H-S or C-C H-O or C-NW H-W or C-W H-S or C-C H-O or C-NW Primary Diverted Pass-by
Apartments Mid Rise 0.00 0.00 0.00 0.00 0.00 0.00 86 11 3
General Office Building 16.60 8.40 6.90 33.00 48.00 19.00 77 19 4
Regional Shopping Center 16.60 8.40 6.90 16.30 64.70 19.00 54 35 11
4.4 Fleet Mix
CalEEMod Version: CalEEMod.2016.3.2 Date: 8/28/2020 12:13 PMPage 19 of 25
ITC Adjusted Baseline - South Coast Air Basin, Summer

5.0 Energy Detail
ROG NOx CO SO2 Fugitive PM10
Exhaust PM10
PM10 Total
Fugitive PM2.5
Exhaust PM2.5
PM2.5 Total
Bio- CO2 NBio- CO2 Total CO2 CH4 N2O CO2e
Category lb/day lb/day
NaturalGas Mitigated
0.2625 2.3283 1.5803 0.0143 0.1814 0.1814 0.1814 0.1814 2,863.3755
2,863.3755
0.0549 0.0525 2,880.3911
NaturalGas Unmitigated
0.2625 2.3283 1.5803 0.0143 0.1814 0.1814 0.1814 0.1814 2,863.3755
2,863.3755
0.0549 0.0525 2,880.3911
5.1 Mitigation Measures Energy
Land Use LDA LDT1 LDT2 MDV LHD1 LHD2 MHD HHD OBUS UBUS MCY SBUS MH
Apartments Mid Rise 0.550339 0.043800 0.200255 0.122233 0.016799 0.005871 0.020633 0.029727 0.002027 0.001932 0.004726 0.000704 0.000955
General Office Building 0.550339 0.043800 0.200255 0.122233 0.016799 0.005871 0.020633 0.029727 0.002027 0.001932 0.004726 0.000704 0.000955
Regional Shopping Center 0.550339 0.043800 0.200255 0.122233 0.016799 0.005871 0.020633 0.029727 0.002027 0.001932 0.004726 0.000704 0.000955
Historical Energy Use: N
CalEEMod Version: CalEEMod.2016.3.2 Date: 8/28/2020 12:13 PMPage 20 of 25
ITC Adjusted Baseline - South Coast Air Basin, Summer

6.0 Area Detail
5.2 Energy by Land Use - NaturalGas
NaturalGas Use
ROG NOx CO SO2 Fugitive PM10
Exhaust PM10
PM10 Total
Fugitive PM2.5
Exhaust PM2.5
PM2.5 Total
Bio- CO2 NBio- CO2 Total CO2 CH4 N2O CO2e
Land Use kBTU/yr lb/day lb/day
Apartments Mid Rise
9830.75 0.1060 0.9060 0.3855 5.7800e-003
0.0733 0.0733 0.0733 0.0733 1,156.5584
1,156.5584
0.0222 0.0212 1,163.4313
General Office Building
11669.2 0.1258 1.1440 0.9610 6.8600e-003
0.0870 0.0870 0.0870 0.0870 1,372.8413
1,372.8413
0.0263 0.0252 1,380.9994
Regional Shopping Center
2838.79 0.0306 0.2783 0.2338 1.6700e-003
0.0212 0.0212 0.0212 0.0212 333.9758 333.9758 6.4000e-003
6.1200e-003
335.9605
Total 0.2625 2.3283 1.5803 0.0143 0.1814 0.1814 0.1814 0.1814 2,863.3755
2,863.3755
0.0549 0.0525 2,880.3911
Unmitigated
NaturalGas Use
ROG NOx CO SO2 Fugitive PM10
Exhaust PM10
PM10 Total
Fugitive PM2.5
Exhaust PM2.5
PM2.5 Total
Bio- CO2 NBio- CO2 Total CO2 CH4 N2O CO2e
Land Use kBTU/yr lb/day lb/day
Apartments Mid Rise
9.83075 0.1060 0.9060 0.3855 5.7800e-003
0.0733 0.0733 0.0733 0.0733 1,156.5584
1,156.5584
0.0222 0.0212 1,163.4313
General Office Building
11.6692 0.1258 1.1440 0.9610 6.8600e-003
0.0870 0.0870 0.0870 0.0870 1,372.8413
1,372.8413
0.0263 0.0252 1,380.9994
Regional Shopping Center
2.83879 0.0306 0.2783 0.2338 1.6700e-003
0.0212 0.0212 0.0212 0.0212 333.9758 333.9758 6.4000e-003
6.1200e-003
335.9605
Total 0.2625 2.3283 1.5803 0.0143 0.1814 0.1814 0.1814 0.1814 2,863.3755
2,863.3755
0.0549 0.0525 2,880.3911
Mitigated
CalEEMod Version: CalEEMod.2016.3.2 Date: 8/28/2020 12:13 PMPage 21 of 25
ITC Adjusted Baseline - South Coast Air Basin, Summer

6.1 Mitigation Measures Area
6.0 Area Detail
ROG NOx CO SO2 Fugitive PM10
Exhaust PM10
PM10 Total
Fugitive PM2.5
Exhaust PM2.5
PM2.5 Total
Bio- CO2 NBio- CO2 Total CO2 CH4 N2O CO2e
Category lb/day lb/day
Mitigated 111.8199 6.8165 185.7779 0.4088 24.1292 24.1292 24.1292 24.1292 2,941.2124
5,698.8608
8,640.0732
8.8173 0.1996 8,919.9956
Unmitigated 111.8199 6.8165 185.7779 0.4088 24.1292 24.1292 24.1292 24.1292 2,941.2124
5,698.8608
8,640.0732
8.8173 0.1996 8,919.9956
CalEEMod Version: CalEEMod.2016.3.2 Date: 8/28/2020 12:13 PMPage 22 of 25
ITC Adjusted Baseline - South Coast Air Basin, Summer

6.2 Area by SubCategory
ROG NOx CO SO2 Fugitive PM10
Exhaust PM10
PM10 Total
Fugitive PM2.5
Exhaust PM2.5
PM2.5 Total
Bio- CO2 NBio- CO2 Total CO2 CH4 N2O CO2e
SubCategory lb/day lb/day
Architectural Coating
3.0376 0.0000 0.0000 0.0000 0.0000 0.0000 0.0000
Consumer Products
25.7020 0.0000 0.0000 0.0000 0.0000 0.0000 0.0000
Hearth 82.2793 6.5150 159.6853 0.4074 23.9859 23.9859 23.9859 23.9859 2,941.2124
5,652.0000
8,593.2124
8.7713 0.1996 8,871.9833
Landscaping 0.8010 0.3016 26.0926 1.3800e-003
0.1433 0.1433 0.1433 0.1433 46.8608 46.8608 0.0461 48.0123
Total 111.8199 6.8165 185.7779 0.4088 24.1292 24.1292 24.1292 24.1292 2,941.2124
5,698.8608
8,640.0732
8.8173 0.1996 8,919.9956
Unmitigated
CalEEMod Version: CalEEMod.2016.3.2 Date: 8/28/2020 12:13 PMPage 23 of 25
ITC Adjusted Baseline - South Coast Air Basin, Summer

8.1 Mitigation Measures Waste
7.1 Mitigation Measures Water
7.0 Water Detail
8.0 Waste Detail
6.2 Area by SubCategory
ROG NOx CO SO2 Fugitive PM10
Exhaust PM10
PM10 Total
Fugitive PM2.5
Exhaust PM2.5
PM2.5 Total
Bio- CO2 NBio- CO2 Total CO2 CH4 N2O CO2e
SubCategory lb/day lb/day
Architectural Coating
3.0376 0.0000 0.0000 0.0000 0.0000 0.0000 0.0000
Consumer Products
25.7020 0.0000 0.0000 0.0000 0.0000 0.0000 0.0000
Hearth 82.2793 6.5150 159.6853 0.4074 23.9859 23.9859 23.9859 23.9859 2,941.2124
5,652.0000
8,593.2124
8.7713 0.1996 8,871.9833
Landscaping 0.8010 0.3016 26.0926 1.3800e-003
0.1433 0.1433 0.1433 0.1433 46.8608 46.8608 0.0461 48.0123
Total 111.8199 6.8165 185.7779 0.4088 24.1292 24.1292 24.1292 24.1292 2,941.2124
5,698.8608
8,640.0732
8.8173 0.1996 8,919.9956
Mitigated
9.0 Operational Offroad
Equipment Type Number Hours/Day Days/Year Horse Power Load Factor Fuel Type
10.0 Stationary Equipment
CalEEMod Version: CalEEMod.2016.3.2 Date: 8/28/2020 12:13 PMPage 24 of 25
ITC Adjusted Baseline - South Coast Air Basin, Summer

11.0 Vegetation
Fire Pumps and Emergency Generators
Equipment Type Number Hours/Day Hours/Year Horse Power Load Factor Fuel Type
Boilers
Equipment Type Number Heat Input/Day Heat Input/Year Boiler Rating Fuel Type
User Defined Equipment
Equipment Type Number
CalEEMod Version: CalEEMod.2016.3.2 Date: 8/28/2020 12:13 PMPage 25 of 25
ITC Adjusted Baseline - South Coast Air Basin, Summer

Project Characteristics -
Land Use -
Construction Phase - Adjusted Baseline, no construction
Vehicle Trips - Using EMFAC for motor vehicle emissions
Grading -
1.1 Land Usage
Land Uses Size Metric Lot Acreage Floor Surface Area Population
General Office Building 466.00 1000sqft 10.70 466,000.00 0
Apartments Mid Rise 314.00 Dwelling Unit 8.26 314,000.00 898
Regional Shopping Center 518.08 1000sqft 11.89 518,080.00 0
1.2 Other Project Characteristics
Urbanization
Climate Zone
Urban
8
Wind Speed (m/s) Precipitation Freq (Days)2.2 31
1.3 User Entered Comments & Non-Default Data
1.0 Project Characteristics
Utility Company Southern California Edison
2020Operational Year
CO2 Intensity (lb/MWhr)
702.44 0.029CH4 Intensity (lb/MWhr)
0.006N2O Intensity (lb/MWhr)
ITC Adjusted BaselineSouth Coast Air Basin, Winter
CalEEMod Version: CalEEMod.2016.3.2 Date: 8/28/2020 12:16 PMPage 1 of 25
ITC Adjusted Baseline - South Coast Air Basin, Winter

2.0 Emissions Summary
Table Name Column Name Default Value New Value
tblConstructionPhase NumDays 30.00 0.00
tblConstructionPhase NumDays 20.00 0.00
tblConstructionPhase NumDays 45.00 0.00
tblConstructionPhase NumDays 500.00 0.00
tblConstructionPhase NumDays 35.00 0.00
tblConstructionPhase NumDays 35.00 0.00
tblVehicleTrips HO_TL 8.70 0.00
tblVehicleTrips HO_TTP 40.60 0.00
tblVehicleTrips HS_TL 5.90 0.00
tblVehicleTrips HS_TTP 19.20 0.00
tblVehicleTrips HW_TL 14.70 0.00
tblVehicleTrips HW_TTP 40.20 0.00
tblVehicleTrips ST_TR 6.39 0.00
tblVehicleTrips ST_TR 2.46 0.00
tblVehicleTrips ST_TR 49.97 0.00
tblVehicleTrips SU_TR 5.86 0.00
tblVehicleTrips SU_TR 1.05 0.00
tblVehicleTrips SU_TR 25.24 0.00
tblVehicleTrips WD_TR 6.65 0.00
tblVehicleTrips WD_TR 11.03 0.00
tblVehicleTrips WD_TR 42.70 0.00
CalEEMod Version: CalEEMod.2016.3.2 Date: 8/28/2020 12:16 PMPage 2 of 25
ITC Adjusted Baseline - South Coast Air Basin, Winter

2.1 Overall Construction (Maximum Daily Emission)
ROG NOx CO SO2 Fugitive PM10
Exhaust PM10
PM10 Total
Fugitive PM2.5
Exhaust PM2.5
PM2.5 Total
Bio- CO2 NBio- CO2 Total CO2 CH4 N2O CO2e
Year lb/day lb/day
2018 0.0000 0.0000 0.0000 0.0000 0.0000 2.5785 0.0000 0.0000 2.3722 0.0000 0.0000 0.0000 0.0000 0.0000 0.0000 0.0000
2021 0.0000 0.0000 0.0000 0.0000 0.0000 1.9870 0.0000 0.0000 1.8280 0.0000 0.0000 0.0000 0.0000 0.0000 0.0000 0.0000
2027 0.0000 0.0000 0.0000 0.0000 0.0000 0.5799 0.0000 0.0000 0.5449 0.0000 0.0000 0.0000 0.0000 0.0000 0.0000 0.0000
2086 0.0000 0.0000 0.0000 0.0000 0.0000 0.1164 0.0000 0.0000 0.1164 0.0000 0.0000 0.0000 0.0000 0.0000 0.0000 0.0000
2090 0.0000 0.0000 0.0000 0.0000 0.0000 7.4300e-003
0.0000 0.0000 7.4300e-003
0.0000 0.0000 0.0000 0.0000 0.0000 0.0000 0.0000
Maximum 0.0000 0.0000 0.0000 0.0000 0.0000 2.5785 0.0000 0.0000 2.3722 0.0000 0.0000 0.0000 0.0000 0.0000 0.0000 0.0000
Unmitigated Construction
CalEEMod Version: CalEEMod.2016.3.2 Date: 8/28/2020 12:16 PMPage 3 of 25
ITC Adjusted Baseline - South Coast Air Basin, Winter

2.1 Overall Construction (Maximum Daily Emission)
ROG NOx CO SO2 Fugitive PM10
Exhaust PM10
PM10 Total
Fugitive PM2.5
Exhaust PM2.5
PM2.5 Total
Bio- CO2 NBio- CO2 Total CO2 CH4 N2O CO2e
Year lb/day lb/day
2018 0.0000 0.0000 0.0000 0.0000 0.0000 2.5785 0.0000 0.0000 2.3722 0.0000 0.0000 0.0000 0.0000 0.0000 0.0000 0.0000
2021 0.0000 0.0000 0.0000 0.0000 0.0000 1.9870 0.0000 0.0000 1.8280 0.0000 0.0000 0.0000 0.0000 0.0000 0.0000 0.0000
2027 0.0000 0.0000 0.0000 0.0000 0.0000 0.5799 0.0000 0.0000 0.5449 0.0000 0.0000 0.0000 0.0000 0.0000 0.0000 0.0000
2086 0.0000 0.0000 0.0000 0.0000 0.0000 0.1164 0.0000 0.0000 0.1164 0.0000 0.0000 0.0000 0.0000 0.0000 0.0000 0.0000
2090 0.0000 0.0000 0.0000 0.0000 0.0000 7.4300e-003
0.0000 0.0000 7.4300e-003
0.0000 0.0000 0.0000 0.0000 0.0000 0.0000 0.0000
Maximum 0.0000 0.0000 0.0000 0.0000 0.0000 2.5785 0.0000 0.0000 2.3722 0.0000 0.0000 0.0000 0.0000 0.0000 0.0000 0.0000
Mitigated Construction
ROG NOx CO SO2 Fugitive PM10
Exhaust PM10
PM10 Total
Fugitive PM2.5
Exhaust PM2.5
PM2.5 Total
Bio- CO2 NBio-CO2 Total CO2 CH4 N20 CO2e
Percent Reduction
0.00 0.00 0.00 0.00 0.00 0.00 0.00 0.00 0.00 0.00 0.00 0.00 0.00 0.00 0.00 0.00
CalEEMod Version: CalEEMod.2016.3.2 Date: 8/28/2020 12:16 PMPage 4 of 25
ITC Adjusted Baseline - South Coast Air Basin, Winter

2.2 Overall Operational
ROG NOx CO SO2 Fugitive PM10
Exhaust PM10
PM10 Total
Fugitive PM2.5
Exhaust PM2.5
PM2.5 Total
Bio- CO2 NBio- CO2 Total CO2 CH4 N2O CO2e
Category lb/day lb/day
Area 111.8199 6.8165 185.7779 0.4088 24.1292 24.1292 24.1292 24.1292 2,941.2124
5,698.8608
8,640.0732
8.8173 0.1996 8,919.9956
Energy 0.2625 2.3283 1.5803 0.0143 0.1814 0.1814 0.1814 0.1814 2,863.3755
2,863.3755
0.0549 0.0525 2,880.3911
Mobile 0.0000 0.0000 0.0000 0.0000 0.0000 0.0000 0.0000 0.0000 0.0000 0.0000 0.0000 0.0000 0.0000 0.0000
Total 112.0823 9.1448 187.3582 0.4231 0.0000 24.3106 24.3106 0.0000 24.3106 24.3106 2,941.2124
8,562.2363
11,503.4487
8.8722 0.2521 11,800.3867
Unmitigated Operational
ROG NOx CO SO2 Fugitive PM10
Exhaust PM10
PM10 Total
Fugitive PM2.5
Exhaust PM2.5
PM2.5 Total
Bio- CO2 NBio- CO2 Total CO2 CH4 N2O CO2e
Category lb/day lb/day
Area 111.8199 6.8165 185.7779 0.4088 24.1292 24.1292 24.1292 24.1292 2,941.2124
5,698.8608
8,640.0732
8.8173 0.1996 8,919.9956
Energy 0.2625 2.3283 1.5803 0.0143 0.1814 0.1814 0.1814 0.1814 2,863.3755
2,863.3755
0.0549 0.0525 2,880.3911
Mobile 0.0000 0.0000 0.0000 0.0000 0.0000 0.0000 0.0000 0.0000 0.0000 0.0000 0.0000 0.0000 0.0000 0.0000
Total 112.0823 9.1448 187.3582 0.4231 0.0000 24.3106 24.3106 0.0000 24.3106 24.3106 2,941.2124
8,562.2363
11,503.4487
8.8722 0.2521 11,800.3867
Mitigated Operational
CalEEMod Version: CalEEMod.2016.3.2 Date: 8/28/2020 12:16 PMPage 5 of 25
ITC Adjusted Baseline - South Coast Air Basin, Winter

3.0 Construction Detail
Construction Phase
Phase Number
Phase Name Phase Type Start Date End Date Num Days Week
Num Days Phase Description
1 Demolition Demolition 1/1/2015 12/31/2014 5 0
2 Site Preparation Site Preparation 11/1/2018 10/31/2018 5 0
3 Grading Grading 2/18/2021 2/17/2021 5 0
4 Building Construction Building Construction 1/28/2027 1/27/2027 5 0
5 Paving Paving 6/27/2086 6/26/2086 5 0
6 Architectural Coating Architectural Coating 9/14/2090 9/13/2090 5 0
OffRoad Equipment
ROG NOx CO SO2 Fugitive PM10
Exhaust PM10
PM10 Total
Fugitive PM2.5
Exhaust PM2.5
PM2.5 Total
Bio- CO2 NBio-CO2 Total CO2 CH4 N20 CO2e
Percent Reduction
0.00 0.00 0.00 0.00 0.00 0.00 0.00 0.00 0.00 0.00 0.00 0.00 0.00 0.00 0.00 0.00
Residential Indoor: 635,850; Residential Outdoor: 211,950; Non-Residential Indoor: 1,476,120; Non-Residential Outdoor: 492,040; Striped Parking Area: 0 (Architectural Coating – sqft)
Acres of Grading (Site Preparation Phase): 0
Acres of Grading (Grading Phase): 0
Acres of Paving: 0
CalEEMod Version: CalEEMod.2016.3.2 Date: 8/28/2020 12:16 PMPage 6 of 25
ITC Adjusted Baseline - South Coast Air Basin, Winter

Phase Name Offroad Equipment Type Amount Usage Hours Horse Power Load Factor
Demolition Concrete/Industrial Saws 1 8.00 81 0.73
Demolition Excavators 3 8.00 158 0.38
Demolition Rubber Tired Dozers 2 8.00 247 0.40
Site Preparation Rubber Tired Dozers 3 8.00 247 0.40
Site Preparation Tractors/Loaders/Backhoes 4 8.00 97 0.37
Grading Excavators 2 8.00 158 0.38
Grading Graders 1 8.00 187 0.41
Grading Rubber Tired Dozers 1 8.00 247 0.40
Grading Scrapers 2 8.00 367 0.48
Grading Tractors/Loaders/Backhoes 2 8.00 97 0.37
Building Construction Cranes 1 7.00 231 0.29
Building Construction Forklifts 3 8.00 89 0.20
Building Construction Generator Sets 1 8.00 84 0.74
Building Construction Tractors/Loaders/Backhoes 3 7.00 97 0.37
Building Construction Welders 1 8.00 46 0.45
Paving Pavers 2 8.00 130 0.42
Paving Paving Equipment 2 8.00 132 0.36
Paving Rollers 2 8.00 80 0.38
Architectural Coating Air Compressors 1 6.00 78 0.48
Trips and VMT
CalEEMod Version: CalEEMod.2016.3.2 Date: 8/28/2020 12:16 PMPage 7 of 25
ITC Adjusted Baseline - South Coast Air Basin, Winter

3.3 Site Preparation - 2018
ROG NOx CO SO2 Fugitive PM10
Exhaust PM10
PM10 Total
Fugitive PM2.5
Exhaust PM2.5
PM2.5 Total
Bio- CO2 NBio- CO2 Total CO2 CH4 N2O CO2e
Category lb/day lb/day
Fugitive Dust 0.0000 0.0000 0.0000 0.0000 0.0000 0.0000 0.0000 0.0000 0.0000 0.0000 0.0000 0.0000 0.0000 0.0000 0.0000 0.0000
Off-Road 0.0000 0.0000 0.0000 0.0000 0.0000 0.0000 0.0000 0.0000 0.0000 0.0000 0.0000 0.0000 0.0000 0.0000 0.0000 0.0000
Total 0.0000 0.0000 0.0000 0.0000 0.0000 0.0000 0.0000 0.0000 0.0000 0.0000 0.0000 0.0000 0.0000 0.0000 0.0000 0.0000
Unmitigated Construction On-Site
3.1 Mitigation Measures Construction
Phase Name Offroad Equipment Count
Worker Trip Number
Vendor Trip Number
Hauling Trip Number
Worker Trip Length
Vendor Trip Length
Hauling Trip Length
Worker Vehicle Class
Vendor Vehicle Class
Hauling Vehicle Class
Demolition 6 15.00 0.00 0.00 14.70 6.90 20.00 LD_Mix HDT_Mix HHDT
Site Preparation 7 18.00 0.00 0.00 14.70 6.90 20.00 LD_Mix HDT_Mix HHDT
Grading 8 20.00 0.00 0.00 14.70 6.90 20.00 LD_Mix HDT_Mix HHDT
Building Construction 9 541.00 195.00 0.00 14.70 6.90 20.00 LD_Mix HDT_Mix HHDT
Paving 6 15.00 0.00 0.00 14.70 6.90 20.00 LD_Mix HDT_Mix HHDT
Architectural Coating 1 108.00 0.00 0.00 14.70 6.90 20.00 LD_Mix HDT_Mix HHDT
CalEEMod Version: CalEEMod.2016.3.2 Date: 8/28/2020 12:16 PMPage 8 of 25
ITC Adjusted Baseline - South Coast Air Basin, Winter

3.3 Site Preparation - 2018
ROG NOx CO SO2 Fugitive PM10
Exhaust PM10
PM10 Total
Fugitive PM2.5
Exhaust PM2.5
PM2.5 Total
Bio- CO2 NBio- CO2 Total CO2 CH4 N2O CO2e
Category lb/day lb/day
Hauling 0.0000 0.0000 0.0000 0.0000 0.0000 0.0000 0.0000 0.0000 0.0000 0.0000 0.0000 0.0000 0.0000 0.0000 0.0000 0.0000
Vendor 0.0000 0.0000 0.0000 0.0000 0.0000 0.0000 0.0000 0.0000 0.0000 0.0000 0.0000 0.0000 0.0000 0.0000 0.0000 0.0000
Worker 0.0000 0.0000 0.0000 0.0000 0.0000 0.0000 0.0000 0.0000 0.0000 0.0000 0.0000 0.0000 0.0000 0.0000 0.0000 0.0000
Total 0.0000 0.0000 0.0000 0.0000 0.0000 0.0000 0.0000 0.0000 0.0000 0.0000 0.0000 0.0000 0.0000 0.0000 0.0000 0.0000
Unmitigated Construction Off-Site
ROG NOx CO SO2 Fugitive PM10
Exhaust PM10
PM10 Total
Fugitive PM2.5
Exhaust PM2.5
PM2.5 Total
Bio- CO2 NBio- CO2 Total CO2 CH4 N2O CO2e
Category lb/day lb/day
Fugitive Dust 0.0000 0.0000 0.0000 0.0000 0.0000 0.0000 0.0000 0.0000 0.0000 0.0000 0.0000 0.0000 0.0000 0.0000 0.0000 0.0000
Off-Road 0.0000 0.0000 0.0000 0.0000 0.0000 0.0000 0.0000 0.0000 0.0000 0.0000 0.0000 0.0000 0.0000 0.0000 0.0000 0.0000
Total 0.0000 0.0000 0.0000 0.0000 0.0000 0.0000 0.0000 0.0000 0.0000 0.0000 0.0000 0.0000 0.0000 0.0000 0.0000 0.0000
Mitigated Construction On-Site
CalEEMod Version: CalEEMod.2016.3.2 Date: 8/28/2020 12:16 PMPage 9 of 25
ITC Adjusted Baseline - South Coast Air Basin, Winter

3.3 Site Preparation - 2018
ROG NOx CO SO2 Fugitive PM10
Exhaust PM10
PM10 Total
Fugitive PM2.5
Exhaust PM2.5
PM2.5 Total
Bio- CO2 NBio- CO2 Total CO2 CH4 N2O CO2e
Category lb/day lb/day
Hauling 0.0000 0.0000 0.0000 0.0000 0.0000 0.0000 0.0000 0.0000 0.0000 0.0000 0.0000 0.0000 0.0000 0.0000 0.0000 0.0000
Vendor 0.0000 0.0000 0.0000 0.0000 0.0000 0.0000 0.0000 0.0000 0.0000 0.0000 0.0000 0.0000 0.0000 0.0000 0.0000 0.0000
Worker 0.0000 0.0000 0.0000 0.0000 0.0000 0.0000 0.0000 0.0000 0.0000 0.0000 0.0000 0.0000 0.0000 0.0000 0.0000 0.0000
Total 0.0000 0.0000 0.0000 0.0000 0.0000 0.0000 0.0000 0.0000 0.0000 0.0000 0.0000 0.0000 0.0000 0.0000 0.0000 0.0000
Mitigated Construction Off-Site
3.4 Grading - 2021
ROG NOx CO SO2 Fugitive PM10
Exhaust PM10
PM10 Total
Fugitive PM2.5
Exhaust PM2.5
PM2.5 Total
Bio- CO2 NBio- CO2 Total CO2 CH4 N2O CO2e
Category lb/day lb/day
Fugitive Dust 0.0000 0.0000 0.0000 0.0000 0.0000 0.0000 0.0000 0.0000 0.0000 0.0000 0.0000 0.0000 0.0000 0.0000 0.0000 0.0000
Off-Road 0.0000 0.0000 0.0000 0.0000 0.0000 0.0000 0.0000 0.0000 0.0000 0.0000 0.0000 0.0000 0.0000 0.0000 0.0000 0.0000
Total 0.0000 0.0000 0.0000 0.0000 0.0000 0.0000 0.0000 0.0000 0.0000 0.0000 0.0000 0.0000 0.0000 0.0000 0.0000 0.0000
Unmitigated Construction On-Site
CalEEMod Version: CalEEMod.2016.3.2 Date: 8/28/2020 12:16 PMPage 10 of 25
ITC Adjusted Baseline - South Coast Air Basin, Winter

3.4 Grading - 2021
ROG NOx CO SO2 Fugitive PM10
Exhaust PM10
PM10 Total
Fugitive PM2.5
Exhaust PM2.5
PM2.5 Total
Bio- CO2 NBio- CO2 Total CO2 CH4 N2O CO2e
Category lb/day lb/day
Hauling 0.0000 0.0000 0.0000 0.0000 0.0000 0.0000 0.0000 0.0000 0.0000 0.0000 0.0000 0.0000 0.0000 0.0000 0.0000 0.0000
Vendor 0.0000 0.0000 0.0000 0.0000 0.0000 0.0000 0.0000 0.0000 0.0000 0.0000 0.0000 0.0000 0.0000 0.0000 0.0000 0.0000
Worker 0.0000 0.0000 0.0000 0.0000 0.0000 0.0000 0.0000 0.0000 0.0000 0.0000 0.0000 0.0000 0.0000 0.0000 0.0000 0.0000
Total 0.0000 0.0000 0.0000 0.0000 0.0000 0.0000 0.0000 0.0000 0.0000 0.0000 0.0000 0.0000 0.0000 0.0000 0.0000 0.0000
Unmitigated Construction Off-Site
ROG NOx CO SO2 Fugitive PM10
Exhaust PM10
PM10 Total
Fugitive PM2.5
Exhaust PM2.5
PM2.5 Total
Bio- CO2 NBio- CO2 Total CO2 CH4 N2O CO2e
Category lb/day lb/day
Fugitive Dust 0.0000 0.0000 0.0000 0.0000 0.0000 0.0000 0.0000 0.0000 0.0000 0.0000 0.0000 0.0000 0.0000 0.0000 0.0000 0.0000
Off-Road 0.0000 0.0000 0.0000 0.0000 0.0000 0.0000 0.0000 0.0000 0.0000 0.0000 0.0000 0.0000 0.0000 0.0000 0.0000 0.0000
Total 0.0000 0.0000 0.0000 0.0000 0.0000 0.0000 0.0000 0.0000 0.0000 0.0000 0.0000 0.0000 0.0000 0.0000 0.0000 0.0000
Mitigated Construction On-Site
CalEEMod Version: CalEEMod.2016.3.2 Date: 8/28/2020 12:16 PMPage 11 of 25
ITC Adjusted Baseline - South Coast Air Basin, Winter

3.4 Grading - 2021
ROG NOx CO SO2 Fugitive PM10
Exhaust PM10
PM10 Total
Fugitive PM2.5
Exhaust PM2.5
PM2.5 Total
Bio- CO2 NBio- CO2 Total CO2 CH4 N2O CO2e
Category lb/day lb/day
Hauling 0.0000 0.0000 0.0000 0.0000 0.0000 0.0000 0.0000 0.0000 0.0000 0.0000 0.0000 0.0000 0.0000 0.0000 0.0000 0.0000
Vendor 0.0000 0.0000 0.0000 0.0000 0.0000 0.0000 0.0000 0.0000 0.0000 0.0000 0.0000 0.0000 0.0000 0.0000 0.0000 0.0000
Worker 0.0000 0.0000 0.0000 0.0000 0.0000 0.0000 0.0000 0.0000 0.0000 0.0000 0.0000 0.0000 0.0000 0.0000 0.0000 0.0000
Total 0.0000 0.0000 0.0000 0.0000 0.0000 0.0000 0.0000 0.0000 0.0000 0.0000 0.0000 0.0000 0.0000 0.0000 0.0000 0.0000
Mitigated Construction Off-Site
3.5 Building Construction - 2027
ROG NOx CO SO2 Fugitive PM10
Exhaust PM10
PM10 Total
Fugitive PM2.5
Exhaust PM2.5
PM2.5 Total
Bio- CO2 NBio- CO2 Total CO2 CH4 N2O CO2e
Category lb/day lb/day
Off-Road 0.0000 0.0000 0.0000 0.0000 0.0000 0.0000 0.0000 0.0000 0.0000 0.0000 0.0000 0.0000 0.0000 0.0000 0.0000 0.0000
Total 0.0000 0.0000 0.0000 0.0000 0.0000 0.0000 0.0000 0.0000 0.0000 0.0000 0.0000 0.0000 0.0000 0.0000 0.0000 0.0000
Unmitigated Construction On-Site
CalEEMod Version: CalEEMod.2016.3.2 Date: 8/28/2020 12:16 PMPage 12 of 25
ITC Adjusted Baseline - South Coast Air Basin, Winter

3.5 Building Construction - 2027
ROG NOx CO SO2 Fugitive PM10
Exhaust PM10
PM10 Total
Fugitive PM2.5
Exhaust PM2.5
PM2.5 Total
Bio- CO2 NBio- CO2 Total CO2 CH4 N2O CO2e
Category lb/day lb/day
Hauling 0.0000 0.0000 0.0000 0.0000 0.0000 0.0000 0.0000 0.0000 0.0000 0.0000 0.0000 0.0000 0.0000 0.0000 0.0000 0.0000
Vendor 0.0000 0.0000 0.0000 0.0000 0.0000 0.0000 0.0000 0.0000 0.0000 0.0000 0.0000 0.0000 0.0000 0.0000 0.0000 0.0000
Worker 0.0000 0.0000 0.0000 0.0000 0.0000 0.0000 0.0000 0.0000 0.0000 0.0000 0.0000 0.0000 0.0000 0.0000 0.0000 0.0000
Total 0.0000 0.0000 0.0000 0.0000 0.0000 0.0000 0.0000 0.0000 0.0000 0.0000 0.0000 0.0000 0.0000 0.0000 0.0000 0.0000
Unmitigated Construction Off-Site
ROG NOx CO SO2 Fugitive PM10
Exhaust PM10
PM10 Total
Fugitive PM2.5
Exhaust PM2.5
PM2.5 Total
Bio- CO2 NBio- CO2 Total CO2 CH4 N2O CO2e
Category lb/day lb/day
Off-Road 0.0000 0.0000 0.0000 0.0000 0.0000 0.0000 0.0000 0.0000 0.0000 0.0000 0.0000 0.0000 0.0000 0.0000 0.0000 0.0000
Total 0.0000 0.0000 0.0000 0.0000 0.0000 0.0000 0.0000 0.0000 0.0000 0.0000 0.0000 0.0000 0.0000 0.0000 0.0000 0.0000
Mitigated Construction On-Site
CalEEMod Version: CalEEMod.2016.3.2 Date: 8/28/2020 12:16 PMPage 13 of 25
ITC Adjusted Baseline - South Coast Air Basin, Winter

3.5 Building Construction - 2027
ROG NOx CO SO2 Fugitive PM10
Exhaust PM10
PM10 Total
Fugitive PM2.5
Exhaust PM2.5
PM2.5 Total
Bio- CO2 NBio- CO2 Total CO2 CH4 N2O CO2e
Category lb/day lb/day
Hauling 0.0000 0.0000 0.0000 0.0000 0.0000 0.0000 0.0000 0.0000 0.0000 0.0000 0.0000 0.0000 0.0000 0.0000 0.0000 0.0000
Vendor 0.0000 0.0000 0.0000 0.0000 0.0000 0.0000 0.0000 0.0000 0.0000 0.0000 0.0000 0.0000 0.0000 0.0000 0.0000 0.0000
Worker 0.0000 0.0000 0.0000 0.0000 0.0000 0.0000 0.0000 0.0000 0.0000 0.0000 0.0000 0.0000 0.0000 0.0000 0.0000 0.0000
Total 0.0000 0.0000 0.0000 0.0000 0.0000 0.0000 0.0000 0.0000 0.0000 0.0000 0.0000 0.0000 0.0000 0.0000 0.0000 0.0000
Mitigated Construction Off-Site
3.6 Paving - 2086
ROG NOx CO SO2 Fugitive PM10
Exhaust PM10
PM10 Total
Fugitive PM2.5
Exhaust PM2.5
PM2.5 Total
Bio- CO2 NBio- CO2 Total CO2 CH4 N2O CO2e
Category lb/day lb/day
Off-Road 0.0000 0.0000 0.0000 0.0000 0.0000 0.0000 0.0000 0.0000 0.0000 0.0000 0.0000 0.0000 0.0000 0.0000 0.0000 0.0000
Paving 0.0000 0.0000 0.0000 0.0000 0.0000 0.0000 0.0000 0.0000 0.0000 0.0000 0.0000 0.0000 0.0000 0.0000 0.0000 0.0000
Total 0.0000 0.0000 0.0000 0.0000 0.0000 0.0000 0.0000 0.0000 0.0000 0.0000 0.0000 0.0000 0.0000 0.0000 0.0000 0.0000
Unmitigated Construction On-Site
CalEEMod Version: CalEEMod.2016.3.2 Date: 8/28/2020 12:16 PMPage 14 of 25
ITC Adjusted Baseline - South Coast Air Basin, Winter

3.6 Paving - 2086
ROG NOx CO SO2 Fugitive PM10
Exhaust PM10
PM10 Total
Fugitive PM2.5
Exhaust PM2.5
PM2.5 Total
Bio- CO2 NBio- CO2 Total CO2 CH4 N2O CO2e
Category lb/day lb/day
Hauling 0.0000 0.0000 0.0000 0.0000 0.0000 0.0000 0.0000 0.0000 0.0000 0.0000 0.0000 0.0000 0.0000 0.0000 0.0000 0.0000
Vendor 0.0000 0.0000 0.0000 0.0000 0.0000 0.0000 0.0000 0.0000 0.0000 0.0000 0.0000 0.0000 0.0000 0.0000 0.0000 0.0000
Worker 0.0000 0.0000 0.0000 0.0000 0.0000 0.0000 0.0000 0.0000 0.0000 0.0000 0.0000 0.0000 0.0000 0.0000 0.0000 0.0000
Total 0.0000 0.0000 0.0000 0.0000 0.0000 0.0000 0.0000 0.0000 0.0000 0.0000 0.0000 0.0000 0.0000 0.0000 0.0000 0.0000
Unmitigated Construction Off-Site
ROG NOx CO SO2 Fugitive PM10
Exhaust PM10
PM10 Total
Fugitive PM2.5
Exhaust PM2.5
PM2.5 Total
Bio- CO2 NBio- CO2 Total CO2 CH4 N2O CO2e
Category lb/day lb/day
Off-Road 0.0000 0.0000 0.0000 0.0000 0.0000 0.0000 0.0000 0.0000 0.0000 0.0000 0.0000 0.0000 0.0000 0.0000 0.0000 0.0000
Paving 0.0000 0.0000 0.0000 0.0000 0.0000 0.0000 0.0000 0.0000 0.0000 0.0000 0.0000 0.0000 0.0000 0.0000 0.0000 0.0000
Total 0.0000 0.0000 0.0000 0.0000 0.0000 0.0000 0.0000 0.0000 0.0000 0.0000 0.0000 0.0000 0.0000 0.0000 0.0000 0.0000
Mitigated Construction On-Site
CalEEMod Version: CalEEMod.2016.3.2 Date: 8/28/2020 12:16 PMPage 15 of 25
ITC Adjusted Baseline - South Coast Air Basin, Winter

3.6 Paving - 2086
ROG NOx CO SO2 Fugitive PM10
Exhaust PM10
PM10 Total
Fugitive PM2.5
Exhaust PM2.5
PM2.5 Total
Bio- CO2 NBio- CO2 Total CO2 CH4 N2O CO2e
Category lb/day lb/day
Hauling 0.0000 0.0000 0.0000 0.0000 0.0000 0.0000 0.0000 0.0000 0.0000 0.0000 0.0000 0.0000 0.0000 0.0000 0.0000 0.0000
Vendor 0.0000 0.0000 0.0000 0.0000 0.0000 0.0000 0.0000 0.0000 0.0000 0.0000 0.0000 0.0000 0.0000 0.0000 0.0000 0.0000
Worker 0.0000 0.0000 0.0000 0.0000 0.0000 0.0000 0.0000 0.0000 0.0000 0.0000 0.0000 0.0000 0.0000 0.0000 0.0000 0.0000
Total 0.0000 0.0000 0.0000 0.0000 0.0000 0.0000 0.0000 0.0000 0.0000 0.0000 0.0000 0.0000 0.0000 0.0000 0.0000 0.0000
Mitigated Construction Off-Site
3.7 Architectural Coating - 2090
ROG NOx CO SO2 Fugitive PM10
Exhaust PM10
PM10 Total
Fugitive PM2.5
Exhaust PM2.5
PM2.5 Total
Bio- CO2 NBio- CO2 Total CO2 CH4 N2O CO2e
Category lb/day lb/day
Archit. Coating 0.0000 0.0000 0.0000 0.0000 0.0000 0.0000 0.0000 0.0000 0.0000 0.0000 0.0000 0.0000 0.0000 0.0000 0.0000 0.0000
Off-Road 0.0000 0.0000 0.0000 0.0000 0.0000 0.0000 0.0000 0.0000 0.0000 0.0000 0.0000 0.0000 0.0000 0.0000 0.0000 0.0000
Total 0.0000 0.0000 0.0000 0.0000 0.0000 0.0000 0.0000 0.0000 0.0000 0.0000 0.0000 0.0000 0.0000 0.0000 0.0000 0.0000
Unmitigated Construction On-Site
CalEEMod Version: CalEEMod.2016.3.2 Date: 8/28/2020 12:16 PMPage 16 of 25
ITC Adjusted Baseline - South Coast Air Basin, Winter

3.7 Architectural Coating - 2090
ROG NOx CO SO2 Fugitive PM10
Exhaust PM10
PM10 Total
Fugitive PM2.5
Exhaust PM2.5
PM2.5 Total
Bio- CO2 NBio- CO2 Total CO2 CH4 N2O CO2e
Category lb/day lb/day
Hauling 0.0000 0.0000 0.0000 0.0000 0.0000 0.0000 0.0000 0.0000 0.0000 0.0000 0.0000 0.0000 0.0000 0.0000 0.0000 0.0000
Vendor 0.0000 0.0000 0.0000 0.0000 0.0000 0.0000 0.0000 0.0000 0.0000 0.0000 0.0000 0.0000 0.0000 0.0000 0.0000 0.0000
Worker 0.0000 0.0000 0.0000 0.0000 0.0000 0.0000 0.0000 0.0000 0.0000 0.0000 0.0000 0.0000 0.0000 0.0000 0.0000 0.0000
Total 0.0000 0.0000 0.0000 0.0000 0.0000 0.0000 0.0000 0.0000 0.0000 0.0000 0.0000 0.0000 0.0000 0.0000 0.0000 0.0000
Unmitigated Construction Off-Site
ROG NOx CO SO2 Fugitive PM10
Exhaust PM10
PM10 Total
Fugitive PM2.5
Exhaust PM2.5
PM2.5 Total
Bio- CO2 NBio- CO2 Total CO2 CH4 N2O CO2e
Category lb/day lb/day
Archit. Coating 0.0000 0.0000 0.0000 0.0000 0.0000 0.0000 0.0000 0.0000 0.0000 0.0000 0.0000 0.0000 0.0000 0.0000 0.0000 0.0000
Off-Road 0.0000 0.0000 0.0000 0.0000 0.0000 0.0000 0.0000 0.0000 0.0000 0.0000 0.0000 0.0000 0.0000 0.0000 0.0000 0.0000
Total 0.0000 0.0000 0.0000 0.0000 0.0000 0.0000 0.0000 0.0000 0.0000 0.0000 0.0000 0.0000 0.0000 0.0000 0.0000 0.0000
Mitigated Construction On-Site
CalEEMod Version: CalEEMod.2016.3.2 Date: 8/28/2020 12:16 PMPage 17 of 25
ITC Adjusted Baseline - South Coast Air Basin, Winter

4.0 Operational Detail - Mobile
4.1 Mitigation Measures Mobile
3.7 Architectural Coating - 2090
ROG NOx CO SO2 Fugitive PM10
Exhaust PM10
PM10 Total
Fugitive PM2.5
Exhaust PM2.5
PM2.5 Total
Bio- CO2 NBio- CO2 Total CO2 CH4 N2O CO2e
Category lb/day lb/day
Hauling 0.0000 0.0000 0.0000 0.0000 0.0000 0.0000 0.0000 0.0000 0.0000 0.0000 0.0000 0.0000 0.0000 0.0000 0.0000 0.0000
Vendor 0.0000 0.0000 0.0000 0.0000 0.0000 0.0000 0.0000 0.0000 0.0000 0.0000 0.0000 0.0000 0.0000 0.0000 0.0000 0.0000
Worker 0.0000 0.0000 0.0000 0.0000 0.0000 0.0000 0.0000 0.0000 0.0000 0.0000 0.0000 0.0000 0.0000 0.0000 0.0000 0.0000
Total 0.0000 0.0000 0.0000 0.0000 0.0000 0.0000 0.0000 0.0000 0.0000 0.0000 0.0000 0.0000 0.0000 0.0000 0.0000 0.0000
Mitigated Construction Off-Site
CalEEMod Version: CalEEMod.2016.3.2 Date: 8/28/2020 12:16 PMPage 18 of 25
ITC Adjusted Baseline - South Coast Air Basin, Winter

ROG NOx CO SO2 Fugitive PM10
Exhaust PM10
PM10 Total
Fugitive PM2.5
Exhaust PM2.5
PM2.5 Total
Bio- CO2 NBio- CO2 Total CO2 CH4 N2O CO2e
Category lb/day lb/day
Mitigated 0.0000 0.0000 0.0000 0.0000 0.0000 0.0000 0.0000 0.0000 0.0000 0.0000 0.0000 0.0000 0.0000 0.0000
Unmitigated 0.0000 0.0000 0.0000 0.0000 0.0000 0.0000 0.0000 0.0000 0.0000 0.0000 0.0000 0.0000 0.0000 0.0000
4.2 Trip Summary Information
4.3 Trip Type Information
Average Daily Trip Rate Unmitigated Mitigated
Land Use Weekday Saturday Sunday Annual VMT Annual VMT
Apartments Mid Rise 0.00 0.00 0.00
General Office Building 0.00 0.00 0.00
Regional Shopping Center 0.00 0.00 0.00
Total 0.00 0.00 0.00
Miles Trip % Trip Purpose %
Land Use H-W or C-W H-S or C-C H-O or C-NW H-W or C-W H-S or C-C H-O or C-NW Primary Diverted Pass-by
Apartments Mid Rise 0.00 0.00 0.00 0.00 0.00 0.00 86 11 3
General Office Building 16.60 8.40 6.90 33.00 48.00 19.00 77 19 4
Regional Shopping Center 16.60 8.40 6.90 16.30 64.70 19.00 54 35 11
4.4 Fleet Mix
CalEEMod Version: CalEEMod.2016.3.2 Date: 8/28/2020 12:16 PMPage 19 of 25
ITC Adjusted Baseline - South Coast Air Basin, Winter

5.0 Energy Detail
ROG NOx CO SO2 Fugitive PM10
Exhaust PM10
PM10 Total
Fugitive PM2.5
Exhaust PM2.5
PM2.5 Total
Bio- CO2 NBio- CO2 Total CO2 CH4 N2O CO2e
Category lb/day lb/day
NaturalGas Mitigated
0.2625 2.3283 1.5803 0.0143 0.1814 0.1814 0.1814 0.1814 2,863.3755
2,863.3755
0.0549 0.0525 2,880.3911
NaturalGas Unmitigated
0.2625 2.3283 1.5803 0.0143 0.1814 0.1814 0.1814 0.1814 2,863.3755
2,863.3755
0.0549 0.0525 2,880.3911
5.1 Mitigation Measures Energy
Land Use LDA LDT1 LDT2 MDV LHD1 LHD2 MHD HHD OBUS UBUS MCY SBUS MH
Apartments Mid Rise 0.550339 0.043800 0.200255 0.122233 0.016799 0.005871 0.020633 0.029727 0.002027 0.001932 0.004726 0.000704 0.000955
General Office Building 0.550339 0.043800 0.200255 0.122233 0.016799 0.005871 0.020633 0.029727 0.002027 0.001932 0.004726 0.000704 0.000955
Regional Shopping Center 0.550339 0.043800 0.200255 0.122233 0.016799 0.005871 0.020633 0.029727 0.002027 0.001932 0.004726 0.000704 0.000955
Historical Energy Use: N
CalEEMod Version: CalEEMod.2016.3.2 Date: 8/28/2020 12:16 PMPage 20 of 25
ITC Adjusted Baseline - South Coast Air Basin, Winter

6.0 Area Detail
5.2 Energy by Land Use - NaturalGas
NaturalGas Use
ROG NOx CO SO2 Fugitive PM10
Exhaust PM10
PM10 Total
Fugitive PM2.5
Exhaust PM2.5
PM2.5 Total
Bio- CO2 NBio- CO2 Total CO2 CH4 N2O CO2e
Land Use kBTU/yr lb/day lb/day
Apartments Mid Rise
9830.75 0.1060 0.9060 0.3855 5.7800e-003
0.0733 0.0733 0.0733 0.0733 1,156.5584
1,156.5584
0.0222 0.0212 1,163.4313
General Office Building
11669.2 0.1258 1.1440 0.9610 6.8600e-003
0.0870 0.0870 0.0870 0.0870 1,372.8413
1,372.8413
0.0263 0.0252 1,380.9994
Regional Shopping Center
2838.79 0.0306 0.2783 0.2338 1.6700e-003
0.0212 0.0212 0.0212 0.0212 333.9758 333.9758 6.4000e-003
6.1200e-003
335.9605
Total 0.2625 2.3283 1.5803 0.0143 0.1814 0.1814 0.1814 0.1814 2,863.3755
2,863.3755
0.0549 0.0525 2,880.3911
Unmitigated
NaturalGas Use
ROG NOx CO SO2 Fugitive PM10
Exhaust PM10
PM10 Total
Fugitive PM2.5
Exhaust PM2.5
PM2.5 Total
Bio- CO2 NBio- CO2 Total CO2 CH4 N2O CO2e
Land Use kBTU/yr lb/day lb/day
Apartments Mid Rise
9.83075 0.1060 0.9060 0.3855 5.7800e-003
0.0733 0.0733 0.0733 0.0733 1,156.5584
1,156.5584
0.0222 0.0212 1,163.4313
General Office Building
11.6692 0.1258 1.1440 0.9610 6.8600e-003
0.0870 0.0870 0.0870 0.0870 1,372.8413
1,372.8413
0.0263 0.0252 1,380.9994
Regional Shopping Center
2.83879 0.0306 0.2783 0.2338 1.6700e-003
0.0212 0.0212 0.0212 0.0212 333.9758 333.9758 6.4000e-003
6.1200e-003
335.9605
Total 0.2625 2.3283 1.5803 0.0143 0.1814 0.1814 0.1814 0.1814 2,863.3755
2,863.3755
0.0549 0.0525 2,880.3911
Mitigated
CalEEMod Version: CalEEMod.2016.3.2 Date: 8/28/2020 12:16 PMPage 21 of 25
ITC Adjusted Baseline - South Coast Air Basin, Winter

6.1 Mitigation Measures Area
6.0 Area Detail
ROG NOx CO SO2 Fugitive PM10
Exhaust PM10
PM10 Total
Fugitive PM2.5
Exhaust PM2.5
PM2.5 Total
Bio- CO2 NBio- CO2 Total CO2 CH4 N2O CO2e
Category lb/day lb/day
Mitigated 111.8199 6.8165 185.7779 0.4088 24.1292 24.1292 24.1292 24.1292 2,941.2124
5,698.8608
8,640.0732
8.8173 0.1996 8,919.9956
Unmitigated 111.8199 6.8165 185.7779 0.4088 24.1292 24.1292 24.1292 24.1292 2,941.2124
5,698.8608
8,640.0732
8.8173 0.1996 8,919.9956
CalEEMod Version: CalEEMod.2016.3.2 Date: 8/28/2020 12:16 PMPage 22 of 25
ITC Adjusted Baseline - South Coast Air Basin, Winter

6.2 Area by SubCategory
ROG NOx CO SO2 Fugitive PM10
Exhaust PM10
PM10 Total
Fugitive PM2.5
Exhaust PM2.5
PM2.5 Total
Bio- CO2 NBio- CO2 Total CO2 CH4 N2O CO2e
SubCategory lb/day lb/day
Architectural Coating
3.0376 0.0000 0.0000 0.0000 0.0000 0.0000 0.0000
Consumer Products
25.7020 0.0000 0.0000 0.0000 0.0000 0.0000 0.0000
Hearth 82.2793 6.5150 159.6853 0.4074 23.9859 23.9859 23.9859 23.9859 2,941.2124
5,652.0000
8,593.2124
8.7713 0.1996 8,871.9833
Landscaping 0.8010 0.3016 26.0926 1.3800e-003
0.1433 0.1433 0.1433 0.1433 46.8608 46.8608 0.0461 48.0123
Total 111.8199 6.8165 185.7779 0.4088 24.1292 24.1292 24.1292 24.1292 2,941.2124
5,698.8608
8,640.0732
8.8173 0.1996 8,919.9956
Unmitigated
CalEEMod Version: CalEEMod.2016.3.2 Date: 8/28/2020 12:16 PMPage 23 of 25
ITC Adjusted Baseline - South Coast Air Basin, Winter

8.1 Mitigation Measures Waste
7.1 Mitigation Measures Water
7.0 Water Detail
8.0 Waste Detail
6.2 Area by SubCategory
ROG NOx CO SO2 Fugitive PM10
Exhaust PM10
PM10 Total
Fugitive PM2.5
Exhaust PM2.5
PM2.5 Total
Bio- CO2 NBio- CO2 Total CO2 CH4 N2O CO2e
SubCategory lb/day lb/day
Architectural Coating
3.0376 0.0000 0.0000 0.0000 0.0000 0.0000 0.0000
Consumer Products
25.7020 0.0000 0.0000 0.0000 0.0000 0.0000 0.0000
Hearth 82.2793 6.5150 159.6853 0.4074 23.9859 23.9859 23.9859 23.9859 2,941.2124
5,652.0000
8,593.2124
8.7713 0.1996 8,871.9833
Landscaping 0.8010 0.3016 26.0926 1.3800e-003
0.1433 0.1433 0.1433 0.1433 46.8608 46.8608 0.0461 48.0123
Total 111.8199 6.8165 185.7779 0.4088 24.1292 24.1292 24.1292 24.1292 2,941.2124
5,698.8608
8,640.0732
8.8173 0.1996 8,919.9956
Mitigated
9.0 Operational Offroad
Equipment Type Number Hours/Day Days/Year Horse Power Load Factor Fuel Type
10.0 Stationary Equipment
CalEEMod Version: CalEEMod.2016.3.2 Date: 8/28/2020 12:16 PMPage 24 of 25
ITC Adjusted Baseline - South Coast Air Basin, Winter

11.0 Vegetation
Fire Pumps and Emergency Generators
Equipment Type Number Hours/Day Hours/Year Horse Power Load Factor Fuel Type
Boilers
Equipment Type Number Heat Input/Day Heat Input/Year Boiler Rating Fuel Type
User Defined Equipment
Equipment Type Number
CalEEMod Version: CalEEMod.2016.3.2 Date: 8/28/2020 12:16 PMPage 25 of 25
ITC Adjusted Baseline - South Coast Air Basin, Winter

1.1 Land Usage
Land Uses Size Metric Lot Acreage Floor Surface Area Population
High Turnover (Sit Down Restaurant) 1.20 1000sqft 0.03 1,200.00 0
High Turnover (Sit Down Restaurant) 4.76 1000sqft 0.11 4,760.00 0
High Turnover (Sit Down Restaurant) 4.61 1000sqft 0.11 4,610.00 0
Automobile Care Center 44.00 1000sqft 1.01 44,000.00 0
Free-Standing Discount Store 22.19 1000sqft 0.51 22,190.00 0
Free-Standing Discount Store 5.00 1000sqft 0.11 5,000.00 0
Free-Standing Discount Store 16.57 1000sqft 0.38 16,570.00 0
Gasoline/Service Station 6.00 Pump 0.02 202.00 0
Regional Shopping Center 12.30 1000sqft 0.28 12,300.00 0
Regional Shopping Center 25.50 1000sqft 0.59 25,500.00 0
Regional Shopping Center 7.35 1000sqft 0.17 7,350.00 0
Supermarket 76.40 1000sqft 1.75 76,400.00 0
1.2 Other Project Characteristics
Urbanization
Climate Zone
Urban
8
Wind Speed (m/s) Precipitation Freq (Days)2.2 31
1.0 Project Characteristics
Utility Company Southern California Edison
2020Operational Year
CO2 Intensity (lb/MWhr)
702.44 0.029CH4 Intensity (lb/MWhr)
0.006N2O Intensity (lb/MWhr)
ITC Existing UsesSouth Coast Air Basin, Annual
CalEEMod Version: CalEEMod.2016.3.2 Date: 8/26/2020 8:59 PMPage 1 of 35
ITC Existing Uses - South Coast Air Basin, Annual

Project Characteristics -
Land Use - '
Construction Phase - Existing Uses, no construction
Vehicle Trips - Using EMFAC for motor vehicle emissions
1.3 User Entered Comments & Non-Default Data
Table Name Column Name Default Value New Value
tblConstructionPhase NumDays 20.00 0.00
tblConstructionPhase NumDays 10.00 0.00
tblConstructionPhase NumDays 20.00 0.00
tblConstructionPhase NumDays 230.00 0.00
tblConstructionPhase NumDays 20.00 0.00
tblConstructionPhase NumDays 20.00 0.00
tblGrading AcresOfGrading 0.00 10.00
tblLandUse LandUseSquareFeet 847.05 202.00
tblSolidWaste SolidWasteGenerationRate 188.20 188.24
tblVehicleTrips ST_TR 23.72 0.00
tblVehicleTrips ST_TR 71.07 0.00
tblVehicleTrips ST_TR 168.56 0.00
tblVehicleTrips ST_TR 158.37 0.00
tblVehicleTrips ST_TR 49.97 0.00
tblVehicleTrips ST_TR 177.59 0.00
tblVehicleTrips SU_TR 11.88 0.00
tblVehicleTrips SU_TR 56.36 0.00
tblVehicleTrips SU_TR 168.56 0.00
tblVehicleTrips SU_TR 131.84 0.00
tblVehicleTrips SU_TR 25.24 0.00
CalEEMod Version: CalEEMod.2016.3.2 Date: 8/26/2020 8:59 PMPage 2 of 35
ITC Existing Uses - South Coast Air Basin, Annual

2.0 Emissions Summary
tblVehicleTrips SU_TR 166.44 0.00
tblVehicleTrips WD_TR 23.72 0.00
tblVehicleTrips WD_TR 57.24 0.00
tblVehicleTrips WD_TR 168.56 0.00
tblVehicleTrips WD_TR 127.15 0.00
tblVehicleTrips WD_TR 42.70 0.00
tblVehicleTrips WD_TR 102.24 0.00
tblWater IndoorWaterUseRate 3,241,413.54 3,242,154.27
tblWater OutdoorWaterUseRate 1,986,672.81 1,987,126.81
CalEEMod Version: CalEEMod.2016.3.2 Date: 8/26/2020 8:59 PMPage 3 of 35
ITC Existing Uses - South Coast Air Basin, Annual

2.1 Overall Construction
ROG NOx CO SO2 Fugitive PM10
Exhaust PM10
PM10 Total
Fugitive PM2.5
Exhaust PM2.5
PM2.5 Total
Bio- CO2 NBio- CO2 Total CO2 CH4 N2O CO2e
Year tons/yr MT/yr
2019 0.0000 0.0000 0.0000 0.0000 0.0000 0.0000 0.0000 0.0000 0.0000 0.0000 0.0000 0.0000 0.0000 0.0000 0.0000 0.0000
2020 0.0000 0.0000 0.0000 0.0000 0.0000 0.0000 0.0000 0.0000 0.0000 0.0000 0.0000 0.0000 0.0000 0.0000 0.0000 0.0000
Maximum 0.0000 0.0000 0.0000 0.0000 0.0000 0.0000 0.0000 0.0000 0.0000 0.0000 0.0000 0.0000 0.0000 0.0000 0.0000 0.0000
Unmitigated Construction
ROG NOx CO SO2 Fugitive PM10
Exhaust PM10
PM10 Total
Fugitive PM2.5
Exhaust PM2.5
PM2.5 Total
Bio- CO2 NBio- CO2 Total CO2 CH4 N2O CO2e
Year tons/yr MT/yr
2019 0.0000 0.0000 0.0000 0.0000 0.0000 0.0000 0.0000 0.0000 0.0000 0.0000 0.0000 0.0000 0.0000 0.0000 0.0000 0.0000
2020 0.0000 0.0000 0.0000 0.0000 0.0000 0.0000 0.0000 0.0000 0.0000 0.0000 0.0000 0.0000 0.0000 0.0000 0.0000 0.0000
Maximum 0.0000 0.0000 0.0000 0.0000 0.0000 0.0000 0.0000 0.0000 0.0000 0.0000 0.0000 0.0000 0.0000 0.0000 0.0000 0.0000
Mitigated Construction
ROG NOx CO SO2 Fugitive PM10
Exhaust PM10
PM10 Total
Fugitive PM2.5
Exhaust PM2.5
PM2.5 Total
Bio- CO2 NBio-CO2 Total CO2 CH4 N20 CO2e
Percent Reduction
0.00 0.00 0.00 0.00 0.00 0.00 0.00 0.00 0.00 0.00 0.00 0.00 0.00 0.00 0.00 0.00
CalEEMod Version: CalEEMod.2016.3.2 Date: 8/26/2020 8:59 PMPage 4 of 35
ITC Existing Uses - South Coast Air Basin, Annual

2.2 Overall Operational
ROG NOx CO SO2 Fugitive PM10
Exhaust PM10
PM10 Total
Fugitive PM2.5
Exhaust PM2.5
PM2.5 Total
Bio- CO2 NBio- CO2 Total CO2 CH4 N2O CO2e
Category tons/yr MT/yr
Area 0.8979 3.0000e-005
2.9000e-003
0.0000 1.0000e-005
1.0000e-005
1.0000e-005
1.0000e-005
0.0000 5.6100e-003
5.6100e-003
2.0000e-005
0.0000 5.9800e-003
Energy 0.0292 0.2653 0.2229 1.5900e-003
0.0202 0.0202 0.0202 0.0202 0.0000 1,794.9003
1,794.9003
0.0677 0.0182 1,802.0047
Mobile 0.0000 0.0000 0.0000 0.0000 0.0000 0.0000 0.0000 0.0000 0.0000 0.0000 0.0000 0.0000 0.0000 0.0000 0.0000 0.0000
Waste 0.0000 0.0000 0.0000 0.0000 195.6102 0.0000 195.6102 11.5602 0.0000 484.6160
Water 0.0000 0.0000 0.0000 0.0000 7.4338 122.4136 129.8474 0.7686 0.0191 154.7460
Total 0.9270 0.2654 0.2258 1.5900e-003
0.0000 0.0202 0.0202 0.0000 0.0202 0.0202 203.0441 1,917.3195
2,120.3635
12.3965 0.0372 2,441.3727
Unmitigated Operational
Quarter Start Date End Date Maximum Unmitigated ROG + NOX (tons/quarter) Maximum Mitigated ROG + NOX (tons/quarter)
Highest
CalEEMod Version: CalEEMod.2016.3.2 Date: 8/26/2020 8:59 PMPage 5 of 35
ITC Existing Uses - South Coast Air Basin, Annual

2.2 Overall Operational
ROG NOx CO SO2 Fugitive PM10
Exhaust PM10
PM10 Total
Fugitive PM2.5
Exhaust PM2.5
PM2.5 Total
Bio- CO2 NBio- CO2 Total CO2 CH4 N2O CO2e
Category tons/yr MT/yr
Area 0.8979 3.0000e-005
2.9000e-003
0.0000 1.0000e-005
1.0000e-005
1.0000e-005
1.0000e-005
0.0000 5.6100e-003
5.6100e-003
2.0000e-005
0.0000 5.9800e-003
Energy 0.0292 0.2653 0.2229 1.5900e-003
0.0202 0.0202 0.0202 0.0202 0.0000 1,794.9003
1,794.9003
0.0677 0.0182 1,802.0047
Mobile 0.0000 0.0000 0.0000 0.0000 0.0000 0.0000 0.0000 0.0000 0.0000 0.0000 0.0000 0.0000 0.0000 0.0000 0.0000 0.0000
Waste 0.0000 0.0000 0.0000 0.0000 195.6102 0.0000 195.6102 11.5602 0.0000 484.6160
Water 0.0000 0.0000 0.0000 0.0000 7.4338 122.4136 129.8474 0.7686 0.0191 154.7460
Total 0.9270 0.2654 0.2258 1.5900e-003
0.0000 0.0202 0.0202 0.0000 0.0202 0.0202 203.0441 1,917.3195
2,120.3635
12.3965 0.0372 2,441.3727
Mitigated Operational
3.0 Construction Detail
Construction Phase
ROG NOx CO SO2 Fugitive PM10
Exhaust PM10
PM10 Total
Fugitive PM2.5
Exhaust PM2.5
PM2.5 Total
Bio- CO2 NBio-CO2 Total CO2 CH4 N20 CO2e
Percent Reduction
0.00 0.00 0.00 0.00 0.00 0.00 0.00 0.00 0.00 0.00 0.00 0.00 0.00 0.00 0.00 0.00
CalEEMod Version: CalEEMod.2016.3.2 Date: 8/26/2020 8:59 PMPage 6 of 35
ITC Existing Uses - South Coast Air Basin, Annual

Phase Number
Phase Name Phase Type Start Date End Date Num Days Week
Num Days Phase Description
1 Demolition Demolition 1/1/2019 12/31/2018 5 0
2 Site Preparation Site Preparation 1/29/2019 1/28/2019 5 0
3 Grading Grading 2/12/2019 2/11/2019 5 0
4 Building Construction Building Construction 3/12/2019 3/11/2019 5 0
5 Paving Paving 1/28/2020 1/27/2020 5 0
6 Architectural Coating Architectural Coating 2/25/2020 2/24/2020 5 0
OffRoad Equipment
Residential Indoor: 0; Residential Outdoor: 0; Non-Residential Indoor: 331,104; Non-Residential Outdoor: 110,368; Striped Parking Area: 0 (Architectural Coating – sqft)
Acres of Grading (Site Preparation Phase): 0
Acres of Grading (Grading Phase): 10
Acres of Paving: 0
CalEEMod Version: CalEEMod.2016.3.2 Date: 8/26/2020 8:59 PMPage 7 of 35
ITC Existing Uses - South Coast Air Basin, Annual

Phase Name Offroad Equipment Type Amount Usage Hours Horse Power Load Factor
Demolition Concrete/Industrial Saws 1 8.00 81 0.73
Demolition Excavators 3 8.00 158 0.38
Demolition Rubber Tired Dozers 2 8.00 247 0.40
Site Preparation Rubber Tired Dozers 3 8.00 247 0.40
Site Preparation Tractors/Loaders/Backhoes 4 8.00 97 0.37
Grading Excavators 1 8.00 158 0.38
Grading Graders 1 8.00 187 0.41
Grading Rubber Tired Dozers 1 8.00 247 0.40
Grading Tractors/Loaders/Backhoes 3 8.00 97 0.37
Building Construction Cranes 1 7.00 231 0.29
Building Construction Forklifts 3 8.00 89 0.20
Building Construction Generator Sets 1 8.00 84 0.74
Building Construction Tractors/Loaders/Backhoes 3 7.00 97 0.37
Building Construction Welders 1 8.00 46 0.45
Paving Pavers 2 8.00 130 0.42
Paving Paving Equipment 2 8.00 132 0.36
Paving Rollers 2 8.00 80 0.38
Architectural Coating Air Compressors 1 6.00 78 0.48
Trips and VMT
CalEEMod Version: CalEEMod.2016.3.2 Date: 8/26/2020 8:59 PMPage 8 of 35
ITC Existing Uses - South Coast Air Basin, Annual

3.3 Site Preparation - 2019
ROG NOx CO SO2 Fugitive PM10
Exhaust PM10
PM10 Total
Fugitive PM2.5
Exhaust PM2.5
PM2.5 Total
Bio- CO2 NBio- CO2 Total CO2 CH4 N2O CO2e
Category tons/yr MT/yr
Fugitive Dust 0.0000 0.0000 0.0000 0.0000 0.0000 0.0000 0.0000 0.0000 0.0000 0.0000 0.0000 0.0000 0.0000 0.0000 0.0000 0.0000
Off-Road 0.0000 0.0000 0.0000 0.0000 0.0000 0.0000 0.0000 0.0000 0.0000 0.0000 0.0000 0.0000 0.0000 0.0000 0.0000 0.0000
Total 0.0000 0.0000 0.0000 0.0000 0.0000 0.0000 0.0000 0.0000 0.0000 0.0000 0.0000 0.0000 0.0000 0.0000 0.0000 0.0000
Unmitigated Construction On-Site
3.1 Mitigation Measures Construction
Phase Name Offroad Equipment Count
Worker Trip Number
Vendor Trip Number
Hauling Trip Number
Worker Trip Length
Vendor Trip Length
Hauling Trip Length
Worker Vehicle Class
Vendor Vehicle Class
Hauling Vehicle Class
Demolition 6 15.00 0.00 0.00 14.70 6.90 20.00 LD_Mix HDT_Mix HHDT
Site Preparation 7 18.00 0.00 0.00 14.70 6.90 20.00 LD_Mix HDT_Mix HHDT
Grading 6 15.00 0.00 0.00 14.70 6.90 20.00 LD_Mix HDT_Mix HHDT
Building Construction 9 72.00 36.00 0.00 14.70 6.90 20.00 LD_Mix HDT_Mix HHDT
Paving 6 15.00 0.00 0.00 14.70 6.90 20.00 LD_Mix HDT_Mix HHDT
Architectural Coating 1 14.00 0.00 0.00 14.70 6.90 20.00 LD_Mix HDT_Mix HHDT
CalEEMod Version: CalEEMod.2016.3.2 Date: 8/26/2020 8:59 PMPage 9 of 35
ITC Existing Uses - South Coast Air Basin, Annual

3.3 Site Preparation - 2019
ROG NOx CO SO2 Fugitive PM10
Exhaust PM10
PM10 Total
Fugitive PM2.5
Exhaust PM2.5
PM2.5 Total
Bio- CO2 NBio- CO2 Total CO2 CH4 N2O CO2e
Category tons/yr MT/yr
Hauling 0.0000 0.0000 0.0000 0.0000 0.0000 0.0000 0.0000 0.0000 0.0000 0.0000 0.0000 0.0000 0.0000 0.0000 0.0000 0.0000
Vendor 0.0000 0.0000 0.0000 0.0000 0.0000 0.0000 0.0000 0.0000 0.0000 0.0000 0.0000 0.0000 0.0000 0.0000 0.0000 0.0000
Worker 0.0000 0.0000 0.0000 0.0000 0.0000 0.0000 0.0000 0.0000 0.0000 0.0000 0.0000 0.0000 0.0000 0.0000 0.0000 0.0000
Total 0.0000 0.0000 0.0000 0.0000 0.0000 0.0000 0.0000 0.0000 0.0000 0.0000 0.0000 0.0000 0.0000 0.0000 0.0000 0.0000
Unmitigated Construction Off-Site
ROG NOx CO SO2 Fugitive PM10
Exhaust PM10
PM10 Total
Fugitive PM2.5
Exhaust PM2.5
PM2.5 Total
Bio- CO2 NBio- CO2 Total CO2 CH4 N2O CO2e
Category tons/yr MT/yr
Fugitive Dust 0.0000 0.0000 0.0000 0.0000 0.0000 0.0000 0.0000 0.0000 0.0000 0.0000 0.0000 0.0000 0.0000 0.0000 0.0000 0.0000
Off-Road 0.0000 0.0000 0.0000 0.0000 0.0000 0.0000 0.0000 0.0000 0.0000 0.0000 0.0000 0.0000 0.0000 0.0000 0.0000 0.0000
Total 0.0000 0.0000 0.0000 0.0000 0.0000 0.0000 0.0000 0.0000 0.0000 0.0000 0.0000 0.0000 0.0000 0.0000 0.0000 0.0000
Mitigated Construction On-Site
CalEEMod Version: CalEEMod.2016.3.2 Date: 8/26/2020 8:59 PMPage 10 of 35
ITC Existing Uses - South Coast Air Basin, Annual

3.3 Site Preparation - 2019
ROG NOx CO SO2 Fugitive PM10
Exhaust PM10
PM10 Total
Fugitive PM2.5
Exhaust PM2.5
PM2.5 Total
Bio- CO2 NBio- CO2 Total CO2 CH4 N2O CO2e
Category tons/yr MT/yr
Hauling 0.0000 0.0000 0.0000 0.0000 0.0000 0.0000 0.0000 0.0000 0.0000 0.0000 0.0000 0.0000 0.0000 0.0000 0.0000 0.0000
Vendor 0.0000 0.0000 0.0000 0.0000 0.0000 0.0000 0.0000 0.0000 0.0000 0.0000 0.0000 0.0000 0.0000 0.0000 0.0000 0.0000
Worker 0.0000 0.0000 0.0000 0.0000 0.0000 0.0000 0.0000 0.0000 0.0000 0.0000 0.0000 0.0000 0.0000 0.0000 0.0000 0.0000
Total 0.0000 0.0000 0.0000 0.0000 0.0000 0.0000 0.0000 0.0000 0.0000 0.0000 0.0000 0.0000 0.0000 0.0000 0.0000 0.0000
Mitigated Construction Off-Site
3.4 Grading - 2019
ROG NOx CO SO2 Fugitive PM10
Exhaust PM10
PM10 Total
Fugitive PM2.5
Exhaust PM2.5
PM2.5 Total
Bio- CO2 NBio- CO2 Total CO2 CH4 N2O CO2e
Category tons/yr MT/yr
Fugitive Dust 0.0000 0.0000 0.0000 0.0000 0.0000 0.0000 0.0000 0.0000 0.0000 0.0000 0.0000 0.0000 0.0000 0.0000 0.0000 0.0000
Off-Road 0.0000 0.0000 0.0000 0.0000 0.0000 0.0000 0.0000 0.0000 0.0000 0.0000 0.0000 0.0000 0.0000 0.0000 0.0000 0.0000
Total 0.0000 0.0000 0.0000 0.0000 0.0000 0.0000 0.0000 0.0000 0.0000 0.0000 0.0000 0.0000 0.0000 0.0000 0.0000 0.0000
Unmitigated Construction On-Site
CalEEMod Version: CalEEMod.2016.3.2 Date: 8/26/2020 8:59 PMPage 11 of 35
ITC Existing Uses - South Coast Air Basin, Annual

3.4 Grading - 2019
ROG NOx CO SO2 Fugitive PM10
Exhaust PM10
PM10 Total
Fugitive PM2.5
Exhaust PM2.5
PM2.5 Total
Bio- CO2 NBio- CO2 Total CO2 CH4 N2O CO2e
Category tons/yr MT/yr
Hauling 0.0000 0.0000 0.0000 0.0000 0.0000 0.0000 0.0000 0.0000 0.0000 0.0000 0.0000 0.0000 0.0000 0.0000 0.0000 0.0000
Vendor 0.0000 0.0000 0.0000 0.0000 0.0000 0.0000 0.0000 0.0000 0.0000 0.0000 0.0000 0.0000 0.0000 0.0000 0.0000 0.0000
Worker 0.0000 0.0000 0.0000 0.0000 0.0000 0.0000 0.0000 0.0000 0.0000 0.0000 0.0000 0.0000 0.0000 0.0000 0.0000 0.0000
Total 0.0000 0.0000 0.0000 0.0000 0.0000 0.0000 0.0000 0.0000 0.0000 0.0000 0.0000 0.0000 0.0000 0.0000 0.0000 0.0000
Unmitigated Construction Off-Site
ROG NOx CO SO2 Fugitive PM10
Exhaust PM10
PM10 Total
Fugitive PM2.5
Exhaust PM2.5
PM2.5 Total
Bio- CO2 NBio- CO2 Total CO2 CH4 N2O CO2e
Category tons/yr MT/yr
Fugitive Dust 0.0000 0.0000 0.0000 0.0000 0.0000 0.0000 0.0000 0.0000 0.0000 0.0000 0.0000 0.0000 0.0000 0.0000 0.0000 0.0000
Off-Road 0.0000 0.0000 0.0000 0.0000 0.0000 0.0000 0.0000 0.0000 0.0000 0.0000 0.0000 0.0000 0.0000 0.0000 0.0000 0.0000
Total 0.0000 0.0000 0.0000 0.0000 0.0000 0.0000 0.0000 0.0000 0.0000 0.0000 0.0000 0.0000 0.0000 0.0000 0.0000 0.0000
Mitigated Construction On-Site
CalEEMod Version: CalEEMod.2016.3.2 Date: 8/26/2020 8:59 PMPage 12 of 35
ITC Existing Uses - South Coast Air Basin, Annual

3.4 Grading - 2019
ROG NOx CO SO2 Fugitive PM10
Exhaust PM10
PM10 Total
Fugitive PM2.5
Exhaust PM2.5
PM2.5 Total
Bio- CO2 NBio- CO2 Total CO2 CH4 N2O CO2e
Category tons/yr MT/yr
Hauling 0.0000 0.0000 0.0000 0.0000 0.0000 0.0000 0.0000 0.0000 0.0000 0.0000 0.0000 0.0000 0.0000 0.0000 0.0000 0.0000
Vendor 0.0000 0.0000 0.0000 0.0000 0.0000 0.0000 0.0000 0.0000 0.0000 0.0000 0.0000 0.0000 0.0000 0.0000 0.0000 0.0000
Worker 0.0000 0.0000 0.0000 0.0000 0.0000 0.0000 0.0000 0.0000 0.0000 0.0000 0.0000 0.0000 0.0000 0.0000 0.0000 0.0000
Total 0.0000 0.0000 0.0000 0.0000 0.0000 0.0000 0.0000 0.0000 0.0000 0.0000 0.0000 0.0000 0.0000 0.0000 0.0000 0.0000
Mitigated Construction Off-Site
3.5 Building Construction - 2019
ROG NOx CO SO2 Fugitive PM10
Exhaust PM10
PM10 Total
Fugitive PM2.5
Exhaust PM2.5
PM2.5 Total
Bio- CO2 NBio- CO2 Total CO2 CH4 N2O CO2e
Category tons/yr MT/yr
Off-Road 0.0000 0.0000 0.0000 0.0000 0.0000 0.0000 0.0000 0.0000 0.0000 0.0000 0.0000 0.0000 0.0000 0.0000 0.0000 0.0000
Total 0.0000 0.0000 0.0000 0.0000 0.0000 0.0000 0.0000 0.0000 0.0000 0.0000 0.0000 0.0000 0.0000 0.0000 0.0000 0.0000
Unmitigated Construction On-Site
CalEEMod Version: CalEEMod.2016.3.2 Date: 8/26/2020 8:59 PMPage 13 of 35
ITC Existing Uses - South Coast Air Basin, Annual

3.5 Building Construction - 2019
ROG NOx CO SO2 Fugitive PM10
Exhaust PM10
PM10 Total
Fugitive PM2.5
Exhaust PM2.5
PM2.5 Total
Bio- CO2 NBio- CO2 Total CO2 CH4 N2O CO2e
Category tons/yr MT/yr
Hauling 0.0000 0.0000 0.0000 0.0000 0.0000 0.0000 0.0000 0.0000 0.0000 0.0000 0.0000 0.0000 0.0000 0.0000 0.0000 0.0000
Vendor 0.0000 0.0000 0.0000 0.0000 0.0000 0.0000 0.0000 0.0000 0.0000 0.0000 0.0000 0.0000 0.0000 0.0000 0.0000 0.0000
Worker 0.0000 0.0000 0.0000 0.0000 0.0000 0.0000 0.0000 0.0000 0.0000 0.0000 0.0000 0.0000 0.0000 0.0000 0.0000 0.0000
Total 0.0000 0.0000 0.0000 0.0000 0.0000 0.0000 0.0000 0.0000 0.0000 0.0000 0.0000 0.0000 0.0000 0.0000 0.0000 0.0000
Unmitigated Construction Off-Site
ROG NOx CO SO2 Fugitive PM10
Exhaust PM10
PM10 Total
Fugitive PM2.5
Exhaust PM2.5
PM2.5 Total
Bio- CO2 NBio- CO2 Total CO2 CH4 N2O CO2e
Category tons/yr MT/yr
Off-Road 0.0000 0.0000 0.0000 0.0000 0.0000 0.0000 0.0000 0.0000 0.0000 0.0000 0.0000 0.0000 0.0000 0.0000 0.0000 0.0000
Total 0.0000 0.0000 0.0000 0.0000 0.0000 0.0000 0.0000 0.0000 0.0000 0.0000 0.0000 0.0000 0.0000 0.0000 0.0000 0.0000
Mitigated Construction On-Site
CalEEMod Version: CalEEMod.2016.3.2 Date: 8/26/2020 8:59 PMPage 14 of 35
ITC Existing Uses - South Coast Air Basin, Annual

3.5 Building Construction - 2019
ROG NOx CO SO2 Fugitive PM10
Exhaust PM10
PM10 Total
Fugitive PM2.5
Exhaust PM2.5
PM2.5 Total
Bio- CO2 NBio- CO2 Total CO2 CH4 N2O CO2e
Category tons/yr MT/yr
Hauling 0.0000 0.0000 0.0000 0.0000 0.0000 0.0000 0.0000 0.0000 0.0000 0.0000 0.0000 0.0000 0.0000 0.0000 0.0000 0.0000
Vendor 0.0000 0.0000 0.0000 0.0000 0.0000 0.0000 0.0000 0.0000 0.0000 0.0000 0.0000 0.0000 0.0000 0.0000 0.0000 0.0000
Worker 0.0000 0.0000 0.0000 0.0000 0.0000 0.0000 0.0000 0.0000 0.0000 0.0000 0.0000 0.0000 0.0000 0.0000 0.0000 0.0000
Total 0.0000 0.0000 0.0000 0.0000 0.0000 0.0000 0.0000 0.0000 0.0000 0.0000 0.0000 0.0000 0.0000 0.0000 0.0000 0.0000
Mitigated Construction Off-Site
3.6 Paving - 2020
ROG NOx CO SO2 Fugitive PM10
Exhaust PM10
PM10 Total
Fugitive PM2.5
Exhaust PM2.5
PM2.5 Total
Bio- CO2 NBio- CO2 Total CO2 CH4 N2O CO2e
Category tons/yr MT/yr
Off-Road 0.0000 0.0000 0.0000 0.0000 0.0000 0.0000 0.0000 0.0000 0.0000 0.0000 0.0000 0.0000 0.0000 0.0000 0.0000 0.0000
Paving 0.0000 0.0000 0.0000 0.0000 0.0000 0.0000 0.0000 0.0000 0.0000 0.0000 0.0000 0.0000 0.0000 0.0000 0.0000 0.0000
Total 0.0000 0.0000 0.0000 0.0000 0.0000 0.0000 0.0000 0.0000 0.0000 0.0000 0.0000 0.0000 0.0000 0.0000 0.0000 0.0000
Unmitigated Construction On-Site
CalEEMod Version: CalEEMod.2016.3.2 Date: 8/26/2020 8:59 PMPage 15 of 35
ITC Existing Uses - South Coast Air Basin, Annual

3.6 Paving - 2020
ROG NOx CO SO2 Fugitive PM10
Exhaust PM10
PM10 Total
Fugitive PM2.5
Exhaust PM2.5
PM2.5 Total
Bio- CO2 NBio- CO2 Total CO2 CH4 N2O CO2e
Category tons/yr MT/yr
Hauling 0.0000 0.0000 0.0000 0.0000 0.0000 0.0000 0.0000 0.0000 0.0000 0.0000 0.0000 0.0000 0.0000 0.0000 0.0000 0.0000
Vendor 0.0000 0.0000 0.0000 0.0000 0.0000 0.0000 0.0000 0.0000 0.0000 0.0000 0.0000 0.0000 0.0000 0.0000 0.0000 0.0000
Worker 0.0000 0.0000 0.0000 0.0000 0.0000 0.0000 0.0000 0.0000 0.0000 0.0000 0.0000 0.0000 0.0000 0.0000 0.0000 0.0000
Total 0.0000 0.0000 0.0000 0.0000 0.0000 0.0000 0.0000 0.0000 0.0000 0.0000 0.0000 0.0000 0.0000 0.0000 0.0000 0.0000
Unmitigated Construction Off-Site
ROG NOx CO SO2 Fugitive PM10
Exhaust PM10
PM10 Total
Fugitive PM2.5
Exhaust PM2.5
PM2.5 Total
Bio- CO2 NBio- CO2 Total CO2 CH4 N2O CO2e
Category tons/yr MT/yr
Off-Road 0.0000 0.0000 0.0000 0.0000 0.0000 0.0000 0.0000 0.0000 0.0000 0.0000 0.0000 0.0000 0.0000 0.0000 0.0000 0.0000
Paving 0.0000 0.0000 0.0000 0.0000 0.0000 0.0000 0.0000 0.0000 0.0000 0.0000 0.0000 0.0000 0.0000 0.0000 0.0000 0.0000
Total 0.0000 0.0000 0.0000 0.0000 0.0000 0.0000 0.0000 0.0000 0.0000 0.0000 0.0000 0.0000 0.0000 0.0000 0.0000 0.0000
Mitigated Construction On-Site
CalEEMod Version: CalEEMod.2016.3.2 Date: 8/26/2020 8:59 PMPage 16 of 35
ITC Existing Uses - South Coast Air Basin, Annual

3.6 Paving - 2020
ROG NOx CO SO2 Fugitive PM10
Exhaust PM10
PM10 Total
Fugitive PM2.5
Exhaust PM2.5
PM2.5 Total
Bio- CO2 NBio- CO2 Total CO2 CH4 N2O CO2e
Category tons/yr MT/yr
Hauling 0.0000 0.0000 0.0000 0.0000 0.0000 0.0000 0.0000 0.0000 0.0000 0.0000 0.0000 0.0000 0.0000 0.0000 0.0000 0.0000
Vendor 0.0000 0.0000 0.0000 0.0000 0.0000 0.0000 0.0000 0.0000 0.0000 0.0000 0.0000 0.0000 0.0000 0.0000 0.0000 0.0000
Worker 0.0000 0.0000 0.0000 0.0000 0.0000 0.0000 0.0000 0.0000 0.0000 0.0000 0.0000 0.0000 0.0000 0.0000 0.0000 0.0000
Total 0.0000 0.0000 0.0000 0.0000 0.0000 0.0000 0.0000 0.0000 0.0000 0.0000 0.0000 0.0000 0.0000 0.0000 0.0000 0.0000
Mitigated Construction Off-Site
3.7 Architectural Coating - 2020
ROG NOx CO SO2 Fugitive PM10
Exhaust PM10
PM10 Total
Fugitive PM2.5
Exhaust PM2.5
PM2.5 Total
Bio- CO2 NBio- CO2 Total CO2 CH4 N2O CO2e
Category tons/yr MT/yr
Archit. Coating 0.0000 0.0000 0.0000 0.0000 0.0000 0.0000 0.0000 0.0000 0.0000 0.0000 0.0000 0.0000 0.0000 0.0000 0.0000 0.0000
Off-Road 0.0000 0.0000 0.0000 0.0000 0.0000 0.0000 0.0000 0.0000 0.0000 0.0000 0.0000 0.0000 0.0000 0.0000 0.0000 0.0000
Total 0.0000 0.0000 0.0000 0.0000 0.0000 0.0000 0.0000 0.0000 0.0000 0.0000 0.0000 0.0000 0.0000 0.0000 0.0000 0.0000
Unmitigated Construction On-Site
CalEEMod Version: CalEEMod.2016.3.2 Date: 8/26/2020 8:59 PMPage 17 of 35
ITC Existing Uses - South Coast Air Basin, Annual

3.7 Architectural Coating - 2020
ROG NOx CO SO2 Fugitive PM10
Exhaust PM10
PM10 Total
Fugitive PM2.5
Exhaust PM2.5
PM2.5 Total
Bio- CO2 NBio- CO2 Total CO2 CH4 N2O CO2e
Category tons/yr MT/yr
Hauling 0.0000 0.0000 0.0000 0.0000 0.0000 0.0000 0.0000 0.0000 0.0000 0.0000 0.0000 0.0000 0.0000 0.0000 0.0000 0.0000
Vendor 0.0000 0.0000 0.0000 0.0000 0.0000 0.0000 0.0000 0.0000 0.0000 0.0000 0.0000 0.0000 0.0000 0.0000 0.0000 0.0000
Worker 0.0000 0.0000 0.0000 0.0000 0.0000 0.0000 0.0000 0.0000 0.0000 0.0000 0.0000 0.0000 0.0000 0.0000 0.0000 0.0000
Total 0.0000 0.0000 0.0000 0.0000 0.0000 0.0000 0.0000 0.0000 0.0000 0.0000 0.0000 0.0000 0.0000 0.0000 0.0000 0.0000
Unmitigated Construction Off-Site
ROG NOx CO SO2 Fugitive PM10
Exhaust PM10
PM10 Total
Fugitive PM2.5
Exhaust PM2.5
PM2.5 Total
Bio- CO2 NBio- CO2 Total CO2 CH4 N2O CO2e
Category tons/yr MT/yr
Archit. Coating 0.0000 0.0000 0.0000 0.0000 0.0000 0.0000 0.0000 0.0000 0.0000 0.0000 0.0000 0.0000 0.0000 0.0000 0.0000 0.0000
Off-Road 0.0000 0.0000 0.0000 0.0000 0.0000 0.0000 0.0000 0.0000 0.0000 0.0000 0.0000 0.0000 0.0000 0.0000 0.0000 0.0000
Total 0.0000 0.0000 0.0000 0.0000 0.0000 0.0000 0.0000 0.0000 0.0000 0.0000 0.0000 0.0000 0.0000 0.0000 0.0000 0.0000
Mitigated Construction On-Site
CalEEMod Version: CalEEMod.2016.3.2 Date: 8/26/2020 8:59 PMPage 18 of 35
ITC Existing Uses - South Coast Air Basin, Annual

4.0 Operational Detail - Mobile
4.1 Mitigation Measures Mobile
3.7 Architectural Coating - 2020
ROG NOx CO SO2 Fugitive PM10
Exhaust PM10
PM10 Total
Fugitive PM2.5
Exhaust PM2.5
PM2.5 Total
Bio- CO2 NBio- CO2 Total CO2 CH4 N2O CO2e
Category tons/yr MT/yr
Hauling 0.0000 0.0000 0.0000 0.0000 0.0000 0.0000 0.0000 0.0000 0.0000 0.0000 0.0000 0.0000 0.0000 0.0000 0.0000 0.0000
Vendor 0.0000 0.0000 0.0000 0.0000 0.0000 0.0000 0.0000 0.0000 0.0000 0.0000 0.0000 0.0000 0.0000 0.0000 0.0000 0.0000
Worker 0.0000 0.0000 0.0000 0.0000 0.0000 0.0000 0.0000 0.0000 0.0000 0.0000 0.0000 0.0000 0.0000 0.0000 0.0000 0.0000
Total 0.0000 0.0000 0.0000 0.0000 0.0000 0.0000 0.0000 0.0000 0.0000 0.0000 0.0000 0.0000 0.0000 0.0000 0.0000 0.0000
Mitigated Construction Off-Site
CalEEMod Version: CalEEMod.2016.3.2 Date: 8/26/2020 8:59 PMPage 19 of 35
ITC Existing Uses - South Coast Air Basin, Annual

ROG NOx CO SO2 Fugitive PM10
Exhaust PM10
PM10 Total
Fugitive PM2.5
Exhaust PM2.5
PM2.5 Total
Bio- CO2 NBio- CO2 Total CO2 CH4 N2O CO2e
Category tons/yr MT/yr
Mitigated 0.0000 0.0000 0.0000 0.0000 0.0000 0.0000 0.0000 0.0000 0.0000 0.0000 0.0000 0.0000 0.0000 0.0000 0.0000 0.0000
Unmitigated 0.0000 0.0000 0.0000 0.0000 0.0000 0.0000 0.0000 0.0000 0.0000 0.0000 0.0000 0.0000 0.0000 0.0000 0.0000 0.0000
4.2 Trip Summary Information
4.3 Trip Type Information
Average Daily Trip Rate Unmitigated Mitigated
Land Use Weekday Saturday Sunday Annual VMT Annual VMT
Automobile Care Center 0.00 0.00 0.00
Free-Standing Discount Store 0.00 0.00 0.00
Free-Standing Discount Store 0.00 0.00 0.00
Free-Standing Discount Store 0.00 0.00 0.00
Gasoline/Service Station 0.00 0.00 0.00
High Turnover (Sit Down Restaurant) 0.00 0.00 0.00
High Turnover (Sit Down Restaurant) 0.00 0.00 0.00
High Turnover (Sit Down Restaurant) 0.00 0.00 0.00
Regional Shopping Center 0.00 0.00 0.00
Regional Shopping Center 0.00 0.00 0.00
Regional Shopping Center 0.00 0.00 0.00
Supermarket 0.00 0.00 0.00
Total 0.00 0.00 0.00
CalEEMod Version: CalEEMod.2016.3.2 Date: 8/26/2020 8:59 PMPage 20 of 35
ITC Existing Uses - South Coast Air Basin, Annual

Miles Trip % Trip Purpose %
Land Use H-W or C-W H-S or C-C H-O or C-NW H-W or C-W H-S or C-C H-O or C-NW Primary Diverted Pass-by
Automobile Care Center 16.60 8.40 6.90 33.00 48.00 19.00 21 51 28
Free-Standing Discount Store 16.60 8.40 6.90 12.20 68.80 19.00 47.5 35.5 17
Free-Standing Discount Store 16.60 8.40 6.90 12.20 68.80 19.00 47.5 35.5 17
Free-Standing Discount Store 16.60 8.40 6.90 12.20 68.80 19.00 47.5 35.5 17
Gasoline/Service Station 16.60 8.40 6.90 2.00 79.00 19.00 14 27 59
High Turnover (Sit Down Restaurant)
16.60 8.40 6.90 8.50 72.50 19.00 37 20 43
High Turnover (Sit Down Restaurant)
16.60 8.40 6.90 8.50 72.50 19.00 37 20 43
High Turnover (Sit Down Restaurant)
16.60 8.40 6.90 8.50 72.50 19.00 37 20 43
Regional Shopping Center 16.60 8.40 6.90 16.30 64.70 19.00 54 35 11
Regional Shopping Center 16.60 8.40 6.90 16.30 64.70 19.00 54 35 11
Regional Shopping Center 16.60 8.40 6.90 16.30 64.70 19.00 54 35 11
Supermarket 16.60 8.40 6.90 6.50 74.50 19.00 34 30 36
5.0 Energy Detail
5.1 Mitigation Measures Energy
4.4 Fleet Mix
Land Use LDA LDT1 LDT2 MDV LHD1 LHD2 MHD HHD OBUS UBUS MCY SBUS MH
Automobile Care Center 0.550339 0.043800 0.200255 0.122233 0.016799 0.005871 0.020633 0.029727 0.002027 0.001932 0.004726 0.000704 0.000955
Free-Standing Discount Store 0.550339 0.043800 0.200255 0.122233 0.016799 0.005871 0.020633 0.029727 0.002027 0.001932 0.004726 0.000704 0.000955
Gasoline/Service Station 0.550339 0.043800 0.200255 0.122233 0.016799 0.005871 0.020633 0.029727 0.002027 0.001932 0.004726 0.000704 0.000955
High Turnover (Sit Down Restaurant)
0.550339 0.043800 0.200255 0.122233 0.016799 0.005871 0.020633 0.029727 0.002027 0.001932 0.004726 0.000704 0.000955
Regional Shopping Center 0.550339 0.043800 0.200255 0.122233 0.016799 0.005871 0.020633 0.029727 0.002027 0.001932 0.004726 0.000704 0.000955
Supermarket 0.550339 0.043800 0.200255 0.122233 0.016799 0.005871 0.020633 0.029727 0.002027 0.001932 0.004726 0.000704 0.000955
Historical Energy Use: N
CalEEMod Version: CalEEMod.2016.3.2 Date: 8/26/2020 8:59 PMPage 21 of 35
ITC Existing Uses - South Coast Air Basin, Annual

ROG NOx CO SO2 Fugitive PM10
Exhaust PM10
PM10 Total
Fugitive PM2.5
Exhaust PM2.5
PM2.5 Total
Bio- CO2 NBio- CO2 Total CO2 CH4 N2O CO2e
Category tons/yr MT/yr
Electricity Mitigated
0.0000 0.0000 0.0000 0.0000 0.0000 1,506.0594
1,506.0594
0.0622 0.0129 1,511.4474
Electricity Unmitigated
0.0000 0.0000 0.0000 0.0000 0.0000 1,506.0594
1,506.0594
0.0622 0.0129 1,511.4474
NaturalGas Mitigated
0.0292 0.2653 0.2229 1.5900e-003
0.0202 0.0202 0.0202 0.0202 0.0000 288.8409 288.8409 5.5400e-003
5.3000e-003
290.5574
NaturalGas Unmitigated
0.0292 0.2653 0.2229 1.5900e-003
0.0202 0.0202 0.0202 0.0202 0.0000 288.8409 288.8409 5.5400e-003
5.3000e-003
290.5574
CalEEMod Version: CalEEMod.2016.3.2 Date: 8/26/2020 8:59 PMPage 22 of 35
ITC Existing Uses - South Coast Air Basin, Annual

5.2 Energy by Land Use - NaturalGas
NaturalGas Use
ROG NOx CO SO2 Fugitive PM10
Exhaust PM10
PM10 Total
Fugitive PM2.5
Exhaust PM2.5
PM2.5 Total
Bio- CO2 NBio- CO2 Total CO2 CH4 N2O CO2e
Land Use kBTU/yr tons/yr MT/yr
Automobile Care Center
919600 4.9600e-003
0.0451 0.0379 2.7000e-004
3.4300e-003
3.4300e-003
3.4300e-003
3.4300e-003
0.0000 49.0734 49.0734 9.4000e-004
9.0000e-004
49.3650
Free-Standing Discount Store
10000 5.0000e-005
4.9000e-004
4.1000e-004
0.0000 4.0000e-005
4.0000e-005
4.0000e-005
4.0000e-005
0.0000 0.5336 0.5336 1.0000e-005
1.0000e-005
0.5368
Free-Standing Discount Store
33140 1.8000e-004
1.6200e-003
1.3600e-003
1.0000e-005
1.2000e-004
1.2000e-004
1.2000e-004
1.2000e-004
0.0000 1.7685 1.7685 3.0000e-005
3.0000e-005
1.7790
Free-Standing Discount Store
44380 2.4000e-004
2.1800e-003
1.8300e-003
1.0000e-005
1.7000e-004
1.7000e-004
1.7000e-004
1.7000e-004
0.0000 2.3683 2.3683 5.0000e-005
4.0000e-005
2.3824
Gasoline/Service Station
4221.8 2.0000e-005
2.1000e-004
1.7000e-004
0.0000 2.0000e-005
2.0000e-005
2.0000e-005
2.0000e-005
0.0000 0.2253 0.2253 0.0000 0.0000 0.2266
High Turnover (Sit Down Restaurant)
1.19547e+006
6.4500e-003
0.0586 0.0492 3.5000e-004
4.4500e-003
4.4500e-003
4.4500e-003
4.4500e-003
0.0000 63.7946 63.7946 1.2200e-003
1.1700e-003
64.1737
High Turnover (Sit Down Restaurant)
1.23436e+006
6.6600e-003
0.0605 0.0508 3.6000e-004
4.6000e-003
4.6000e-003
4.6000e-003
4.6000e-003
0.0000 65.8703 65.8703 1.2600e-003
1.2100e-003
66.2618
High Turnover (Sit Down Restaurant)
311184 1.6800e-003
0.0153 0.0128 9.0000e-005
1.1600e-003
1.1600e-003
1.1600e-003
1.1600e-003
0.0000 16.6060 16.6060 3.2000e-004
3.0000e-004
16.7046
Regional Shopping Center
14700 8.0000e-005
7.2000e-004
6.1000e-004
0.0000 5.0000e-005
5.0000e-005
5.0000e-005
5.0000e-005
0.0000 0.7845 0.7845 2.0000e-005
1.0000e-005
0.7891
Regional Shopping Center
24600 1.3000e-004
1.2100e-003
1.0100e-003
1.0000e-005
9.0000e-005
9.0000e-005
9.0000e-005
9.0000e-005
0.0000 1.3128 1.3128 3.0000e-005
2.0000e-005
1.3206
Regional Shopping Center
51000 2.8000e-004
2.5000e-003
2.1000e-003
1.0000e-005
1.9000e-004
1.9000e-004
1.9000e-004
1.9000e-004
0.0000 2.7216 2.7216 5.0000e-005
5.0000e-005
2.7377
Supermarket 1.57002e+006
8.4700e-003
0.0770 0.0647 4.6000e-004
5.8500e-003
5.8500e-003
5.8500e-003
5.8500e-003
0.0000 83.7823 83.7823 1.6100e-003
1.5400e-003
84.2801
Total 0.0292 0.2653 0.2229 1.5700e-003
0.0202 0.0202 0.0202 0.0202 0.0000 288.8409 288.8409 5.5400e-003
5.2800e-003
290.5574
Unmitigated
CalEEMod Version: CalEEMod.2016.3.2 Date: 8/26/2020 8:59 PMPage 23 of 35
ITC Existing Uses - South Coast Air Basin, Annual

5.2 Energy by Land Use - NaturalGas
NaturalGas Use
ROG NOx CO SO2 Fugitive PM10
Exhaust PM10
PM10 Total
Fugitive PM2.5
Exhaust PM2.5
PM2.5 Total
Bio- CO2 NBio- CO2 Total CO2 CH4 N2O CO2e
Land Use kBTU/yr tons/yr MT/yr
Automobile Care Center
919600 4.9600e-003
0.0451 0.0379 2.7000e-004
3.4300e-003
3.4300e-003
3.4300e-003
3.4300e-003
0.0000 49.0734 49.0734 9.4000e-004
9.0000e-004
49.3650
Free-Standing Discount Store
10000 5.0000e-005
4.9000e-004
4.1000e-004
0.0000 4.0000e-005
4.0000e-005
4.0000e-005
4.0000e-005
0.0000 0.5336 0.5336 1.0000e-005
1.0000e-005
0.5368
Free-Standing Discount Store
33140 1.8000e-004
1.6200e-003
1.3600e-003
1.0000e-005
1.2000e-004
1.2000e-004
1.2000e-004
1.2000e-004
0.0000 1.7685 1.7685 3.0000e-005
3.0000e-005
1.7790
Free-Standing Discount Store
44380 2.4000e-004
2.1800e-003
1.8300e-003
1.0000e-005
1.7000e-004
1.7000e-004
1.7000e-004
1.7000e-004
0.0000 2.3683 2.3683 5.0000e-005
4.0000e-005
2.3824
Gasoline/Service Station
4221.8 2.0000e-005
2.1000e-004
1.7000e-004
0.0000 2.0000e-005
2.0000e-005
2.0000e-005
2.0000e-005
0.0000 0.2253 0.2253 0.0000 0.0000 0.2266
High Turnover (Sit Down Restaurant)
1.19547e+006
6.4500e-003
0.0586 0.0492 3.5000e-004
4.4500e-003
4.4500e-003
4.4500e-003
4.4500e-003
0.0000 63.7946 63.7946 1.2200e-003
1.1700e-003
64.1737
High Turnover (Sit Down Restaurant)
1.23436e+006
6.6600e-003
0.0605 0.0508 3.6000e-004
4.6000e-003
4.6000e-003
4.6000e-003
4.6000e-003
0.0000 65.8703 65.8703 1.2600e-003
1.2100e-003
66.2618
High Turnover (Sit Down Restaurant)
311184 1.6800e-003
0.0153 0.0128 9.0000e-005
1.1600e-003
1.1600e-003
1.1600e-003
1.1600e-003
0.0000 16.6060 16.6060 3.2000e-004
3.0000e-004
16.7046
Regional Shopping Center
14700 8.0000e-005
7.2000e-004
6.1000e-004
0.0000 5.0000e-005
5.0000e-005
5.0000e-005
5.0000e-005
0.0000 0.7845 0.7845 2.0000e-005
1.0000e-005
0.7891
Regional Shopping Center
24600 1.3000e-004
1.2100e-003
1.0100e-003
1.0000e-005
9.0000e-005
9.0000e-005
9.0000e-005
9.0000e-005
0.0000 1.3128 1.3128 3.0000e-005
2.0000e-005
1.3206
Regional Shopping Center
51000 2.8000e-004
2.5000e-003
2.1000e-003
1.0000e-005
1.9000e-004
1.9000e-004
1.9000e-004
1.9000e-004
0.0000 2.7216 2.7216 5.0000e-005
5.0000e-005
2.7377
Supermarket 1.57002e+006
8.4700e-003
0.0770 0.0647 4.6000e-004
5.8500e-003
5.8500e-003
5.8500e-003
5.8500e-003
0.0000 83.7823 83.7823 1.6100e-003
1.5400e-003
84.2801
Total 0.0292 0.2653 0.2229 1.5700e-003
0.0202 0.0202 0.0202 0.0202 0.0000 288.8409 288.8409 5.5400e-003
5.2800e-003
290.5574
Mitigated
CalEEMod Version: CalEEMod.2016.3.2 Date: 8/26/2020 8:59 PMPage 24 of 35
ITC Existing Uses - South Coast Air Basin, Annual

5.3 Energy by Land Use - Electricity
Electricity Use
Total CO2 CH4 N2O CO2e
Land Use kWh/yr MT/yr
Automobile Care Center
371800 118.4635 4.8900e-003
1.0100e-003
118.8873
Free-Standing Discount Store
189561 60.3981 2.4900e-003
5.2000e-004
60.6142
Free-Standing Discount Store
253854 80.8832 3.3400e-003
6.9000e-004
81.1726
Free-Standing Discount Store
57200 18.2252 7.5000e-004
1.6000e-004
18.2904
Gasoline/Service Station
1706.9 0.5439 2.0000e-005
0.0000 0.5458
High Turnover (Sit Down Restaurant)
168173 53.5835 2.2100e-003
4.6000e-004
53.7752
High Turnover (Sit Down Restaurant)
173645 55.3270 2.2800e-003
4.7000e-004
55.5249
High Turnover (Sit Down Restaurant)
43776 13.9480 5.8000e-004
1.2000e-004
13.9979
Regional Shopping Center
140712 44.8339 1.8500e-003
3.8000e-004
44.9943
Regional Shopping Center
291720 92.9482 3.8400e-003
7.9000e-004
93.2808
Regional Shopping Center
84084 26.7910 1.1100e-003
2.3000e-004
26.8868
Supermarket 2.95057e+006
940.1142 0.0388 8.0300e-003
943.4775
Total 1,506.0594
0.0622 0.0129 1,511.4474
Unmitigated
CalEEMod Version: CalEEMod.2016.3.2 Date: 8/26/2020 8:59 PMPage 25 of 35
ITC Existing Uses - South Coast Air Basin, Annual

6.0 Area Detail
5.3 Energy by Land Use - Electricity
Electricity Use
Total CO2 CH4 N2O CO2e
Land Use kWh/yr MT/yr
Automobile Care Center
371800 118.4635 4.8900e-003
1.0100e-003
118.8873
Free-Standing Discount Store
189561 60.3981 2.4900e-003
5.2000e-004
60.6142
Free-Standing Discount Store
253854 80.8832 3.3400e-003
6.9000e-004
81.1726
Free-Standing Discount Store
57200 18.2252 7.5000e-004
1.6000e-004
18.2904
Gasoline/Service Station
1706.9 0.5439 2.0000e-005
0.0000 0.5458
High Turnover (Sit Down Restaurant)
168173 53.5835 2.2100e-003
4.6000e-004
53.7752
High Turnover (Sit Down Restaurant)
173645 55.3270 2.2800e-003
4.7000e-004
55.5249
High Turnover (Sit Down Restaurant)
43776 13.9480 5.8000e-004
1.2000e-004
13.9979
Regional Shopping Center
140712 44.8339 1.8500e-003
3.8000e-004
44.9943
Regional Shopping Center
291720 92.9482 3.8400e-003
7.9000e-004
93.2808
Regional Shopping Center
84084 26.7910 1.1100e-003
2.3000e-004
26.8868
Supermarket 2.95057e+006
940.1142 0.0388 8.0300e-003
943.4775
Total 1,506.0594
0.0622 0.0129 1,511.4474
Mitigated
CalEEMod Version: CalEEMod.2016.3.2 Date: 8/26/2020 8:59 PMPage 26 of 35
ITC Existing Uses - South Coast Air Basin, Annual

6.1 Mitigation Measures Area
ROG NOx CO SO2 Fugitive PM10
Exhaust PM10
PM10 Total
Fugitive PM2.5
Exhaust PM2.5
PM2.5 Total
Bio- CO2 NBio- CO2 Total CO2 CH4 N2O CO2e
Category tons/yr MT/yr
Mitigated 0.8979 3.0000e-005
2.9000e-003
0.0000 1.0000e-005
1.0000e-005
1.0000e-005
1.0000e-005
0.0000 5.6100e-003
5.6100e-003
2.0000e-005
0.0000 5.9800e-003
Unmitigated 0.8979 3.0000e-005
2.9000e-003
0.0000 1.0000e-005
1.0000e-005
1.0000e-005
1.0000e-005
0.0000 5.6100e-003
5.6100e-003
2.0000e-005
0.0000 5.9800e-003
6.2 Area by SubCategory
ROG NOx CO SO2 Fugitive PM10
Exhaust PM10
PM10 Total
Fugitive PM2.5
Exhaust PM2.5
PM2.5 Total
Bio- CO2 NBio- CO2 Total CO2 CH4 N2O CO2e
SubCategory tons/yr MT/yr
Architectural Coating
0.1023 0.0000 0.0000 0.0000 0.0000 0.0000 0.0000 0.0000 0.0000 0.0000 0.0000
Consumer Products
0.7953 0.0000 0.0000 0.0000 0.0000 0.0000 0.0000 0.0000 0.0000 0.0000 0.0000
Landscaping 2.7000e-004
3.0000e-005
2.9000e-003
0.0000 1.0000e-005
1.0000e-005
1.0000e-005
1.0000e-005
0.0000 5.6100e-003
5.6100e-003
2.0000e-005
0.0000 5.9800e-003
Total 0.8979 3.0000e-005
2.9000e-003
0.0000 1.0000e-005
1.0000e-005
1.0000e-005
1.0000e-005
0.0000 5.6100e-003
5.6100e-003
2.0000e-005
0.0000 5.9800e-003
Unmitigated
CalEEMod Version: CalEEMod.2016.3.2 Date: 8/26/2020 8:59 PMPage 27 of 35
ITC Existing Uses - South Coast Air Basin, Annual

7.1 Mitigation Measures Water
7.0 Water Detail
6.2 Area by SubCategory
ROG NOx CO SO2 Fugitive PM10
Exhaust PM10
PM10 Total
Fugitive PM2.5
Exhaust PM2.5
PM2.5 Total
Bio- CO2 NBio- CO2 Total CO2 CH4 N2O CO2e
SubCategory tons/yr MT/yr
Architectural Coating
0.1023 0.0000 0.0000 0.0000 0.0000 0.0000 0.0000 0.0000 0.0000 0.0000 0.0000
Consumer Products
0.7953 0.0000 0.0000 0.0000 0.0000 0.0000 0.0000 0.0000 0.0000 0.0000 0.0000
Landscaping 2.7000e-004
3.0000e-005
2.9000e-003
0.0000 1.0000e-005
1.0000e-005
1.0000e-005
1.0000e-005
0.0000 5.6100e-003
5.6100e-003
2.0000e-005
0.0000 5.9800e-003
Total 0.8979 3.0000e-005
2.9000e-003
0.0000 1.0000e-005
1.0000e-005
1.0000e-005
1.0000e-005
0.0000 5.6100e-003
5.6100e-003
2.0000e-005
0.0000 5.9800e-003
Mitigated
CalEEMod Version: CalEEMod.2016.3.2 Date: 8/26/2020 8:59 PMPage 28 of 35
ITC Existing Uses - South Coast Air Basin, Annual

Total CO2 CH4 N2O CO2e
Category MT/yr
Mitigated 129.8474 0.7686 0.0191 154.7460
Unmitigated 129.8474 0.7686 0.0191 154.7460
CalEEMod Version: CalEEMod.2016.3.2 Date: 8/26/2020 8:59 PMPage 29 of 35
ITC Existing Uses - South Coast Air Basin, Annual

7.2 Water by Land Use
Indoor/Outdoor Use
Total CO2 CH4 N2O CO2e
Land Use Mgal MT/yr
Automobile Care Center
4.13957 / 2.53716
27.4687 0.1360 3.4100e-003
31.8835
Free-Standing Discount Store
3.24215 / 1.98713
21.5137 0.1065 2.6700e-003
24.9715
Gasoline/Service Station
0.0796913 /
0.0488431
0.5288 2.6200e-003
7.0000e-005
0.6138
High Turnover (Sit Down Restaurant)
3.20835 / 0.204788
15.0535 0.1051 2.5900e-003
18.4529
Regional Shopping Center
3.34437 / 2.04978
22.1920 0.1099 2.7500e-003
25.7588
Supermarket 9.41769 / 0.291269
43.0907 0.3085 7.5900e-003
53.0654
Total 129.8474 0.7686 0.0191 154.7460
Unmitigated
CalEEMod Version: CalEEMod.2016.3.2 Date: 8/26/2020 8:59 PMPage 30 of 35
ITC Existing Uses - South Coast Air Basin, Annual

8.1 Mitigation Measures Waste
7.2 Water by Land Use
Indoor/Outdoor Use
Total CO2 CH4 N2O CO2e
Land Use Mgal MT/yr
Automobile Care Center
4.13957 / 2.53716
27.4687 0.1360 3.4100e-003
31.8835
Free-Standing Discount Store
3.24215 / 1.98713
21.5137 0.1065 2.6700e-003
24.9715
Gasoline/Service Station
0.0796913 /
0.0488431
0.5288 2.6200e-003
7.0000e-005
0.6138
High Turnover (Sit Down Restaurant)
3.20835 / 0.204788
15.0535 0.1051 2.5900e-003
18.4529
Regional Shopping Center
3.34437 / 2.04978
22.1920 0.1099 2.7500e-003
25.7588
Supermarket 9.41769 / 0.291269
43.0907 0.3085 7.5900e-003
53.0654
Total 129.8474 0.7686 0.0191 154.7460
Mitigated
8.0 Waste Detail
CalEEMod Version: CalEEMod.2016.3.2 Date: 8/26/2020 8:59 PMPage 31 of 35
ITC Existing Uses - South Coast Air Basin, Annual
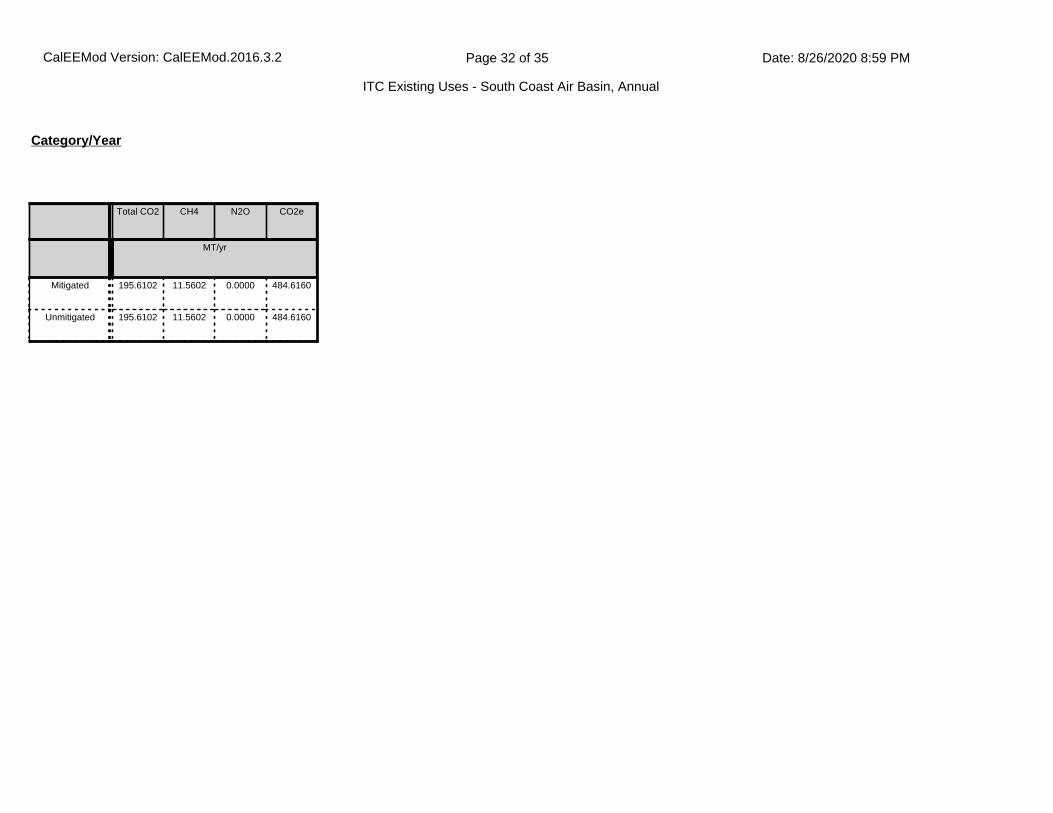
Total CO2 CH4 N2O CO2e
MT/yr
Mitigated 195.6102 11.5602 0.0000 484.6160
Unmitigated 195.6102 11.5602 0.0000 484.6160
Category/Year
CalEEMod Version: CalEEMod.2016.3.2 Date: 8/26/2020 8:59 PMPage 32 of 35
ITC Existing Uses - South Coast Air Basin, Annual

8.2 Waste by Land Use
Waste Disposed
Total CO2 CH4 N2O CO2e
Land Use tons MT/yr
Automobile Care Center
168.08 34.1187 2.0164 0.0000 84.5277
Free-Standing Discount Store
188.24 38.2110 2.2582 0.0000 94.6662
Gasoline/Service Station
3.23 0.6557 0.0388 0.0000 1.6244
High Turnover (Sit Down Restaurant)
125.78 25.5322 1.5089 0.0000 63.2550
Regional Shopping Center
47.41 9.6238 0.5688 0.0000 23.8426
Supermarket 430.9 87.4688 5.1693 0.0000 216.7003
Total 195.6102 11.5602 0.0000 484.6160
Unmitigated
CalEEMod Version: CalEEMod.2016.3.2 Date: 8/26/2020 8:59 PMPage 33 of 35
ITC Existing Uses - South Coast Air Basin, Annual

8.2 Waste by Land Use
Waste Disposed
Total CO2 CH4 N2O CO2e
Land Use tons MT/yr
Automobile Care Center
168.08 34.1187 2.0164 0.0000 84.5277
Free-Standing Discount Store
188.24 38.2110 2.2582 0.0000 94.6662
Gasoline/Service Station
3.23 0.6557 0.0388 0.0000 1.6244
High Turnover (Sit Down Restaurant)
125.78 25.5322 1.5089 0.0000 63.2550
Regional Shopping Center
47.41 9.6238 0.5688 0.0000 23.8426
Supermarket 430.9 87.4688 5.1693 0.0000 216.7003
Total 195.6102 11.5602 0.0000 484.6160
Mitigated
9.0 Operational Offroad
Equipment Type Number Hours/Day Days/Year Horse Power Load Factor Fuel Type
10.0 Stationary Equipment
Fire Pumps and Emergency Generators
Equipment Type Number Hours/Day Hours/Year Horse Power Load Factor Fuel Type
Boilers
CalEEMod Version: CalEEMod.2016.3.2 Date: 8/26/2020 8:59 PMPage 34 of 35
ITC Existing Uses - South Coast Air Basin, Annual

11.0 Vegetation
Equipment Type Number Heat Input/Day Heat Input/Year Boiler Rating Fuel Type
User Defined Equipment
Equipment Type Number
CalEEMod Version: CalEEMod.2016.3.2 Date: 8/26/2020 8:59 PMPage 35 of 35
ITC Existing Uses - South Coast Air Basin, Annual

1.1 Land Usage
Land Uses Size Metric Lot Acreage Floor Surface Area Population
High Turnover (Sit Down Restaurant) 1.20 1000sqft 0.03 1,200.00 0
High Turnover (Sit Down Restaurant) 4.76 1000sqft 0.11 4,760.00 0
High Turnover (Sit Down Restaurant) 4.61 1000sqft 0.11 4,610.00 0
Automobile Care Center 44.00 1000sqft 1.01 44,000.00 0
Free-Standing Discount Store 22.19 1000sqft 0.51 22,190.00 0
Free-Standing Discount Store 5.00 1000sqft 0.11 5,000.00 0
Free-Standing Discount Store 16.57 1000sqft 0.38 16,570.00 0
Gasoline/Service Station 6.00 Pump 0.02 202.00 0
Regional Shopping Center 12.30 1000sqft 0.28 12,300.00 0
Regional Shopping Center 25.50 1000sqft 0.59 25,500.00 0
Regional Shopping Center 7.35 1000sqft 0.17 7,350.00 0
Supermarket 76.40 1000sqft 1.75 76,400.00 0
1.2 Other Project Characteristics
Urbanization
Climate Zone
Urban
8
Wind Speed (m/s) Precipitation Freq (Days)2.2 31
1.0 Project Characteristics
Utility Company Southern California Edison
2020Operational Year
CO2 Intensity (lb/MWhr)
702.44 0.029CH4 Intensity (lb/MWhr)
0.006N2O Intensity (lb/MWhr)
ITC Existing UsesSouth Coast Air Basin, Summer
CalEEMod Version: CalEEMod.2016.3.2 Date: 8/26/2020 9:01 PMPage 1 of 26
ITC Existing Uses - South Coast Air Basin, Summer

Project Characteristics -
Land Use - '
Construction Phase - Existing Uses, no construction
Vehicle Trips - Using EMFAC for motor vehicle emissions
1.3 User Entered Comments & Non-Default Data
Table Name Column Name Default Value New Value
tblConstructionPhase NumDays 20.00 0.00
tblConstructionPhase NumDays 10.00 0.00
tblConstructionPhase NumDays 20.00 0.00
tblConstructionPhase NumDays 230.00 0.00
tblConstructionPhase NumDays 20.00 0.00
tblConstructionPhase NumDays 20.00 0.00
tblGrading AcresOfGrading 0.00 10.00
tblLandUse LandUseSquareFeet 847.05 202.00
tblSolidWaste SolidWasteGenerationRate 188.20 188.24
tblVehicleTrips ST_TR 23.72 0.00
tblVehicleTrips ST_TR 71.07 0.00
tblVehicleTrips ST_TR 168.56 0.00
tblVehicleTrips ST_TR 158.37 0.00
tblVehicleTrips ST_TR 49.97 0.00
tblVehicleTrips ST_TR 177.59 0.00
tblVehicleTrips SU_TR 11.88 0.00
tblVehicleTrips SU_TR 56.36 0.00
tblVehicleTrips SU_TR 168.56 0.00
tblVehicleTrips SU_TR 131.84 0.00
tblVehicleTrips SU_TR 25.24 0.00
CalEEMod Version: CalEEMod.2016.3.2 Date: 8/26/2020 9:01 PMPage 2 of 26
ITC Existing Uses - South Coast Air Basin, Summer

2.0 Emissions Summary
tblVehicleTrips SU_TR 166.44 0.00
tblVehicleTrips WD_TR 23.72 0.00
tblVehicleTrips WD_TR 57.24 0.00
tblVehicleTrips WD_TR 168.56 0.00
tblVehicleTrips WD_TR 127.15 0.00
tblVehicleTrips WD_TR 42.70 0.00
tblVehicleTrips WD_TR 102.24 0.00
tblWater IndoorWaterUseRate 3,241,413.54 3,242,154.27
tblWater OutdoorWaterUseRate 1,986,672.81 1,987,126.81
CalEEMod Version: CalEEMod.2016.3.2 Date: 8/26/2020 9:01 PMPage 3 of 26
ITC Existing Uses - South Coast Air Basin, Summer

2.1 Overall Construction (Maximum Daily Emission)
ROG NOx CO SO2 Fugitive PM10
Exhaust PM10
PM10 Total
Fugitive PM2.5
Exhaust PM2.5
PM2.5 Total
Bio- CO2 NBio- CO2 Total CO2 CH4 N2O CO2e
Year lb/day lb/day
2019 0.0000 0.0000 0.0000 0.0000 0.0000 5.1142 0.0000 0.0000 4.7321 0.0000 0.0000 0.0000 0.0000 0.0000 0.0000 0.0000
2020 0.0000 0.0000 0.0000 0.0000 0.0000 0.8662 0.0000 0.0000 0.8058 0.0000 0.0000 0.0000 0.0000 0.0000 0.0000 0.0000
Maximum 0.0000 0.0000 0.0000 0.0000 0.0000 5.1142 0.0000 0.0000 4.7321 0.0000 0.0000 0.0000 0.0000 0.0000 0.0000 0.0000
Unmitigated Construction
ROG NOx CO SO2 Fugitive PM10
Exhaust PM10
PM10 Total
Fugitive PM2.5
Exhaust PM2.5
PM2.5 Total
Bio- CO2 NBio- CO2 Total CO2 CH4 N2O CO2e
Year lb/day lb/day
2019 0.0000 0.0000 0.0000 0.0000 0.0000 5.1142 0.0000 0.0000 4.7321 0.0000 0.0000 0.0000 0.0000 0.0000 0.0000 0.0000
2020 0.0000 0.0000 0.0000 0.0000 0.0000 0.8662 0.0000 0.0000 0.8058 0.0000 0.0000 0.0000 0.0000 0.0000 0.0000 0.0000
Maximum 0.0000 0.0000 0.0000 0.0000 0.0000 5.1142 0.0000 0.0000 4.7321 0.0000 0.0000 0.0000 0.0000 0.0000 0.0000 0.0000
Mitigated Construction
ROG NOx CO SO2 Fugitive PM10
Exhaust PM10
PM10 Total
Fugitive PM2.5
Exhaust PM2.5
PM2.5 Total
Bio- CO2 NBio-CO2 Total CO2 CH4 N20 CO2e
Percent Reduction
0.00 0.00 0.00 0.00 0.00 0.00 0.00 0.00 0.00 0.00 0.00 0.00 0.00 0.00 0.00 0.00
CalEEMod Version: CalEEMod.2016.3.2 Date: 8/26/2020 9:01 PMPage 4 of 26
ITC Existing Uses - South Coast Air Basin, Summer

2.2 Overall Operational
ROG NOx CO SO2 Fugitive PM10
Exhaust PM10
PM10 Total
Fugitive PM2.5
Exhaust PM2.5
PM2.5 Total
Bio- CO2 NBio- CO2 Total CO2 CH4 N2O CO2e
Category lb/day lb/day
Area 4.9204 2.1000e-004
0.0232 0.0000 8.0000e-005
8.0000e-005
8.0000e-005
8.0000e-005
0.0494 0.0494 1.3000e-004
0.0528
Energy 0.1599 1.4539 1.2212 8.7200e-003
0.1105 0.1105 0.1105 0.1105 1,744.6170
1,744.6170
0.0334 0.0320 1,754.9844
Mobile 0.0000 0.0000 0.0000 0.0000 0.0000 0.0000 0.0000 0.0000 0.0000 0.0000 0.0000 0.0000 0.0000 0.0000
Total 5.0803 1.4541 1.2444 8.7200e-003
0.0000 0.1106 0.1106 0.0000 0.1106 0.1106 1,744.6664
1,744.6664
0.0336 0.0320 1,755.0371
Unmitigated Operational
ROG NOx CO SO2 Fugitive PM10
Exhaust PM10
PM10 Total
Fugitive PM2.5
Exhaust PM2.5
PM2.5 Total
Bio- CO2 NBio- CO2 Total CO2 CH4 N2O CO2e
Category lb/day lb/day
Area 4.9204 2.1000e-004
0.0232 0.0000 8.0000e-005
8.0000e-005
8.0000e-005
8.0000e-005
0.0494 0.0494 1.3000e-004
0.0528
Energy 0.1599 1.4539 1.2212 8.7200e-003
0.1105 0.1105 0.1105 0.1105 1,744.6170
1,744.6170
0.0334 0.0320 1,754.9844
Mobile 0.0000 0.0000 0.0000 0.0000 0.0000 0.0000 0.0000 0.0000 0.0000 0.0000 0.0000 0.0000 0.0000 0.0000
Total 5.0803 1.4541 1.2444 8.7200e-003
0.0000 0.1106 0.1106 0.0000 0.1106 0.1106 1,744.6664
1,744.6664
0.0336 0.0320 1,755.0371
Mitigated Operational
CalEEMod Version: CalEEMod.2016.3.2 Date: 8/26/2020 9:01 PMPage 5 of 26
ITC Existing Uses - South Coast Air Basin, Summer

3.0 Construction Detail
Construction Phase
Phase Number
Phase Name Phase Type Start Date End Date Num Days Week
Num Days Phase Description
1 Demolition Demolition 1/1/2019 12/31/2018 5 0
2 Site Preparation Site Preparation 1/29/2019 1/28/2019 5 0
3 Grading Grading 2/12/2019 2/11/2019 5 0
4 Building Construction Building Construction 3/12/2019 3/11/2019 5 0
5 Paving Paving 1/28/2020 1/27/2020 5 0
6 Architectural Coating Architectural Coating 2/25/2020 2/24/2020 5 0
OffRoad Equipment
ROG NOx CO SO2 Fugitive PM10
Exhaust PM10
PM10 Total
Fugitive PM2.5
Exhaust PM2.5
PM2.5 Total
Bio- CO2 NBio-CO2 Total CO2 CH4 N20 CO2e
Percent Reduction
0.00 0.00 0.00 0.00 0.00 0.00 0.00 0.00 0.00 0.00 0.00 0.00 0.00 0.00 0.00 0.00
Residential Indoor: 0; Residential Outdoor: 0; Non-Residential Indoor: 331,104; Non-Residential Outdoor: 110,368; Striped Parking Area: 0 (Architectural Coating – sqft)
Acres of Grading (Site Preparation Phase): 0
Acres of Grading (Grading Phase): 10
Acres of Paving: 0
CalEEMod Version: CalEEMod.2016.3.2 Date: 8/26/2020 9:01 PMPage 6 of 26
ITC Existing Uses - South Coast Air Basin, Summer

Phase Name Offroad Equipment Type Amount Usage Hours Horse Power Load Factor
Demolition Concrete/Industrial Saws 1 8.00 81 0.73
Demolition Excavators 3 8.00 158 0.38
Demolition Rubber Tired Dozers 2 8.00 247 0.40
Site Preparation Rubber Tired Dozers 3 8.00 247 0.40
Site Preparation Tractors/Loaders/Backhoes 4 8.00 97 0.37
Grading Excavators 1 8.00 158 0.38
Grading Graders 1 8.00 187 0.41
Grading Rubber Tired Dozers 1 8.00 247 0.40
Grading Tractors/Loaders/Backhoes 3 8.00 97 0.37
Building Construction Cranes 1 7.00 231 0.29
Building Construction Forklifts 3 8.00 89 0.20
Building Construction Generator Sets 1 8.00 84 0.74
Building Construction Tractors/Loaders/Backhoes 3 7.00 97 0.37
Building Construction Welders 1 8.00 46 0.45
Paving Pavers 2 8.00 130 0.42
Paving Paving Equipment 2 8.00 132 0.36
Paving Rollers 2 8.00 80 0.38
Architectural Coating Air Compressors 1 6.00 78 0.48
Trips and VMT
CalEEMod Version: CalEEMod.2016.3.2 Date: 8/26/2020 9:01 PMPage 7 of 26
ITC Existing Uses - South Coast Air Basin, Summer

3.3 Site Preparation - 2019
ROG NOx CO SO2 Fugitive PM10
Exhaust PM10
PM10 Total
Fugitive PM2.5
Exhaust PM2.5
PM2.5 Total
Bio- CO2 NBio- CO2 Total CO2 CH4 N2O CO2e
Category lb/day lb/day
Fugitive Dust 0.0000 0.0000 0.0000 0.0000 0.0000 0.0000 0.0000 0.0000 0.0000 0.0000 0.0000 0.0000 0.0000 0.0000 0.0000 0.0000
Off-Road 0.0000 0.0000 0.0000 0.0000 0.0000 0.0000 0.0000 0.0000 0.0000 0.0000 0.0000 0.0000 0.0000 0.0000 0.0000 0.0000
Total 0.0000 0.0000 0.0000 0.0000 0.0000 0.0000 0.0000 0.0000 0.0000 0.0000 0.0000 0.0000 0.0000 0.0000 0.0000 0.0000
Unmitigated Construction On-Site
3.1 Mitigation Measures Construction
Phase Name Offroad Equipment Count
Worker Trip Number
Vendor Trip Number
Hauling Trip Number
Worker Trip Length
Vendor Trip Length
Hauling Trip Length
Worker Vehicle Class
Vendor Vehicle Class
Hauling Vehicle Class
Demolition 6 15.00 0.00 0.00 14.70 6.90 20.00 LD_Mix HDT_Mix HHDT
Site Preparation 7 18.00 0.00 0.00 14.70 6.90 20.00 LD_Mix HDT_Mix HHDT
Grading 6 15.00 0.00 0.00 14.70 6.90 20.00 LD_Mix HDT_Mix HHDT
Building Construction 9 72.00 36.00 0.00 14.70 6.90 20.00 LD_Mix HDT_Mix HHDT
Paving 6 15.00 0.00 0.00 14.70 6.90 20.00 LD_Mix HDT_Mix HHDT
Architectural Coating 1 14.00 0.00 0.00 14.70 6.90 20.00 LD_Mix HDT_Mix HHDT
CalEEMod Version: CalEEMod.2016.3.2 Date: 8/26/2020 9:01 PMPage 8 of 26
ITC Existing Uses - South Coast Air Basin, Summer

3.3 Site Preparation - 2019
ROG NOx CO SO2 Fugitive PM10
Exhaust PM10
PM10 Total
Fugitive PM2.5
Exhaust PM2.5
PM2.5 Total
Bio- CO2 NBio- CO2 Total CO2 CH4 N2O CO2e
Category lb/day lb/day
Hauling 0.0000 0.0000 0.0000 0.0000 0.0000 0.0000 0.0000 0.0000 0.0000 0.0000 0.0000 0.0000 0.0000 0.0000 0.0000 0.0000
Vendor 0.0000 0.0000 0.0000 0.0000 0.0000 0.0000 0.0000 0.0000 0.0000 0.0000 0.0000 0.0000 0.0000 0.0000 0.0000 0.0000
Worker 0.0000 0.0000 0.0000 0.0000 0.0000 0.0000 0.0000 0.0000 0.0000 0.0000 0.0000 0.0000 0.0000 0.0000 0.0000 0.0000
Total 0.0000 0.0000 0.0000 0.0000 0.0000 0.0000 0.0000 0.0000 0.0000 0.0000 0.0000 0.0000 0.0000 0.0000 0.0000 0.0000
Unmitigated Construction Off-Site
ROG NOx CO SO2 Fugitive PM10
Exhaust PM10
PM10 Total
Fugitive PM2.5
Exhaust PM2.5
PM2.5 Total
Bio- CO2 NBio- CO2 Total CO2 CH4 N2O CO2e
Category lb/day lb/day
Fugitive Dust 0.0000 0.0000 0.0000 0.0000 0.0000 0.0000 0.0000 0.0000 0.0000 0.0000 0.0000 0.0000 0.0000 0.0000 0.0000 0.0000
Off-Road 0.0000 0.0000 0.0000 0.0000 0.0000 0.0000 0.0000 0.0000 0.0000 0.0000 0.0000 0.0000 0.0000 0.0000 0.0000 0.0000
Total 0.0000 0.0000 0.0000 0.0000 0.0000 0.0000 0.0000 0.0000 0.0000 0.0000 0.0000 0.0000 0.0000 0.0000 0.0000 0.0000
Mitigated Construction On-Site
CalEEMod Version: CalEEMod.2016.3.2 Date: 8/26/2020 9:01 PMPage 9 of 26
ITC Existing Uses - South Coast Air Basin, Summer

3.3 Site Preparation - 2019
ROG NOx CO SO2 Fugitive PM10
Exhaust PM10
PM10 Total
Fugitive PM2.5
Exhaust PM2.5
PM2.5 Total
Bio- CO2 NBio- CO2 Total CO2 CH4 N2O CO2e
Category lb/day lb/day
Hauling 0.0000 0.0000 0.0000 0.0000 0.0000 0.0000 0.0000 0.0000 0.0000 0.0000 0.0000 0.0000 0.0000 0.0000 0.0000 0.0000
Vendor 0.0000 0.0000 0.0000 0.0000 0.0000 0.0000 0.0000 0.0000 0.0000 0.0000 0.0000 0.0000 0.0000 0.0000 0.0000 0.0000
Worker 0.0000 0.0000 0.0000 0.0000 0.0000 0.0000 0.0000 0.0000 0.0000 0.0000 0.0000 0.0000 0.0000 0.0000 0.0000 0.0000
Total 0.0000 0.0000 0.0000 0.0000 0.0000 0.0000 0.0000 0.0000 0.0000 0.0000 0.0000 0.0000 0.0000 0.0000 0.0000 0.0000
Mitigated Construction Off-Site
3.4 Grading - 2019
ROG NOx CO SO2 Fugitive PM10
Exhaust PM10
PM10 Total
Fugitive PM2.5
Exhaust PM2.5
PM2.5 Total
Bio- CO2 NBio- CO2 Total CO2 CH4 N2O CO2e
Category lb/day lb/day
Fugitive Dust 0.0000 0.0000 0.0000 0.0000 0.0000 0.0000 0.0000 0.0000 0.0000 0.0000 0.0000 0.0000 0.0000 0.0000 0.0000 0.0000
Off-Road 0.0000 0.0000 0.0000 0.0000 0.0000 0.0000 0.0000 0.0000 0.0000 0.0000 0.0000 0.0000 0.0000 0.0000 0.0000 0.0000
Total 0.0000 0.0000 0.0000 0.0000 0.0000 0.0000 0.0000 0.0000 0.0000 0.0000 0.0000 0.0000 0.0000 0.0000 0.0000 0.0000
Unmitigated Construction On-Site
CalEEMod Version: CalEEMod.2016.3.2 Date: 8/26/2020 9:01 PMPage 10 of 26
ITC Existing Uses - South Coast Air Basin, Summer

3.4 Grading - 2019
ROG NOx CO SO2 Fugitive PM10
Exhaust PM10
PM10 Total
Fugitive PM2.5
Exhaust PM2.5
PM2.5 Total
Bio- CO2 NBio- CO2 Total CO2 CH4 N2O CO2e
Category lb/day lb/day
Hauling 0.0000 0.0000 0.0000 0.0000 0.0000 0.0000 0.0000 0.0000 0.0000 0.0000 0.0000 0.0000 0.0000 0.0000 0.0000 0.0000
Vendor 0.0000 0.0000 0.0000 0.0000 0.0000 0.0000 0.0000 0.0000 0.0000 0.0000 0.0000 0.0000 0.0000 0.0000 0.0000 0.0000
Worker 0.0000 0.0000 0.0000 0.0000 0.0000 0.0000 0.0000 0.0000 0.0000 0.0000 0.0000 0.0000 0.0000 0.0000 0.0000 0.0000
Total 0.0000 0.0000 0.0000 0.0000 0.0000 0.0000 0.0000 0.0000 0.0000 0.0000 0.0000 0.0000 0.0000 0.0000 0.0000 0.0000
Unmitigated Construction Off-Site
ROG NOx CO SO2 Fugitive PM10
Exhaust PM10
PM10 Total
Fugitive PM2.5
Exhaust PM2.5
PM2.5 Total
Bio- CO2 NBio- CO2 Total CO2 CH4 N2O CO2e
Category lb/day lb/day
Fugitive Dust 0.0000 0.0000 0.0000 0.0000 0.0000 0.0000 0.0000 0.0000 0.0000 0.0000 0.0000 0.0000 0.0000 0.0000 0.0000 0.0000
Off-Road 0.0000 0.0000 0.0000 0.0000 0.0000 0.0000 0.0000 0.0000 0.0000 0.0000 0.0000 0.0000 0.0000 0.0000 0.0000 0.0000
Total 0.0000 0.0000 0.0000 0.0000 0.0000 0.0000 0.0000 0.0000 0.0000 0.0000 0.0000 0.0000 0.0000 0.0000 0.0000 0.0000
Mitigated Construction On-Site
CalEEMod Version: CalEEMod.2016.3.2 Date: 8/26/2020 9:01 PMPage 11 of 26
ITC Existing Uses - South Coast Air Basin, Summer

3.4 Grading - 2019
ROG NOx CO SO2 Fugitive PM10
Exhaust PM10
PM10 Total
Fugitive PM2.5
Exhaust PM2.5
PM2.5 Total
Bio- CO2 NBio- CO2 Total CO2 CH4 N2O CO2e
Category lb/day lb/day
Hauling 0.0000 0.0000 0.0000 0.0000 0.0000 0.0000 0.0000 0.0000 0.0000 0.0000 0.0000 0.0000 0.0000 0.0000 0.0000 0.0000
Vendor 0.0000 0.0000 0.0000 0.0000 0.0000 0.0000 0.0000 0.0000 0.0000 0.0000 0.0000 0.0000 0.0000 0.0000 0.0000 0.0000
Worker 0.0000 0.0000 0.0000 0.0000 0.0000 0.0000 0.0000 0.0000 0.0000 0.0000 0.0000 0.0000 0.0000 0.0000 0.0000 0.0000
Total 0.0000 0.0000 0.0000 0.0000 0.0000 0.0000 0.0000 0.0000 0.0000 0.0000 0.0000 0.0000 0.0000 0.0000 0.0000 0.0000
Mitigated Construction Off-Site
3.5 Building Construction - 2019
ROG NOx CO SO2 Fugitive PM10
Exhaust PM10
PM10 Total
Fugitive PM2.5
Exhaust PM2.5
PM2.5 Total
Bio- CO2 NBio- CO2 Total CO2 CH4 N2O CO2e
Category lb/day lb/day
Off-Road 0.0000 0.0000 0.0000 0.0000 0.0000 0.0000 0.0000 0.0000 0.0000 0.0000 0.0000 0.0000 0.0000 0.0000 0.0000 0.0000
Total 0.0000 0.0000 0.0000 0.0000 0.0000 0.0000 0.0000 0.0000 0.0000 0.0000 0.0000 0.0000 0.0000 0.0000 0.0000 0.0000
Unmitigated Construction On-Site
CalEEMod Version: CalEEMod.2016.3.2 Date: 8/26/2020 9:01 PMPage 12 of 26
ITC Existing Uses - South Coast Air Basin, Summer

3.5 Building Construction - 2019
ROG NOx CO SO2 Fugitive PM10
Exhaust PM10
PM10 Total
Fugitive PM2.5
Exhaust PM2.5
PM2.5 Total
Bio- CO2 NBio- CO2 Total CO2 CH4 N2O CO2e
Category lb/day lb/day
Hauling 0.0000 0.0000 0.0000 0.0000 0.0000 0.0000 0.0000 0.0000 0.0000 0.0000 0.0000 0.0000 0.0000 0.0000 0.0000 0.0000
Vendor 0.0000 0.0000 0.0000 0.0000 0.0000 0.0000 0.0000 0.0000 0.0000 0.0000 0.0000 0.0000 0.0000 0.0000 0.0000 0.0000
Worker 0.0000 0.0000 0.0000 0.0000 0.0000 0.0000 0.0000 0.0000 0.0000 0.0000 0.0000 0.0000 0.0000 0.0000 0.0000 0.0000
Total 0.0000 0.0000 0.0000 0.0000 0.0000 0.0000 0.0000 0.0000 0.0000 0.0000 0.0000 0.0000 0.0000 0.0000 0.0000 0.0000
Unmitigated Construction Off-Site
ROG NOx CO SO2 Fugitive PM10
Exhaust PM10
PM10 Total
Fugitive PM2.5
Exhaust PM2.5
PM2.5 Total
Bio- CO2 NBio- CO2 Total CO2 CH4 N2O CO2e
Category lb/day lb/day
Off-Road 0.0000 0.0000 0.0000 0.0000 0.0000 0.0000 0.0000 0.0000 0.0000 0.0000 0.0000 0.0000 0.0000 0.0000 0.0000 0.0000
Total 0.0000 0.0000 0.0000 0.0000 0.0000 0.0000 0.0000 0.0000 0.0000 0.0000 0.0000 0.0000 0.0000 0.0000 0.0000 0.0000
Mitigated Construction On-Site
CalEEMod Version: CalEEMod.2016.3.2 Date: 8/26/2020 9:01 PMPage 13 of 26
ITC Existing Uses - South Coast Air Basin, Summer

3.5 Building Construction - 2019
ROG NOx CO SO2 Fugitive PM10
Exhaust PM10
PM10 Total
Fugitive PM2.5
Exhaust PM2.5
PM2.5 Total
Bio- CO2 NBio- CO2 Total CO2 CH4 N2O CO2e
Category lb/day lb/day
Hauling 0.0000 0.0000 0.0000 0.0000 0.0000 0.0000 0.0000 0.0000 0.0000 0.0000 0.0000 0.0000 0.0000 0.0000 0.0000 0.0000
Vendor 0.0000 0.0000 0.0000 0.0000 0.0000 0.0000 0.0000 0.0000 0.0000 0.0000 0.0000 0.0000 0.0000 0.0000 0.0000 0.0000
Worker 0.0000 0.0000 0.0000 0.0000 0.0000 0.0000 0.0000 0.0000 0.0000 0.0000 0.0000 0.0000 0.0000 0.0000 0.0000 0.0000
Total 0.0000 0.0000 0.0000 0.0000 0.0000 0.0000 0.0000 0.0000 0.0000 0.0000 0.0000 0.0000 0.0000 0.0000 0.0000 0.0000
Mitigated Construction Off-Site
3.6 Paving - 2020
ROG NOx CO SO2 Fugitive PM10
Exhaust PM10
PM10 Total
Fugitive PM2.5
Exhaust PM2.5
PM2.5 Total
Bio- CO2 NBio- CO2 Total CO2 CH4 N2O CO2e
Category lb/day lb/day
Off-Road 0.0000 0.0000 0.0000 0.0000 0.0000 0.0000 0.0000 0.0000 0.0000 0.0000 0.0000 0.0000 0.0000 0.0000 0.0000 0.0000
Paving 0.0000 0.0000 0.0000 0.0000 0.0000 0.0000 0.0000 0.0000 0.0000 0.0000 0.0000 0.0000 0.0000 0.0000 0.0000 0.0000
Total 0.0000 0.0000 0.0000 0.0000 0.0000 0.0000 0.0000 0.0000 0.0000 0.0000 0.0000 0.0000 0.0000 0.0000 0.0000 0.0000
Unmitigated Construction On-Site
CalEEMod Version: CalEEMod.2016.3.2 Date: 8/26/2020 9:01 PMPage 14 of 26
ITC Existing Uses - South Coast Air Basin, Summer

3.6 Paving - 2020
ROG NOx CO SO2 Fugitive PM10
Exhaust PM10
PM10 Total
Fugitive PM2.5
Exhaust PM2.5
PM2.5 Total
Bio- CO2 NBio- CO2 Total CO2 CH4 N2O CO2e
Category lb/day lb/day
Hauling 0.0000 0.0000 0.0000 0.0000 0.0000 0.0000 0.0000 0.0000 0.0000 0.0000 0.0000 0.0000 0.0000 0.0000 0.0000 0.0000
Vendor 0.0000 0.0000 0.0000 0.0000 0.0000 0.0000 0.0000 0.0000 0.0000 0.0000 0.0000 0.0000 0.0000 0.0000 0.0000 0.0000
Worker 0.0000 0.0000 0.0000 0.0000 0.0000 0.0000 0.0000 0.0000 0.0000 0.0000 0.0000 0.0000 0.0000 0.0000 0.0000 0.0000
Total 0.0000 0.0000 0.0000 0.0000 0.0000 0.0000 0.0000 0.0000 0.0000 0.0000 0.0000 0.0000 0.0000 0.0000 0.0000 0.0000
Unmitigated Construction Off-Site
ROG NOx CO SO2 Fugitive PM10
Exhaust PM10
PM10 Total
Fugitive PM2.5
Exhaust PM2.5
PM2.5 Total
Bio- CO2 NBio- CO2 Total CO2 CH4 N2O CO2e
Category lb/day lb/day
Off-Road 0.0000 0.0000 0.0000 0.0000 0.0000 0.0000 0.0000 0.0000 0.0000 0.0000 0.0000 0.0000 0.0000 0.0000 0.0000 0.0000
Paving 0.0000 0.0000 0.0000 0.0000 0.0000 0.0000 0.0000 0.0000 0.0000 0.0000 0.0000 0.0000 0.0000 0.0000 0.0000 0.0000
Total 0.0000 0.0000 0.0000 0.0000 0.0000 0.0000 0.0000 0.0000 0.0000 0.0000 0.0000 0.0000 0.0000 0.0000 0.0000 0.0000
Mitigated Construction On-Site
CalEEMod Version: CalEEMod.2016.3.2 Date: 8/26/2020 9:01 PMPage 15 of 26
ITC Existing Uses - South Coast Air Basin, Summer

3.6 Paving - 2020
ROG NOx CO SO2 Fugitive PM10
Exhaust PM10
PM10 Total
Fugitive PM2.5
Exhaust PM2.5
PM2.5 Total
Bio- CO2 NBio- CO2 Total CO2 CH4 N2O CO2e
Category lb/day lb/day
Hauling 0.0000 0.0000 0.0000 0.0000 0.0000 0.0000 0.0000 0.0000 0.0000 0.0000 0.0000 0.0000 0.0000 0.0000 0.0000 0.0000
Vendor 0.0000 0.0000 0.0000 0.0000 0.0000 0.0000 0.0000 0.0000 0.0000 0.0000 0.0000 0.0000 0.0000 0.0000 0.0000 0.0000
Worker 0.0000 0.0000 0.0000 0.0000 0.0000 0.0000 0.0000 0.0000 0.0000 0.0000 0.0000 0.0000 0.0000 0.0000 0.0000 0.0000
Total 0.0000 0.0000 0.0000 0.0000 0.0000 0.0000 0.0000 0.0000 0.0000 0.0000 0.0000 0.0000 0.0000 0.0000 0.0000 0.0000
Mitigated Construction Off-Site
3.7 Architectural Coating - 2020
ROG NOx CO SO2 Fugitive PM10
Exhaust PM10
PM10 Total
Fugitive PM2.5
Exhaust PM2.5
PM2.5 Total
Bio- CO2 NBio- CO2 Total CO2 CH4 N2O CO2e
Category lb/day lb/day
Archit. Coating 0.0000 0.0000 0.0000 0.0000 0.0000 0.0000 0.0000 0.0000 0.0000 0.0000 0.0000 0.0000 0.0000 0.0000 0.0000 0.0000
Off-Road 0.0000 0.0000 0.0000 0.0000 0.0000 0.0000 0.0000 0.0000 0.0000 0.0000 0.0000 0.0000 0.0000 0.0000 0.0000 0.0000
Total 0.0000 0.0000 0.0000 0.0000 0.0000 0.0000 0.0000 0.0000 0.0000 0.0000 0.0000 0.0000 0.0000 0.0000 0.0000 0.0000
Unmitigated Construction On-Site
CalEEMod Version: CalEEMod.2016.3.2 Date: 8/26/2020 9:01 PMPage 16 of 26
ITC Existing Uses - South Coast Air Basin, Summer
3.7 Architectural Coating - 2020
ROG NOx CO SO2 Fugitive PM10
Exhaust PM10
PM10 Total
Fugitive PM2.5
Exhaust PM2.5
PM2.5 Total
Bio- CO2 NBio- CO2 Total CO2 CH4 N2O CO2e
Category lb/day lb/day
Hauling 0.0000 0.0000 0.0000 0.0000 0.0000 0.0000 0.0000 0.0000 0.0000 0.0000 0.0000 0.0000 0.0000 0.0000 0.0000 0.0000
Vendor 0.0000 0.0000 0.0000 0.0000 0.0000 0.0000 0.0000 0.0000 0.0000 0.0000 0.0000 0.0000 0.0000 0.0000 0.0000 0.0000
Worker 0.0000 0.0000 0.0000 0.0000 0.0000 0.0000 0.0000 0.0000 0.0000 0.0000 0.0000 0.0000 0.0000 0.0000 0.0000 0.0000
Total 0.0000 0.0000 0.0000 0.0000 0.0000 0.0000 0.0000 0.0000 0.0000 0.0000 0.0000 0.0000 0.0000 0.0000 0.0000 0.0000
Unmitigated Construction Off-Site
ROG NOx CO SO2 Fugitive PM10
Exhaust PM10
PM10 Total
Fugitive PM2.5
Exhaust PM2.5
PM2.5 Total
Bio- CO2 NBio- CO2 Total CO2 CH4 N2O CO2e
Category lb/day lb/day
Archit. Coating 0.0000 0.0000 0.0000 0.0000 0.0000 0.0000 0.0000 0.0000 0.0000 0.0000 0.0000 0.0000 0.0000 0.0000 0.0000 0.0000
Off-Road 0.0000 0.0000 0.0000 0.0000 0.0000 0.0000 0.0000 0.0000 0.0000 0.0000 0.0000 0.0000 0.0000 0.0000 0.0000 0.0000
Total 0.0000 0.0000 0.0000 0.0000 0.0000 0.0000 0.0000 0.0000 0.0000 0.0000 0.0000 0.0000 0.0000 0.0000 0.0000 0.0000
Mitigated Construction On-Site
CalEEMod Version: CalEEMod.2016.3.2 Date: 8/26/2020 9:01 PMPage 17 of 26
ITC Existing Uses - South Coast Air Basin, Summer
4.0 Operational Detail - Mobile
4.1 Mitigation Measures Mobile
3.7 Architectural Coating - 2020
ROG NOx CO SO2 Fugitive PM10
Exhaust PM10
PM10 Total
Fugitive PM2.5
Exhaust PM2.5
PM2.5 Total
Bio- CO2 NBio- CO2 Total CO2 CH4 N2O CO2e
Category lb/day lb/day
Hauling 0.0000 0.0000 0.0000 0.0000 0.0000 0.0000 0.0000 0.0000 0.0000 0.0000 0.0000 0.0000 0.0000 0.0000 0.0000 0.0000
Vendor 0.0000 0.0000 0.0000 0.0000 0.0000 0.0000 0.0000 0.0000 0.0000 0.0000 0.0000 0.0000 0.0000 0.0000 0.0000 0.0000
Worker 0.0000 0.0000 0.0000 0.0000 0.0000 0.0000 0.0000 0.0000 0.0000 0.0000 0.0000 0.0000 0.0000 0.0000 0.0000 0.0000
Total 0.0000 0.0000 0.0000 0.0000 0.0000 0.0000 0.0000 0.0000 0.0000 0.0000 0.0000 0.0000 0.0000 0.0000 0.0000 0.0000
Mitigated Construction Off-Site
CalEEMod Version: CalEEMod.2016.3.2 Date: 8/26/2020 9:01 PMPage 18 of 26
ITC Existing Uses - South Coast Air Basin, Summer

ROG NOx CO SO2 Fugitive PM10
Exhaust PM10
PM10 Total
Fugitive PM2.5
Exhaust PM2.5
PM2.5 Total
Bio- CO2 NBio- CO2 Total CO2 CH4 N2O CO2e
Category lb/day lb/day
Mitigated 0.0000 0.0000 0.0000 0.0000 0.0000 0.0000 0.0000 0.0000 0.0000 0.0000 0.0000 0.0000 0.0000 0.0000
Unmitigated 0.0000 0.0000 0.0000 0.0000 0.0000 0.0000 0.0000 0.0000 0.0000 0.0000 0.0000 0.0000 0.0000 0.0000
4.2 Trip Summary Information
4.3 Trip Type Information
Average Daily Trip Rate Unmitigated Mitigated
Land Use Weekday Saturday Sunday Annual VMT Annual VMT
Automobile Care Center 0.00 0.00 0.00
Free-Standing Discount Store 0.00 0.00 0.00
Free-Standing Discount Store 0.00 0.00 0.00
Free-Standing Discount Store 0.00 0.00 0.00
Gasoline/Service Station 0.00 0.00 0.00
High Turnover (Sit Down Restaurant) 0.00 0.00 0.00
High Turnover (Sit Down Restaurant) 0.00 0.00 0.00
High Turnover (Sit Down Restaurant) 0.00 0.00 0.00
Regional Shopping Center 0.00 0.00 0.00
Regional Shopping Center 0.00 0.00 0.00
Regional Shopping Center 0.00 0.00 0.00
Supermarket 0.00 0.00 0.00
Total 0.00 0.00 0.00
CalEEMod Version: CalEEMod.2016.3.2 Date: 8/26/2020 9:01 PMPage 19 of 26
ITC Existing Uses - South Coast Air Basin, Summer

Miles Trip % Trip Purpose %
Land Use H-W or C-W H-S or C-C H-O or C-NW H-W or C-W H-S or C-C H-O or C-NW Primary Diverted Pass-by
Automobile Care Center 16.60 8.40 6.90 33.00 48.00 19.00 21 51 28
Free-Standing Discount Store 16.60 8.40 6.90 12.20 68.80 19.00 47.5 35.5 17
Free-Standing Discount Store 16.60 8.40 6.90 12.20 68.80 19.00 47.5 35.5 17
Free-Standing Discount Store 16.60 8.40 6.90 12.20 68.80 19.00 47.5 35.5 17
Gasoline/Service Station 16.60 8.40 6.90 2.00 79.00 19.00 14 27 59
High Turnover (Sit Down Restaurant)
16.60 8.40 6.90 8.50 72.50 19.00 37 20 43
High Turnover (Sit Down Restaurant)
16.60 8.40 6.90 8.50 72.50 19.00 37 20 43
High Turnover (Sit Down Restaurant)
16.60 8.40 6.90 8.50 72.50 19.00 37 20 43
Regional Shopping Center 16.60 8.40 6.90 16.30 64.70 19.00 54 35 11
Regional Shopping Center 16.60 8.40 6.90 16.30 64.70 19.00 54 35 11
Regional Shopping Center 16.60 8.40 6.90 16.30 64.70 19.00 54 35 11
Supermarket 16.60 8.40 6.90 6.50 74.50 19.00 34 30 36
5.0 Energy Detail
5.1 Mitigation Measures Energy
4.4 Fleet Mix
Land Use LDA LDT1 LDT2 MDV LHD1 LHD2 MHD HHD OBUS UBUS MCY SBUS MH
Automobile Care Center 0.550339 0.043800 0.200255 0.122233 0.016799 0.005871 0.020633 0.029727 0.002027 0.001932 0.004726 0.000704 0.000955
Free-Standing Discount Store 0.550339 0.043800 0.200255 0.122233 0.016799 0.005871 0.020633 0.029727 0.002027 0.001932 0.004726 0.000704 0.000955
Gasoline/Service Station 0.550339 0.043800 0.200255 0.122233 0.016799 0.005871 0.020633 0.029727 0.002027 0.001932 0.004726 0.000704 0.000955
High Turnover (Sit Down Restaurant)
0.550339 0.043800 0.200255 0.122233 0.016799 0.005871 0.020633 0.029727 0.002027 0.001932 0.004726 0.000704 0.000955
Regional Shopping Center 0.550339 0.043800 0.200255 0.122233 0.016799 0.005871 0.020633 0.029727 0.002027 0.001932 0.004726 0.000704 0.000955
Supermarket 0.550339 0.043800 0.200255 0.122233 0.016799 0.005871 0.020633 0.029727 0.002027 0.001932 0.004726 0.000704 0.000955
Historical Energy Use: N
CalEEMod Version: CalEEMod.2016.3.2 Date: 8/26/2020 9:01 PMPage 20 of 26
ITC Existing Uses - South Coast Air Basin, Summer

ROG NOx CO SO2 Fugitive PM10
Exhaust PM10
PM10 Total
Fugitive PM2.5
Exhaust PM2.5
PM2.5 Total
Bio- CO2 NBio- CO2 Total CO2 CH4 N2O CO2e
Category lb/day lb/day
NaturalGas Mitigated
0.1599 1.4539 1.2212 8.7200e-003
0.1105 0.1105 0.1105 0.1105 1,744.6170
1,744.6170
0.0334 0.0320 1,754.9844
NaturalGas Unmitigated
0.1599 1.4539 1.2212 8.7200e-003
0.1105 0.1105 0.1105 0.1105 1,744.6170
1,744.6170
0.0334 0.0320 1,754.9844
CalEEMod Version: CalEEMod.2016.3.2 Date: 8/26/2020 9:01 PMPage 21 of 26
ITC Existing Uses - South Coast Air Basin, Summer

5.2 Energy by Land Use - NaturalGas
NaturalGas Use
ROG NOx CO SO2 Fugitive PM10
Exhaust PM10
PM10 Total
Fugitive PM2.5
Exhaust PM2.5
PM2.5 Total
Bio- CO2 NBio- CO2 Total CO2 CH4 N2O CO2e
Land Use kBTU/yr lb/day lb/day
Automobile Care Center
2519.45 0.0272 0.2470 0.2075 1.4800e-003
0.0188 0.0188 0.0188 0.0188 296.4061 296.4061 5.6800e-003
5.4300e-003
298.1675
Free-Standing Discount Store
121.589 1.3100e-003
0.0119 0.0100 7.0000e-005
9.1000e-004
9.1000e-004
9.1000e-004
9.1000e-004
14.3046 14.3046 2.7000e-004
2.6000e-004
14.3896
Free-Standing Discount Store
27.3973 3.0000e-004
2.6900e-003
2.2600e-003
2.0000e-005
2.0000e-004
2.0000e-004
2.0000e-004
2.0000e-004
3.2232 3.2232 6.0000e-005
6.0000e-005
3.2424
Free-Standing Discount Store
90.7945 9.8000e-004
8.9000e-003
7.4800e-003
5.0000e-005
6.8000e-004
6.8000e-004
6.8000e-004
6.8000e-004
10.6817 10.6817 2.0000e-004
2.0000e-004
10.7452
Gasoline/Service Station
11.5666 1.2000e-004
1.1300e-003
9.5000e-004
1.0000e-005
9.0000e-005
9.0000e-005
9.0000e-005
9.0000e-005
1.3608 1.3608 3.0000e-005
2.0000e-005
1.3689
High Turnover (Sit Down Restaurant)
3275.25 0.0353 0.3211 0.2697 1.9300e-003
0.0244 0.0244 0.0244 0.0244 385.3232 385.3232 7.3900e-003
7.0600e-003
387.6130
High Turnover (Sit Down Restaurant)
3381.82 0.0365 0.3316 0.2785 1.9900e-003
0.0252 0.0252 0.0252 0.0252 397.8608 397.8608 7.6300e-003
7.2900e-003
400.2251
High Turnover (Sit Down Restaurant)
852.559 9.1900e-003
0.0836 0.0702 5.0000e-004
6.3500e-003
6.3500e-003
6.3500e-003
6.3500e-003
100.3011 100.3011 1.9200e-003
1.8400e-003
100.8971
Regional Shopping Center
139.726 1.5100e-003
0.0137 0.0115 8.0000e-005
1.0400e-003
1.0400e-003
1.0400e-003
1.0400e-003
16.4384 16.4384 3.2000e-004
3.0000e-004
16.5360
Regional Shopping Center
40.274 4.3000e-004
3.9500e-003
3.3200e-003
2.0000e-005
3.0000e-004
3.0000e-004
3.0000e-004
3.0000e-004
4.7381 4.7381 9.0000e-005
9.0000e-005
4.7663
Regional Shopping Center
67.3973 7.3000e-004
6.6100e-003
5.5500e-003
4.0000e-005
5.0000e-004
5.0000e-004
5.0000e-004
5.0000e-004
7.9291 7.9291 1.5000e-004
1.5000e-004
7.9762
Supermarket 4301.42 0.0464 0.4217 0.3542 2.5300e-003
0.0321 0.0321 0.0321 0.0321 506.0500 506.0500 9.7000e-003
9.2800e-003
509.0572
Total 0.1599 1.4539 1.2212 8.7200e-003
0.1105 0.1105 0.1105 0.1105 1,744.6170
1,744.6170
0.0334 0.0320 1,754.9844
Unmitigated
CalEEMod Version: CalEEMod.2016.3.2 Date: 8/26/2020 9:01 PMPage 22 of 26
ITC Existing Uses - South Coast Air Basin, Summer

6.0 Area Detail
5.2 Energy by Land Use - NaturalGas
NaturalGas Use
ROG NOx CO SO2 Fugitive PM10
Exhaust PM10
PM10 Total
Fugitive PM2.5
Exhaust PM2.5
PM2.5 Total
Bio- CO2 NBio- CO2 Total CO2 CH4 N2O CO2e
Land Use kBTU/yr lb/day lb/day
Automobile Care Center
2.51945 0.0272 0.2470 0.2075 1.4800e-003
0.0188 0.0188 0.0188 0.0188 296.4061 296.4061 5.6800e-003
5.4300e-003
298.1675
Free-Standing Discount Store
0.0907945 9.8000e-004
8.9000e-003
7.4800e-003
5.0000e-005
6.8000e-004
6.8000e-004
6.8000e-004
6.8000e-004
10.6817 10.6817 2.0000e-004
2.0000e-004
10.7452
Free-Standing Discount Store
0.121589 1.3100e-003
0.0119 0.0100 7.0000e-005
9.1000e-004
9.1000e-004
9.1000e-004
9.1000e-004
14.3046 14.3046 2.7000e-004
2.6000e-004
14.3896
Free-Standing Discount Store
0.0273973 3.0000e-004
2.6900e-003
2.2600e-003
2.0000e-005
2.0000e-004
2.0000e-004
2.0000e-004
2.0000e-004
3.2232 3.2232 6.0000e-005
6.0000e-005
3.2424
Gasoline/Service Station
0.0115666 1.2000e-004
1.1300e-003
9.5000e-004
1.0000e-005
9.0000e-005
9.0000e-005
9.0000e-005
9.0000e-005
1.3608 1.3608 3.0000e-005
2.0000e-005
1.3689
High Turnover (Sit Down Restaurant)
0.852559 9.1900e-003
0.0836 0.0702 5.0000e-004
6.3500e-003
6.3500e-003
6.3500e-003
6.3500e-003
100.3011 100.3011 1.9200e-003
1.8400e-003
100.8971
High Turnover (Sit Down Restaurant)
3.27525 0.0353 0.3211 0.2697 1.9300e-003
0.0244 0.0244 0.0244 0.0244 385.3232 385.3232 7.3900e-003
7.0600e-003
387.6130
High Turnover (Sit Down Restaurant)
3.38182 0.0365 0.3316 0.2785 1.9900e-003
0.0252 0.0252 0.0252 0.0252 397.8608 397.8608 7.6300e-003
7.2900e-003
400.2251
Regional Shopping Center
0.040274 4.3000e-004
3.9500e-003
3.3200e-003
2.0000e-005
3.0000e-004
3.0000e-004
3.0000e-004
3.0000e-004
4.7381 4.7381 9.0000e-005
9.0000e-005
4.7663
Regional Shopping Center
0.0673973 7.3000e-004
6.6100e-003
5.5500e-003
4.0000e-005
5.0000e-004
5.0000e-004
5.0000e-004
5.0000e-004
7.9291 7.9291 1.5000e-004
1.5000e-004
7.9762
Regional Shopping Center
0.139726 1.5100e-003
0.0137 0.0115 8.0000e-005
1.0400e-003
1.0400e-003
1.0400e-003
1.0400e-003
16.4384 16.4384 3.2000e-004
3.0000e-004
16.5360
Supermarket 4.30142 0.0464 0.4217 0.3542 2.5300e-003
0.0321 0.0321 0.0321 0.0321 506.0500 506.0500 9.7000e-003
9.2800e-003
509.0572
Total 0.1599 1.4539 1.2212 8.7200e-003
0.1105 0.1105 0.1105 0.1105 1,744.6170
1,744.6170
0.0334 0.0320 1,754.9844
Mitigated
CalEEMod Version: CalEEMod.2016.3.2 Date: 8/26/2020 9:01 PMPage 23 of 26
ITC Existing Uses - South Coast Air Basin, Summer

6.1 Mitigation Measures Area
ROG NOx CO SO2 Fugitive PM10
Exhaust PM10
PM10 Total
Fugitive PM2.5
Exhaust PM2.5
PM2.5 Total
Bio- CO2 NBio- CO2 Total CO2 CH4 N2O CO2e
Category lb/day lb/day
Mitigated 4.9204 2.1000e-004
0.0232 0.0000 8.0000e-005
8.0000e-005
8.0000e-005
8.0000e-005
0.0494 0.0494 1.3000e-004
0.0528
Unmitigated 4.9204 2.1000e-004
0.0232 0.0000 8.0000e-005
8.0000e-005
8.0000e-005
8.0000e-005
0.0494 0.0494 1.3000e-004
0.0528
6.2 Area by SubCategory
ROG NOx CO SO2 Fugitive PM10
Exhaust PM10
PM10 Total
Fugitive PM2.5
Exhaust PM2.5
PM2.5 Total
Bio- CO2 NBio- CO2 Total CO2 CH4 N2O CO2e
SubCategory lb/day lb/day
Architectural Coating
0.5606 0.0000 0.0000 0.0000 0.0000 0.0000 0.0000
Consumer Products
4.3576 0.0000 0.0000 0.0000 0.0000 0.0000 0.0000
Landscaping 2.1800e-003
2.1000e-004
0.0232 0.0000 8.0000e-005
8.0000e-005
8.0000e-005
8.0000e-005
0.0494 0.0494 1.3000e-004
0.0528
Total 4.9204 2.1000e-004
0.0232 0.0000 8.0000e-005
8.0000e-005
8.0000e-005
8.0000e-005
0.0494 0.0494 1.3000e-004
0.0528
Unmitigated
CalEEMod Version: CalEEMod.2016.3.2 Date: 8/26/2020 9:01 PMPage 24 of 26
ITC Existing Uses - South Coast Air Basin, Summer

8.1 Mitigation Measures Waste
7.1 Mitigation Measures Water
7.0 Water Detail
8.0 Waste Detail
6.2 Area by SubCategory
ROG NOx CO SO2 Fugitive PM10
Exhaust PM10
PM10 Total
Fugitive PM2.5
Exhaust PM2.5
PM2.5 Total
Bio- CO2 NBio- CO2 Total CO2 CH4 N2O CO2e
SubCategory lb/day lb/day
Architectural Coating
0.5606 0.0000 0.0000 0.0000 0.0000 0.0000 0.0000
Consumer Products
4.3576 0.0000 0.0000 0.0000 0.0000 0.0000 0.0000
Landscaping 2.1800e-003
2.1000e-004
0.0232 0.0000 8.0000e-005
8.0000e-005
8.0000e-005
8.0000e-005
0.0494 0.0494 1.3000e-004
0.0528
Total 4.9204 2.1000e-004
0.0232 0.0000 8.0000e-005
8.0000e-005
8.0000e-005
8.0000e-005
0.0494 0.0494 1.3000e-004
0.0528
Mitigated
9.0 Operational Offroad
Equipment Type Number Hours/Day Days/Year Horse Power Load Factor Fuel Type
10.0 Stationary Equipment
Fire Pumps and Emergency Generators
CalEEMod Version: CalEEMod.2016.3.2 Date: 8/26/2020 9:01 PMPage 25 of 26
ITC Existing Uses - South Coast Air Basin, Summer

11.0 Vegetation
Equipment Type Number Hours/Day Hours/Year Horse Power Load Factor Fuel Type
Boilers
Equipment Type Number Heat Input/Day Heat Input/Year Boiler Rating Fuel Type
User Defined Equipment
Equipment Type Number
CalEEMod Version: CalEEMod.2016.3.2 Date: 8/26/2020 9:01 PMPage 26 of 26
ITC Existing Uses - South Coast Air Basin, Summer

1.1 Land Usage
Land Uses Size Metric Lot Acreage Floor Surface Area Population
High Turnover (Sit Down Restaurant) 1.20 1000sqft 0.03 1,200.00 0
High Turnover (Sit Down Restaurant) 4.76 1000sqft 0.11 4,760.00 0
High Turnover (Sit Down Restaurant) 4.61 1000sqft 0.11 4,610.00 0
Automobile Care Center 44.00 1000sqft 1.01 44,000.00 0
Free-Standing Discount Store 22.19 1000sqft 0.51 22,190.00 0
Free-Standing Discount Store 5.00 1000sqft 0.11 5,000.00 0
Free-Standing Discount Store 16.57 1000sqft 0.38 16,570.00 0
Gasoline/Service Station 6.00 Pump 0.02 202.00 0
Regional Shopping Center 12.30 1000sqft 0.28 12,300.00 0
Regional Shopping Center 25.50 1000sqft 0.59 25,500.00 0
Regional Shopping Center 7.35 1000sqft 0.17 7,350.00 0
Supermarket 76.40 1000sqft 1.75 76,400.00 0
1.2 Other Project Characteristics
Urbanization
Climate Zone
Urban
8
Wind Speed (m/s) Precipitation Freq (Days)2.2 31
1.0 Project Characteristics
Utility Company Southern California Edison
2020Operational Year
CO2 Intensity (lb/MWhr)
702.44 0.029CH4 Intensity (lb/MWhr)
0.006N2O Intensity (lb/MWhr)
ITC Existing UsesSouth Coast Air Basin, Winter
CalEEMod Version: CalEEMod.2016.3.2 Date: 8/26/2020 9:02 PMPage 1 of 26
ITC Existing Uses - South Coast Air Basin, Winter

Project Characteristics -
Land Use - '
Construction Phase - Existing Uses, no construction
Vehicle Trips - Using EMFAC for motor vehicle emissions
1.3 User Entered Comments & Non-Default Data
Table Name Column Name Default Value New Value
tblConstructionPhase NumDays 20.00 0.00
tblConstructionPhase NumDays 10.00 0.00
tblConstructionPhase NumDays 20.00 0.00
tblConstructionPhase NumDays 230.00 0.00
tblConstructionPhase NumDays 20.00 0.00
tblConstructionPhase NumDays 20.00 0.00
tblGrading AcresOfGrading 0.00 10.00
tblLandUse LandUseSquareFeet 847.05 202.00
tblSolidWaste SolidWasteGenerationRate 188.20 188.24
tblVehicleTrips ST_TR 23.72 0.00
tblVehicleTrips ST_TR 71.07 0.00
tblVehicleTrips ST_TR 168.56 0.00
tblVehicleTrips ST_TR 158.37 0.00
tblVehicleTrips ST_TR 49.97 0.00
tblVehicleTrips ST_TR 177.59 0.00
tblVehicleTrips SU_TR 11.88 0.00
tblVehicleTrips SU_TR 56.36 0.00
tblVehicleTrips SU_TR 168.56 0.00
tblVehicleTrips SU_TR 131.84 0.00
tblVehicleTrips SU_TR 25.24 0.00
CalEEMod Version: CalEEMod.2016.3.2 Date: 8/26/2020 9:02 PMPage 2 of 26
ITC Existing Uses - South Coast Air Basin, Winter

2.0 Emissions Summary
tblVehicleTrips SU_TR 166.44 0.00
tblVehicleTrips WD_TR 23.72 0.00
tblVehicleTrips WD_TR 57.24 0.00
tblVehicleTrips WD_TR 168.56 0.00
tblVehicleTrips WD_TR 127.15 0.00
tblVehicleTrips WD_TR 42.70 0.00
tblVehicleTrips WD_TR 102.24 0.00
tblWater IndoorWaterUseRate 3,241,413.54 3,242,154.27
tblWater OutdoorWaterUseRate 1,986,672.81 1,987,126.81
CalEEMod Version: CalEEMod.2016.3.2 Date: 8/26/2020 9:02 PMPage 3 of 26
ITC Existing Uses - South Coast Air Basin, Winter

2.1 Overall Construction (Maximum Daily Emission)
ROG NOx CO SO2 Fugitive PM10
Exhaust PM10
PM10 Total
Fugitive PM2.5
Exhaust PM2.5
PM2.5 Total
Bio- CO2 NBio- CO2 Total CO2 CH4 N2O CO2e
Year lb/day lb/day
2019 0.0000 0.0000 0.0000 0.0000 0.0000 5.1146 0.0000 0.0000 4.7325 0.0000 0.0000 0.0000 0.0000 0.0000 0.0000 0.0000
2020 0.0000 0.0000 0.0000 0.0000 0.0000 0.8662 0.0000 0.0000 0.8058 0.0000 0.0000 0.0000 0.0000 0.0000 0.0000 0.0000
Maximum 0.0000 0.0000 0.0000 0.0000 0.0000 5.1146 0.0000 0.0000 4.7325 0.0000 0.0000 0.0000 0.0000 0.0000 0.0000 0.0000
Unmitigated Construction
ROG NOx CO SO2 Fugitive PM10
Exhaust PM10
PM10 Total
Fugitive PM2.5
Exhaust PM2.5
PM2.5 Total
Bio- CO2 NBio- CO2 Total CO2 CH4 N2O CO2e
Year lb/day lb/day
2019 0.0000 0.0000 0.0000 0.0000 0.0000 5.1146 0.0000 0.0000 4.7325 0.0000 0.0000 0.0000 0.0000 0.0000 0.0000 0.0000
2020 0.0000 0.0000 0.0000 0.0000 0.0000 0.8662 0.0000 0.0000 0.8058 0.0000 0.0000 0.0000 0.0000 0.0000 0.0000 0.0000
Maximum 0.0000 0.0000 0.0000 0.0000 0.0000 5.1146 0.0000 0.0000 4.7325 0.0000 0.0000 0.0000 0.0000 0.0000 0.0000 0.0000
Mitigated Construction
ROG NOx CO SO2 Fugitive PM10
Exhaust PM10
PM10 Total
Fugitive PM2.5
Exhaust PM2.5
PM2.5 Total
Bio- CO2 NBio-CO2 Total CO2 CH4 N20 CO2e
Percent Reduction
0.00 0.00 0.00 0.00 0.00 0.00 0.00 0.00 0.00 0.00 0.00 0.00 0.00 0.00 0.00 0.00
CalEEMod Version: CalEEMod.2016.3.2 Date: 8/26/2020 9:02 PMPage 4 of 26
ITC Existing Uses - South Coast Air Basin, Winter

2.2 Overall Operational
ROG NOx CO SO2 Fugitive PM10
Exhaust PM10
PM10 Total
Fugitive PM2.5
Exhaust PM2.5
PM2.5 Total
Bio- CO2 NBio- CO2 Total CO2 CH4 N2O CO2e
Category lb/day lb/day
Area 4.9204 2.1000e-004
0.0232 0.0000 8.0000e-005
8.0000e-005
8.0000e-005
8.0000e-005
0.0494 0.0494 1.3000e-004
0.0528
Energy 0.1599 1.4539 1.2212 8.7200e-003
0.1105 0.1105 0.1105 0.1105 1,744.6170
1,744.6170
0.0334 0.0320 1,754.9844
Mobile 0.0000 0.0000 0.0000 0.0000 0.0000 0.0000 0.0000 0.0000 0.0000 0.0000 0.0000 0.0000 0.0000 0.0000
Total 5.0803 1.4541 1.2444 8.7200e-003
0.0000 0.1106 0.1106 0.0000 0.1106 0.1106 1,744.6664
1,744.6664
0.0336 0.0320 1,755.0371
Unmitigated Operational
ROG NOx CO SO2 Fugitive PM10
Exhaust PM10
PM10 Total
Fugitive PM2.5
Exhaust PM2.5
PM2.5 Total
Bio- CO2 NBio- CO2 Total CO2 CH4 N2O CO2e
Category lb/day lb/day
Area 4.9204 2.1000e-004
0.0232 0.0000 8.0000e-005
8.0000e-005
8.0000e-005
8.0000e-005
0.0494 0.0494 1.3000e-004
0.0528
Energy 0.1599 1.4539 1.2212 8.7200e-003
0.1105 0.1105 0.1105 0.1105 1,744.6170
1,744.6170
0.0334 0.0320 1,754.9844
Mobile 0.0000 0.0000 0.0000 0.0000 0.0000 0.0000 0.0000 0.0000 0.0000 0.0000 0.0000 0.0000 0.0000 0.0000
Total 5.0803 1.4541 1.2444 8.7200e-003
0.0000 0.1106 0.1106 0.0000 0.1106 0.1106 1,744.6664
1,744.6664
0.0336 0.0320 1,755.0371
Mitigated Operational
CalEEMod Version: CalEEMod.2016.3.2 Date: 8/26/2020 9:02 PMPage 5 of 26
ITC Existing Uses - South Coast Air Basin, Winter

3.0 Construction Detail
Construction Phase
Phase Number
Phase Name Phase Type Start Date End Date Num Days Week
Num Days Phase Description
1 Demolition Demolition 1/1/2019 12/31/2018 5 0
2 Site Preparation Site Preparation 1/29/2019 1/28/2019 5 0
3 Grading Grading 2/12/2019 2/11/2019 5 0
4 Building Construction Building Construction 3/12/2019 3/11/2019 5 0
5 Paving Paving 1/28/2020 1/27/2020 5 0
6 Architectural Coating Architectural Coating 2/25/2020 2/24/2020 5 0
OffRoad Equipment
ROG NOx CO SO2 Fugitive PM10
Exhaust PM10
PM10 Total
Fugitive PM2.5
Exhaust PM2.5
PM2.5 Total
Bio- CO2 NBio-CO2 Total CO2 CH4 N20 CO2e
Percent Reduction
0.00 0.00 0.00 0.00 0.00 0.00 0.00 0.00 0.00 0.00 0.00 0.00 0.00 0.00 0.00 0.00
Residential Indoor: 0; Residential Outdoor: 0; Non-Residential Indoor: 331,104; Non-Residential Outdoor: 110,368; Striped Parking Area: 0 (Architectural Coating – sqft)
Acres of Grading (Site Preparation Phase): 0
Acres of Grading (Grading Phase): 10
Acres of Paving: 0
CalEEMod Version: CalEEMod.2016.3.2 Date: 8/26/2020 9:02 PMPage 6 of 26
ITC Existing Uses - South Coast Air Basin, Winter

Phase Name Offroad Equipment Type Amount Usage Hours Horse Power Load Factor
Demolition Concrete/Industrial Saws 1 8.00 81 0.73
Demolition Excavators 3 8.00 158 0.38
Demolition Rubber Tired Dozers 2 8.00 247 0.40
Site Preparation Rubber Tired Dozers 3 8.00 247 0.40
Site Preparation Tractors/Loaders/Backhoes 4 8.00 97 0.37
Grading Excavators 1 8.00 158 0.38
Grading Graders 1 8.00 187 0.41
Grading Rubber Tired Dozers 1 8.00 247 0.40
Grading Tractors/Loaders/Backhoes 3 8.00 97 0.37
Building Construction Cranes 1 7.00 231 0.29
Building Construction Forklifts 3 8.00 89 0.20
Building Construction Generator Sets 1 8.00 84 0.74
Building Construction Tractors/Loaders/Backhoes 3 7.00 97 0.37
Building Construction Welders 1 8.00 46 0.45
Paving Pavers 2 8.00 130 0.42
Paving Paving Equipment 2 8.00 132 0.36
Paving Rollers 2 8.00 80 0.38
Architectural Coating Air Compressors 1 6.00 78 0.48
Trips and VMT
CalEEMod Version: CalEEMod.2016.3.2 Date: 8/26/2020 9:02 PMPage 7 of 26
ITC Existing Uses - South Coast Air Basin, Winter

3.3 Site Preparation - 2019
ROG NOx CO SO2 Fugitive PM10
Exhaust PM10
PM10 Total
Fugitive PM2.5
Exhaust PM2.5
PM2.5 Total
Bio- CO2 NBio- CO2 Total CO2 CH4 N2O CO2e
Category lb/day lb/day
Fugitive Dust 0.0000 0.0000 0.0000 0.0000 0.0000 0.0000 0.0000 0.0000 0.0000 0.0000 0.0000 0.0000 0.0000 0.0000 0.0000 0.0000
Off-Road 0.0000 0.0000 0.0000 0.0000 0.0000 0.0000 0.0000 0.0000 0.0000 0.0000 0.0000 0.0000 0.0000 0.0000 0.0000 0.0000
Total 0.0000 0.0000 0.0000 0.0000 0.0000 0.0000 0.0000 0.0000 0.0000 0.0000 0.0000 0.0000 0.0000 0.0000 0.0000 0.0000
Unmitigated Construction On-Site
3.1 Mitigation Measures Construction
Phase Name Offroad Equipment Count
Worker Trip Number
Vendor Trip Number
Hauling Trip Number
Worker Trip Length
Vendor Trip Length
Hauling Trip Length
Worker Vehicle Class
Vendor Vehicle Class
Hauling Vehicle Class
Demolition 6 15.00 0.00 0.00 14.70 6.90 20.00 LD_Mix HDT_Mix HHDT
Site Preparation 7 18.00 0.00 0.00 14.70 6.90 20.00 LD_Mix HDT_Mix HHDT
Grading 6 15.00 0.00 0.00 14.70 6.90 20.00 LD_Mix HDT_Mix HHDT
Building Construction 9 72.00 36.00 0.00 14.70 6.90 20.00 LD_Mix HDT_Mix HHDT
Paving 6 15.00 0.00 0.00 14.70 6.90 20.00 LD_Mix HDT_Mix HHDT
Architectural Coating 1 14.00 0.00 0.00 14.70 6.90 20.00 LD_Mix HDT_Mix HHDT
CalEEMod Version: CalEEMod.2016.3.2 Date: 8/26/2020 9:02 PMPage 8 of 26
ITC Existing Uses - South Coast Air Basin, Winter

3.3 Site Preparation - 2019
ROG NOx CO SO2 Fugitive PM10
Exhaust PM10
PM10 Total
Fugitive PM2.5
Exhaust PM2.5
PM2.5 Total
Bio- CO2 NBio- CO2 Total CO2 CH4 N2O CO2e
Category lb/day lb/day
Hauling 0.0000 0.0000 0.0000 0.0000 0.0000 0.0000 0.0000 0.0000 0.0000 0.0000 0.0000 0.0000 0.0000 0.0000 0.0000 0.0000
Vendor 0.0000 0.0000 0.0000 0.0000 0.0000 0.0000 0.0000 0.0000 0.0000 0.0000 0.0000 0.0000 0.0000 0.0000 0.0000 0.0000
Worker 0.0000 0.0000 0.0000 0.0000 0.0000 0.0000 0.0000 0.0000 0.0000 0.0000 0.0000 0.0000 0.0000 0.0000 0.0000 0.0000
Total 0.0000 0.0000 0.0000 0.0000 0.0000 0.0000 0.0000 0.0000 0.0000 0.0000 0.0000 0.0000 0.0000 0.0000 0.0000 0.0000
Unmitigated Construction Off-Site
ROG NOx CO SO2 Fugitive PM10
Exhaust PM10
PM10 Total
Fugitive PM2.5
Exhaust PM2.5
PM2.5 Total
Bio- CO2 NBio- CO2 Total CO2 CH4 N2O CO2e
Category lb/day lb/day
Fugitive Dust 0.0000 0.0000 0.0000 0.0000 0.0000 0.0000 0.0000 0.0000 0.0000 0.0000 0.0000 0.0000 0.0000 0.0000 0.0000 0.0000
Off-Road 0.0000 0.0000 0.0000 0.0000 0.0000 0.0000 0.0000 0.0000 0.0000 0.0000 0.0000 0.0000 0.0000 0.0000 0.0000 0.0000
Total 0.0000 0.0000 0.0000 0.0000 0.0000 0.0000 0.0000 0.0000 0.0000 0.0000 0.0000 0.0000 0.0000 0.0000 0.0000 0.0000
Mitigated Construction On-Site
CalEEMod Version: CalEEMod.2016.3.2 Date: 8/26/2020 9:02 PMPage 9 of 26
ITC Existing Uses - South Coast Air Basin, Winter
3.3 Site Preparation - 2019
ROG NOx CO SO2 Fugitive PM10
Exhaust PM10
PM10 Total
Fugitive PM2.5
Exhaust PM2.5
PM2.5 Total
Bio- CO2 NBio- CO2 Total CO2 CH4 N2O CO2e
Category lb/day lb/day
Hauling 0.0000 0.0000 0.0000 0.0000 0.0000 0.0000 0.0000 0.0000 0.0000 0.0000 0.0000 0.0000 0.0000 0.0000 0.0000 0.0000
Vendor 0.0000 0.0000 0.0000 0.0000 0.0000 0.0000 0.0000 0.0000 0.0000 0.0000 0.0000 0.0000 0.0000 0.0000 0.0000 0.0000
Worker 0.0000 0.0000 0.0000 0.0000 0.0000 0.0000 0.0000 0.0000 0.0000 0.0000 0.0000 0.0000 0.0000 0.0000 0.0000 0.0000
Total 0.0000 0.0000 0.0000 0.0000 0.0000 0.0000 0.0000 0.0000 0.0000 0.0000 0.0000 0.0000 0.0000 0.0000 0.0000 0.0000
Mitigated Construction Off-Site
3.4 Grading - 2019
ROG NOx CO SO2 Fugitive PM10
Exhaust PM10
PM10 Total
Fugitive PM2.5
Exhaust PM2.5
PM2.5 Total
Bio- CO2 NBio- CO2 Total CO2 CH4 N2O CO2e
Category lb/day lb/day
Fugitive Dust 0.0000 0.0000 0.0000 0.0000 0.0000 0.0000 0.0000 0.0000 0.0000 0.0000 0.0000 0.0000 0.0000 0.0000 0.0000 0.0000
Off-Road 0.0000 0.0000 0.0000 0.0000 0.0000 0.0000 0.0000 0.0000 0.0000 0.0000 0.0000 0.0000 0.0000 0.0000 0.0000 0.0000
Total 0.0000 0.0000 0.0000 0.0000 0.0000 0.0000 0.0000 0.0000 0.0000 0.0000 0.0000 0.0000 0.0000 0.0000 0.0000 0.0000
Unmitigated Construction On-Site
CalEEMod Version: CalEEMod.2016.3.2 Date: 8/26/2020 9:02 PMPage 10 of 26
ITC Existing Uses - South Coast Air Basin, Winter

3.4 Grading - 2019
ROG NOx CO SO2 Fugitive PM10
Exhaust PM10
PM10 Total
Fugitive PM2.5
Exhaust PM2.5
PM2.5 Total
Bio- CO2 NBio- CO2 Total CO2 CH4 N2O CO2e
Category lb/day lb/day
Hauling 0.0000 0.0000 0.0000 0.0000 0.0000 0.0000 0.0000 0.0000 0.0000 0.0000 0.0000 0.0000 0.0000 0.0000 0.0000 0.0000
Vendor 0.0000 0.0000 0.0000 0.0000 0.0000 0.0000 0.0000 0.0000 0.0000 0.0000 0.0000 0.0000 0.0000 0.0000 0.0000 0.0000
Worker 0.0000 0.0000 0.0000 0.0000 0.0000 0.0000 0.0000 0.0000 0.0000 0.0000 0.0000 0.0000 0.0000 0.0000 0.0000 0.0000
Total 0.0000 0.0000 0.0000 0.0000 0.0000 0.0000 0.0000 0.0000 0.0000 0.0000 0.0000 0.0000 0.0000 0.0000 0.0000 0.0000
Unmitigated Construction Off-Site
ROG NOx CO SO2 Fugitive PM10
Exhaust PM10
PM10 Total
Fugitive PM2.5
Exhaust PM2.5
PM2.5 Total
Bio- CO2 NBio- CO2 Total CO2 CH4 N2O CO2e
Category lb/day lb/day
Fugitive Dust 0.0000 0.0000 0.0000 0.0000 0.0000 0.0000 0.0000 0.0000 0.0000 0.0000 0.0000 0.0000 0.0000 0.0000 0.0000 0.0000
Off-Road 0.0000 0.0000 0.0000 0.0000 0.0000 0.0000 0.0000 0.0000 0.0000 0.0000 0.0000 0.0000 0.0000 0.0000 0.0000 0.0000
Total 0.0000 0.0000 0.0000 0.0000 0.0000 0.0000 0.0000 0.0000 0.0000 0.0000 0.0000 0.0000 0.0000 0.0000 0.0000 0.0000
Mitigated Construction On-Site
CalEEMod Version: CalEEMod.2016.3.2 Date: 8/26/2020 9:02 PMPage 11 of 26
ITC Existing Uses - South Coast Air Basin, Winter

3.4 Grading - 2019
ROG NOx CO SO2 Fugitive PM10
Exhaust PM10
PM10 Total
Fugitive PM2.5
Exhaust PM2.5
PM2.5 Total
Bio- CO2 NBio- CO2 Total CO2 CH4 N2O CO2e
Category lb/day lb/day
Hauling 0.0000 0.0000 0.0000 0.0000 0.0000 0.0000 0.0000 0.0000 0.0000 0.0000 0.0000 0.0000 0.0000 0.0000 0.0000 0.0000
Vendor 0.0000 0.0000 0.0000 0.0000 0.0000 0.0000 0.0000 0.0000 0.0000 0.0000 0.0000 0.0000 0.0000 0.0000 0.0000 0.0000
Worker 0.0000 0.0000 0.0000 0.0000 0.0000 0.0000 0.0000 0.0000 0.0000 0.0000 0.0000 0.0000 0.0000 0.0000 0.0000 0.0000
Total 0.0000 0.0000 0.0000 0.0000 0.0000 0.0000 0.0000 0.0000 0.0000 0.0000 0.0000 0.0000 0.0000 0.0000 0.0000 0.0000
Mitigated Construction Off-Site
3.5 Building Construction - 2019
ROG NOx CO SO2 Fugitive PM10
Exhaust PM10
PM10 Total
Fugitive PM2.5
Exhaust PM2.5
PM2.5 Total
Bio- CO2 NBio- CO2 Total CO2 CH4 N2O CO2e
Category lb/day lb/day
Off-Road 0.0000 0.0000 0.0000 0.0000 0.0000 0.0000 0.0000 0.0000 0.0000 0.0000 0.0000 0.0000 0.0000 0.0000 0.0000 0.0000
Total 0.0000 0.0000 0.0000 0.0000 0.0000 0.0000 0.0000 0.0000 0.0000 0.0000 0.0000 0.0000 0.0000 0.0000 0.0000 0.0000
Unmitigated Construction On-Site
CalEEMod Version: CalEEMod.2016.3.2 Date: 8/26/2020 9:02 PMPage 12 of 26
ITC Existing Uses - South Coast Air Basin, Winter

3.5 Building Construction - 2019
ROG NOx CO SO2 Fugitive PM10
Exhaust PM10
PM10 Total
Fugitive PM2.5
Exhaust PM2.5
PM2.5 Total
Bio- CO2 NBio- CO2 Total CO2 CH4 N2O CO2e
Category lb/day lb/day
Hauling 0.0000 0.0000 0.0000 0.0000 0.0000 0.0000 0.0000 0.0000 0.0000 0.0000 0.0000 0.0000 0.0000 0.0000 0.0000 0.0000
Vendor 0.0000 0.0000 0.0000 0.0000 0.0000 0.0000 0.0000 0.0000 0.0000 0.0000 0.0000 0.0000 0.0000 0.0000 0.0000 0.0000
Worker 0.0000 0.0000 0.0000 0.0000 0.0000 0.0000 0.0000 0.0000 0.0000 0.0000 0.0000 0.0000 0.0000 0.0000 0.0000 0.0000
Total 0.0000 0.0000 0.0000 0.0000 0.0000 0.0000 0.0000 0.0000 0.0000 0.0000 0.0000 0.0000 0.0000 0.0000 0.0000 0.0000
Unmitigated Construction Off-Site
ROG NOx CO SO2 Fugitive PM10
Exhaust PM10
PM10 Total
Fugitive PM2.5
Exhaust PM2.5
PM2.5 Total
Bio- CO2 NBio- CO2 Total CO2 CH4 N2O CO2e
Category lb/day lb/day
Off-Road 0.0000 0.0000 0.0000 0.0000 0.0000 0.0000 0.0000 0.0000 0.0000 0.0000 0.0000 0.0000 0.0000 0.0000 0.0000 0.0000
Total 0.0000 0.0000 0.0000 0.0000 0.0000 0.0000 0.0000 0.0000 0.0000 0.0000 0.0000 0.0000 0.0000 0.0000 0.0000 0.0000
Mitigated Construction On-Site
CalEEMod Version: CalEEMod.2016.3.2 Date: 8/26/2020 9:02 PMPage 13 of 26
ITC Existing Uses - South Coast Air Basin, Winter

3.5 Building Construction - 2019
ROG NOx CO SO2 Fugitive PM10
Exhaust PM10
PM10 Total
Fugitive PM2.5
Exhaust PM2.5
PM2.5 Total
Bio- CO2 NBio- CO2 Total CO2 CH4 N2O CO2e
Category lb/day lb/day
Hauling 0.0000 0.0000 0.0000 0.0000 0.0000 0.0000 0.0000 0.0000 0.0000 0.0000 0.0000 0.0000 0.0000 0.0000 0.0000 0.0000
Vendor 0.0000 0.0000 0.0000 0.0000 0.0000 0.0000 0.0000 0.0000 0.0000 0.0000 0.0000 0.0000 0.0000 0.0000 0.0000 0.0000
Worker 0.0000 0.0000 0.0000 0.0000 0.0000 0.0000 0.0000 0.0000 0.0000 0.0000 0.0000 0.0000 0.0000 0.0000 0.0000 0.0000
Total 0.0000 0.0000 0.0000 0.0000 0.0000 0.0000 0.0000 0.0000 0.0000 0.0000 0.0000 0.0000 0.0000 0.0000 0.0000 0.0000
Mitigated Construction Off-Site
3.6 Paving - 2020
ROG NOx CO SO2 Fugitive PM10
Exhaust PM10
PM10 Total
Fugitive PM2.5
Exhaust PM2.5
PM2.5 Total
Bio- CO2 NBio- CO2 Total CO2 CH4 N2O CO2e
Category lb/day lb/day
Off-Road 0.0000 0.0000 0.0000 0.0000 0.0000 0.0000 0.0000 0.0000 0.0000 0.0000 0.0000 0.0000 0.0000 0.0000 0.0000 0.0000
Paving 0.0000 0.0000 0.0000 0.0000 0.0000 0.0000 0.0000 0.0000 0.0000 0.0000 0.0000 0.0000 0.0000 0.0000 0.0000 0.0000
Total 0.0000 0.0000 0.0000 0.0000 0.0000 0.0000 0.0000 0.0000 0.0000 0.0000 0.0000 0.0000 0.0000 0.0000 0.0000 0.0000
Unmitigated Construction On-Site
CalEEMod Version: CalEEMod.2016.3.2 Date: 8/26/2020 9:02 PMPage 14 of 26
ITC Existing Uses - South Coast Air Basin, Winter

3.6 Paving - 2020
ROG NOx CO SO2 Fugitive PM10
Exhaust PM10
PM10 Total
Fugitive PM2.5
Exhaust PM2.5
PM2.5 Total
Bio- CO2 NBio- CO2 Total CO2 CH4 N2O CO2e
Category lb/day lb/day
Hauling 0.0000 0.0000 0.0000 0.0000 0.0000 0.0000 0.0000 0.0000 0.0000 0.0000 0.0000 0.0000 0.0000 0.0000 0.0000 0.0000
Vendor 0.0000 0.0000 0.0000 0.0000 0.0000 0.0000 0.0000 0.0000 0.0000 0.0000 0.0000 0.0000 0.0000 0.0000 0.0000 0.0000
Worker 0.0000 0.0000 0.0000 0.0000 0.0000 0.0000 0.0000 0.0000 0.0000 0.0000 0.0000 0.0000 0.0000 0.0000 0.0000 0.0000
Total 0.0000 0.0000 0.0000 0.0000 0.0000 0.0000 0.0000 0.0000 0.0000 0.0000 0.0000 0.0000 0.0000 0.0000 0.0000 0.0000
Unmitigated Construction Off-Site
ROG NOx CO SO2 Fugitive PM10
Exhaust PM10
PM10 Total
Fugitive PM2.5
Exhaust PM2.5
PM2.5 Total
Bio- CO2 NBio- CO2 Total CO2 CH4 N2O CO2e
Category lb/day lb/day
Off-Road 0.0000 0.0000 0.0000 0.0000 0.0000 0.0000 0.0000 0.0000 0.0000 0.0000 0.0000 0.0000 0.0000 0.0000 0.0000 0.0000
Paving 0.0000 0.0000 0.0000 0.0000 0.0000 0.0000 0.0000 0.0000 0.0000 0.0000 0.0000 0.0000 0.0000 0.0000 0.0000 0.0000
Total 0.0000 0.0000 0.0000 0.0000 0.0000 0.0000 0.0000 0.0000 0.0000 0.0000 0.0000 0.0000 0.0000 0.0000 0.0000 0.0000
Mitigated Construction On-Site
CalEEMod Version: CalEEMod.2016.3.2 Date: 8/26/2020 9:02 PMPage 15 of 26
ITC Existing Uses - South Coast Air Basin, Winter

3.6 Paving - 2020
ROG NOx CO SO2 Fugitive PM10
Exhaust PM10
PM10 Total
Fugitive PM2.5
Exhaust PM2.5
PM2.5 Total
Bio- CO2 NBio- CO2 Total CO2 CH4 N2O CO2e
Category lb/day lb/day
Hauling 0.0000 0.0000 0.0000 0.0000 0.0000 0.0000 0.0000 0.0000 0.0000 0.0000 0.0000 0.0000 0.0000 0.0000 0.0000 0.0000
Vendor 0.0000 0.0000 0.0000 0.0000 0.0000 0.0000 0.0000 0.0000 0.0000 0.0000 0.0000 0.0000 0.0000 0.0000 0.0000 0.0000
Worker 0.0000 0.0000 0.0000 0.0000 0.0000 0.0000 0.0000 0.0000 0.0000 0.0000 0.0000 0.0000 0.0000 0.0000 0.0000 0.0000
Total 0.0000 0.0000 0.0000 0.0000 0.0000 0.0000 0.0000 0.0000 0.0000 0.0000 0.0000 0.0000 0.0000 0.0000 0.0000 0.0000
Mitigated Construction Off-Site
3.7 Architectural Coating - 2020
ROG NOx CO SO2 Fugitive PM10
Exhaust PM10
PM10 Total
Fugitive PM2.5
Exhaust PM2.5
PM2.5 Total
Bio- CO2 NBio- CO2 Total CO2 CH4 N2O CO2e
Category lb/day lb/day
Archit. Coating 0.0000 0.0000 0.0000 0.0000 0.0000 0.0000 0.0000 0.0000 0.0000 0.0000 0.0000 0.0000 0.0000 0.0000 0.0000 0.0000
Off-Road 0.0000 0.0000 0.0000 0.0000 0.0000 0.0000 0.0000 0.0000 0.0000 0.0000 0.0000 0.0000 0.0000 0.0000 0.0000 0.0000
Total 0.0000 0.0000 0.0000 0.0000 0.0000 0.0000 0.0000 0.0000 0.0000 0.0000 0.0000 0.0000 0.0000 0.0000 0.0000 0.0000
Unmitigated Construction On-Site
CalEEMod Version: CalEEMod.2016.3.2 Date: 8/26/2020 9:02 PMPage 16 of 26
ITC Existing Uses - South Coast Air Basin, Winter

3.7 Architectural Coating - 2020
ROG NOx CO SO2 Fugitive PM10
Exhaust PM10
PM10 Total
Fugitive PM2.5
Exhaust PM2.5
PM2.5 Total
Bio- CO2 NBio- CO2 Total CO2 CH4 N2O CO2e
Category lb/day lb/day
Hauling 0.0000 0.0000 0.0000 0.0000 0.0000 0.0000 0.0000 0.0000 0.0000 0.0000 0.0000 0.0000 0.0000 0.0000 0.0000 0.0000
Vendor 0.0000 0.0000 0.0000 0.0000 0.0000 0.0000 0.0000 0.0000 0.0000 0.0000 0.0000 0.0000 0.0000 0.0000 0.0000 0.0000
Worker 0.0000 0.0000 0.0000 0.0000 0.0000 0.0000 0.0000 0.0000 0.0000 0.0000 0.0000 0.0000 0.0000 0.0000 0.0000 0.0000
Total 0.0000 0.0000 0.0000 0.0000 0.0000 0.0000 0.0000 0.0000 0.0000 0.0000 0.0000 0.0000 0.0000 0.0000 0.0000 0.0000
Unmitigated Construction Off-Site
ROG NOx CO SO2 Fugitive PM10
Exhaust PM10
PM10 Total
Fugitive PM2.5
Exhaust PM2.5
PM2.5 Total
Bio- CO2 NBio- CO2 Total CO2 CH4 N2O CO2e
Category lb/day lb/day
Archit. Coating 0.0000 0.0000 0.0000 0.0000 0.0000 0.0000 0.0000 0.0000 0.0000 0.0000 0.0000 0.0000 0.0000 0.0000 0.0000 0.0000
Off-Road 0.0000 0.0000 0.0000 0.0000 0.0000 0.0000 0.0000 0.0000 0.0000 0.0000 0.0000 0.0000 0.0000 0.0000 0.0000 0.0000
Total 0.0000 0.0000 0.0000 0.0000 0.0000 0.0000 0.0000 0.0000 0.0000 0.0000 0.0000 0.0000 0.0000 0.0000 0.0000 0.0000
Mitigated Construction On-Site
CalEEMod Version: CalEEMod.2016.3.2 Date: 8/26/2020 9:02 PMPage 17 of 26
ITC Existing Uses - South Coast Air Basin, Winter

4.0 Operational Detail - Mobile
4.1 Mitigation Measures Mobile
3.7 Architectural Coating - 2020
ROG NOx CO SO2 Fugitive PM10
Exhaust PM10
PM10 Total
Fugitive PM2.5
Exhaust PM2.5
PM2.5 Total
Bio- CO2 NBio- CO2 Total CO2 CH4 N2O CO2e
Category lb/day lb/day
Hauling 0.0000 0.0000 0.0000 0.0000 0.0000 0.0000 0.0000 0.0000 0.0000 0.0000 0.0000 0.0000 0.0000 0.0000 0.0000 0.0000
Vendor 0.0000 0.0000 0.0000 0.0000 0.0000 0.0000 0.0000 0.0000 0.0000 0.0000 0.0000 0.0000 0.0000 0.0000 0.0000 0.0000
Worker 0.0000 0.0000 0.0000 0.0000 0.0000 0.0000 0.0000 0.0000 0.0000 0.0000 0.0000 0.0000 0.0000 0.0000 0.0000 0.0000
Total 0.0000 0.0000 0.0000 0.0000 0.0000 0.0000 0.0000 0.0000 0.0000 0.0000 0.0000 0.0000 0.0000 0.0000 0.0000 0.0000
Mitigated Construction Off-Site
CalEEMod Version: CalEEMod.2016.3.2 Date: 8/26/2020 9:02 PMPage 18 of 26
ITC Existing Uses - South Coast Air Basin, Winter

ROG NOx CO SO2 Fugitive PM10
Exhaust PM10
PM10 Total
Fugitive PM2.5
Exhaust PM2.5
PM2.5 Total
Bio- CO2 NBio- CO2 Total CO2 CH4 N2O CO2e
Category lb/day lb/day
Mitigated 0.0000 0.0000 0.0000 0.0000 0.0000 0.0000 0.0000 0.0000 0.0000 0.0000 0.0000 0.0000 0.0000 0.0000
Unmitigated 0.0000 0.0000 0.0000 0.0000 0.0000 0.0000 0.0000 0.0000 0.0000 0.0000 0.0000 0.0000 0.0000 0.0000
4.2 Trip Summary Information
4.3 Trip Type Information
Average Daily Trip Rate Unmitigated Mitigated
Land Use Weekday Saturday Sunday Annual VMT Annual VMT
Automobile Care Center 0.00 0.00 0.00
Free-Standing Discount Store 0.00 0.00 0.00
Free-Standing Discount Store 0.00 0.00 0.00
Free-Standing Discount Store 0.00 0.00 0.00
Gasoline/Service Station 0.00 0.00 0.00
High Turnover (Sit Down Restaurant) 0.00 0.00 0.00
High Turnover (Sit Down Restaurant) 0.00 0.00 0.00
High Turnover (Sit Down Restaurant) 0.00 0.00 0.00
Regional Shopping Center 0.00 0.00 0.00
Regional Shopping Center 0.00 0.00 0.00
Regional Shopping Center 0.00 0.00 0.00
Supermarket 0.00 0.00 0.00
Total 0.00 0.00 0.00
CalEEMod Version: CalEEMod.2016.3.2 Date: 8/26/2020 9:02 PMPage 19 of 26
ITC Existing Uses - South Coast Air Basin, Winter

Miles Trip % Trip Purpose %
Land Use H-W or C-W H-S or C-C H-O or C-NW H-W or C-W H-S or C-C H-O or C-NW Primary Diverted Pass-by
Automobile Care Center 16.60 8.40 6.90 33.00 48.00 19.00 21 51 28
Free-Standing Discount Store 16.60 8.40 6.90 12.20 68.80 19.00 47.5 35.5 17
Free-Standing Discount Store 16.60 8.40 6.90 12.20 68.80 19.00 47.5 35.5 17
Free-Standing Discount Store 16.60 8.40 6.90 12.20 68.80 19.00 47.5 35.5 17
Gasoline/Service Station 16.60 8.40 6.90 2.00 79.00 19.00 14 27 59
High Turnover (Sit Down Restaurant)
16.60 8.40 6.90 8.50 72.50 19.00 37 20 43
High Turnover (Sit Down Restaurant)
16.60 8.40 6.90 8.50 72.50 19.00 37 20 43
High Turnover (Sit Down Restaurant)
16.60 8.40 6.90 8.50 72.50 19.00 37 20 43
Regional Shopping Center 16.60 8.40 6.90 16.30 64.70 19.00 54 35 11
Regional Shopping Center 16.60 8.40 6.90 16.30 64.70 19.00 54 35 11
Regional Shopping Center 16.60 8.40 6.90 16.30 64.70 19.00 54 35 11
Supermarket 16.60 8.40 6.90 6.50 74.50 19.00 34 30 36
5.0 Energy Detail
5.1 Mitigation Measures Energy
4.4 Fleet Mix
Land Use LDA LDT1 LDT2 MDV LHD1 LHD2 MHD HHD OBUS UBUS MCY SBUS MH
Automobile Care Center 0.550339 0.043800 0.200255 0.122233 0.016799 0.005871 0.020633 0.029727 0.002027 0.001932 0.004726 0.000704 0.000955
Free-Standing Discount Store 0.550339 0.043800 0.200255 0.122233 0.016799 0.005871 0.020633 0.029727 0.002027 0.001932 0.004726 0.000704 0.000955
Gasoline/Service Station 0.550339 0.043800 0.200255 0.122233 0.016799 0.005871 0.020633 0.029727 0.002027 0.001932 0.004726 0.000704 0.000955
High Turnover (Sit Down Restaurant)
0.550339 0.043800 0.200255 0.122233 0.016799 0.005871 0.020633 0.029727 0.002027 0.001932 0.004726 0.000704 0.000955
Regional Shopping Center 0.550339 0.043800 0.200255 0.122233 0.016799 0.005871 0.020633 0.029727 0.002027 0.001932 0.004726 0.000704 0.000955
Supermarket 0.550339 0.043800 0.200255 0.122233 0.016799 0.005871 0.020633 0.029727 0.002027 0.001932 0.004726 0.000704 0.000955
Historical Energy Use: N
CalEEMod Version: CalEEMod.2016.3.2 Date: 8/26/2020 9:02 PMPage 20 of 26
ITC Existing Uses - South Coast Air Basin, Winter

ROG NOx CO SO2 Fugitive PM10
Exhaust PM10
PM10 Total
Fugitive PM2.5
Exhaust PM2.5
PM2.5 Total
Bio- CO2 NBio- CO2 Total CO2 CH4 N2O CO2e
Category lb/day lb/day
NaturalGas Mitigated
0.1599 1.4539 1.2212 8.7200e-003
0.1105 0.1105 0.1105 0.1105 1,744.6170
1,744.6170
0.0334 0.0320 1,754.9844
NaturalGas Unmitigated
0.1599 1.4539 1.2212 8.7200e-003
0.1105 0.1105 0.1105 0.1105 1,744.6170
1,744.6170
0.0334 0.0320 1,754.9844
CalEEMod Version: CalEEMod.2016.3.2 Date: 8/26/2020 9:02 PMPage 21 of 26
ITC Existing Uses - South Coast Air Basin, Winter

5.2 Energy by Land Use - NaturalGas
NaturalGas Use
ROG NOx CO SO2 Fugitive PM10
Exhaust PM10
PM10 Total
Fugitive PM2.5
Exhaust PM2.5
PM2.5 Total
Bio- CO2 NBio- CO2 Total CO2 CH4 N2O CO2e
Land Use kBTU/yr lb/day lb/day
Automobile Care Center
2519.45 0.0272 0.2470 0.2075 1.4800e-003
0.0188 0.0188 0.0188 0.0188 296.4061 296.4061 5.6800e-003
5.4300e-003
298.1675
Free-Standing Discount Store
121.589 1.3100e-003
0.0119 0.0100 7.0000e-005
9.1000e-004
9.1000e-004
9.1000e-004
9.1000e-004
14.3046 14.3046 2.7000e-004
2.6000e-004
14.3896
Free-Standing Discount Store
27.3973 3.0000e-004
2.6900e-003
2.2600e-003
2.0000e-005
2.0000e-004
2.0000e-004
2.0000e-004
2.0000e-004
3.2232 3.2232 6.0000e-005
6.0000e-005
3.2424
Free-Standing Discount Store
90.7945 9.8000e-004
8.9000e-003
7.4800e-003
5.0000e-005
6.8000e-004
6.8000e-004
6.8000e-004
6.8000e-004
10.6817 10.6817 2.0000e-004
2.0000e-004
10.7452
Gasoline/Service Station
11.5666 1.2000e-004
1.1300e-003
9.5000e-004
1.0000e-005
9.0000e-005
9.0000e-005
9.0000e-005
9.0000e-005
1.3608 1.3608 3.0000e-005
2.0000e-005
1.3689
High Turnover (Sit Down Restaurant)
3275.25 0.0353 0.3211 0.2697 1.9300e-003
0.0244 0.0244 0.0244 0.0244 385.3232 385.3232 7.3900e-003
7.0600e-003
387.6130
High Turnover (Sit Down Restaurant)
3381.82 0.0365 0.3316 0.2785 1.9900e-003
0.0252 0.0252 0.0252 0.0252 397.8608 397.8608 7.6300e-003
7.2900e-003
400.2251
High Turnover (Sit Down Restaurant)
852.559 9.1900e-003
0.0836 0.0702 5.0000e-004
6.3500e-003
6.3500e-003
6.3500e-003
6.3500e-003
100.3011 100.3011 1.9200e-003
1.8400e-003
100.8971
Regional Shopping Center
139.726 1.5100e-003
0.0137 0.0115 8.0000e-005
1.0400e-003
1.0400e-003
1.0400e-003
1.0400e-003
16.4384 16.4384 3.2000e-004
3.0000e-004
16.5360
Regional Shopping Center
40.274 4.3000e-004
3.9500e-003
3.3200e-003
2.0000e-005
3.0000e-004
3.0000e-004
3.0000e-004
3.0000e-004
4.7381 4.7381 9.0000e-005
9.0000e-005
4.7663
Regional Shopping Center
67.3973 7.3000e-004
6.6100e-003
5.5500e-003
4.0000e-005
5.0000e-004
5.0000e-004
5.0000e-004
5.0000e-004
7.9291 7.9291 1.5000e-004
1.5000e-004
7.9762
Supermarket 4301.42 0.0464 0.4217 0.3542 2.5300e-003
0.0321 0.0321 0.0321 0.0321 506.0500 506.0500 9.7000e-003
9.2800e-003
509.0572
Total 0.1599 1.4539 1.2212 8.7200e-003
0.1105 0.1105 0.1105 0.1105 1,744.6170
1,744.6170
0.0334 0.0320 1,754.9844
Unmitigated
CalEEMod Version: CalEEMod.2016.3.2 Date: 8/26/2020 9:02 PMPage 22 of 26
ITC Existing Uses - South Coast Air Basin, Winter

6.0 Area Detail
5.2 Energy by Land Use - NaturalGas
NaturalGas Use
ROG NOx CO SO2 Fugitive PM10
Exhaust PM10
PM10 Total
Fugitive PM2.5
Exhaust PM2.5
PM2.5 Total
Bio- CO2 NBio- CO2 Total CO2 CH4 N2O CO2e
Land Use kBTU/yr lb/day lb/day
Automobile Care Center
2.51945 0.0272 0.2470 0.2075 1.4800e-003
0.0188 0.0188 0.0188 0.0188 296.4061 296.4061 5.6800e-003
5.4300e-003
298.1675
Free-Standing Discount Store
0.0273973 3.0000e-004
2.6900e-003
2.2600e-003
2.0000e-005
2.0000e-004
2.0000e-004
2.0000e-004
2.0000e-004
3.2232 3.2232 6.0000e-005
6.0000e-005
3.2424
Free-Standing Discount Store
0.0907945 9.8000e-004
8.9000e-003
7.4800e-003
5.0000e-005
6.8000e-004
6.8000e-004
6.8000e-004
6.8000e-004
10.6817 10.6817 2.0000e-004
2.0000e-004
10.7452
Free-Standing Discount Store
0.121589 1.3100e-003
0.0119 0.0100 7.0000e-005
9.1000e-004
9.1000e-004
9.1000e-004
9.1000e-004
14.3046 14.3046 2.7000e-004
2.6000e-004
14.3896
Gasoline/Service Station
0.0115666 1.2000e-004
1.1300e-003
9.5000e-004
1.0000e-005
9.0000e-005
9.0000e-005
9.0000e-005
9.0000e-005
1.3608 1.3608 3.0000e-005
2.0000e-005
1.3689
High Turnover (Sit Down Restaurant)
0.852559 9.1900e-003
0.0836 0.0702 5.0000e-004
6.3500e-003
6.3500e-003
6.3500e-003
6.3500e-003
100.3011 100.3011 1.9200e-003
1.8400e-003
100.8971
High Turnover (Sit Down Restaurant)
3.27525 0.0353 0.3211 0.2697 1.9300e-003
0.0244 0.0244 0.0244 0.0244 385.3232 385.3232 7.3900e-003
7.0600e-003
387.6130
High Turnover (Sit Down Restaurant)
3.38182 0.0365 0.3316 0.2785 1.9900e-003
0.0252 0.0252 0.0252 0.0252 397.8608 397.8608 7.6300e-003
7.2900e-003
400.2251
Regional Shopping Center
0.040274 4.3000e-004
3.9500e-003
3.3200e-003
2.0000e-005
3.0000e-004
3.0000e-004
3.0000e-004
3.0000e-004
4.7381 4.7381 9.0000e-005
9.0000e-005
4.7663
Regional Shopping Center
0.0673973 7.3000e-004
6.6100e-003
5.5500e-003
4.0000e-005
5.0000e-004
5.0000e-004
5.0000e-004
5.0000e-004
7.9291 7.9291 1.5000e-004
1.5000e-004
7.9762
Regional Shopping Center
0.139726 1.5100e-003
0.0137 0.0115 8.0000e-005
1.0400e-003
1.0400e-003
1.0400e-003
1.0400e-003
16.4384 16.4384 3.2000e-004
3.0000e-004
16.5360
Supermarket 4.30142 0.0464 0.4217 0.3542 2.5300e-003
0.0321 0.0321 0.0321 0.0321 506.0500 506.0500 9.7000e-003
9.2800e-003
509.0572
Total 0.1599 1.4539 1.2212 8.7200e-003
0.1105 0.1105 0.1105 0.1105 1,744.6170
1,744.6170
0.0334 0.0320 1,754.9844
Mitigated
CalEEMod Version: CalEEMod.2016.3.2 Date: 8/26/2020 9:02 PMPage 23 of 26
ITC Existing Uses - South Coast Air Basin, Winter

6.1 Mitigation Measures Area
ROG NOx CO SO2 Fugitive PM10
Exhaust PM10
PM10 Total
Fugitive PM2.5
Exhaust PM2.5
PM2.5 Total
Bio- CO2 NBio- CO2 Total CO2 CH4 N2O CO2e
Category lb/day lb/day
Mitigated 4.9204 2.1000e-004
0.0232 0.0000 8.0000e-005
8.0000e-005
8.0000e-005
8.0000e-005
0.0494 0.0494 1.3000e-004
0.0528
Unmitigated 4.9204 2.1000e-004
0.0232 0.0000 8.0000e-005
8.0000e-005
8.0000e-005
8.0000e-005
0.0494 0.0494 1.3000e-004
0.0528
6.2 Area by SubCategory
ROG NOx CO SO2 Fugitive PM10
Exhaust PM10
PM10 Total
Fugitive PM2.5
Exhaust PM2.5
PM2.5 Total
Bio- CO2 NBio- CO2 Total CO2 CH4 N2O CO2e
SubCategory lb/day lb/day
Architectural Coating
0.5606 0.0000 0.0000 0.0000 0.0000 0.0000 0.0000
Consumer Products
4.3576 0.0000 0.0000 0.0000 0.0000 0.0000 0.0000
Landscaping 2.1800e-003
2.1000e-004
0.0232 0.0000 8.0000e-005
8.0000e-005
8.0000e-005
8.0000e-005
0.0494 0.0494 1.3000e-004
0.0528
Total 4.9204 2.1000e-004
0.0232 0.0000 8.0000e-005
8.0000e-005
8.0000e-005
8.0000e-005
0.0494 0.0494 1.3000e-004
0.0528
Unmitigated
CalEEMod Version: CalEEMod.2016.3.2 Date: 8/26/2020 9:02 PMPage 24 of 26
ITC Existing Uses - South Coast Air Basin, Winter
8.1 Mitigation Measures Waste
7.1 Mitigation Measures Water
7.0 Water Detail
8.0 Waste Detail
6.2 Area by SubCategory
ROG NOx CO SO2 Fugitive PM10
Exhaust PM10
PM10 Total
Fugitive PM2.5
Exhaust PM2.5
PM2.5 Total
Bio- CO2 NBio- CO2 Total CO2 CH4 N2O CO2e
SubCategory lb/day lb/day
Architectural Coating
0.5606 0.0000 0.0000 0.0000 0.0000 0.0000 0.0000
Consumer Products
4.3576 0.0000 0.0000 0.0000 0.0000 0.0000 0.0000
Landscaping 2.1800e-003
2.1000e-004
0.0232 0.0000 8.0000e-005
8.0000e-005
8.0000e-005
8.0000e-005
0.0494 0.0494 1.3000e-004
0.0528
Total 4.9204 2.1000e-004
0.0232 0.0000 8.0000e-005
8.0000e-005
8.0000e-005
8.0000e-005
0.0494 0.0494 1.3000e-004
0.0528
Mitigated
9.0 Operational Offroad
Equipment Type Number Hours/Day Days/Year Horse Power Load Factor Fuel Type
10.0 Stationary Equipment
Fire Pumps and Emergency Generators
CalEEMod Version: CalEEMod.2016.3.2 Date: 8/26/2020 9:02 PMPage 25 of 26
ITC Existing Uses - South Coast Air Basin, Winter

11.0 Vegetation
Equipment Type Number Hours/Day Hours/Year Horse Power Load Factor Fuel Type
Boilers
Equipment Type Number Heat Input/Day Heat Input/Year Boiler Rating Fuel Type
User Defined Equipment
Equipment Type Number
CalEEMod Version: CalEEMod.2016.3.2 Date: 8/26/2020 9:02 PMPage 26 of 26
ITC Existing Uses - South Coast Air Basin, Winter

Project Characteristics - Southern California Edison, 2018. ESG/Sustainability Template, September 27, 2018
Land Use -
Construction Phase - Construction emissions determined via EMFAC/OFFROAD
Vehicle Trips - Using EMFAC for motor vehicle emissions
Grading -
1.1 Land Usage
Land Uses Size Metric Lot Acreage Floor Surface Area Population
General Light Industry 78.00 1000sqft 1.79 78,000.00 0
Parking Lot 300.00 Space 2.70 120,000.00 0
Arena 24.00 1000sqft 7.71 24,000.00 0
1.2 Other Project Characteristics
Urbanization
Climate Zone
Urban
8
Wind Speed (m/s) Precipitation Freq (Days)2.2 31
1.3 User Entered Comments & Non-Default Data
1.0 Project Characteristics
Utility Company Southern California Edison
2026Operational Year
CO2 Intensity (lb/MWhr)
535 0.029CH4 Intensity (lb/MWhr)
0.006N2O Intensity (lb/MWhr)
Inglewood Transit MSFSouth Coast Air Basin, Annual
CalEEMod Version: CalEEMod.2016.3.2 Date: 8/28/2020 12:43 PMPage 1 of 31
Inglewood Transit MSF - South Coast Air Basin, Annual

2.0 Emissions Summary
Table Name Column Name Default Value New Value
tblConstructionPhase NumDays 20.00 0.00
tblConstructionPhase NumDays 10.00 0.00
tblConstructionPhase NumDays 30.00 0.00
tblConstructionPhase NumDays 300.00 0.00
tblConstructionPhase NumDays 20.00 0.00
tblConstructionPhase NumDays 20.00 0.00
tblProjectCharacteristics CO2IntensityFactor 702.44 535
tblVehicleTrips ST_TR 10.71 0.00
tblVehicleTrips ST_TR 1.32 0.00
tblVehicleTrips SU_TR 10.71 0.00
tblVehicleTrips SU_TR 0.68 0.00
tblVehicleTrips WD_TR 10.71 0.00
tblVehicleTrips WD_TR 6.97 0.00
CalEEMod Version: CalEEMod.2016.3.2 Date: 8/28/2020 12:43 PMPage 2 of 31
Inglewood Transit MSF - South Coast Air Basin, Annual

2.1 Overall Construction
ROG NOx CO SO2 Fugitive PM10
Exhaust PM10
PM10 Total
Fugitive PM2.5
Exhaust PM2.5
PM2.5 Total
Bio- CO2 NBio- CO2 Total CO2 CH4 N2O CO2e
Year tons/yr MT/yr
2024 0.0000 0.0000 0.0000 0.0000 0.0000 0.0000 0.0000 0.0000 0.0000 0.0000 0.0000 0.0000 0.0000 0.0000 0.0000 0.0000
2025 0.0000 0.0000 0.0000 0.0000 0.0000 0.0000 0.0000 0.0000 0.0000 0.0000 0.0000 0.0000 0.0000 0.0000 0.0000 0.0000
Maximum 0.0000 0.0000 0.0000 0.0000 0.0000 0.0000 0.0000 0.0000 0.0000 0.0000 0.0000 0.0000 0.0000 0.0000 0.0000 0.0000
Unmitigated Construction
ROG NOx CO SO2 Fugitive PM10
Exhaust PM10
PM10 Total
Fugitive PM2.5
Exhaust PM2.5
PM2.5 Total
Bio- CO2 NBio- CO2 Total CO2 CH4 N2O CO2e
Year tons/yr MT/yr
2024 0.0000 0.0000 0.0000 0.0000 0.0000 0.0000 0.0000 0.0000 0.0000 0.0000 0.0000 0.0000 0.0000 0.0000 0.0000 0.0000
2025 0.0000 0.0000 0.0000 0.0000 0.0000 0.0000 0.0000 0.0000 0.0000 0.0000 0.0000 0.0000 0.0000 0.0000 0.0000 0.0000
Maximum 0.0000 0.0000 0.0000 0.0000 0.0000 0.0000 0.0000 0.0000 0.0000 0.0000 0.0000 0.0000 0.0000 0.0000 0.0000 0.0000
Mitigated Construction
ROG NOx CO SO2 Fugitive PM10
Exhaust PM10
PM10 Total
Fugitive PM2.5
Exhaust PM2.5
PM2.5 Total
Bio- CO2 NBio-CO2 Total CO2 CH4 N20 CO2e
Percent Reduction
0.00 0.00 0.00 0.00 0.00 0.00 0.00 0.00 0.00 0.00 0.00 0.00 0.00 0.00 0.00 0.00
CalEEMod Version: CalEEMod.2016.3.2 Date: 8/28/2020 12:43 PMPage 3 of 31
Inglewood Transit MSF - South Coast Air Basin, Annual

2.2 Overall Operational
ROG NOx CO SO2 Fugitive PM10
Exhaust PM10
PM10 Total
Fugitive PM2.5
Exhaust PM2.5
PM2.5 Total
Bio- CO2 NBio- CO2 Total CO2 CH4 N2O CO2e
Category tons/yr MT/yr
Area 0.4258 5.0000e-005
5.1200e-003
0.0000 2.0000e-005
2.0000e-005
2.0000e-005
2.0000e-005
0.0000 9.9800e-003
9.9800e-003
3.0000e-005
0.0000 0.0106
Energy 0.0115 0.1045 0.0878 6.3000e-004
7.9400e-003
7.9400e-003
7.9400e-003
7.9400e-003
0.0000 333.1121 333.1121 0.0141 4.5500e-003
334.8185
Mobile 0.0000 0.0000 0.0000 0.0000 0.0000 0.0000 0.0000 0.0000 0.0000 0.0000 0.0000 0.0000 0.0000 0.0000 0.0000 0.0000
Waste 0.0000 0.0000 0.0000 0.0000 19.7673 0.0000 19.7673 1.1682 0.0000 48.9726
Water 0.0000 0.0000 0.0000 0.0000 9.0024 91.4425 100.4449 0.9296 0.0229 130.4963
Total 0.4373 0.1046 0.0929 6.3000e-004
0.0000 7.9600e-003
7.9600e-003
0.0000 7.9600e-003
7.9600e-003
28.7697 424.5646 453.3342 2.1119 0.0274 514.2979
Unmitigated Operational
Quarter Start Date End Date Maximum Unmitigated ROG + NOX (tons/quarter) Maximum Mitigated ROG + NOX (tons/quarter)
Highest
CalEEMod Version: CalEEMod.2016.3.2 Date: 8/28/2020 12:43 PMPage 4 of 31
Inglewood Transit MSF - South Coast Air Basin, Annual

2.2 Overall Operational
ROG NOx CO SO2 Fugitive PM10
Exhaust PM10
PM10 Total
Fugitive PM2.5
Exhaust PM2.5
PM2.5 Total
Bio- CO2 NBio- CO2 Total CO2 CH4 N2O CO2e
Category tons/yr MT/yr
Area 0.4258 5.0000e-005
5.1200e-003
0.0000 2.0000e-005
2.0000e-005
2.0000e-005
2.0000e-005
0.0000 9.9800e-003
9.9800e-003
3.0000e-005
0.0000 0.0106
Energy 0.0115 0.1045 0.0878 6.3000e-004
7.9400e-003
7.9400e-003
7.9400e-003
7.9400e-003
0.0000 333.1121 333.1121 0.0141 4.5500e-003
334.8185
Mobile 0.0000 0.0000 0.0000 0.0000 0.0000 0.0000 0.0000 0.0000 0.0000 0.0000 0.0000 0.0000 0.0000 0.0000 0.0000 0.0000
Waste 0.0000 0.0000 0.0000 0.0000 19.7673 0.0000 19.7673 1.1682 0.0000 48.9726
Water 0.0000 0.0000 0.0000 0.0000 9.0024 91.4425 100.4449 0.9296 0.0229 130.4963
Total 0.4373 0.1046 0.0929 6.3000e-004
0.0000 7.9600e-003
7.9600e-003
0.0000 7.9600e-003
7.9600e-003
28.7697 424.5646 453.3342 2.1119 0.0274 514.2979
Mitigated Operational
3.0 Construction Detail
Construction Phase
ROG NOx CO SO2 Fugitive PM10
Exhaust PM10
PM10 Total
Fugitive PM2.5
Exhaust PM2.5
PM2.5 Total
Bio- CO2 NBio-CO2 Total CO2 CH4 N20 CO2e
Percent Reduction
0.00 0.00 0.00 0.00 0.00 0.00 0.00 0.00 0.00 0.00 0.00 0.00 0.00 0.00 0.00 0.00
CalEEMod Version: CalEEMod.2016.3.2 Date: 8/28/2020 12:43 PMPage 5 of 31
Inglewood Transit MSF - South Coast Air Basin, Annual

Phase Number
Phase Name Phase Type Start Date End Date Num Days Week
Num Days Phase Description
1 Demolition Demolition 4/6/2024 4/5/2024 5 0
2 Site Preparation Site Preparation 5/4/2024 5/3/2024 5 0
3 Grading Grading 5/18/2024 5/17/2024 5 0
4 Building Construction Building Construction 6/29/2024 6/28/2024 5 0
5 Paving Paving 8/23/2025 8/22/2025 5 0
6 Architectural Coating Architectural Coating 9/20/2025 9/19/2025 5 0
OffRoad Equipment
Residential Indoor: 0; Residential Outdoor: 0; Non-Residential Indoor: 153,000; Non-Residential Outdoor: 51,000; Striped Parking Area: 7,200 (Architectural Coating – sqft)
Acres of Grading (Site Preparation Phase): 0
Acres of Grading (Grading Phase): 0
Acres of Paving: 2.7
CalEEMod Version: CalEEMod.2016.3.2 Date: 8/28/2020 12:43 PMPage 6 of 31
Inglewood Transit MSF - South Coast Air Basin, Annual

Phase Name Offroad Equipment Type Amount Usage Hours Horse Power Load Factor
Demolition Concrete/Industrial Saws 1 8.00 81 0.73
Demolition Excavators 3 8.00 158 0.38
Demolition Rubber Tired Dozers 2 8.00 247 0.40
Site Preparation Rubber Tired Dozers 3 8.00 247 0.40
Site Preparation Tractors/Loaders/Backhoes 4 8.00 97 0.37
Grading Excavators 2 8.00 158 0.38
Grading Graders 1 8.00 187 0.41
Grading Rubber Tired Dozers 1 8.00 247 0.40
Grading Scrapers 2 8.00 367 0.48
Grading Tractors/Loaders/Backhoes 2 8.00 97 0.37
Building Construction Cranes 1 7.00 231 0.29
Building Construction Forklifts 3 8.00 89 0.20
Building Construction Generator Sets 1 8.00 84 0.74
Building Construction Tractors/Loaders/Backhoes 3 7.00 97 0.37
Building Construction Welders 1 8.00 46 0.45
Paving Pavers 2 8.00 130 0.42
Paving Paving Equipment 2 8.00 132 0.36
Paving Rollers 2 8.00 80 0.38
Architectural Coating Air Compressors 1 6.00 78 0.48
Trips and VMT
CalEEMod Version: CalEEMod.2016.3.2 Date: 8/28/2020 12:43 PMPage 7 of 31
Inglewood Transit MSF - South Coast Air Basin, Annual

3.2 Demolition - 2024
ROG NOx CO SO2 Fugitive PM10
Exhaust PM10
PM10 Total
Fugitive PM2.5
Exhaust PM2.5
PM2.5 Total
Bio- CO2 NBio- CO2 Total CO2 CH4 N2O CO2e
Category tons/yr MT/yr
Off-Road 0.0000 0.0000 0.0000 0.0000 0.0000 0.0000 0.0000 0.0000 0.0000 0.0000 0.0000 0.0000 0.0000 0.0000 0.0000 0.0000
Total 0.0000 0.0000 0.0000 0.0000 0.0000 0.0000 0.0000 0.0000 0.0000 0.0000 0.0000 0.0000 0.0000 0.0000 0.0000 0.0000
Unmitigated Construction On-Site
3.1 Mitigation Measures Construction
Phase Name Offroad Equipment Count
Worker Trip Number
Vendor Trip Number
Hauling Trip Number
Worker Trip Length
Vendor Trip Length
Hauling Trip Length
Worker Vehicle Class
Vendor Vehicle Class
Hauling Vehicle Class
Demolition 6 15.00 0.00 0.00 14.70 6.90 20.00 LD_Mix HDT_Mix HHDT
Site Preparation 7 18.00 0.00 0.00 14.70 6.90 20.00 LD_Mix HDT_Mix HHDT
Grading 8 20.00 0.00 0.00 14.70 6.90 20.00 LD_Mix HDT_Mix HHDT
Building Construction 9 93.00 36.00 0.00 14.70 6.90 20.00 LD_Mix HDT_Mix HHDT
Paving 6 15.00 0.00 0.00 14.70 6.90 20.00 LD_Mix HDT_Mix HHDT
Architectural Coating 1 19.00 0.00 0.00 14.70 6.90 20.00 LD_Mix HDT_Mix HHDT
CalEEMod Version: CalEEMod.2016.3.2 Date: 8/28/2020 12:43 PMPage 8 of 31
Inglewood Transit MSF - South Coast Air Basin, Annual

3.2 Demolition - 2024
ROG NOx CO SO2 Fugitive PM10
Exhaust PM10
PM10 Total
Fugitive PM2.5
Exhaust PM2.5
PM2.5 Total
Bio- CO2 NBio- CO2 Total CO2 CH4 N2O CO2e
Category tons/yr MT/yr
Hauling 0.0000 0.0000 0.0000 0.0000 0.0000 0.0000 0.0000 0.0000 0.0000 0.0000 0.0000 0.0000 0.0000 0.0000 0.0000 0.0000
Vendor 0.0000 0.0000 0.0000 0.0000 0.0000 0.0000 0.0000 0.0000 0.0000 0.0000 0.0000 0.0000 0.0000 0.0000 0.0000 0.0000
Worker 0.0000 0.0000 0.0000 0.0000 0.0000 0.0000 0.0000 0.0000 0.0000 0.0000 0.0000 0.0000 0.0000 0.0000 0.0000 0.0000
Total 0.0000 0.0000 0.0000 0.0000 0.0000 0.0000 0.0000 0.0000 0.0000 0.0000 0.0000 0.0000 0.0000 0.0000 0.0000 0.0000
Unmitigated Construction Off-Site
ROG NOx CO SO2 Fugitive PM10
Exhaust PM10
PM10 Total
Fugitive PM2.5
Exhaust PM2.5
PM2.5 Total
Bio- CO2 NBio- CO2 Total CO2 CH4 N2O CO2e
Category tons/yr MT/yr
Off-Road 0.0000 0.0000 0.0000 0.0000 0.0000 0.0000 0.0000 0.0000 0.0000 0.0000 0.0000 0.0000 0.0000 0.0000 0.0000 0.0000
Total 0.0000 0.0000 0.0000 0.0000 0.0000 0.0000 0.0000 0.0000 0.0000 0.0000 0.0000 0.0000 0.0000 0.0000 0.0000 0.0000
Mitigated Construction On-Site
CalEEMod Version: CalEEMod.2016.3.2 Date: 8/28/2020 12:43 PMPage 9 of 31
Inglewood Transit MSF - South Coast Air Basin, Annual

3.2 Demolition - 2024
ROG NOx CO SO2 Fugitive PM10
Exhaust PM10
PM10 Total
Fugitive PM2.5
Exhaust PM2.5
PM2.5 Total
Bio- CO2 NBio- CO2 Total CO2 CH4 N2O CO2e
Category tons/yr MT/yr
Hauling 0.0000 0.0000 0.0000 0.0000 0.0000 0.0000 0.0000 0.0000 0.0000 0.0000 0.0000 0.0000 0.0000 0.0000 0.0000 0.0000
Vendor 0.0000 0.0000 0.0000 0.0000 0.0000 0.0000 0.0000 0.0000 0.0000 0.0000 0.0000 0.0000 0.0000 0.0000 0.0000 0.0000
Worker 0.0000 0.0000 0.0000 0.0000 0.0000 0.0000 0.0000 0.0000 0.0000 0.0000 0.0000 0.0000 0.0000 0.0000 0.0000 0.0000
Total 0.0000 0.0000 0.0000 0.0000 0.0000 0.0000 0.0000 0.0000 0.0000 0.0000 0.0000 0.0000 0.0000 0.0000 0.0000 0.0000
Mitigated Construction Off-Site
3.3 Site Preparation - 2024
ROG NOx CO SO2 Fugitive PM10
Exhaust PM10
PM10 Total
Fugitive PM2.5
Exhaust PM2.5
PM2.5 Total
Bio- CO2 NBio- CO2 Total CO2 CH4 N2O CO2e
Category tons/yr MT/yr
Fugitive Dust 0.0000 0.0000 0.0000 0.0000 0.0000 0.0000 0.0000 0.0000 0.0000 0.0000 0.0000 0.0000 0.0000 0.0000 0.0000 0.0000
Off-Road 0.0000 0.0000 0.0000 0.0000 0.0000 0.0000 0.0000 0.0000 0.0000 0.0000 0.0000 0.0000 0.0000 0.0000 0.0000 0.0000
Total 0.0000 0.0000 0.0000 0.0000 0.0000 0.0000 0.0000 0.0000 0.0000 0.0000 0.0000 0.0000 0.0000 0.0000 0.0000 0.0000
Unmitigated Construction On-Site
CalEEMod Version: CalEEMod.2016.3.2 Date: 8/28/2020 12:43 PMPage 10 of 31
Inglewood Transit MSF - South Coast Air Basin, Annual

3.3 Site Preparation - 2024
ROG NOx CO SO2 Fugitive PM10
Exhaust PM10
PM10 Total
Fugitive PM2.5
Exhaust PM2.5
PM2.5 Total
Bio- CO2 NBio- CO2 Total CO2 CH4 N2O CO2e
Category tons/yr MT/yr
Hauling 0.0000 0.0000 0.0000 0.0000 0.0000 0.0000 0.0000 0.0000 0.0000 0.0000 0.0000 0.0000 0.0000 0.0000 0.0000 0.0000
Vendor 0.0000 0.0000 0.0000 0.0000 0.0000 0.0000 0.0000 0.0000 0.0000 0.0000 0.0000 0.0000 0.0000 0.0000 0.0000 0.0000
Worker 0.0000 0.0000 0.0000 0.0000 0.0000 0.0000 0.0000 0.0000 0.0000 0.0000 0.0000 0.0000 0.0000 0.0000 0.0000 0.0000
Total 0.0000 0.0000 0.0000 0.0000 0.0000 0.0000 0.0000 0.0000 0.0000 0.0000 0.0000 0.0000 0.0000 0.0000 0.0000 0.0000
Unmitigated Construction Off-Site
ROG NOx CO SO2 Fugitive PM10
Exhaust PM10
PM10 Total
Fugitive PM2.5
Exhaust PM2.5
PM2.5 Total
Bio- CO2 NBio- CO2 Total CO2 CH4 N2O CO2e
Category tons/yr MT/yr
Fugitive Dust 0.0000 0.0000 0.0000 0.0000 0.0000 0.0000 0.0000 0.0000 0.0000 0.0000 0.0000 0.0000 0.0000 0.0000 0.0000 0.0000
Off-Road 0.0000 0.0000 0.0000 0.0000 0.0000 0.0000 0.0000 0.0000 0.0000 0.0000 0.0000 0.0000 0.0000 0.0000 0.0000 0.0000
Total 0.0000 0.0000 0.0000 0.0000 0.0000 0.0000 0.0000 0.0000 0.0000 0.0000 0.0000 0.0000 0.0000 0.0000 0.0000 0.0000
Mitigated Construction On-Site
CalEEMod Version: CalEEMod.2016.3.2 Date: 8/28/2020 12:43 PMPage 11 of 31
Inglewood Transit MSF - South Coast Air Basin, Annual

3.3 Site Preparation - 2024
ROG NOx CO SO2 Fugitive PM10
Exhaust PM10
PM10 Total
Fugitive PM2.5
Exhaust PM2.5
PM2.5 Total
Bio- CO2 NBio- CO2 Total CO2 CH4 N2O CO2e
Category tons/yr MT/yr
Hauling 0.0000 0.0000 0.0000 0.0000 0.0000 0.0000 0.0000 0.0000 0.0000 0.0000 0.0000 0.0000 0.0000 0.0000 0.0000 0.0000
Vendor 0.0000 0.0000 0.0000 0.0000 0.0000 0.0000 0.0000 0.0000 0.0000 0.0000 0.0000 0.0000 0.0000 0.0000 0.0000 0.0000
Worker 0.0000 0.0000 0.0000 0.0000 0.0000 0.0000 0.0000 0.0000 0.0000 0.0000 0.0000 0.0000 0.0000 0.0000 0.0000 0.0000
Total 0.0000 0.0000 0.0000 0.0000 0.0000 0.0000 0.0000 0.0000 0.0000 0.0000 0.0000 0.0000 0.0000 0.0000 0.0000 0.0000
Mitigated Construction Off-Site
3.4 Grading - 2024
ROG NOx CO SO2 Fugitive PM10
Exhaust PM10
PM10 Total
Fugitive PM2.5
Exhaust PM2.5
PM2.5 Total
Bio- CO2 NBio- CO2 Total CO2 CH4 N2O CO2e
Category tons/yr MT/yr
Fugitive Dust 0.0000 0.0000 0.0000 0.0000 0.0000 0.0000 0.0000 0.0000 0.0000 0.0000 0.0000 0.0000 0.0000 0.0000 0.0000 0.0000
Off-Road 0.0000 0.0000 0.0000 0.0000 0.0000 0.0000 0.0000 0.0000 0.0000 0.0000 0.0000 0.0000 0.0000 0.0000 0.0000 0.0000
Total 0.0000 0.0000 0.0000 0.0000 0.0000 0.0000 0.0000 0.0000 0.0000 0.0000 0.0000 0.0000 0.0000 0.0000 0.0000 0.0000
Unmitigated Construction On-Site
CalEEMod Version: CalEEMod.2016.3.2 Date: 8/28/2020 12:43 PMPage 12 of 31
Inglewood Transit MSF - South Coast Air Basin, Annual

3.4 Grading - 2024
ROG NOx CO SO2 Fugitive PM10
Exhaust PM10
PM10 Total
Fugitive PM2.5
Exhaust PM2.5
PM2.5 Total
Bio- CO2 NBio- CO2 Total CO2 CH4 N2O CO2e
Category tons/yr MT/yr
Hauling 0.0000 0.0000 0.0000 0.0000 0.0000 0.0000 0.0000 0.0000 0.0000 0.0000 0.0000 0.0000 0.0000 0.0000 0.0000 0.0000
Vendor 0.0000 0.0000 0.0000 0.0000 0.0000 0.0000 0.0000 0.0000 0.0000 0.0000 0.0000 0.0000 0.0000 0.0000 0.0000 0.0000
Worker 0.0000 0.0000 0.0000 0.0000 0.0000 0.0000 0.0000 0.0000 0.0000 0.0000 0.0000 0.0000 0.0000 0.0000 0.0000 0.0000
Total 0.0000 0.0000 0.0000 0.0000 0.0000 0.0000 0.0000 0.0000 0.0000 0.0000 0.0000 0.0000 0.0000 0.0000 0.0000 0.0000
Unmitigated Construction Off-Site
ROG NOx CO SO2 Fugitive PM10
Exhaust PM10
PM10 Total
Fugitive PM2.5
Exhaust PM2.5
PM2.5 Total
Bio- CO2 NBio- CO2 Total CO2 CH4 N2O CO2e
Category tons/yr MT/yr
Fugitive Dust 0.0000 0.0000 0.0000 0.0000 0.0000 0.0000 0.0000 0.0000 0.0000 0.0000 0.0000 0.0000 0.0000 0.0000 0.0000 0.0000
Off-Road 0.0000 0.0000 0.0000 0.0000 0.0000 0.0000 0.0000 0.0000 0.0000 0.0000 0.0000 0.0000 0.0000 0.0000 0.0000 0.0000
Total 0.0000 0.0000 0.0000 0.0000 0.0000 0.0000 0.0000 0.0000 0.0000 0.0000 0.0000 0.0000 0.0000 0.0000 0.0000 0.0000
Mitigated Construction On-Site
CalEEMod Version: CalEEMod.2016.3.2 Date: 8/28/2020 12:43 PMPage 13 of 31
Inglewood Transit MSF - South Coast Air Basin, Annual

3.4 Grading - 2024
ROG NOx CO SO2 Fugitive PM10
Exhaust PM10
PM10 Total
Fugitive PM2.5
Exhaust PM2.5
PM2.5 Total
Bio- CO2 NBio- CO2 Total CO2 CH4 N2O CO2e
Category tons/yr MT/yr
Hauling 0.0000 0.0000 0.0000 0.0000 0.0000 0.0000 0.0000 0.0000 0.0000 0.0000 0.0000 0.0000 0.0000 0.0000 0.0000 0.0000
Vendor 0.0000 0.0000 0.0000 0.0000 0.0000 0.0000 0.0000 0.0000 0.0000 0.0000 0.0000 0.0000 0.0000 0.0000 0.0000 0.0000
Worker 0.0000 0.0000 0.0000 0.0000 0.0000 0.0000 0.0000 0.0000 0.0000 0.0000 0.0000 0.0000 0.0000 0.0000 0.0000 0.0000
Total 0.0000 0.0000 0.0000 0.0000 0.0000 0.0000 0.0000 0.0000 0.0000 0.0000 0.0000 0.0000 0.0000 0.0000 0.0000 0.0000
Mitigated Construction Off-Site
3.5 Building Construction - 2024
ROG NOx CO SO2 Fugitive PM10
Exhaust PM10
PM10 Total
Fugitive PM2.5
Exhaust PM2.5
PM2.5 Total
Bio- CO2 NBio- CO2 Total CO2 CH4 N2O CO2e
Category tons/yr MT/yr
Off-Road 0.0000 0.0000 0.0000 0.0000 0.0000 0.0000 0.0000 0.0000 0.0000 0.0000 0.0000 0.0000 0.0000 0.0000 0.0000 0.0000
Total 0.0000 0.0000 0.0000 0.0000 0.0000 0.0000 0.0000 0.0000 0.0000 0.0000 0.0000 0.0000 0.0000 0.0000 0.0000 0.0000
Unmitigated Construction On-Site
CalEEMod Version: CalEEMod.2016.3.2 Date: 8/28/2020 12:43 PMPage 14 of 31
Inglewood Transit MSF - South Coast Air Basin, Annual

3.5 Building Construction - 2024
ROG NOx CO SO2 Fugitive PM10
Exhaust PM10
PM10 Total
Fugitive PM2.5
Exhaust PM2.5
PM2.5 Total
Bio- CO2 NBio- CO2 Total CO2 CH4 N2O CO2e
Category tons/yr MT/yr
Hauling 0.0000 0.0000 0.0000 0.0000 0.0000 0.0000 0.0000 0.0000 0.0000 0.0000 0.0000 0.0000 0.0000 0.0000 0.0000 0.0000
Vendor 0.0000 0.0000 0.0000 0.0000 0.0000 0.0000 0.0000 0.0000 0.0000 0.0000 0.0000 0.0000 0.0000 0.0000 0.0000 0.0000
Worker 0.0000 0.0000 0.0000 0.0000 0.0000 0.0000 0.0000 0.0000 0.0000 0.0000 0.0000 0.0000 0.0000 0.0000 0.0000 0.0000
Total 0.0000 0.0000 0.0000 0.0000 0.0000 0.0000 0.0000 0.0000 0.0000 0.0000 0.0000 0.0000 0.0000 0.0000 0.0000 0.0000
Unmitigated Construction Off-Site
ROG NOx CO SO2 Fugitive PM10
Exhaust PM10
PM10 Total
Fugitive PM2.5
Exhaust PM2.5
PM2.5 Total
Bio- CO2 NBio- CO2 Total CO2 CH4 N2O CO2e
Category tons/yr MT/yr
Off-Road 0.0000 0.0000 0.0000 0.0000 0.0000 0.0000 0.0000 0.0000 0.0000 0.0000 0.0000 0.0000 0.0000 0.0000 0.0000 0.0000
Total 0.0000 0.0000 0.0000 0.0000 0.0000 0.0000 0.0000 0.0000 0.0000 0.0000 0.0000 0.0000 0.0000 0.0000 0.0000 0.0000
Mitigated Construction On-Site
CalEEMod Version: CalEEMod.2016.3.2 Date: 8/28/2020 12:43 PMPage 15 of 31
Inglewood Transit MSF - South Coast Air Basin, Annual

3.5 Building Construction - 2024
ROG NOx CO SO2 Fugitive PM10
Exhaust PM10
PM10 Total
Fugitive PM2.5
Exhaust PM2.5
PM2.5 Total
Bio- CO2 NBio- CO2 Total CO2 CH4 N2O CO2e
Category tons/yr MT/yr
Hauling 0.0000 0.0000 0.0000 0.0000 0.0000 0.0000 0.0000 0.0000 0.0000 0.0000 0.0000 0.0000 0.0000 0.0000 0.0000 0.0000
Vendor 0.0000 0.0000 0.0000 0.0000 0.0000 0.0000 0.0000 0.0000 0.0000 0.0000 0.0000 0.0000 0.0000 0.0000 0.0000 0.0000
Worker 0.0000 0.0000 0.0000 0.0000 0.0000 0.0000 0.0000 0.0000 0.0000 0.0000 0.0000 0.0000 0.0000 0.0000 0.0000 0.0000
Total 0.0000 0.0000 0.0000 0.0000 0.0000 0.0000 0.0000 0.0000 0.0000 0.0000 0.0000 0.0000 0.0000 0.0000 0.0000 0.0000
Mitigated Construction Off-Site
3.6 Paving - 2025
ROG NOx CO SO2 Fugitive PM10
Exhaust PM10
PM10 Total
Fugitive PM2.5
Exhaust PM2.5
PM2.5 Total
Bio- CO2 NBio- CO2 Total CO2 CH4 N2O CO2e
Category tons/yr MT/yr
Off-Road 0.0000 0.0000 0.0000 0.0000 0.0000 0.0000 0.0000 0.0000 0.0000 0.0000 0.0000 0.0000 0.0000 0.0000 0.0000 0.0000
Paving 0.0000 0.0000 0.0000 0.0000 0.0000 0.0000 0.0000 0.0000 0.0000 0.0000 0.0000 0.0000 0.0000 0.0000 0.0000 0.0000
Total 0.0000 0.0000 0.0000 0.0000 0.0000 0.0000 0.0000 0.0000 0.0000 0.0000 0.0000 0.0000 0.0000 0.0000 0.0000 0.0000
Unmitigated Construction On-Site
CalEEMod Version: CalEEMod.2016.3.2 Date: 8/28/2020 12:43 PMPage 16 of 31
Inglewood Transit MSF - South Coast Air Basin, Annual

3.6 Paving - 2025
ROG NOx CO SO2 Fugitive PM10
Exhaust PM10
PM10 Total
Fugitive PM2.5
Exhaust PM2.5
PM2.5 Total
Bio- CO2 NBio- CO2 Total CO2 CH4 N2O CO2e
Category tons/yr MT/yr
Hauling 0.0000 0.0000 0.0000 0.0000 0.0000 0.0000 0.0000 0.0000 0.0000 0.0000 0.0000 0.0000 0.0000 0.0000 0.0000 0.0000
Vendor 0.0000 0.0000 0.0000 0.0000 0.0000 0.0000 0.0000 0.0000 0.0000 0.0000 0.0000 0.0000 0.0000 0.0000 0.0000 0.0000
Worker 0.0000 0.0000 0.0000 0.0000 0.0000 0.0000 0.0000 0.0000 0.0000 0.0000 0.0000 0.0000 0.0000 0.0000 0.0000 0.0000
Total 0.0000 0.0000 0.0000 0.0000 0.0000 0.0000 0.0000 0.0000 0.0000 0.0000 0.0000 0.0000 0.0000 0.0000 0.0000 0.0000
Unmitigated Construction Off-Site
ROG NOx CO SO2 Fugitive PM10
Exhaust PM10
PM10 Total
Fugitive PM2.5
Exhaust PM2.5
PM2.5 Total
Bio- CO2 NBio- CO2 Total CO2 CH4 N2O CO2e
Category tons/yr MT/yr
Off-Road 0.0000 0.0000 0.0000 0.0000 0.0000 0.0000 0.0000 0.0000 0.0000 0.0000 0.0000 0.0000 0.0000 0.0000 0.0000 0.0000
Paving 0.0000 0.0000 0.0000 0.0000 0.0000 0.0000 0.0000 0.0000 0.0000 0.0000 0.0000 0.0000 0.0000 0.0000 0.0000 0.0000
Total 0.0000 0.0000 0.0000 0.0000 0.0000 0.0000 0.0000 0.0000 0.0000 0.0000 0.0000 0.0000 0.0000 0.0000 0.0000 0.0000
Mitigated Construction On-Site
CalEEMod Version: CalEEMod.2016.3.2 Date: 8/28/2020 12:43 PMPage 17 of 31
Inglewood Transit MSF - South Coast Air Basin, Annual

3.6 Paving - 2025
ROG NOx CO SO2 Fugitive PM10
Exhaust PM10
PM10 Total
Fugitive PM2.5
Exhaust PM2.5
PM2.5 Total
Bio- CO2 NBio- CO2 Total CO2 CH4 N2O CO2e
Category tons/yr MT/yr
Hauling 0.0000 0.0000 0.0000 0.0000 0.0000 0.0000 0.0000 0.0000 0.0000 0.0000 0.0000 0.0000 0.0000 0.0000 0.0000 0.0000
Vendor 0.0000 0.0000 0.0000 0.0000 0.0000 0.0000 0.0000 0.0000 0.0000 0.0000 0.0000 0.0000 0.0000 0.0000 0.0000 0.0000
Worker 0.0000 0.0000 0.0000 0.0000 0.0000 0.0000 0.0000 0.0000 0.0000 0.0000 0.0000 0.0000 0.0000 0.0000 0.0000 0.0000
Total 0.0000 0.0000 0.0000 0.0000 0.0000 0.0000 0.0000 0.0000 0.0000 0.0000 0.0000 0.0000 0.0000 0.0000 0.0000 0.0000
Mitigated Construction Off-Site
3.7 Architectural Coating - 2025
ROG NOx CO SO2 Fugitive PM10
Exhaust PM10
PM10 Total
Fugitive PM2.5
Exhaust PM2.5
PM2.5 Total
Bio- CO2 NBio- CO2 Total CO2 CH4 N2O CO2e
Category tons/yr MT/yr
Archit. Coating 0.0000 0.0000 0.0000 0.0000 0.0000 0.0000 0.0000 0.0000 0.0000 0.0000 0.0000 0.0000 0.0000 0.0000 0.0000 0.0000
Off-Road 0.0000 0.0000 0.0000 0.0000 0.0000 0.0000 0.0000 0.0000 0.0000 0.0000 0.0000 0.0000 0.0000 0.0000 0.0000 0.0000
Total 0.0000 0.0000 0.0000 0.0000 0.0000 0.0000 0.0000 0.0000 0.0000 0.0000 0.0000 0.0000 0.0000 0.0000 0.0000 0.0000
Unmitigated Construction On-Site
CalEEMod Version: CalEEMod.2016.3.2 Date: 8/28/2020 12:43 PMPage 18 of 31
Inglewood Transit MSF - South Coast Air Basin, Annual

3.7 Architectural Coating - 2025
ROG NOx CO SO2 Fugitive PM10
Exhaust PM10
PM10 Total
Fugitive PM2.5
Exhaust PM2.5
PM2.5 Total
Bio- CO2 NBio- CO2 Total CO2 CH4 N2O CO2e
Category tons/yr MT/yr
Hauling 0.0000 0.0000 0.0000 0.0000 0.0000 0.0000 0.0000 0.0000 0.0000 0.0000 0.0000 0.0000 0.0000 0.0000 0.0000 0.0000
Vendor 0.0000 0.0000 0.0000 0.0000 0.0000 0.0000 0.0000 0.0000 0.0000 0.0000 0.0000 0.0000 0.0000 0.0000 0.0000 0.0000
Worker 0.0000 0.0000 0.0000 0.0000 0.0000 0.0000 0.0000 0.0000 0.0000 0.0000 0.0000 0.0000 0.0000 0.0000 0.0000 0.0000
Total 0.0000 0.0000 0.0000 0.0000 0.0000 0.0000 0.0000 0.0000 0.0000 0.0000 0.0000 0.0000 0.0000 0.0000 0.0000 0.0000
Unmitigated Construction Off-Site
ROG NOx CO SO2 Fugitive PM10
Exhaust PM10
PM10 Total
Fugitive PM2.5
Exhaust PM2.5
PM2.5 Total
Bio- CO2 NBio- CO2 Total CO2 CH4 N2O CO2e
Category tons/yr MT/yr
Archit. Coating 0.0000 0.0000 0.0000 0.0000 0.0000 0.0000 0.0000 0.0000 0.0000 0.0000 0.0000 0.0000 0.0000 0.0000 0.0000 0.0000
Off-Road 0.0000 0.0000 0.0000 0.0000 0.0000 0.0000 0.0000 0.0000 0.0000 0.0000 0.0000 0.0000 0.0000 0.0000 0.0000 0.0000
Total 0.0000 0.0000 0.0000 0.0000 0.0000 0.0000 0.0000 0.0000 0.0000 0.0000 0.0000 0.0000 0.0000 0.0000 0.0000 0.0000
Mitigated Construction On-Site
CalEEMod Version: CalEEMod.2016.3.2 Date: 8/28/2020 12:43 PMPage 19 of 31
Inglewood Transit MSF - South Coast Air Basin, Annual

4.0 Operational Detail - Mobile
4.1 Mitigation Measures Mobile
3.7 Architectural Coating - 2025
ROG NOx CO SO2 Fugitive PM10
Exhaust PM10
PM10 Total
Fugitive PM2.5
Exhaust PM2.5
PM2.5 Total
Bio- CO2 NBio- CO2 Total CO2 CH4 N2O CO2e
Category tons/yr MT/yr
Hauling 0.0000 0.0000 0.0000 0.0000 0.0000 0.0000 0.0000 0.0000 0.0000 0.0000 0.0000 0.0000 0.0000 0.0000 0.0000 0.0000
Vendor 0.0000 0.0000 0.0000 0.0000 0.0000 0.0000 0.0000 0.0000 0.0000 0.0000 0.0000 0.0000 0.0000 0.0000 0.0000 0.0000
Worker 0.0000 0.0000 0.0000 0.0000 0.0000 0.0000 0.0000 0.0000 0.0000 0.0000 0.0000 0.0000 0.0000 0.0000 0.0000 0.0000
Total 0.0000 0.0000 0.0000 0.0000 0.0000 0.0000 0.0000 0.0000 0.0000 0.0000 0.0000 0.0000 0.0000 0.0000 0.0000 0.0000
Mitigated Construction Off-Site
CalEEMod Version: CalEEMod.2016.3.2 Date: 8/28/2020 12:43 PMPage 20 of 31
Inglewood Transit MSF - South Coast Air Basin, Annual

ROG NOx CO SO2 Fugitive PM10
Exhaust PM10
PM10 Total
Fugitive PM2.5
Exhaust PM2.5
PM2.5 Total
Bio- CO2 NBio- CO2 Total CO2 CH4 N2O CO2e
Category tons/yr MT/yr
Mitigated 0.0000 0.0000 0.0000 0.0000 0.0000 0.0000 0.0000 0.0000 0.0000 0.0000 0.0000 0.0000 0.0000 0.0000 0.0000 0.0000
Unmitigated 0.0000 0.0000 0.0000 0.0000 0.0000 0.0000 0.0000 0.0000 0.0000 0.0000 0.0000 0.0000 0.0000 0.0000 0.0000 0.0000
4.2 Trip Summary Information
4.3 Trip Type Information
Average Daily Trip Rate Unmitigated Mitigated
Land Use Weekday Saturday Sunday Annual VMT Annual VMT
Arena 0.00 0.00 0.00
General Light Industry 0.00 0.00 0.00
Parking Lot 0.00 0.00 0.00
Total 0.00 0.00 0.00
Miles Trip % Trip Purpose %
Land Use H-W or C-W H-S or C-C H-O or C-NW H-W or C-W H-S or C-C H-O or C-NW Primary Diverted Pass-by
Arena 16.60 8.40 6.90 0.00 81.00 19.00 66 28 6
General Light Industry 16.60 8.40 6.90 59.00 28.00 13.00 92 5 3
Parking Lot 16.60 8.40 6.90 0.00 0.00 0.00 0 0 0
4.4 Fleet Mix
CalEEMod Version: CalEEMod.2016.3.2 Date: 8/28/2020 12:43 PMPage 21 of 31
Inglewood Transit MSF - South Coast Air Basin, Annual

5.0 Energy Detail
ROG NOx CO SO2 Fugitive PM10
Exhaust PM10
PM10 Total
Fugitive PM2.5
Exhaust PM2.5
PM2.5 Total
Bio- CO2 NBio- CO2 Total CO2 CH4 N2O CO2e
Category tons/yr MT/yr
Electricity Mitigated
0.0000 0.0000 0.0000 0.0000 0.0000 219.3512 219.3512 0.0119 2.4600e-003
220.3815
Electricity Unmitigated
0.0000 0.0000 0.0000 0.0000 0.0000 219.3512 219.3512 0.0119 2.4600e-003
220.3815
NaturalGas Mitigated
0.0115 0.1045 0.0878 6.3000e-004
7.9400e-003
7.9400e-003
7.9400e-003
7.9400e-003
0.0000 113.7610 113.7610 2.1800e-003
2.0900e-003
114.4370
NaturalGas Unmitigated
0.0115 0.1045 0.0878 6.3000e-004
7.9400e-003
7.9400e-003
7.9400e-003
7.9400e-003
0.0000 113.7610 113.7610 2.1800e-003
2.0900e-003
114.4370
5.1 Mitigation Measures Energy
Land Use LDA LDT1 LDT2 MDV LHD1 LHD2 MHD HHD OBUS UBUS MCY SBUS MH
Arena 0.554129 0.042164 0.205182 0.113554 0.013848 0.005806 0.021992 0.033191 0.002140 0.001609 0.004858 0.000715 0.000811
General Light Industry 0.554129 0.042164 0.205182 0.113554 0.013848 0.005806 0.021992 0.033191 0.002140 0.001609 0.004858 0.000715 0.000811
Parking Lot 0.554129 0.042164 0.205182 0.113554 0.013848 0.005806 0.021992 0.033191 0.002140 0.001609 0.004858 0.000715 0.000811
Historical Energy Use: N
CalEEMod Version: CalEEMod.2016.3.2 Date: 8/28/2020 12:43 PMPage 22 of 31
Inglewood Transit MSF - South Coast Air Basin, Annual

5.2 Energy by Land Use - NaturalGas
NaturalGas Use
ROG NOx CO SO2 Fugitive PM10
Exhaust PM10
PM10 Total
Fugitive PM2.5
Exhaust PM2.5
PM2.5 Total
Bio- CO2 NBio- CO2 Total CO2 CH4 N2O CO2e
Land Use kBTU/yr tons/yr MT/yr
Arena 501600 2.7000e-003
0.0246 0.0207 1.5000e-004
1.8700e-003
1.8700e-003
1.8700e-003
1.8700e-003
0.0000 26.7673 26.7673 5.1000e-004
4.9000e-004
26.9264
General Light Industry
1.6302e+006
8.7900e-003
0.0799 0.0671 4.8000e-004
6.0700e-003
6.0700e-003
6.0700e-003
6.0700e-003
0.0000 86.9937 86.9937 1.6700e-003
1.5900e-003
87.5106
Parking Lot 0 0.0000 0.0000 0.0000 0.0000 0.0000 0.0000 0.0000 0.0000 0.0000 0.0000 0.0000 0.0000 0.0000 0.0000
Total 0.0115 0.1045 0.0878 6.3000e-004
7.9400e-003
7.9400e-003
7.9400e-003
7.9400e-003
0.0000 113.7610 113.7610 2.1800e-003
2.0800e-003
114.4370
Unmitigated
NaturalGas Use
ROG NOx CO SO2 Fugitive PM10
Exhaust PM10
PM10 Total
Fugitive PM2.5
Exhaust PM2.5
PM2.5 Total
Bio- CO2 NBio- CO2 Total CO2 CH4 N2O CO2e
Land Use kBTU/yr tons/yr MT/yr
Arena 501600 2.7000e-003
0.0246 0.0207 1.5000e-004
1.8700e-003
1.8700e-003
1.8700e-003
1.8700e-003
0.0000 26.7673 26.7673 5.1000e-004
4.9000e-004
26.9264
General Light Industry
1.6302e+006
8.7900e-003
0.0799 0.0671 4.8000e-004
6.0700e-003
6.0700e-003
6.0700e-003
6.0700e-003
0.0000 86.9937 86.9937 1.6700e-003
1.5900e-003
87.5106
Parking Lot 0 0.0000 0.0000 0.0000 0.0000 0.0000 0.0000 0.0000 0.0000 0.0000 0.0000 0.0000 0.0000 0.0000 0.0000
Total 0.0115 0.1045 0.0878 6.3000e-004
7.9400e-003
7.9400e-003
7.9400e-003
7.9400e-003
0.0000 113.7610 113.7610 2.1800e-003
2.0800e-003
114.4370
Mitigated
CalEEMod Version: CalEEMod.2016.3.2 Date: 8/28/2020 12:43 PMPage 23 of 31
Inglewood Transit MSF - South Coast Air Basin, Annual

6.0 Area Detail
5.3 Energy by Land Use - Electricity
Electricity Use
Total CO2 CH4 N2O CO2e
Land Use kWh/yr MT/yr
Arena 202800 49.2139 2.6700e-003
5.5000e-004
49.4450
General Light Industry
659100 159.9451 8.6700e-003
1.7900e-003
160.6964
Parking Lot 42000 10.1922 5.5000e-004
1.1000e-004
10.2401
Total 219.3511 0.0119 2.4500e-003
220.3815
Unmitigated
Electricity Use
Total CO2 CH4 N2O CO2e
Land Use kWh/yr MT/yr
Arena 202800 49.2139 2.6700e-003
5.5000e-004
49.4450
General Light Industry
659100 159.9451 8.6700e-003
1.7900e-003
160.6964
Parking Lot 42000 10.1922 5.5000e-004
1.1000e-004
10.2401
Total 219.3511 0.0119 2.4500e-003
220.3815
Mitigated
CalEEMod Version: CalEEMod.2016.3.2 Date: 8/28/2020 12:43 PMPage 24 of 31
Inglewood Transit MSF - South Coast Air Basin, Annual

6.1 Mitigation Measures Area
6.0 Area Detail
ROG NOx CO SO2 Fugitive PM10
Exhaust PM10
PM10 Total
Fugitive PM2.5
Exhaust PM2.5
PM2.5 Total
Bio- CO2 NBio- CO2 Total CO2 CH4 N2O CO2e
Category tons/yr MT/yr
Mitigated 0.4258 5.0000e-005
5.1200e-003
0.0000 2.0000e-005
2.0000e-005
2.0000e-005
2.0000e-005
0.0000 9.9800e-003
9.9800e-003
3.0000e-005
0.0000 0.0106
Unmitigated 0.4258 5.0000e-005
5.1200e-003
0.0000 2.0000e-005
2.0000e-005
2.0000e-005
2.0000e-005
0.0000 9.9800e-003
9.9800e-003
3.0000e-005
0.0000 0.0106
6.2 Area by SubCategory
ROG NOx CO SO2 Fugitive PM10
Exhaust PM10
PM10 Total
Fugitive PM2.5
Exhaust PM2.5
PM2.5 Total
Bio- CO2 NBio- CO2 Total CO2 CH4 N2O CO2e
SubCategory tons/yr MT/yr
Architectural Coating
0.0490 0.0000 0.0000 0.0000 0.0000 0.0000 0.0000 0.0000 0.0000 0.0000 0.0000
Consumer Products
0.3763 0.0000 0.0000 0.0000 0.0000 0.0000 0.0000 0.0000 0.0000 0.0000 0.0000
Landscaping 4.7000e-004
5.0000e-005
5.1200e-003
0.0000 2.0000e-005
2.0000e-005
2.0000e-005
2.0000e-005
0.0000 9.9800e-003
9.9800e-003
3.0000e-005
0.0000 0.0106
Total 0.4258 5.0000e-005
5.1200e-003
0.0000 2.0000e-005
2.0000e-005
2.0000e-005
2.0000e-005
0.0000 9.9800e-003
9.9800e-003
3.0000e-005
0.0000 0.0106
Unmitigated
CalEEMod Version: CalEEMod.2016.3.2 Date: 8/28/2020 12:43 PMPage 25 of 31
Inglewood Transit MSF - South Coast Air Basin, Annual

7.1 Mitigation Measures Water
7.0 Water Detail
6.2 Area by SubCategory
ROG NOx CO SO2 Fugitive PM10
Exhaust PM10
PM10 Total
Fugitive PM2.5
Exhaust PM2.5
PM2.5 Total
Bio- CO2 NBio- CO2 Total CO2 CH4 N2O CO2e
SubCategory tons/yr MT/yr
Architectural Coating
0.0490 0.0000 0.0000 0.0000 0.0000 0.0000 0.0000 0.0000 0.0000 0.0000 0.0000
Consumer Products
0.3763 0.0000 0.0000 0.0000 0.0000 0.0000 0.0000 0.0000 0.0000 0.0000 0.0000
Landscaping 4.7000e-004
5.0000e-005
5.1200e-003
0.0000 2.0000e-005
2.0000e-005
2.0000e-005
2.0000e-005
0.0000 9.9800e-003
9.9800e-003
3.0000e-005
0.0000 0.0106
Total 0.4258 5.0000e-005
5.1200e-003
0.0000 2.0000e-005
2.0000e-005
2.0000e-005
2.0000e-005
0.0000 9.9800e-003
9.9800e-003
3.0000e-005
0.0000 0.0106
Mitigated
CalEEMod Version: CalEEMod.2016.3.2 Date: 8/28/2020 12:43 PMPage 26 of 31
Inglewood Transit MSF - South Coast Air Basin, Annual

Total CO2 CH4 N2O CO2e
Category MT/yr
Mitigated 100.4449 0.9296 0.0229 130.4963
Unmitigated 100.4449 0.9296 0.0229 130.4963
7.2 Water by Land Use
Indoor/Outdoor Use
Total CO2 CH4 N2O CO2e
Land Use Mgal MT/yr
Arena 10.3385 / 0.659903
37.7269 0.3388 8.3400e-003
48.6812
General Light Industry
18.0375 / 0
62.7179 0.5908 0.0145 81.8151
Parking Lot 0 / 0 0.0000 0.0000 0.0000 0.0000
Total 100.4449 0.9296 0.0229 130.4963
Unmitigated
CalEEMod Version: CalEEMod.2016.3.2 Date: 8/28/2020 12:43 PMPage 27 of 31
Inglewood Transit MSF - South Coast Air Basin, Annual

8.1 Mitigation Measures Waste
7.2 Water by Land Use
Indoor/Outdoor Use
Total CO2 CH4 N2O CO2e
Land Use Mgal MT/yr
Arena 10.3385 / 0.659903
37.7269 0.3388 8.3400e-003
48.6812
General Light Industry
18.0375 / 0
62.7179 0.5908 0.0145 81.8151
Parking Lot 0 / 0 0.0000 0.0000 0.0000 0.0000
Total 100.4449 0.9296 0.0229 130.4963
Mitigated
8.0 Waste Detail
CalEEMod Version: CalEEMod.2016.3.2 Date: 8/28/2020 12:43 PMPage 28 of 31
Inglewood Transit MSF - South Coast Air Basin, Annual

Total CO2 CH4 N2O CO2e
MT/yr
Mitigated 19.7673 1.1682 0.0000 48.9726
Unmitigated 19.7673 1.1682 0.0000 48.9726
Category/Year
8.2 Waste by Land Use
Waste Disposed
Total CO2 CH4 N2O CO2e
Land Use tons MT/yr
Arena 0.66 0.1340 7.9200e-003
0.0000 0.3319
General Light Industry
96.72 19.6333 1.1603 0.0000 48.6406
Parking Lot 0 0.0000 0.0000 0.0000 0.0000
Total 19.7673 1.1682 0.0000 48.9726
Unmitigated
CalEEMod Version: CalEEMod.2016.3.2 Date: 8/28/2020 12:43 PMPage 29 of 31
Inglewood Transit MSF - South Coast Air Basin, Annual
8.2 Waste by Land Use
Waste Disposed
Total CO2 CH4 N2O CO2e
Land Use tons MT/yr
Arena 0.66 0.1340 7.9200e-003
0.0000 0.3319
General Light Industry
96.72 19.6333 1.1603 0.0000 48.6406
Parking Lot 0 0.0000 0.0000 0.0000 0.0000
Total 19.7673 1.1682 0.0000 48.9726
Mitigated
9.0 Operational Offroad
Equipment Type Number Hours/Day Days/Year Horse Power Load Factor Fuel Type
10.0 Stationary Equipment
Fire Pumps and Emergency Generators
Equipment Type Number Hours/Day Hours/Year Horse Power Load Factor Fuel Type
Boilers
Equipment Type Number Heat Input/Day Heat Input/Year Boiler Rating Fuel Type
User Defined Equipment
Equipment Type Number
CalEEMod Version: CalEEMod.2016.3.2 Date: 8/28/2020 12:43 PMPage 30 of 31
Inglewood Transit MSF - South Coast Air Basin, Annual

11.0 Vegetation
CalEEMod Version: CalEEMod.2016.3.2 Date: 8/28/2020 12:43 PMPage 31 of 31
Inglewood Transit MSF - South Coast Air Basin, Annual

Project Characteristics - Southern California Edison, 2018. ESG/Sustainability Template, September 27, 2018
Land Use -
Construction Phase - Construction emissions determined via EMFAC/OFFROAD
Vehicle Trips - Using EMFAC for motor vehicle emissions
Grading -
1.1 Land Usage
Land Uses Size Metric Lot Acreage Floor Surface Area Population
General Light Industry 78.00 1000sqft 1.79 78,000.00 0
Parking Lot 300.00 Space 2.70 120,000.00 0
Arena 24.00 1000sqft 7.71 24,000.00 0
1.2 Other Project Characteristics
Urbanization
Climate Zone
Urban
8
Wind Speed (m/s) Precipitation Freq (Days)2.2 31
1.3 User Entered Comments & Non-Default Data
1.0 Project Characteristics
Utility Company Southern California Edison
2026Operational Year
CO2 Intensity (lb/MWhr)
535 0.029CH4 Intensity (lb/MWhr)
0.006N2O Intensity (lb/MWhr)
Inglewood Transit MSFSouth Coast Air Basin, Summer
CalEEMod Version: CalEEMod.2016.3.2 Date: 8/28/2020 12:46 PMPage 1 of 25
Inglewood Transit MSF - South Coast Air Basin, Summer

2.0 Emissions Summary
Table Name Column Name Default Value New Value
tblConstructionPhase NumDays 20.00 0.00
tblConstructionPhase NumDays 10.00 0.00
tblConstructionPhase NumDays 30.00 0.00
tblConstructionPhase NumDays 300.00 0.00
tblConstructionPhase NumDays 20.00 0.00
tblConstructionPhase NumDays 20.00 0.00
tblProjectCharacteristics CO2IntensityFactor 702.44 535
tblVehicleTrips ST_TR 10.71 0.00
tblVehicleTrips ST_TR 1.32 0.00
tblVehicleTrips SU_TR 10.71 0.00
tblVehicleTrips SU_TR 0.68 0.00
tblVehicleTrips WD_TR 10.71 0.00
tblVehicleTrips WD_TR 6.97 0.00
CalEEMod Version: CalEEMod.2016.3.2 Date: 8/28/2020 12:46 PMPage 2 of 25
Inglewood Transit MSF - South Coast Air Basin, Summer

2.1 Overall Construction (Maximum Daily Emission)
ROG NOx CO SO2 Fugitive PM10
Exhaust PM10
PM10 Total
Fugitive PM2.5
Exhaust PM2.5
PM2.5 Total
Bio- CO2 NBio- CO2 Total CO2 CH4 N2O CO2e
Year lb/day lb/day
2024 0.0000 0.0000 0.0000 0.0000 0.0000 4.1523 0.0000 0.0000 3.8417 0.0000 0.0000 0.0000 0.0000 0.0000 0.0000 0.0000
2025 0.0000 0.0000 0.0000 0.0000 0.0000 0.4726 0.0000 0.0000 0.4389 0.0000 0.0000 0.0000 0.0000 0.0000 0.0000 0.0000
Maximum 0.0000 0.0000 0.0000 0.0000 0.0000 4.1523 0.0000 0.0000 3.8417 0.0000 0.0000 0.0000 0.0000 0.0000 0.0000 0.0000
Unmitigated Construction
ROG NOx CO SO2 Fugitive PM10
Exhaust PM10
PM10 Total
Fugitive PM2.5
Exhaust PM2.5
PM2.5 Total
Bio- CO2 NBio- CO2 Total CO2 CH4 N2O CO2e
Year lb/day lb/day
2024 0.0000 0.0000 0.0000 0.0000 0.0000 4.1523 0.0000 0.0000 3.8417 0.0000 0.0000 0.0000 0.0000 0.0000 0.0000 0.0000
2025 0.0000 0.0000 0.0000 0.0000 0.0000 0.4726 0.0000 0.0000 0.4389 0.0000 0.0000 0.0000 0.0000 0.0000 0.0000 0.0000
Maximum 0.0000 0.0000 0.0000 0.0000 0.0000 4.1523 0.0000 0.0000 3.8417 0.0000 0.0000 0.0000 0.0000 0.0000 0.0000 0.0000
Mitigated Construction
ROG NOx CO SO2 Fugitive PM10
Exhaust PM10
PM10 Total
Fugitive PM2.5
Exhaust PM2.5
PM2.5 Total
Bio- CO2 NBio-CO2 Total CO2 CH4 N20 CO2e
Percent Reduction
0.00 0.00 0.00 0.00 0.00 0.00 0.00 0.00 0.00 0.00 0.00 0.00 0.00 0.00 0.00 0.00
CalEEMod Version: CalEEMod.2016.3.2 Date: 8/28/2020 12:46 PMPage 3 of 25
Inglewood Transit MSF - South Coast Air Basin, Summer

2.2 Overall Operational
ROG NOx CO SO2 Fugitive PM10
Exhaust PM10
PM10 Total
Fugitive PM2.5
Exhaust PM2.5
PM2.5 Total
Bio- CO2 NBio- CO2 Total CO2 CH4 N2O CO2e
Category lb/day lb/day
Area 2.3341 3.7000e-004
0.0409 0.0000 1.5000e-004
1.5000e-004
1.5000e-004
1.5000e-004
0.0880 0.0880 2.3000e-004
0.0937
Energy 0.0630 0.5726 0.4810 3.4400e-003
0.0435 0.0435 0.0435 0.0435 687.1233 687.1233 0.0132 0.0126 691.2065
Mobile 0.0000 0.0000 0.0000 0.0000 0.0000 0.0000 0.0000 0.0000 0.0000 0.0000 0.0000 0.0000 0.0000 0.0000
Total 2.3971 0.5730 0.5219 3.4400e-003
0.0000 0.0437 0.0437 0.0000 0.0437 0.0437 687.2113 687.2113 0.0134 0.0126 691.3002
Unmitigated Operational
ROG NOx CO SO2 Fugitive PM10
Exhaust PM10
PM10 Total
Fugitive PM2.5
Exhaust PM2.5
PM2.5 Total
Bio- CO2 NBio- CO2 Total CO2 CH4 N2O CO2e
Category lb/day lb/day
Area 2.3341 3.7000e-004
0.0409 0.0000 1.5000e-004
1.5000e-004
1.5000e-004
1.5000e-004
0.0880 0.0880 2.3000e-004
0.0937
Energy 0.0630 0.5726 0.4810 3.4400e-003
0.0435 0.0435 0.0435 0.0435 687.1233 687.1233 0.0132 0.0126 691.2065
Mobile 0.0000 0.0000 0.0000 0.0000 0.0000 0.0000 0.0000 0.0000 0.0000 0.0000 0.0000 0.0000 0.0000 0.0000
Total 2.3971 0.5730 0.5219 3.4400e-003
0.0000 0.0437 0.0437 0.0000 0.0437 0.0437 687.2113 687.2113 0.0134 0.0126 691.3002
Mitigated Operational
CalEEMod Version: CalEEMod.2016.3.2 Date: 8/28/2020 12:46 PMPage 4 of 25
Inglewood Transit MSF - South Coast Air Basin, Summer

3.0 Construction Detail
Construction Phase
Phase Number
Phase Name Phase Type Start Date End Date Num Days Week
Num Days Phase Description
1 Demolition Demolition 4/6/2024 4/5/2024 5 0
2 Site Preparation Site Preparation 5/4/2024 5/3/2024 5 0
3 Grading Grading 5/18/2024 5/17/2024 5 0
4 Building Construction Building Construction 6/29/2024 6/28/2024 5 0
5 Paving Paving 8/23/2025 8/22/2025 5 0
6 Architectural Coating Architectural Coating 9/20/2025 9/19/2025 5 0
OffRoad Equipment
ROG NOx CO SO2 Fugitive PM10
Exhaust PM10
PM10 Total
Fugitive PM2.5
Exhaust PM2.5
PM2.5 Total
Bio- CO2 NBio-CO2 Total CO2 CH4 N20 CO2e
Percent Reduction
0.00 0.00 0.00 0.00 0.00 0.00 0.00 0.00 0.00 0.00 0.00 0.00 0.00 0.00 0.00 0.00
Residential Indoor: 0; Residential Outdoor: 0; Non-Residential Indoor: 153,000; Non-Residential Outdoor: 51,000; Striped Parking Area: 7,200 (Architectural Coating – sqft)
Acres of Grading (Site Preparation Phase): 0
Acres of Grading (Grading Phase): 0
Acres of Paving: 2.7
CalEEMod Version: CalEEMod.2016.3.2 Date: 8/28/2020 12:46 PMPage 5 of 25
Inglewood Transit MSF - South Coast Air Basin, Summer

Phase Name Offroad Equipment Type Amount Usage Hours Horse Power Load Factor
Demolition Concrete/Industrial Saws 1 8.00 81 0.73
Demolition Excavators 3 8.00 158 0.38
Demolition Rubber Tired Dozers 2 8.00 247 0.40
Site Preparation Rubber Tired Dozers 3 8.00 247 0.40
Site Preparation Tractors/Loaders/Backhoes 4 8.00 97 0.37
Grading Excavators 2 8.00 158 0.38
Grading Graders 1 8.00 187 0.41
Grading Rubber Tired Dozers 1 8.00 247 0.40
Grading Scrapers 2 8.00 367 0.48
Grading Tractors/Loaders/Backhoes 2 8.00 97 0.37
Building Construction Cranes 1 7.00 231 0.29
Building Construction Forklifts 3 8.00 89 0.20
Building Construction Generator Sets 1 8.00 84 0.74
Building Construction Tractors/Loaders/Backhoes 3 7.00 97 0.37
Building Construction Welders 1 8.00 46 0.45
Paving Pavers 2 8.00 130 0.42
Paving Paving Equipment 2 8.00 132 0.36
Paving Rollers 2 8.00 80 0.38
Architectural Coating Air Compressors 1 6.00 78 0.48
Trips and VMT
CalEEMod Version: CalEEMod.2016.3.2 Date: 8/28/2020 12:46 PMPage 6 of 25
Inglewood Transit MSF - South Coast Air Basin, Summer

3.2 Demolition - 2024
ROG NOx CO SO2 Fugitive PM10
Exhaust PM10
PM10 Total
Fugitive PM2.5
Exhaust PM2.5
PM2.5 Total
Bio- CO2 NBio- CO2 Total CO2 CH4 N2O CO2e
Category lb/day lb/day
Off-Road 0.0000 0.0000 0.0000 0.0000 0.0000 0.0000 0.0000 0.0000 0.0000 0.0000 0.0000 0.0000 0.0000 0.0000 0.0000 0.0000
Total 0.0000 0.0000 0.0000 0.0000 0.0000 0.0000 0.0000 0.0000 0.0000 0.0000 0.0000 0.0000 0.0000 0.0000 0.0000 0.0000
Unmitigated Construction On-Site
3.1 Mitigation Measures Construction
Phase Name Offroad Equipment Count
Worker Trip Number
Vendor Trip Number
Hauling Trip Number
Worker Trip Length
Vendor Trip Length
Hauling Trip Length
Worker Vehicle Class
Vendor Vehicle Class
Hauling Vehicle Class
Demolition 6 15.00 0.00 0.00 14.70 6.90 20.00 LD_Mix HDT_Mix HHDT
Site Preparation 7 18.00 0.00 0.00 14.70 6.90 20.00 LD_Mix HDT_Mix HHDT
Grading 8 20.00 0.00 0.00 14.70 6.90 20.00 LD_Mix HDT_Mix HHDT
Building Construction 9 93.00 36.00 0.00 14.70 6.90 20.00 LD_Mix HDT_Mix HHDT
Paving 6 15.00 0.00 0.00 14.70 6.90 20.00 LD_Mix HDT_Mix HHDT
Architectural Coating 1 19.00 0.00 0.00 14.70 6.90 20.00 LD_Mix HDT_Mix HHDT
CalEEMod Version: CalEEMod.2016.3.2 Date: 8/28/2020 12:46 PMPage 7 of 25
Inglewood Transit MSF - South Coast Air Basin, Summer

3.2 Demolition - 2024
ROG NOx CO SO2 Fugitive PM10
Exhaust PM10
PM10 Total
Fugitive PM2.5
Exhaust PM2.5
PM2.5 Total
Bio- CO2 NBio- CO2 Total CO2 CH4 N2O CO2e
Category lb/day lb/day
Hauling 0.0000 0.0000 0.0000 0.0000 0.0000 0.0000 0.0000 0.0000 0.0000 0.0000 0.0000 0.0000 0.0000 0.0000 0.0000 0.0000
Vendor 0.0000 0.0000 0.0000 0.0000 0.0000 0.0000 0.0000 0.0000 0.0000 0.0000 0.0000 0.0000 0.0000 0.0000 0.0000 0.0000
Worker 0.0000 0.0000 0.0000 0.0000 0.0000 0.0000 0.0000 0.0000 0.0000 0.0000 0.0000 0.0000 0.0000 0.0000 0.0000 0.0000
Total 0.0000 0.0000 0.0000 0.0000 0.0000 0.0000 0.0000 0.0000 0.0000 0.0000 0.0000 0.0000 0.0000 0.0000 0.0000 0.0000
Unmitigated Construction Off-Site
ROG NOx CO SO2 Fugitive PM10
Exhaust PM10
PM10 Total
Fugitive PM2.5
Exhaust PM2.5
PM2.5 Total
Bio- CO2 NBio- CO2 Total CO2 CH4 N2O CO2e
Category lb/day lb/day
Off-Road 0.0000 0.0000 0.0000 0.0000 0.0000 0.0000 0.0000 0.0000 0.0000 0.0000 0.0000 0.0000 0.0000 0.0000 0.0000 0.0000
Total 0.0000 0.0000 0.0000 0.0000 0.0000 0.0000 0.0000 0.0000 0.0000 0.0000 0.0000 0.0000 0.0000 0.0000 0.0000 0.0000
Mitigated Construction On-Site
CalEEMod Version: CalEEMod.2016.3.2 Date: 8/28/2020 12:46 PMPage 8 of 25
Inglewood Transit MSF - South Coast Air Basin, Summer

3.2 Demolition - 2024
ROG NOx CO SO2 Fugitive PM10
Exhaust PM10
PM10 Total
Fugitive PM2.5
Exhaust PM2.5
PM2.5 Total
Bio- CO2 NBio- CO2 Total CO2 CH4 N2O CO2e
Category lb/day lb/day
Hauling 0.0000 0.0000 0.0000 0.0000 0.0000 0.0000 0.0000 0.0000 0.0000 0.0000 0.0000 0.0000 0.0000 0.0000 0.0000 0.0000
Vendor 0.0000 0.0000 0.0000 0.0000 0.0000 0.0000 0.0000 0.0000 0.0000 0.0000 0.0000 0.0000 0.0000 0.0000 0.0000 0.0000
Worker 0.0000 0.0000 0.0000 0.0000 0.0000 0.0000 0.0000 0.0000 0.0000 0.0000 0.0000 0.0000 0.0000 0.0000 0.0000 0.0000
Total 0.0000 0.0000 0.0000 0.0000 0.0000 0.0000 0.0000 0.0000 0.0000 0.0000 0.0000 0.0000 0.0000 0.0000 0.0000 0.0000
Mitigated Construction Off-Site
3.3 Site Preparation - 2024
ROG NOx CO SO2 Fugitive PM10
Exhaust PM10
PM10 Total
Fugitive PM2.5
Exhaust PM2.5
PM2.5 Total
Bio- CO2 NBio- CO2 Total CO2 CH4 N2O CO2e
Category lb/day lb/day
Fugitive Dust 0.0000 0.0000 0.0000 0.0000 0.0000 0.0000 0.0000 0.0000 0.0000 0.0000 0.0000 0.0000 0.0000 0.0000 0.0000 0.0000
Off-Road 0.0000 0.0000 0.0000 0.0000 0.0000 0.0000 0.0000 0.0000 0.0000 0.0000 0.0000 0.0000 0.0000 0.0000 0.0000 0.0000
Total 0.0000 0.0000 0.0000 0.0000 0.0000 0.0000 0.0000 0.0000 0.0000 0.0000 0.0000 0.0000 0.0000 0.0000 0.0000 0.0000
Unmitigated Construction On-Site
CalEEMod Version: CalEEMod.2016.3.2 Date: 8/28/2020 12:46 PMPage 9 of 25
Inglewood Transit MSF - South Coast Air Basin, Summer

3.3 Site Preparation - 2024
ROG NOx CO SO2 Fugitive PM10
Exhaust PM10
PM10 Total
Fugitive PM2.5
Exhaust PM2.5
PM2.5 Total
Bio- CO2 NBio- CO2 Total CO2 CH4 N2O CO2e
Category lb/day lb/day
Hauling 0.0000 0.0000 0.0000 0.0000 0.0000 0.0000 0.0000 0.0000 0.0000 0.0000 0.0000 0.0000 0.0000 0.0000 0.0000 0.0000
Vendor 0.0000 0.0000 0.0000 0.0000 0.0000 0.0000 0.0000 0.0000 0.0000 0.0000 0.0000 0.0000 0.0000 0.0000 0.0000 0.0000
Worker 0.0000 0.0000 0.0000 0.0000 0.0000 0.0000 0.0000 0.0000 0.0000 0.0000 0.0000 0.0000 0.0000 0.0000 0.0000 0.0000
Total 0.0000 0.0000 0.0000 0.0000 0.0000 0.0000 0.0000 0.0000 0.0000 0.0000 0.0000 0.0000 0.0000 0.0000 0.0000 0.0000
Unmitigated Construction Off-Site
ROG NOx CO SO2 Fugitive PM10
Exhaust PM10
PM10 Total
Fugitive PM2.5
Exhaust PM2.5
PM2.5 Total
Bio- CO2 NBio- CO2 Total CO2 CH4 N2O CO2e
Category lb/day lb/day
Fugitive Dust 0.0000 0.0000 0.0000 0.0000 0.0000 0.0000 0.0000 0.0000 0.0000 0.0000 0.0000 0.0000 0.0000 0.0000 0.0000 0.0000
Off-Road 0.0000 0.0000 0.0000 0.0000 0.0000 0.0000 0.0000 0.0000 0.0000 0.0000 0.0000 0.0000 0.0000 0.0000 0.0000 0.0000
Total 0.0000 0.0000 0.0000 0.0000 0.0000 0.0000 0.0000 0.0000 0.0000 0.0000 0.0000 0.0000 0.0000 0.0000 0.0000 0.0000
Mitigated Construction On-Site
CalEEMod Version: CalEEMod.2016.3.2 Date: 8/28/2020 12:46 PMPage 10 of 25
Inglewood Transit MSF - South Coast Air Basin, Summer

3.3 Site Preparation - 2024
ROG NOx CO SO2 Fugitive PM10
Exhaust PM10
PM10 Total
Fugitive PM2.5
Exhaust PM2.5
PM2.5 Total
Bio- CO2 NBio- CO2 Total CO2 CH4 N2O CO2e
Category lb/day lb/day
Hauling 0.0000 0.0000 0.0000 0.0000 0.0000 0.0000 0.0000 0.0000 0.0000 0.0000 0.0000 0.0000 0.0000 0.0000 0.0000 0.0000
Vendor 0.0000 0.0000 0.0000 0.0000 0.0000 0.0000 0.0000 0.0000 0.0000 0.0000 0.0000 0.0000 0.0000 0.0000 0.0000 0.0000
Worker 0.0000 0.0000 0.0000 0.0000 0.0000 0.0000 0.0000 0.0000 0.0000 0.0000 0.0000 0.0000 0.0000 0.0000 0.0000 0.0000
Total 0.0000 0.0000 0.0000 0.0000 0.0000 0.0000 0.0000 0.0000 0.0000 0.0000 0.0000 0.0000 0.0000 0.0000 0.0000 0.0000
Mitigated Construction Off-Site
3.4 Grading - 2024
ROG NOx CO SO2 Fugitive PM10
Exhaust PM10
PM10 Total
Fugitive PM2.5
Exhaust PM2.5
PM2.5 Total
Bio- CO2 NBio- CO2 Total CO2 CH4 N2O CO2e
Category lb/day lb/day
Fugitive Dust 0.0000 0.0000 0.0000 0.0000 0.0000 0.0000 0.0000 0.0000 0.0000 0.0000 0.0000 0.0000 0.0000 0.0000 0.0000 0.0000
Off-Road 0.0000 0.0000 0.0000 0.0000 0.0000 0.0000 0.0000 0.0000 0.0000 0.0000 0.0000 0.0000 0.0000 0.0000 0.0000 0.0000
Total 0.0000 0.0000 0.0000 0.0000 0.0000 0.0000 0.0000 0.0000 0.0000 0.0000 0.0000 0.0000 0.0000 0.0000 0.0000 0.0000
Unmitigated Construction On-Site
CalEEMod Version: CalEEMod.2016.3.2 Date: 8/28/2020 12:46 PMPage 11 of 25
Inglewood Transit MSF - South Coast Air Basin, Summer

3.4 Grading - 2024
ROG NOx CO SO2 Fugitive PM10
Exhaust PM10
PM10 Total
Fugitive PM2.5
Exhaust PM2.5
PM2.5 Total
Bio- CO2 NBio- CO2 Total CO2 CH4 N2O CO2e
Category lb/day lb/day
Hauling 0.0000 0.0000 0.0000 0.0000 0.0000 0.0000 0.0000 0.0000 0.0000 0.0000 0.0000 0.0000 0.0000 0.0000 0.0000 0.0000
Vendor 0.0000 0.0000 0.0000 0.0000 0.0000 0.0000 0.0000 0.0000 0.0000 0.0000 0.0000 0.0000 0.0000 0.0000 0.0000 0.0000
Worker 0.0000 0.0000 0.0000 0.0000 0.0000 0.0000 0.0000 0.0000 0.0000 0.0000 0.0000 0.0000 0.0000 0.0000 0.0000 0.0000
Total 0.0000 0.0000 0.0000 0.0000 0.0000 0.0000 0.0000 0.0000 0.0000 0.0000 0.0000 0.0000 0.0000 0.0000 0.0000 0.0000
Unmitigated Construction Off-Site
ROG NOx CO SO2 Fugitive PM10
Exhaust PM10
PM10 Total
Fugitive PM2.5
Exhaust PM2.5
PM2.5 Total
Bio- CO2 NBio- CO2 Total CO2 CH4 N2O CO2e
Category lb/day lb/day
Fugitive Dust 0.0000 0.0000 0.0000 0.0000 0.0000 0.0000 0.0000 0.0000 0.0000 0.0000 0.0000 0.0000 0.0000 0.0000 0.0000 0.0000
Off-Road 0.0000 0.0000 0.0000 0.0000 0.0000 0.0000 0.0000 0.0000 0.0000 0.0000 0.0000 0.0000 0.0000 0.0000 0.0000 0.0000
Total 0.0000 0.0000 0.0000 0.0000 0.0000 0.0000 0.0000 0.0000 0.0000 0.0000 0.0000 0.0000 0.0000 0.0000 0.0000 0.0000
Mitigated Construction On-Site
CalEEMod Version: CalEEMod.2016.3.2 Date: 8/28/2020 12:46 PMPage 12 of 25
Inglewood Transit MSF - South Coast Air Basin, Summer

3.4 Grading - 2024
ROG NOx CO SO2 Fugitive PM10
Exhaust PM10
PM10 Total
Fugitive PM2.5
Exhaust PM2.5
PM2.5 Total
Bio- CO2 NBio- CO2 Total CO2 CH4 N2O CO2e
Category lb/day lb/day
Hauling 0.0000 0.0000 0.0000 0.0000 0.0000 0.0000 0.0000 0.0000 0.0000 0.0000 0.0000 0.0000 0.0000 0.0000 0.0000 0.0000
Vendor 0.0000 0.0000 0.0000 0.0000 0.0000 0.0000 0.0000 0.0000 0.0000 0.0000 0.0000 0.0000 0.0000 0.0000 0.0000 0.0000
Worker 0.0000 0.0000 0.0000 0.0000 0.0000 0.0000 0.0000 0.0000 0.0000 0.0000 0.0000 0.0000 0.0000 0.0000 0.0000 0.0000
Total 0.0000 0.0000 0.0000 0.0000 0.0000 0.0000 0.0000 0.0000 0.0000 0.0000 0.0000 0.0000 0.0000 0.0000 0.0000 0.0000
Mitigated Construction Off-Site
3.5 Building Construction - 2024
ROG NOx CO SO2 Fugitive PM10
Exhaust PM10
PM10 Total
Fugitive PM2.5
Exhaust PM2.5
PM2.5 Total
Bio- CO2 NBio- CO2 Total CO2 CH4 N2O CO2e
Category lb/day lb/day
Off-Road 0.0000 0.0000 0.0000 0.0000 0.0000 0.0000 0.0000 0.0000 0.0000 0.0000 0.0000 0.0000 0.0000 0.0000 0.0000 0.0000
Total 0.0000 0.0000 0.0000 0.0000 0.0000 0.0000 0.0000 0.0000 0.0000 0.0000 0.0000 0.0000 0.0000 0.0000 0.0000 0.0000
Unmitigated Construction On-Site
CalEEMod Version: CalEEMod.2016.3.2 Date: 8/28/2020 12:46 PMPage 13 of 25
Inglewood Transit MSF - South Coast Air Basin, Summer

3.5 Building Construction - 2024
ROG NOx CO SO2 Fugitive PM10
Exhaust PM10
PM10 Total
Fugitive PM2.5
Exhaust PM2.5
PM2.5 Total
Bio- CO2 NBio- CO2 Total CO2 CH4 N2O CO2e
Category lb/day lb/day
Hauling 0.0000 0.0000 0.0000 0.0000 0.0000 0.0000 0.0000 0.0000 0.0000 0.0000 0.0000 0.0000 0.0000 0.0000 0.0000 0.0000
Vendor 0.0000 0.0000 0.0000 0.0000 0.0000 0.0000 0.0000 0.0000 0.0000 0.0000 0.0000 0.0000 0.0000 0.0000 0.0000 0.0000
Worker 0.0000 0.0000 0.0000 0.0000 0.0000 0.0000 0.0000 0.0000 0.0000 0.0000 0.0000 0.0000 0.0000 0.0000 0.0000 0.0000
Total 0.0000 0.0000 0.0000 0.0000 0.0000 0.0000 0.0000 0.0000 0.0000 0.0000 0.0000 0.0000 0.0000 0.0000 0.0000 0.0000
Unmitigated Construction Off-Site
ROG NOx CO SO2 Fugitive PM10
Exhaust PM10
PM10 Total
Fugitive PM2.5
Exhaust PM2.5
PM2.5 Total
Bio- CO2 NBio- CO2 Total CO2 CH4 N2O CO2e
Category lb/day lb/day
Off-Road 0.0000 0.0000 0.0000 0.0000 0.0000 0.0000 0.0000 0.0000 0.0000 0.0000 0.0000 0.0000 0.0000 0.0000 0.0000 0.0000
Total 0.0000 0.0000 0.0000 0.0000 0.0000 0.0000 0.0000 0.0000 0.0000 0.0000 0.0000 0.0000 0.0000 0.0000 0.0000 0.0000
Mitigated Construction On-Site
CalEEMod Version: CalEEMod.2016.3.2 Date: 8/28/2020 12:46 PMPage 14 of 25
Inglewood Transit MSF - South Coast Air Basin, Summer

3.5 Building Construction - 2024
ROG NOx CO SO2 Fugitive PM10
Exhaust PM10
PM10 Total
Fugitive PM2.5
Exhaust PM2.5
PM2.5 Total
Bio- CO2 NBio- CO2 Total CO2 CH4 N2O CO2e
Category lb/day lb/day
Hauling 0.0000 0.0000 0.0000 0.0000 0.0000 0.0000 0.0000 0.0000 0.0000 0.0000 0.0000 0.0000 0.0000 0.0000 0.0000 0.0000
Vendor 0.0000 0.0000 0.0000 0.0000 0.0000 0.0000 0.0000 0.0000 0.0000 0.0000 0.0000 0.0000 0.0000 0.0000 0.0000 0.0000
Worker 0.0000 0.0000 0.0000 0.0000 0.0000 0.0000 0.0000 0.0000 0.0000 0.0000 0.0000 0.0000 0.0000 0.0000 0.0000 0.0000
Total 0.0000 0.0000 0.0000 0.0000 0.0000 0.0000 0.0000 0.0000 0.0000 0.0000 0.0000 0.0000 0.0000 0.0000 0.0000 0.0000
Mitigated Construction Off-Site
3.6 Paving - 2025
ROG NOx CO SO2 Fugitive PM10
Exhaust PM10
PM10 Total
Fugitive PM2.5
Exhaust PM2.5
PM2.5 Total
Bio- CO2 NBio- CO2 Total CO2 CH4 N2O CO2e
Category lb/day lb/day
Off-Road 0.0000 0.0000 0.0000 0.0000 0.0000 0.0000 0.0000 0.0000 0.0000 0.0000 0.0000 0.0000 0.0000 0.0000 0.0000 0.0000
Paving 0.0000 0.0000 0.0000 0.0000 0.0000 0.0000 0.0000 0.0000 0.0000 0.0000 0.0000 0.0000 0.0000 0.0000 0.0000 0.0000
Total 0.0000 0.0000 0.0000 0.0000 0.0000 0.0000 0.0000 0.0000 0.0000 0.0000 0.0000 0.0000 0.0000 0.0000 0.0000 0.0000
Unmitigated Construction On-Site
CalEEMod Version: CalEEMod.2016.3.2 Date: 8/28/2020 12:46 PMPage 15 of 25
Inglewood Transit MSF - South Coast Air Basin, Summer
3.6 Paving - 2025
ROG NOx CO SO2 Fugitive PM10
Exhaust PM10
PM10 Total
Fugitive PM2.5
Exhaust PM2.5
PM2.5 Total
Bio- CO2 NBio- CO2 Total CO2 CH4 N2O CO2e
Category lb/day lb/day
Hauling 0.0000 0.0000 0.0000 0.0000 0.0000 0.0000 0.0000 0.0000 0.0000 0.0000 0.0000 0.0000 0.0000 0.0000 0.0000 0.0000
Vendor 0.0000 0.0000 0.0000 0.0000 0.0000 0.0000 0.0000 0.0000 0.0000 0.0000 0.0000 0.0000 0.0000 0.0000 0.0000 0.0000
Worker 0.0000 0.0000 0.0000 0.0000 0.0000 0.0000 0.0000 0.0000 0.0000 0.0000 0.0000 0.0000 0.0000 0.0000 0.0000 0.0000
Total 0.0000 0.0000 0.0000 0.0000 0.0000 0.0000 0.0000 0.0000 0.0000 0.0000 0.0000 0.0000 0.0000 0.0000 0.0000 0.0000
Unmitigated Construction Off-Site
ROG NOx CO SO2 Fugitive PM10
Exhaust PM10
PM10 Total
Fugitive PM2.5
Exhaust PM2.5
PM2.5 Total
Bio- CO2 NBio- CO2 Total CO2 CH4 N2O CO2e
Category lb/day lb/day
Off-Road 0.0000 0.0000 0.0000 0.0000 0.0000 0.0000 0.0000 0.0000 0.0000 0.0000 0.0000 0.0000 0.0000 0.0000 0.0000 0.0000
Paving 0.0000 0.0000 0.0000 0.0000 0.0000 0.0000 0.0000 0.0000 0.0000 0.0000 0.0000 0.0000 0.0000 0.0000 0.0000 0.0000
Total 0.0000 0.0000 0.0000 0.0000 0.0000 0.0000 0.0000 0.0000 0.0000 0.0000 0.0000 0.0000 0.0000 0.0000 0.0000 0.0000
Mitigated Construction On-Site
CalEEMod Version: CalEEMod.2016.3.2 Date: 8/28/2020 12:46 PMPage 16 of 25
Inglewood Transit MSF - South Coast Air Basin, Summer

3.6 Paving - 2025
ROG NOx CO SO2 Fugitive PM10
Exhaust PM10
PM10 Total
Fugitive PM2.5
Exhaust PM2.5
PM2.5 Total
Bio- CO2 NBio- CO2 Total CO2 CH4 N2O CO2e
Category lb/day lb/day
Hauling 0.0000 0.0000 0.0000 0.0000 0.0000 0.0000 0.0000 0.0000 0.0000 0.0000 0.0000 0.0000 0.0000 0.0000 0.0000 0.0000
Vendor 0.0000 0.0000 0.0000 0.0000 0.0000 0.0000 0.0000 0.0000 0.0000 0.0000 0.0000 0.0000 0.0000 0.0000 0.0000 0.0000
Worker 0.0000 0.0000 0.0000 0.0000 0.0000 0.0000 0.0000 0.0000 0.0000 0.0000 0.0000 0.0000 0.0000 0.0000 0.0000 0.0000
Total 0.0000 0.0000 0.0000 0.0000 0.0000 0.0000 0.0000 0.0000 0.0000 0.0000 0.0000 0.0000 0.0000 0.0000 0.0000 0.0000
Mitigated Construction Off-Site
3.7 Architectural Coating - 2025
ROG NOx CO SO2 Fugitive PM10
Exhaust PM10
PM10 Total
Fugitive PM2.5
Exhaust PM2.5
PM2.5 Total
Bio- CO2 NBio- CO2 Total CO2 CH4 N2O CO2e
Category lb/day lb/day
Archit. Coating 0.0000 0.0000 0.0000 0.0000 0.0000 0.0000 0.0000 0.0000 0.0000 0.0000 0.0000 0.0000 0.0000 0.0000 0.0000 0.0000
Off-Road 0.0000 0.0000 0.0000 0.0000 0.0000 0.0000 0.0000 0.0000 0.0000 0.0000 0.0000 0.0000 0.0000 0.0000 0.0000 0.0000
Total 0.0000 0.0000 0.0000 0.0000 0.0000 0.0000 0.0000 0.0000 0.0000 0.0000 0.0000 0.0000 0.0000 0.0000 0.0000 0.0000
Unmitigated Construction On-Site
CalEEMod Version: CalEEMod.2016.3.2 Date: 8/28/2020 12:46 PMPage 17 of 25
Inglewood Transit MSF - South Coast Air Basin, Summer

3.7 Architectural Coating - 2025
ROG NOx CO SO2 Fugitive PM10
Exhaust PM10
PM10 Total
Fugitive PM2.5
Exhaust PM2.5
PM2.5 Total
Bio- CO2 NBio- CO2 Total CO2 CH4 N2O CO2e
Category lb/day lb/day
Hauling 0.0000 0.0000 0.0000 0.0000 0.0000 0.0000 0.0000 0.0000 0.0000 0.0000 0.0000 0.0000 0.0000 0.0000 0.0000 0.0000
Vendor 0.0000 0.0000 0.0000 0.0000 0.0000 0.0000 0.0000 0.0000 0.0000 0.0000 0.0000 0.0000 0.0000 0.0000 0.0000 0.0000
Worker 0.0000 0.0000 0.0000 0.0000 0.0000 0.0000 0.0000 0.0000 0.0000 0.0000 0.0000 0.0000 0.0000 0.0000 0.0000 0.0000
Total 0.0000 0.0000 0.0000 0.0000 0.0000 0.0000 0.0000 0.0000 0.0000 0.0000 0.0000 0.0000 0.0000 0.0000 0.0000 0.0000
Unmitigated Construction Off-Site
ROG NOx CO SO2 Fugitive PM10
Exhaust PM10
PM10 Total
Fugitive PM2.5
Exhaust PM2.5
PM2.5 Total
Bio- CO2 NBio- CO2 Total CO2 CH4 N2O CO2e
Category lb/day lb/day
Archit. Coating 0.0000 0.0000 0.0000 0.0000 0.0000 0.0000 0.0000 0.0000 0.0000 0.0000 0.0000 0.0000 0.0000 0.0000 0.0000 0.0000
Off-Road 0.0000 0.0000 0.0000 0.0000 0.0000 0.0000 0.0000 0.0000 0.0000 0.0000 0.0000 0.0000 0.0000 0.0000 0.0000 0.0000
Total 0.0000 0.0000 0.0000 0.0000 0.0000 0.0000 0.0000 0.0000 0.0000 0.0000 0.0000 0.0000 0.0000 0.0000 0.0000 0.0000
Mitigated Construction On-Site
CalEEMod Version: CalEEMod.2016.3.2 Date: 8/28/2020 12:46 PMPage 18 of 25
Inglewood Transit MSF - South Coast Air Basin, Summer

4.0 Operational Detail - Mobile
4.1 Mitigation Measures Mobile
3.7 Architectural Coating - 2025
ROG NOx CO SO2 Fugitive PM10
Exhaust PM10
PM10 Total
Fugitive PM2.5
Exhaust PM2.5
PM2.5 Total
Bio- CO2 NBio- CO2 Total CO2 CH4 N2O CO2e
Category lb/day lb/day
Hauling 0.0000 0.0000 0.0000 0.0000 0.0000 0.0000 0.0000 0.0000 0.0000 0.0000 0.0000 0.0000 0.0000 0.0000 0.0000 0.0000
Vendor 0.0000 0.0000 0.0000 0.0000 0.0000 0.0000 0.0000 0.0000 0.0000 0.0000 0.0000 0.0000 0.0000 0.0000 0.0000 0.0000
Worker 0.0000 0.0000 0.0000 0.0000 0.0000 0.0000 0.0000 0.0000 0.0000 0.0000 0.0000 0.0000 0.0000 0.0000 0.0000 0.0000
Total 0.0000 0.0000 0.0000 0.0000 0.0000 0.0000 0.0000 0.0000 0.0000 0.0000 0.0000 0.0000 0.0000 0.0000 0.0000 0.0000
Mitigated Construction Off-Site
CalEEMod Version: CalEEMod.2016.3.2 Date: 8/28/2020 12:46 PMPage 19 of 25
Inglewood Transit MSF - South Coast Air Basin, Summer

ROG NOx CO SO2 Fugitive PM10
Exhaust PM10
PM10 Total
Fugitive PM2.5
Exhaust PM2.5
PM2.5 Total
Bio- CO2 NBio- CO2 Total CO2 CH4 N2O CO2e
Category lb/day lb/day
Mitigated 0.0000 0.0000 0.0000 0.0000 0.0000 0.0000 0.0000 0.0000 0.0000 0.0000 0.0000 0.0000 0.0000 0.0000
Unmitigated 0.0000 0.0000 0.0000 0.0000 0.0000 0.0000 0.0000 0.0000 0.0000 0.0000 0.0000 0.0000 0.0000 0.0000
4.2 Trip Summary Information
4.3 Trip Type Information
Average Daily Trip Rate Unmitigated Mitigated
Land Use Weekday Saturday Sunday Annual VMT Annual VMT
Arena 0.00 0.00 0.00
General Light Industry 0.00 0.00 0.00
Parking Lot 0.00 0.00 0.00
Total 0.00 0.00 0.00
Miles Trip % Trip Purpose %
Land Use H-W or C-W H-S or C-C H-O or C-NW H-W or C-W H-S or C-C H-O or C-NW Primary Diverted Pass-by
Arena 16.60 8.40 6.90 0.00 81.00 19.00 66 28 6
General Light Industry 16.60 8.40 6.90 59.00 28.00 13.00 92 5 3
Parking Lot 16.60 8.40 6.90 0.00 0.00 0.00 0 0 0
4.4 Fleet Mix
CalEEMod Version: CalEEMod.2016.3.2 Date: 8/28/2020 12:46 PMPage 20 of 25
Inglewood Transit MSF - South Coast Air Basin, Summer

5.0 Energy Detail
ROG NOx CO SO2 Fugitive PM10
Exhaust PM10
PM10 Total
Fugitive PM2.5
Exhaust PM2.5
PM2.5 Total
Bio- CO2 NBio- CO2 Total CO2 CH4 N2O CO2e
Category lb/day lb/day
NaturalGas Mitigated
0.0630 0.5726 0.4810 3.4400e-003
0.0435 0.0435 0.0435 0.0435 687.1233 687.1233 0.0132 0.0126 691.2065
NaturalGas Unmitigated
0.0630 0.5726 0.4810 3.4400e-003
0.0435 0.0435 0.0435 0.0435 687.1233 687.1233 0.0132 0.0126 691.2065
5.1 Mitigation Measures Energy
Land Use LDA LDT1 LDT2 MDV LHD1 LHD2 MHD HHD OBUS UBUS MCY SBUS MH
Arena 0.554129 0.042164 0.205182 0.113554 0.013848 0.005806 0.021992 0.033191 0.002140 0.001609 0.004858 0.000715 0.000811
General Light Industry 0.554129 0.042164 0.205182 0.113554 0.013848 0.005806 0.021992 0.033191 0.002140 0.001609 0.004858 0.000715 0.000811
Parking Lot 0.554129 0.042164 0.205182 0.113554 0.013848 0.005806 0.021992 0.033191 0.002140 0.001609 0.004858 0.000715 0.000811
Historical Energy Use: N
CalEEMod Version: CalEEMod.2016.3.2 Date: 8/28/2020 12:46 PMPage 21 of 25
Inglewood Transit MSF - South Coast Air Basin, Summer

6.0 Area Detail
5.2 Energy by Land Use - NaturalGas
NaturalGas Use
ROG NOx CO SO2 Fugitive PM10
Exhaust PM10
PM10 Total
Fugitive PM2.5
Exhaust PM2.5
PM2.5 Total
Bio- CO2 NBio- CO2 Total CO2 CH4 N2O CO2e
Land Use kBTU/yr lb/day lb/day
Arena 1374.25 0.0148 0.1347 0.1132 8.1000e-004
0.0102 0.0102 0.0102 0.0102 161.6761 161.6761 3.1000e-003
2.9600e-003
162.6368
General Light Industry
4466.3 0.0482 0.4379 0.3678 2.6300e-003
0.0333 0.0333 0.0333 0.0333 525.4472 525.4472 0.0101 9.6300e-003
528.5697
Parking Lot 0 0.0000 0.0000 0.0000 0.0000 0.0000 0.0000 0.0000 0.0000 0.0000 0.0000 0.0000 0.0000 0.0000
Total 0.0630 0.5726 0.4810 3.4400e-003
0.0435 0.0435 0.0435 0.0435 687.1233 687.1233 0.0132 0.0126 691.2065
Unmitigated
NaturalGas Use
ROG NOx CO SO2 Fugitive PM10
Exhaust PM10
PM10 Total
Fugitive PM2.5
Exhaust PM2.5
PM2.5 Total
Bio- CO2 NBio- CO2 Total CO2 CH4 N2O CO2e
Land Use kBTU/yr lb/day lb/day
Arena 1.37425 0.0148 0.1347 0.1132 8.1000e-004
0.0102 0.0102 0.0102 0.0102 161.6761 161.6761 3.1000e-003
2.9600e-003
162.6368
General Light Industry
4.4663 0.0482 0.4379 0.3678 2.6300e-003
0.0333 0.0333 0.0333 0.0333 525.4472 525.4472 0.0101 9.6300e-003
528.5697
Parking Lot 0 0.0000 0.0000 0.0000 0.0000 0.0000 0.0000 0.0000 0.0000 0.0000 0.0000 0.0000 0.0000 0.0000
Total 0.0630 0.5726 0.4810 3.4400e-003
0.0435 0.0435 0.0435 0.0435 687.1233 687.1233 0.0132 0.0126 691.2065
Mitigated
CalEEMod Version: CalEEMod.2016.3.2 Date: 8/28/2020 12:46 PMPage 22 of 25
Inglewood Transit MSF - South Coast Air Basin, Summer

6.1 Mitigation Measures Area
6.0 Area Detail
ROG NOx CO SO2 Fugitive PM10
Exhaust PM10
PM10 Total
Fugitive PM2.5
Exhaust PM2.5
PM2.5 Total
Bio- CO2 NBio- CO2 Total CO2 CH4 N2O CO2e
Category lb/day lb/day
Mitigated 2.3341 3.7000e-004
0.0409 0.0000 1.5000e-004
1.5000e-004
1.5000e-004
1.5000e-004
0.0880 0.0880 2.3000e-004
0.0937
Unmitigated 2.3341 3.7000e-004
0.0409 0.0000 1.5000e-004
1.5000e-004
1.5000e-004
1.5000e-004
0.0880 0.0880 2.3000e-004
0.0937
6.2 Area by SubCategory
ROG NOx CO SO2 Fugitive PM10
Exhaust PM10
PM10 Total
Fugitive PM2.5
Exhaust PM2.5
PM2.5 Total
Bio- CO2 NBio- CO2 Total CO2 CH4 N2O CO2e
SubCategory lb/day lb/day
Architectural Coating
0.2682 0.0000 0.0000 0.0000 0.0000 0.0000 0.0000
Consumer Products
2.0621 0.0000 0.0000 0.0000 0.0000 0.0000 0.0000
Landscaping 3.7700e-003
3.7000e-004
0.0409 0.0000 1.5000e-004
1.5000e-004
1.5000e-004
1.5000e-004
0.0880 0.0880 2.3000e-004
0.0937
Total 2.3341 3.7000e-004
0.0409 0.0000 1.5000e-004
1.5000e-004
1.5000e-004
1.5000e-004
0.0880 0.0880 2.3000e-004
0.0937
Unmitigated
CalEEMod Version: CalEEMod.2016.3.2 Date: 8/28/2020 12:46 PMPage 23 of 25
Inglewood Transit MSF - South Coast Air Basin, Summer

8.1 Mitigation Measures Waste
7.1 Mitigation Measures Water
7.0 Water Detail
8.0 Waste Detail
6.2 Area by SubCategory
ROG NOx CO SO2 Fugitive PM10
Exhaust PM10
PM10 Total
Fugitive PM2.5
Exhaust PM2.5
PM2.5 Total
Bio- CO2 NBio- CO2 Total CO2 CH4 N2O CO2e
SubCategory lb/day lb/day
Architectural Coating
0.2682 0.0000 0.0000 0.0000 0.0000 0.0000 0.0000
Consumer Products
2.0621 0.0000 0.0000 0.0000 0.0000 0.0000 0.0000
Landscaping 3.7700e-003
3.7000e-004
0.0409 0.0000 1.5000e-004
1.5000e-004
1.5000e-004
1.5000e-004
0.0880 0.0880 2.3000e-004
0.0937
Total 2.3341 3.7000e-004
0.0409 0.0000 1.5000e-004
1.5000e-004
1.5000e-004
1.5000e-004
0.0880 0.0880 2.3000e-004
0.0937
Mitigated
9.0 Operational Offroad
Equipment Type Number Hours/Day Days/Year Horse Power Load Factor Fuel Type
10.0 Stationary Equipment
Fire Pumps and Emergency Generators
CalEEMod Version: CalEEMod.2016.3.2 Date: 8/28/2020 12:46 PMPage 24 of 25
Inglewood Transit MSF - South Coast Air Basin, Summer
11.0 Vegetation
Equipment Type Number Hours/Day Hours/Year Horse Power Load Factor Fuel Type
Boilers
Equipment Type Number Heat Input/Day Heat Input/Year Boiler Rating Fuel Type
User Defined Equipment
Equipment Type Number
CalEEMod Version: CalEEMod.2016.3.2 Date: 8/28/2020 12:46 PMPage 25 of 25
Inglewood Transit MSF - South Coast Air Basin, Summer

Project Characteristics - Southern California Edison, 2018. ESG/Sustainability Template, September 27, 2018
Land Use -
Construction Phase - Construction emissions determined via EMFAC/OFFROAD
Vehicle Trips - Using EMFAC for motor vehicle emissions
Grading -
1.1 Land Usage
Land Uses Size Metric Lot Acreage Floor Surface Area Population
General Light Industry 78.00 1000sqft 1.79 78,000.00 0
Parking Lot 300.00 Space 2.70 120,000.00 0
Arena 24.00 1000sqft 7.71 24,000.00 0
1.2 Other Project Characteristics
Urbanization
Climate Zone
Urban
8
Wind Speed (m/s) Precipitation Freq (Days)2.2 31
1.3 User Entered Comments & Non-Default Data
1.0 Project Characteristics
Utility Company Southern California Edison
2026Operational Year
CO2 Intensity (lb/MWhr)
535 0.029CH4 Intensity (lb/MWhr)
0.006N2O Intensity (lb/MWhr)
Inglewood Transit MSFSouth Coast Air Basin, Winter
CalEEMod Version: CalEEMod.2016.3.2 Date: 8/28/2020 12:47 PMPage 1 of 25
Inglewood Transit MSF - South Coast Air Basin, Winter

2.0 Emissions Summary
Table Name Column Name Default Value New Value
tblConstructionPhase NumDays 20.00 0.00
tblConstructionPhase NumDays 10.00 0.00
tblConstructionPhase NumDays 30.00 0.00
tblConstructionPhase NumDays 300.00 0.00
tblConstructionPhase NumDays 20.00 0.00
tblConstructionPhase NumDays 20.00 0.00
tblProjectCharacteristics CO2IntensityFactor 702.44 535
tblVehicleTrips ST_TR 10.71 0.00
tblVehicleTrips ST_TR 1.32 0.00
tblVehicleTrips SU_TR 10.71 0.00
tblVehicleTrips SU_TR 0.68 0.00
tblVehicleTrips WD_TR 10.71 0.00
tblVehicleTrips WD_TR 6.97 0.00
CalEEMod Version: CalEEMod.2016.3.2 Date: 8/28/2020 12:47 PMPage 2 of 25
Inglewood Transit MSF - South Coast Air Basin, Winter

2.1 Overall Construction (Maximum Daily Emission)
ROG NOx CO SO2 Fugitive PM10
Exhaust PM10
PM10 Total
Fugitive PM2.5
Exhaust PM2.5
PM2.5 Total
Bio- CO2 NBio- CO2 Total CO2 CH4 N2O CO2e
Year lb/day lb/day
2024 0.0000 0.0000 0.0000 0.0000 0.0000 4.1524 0.0000 0.0000 3.8418 0.0000 0.0000 0.0000 0.0000 0.0000 0.0000 0.0000
2025 0.0000 0.0000 0.0000 0.0000 0.0000 0.4726 0.0000 0.0000 0.4389 0.0000 0.0000 0.0000 0.0000 0.0000 0.0000 0.0000
Maximum 0.0000 0.0000 0.0000 0.0000 0.0000 4.1524 0.0000 0.0000 3.8418 0.0000 0.0000 0.0000 0.0000 0.0000 0.0000 0.0000
Unmitigated Construction
ROG NOx CO SO2 Fugitive PM10
Exhaust PM10
PM10 Total
Fugitive PM2.5
Exhaust PM2.5
PM2.5 Total
Bio- CO2 NBio- CO2 Total CO2 CH4 N2O CO2e
Year lb/day lb/day
2024 0.0000 0.0000 0.0000 0.0000 0.0000 4.1524 0.0000 0.0000 3.8418 0.0000 0.0000 0.0000 0.0000 0.0000 0.0000 0.0000
2025 0.0000 0.0000 0.0000 0.0000 0.0000 0.4726 0.0000 0.0000 0.4389 0.0000 0.0000 0.0000 0.0000 0.0000 0.0000 0.0000
Maximum 0.0000 0.0000 0.0000 0.0000 0.0000 4.1524 0.0000 0.0000 3.8418 0.0000 0.0000 0.0000 0.0000 0.0000 0.0000 0.0000
Mitigated Construction
ROG NOx CO SO2 Fugitive PM10
Exhaust PM10
PM10 Total
Fugitive PM2.5
Exhaust PM2.5
PM2.5 Total
Bio- CO2 NBio-CO2 Total CO2 CH4 N20 CO2e
Percent Reduction
0.00 0.00 0.00 0.00 0.00 0.00 0.00 0.00 0.00 0.00 0.00 0.00 0.00 0.00 0.00 0.00
CalEEMod Version: CalEEMod.2016.3.2 Date: 8/28/2020 12:47 PMPage 3 of 25
Inglewood Transit MSF - South Coast Air Basin, Winter

2.2 Overall Operational
ROG NOx CO SO2 Fugitive PM10
Exhaust PM10
PM10 Total
Fugitive PM2.5
Exhaust PM2.5
PM2.5 Total
Bio- CO2 NBio- CO2 Total CO2 CH4 N2O CO2e
Category lb/day lb/day
Area 2.3341 3.7000e-004
0.0409 0.0000 1.5000e-004
1.5000e-004
1.5000e-004
1.5000e-004
0.0880 0.0880 2.3000e-004
0.0937
Energy 0.0630 0.5726 0.4810 3.4400e-003
0.0435 0.0435 0.0435 0.0435 687.1233 687.1233 0.0132 0.0126 691.2065
Mobile 0.0000 0.0000 0.0000 0.0000 0.0000 0.0000 0.0000 0.0000 0.0000 0.0000 0.0000 0.0000 0.0000 0.0000
Total 2.3971 0.5730 0.5219 3.4400e-003
0.0000 0.0437 0.0437 0.0000 0.0437 0.0437 687.2113 687.2113 0.0134 0.0126 691.3002
Unmitigated Operational
ROG NOx CO SO2 Fugitive PM10
Exhaust PM10
PM10 Total
Fugitive PM2.5
Exhaust PM2.5
PM2.5 Total
Bio- CO2 NBio- CO2 Total CO2 CH4 N2O CO2e
Category lb/day lb/day
Area 2.3341 3.7000e-004
0.0409 0.0000 1.5000e-004
1.5000e-004
1.5000e-004
1.5000e-004
0.0880 0.0880 2.3000e-004
0.0937
Energy 0.0630 0.5726 0.4810 3.4400e-003
0.0435 0.0435 0.0435 0.0435 687.1233 687.1233 0.0132 0.0126 691.2065
Mobile 0.0000 0.0000 0.0000 0.0000 0.0000 0.0000 0.0000 0.0000 0.0000 0.0000 0.0000 0.0000 0.0000 0.0000
Total 2.3971 0.5730 0.5219 3.4400e-003
0.0000 0.0437 0.0437 0.0000 0.0437 0.0437 687.2113 687.2113 0.0134 0.0126 691.3002
Mitigated Operational
CalEEMod Version: CalEEMod.2016.3.2 Date: 8/28/2020 12:47 PMPage 4 of 25
Inglewood Transit MSF - South Coast Air Basin, Winter

3.0 Construction Detail
Construction Phase
Phase Number
Phase Name Phase Type Start Date End Date Num Days Week
Num Days Phase Description
1 Demolition Demolition 4/6/2024 4/5/2024 5 0
2 Site Preparation Site Preparation 5/4/2024 5/3/2024 5 0
3 Grading Grading 5/18/2024 5/17/2024 5 0
4 Building Construction Building Construction 6/29/2024 6/28/2024 5 0
5 Paving Paving 8/23/2025 8/22/2025 5 0
6 Architectural Coating Architectural Coating 9/20/2025 9/19/2025 5 0
OffRoad Equipment
ROG NOx CO SO2 Fugitive PM10
Exhaust PM10
PM10 Total
Fugitive PM2.5
Exhaust PM2.5
PM2.5 Total
Bio- CO2 NBio-CO2 Total CO2 CH4 N20 CO2e
Percent Reduction
0.00 0.00 0.00 0.00 0.00 0.00 0.00 0.00 0.00 0.00 0.00 0.00 0.00 0.00 0.00 0.00
Residential Indoor: 0; Residential Outdoor: 0; Non-Residential Indoor: 153,000; Non-Residential Outdoor: 51,000; Striped Parking Area: 7,200 (Architectural Coating – sqft)
Acres of Grading (Site Preparation Phase): 0
Acres of Grading (Grading Phase): 0
Acres of Paving: 2.7
CalEEMod Version: CalEEMod.2016.3.2 Date: 8/28/2020 12:47 PMPage 5 of 25
Inglewood Transit MSF - South Coast Air Basin, Winter

Phase Name Offroad Equipment Type Amount Usage Hours Horse Power Load Factor
Demolition Concrete/Industrial Saws 1 8.00 81 0.73
Demolition Excavators 3 8.00 158 0.38
Demolition Rubber Tired Dozers 2 8.00 247 0.40
Site Preparation Rubber Tired Dozers 3 8.00 247 0.40
Site Preparation Tractors/Loaders/Backhoes 4 8.00 97 0.37
Grading Excavators 2 8.00 158 0.38
Grading Graders 1 8.00 187 0.41
Grading Rubber Tired Dozers 1 8.00 247 0.40
Grading Scrapers 2 8.00 367 0.48
Grading Tractors/Loaders/Backhoes 2 8.00 97 0.37
Building Construction Cranes 1 7.00 231 0.29
Building Construction Forklifts 3 8.00 89 0.20
Building Construction Generator Sets 1 8.00 84 0.74
Building Construction Tractors/Loaders/Backhoes 3 7.00 97 0.37
Building Construction Welders 1 8.00 46 0.45
Paving Pavers 2 8.00 130 0.42
Paving Paving Equipment 2 8.00 132 0.36
Paving Rollers 2 8.00 80 0.38
Architectural Coating Air Compressors 1 6.00 78 0.48
Trips and VMT
CalEEMod Version: CalEEMod.2016.3.2 Date: 8/28/2020 12:47 PMPage 6 of 25
Inglewood Transit MSF - South Coast Air Basin, Winter

3.2 Demolition - 2024
ROG NOx CO SO2 Fugitive PM10
Exhaust PM10
PM10 Total
Fugitive PM2.5
Exhaust PM2.5
PM2.5 Total
Bio- CO2 NBio- CO2 Total CO2 CH4 N2O CO2e
Category lb/day lb/day
Off-Road 0.0000 0.0000 0.0000 0.0000 0.0000 0.0000 0.0000 0.0000 0.0000 0.0000 0.0000 0.0000 0.0000 0.0000 0.0000 0.0000
Total 0.0000 0.0000 0.0000 0.0000 0.0000 0.0000 0.0000 0.0000 0.0000 0.0000 0.0000 0.0000 0.0000 0.0000 0.0000 0.0000
Unmitigated Construction On-Site
3.1 Mitigation Measures Construction
Phase Name Offroad Equipment Count
Worker Trip Number
Vendor Trip Number
Hauling Trip Number
Worker Trip Length
Vendor Trip Length
Hauling Trip Length
Worker Vehicle Class
Vendor Vehicle Class
Hauling Vehicle Class
Demolition 6 15.00 0.00 0.00 14.70 6.90 20.00 LD_Mix HDT_Mix HHDT
Site Preparation 7 18.00 0.00 0.00 14.70 6.90 20.00 LD_Mix HDT_Mix HHDT
Grading 8 20.00 0.00 0.00 14.70 6.90 20.00 LD_Mix HDT_Mix HHDT
Building Construction 9 93.00 36.00 0.00 14.70 6.90 20.00 LD_Mix HDT_Mix HHDT
Paving 6 15.00 0.00 0.00 14.70 6.90 20.00 LD_Mix HDT_Mix HHDT
Architectural Coating 1 19.00 0.00 0.00 14.70 6.90 20.00 LD_Mix HDT_Mix HHDT
CalEEMod Version: CalEEMod.2016.3.2 Date: 8/28/2020 12:47 PMPage 7 of 25
Inglewood Transit MSF - South Coast Air Basin, Winter

3.2 Demolition - 2024
ROG NOx CO SO2 Fugitive PM10
Exhaust PM10
PM10 Total
Fugitive PM2.5
Exhaust PM2.5
PM2.5 Total
Bio- CO2 NBio- CO2 Total CO2 CH4 N2O CO2e
Category lb/day lb/day
Hauling 0.0000 0.0000 0.0000 0.0000 0.0000 0.0000 0.0000 0.0000 0.0000 0.0000 0.0000 0.0000 0.0000 0.0000 0.0000 0.0000
Vendor 0.0000 0.0000 0.0000 0.0000 0.0000 0.0000 0.0000 0.0000 0.0000 0.0000 0.0000 0.0000 0.0000 0.0000 0.0000 0.0000
Worker 0.0000 0.0000 0.0000 0.0000 0.0000 0.0000 0.0000 0.0000 0.0000 0.0000 0.0000 0.0000 0.0000 0.0000 0.0000 0.0000
Total 0.0000 0.0000 0.0000 0.0000 0.0000 0.0000 0.0000 0.0000 0.0000 0.0000 0.0000 0.0000 0.0000 0.0000 0.0000 0.0000
Unmitigated Construction Off-Site
ROG NOx CO SO2 Fugitive PM10
Exhaust PM10
PM10 Total
Fugitive PM2.5
Exhaust PM2.5
PM2.5 Total
Bio- CO2 NBio- CO2 Total CO2 CH4 N2O CO2e
Category lb/day lb/day
Off-Road 0.0000 0.0000 0.0000 0.0000 0.0000 0.0000 0.0000 0.0000 0.0000 0.0000 0.0000 0.0000 0.0000 0.0000 0.0000 0.0000
Total 0.0000 0.0000 0.0000 0.0000 0.0000 0.0000 0.0000 0.0000 0.0000 0.0000 0.0000 0.0000 0.0000 0.0000 0.0000 0.0000
Mitigated Construction On-Site
CalEEMod Version: CalEEMod.2016.3.2 Date: 8/28/2020 12:47 PMPage 8 of 25
Inglewood Transit MSF - South Coast Air Basin, Winter

3.2 Demolition - 2024
ROG NOx CO SO2 Fugitive PM10
Exhaust PM10
PM10 Total
Fugitive PM2.5
Exhaust PM2.5
PM2.5 Total
Bio- CO2 NBio- CO2 Total CO2 CH4 N2O CO2e
Category lb/day lb/day
Hauling 0.0000 0.0000 0.0000 0.0000 0.0000 0.0000 0.0000 0.0000 0.0000 0.0000 0.0000 0.0000 0.0000 0.0000 0.0000 0.0000
Vendor 0.0000 0.0000 0.0000 0.0000 0.0000 0.0000 0.0000 0.0000 0.0000 0.0000 0.0000 0.0000 0.0000 0.0000 0.0000 0.0000
Worker 0.0000 0.0000 0.0000 0.0000 0.0000 0.0000 0.0000 0.0000 0.0000 0.0000 0.0000 0.0000 0.0000 0.0000 0.0000 0.0000
Total 0.0000 0.0000 0.0000 0.0000 0.0000 0.0000 0.0000 0.0000 0.0000 0.0000 0.0000 0.0000 0.0000 0.0000 0.0000 0.0000
Mitigated Construction Off-Site
3.3 Site Preparation - 2024
ROG NOx CO SO2 Fugitive PM10
Exhaust PM10
PM10 Total
Fugitive PM2.5
Exhaust PM2.5
PM2.5 Total
Bio- CO2 NBio- CO2 Total CO2 CH4 N2O CO2e
Category lb/day lb/day
Fugitive Dust 0.0000 0.0000 0.0000 0.0000 0.0000 0.0000 0.0000 0.0000 0.0000 0.0000 0.0000 0.0000 0.0000 0.0000 0.0000 0.0000
Off-Road 0.0000 0.0000 0.0000 0.0000 0.0000 0.0000 0.0000 0.0000 0.0000 0.0000 0.0000 0.0000 0.0000 0.0000 0.0000 0.0000
Total 0.0000 0.0000 0.0000 0.0000 0.0000 0.0000 0.0000 0.0000 0.0000 0.0000 0.0000 0.0000 0.0000 0.0000 0.0000 0.0000
Unmitigated Construction On-Site
CalEEMod Version: CalEEMod.2016.3.2 Date: 8/28/2020 12:47 PMPage 9 of 25
Inglewood Transit MSF - South Coast Air Basin, Winter

3.3 Site Preparation - 2024
ROG NOx CO SO2 Fugitive PM10
Exhaust PM10
PM10 Total
Fugitive PM2.5
Exhaust PM2.5
PM2.5 Total
Bio- CO2 NBio- CO2 Total CO2 CH4 N2O CO2e
Category lb/day lb/day
Hauling 0.0000 0.0000 0.0000 0.0000 0.0000 0.0000 0.0000 0.0000 0.0000 0.0000 0.0000 0.0000 0.0000 0.0000 0.0000 0.0000
Vendor 0.0000 0.0000 0.0000 0.0000 0.0000 0.0000 0.0000 0.0000 0.0000 0.0000 0.0000 0.0000 0.0000 0.0000 0.0000 0.0000
Worker 0.0000 0.0000 0.0000 0.0000 0.0000 0.0000 0.0000 0.0000 0.0000 0.0000 0.0000 0.0000 0.0000 0.0000 0.0000 0.0000
Total 0.0000 0.0000 0.0000 0.0000 0.0000 0.0000 0.0000 0.0000 0.0000 0.0000 0.0000 0.0000 0.0000 0.0000 0.0000 0.0000
Unmitigated Construction Off-Site
ROG NOx CO SO2 Fugitive PM10
Exhaust PM10
PM10 Total
Fugitive PM2.5
Exhaust PM2.5
PM2.5 Total
Bio- CO2 NBio- CO2 Total CO2 CH4 N2O CO2e
Category lb/day lb/day
Fugitive Dust 0.0000 0.0000 0.0000 0.0000 0.0000 0.0000 0.0000 0.0000 0.0000 0.0000 0.0000 0.0000 0.0000 0.0000 0.0000 0.0000
Off-Road 0.0000 0.0000 0.0000 0.0000 0.0000 0.0000 0.0000 0.0000 0.0000 0.0000 0.0000 0.0000 0.0000 0.0000 0.0000 0.0000
Total 0.0000 0.0000 0.0000 0.0000 0.0000 0.0000 0.0000 0.0000 0.0000 0.0000 0.0000 0.0000 0.0000 0.0000 0.0000 0.0000
Mitigated Construction On-Site
CalEEMod Version: CalEEMod.2016.3.2 Date: 8/28/2020 12:47 PMPage 10 of 25
Inglewood Transit MSF - South Coast Air Basin, Winter

3.3 Site Preparation - 2024
ROG NOx CO SO2 Fugitive PM10
Exhaust PM10
PM10 Total
Fugitive PM2.5
Exhaust PM2.5
PM2.5 Total
Bio- CO2 NBio- CO2 Total CO2 CH4 N2O CO2e
Category lb/day lb/day
Hauling 0.0000 0.0000 0.0000 0.0000 0.0000 0.0000 0.0000 0.0000 0.0000 0.0000 0.0000 0.0000 0.0000 0.0000 0.0000 0.0000
Vendor 0.0000 0.0000 0.0000 0.0000 0.0000 0.0000 0.0000 0.0000 0.0000 0.0000 0.0000 0.0000 0.0000 0.0000 0.0000 0.0000
Worker 0.0000 0.0000 0.0000 0.0000 0.0000 0.0000 0.0000 0.0000 0.0000 0.0000 0.0000 0.0000 0.0000 0.0000 0.0000 0.0000
Total 0.0000 0.0000 0.0000 0.0000 0.0000 0.0000 0.0000 0.0000 0.0000 0.0000 0.0000 0.0000 0.0000 0.0000 0.0000 0.0000
Mitigated Construction Off-Site
3.4 Grading - 2024
ROG NOx CO SO2 Fugitive PM10
Exhaust PM10
PM10 Total
Fugitive PM2.5
Exhaust PM2.5
PM2.5 Total
Bio- CO2 NBio- CO2 Total CO2 CH4 N2O CO2e
Category lb/day lb/day
Fugitive Dust 0.0000 0.0000 0.0000 0.0000 0.0000 0.0000 0.0000 0.0000 0.0000 0.0000 0.0000 0.0000 0.0000 0.0000 0.0000 0.0000
Off-Road 0.0000 0.0000 0.0000 0.0000 0.0000 0.0000 0.0000 0.0000 0.0000 0.0000 0.0000 0.0000 0.0000 0.0000 0.0000 0.0000
Total 0.0000 0.0000 0.0000 0.0000 0.0000 0.0000 0.0000 0.0000 0.0000 0.0000 0.0000 0.0000 0.0000 0.0000 0.0000 0.0000
Unmitigated Construction On-Site
CalEEMod Version: CalEEMod.2016.3.2 Date: 8/28/2020 12:47 PMPage 11 of 25
Inglewood Transit MSF - South Coast Air Basin, Winter

3.4 Grading - 2024
ROG NOx CO SO2 Fugitive PM10
Exhaust PM10
PM10 Total
Fugitive PM2.5
Exhaust PM2.5
PM2.5 Total
Bio- CO2 NBio- CO2 Total CO2 CH4 N2O CO2e
Category lb/day lb/day
Hauling 0.0000 0.0000 0.0000 0.0000 0.0000 0.0000 0.0000 0.0000 0.0000 0.0000 0.0000 0.0000 0.0000 0.0000 0.0000 0.0000
Vendor 0.0000 0.0000 0.0000 0.0000 0.0000 0.0000 0.0000 0.0000 0.0000 0.0000 0.0000 0.0000 0.0000 0.0000 0.0000 0.0000
Worker 0.0000 0.0000 0.0000 0.0000 0.0000 0.0000 0.0000 0.0000 0.0000 0.0000 0.0000 0.0000 0.0000 0.0000 0.0000 0.0000
Total 0.0000 0.0000 0.0000 0.0000 0.0000 0.0000 0.0000 0.0000 0.0000 0.0000 0.0000 0.0000 0.0000 0.0000 0.0000 0.0000
Unmitigated Construction Off-Site
ROG NOx CO SO2 Fugitive PM10
Exhaust PM10
PM10 Total
Fugitive PM2.5
Exhaust PM2.5
PM2.5 Total
Bio- CO2 NBio- CO2 Total CO2 CH4 N2O CO2e
Category lb/day lb/day
Fugitive Dust 0.0000 0.0000 0.0000 0.0000 0.0000 0.0000 0.0000 0.0000 0.0000 0.0000 0.0000 0.0000 0.0000 0.0000 0.0000 0.0000
Off-Road 0.0000 0.0000 0.0000 0.0000 0.0000 0.0000 0.0000 0.0000 0.0000 0.0000 0.0000 0.0000 0.0000 0.0000 0.0000 0.0000
Total 0.0000 0.0000 0.0000 0.0000 0.0000 0.0000 0.0000 0.0000 0.0000 0.0000 0.0000 0.0000 0.0000 0.0000 0.0000 0.0000
Mitigated Construction On-Site
CalEEMod Version: CalEEMod.2016.3.2 Date: 8/28/2020 12:47 PMPage 12 of 25
Inglewood Transit MSF - South Coast Air Basin, Winter

3.4 Grading - 2024
ROG NOx CO SO2 Fugitive PM10
Exhaust PM10
PM10 Total
Fugitive PM2.5
Exhaust PM2.5
PM2.5 Total
Bio- CO2 NBio- CO2 Total CO2 CH4 N2O CO2e
Category lb/day lb/day
Hauling 0.0000 0.0000 0.0000 0.0000 0.0000 0.0000 0.0000 0.0000 0.0000 0.0000 0.0000 0.0000 0.0000 0.0000 0.0000 0.0000
Vendor 0.0000 0.0000 0.0000 0.0000 0.0000 0.0000 0.0000 0.0000 0.0000 0.0000 0.0000 0.0000 0.0000 0.0000 0.0000 0.0000
Worker 0.0000 0.0000 0.0000 0.0000 0.0000 0.0000 0.0000 0.0000 0.0000 0.0000 0.0000 0.0000 0.0000 0.0000 0.0000 0.0000
Total 0.0000 0.0000 0.0000 0.0000 0.0000 0.0000 0.0000 0.0000 0.0000 0.0000 0.0000 0.0000 0.0000 0.0000 0.0000 0.0000
Mitigated Construction Off-Site
3.5 Building Construction - 2024
ROG NOx CO SO2 Fugitive PM10
Exhaust PM10
PM10 Total
Fugitive PM2.5
Exhaust PM2.5
PM2.5 Total
Bio- CO2 NBio- CO2 Total CO2 CH4 N2O CO2e
Category lb/day lb/day
Off-Road 0.0000 0.0000 0.0000 0.0000 0.0000 0.0000 0.0000 0.0000 0.0000 0.0000 0.0000 0.0000 0.0000 0.0000 0.0000 0.0000
Total 0.0000 0.0000 0.0000 0.0000 0.0000 0.0000 0.0000 0.0000 0.0000 0.0000 0.0000 0.0000 0.0000 0.0000 0.0000 0.0000
Unmitigated Construction On-Site
CalEEMod Version: CalEEMod.2016.3.2 Date: 8/28/2020 12:47 PMPage 13 of 25
Inglewood Transit MSF - South Coast Air Basin, Winter

3.5 Building Construction - 2024
ROG NOx CO SO2 Fugitive PM10
Exhaust PM10
PM10 Total
Fugitive PM2.5
Exhaust PM2.5
PM2.5 Total
Bio- CO2 NBio- CO2 Total CO2 CH4 N2O CO2e
Category lb/day lb/day
Hauling 0.0000 0.0000 0.0000 0.0000 0.0000 0.0000 0.0000 0.0000 0.0000 0.0000 0.0000 0.0000 0.0000 0.0000 0.0000 0.0000
Vendor 0.0000 0.0000 0.0000 0.0000 0.0000 0.0000 0.0000 0.0000 0.0000 0.0000 0.0000 0.0000 0.0000 0.0000 0.0000 0.0000
Worker 0.0000 0.0000 0.0000 0.0000 0.0000 0.0000 0.0000 0.0000 0.0000 0.0000 0.0000 0.0000 0.0000 0.0000 0.0000 0.0000
Total 0.0000 0.0000 0.0000 0.0000 0.0000 0.0000 0.0000 0.0000 0.0000 0.0000 0.0000 0.0000 0.0000 0.0000 0.0000 0.0000
Unmitigated Construction Off-Site
ROG NOx CO SO2 Fugitive PM10
Exhaust PM10
PM10 Total
Fugitive PM2.5
Exhaust PM2.5
PM2.5 Total
Bio- CO2 NBio- CO2 Total CO2 CH4 N2O CO2e
Category lb/day lb/day
Off-Road 0.0000 0.0000 0.0000 0.0000 0.0000 0.0000 0.0000 0.0000 0.0000 0.0000 0.0000 0.0000 0.0000 0.0000 0.0000 0.0000
Total 0.0000 0.0000 0.0000 0.0000 0.0000 0.0000 0.0000 0.0000 0.0000 0.0000 0.0000 0.0000 0.0000 0.0000 0.0000 0.0000
Mitigated Construction On-Site
CalEEMod Version: CalEEMod.2016.3.2 Date: 8/28/2020 12:47 PMPage 14 of 25
Inglewood Transit MSF - South Coast Air Basin, Winter

3.5 Building Construction - 2024
ROG NOx CO SO2 Fugitive PM10
Exhaust PM10
PM10 Total
Fugitive PM2.5
Exhaust PM2.5
PM2.5 Total
Bio- CO2 NBio- CO2 Total CO2 CH4 N2O CO2e
Category lb/day lb/day
Hauling 0.0000 0.0000 0.0000 0.0000 0.0000 0.0000 0.0000 0.0000 0.0000 0.0000 0.0000 0.0000 0.0000 0.0000 0.0000 0.0000
Vendor 0.0000 0.0000 0.0000 0.0000 0.0000 0.0000 0.0000 0.0000 0.0000 0.0000 0.0000 0.0000 0.0000 0.0000 0.0000 0.0000
Worker 0.0000 0.0000 0.0000 0.0000 0.0000 0.0000 0.0000 0.0000 0.0000 0.0000 0.0000 0.0000 0.0000 0.0000 0.0000 0.0000
Total 0.0000 0.0000 0.0000 0.0000 0.0000 0.0000 0.0000 0.0000 0.0000 0.0000 0.0000 0.0000 0.0000 0.0000 0.0000 0.0000
Mitigated Construction Off-Site
3.6 Paving - 2025
ROG NOx CO SO2 Fugitive PM10
Exhaust PM10
PM10 Total
Fugitive PM2.5
Exhaust PM2.5
PM2.5 Total
Bio- CO2 NBio- CO2 Total CO2 CH4 N2O CO2e
Category lb/day lb/day
Off-Road 0.0000 0.0000 0.0000 0.0000 0.0000 0.0000 0.0000 0.0000 0.0000 0.0000 0.0000 0.0000 0.0000 0.0000 0.0000 0.0000
Paving 0.0000 0.0000 0.0000 0.0000 0.0000 0.0000 0.0000 0.0000 0.0000 0.0000 0.0000 0.0000 0.0000 0.0000 0.0000 0.0000
Total 0.0000 0.0000 0.0000 0.0000 0.0000 0.0000 0.0000 0.0000 0.0000 0.0000 0.0000 0.0000 0.0000 0.0000 0.0000 0.0000
Unmitigated Construction On-Site
CalEEMod Version: CalEEMod.2016.3.2 Date: 8/28/2020 12:47 PMPage 15 of 25
Inglewood Transit MSF - South Coast Air Basin, Winter

3.6 Paving - 2025
ROG NOx CO SO2 Fugitive PM10
Exhaust PM10
PM10 Total
Fugitive PM2.5
Exhaust PM2.5
PM2.5 Total
Bio- CO2 NBio- CO2 Total CO2 CH4 N2O CO2e
Category lb/day lb/day
Hauling 0.0000 0.0000 0.0000 0.0000 0.0000 0.0000 0.0000 0.0000 0.0000 0.0000 0.0000 0.0000 0.0000 0.0000 0.0000 0.0000
Vendor 0.0000 0.0000 0.0000 0.0000 0.0000 0.0000 0.0000 0.0000 0.0000 0.0000 0.0000 0.0000 0.0000 0.0000 0.0000 0.0000
Worker 0.0000 0.0000 0.0000 0.0000 0.0000 0.0000 0.0000 0.0000 0.0000 0.0000 0.0000 0.0000 0.0000 0.0000 0.0000 0.0000
Total 0.0000 0.0000 0.0000 0.0000 0.0000 0.0000 0.0000 0.0000 0.0000 0.0000 0.0000 0.0000 0.0000 0.0000 0.0000 0.0000
Unmitigated Construction Off-Site
ROG NOx CO SO2 Fugitive PM10
Exhaust PM10
PM10 Total
Fugitive PM2.5
Exhaust PM2.5
PM2.5 Total
Bio- CO2 NBio- CO2 Total CO2 CH4 N2O CO2e
Category lb/day lb/day
Off-Road 0.0000 0.0000 0.0000 0.0000 0.0000 0.0000 0.0000 0.0000 0.0000 0.0000 0.0000 0.0000 0.0000 0.0000 0.0000 0.0000
Paving 0.0000 0.0000 0.0000 0.0000 0.0000 0.0000 0.0000 0.0000 0.0000 0.0000 0.0000 0.0000 0.0000 0.0000 0.0000 0.0000
Total 0.0000 0.0000 0.0000 0.0000 0.0000 0.0000 0.0000 0.0000 0.0000 0.0000 0.0000 0.0000 0.0000 0.0000 0.0000 0.0000
Mitigated Construction On-Site
CalEEMod Version: CalEEMod.2016.3.2 Date: 8/28/2020 12:47 PMPage 16 of 25
Inglewood Transit MSF - South Coast Air Basin, Winter

3.6 Paving - 2025
ROG NOx CO SO2 Fugitive PM10
Exhaust PM10
PM10 Total
Fugitive PM2.5
Exhaust PM2.5
PM2.5 Total
Bio- CO2 NBio- CO2 Total CO2 CH4 N2O CO2e
Category lb/day lb/day
Hauling 0.0000 0.0000 0.0000 0.0000 0.0000 0.0000 0.0000 0.0000 0.0000 0.0000 0.0000 0.0000 0.0000 0.0000 0.0000 0.0000
Vendor 0.0000 0.0000 0.0000 0.0000 0.0000 0.0000 0.0000 0.0000 0.0000 0.0000 0.0000 0.0000 0.0000 0.0000 0.0000 0.0000
Worker 0.0000 0.0000 0.0000 0.0000 0.0000 0.0000 0.0000 0.0000 0.0000 0.0000 0.0000 0.0000 0.0000 0.0000 0.0000 0.0000
Total 0.0000 0.0000 0.0000 0.0000 0.0000 0.0000 0.0000 0.0000 0.0000 0.0000 0.0000 0.0000 0.0000 0.0000 0.0000 0.0000
Mitigated Construction Off-Site
3.7 Architectural Coating - 2025
ROG NOx CO SO2 Fugitive PM10
Exhaust PM10
PM10 Total
Fugitive PM2.5
Exhaust PM2.5
PM2.5 Total
Bio- CO2 NBio- CO2 Total CO2 CH4 N2O CO2e
Category lb/day lb/day
Archit. Coating 0.0000 0.0000 0.0000 0.0000 0.0000 0.0000 0.0000 0.0000 0.0000 0.0000 0.0000 0.0000 0.0000 0.0000 0.0000 0.0000
Off-Road 0.0000 0.0000 0.0000 0.0000 0.0000 0.0000 0.0000 0.0000 0.0000 0.0000 0.0000 0.0000 0.0000 0.0000 0.0000 0.0000
Total 0.0000 0.0000 0.0000 0.0000 0.0000 0.0000 0.0000 0.0000 0.0000 0.0000 0.0000 0.0000 0.0000 0.0000 0.0000 0.0000
Unmitigated Construction On-Site
CalEEMod Version: CalEEMod.2016.3.2 Date: 8/28/2020 12:47 PMPage 17 of 25
Inglewood Transit MSF - South Coast Air Basin, Winter

3.7 Architectural Coating - 2025
ROG NOx CO SO2 Fugitive PM10
Exhaust PM10
PM10 Total
Fugitive PM2.5
Exhaust PM2.5
PM2.5 Total
Bio- CO2 NBio- CO2 Total CO2 CH4 N2O CO2e
Category lb/day lb/day
Hauling 0.0000 0.0000 0.0000 0.0000 0.0000 0.0000 0.0000 0.0000 0.0000 0.0000 0.0000 0.0000 0.0000 0.0000 0.0000 0.0000
Vendor 0.0000 0.0000 0.0000 0.0000 0.0000 0.0000 0.0000 0.0000 0.0000 0.0000 0.0000 0.0000 0.0000 0.0000 0.0000 0.0000
Worker 0.0000 0.0000 0.0000 0.0000 0.0000 0.0000 0.0000 0.0000 0.0000 0.0000 0.0000 0.0000 0.0000 0.0000 0.0000 0.0000
Total 0.0000 0.0000 0.0000 0.0000 0.0000 0.0000 0.0000 0.0000 0.0000 0.0000 0.0000 0.0000 0.0000 0.0000 0.0000 0.0000
Unmitigated Construction Off-Site
ROG NOx CO SO2 Fugitive PM10
Exhaust PM10
PM10 Total
Fugitive PM2.5
Exhaust PM2.5
PM2.5 Total
Bio- CO2 NBio- CO2 Total CO2 CH4 N2O CO2e
Category lb/day lb/day
Archit. Coating 0.0000 0.0000 0.0000 0.0000 0.0000 0.0000 0.0000 0.0000 0.0000 0.0000 0.0000 0.0000 0.0000 0.0000 0.0000 0.0000
Off-Road 0.0000 0.0000 0.0000 0.0000 0.0000 0.0000 0.0000 0.0000 0.0000 0.0000 0.0000 0.0000 0.0000 0.0000 0.0000 0.0000
Total 0.0000 0.0000 0.0000 0.0000 0.0000 0.0000 0.0000 0.0000 0.0000 0.0000 0.0000 0.0000 0.0000 0.0000 0.0000 0.0000
Mitigated Construction On-Site
CalEEMod Version: CalEEMod.2016.3.2 Date: 8/28/2020 12:47 PMPage 18 of 25
Inglewood Transit MSF - South Coast Air Basin, Winter

4.0 Operational Detail - Mobile
4.1 Mitigation Measures Mobile
3.7 Architectural Coating - 2025
ROG NOx CO SO2 Fugitive PM10
Exhaust PM10
PM10 Total
Fugitive PM2.5
Exhaust PM2.5
PM2.5 Total
Bio- CO2 NBio- CO2 Total CO2 CH4 N2O CO2e
Category lb/day lb/day
Hauling 0.0000 0.0000 0.0000 0.0000 0.0000 0.0000 0.0000 0.0000 0.0000 0.0000 0.0000 0.0000 0.0000 0.0000 0.0000 0.0000
Vendor 0.0000 0.0000 0.0000 0.0000 0.0000 0.0000 0.0000 0.0000 0.0000 0.0000 0.0000 0.0000 0.0000 0.0000 0.0000 0.0000
Worker 0.0000 0.0000 0.0000 0.0000 0.0000 0.0000 0.0000 0.0000 0.0000 0.0000 0.0000 0.0000 0.0000 0.0000 0.0000 0.0000
Total 0.0000 0.0000 0.0000 0.0000 0.0000 0.0000 0.0000 0.0000 0.0000 0.0000 0.0000 0.0000 0.0000 0.0000 0.0000 0.0000
Mitigated Construction Off-Site
CalEEMod Version: CalEEMod.2016.3.2 Date: 8/28/2020 12:47 PMPage 19 of 25
Inglewood Transit MSF - South Coast Air Basin, Winter

ROG NOx CO SO2 Fugitive PM10
Exhaust PM10
PM10 Total
Fugitive PM2.5
Exhaust PM2.5
PM2.5 Total
Bio- CO2 NBio- CO2 Total CO2 CH4 N2O CO2e
Category lb/day lb/day
Mitigated 0.0000 0.0000 0.0000 0.0000 0.0000 0.0000 0.0000 0.0000 0.0000 0.0000 0.0000 0.0000 0.0000 0.0000
Unmitigated 0.0000 0.0000 0.0000 0.0000 0.0000 0.0000 0.0000 0.0000 0.0000 0.0000 0.0000 0.0000 0.0000 0.0000
4.2 Trip Summary Information
4.3 Trip Type Information
Average Daily Trip Rate Unmitigated Mitigated
Land Use Weekday Saturday Sunday Annual VMT Annual VMT
Arena 0.00 0.00 0.00
General Light Industry 0.00 0.00 0.00
Parking Lot 0.00 0.00 0.00
Total 0.00 0.00 0.00
Miles Trip % Trip Purpose %
Land Use H-W or C-W H-S or C-C H-O or C-NW H-W or C-W H-S or C-C H-O or C-NW Primary Diverted Pass-by
Arena 16.60 8.40 6.90 0.00 81.00 19.00 66 28 6
General Light Industry 16.60 8.40 6.90 59.00 28.00 13.00 92 5 3
Parking Lot 16.60 8.40 6.90 0.00 0.00 0.00 0 0 0
4.4 Fleet Mix
CalEEMod Version: CalEEMod.2016.3.2 Date: 8/28/2020 12:47 PMPage 20 of 25
Inglewood Transit MSF - South Coast Air Basin, Winter

5.0 Energy Detail
ROG NOx CO SO2 Fugitive PM10
Exhaust PM10
PM10 Total
Fugitive PM2.5
Exhaust PM2.5
PM2.5 Total
Bio- CO2 NBio- CO2 Total CO2 CH4 N2O CO2e
Category lb/day lb/day
NaturalGas Mitigated
0.0630 0.5726 0.4810 3.4400e-003
0.0435 0.0435 0.0435 0.0435 687.1233 687.1233 0.0132 0.0126 691.2065
NaturalGas Unmitigated
0.0630 0.5726 0.4810 3.4400e-003
0.0435 0.0435 0.0435 0.0435 687.1233 687.1233 0.0132 0.0126 691.2065
5.1 Mitigation Measures Energy
Land Use LDA LDT1 LDT2 MDV LHD1 LHD2 MHD HHD OBUS UBUS MCY SBUS MH
Arena 0.554129 0.042164 0.205182 0.113554 0.013848 0.005806 0.021992 0.033191 0.002140 0.001609 0.004858 0.000715 0.000811
General Light Industry 0.554129 0.042164 0.205182 0.113554 0.013848 0.005806 0.021992 0.033191 0.002140 0.001609 0.004858 0.000715 0.000811
Parking Lot 0.554129 0.042164 0.205182 0.113554 0.013848 0.005806 0.021992 0.033191 0.002140 0.001609 0.004858 0.000715 0.000811
Historical Energy Use: N
CalEEMod Version: CalEEMod.2016.3.2 Date: 8/28/2020 12:47 PMPage 21 of 25
Inglewood Transit MSF - South Coast Air Basin, Winter

6.0 Area Detail
5.2 Energy by Land Use - NaturalGas
NaturalGas Use
ROG NOx CO SO2 Fugitive PM10
Exhaust PM10
PM10 Total
Fugitive PM2.5
Exhaust PM2.5
PM2.5 Total
Bio- CO2 NBio- CO2 Total CO2 CH4 N2O CO2e
Land Use kBTU/yr lb/day lb/day
Arena 1374.25 0.0148 0.1347 0.1132 8.1000e-004
0.0102 0.0102 0.0102 0.0102 161.6761 161.6761 3.1000e-003
2.9600e-003
162.6368
General Light Industry
4466.3 0.0482 0.4379 0.3678 2.6300e-003
0.0333 0.0333 0.0333 0.0333 525.4472 525.4472 0.0101 9.6300e-003
528.5697
Parking Lot 0 0.0000 0.0000 0.0000 0.0000 0.0000 0.0000 0.0000 0.0000 0.0000 0.0000 0.0000 0.0000 0.0000
Total 0.0630 0.5726 0.4810 3.4400e-003
0.0435 0.0435 0.0435 0.0435 687.1233 687.1233 0.0132 0.0126 691.2065
Unmitigated
NaturalGas Use
ROG NOx CO SO2 Fugitive PM10
Exhaust PM10
PM10 Total
Fugitive PM2.5
Exhaust PM2.5
PM2.5 Total
Bio- CO2 NBio- CO2 Total CO2 CH4 N2O CO2e
Land Use kBTU/yr lb/day lb/day
Arena 1.37425 0.0148 0.1347 0.1132 8.1000e-004
0.0102 0.0102 0.0102 0.0102 161.6761 161.6761 3.1000e-003
2.9600e-003
162.6368
General Light Industry
4.4663 0.0482 0.4379 0.3678 2.6300e-003
0.0333 0.0333 0.0333 0.0333 525.4472 525.4472 0.0101 9.6300e-003
528.5697
Parking Lot 0 0.0000 0.0000 0.0000 0.0000 0.0000 0.0000 0.0000 0.0000 0.0000 0.0000 0.0000 0.0000 0.0000
Total 0.0630 0.5726 0.4810 3.4400e-003
0.0435 0.0435 0.0435 0.0435 687.1233 687.1233 0.0132 0.0126 691.2065
Mitigated
CalEEMod Version: CalEEMod.2016.3.2 Date: 8/28/2020 12:47 PMPage 22 of 25
Inglewood Transit MSF - South Coast Air Basin, Winter

6.1 Mitigation Measures Area
6.0 Area Detail
ROG NOx CO SO2 Fugitive PM10
Exhaust PM10
PM10 Total
Fugitive PM2.5
Exhaust PM2.5
PM2.5 Total
Bio- CO2 NBio- CO2 Total CO2 CH4 N2O CO2e
Category lb/day lb/day
Mitigated 2.3341 3.7000e-004
0.0409 0.0000 1.5000e-004
1.5000e-004
1.5000e-004
1.5000e-004
0.0880 0.0880 2.3000e-004
0.0937
Unmitigated 2.3341 3.7000e-004
0.0409 0.0000 1.5000e-004
1.5000e-004
1.5000e-004
1.5000e-004
0.0880 0.0880 2.3000e-004
0.0937
6.2 Area by SubCategory
ROG NOx CO SO2 Fugitive PM10
Exhaust PM10
PM10 Total
Fugitive PM2.5
Exhaust PM2.5
PM2.5 Total
Bio- CO2 NBio- CO2 Total CO2 CH4 N2O CO2e
SubCategory lb/day lb/day
Architectural Coating
0.2682 0.0000 0.0000 0.0000 0.0000 0.0000 0.0000
Consumer Products
2.0621 0.0000 0.0000 0.0000 0.0000 0.0000 0.0000
Landscaping 3.7700e-003
3.7000e-004
0.0409 0.0000 1.5000e-004
1.5000e-004
1.5000e-004
1.5000e-004
0.0880 0.0880 2.3000e-004
0.0937
Total 2.3341 3.7000e-004
0.0409 0.0000 1.5000e-004
1.5000e-004
1.5000e-004
1.5000e-004
0.0880 0.0880 2.3000e-004
0.0937
Unmitigated
CalEEMod Version: CalEEMod.2016.3.2 Date: 8/28/2020 12:47 PMPage 23 of 25
Inglewood Transit MSF - South Coast Air Basin, Winter

8.1 Mitigation Measures Waste
7.1 Mitigation Measures Water
7.0 Water Detail
8.0 Waste Detail
6.2 Area by SubCategory
ROG NOx CO SO2 Fugitive PM10
Exhaust PM10
PM10 Total
Fugitive PM2.5
Exhaust PM2.5
PM2.5 Total
Bio- CO2 NBio- CO2 Total CO2 CH4 N2O CO2e
SubCategory lb/day lb/day
Architectural Coating
0.2682 0.0000 0.0000 0.0000 0.0000 0.0000 0.0000
Consumer Products
2.0621 0.0000 0.0000 0.0000 0.0000 0.0000 0.0000
Landscaping 3.7700e-003
3.7000e-004
0.0409 0.0000 1.5000e-004
1.5000e-004
1.5000e-004
1.5000e-004
0.0880 0.0880 2.3000e-004
0.0937
Total 2.3341 3.7000e-004
0.0409 0.0000 1.5000e-004
1.5000e-004
1.5000e-004
1.5000e-004
0.0880 0.0880 2.3000e-004
0.0937
Mitigated
9.0 Operational Offroad
Equipment Type Number Hours/Day Days/Year Horse Power Load Factor Fuel Type
10.0 Stationary Equipment
Fire Pumps and Emergency Generators
CalEEMod Version: CalEEMod.2016.3.2 Date: 8/28/2020 12:47 PMPage 24 of 25
Inglewood Transit MSF - South Coast Air Basin, Winter

11.0 Vegetation
Equipment Type Number Hours/Day Hours/Year Horse Power Load Factor Fuel Type
Boilers
Equipment Type Number Heat Input/Day Heat Input/Year Boiler Rating Fuel Type
User Defined Equipment
Equipment Type Number
CalEEMod Version: CalEEMod.2016.3.2 Date: 8/28/2020 12:47 PMPage 25 of 25
Inglewood Transit MSF - South Coast Air Basin, Winter


