21
Half-Year Report 201 9 BUILDING BETTER FUTURES

Half-Year Report
2019BUILDING BETTER FUTURES

Appendix 4D
Half-Year Report
1 | P a g e
Results for announcement to the market
This information should be read in conjunction with the 2018 Annual Financial Report of Ambition Group Limited and its controlled entities and any public announcements made in the period on the ASX in accordance with the continuous disclosure requirements of the Corporations Act 2001 and Listing Rules.
Half-Year Ending 30 June 2019
Previous corresponding period is half-year ended 30 June 2018.
The consolidated entity has adopted Accounting Standard AASB 16 ‘Leases’ for the half-year ended 30 June 2019 using the modified retrospective approach and as such the comparatives have not been restated.
% change $,000
Revenue from ordinary activities Down 5 % to 53,209
Profit from ordinary activities after tax for the period Down 592% to (579)
Net Profit attributable to members Down 318% to (457)
Cents Cents 2019 2018
Basic earnings per share (0.68) 0.31
Net tangible assets per share 15.02 17.70
Net assets per share
2019 represents the current period ended 30 June 2019 2018 represents the previous corresponding period
15.57 18.29
Dividends
The Directors have declared that there will be no interim dividend for 2019.
Comments
AASB 16 ‘Leases’ had a significant impact on the current period. The current profit before income tax expense was reduced by $59k. This included an increased depreciation and amortisation expense of $1,384k and increased finance costs of $296k, offset by a reduction in rental expense and operating leases of $1,621k. As at 30 June 2019, net current assets were reduced by $2,267k (attributable to current lease liabilities) and net assets were reduced by $718k (attributable to right-of-use assets, lease liabilities and deferred tax assets).

Appendix 4D
Half-Year Report
2 | P a g e
Operational Review
The first six months of 2019 saw continued success for our international operations, with revenue and profit growing. Over 45% of top line revenue is now generated from outside of Australia, specifically Asia and the UK.
In Australia, we have made a number of leadership appointments that we feel will have a positive effect in driving the local business to achieve acceptable results. This process has taken somewhat longer than was expected but progress is underway.
Review of Revenue, Net Fee Income and Net loss for the period
AASB 16 was adopted using the modified retrospective approach and as such the comparatives have not been restated. Therefore, the current and comparative EBITDA are not directly comparable.
Asia
In Asia, our office network performed in-line with expectations, with revenue and profit growing. We are well-positioned to take long-term advantage of the economic growth in the region.
The Ambition brand is high profile in our chosen market segments, and this plays an important role not only with clients and candidates, but also in attracting and retaining high performing staff.
Operating profit from our Asian offices rose to $888k, from $719k in 2018 which is 23% growth.
The UK
In the UK, benefitting from long-term work building a strong and focused market position, profit in London grew to $489k, from $484k in 2018.
We are recognised as one of the key players in recruitment for professional services firms, including lawyers, accountants, consultancies, property specialists, etc. We enjoy consistent levels of repeat business from our clients especially for roles in accounting/finance and marketing/business development.
Australia
In Australia, whilst the bottom-line contribution was disappointing, we are pleased with our client mix, that comprises a good balance between enterprise accounts and SMEs.
As mentioned, we have appointed some excellent people over recent months and believe we have the right balance between new business expertise and execution/account management
$’000 2019 30 June
2018 30 June
Revenue 53,209 55,727
Net Fee Income 21,597 20,590
Net Fee Income % 40.6% 36.9%
Loss Before Tax (425) (6)
Net profit/(loss) for the period (579) 118
Appendix 4D
Half-Year Report
3 | P a g e
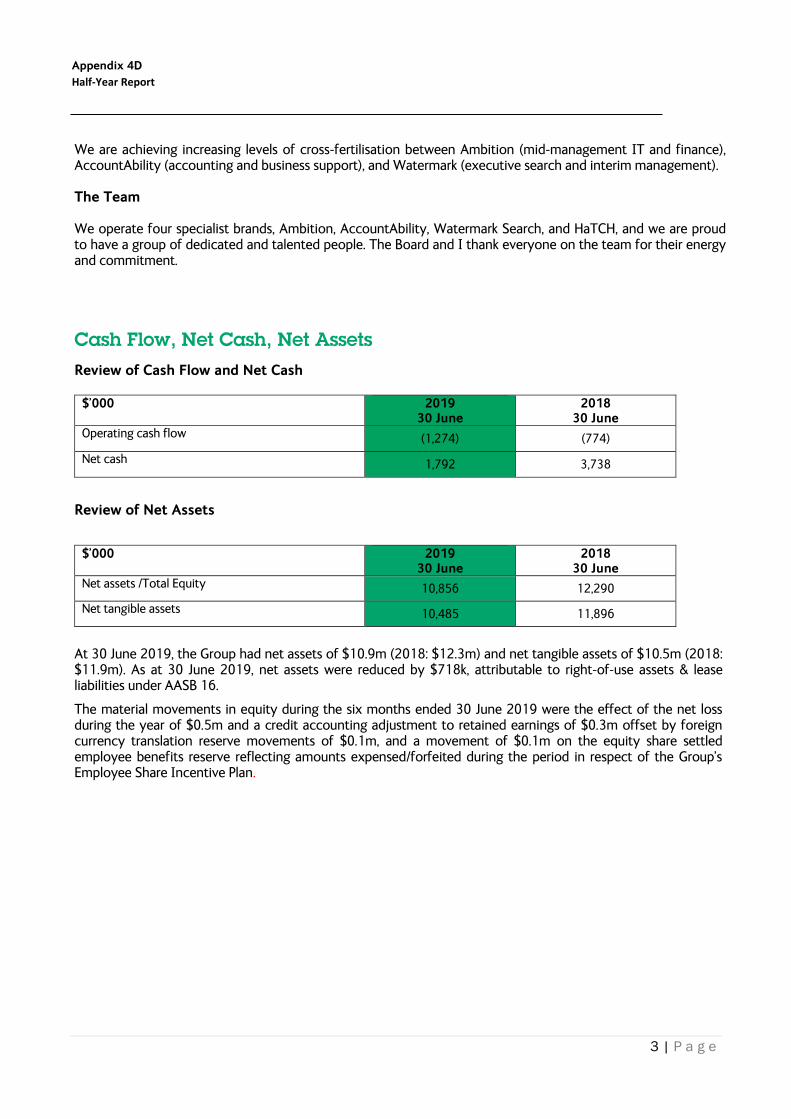
Cash Flow, Net Cash, Net Assets
Review of Cash Flow and Net Cash
$’000 2019 30 June
2018 30 June
Operating cash flow (1,274) (774)
Net cash 1,792 3,738
Review of Net Assets
$’000 2019 30 June
2018 30 June
Net assets /Total Equity 10,856 12,290
Net tangible assets 10,485 11,896
At 30 June 2019, the Group had net assets of $10.9m (2018: $12.3m) and net tangible assets of $10.5m (2018: $11.9m). As at 30 June 2019, net assets were reduced by $718k, attributable to right-of-use assets & lease liabilities under AASB 16.
The material movements in equity during the six months ended 30 June 2019 were the effect of the net loss during the year of $0.5m and a credit accounting adjustment to retained earnings of $0.3m offset by foreign currency translation reserve movements of $0.1m, and a movement of $0.1m on the equity share settled employee benefits reserve reflecting amounts expensed/forfeited during the period in respect of the Group’s Employee Share Incentive Plan.
We are achieving increasing levels of cross-fertilisation between Ambition (mid-management IT and finance), AccountAbility (accounting and business support), and Watermark (executive search and interim management).
The Team
We operate four specialist brands, Ambition, AccountAbility, Watermark Search, and HaTCH, and we are proud to have a group of dedicated and talented people. The Board and I thank everyone on the team for their energy and commitment.

Ambition Group Limited Appendix 4D: Half-Year Report For the half-year ended 30 June 2019
4 | P a g e
Directors’ Report
The Directors of Ambition Group Limited (the Company) are pleased to submit the financial report of the Company and its subsidiaries (the Group) for the half-year ended 30 June 2019. In order to comply with the provisions of the Corporations Act 2001, the Directors report as follows:
Directors
The names of the Directors of the Company during or since the end of the half-year are:
Mr Nick Waterworth Mr Paul Young Ms Deborah Hadwen Professor Richard Petty
Principal Activities
The Group is in the business of recruitment consultancy, generating revenue from permanent and contracting placements as well as a small number of ancillary services.
Review of Operations
Revenue decreased by 4.5% from $55.7m to $53.2m in the previous corresponding period. However net fee income (NFI) increased 4.9% from $20.6m to $21.6m with the NFI margin (NFI/Revenue) up to 40.6% from 36.9% over the same period, due to a combination of NFI decline in Australia (17%) and improved focus on margin globally.
AASB 16 ‘Leases’ had a significant impact on the current period. The current profit before income tax expense was reduced by $59k. This included an increased depreciation and amortisation expense of $1,384k and increased finance costs of $296k, offset by a reduction in rental expense and operating leases of $1,621k. As at 30 June 2019, net current assets were reduced by $2,267k (attributable to current lease liabilities) and net assets were reduced by $718k (attributable to right-of-use assets, lease liabilities and deferred tax assets).
Earnings before interest, tax, depreciation and amortisation (EBITDA) increased by 245% from $0.5m to $1.6m. On a comparable basis, without AASB 16 in place, EBITDA would have decreased from $460k to $18k loss.
Profits from the Australian operations decreased to ($0.8m), and the Asian operations moved from a profit of $0.7m in the prior period to a profit of $0.9m. Profit in the UK operations is consistent with the prior period at $0.5m.
The loss after tax attributable to shareholders for the period was ($0.5m), (2018: profit of $0.2m).
The Directors’ Operational Review in the preceding section gives further detail on the performance in this period.
The Directors have declared that there will be no interim dividend for 2019 (30 June 2018: nil).
Auditor’s Independence Declaration
The auditor’s independence declaration is included on page 6 of the half-year report.
Ambition Group Limited Appendix 4D: Half-Year Report For the half-year ended 30 June 2019
5 | P a g e
Rounding-off of amounts
The Company is a company of the kind referred to in ASIC Corporations (Rounding in Financial/Directors’ Reports) Instrument 2016/191, and in accordance with that Class Order amounts in the Directors’ report and the half-year financial report are rounded off to the nearest thousand dollars, unless otherwise indicated.
Signed in accordance with a resolution of Directors made pursuant to s.306(3) of the Corporations Act 2001.
On behalf of the Directors
Paul Young Director
Nick Waterworth Executive Chairman
21st August 2019

6 | P a g e
AUDITOR’S INDEPENDENCE DECLARATION As lead auditor for the review of the financial report of Ambition Group Limited for the half year ended 30 June 2019, I declare that, to the best of my knowledge and belief, there have been no contraventions of:
(i) the auditor independence requirements of the Corporations Act 2001 in relation to the review; and
(ii) any applicable code of professional conduct in relation to the review. RSM AUSTRALIA PARTNERS David Talbot Partner Sydney, NSW Dated: 21 August 2019
Ambition Group Limited Appendix 4D: Half-Year Report For the half-year ended 30 June 2019
7 | P a g e
Directors’ declaration
The Directors declare that :
a) in the Directors' opinion, the attached financial statements and notes comply with theCorporations Act 2001, Australian Accounting Standard AASB 134 ‘Interim FinancialReporting’, the Corporations Regulations 2001 and other mandatory professionalreporting requirements;
b) in the Directors’ opinion, there are reasonable grounds to believe that the Company willbe able to pay its debts as and when they become due and payable; and
c) in the Directors’ opinion, the attached financial statements and notes thereto give atrue and fair view of the consolidated entity’s financial position as at 30 June 2019 andof its performance for the financial half-year ended on that date.
Signed in accordance with a resolution of the Directors made pursuant to s.303(5)(a) of the Corporations Act 2001.
On behalf of the Directors
Paul Young Director
Nick Waterworth Executive Chairman
21st August 2019

Ambition Group Limited Appendix 4D: Half-Year Report For the half-year ended 30 June 2019
8 | P a g e
Condensed consolidated statement of profit or loss for the half-year ended 30 June 2019
Consolidated
Half-year ended
30 June 2019 30 June 2018
Continuing Operations $’000 $’000
Revenue 53,209 55,727
On-hired labour costs (31,612) (35,137)
Net Fee Income 21,597 20,590
Investment income 15 11
Employee benefits expense (15,673) (15,081)
Indirect employment costs (559) (376)
Payroll tax (296) (345)
Depreciation and amortisation expense (1,626) (404)
Finance costs (402) (73)
Advertising and marketing (677) (531)
Computer expenses (523) (633)
Rental expense on operating leases (239) (1,477)
Other expenses (2,042) (1,687)
(Loss) before tax (425) (6)
Income tax benefit/ (expense) (154) 124
Profit/ (Loss) for the period (579) 118
Attributable to: Owners of the parent (457) 209Non-controlling interests (122) (92)
Earnings per share
Basic (cents per share) (0.68) 0.31
Diluted (cents per share) (0.68) 0.29
Condensed consolidated statement of other comprehensive income for the half-year ended 30 June 2019
Consolidated
Half-year ended
30 June 2019 30 June 2018
$’000 $’000
Profit for the period (579) 118
Other comprehensive income:
Items that may be reclassified subsequently to profit or loss
Exchange difference on translation of foreign operations 49 390
Total comprehensive income/ (loss) for the period (530) 508
Total comprehensive income/ (loss) attributable to:
Owners of the parent (402) 650
Non-controlling interests (128) (142)
(530) 508
Notes to the condensed consolidated financial statements are included on pages 12 to 14.

Ambition Group Limited Appendix 4D: Half-Year Report For the half-year ended 30 June 2019
9 | P a g e
Condensed consolidated statement of financial position as at 30 June 2019
Consolidated
30 June 2019 31 Dec 2018
Current assets Note $’000 $’000
Cash and cash equivalents 1,792 3,942
Trade and other receivables 18,756 16,341
Current tax assets 121 151
Other current assets 2,300 2,242
Total current assets 22,969 22,676
Non-current assets
Property, plant and equipment 287 713
Right of use assets 9 5,374 -
Intangible assets 371 353
Deferred tax assets 1,129 1,177
Total non-current assets 7,161 2,243
Total assets 30,130 24,919
Current liabilities
Trade and other payables 10,567 10,400
Current tax liabilities 346 224
Borrowings 455 226
Lease liabilities 10 2,109 -
Provisions 1,029 1,096
Total current liabilities 14,506 11,946
Non-current liabilities
Provisions 840 998
Lease liabilities 11 3,527 -
Deferred tax liabilities 401 401
Total non-current liabilities 4,768 1,399
Total liabilities 19,274 13,345
Net assets 10,856 11,574
Equity
Issued capital 5 13,213 13,213
Reserves (2,369) (2,483)
Retained earnings 1,123 1,827
Non-controlling interest (1,111) (983)
Total equity 10,856 11,574
Notes to the condensed consolidated financial statements are included on pages 12 to 14

Ambition Group Limited Appendix 4D: Half-Year Report For the half-year ended 30 June 2019
10 | P a g e
Condensed consolidated statement of changes in equity for the half-year ended 30 June 2019
Issued Capital
Retained Earnings
Foreign Currency Translation
Reserve
Equity Settled Employee Benefits
Reserve
Attributable to owners of
the parent
Non-controlling
interest Total
$’000 $’000 $’000 $’000 $’000 $’000 $’000
Balance as at 1 January 2018 12,977 2,653 (3,330) 302 12,602 (758) 11,844
Adjustment for change in accounting policy - (259) - - - - (259)
Balance as at 1 January 2018 - restated 12,977 2,394 (3,330) 302 12,602 (758) 11,585
Profit / (Loss) for the period - 209 - - 209 (91) 118
Other comprehensive income for the period - - 440 - 440 (50) 390
Total comprehensive income for the period - 209 440 - 610 (141) 508
Payment of dividends - - - - - - -
Recognition of share-based payments - - - (63) (63) - (63)
Vesting of employee share schemes 236 - - (236) - - -
Balance as at 30 June 2018 13,213 2,603 (2,890) 3 13,188 (899) 12,289
Balance as at 1 January 2019 13,213 1,827 (2,493) 10 12,557 (983) 11,574Adjustment for change in accounting policy (note 8) - (247) - - (247) - (247)
Balance as at 1 January 2019 - restated 13,213 1,580 (2,493) 10 12,310 (983) 11,327
Profit / (Loss) for the period - (457) - - (457) (122) (579)
Other comprehensive income for the period - - 55 - 55 (6) 49
Total comprehensive income for the period - (457) 55 - (402) (128) (530)
Payment of dividends - - - - - - -
Recognition of share-based payments - - - 59 59 - 59
Vesting of employee share schemes - - - - - - -
Balance as at 30 June 2019 13,213 1,123 (2,438) 69 11,967 (1,111) 10,856
Notes to the condensed consolidated financial statements are included on pages 12 to 14.

Ambition Group Limited Appendix 4D: Half-Year Report For the half-year ended 30 June 2019
11 | P a g e
Condensed consolidated statement of cash flows
for the half-year ended 30 June 2019
Consolidated
Half-year ended
30 June 2019 30 June 2018
$’000 $’000 Cash flows from operating activities
Receipts from customers 50,822 56,658
Payments to suppliers and employees (51,694) (57,321)
Cash used in operations (872) (663)
Interest paid (402) (73)
Income tax refund / (paid) - (38)
Net cash used in operating activities (1,274) (774)
Cash flows from investing activities
Payment for property, plant and equipment (32) (52)
Interest Income 15 11
Payment for intangible assets (65) (9)
Proceeds from disposal of property, plant and equipment 18 1
Net cash used in investing activities (64) (49)
Cash flows from financing activities
Repayment of lease liabilities (1,624) -
Loan - 2,033
Credit Facility 455 (1,042)
Net cash used in financing activities (1,169) 991
Net decrease in cash and cash equivalents (2,507) 168
Cash and cash equivalents at the beginning of the period 3,942 3,215 Effect of exchange rate changes on the balance of cash held in foreign currencies 357 355
Cash and cash equivalents at the end of the period 1,792 3,738
Notes to the condensed consolidated financial statements are included on pages 12 to 14.

12 | P a g e
Notes to the condensed consolidated financial statements
1. Significant accounting policies
(a) Statement of compliance
The half-year financial report is a general purpose financial report prepared in accordance with the Corporations Act 2001 and AASB 134 ‘Interim Financial Reporting’. Compliance with AASB 134 ensures compliance with International Financial Reporting Standard IAS 34 ‘Interim Financial Reporting’. The half-year report does not include notes of the type normally included in an annual financial report and shall be read in conjunction with the most recent annual financial report.
(b) Basis of preparation
For preparing the condensed consolidated financial statements the Company is a for-profit entity.
The condensed consolidated financial statements have been prepared on the basis of historical cost, except for the revaluation of certain non-current assets and financial instruments. Cost is based on the fair values of the consideration given in exchange for assets. All amounts are presented in Australian dollars, unless otherwise noted.
The company is a company of the kind referred to in ASIC Corporations (Rounding in Financial/Directors’ Reports) Instrument 2016/191 and in accordance with that Class Order amounts in the directors’ report and the half-year financial report are rounded off to the nearest thousand dollars, unless otherwise indicated.
The accounting policies and methods of computation adopted in the preparation of the half-year financial report are consistent with those adopted and disclosed in the company’s 2018 annual financial report for the financial year ended 31 December 2018, except for the impact of the Standards and Interpretations described below. These accounting policies are consistent with Australian Accounting Standards and with International Financial Reporting Standards.
The Group has adopted all of the new and revised Standards and Interpretations issued by the Australian Accounting Standards Board (the AASB) that are relevant to their operations and effective for the current half-year, in particular AASB 16 which came into effect from 1 January 2019. See note 8.
2. Segment information
AASB 8 requires operating segments to be identified on the basis of internal reports about components of the Group that are regularly reviewed by the chief operating decision maker in order to allocate resources to the segment and to assess its performance.
Information reported to the Group’s Executive Chairman for the purposes of resource allocation and assessment of performance is focused on the geographic segments the business operates in.

13 | P a g e
• Australia• Asia• UK• Group
There have been no changes in the basis of segmentation or basis of segmental profit or loss since the previous financial report. Information regarding these segments is presented below. The accounting policies of the reportable segments are the same as the Group’s accounting policies.
Revenue Segment profit / (loss)
Half-year ended Half-year ended
30 June 2019 30 June 2018 30 June 2019 30 June 2018
$’000 $’000 $’000 $’000
28,656 36,523 (794) (406)19,667 14,732 888 719
4,886 4,472 489 484
53,209 55,727 583 797
15 11 (1,023) (814)
(425) (6)
(154) 125
Continuing operations Australia Asia UK
Investment income Corporate Overhead Unalocated
Profit / (loss) before tax
Income tax benefit / (expense)
Consolidated segment revenue and profit / (loss) for the period
53,209 55,727 (579) 118
The revenue reported above represents revenue generated from external customers. There were no intersegment sales during the period.
3. Net tangible assets
Net tangible asset backing per ordinary share at 30 June 2019 was 15.02 cents per share (30 June 2018: 17.70 cents per share).
4. Events subsequent to reporting date
There are no events subsequent to the report date of which we are aware that would have a material impact on this report.
5. Issuances of Equity Securities
Issued capital at 30 June 2019 amounted to $13,213,000 (67,348,247 ordinary shares). As at 30 June 2018: $13,213,000 (67,348,247 ordinary shares).
The Group issued nil share options (30 June 2018: nil) over ordinary shares under its executive share option plan during the half-year reporting period.
2. Segment information (continued)
The Group's reportable segments under AASB are as follows
14 | P a g e
6. Key Management Personnel
The remuneration arrangements for key management personnel is disclosed in the annual financial report.
7. Dividends
The Directors have not reported an interim dividend for 2019 (30 June 2018: nil).
8. Change in accounting policies
AASB 16 Leases
The consolidated entity has adopted AASB 16 from 1 January 2019. The standard replaces AASB 117 ‘Leases’ and for lessees eliminates the classifications of operating leases and finance leases. Except for short-term leases and leases of low-value assets, right-of-use assets and corresponding lease liabilities are recognized in the statement of financial position. Straight-line operating lease expense recognition is replaced with a depreciation charge for the right of-use assets (included in operating costs) and an interest expense on the recognized lease liabilities (included in finance costs). In the earlier period of the lease, the expenses associated with the lease under AASB 16 will be higher when compared to lease expenses under AASB 117. However, EBITDA (Earnings Before Interest, Tax, Depreciation and Amortisation) results improve as the operating expense in now replaced by interest expense and depreciation in profit and loss. For classification within the statement of cash flows, the interest portion is disclosed in operating activities and the principal portion of the lease payments are separately disclosed in financing activities. For lessor accounting, the standard does not substantially change how a lessor accounts for leases.
Right-of-use assets
A right-of-use asset is recognized at the commencement date of a lease. The right-of-use asset is measured at cost, which comprises the initial amount of the lease liability, adjusted for, as applicable, any lease payments made at or before the commencement date net of any lease incentives received, any initial direct costs incurred, and, except where included in the cost of inventories, an estimate of costs expected to be incurred for dismantling and removing the underlying asset, and restoring the site or asset.
Right-of-use assets are depreciated on a straight-line basis over the unexpired period of the lease or the estimated useful life of the asset, whichever is the shorter. Where the consolidated entity expects to obtain ownership of the leased asset at the end of the lease term, the depreciation is over its estimated useful life. Right-of-use assets are subject to impairment or adjusted for any remeasurement of lease liabilities.
The consolidated entity has elected not to recognize a right-of-use asset and corresponding lease liability for short-term leases with terms of 12 months or less and leases of low-value assets. Lease payments on these assets are expensed to profit or loss as incurred.
Lease Liabilities
A lease liability is recognized at the commencement date of a lease. The lease liability is initially recognized at the present value of the lease payments to be made over the term of the lease, discounted using the interest rate implicit in the lease or, if that rate cannot be readily determined, the consolidated entity’s incremental borrowing rate. Lease payments comprise of fixed payments less any lease incentives receivable, variable lease payments that depend on an index or a rate, amounts expected to be paid under residual value guarantees, exercise price of a purchase option when the exercise of the option is reasonably certain to occur, and any anticipated termination penalties. The variable lease payments that do not depend on an index or a rate are expensed in the period in which they are incurred.
15 | P a g e
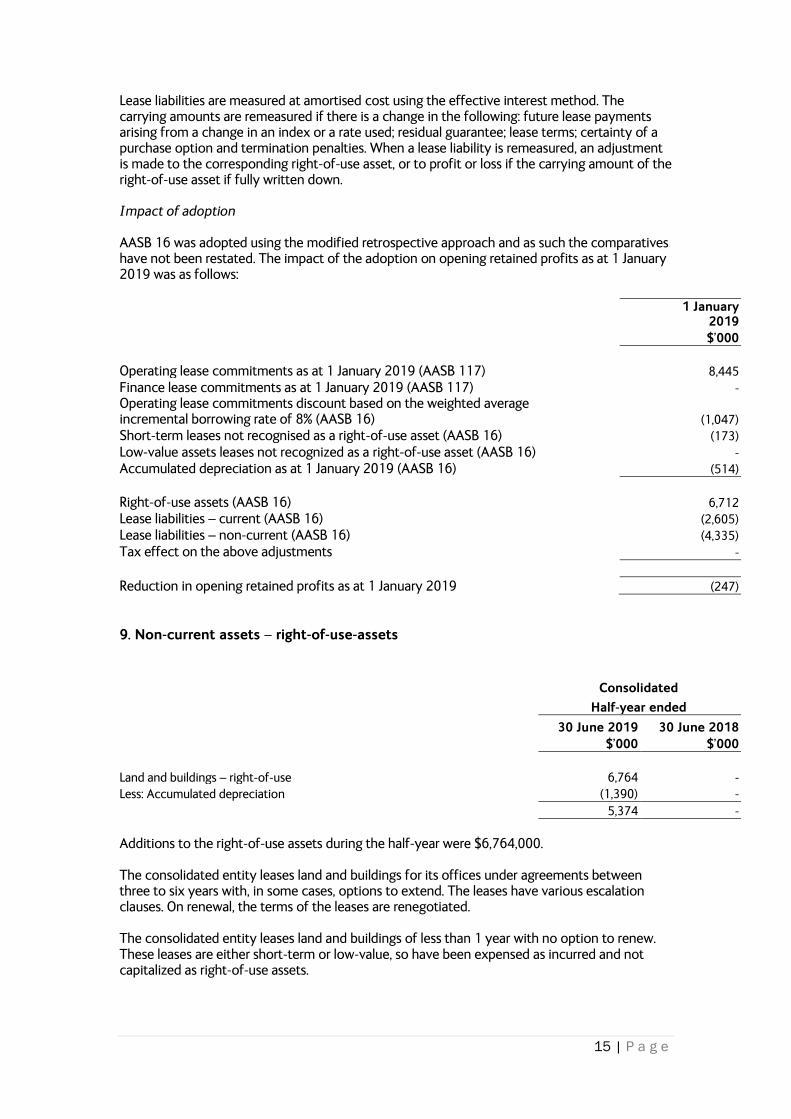
Lease liabilities are measured at amortised cost using the effective interest method. The carrying amounts are remeasured if there is a change in the following: future lease payments arising from a change in an index or a rate used; residual guarantee; lease terms; certainty of a purchase option and termination penalties. When a lease liability is remeasured, an adjustment is made to the corresponding right-of-use asset, or to profit or loss if the carrying amount of the right-of-use asset if fully written down.
Impact of adoption
AASB 16 was adopted using the modified retrospective approach and as such the comparatives have not been restated. The impact of the adoption on opening retained profits as at 1 January 2019 was as follows:
1 January 2019
$’000
Operating lease commitments as at 1 January 2019 (AASB 117) 8,445 Finance lease commitments as at 1 January 2019 (AASB 117) - Operating lease commitments discount based on the weighted average incremental borrowing rate of 8% (AASB 16) (1,047) Short-term leases not recognised as a right-of-use asset (AASB 16) (173) Low-value assets leases not recognized as a right-of-use asset (AASB 16) - Accumulated depreciation as at 1 January 2019 (AASB 16) (514)
Right-of-use assets (AASB 16) 6,712 Lease liabilities – current (AASB 16) (2,605) Lease liabilities – non-current (AASB 16) (4,335) Tax effect on the above adjustments -
Reduction in opening retained profits as at 1 January 2019 (247)
9. Non-current assets – right-of-use-assets
Consolidated
Half-year ended
30 June 2019 30 June 2018
$’000 $’000
Land and buildings – right-of-use 6,764 - Less: Accumulated depreciation (1,390) -
5,374 -
Additions to the right-of-use assets during the half-year were $6,764,000.
The consolidated entity leases land and buildings for its offices under agreements between three to six years with, in some cases, options to extend. The leases have various escalation clauses. On renewal, the terms of the leases are renegotiated.
The consolidated entity leases land and buildings of less than 1 year with no option to renew. These leases are either short-term or low-value, so have been expensed as incurred and not capitalized as right-of-use assets.

16 | P a g e
10. Current liabilities – lease liabilities
Consolidated
Half-year ended
30 June 2019 30 June 2018 $’000 $’000
Lease liability 2,109 -
11. Non-current liabilities – lease liabilities
Consolidated
Half-year ended
30 June 2019 30 June 2018 $’000 $’000
Lease liability 3,527 -

17| P a g e
INDEPENDENT AUDITOR’S REVIEW REPORT
TO THE MEMBERS OF
AMBITION GROUP LIMITED Report on the Half-Year Financial Report
We have reviewed the accompanying half-year financial report of Ambition Group Limited which comprises the condensed consolidated statement of financial position as at 30 June 2019, the condensed consolidated statement of profit or loss, the condensed consolidated statement of other comprehensive income, condensed consolidated statement of changes in equity and condensed consolidated statement of cash flows for the half-year ended on that date, notes comprising a summary of significant accounting policies and other explanatory information, and the directors’ declaration of the consolidated entity comprising the company and the entities it controlled at the half-year end or from time to time during the half-year.
Directors’ Responsibility for the Half-Year Financial Report
The directors of the company are responsible for the preparation of the half-year financial report that gives a true and fair view in accordance with Australian Accounting Standards and the Corporations Act 2001 and for such internal control as the directors those charged with governance determine is necessary to enable the preparation of the half-year financial report that is free from material misstatement, whether due to fraud or error.
Auditor’s Responsibility
Our responsibility is to express a conclusion on the half-year financial report based on our review. We conducted our review in accordance with Auditing Standard on Review Engagements ASRE 2410 Review of a Financial Report Performed by the Independent Auditor of the Entity, in order to state whether, on the basis of the procedures described, we have become aware of any matter that makes us believe that the half-year financial report is not in accordance with the Corporations Act 2001 including: giving a true and fair view of the consolidated entity’s financial position as at 30 June 2019 and its performance for the half-year ended on that date; and complying with Accounting Standard AASB 134 Interim Financial Reporting and the Corporations Regulations 2001. As the auditor of Ambition Group Limited, ASRE 2410 requires that we comply with the ethical requirements relevant to the audit of the annual financial report.
A review of a half-year financial report consists of making enquiries, primarily of persons responsible for financial and accounting matters, and applying analytical and other review procedures. A review is substantially less in scope than an audit conducted in accordance with Australian Auditing Standards and consequently does not enable us to obtain assurance that we would become aware of all significant matters that might be identified in an audit. Accordingly, we do not express an audit opinion.

18| P a g e
Independence
In conducting our review, we have complied with the independence requirements of the Corporations Act 2001. We confirm that the independence declaration required by the Corporations act 2001, which has been given to the directors of Ambition Group Limited, would be in the same terms if given to the directors as at the time of this auditor’s report.
Conclusion
Based on our review, which is not an audit, we have not become aware of any matter that makes us believe that the half-year financial report of Ambition Group Limited is not in accordance with the Corporations Act 2001 including:
(a) giving a true and fair view of the consolidated entity’s financial position as at 30 June 2019 and of its performance for the half-year ended on that date; and
(b) complying with Accounting Standard AASB 134 Interim Financial Reporting and Corporations Regulations 2001.
RSM AUSTRALIA PARTNERS David Talbot Partner Sydney, NSW Dated: 21 August 2019
Corporate Directory
Websites wwww.ambition.com.au
www.ambition.com.hk www.ambition.com.sg
www.ambition.co.uk www.ambition.com.my
www.hatch.careers www.accountability.com.au
www.watermarksearch.com.au
Share Registry Computershare Investor Services Pty Ltd
Level 5 115 Grenfell Street Adelaide SA 5000
Stock Exchange Listing Ambition Group Limited is listed on the
Australian Securities Exchange ASX code: AMB
Ambition Group Limited and its Controlled Entities
ABN 31 089 183 362

Sydney Level 5, 55 Clarence Street, Sydney NSW 2000 T: +61 2 9249 5000
Melbourne Level 36, 140 William Street, Melbourne VIC 3000 T: +61 3 8629 1000
Brisbane Level 7, 410 Queen Street, Brisbane QLD 4000 T: +61 7 3020 0300
Singapore One Raffles Place, Level 14 Office Tower 2, Singapore 048616 T: +65 6854 5600
Hong Kong Level 25 28 Hennessy Road, Hong Kong T: +852 3101 3066
Malaysia Level 20, Integra Tower, The Intermark, 348, Jalan Tun Razak 50400 Kuala Lumpur T: +603 2300 7200
London 13 Southampton Place, London WC1A 2AL T: +44 20 7404 4004


