APPENDIX 4E ANNUAL REPORT THINKSMART LIMITED ACN 092 319 698 YEAR ENDED 31 DECEMBER 2011 1 Details of the reporting period and the previous corresponding period Current period: 1 January 2011 to 31 December 2011 Prior corresponding period: 1 January 2010 to 31 December 2010 2 Results for announcement to the market Year Ended 31 December 2011 Year Ended 31 December 2010 Increase on Previous Period Increase on Previous Period $ $ $ % 2.1 Operating income 45,474,003 42,110,562 3,363,441 8% 2.2 Profit after tax attributable to members of ThinkSmart Limited 6,798,348 6,773,013 25,335 0% 2.3 Profit after tax attributable to members of ThinkSmart Limited 6,798,348 6,773,013 25,335 0% 2.4 Amount per security Franked amount per security 2.5 Current period - 2011 Nil Previous corresponding period - 2010 Final 2010 dividend - paid 29 April 2011 3.5 cents 45% Record date for determining entitlements to the dividends n/a Brief explanation on Revenue, Net Profit and Dividends Refer to the 2011 annual report 3 Consolidated statement of comprehensive income Refer to the 2011 annual report 4 Consolidated statement of financial position Refer to the 2011 annual report 5 Consolidated statement of cash flows Refer to the 2011 annual report Key Information Dividends For personal use only
Transcript
APPENDIX 4E
ANNUAL REPORT
THINKSMART LIMITEDACN 092 319 698
YEAR ENDED 31 DECEMBER 2011
1 Details of the reporting period and the previous corresponding period
Current period: 1 January 2011 to 31 December 2011Prior corresponding period: 1 January 2010 to 31 December 2010
2 Results for announcement to the market
Year Ended 31 December 2011
Year Ended 31 December 2010
Increase on Previous Period
Increase on Previous Period
$ $ $ %2.1 Operating income 45,474,003 42,110,562 3,363,441 8%2.2 Profit after tax attributable to members of ThinkSmart Limited 6,798,348 6,773,013 25,335 0%2.3 Profit after tax attributable to members of ThinkSmart Limited 6,798,348 6,773,013 25,335 0%
2.4Amount per
securityFranked amount
per security2.5
Current period - 2011
Nil
Previous corresponding period - 2010
Final 2010 dividend - paid 29 April 2011 3.5 cents 45%
Record date for determining entitlements to the dividends
n/a
Brief explanation on Revenue, Net Profit and Dividends
Refer to the 2011 annual report
3 Consolidated statement of comprehensive income
Refer to the 2011 annual report
4 Consolidated statement of financial position
Refer to the 2011 annual report
5 Consolidated statement of cash flows
Refer to the 2011 annual report
Key Information
Dividends
For
per
sona
l use
onl
y
6 Consolidated statement of changes in equity
Refer to the 2011 annual report
7 Dividend details
Refer to the 2011 annual report
8 Dividend or distribution reinvestment plans
ThinkSmart Limited does not currently operate a dividend reinvestment plan.
9 Net tangible assets per security
Year Ended 31 December 2011
Year Ended 31 December 2010
$ $Ordinary shares 0.20 0.23
10 Control gained or lost over entities on the financial year
Name of entities where control was gained in the financial year Date control gainedThinkSmart Trust 6 May 2011
Name of entities where lost was gained in the financial year Date control lostNone
11 Investment in Associates and Joint Ventures
ThinkSmart Limited does not have a percentage holding in any associates or joint venture entities.
12 Other information
Refer to the 2011 annual report.
13 Foreign entities
14 Commentary on results for the financial year
Refer to the 2011 annual report.
15 Audited report
This annual report is based on audited accounts.
16 Statement if financial report is not audited
Not applicable as the annual report is audited.
17 Statement if financial statement is audited
The annual report has been audited and is not subject to disputes or qualifications.
The consolidated financial report of the Group and the financial report of the Company comply with International Financial Reporting Standards (IFRSs) and interpretations adopted by the Internal Accounting Standards Board (IASB).
DirectorsN R Montarello (Chairman and Chief Executive Officer)D Griffiths (Deputy Chairman)S Penglis F de VicenteN Fox
Company SecretaryJ Ferreira
Registered OfficeLevel 1, The West Centre 1260 Hay StreetWest Perth, WA 6005Australia
Principal place of businessLevel 1, The West Centre 1260 Hay StreetWest Perth, WA 6005AustraliaPhone: +61 8 9463 7500
Share Register Computershare Investor Services Pty LimitedLevel 2, 45 St Georges TerracePerth, WA 6000AustraliaPhone: 1300 850 505
ThinkSmart Limited shares are listed on the Australian Securities Exchange (ASX code: TSM)
SolicitorsFreehills250 St Georges TerracePerth, WA 6000Australia
AuditorsKPMG235 St Georges TerracePerth, WA 6000Australia
BankersWestpac Banking Corporation109 St Georges TerracePerth, WA 6000Australia
1
For
per
sona
l use
onl
y
THINKSMART LIMITED DIRECTORS' REPORT
DIRECTORS
Names, qualifications, experience and special responsibilities
Ned Montarello Executive Chairman and Chief Executive Officer
David Griffiths B. Ec (Hons), M. Ec, D. Ec (Hon), FAICDNon-Executive Director, Deputy Chairman
Steven Penglis B. Juris and B. LawNon-Executive Director
Fernando de Vicente B. Econ, MBA BusNon-Executive Director
Fernando is a citizen of Spain who joined the Board on 7 April 2010. Fernando has a Degree in Economics (InternationalDevelopment) from the University Complutense in Madrid, and an Executive MBA from IESE Business School in Madrid.Fernando spent nine years at DSG International, one of Europe’s largest electrical retailers, where he most recently held therole of International Managing Director, with responsibility for DSG’s Central & Southern European operations, a A$3billion business with 350 stores across six countries.Fernando started his career with DSG as Finance Director for PC City Spain, and became the MD for Spain in 2003. In2006 he was promoted to Regional Managing Director for South-East Europe based in Greece, before assuming the role ofInternational Managing Director in 2008. In March 2010, Fernando left DSG to become the Executive Chairman ofBodyBell Group, one of Spain’s largest speciality retailers. On 15 February 2012, Fernando was appointed non-executivedirector of Levantina, a multinational company dealing in natural stone products.
The Directors of ThinkSmart Limited (the “Company”) submit herewith the annual financial report of the consolidatedentity (“the Group”) for the financial year ended 31 December 2011 and the auditor’s report thereon. In order to complywith the provisions of the Corporations Act 2001, the directors report as follows:
The names and details of the Company’s directors in office during the financial year and until the date of this report are asfollows. Directors were in office for this entire period unless otherwise stated.
Ned was appointed Executive Chairman on 22 May 2010. Ned has over 24 years experience in the finance industry. Hefounded ThinkSmart in 1996 and through this vehicle has been credited with elevating the Nano-Ticket rental market sector in Australia, receiving the Telstra and Australian Government’s Entrepreneur of the Year Award in 1998. Ned steered theexpansion of the business into Europe, establishing agreements in 2002/2003 with DSG International and HBoS to launchin the UK.
David joined the Board on 28 November 2000 and was appointed Deputy Chairman on 22 May 2010. David has overfourteen years experience in investment banking, most recently as Division Director of Macquarie Bank Limited andpreviously as Executive Chairman of Porter Western Limited. He holds an Honours Degree in Economics and an honoraryDoctor of Economics from The University of Western Australia, a Masters Degree in Economics from Australian NationalUniversity and is a Fellow of the Australian Institute of Company Directors. David sits on the Board of the PerthInternational Arts Festival and is currently the chairman of Automotive Holdings Group Limited and chairman of NorthernIron Limited. David is currently Chair of the Audit and Risk Committee of ThinkSmart.
Steven joined the Board on 1 July 2000 and stepped down as Chairman on 6 May 2007. Steven has been a Partner atFreehills since 1987. Steven specialises in the area of Corporate and Corporations Law Litigation, advising many publiccompanies (including ThinkSmart before his appointment to the Board). He is a part-time Senior Member of theCommonwealth Administrative Appeals Tribunal; a former elected member and Chairman of the Legal Practice Board ofWestern Australia; and an elected member of the Council of the Law Society of Western Australia. Steven is currentlyChair of the Nomination and Remuneration Committee of ThinkSmart.
2
For
per
sona
l use
onl
y
THINKSMART LIMITED DIRECTORS' REPORT
Nancy Fox BA, JD (Law), FAICDNon-Executive Director
COMPANY SECRETARYJan Ferreira B.Compt, ACMA, CPA
DIRECTORS’ MEETINGS
Director
B A B A BN Montarello 8 2* - - -D Griffiths 8 2 2 - -S Penglis 8 2 2 - -F de Vicente 8 - - - -N Fox 2 - - - -A – Number of meetings attendedB – Number of meetings held during the time the director held office during the year† - During the year the full Board considered all matters of nomination and remuneration* Attendance by invitation from the Committee
CORPORATE GOVERNANCE STATEMENT
Board of Directors
Role of the BoardThe Board’s primary role is the protection and enhancement of long-term shareholder value.
The following table sets out the number of directors’ meetings held during the financial year. During the financial year 8Board meetings were held.
Nomination and Remuneration Committee
Meeting †
Audit and Risk Committee Meetings
Board Meetings
This statement outlines the main corporate governance practices in place throughout the financial year, which comply withthe ASX Corporate Governance Council recommendations, unless otherwise stated.
2
A8878
Nancy joined the Board on 10 October 2011 and the Audit and Risk Committee on 25 November 2011. Nancy is currentlyChairman of Adelaide Managed Funds Limited, a subsidiary of Bendigo & Adelaide Bank and is also a board member ofAPA Ethane Limited, the responsible entity of the Ethane Pipeline Income Fund (EPX), the Energy Security Council, HCFLife, the Taronga Conservation Society of Australia and the Australian Theatre for Young People.
Nancy was previously the Managing Director of Ambac Assurance Corporation with responsibility for the Asia PacificRegion. Prior to joining Ambac, Nancy was an investment banker for over 15 years and has held a number of seniorpositions as head of securitisation and structured finance at ABN AMRO, AIDC and Citibank. Before moving toinvestment banking, she was an attorney in New York. Nancy was a National Committee member of the AustralianSecuritisation Forum for 9 years and received the Australian Securitisation Forum's inaugural Distinguished Service Awardin 2005.
Jan was appointed Company Secretary on 1 July 2011. Jan is a Chartered Management Accountant and Certified PracticingAccountant with over 18 years experience. Prior to his appointment to this role, he was Chief Financial Officer ofThinkSmart’s Australian business unit for 4 years. Prior to joining ThinkSmart, Jan held a number of finance roles in thefunds management and utilities sectors based in the UK and Australia after commencing his career with Ernst & Young.
3
For
per
sona
l use
onl
y
THINKSMART LIMITED DIRECTORS' REPORT
• working with management to establish ThinkSmart’s strategic direction; • monitoring management and financial performance; • monitoring compliance and risk management; •
• ensuring effective disclosure policies and procedures.
Matters which are specifically reserved for the Board or its Committees under the Board Charter include:• appointment of a chair; • appointment and removal of the Chief Executive Officer; • appointment of directors to fill a vacancy or as additional directors; • establishment of Board Committees, their membership and delegated authorities; • approval of dividends; • development and review of corporate governance principles and policies; •
• calling of meetings of shareholders; and • any other specific matters nominated by the Board from time to time.
Board process
Independent professional advice and access to company information
Composition of the Board
•
•
•
•
It is intended that the Board should comprise a majority of independent non-executive directors and comprisedirectors with a broad range of skills, expertise and experience from a diverse range of backgrounds.
The Board has delegated responsibility for operations and administration of the Company to the Chief Executive Officerand executive management. Responsibilities are delineated by formal authority delegations.
To assist in the execution of its responsibilities, the Board has established a Nomination and Remuneration Committee, aswell as an Audit and Risk Committee. These Committees have written mandates and operating procedures, which arereviewed on a regular basis. The Board has also established framework for management of the Group including a system ofinternal control, a business risk management process and the establishment of appropriate ethical standards.
Following consultation with the chairperson, directors may seek independent professional advice at the Company’sexpense. Generally, this advice will be available to all directors.
The names of the directors of the Company in the office at the date of this report are set out in the Directors’ Report onpage 2 and 3 of this report. The composition of the Board is determined using the following principles:
The Board does not believe that it should establish a limit on tenure. While tenure limits can help to ensure that thereare fresh ideas and viewpoints available to the Board, they hold the disadvantage of losing the contribution ofdirectors who have been able to develop, over a period of time, increasing insight in the Company and its operationand, therefore, an increasing contribution to the Board as a whole.
To fulfil this role, the Board has adopted a charter which establishes the relationship between the Board and managementand describes their functions and responsibilities. The Board’s responsibilities, as set out in the Board Charter, include:
reviewing procedures in place for appointment of senior management and monitoring of its performance and forsuccession planning; and
approval of operational budgets, major capital expenditure, acquisitions and divestitures in excess of authority levelsdelegated to management;
It is also responsible for approving and monitoring financial and other reporting. Detail of the Board’s charter is located inthe Company’s website (www.thinksmartworld.com).
The Board, together with the Nomination and Remuneration Committee, determines the size and composition of the Board,subject to the terms of the constitution.
The Board regularly reviews the independence of each director in light of the interests disclosed to the Board.A minimum of three directors and a maximum of twelve.
4
For
per
sona
l use
onl
y
THINKSMART LIMITED DIRECTORS' REPORT
Audit and Risk Committee
The Committee’s primary roles are:• to assist the Board in relation to the reporting of financial information;• the appropriate application and amendment of accounting policies;• the appointment, independence and remuneration of the external auditor; and• to provide a link between the external auditors, the Board and management of the Company.
Risk managementThe Committee’s specific function with respect to risk management is to review and report to the Board that:• the Company’s ongoing risk management program effectively identifies all areas of potential risk;• adequate policies and procedures have been designed and implemented to manage identified risks;• a regular program of audits is undertaken to test the adequacy of and compliance with prescribed policies; and•
Financial reporting
Environmental regulation
Ethical standards
Conflict of interest
The risk management policy can be found on the Company’s website (www.thinksmartworld.com).
The Board is aware of the ASX Corporate Governance Recommendation which stipulates that the roles of Chair and ChiefExecutive Officer should not be exercised by the same individual. Given the breadth of the Group’s operations and theExecutive Chairman’s extensive business experience, the Board considers it appropriate that the Executive Chairman beconsidered the most senior executive overseeing and supervising the Group as well as managing the Group’s smallexecutive team in regard to this.
The Audit and Risk Committee has a documented charter, approved by the Board, which is available on the website(www.thinksmartworld.com). All members must be non-executive directors with a majority being independent. TheChairperson may not be the Chairperson of the Board. The Committee advises on the establishment and maintenance of aframework of internal control and appropriate ethical standards for the management of the Group.
The members of the Audit Committee during the year were non-executive directors, and are D Griffiths (Chair), S Penglisand N Fox (appointed 25 November 2011).
The Committee will meet as often as the Committee members deem necessary in order to fulfil their role. The externalauditors, Chief Executive Officer and Chief Financial Officer, are invited to the Audit Committee meetings at the discretionof the Committee. The external auditor met with the Audit Committee and the Board of Directors twice during the yearwithout management being present.
The Chief Executive Officer and the Chief Financial Officer have declared in writing to the Board that the Company’sfinancial reports are founded on a sound system of risk management and internal compliance and control which implementsthe policies adopted by the Board, and is operating efficiently and effectively in all material aspects.
The Group’s operations are not subject to any significant environmental regulation under both Commonwealth and Statelegislation in relation to its activities.
All directors, managers and employees are expected to act with the utmost integrity and objectivity, striving at all times toenhance the reputation and performance of the Group. Every employee has a nominated supervisor to whom they may referany issues arising from their employment.
Directors must keep the Board advised, on an ongoing basis, of any interest that could potentially conflict with those of theCompany. The Board has developed procedures to assist directors to disclose potential conflicts of interest.Where the Board believes that a significant conflict exists for a director on a Board matter, the director concerned does notreceive the relevant Board papers and is not present at the meeting whilst the item is considered. Details of director relatedentity transactions with the Company and the Group are set out in note 31 to the financial statements.
proper remedial action is undertaken to redress areas of weakness.
5
For
per
sona
l use
onl
y
THINKSMART LIMITED DIRECTORS' REPORT
Code of conduct
Trading in general Company securities by directors and employees
• the announcement of half-yearly results; • the announcement of annual results; or • the holding of the annual general meeting,
• a director must receive approval from the Chair of the Board; • the Chair must receive approval from the Board or the most senior director; • executives and senior management must receive approval from the Chief Executive Officer; and • all other Relevant persons must receive approval from the Company Secretary.
Disclosure Policy
•
•
•
Communication with shareholders
The Guidelines establish a ‘window period’, where, generally, Relevant Persons (provided they are not in possession ofinside information) may buy or sell ThinkSmart’s securities on ASX in the period from 31 days from the day following:
Outside the window period, Relevant Persons must receive clearance for any proposed dealing in ThinkSmart’s securitieson ASX as follows:
The Guidelines also prohibit short term dealing (buying and selling within 3 months) in ThinkSmart securities by RelevantPersons.
ThinkSmart understands its obligations under the ASX Listing Rules and Corporations Act 2001 to keep the market fullyinformed of information which may have a material effect on the price or value of ThinkSmart’s securities. ThinkSmart hasadopted a Disclosure Policy which sets out its policy to strictly comply with the continuous disclosure requirements.
The Company Secretary has the primary responsibility for all communication with the ASX in relation to Listing Rulematters including lodging announcements with ASX. The Company Secretary is also responsible for ensuring seniormanagement is aware of the Disclosure Policy and that the Disclosure Policy is updated.
The Code is directed at maintaining high ethical standards and integrity. Employees are expected to adhere to ThinkSmart’spolicies, perform their duties diligently, properly use company resources, protect confidential information and avoidconflicts of interest.
The Code sets out the reporting lines where there is a potential breach of the Code, ThinkSmart’s commitment to the Codeand the consequences of breaching the Code. The Code is acknowledged by all employees.
ThinkSmart’s Guidelines for Dealing in Securities explain and reinforce the Corporations Act 2001 requirements relating toinsider trading. The Guidelines are summarised below.
The Guidelines apply to all directors and employees of the ThinkSmart group, and their associates (“Relevant Persons”).
The Guidelines expressly prohibit Relevant Persons buying or selling ThinkSmart securities where the Relevant Person orThinkSmart is in possession of price sensitive or ‘inside’ information.
If management becomes aware of any information at any time that should be considered for release to the market, itmust be reported immediately to the Chief Executive Officer, or the Group Chief Financial Officer / CompanySecretary. Operating and divisional heads and group functional heads must ensure they have appropriate procedures in placewithin their areas of responsibility to ensure that all relevant information is reported to them so it can be dealt with inaccordance with the Disclosure Policy.
The Board provides shareholders with information using a comprehensive Continuous Disclosure Policy which includesidentifying matters that may have a material effect on the price of the Company’s securities, notifying them to the ASX,posting them on the Company’s website, and issuing media releases.
ThinkSmart’s Disclosure Policy is summarised below.
ThinkSmart has developed a Code of Conduct which states ThinkSmart’s and its employees’ commitment to the conduct ofits business with employees, customers, funders, retailers and other external parties.
6
For
per
sona
l use
onl
y
THINKSMART LIMITED DIRECTORS' REPORT
In summary, the Continuous Disclosure Policy operates as follows:•
•
•
Diversity
Nomination and Remuneration Committee
•
•
•
•
Remuneration Report
A: Principles of remunerationB: Directors’ and executive officers’ remunerationC: Service agreementsD: Share-based compensation (options)E: Share-based compensation (shares)F: Bonus remuneration
A. Principles of remuneration
Shareholders are able to access information, including media releases, key policies and the terms of reference of theBoard Committees through ThinkSmart’s website. All relevant ASX announcements will be posted on ThinkSmart’swebsite as soon as they have been released to ASX. ThinkSmart encourages participation of shareholders at its annual general meeting. The external auditor will attendthe annual general meeting and be available to answer shareholder questions about the conduct of the audit and thepreparation and content of the auditor’s report.
The Board is committed to having an appropriate blend of diversity on the Board and in the group’s senior executivepositions. The Board does not currently have a policy on diversity but intends to develop one during 2012, to complementand enhance the Anti-Discrimination & Equal Employment Opportunity Policy it displays on its intranet site.
Information is communicated to shareholders through ASX announcements, the annual report, annual general meetingand half year and full year results announcements.
The remuneration report for 2011, as presented below, has been prepared for consideration by shareholders. Theremuneration report is set out under the following main headings:
The objective of the Nomination and Remuneration Committee is to help the Board ensure that ThinkSmart has a Board ofan effective composition, size and the commitment to adequately discharge its responsibilities and duties, and to determineand review the compensation arrangements for the Directors and senior management team.
The Nomination and Remuneration Committee reviews and makes recommendations to the Board on remunerationpackages and policies applicable to the executives and directors of the Company as well as the Group. On an annual basis:
Directors will provide written feedback in relation to the Board and its Committees against an agreed set of criteriaand each Committee will do the same regarding its own performance; Feedback will be collected by the chair of the Board, or an external facilitator, and discussed by the Board, withconsideration being given as to whether any steps should be taken to improve performance of the Board or itsCommittees; The Chief Executive Officer will also provide feedback from senior management in connection with any issues thatmay be relevant in the context of the Board performance review; and Where appropriate to facilitate the review process, assistance may be obtained from third party advisers.
The current members of the Committee are S Penglis (Chair), D Griffiths, and F De Vicente.
The Committee will meet as often as the Committee members deem necessary in order to fulfil their role. However, it isintended that the Committee will normally meet at least annually.
The Committee consists of a minimum of 3 members, the majority being non-executive directors, and an independentdirector as chair. The Nomination and Remuneration Committee has a documented charter, approved by the Board, whichis available on the website (www.thinksmartworld.com).
Key management personnel have authority and responsibility for planning, directing and controlling the activities of theCompany and the Group, including directors of the Company and other executives. Key management personnel comprisethe directors of the Company and executives for the Company and the Group including the five most highly remuneratedexecutives.
7
For
per
sona
l use
onl
y
THINKSMART LIMITED DIRECTORS' REPORT
The following are Key Management Personnel of the Group:
Non-Executive DirectorsD Griffiths (Deputy Chairman, ThinkSmart Limited) S Penglis (Non-Executive Director, ThinkSmart Limited)F de Vicente (Non-Executive Director, ThinkSmart Limited) N Fox (Non-Executive Director, ThinkSmart Limited) – appointed 10 October 2011
ExecutivesA Baum (Group Chief Operating Officer, ThinkSmart Limited) N Barker (Group Chief Financial Officer, ThinkSmart Limited) – resigned 30 June 2011J Ferreira (Group Chief Financial Officer (acting), ThinkSmart Limited) – appointed 1 July 2011S McDonagh (Head of Product & Marketing – ThinkSmart Limited) – re-appointed 25 July 2011G Varma (Group Chief Information Officer, ThinkSmart Limited)G Parry (Managing Director - UK, RentSmart Limited)
•
•
• the capability and experience of the key management personnel;• the key management personnel’s ability to control the relevant segment's performance; and• the Group’s performance.
Linking Executive Remuneration to Group Performance
2011 2010 2009 2008 2007Profit attributable to owners of the company 6,798,347$ 6,773,013$ 5,171,776$ 3,210,752$ $ 73,066 Basic EPS 5.23 cents 6.52 cents 5.35 cents 3.34 cents 0.80 centsDividends paid 4,545,779$ 1,937,788$ 2,900,682$ 1,933,788$ - Dividend paid per share 3.5 cents 2 cents 3 cents 2 cents -Share price at year end $0.41 $0.73 $0.90 $0.17 $1.92 Change in share price ($0.32) ($0.17) $0.73 ($1.75) ($0.23)Return on capital employed 18% 36% 34% 22% 6%
Remuneration levels for key management personnel and secretaries of the company and key management personnel of theGroup are competitively set with a view to:
Maintain alignment with shareholders’ interests; andEnsure remuneration remains competitive to retain and attract talented people who are key to delivering sustainedprofitable growth of the company.
The Nomination and Remuneration Committee obtains independent advice on the appropriateness of remunerationpackages of both the company and the Group given trends in comparative companies both locally and internationally andthe objectives of the company’s remuneration strategy.
The remuneration structures explained below are designed to attract suitably qualified candidates, reward the achievementof strategic objectives, and achieve the broader outcome of creation of value for shareholders. The remuneration structurestake into account:
Remuneration packages include a mix of fixed and variable remuneration and short-term and long-term performance-basedincentives.
The Directors of ThinkSmart Limited understand that linking executive remuneration to Group performance is a driver ofperformance. Base pay is set at levels that are intended to attract and retain executives capable of managing the Group’sperformance and is therefore indirectly linked to Group performance. A direct link between executive remuneration andGroup performance is achieved through the application of short and long term incentives which are subject to performancecriteria which, if met, reflect the performance of the Group.
In considering the Group’s performance and benefits for shareholder wealth, the Executive Chairman and Nomination andRemuneration Committee have regard to the following indices of the current financial year and the previous four financialyears.
8
For
per
sona
l use
onl
y
THINKSMART LIMITED DIRECTORS' REPORT
Non-Executive Directors
Non-Executive Director’s fees
Executive pay
• base pay and benefits• short-term performance incentives (STIs)• long-term incentives through participation in the ThinkSmart Long Term Incentive Plan • other remuneration such as superannuation.
Base pay
Short-term performance incentive
The Directors of ThinkSmart Limited consider that a variety of factors, including the broad economic environment, marketsentiment and financial performance, contribute to the company’s share price. As a result, the Executive remuneration islinked to the Group’s financial performance.
Profit is considered as one of the financial performance targets setting of the short term incentive. Profit amounts for 2007to 2011 have been calculated in accordance with Australian Accounting Standards (AASBs).
The level of key management personnel remuneration takes into account the performance of the Group over a number ofyears. Over the past four years, the group’s profit from ordinary activities after income tax has grown at an average rate perannum of over 27%. During the same period, average key management personnel remuneration has grown byapproximately 8.9% per annum.
Fees and payments to non-executive directors reflect the demands which are made on and the responsibilities of the Non-Executive Directors. Non-Executive Directors’ fees and payments are reviewed annually by the Board. Non-ExecutiveDirectors do not receive Share Options.
The Non-Executive Directors shall be paid by way of fees for services, the maximum aggregate sum as may be approvedfrom time to time by ThinkSmart in general meeting. The fees include Director’s fee as well as Board Committeemembership fee. The current maximum aggregate annual sum approved by shareholders at a previous general meeting is$600,000 (2010: $600,000). Any change to that aggregate annual sum needs to be approved by the shareholders. Theconstitution also makes provision for ThinkSmart to pay all reasonable expenses of directors in attending meetings andcarrying out their duties.
The Group's remuneration is market competitive and aims to attract retain and motivate high calibre employees whocontribute to the sustained growth of the ThinkSmart business with a mix of the following four components:
The purpose of STIs is to make a significant contribution to the total reward package subject to meeting various targetslinked to the Group’s business objectives. An incentivised reward structure is necessary to ensure a competitive package inthe Australian and global marketplace for executives. Incentives are designed to focus and motivate employees to achieveoutcomes beyond the expectation of normal professional competence.
Remuneration is reviewed annually. In reviewing each Executive’s salary, consideration is given to externalcompetitiveness, position responsibilities and individual skills and experience. The STI component of Executiveremuneration is based on annual performance targets and delivered in the form of cash. The Long Term Incentive Planrecognises performance and behaviour that delivers sustainable long term shareholder value and seeks to align the interestsof management with those of the shareholders.
Executives are offered a competitive salary that comprises the components of base pay and benefits that reflects the appliedprofessional competence of each Executive according to his/her knowledge, experience and accountabilities. Base pay forExecutives is reviewed annually by the Executive Chairman to ensure the executive’s pay is competitive with the market.An executive’s pay is also reviewed on promotion. Base pay for the Executive Chairman is reviewed annually by theNomination and Remuneration Committee.
Short-term performance incentives (STIs) vary according to individual contracts, however, for Executives they are broadlybased as follows:
9
For
per
sona
l use
onl
y
THINKSMART LIMITED DIRECTORS' REPORT
•
•
Long term incentive
The table below sets out the details of the performance options issued to Key Management Personnel:
The short-term bonus payments may be adjusted up or down in line with under or over achievement against the targetperformance levels. This is at the discretion of the Senior Executives. The STI target annual payment is reviewed annually.Information on the STI is detailed on section F of the Remuneration Report.
a component of the STI is linked to the individual performance of the executive (this is based on a number of factors,including performance against budgets, achievement of key performance indicators (KPIs) and other personalobjectives)a component of the STI is linked to the financial performance of the business or measured against budgets determinedat the beginning of each financial year.
Using various profit performance targets and personal performance objectives assessed against KPIs which are alignedwith achievement of the Board’s strategic objectives, the Group ensures variable reward is only paid when value has beencreated for shareholders. For middle and lower level management, total STIs are linked to individual performance measuresand also to the financial performance of the business. The STI bonus is delivered in the form of cash.
For the 2011 financial year, STI performance targets for Executives were based on the respective territories’ targets ofEarnings before Tax, Depreciation and Amortisation (“EBTDA”), penetration rate, application volumes, settlementvolumes, Average Transaction Value and territory expansion targets. These targets were selected on the basis that theGroup has, and is likely to have for sometime, a small number of experienced executives and ensuring that employmentpractices support and encourage continuity of team engagement with sustained and profitable growth of the company.
During 2009 the Board introduced a new Executive Share Option Plan (“ESOP”) which recognises performance andbehaviour that delivers sustainable long term shareholder value and seeks to align the interests of management with thoseof the shareholders. Consequently, options are issued to executives, and the ability to exercise the options is conditional onthe Group achieving the pre-determined performance criteria.
Each option represents an entitlement to one ordinary share.
Performance options will vest on, and become exercisable on or after, the Vesting Date tothe extent that certain performance conditions that are based on the achievement of pre-determined financial performance of the Group over the performance measurementperiod, as follows:
Subject to the executive remaining an employee of the Group. If the executive ceases tobe an employee of the Group before the option is exercised, all options held by theexecutive will automatically lapse one month after the date of cessation of employment.
50% of performance options are subject to achievement of Earnings Per Share (EPS) performance condition; and50% of performance options are subject to achievement of Total Shareholder Return (TSR) performance condition.
The Group’s EPS growth will be measured relative to a target of more than 7.5% perannum compound growth. The proportion of the EPS award that vests will be:
Compound EPS growth between 7.6% to 9.9%: 4% of the EPS award for each 0.1% of compound EPS growth above 7.5%
10
For
per
sona
l use
onl
y
THINKSMART LIMITED DIRECTORS' REPORT
EPS performance period
TSR performance target
- TSR rank less than 50th percentile: 0%- TSR ranks 50th percentile: 50%-
- TSR rank at or above 75th percentile: 100%
TSR performance period Performance Options Tranche 1: As at 1 January 2009Performance Options Tranche 2: As at 1 January 2010Performance Options Tranche 3: As at 1 January 2011
Vesting date Performance Options Tranche 1: 1 January 2012Performance Options Tranche 2: 31 December 2012Performance Options Tranche 3: 31 December 2013
Exercise period Performance Options Tranche 1: From vesting date to expiry datePerformance Options Tranche 2: From vesting date to expiry datePerformance Options Tranche 3: From vesting date to expiry date
Expiry date Performance Options Tranche 1: 31 December 2013Performance Options Tranche 2: 31 December 2014Performance Options Tranche 3: 31 December 2015
Disposal restriction No disposal restriction imposed at the time of this grant.
B. Directors’ and executive officers’ remunerationAmount of remuneration
Key management personnel and other executives of the Group
Why vesting conditions are chosen
Why vesting conditions are chosen
The vesting conditions were chosen as performance conditions as they reflect, at the datethey were granted, alignment with shareholder expectations.
Details of the remuneration of the Directors and the Key Management Personnel (as defined in AASB 124 Related PartyDisclosures) of ThinkSmart Limited and its subsidiaries are set out in the following tables. The cash bonuses are dependenton the satisfaction of performance conditions as set out in the section headed Short-term performance incentives above.
The Key Management Personnel of ThinkSmart Limited are the Directors and certain executives within the seniormanagement team having responsibility for planning, directing and controlling the activities of the Group. This includesGroup executives who received the highest remuneration for the year ended 31 December 2011.
Details of the nature and amount of each major element of remuneration of each director of the company, each of the fivenamed company executives and relevant Group executives who receive the highest remuneration and other keymanagement personnel are:
Performance Options Tranche 1: 3 year period commencing 1 January 2009 with the baseyear being the period ended 31 December 2008.Performance Options Tranche 2: 3 year period commencing 1 January 2010 with the baseyear being the period ended 31 December 2009.Performance Options Tranche 3: 3 year period commencing 1 January 2011 with the baseyear being the period ended 31 December 2010.The vesting conditions were chosen as performance conditions as they reflect, at the datethey were granted, the improvement of earnings.
The Group will be given percentile ranking having regards to its performance relative toa comparator group consisting of the S&P/ASX Small Ordinaries Index (ASX code:ASO). The Group will be given a percentile ranking having regard to its performancerelative to the comparative group of companies. The percentage of the TSR reward thatvests will be determined by the Group’s ranking as follows:
TSR rank between 50th and 75th percentile: 50% plus an additional 2% of this award for each additional percentile ranking above 50th percentile
* During the year, the Key Management Personnel has either resigned or been appointed.† This information provided for comparative purposes. This person was not a Key Management Personnel during the year.
Value of options as proportion of
remuneration
Non-Executive Directors
Executive Director
Short Term Share-based payments
Total
Proportion of remuneration performance
related
12
For
per
sona
l use
onl
y
THINKSMART LIMITED DIRECTORS' REPORT
C. Service agreements
Options and rights over equity instruments granted as compensation
ExecutivesA Baum 333,333 11/04/2011 0.404 0.84 31/12/2015 - J Ferreira 150,000 11/04/2011 0.404 0.84 31/12/2015 - S McDonagh 250,000 25/07/2011 0.276 0.84 31/12/2015 - G Varma 100,000 11/04/2011 0.404 0.84 31/12/2015 - G Parry 200,000 11/04/2011 0.404 0.84 31/12/2015 - No options were granted since the end of the financial year. The options are provided at no cost to the recipients.
Modification of terms of equity-settled share-based payment transactions
Exercise of options granted as remunerationDuring the 2011 reporting period, no shares were issued as a result of the exercise of options.
Analysis of options and rights over equity instruments granted as remuneration
Service agreements can provide for the provision of short-term performance incentives, eligibility for the ThinkSmartESOP, other benefits including the use of a Company motor vehicle, tax advisory fees, payment of benefits forgone at aprevious employer, relocation, living, tax equalisation, travel and accommodation expenses whilst an executive is requiredto live away from their normal place of residence.
In the event of retrenchment, the executives listed in the table on page 12 are entitled to the payment provided for in theservice agreement, where applicable. The employment of the executives may be terminated by the Company without noticeby payment in lieu of notice.
The service agreements also contain confidentiality and restraint of trade clauses.
D. Share Based Compensation (Options)
Details on options over ordinary shares in the Company that were granted as compensation to each key management personduring the reporting period and details on options that vested during the reporting period are as follows:
Only remuneration and other terms of employment for the Chief Executive Officer are formalised in a service agreement.The Chief Executive Officer’s employment agreement is for a fixed term of 3 years to 28 August 2012. All otheremployment agreements are unlimited in term but capable of termination with one to three months’ notice by either theCompany or the executive. The Company can make a payment in lieu of notice.
All options refer to options over ordinary shares of ThinkSmart Limited, which are exercisable on a one-for-one basisunder the Employee Share Options Plan (“ESOP”).
No of options granted during
2011
No of options vested
during 2011
No terms of equity-settled share-based payment transactions (including options and rights granted as compensation to a keymanagement person) have been altered or modified by the issuing entity during the reporting period or the prior period.
Details of vesting profiles of the options granted as remuneration to each director of the Company and each of the fivenamed Company executives and relevant Group executives and other key management personnel are detailed below.
The % forfeited in the year represents the reduction from the maximum number of options available to vest due to the retirement of the executive.
423,000
Granted in year $ (a)
Options granted
The movement during the reporting period, by value of options over ordinary shares in the Company held by eachCompany director and each of the five named Company executives and relevant Group executives and other keymanagement personnel is detailed below.
Expired and Lapsed in year $ (c )
-
-
- - -
7,343 80,800 808,467
60,600 69,000 40,400
62,730
The value of options granted in the year is the fair value of the options calculated at grant date using a binominaloption-pricing model. The total value of the options granted is included in the table above. This amount is allocated toremuneration over the vesting period.
- - -
Exercised in year $ (b)
-
-
- -
134,667
14
For
per
sona
l use
onl
y
THINKSMART LIMITED DIRECTORS' REPORT
(b)
(c)
All shares refer to shares over ordinary shares of ThinkSmart Limited.
Shares granted as remuneration – audited
Grant date Fair value at grant date
($)
Vesting period
No of shares vested
during 2011ExecutivesA Baum 125,000 1/09/2011 0.52 3 years -
No shares were granted since the end of the financial year. The shares are provided at no cost to the recipient.
The % forfeited in the year represents the reduction from the maximum number of shares available to vest due to the highest level service criteria not being achieved.
The movement during the reporting period, by value of shares in the Company held by each Company director and each ofthe five named Company executives and relevant Group executives and other key management personnel is detailed below.
Shares granted
The value of options exercised during the year is calculated as the market price of shares of the Company on theAustralian Securities Exchange as at close of trading on the date the options were exercised after deducting the pricepaid to exercise the option.
The value of the options that lapsed during the year represents the benefit forgone and is calculated at the date theoption lapsed using original fair value.
E. Share Based Compensation (Shares)
Details on shares of the Company that were granted as remuneration to each key management and details on shares vestedduring the reporting period are as follows:
These shares were issued to A Baum and are held in escrow. The shares are ordinary shares in the Company and will vestupon completion of a 3 year service period. During this period, Mr Baum is entitled to any dividends declared by theCompany and normal voting rights are attached. In the event that Mr Baum’s employment with the Company ceases beforethe vesting period (i.e. through resignation or termination), the shares will be cancelled. If Mr Baum is retrenched by theCompany due to changes in the Company’s structure or operations, he will be entitled to retain the shares and they willbecome immediately unconditional if this occurs before the escrow period expires.
Details of vesting profiles of the shares granted as remuneration to each director of the Company and each of the fivenamed Company executives and relevant Group executives and other key management personnel are detailed below.
In Australia, the value of equipment financed declined 17% as deteriorating conditions within the electrical retail sectorresulted in heavy price discounting by retailers which had a 10% impact on average transaction values. Ahead ofcompleting transition to lease accounting, the Group also tightened its credit policy significantly, leading to a 7 percentagepoint reduction in approval rates. This initiative, while reducing volume in the short term is expected to significantlyenhance asset quality in the medium term with a resultant benefit to group earnings. Primarily as a result of the volumedecline, the Australian business recorded a decline in profit before tax contribution of 9% to $8.7 million.
Details of the vesting profile of the short-term incentive cash bonuses awarded as remuneration to each director of theCompany, each of the five named Company executives and relevant Group executives and other key managementpersonnel are detailed below:
The Group’s principal activity in the course of the financial year was to arrange finance for the renting of equipment inAustralia and Europe.
During the year, the Group completed its new multi-funder securitisation platform in Australia as the financing vehicle forthe leases it arranges for customers.
The after tax net profit of the Group for the year was $6,798,347 (2010: $6,773,013). This result includes the net incomederived from lease accounting for the portfolios of receivables the group acquired during the year as well as the costsincurred in restructuring its operations, primarily in Spain and Italy. The strong Australian dollar again weighed onearnings, with an estimated $476,000 impact on the reported after tax profit.
In the UK, the Group achieved a 61% increase in profit before tax contribution to $7.0 million. After adding back therecognition in the year of $1 million of deferred service income (Note 6) and $0.6 million from the change in estimaterelating to UK insurance income (Note 4), the UK business recorded an underlying 23% increase. This stellar result wasdriven by the 47% increase in the value of equipment financed as a result of the new Infinity product which was launchedin late 2010.
Short term incentive bonus
Amounts included in remuneration for the financial year represent the amount that vested in the financial year basedon achievement of personal goals and satisfaction of specified performance criteria. No amounts vest in futurefinancial years in respect of the bonus schemes for the 2011 financial year.The amounts forfeited are due to the performance or service criteria not being met in relation to the current financialyear.
The value of shares granted in the year is the fair value of the shares as determined in reference to the prevailingmarket price of the Company’s shares on the ASX.The value of shares vested during the year is calculated as the market price of shares of the Company on the ASX asat close of trading on the date the shares were vested.The value of the shares that lapsed during the year represents the benefit foregone and is determined in reference tothe prevailing market price of the Company’s shares on the ASX at the date the shares lapsed, with no adjustments forwhether the service criteria had been achieved.
16
For
per
sona
l use
onl
y
THINKSMART LIMITED DIRECTORS' REPORT
SIGNIFICANT CHANGES IN STATE OF AFFAIRS
DIVIDENDS
Cents per share
Total amount
Franked/ unfranked
Declared and paid during the year 2011Final 2010 ordinary 3.5c 4,545,779 45% franked
Dividends have been dealt within the financial report as:Note
Declared and paid during the year 2011Final 2010 ordinary 24(b)(ii)
SIGNIFICANT EVENTS AFTER THE BALANCE DATE
The period has been a transformational one for the Group which has undertaken significant investment in its fundingplatforms after raising the capital to do so in 2010. The group has completed its multi-funder securitisation platform andlaunched this with a facility from Westpac and later added Bendigo and Adelaide Bank to the panel of funders able tofinance lease and other receivables in the Australian market through this vehicle. The funding arrangements with thesefunders now extend into 2016 and provide the capacity for the Group to grow its receivables under management throughthe launching of new products in its core territories.
The Group secured ongoing funding for both its Infinity consumer rental product which was launched in November 2010,as well as its existing SmartPlan commercial small ticket leasing product. The new funding facility for £40 million extendsthree years to 2014 and has allowed the group to fund the 23% increase in UK assets under management it has generated,primarily through its Infinity product.
In furtherance of its strategy to expand distribution within its core territories, the Group extended retailer operatingagreements with Dixons (B2B) to 2015, JB HiFi to 2014, Officeworks to 2013 and signed a new retailer operatingagreement to 2016 with the Leading Edge group. In the second half of the year, the group also launched the ThinkSmartMarketplace, a web portal allowing prospective retailers to apply, undergo credit checks and upon approval, becomeaffiliated retailers of the RentSmart product in Australia. This allows the group to access the underserviced portion of theestimated $6 billion Australian technology market. This same platform will allow the group to launch new products in2012.
Given the adverse economic environment, particularly on continental Europe, the Group made the decision to cease writingnew business in Spain and Italy and has incurred restructuring costs in exiting those businesses.
During the period the group has invested significantly in its technology platform to improve customer delivery, signing anagreement with Silanis Inc to deliver e-signature technology across both Australia and the UK, a move which will see thegroup be able to transact fully on line from end to end. The group has also invested heavily in fraud and credit riskmitigation functionality in its patented QuickSmart credit decisioning system, with the aim of minimising credit risk furtherahead of completing its full transition to lease accounting for new originations.
During the financial year the group significantly transformed its funding arrangements as described in the Operating andFinancial Review and the financial statements and the notes thereto. There were no other significant changes in the state ofaffairs of the Company other than that referred to in the financial statements or notes thereto.
Dividends declared and paid by the Company to members since the end of the previous financial year were:
Date of payment
29-April-2011
Total amount ($)
4,545,779
Since the end of the financial year the Group has extended the maturity date of its corporate banking facilities to 30 June2013 and has drawn a further $1.2 million under this facility, taking the drawn balance of the $5 million facility to $3.7million. Also since the end of the financial year the Group has succeeded in removing the requirement for a £2 millionStandby Letter of Credit which had been issued in favour of its UK clearing bank and has received conditional credit approval for a $3 million extension of its corporate banking facilities to $8 million in total.
17
For
per
sona
l use
onl
y
THINKSMART LIMITED DIRECTORS' REPORT
LIKELY DEVELOPMENTS AND EXPECTED RESULTS
DIRECTORS’ INTERESTS
N MontarelloS PenglisD GriffithsF de VicenteN Fox
SHARE OPTIONSOptions granted to directors and officers of the Company
All options were granted during the financial year. No options have been granted since the end of the financial year.
Shares granted to directors and officers of the CompanyDuring or since the year end of the financial year, the Company granted shares for no consideration to the followingdirectors and to the following of the five most highly remunerated officers of the Company as part of their remuneration:
---
During or since the end of the financial year, the Company granted options for no consideration over unissued ordinaryshares in the Company to the following directors and to the following of the five most highly remunerated officers of theCompany as part of their remuneration:
Number of ordinary shares
22,520,997 3,000,0001,272,6002,160,000
-68,000
Number of options granted over ordinary shares
-
The Group will launch 2 new products in February 2012 which will see it significantly expand its addressable market bothin Australia and the UK. In Australia, the Group will launch the Fido payment plan product into new retail categories suitedto payment plans such as furniture, sports equipment and jewellery. In the UK, the Group will launch ThinkSmart BusinessLeasing, a non-Dixons commercial small ticket leasing product aimed at the under serviced commercial small ticket leasingmarket in the UK. The Group will seek equity funding to complement available debt facilities to invest in the growth opportunities providedby these new products.Further information about likely developments in the operations of the Group and the expected results of those operationsin future financial years has not been included in this report because disclosure of the information would be likely to resultin unreasonable prejudice to the Group.
The relevant interests of each director in the shares and options over such instruments issued by the companies within theGroup and other related bodies corporate, as notified by the directors to the Australian Securities Exchange in accordancewith s205G(1) of the Corporations Act 2001, at the date of this report is as follows:
ThinkSmart Limited
18
For
per
sona
l use
onl
y
THINKSMART LIMITED DIRECTORS' REPORT
No of shares granted
Share price at grant date
Vesting date
ExecutivesA Baum 125,000* $0.52 1/09/2014*Shares are escrowed for 3 years until 1 September 2014.
All shares were granted during the financial year. No shares have been granted since the end of the financial year.
Shares issued as a result of the exercise of optionsDuring the 2011 reporting period, no shares were issued as a result of the exercise of options.
Unissued shares under optionsAt the date of this report, unissued ordinary shares of the Company under option are:
Number of shares under
option
Exercise price of options
2,616,667 $0.622,166,667 $1.112,383,333 $0.84
These options do not entitle the holder to participate in any share issue of the Company or any other body corporate.
INDEMNIFICATION AND INSURANCE OF DIRECTORS AND OFFICERS
NON-AUDIT SERVICES
•
•
During the year KPMG, the Company auditor, has performed certain other services in addition to their statutory duties.
The company has not otherwise, during or since the financial year, indemnified or agreed to indemnify an officer or auditorof the company or of any related body corporate against a liability incurred by such an officer or director.
The Board has considered the non-audit services provided during the year by the auditor and in accordance with writtenadvice provided by resolution of the Audit Committee, is satisfied that the provision of those non-audit services during theyear by the auditors is compatible with, and did not compromise, the auditor independence requirements of theCorporations Act 2001 for the following reasons:
During the financial year, the company paid a premium in respect of a contract insuring the directors of the company (asnamed above), the company secretary and all executive officers of the company and of any related body corporate against aliability incurred as such a director, secretary or executive officer to the extent permitted by the Corporations Act 2001. Thecontract of insurance prohibits disclosure of the nature of the liability and the amount of the premium.
Details of the amounts paid to the auditor of the Group, KPMG, and its related practices for audit and non-audit servicesprovided during the year are set out in note 27.
All non-audit services are subject to the corporate governance procedures adopted by the Company and have beenreviewed by the Audit Committee to ensure they do not impact the integrity and objectivity of the auditor; and
The non-audit services provided do not undermine the general principles relating to auditor independence as set out inAPES 110 Code of Ethics for Professional Accountants , as they did not involve reviewing or auditing the auditor’sown work, acting in a management or decision making capacity for the Company, acting as an advocate for theCompany or jointly sharing risks and rewards.
31 December 201331 December 201431 December 2015
All options expire on the earlier of their expiry date or termination of the employee’s employment. Further details areincluded in the remuneration report on pages 7 to 16.
In accordance to the Company’s constitution, the Company must indemnify its directors and officers on a full indemnitybasis and to the full extent permitted by law against all liabilities incurred by the directors and officers in their capacity asan officer of the Company or of a related body corporate.
Expiry date of options
19
For
per
sona
l use
onl
y
For
per
sona
l use
onl
y
For
per
sona
l use
onl
y
For
per
sona
l use
onl
y
THINKSMART LIMITEDCONSOLIDATED STATEMENT OF COMPREHENSIVE INCOME
Notes 2011 2010$ $
Revenue 6(a) 45,474,004 42,110,562 Employee benefits expense 6(b) (13,796,347) (12,590,923)Indirect customer acquisition cost (9,752,934) (10,983,096)Occupancy costs (1,179,752) (1,065,424)Printing and stationery (371,347) (354,317)IT and communication costs (860,894) (690,852)Impairment losses on finance leases and receivables (1,521,704) (233,431)Professional services (1,504,025) (1,224,825)Insurance costs (201,714) (207,847)Travel costs (894,089) (906,518)Other costs (492,784) (608,800)Finance revenue 6(e) 880,244 441,009 Finance costs 6(e) (3,048,441) (959,036)Depreciation 6(c) (541,153) (465,167)Foreign exchange (loss)/gain 13,030 (492,911)Restructuring costs (401,856) - Impairment of intangible assets (68,683) - Earnings before tax and amortisation (EBTA) 11,731,555 11,768,424 Amortisation of intangibles 6(d) (1,720,343) (2,053,385)Profit before Tax 10,011,212 9,715,039 Income tax expense 7 (3,212,865) (2,942,026)Profit from continuing operations 6,798,347 6,773,013
Other comprehensive incomeForeign currency translation differences for foreign operations (64,556) (1,337,529)Effective portion of changes in fair value of cash flow hedges, net of (208,051) - Other comprehensive income for the period, net of income tax (272,606) (1,337,529)Total comprehensive income for the period attributable to owners of the Company 6,525,741 5,435,484
Earnings per shareBasic (cents per share) 33 5.23 6.52Diluted (cents per share) 33 5.23 6.29
The attached notes form an integral part of these consolidated financial statements.
Consolidated Statement of Comprehensive IncomeFor the Financial Year Ended 31 December 2011
23
For
per
sona
l use
onl
y
THINKSMART LIMITEDCONSOLIDATED STATEMENT OF FINANCIAL POSITION
Notes 2011 2010$ $
Current AssetsCash and cash equivalents 24(a) 4,610,532 21,186,022 Trade and other receivables 8 11,102,753 2,582,338 Lease receivables 9 38,419,290 - Inventories 10 57,672 57,707 Prepayments 11 3,335,775 3,276,469 Other 12 771,029 394,083 Total Current Assets 58,297,051 27,496,619 Non-Current AssetsDeposits held by funders 8 5,175,350 6,737,156 Lease receivables 9 28,006,496 - Prepayments 13 1,601,516 2,372,572 Plant and equipment 14 873,638 1,120,251 Intangibles 15 10,688,825 4,348,343 Goodwill 17 3,538,625 3,540,774 Deferred tax assets 7 - 287,676 Total Non-Current Assets 49,884,450 18,406,772 Total Assets 108,181,501 45,903,391 Current LiabilitiesTrade and other payables 19 6,903,386 4,317,611 Deferred service income 19 1,379,848 - Borrowings 20 2,426,713 2,489,944 Other interest bearing liabilities 21 36,731,444 - Tax payable 1,607,325 521,144 Provisions 19 510,805 507,867 Total Current Liabilities 49,559,521 7,836,566 Non-Current LiabilitiesDeferred service income 19 1,191,573 - Other interest bearing liabilities 21 16,990,940 - Deferred tax liability 7 173,293 367,698 Total Non-Current Liabilities 18,355,806 367,698 Total Liabilities 67,915,327 8,204,264 Net Assets 40,266,174 37,699,127 EquityIssued Capital 22(a) 39,663,558 39,615,239 Reserves 23 (3,869,576) (4,135,736)Accumulated profits/(losses) 4,472,192 2,219,624 Total Equity 40,266,174 37,699,127
The attached notes form an integral part of these consolidated financial statements.
Consolidated Statement of Financial PositionAs At 31 December 2011
24
For
per
sona
l use
onl
y
THINKSMART LIMITEDCONSOLIDATED STATEMENT OF CHANGES IN EQUITY
Consolidated Fully paid ordinary
shares
Equity settled employee benefits reserve
Foreign currency
translation reserve
Hedging reserve
Accumulated (Losses)/Profit
Attributable to equity
holders of the parent
$ $ $ $ $ $Balance at 1 January 2010 23,614,091 199,726 (3,034,333) - (2,615,601) 18,163,883 Profit for the period - - - - 6,773,013 6,773,013 Exchange differences arising on translation of foreign operations - (5,176) (1,332,353) - - (1,337,529)Net income recognised directly in equity - (5,176) (1,332,353) - 6,773,013 5,435,484 Total comprehensive income for the period - (5,176) (1,332,353) - 6,773,013 5,435,484 Transactions with owners of the Company, recognised directly in equityContributions by and distributions to owners of the CompanyIssue of ordinary shares, net of after tax capital raising costs 15,252,148 - - - - 15,252,148 Share options exercised 525,000 - - - - 525,000 Dividends paid - - - - (1,937,788) (1,937,788)Share-based payments held in escrow 224,000 (224,000) - - - - Recognition of share-based payments - 260,400 - - - 260,400 Balance at 31 December 2010 39,615,239 230,950 (4,366,686) - 2,219,624 37,699,127 Balance at 1 January 2011 39,615,239 230,950 (4,366,686) - 2,219,624 37,699,127 Profit for the period - - - - 6,798,347 6,798,347 Exchange differences arising on translation of foreign operations - - (64,556) - - (64,556)Effective portion of changes in fair value of cash flow hedges, net of tax - - - (208,051) - (208,050)Net income recognised directly in equity - - (64,556) (208,051) 6,798,347 6,525,741 Total comprehensive income for the period - - (64,556) (208,051) 6,798,347 6,525,741 Transactions with owners of the Company, recognised directly in equityContributions by and distributions to owners of the CompanyCapital raising costs (16,681) - - - - (16,681)Dividends paid - - - - (4,545,779) (4,545,779)Share-based payments held in escrow 65,000 (65,000) - - - - Recognition of share-based payments - 603,767 - - - 603,767 Balance at 31 December 2011 39,663,558 769,717 (4,431,242) (208,051) 4,472,192 40,266,174 The attached notes form an integral part of these consolidated financial statements.
Consolidated Statement of Changes in EquityFor the financial year ended 31 December 2011
25
For
per
sona
l use
onl
y
THINKSMART LIMITEDCONSOLIDATED STATEMENT OF CASH FLOWS
2011 2010$ $
Cash Flows from Operating ActivitiesReceipts from customers 45,961,583 36,882,735 Payments to suppliers and employees (27,907,991) (28,668,294)Interest received 943,669 437,417 Interest paid on corporate borrowings (154,692) (121,109)Interest paid on other interest bearing liabilities (1,130,184) - Payments for security guarantee (1,635,245) - Finance charges (1,593,724) (846,899)Income tax paid (2,071,359) (1,722,399)Net cash from operating activities 24(b) 12,412,057 5,961,451
Cash Flows from Investing ActivitiesPayments for plant and equipment (340,822) (625,535)Proceeds from sale of plant and equipment - 132,611 Payment for intangible assets – Software (1,573,780) (1,182,736)Payment for intangible assets – Contract rights (2,973,439) (1,551,111)Payment for leased assets (36,860,707) - Net cash used in investing activities (41,748,748) (3,226,771)
Cash Flows from Financing ActivitiesHire purchase and lease finance repaid - (3,543)Proceeds from rights issue - 16,000,000 Proceeds from exercise of share options - 525,000 Payments for equity raising costs - (1,068,354)Payments for establishing financing facilities (81,430) - Proceeds from other interest bearing liabilities 26,490,000 - Repayment of other interest bearing liabilities (9,260,377) - Proceeds of borrowings 2,500,000 - Repayment of borrowings (2,500,000)Dividend paid (4,545,779) (1,937,788)Net cash from financing activities 12,602,414 13,515,315
Net (decrease) / increase in cash and cash equivalents (16,734,277) 16,249,995 Effect of exchange rate fluctuations on cash held 158,787 (532,144)Cash and cash equivalents at beginning of the financial year 21,186,022 5,468,171 Total cash and cash equivalents at the end of the financial year 24(a) 4,610,532 21,186,022
Restricted cash and cash equivalents at the end of the financial year (2,028,210) (2,917,361)
Net available cash and cash equivalents at the end of the financial year 2,582,322 18,268,661 The attached notes form an integral part of these consolidated financial statements.
The attached notes form an integral part of these consolidated financial statements.
Consolidated Statement of Cash FlowFor the financial year ended 31 December 2011
Notes
26
For
per
sona
l use
onl
y
THINKSMART LIMITED NOTES TO THE FINANCIAL STATEMENTS
1. General Information
2. Basis of Preparation
(a) Statement of compliance
(b) Basis of measurement
(c) Functional and presentation currency
(d) Changes in accounting policiesInformation regarding changes to the accounting policies of the Group are found as follows:
(i) Removal of parent entity financial statements
(ii) Accounting policies available for early adoption not yet adoptedA number of new standards and interpretations are effective for annual periods beginning after 1 July 2011 and have notbeen applied in preparing this financial report. Where an assessment has been completed, none of these is expected to havea significant effect on the consolidated financial statements of the Group, except for IFRS 9 Financial Instruments , whichbecomes mandatory for the Group’s 2015 consolidated financial statements and could change the classification andmeasurement of financial assets. The Group does not plan to adopt this standard early and the extent of the impact has notbeen determined.
ThinkSmart Limited (the “Company”) is a publicly listed company, incorporated and domiciled in Australia. Theconsolidated financial statements of the Company as at and for the year ended 31 December 2011 comprise of the Companyand its subsidiaries (the “Group”). The Group’s principal activity is to arrange or provide finance for renting of equipmentin Australia, New Zealand and Europe. The address of the Company’s registered office is Level 1, The West Centre, 1260Hay Street West Perth WA 6005.
The consolidated financial statements are general purpose financial statements which have been prepared in accordancewith the Australian Accounting Standards (AASBs) adopted by the Australian Accounting Standards Board (AASB) andthe Corporations Act 2001. The consolidated financial statements comply with International Financial Reporting Standards(IFRSs) and interpretations adopted by the International Accounting Standards Board (IASB).
The consolidated financial statements were authorised for issue by the Board of Directors on 21 February 2012.
The financial report has been prepared on the basis of historical cost, except for the revaluation of certain non-current assetsand financial instruments. Cost is based on the fair values of the consideration given in exchange for assets. All amounts are presented in Australian Dollars unless otherwise noted.
These consolidated financial statements are presented in Australian dollars, which is the Company’s functional currency.
The Group has applied amendments to the Corporations Act (2001) that remove the requirement for the Group to lodgeparent entity financial statements. Parent entity financial statements have been replaced by the specific parent entitydisclosures in note 34.
27
For
per
sona
l use
onl
y
THINKSMART LIMITED NOTES TO THE FINANCIAL STATEMENTS
Title Application date of standard
Application date for Group
Financial Instruments
1-Jan-2013 1-Jan-2013
AASB 9 is applied.
Application of Tiers of Australian Accounting Standards
1-Jul-2013 1-Jan-2014
Amendments to Australian Accounting Standards arising from reduced disclosure requirements
1-Jul-2013 1-Jan-2014
AASB 2009-11
Amendments to Australian Accounting Standards arising from AASB 9
a) These amendments arise from the issuance of AASB 9 Financial Instruments that sets out requirements for the classification and measurement of financial assets.
(b) This Standard shall be applied when
1-Jan-2013
AASB 2010-2
The Group has not yet determined the extent of the impacts of the amendments, if any.
1-Jan-2013
The requirements for classifying and measuring financial liabilities were added to AASB 9. The existing requirements for the classification of financial liabilities and the ability to use the fair value option have been retained. However, where the fair value option is used for financial liabilities the change in fair value is accounted for as follows:(a) The change attributable to changes in credit risk are presented in other comprehensive income (OCI)(b) The remaining change is presented in profit or loss If this approach creates or enlarges an accounting mismatch in the profit or loss, the effect of the changes in credit risk are also presented in profit or loss.
AASB 2010-7
Amendments to Australian Accounting Standards arising from AASB 9
1-Jan-2013 The Group has not yet determined the extent of the impacts of the amendments, if any.
Reference Summary Impact on Group financial report
AASB9 AASB 9 includes requirements for the classification and measurement of financial assets resulting from the first part of Phase1 of the IASB’s project to replace IAS 39 Financial Instruments: Recognition and Measurement (AASB 139 Financial Instruments: Recognition and Measurement ). These requirements improve and simplify the approach for classification , measurement and de-recognition of financial assets compared with the requirements of AASB 139.
The Group has not yet determined the extent of the impacts of the amendments, if any.
1-Jan-2013
This Standard establishes a differential financial reporting framework consisting of two Tiers of reporting requirements for preparing general purpose financial statements.
AASB1053 The Group has not yet determined the extent of the impacts of the amendments, if any.
This Standard makes amendments to many Australian Accounting Standards, reducing the disclosure requirements for Tier 2 entities, identified in accordance with AASB 1053, preparing general purpose financial statements.
The Group has not yet determined the extent of the impacts of the amendments, if any.
28
For
per
sona
l use
onl
y
THINKSMART LIMITED NOTES TO THE FINANCIAL STATEMENTS
Title Application date of standard
Application date for Group
Amendments to Australian Accounting Standards to remove individual key management personnel disclosure requirements
1-Jul-2013 1-Jan-2014
Consolidated Financial Statements
1-Jan-2013 1-Jan-2013
Joint Arrangements
Disclosure of Interests in Other Entities
Separate Financial Statements
Investments in Associates
1-Jan-2013
AASB 12 ‘Disclosure of Interests in Other Entities’ applies to entities that have an interest in subsidiaries, joint arrangements, associates or unconsolidated structured entities. It serves to integrate the disclosure requirements of interests in other entities, currently included in several standards, and also adds additional requirements in a number of areas.
The definition of control includes three elements: power over an investee, exposure or rights to variable returns of the investee, and the ability to use power over the investee to affect the investor’s returns;
An investor would reassess whether it controls an investee if there is a change in facts and circumstances.
Amendments are not expected to have any significant impact on the Group.
Amendments to these standards are concurrent with the issue of AASB 10.
Key changes include: Using control as the single basis for consolidation, irrespective of the nature of the investee, eliminating the risks and rewards approach included in SIC-12;
Amendments are not expected to have any significant impact on the Group’s financial statements
1-Jan-2013AASB 11
AASB 12
AASB 127
AASB 128
AASB 10 Consolidated Financial Statements introduces control as the single basis for consolidation for all entities, regardless of the nature of the investee. AASB 10 replaces those parts of AASB 127 ‘Consolidated and Separate Financial Statements’ that address when and how an investor should prepare consolidated financial statements and replaces SIC-12 ‘Consolidation – Special Purpose Entities’ in its entirety.
Reference Summary Impact on Group financial report
AASB 2011-4
The amendment removes the requirement to include individual key management personnel disclosures in the notes to the financial statement. These disclosures will still need to be provided in the Remuneration Report under s.300A of the Corporations Act 2001. Early adoption is not permitted
The Group's financial statements will exclude these disclosures in the notes to the financial statements but still disclose these in the Director Report – remuneration report.
29
For
per
sona
l use
onl
y
THINKSMART LIMITED NOTES TO THE FINANCIAL STATEMENTS
Title Application date of standard
Application date for Group
Employee Benefits
1-Jan-2013 1-Jan-2013
3. Significant accounting policies
(a) Basis of consolidation(i) Subsidiaries
(ii) Special purpose entities
•
•
•
•
(iii) Transactions eliminated on consolidation
Amendments will result in changes to the recognition and measurement of defined benefit pension expense and termination benefits, and to the disclosures for all employee benefits.
The group has not yet determined the extent of the impacts of the amendments, if any.
Items are presented separately, in two groups in OCI, based on whether or not they may be recycled to profit or loss in the future; andWhere OCI items have been presented before tax, the amount of tax related to the two groups will need to be shown.
The group has not yet determined the extent of the impacts of the amendments, if any.
AASB 119
The amendment changes the disclosure of items presented in OCI in the Statement of Comprehensive Income. The key changes include:
AASB 101
Reference Summary Impact on Group financial report
1-Jan-20131-Jul-2012Presentation of Financial Statements
The consolidated financial statements incorporate the financial statements of the company and entities controlled by thecompany (its subsidiaries). Control is achieved when the company has the power to govern the financial and operatingpolicies of an entity so as to obtain the benefits from its activities. The results of subsidiaries acquired or disposed of duringthe year are included in the consolidated income statement from the effective date of acquisition or up to the effective dateof disposal, as appropriate. The accounting policies of subsidiaries have been changed when necessary to align them withthe policies adopted by the Group.
The Group has established a special purpose entity (SPE) ThinkSmart Trust for the purpose of securitising finance leasereceivables acquired and other receivables it intends to originate. The SPE entity is wholly owned by the Group andincluded in the consolidated financial statements of the Group, based on the evaluation of the substance of its relationshipwith the Group and the SPE's risks and rewards. The following circumstances indicate a relationship in which the Groupcontrols and subsequently consolidates the SPE:
Where necessary, adjustments are made to the financial statements of subsidiaries to bring their accounting policies in linewith those by other members of the Group. All intra-group balances, transactions, income and expenses are eliminated infull on consolidation.
The activities of the SPE are being conducted on behalf of the Group according to its specific business needs so thatthe Group obtains benefits from the SPE's operation.The Group has the decision making powers to obtain the majority of the benefits of the activities of the SPE or, bysetting up an 'autopilot mechanism', the Group has delegated these decision making powers.The Group has rights to obtain the majority of the benefits of the SPE and therefore may be exposed to risks incidentto the activity of the SPE.The Group retains the majority of the residual of ownership risks of the SPE or its asset in order to obtain benefitsfrom its activities.
The accounting policies set out below have been applied consistently to all periods presented in these consolidated financialstatements, and have been applied consistently by Group entities.Certain comparative amounts have been reclassified to conform with the current year’s presentation (see note 6(f)).
30
For
per
sona
l use
onl
y
THINKSMART LIMITED NOTES TO THE FINANCIAL STATEMENTS
(b) Business combinations
Measuring goodwill
Share-based payment awards
Contingent liabilities
Non-controlling interest
Transaction costs
(c) Cash and cash equivalents
Bank overdrafts are shown within borrowings in current liabilities in the balance sheet.
(d) Plant and equipmentRecognition and measurement
DepreciationDepreciation is based on the cost of an asset less its residual value. Significant component of individual assets are assessedand if a component has a useful life that is different from the remainder of the asset, that component is depreciatedseparately.
Consideration transferred includes the fair values of the asset transferred, liabilities incurred by the Group to the previousowners of the acquiree, and equity interests issued by the Group. Consideration transferred also includes the fair value ofany contingent consideration and share-based payment awards of the acquiree that are replaced mandatorily in the businesscombination (see below).
When share-based payment awards exchanges (replacement awards) for awards held by acquiree’s employees (acquiree’sawards) relate to past services, then a part of the market-based measure of the awards replaced is included in theconsideration transferred. If they require future services, then the difference between the amount included in considerationtransferred and the market-based measure of the replacement awards is treated as post-combination remuneration cost.
A contingent liability of the acquiree is assumed in a business combination only if such a liability represents a presentobligation and arises from a past event, and its fair value can be measured reliably.
The group measures any non-controlling interest at its proportionate interest in the identifiable net assets of the acquiree.
Transaction costs that the Group incurs in connection with a business combination, such as finder’s fees, legal fees, duediligence fees, and other professional and consulting fees, are expensed as incurred.
Cash comprises cash on hand and demand deposits. Cash equivalents are short-term, highly liquid investments that arereadily converted to known amounts of cash and which are subject to an insignificant risk of change in value.
Items of property, plant and equipment are measured at cost less accumulated depreciation and accumulated impairmentlosses. Cost includes expenditure that is directly attributable to the acquisition of the asset. Purchased software that isintegral to the functionality of the related equipment is capitalised as part of that equipment.
When parts of an item of property, plant and equipment have different useful lives they are accounted for as separate items(major components) of property, plant and equipment.
The gain or loss on disposal of an item of property, plant and equipment is determined by comparing the proceeds fromdisposal with the carrying amount of the property, plant and equipment, and is recognised net within other income/otherexpenses in profit or loss.
For every business combination, the Group identifies the acquirer, which is the combining entity that obtains control of theother combining entities or businesses. Control is the power to govern the financial and operating policies of an entity so asto obtain benefits from its activities. In assessing control, the Group takes into consideration potential voting rights thatcurrently are exercisable. The acquisition date is the date on which control is transferred to the acquirer. Judgement isapplied in determining the acquisition date and determining whether control is transferred from one party to another.
The Group measures goodwill as the fair value of consideration transferred including the recognised amount of any non-controlling interest in the acquiree, less the net recognised amount (generally fair value) of the identifiable assets acquiredand liabilities assumed, all measured as of the acquisition date.
31
For
per
sona
l use
onl
y
THINKSMART LIMITED NOTES TO THE FINANCIAL STATEMENTS
The following estimated useful lives are used in the calculation of depreciation:- Office furniture, fittings, equipment and computers 2.5 to 5 years- Leasehold improvements the lease term - Self-funded rental assets 2.5 to 5 years- Motor vehicles 5 years- Leased computer equipment and software 2.5 to 5 years
Depreciation methods, useful lives and residual values are reviewed at each reporting date.
(e) Leased assets
Operating leases
Finance leases
(f) Trade and other accounts payables
(g) InvestmentsInvestments in controlled entities are recorded at the lower of cost and recoverable amount.
Depreciation is recognised in profit or loss on a straight-line basis over the estimated useful lives of each component of anitem of property, plant and equipment. Leased assets are depreciated over the shorter of the lease term and their useful livesunless it is reasonably certain that the Group will obtain ownership by the end of the lease term.
Leases are classified at their inception as either operating or finance leases based on the economic substance of theagreement so as to reflect the risks and benefits incidental to ownership.
The minimum lease payments of operating leases, where the lessor effectively retains substantially all of the risks andbenefits of ownership of the leased item, are recognised as an expense on a straight line basis.
Leases which effectively transfer substantially all of the risks and benefits incidental to ownership of the leased item to theconsolidated entity are capitalised at the present value of the minimum lease payments and disclosed as plant andequipment under lease. A lease liability of equal value is also recognised.
Capitalised lease assets are depreciated over the shorter of the estimated useful life of the assets and the lease term.Minimum lease payments are allocated between interest expense and reduction of the lease liability with the interestexpense calculated using the interest rate implicit in the lease and charged directly to the profit and loss.
Trade payables are recognised when the consolidated entity becomes obliged to make future payments resulting from thepurchase of goods and services.
The group initially recognises loans and receivables and deposits on the date that they are originated. All other financialassets (including assets designated at fair value through profit or loss) are recognised initially on the trade date at which theGroup becomes a party to the contractual provisions of the instrument.
The group derecognises a financial asset when the contractual rights to the cash flows from the asset expire, or it transfersthe right to receive the contractual cash flows on the financial asset in a transaction in which substantially all the risks andrewards of ownership of the financial asset are transferred. Any interest in transferred financial assets that is created orretained by the group is recognised as a separate asset or liability.
Financial assets and liabilities are offset and the net amount presented in the statement of financial position when, and onlywhen, the group has a legal right to offset the amounts and intends either to settle on a net basis or to realise the asset andsettle the liability simultaneously.
32
For
per
sona
l use
onl
y
THINKSMART LIMITED NOTES TO THE FINANCIAL STATEMENTS
Investments
Lease receivable
Unearned interest
Initial direct transaction costs
Allowance for losses
Effective interest method
Loans and receivables
Insurance prepayment
(ii) Non-derivative financial liabilities
The collectability of lease receivables is assessed on an ongoing basis. A provision is made for losses based onhistorical rates of arrears and the current delinquency position of the portfolio.
In respect to the UK operations, when an equipment insurance policy is issued by Allianz to RentSmart Limited’scustomers, RentSmart Limited pays the customer’s insurance premium to Allianz. RentSmart Limited subsequently collectsthe insurance premium from the customer on a monthly basis over the life of the rental agreement. Where a policy iscancelled, the unexpired premiums are refunded to RentSmart Limited.
The Group initially recognises debt securities issued and subordinated liabilities on the date that they are originated. TheGroup derecognises a financial liability when its contractual obligations are discharged or cancelled or expire.
Financial liabilities are recognised initially at fair value plus any directly attributable transaction costs. Subsequent to initialrecognition, these financial liabilities are measured at amortised cost using the effective interest rate method.
Investments are recognised and derecognised on trade date where purchase or sale of an investment is under a contractwhose terms require delivery of the investment within the timeframe established by the market concerned, and are initiallymeasured at fair value net of transaction costs. Subsequent to initial recognition, investments in subsidiaries are measured atcost in the company financial statements. Subsequent to initial recognition, investments in associates are accounted forunder the equity method in the consolidated financial statements and the cost method in the company. Other financial assetsare classified into the following specified categories: financial assets at ‘fair value through profit and loss’, ‘held-to-maturity’ investments, ‘available-for-sale’ financial assets and ‘loans and receivables’. The classification depends on thenature and purpose of the financial assets and is determined at the time of initial recognition.
The effective interest method is a method of calculating the amortised cost of a financial asset and allocating interestincome over the relevant period. The effective interest rate is the rate that exactly discounts estimated future cash receiptsthrough the expected life of the financial asset or, where appropriate, a shorter period.
Loans and receivables are financial assets with fixed or determinable payments that are not quoted in an active market.Such assets are recognised initially at fair value plus any directly attributable transaction costs. Subsequent to initialrecognition loans and receivables are measured at amortised cost using the effective interest method, less any impairmentlosses.
The Group has entered into financing transactions with customers and has classified its leases as finance leases foraccounting purposes. Under a finance lease, substantially all the risks and benefits incidental to the ownership of the leasedasset are transferred by the lessor to the lessee. The Group recognises at the beginning of the lease term an asset at anamount equal to the aggregate of the present value (discounted at the interest rate implicit in the lease) of the minimumlease payments and an estimate of the value of any unguaranteed residual value expected to accrue to the benefit of theGroup at the end of the lease term. This asset represents the Group’s net investment in the lease. Finance leases acquiredfrom other parties are recognised at fair value including direct and incremental costs and subsequently remeasured atamortised cost using the effective interest rate method and are presented net of provisions for impairment.
Unearned interest on leases and other receivables is brought to account over the life of the lease contract based on theinterest rate implicit in the lease using the effective interest rate method.
Initial direct costs or directly attributable, incremental transaction costs incurred in the origination of leases areincluded as part of receivables in the balance sheet and are amortised in the calculation of lease income and interestincome.
33
For
per
sona
l use
onl
y
THINKSMART LIMITED NOTES TO THE FINANCIAL STATEMENTS
Financial guarantee contracts
(iii) Impairment of assetsFinancial assets, including finance lease receivables
Non-financial assets
Capitalised borrowing costs consist of legal and other costs that are incurred in connection with the borrowing of funds.These costs are capitalised and then amortised over the life of the loan.
Financial guarantees issued by the Group are recognised as financial liabilities at the date the guarantee is issued. Liabilitiesarising from financial guarantee contracts, including where applicable, guarantees of subsidiaries through deeds of crossguarantee, are initially recognised at fair value and subsequently at the higher of the amount of projected future losses andthe amount initially recognised less cumulative amortisation.
The fair value of the financial guarantee is determined by way of calculating the present value of the difference in net cashflows between the contractual payments under the debt instrument and the payments that would be required without theguarantee, or the estimated amount that would be payable to a third party for assuming the obligation.
Any increase in the liability relating to financial guarantees is recognised in the Statement of Comprehensive Income. Anyliability remaining is derecognised in the Statement of Comprehensive Income when the guarantee is discharged, cancelledor expires.
Individually significant financial assets are tested for impairment on an individual basis. The remaining financial assets areassessed collectively in groups that share similar credit risk characteristics.
All impairment losses are recognised in profit and loss. Any cumulative loss in respect of an available-for-sale financialasset recognised previously in equity is transferred to profit and loss.
An impairment loss is reversed if the reversal can be related objectively to an event occurring after the impairment loss wasrecognised. For financial assets measured at amortised cost and available-for-sale financial assets that are debt securities,the reversal is recognised in profit and loss. For available-for-sale financial assets that are equity securities, the reversal isrecognised directly in other comprehensive income.
The carrying amounts of the Group’s non-financial assets, other than inventories and deferred tax assets, are reviewed ateach reporting date to determine whether there is any indication of impairment. If any such indication exists then the asset’srecoverable amount is estimated. For goodwill and intangible assets that have indefinite lives or that are not yet availablefor use, the recoverable amount is estimated at each reporting date.
The recoverable amount of an asset or cash-generating unit is the greater of its value in use and its fair value less costs tosell. In assessing value in use, the estimated future cash flows are discounted to their present value using a pre-tax discountrate that reflects current market assessments of the time value of money and the risks specific to the asset. For the purposeof impairment testing, assets are grouped together into the smallest group of assets that generates cash inflows fromcontinuing use that are largely independent of the cash inflows of other assets or groups of assets (the “cash-generatingunit”). The goodwill acquired in a business combination, for the purpose of impairment testing, is allocated to cash-generating units that are expected to benefit from the synergies of the combination.
A financial asset is assessed at each reporting date to determine whether there is any objective evidence that it is impaired.A financial asset is considered to be impaired if objective evidence indicates that one or more events have had a negativeeffect on the estimated future cash flows of that asset.
An impairment loss in respect of a financial asset measured at amortised cost is calculated as the difference between itscarrying amount, and the present value of the estimated future cash flows discounted at the original effective interest rate.An impairment loss in respect of an available-for sale financial asset is calculated by reference to its fair value.
In assessing collective impairment, the Group uses modelling of historical trends of the probability of defaults, timing ofrecoveries and the amount of loss incurred. Impairment losses on assets carried at amortised cost are measured as thedifference between the carrying amount of the financial assets and the present value of the estimated future cash flowsdiscounted at the assets original effective interest rate. Given the relatively short period between the recognition of arrearsbalances and recovery or write-off, the effect of discounting is not generally considered material.
34
For
per
sona
l use
onl
y
THINKSMART LIMITED NOTES TO THE FINANCIAL STATEMENTS
(i) Intangible assets Intellectual property
Distribution network assets
Inertia Assets
Contract Rights
Software development
Amortisation is based on cost less estimated residual value.
At the end of the hiring term the intangible asset is derecognised and the group recognises the equipment as inventory at thecorresponding value.
Software development relates to the development of the Group’s proprietary SmartCheck credit application processingsoftware system. Software development costs are capitalised only up to the point when the software has been tested and isready for use in the manner intended by management.
Software development expenditure is capitalised only if the development costs can be measured reliably, the productprocess is technically and commercially feasible, future economic benefits are probable, and the Group intends to and hassufficient resources to complete development and to use or sell the asset. The expenditure capitalised includes the cost ofdirect labour and overhead costs that are directly attributable to preparing the asset for its intended use.
The intangible asset is amortised on a straight line basis over its estimated useful life, which is 4 years. Capitalised softwaredevelopment expenditure is measured at cost less accumulated amortisation and accumulated impairment losses.
Distribution networks represent the value attributable to the retailer network from which rental contracts are originated. Theintangible asset is amortised on a straight line basis until the expected expiry of the contract, which is 4.5 years.
The contractual rights obtained by the Group under financing agreements entered into with its funding partners andoperating agreements with its retail partners constitute intangible assets with finite useful lives. These contract rights arerecognised initially at cost and amortised over their expected useful lives. In relation to funder contact rights, the expecteduseful life is the earlier of the initial contract term or expected period until facility limit is reached. At each reporting date areview for indicators of impairment is conducted.
An impairment loss is recognised if the carrying amount of an asset or its cash-generating unit exceeds its recoverableamount. Impairment losses are recognised in profit or loss. Impairment losses recognised in respect of cash-generating unitsare allocated first to reduce the carrying amount of the other assets in the unit (groups of units) on a pro rata basis.
An impairment loss in respect of goodwill is not reversed. In respect of other assets, impairment losses recognised in theprior periods are assessed at each reporting date for any indications that the loss has decreased or no longer exists. Animpairment loss is reversed if there has been a change in the estimates used to determine the recoverable amount. Animpairment loss is reversed only to the extent that the asset’s carrying amount does not exceed the carrying amount thatwould have been determined, net of depreciation or amortisation, if no impairment loss had been recognised.
Intellectual property is recorded at the cost of acquisition over the fair value of the identifiable net assets acquired, and isamortised on a straight line basis over 20 years.
The group recognises an intangible asset arising if it has the unconditional contractual right to receive income arising fromequipment and rights to the hiring agreement at the end of term. This inertia asset is measured at fair value at the inceptionof the hiring agreement, and is based on discounted cash flows expected to be derived from the sale or hire of the assets atthe end of the term. Subsequent to initial recognition the intangible asset is measured at cost.
Intangible assets acquired in a business combination are identified and recognised separately from goodwill where theysatisfy the definition of an intangible asset and their fair values can be measured reliably. Intangible assets recognised are“distribution networks” acquired on the acquisition of RentSmart Limited on 1 December 2006.
35
For
per
sona
l use
onl
y
THINKSMART LIMITED NOTES TO THE FINANCIAL STATEMENTS
(j) Goodwill
(k) Government grants
(l) Employee benefits
Share-based payments
The Group pays defined contributions for post-employment benefit into a separate entity. Obligations for contributions to defined contribution pension plans are recognised as an employee benefit expense in profit or loss in the periods during which services are rendered by employees.
The grant date fair value of share-based payment awards granted to employees is recognised as an employee expense, witha corresponding increase in equity, over the period that the employees unconditionally become entitled to the awards. Theamount recognised as an expense is adjusted to reflect the number of awards for which the related service and non-marketvesting conditions are expected to be met, such that the amount ultimately recognised as an expense is based on the numberof awards that do not meet the related service and non-market performance conditions at the vesting date. For share-basedpayment awards with non-vesting conditions, the grant date fair value of the share-based payment is measured to reflectsuch conditions and there is no true-up for differences between expected and actual outcomes.
On disposal of an operation within a CGU, the attributable goodwill is included in the determination of the profit or loss ofdisposal on the operation.
Government grants are assistance by the Government in the form of transfer of resources to the company in return for pastor future compliance with certain conditions to the operating activities of the company. Government grants are notrecognised until there is reasonable assurance that the company will or has complied with the conditions attaching to themand the grants will be received. Government grants are recognised as income over the periods necessary to match them withthe related costs which they are intended to compensate. Government grants that are receivable as remuneration forexpenses or losses already incurred are recognised as income of the period in which it becomes receivable.
A liability is recognised for benefits accruing to employees in respect of wages and salaries and annual leave when it isprobable that settlement will be required and they are capable of being measured reliably.
The group’s net obligation in respect of long service leave is the amount of future benefit that employees earned in returnfor their service in the current and prior periods plus related on-costs; that benefit is discounted to determine its presentvalue, and the fair value of any related assets is deducted.
Liabilities recognised in respect of employee benefits, which are expected to be settled within 12 months, are measured attheir nominal values, using the remuneration rate expected to apply at the time of settlement.
Liabilities recognised in respect of employee benefits, which are not expected to be settled within 12 months, are measuredat their present value of the estimated future cash flows to be made by the group.
Termination benefits are recognised as an expense when the Group is committed, it is probable that settlement will berequired, and they are capable of being reliably measured. If benefits are payable more than 12 months after the reportingdate, then they are discounted to their present value.
Goodwill acquired in a business combination is initially measured at its cost, being the excess of the cost of the businesscombination over the acquirer’s interest in the net fair value of the identifiable assets, liabilities and contingent liabilitiesrecognised. Goodwill is subsequently measured at its cost less any impairment losses.
For the purpose of impairment testing, goodwill is allocated to each of the Group’s cash generating units (CGUs) or groupsof CGUs, expected to benefit from the synergies of the business combination. CGUs (or groups of CGUs) to whichgoodwill has been allocated are tested for impairment annually, or more frequently if events or changes in circumstancesindicate that goodwill might be impaired.
If the recoverable amount of the CGU (or group of CGUs) is less than the carrying amount of the CGU (or group ofCGUs), the impairment loss is allocated first to reduce the carrying amount of any goodwill allocated to the CGU (or groupof CGUs) and then to the other assets of the CGU (or group of CGUs) pro-rata on the basis of the carrying amount of eachasset in the CGU (or CGUs). The impairment loss recognised for goodwill is recognised immediately in the profit or lossand is not reversed in the subsequent period.
36
For
per
sona
l use
onl
y
THINKSMART LIMITED NOTES TO THE FINANCIAL STATEMENTS
(m) Inventories
(n) Revenue recognition
Finance Lease Income
Commission income
Residual interest in equipment (inertia revenue) • Secondary rental income
• Income earned from sale of equipmentProceeds from the sale of rental assets are brought to account at the time of the sale.
Insurance income
(o) Derivative financial instruments, including hedge accounting
Rental income from extended rental assets is recognised when receivable usually on a monthly basis. No ongoingrental income is brought to account in respect of the unexpired rental contracts.
The Group makes an assessment, both at the inception of the hedge relationship as well as on an ongoing basis, whether thehedging instruments are expected to be “highly effective” in offsetting the changes in cash flows of the respective hedgeditems attributable to hedged risk, and whether the actual results of each hedge are within a range of 80 – 125 percent. For acash flow hedge of a forecast transaction, the transaction should be highly probable to occur and should present anexposure to variations in cash flows that could ultimately affect reported profit or loss.
Inventories are valued at the lower of cost and net realisable value. Net realisable value represents the estimated sellingprice less all estimated costs of completion and costs necessary to make use for sale.
Revenue is measured at the fair value of the consideration received or receivable and is recognised to the extent that it isprobable that the economic benefits will flow to the entity and the revenue can be reliably measured. The following specificrecognition criteria must also be met before revenue is recognised:
Finance lease income is recognised on those leases originated or acquired by the Group where the Group, rather than a thirdparty financier, is the lessor. Finance lease income is recognised on the effective interest rate method at the constant rate ofreturn which amortises over its economic life, the lease asset down to the estimate of any unguaranteed residual value thatis expected to be accrue to the Group at the end of the lease.
Commission receivable from funders is recognised at the time finance approval is given to the customer, adjusted for anallowance for loans not expected to proceed to a contract by the funder.
Insurance income includes commissions received on insurance policies issued by third party insurers to cover theft anddamage of rental equipment. In the UK, insurance income is recognised at fair value of the future payments receivable assubstantially all of the services to earn that revenue are completed upfront. The revenue recognition policy for theAustralian insurance income is consistent with the treatment of commission income from funders.
On initial designation of the derivative as the hedging instrument, the Group formally documents the relationship betweenthe hedging instrument and the hedged item, including the risk management objectives and strategy in undertaking thehedge transaction and the hedged risk, together with the methods that will be used to assess the effectiveness of the hedgingrelationship.
Derivatives are recognised initially at fair value; attributable transaction costs are recognised in profit or loss as incurred.Subsequent to initial recognition, derivatives are measured at fair value and changes therein are accounted for as describedbelow. The fair values of derivatives used for hedging purposes are disclosed in note 30(b). Movements in the hedgingreserve in shareholder equity are shown in the Statement of Changes in Equity.
The Group holds derivative financial instruments to hedge its interest rate risk exposures, predominately in the ThinkSmartTrust.
Income arising on recognition of any intangible inertia asset at the commencement of the lease is deferred and recognised over the lease term on a straight line basis as the services are rendered.
Deferred Service Income
37
For
per
sona
l use
onl
y
THINKSMART LIMITED NOTES TO THE FINANCIAL STATEMENTS
Cash flow hedges
Share capital
(p) Income taxCurrent tax
Deferred taxDeferred tax is accounted for using the comprehensive balance sheet liability method in respect of temporary differencesarising from differences between the carrying amount of assets and liabilities in the financial statements and thecorresponding tax base of those items.
In principle, deferred tax liabilities are recognised for all taxable temporary differences. Deferred tax assets are recognisedto the extent that it is probable that sufficient taxable amounts will be available against which deductible temporarydifferences or unused tax losses and tax offsets can be utilised. However, deferred tax assets and liabilities are notrecognised if the temporary differences giving rise to them arise from the initial recognition of assets and liabilities (otherthan as a result of a business combination) which affects neither taxable income nor accounting profit. Furthermore, adeferred tax liability is not recognised in relation to taxable temporary differences arising from goodwill.
Deferred tax liabilities are recognised for taxable temporary differences arising on investments in subsidiaries and jointventures except where the Consolidated Entity is able to control the reversal of the temporary differences and it is probablethat the temporary differences will not reverse in the foreseeable future.
Deferred tax assets and liabilities are measured at the tax rates that are expected to apply to the period(s) when the asset andliability giving rise to them are realised or settled, based on tax rates (and tax laws) that have been enacted or substantivelyenacted by reporting date. The measurement of deferred tax liabilities and assets reflects the tax consequences that wouldfollow from the manner in which the Consolidated Entity expects, at the reporting date, to recover or settle the carryingamount of its assets and liabilities.
Deferred tax assets and liabilities are offset when they relate to income taxes levied by the same taxation authority and theCompany/Consolidated Entity intends to settle its current tax assets and liabilities on a net basis.
Deferred tax assets arising from deductible temporary differences associated with these investments and interests are onlyrecognised to the extent that it is probable that there will be sufficient taxable profits against which to utilise the benefits ofthe temporary differences and they are expected to reverse in the foreseeable future.
When a derivative is designated as the hedging instrument in a hedge of the variability in cash flows attributable to aparticular risk associated with a recognised asset or liability or a highly probable forecast transaction that could affect profitor loss, the effective portion of changes in the fair value of the derivative is recognised in other comprehensive income andpresented in the hedging reserve in equity. Any ineffective portion of changes in the fair value of the derivative isrecognised immediately in profit or loss.
When the hedged item is a non-financial asset, the amount recognised in equity is included in the carrying amount of theasset when the asset is recognised. In other cases the amount accumulated in equity is reclassified to profit or loss in thesame period that the hedged item affects profit or loss. If the hedging instrument no longer meets the criteria for hedgeaccounting, expires or is sold, terminated or exercised, or the designation is revoked, then hedge accounting is discontinuedprospectively. If the forecast transaction is no longer expected to occur, then the balance in equity is reclassified in profit orloss.
Ordinary shares are classified as equity. Incremental costs directly attributable to issue of ordinary shares and share optionsare recognised as a deduction from equity, net of any tax effects.
Current tax is calculated by reference to the amount of income taxes payable or recoverable in respect of the taxable profitor tax loss for the period. It is calculated using tax rates and tax laws that have been enacted or substantively enacted byreporting date. Current tax for current and prior periods is recognised as a liability (or asset) to the extent that it is unpaid(or refundable).
38
For
per
sona
l use
onl
y
THINKSMART LIMITED NOTES TO THE FINANCIAL STATEMENTS
Current and deferred tax for the period
Tax consolidation
(q) Goods and services taxRevenues, expenses and assets are recognised net of the amount of goods and services tax (GST) except:i)
ii) receivables and payables which are recognised inclusive of GST.
(r) Foreign currency transactionsFunctional and presentation currency
Foreign currency transactions
Items included in the financial statements of each of the Group’s entities are measured using the currency of the primaryeconomic environment in which the Entity operates (“the functional currency”).
The Consolidated financial statements are presented in Australian dollars, which is ThinkSmart Limited’s functional andpresentation currency. Foreign currency gains and losses are reported on a net basis.
The net amount of GST recoverable from, or payable to, the taxation authority is included as part of receivables orpayables.
Transactions in foreign currencies are translated to the respective functional currencies of Group entities at exchange ratesprevailing at the dates of the transactions. Monetary assets and liabilities denominated in foreign currencies at the reportingdate are retranslated to the functional currency at the exchange rate at that date. The foreign currency gain or loss onmonetary items is the difference between amortised cost in the functional currency at the beginning of the period, adjustedfor effective interest and payments during the period, and the amortised cost in foreign currency translated at the exchangerate at the end of the year.Non-monetary assets and liabilities denominated in foreign currencies that are measured at fair value are retranslated to thefunctional currency at the exchange rate at the date that the fair value was determined. Non-monetary items in a foreigncurrency that are measured in terms of historical cost are translated using the exchange rate at the date of the transaction.Foreign currency differences arising on retranslation are presented in profit or loss on a net basis, except for differencesarising on the retranslation of a financial liability designated as a hedge of the net investment in a foreign operation that iseffective, which are recognised in other comprehensive income.
Cash flows are included in the statement of cash flows on a gross basis. The GST component of cash flows arising frominvesting and financing activities which is recoverable from, or payable to, the taxation authority is classified as operatingcash flows.
Current and deferred tax is recognised as an expense or income in the income statement, except when it relates to itemscredited or debited directly to equity, in which case the deferred tax is also recognised directly in equity, or where it arisesfrom the initial accounting for a business combination, in which case it is taken into account in the determination ofgoodwill or excess purchase consideration.
The Company and its wholly owned Australian resident entities formed a tax-consolidated group during 2009. As aconsequence, all members of the tax-consolidated group are taxed as a single entity from 1 January 2009. The head entitywithin the tax-consolidated group is ThinkSmart Ltd.
where the amount of GST incurred is not recoverable from the taxation authority, it is recognised as part of the cost ofacquisition of an asset or as part of an item of expense; and
39
For
per
sona
l use
onl
y
THINKSMART LIMITED NOTES TO THE FINANCIAL STATEMENTS
Foreign operations
(s) Earnings per shareBasic earnings per share
Diluted earnings per share
(t) Provisions
(u) Lease payments
(v) Finance income and expenses
Basic earnings per share is calculated by dividing the profit attributable to equity holders of the Company, excluding anycosts of servicing equity other than ordinary shares, by the weighted average number of ordinary shares outstanding duringthe year, adjusted for bonus elements in ordinary shares issued during the year.
Diluted earnings per share adjusts the figures used in the determination of basic earnings per share to take into account theafter income tax effect of interest and other financing costs associated with dilutive potential ordinary shares and theweighted average number of shares assumed to have been issued for no consideration in relation to dilutive potentialordinary shares.
A provision is recognised if, as a result of a past event, the Group has a present legal or constructive obligation that can beestimated reliably, and it is probable that an outflow of economic benefits will be required to settle the obligations.Provisions are determined by discounting the expected future cash flows at a pre-tax rate that reflects current marketassessments of the time value of money and the risks specific to the liability.
Payments made under operating leases are recognised in profit or loss on a straight line basis over the term of the lease.Lease incentives received are recognised as an integral part of the total lease expense, over the term of the lease.
Minimum lease payments made under finance leases are apportioned between the finance expense and the reduction of theoutstanding liability. The finance expense is allocated to each period during the lease term so as to produce a constantperiod rate of interest on the remaining balance of the liability.
Contingent lease payments are accounted for by revising the minimum lease payments over the remaining term of the leasewhen the contingency no longer exists and the lease adjustments are known.
Finance income comprises interest income on funds invested (included available-for-sale financial assets), dividendincome, gains on disposal of available-for-sale financial assets and changes in fair value of financial assets at fair valuethrough profit or loss. Interest income is recognised as it accrues in profit or loss, using the effective interest method.Dividend income is recognised in profit or loss on the date the Group’s right to receive payment is established, which in thecase of quoted securities is the ex-dividend date.
The assets and liabilities of foreign operations, including goodwill and fair value adjustments arising on acquisition, aretranslated to the functional currency at exchange rates prevailing at the reporting date. The income and expenses of foreignoperations, excluding foreign operations in hyperinflationary economies, are translated to Australian dollars at exchangerates at the dates of the transactions.The income and expenses of foreign operations in hyperinflationary economies are translated to the functional currency atthe reporting date. Prior to translating the financial statements of foreign operations in hyperinflationary economies, theirfinancial statements for the current period are restated to account for changes in the general purchasing power of the localcurrency. The restatement is based on relevant price indices at the reporting date.
Foreign currency differences are recognised in other comprehensive income, and presented in the foreign currencytranslation reserve in equity. However, if the operation is not a wholly-owned subsidiary, then the relevant proportionateshare of the translation difference is allocated to the non-controlling interests. When a foreign operation is disposed of suchthat control, significant influence or joint control is lost, the cumulative amount in the translation reserve related to thatforeign operation is reclassified to the profit or loss as part of the gain or loss on disposal. When the Group disposes of onlypart of its interest in a subsidiary that includes a foreign operation while retaining control, the relevant proportion of thecumulative amount is reattributed to non-controlling interests. When the Group disposes of only part of its investment in anassociate or joint venture that includes a foreign operation while retaining significant influence or joint control, the relevantproportion of the cumulative amount is classified to profit or loss.
40
For
per
sona
l use
onl
y
THINKSMART LIMITED NOTES TO THE FINANCIAL STATEMENTS
(w) Segment reporting
(x) Determination of fair value
Intangible assets
Intangible inertia asset
Trade and other receivables
Non-derivative financial liabilities
Share-based payment transactions
Contingent consideration
The fair value of the inertia asset is measured at inception of the hiring agreement and is based on discounted cash flowsexpected to be derived from the sale or hire of the assets at the end of the hire term.
The fair value of employee stock options is measured using a binomial model. Measurement inputs include share price onmeasurement date, exercise price of the instrument, expected volatility (based on weighted average historic volatilityadjusted for changes expected due to publicly available information), weighted average expected life of the instruments(based on historical experience and general option holder behaviour), expected dividends, and the risk-free interest rate(based on government bonds). Service and non-market performance conditions attached to the transactions are not takeninto account in determining fair value. The fair value of employee shares provided as remuneration is measured using the closing share price on the date the sharesare granted.
An operating segment is a component of the Group that engages in business activities from which it may earn revenues andincur expenses, including revenues and expenses that relate to transactions with any of the Group’s other components. Alloperating segments’ operating results are regularly reviewed by the Group’s Chief Executive Officer to make decisionsabout resources to be allocated to the segment and assess its performance, and for which discrete financial information isavailable. Segment results, assets and liabilities include items attributable to a segment as well as those that can be allocated on areasonable basis. Unallocated items compromise mainly loans and borrowings and related expenses, and head officeexpenses, and income tax assets and liabilities.
Segment capital expenditure is the total cost incurred during the period to acquire property, plant and equipment, andintangible assets other than goodwill.
The fair value of contingent consideration is calculated using the income approach based on the expected payment amountsand their associated probabilities (i.e. probability-weighted). Since the contingent consideration is long-term in nature, it isdiscounted to present value.
Finance expenses comprise interest expense on borrowings, unwinding of the discount on provisions, dividends onpreference shares classified as liabilities, changes in the fair value of financial assets at fair value through profit or loss,impairment losses recognised on financial assets, and losses on hedging instruments that are recognised in profit or loss. Allborrowings costs are recognised in profit or loss using the effective interest method.
A number of the Group’s accounting policies and disclosures require the determination of fair value, for both financial andnon-financial assets and liabilities. Fair values have been determined for measurement and/or disclosure purposes based onthe following methods. When applicable, further information about the assumptions made in determining fair values isdisclosed in the notes specific to that asset and liability.
The fair value of intangible assets is based on the discounted cash flows expected to be derived from the use and eventualsale of the assets (refer to note 3(i)).
The fair value of trade and other receivables is estimated as the present value of future cash flows, discounted at the marketrate of interest at the reporting date.
Fair value, which is determined for disclosure purposes, is calculated based on the present value of future principal andinterest cash flows, discounted at the market rate of interest at the reporting date. For finance leases, the market rate ofinterest is determined by reference to similar lease agreements.
41
For
per
sona
l use
onl
y
THINKSMART LIMITED NOTES TO THE FINANCIAL STATEMENTS
4. Critical accounting judgements and key sources of estimation uncertainty
(a) Key sources of estimation uncertainty and critical judgements in applying the entity’s accounting policies
• Note 6 (a) - revenue from finance lease operations• Note 7 - measurement and recognition of tax losses• Note 9 - lease receivables, including estimation of unguaranteed residual value• Note 15 - recoverable amount of intangible assets• Note 17 - measurement of the recoverable amounts of cash-generating units containing goodwill• Note 19 - measurement deferred services income• Note 22 - measurement of share based payments• Note 28-29 - contingent assets and liabilities
Change in Accounting Estimates
5. Financial Risk ManagementOverviewThe Group has exposure to the following risks from the use of financial instruments: • Credit risk• Liquidity risk• Market risk• Operational risk
In particular, information about significant areas of estimation uncertainty and critical judgements in applying accountingpolicies that have the most significant affect on the amount recognised in the financial statements are described in thefollowing notes:
During the year, the Group has reassessed the percentage of insurance commission income recognised at the inception ofinsurance contracts that the Group has received from referring its customers’ insurance contracts to an insurer in respect ofits UK business. This review considered the level of continuing involvement in servicing these insurance contracts and thehistorical trend of cancellations that result in commission being refunded. As a result, the Group has increased thepercentage of commission income being recognised at inception of the insurance contracts resulting in an increase of$1,094,041 to insurance commission income. This comprises an amount of $496,855 relating to contracts referred duringthe year and an amount of $597,186 representing an acceleration of commission income that would have been recognised infuture years.
The preparation of financial statements requires management to make judgements, estimates and assumptions that affect theapplication of accounting policies and the reported amounts of assets, liabilities, income and expenses. Actual results maydiffer from these estimates. Estimates and underlying assumptions are reviewed on an ongoing basis. Revisions toaccounting estimates are recognised in the period in which the estimate is revised and in any future periods affected.
The estimates and underlying assumptions are reviewed on an ongoing basis. Revisions to accounting estimates arerecognised in the period in which the estimate is revised if the revision affects only that period, or in the period of therevision and future periods if the revision affects both current and future periods.
Except as described below, in preparing this consolidated financial report, the significant judgements made by managementin applying the consolidated entity’s accounting policies and the key sources of estimation uncertainty were the same asthose that applied to the consolidated financial report as at and for the year ended 31 December 2010.
In the application of the Group’s accounting policies, which are described in note 3, management is required to makejudgements, estimates and assumptions about carrying values of assets and liabilities that are not readily apparent fromother sources. The estimates and associated assumptions are based on historical experience and various other factors thatare believed to be reasonable under the circumstance, the results of which form the basis of making the judgements. Actualresults may differ from these estimates.
42
For
per
sona
l use
onl
y
THINKSMART LIMITED NOTES TO THE FINANCIAL STATEMENTS
Credit Risk
The Group assesses the impairment of receivables on an individual basis.
Guarantees
To manage credit risk in relation to its customers, the Group employs a sophisticated credit assessment and fraudminimisation process delivered through its patented QuickSmart system. The credit underwriting system uses acombination of credit scoring and credit bureau reports as well as electronic identity verification and a review of anapplicant’s details against a fraud database. The credit policy is developed and applied by the group’s Head of Treasury andRisk who monitors ongoing credit performance on different cohorts of customer contracts. The Group has a specialistcollections function which manages all delinquent accounts. Delinquent accounts are those which are overdue on acontractual payment by one day. The total principal balance outstanding on a delinquent account is defined as the arrearsamount. The collectability of lease receivables is assessed on an ongoing basis and a provision is made for losses based onhistorical cure rates of arrears and the current delinquency position of the portfolio.
Group policy is to provide financial guarantees only to wholly-owned subsidiaries. Details of outstanding guarantees areprovided in note 34.
This note presents information about the Group’s exposure to each of the above risks, the objectives, policies and processesfor measuring and managing risks, and the management of capital. Further quantitative disclosures are included throughoutthis financial report.
The Board of Directors has overall responsibility for the establishment and oversight of the risk management framework.The Board has established the Audit and Risk Management Committee, which is responsible for developing and monitoringrisk management policies. The Committee reports to the Board of Directors on its activities.
Risk management policies are established to identify and analyse the risks faced by the Group, to set appropriate limits andcontrols, and to monitor risks and adherence to limits. Risk management policies and systems are reviewed regularly toreflect the changes in market conditions and the Group’s activities. The Group, through its training and managementstandards and procedures, aims to develop a disciplined and constructive control environment in which all employeesunderstand their roles and obligations.
The Audit and Risk Committee oversees how management monitors compliance with the Group’s risk management policies and procedures and reviews the adequacy of the risk management framework in relation to the risks faced by the Group.
Credit risk refers to the risk that a counterparty or customer will default on its contractual obligations resulting in financialloss to the Group and arises principally from the Group’s assessment of recoverability from debtors and lease receivables.The Group has adopted a policy of only dealing with credit worthy counterparties as a means of mitigating the risk offinancial loss from defaults. During the financial year, the Group has appointed an experienced Head of Treasury and Riskwho has day to day responsibility for managing credit risk within the risk appetite of the Board. Appropriate oversightoccurs via monthly credit performance reporting to Board on both brokerage funded leases as well as leases financed viaThinkSmart Trust the special purpose entity ("SPE") established by the Group.
The Group has minimal concentrations of credit risk in relation to debtors and lease receivables. In the case of most of itsbrokerage funded operations, credit risk arising from customer rental contracts are not borne by the Group but by thefunding institutions. In the case of the SPE funded operations, ThinkSmart’s exposure to credit risk is limited to the valueof its notes in the relevant series of the SPE. Losses in excess of that are borne by the senior financier’s notes. The notes inthe various series of the SPE are structured such that on a probability weighted outcomes basis, ThinkSmart bears the creditrisk.
The Group’s credit risk exposure to funder deposits are more concentrated, however the counterparties are regulatedbanking institutions and the credit risk exposure is assessed as low. The Group closely monitors the credit risk associatedwith each funder deposit counterparty.
The carrying amount of financial assets recorded in the financial statements, net of any allowances for losses, represents theGroup’s maximum exposure to credit risk.
43
For
per
sona
l use
onl
y
THINKSMART LIMITED NOTES TO THE FINANCIAL STATEMENTS
Liquidity risk
•
• Other operational facilities are set out in note 20 and 21.
Market risk
Currency risk
Interest rate risk
Liquidity risk is the risk that the Group will not be able to meet its financial obligations as they fall due. The Group’sapproach to managing liquidity is to ensure, as far as possible, that it will always have sufficient liquidity to meet itsliabilities when due, under both normal and stressed conditions, without incurring unacceptable losses or risking damage tothe Group’s reputation.
The consolidated entity manages liquidity risk by maintaining adequate reserve facilities by continuously reviewing itsfacilities and cash flows, and for the Group's securitisation activities, in accordance with the terms of the Group's AustralianFinancial Services License (AFSL).The Group ensures that it has sufficient cash on demand to meet expected operational expenses. In addition, the Groupmaintains the following lines of credit:
Committed Cash Advance Facility of $5,000,000, of which $3,700,000 is presently drawn down. Interest is payable atprevailing bank rate.
Market risk is the risk that changes in market prices, such as foreign exchange rates, interest rates and equity prices willaffect the Group’s income or the value of its holdings of financial instruments. The objective of market risk management isto manage and control market risk exposures within acceptable parameters, while optimising return.
The Group is exposed to currency risk on sales, purchases and borrowings that are denominated in a currency other than therespective functional currencies of the Group entities, primarily the Australian dollar (AUD), but also the Euro (EUR),Sterling (GBP) and US dollars (USD). The currencies in which these transactions primarily are denominated are AUD,EUR, GBP and USD.
Interest on borrowings is denominated in currencies that match the cash flows generated by the underlying operations of theGroup, primarily AUD, but also GBP and EUR. This provides an economic hedge and no derivatives are entered into.
Liabilities incurred in each respective geographical territory are paid for by the cash flows of the functional currency of thatterritory. Exposures for singular transactions greater than $50,000 are considered for hedging by management, withforward exchange contracts to mitigate exchange rate risk and are considered separately as they arise. The consolidatedentity has no forward exchange contracts as at reporting date (2010: nil)
Intercompany borrowings are denominated in the currency of the lender. Transaction recharges between the companiesprovides an economic hedge and timing of payments are within the control of the Group to ensure economic viability, as aresult no derivatives are entered into.
In respect of other monetary assets and liabilities denominated in foreign currencies, the management ensures that theGroup’s net exposure is kept to an acceptable level by buying or selling foreign currencies at spot rates when necessary toaddress the short term imbalances.
The Group has no significant non-current corporate borrowings. The terms and conditions of current interest-bearingborrowings are set out above. Exposure to interest rate risk on any future corporate borrowings will be assessed by theBoard and where appropriate, the exposure to movement in interest rates may be hedged by entering into interest rateswaps, when considered appropriate by the management and the Board.
The Group has interest rate risk exposure to the notes in the SPE that it has issued to the financiers of its lease receivables.These notes are floating rate notes with the rate based on a fixed margin above a benchmark interest rate. Interest rate riskresults principally from changes in the benchmark interest rate and accordingly the Group has mitigated this risk byentering into an interest rate swap to hedge against the variability in the cash flows due to changes in the interest rate.
44
For
per
sona
l use
onl
y
THINKSMART LIMITED NOTES TO THE FINANCIAL STATEMENTS
Operational risk
• Requirements for appropriate segregation of duties, including the independent authorisation of transactions• Requirements for the reconciliation and monitoring of transactions• Compliance with regulatory and other legal requirements• Documentation of controls and procedures•
• Development of business continuity plans• Training and professional development• Ethical and business standards• Risk mitigation, including insurance where this is effective
Capital management
ThinkSmart Finance Limited holds an Australian Financial Services Licence (AFSL) in relation to its role as Trust Managerof the SPE. Under the terms of its AFSL it must have assets that exceed its liabilities and there are also liquidity conditions(measured on a Group basis).
The Group’s objective is to manage operational risk so as to balance the avoidance of financial losses and damage to theGroup’s reputation with overall cost effectiveness and to avoid control procedures that restrict initiative and creativity.
The primary responsibility for the development and implementation of controls to address operational risk is assigned tosenior management within each business unit. This responsibility is supported by the development of overall groupstandards for the management of operational risk in the following areas:
Requirements for the periodic assessment of operational risks faced, and the adequacy of controls and procedures toaddress the risks identified
The Board’s policy is to maintain a strong capital base so as to maintain investor, creditor and market confidence and tosustain future development of the business. Management aims to maintain a capital structure that ensures the lowest cost ofcapital available to the group. Management constantly reviews the capital structure to ensure an increasing return on assets.As the market is constantly changing, management may change the amount of dividends to be paid to shareholders, returnof capital to shareholders, issue new shares or sell assets to reduce debt.
Under the terms of its financing arrangements in the SPE, the Group is required to subscribe to and hold a minimum valueof notes based on the value of receivables outstanding to ensure ongoing financing. The SPE is bankruptcy remote in thatThinkSmart’s risk exposure is limited to the amount of capital that it holds within the relevant series of the SPE.
Operational risk is the risk of direct or indirect loss arising from a wide variety of causes associated with the Group’sprocesses, personnel, technology and infrastructure, and from external factors other than credit, market and liquidity riskssuch as those arising from legal and regulatory requirements and generally accepted standards of corporate behaviour.Operational risks arise from all of the Group’s operations.
45
For
per
sona
l use
onl
y
THINKSMART LIMITED NOTES TO THE FINANCIAL STATEMENTS
2011 2010$ $
Total liabilities 67,915,327 8,204,264 Less cash and cash equivalents (4,610,532) (21,186,022)Net debt/(cash) 63,304,795 (12,981,758)
Total equity 40,266,174 37,699,127 Less adjustments - - Adjusted capital 40,266,174 37,699,127 Debt-to-adjusted capital ratio at 31 December 1.6 -
2011 2010$ $
6. Profit Profit is arrived at after crediting/(charging) the following items:
(a) Revenue Commission income from funders 21,859,946 25,551,047 Surplus unguaranteed residual income 4,408,098 4,675,138 Extended rental income 6,205,307 5,984,721 Other inertia income 1,037,047 - Finance lease income 6,306,791 - Services revenue - insurance and warranty 4,897,702 5,064,455 Other revenue 759,113 835,201
45,474,004 42,110,562
(b) Employee benefits expensePayments to employees 11,895,555 11,660,160 Employee superannuation cost 786,986 641,783 Share based payment expense 603,767 260,400 Provision for employee entitlements 510,039 28,580
13,796,347 12,590,923
(c) Depreciation expenseDepreciation of plant and equipment 397,017 365,650 Depreciation of leasehold improvements 8 63,827 Depreciation of lease equipment & software 144,128 35,690
541,153 465,167
The Group’s debt-to-adjusted capital ratio at the end of the reporting period was as follows:
The Board encourages employees to hold shares in the Company. At present employees hold 20.4% (2010: 20.8%) ofordinary shares.
Other than as described above in relation to the SPE, the Group is not subject to externally imposed capital requirements. Forthe purposes of capital management, capital consists of share capital, reserves and retained earnings.
46
For
per
sona
l use
onl
y
THINKSMART LIMITED NOTES TO THE FINANCIAL STATEMENTS
2011 2010$ $
(d) Amortisation expenseAmortisation of software 639,754 660,681 Amortisation of contract rights 1,009,591 635,406 Amortisation of distribution network 38,907 100,988 Amortisation of inertia contracts - 624,219 Amortisation of intellectual property 32,091 32,091
1,720,343 2,053,385
(e) Finance (costs)/benefitsInterest revenue – other entities 880,244 441,009 Total finance benefits 880,244 441,009
(f) Reclassification of items of income and expenseTo facilitate accurate comparison to 2011, certain items of income and expense have been reclassified as follows:
Prior year accounts
Current year comparative
2010 2010$ $
Revenue 42,110,562 42,110,562 Employee benefits expense (10,908,454) (12,590,923)Indirect customer acquisition cost - (10,983,096)Sales and marketing costs (10,520,320) - Occupancy costs (1,062,593) (1,065,424)Printing and stationery - (354,317)Communication costs (662,027) (690,852)Doubtful and bad debts (239,514) (233,431)Professional services - (1,224,825)Legal and consulting costs (682,473) - Credit bureau costs (656,468) - Corporate development costs (2,594,617) - Insurance costs (207,847) (207,847)Travel costs - (906,518)Other expenses (1,319,156) (608,800)Finance revenue - 441,009 Finance costs (530,591) (959,036)Depreciation (465,167) (465,167)Foreign exchange (loss)/gain (492,911) (492,911)Earnings before tax and amortisation (EBTA) 11,768,424 11,768,424
- (906,518)
710,356 441,009
(428,445) -
(2,831)(354,317)
(28,825) 6,083
(1,682,469)(10,983,096)
10,520,320
(1,224,825) 682,473 656,468 2,594,617
Reclassification
$
-
- -
47
For
per
sona
l use
onl
y
THINKSMART LIMITED NOTES TO THE FINANCIAL STATEMENTS
2011 2010$ $
7. Income Tax
The major components of income tax expense for the year ended 31 December are:Current income tax expense Current income tax charge 3,258,680 2,562,286 Adjustment for prior period (101,140) 54,694 Deferred income tax expenseOrigination and reversal of temporary differences (282,344) 348,182 De-recognition of previously recognised tax asset 230,178 - Adjustment for prior period 107,491 (48,435)Change in unrecognised temporary differences - 25,299 Income tax expense/ (benefit) reported in income statement 3,212,865 2,942,026
Accounting profit/(loss) before tax 10,011,212 9,715,039 At the statutory income tax rate of 30% 3,003,364 2,914,512 Effect of tax rates in foreign jurisdictions (120,361) 12,229 Non deductible expenses:- corporate development 21,489 30,619 - other 106,796 (51,988)Overseas tax losses not recognised 80,024 30,394 Adjustments in respect of prior periods 121,553 6,260 Income tax expense reported in the income statement 3,212,865 2,942,026
Income tax recognised directly in equityEquity raising cost - 320,500
Income tax recognised in other comprehensive incomeCash flow hedges 89,164 -
A reconciliation between tax expense and the product of accounting profit/(loss) before income tax multiplied by theapplicable income tax rate is as follows:
48
For
per
sona
l use
onl
y
THINKSMART LIMITED NOTES TO THE FINANCIAL STATEMENTS
Deferred tax liabilityPrepayments 2,152 - Receivables 386,427 118,225 Intangible assets 142,927 246,732 Software 1,186,302 300,424 Amounts held by funders - 792,637 Other 335,340 237,680 Total 2,053,148 1,695,698
Net deferred tax asset (i) - 287,676 Net deferred tax liability (i) 173,293 367,698
(i) Deferred tax assets and deferred tax liabilities that relate to the same taxable entity have been netted off.
Unrecognised deferred tax assets
Deferred tax assets have not been recognised in respect of the following items:Tax losses 957,098 726,920
957,098 726,920
The deductible temporary differences and tax losses do not expire under current tax legislation. Deferred tax assets that relateto tax losses in France, Italy and USA have not been recognised in respect of these items because it is not probable that futuretaxable profit will be available against which the group can utilise the benefits there from.
49
For
per
sona
l use
onl
y
THINKSMART LIMITED NOTES TO THE FINANCIAL STATEMENTS
2011 2010$ $
8. Trade and Other ReceivablesCurrentTrade receivables (i) 10,015,423 2,362,465 Allowance for doubtful debts (85,299) (112,178)Deposits held by funders (ii) - 143,398 Sundry debtors 1,172,629 188,653
11,102,753 2,582,338
Non-currentDeposits held by funders (ii) 5,175,350 6,737,156
5,175,350 6,737,156
9. Lease ReceivableCurrentRental receivables (net of GST) 17,267,656 - Unguaranteed residuals 2,816,500 - Unearned finance income (2,385,368) - Net lease receivables (i) 17,698,787 - Other lease receivable (ii) 21,583,587 - Allowance for losses (863,084) -
38,419,290 - Non-currentRental receivables (net of GST) 8,870,371 - Unguaranteed residuals 1,463,275 - Unearned finance income (1,239,286) - Net lease receivables (i) 9,094,360 - Other lease receivable (ii) 19,637,163 Allowance for losses (725,027) -
28,006,496 -
Lease receivables due within 12 months 38,419,290 - Lease receivables due in greater than 12 months and less than 5 years 28,006,496 -
66,425,786 -
(i) No interest is charged on trade receivables. The Group’s exposure to credit and currency risks and impairment losses related to trade and other receivables are disclosed in note 30.(ii) Deposits held by funders for the servicing and management of their portfolios in the event of default. The deposits earn interest at market rates of return for similar instruments.
50
For
per
sona
l use
onl
y
THINKSMART LIMITED NOTES TO THE FINANCIAL STATEMENTS
13. Prepayments – Non currentInsurance prepayment 3(h) 1,601,516 2,372,572
1,601,516 2,372,572
During the second half of 2011 the Group progressed the acquisition of the remaining lease receivables from BEN.The acquisition of these receivables is subject to APRA approval as set out in note 24(c). On 22 December 2011agreement was reached with BEN resulting in the rights to the lease receivables held by BEN being assigned to theGroup effective from 1 October 2011. This is recognised as a "pass through" arrangement under AASB 139 Financial Instruments whereby the risks and rewards of the underlying finance lease receivables have been transferred to theGroup. A notional liability of $36.5 million relating to the assigned receivables is recognised at note 21.
On 14 June 2011 the Group acquired a portfolio of finance lease receivables from Bendigo and Adelaide Bank(BEN). These receivables were previously originated by the Group on behalf of BEN. The receivables were acquiredby ThinkSmart Trust at a fair value of $36 million at the date of acquisition. The receivables were acquired into series2 of ThinkSmart Trust with funding provided by the issue of $26 million of a series notes in series 2 of ThinkSmartTrust to Westpac with the balance provided by internally funded notes in the same series of ThinkSmart Trust issuedto ThinkSmart. Further details of the notes are disclosed in note 21.
51
For
per
sona
l use
onl
y
THINKSMART LIMITED NOTES TO THE FINANCIAL STATEMENTS
14. Plant & Equipment
Plant & Equipment
Leasehold improvements
Self funded rentals
Web Sites Lease equipment &
software
Total
$ $ $ $ $ $Gross Carrying AmountCost or deemed costBalance at 1 January 2010 2,123,880 276,689 149,958 76,450 2,332,283 4,959,260
Impairment loss (65,403) - - - - (65,403)Balance at 31 December 2011 (2,254,065) (2,252,859) (410,371) (369,047) - (5,286,342)
Net book valueAt 31 December 2010 1,451,293 2,554,180 38,013 304,857 - 4,348,343
3,276,677 3,530,911 - 272,769 3,608,468 10,688,825 At 31 December 2011
Effect of movement in exchange rate
Effect of movement in exchange rate
Effect of movement in exchange rate
Effect of movement in exchange rate
53
For
per
sona
l use
onl
y
THINKSMART LIMITED NOTES TO THE FINANCIAL STATEMENTS
2011 201016. Interest in Subsidiaries
Interest in Subsidiaries Country of Incorporation RentSmart Unit Trust Australia 100% 100%RentSmart Pty Ltd Australia 100% 100%ThinkSmart Finance Ltd Australia 100% 100%RentSmart Servicing Pty Ltd Australia 100% 100%RentSmart Limited UK 100% 100%SmartCheck Pty Ltd Australia 100% 100%RentSmart Pty Ltd New Zealand 100% 100%RentSmart Pte Ltd Singapore 100% 100%ThinkSmart Europe Ltd UK 100% 100%ThinkSmart Financial Services Ltd UK 100% 100%SmartCheck Ltd UK 100% 100%ThinkSmart Insurance Administration Ltd UK 100% 100%SmartCheck Finance Spain SL Spain 100% 100%SmartPlan Spain SL Spain 100% 100%ThinkSmart France SARL France 100% 100%ThinkSmart Sweden AB Sweden 100% 100%ThinkSmart Italy Srl Italy 100% 100%ThinkSmart Inc USA 100% 100%ThinkSmart Trust Australia 100% n/a
2011 2010$ $
17. GoodwillBalance at beginning of financial year 3,540,774 4,177,746 Effect of movement in exchange rate (2,149) (636,972)Balance at end of financial year 3,538,625 3,540,774
% of Equity
54
For
per
sona
l use
onl
y
THINKSMART LIMITED NOTES TO THE FINANCIAL STATEMENTS
17. Goodwill (cont.)
Impairment testing for cash-generating units containing goodwill
•
•
18. Assets Pledged as Security
2011 2010$ $
19. Trade and Other Payables, Provisions and Deferred Service Income
Trade and other payables (i) 3,219,720 2,048,014 Hedging derivative 297,214 - Product plan 250,792 218,442 GST Payable 1,664,860 585,006 Other accrued expenses 1,470,800 1,466,149
6,903,386 4,317,611
ProvisionsAnnual leave 310,211 231,200 Long service leave (ii) 199,828 276,667 Other 766 -
510,805 507,867
Deferred service incomeInertia income 3,608,468 - less recognised in year (1,037,047) -
2,571,421 -
Deferred service income recognised within 12 months 1,379,848 - Deferred service income recognised in greater than 12 months 1,191,573 -
(i) Trade liabilities are normally settled on 30 day terms. (ii) The pro rata entitlement of long service leave is provided for after 7 years of service.The Group’s exposure to currency and liquidity risk related to trade and other payables is disclosed in note 30.
For the purpose of impairment testing, goodwill is allocated to the UK operations, RentSmart Limited and ThinkSmartInsurance and Administration Ltd, which represents the lowest level within the Group at which goodwill is monitored forinternal management purposes. The goodwill arose on the acquisition of RentSmart Limited.
The recoverable amount of the RentSmart Limited and ThinkSmart Insurance and Administration Ltd cash-generating unitwas based on its value in use, and was determined by using future cash flows generated from the continuing use of the unit.The recoverable amount of the unit was determined to be significantly higher than the carrying amount, therefore noimpairment of goodwill is required, and no further sensitivity analysis is considered necessary.
Cash flows were projected based on the forecast operating results for 2012 and 2013, 2.0% year-on-year growth to2016, and estimated terminal growth at 2.0%.A post tax discount rate of 13.21% (16.64% pre tax) was applied in determining the recoverable amount of the unit.The discount rate was based on the weighted average cost of capital (WACC) for the Group. The WACC ispredominantly a factor of the cost of equity which has been set at 13.67% consistent with independent determinationsof the Group’s cost of equity.
ThinkSmart Limited and ThinkSmart Finance Limited have pledged all their present and future assets to Westpac as security for the used corporate financing facilities Westpac has provided, as disclosed in notes 20 and 21. ThinkSmart Europe Limited has provided an equitable mortgage over the shares it holds in the main UK operating entity, RentSmart Limited.
Value in use is determined by discounting the future cash flows generated from the continuing use of the unit and was basedon the following key assumptions:
55
For
per
sona
l use
onl
y
THINKSMART LIMITED NOTES TO THE FINANCIAL STATEMENTS
2011 201020. Current Borrowings $ $
Term loans (i)(ii) 2,500,000 2,489,944 Borrowing costs (73,287) -
2,426,713 2,489,944
(i)
(ii) Corporate financing facilities 2011 2010
$ $Secured bank overdraft facility reviewed annually and payable at call:- amount used - - - amount unused - 250,000
- 250,000 Hire purchase and/or leasing facilities:- amount used - - - amount unused - 10,000
- 10,000 Cash advance/Secured bill acceptance facility:- amount used 2,500,000 2,500,000 - amount unused 2,500,000 2,500,000
5,000,000 5,000,000 Standby letter of credit facility- amount used 3,035,400 - - amount unused - -
3,035,400 - Other finance facilities (business credit card, payroll facility, term loan, multi-option facility):- amount used - 121,500 - amount unused 129,000 7,523,500
129,000 7,645,000 Total corporate financing facility 8,164,400 12,905,000
The total corporate facility of $8,164,400 (2010: $12,905,000) identified above is reviewed annually and secured over the assets of the group. The next annual review is scheduled to be completed by 30 June 2013.
This note provides information about the contractual terms of the Group’s interest-bearing loans and borrowings, which are measured at amortised cost. For more information about the Group’s exposure to interest rate, foreign currency and liquidity risk, see note 30.
The $2,500,000 fixed term loan relates to the amount drawn of a $5,000,000 cash advance facility denominated inAustralian Dollars with a fixed interest of 7.55% pa. Subsequent to balance date the Company has drawn a further$1,200,000 against this facility with a fixed interest of 7.40%. Subsequent to year end the annual review wascompleted and the drawn balance of the cash advance facility is now repayable on 30 June 2013.
56
For
per
sona
l use
onl
y
THINKSMART LIMITED NOTES TO THE FINANCIAL STATEMENTS
2011 2010$ $
21. Other interest bearing liabilitiesCurrentLoan advances - secured (i) 14,929,538 - Financial liability - secured (ii) 21,801,906 -
The loans are provided in the form of notes in a series of ThinkSmart Trust. The notes are secured by all paymentsreceivable in respect of the underlying lease receivable contracts assigned to the relevant series of ThinkSmart Trustand pay down in line with the repayments of the underlying leases. The notes are interest bearing and during theperiod the weighted average interest rate was 7.62% (2010: n/a).
The customer financing facility of $100,000,000 (2010: n/a) identified above is reviewed annually and secured overthe assets of the relevant series of the SPE. The next annual review for the customer financing facility of$100,000,000 is scheduled to be completed by 8 June 2012. Regardless of the outcome of the review, the notes inThinkSmart Trust pay down in line with the repayments of the underlying leases.
The financial liability arises from a contractual obligation the Group has to remit funds to Bendigo and Adelaide B ankarising from the "pass through" arrangement referred to in note 9. The obligation is secured by all paymentsreceivable in respect of the underlying lease receivable contracts subject to the "pass through" arrangement and paydown in line with the repayments of the underlying leases. The obligation is interest bearing and during the period theweighted average interest rate was 8.49% (2010: n/a).
The group has entered into a new 5 year, $67,500,000 financing agreement with Bendigo and Adelaide Bank underwhich it has established series 3 of ThinkSmart Trust. An application is currently before APRA to allow Bendigo andAdelaide Bank to provide financing for the acquisition by ThinkSmart Trust of receivables currently on Bendigo andAdelaide Bank’s balance sheet. In the interim the group continues to fund lease receivables that it originates as agentfor Bendigo and Adelaide Bank under the terms of the pre-existing funding agreement it has with Bendigo andAdelaide Bank and recognises brokerage income from the origination of those leases. The aggregate of leasesoriginated under the two agreements with Bendigo and Adelaide Bank comprise the utilised portion of the availablefacility limit. The $67,500,000 customer financing facility is available until December 2016 on an offer and acceptbasis.
57
For
per
sona
l use
onl
y
THINKSMART LIMITED NOTES TO THE FINANCIAL STATEMENTS
22. Issued Capital 2011 2010$ $
(a) Issued and Paid up Capital130,004,390 Ordinary Shares fully paid (2010: 129,879,390) 39,663,558 39,615,239
2011Number $
Fully Paid Ordinary Shares Balance at beginning of the financial year 129,879,390 39,615,239 Issue of new shares for employee share based payment 125,000 65,000 Capital raising costs - (16,681)Balance at end of the financial year 130,004,390 39,663,558
The Company does not have authorised capital or par value in respect to its issued shares.
(b)(i) Share Options – Employee Options
Options issued in previous periods:•
•
•
--
•
Options issued in the current period:•
--
The value of these options will be expensed over the vesting period in accordance with AASB 2.
Ordinary Shares entitle the holder to participate in dividends and the proceeds on winding up the Company in proportion tothe number of and amount paid on the Shares held.On a show of hands, every holder of Ordinary Shares present in the meeting in person or by proxy, is entitled to one vote,and upon a poll each Share is entitled to one vote.
During the year no employee share options were exercised (2010: 840,000 employee share options were exercised for$525,000). The Company has issued 125,000 escrowed shares to Mr A Baum (Group Chief Operating Officer) during theyear as part of his remuneration, refer to note 22(b)(ii).
50% of options are subject to achievement of Earnings per Share (“EPS”) performance conditions; and50% of options are subject to achievement of Total Shareholder Return (“TSR”) performance condition.
2,133,333, 100,000 and 250,000 options over ordinary shares were issued 11 April 2011, 15 June 2011 and 25 July2011 respectively. The options are exercisable at $0.84, with an exercise period between 1 January 2014 to 31December 2015. Vesting of the options is subject to achievement of the following performance conditions:
50% of options are subject to achievement of Earnings per Share (“EPS”) performance conditions; and50% of options are subject to achievement of Total Shareholder Return (“TSR”) performance condition.
640,000 options over ordinary shares were issued 17 April 2007 and exercisable at $1.375, vesting and exercisable on1 January 2009 exercisable until 31 December 2011.720,000 options over ordinary shares were issued 17 April 2007 and exercisable at $3.00, vesting and exercisable on1 January 2009 exercisable until 31 December 2011.
2,200,000 and 333,333 options over ordinary shares were issued 5 May 2010 and 1 September 2010 respectively. Theoptions are exercisable at $1.11, with an exercise period between 1 January 2013 to 31 December 2014. Vesting ofthe options is subject to achievement of the following performance conditions:
50% of options are subject to achievement of Earnings per Share (“EPS”) performance conditions; and50% of options are subject to achievement of Total Shareholder Return (“TSR”) performance condition.
The Company has an ownership-based remuneration scheme for executives and senior employees. Each employee shareoption converts to one ordinary share of ThinkSmart Limited on exercise and payment of the exercise price. The optionscarry neither rights or dividends nor voting rights. Options may be exercised at any time within the specified exercise periodto the date of their expiry.
3,350,000 options over ordinary shares were issued 30 June 2009 and exercisable at $0.62, with an exercise periodbetween 1 January 2012 to 31 December 2013. Vesting of the options is subject to achievement of the followingperformance conditions:
58
For
per
sona
l use
onl
y
THINKSMART LIMITED NOTES TO THE FINANCIAL STATEMENTS
22. Issued Capital (cont.)
(b)(i) Share Options – Employee Options (cont.)
Below are options that were issued in 2010 and 2011:
Below are the inputs used to measure the fair value of the options:
Employee options
Employee options
Employee options
Employee options
Issued in 2011
Grant date 11/04/2011 11/04/2011 15/06/2011 25/07/2011Fair value at grant date $0.42 $0.40 $0.30 $0.28Grant date share price $0.83 $0.83 $0.70 $0.66Exercise price $0.84 $0.84 $0.84 $0.84Expected volatility 78% 78% 78% 78%Option life 4.2 years 3.7 years 3.5 years 3.4 yearsDividend yield 4.15% 4.15% 4.88% 4.88%Risk-free interest rate 5.85% 5.75% 5.50% 4.56%
Issued in 2010
Grant date 5/05/2010 1/09/2010Fair value at grant date $0.27 $0.23Grant date share price $0.82 $0.62Exercise price $1.11 $1.11Expected volatility 61.50% 83.70%Option life 3.7 years 3.3 yearsDividend yield 3.50% 7.46%Risk-free interest rate 5.26% 4.35%
1 Jan 2014 to 31 Dec 2015
Fair value at grant date
Options series issued in 2010
Number Grant date Fair value at grant date
1 Jan 2014 to 31 Dec 20151 Jan 2014 to 31 Dec 2015
Options series issued in 2011
1 Jan 2014 to 31 Dec 2015
Exercise period Exercise price $
1 Jan 2013 to 31 Dec 20141 Jan 2013 to 31 Dec 2014
Exercise period
The weighted average fair value of the share options granted in 2011 is $0.33 (2010: $0.27). Options were priced using abinomial option pricing model. Expected volatility is based on that observed for comparable listed companies over the timeperiod appropriate to the option grant in question.
59
For
per
sona
l use
onl
y
THINKSMART LIMITED NOTES TO THE FINANCIAL STATEMENTS
22. Issued Capital (cont.)
(b)(i) Share Options – Employee Options (cont.)
Number of options
Weighted average
exercise price
Number of options
Weighted average exercise
price$ $
Balance at beginning of the financial year 6,293,333 $1.05 6,736,667 $1.05Granted during the financial year 2,483,333 $0.84 2,533,333 $1.11Forfeited during the financial year (649,999) $0.85 (550,000) $0.71Exercised during the financial year - - (840,000) $0.63Expired during the financial year (960,000) $2.19 (1,586,667) $1.51Balance at the end of financial year 7,166,667 $0.84 6,293,333 $1.05Exercisable at end of the financial year - - 960,000 $2.19
The following is the total expense recognised for the period arising from share-based payment transactions.
2011 2010$ $
Share options granted in 2006 – equity settled - 20,740 Share options granted in 2009 – equity settled 43,012 51,960 Share options granted in 2010 – equity settled 224,445 162,811 Share options granted in 2011 – equity settled 254,421 - Shares as remuneration granted in 2010 and 2011 – equity settled 81,889 24,889 Total expense recognised as employee costs 603,767 260,400
(b)(ii) Share Compensation – Employee Shares
No of shares granted
Grant date Fair value at grant date ($)
Vesting period
No of shares vested during 2011
ExecutivesA Baum 350,000 1/09/2010 0.64 3 years -A Baum 125,000 1/09/2011 0.52 3 years -
No shares were granted since the end of the financial year. The shares are provided at no cost to the recipients.
The options outstanding at 31 December 2011 have an exercise price in the range of $0.62 to $1.11 (2010: $0.62 to $3.00)and a weighted average contractual life of 2.97 years (2010: 3.08 years).
The following reconciles the outstanding share options granted under the employee share option plan and at the beginning and end of the financial year:
Details on shares of the Company that were granted as remuneration to each key management person and details on shares vested during the reporting period are as follows:
2011 2010
The weighted average share price at the date of exercise for share options exercised during the year ended 31 December 2011was Nil, no options exercised (2010: $0.80).
60
For
per
sona
l use
onl
y
THINKSMART LIMITED NOTES TO THE FINANCIAL STATEMENTS
(c) DividendsDividends recognised in the current year by the Group are:
Cents per share
Total amount
Franked/ unfranked
Final Ordinary 2010 3.5 $4,545,779 45% Franked
Final Ordinary 2009 2 $1,937,788 100% franked
(d) Franking credits2011 2010
$ $
615,005 545,068
1,644,354 1,160,426 Franking debits from the payment of dividends in the financial year (1,069,463) (1,090,489)
1,189,896 615,005
These shares were issued to A Baum upon him joining ThinkSmart Ltd and upon his first anniversary with the Company andare held in escrow. The shares are ordinary shares in the Company and will vest upon completion of a 3-year service periodfrom the date of each issue. During this period, Mr Baum is entitled to any dividends declared by the Company and normalvoting rights are attached. In the event that Mr Baum’s employment with the Company ceases before the vesting period (i.e.through resignation or termination), the shares will be cancelled. If Mr Baum is retrenched by the Company due to changes inthe Company’s structure or operations, he will be entitled to retain the shares and they will become immediatelyunconditional if this occurs before the escrow period expires.
Franking credits available for subsequent financial years based on a tax rate of 30% (2010: 30%)
The ability to utilise the franking credits is dependent upon there being sufficient available profits to declare dividends. Theimpact on the dividend franking account of dividends declared after the balance sheet date but not recognised as a liability isto reduce it by $nil (2010: $876,686). In accordance with the tax consolidation legislation, the Company as the head entity inthe tax-consolidated group is allowed to assume the relevant subsidiaries’ franking credits. As at 31 December 2011, thesubsidiaries have no franking credits for the benefit for the Company (2010: nil).
2010
Date of payment
29 April 2011
23 April 2010
Franked dividend declared and paid during the year was 45% franked at the tax rate of 30% (2010: 100% franked at the tax rate of 30%).
Franking credit account balance as at the beginning of the financial year at a tax rate of 30% (2010: 30%)
2011
Franking credits from the payment of income tax paid and payable as at the end of the financial year
61
For
per
sona
l use
onl
y
THINKSMART LIMITED NOTES TO THE FINANCIAL STATEMENTS
Reconciliation of cash and cash equivalentsCash balance comprises:- Available cash and cash equivalents 2,582,322 18,268,661 - Restricted cash 2,028,210 2,917,361
4,610,532 21,186,022
The share-based remuneration reserve arises on the grant of share options and shares to executives under theemployee share option plan. Amounts are transferred out of the reserves and into issued capital when the options areexercised. For shares issued as remuneration and accounted for as a share based payment arrangement, the full fairvalue of the shares are initially recognised in the reserve and share capital, and are subsequently transferred out of thereserve to the profit and loss over the vesting period. Further information about the share-based payments is made innote 22(b) to the financial statements.The translation reserve comprises all foreign currency differences arising from the translation of the financialstatements of foreign operations as well as from the translation of liabilities that hedge the Company’s net investmentin a foreign subsidiary.
For the purposes of the cash flow statement, cash and cash equivalents includes cash on hand and in banks andinvestments in money market instruments, net of outstanding bank overdrafts. Cash and cash equivalents at the end ofthe financial year as shown in the cash flow statement is reconciled to the related items in the balance sheet as follows:
The restricted cash is held as part of the Group's funding arrangements and the restriction will cease as the contract term expires but will be replaced as new lease contracts are originated.
The Group’s exposure to credit risk, interest rate and sensitivity analysis of the financial assets and liabilities are discussed in note 30.
The hedge reserve comprises the effective portion of the cumulative net change in fair value of the cash flow hedgerelating to hedged transactions that have not yet occurred.
62
For
per
sona
l use
onl
y
THINKSMART LIMITED NOTES TO THE FINANCIAL STATEMENTS
24. Notes to the Cash Flow Statement (cont.)2011 2010
$ $(b) Reconciliation of the profit /(loss) for the year to net cash flows from operating activities:
Profit after tax 6,798,347 6,773,013 Add back non cash items:Depreciation 541,153 465,167 Amortisation 1,720,343 2,053,385 Impairment 68,683 - Loss on disposal of plant and equipment - (73,866)Impairment losses on finance lease receivables 1,521,704 239,514 Foreign currency gain unrealised (13,030) - Provision for employee entitlements 2,938 6,620 Equity settled share based payment 603,767 260,400
(Increase) / decrease in assets:Trade receivables and deposits with funders (6,958,609) (7,082,898)Prepayments 711,750 1,623,821 Deferred tax asset 287,676 133,372 Other assets (376,946) (83,465)Rental asset inventory 35 16,879 Increase / (decrease) in liabilities:Trade and other creditors 6,612,470 1,272,890 Provision for income tax 1,086,181 (91,134)Deferred tax liability (194,405) 448,245 Other payable - (492)Net cash from/(used in) operating activities 12,412,057 5,961,451
(c) Non-cash financing transactionsThe consolidated entity entered into the non-cash finance transaction described below during the period (2010: Nil).During the second half of 2011 the Group progressed the acquisition of the remaining lease receivables from Bendigoand Adelaide Bank. The acquisition of these receivables is subject to APRA approval. On 22 December 2011agreement was reached with Bendigo and Adelaide Bank resulting in the rights to the lease receivables held byBendigo and Adelaide Bank being assigned to the Group effective from 1 October 2011 as described in note 9.
Pending approval from APRA to allow the acquisition of the leases by ThinkSmart Trust, collections from customershave been retained in the collections account established for that purpose and held by Bendigo and Adelaide Bank.Bendigo and Adelaide Bank also have cash balances relating to items previously disclosed as funder deposits whichcomprise ThinkSmart’s investment in the portfolio of leases acquired with effect from 1 October 2011. Distributionsto both Bendigo and Adelaide Bank and ThinkSmart are expected to commence Q1 2012.
63
For
per
sona
l use
onl
y
THINKSMART LIMITED NOTES TO THE FINANCIAL STATEMENTS
25. Leases and Hire Purchase Obligations
Operating Leases – Leasing Arrangements
2011 2010$ $
Non-cancellable operating lease payments:No later than 1 year 838,253 807,061Later than 1 year and not later than 5 years 871,121 1,709,594
1,709,374 2,516,655
No provisions have been recognised in respect of non-cancellable operating leases.
− ThinkSmart Finance Ltd − ThinkSmart Trust − Tranche 2 of receivables acquired by RentSmart Unit Trust via pass through arrangement
• Australasia – Other:− RentSmart Unit Trust – except Tranche 2 of receivables assigned to leasing segment− RentSmart Servicing Pty Ltd− RentSmart Pty Ltd
The Group has 2 main reportable segments which comprise the group’s two core strategic business units, with theAustralasian business unit further segmented to report segments relating to lease accounting and other operations. Thestrategic business units offer predominantly similar products and services, however have separate executive structures andseparate operational teams. During the period the Australasian business unit commenced funding finance leases “on balancesheet”, primarily through the SPE it has established, ThinkSmart Trust, although a tranche of assets acquired by pass througharrangement sit outside of the SPE at 31 December 2011.
For each of the segments, the CEO reviews internal management reports on a monthly basis. The composition of the reportable segments is as follow:
Operating leases relate to office facilities with lease terms of between 1 and 6 years. All operating lease contracts containmarket review clauses in the event that the consolidated entity exercises its option to renew. The consolidated entity does nothave an option to purchase the leased asset at the expiry of the lease period.
64
For
per
sona
l use
onl
y
THINKSMART LIMITED NOTES TO THE FINANCIAL STATEMENTS
Operating Segments
Information about reportable segments
For the year ended 31 December 2011 2010 2011 2010 2011 2010 2011 2010
Capital Expenditure 639,263 444,331 931,370 - 3,229,322 2,915,050 4,799,956 3,359,381
Reconciliation of reportable segment revenue
Total revenue for reportable segments 46,769,601 43,584,866
Elimination of inter-segment revenue (1,295,597) (1,474,304)
Consolidated revenue 45,474,004 42,110,562
Reconciliation of reportable segment profit or loss
Total profit or loss for reportable segments 15,866,750 14,052,883
Elimination of inter-segment profits (1,259,761) (1,482,828)
Unallocated expenses (4,595,777) (2,855,016)
Consolidated profit before tax 10,011,212 9,715,039
Australasia - Other
Europe
Australasia - Leasing Total
Australasia
Reportable segment profit before income tax, corporate costs and intercompany charges
65
For
per
sona
l use
onl
y
THINKSMART LIMITED NOTES TO THE FINANCIAL STATEMENTS
2011 2010
$ $
Reconciliation of reportable segment assets
Total assets for reportable segments 108,878,858 45,611,508
Other unallocated amounts (697,357) 291,883
Consolidated total assets 108,181,501 45,903,391
Reconciliation of reportable segment liabilities
Total liabilities for reportable segments 69,843,143 8,264,853
Other unallocated amounts (1,927,816) (60,589)
Consolidated total liabilities 67,915,327 8,204,264
Other than recognising that within the Australasia segment there are two reportable segments with the commencement during the year of a leasing segment, there has been no change to the basis of segmentation or the measurement basis for the segment profit or loss since 31 December 2010.
66
For
per
sona
l use
onl
y
THINKSMART LIMITED NOTES TO THE FINANCIAL STATEMENTS
26. Segment Information (cont.)
Major customerRevenues from the Group’s funding partners represent $28,166,737 (2010: $25,551,047) of the Group’s total revenue.
2011 2010$ $
27. Remuneration of AuditorsAudit services:Auditors of the Company:Audit and review of financial reports (Australia) 302,645 224,807 Audit and review of financial reports (Overseas) 96,373 68,337
399,018 293,144
Services other than statutory audit:Other assurance servicesTax and other services 80,307 22,133
80,307 22,133
The Group’s auditors were KPMG in 2011 and 2010.
28. Commitments and Contingent Liabilities
Under the terms of the previous UK funding agreement the Group is potentially liable to refund part of its brokerageincome in the event that the funders bad debts exceed certain pre-agreed levels. As at 31 December 2011, the maximumamount of brokerage income that the group may potentially have to refund in the future is $29,982 (2010:$492,027).
Under the terms of the UK current funding agreement with Secure Trust Bank ("STB"), the Group is obliged to purchasedelinquent leases from the funder at the funded amount. At 31 December 2011, the total funded amount of all leasesfunded by the funder is $25,952,670 (2010: $11,845,103). The Group has entered into a Credit Default Swap ("CDS") withSTB for which it has provided a deposit of $4,395,872 as collateral for the obligation under the CDS. The Group hasprovided $1,365,930 (2010: $683,372) being its estimate of the funded amount of these leases that are likely to becomedelinquent in the future.
Included in cash and cash equivalents is $2,028,210 (2010:$2,917,361) which is held as part of the Group's fundingarrangements (including the SPE) and is restricted.
Under the terms of its Australian non-SPE funding agreement the Group has deposits held by the funder as credit supportfor the portfolio of leases funded by the funder. These deposits represent amounts held in excess of expected future losses,however the group has a potential risk that, should losses exceed expected levels and alternate remedies are not made, aportion of these deposits may be forfeit. As at 31 December 2011, the maximum amount of funder deposits that the Groupmay potentially forfeit in the future is $1,241,296 (2010: $3,122,945). Further funder deposits are held by the funderagainst the risk of default by the group under the servicing provisions of its Australian funding agreement. Should thegroup default against these obligations, the entire deposit would be forfeit. As at 31 December 2011 the deposit heldagainst servicing default was $904,112 (2010: $2,643,398).
Under the terms of its agreement with its UK clearing bank for the provision of direct debit facilities, the Group has issueda Standby Letter of Credit for £2,000,000 in favour of the UK clearing bank as a mitigant against the potential for thereversal of direct debit payments pursuant to individual customers’ dispute of direct debit payments which the Group isunable to prove authorisation for. On 15 February 2012 this Standby Letter of Credit was released and replaced by aparental guarantee issued by ThinkSmart Ltd in favour of the UK clearing bank.
The total balance of deposits recognised with funders net of associated provisions and financial guarantee contracts is$5,175,350.
67
For
per
sona
l use
onl
y
THINKSMART LIMITED NOTES TO THE FINANCIAL STATEMENTS
29. Contingent Inertia Assets
30. Financial Instruments
(a) Interest rate risk ProfileAt the reporting date, the interest rate profile of the Group’s interest-bearing financial instrument were:
A conservative estimate of its realisable value has been made by estimating expected sales proceeds through the leastprofitable sales channel and public auction. The after-tax cash flows, calculated from rental contracts in existence at 31December 2011, are discounted using appropriate risk factors. The estimated value of future cash flows is $1,794,114(2010: $9,572,203), representing the discounted after tax value of assets as determined by reference to auction saleshistory. The primary reason for the reduction in value of this contingent asset is the change in the Group's fundingarrangements which means a proportion of these assets are no longer contingent because the Group has obtainedunconditional rights to the future revenue streams.
Carrying amount
A change in 1% in interest rates would have increased or decreased the Group’s profit by the amounts show below (2010:$255,766). This analysis assumes that all other factor remain constant including foreign currency rates.
Under the Group’s accounting policy (note 3(n)), inertia revenue for those assets funded under the brokerage model, wherethe Group does not have an unconditional right to the asset and residual lease rights, is not recognised until the conclusionof the initial rental period. At this point, the Group is entitled to acquire the equipment from the funders at a nominal value,and the equipment can be disposed of, or continue to be rented to third parties.
The Group does not have control over these future revenue streams and accordingly the revenue is not brought to accountuntil it is received. Where the Group does have an unconditional right to these future revenue streams it recognises anintangible asset as described in note 3(i).
68
For
per
sona
l use
onl
y
THINKSMART LIMITED NOTES TO THE FINANCIAL STATEMENTS
30. Financial Instruments (cont.)
(b) Fair value of financial instruments
Fair value hierarchyThe financial instruments carried at fair value have been classified by valuation method.The different levels have been defined as follows:• Level 1: quoted prices (unadjusted) in active markets for identical assets or liabilities• Level 2: inputs other than quoted prices included within Level 1 that are observable
for the asset or liability, either directly (i.e., as prices) or indirectly (i.e., derived from prices)• Level 3: inputs for the asset or liability that are not based on observable market data (unobservable inputs)
Australasia 82,759,298 22,110,658 Europe 10,348,742 12,570,466
93,108,040 34,681,124
The carrying amounts of financial assets and financial liabilities recorded in the financial statements approximate their aggregate net fair values.
The maximum credit risk exposure of the Group is the sum of the carrying amount of the Group’s financial assets and the contingent liabilities in note 28. The carrying amount of the Group’s financial assets that is exposed to credit risk at reporting date is:
The financial liability of the Group is comprised of interest rate swaps used for hedging. $297,214 is classified as level 2and an interest rate of 5.25% has been used to determine the hedge fair value.
The carrying amount of the Group’s financial assets that is exposed to credit risk at reporting date by geographic region is:
69
For
per
sona
l use
onl
y
THINKSMART LIMITED NOTES TO THE FINANCIAL STATEMENTS
$ $ $ $Not past due 343,820 - 2,088,171 53,993 Past due 0-30 days 9,602,141 29,981 104,134 5,468 Past due 31-120 days 35,331 21,190 88,350 25,172 Past due 120-365 days 31,684 31,681 79,042 27,545 More than 1 year 2,447 2,447 2,769 -
10,015,423 85,299 2,362,466 112,178
The movement in the allowance for impairment in respect of trade receivables during the year was as follows:
2011 2010$ $
Balance at 1 January 112,178 214,448 Impairment loss recognised 148,230 239,513 Bad debt written off (174,676) (308,555)Effect of exchange rate (433) (33,228)Balance at 31 December 85,299 112,178
Included in Others is an amount of $7,297,323 relating to collections from lessee customers in relation to theportfolio of leases acquired by the Group via a pass through arrangement from Bendigo and Adelaide Bank.Bendigo and Adelaide Bank has not distributed any funds from this account as per Note 24(c). The credit riskexposure from retail customers also includes an amount of $41,220,750 which relates to the same portfolio ofleases. Bendigo and Adelaide Bank controls the bank account to which the collections are deposited andaccordingly the Group has a credit risk exposure to Bendigo and Adelaide Bank with respect to these amounts.
The carrying amount of the Group’s financial assets that are exposed to credit risk at reporting date by types of counterparty is:
In 2011, 72% (2010: 66%) of the total prepayment relates to RentSmart Limited’s upfront insurance premiumspayment to Allianz on behalf of the rental customer. The premiums are recovered from the customer on a monthlybasis. In the event the customer defaults, the policy is cancelled and Allianz refunds the unexpired premium.
70
For
per
sona
l use
onl
y
THINKSMART LIMITED NOTES TO THE FINANCIAL STATEMENTS
30. Financial Instruments (cont.)
(c) Credit risk management (cont.)
The ageing of the Group’s lease receivables at the reporting date was:
$ $ $ $Not past due 59,564,689 - - - Past due 0-30 days 5,200,079 225,586 - - Past due 31-120 days 2,986,309 1,208,439 - - Past due 120-365 days 258,648 152,967 - - More than 1 year 4,172 1,119 - -
68,013,897 1,588,111 - -
The movement in the allowance for impairment in respect of lease receivables during the year was as follows:
2011 2010$ $
Balance at 1 January - - Impairment loss recognised 1,588,111 - Balance at 31 December 1,588,111 -
(d) Currency risk management Exposure to currency riskThe Group’s exposure to foreign currency risk at balance date was as follows, based on notional amounts:
In AUD GBP EUR NZD USDCash and cash equivalent 1,179,903 74,792 24,486 8,609 Trade and other receivables 955,128 29,261 116,445 - Trade and other payables 1,109,365 51,382 44,153 2,637 Gross exposure 3,244,396 155,435 185,084 11,246
31 December 2011
Trade receivables are reviewed and considered for impairment on a periodic basis, based on the number of daysoutstanding and number of payments in arrears. 95% (2010: 90%) of the net trade receivables balance is owed by theGroup’s most significant financiers, and 4% (2010: 3%) of the remaining net receivables balance is owed by debtors with agood credit history with the Group.
Since May 2011 when the Group acquired a portfolio of finance lease receivables from Bendigo Adelaide Bank (BEN) ithas made $27,251 of recoveries in relation to assets repossessed and cash recoveries.
The management of credit risk in relation to its customers is described in Note 5.
71
For
per
sona
l use
onl
y
THINKSMART LIMITED NOTES TO THE FINANCIAL STATEMENTS
30. Financial Instruments (cont.)
(d) Currency risk management (cont.)
In AUD GBP EUR NZD USDCash and cash equivalent 6,392,124 491,964 48,531 1,894 Trade and other receivables 1,913,291 70,180 107,939 - Trade and other payables (1,738,530) (229,750) (82,448) (2,105)Gross exposure 6,566,885 332,394 74,222 (212)
The following significant exchange rates applied during the year:
A 10% strengthening of the Australian dollar against the following currencies at 31 December would have increased/(decreased) equity and profit and loss by the amounts shown below. This analysis assumes that all other variables, inparticular interest rates, remain constant. The analysis is performed on the same basis for 2010:
A 10% weakening of the Australian dollar against the above currencies at 31 December would have had equal but oppositeeffect on the above currencies to the amounts shown above, on the basis that all other variables remain constant.
72
For
per
sona
l use
onl
y
THINKSMART LIMITED NOTES TO THE FINANCIAL STATEMENTS
30. Financial Instruments (cont.)
(e) Liquidity risk management
Non-derivatives Carrying Amount
Contractual cash flow
Less than 1 year
1-2 years 2-5 years
31 December 2011Trade and other payables 6,903,386 (6,903,387) (6,903,387) - - Term loans 2,426,713 2,615,506 2,615,506 - - Secured note facility 53,722,384 (57,766,918) (39,964,315) (14,302,437) (3,500,166)
63,052,483 (62,054,799) (44,252,196) (14,302,437) (3,500,166)31 December 2010Trade and other payables 4,317,611 (4,317,615) (4,317,615) - - Term loans 2,489,944 (2,500,000) (2,500,000) - -
6,807,555 (6,817,615) (6,817,615) - -
Derivatives Carrying Amount
Contractual cash flow
Less than 1 year
1-2 years 2-5 years
31 December 2011Interest rate swaps used for hedging 297,214 (297,214) (226,525) (64,560) (6,129)
297,214 (297,214) (226,525) (64,560) (6,129)
31. Related Party Disclosures
Non-Executive DirectorsD Griffiths (Deputy Chairman)S PenglisF de Vicente N Fox – appointed 10 October 2011
Executive DirectorsN Montarello (Chairman, Managing Director and Chief Executive Officer)
ExecutivesA Baum (Group Chief Operating Officer, ThinkSmart Limited) N Barker (Group Chief Financial Officer, ThinkSmart Limited) – resigned 30 June 2011J Ferreira (Group Chief Financial Officer (acting), ThinkSmart Limited) – appointed 1 July 2011S McDonagh (Executive General Manager, RentSmart Unit Trust) – re-appointed 25 July 2011G Varma (Group Chief Information Officer, ThinkSmart Limited)G Parry (Managing Director - UK, RentSmart Limited)
The following are the contractual maturities of non-derivative financial liabilities, including estimated interest payments and excluding the impact of netting agreements:
The following were key management personnel (“KMP”) of the Group are any time during the reporting period and unless otherwise indicated were key management personnel for the entire period:
73
For
per
sona
l use
onl
y
THINKSMART LIMITED NOTES TO THE FINANCIAL STATEMENTS
31. Related Party Disclosures (cont.)
The KMP remuneration included in ‘employee benefits expense’ in note 6(b) is as follows:
The KMP receive no remuneration in relation to management of the Company (2010: nil).
Individual directors and executives remuneration disclosures
Loans to KMP and their related partiesThere have been no loans provided to KMP and their related parties as at 31 December 2011 (2010: nil).
Other KMP transactions
Options and rights over equity instruments
During the year and previous year, there have been no transactions with entities in which the KMP has significant controlor influence over those entities’ financial or operating policies.
The movement during the reporting period in the number of options over ordinary shares in ThinkSmart Ltd held, directly,indirectly or beneficially, by each key management person, including their related parties, is as follows:
Information regarding individual directors and executives remuneration and some equity instruments disclosures aspermitted by Corporations Regulations 2M.3.03 is provided in the Remuneration Report section of the Directors’ report.
Apart from the details disclosed in this note, no director has entered into a material contract with the Group since the endof the previous financial year and there were no material contracts involving directors’ interests existing at year-end.
74
For
per
sona
l use
onl
y
THINKSMART LIMITED NOTES TO THE FINANCIAL STATEMENTS
31. Related Party Disclosures (cont.)Employee Options
2011Exercised
DirectorsD Griffiths - - - - - - - S Penglis - - - - - - - F de Vincente - - - - - - - N Fox - - - - - - - N Montarello 2,000,000 1,000,000 - - 3,000,000 - -
ExecutivesA Baum - 5,800 271,110 - - 350,000 626,910 N Barker 172,999 - 95,000 - 280,000 - 547,999 S McDonagh 111,000 - - (46,100) - - n/aM Radotic 35,000 - - - - - 35,000 G Varma 398,333 - 43,114 (256,365) - - 185,082 G Parry 25,357 - - - - - 25,357 n/a: Personnel have resigned before reporting date. The share movement only relates to the period up to their respective resignation dates.
Held at 31 December 2010*
Granted as compensation
Held at 1 January 2010
Received on exercise of options
Granted as compensation
Held at 1 January 2011
Received on exercise of options
Held at 31 December 2011*
The movement during the reporting period in the number of ordinary shares in ThinkSmart Ltd held, directly, indirectly or beneficially, by each key management person, including their related parties, is as follows:
76
For
per
sona
l use
onl
y
THINKSMART LIMITED NOTES TO THE FINANCIAL STATEMENTS
31. Related Party Disclosures (cont.)
* The following shares are subject to escrow as at 31 December 2011 (refer to note 22 (b)(ii)):Held at Held at
31 December 2011 31 December 2010ExecutiveA Baum 475,000 350,000
ParentThe parent entity of the Group is ThinkSmart Limited.
32. Subsequent Events
33. Earnings per Share2011 2010
Cents per share Cents per shareBasic earnings per shareFrom continuing operations 5.23 6.52
Diluted earnings per shareFrom continuing operations 5.23 6.29
Basic earnings per share
2011 2010$ $
Profit after tax from continuing operations 6,798,347 6,773,013
Earnings used in the calculation of basic EPS from continuing operations 6,798,347 6,773,013
2011 2010Number Number
129,921,171 103,818,543
Diluted earnings per share
2011 2010$ $
Profit after tax from continuing operations 6,798,347 6,773,013 Earnings used in the calculation of diluted EPS from continuing operations 6,798,347 6,773,013
Since the end of the financial year the Group has extended the maturity date of its corporate banking facilities to 30 June2013 and has drawn a further $1.2 million under this facility, taking the drawn balance of the $5 million facility to $3.7million. Also since the end of the financial year the Group has succeeded in removing the requirement for a £2 millionStandby Letter of Credit which had been issued in favour of its UK clearing bank and has received conditional creditapproval for a $3 million extension of its corporate banking facilities to $8 million in total.
Weighted average number of ordinary shares for the purposes of basic earnings per share
The earnings and weighted average number of ordinary shares used in the calculation of diluted earnings per share are as follows:
The earnings and weighted average number of ordinary shares used in the calculation of basic earnings per share are as follows:
77
For
per
sona
l use
onl
y
THINKSMART LIMITED NOTES TO THE FINANCIAL STATEMENTS
Result of parent entityProfit for the period 648,731 492,256 Other comprehensive income (25,692) - Total comprehensive income for the period 623,039 492,256
Financial position of parent entity at year endCurrent assets 692,942 12,353,442 Total assets 35,044,913 39,391,828
Current liabilities 1,707,370 3,405,428 Total liabilities 1,733,304 3,662,416
Total equity of the parent entity comprising of:Share capital 39,663,556 39,615,237 Share based payment reserve 744,026 230,947 Retained earnings (7,095,972) (4,116,772)Total equity 33,311,610 35,729,412
Parent entity contingencies
Shares deemed to be issued for no consideration in respect of:
Weighted average number of ordinary shares used in the calculation of diluted EPS
Weighted average number of ordinary shares for the purposes of diluted earnings per share are as follows:Weighted average number of ordinary shares used in the calculation of basic EPS
At 31 December 2011 7,166,667 options (2010: 3,393,333) were excluded from the diluted weighted average number of ordinary shares calculation as their effect would have been anti-dilutive.
The directors are of the opinion that provisions are not required in respect of these matters, as it is not probable that a future sacrifice of economic benefits will be required or the amount is not capable of reliable measurement.
As at, and throughout, the financial year ending 31 December 2011, the parent entity of the Group was ThinkSmart Limited.
78
For
per
sona
l use
onl
y
THINKSMART LIMITED NOTES TO THE FINANCIAL STATEMENTS
$ $Contingent liabilities considered unlikelyPerformance guarantees (a) - 7,000,000
The parent entity has issued a parental guarantee in favour of its UK clearing bank to guarantee the obligations of RentSmartLimited with respect to its Direct Debit facilities as described in Note 28.
(a) A bank guarantee had been issued on behalf of the parent entity, to an unrelated party, in relation to the performance of asubsidiary in the management of a portfolio of rental agreements. During the financial year this guarantee was returned andcancelled.
The parent entity has provided a commitment to continue its financial support of RentSmart Unit Trust, ThinkSmart EuropeLtd and RentSmart Ltd to enable the subsidiaries to pay their debts as and when they fall due. The Company will not call forthe repayment of its loan until RentSmart Unit Trust, ThinkSmart Europe Ltd and RentSmart Ltd are in a financial positionto make such a payment without affecting its operational capabilities.


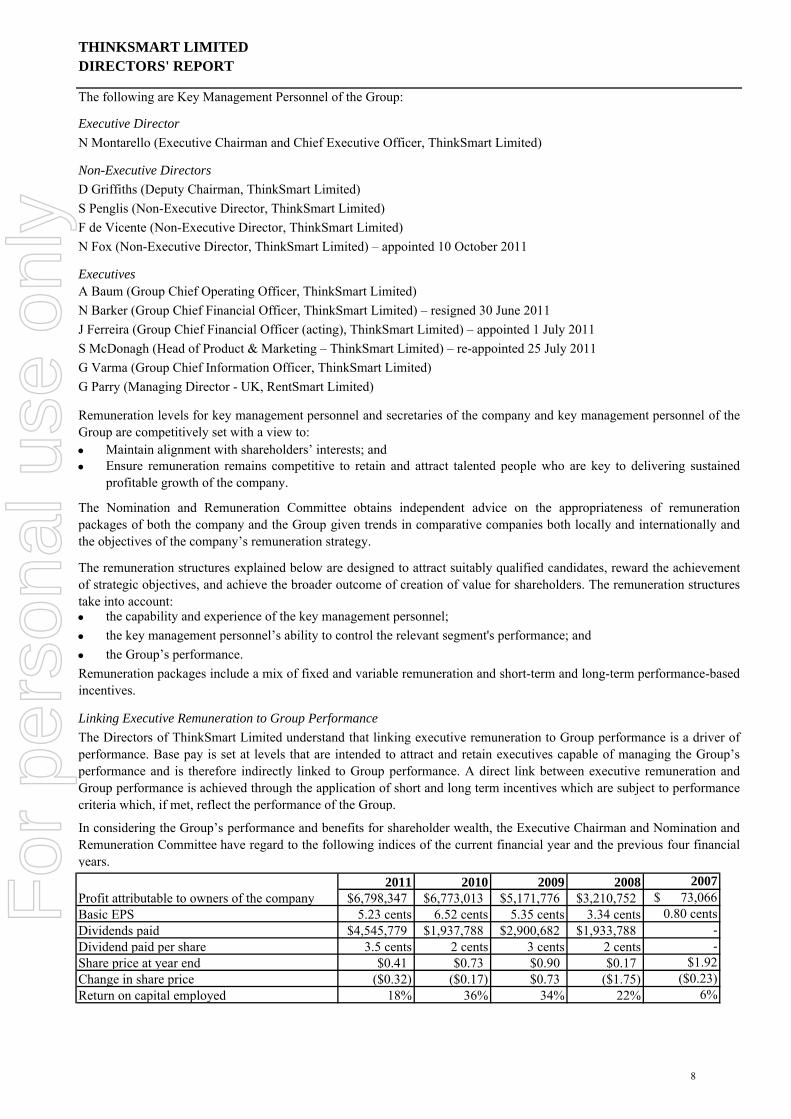

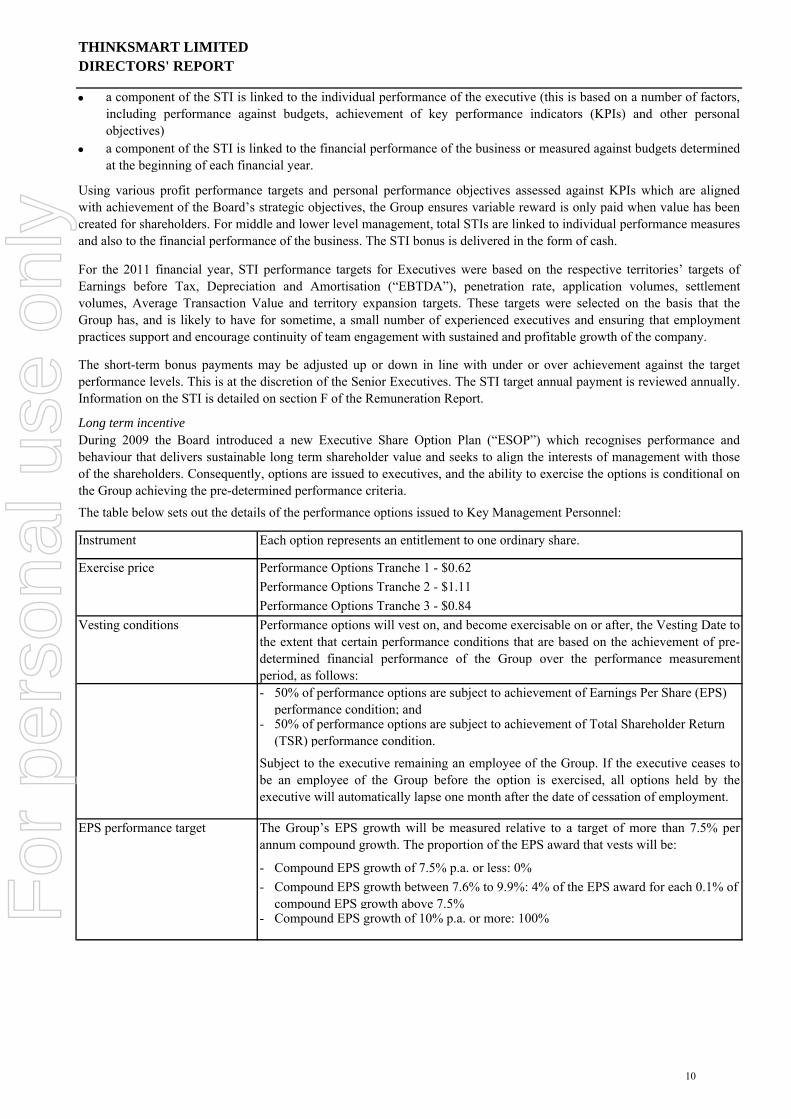
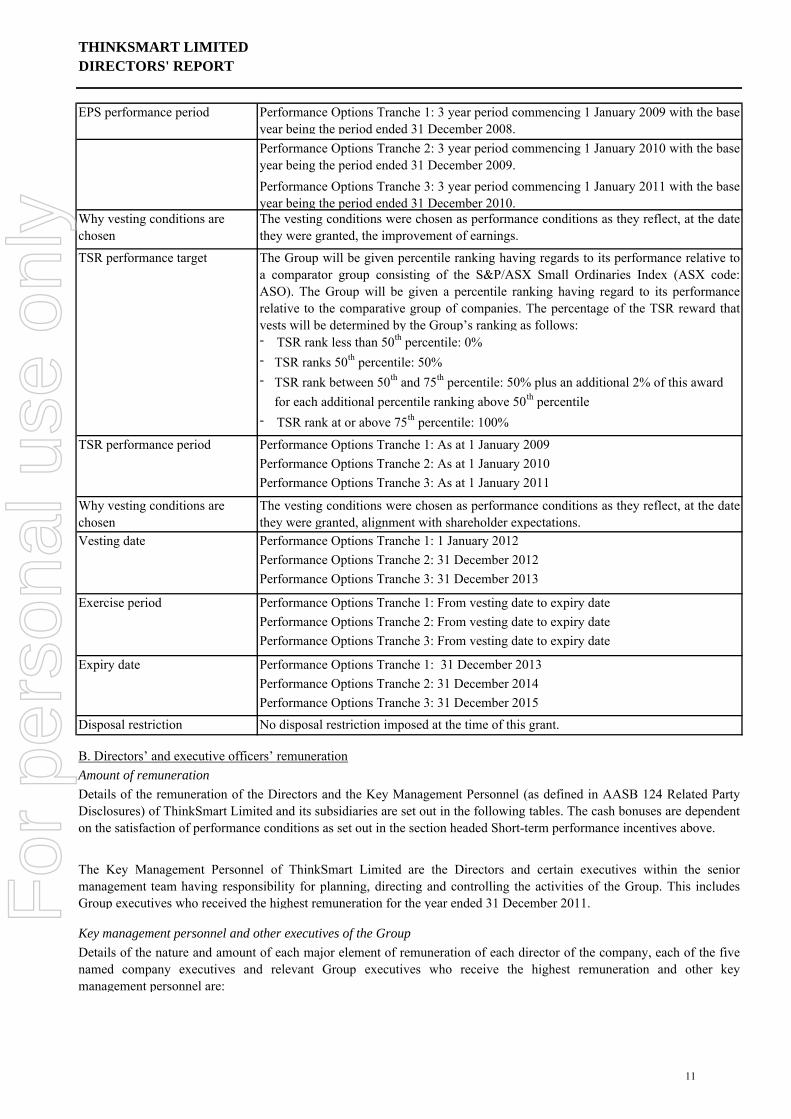

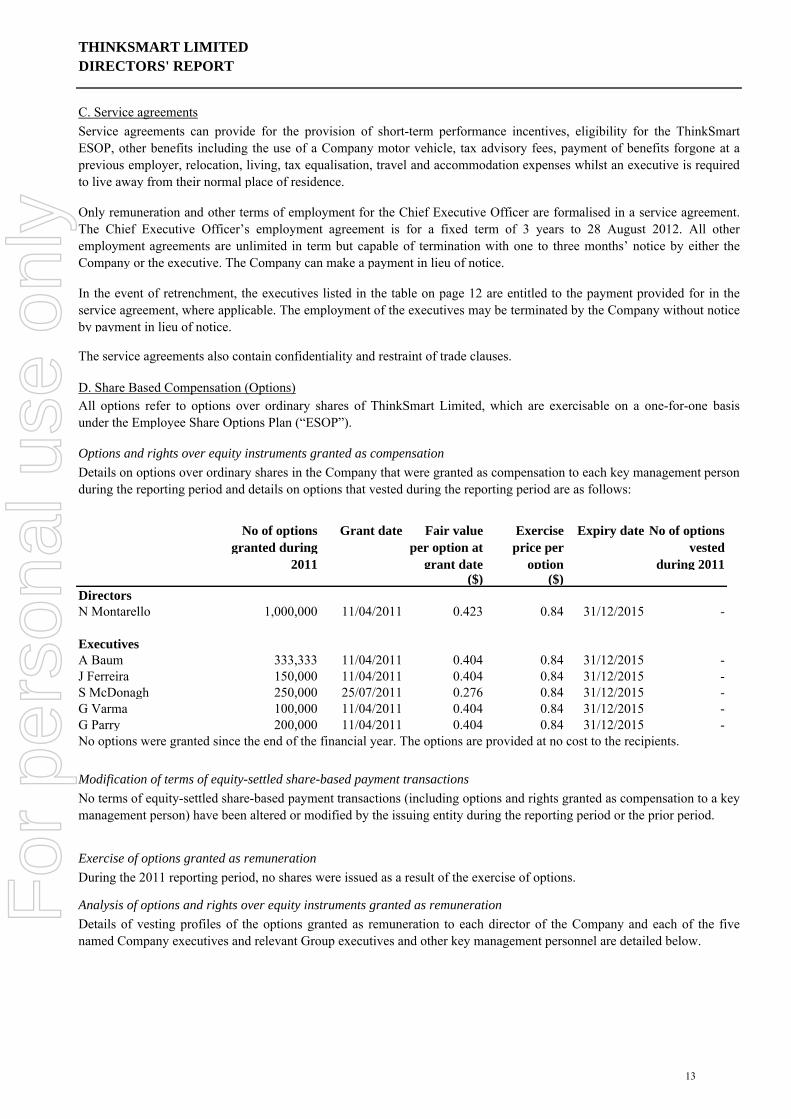


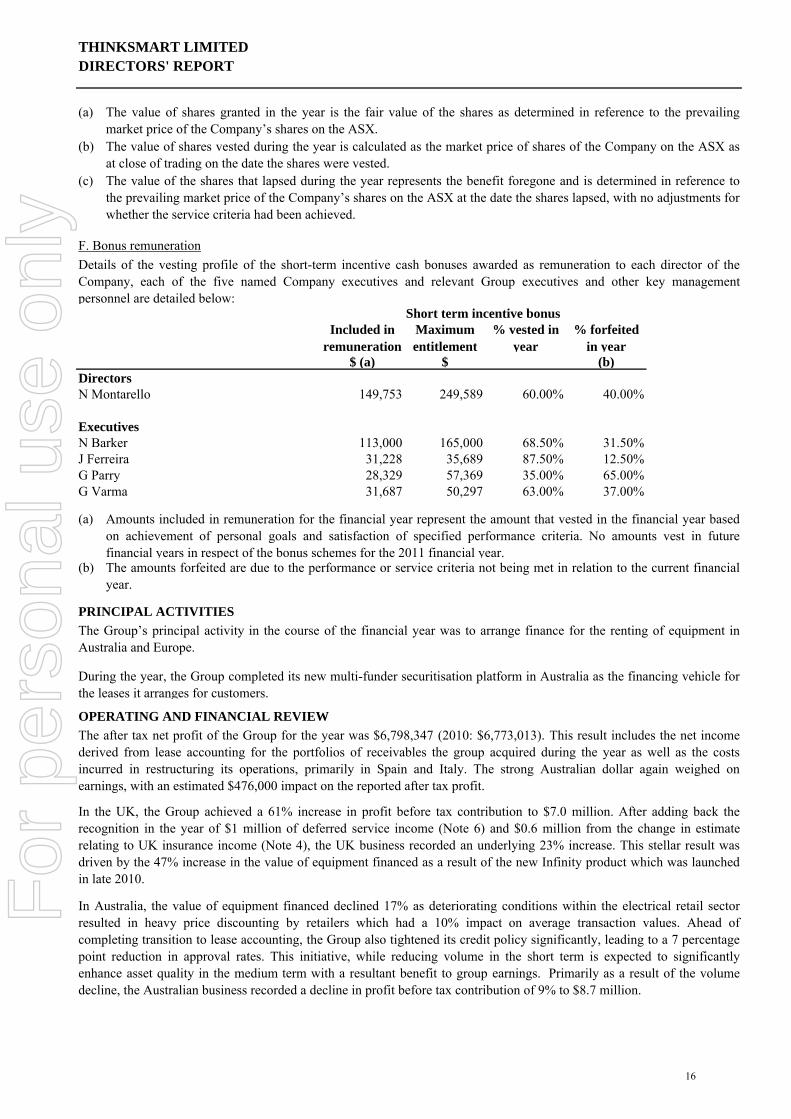


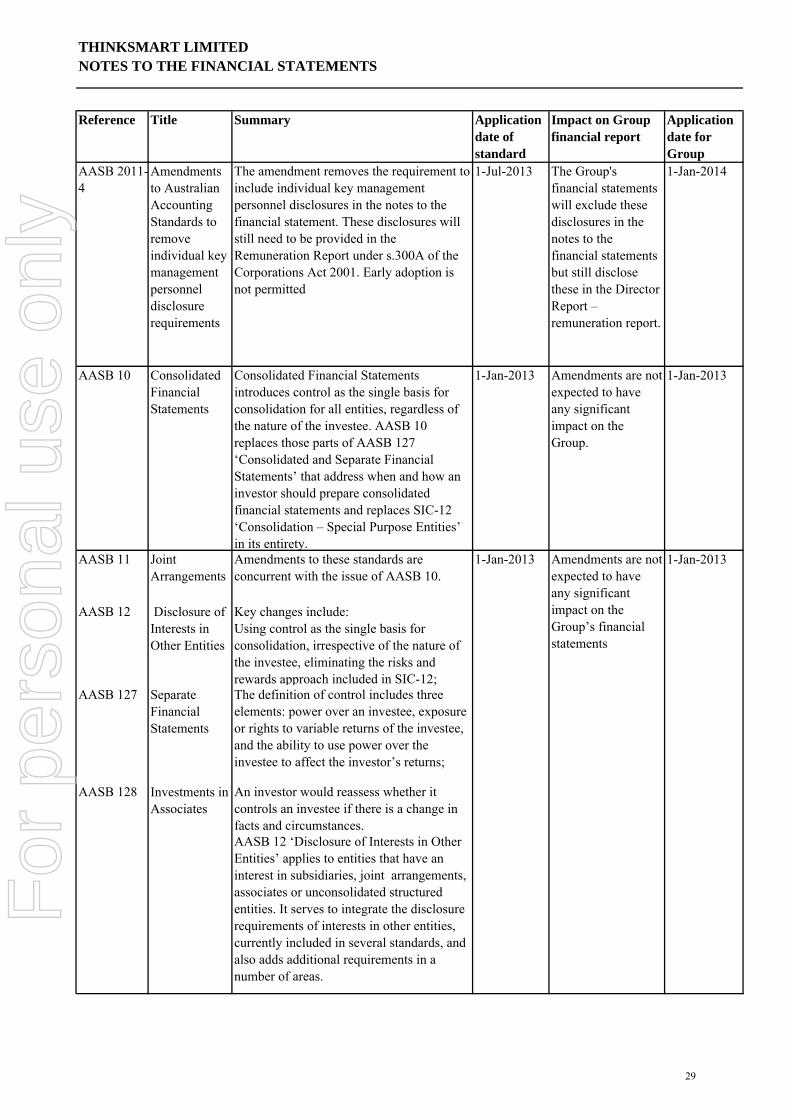


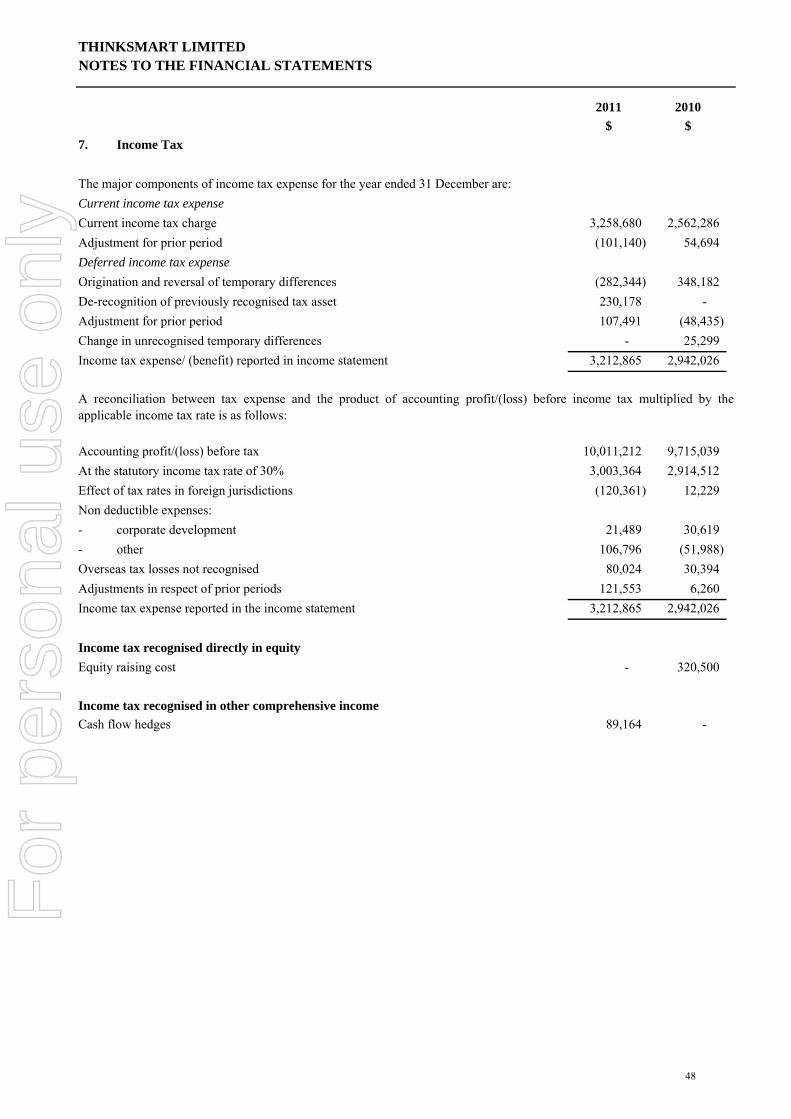


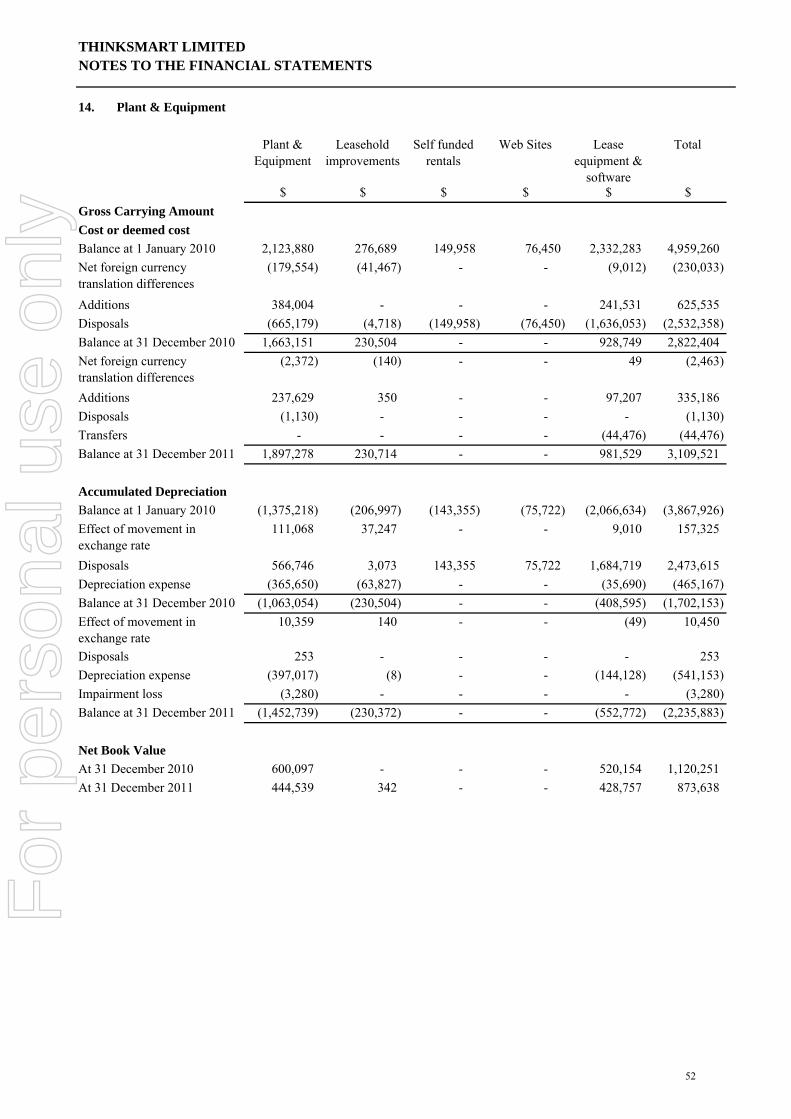
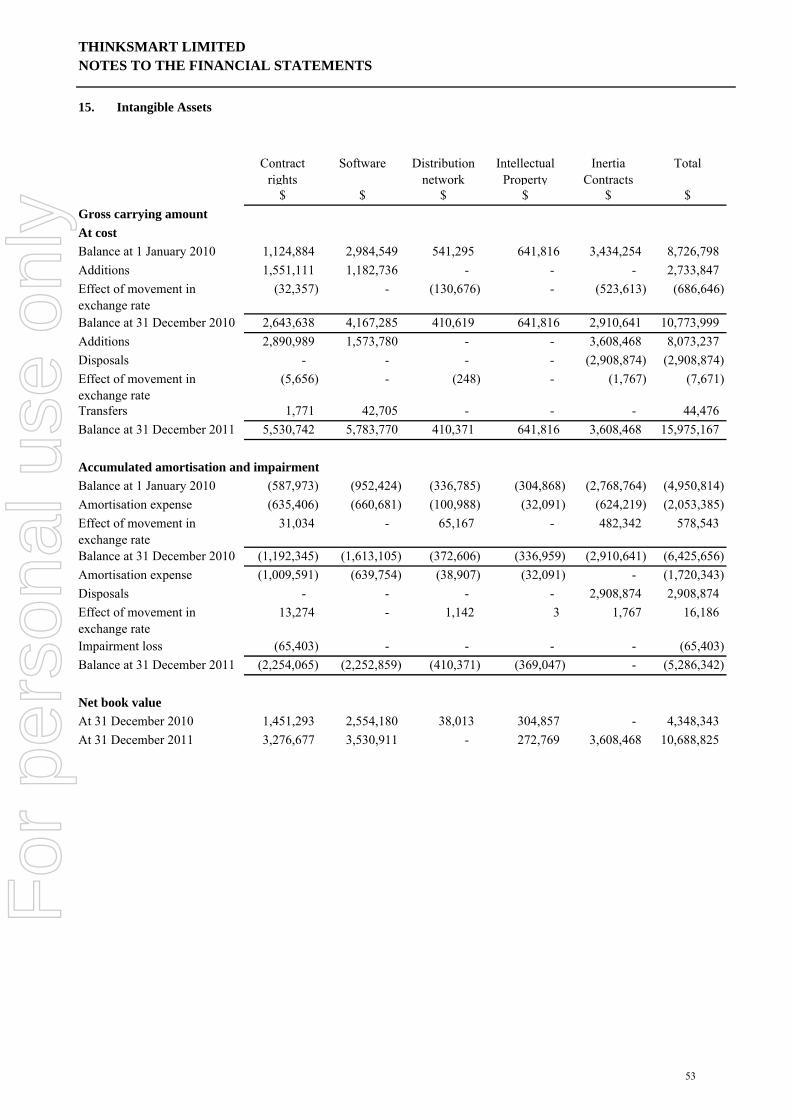


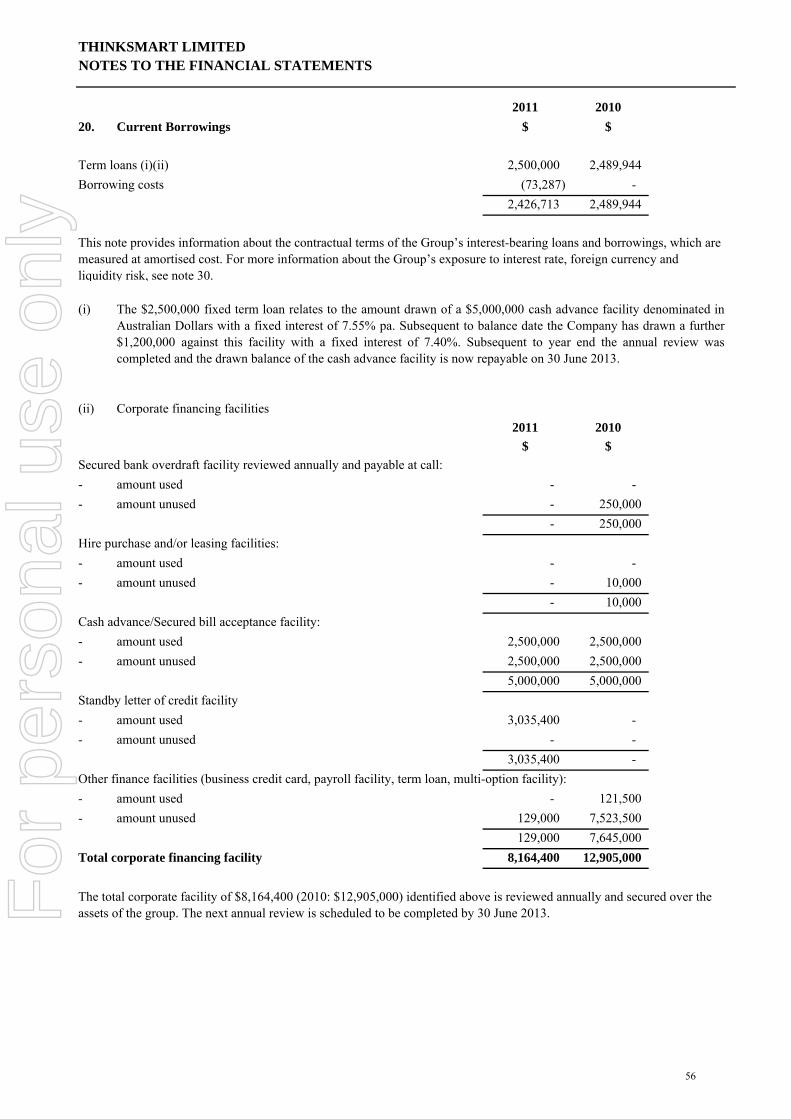


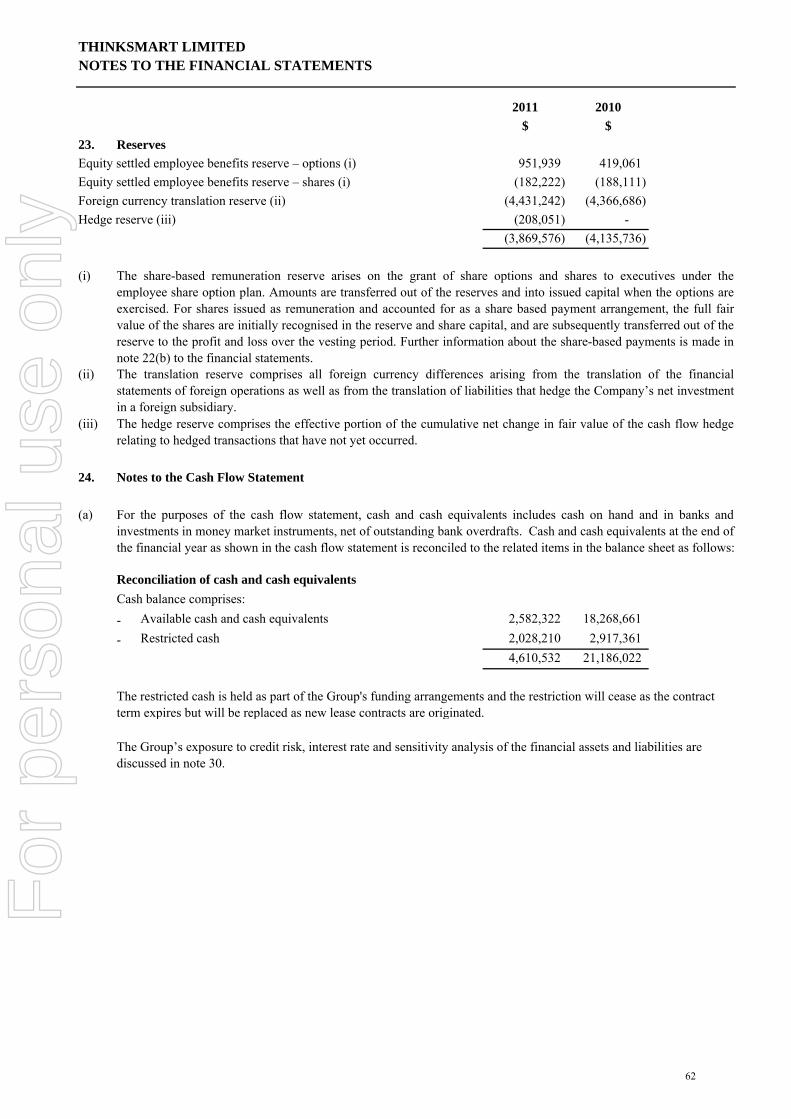


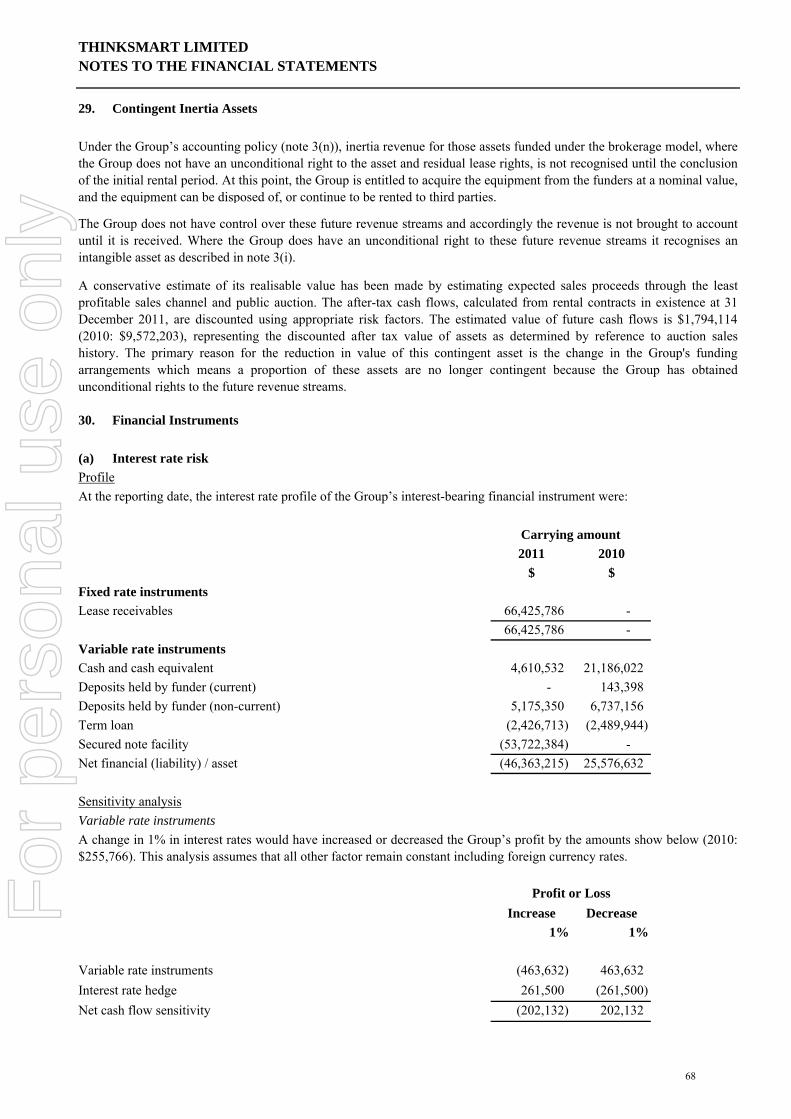
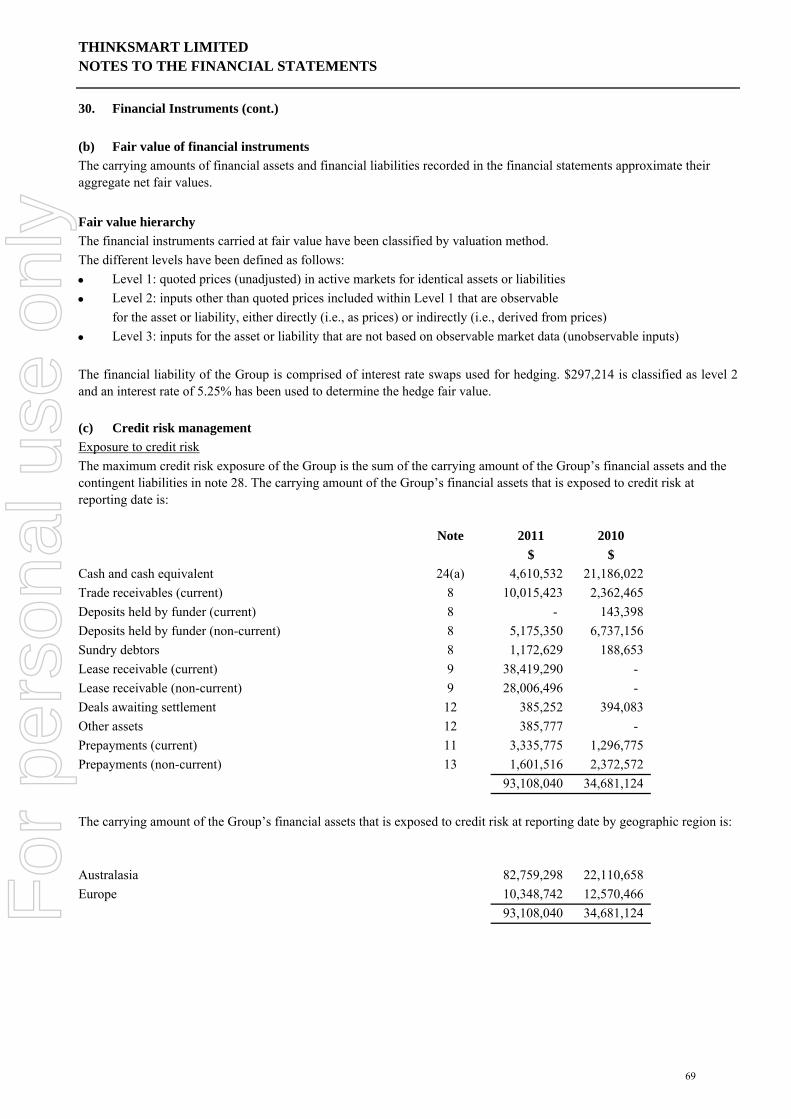
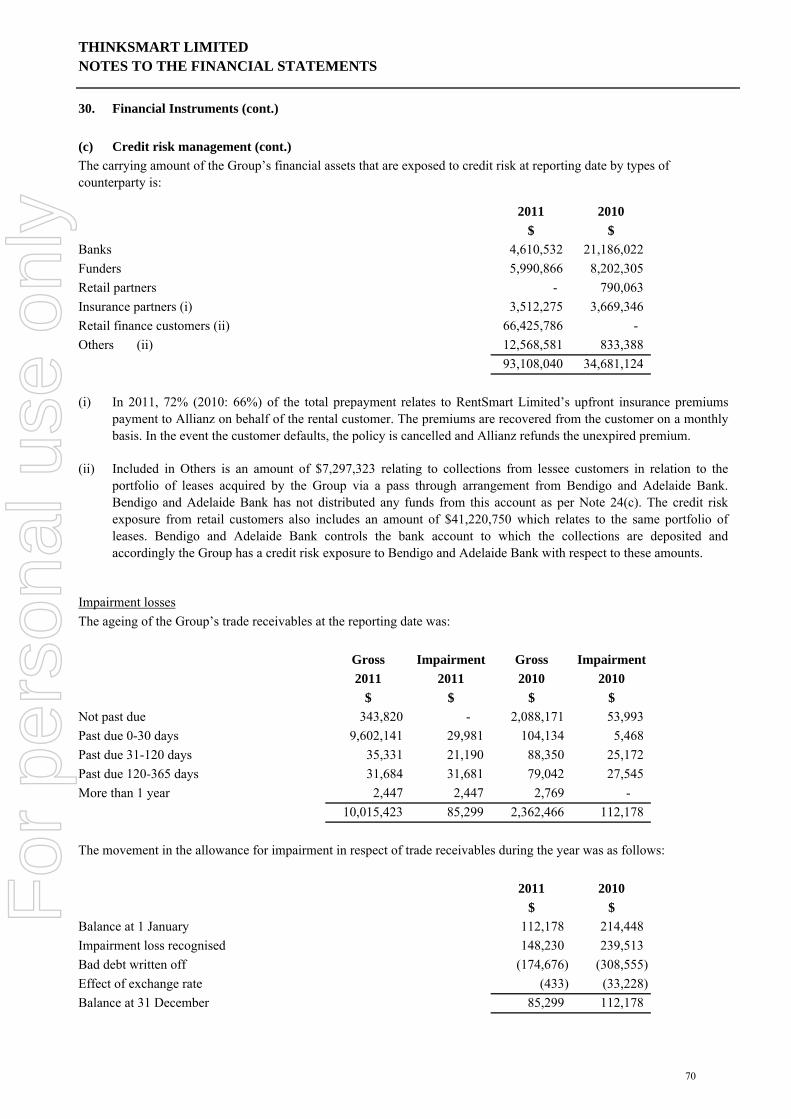
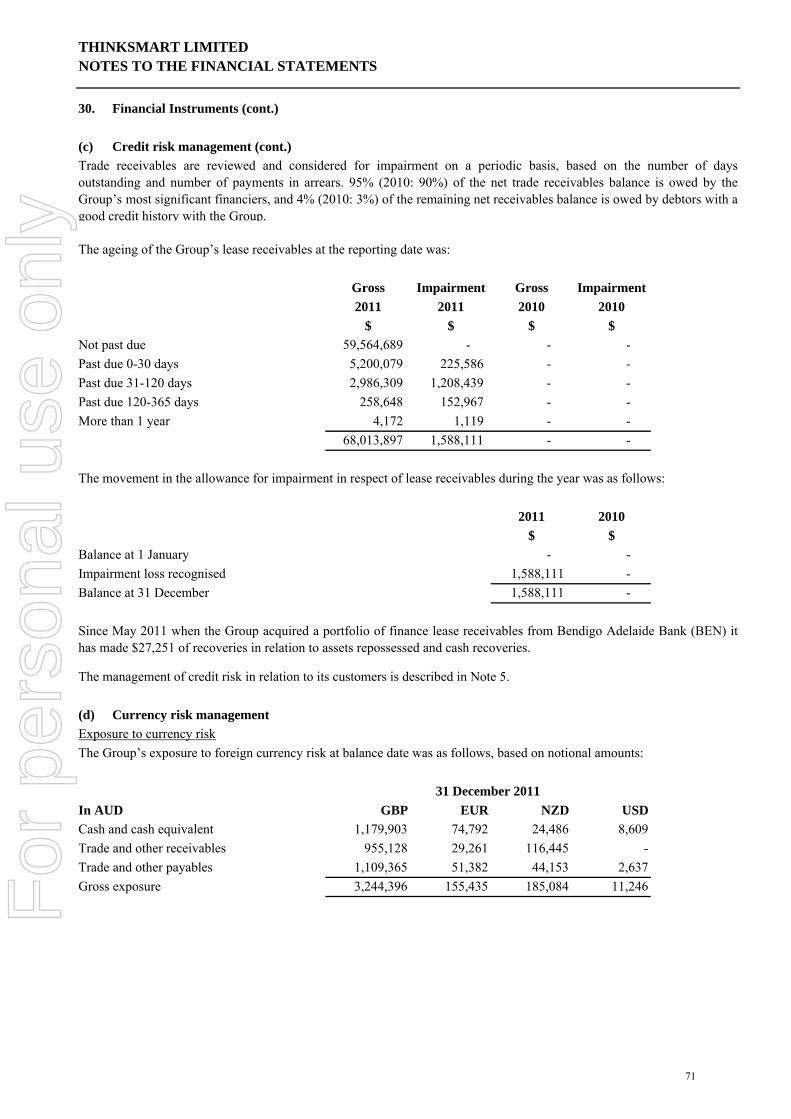

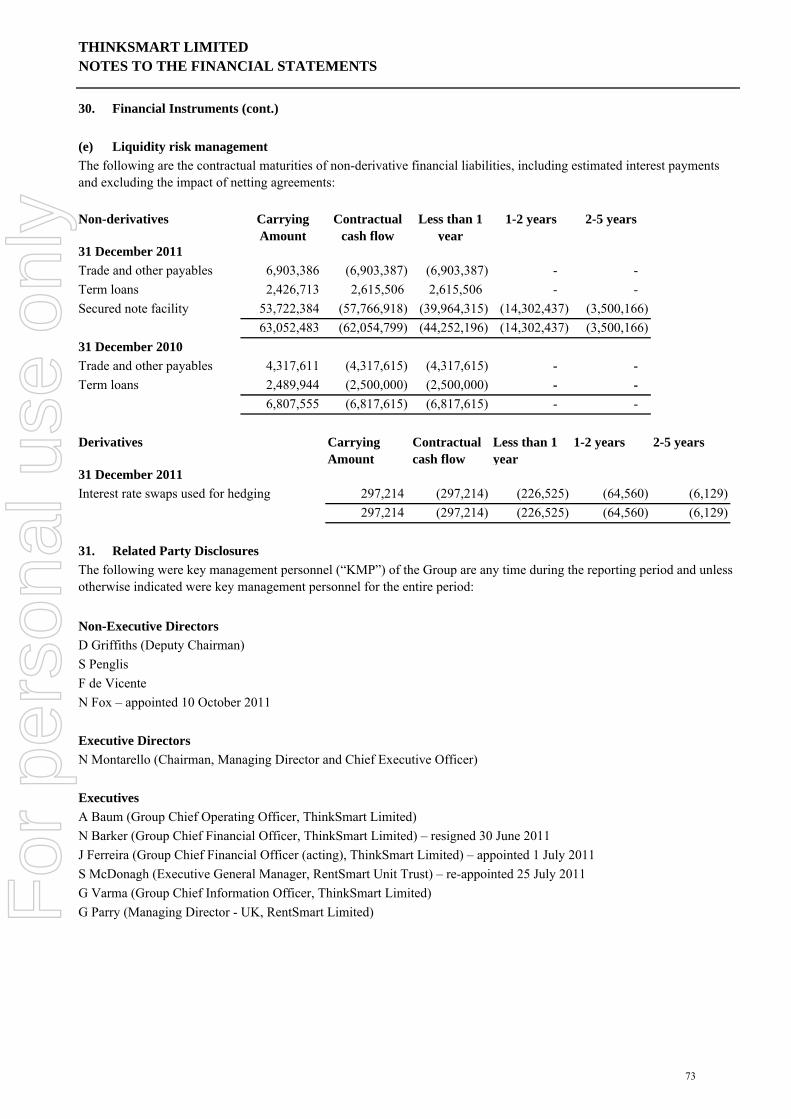
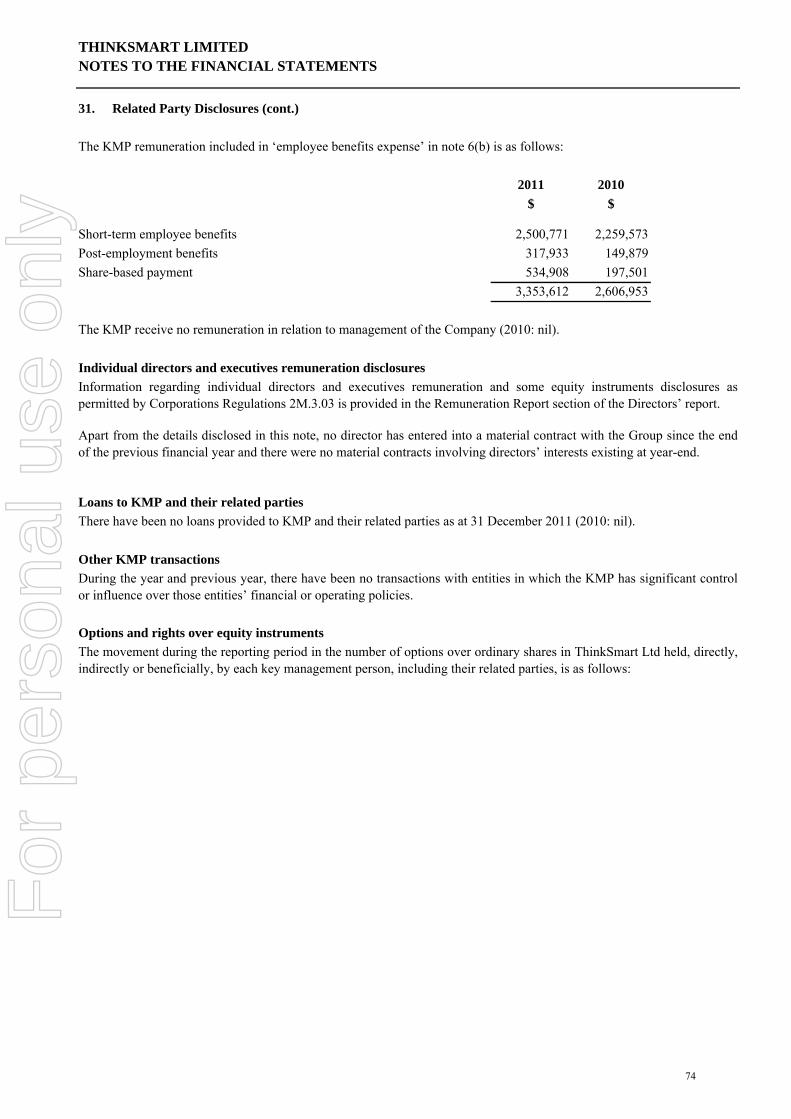
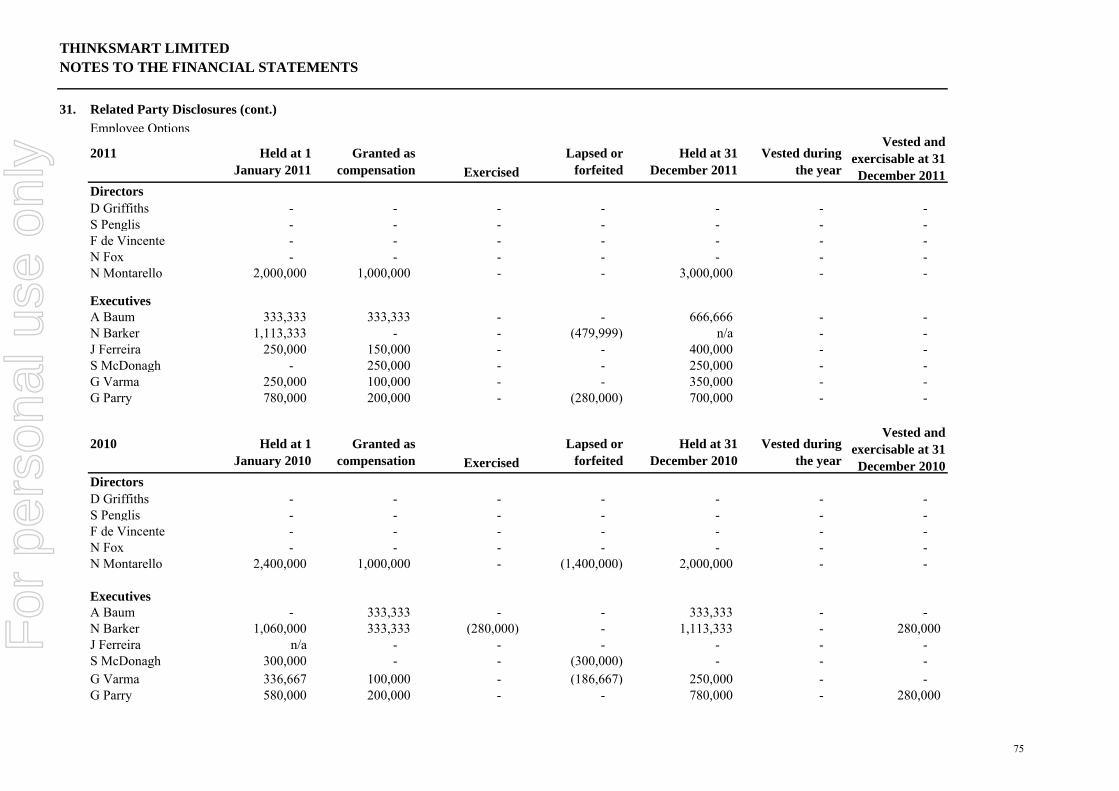


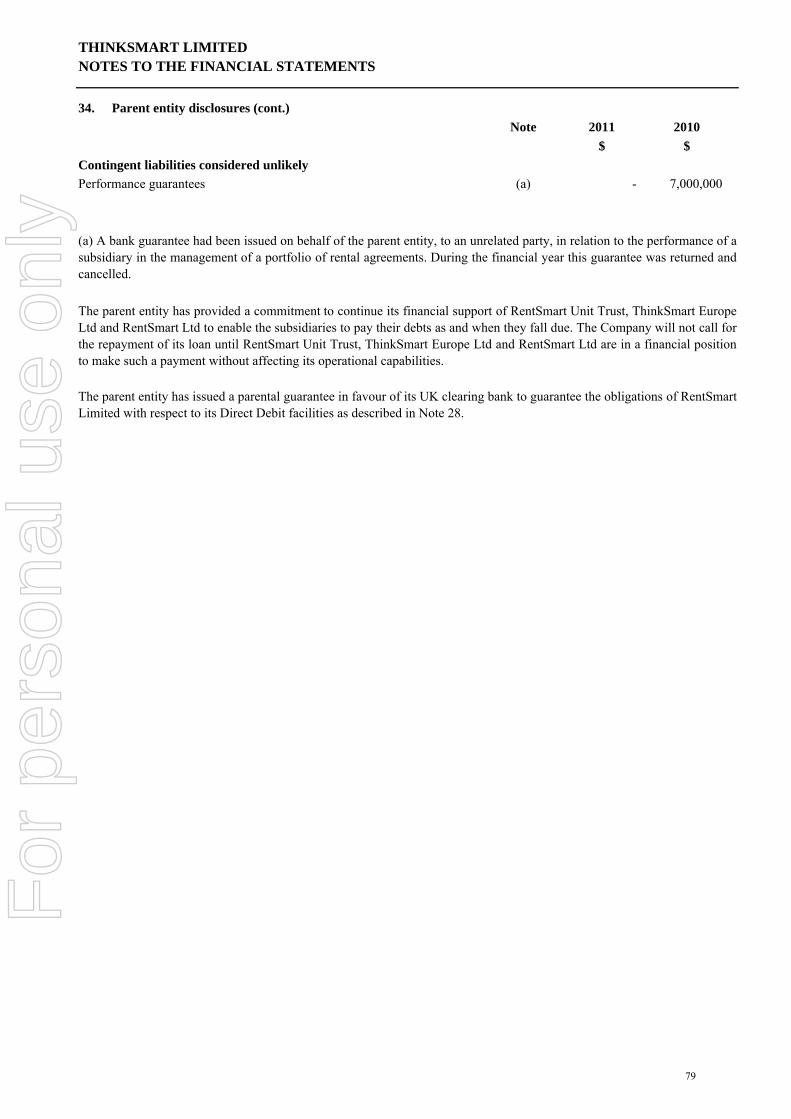


![[Shinobi] Claymore 092](https://static.documents.pub/doc/80x56/568bd5b31a28ab2034996af8/shinobi-claymore-092.jpg)


