NAOS Emerging Opportunities Company Limited ASX Code: NCC ACN: 161 106 510 Appendix 4E | Results for Announcement to the Market Results Announcement for the year ended 30 June 2019 All comparisons are to the year ended 30 June 2018 $ up/down % change Revenue from ordinary activities (8,816,663) down -236% Loss from ordinary activities before tax attributable to shareholders (10,211,753) down -308% Loss from ordinary activities after tax attributable to shareholders (7,507,390) down -282% Dividend Information Cents per share Franked amount per share Tax rate for franking 2019 Final dividend 3.50 3.50 27.5% 2019 Interim dividend 3.75 3.75 27.5% Final Dividend Dates Ex-dividend date 7 October 2019 Record date 8 October 2019 Last date for DRP election 9 October 2019 Payment date 23 October 2019 Dividend Reinvestment Plan The Dividend Reinvestment Plan is in operation and the recommended fully franked final dividend of 3.50 cents per share qualifies. The plan will be in effect per the latest dividend reinvestment rules. 30 June 2019 30 June 2018 $ $ (Post Tax) Net tangible asset backing per share 1.04 1.23 This report is based on the annual report which has been subject to independent audit by the auditors, Deloitte Touche Tohmatsu Australia. The audit report is included with the Company's Annual Report, which accompanies this Appendix 4E. All the documents comprise the information required by the Listing Rule 4.3A. For personal use only
Transcript
NAOS Emerging Opportunities Company Limited
ASX Code: NCC ACN: 161 106 510
Appendix 4E | Results for Announcement to the Market
Results Announcement for the year ended 30 June 2019
All comparisons are to the year ended 30 June 2018
$ up/down % change
Revenue from ordinary activities
(8,816,663) down -236% Loss from ordinary activities before tax attributable to shareholders (10,211,753) down -308% Loss from ordinary activities after tax attributable to shareholders (7,507,390) down -282%
The Dividend Reinvestment Plan is in operation and the recommended fully franked final dividend of 3.50 cents per
share qualifies. The plan will be in effect per the latest dividend reinvestment rules.
30 June 2019 30 June 2018 $ $ (Post Tax) Net tangible asset backing per share 1.04 1.23
This report is based on the annual report which has been subject to independent audit by the auditors, Deloitte Touche
Tohmatsu Australia. The audit report is included with the Company's Annual Report, which accompanies this Appendix 4E. All
the documents comprise the information required by the Listing Rule 4.3A.
For
per
sona
l use
onl
y
ACN 161 106 510 ASX: NCC
NAOS EMERGING OPPORTUNITIESCOMPANY LIMITED
Annual Report 2019
For
per
sona
l use
onl
y
NAOS Emerging Opportunities Company Limited Annual Report 2019
2019 ANNUAL GENERAL MEETINGAGM to be held at 10:00am (AEDT) on Thursday 14 November 2019 at Morgans, Level 21, Aurora Place, 88 Philip Street, Sydney NSW 2000
Please join us for our bi-annual Investor Roadshow
The NAOS team will provide an update on our Listed Investment Companies (LICs). The discussion will include an insight into our investment philosophy and process as well as highlighting a selection of stocks held within the LICs. Refreshments will be provided at 10:30am before each presentation.
PERTHTuesday 10 September 2019
11:00am-12:30pm Parmelia Hilton Perth 14 Mill Street Perth WA 6000
MELBOURNEThursday 12 September 2019
11:00am-12:30pm The Westin Melbourne 205 Collins Street Melbourne VIC 3000
BRISBANETuesday 17 September 2019
11:00am-12:30pm Customs House 399 Queen Street Brisbane QLD 4000
SYDNEYThursday 19 September 2019
11:00am-12:30pm State Library of NSW Corner Macquarie Street and Shakespeare Place Sydney NSW 2000
ADELAIDE Tuesday 24 September 2019
11:00am-12:30pm Pullman Adelaide 16 Hindmarsh Square Adelaide SA 5000
CANBERRAThursday 26 September 2019
11:00am-12:30pm Hyatt Hotel Canberra 120 Commonwealth Avenue Yarralumla ACT 2600
KEY DATES
CONTENTS
The Year at a Glance 1
Board of Directors 2
Chairman’s Letter 3
Investment Manager’s Review 5
Investing with NAOS Asset Management 10
Our Investment Process 11
Our ESG Process 12
Our Team 13
Corporate Governance Statement 14
Directors’ Report 16
Auditor’s Independence Declaration 22
Independent Auditor’s Report 23
Statement of Profit or Loss and Other Comprehensive Income for the year ended 30 June 2019 26
Statement of Financial Position as at 30 June 2019 27
Statement of Changes in Equity for the year ended 30 June 2019 28
Statement of Cash Flows for the year ended 30 June 2019 29
Notes to the Financial Statements 30
Directors’ Declaration 45
Additional Information 46
Corporate Information 49
For
per
sona
l use
onl
y
1
THE YEAR AT A GLANCE
KEY METRICS AS AT 30 JUNE 2019
Pre-tax Net Tangible Assets $1.02
Post-tax Net Tangible Assets $1.04
Fully Franked FY19 Dividend 7.25 cents
Fully Franked Dividend Yield 8.19%
Share Price $0.885
Shares on Issue 59,905,339
Directors’ Shareholding 4,061,457
Market Capitalisation $53.02 million
7.25cFULLY FRANKED FY19 DIVIDEND
8.19% FULLY FRANKED DIVIDEND YIELD
2,139 SHAREHOLDERS (INCREASE 13%)
1 YEAR 3 YEARS (P.A.)
5 YEARS (P.A.)
6 YEARS (P.A.)
INCEPTION (P.A.)
INCEPTION (Total Return)
NCC INVESTMENT PORTFOLIO PERFORMANCE*
–12.51% +1.75% +5.92% +9.82% +11.03% +94.08%
S&P/ASX SMALL ORDINARIES ACCUMULATION INDEX (XSOAI)
+1.92% +10.67% +9.26% +9.90% +6.19% +46.35%
PERFORMANCE RELATIVE TO BENCHMARK –14.43% –8.92% –3.34% –0.08% +4.84% +47.73%
* Investment Portfolio Performance is post all operating expenses, before fees, taxes and initial IPO and placement commissions. Performance has not been grossed up for franking credits received by shareholders. Since inception (p.a. and total return) includes part performance for the month of February 2013.
INVESTMENT PORTFOLIO PERFORMANCE AS AT 30 JUNE 2019
NAOS Emerging Opportunities Company Limited is a listed investment company and its shares are listed on the Australian Securities Exchange (ASX: NCC). The Company seeks to protect investor capital whilst providing a sustainable growing stream of fully franked dividends and long-term capital growth above the benchmark index, being the S&P/ASX Small Ordinaries Accumulation Index (XSOAI).
NCC aims to provide investors with genuine long-term concentrated exposure to Australian undervalued listed micro-cap companies (market capitalisation generally less than $250 million) with an industrial focus.
For
per
sona
l use
onl
y
BOARD OF DIRECTORS
SEBASTIAN EVANSDirector
Sebastian Evans has been a Director of the Company since inception. Sebastian is also a Director of NAOS Ex-50 Opportunities Company Limited (ASX: NAC), NAOS Small Cap Opportunities Company Limited (ASX: NSC) and is Chief Investment Officer (CIO) and Managing Director of NAOS Asset Management Limited, the Investment Manager. Sebastian is the CIO across all investment strategies.
Sebastian holds a Masters of Applied Finance majoring in Investment Management (MAppFin) as well as a Bachelor’s Degree in Commerce, majoring in Finance and International Business, a Graduate Diploma in Management from the Australian Graduate School of Management (AGSM) and a Diploma in Financial Services.
WARWICK EVANSDirector
Warwick Evans has been a Director of the Company since inception. Warwick is also a Director of NAOS Ex-50 Opportunities Company Limited (ASX: NAC), NAOS Small Cap Opportunities Company Limited (ASX: NSC) and NAOS Asset Management Limited, the Investment Manager.
Warwick has over 35 years of equity markets experience, most notably as Managing Director for Macquarie Equities (globally) from 1991 to 2001 as well as being an Executive Director for Macquarie Group. He was the founding Chairman and CEO of the Newcastle Stock Exchange (NSX), and was also the Chairman of the Australian Stockbrokers Association. Prior to these positions he was an Executive Director at County NatWest.
Warwick holds a Bachelor’s degree in Commerce majoring in Economics from the University of New South Wales.
SARAH WILLIAMSIndependent Director
Sarah Williams was appointed as an Independent Director during January 2019. Sarah is also a Director of NAOS Ex-50 Opportunities Company Limited (ASX: NAC). Sarah has over 25 years’ experience in executive management, leadership, IT and risk management within the financial services and IT industries. Most recently, Sarah was an Executive Director at Macquarie Group holding the role of Head of IT for the Asset Management, Investment Banking and Leasing businesses. During her 18-year tenure at Macquarie Group she also led the Risk and Regulatory Change team, the Equities IT team and developed the IT M&A capability. Sarah has also held senior roles with JP Morgan and Pricewaterhouse Coopers in London.
Sarah has also been a director of charitable organisations including Cure Cancer Australia Foundation and Make a Mark Australia.
Sarah holds an Honours Degree in Engineering Physics from Loughborough University and has also studied at the Harvard Business School.
DAVID RICKARDSIndependent Chairman
David Rickards has been a Director and Chairman of the Company since inception. David is also a Director of NAOS Small Cap Opportunities Company Limited (ASX: NSC) and Chairman of NAOS Ex-50 Opportunities Company Limited (ASX: NAC).
David is also Co- Founder of Social Enterprise Finance Australia (SEFA) and up until recently was a Director and Treasurer of Bush Heritage Australia.
David has over 25 years of equity market experience, most recently as an Executive Director at Macquarie Group where David was head of equities research globally as well as equity strategy since 1989 until he retired in mid-2013. David was also a Consultant for the financial analysis firm Barra International.
David holds a Masters of Business Administration majoring in Accounting and Finance from the University of Queensland as well as two Bachelor degrees, one in Engineering (Civil and Structural) from the University of Sydney, and a Bachelor’s degree in Science (Pure Mathematics and Geology).
2 NAOS Emerging Opportunities Company Limited Annual Report 2019
For
per
sona
l use
onl
y
3
CHAIRMAN’S LETTER
For the financial year ended 30 June 2019, the Company recorded an after-tax loss of $7.5 million which signified the first loss for the Company since its inception. The Company declared 7.25 cents per share of fully franked dividends for the year, maintaining the previous year’s dividend, paid from profit reserves generated during times of stronger performance. Since listing, the Company has declared an aggregate 42.75 cents per share of fully franked dividends.
The Board continues to be mindful of providing shareholders a growing stream of fully franked dividends over the longer term and building profit reserves. Thus, the Company was able to maintain the dividend despite experiencing a period of weaker performance. The profit reserve balance at year end was $9.65 million.
The Company aims to provide investors genuine long-term concentrated exposure to micro-cap industrial businesses regardless of their liquidity profile. This concentrated long-term approach is reflected by the 10 positions held as at 30 June, three of which have been held for more than five years within the investment portfolio. The portfolio also continues to reflect our belief that the companies held offer strong long-term returns and good value despite their lack of performance over the past year.
The investment portfolio produced a return of –12.51% for the financial year ended 30 June 2019, underperforming the benchmark S&P/ASX Small Ordinaries Accumulation Index (‘XSOAI’) which produced a positive return of +1.92%. It proved to be a very difficult year for markets and most micro-cap companies in particular, where there was a significant shift of investor dollars towards a very select group of, in our view, speculative companies. It remains the opinion of the Board that the companies held in the portfolio offer good value.
The investment manager has redoubled efforts to work proactively with the Boards and management teams of all the portfolio companies as part of their continuing due diligence. Given the index unaware approach and the concentrated nature of the portfolio, performance differing to the broader market from time to time will occur. While recognising the first instance of annual negative performance of the portfolio, we do also emphasise that the manager maintains a rigorous investment process focused on capital preservation over the longer term and continues to target capital growth above the benchmark with a lower volatility. We are confident that by maintaining a disciplined approach the portfolio holdings will allow shareholders to look forward to positive performance in the future.
Although the share price started the year trading close to the pre-tax net tangible asset backing (‘NTA’) and continued to trade on average close to NTA for most of the year, a decrease in the share price during the final month of the financial
Dear Fellow Shareholders,
Welcome to the 2019 Annual Report for the NAOS Emerging Opportunities Company Limited. The Board would like to thank all our shareholders for their continued support and we welcome the new shareholders who have joined the Company during the past financial year.
year caused the movement in share price to lag the portfolio return. The share price closed the financial year at $0.885 which represented a significant discount of 13.24% to pre-tax NTA.
With regard to NTA, the NTA of the Company fell over the year, with the fall generated from the negative performance of the investment portfolio as well as by the payment of dividends to shareholders and the payment of tax over the course of the year. To reduce dilution for existing shareholders, the Company did not issue any shares at a discount, with the Dividend Reinvestment Plan (‘DRP’) capital management initiative further supporting this by issuing DRP shares only when the Company is trading at a premium, and buying shares on-market when trading at a discount to post-tax NTA.
NCC FULLY FRANKED DIVIDEND
0.0
1.0
2.0
3.0
4.0
5.0
6.0
7.0
8.0
NCC Dividend (cents per share)
7.2
5
FY19FY18FY17FY16FY15FY14FY13(Part Yr)
7.2
5
7.0
0
6.7
5
6.2
5
5.7
5
2.5
0
For
per
sona
l use
onl
y
During FY19, the Company continued to focus on improving the quality and transparency of our investment communications; these initiatives contributed to record shareholder numbers, with 244 new shareholders added to the register. As at 30 June 2019 the Company had 2,139 shareholders which represented a 13% increase from the end of the previous financial year. Generally, a larger shareholder base corresponds to stronger liquidity which correlates to less discount to NTA.
As always, the Board remains committed to managing the capital base of the Company in a manner that provides the most suitable framework for maximising potential shareholder return.
With this in mind, the Board was pleased to announce a one-for-four bonus options issue to eligible shareholders during June 2019. The Board believes that this is a measured way to allow the Company to grow over the next 24 months. In our view, it would allow NAOS Asset Management (the Investment Manager) to take advantage of a number of investment opportunities that have arisen within the micro-cap end of the Australian stock market; whilst not placing undue pressure on the short-term performance and dividend reserves of the Company. In addition, we believe that growing the size of the Company to between $125 million to $150 million is optimal as it scales the Company to an appropriate size that lowers fixed costs on a per share basis.
During January the Company announced the appointment of Ms Sarah Williams as an Independent Director. Sarah has over 25 years’ experience in executive management, leadership, IT and risk management within the financial services and IT industries. The Company is very fortunate to have such a skilled person join the Board. Sarah provides a major addition to the skills and experience that the Board currently has.
Directors increased their holdings over the financial year whilst also taking advantage of the Dividend Reinvestment Plan; and now hold a cumulative 4.06 million shares, continuing to align their interests with those of shareholders.
On behalf of the Board I would like to thank all the staff of the Investment Manager for their continued efforts and dedication throughout the year.
David Rickards Independent Chairman 22 August 2019
“As always, the Board remains committed to managing the capital base of the Company in a manner that provides the most suitable framework for maximising potential shareholder return.
“With this in mind, the Board was pleased to announce a one-for-four bonus options issue to eligible shareholders during June 2019.”
CHAIRMAN’S LETTER
4 NAOS Emerging Opportunities Company Limited Annual Report 2019
For
per
sona
l use
onl
y
5
“This investment philosophy has proven to be successful over the long term, though clearly when investing in a concentrated manner into a specialised segment of the market there will be times when performance will deviate significantly from the wider market both in positive and negative terms.”
NCC Investment Portfolio FY Return
-15%
-10%
-5%
0%
5%
10%
15%
20%
25%
30%
35%
12.3
9%
-12.5
1%
7.1
3%
31.5
4%
10.6
7%
1.4
3%
24.7
7%
FY19FY18FY17FY16FY15FY14FY13(Part Yr)
INVESTMENT MANAGER’S REVIEW
NAOS prides itself on offering what we believe is the only Listed Investment Company (‘LIC’) that provides concentrated long-term exposure to micro-cap industrial businesses regardless of their size or liquidity. Our concentrated portfolio structure is implemented by selecting 10-15 businesses that in our view represent sound long-term value. This investment philosophy has proven to be successful over the long term, though clearly when investing in a concentrated manner into a specialised segment of the market there will be times when performance will deviate significantly from the wider market both in positive and negative terms.
Such examples highlighting this performance deviation include FY16 when the investment portfolio produced a return of +24.77%, compared to the XSOAI which produced a +14.40% return and FY14 when the portfolio returned +31.54%; significantly outperforming the benchmark which returned +13.11%. What does provide us with comfort in our process is that the cumulative investment portfolio returns of NCC are still approximately double that of the XSOAI since the Company’s inception.
The following points address what I believe to be the most important items for shareholders to consider when reviewing our performance over FY19; each of these will be covered off in more detail throughout this report.
• High growth and technology stocks outperform (again)
• The NCC investments which grew their earnings base in FY19
• How much is the market willing to pay for businesses?
• Continue to focus on the controllable
• Activist investing
• Looking forward
HIGH GROWTH AND TECHNOLOGY STOCKS OUTPERFORM (AGAIN) Standing out as the key theme of FY19 was the continued strong performance of high growth stocks, many of which were technology-based businesses. As highlighted in the table below, seven of the top 10 contributors to the S&P/ASX Small Ordinaries Index (XSO) were high growth businesses, and cumulatively they contributed 125.5 points to the XSO movement for the year, with the entire index ending 24.4 points lower or –0.85%. If these seven businesses were removed, then the return for XSO would have been –5.25% for FY19.
It is worth highlighting that we believe most of the companies overleaf have solid business models. What we have clearly underestimated though is how much the market has been willing to pay for such businesses. Many of these companies are not yet cash flow positive let alone profitable, as they have continued to invest heavily in growing their respective revenue lines at a very fast pace. As we can see in the table overleaf, the average earnings before interest, tax, depreciation and amortisation (EV/EBITDA) multiple being applied to these businesses is now north of 110 times based on the FY19 earnings expectations from the market.
Dear Fellow Shareholders,
Financial year 2019 marked the first year of negative performance for the NCC investment portfolio since its 2013 inception. The portfolio returned -12.51% for the financial year which was a poor result both in absolute and relative performance terms, as the Benchmark S&P/ASX Small Ordinaries Accumulation Index (‘XSOAI’) increased by +1.92%.
NCC INVESTMENT PORTFOLIO PERFORMANCE* FY RETURN
Figure 1. * Investment Portfolio Performance is post all operating expenses, before fees, taxes and initial IPO and placement commissions. Performance has not been grossed up for franking credits received by shareholders.
This ultimately begs the question, what is a fair valuation multiple for a company that is growing its revenue base at an above market rate? Table 2 below looks at this question by answering it in reverse, assessing how growth prospects and valuation multiples are being factored in to justify the current share prices.
The table assumes that a company earns $100 in EBITDA today and is valued at 110 times EV/EBITDA as per the average from the table above (assuming it has 1,000 shares on issue). If we assume that in five years’ time this company commands a lower or market average valuation multiple (as tends to be the case as businesses mature), then the EBITDA needs to grow at 50% every year for five years to maintain today’s share price of just over $11. Note the five-year forecast does not factor in the free cash flow build-up that may occur over time.
It is not beyond the realms of possibility that a couple of these businesses may well grow at a rate above this figure and therefore command a multiple that is higher than 15 times EBITDA in five years. However, in our view when considering several variables and risks such as cost base, saleability, competitive landscape, regulatory issues, product re-investment and product distribution models, there is significant uncertainty around the profitability and cash flow generation of these businesses over this time horizon.
6 NAOS Emerging Opportunities Company Limited Annual Report 2019
For
per
sona
l use
onl
y
7
THE NCC INVESTMENTS WHICH GREW THEIR EARNINGS BASE IN FY19An objective way to review the performance of our investments over the past 12 months is to analyse whether each individual investment is on track to, or has managed to grow, its underlying EBITDA from FY18 to FY19. Such analysis is particularly relevant for the NCC investment portfolio as all the companies that were held at the end of FY18 remain in the portfolio at the end of FY19.
Companies that we believe will be able to grow their EBITDA in FY19 include:
• BSA Limited (ASX: BSA)
• CML Group (ASX: CGR)
• Consolidated Operations Group (ASX: COG)
• Enero Group (ASX: EGG)
• Wingara AG (ASX: WNR)
Companies that were able to increase their revenue meaningfully, yet their EBITDA is still at an insignificant level, include:
• BTC Health (ASX: BTC)
• Contango Asset Management (ASX: CGA)
Companies that did not make any substantial improvement in revenue or EBITDA include:
• Big River Industries (ASX: BRI)
• Saunders International (ASX: SND)
Unsurprisingly, when reviewing the positive and the negative contributors to the Company’s performance over the year, BRI and SND were two of the top four detractors to portfolio performance. Surprisingly though, CGR and BTC made up the other two largest detractors, yet in our view both businesses made significant progress from both a financial and business strategy perspective, and in addition both are run by proven management teams. Notably, there was only one standout contributor to the overall investment performance (i.e. contributed more than +1% to portfolio performance) and this business was EGG which contributed almost +5%.
HOW MUCH IS THE MARKET WILLING TO PAY FOR BUSINESSES?Clearly over the last year the market has been willing to pay progressively less for small and micro-cap industrial companies.
CML Group Ltd (ASX: CGR) is a good example of this, an NCC holding with a market capitalisation of approximately $90 million. As at the end of FY18, CGR had a share price of $0.57 and reported an NPATA of $6.5 million. At FY19 year-end the CGR share price was $0.465 with guidance for NPATA more than $9.0 million. In valuation terms, the price to earnings ratio (P/E) at the end of FY18 was 17.6 times; if CGR reports in line with their FY19 guidance then the current P/E is 10.40 times.
In our view, CGR made several substantial qualitative improvements in FY19, such as increasing the depth of its management team, securing improved funding arrangements and rolling out new product initiatives. All these initiatives should lead to a business that has a more sustainable growth profile and more predictable earnings base.
The obvious question to ask is that if most of our investments are on track to grow their EBITDA and, in our view, have stronger businesses today than they did 12 months ago, why have their share prices fallen or remained flat?
We believe this has been driven by several variables including:
1. The flight to liquidity (i.e. more investors being invested in larger companies and ETFs);
2. Investor concerns around the macro backdrop; and
3. A lack of transparency (news flow) from many of these smaller companies, especially when compared to their larger counterparts.
So what do we do next?
CONTINUE TO FOCUS ON THE CONTROLLABLEWith NCC now entering its seventh year of operations it is paramount that we continue to review our investment philosophy and process to ensure that it can continue to deliver the desired outcome for our shareholders over the long term. As stated at the beginning of this report, even after the poor performance of FY19 our investment process has resulted in significant portfolio outperformance over the benchmark index since the Company’s inception.
The foundations of how we manage investments should in theory be very simple. We seek to invest in businesses with proven business models, run by proven and aligned management teams, with balance sheets that provide the financial flexibility to execute their respective strategies; and finally, operate in industries supported by sound long-term fundamentals.
In my view, one thing that makes funds management more complex is the day to day pricing of securities on the stock market which can lead to poor and irrational decision making, often led by emotion, and without a focus on the long-term objectives of the underlying businesses. In ASX listed businesses considered microcaps this phenomenon is amplified by reduced liquidity, and more recently by an exodus of small-cap fund managers who have been forced by investor redemptions to withdraw from investing in this space.
As an investment team we will continue to invest in businesses that we believe meet our controllable criteria, which is described in the figure overleaf. We steadfastly believe that if we continue to invest in businesses meeting these criteria then we will give the portfolio the best possible likelihood of delivering significant performance over the long term, and just as importantly, minimising any potential investment delivering a permanent capital loss.
+11.03%P.A. PORTFOLIO RETURN SINCE INCEPTION
+94.08%PORTFOLIO RETURN SINCE INCEPTION (TOTAL RETURN)
For
per
sona
l use
onl
y
INVESTMENT MANAGER’S REVIEW
CORECOMPETENCY
COMPANIESVALUED
BASED ON TODAY’SFLAT EARNINGS
PROFILE
BALANCE SHEET FLEXIBILITY
FOCUS ON THECONTROLLABLE
ABILITY TO DRIVEREVENUE &/OR
MARGIN GROWTH
EXISTING REVENUESTREAMS
ESG AWARE
PROVENMANAGEMENT
TEAMS &SHAREHOLDER
ALIGNMENT
Figure 2.
ACTIVIST INVESTINGOver the past 12 months NAOS has worked with several board and management teams of our investments to ensure shareholder value will be maximised over the long term. All companies are run for shareholders and we believe that this is something that can often be forgotten by boards and management teams, especially when it comes to shareholder communications and capital allocation. We will continue to ensure that our investee companies maintain a sustained focus on:
• Capital allocation (buy-backs, dividends, acquisitions and investments);
• Shareholder communications (transparency, consistency and timeliness);
• Board makeup (relevant experience, alignment and track record); and
• A continued focus on long-term strategy (is the strategy still valid and if not, what is the best course of action?).
LOOKING FORWARD It is impossible for a fund manager or any investor to accurately predict the future, but I believe it is important to provide our shareholders with an insight into how we believe the portfolio is shaped for the future, especially as many of our investments may well still be with us at the end of FY20.
We believe the portfolio is entering FY20 with a bright future as many of our investments have made significant progress over the previous two years that is yet to flow through to a much-improved financial performance. Listed businesses demonstrating the ability to develop a sustainable competitive advantage, which is frequently preceded by significant investment, often see increased profitability as a longer-term outcome. In our view, there are three stand-out businesses within the investment portfolio which are most likely to fall into this category.
FOCUS ON THE CONTROLLABLE
8 NAOS Emerging Opportunities Company Limited Annual Report 2019
For
per
sona
l use
onl
y
9
1. ENERO GROUP (ASX: EGG) Enero has been a position in the NCC investment portfolio since inception, and from FY17 to FY19 we have seen its operating EBITDA increase from $10 million for the full year, to $10 million for just the first half of FY19. We believe EGG still has a long way to go as it continues to build out what is one of the world’s leading public relations and strategy businesses in Hotwire Group. Hotwire focuses its service offering on technology businesses, with substantial clients now including Facebook, Adobe and NetApp. As it has been able to develop more value-add services we have seen its footprint increase organically within its client base and also across new geographies. Hotwire now works with Facebook across five different regions, demonstrating that businesses such as this will continue to look for high quality PR service providers; particularly as they come under increased public scrutiny, which has been evident in the US.
2. CONSOLIDATED OPERATIONS GROUP (ASX: COG) COG would be our most frustrating investment from a contribution perspective over the past five years. We initially made our investment at $0.04 and have seen the share price reach a high of $0.185 in late 2016, before slowly falling back to $0.097 at the end of FY19. Over the past year there have been several significant developments in the business with the appointment of a new CEO and Chairman, a new CEO of the leasing businesses TL Rentals, together with the strategic acquisitions of Westlawn Finance and Centrepoint Finance. COG now has over $4 billion of equipment finance flows running through its network, making it the largest player in the market by a significant margin. COG has also announced that it will be launching its first white label prime finance/loan product by the end of CY19 which we believe will be a significant catalyst in validating the COG model, with the potential to significantly increase the profitability and strategic value of the COG business.
3. BTC HEALTH (ASX: BTC) BTC has been a small investment within the portfolio for almost two years and a business which has been very much in its infancy. That all changed at the very end of FY19 when BTC acquired a medical device distribution business with a national distribution footprint. Over the past two years BTC has built a strong proven management team led by Dr Richard Treagus, who has led a number of successful listed healthcare businesses. With a focus on medical devices, and operating in an industry experiencing rapid technological change, we believe there is significant scope for BTC to in-licence proven medical devices from large global device makers looking to sell into Australia.
I thank you again for your support over the past 12 months and I look forward to providing another update at our upcoming investor roadshows during September.
“It is impossible for a fund manager or any investor to accurately predict the future, but I believe it is important to provide our shareholders with an insight into how we believe the portfolio is shaped for the future, especially as many of our investments may well still be with us at the end of FY20.”
For
per
sona
l use
onl
y
INVESTING WITH NAOS ASSET MANAGEMENT
NAOS ASSET MANAGEMENT is a specialist fund manager providing genuine long-term concentrated exposure to Australian listed industrial companies outside of the ASX 50.
With a proven performance track record, NAOS maintains a focus on protecting capital and aims to deliver shareholders a sustainable growing stream of fully franked dividends, whilst providing capital growth over the longer term.
VALUE WITH LONG-TERM GROWTHWe believe in investing in businesses where the earnings today are not a fair reflection of what the same business will earn over the longer term. Ultimately, this earnings growth can be driven by many factors including revenue growth, margin growth, cost cutting, acquisitions and even share buybacks. The end result is earnings growth over a long-term investment horizon even if the business was perceived to be a value type business at the time of the initial investment.
QUALITY OVER QUANTITYExcessive diversification, or holding too many investments, may be detrimental to overall portfolio performance. We believe it is better to approach each investment decision with conviction. In our view, to balance risk and performance most favourably, the ideal number of quality companies in each portfolio would generally be 10 to 20.
INVEST FOR THE LONG TERMAs investors who are willing to maintain perspective by taking a patient and disciplined approach, we believe we will be rewarded over the long term. If our investment thesis holds true we persist. Many of our core investments have been held for three or more years where management execution has been consistent and the value proposition is still apparent.
MANAGEMENT ALIGNMENTWe believe in backing people who are proven and aligned with their shareholders. One of the most fundamental factors which is consistent across the majority of company success stories in our investment universe is a high quality proven management team with ‘skin in the game’. NAOS Directors and staff members are significant holders of shares on issue across our strategies, so the interests of our shareholders are well aligned with our own.
IGNORE THE INDEXThis means we are not forced holders of stocks with large index weightings that we are not convinced are attractive investment propositions. We actively manage each investment to ensure the best outcome for our shareholders and only invest in companies that we believe will provide excellent/sustainable long-term returns.
PURE EXPOSURE TO INDUSTRIALSWith the big four banks making up a large portion of total domestic equity holdings for the SMSF investor group, many Australian investors are at risk of being overexposed to one sector and may be missing out on opportunities to invest in quality companies in industries such as Media, Advertising, Agriculture or Building Materials. Australian listed industrial companies outside the ASX 50 are our core focus, and we believe the LICs we manage provide pure access to these companies which may be lesser known by the broader investment community.
PERFORMANCE VS LIQUIDITY FOCUSWe believe in taking advantage of inefficient markets; the perceived risk associated with low liquidity (or difficulty buying or selling large positions) combined with investor short-termism presents an opportunity to act based purely on the long-term value proposition where the majority may lose patience and move on. Often illiquidity is caused by aligned founders or management having significant holdings in a company. NAOS benefits from a closed-end LIC structure, which means we do not suffer ‘redemption risk’ and we can focus on finding quality undervalued businesses regardless of their liquidity profile.
ENVIRONMENTAL, SOCIAL AND GOVERNANCE (ESG)As an investment manager, NAOS recognises and accepts its duty to act responsibly and in the best interests of shareholders. We believe that a high standard of business conduct and a responsible approach to environmental, social and governance (ESG) factors is associated with a sustainable business model over the longer term that benefits not only shareholders but also the broader economy. NAOS supports the UN Principles for Responsible Investment and is guided by these principles in incorporating ESG into our investment practices.
Further information about NAOS can be found at www.naos.com.au
OUR INVESTMENT BELIEFS
10 NAOS Emerging Opportunities Company Limited Annual Report 2019
For
per
sona
l use
onl
y
11
LISTED INVESTMENT COMPANY
2568
Does the management team have a long-term proven track record?
Is the management team aligned with shareholders?
Is there management team depth?
Does the culture support a sustainable competitive advantage?
Does long-term valuation meet a 20% p.a. return hurdle?
Does the Company comply with our ESG Framework?
Remove: Unsustainable Debt Levels
Remove: Tobacco, Gambling, Nuclear & Uranium, Controversial Weapons,Coal Mining Operations, Oil & Gas Production
Remove: ASX Top 50, <$10m Market Cap
Remove: No Substantial Revenue
Can the balance sheet support future growth?
What is the trend and future of return on invested capital (ROIC)?
Is the industry conducive to revenue growth?
Does free cash flow allow for both organic growth and growth by acquisition?
Are the earnings drivers transparent to shareholders?
Is there a clear plan and a history of earnings growth?
Is the company developing processes and services to increase sales?
296
OUR INVESTMENT PROCESSF
or p
erso
nal u
se o
nly
OF SHAREHOLDERSBEST INTERESTS ACT IN THE
POSITIV
E SO
CIA
LR
ETUR
NINVESTMENT
RETURNS
RIS
K
OUR ESG PROCESS
12 NAOS Emerging Opportunities Company Limited Annual Report 2019
For
per
sona
l use
onl
y
13
OUR TEAM
RICHARD PREEDY
Chief Financial and Operating Officer
Richard joined NAOS in October 2015 as Chief Financial and Operating Officer. Richard has over 13 years’ financial services experience in the UK and Australia, beginning his career in London with Deloitte & Touche before relocating to Sydney in 2013. Richard holds a BA (Hons) in Business Management from the University of Sheffield, and is a fully qualified Chartered Accountant.
RAJIV SHARMA
Senior Legal Counsel
Rajiv joined NAOS in August 2017. Most recently, he was Senior Legal Counsel at Magellan Financial Group and has previously worked at law firms Johnson Winter & Slattery and Clayton Utz.
Rajiv holds a Bachelor of Laws (First Class Honours), a Bachelor of Business (Accounting major) and a Graduate Diploma in Legal Practice from the University of Technology, Sydney. He is a member of the Law Society of New South Wales and is admitted to the Supreme Court of New South Wales and the High Court of Australia.
JULIA STANISTREET
Business Development Manager
Julia joined NAOS in September 2015. Prior to this, Julia held various Client Relationship roles within the Financial Services Industry in Australia and the UK including roles at Macquarie Bank and Deutsche Bank. Julia holds a Bachelor of Business degree majoring in Accounting from UTS and she also holds a Graduate Diploma in Applied Finance from KAPLAN.
SEBASTIAN EVANS
Chief Investment Officer
See bio on page 2.
BEN RUNDLE
Portfolio Manager
Ben joined NAOS in January 2015 as a Portfolio Manager.
Ben has been working in the financial markets since February 2006 and prior to joining NAOS he held various roles within the Financial Services Industry including roles at Macquarie Bank and most recently with Moelis and Company. Ben holds a Bachelor of Commerce, majoring in Accounting, from the University of South Australia.
ROBERT MILLER
Portfolio Manager
Robert Miller has been with NAOS since September 2009 working with the investment team as an Investment Analyst and now Portfolio Manager.
Robert has completed his Bachelor’s Degree in Business from the University of Technology, Sydney, as well as completing his Masters of Applied Finance from the Financial Services Institute of Australasia.
RACHEL COLE
Investment Analyst
Rachel joined NAOS in April 2018 as an Investment Analyst.
Prior to joining NAOS, Rachel was an Investment Analyst at Colonial First State Global Asset Management.
Rachel graduated from the University of New South Wales with a Bachelor of Commerce, majoring in Actuarial Studies and Financial Economics.
Rachel is an Associate of the Institute of Actuaries of Australia and is a CFA Charterholder.
For
per
sona
l use
onl
y
CORPORATE GOVERNANCE
The Board of NAOS Emerging Opportunities Company Limited is committed to achieving and demonstrating the highest standards of corporate governance. As such, the Company has adopted what it believes to be appropriate corporate governance policies and practices having regard to its size and the nature of its activities.
The Board has adopted the ASX Corporate Governance Principles and Recommendations which are complemented by the Company’s core principles of honesty and integrity. The corporate governance policies and practices adopted by the Board are outlined in the Corporate Governance section of the Company’s website (www.naos.com.au/corporate-governance).
CORPORATE GOVERNANCE STATEMENT
14 NAOS Emerging Opportunities Company Limited Annual Report 2019
For
per
sona
l use
onl
y
15
Directors’ Report 16
Auditor’s Independence Declaration 22
Independent Auditor’s Report 23
Statement of Profit or Loss and Other Comprehensive Income for the year ended 30 June 2019 26
Statement of Financial Position as at 30 June 2019 27
Statement of Changes in Equity for the year ended 30 June 2019 28
Statement of Cash Flows for the year ended 30 June 2019 29
Notes to the Financial Statements 30
Directors’ Declaration 45
Additional Information 46
Corporate Information 49
CONTENTSF
or p
erso
nal u
se o
nly
16 NAOS Emerging Opportunities Company Limited Annual Report 2019
DIRECTORS’ REPORT
The Directors of NAOS Emerging Opportunities Company Limited ACN 161 106 510 (“the Company”), submit their report for the Company for the year ended 30 June 2019.
COMPANY INFORMATIONThe Company is a listed investment company (“LIC”) and its shares are listed on the Australian Securities Exchange. The Company has outsourced its investment management function to NAOS Asset Management Limited (ACN 107 624 126) (Australian Financial Services Licence No. 273529) (the “Investment Manager”).
PRINCIPAL ACTIVITIESThe Company invests primarily in a concentrated portfolio of Australian listed equities that are not included in the S&P/ASX 100 Accumulation Index with the objective of providing investors with genuine exposure to emerging industrial companies, with a long‑term value focus.
DIRECTORS AND OFFICERSThe following persons held office as Directors of the Company during or since the end of the year.
Directors
Name Appointment Date Period of Office
David Rickards (Independent Chairman) 20 November 2012 20 November 2012 – Present
Warwick Evans 6 November 2012 6 November 2012 – Present
Sebastian Evans 6 November 2012 6 November 2012 – Present
Sarah Williams 31 January 2019 31 January 2019 – Present
The qualifications and experience of each person who has been a Director or Company Secretary at any time since 1 July 2018 is provided below.
DIRECTORS INFORMATION
David Rickards, Independent ChairmanDavid has been an independent Director and Chairman of the Company since 20 November 2012. David is also an Independent Director and Chairman of NAOS Ex‑50 Opportunities Company Limited (ASX: NAC) and an independent Director of NAOS Small Cap Opportunities Company Limited (ASX: NSC).
David is Co‑Founder of Social Enterprise Finance Australia (SEFA) and until recently was a Director and Treasurer of Bush Heritage Australia.
David has over 25 years of equity market experience, most recently as an Executive Director at Macquarie Group where David was head of equities research globally as well as equity strategy since 1989 until he retired in mid‑2013. David was also a Consultant for the financial analysis firm Barra International.
David holds a Masters of Business Administration majoring in Accounting and Finance from the University of Queensland as well as two Bachelor degrees – one in Engineering (Civil and Structural) from the University of Sydney, and a Bachelor’s degree in Science (Pure Mathematics and Geology).
Warwick Evans, Non-Independent DirectorWarwick Evans has been a Director of the Company since inception (6 November 2012). Warwick is also a Director of NAOS Ex‑50 Opportunities Company Limited (ASX: NAC), NAOS Small Cap Opportunities Company Limited (ASX: NSC), and Chairman of NAOS Asset Management Limited, the Investment Manager.
Warwick has over 35 years of equity market experience, most notably as Managing Director for Macquarie Equities (globally) from 1991 to 2001 as well as being an Executive Director for Macquarie Group. He was the founding Chairman and CEO of the Newcastle Stock Exchange (NSX), and was also Chairman of the Australian Stockbrokers Association. Prior to these positions he was an Executive Director at County NatWest.
Warwick holds a Bachelor’s degree in Commerce majoring in Economics from the University of New South Wales.
Sebastian Evans, Non-Independent DirectorSebastian Evans has been a Director of the Company since inception (6 November 2012) and also joint Company Secretary since 10 July 2019. Sebastian is also a Director of NAOS Small Cap Opportunities Company Limited (ASX: NSC), NAOS Ex‑50 Opportunities Company Limited (ASX: NAC) and is Chief Investment Officer (CIO) and Managing Director of NAOS Asset Management Limited, the Investment Manager. Sebastian is the CIO across all investment strategies.
Sebastian holds a Masters of Applied Finance majoring in Investment Management (MAppFin) as well as a Bachelor’s Degree in Commerce, majoring in Finance and International Business, a Graduate Diploma in Management from the Australian Graduate School of Management (AGSM) and a Diploma in Financial Services.
For
per
sona
l use
onl
y
17
Sarah Williams, Independent DirectorSarah Williams was appointed as a Director of the Company on 31 January 2019. Sarah is also a Director of NAOS Ex‑50 Opportunities Company Limited (ASX: NAC).
Sarah has over 25 years’ experience in executive management, leadership, IT and risk management within the financial services and IT industries. Most recently, Sarah was an Executive Director at Macquarie Group holding the role of Head of IT for the Asset Management, Investment Banking and Leasing businesses. During her 18‑year tenure at Macquarie Group she also led the Risk and Regulatory Change team, the Equities IT team and developed the IT M&A capability. Sarah has also held senior roles with JP Morgan and Pricewaterhouse Coopers in London.
Sarah has also been a director of charitable organisations including Cure Cancer Australia Foundation and Make a Mark Australia. Sarah holds an Honours Degree in Engineering Physics from Loughborough University and has also studied at the Harvard Business School.
COMPANY SECRETARYThe following persons held office as Company Secretary during or since the end of the year.
Name Appointment Date Period of Office
Rajiv Sharma 27 September 2017 27 September 2017 – 10 July 2019
Laura Newell 10 July 2019 10 July 2019 – Present
Sebastian Evans 10 July 2019 10 July 2019 – Present
COMPANY SECRETARY INFORMATION
Rajiv Sharma, Company Secretary (resigned 10 July 2019)Rajiv is Senior Legal Counsel at NAOS Asset Management Limited. Previously, he was Senior Legal Counsel at Magellan Financial Group and has also worked at law firms Johnson Winter & Slattery and Clayton Utz. He holds a Bachelor of Laws (First Class Honours), a Bachelor of Business (Accounting major) and a Graduate Diploma in Legal Practice from the University of Technology, Sydney.
Rajiv is a member of the Law Society of New South Wales and admitted to the Supreme Court of NSW and the High Court of Australia. He is also an Associate of the Governance Institute of Australia.
Laura Newell, Company Secretary (appointed 10 July 2019)Laura is an experienced Chartered Company Secretary who has worked for a broad range of organisations, both in‑house and for corporate secretarial service providers.
Laura has over eight years of experience in company secretarial and governance management of ASX and NSX listed entities, unlisted public entities and FTSE 100 entities. She has worked with Boards and executive management of listed and unlisted companies across a range of industry sectors.
Laura is a Company Secretary of a number of ASX listed and unlisted public companies. She holds a degree with Honours in Law and Criminology and a Masters degree in Law and Corporate Governance. She is an Associate of the Governance Institute of Australia (GIA).
MEETINGS OF DIRECTORSThe following table shows the number of Board meetings held during the financial year ended 30 June 2019.
Year ended 30 June 2019
Eligible to attend Attended
Mr David Rickards (Chairman) 11 11
Mr Warwick Evans (Director) 11 11
Mr Sebastian Evans (Director) 11 11
Ms Sarah Williams (Director) 5 5For
per
sona
l use
onl
y
18 NAOS Emerging Opportunities Company Limited Annual Report 2019
DIRECTORS’ REPORT
Continued
REVIEW OF OPERATIONS
ResultsPlease refer to the Investment Manager’s review on page 5 for further information regarding the performance of the Company.
The results of the operations of the Company are disclosed in the Statement of Profit or Loss and Other Comprehensive Income of these financial statements. The results and dividends for the year ended 30 June 2019 and 30 June 2018 were as follows:
Year ended30 June 2019
$
Year ended30 June 2018
$
(Loss)/Profit before income tax (10,211,753) 4,917,418
Income tax benefit/(expense) 2,704,363 (793,053)
(Loss)/Profit for the year (7,507,390) 4,124,365
(Loss)/Profit for the year attributable to shareholders (7,507,390) 4,124,365
DIVIDENDS PAID OR PAYABLE
Year ended 30 June 2019Dividend rate
(cents per share) Total amount % Franked Date of payment
2018 final dividend (declared 23 August 2018) 3.50 2,088,578 100% 24 October 2018
2019 interim dividend (declared 16 February 2018) 3.75 2,246,452 100% 27 March 2019
4,335,030
Year ended 30 June 2018Dividend rate
(cents per share) Total amount % Franked Date of payment
2017 final dividend (declared 24 August 2017) 3.50 2,071,072 100% 1 November 2017
2018 interim dividend (declared 16 February 2018) 3.75 2,227,685 100% 28 March 2018
4,298,757
Since 30 June 2019, the Board has declared a final dividend of 3.5 cents per share, fully franked, to be paid on 23 October 2019.
For
per
sona
l use
onl
y
19
FINANCIAL POSITIONThe net tangible asset value of the Company as at 30 June 2019 was $62,130,841 (2018: $73,679,945). Further information on the financial position of the Company is included in the Chairman’s letter.
OPTIONS ISSUEDuring the year, the Company conducted a 1‑for‑4 bonus options issue with a record date of 21 June 2019 which entitled shareholders to a bonus option to purchase new shares in the Company at an exercise price of $1.02, the bonus options expire on 29 June 2021. There were 14,975,819 bonus options issued, which are listed on the ASX under code NCCOB, and no bonus options were exercised as at 30 June 2019.
SIGNIFICANT CHANGES IN STATE OF AFFAIRSThere were no other significant changes in the state of affairs of the Company.
SUBSEQUENT EVENTSOn 22 August 2019, the Company declared a fully franked dividend of 3.5 cents per share.
Other than the matters described above, there has been no matter or circumstances occurring subsequent to the end of the year that has significantly affected, or may significantly affect, the operations of the Company, the results of those operations, or the state of affairs of the Company in future financial years.
LIKELY DEVELOPMENTSThe Company will be managed in accordance with the Constitution and its investment objectives.
ENVIRONMENTAL REGULATION AND PERFORMANCE The operations of the Company are not subject to any particular or significant environmental regulation under a law of the Commonwealth or of a State or Territory. There have been no known significant breaches of any other environmental requirements applicable to the Company.
INDEMNIFICATION OF DIRECTORS, OFFICERS AND AUDITORSDuring the financial year, the Company paid premiums in respect of contracts insuring the Directors against a liability incurred as a Director or executive officer to the extent permitted by the Corporations Act 2001. The contracts of insurance prohibit disclosure of the nature of the liability and the amount of the premiums.
The Company has not otherwise, during or since the end of the financial year, except to the extent permitted by law, indemnified or agreed to indemnify an officer or auditor of the Company or of any related body corporate against a liability as such an officer or auditor.
NON-AUDIT SERVICESNo non‑audit services were provided during the year. Refer to Note 11 of this financial report for details of auditor remuneration.
AUDITOR’S INDEPENDENCE DECLARATIONA copy of the Auditor’s Independence Declaration as required under Section 307C of the Corporations Act 2001 is set out on page 22.
For
per
sona
l use
onl
y
20 NAOS Emerging Opportunities Company Limited Annual Report 2019
DIRECTORS’ REPORT
Continued
REMUNERATION REPORT – AUDITEDThe Directors of the Company present the Remuneration Report to shareholders. The report is a requirement under section 300A (1) of the Corporations Act and covers the following information:
• the Board’s policy for determining the nature and amount of remuneration of Directors and other key management personnel (if any) of the Company;
• a discussion of the relationship between such policy and the Company’s performance; and• the details of the remuneration of the Directors and other management personnel (if any).
Remuneration of DirectorsThe Board from time to time determines remuneration of Non‑Executive Directors within the maximum amount approved by shareholders. This is the only remuneration that Directors are entitled to.
Payments to Directors reflect the demands and responsibilities of their roles and are reviewed annually by the Board. The Company determines remuneration levels and ensures they are competitively set to attract and retain appropriately qualified and experienced Directors.
Directors’ base fees are set at a maximum of $100,000 per annum and Directors do not receive bonuses. The maximum fees paid to Directors may not be increased without approval from the Company at a general meeting.
During the year, the Company conducted a 1‑for‑4 bonus options issue with a record date of 21 June 2019 which entitled shareholders to a bonus option to purchase shares in the Company at an exercise price of $1.02, the bonus options expire on 29 June 2021. These bonus options were also made available to the Directors based on their existing shareholding on 21 June 2019.
Directors’ remuneration received for the year ended 30 June 2019 and the year ended 30 June 2018 is disclosed below:
Short-term employee
benefitsDirectors’ fees
$
Post-employment
benefitSuperannuation
$ Total
30 June 2019
Mr David Rickards (Chairman) 31,963 3,037 35,000
Mr Warwick Evans (Director) 9,132 868 10,000
Ms Sarah Williams (Director) 5,708 542 6,250
Mr Sebastian Evans (Director) – – –
46,803 4,447 51,250
Short-term employee
benefitsDirectors’ fees
$
Post-employment
benefitSuperannuation
$ Total
30 June 2018
Mr David Rickards (Chairman) 31,963 3,037 35,000
Mr Warwick Evans (Director) 9,132 868 10,000
Mr Sebastian Evans (Director) – – –
41,095 3,905 45,000
Mr Sebastian Evans is remunerated by the Investment Manager and is currently not entitled to Director’s remuneration from the Company.F
or p
erso
nal u
se o
nly
21
During the financial year ended 30 June 2019 and the year ended 30 June 2018, the relevant interests of the Directors and their related parties in the shares and bonus options of the Company were:
Ordinary sharesYear ended 30 June 2019
Opening balance
No of sharesAcquired
No of sharesSold
No of shares
Closing balance
No of shares
Mr David Rickards (Chairman) 697,835 40,731 – 738,566
Mr Sebastian Evans (Director) 1,165,131 46,196 – 1,211,327
Bonus OptionsYear ended 30 June 2019
Opening balance
No of bonus
options
IssuedNo of
bonus options
ExercisedNo of
bonus options
Closing balance
No of bonus
options
Mr David Rickards (Chairman) – 184,641 – 184,641
Mr Warwick Evans (Director) – 523,158 – 523,158
Mr Sebastian Evans (Director) – 307,563 – 307,563
Ms Sarah Williams (Director) – – – –
Consequences of Company’s performance and shareholder wealthThe following table summarises Company performance and Directors’ Remuneration. Director’s fees are not directly linked to the Company’s performance.
2019 2018 2017 2016 2015
Operating (loss)/profit after tax ($) (7,507,390) 4,124,365 4,586,174 8,063,747 92,984
Dividends (cents per share) 7.25 7.25 7.00 6.75 6.25
NTA after tax ($ per share) 1.04 1.23 1.24 1.18 1.07
Total Directors’ remuneration ($) 51,250 45,000 45,000 45,000 45,000
Signed in accordance with a resolution of Directors of the Company made pursuant to Section 298 (2) of the Corporations Act 2001.
Sebastian Evans
Director
22 August 2019
For
per
sona
l use
onl
y
22 NAOS Emerging Opportunities Company Limited Annual Report 2019
AUDITOR’S INDEPENDENCE DECLARATION
Liability limited by a scheme approved under Professional Standards Legislation.Member of Deloitte Asia Pacific Limited and the Deloitte Network.
The Board of DirectorsNAOS Emerging Opportunities Company LimitedLevel 34, MLC Centre19 Martin PlaceSydney NSW 2000
22 August 2019
Dear Directors,
NAOS Emerging Opportunities Company Limited
In accordance with section 307C of the Corporations Act 2001, I am pleased to provide the followingdeclaration of independence to the Directors of NAOS Emerging Opportunities Company Limited.
As lead audit partner for the audit of the financial statements of NAOS Emerging OpportunitiesCompany Limited for the financial year ended 30 June 2019, I declare that to the best of myknowledge and belief, there have been no contraventions of:
(i) the auditor independence requirements of the Corporations Act 2001 in relation to theaudit; and
(ii) any applicable code of professional conduct in relation to the audit.
Yours sincerely
DELOITTE TOUCHE TOHMATSU
David SalmonPartnerChartered Accountants
Deloitte Touche TohmatsuA.C.N. 74 490 121 060
Level 2, Brindabella Business Park8 Brindabella CircuitCanberra ACT 2609 Australia
Liability limited by a scheme approved under Professional Standards Legislation.Member of Deloitte Asia Pacific Limited and the Deloitte Network
Independent Auditor’s Report to the Members of NAOS EmergingOpportunities Company Limited
Report on the Audit of the Financial Report
Opinion
We have audited the financial report of NAOS Emerging Opportunities Company Limited (the “Company”), which comprises thestatement of financial position as at 30 June 2019, the statement of profit or loss and other comprehensive income, the statementof changes in equity and the statement of cash flows for the year then ended, and notes to the financial statements, including asummary of significant accounting policies and other explanatory information, and the directors’ declaration.
In our opinion, the accompanying financial report of NAOS Emerging Opportunities Company Limited is in accordance with theCorporations Act 2001, including:
(i) giving a true and fair view of the Company’s financial position as at 30 June 2019 and of its performance for the year thenended; and
(ii) complying with Australian Accounting Standards and the Corporations Regulations 2001.
Basis for Opinion
We conducted our audit in accordance with Australian Auditing Standards. Our responsibilities under those standards are furtherdescribed in the Auditor’s Responsibilities for the Audit of the Financial Report section of our report. We are independent of theCompany in accordance with the auditor independence requirements of the Corporations Act 2001 and the ethical requirements ofthe Accounting Professional and Ethical Standards Board’s APES 110 Code of Ethics for Professional Accountants (the “Code”) thatare relevant to our audit of the financial report in Australia. We have also fulfilled our other ethical responsibilities in accordancewith the Code.
We confirm that the independence declaration required by the Corporations Act 2001, which has been given to the directors of theCompany, would be in the same terms if given to directors as at the time of this auditor’s report.
We believe that the audit evidence we have obtained is sufficient and appropriate to provide a basis for our opinion.
Key Audit Matters
Key audit matters are those matters that, in our professional judgement, were of most significance in our audit of the financialreport for the current period. These matters were addressed in the context of our audit of the financial report as a whole, and informing our opinion thereon, and we do not provide a separate opinion on these matters.
Key Audit Matter How the scope of our audit responded to the Key AuditMatter
Valuation and existence of financial assets held at fairvalue through profit or loss
As at 30 June 2019, the Company’s listed equity securities heldat fair value through profit or loss totalled $59 million asdisclosed in Notes 7 and 16.
Whilst there is not significant judgement in determining thevaluation of Company’s financial assets held at fair valuethrough profit or loss, these represent the most significantdriver of the Company’s revenue and its performance.
The fluctuations in financial assets valuation also impacts therealised and unrealised gains/(losses) recognised in thestatement of profit or loss and other comprehensive income,which in turn also affects the current and deferred taxprovisions.
Our procedures included, but were not limited to:
• evaluating key controls in place at the outsourced serviceproviders (i.e. administrator and custodian) in relation tothe valuation and existence of financial assets at fair valuethrough profit or loss, including any exceptions noted;
• agreeing on a sample basis, the valuation of listed equitysecurities to an independent pricing source;
• agreeing on a sample basis, the investment holdings tothe external custodian’s holdings statement; and
• reperforming a reconciliation of the financial assetsbalance for the year, including the 1 July 2018 investmentbalance, purchases, sales, other relevant transactions andthe 30 June 2019 investment balance.
We also assessed the appropriateness of the disclosures inNotes 7 and 16 to the financial statements.
Deloitte Touche TohmatsuA.C.N. 74 490 121 060
Level 2, Brindabella Business Park8 Brindabella CircuitCanberra ACT 2609 Australia
24 NAOS Emerging Opportunities Company Limited Annual Report 2019
INDEPENDENT AUDITOR’S REPORT
Continued
Other Information
The directors are responsible for the other information. The other information comprises the information included in the Company’sannual report for the year ended 30 June 2019, but does not include the financial report and our auditor’s report thereon.
Our opinion on the financial report does not cover the other information and we do not express any form of assurance conclusionthereon.
In connection with our audit of the financial report, our responsibility is to read the other information and, in doing so, considerwhether the other information is materially inconsistent with the financial report or our knowledge obtained in the audit or otherwiseappears to be materially misstated. If, based on the work we have performed, we conclude that there is a material misstatementof this other information; we are required to report that fact. We have nothing to report in this regard.
Responsibilities of the Directors for the Financial Report
The directors are responsible for the preparation of the financial report that gives a true and fair view in accordance with AustralianAccounting Standards and the Corporations Act 2001 and for such internal control as the directors determine is necessary to enablethe preparation of the financial report that gives a true and fair view and is free from material misstatement, whether due to fraudor error.
In preparing the financial report, directors are responsible for assessing the ability of the Company to continue as a going concern,disclosing, as applicable, matters related to going concern and using the going concern basis of accounting unless the directorseither intend to liquidate the Company or to cease operations, or have no realistic alternative but to do so.
Auditor’s Responsibility for the Audit of the Financial Report
Our objectives are to obtain reasonable assurance about whether the financial report as a whole is free from material misstatement,whether due to fraud or error, and to issue an auditor’s report that includes our opinion. Reasonable assurance is a high level ofassurance, but is not a guarantee that an audit conducted in accordance with the Australian Auditing Standards will always detecta material misstatement when it exists. Misstatements can arise from fraud or error and are considered material if, individually orin the aggregate, they could reasonably be expected to influence the economic decisions of users taken on the basis of this financialreport.
As part of an audit in accordance with the Australian Auditing Standards, we exercise professional judgement and maintainprofessional scepticism throughout the audit. We also:
• Identify and assess the risks of material misstatement of the financial report, whether due to fraud or error, design andperform audit procedures responsive to those risks, and obtain audit evidence that is sufficient and appropriate to providea basis for our opinion. The risk of not detecting a material misstatement resulting from fraud is higher than for oneresulting from error, as fraud may involve collusion, forgery, intentional omissions, misrepresentations, or the override ofinternal control.
• Obtain an understanding of internal control relevant to the audit in order to design audit procedures that are appropriatein the circumstances, but not for the purpose of expressing an opinion on the effectiveness of the Company’s internalcontrol.
• Evaluate the appropriateness of accounting policies used and the reasonableness of accounting estimates and relateddisclosures made by the directors.
• Conclude on the appropriateness of the directors’ use of the going concern basis of accounting and, based on the auditevidence obtained, whether a material uncertainty exists related to events or conditions that may cast significant doubton the Company’s ability to continue as a going concern. If we conclude that a material uncertainty exists, we are requiredto draw attention in our auditor’s report to the related disclosures in the financial report or, if such disclosures areinadequate, to modify our opinion. Our conclusions are based on the audit evidence obtained up to the date of our auditor’sreport. However, future events or conditions may cause the Company to cease to continue as a going concern.
• Evaluate the overall presentation, structure and content of the financial report, including the disclosures, and whether thefinancial report represents the underlying transactions and events in a manner that achieves fair presentation.
We communicate with the directors regarding, among other matters, the planned scope and timing of the audit and significantaudit findings, including any significant deficiencies in internal control that we identify during our audit.
We also provide the directors with a statement that we have complied with relevant ethical requirements regarding independence,and to communicate with them all relationships and other matters that may reasonably be thought to bear on our independence,and where applicable, related safeguards.
From the matters communicated with the directors, we determine those matters that were of most significance in the audit of thefinancial report of the current period and are therefore the key audit matters. We describe these matters in our auditor’s reportunless law or regulation precludes public disclosure about the matter or when, in extremely rare circumstances, we determine thata matter should not be communicated in our report because the adverse consequences of doing so would reasonably be expectedto outweigh the public interest benefits of such communication.
For
per
sona
l use
onl
y
25
Report on the Remuneration Report
Opinion on the Remuneration Report
We have audited the Remuneration Report included in pages 20 and 21 of the Directors’ Report for the year ended 30 June 2019.
In our opinion, the Remuneration Report of NAOS Emerging Opportunities Company Limited, for the year ended 30 June 2019,complies with section 300A of the Corporations Act 2001.
Responsibilities
The directors of the Company are responsible for the preparation and presentation of the Remuneration Report in accordance withsection 300A of the Corporations Act 2001. Our responsibility is to express an opinion on the Remuneration Report, based on ouraudit conducted in accordance with Australian Auditing Standards.
DELOITTE TOUCHE TOHMATSU
David SalmonPartnerChartered AccountantsCanberra, 22 August 2019
For
per
sona
l use
onl
y
26 NAOS Emerging Opportunities Company Limited Annual Report 2019
STATEMENT OF PROFIT OR LOSS AND OTHER COMPREHENSIVE INCOME FOR THE YEAR ENDED 30 JUNE 2019
Note
Year ended30 June 2019
$
Year ended30 June 2018
$
Income 3 (8,816,663) 6,459,544
Expenses
Management fees 15 (871,041) (1,038,905)
Administration fees (64,224) (70,647)
Directors’ remuneration (51,250) (45,000)
Australian stock exchange fees (85,376) (68,141)
Auditor’s remuneration (44,500) (38,300)
Custody fees (35,112) (26,085)
Registry fees (46,879) (53,743)
Company secretarial fees (31,900) (31,900)
Other expenses from ordinary activities (164,808) (169,405)
(Loss)/Profit before income tax expense (10,211,753) 4,917,418
Income tax benefit/(expense) 4(a) 2,704,363 (793,053)
(Loss)/Profit for the year attributable to shareholders of the Company (7,507,390) 4,124,365
Other comprehensive income, net of tax – –
Total comprehensive income for the year attributable to shareholders of the Company (7,507,390) 4,124,365
Basic and diluted earnings per share 17 (12.54) 6.94
The accompanying notes to the financial statements should be read in conjunction with this statement.
For
per
sona
l use
onl
y
27
STATEMENT OF FINANCIAL POSITIONAS AT 30 JUNE 2019
Note
As at30 June 2019
$
As at30 June 2018
$
Assets
Cash and cash equivalents 12 2,047,768 140,630
Trade and other receivables 6 741,886 401,285
Financial assets at fair value through profit or loss 7 58,961,523 76,406,321
Deferred tax assets 4(b) 2,164,090 64,655
Total assets 63,915,267 77,012,891
Liabilities
Trade and other payables 8 807,935 564,407
Provision for income tax 976,491 1,017,597
Deferred tax liabilities 4(c) – 1,750,942
Total liabilities 1,784,426 3,332,946
Net assets 62,130,841 73,679,945
Equity
Issued capital 9 64,133,561 63,840,245
Profits reserve 10(a) 9,654,623 13,989,653
Accumulated losses 10(b) (11,657,343) (4,149,953)
Total equity 62,130,841 73,679,945
The accompanying notes to the financial statements should be read in conjunction with this statement.
For
per
sona
l use
onl
y
28 NAOS Emerging Opportunities Company Limited Annual Report 2019
STATEMENT OF CHANGES IN EQUITYFOR THE YEAR ENDED 30 JUNE 2019
Issued Capital
$
Accumulated Losses
$
Profits Reserve
$
Total Equity
$
Balance at 1 July 2017 63,163,012 (1,364,761) 11,378,853 73,177,104
Profit for the year – 4,124,365 – 4,124,365
Transfer to Profits Reserve – (6,909,557) 6,909,557 –
Dividends Paid – – (4,298,757) (4,298,757)
Shares issued under Dividend Reinvestment Plan 677,233 – – 677,233
Balance at 30 June 2018 63,840,245 (4,149,953) 13,989,653 73,679,945
Loss for the year – (7,507,390) – (7,507,390)
Dividends Paid – – (4,335,030) (4,335,030)
Shares issued under Dividend Reinvestment Plan 293,316 – – 293,316
Purchase of shares on‑market for DRP (313,301) – – (313,301)
DRP shares allotted 313,301 – – 313,301
Balance at 30 June 2019 64,133,561 (11,657,343) 9,654,623 62,130,841
The accompanying notes to the financial statements should be read in conjunction with this statement.
For
per
sona
l use
onl
y
29
STATEMENT OF CASH FLOWSFOR THE YEAR ENDED 30 JUNE 2019
Note
Year ended30 June 2019
$
Year ended30 June 2018
$
Cash flows from operating activities
Payments for purchase of investments (11,229,872) (32,284,340)
Proceeds from sale of investments 18,410,381 37,688,254
Dividends received 1,306,676 1,276,323
Interest received 8,074 13,231
Interest paid (10) (14)
Management fees paid (888,398) (1,040,804)
Performance fee paid – (367,716)
Directors’ remuneration paid (51,250) (45,000)
Income tax paid (1,187,120) (1,291,067)
Administration and tax service fee paid (76,350) (81,720)
Custody fees paid (30,570) (37,129)
Audit fee paid (45,845) (32,735)
Registry fee paid (40,768) (52,736)
ASX fees paid (56,438) (68,141)
Company secretarial fees paid (31,900) (31,900)
Other payments (143,803) (151,914)
Other receipts – 50,292
Net cash provided by operating activities 12(b) 5,942,807 3,542,884
Cash flows from financing activities
Dividends paid net of reinvested (3,722,368) (3,604,891)
Purchases of shares on‑market for Dividend Reinvestment Plan (313,301) –
Net cash used in financing activities (4,035,669) (3,604,891)
Net increase/(decrease) in cash and cash equivalents 1,907,138 (62,007)
Cash and cash equivalents at the beginning of the year 140,630 202,637
Cash and cash equivalents at the end of the year 12(a) 2,047,768 140,630
The accompanying notes to the financial statements should be read in conjunction with this statement.
For
per
sona
l use
onl
y
30 NAOS Emerging Opportunities Company Limited Annual Report 2019
NOTES TO THE FINANCIAL STATEMENTS
GENERAL INFORMATIONNAOS Emerging Opportunities Company Limited (the “Company”) is a public company listed on the Australian Securities Exchange (ASX: NCC) registered and domiciled in Australia. The Company was constituted on 6 November 2012 and commenced operations on 22 February 2013.
The registered office and principal place of business of the Company is Level 34, MLC Centre, 19 Martin Place, Sydney NSW 2000.
NAOS Asset Management Limited (the “Investment Manager”) is the investment manager for the Company. The financial statements were authorised for issue by the Directors on 22 August 2019.
1. SUMMARY OF SIGNIFICANT ACCOUNTING POLICIESThe principal accounting policies applied in the preparation of these financial statements are set out below.
a) Basis of PreparationThis general purpose financial report has been prepared in accordance with Australian Accounting Standards, other authoritative pronouncements and interpretations of the Australian Accounting Standards Board (the “AASB”), and the Corporations Act 2001 in Australia. For the purposes of preparing financial statements, the Company is a for profit entity.
This general purpose financial report has been prepared on an accruals basis using historical cost convention, except for the revaluation of investments in financial assets and liabilities, which have been measured at fair value through profit or loss.
The Statement of Financial Position is presented on a liquidity basis. Assets and liabilities are presented in decreasing order of liquidity. All balances are expected to be recovered or settled within 12 months, except for investments in financial assets at fair value through profit or loss and net assets attributable to shareholders.
The preparation of financial statements in conformity with Australian Accounting Standards requires management to make judgements, estimates and assumptions that affect the application of policies and reported amounts of assets and liabilities, income and expenses. The estimates and associated assumptions are based on historical experience and various other factors that are believed to be reasonable under the circumstances, the results of which form the basis of making the judgements about the carrying values of assets and liabilities that are not readily apparent from other sources.
b) Prior Year ComparativesComparative information has been disclosed in respect of the previous period for amounts reported in the financial statements. Where the presentation or classification of items in the financial statements is amended, the comparative amounts have been reclassified to conform with current year presentation. In particular, during the current financial year, cash flows from purchase and sale of investments have been reclassified from investing activities to operating activities to be consistent with generally accepted industry practice.
c) Statement of ComplianceThe financial report of the Company, comprising the financial statements and notes thereto, complies with Australian Accounting Standards as issued by the Australian Accounting Standards Board (“AASB”) and International Financial Reporting Standards (“IFRS”), as issued by the International Accounting Standards Board (the “IASB”).
d) Reporting CurrencyAll amounts are presented in Australian dollars as the functional and presentational currency of the Company.
e) Going Concern BasisThis financial report has been prepared on a going concern basis.
f) Revenue and Income Recognition
RevenueRevenue is recognised and measured at the fair value of the consideration received or receivable to the extent that it is probable that the economic benefits will flow to the Company and the revenue can be reliably measured.
Net gains/(losses) on financial instruments held at fair value through profit or loss arising on a change in fair value are calculated as the difference between the fair value at the period end and the fair value at the previous valuation point. Net gains/(losses) also include realised gains/(losses) and do not include interest or dividend income.
DividendsDividend income is recognised on the ex‑dividend date with the corresponding foreign withholding tax recorded as an expense.
Interest IncomeInterest income is recognised on a time proportionate basis taking into account the effective yield on the financial assets.
g) Cash and Cash EquivalentsCash and cash equivalents includes cash on hand, deposits held at call with financial institutions, and other short‑term, highly liquid investments with original maturities of three months or less that are readily convertible to known amounts of cash and which are subject to an insignificant risk of changes in value.
h) Investments in Financial InstrumentsInvestments in financial instruments, as defined by AASB 132 “Financial Instruments: Presentation”, are categorised in accordance with AASB 9 “Financial Instruments”. This classification is determined by the investment strategy of the Company. The classification of each financial instrument is re‑evaluated at each financial period end.
For
per
sona
l use
onl
y
31
1. SUMMARY OF SIGNIFICANT ACCOUNTING POLICIES (CONTINUED)
h) Investments in Financial Instruments (continued)
(i) Initial recognition, measurement and derecognitionThe Company recognises financial assets and financial liabilities on the date it becomes party to the contractual agreement (trade date) and recognises changes in the fair value of the financial assets and financial liabilities from this date.
At initial recognition, the Company measures a financial asset at its fair value. Transaction costs of financial assets carried at fair value through profit or loss are expensed in the Statement of Profit or Loss and Other Comprehensive Income.
Investments are derecognised when the right to receive cash flows from the investments have expired or the Company has transferred substantially all the risks and rewards of ownership.
(ii) Classification and subsequent measurement
Financial Assets and Liabilities held at Fair Value through Profit or LossSubsequent to initial recognition, all financial assets and liabilities at fair value through profit or loss are measured at fair value. Gains and losses arising from changes in the fair value of the “financial assets or financial liabilities at fair value through profit or loss” category are presented in the Statement of Profit or Loss or Other Comprehensive Income within net gains/(losses) on financial instruments held at fair value through profit or loss in the period in which they arise.
The fair value of financial assets and liabilities traded in active markets is based on their quoted market prices at the reporting date without any deduction for estimated future selling costs. The quoted market price used for financial assets and liabilities held by the Company is the current close price.
Impairment of financial assetsThe Company recognises a loss allowance for expected credit losses (“ECL”) on financial assets excluding investments that are measured at fair value through profit and loss. The amount of expected credit losses is updated at each reporting date to reflect changes in credit risk since initial recognition of the respective financial instruments. The expected credit losses on these financial assets are estimated using a provision matrix based on the Company’s historical credit loss experience, adjusted for factors that are specific to debtors, and general economic conditions at the reporting date, including time value of money where appropriate.
The Company recognises lifetime ECL when there has been a significant increase in credit risk since initial recognition. However, if the credit risk on the financial instruments has not increased significantly since initial recognition, the Company measures the loss allowance for that financial instrument at an amount equal to 12‑month ECL. Lifetime ECL represents the expected credit losses that will result from all possible default events over the expected life of a financial instrument. In contrast, 12‑month ECL represents the portion of lifetime ECL that is expected to result from default events on a financial instrument that are possible within 12 months after the reporting date.
The amount of the impairment loss will be recognised in the Statement of Profit or Loss and Other Comprehensive Income.
i) ExpensesAll expenses, including Investment Manager’s fees, are recognised in the Statement of Profit or Loss and Other Comprehensive Income on an accruals basis.
j) ReceivablesReceivables may include amounts for dividends, interest, trust distributions and amounts due from brokers. Dividends and trust distributions are accrued when the right to receive payment is established. Interest is accrued at the reporting date from the time of last payment in accordance with the policy set out in Note 1(f) above. Receivables also include such items as Reduced Input Tax Credits (“RITC”).
k) PayablesTrade and other payables are recognised when the Company becomes obliged to make future payments resulting from the purchase of goods and services. Payables include liabilities, amounts due to brokers and accrued expenses owed by the Company which are unpaid as at the end of the reporting period.
l) TaxationThe income tax expense comprises of current tax and movements in deferred tax.
Current income tax expense/(benefit) is the tax payable/(receivable) on taxable income calculated using applicable income tax rates enacted, or substantially enacted, as at reporting date. Current tax liabilities/(assets) are therefore measured at the amounts expected to be paid to/(recovered from) the relevant taxation authority.
Current and deferred tax expense/(benefit) is charged or credited directly to equity instead of profit or loss when the tax relates to items that are credited or charged directly to equity. Deferred tax assets and liabilities are ascertained based on temporary differences between the tax bases of assets and liabilities and their carrying amounts in the financial statements. No deferred tax will be recognised from the initial recognition of an asset or liability, excluding a business combination, where there is no effect on accounting or taxable profit or loss.
Deferred tax assets and liabilities are calculated at the tax rates that are expected to apply to the period when the asset is realised or the liability is settled, based on tax rates enacted or substantially enacted at reporting date. Their measurement also reflects the manner in which management expects to recover or settle the carrying amount of the related asset or liability.
Deferred tax assets relating to temporary differences and unused tax losses are recognised only to the extent that it is probable that future taxable profit will be available against which the benefits of the deferred tax asset can be utilised.F
or p
erso
nal u
se o
nly
32 NAOS Emerging Opportunities Company Limited Annual Report 2019
NOTES TO THE FINANCIAL STATEMENTS
Continued
1. SUMMARY OF SIGNIFICANT ACCOUNTING POLICIES (CONTINUED)
l) Taxation (continued)Current tax assets and liabilities are offset where a legally enforceable right of set‑off exists and it is intended that net settlement or simultaneous realisation and settlement of the respective asset and liability will occur. Deferred tax assets and liabilities are offset where a legally enforceable right of set‑off exists, and the deferred tax assets and liabilities relate to income taxes levied by the same taxation authority on either the same taxable entity or different taxable entities where it is intended that net settlement or simultaneous realisation and settlement of the respective asset and liability will occur in future periods in which significant amounts of deferred tax assets or liabilities are expected to be recovered or settled.
m) DividendsDividends payable are recognised in the reporting period in which they are declared, for the entire undistributed amount, regardless of the extent to which they will be paid in cash.
n) Share CapitalOrdinary shares are classified as equity. Costs directly attributable to the issue of ordinary shares are recognised as a deduction from equity, net of any tax effect.
o) Profits ReserveThe profits reserve is made up of amounts transferred from current and retained earnings that are preserved for future dividend payments.
p) Goods and Services Tax (“GST”)Revenues, expenses and assets are recognised net of the amount of GST except:
• where the amount of GST is not recoverable from the taxation authority, it is recognised as part of acquisition of an asset or part of an item of expense; or
• for receivables and payables which are recognised inclusive of GST.
The net amount of GST recoverable from, or payable to, the tax authority is included as part of receivables or payables. Cash flows are included in the Statement of Cash Flows on a gross basis. The GST component of cash flows arising from investing and financing activities which is recoverable from, or payable to, the taxation authority is classified as operating cash flows.
q) Earnings Per ShareBasic earnings per share are calculated by dividing the net profit attributable to shareholders of the Company, excluding any costs of servicing equity other than ordinary shares, by the weighted average number of ordinary shares outstanding during the financial period, adjusted for bonus elements in ordinary shares issued during the period.
Diluted earnings per share are calculated by dividing the net profit attributable to shareholders of the Company, excluding any costs of servicing equity other than ordinary shares, by the weighted average number of ordinary shares and potential ordinary shares (options) outstanding during the financial period, adjusted for bonus elements in ordinary shares issued during the period.
r) Critical Accounting Judgements and Key Sources of Estimation UncertaintyIn the application of the accounting policies, management are required to make judgements, estimates and assumptions about carrying values of some assets and liabilities that are not readily apparent from other sources. The estimates and associated assumptions are based on historical experience and various other factors that are believed to be reasonable under the circumstances, the results of which form the basis of making the judgements. Actual results may differ from these estimates.
The estimates and underlying assumptions are reviewed on an ongoing basis. Revisions to accounting estimates are recognised in the period in which the estimate is revised if the revision affects only that period, or in the period of the revision and future periods if the revision affects both current and future periods.
Income TaxThe Company has recognised deferred tax assets relating to unrealised losses on investments, other accruals and share issue costs of $2,164,090 as at 30 June 2019. The utilisation of tax losses depends on the ability of the Company to generate future taxable profits. The Company considers that it is probable that future taxable profits will be available to utilise those deferred tax assets. This assessment is supported by the Investment Manager’s long‑term performance and profitability. New information may become available that may cause the Company to change its judgement regarding calculation of tax balances, and such changes will impact the profit or loss in the period that such determination is made.
For
per
sona
l use
onl
y
33
2. ADOPTION OF NEW AND REVISED ACCOUNTING STANDARDS
New or amended Accounting Standards and Interpretations adopted in the current periodThe Company has adopted all of the new or amended Accounting Standards and Interpretations issued by the Australian Accounting Standards Board (“AASB”) that are mandatory for the current reporting period:
AASB 9: Financial Instruments (AASB 9) (effective 1 July 2018)In accordance with initial application requirements, the Company adopted AASB 9 from 1 July 2018. All of the Company’s investments in financial assets continued to be accounted for at fair value through profit or loss under AASB 9. Accordingly, first time application of AASB 9 had no impact on the Company’s accounting for its investments in financial assets. On initial application of AASB 9, the Company also adopted the expected credit loss impairment model. As per management’s assessment, the adoption had no material impact on the carrying amounts of the Company’s receivables.
AASB 15: Revenue from Contracts with Customers (AASB 15) (effective 1 July 2018)AASB 15 supersedes AASB 118 Revenue and AASB 111 Construction Contracts. Although AASB 15 is principles‑based, it is a significant change from the current revenue requirements and will involve more judgements and estimates as revenue is recognised when control of a good or service transfers to a customer, or on satisfaction of performance obligations under contracts, which replaces the existing notion of risks and rewards.
As per management’s assessment, there were no impacts on the Company’s financial statements upon adoption of AASB 15 on 1 July 2018 as the Company’s revenue recognition of interest income, dividend income, and net gains/(losses) on financial instruments were unaffected as these items are excluded from the scope of AASB 15.
New standards and interpretations not yet adoptedThere are no new standards or interpretations applicable that would have a material impact for the Company.
3. INCOME
Year ended30 June 2019
$
Year ended30 June 2018
$
(Loss)/gains on financial instruments held at fair value through profit or loss (10,133,878) 5,169,753
Interest income 10,539 13,468
Dividend income 1,306,676 1,276,323
(8,816,663) 6,459,544
4. INCOME TAX
(a) Income Tax ExpenseThe prima facie tax on (loss)/profit before income tax is reconciled to the income tax expense as follows:
Year ended30 June 2019
$
Year ended30 June 2018
$
Prima facie income tax (benefit)/expense calculated at 27.5% (2018: 30%) (2,808,231) 1,475,226
Imputation credit gross up 153,777 164,099
Franking credit offset (559,189) (546,995)
Non‑assessable items 652,682 (299,277)
Tax rate adjustment to 27.5% (143,402) –
(2,704,363) 793,053
The Company assessed that it is a base rate entity for the year ended 30 June 2019 and hence a lower company tax rate of 27.5% is applied to all income tax related balances.
Total Income Tax Expense results in a:
Current tax liability 976,491 1,017,597
Income tax paid 169,523 1,110,049
Change in deferred tax liability (1,750,942) (1,476,047)
Change in deferred tax asset (2,099,435) 141,454
(2,704,363) 793,053
For
per
sona
l use
onl
y
34 NAOS Emerging Opportunities Company Limited Annual Report 2019
NOTES TO THE FINANCIAL STATEMENTS
Continued
4. INCOME TAX (CONTINUED)
(b) Deferred Tax Assets Deferred income tax assets comprises the estimated expense at the current income tax rates of 27.5% (2018: 30%) on the following items:
As at30 June 2019
$
As at30 June 2018
$
Temporary differences in relation to:
Unrealised losses on investments 2,119,018 –
Accruals 10,531 12,872
Capitalised share issue and placement costs 34,541 51,783
2,164,090 64,655
Year ended30 June 2019
$
Year ended30 June 2018
$
Movement in deferred tax assets
Balance at the beginning of the period 64,655 206,109
Credited/(charged) to the Statement of Profit or Loss and Other Comprehensive Income 2,116,677 (107,147)
Capitalised share issue and placement costs (17,242) (34,307)
At reporting date 2,164,090 64,655
(c) Deferred tax Liabilities
As at30 June 2019
$
As at30 June 2018
$
Temporary differences in relation to:
Unrealised gains on investments – 1,750,942
Movement in deferred tax liabilities
Year ended30 June 2019
$
Year ended30 June 2018
$
Balance at the beginning of the year 1,750,942 3,226,989
Charged/(credited) to the Statement of Profit or Loss and Other Comprehensive Income (1,750,942) (1,476,047)
At reporting date – 1,750,942
For
per
sona
l use
onl
y
35
5. DIVIDEND PAID OR PAYABLE
Year ended 30 June 2019Dividend rate
(cents per share) Total amount % Franked Date of payment
2018 Final Dividend (declared 23 August 2018) 3.50 2,088,578 100% 24 October 2018
2019 Interim Dividend (declared 16 February 2018) 3.75 2,246,452 100% 27 March 2019
4,335,030
Year ended 30 June 2018Dividend rate
(cents per share) Total amount % Franked Date of payment
2017 Final Dividend (declared 24 August 2017) 3.50 2,071,072 100% 1 November 2017
2018 Interim Dividend (declared 16 February 2018) 3.75 2,227,685 100% 28 March 2018
4,298,757
Dividends payable at 30 June 2019 were $93,703 (2018: $87,659).
Dividend Franking Information
Year ended30 June 2019
$
Year ended30 June 2018
$
Franking credits available for shareholders from previous financial periods 196,440 200,703
Impact on the franking account of dividends paid during the year (1,747,208) (1,842,325)
Impact on the franking account of dividends received during the year 559,189 546,995
Impact on the franking account of income tax paid during the year 1,187,120 1,291,067
Franking account balance at reporting date 195,541 196,440
The Company’s ability to continue to pay franked dividends is dependent upon the receipt of franked dividends from investments and the payment of tax.
6. TRADE AND OTHER RECEIVABLES
As at30 June 2019
$
As at30 June 2018
$
GST receivable 25,435 24,923
Unsettled trades receivable 687,456 351,652
Prepayments 26,293 24,473
Interest receivable 2,702 237
741,886 401,285
Receivables are non‑interest bearing and unsecured. Outstanding trades i.e. “Unsettled trades receivable” are on the terms operating in the securities industry which usually require settlement within two days of the date of the transaction. None of the receivables are past due or impaired at the end of the reporting period.F
or p
erso
nal u
se o
nly
36 NAOS Emerging Opportunities Company Limited Annual Report 2019
NOTES TO THE FINANCIAL STATEMENTS
Continued
7. INVESTMENTS IN FINANCIAL INSTRUMENTS
Financial assets at Fair Value through Profit or Loss
As at30 June 2019
$
As at30 June 2018
$
Listed investments at fair value 58,961,523 76,406,321
Total financial assets at fair value through profit or loss 58,961,523 76,406,321
Financial liabilities at Fair Value through Profit or LossThere were no financial liabilities at fair value through profit or loss as at 30 June 2019 (2018: $nil).
Disclosed fair valuesFor all financial instruments other than those measured at fair value, their carrying value approximates fair value.
8. TRADE AND OTHER PAYABLES
As at30 June 2019
$
As at30 June 2018
$
Auditor’s remuneration payable 20,778 22,123
Management fee payable 70,260 87,617
Unsettled trades payable 547,072 341,679
Dividend payable 93,704 87,659
Other payables 76,121 25,329
Total 807,935 564,407
Payables are non‑interest bearing and unsecured. Unsettled trades are on the terms operating in the securities industry which usually require settlement within two days of the date of the transaction.
9. ISSUED CAPITAL
30 June 2019 30 June 2018
No of shares $ No of shares $
Issued and paid up capital – Ordinary shares 59,905,339 64,133,561 59,673,562 63,840,245
Detailed provisions relating to the rights attaching to the shares are set out in the Company’s Constitution and the Corporations Act 2001. The detailed provisions relating to the rights attaching to shares under the Constitution and the Corporations Act 2001 are summarised below.
Each share will confer on its holder:
(a) the right to receive notice of and to attend general meetings of the Company and to receive all financial statements, notices and documents required to be sent to them under the constitution and the Corporations Act 2001;
(b) the right to vote at a general meeting of shareholders (whether present in person or by any representative, proxy or attorney) on a show of hands (one vote per shareholder) and on a poll (one vote per Share) subject to the rights and restrictions on voting which may attach to or be imposed on shares (at present there are none);
(c) the right to receive dividends;(d) the right to receive, in kind, the whole or any part of the Company’s property in a winding up, subject to the rights of a liquidator
of the Company (with consent of members by special resolution); and(e) subject to the Corporations Act 2001 and the ASX Listing Rules, shares are fully transferable.
For
per
sona
l use
onl
y
37
9. ISSUED CAPITAL (CONTINUED)
Movements in Ordinary Share Capital
Date Details No of shares $
1 July 2017 Opening balance 59,173,393 63,163,012
Shares issued under Dividend Reinvestment Plan 500,169 677,233
30 June 2018 Closing balance 59,673,562 63,840,245
1 July 2018 Opening balance 59,673,562 63,840,245
Shares issued under Dividend Reinvestment Plan 231,777 293,316
DRP shares allotted 287,122 313,301
Purchase of shares on‑market for DRP (287,122) (313,301)
30 June 2019 Closing balance 59,905,339 64,133,561
During the financial year, the Company made a 1 for 4 bonus option issue to shareholders. These bonus options are listed on the ASX under the code NCCOB and give the right to the option holders to acquire new ordinary shares at a price of $1.02 per share. The bonus options will expire on 29 June 2021.
A total of 14,975,819 bonus options have been issued, all of which remained unexercised at 30 June 2019.
10. PROFITS RESERVE AND ACCUMULATED LOSSES
(a) Profits Reserve
As at 30 June
2019$
As at30 June
2018$
Balance at the beginning of the year 13,989,653 11,378,853
Transfer to Profits Reserve – 6,909,557
Dividends Paid (4,335,030) (4,298,757)
Balance at Reporting Date 9,654,623 13,989,653
To the extent possible under the Corporations Act 2001 and applicable tax laws, the profits reserve is preserved for future dividend payments.
(b) Accumulated Losses
As at 30 June
2019$
As at 30 June
2018$
Balance at the beginning of the year (4,149,953) (1,364,761)
Transfer to Profits Reserve – (6,909,557)
(Loss)/Profit for the year attributable to members of the Company (7,507,390) 4,124,365
Balance at Reporting Date (11,657,343) (4,149,953)For
per
sona
l use
onl
y
38 NAOS Emerging Opportunities Company Limited Annual Report 2019
NOTES TO THE FINANCIAL STATEMENTS
Continued
11. AUDITOR’S REMUNERATIONDuring the year the following fees were paid or payable for services provided by the auditor, its related practices and non‑audit related services:
Year ended30 June 2019
$
Year ended30 June 2018
$
Deloitte Touche Tohmatsu – audit and review of the financial reports 44,500 38,300
Total auditor’s remuneration 44,500 38,300
12. CASH AND CASH EQUIVALENTS
(a) Components of Cash and Cash Equivalents
30 June 2019$
30 June 2018$
Cash at bank 2,047,768 140,630
(b) Reconciliation of Net Profit for the Year to Cash Provided by Operating Activities
As at30 June 2019
$
As at30 June 2018
$
(Loss)/Profit for the year attributable to shareholders after tax (7,507,390) 4,124,365
Adjustments for:
Change in value of financial assets designated at fair value through profit or loss 17,444,798 278,913
Income tax expense recognised in the Statement of Profit or Loss and Other Comprehensive Income (2,704,363) 793,053
Income tax paid (1,187,120) (1,291,067)
Change in assets and liabilities:
Increase in trade and other receivables (340,601) (51,726)
Increase/(decrease) in trade and other payables 237,483 (310,654)
Net cash provided by operating activities 5,942,807 3,542,884
For
per
sona
l use
onl
y
39
13. KEY MANAGEMENT PERSONNEL
(a) Key Management Personnel CompensationThe remuneration of the Company’s key management personnel and their related entities for the year ended 30 June 2019 was $51,250 (2018: $45,000).
There were no shares or bonus options granted during the reporting period as compensation to the Directors. (2018: Nil)
(b) Related Party Shareholdings
NAOS Asset Management LimitedThe Company has outsourced its investment management function to NAOS Asset Management Limited. As at 30 June 2019, NAOS Asset Management Limited holds 789,463 shares (2018: 789,463 shares) in the Company, and 197,365 bonus options (2018: Nil).
Other than the disclosure at Note 15 and below there was no interest in the company held by other entities also managed by the key management personnel.
Holdings of Shares by Key Management PersonnelDuring the year, the relevant interests of the Directors and their related parties in the shares of the Company were:
Ordinary sharesYear ended 30 June 2019
Opening balance
No of sharesAcquired
No of sharesSold
No of shares
Closing balance
No of shares
Mr David Rickards (Chairman) 697,835 40,731 – 738,566
Mr Sebastian Evans (Director) 1,165,131 46,196 – 1,211,327
Holdings of Bonus Options by Key Management PersonnelDuring the year, the relevant interests of the Directors and their related parties in the bonus options of the Company were:
Bonus OptionsYear ended 30 June 2019
Opening balance
No of bonus options
IssuedNo of bonus
options
ExercisedNo of bonus
options
Closing balance
No of bonus options
Mr David Rickards (Chairman) – 184,641 – 184,641
Mr Warwick Evans (Director) – 523,158 – 523,158
Mr Sebastian Evans (Director) – 307,563 – 307,563
Ms Sarah Williams (Director) – – – –
(c) Other Transactions within the CompanyApart from those details disclosed in this note, no other key management personnel have entered into a material contract with the Company during the financial year and there were no material contracts involving key management personnel’s interests existing at year end.
14. SEGMENT INFORMATIONThe Company has only one reportable segment. The Company operates predominantly in Australia and in one industry being the securities industry, deriving revenue from dividend income, interest income and from the investment portfolio.
For
per
sona
l use
onl
y
40 NAOS Emerging Opportunities Company Limited Annual Report 2019
NOTES TO THE FINANCIAL STATEMENTS
Continued
15. RELATED PARTY INFORMATIONTransactions with related parties have taken place at arm’s length and in the ordinary course of business.
Management FeesIn return for the performance of its duties, the Investment Manager of the Company is entitled to be paid a monthly management fee equal to 0.104% (excluding GST) of the gross value of the portfolio calculated on the last business day of each month representing an annualised management fee of 1.25% (excluding GST) per annum of the average gross value of the portfolio. At its discretion and subject to shareholder approval, the Investment Manager may elect to be paid in shares.
The following management fees were paid or payable to the Investment Manager during the year ended 30 June 2019:
• Management fees of $871,041 (2018: $1,038,905) (excluding RITC*) were incurred during the year.• Management fees payable at 30 June 2019 were $70,260 (2018: $87,617) (including RITC*).
*RITC – Reduced Input Tax Credit on GST of 75%.
Performance FeesIn the event that the portfolio outperforms the Benchmark Index (being the S&P/ASX Small Ordinaries Accumulation Index), the Company must pay the Investment Manager a performance fee equal to 15% (excluding GST) per annum of the amount the portfolio outperforms the Benchmark Index. No performance fee is payable if the portfolio underperforms the Benchmark Index. Any underperformance to the Benchmark Index is carried forward to future performance calculation periods and must be recouped before the Investment Manager is entitled to a performance fee. At its discretion and subject to shareholder approval, the Investment Manager may elect to receive the performance fee in shares. No performance fees were paid or payable to the Investment Manager during the year ended 30 June 2019 (2018: Nil).
16. FINANCIAL RISK MANAGEMENT OBJECTIVES AND POLICIESRisks arising from holding financial instruments are inherent in the Company’s activities. These risks are managed through a process of ongoing identification, measurement and monitoring. The Company is exposed to credit risk, liquidity risk and market risk.
Financial instruments of the Company comprise investments in financial assets held for the purpose of generating a return on the investment made by shareholders. In addition, the Company also holds cash and cash equivalents, and other financial instruments such as trade debtors and creditors, which arise directly from the operations of the Company. The responsibility for identifying and controlling the risks that arise from these instruments is that of the Investment Manager of the Company.
The method used to measure the risks reflects the expected impact on the performance of the Company as well as the assets attributable to shareholders of the Company resulting from reasonably possible changes in the relevant risk variables. Information regarding the Company’s risk exposure is prepared and monitored by the Investment Manager against established investment mandate limits. These mandate limits reflect the investment strategy and market environment of the Company as well as the level of risk the Company is willing to accept. Information about these risk exposures at reporting date is disclosed below.
(a) Credit RiskCredit risk represents the risk that the Company will incur financial loss as a result of a failure by a counterparty to discharge a contractual obligation to a financial instrument. The Investment Manager monitors the creditworthiness of counterparties on an ongoing basis and evaluates the credit quality of all new counterparties before engaging them.
The maximum exposure to credit risk on financial assets, excluding investments of the Company which have been recognised in the Statement of Financial Position, is the carrying amount net of any provision for impairment of those assets.
The Investment Manager is responsible for ensuring that counterparties are of sufficient quality to minimise any individual counterparty credit risk. The majority of the Company’s receivables arise from unsettled trades at year end which are settled two days after trade date. Engaging with counterparties via the Australian Securities Exchange facilitates the Company in both mitigating and managing its credit risk. The exposure to credit risk for cash and cash equivalents is considered to be low as counterparties (National Australia Bank) have a rating of A or higher.
None of the financial assets exposed to a credit risk are overdue or considered to be impaired.
For
per
sona
l use
onl
y
41
16. FINANCIAL RISK MANAGEMENT OBJECTIVES AND POLICIES (CONTINUED)
(b) Market RiskMarket risk is the risk that the fair value of future cash flows will fluctuate due to changes in market variables such as interest rates, equity prices and other price risks and liquidity. Market risk is managed and monitored on an ongoing basis by the Investment Manager.
By its nature, as a listed investment company that invests in tradeable securities, the Company will always be subject to market risk as it invests its capital in securities which are not risk free as the market price of these securities can fluctuate.
(i) Interest Rate RiskInterest rate risk arises from the possibility that changes in interest rates will affect future cash flows or the fair value of financial instruments.
30 June 2019
Floating interest rate
$
Non-interest bearing
$Total
$
Assets
Cash and cash equivalents 2,047,768 – 2,047,768
Trade and other receivables – 741,886 741,886
Financial assets at fair value through profit or loss – 58,961,523 58,961,523
Total assets 2,047,768 59,703,409 61,751,177
Liabilities
Trade and other payables – 807,935 807,935
Total liabilities – 807,935 807,935
Net exposure 2,047,768 58,895,474 60,943,242
30 June 2018
Floating interest rate
$
Non-interest bearing
$Total
$
Assets
Cash and cash equivalents 140,630 – 140,630
Trade and other receivables – 401,285 401,285
Financial assets at fair value through profit or loss – 76,406,321 76,406,321
Total assets 140,630 76,807,606 76,948,236
Liabilities
Trade and other payables – 564,407 564,407
Total liabilities – 564,407 564,407
Net exposure 140,630 76,243,199 76,383,829
The sensitivity analyses below have been determined based on the Company’s exposure to interest rates at the reporting date and the stipulated change taking place at the beginning of the financial year and held constant throughout the reporting period, in the case of instruments that have floating interest rates. A 25 basis point increase or decrease is used when reporting interest rate risk internally to key management personnel and represents management’s assessment of reasonably possible changes in interest rates.
Change in basis points increase/(decrease)
Impact on operating profit/Net assets
attributable to shareholders ($)
30 June 2019
AUD interest rate 25bps/(25bps) 5,119/(5,119)
30 June 2018
AUD interest rate 25bps/(25bps) 352/(352)
For
per
sona
l use
onl
y
42 NAOS Emerging Opportunities Company Limited Annual Report 2019
NOTES TO THE FINANCIAL STATEMENTS
Continued
16. FINANCIAL RISK MANAGEMENT OBJECTIVES AND POLICIES (CONTINUED)
(b) Market Risk (continued)
(ii) Price RiskPrice risk is the risk that the fair value of investments decreases as a result of changes in market prices (other than those arising from interest rate risk), whether those changes are caused by factors specific to the individual stock or factors affecting all instruments in the market. Price risk is managed by monitoring compliance with established investment mandate limits. All securities present a risk of loss of capital. The maximum risk resulting from financial instruments is determined by the fair value of the financial instruments.
As at 30 June 2019, a 10% sensitivity would have had an impact on the Company’s Statement of Profit or Loss and Other Comprehensive Income and net assets attributable to shareholders as shown in the table below.
Impact on operating profit/Net assets attributable to
shareholders
–10%$
10%$
30 June 2019 (5,896,152) 5,896,152
30 June 2018 (7,640,632) 7,640,632
The Company’s industry sector weighting of the investment portfolio as at the reporting date is as below:
Industry
% of Portfolio
30 June 2019 30 June 2018
Financials 34.70% 42.30%
Commercial and Professional Services 14.80% 11.00%
Media 13.90% 12.60%
Industrials 10.70% 9.50%
Agriculture 10.60% 7.20%
Construction Materials 8.70% 12.20%
Healthcare 6.40% 5.20%
Real Estate 0.20% –
100% 100%
For
per
sona
l use
onl
y
43
16. FINANCIAL RISK MANAGEMENT OBJECTIVES AND POLICIES (CONTINUED)
(c) Liquidity RiskLiquidity risk is the risk that the Company will encounter difficulty in raising funds to meet commitments associated with financial instruments. The Company’s major cash payments are the purchase of securities and dividends paid to shareholders, the levels of which are managed by the Board and the Investment Manager.
The Company’s cash receipts depend upon the level of sales of securities, dividends and interest received.
The Investment Manager monitors the Company’s cash flow requirements daily by reference to known sales and purchases of securities, dividends and interest to be paid or received. Should these decrease by a material amount, the Company can alter its cash outflows as appropriate. The assets of the Company are largely in the form of tradeable securities which (if liquidity is available) can be sold on the market if necessary.
The table below analyses the Company’s financial liabilities into relevant maturity groupings based on the remaining period from 30 June 2018 and 30 June 2019 to the contractual maturity date.
30 June 2019
On demand$
< 1 month$
> 12 months$
Total$
Trade and other payables – 807,935 – 807,935
Total – 807,935 – 807,935
30 June 2018
On demand$
< 1 month$
> 12 months$
Total$
Trade and other payables – 564,407 – 564,407
Total – 564,407 – 564,407
The amounts in the table are the contractual undiscounted cash flows. Balances equal their carrying balances, as the impact of discounting is not significant.
(d) Fair Value HierarchyAASB 13: Fair Value Measurement requires the disclosure of fair value information using a fair value hierarchy reflecting the significance of the inputs in making the measurements. The fair value hierarchy consists of the following levels:
Level 1: Financial instruments are valued by reference to quoted prices in an active market(s) for identical assets or liabilities. These quoted prices represent actual and regularly occurring market transactions on an arm’s length basis.
Level 2:Financial instruments are valued using inputs other than quoted prices covered in Level 1. These other inputs include quoted prices that are observable for the asset or liability, either directly (as prices) or indirectly (derived from prices). The inputs included in this level encompass quoted prices in active markets for similar assets or liabilities, and quoted prices in markets in which there are few transactions for identical or similar assets or liabilities. Financial instruments that are valued using other inputs that are not quoted prices but are observable for the assets or liabilities also fall into this categorisation.
Level 3:Financial instruments that have been valued, in whole or in part, by using valuation techniques or models that are based on unobservable inputs that are neither supported by prices from observable current market transactions in the same instrument nor are they based on available market data.
Unobservable valuation inputs are determined based on the best information available, which might include the entity’s own data, reflecting its assumptions as well as best practices carried out or undertaken by other market participants. These valuation techniques are used to the extent that observable inputs are not available.
Included within Level 1 of the hierarchy are listed investments. The fair values of these financial assets and liabilities have been based on the quoted closing prices at the end of the reporting period.
For
per
sona
l use
onl
y
44 NAOS Emerging Opportunities Company Limited Annual Report 2019
NOTES TO THE FINANCIAL STATEMENTS
Continued
16. FINANCIAL RISK MANAGEMENT OBJECTIVES AND POLICIES (CONTINUED)
(d) Fair Value Hierarchy (continued)
Financial Assets and Liabilities at Fair Value through Profit or Loss
30 June 2019Level 1
$Level 2
$Level 3
$Total
$
Financial assets 58,961,523 – – 58,961,523
Total 58,961,523 – – 58,961,523
30 June 2018Level 1
$Level 2
$Level 3
$Total
$
Financial assets 76,406,321 – – 76,406,321
Total 76,406,321 – – 76,406,321
(e) Capital ManagementThe Company’s objectives for managing capital are:
• to achieve consistent returns while safeguarding capital by investing in a concentrated portfolio, and closely monitoring the performance of the underlying investments;
• to maintain sufficient liquidity to meet the ongoing expenses of the Company; and• to maintain sufficient size to make the operation of the Company cost‑efficient.
The Board manages the Company’s capital through share and bonus options issuance (including the Dividend Reinvestment Plan), share buybacks and the distribution of dividends to shareholders. These capital management initiatives will be used when deemed appropriate by the Board. The Company is not subject to externally imposed capital requirements.
17. EARNINGS PER SHARE
Year ended30 June 2019
cents
Year ended30 June 2018
cents
Basic and diluted earnings per share (12.54) 6.94
Shares Shares
Weighted average number of ordinary shares used in the calculation of basic and diluted earnings per share 59,846,918 59,416,681
$ $
Net (loss)/profit used in the calculation of basic and diluted earnings per share (7,507,390) 4,124,365
18. COMMITMENTS AND CONTINGENCIESThere are no commitments or contingencies at 30 June 2019 (2018: nil).
19. SUBSEQUENT EVENTSOn 22 August 2019, the Company declared a fully franked dividend of 3.5 cents per share.
Other than the matters described above, there has been no matter or circumstance occurring subsequent to the end of the year that has significantly affected, or may significantly affect the operations of the Company, the results of those operations, or the state of affairs of the Company in future financial years.F
or p
erso
nal u
se o
nly
45
DIRECTORS’ DECLARATION
In accordance with a resolution of the Directors of NAOS Emerging Opportunities Company Limited, we declare that:
In the opinion of the Directors:
• the financial statements and notes are in accordance with the Corporations Act 2001 including compliance with Australian Accounting Standards and give a true and fair view of the financial position and performance of the Company for the financial year ended 30 June 2019;
• the attached financial statements are in compliance with International Financial Reporting Standards, as stated in Note 1(c) to the financial statements;
• there are reasonable grounds to believe that the Company will be able to pay its debts as and when they become due and payable; and
• the Directors have received the declarations required by section 295A of the Corporations Act 2001.
Signed in accordance with a resolution of the Directors made pursuant to section 295(5) of the Corporations Act 2001.
On behalf of the Board
Sebastian Evans
22 August 2019
For
per
sona
l use
onl
y
46 NAOS Emerging Opportunities Company Limited Annual Report 2019
Additional information required by the Australian Securities Exchange Limited Listing Rules and not disclosed elsewhere in the report:
INVESTMENT PORTFOLIO
As at 30 June 2019 the Company held the following investments:
Big River Industries Limited
BTC Health Limited
BSA Limited
CML Group Limited
Consolidated Operations Group Limited
Contango Asset Management Limited
Enero Group Limited
Eureka Group Holdings Limited
Saunders International Limited
Wingara AG Limited
During the financial year ended 30 June 2019, the Company had 441 (2018: 663) transactions in investment securities. Total brokerage fees incurred during the year ended 30 June 2019 were $123,439 (2018: $244,108).
20 LARGEST SHAREHOLDERSDetails of the 20 largest ordinary shareholders and their respective holdings as at 31 July 2019.
DISTRIBUTION OF OPTIONSAnalysis of options by size of bonus option holders as at 31 July 2019.
CategoryNumber of
option holders Options held% of issued
options
1‑1,000 477 216,068 1.46%
1,001‑5,000 879 2,425,476 16.33%
5,001‑10,000 405 2,895,176 19.50%
10,001‑100,000 288 5,776,781 38.90%
100,001 and over 12 3,535,673 23.81%
Total 2,061 14,849,174 100.00%
VOTING RIGHTSAll shareholders registered on the Company’s share register have the right to vote at a general meeting of shareholders (whether present in person or by any representative, proxy or attorney) on a show of hands (one vote per shareholder) and on a poll (one vote per Share) subject to the rights and restrictions on voting which may attach to or be imposed on shares (at present there are none). Bonus options do not entitle the holders to vote in respect of that equity instrument, nor participate in dividends, when declared, until such time as the bonus options are exercised and subsequently registered as ordinary shares.
ASX LISTINGQuotation has been granted for all Ordinary Shares and Bonus Options (ASX code: NCC and NCCOB respectively) of the Company on all Member Exchanges of the Australian Securities Exchange Limited.
BUYBACKCurrently there is no intention to buy back any of the shares of the Company.
UNMARKETABLE PARCELSAs at 31 July 2019, the number of shareholdings held in less than marketable parcels was 71.
UNQUOTED SECURITIESThere are currently no unquoted securities on issue by the Company.
RESTRICTIONS ON SHARESThere are currently no restrictions attached to the shares of the Company.
For
per
sona
l use
onl
y
49
CORPORATE INFORMATION
DIRECTORSDavid Rickards (Independent Chairman)
Warwick Evans (Non-Independent Director)
Sebastian Evans (Non-Independent Director)
Sarah Williams (Independent Director) (appointed 31 January 2019)
COMPANY SECRETARYRajiv Sharma (resigned 10 July 2019)


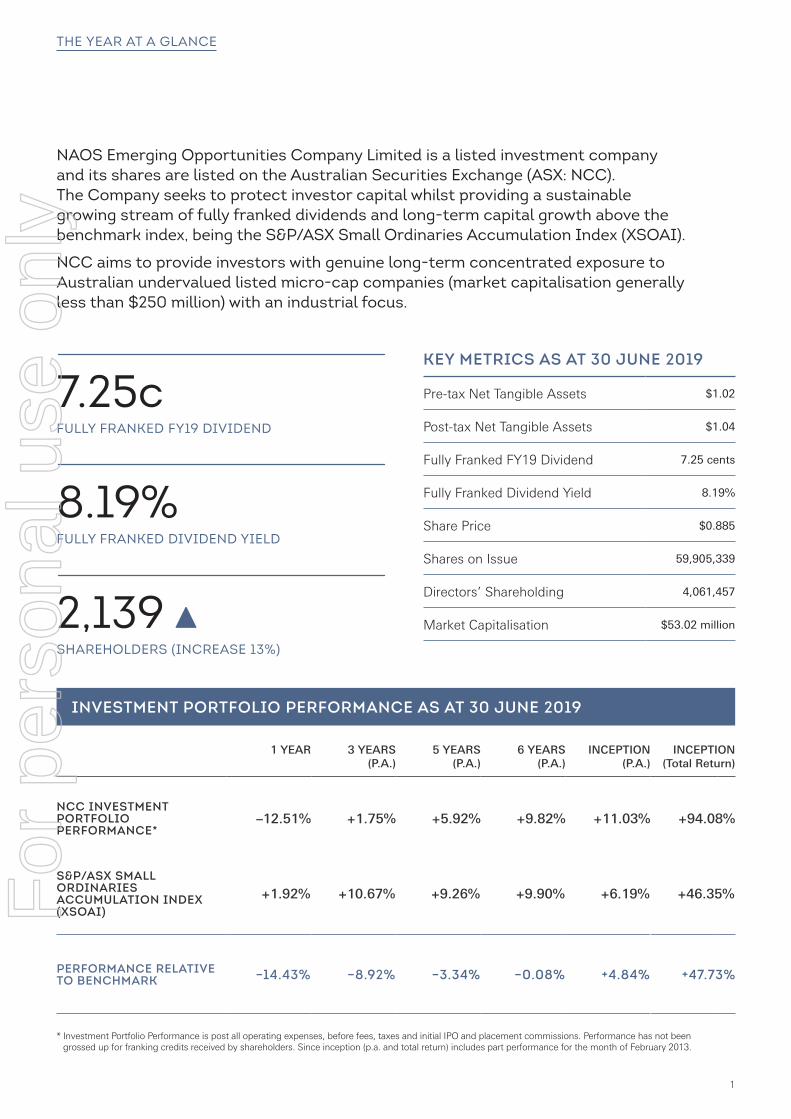


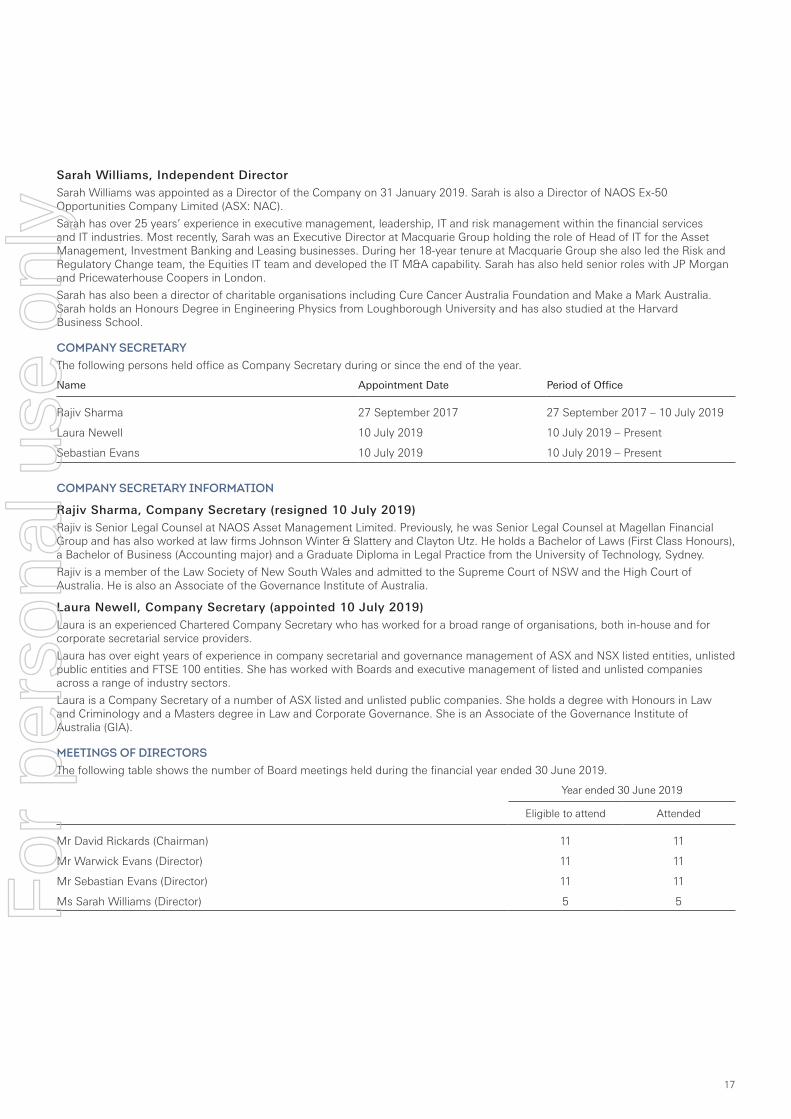
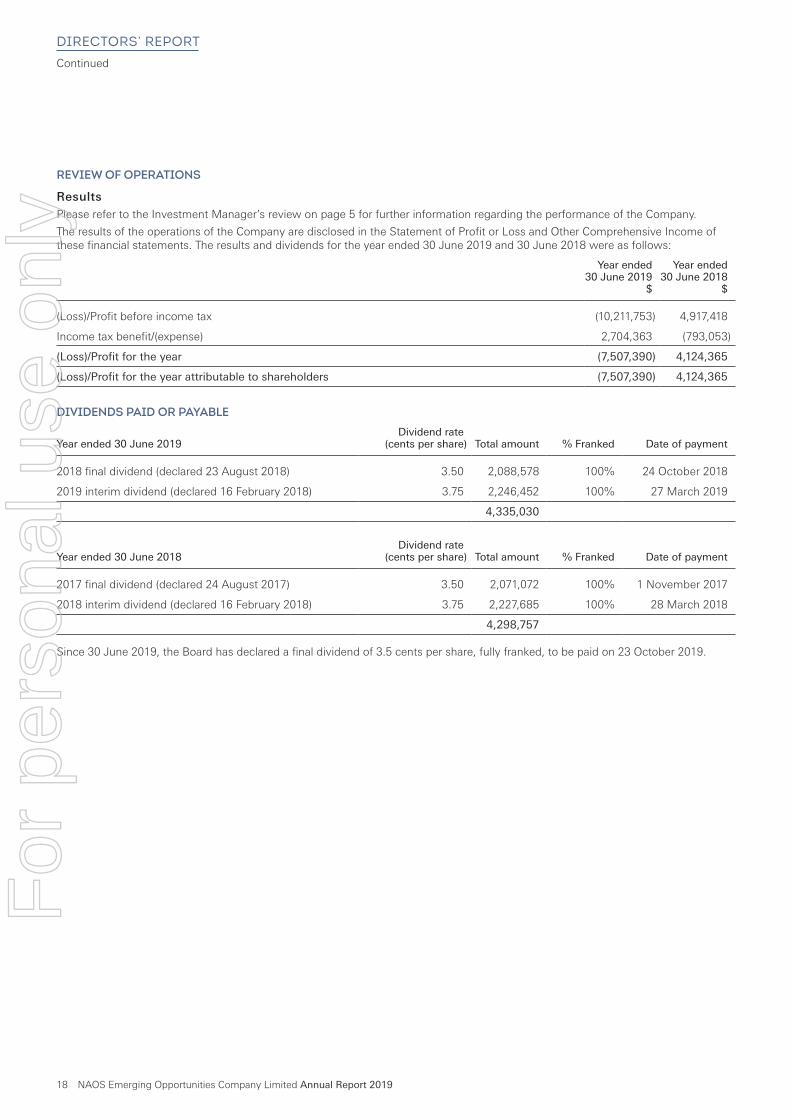


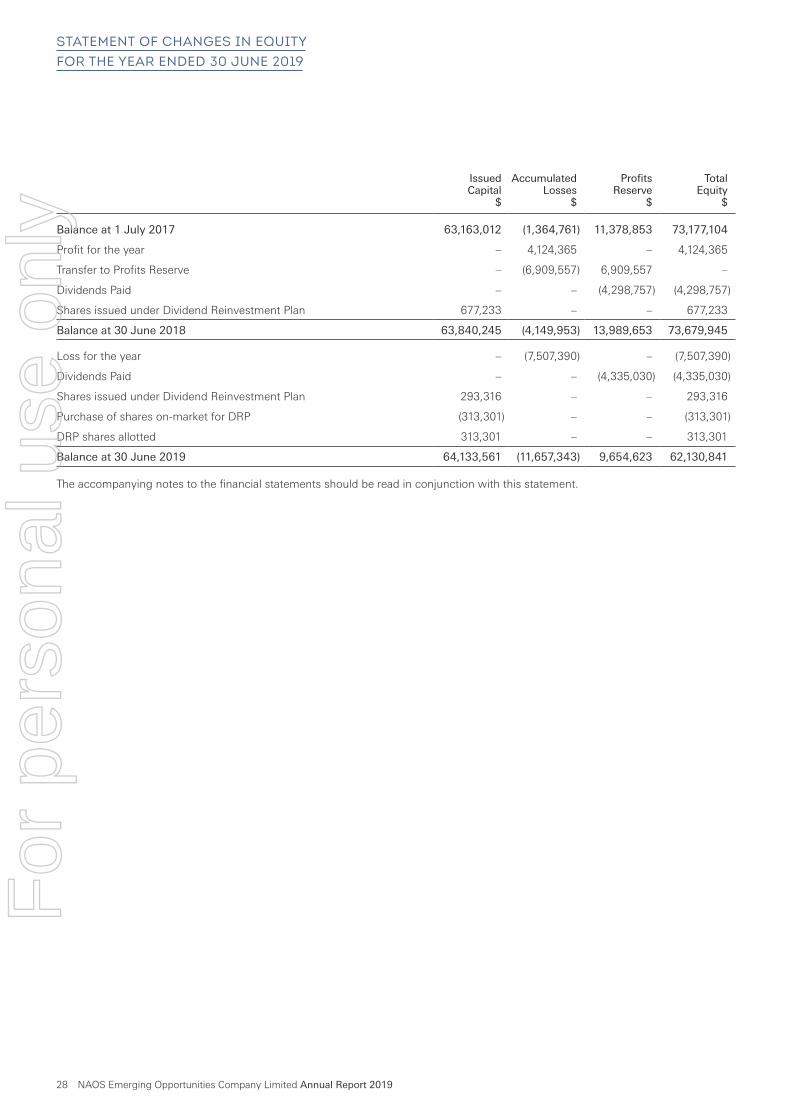


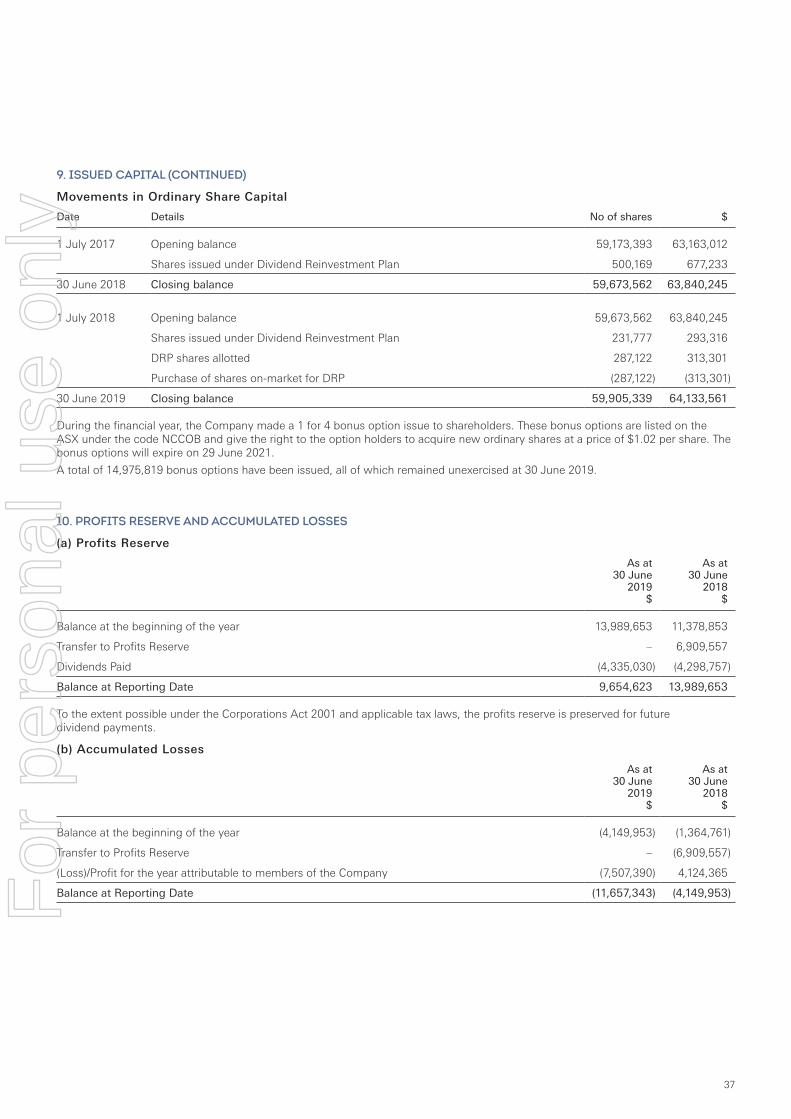


![[l5r 4e] Legend of the Five Rings 4E - Imperial Archives](https://static.documents.pub/doc/80x56/56d6cb291a28ab30169ca7a1/l5r-4e-legend-of-the-five-rings-4e-imperial-archives.jpg)


