44
Appendix 5.0-6 MICRONIZED COAL REBURN DEMONSTRATION PROJECT FOR NO X CONTROL AT THE EASTMAN KODAK CYCLONE-FIRED BOILER 15

Appendix 5.0-6
MICRONIZED COAL REBURN DEMONSTRATION PROJECTFOR NOX CONTROL AT THE EASTMAN KODAK
CYCLONE-FIRED BOILER 15

MICRONIZED COAL REBURNDEMONSTRATION PROJECT FOR NOx CONTROL
AT THE EASTMAN KODAK CYCLONE-FIRED BOILER 15
EVALUATION TEST PROGRAM RESULTS
Final Report
Prepared by
Jamal B. Mereb
CONSOL Inc.Research & Development
4000 Brownsville RoadLibrary, PA 15129-9566
January 29, 1999

Disclaimer of Warranties and Limitation of Liabilities
This report was prepared by the organization(s) named below as an account of work sponsored orcosponsored by New York State Electric & Gas Corporation (NYSEG). Neither NYSEG, nor any of theorganization(s) listed below, nor any person acting on behalf of any of them,
(A) makes any warranty or representation whatsoever, express or implied, (1) with respect to theuse of any information, apparatus, method, process or similar item disclosed in this report,including merchantability and fitness for a particular purpose; or (2) that such use does notinfringe on or interfere with privately owned rights, including any party's intellectual property; or(3) that this report is suitable to any particular user's circumstance; or
(B) assumes any responsibility for any damages or other liability whatsoever (including anyconsequential damages, even if NYSEG or any NYSEG representative has been advised ofthe possibility of such damages) resulting from your selection or use of this report or anyinformation, apparatus, method, process or similar item disclosed in this report.
(C) Reference herein to any specific commercial product, process, or service by trade name,trademark, manufacturer, or otherwise, does not necessarily constitute or imply itsendorsement, recommendation, or favoring by the United States government, or any agencythereof. The views and opinions of authors expressed herein do not necessarily state or reflectthose of the United States government or any agency thereof.
Organization(s) that Co-funded this Report:
New York State Electric & Gas CorporationCorporate Drive, Kirkwood Industrial ParkP.O. Box 5224Binghamton, NY 13902-5224Attn: James J. Harvilla
CONSOL Inc.Research & Development4000 Brownsville RoadLibrary, PA 15129-9566Attn: Robert M. Statnick
U.S. Department of EnergyFETCP.O. Box 10940Pittsburgh, PA 15236-0940Attn: James Watts
New York State Energy Research &Development AuthorityCorporate Plaza West286 Washington Avenue ExtensionAlbany, NY 12203-6399Attn: Joseph Sayer
Ordering Information: For information about ordering this report, contact James J. Harvilla, Project Manager, New YorkState Electric & Gas Corporation, Corporate Drive, Kirkwood Industrial Park, P.O. Box 5224, Binghamton, NY 13902-5224, (607) 762-8768.

i
Micronized Coal Reburn Demonstration Project for NOx Controlat the Eastman Kodak Cyclone-Fired Boiler 15
Abstract
The Micronized Coal Reburn Demonstration Project for NOx Control at the Eastman KodakCyclone-Fired Boiler 15 is part of the DOE Clean Coal Technology Program. The objectiveis to demonstrate the effectiveness of micronized coal reburning in reducing NOx emissionsto meet the compliance limit of 0.6 lb/MM Btu in the Eastman Kodak cyclone-fired Boiler 15.
A reburn system utilizing micronized coal with a fineness exceeding 90% passing 325 meshwas installed on the boiler. The evaluation test program was conducted by CONSOL andconsisted of a sequence of four test sets: 1) Diagnostic, 2) Performance, 3) Long-Term, and4) Validation. The diagnostic test program was based on the analysis of results of short-term(1-3 hours) optimization tests conducted by Babcock & Wilcox to obtain parametric data. Theperformance test program assessed a detailed set of operating variables. The long-term testprogram evaluated the long-term (two months) NOx emissions performance of the reburnsystem. The validation test program included short-term (1-3 hours) parametric testing to re-evaluate the performance of the reburn system following long-term testing.
The focus of the evaluation was on micronized coal reburning, but also included baseline (noreburn) testing for comparison. A primary consideration was given to maintaining reliableboiler operation for power generation. High-volatile bituminous Pittsburgh seam coal wasburned during the evaluation, using the same coal as both the primary and the reburn fuels.
At full boiler load (400 kpph steam), the micronized coal reburn system (at reburnstoichiometry of 0.89) reduced NOx emissions from a baseline (no reburn) of 1.36 to 0.59lb/MM Btu (57% reduction), increased the fly ash carbon content from 11% to 37%, andreduced the boiler efficiency from 87.8% to 87.3%. Long-term operation, which included boilerload fluctuation and variable utilization of the micronized coal reburn system, achieved NOx
emissions of 0.69 ± 0.03 lb/MM Btu (95% confidence), and a fly ash carbon content of 38%± 2%. The increase in the fly ash carbon content relative to baseline was partially due to alower cyclone heat input and partially due to the staged combustion. The contribution ofreburning alone (assuming no change in the cyclone heat input) to the increase in the fly ashcarbon content was estimated at less than 12% (absolute).
The effects of the reburn stoichiometry, the cyclone heat input, the cyclone (primary)stoichiometry and the final stoichiometry on NOx emissions and the fly ash carbon contentwere assessed. The reburn stoichiometry had a dominant effect on NOx emissions and asignificant effect on the fly ash carbon content, with lower reburn stoichiometries reducing NOx
emissions and increasing the fly ash carbon content. Lower cyclone heat inputs reduced NOx
emissions and increased the fly ash carbon content, attributed to lower temperatures in thecyclone zone. The effect on NOx was of minor significance with typical reburn applications(reburn stoichiometries below 0.9). At the same cyclone firing rate, the fly ash carbon content

ii
was not significantly different with or without reburning, suggesting that in reburn applications,the fly ash carbon content could be maintained at levels similar to baseline by maintaining ahigh cyclone firing rate. Variations in the primary stoichiometry between 1.02 and 1.14 hadminor effects on NOx emissions (less than 0.03 lb/MM Btu) and the fly ash carbon content (lessthan 5%). Variations in the final stoichiometry between 1.05 and 1.16 had no significanteffects on NOx emissions or the fly ash carbon content.
The optimization and the validation test results were compared. Both test programs producedconsistent results with respect to the effects of the operating variables on NOx emissions andthe fly ash carbon content. However, the validation tests generated 0.05 lb/MM Btu lower NOx
emissions and 4% higher fly ash carbon contents than the optimization tests, attributedpartially to differences in coal properties, and partially to experimental variability.

iii
Table of Contents
Abstract . . . . . . . . . . . . . . . . . . . . . . . . . . . . . . . . . . . . . . . . . . . . . . . . . . . . . . . . . . . . . . . i
Table of Contents . . . . . . . . . . . . . . . . . . . . . . . . . . . . . . . . . . . . . . . . . . . . . . . . . . . . . . iii
List of Tables . . . . . . . . . . . . . . . . . . . . . . . . . . . . . . . . . . . . . . . . . . . . . . . . . . . . . . . . . iv
List of Figures . . . . . . . . . . . . . . . . . . . . . . . . . . . . . . . . . . . . . . . . . . . . . . . . . . . . . . . . . . v
List of Abbreviations . . . . . . . . . . . . . . . . . . . . . . . . . . . . . . . . . . . . . . . . . . . . . . . . . . . vi
Objective . . . . . . . . . . . . . . . . . . . . . . . . . . . . . . . . . . . . . . . . . . . . . . . . . . . . . . . . . . . . . 1
Conclusions . . . . . . . . . . . . . . . . . . . . . . . . . . . . . . . . . . . . . . . . . . . . . . . . . . . . . . . . . . 1
Recommendations . . . . . . . . . . . . . . . . . . . . . . . . . . . . . . . . . . . . . . . . . . . . . . . . . . . . . 3
Introduction . . . . . . . . . . . . . . . . . . . . . . . . . . . . . . . . . . . . . . . . . . . . . . . . . . . . . . . . . . . 4
NOx Control by Reburning . . . . . . . . . . . . . . . . . . . . . . . . . . . . . . . . . . . . . . . . . . . . . . . 4
Kodak Boiler 15 and the Micronized Coal Reburn System . . . . . . . . . . . . . . . . . . . . 6
Evaluation Test Program . . . . . . . . . . . . . . . . . . . . . . . . . . . . . . . . . . . . . . . . . . . . . . . . 8
Diagnostic Test Program . . . . . . . . . . . . . . . . . . . . . . . . . . . . . . . . . . . . . . . . . . . . . . . 9
Performance Test Program . . . . . . . . . . . . . . . . . . . . . . . . . . . . . . . . . . . . . . . . . . . . 11
Long-Term Test Program . . . . . . . . . . . . . . . . . . . . . . . . . . . . . . . . . . . . . . . . . . . . . . 13
Validation Test Program . . . . . . . . . . . . . . . . . . . . . . . . . . . . . . . . . . . . . . . . . . . . . . . 14

iv
List of Tables
1. Test Program Coal Analyses . . . . . . . . . . . . . . . . . . . . . . . . . . . . . . . . . . . . . 18
2. Optimization Test Matrix (Tests Conducted by Babcock & Wilcox) . . . . . . 19
3. Performance Test Coal Analysis . . . . . . . . . . . . . . . . . . . . . . . . . . . . . . . . . . 20
4. Performance Test Operating Parameters . . . . . . . . . . . . . . . . . . . . . . . . . . . 21
5. Performance Test Flue Gas and Fly Ash Results . . . . . . . . . . . . . . . . . . . . . 22
6. Performance Test Boiler Efficiency Calculations . . . . . . . . . . . . . . . . . . . . . 23
7. Performance Test Summary . . . . . . . . . . . . . . . . . . . . . . . . . . . . . . . . . . . . . . 24
8. Long-Term Test Daily and 30-Day Rolling Averages . . . . . . . . . . . . . . . . . . 25
9. Validation Test Matrix . . . . . . . . . . . . . . . . . . . . . . . . . . . . . . . . . . . . . . . . . . . 27

v
List of Figures
1. Effect of Cyclone Heat Input, Optimization Testing . . . . . . . . . . . . . . . . . . . . 28
2. Effect of Reburn Stoichiometry, Optimization Testing . . . . . . . . . . . . . . . . . 29
3. Effect of Final Stoichiometry, Optimization Testing . . . . . . . . . . . . . . . . . . . 30
4. Comparing Long and Short Term NOx Reduction . . . . . . . . . . . . . . . . . . . . 31
5. Effect of Cyclone Heat Input, Validation Testing . . . . . . . . . . . . . . . . . . . . . . 32
6. Effect of Cyclone Stoichiometry, Validation Testing . . . . . . . . . . . . . . . . . . 33
7. Effect of Reburn Stoichiometry, Validation Testing . . . . . . . . . . . . . . . . . . . 34
8. Effect of Final Stoichiometry, Validation Testing . . . . . . . . . . . . . . . . . . . . . 35

vi
List of Abbreviations
ASME American Society of Mechanical EngineersBtu British Thermal UnitsC Carbon, ElementalEC Degrees CelsiusCCT Clean Coal TechnologyCO Carbon MonoxideCO2 Carbon DioxideCONSOL CONSOL Inc.Cyc CycloneDet As DeterminedDOE U.S. Department of EnergyEPA U.S. Environmental Protection AgencyESP Electrostatic PrecipitatorEF Degrees FahrenheitH Hydrogen, ElementalH2O WaterHGI Hardgrove Grindability Indexkpph Kilo (Thousand) Pounds Per Hourlb PoundsMCR Micronized Coal ReburnMM MillionMW Mega (Million) WattsN Nitrogen, ElementalN2 Nitrogen GasNO Nitric OxideNO2 Nitrogen DioxideNOx Nitrogen Oxides, NO and NO2
NYSEG New York State Electric & Gas CorporationO Oxygen, ElementalO2 Oxygen Gasppm Parts Per Millionpsig Pounds Per Square Inch, Gaugerpm Revolutions Per MinuteS Sulfur, ElementalSO2 Sulfur DioxideSR1 Stoichiometric Ratio in the Primary Combustion Zone of ReburningSR2 Stoichiometric Ratio in the Reburn Combustion Zone of ReburningSR1 Stoichiometric Ratio in the Final Combustion Zone of ReburningTemp TemperatureUARG Utility Air Regulatory Group

1
Objective
The objective of the evaluation test program conducted by CONSOL was to demonstrate theeffectiveness of micronized coal reburning in reducing NOx emissions to meet the compliancelimit of 0.6 lb/MM Btu in the Eastman Kodak cyclone-fired Boiler 15. The evaluation includedan assessment of the effects of the operating variables on NOx emissions and unburnedcarbon losses (measured as fly ash carbon content).
Conclusions
An evaluation test program was conducted by CONSOL to assess micronized coal reburningat the Eastman Kodak cyclone-fired Boiler 15 burning high-volatile bituminous Pittsburghseam coal and using the same coal as the primary and the reburn fuels. The evaluation testprogram consisted of four sequential test programs (Diagnostic, Performance, Long-Termand Validation) assessing the effects of several operating variables on NOx emissions andthe fly ash carbon content. The diagnostic test program was based on the analysis of resultsof short-term (1-3 hours) optimization tests conducted by Babcock & Wilcox to obtainparametric data. The performance test program assessed a detailed set of operatingvariables. The long-term test program evaluated the long-term (two months) NOx emissionsperformance of the reburn system. The validation test program included short-term (1-3 hours)parametric testing to re-evaluate the performance of the reburn system following long-termtesting. The following conclusions were derived.
• Micronized Coal Reburn Performance: Based on performance testing, using17.3% micronized coal reburn (reburn stoichiometry of 0.89) reduced NOx emissionsfrom a baseline (no reburn) of 1.36 to 0.59 lb/MM Btu (57% reduction), increased thefly ash carbon content from 11% to 37%, and reduced the boiler efficiency from 87.8%to 87.3%.
• Long-Term NOx Performance: Based on long-term testing, the achievable annualNOx emissions (at 15.6% reburn or stoichiometry of 0.90) were 0.69 ± 0.03 lb/MM Btu(95% confidence), corresponding to a fly ash carbon content of 38% ± 2%. Higherreburn feeds (estimated at 18.4% reburn or stoichiometry of 0.87) would be requiredfor long-term compliance with the 0.6 lb/MM Btu NOx emissions limit.
• Overall Effect of Reburn Application: The application of micronized coal reburningreduced NOx emissions and increased the fly ash carbon content. The final NOx
emissions mainly depended on the reburn stoichiometry, typically dropping below 0.6lb/MM Btu at reburn stoichiometries below 0.9 and corresponding to 40-45% carbonin the fly ash, compared to typical baseline (no reburn) NOx emissions of 1.2-1.4 lb/MMBtu and 10-15% carbon in the fly ash. The increase in the fly ash carbon contentrelative to baseline was partially due to a lower cyclone heat input resulting in lowertemperatures and partially due to the staged combustion resulting in shorter residence

2
times under oxidizing conditions. The contribution of reburning alone (assuming nochange in the cyclone heat input) to the increase in the fly ash carbon content wasestimated at less than 12% (absolute).
• Effect of Reburn Stoichiometry: The reburn stoichiometry had a dominant effect onNOx emissions and a significant effect on the fly ash carbon content. Lower reburnstoichiometries reduced NOx emissions and increased the fly ash carbon content.Based on validation testing, NOx emissions as low as 0.41 lb/MM Btu were achievableat maximum reburn utilization (reburn stoichiometry of 0.81), corresponding to 48%carbon in the fly ash.
• Effect of Cyclone Heat Input: Based on short-term optimization and validationtesting, lower cyclone heat inputs reduced NOx emissions and increased the fly ashcarbon content. That was attributed to lower temperatures in the primary (cyclone)combustion zone, which reduced thermal NOx formation and resulted in less efficientchar burnout. The effect on NOx was of minor significance with typical reburnapplications (reburn stoichiometries below 0.9). At the same cyclone heat input, the flyash carbon content was not significantly different with or without reburning, suggestingthat in reburn applications, the fly ash carbon content could be maintained at levelssimilar to baseline by maintaining a high cyclone heat input.
• Effect of Cyclone Stoichiometry: Based on short-term validation testing, variationsin the primary stoichiometry between 1.02 and 1.14 had minor effects on NOx
emissions (less than 0.03 lb/MM Btu) and the fly ash carbon content (less than 5%).
• Effect of Final Stoichiometry: Based on short-term optimization and validationtesting, variations in the final stoichiometry between 1.05 and 1.16 had no significanteffects on NOx emissions or the fly ash carbon content.
• Reproducibility: The optimization and the validation test programs producedconsistent results with respect to the effects of the operating variables on NOx
emissions and the fly ash carbon content. However, the validation tests generated 0.05lb/MM Btu lower NOx emissions and 4% higher fly ash carbon contents than theoptimization tests, attributed partially to differences in coal properties, and partially toexperimental variability.

3
Recommendations
The following recommendations are made based on the results of the micronized coal reburnevaluation test program at the Eastman Kodak cyclone-fired Boiler 15.
• Operating at a reburn stoichiometry of 0.87, which can be accomplished using acyclone stoichiometry of 1.05 and 17% micronized coal reburn, is recommended forlong-term compliance with the 0.6 lb/MM Btu NOx emissions limit.
• Exploring operation at cyclone stoichiometries below the current setting of 1.07-1.08for more efficient utilization of the reburn system is recommended. A lower cyclonestoichiometry inhibits primary NOx generation, reduces the amount of reburn fuelrequired to create the desired reburn stoichiometry and permits operation at highercyclone heat inputs. That may allow the boiler to operate at lower NOx emissions andlower fly ash carbon content. Short-term operation at cyclone stoichiometries as lowas 1.02 was tested with no adverse effects.
• Using coarser micronized coal reburn fuel should be investigated. The currentmicronizer setting produces a fineness level exceeding 90% passing 325 mesh.Coarser coal may generate similar results at a reduced cost.

4
Introduction
The Micronized Coal Reburn Demonstration Project for NOx Control at the Eastman KodakCyclone-Fired Boiler 15 is part of the DOE Clean Coal Technology Program. The goal is todemonstrate compliance with the 0.6 lb/MM Btu NOx emission limit for coal-fired cycloneboilers under Title 1 of the Clean Air Act Amendments of 1990 using combustion modificationNOx control techniques, specifically, micronized coal reburning.
A reburn system was installed on Kodak Boiler 15 to achieve the desired NOx reduction levelutilizing micronized coal with a fineness exceeding 90% passing 325 mesh. Pittsburgh seamcoals (high-volatile bituminous) were burned during the demonstration testing, with the samecoal used as both the primary fuel and the reburn fuel. Testing by CONSOL was conductedfollowing the completion of optimization testing conducted by Babcock & Wilcox to identify theoperating limits of the reburn system and to define automatic control parameters. The boilerand the operating settings utilized as a result of optimization testing were used as a referencein conducting additional tests.
The micronized coal reburn evaluation test program consists of sequential test programsconducted to assess the effects of several operating variables on NOx emissions. The testprograms are discussed following a general review of NOx control by reburning with emphasison coal reburning, and descriptions of the Kodak boiler and the reburn system.
NOx Control by Reburning
Reburning is a three-stage combustion modification process for NOx control. A primary fuelis burned under excess air conditions. Then, a secondary fuel is added downstream of theprimary flame at 10%-30% of the thermal input to create a fuel-rich reburn zone where the NOx
formed in the primary zone reacts with hydrocarbons to initiate a path favoring N2 formation.Finally, over fire air is added further downstream to complete the combustion. The reburningprocess reduces NOx emissions due to 1) reactions between NOx and hydrocarbon radicalsin the reburn zone, 2) less thermal NOx formation as part of the heat input is diverted from theprimary zone to the reburn zone, and 3) less thermal and fuel NOx formation as the primaryzone is operated at lower excess air levels than those possible without reburning. Generally,reburning can achieve NOx reductions above 50%.
The variables which effect NOx reduction by reburning include the operating variablesassociated with the three combustion stages created by the reburning process (primary,reburn and final), including the three stoichiometries. The stoichiometry is the ratio of theactual air feed to the theoretical air requirement for complete combustion of the fuel. Thefollowing is a brief review of the variables which affect NOx emissions in reburning.
The primary zone is the main combustion zone prior to reburn fuel introduction. A fuel-lean(excess air) primary stoichiometry is essential to combust the primary fuel resulting in the

5
formation of combustion products including NOx. However, a low primary stoichiometry isdesired to inhibit primary NOx generation, to reduce the amount of reburn fuel required tocreate the desired reburn stoichiometry, and to lower the oxygen carried over into the reburnzone. Primary zone residence times exceeding 0.3 seconds are desired to achieve sufficientprimary fuel burnout and to reduce oxygen carryover into the reburn zone which would reducethe reburning effectiveness in reducing NOx. Generally, reburning is less effective at lowerprimary NOx concentrations.
The reburn zone is created by introducing a reburn fuel downstream of the primary flame andis typically operated fuel-rich to promote NOx destruction and N2 formation. An optimum reburnstoichiometry for low NOx emissions typically occurs between 0.8 and 0.9. The optimumresults from a trade off under fuel-rich conditions between the enhanced destruction of NOx
and the enhanced formation of nitrogenous species (HCN and NH3) which oxidize as over fireair is added and contribute to the final NOx emissions. The effect of the reburn stoichiometrydepends on the level of mixing between the reburn fuel and the primary combustion products,with better mixing conditions creating a sharper dependence on the stoichiometry, a less fuel-rich optimum and an enhanced reburning performance. Longer reburn zone residence timesenhance NOx destruction, reaching an asymptotic level above 0.5-0.8 seconds.
The final combustion zone of reburning is created by adding over fire air to complete thecombustion under overall excess air conditions. The properties of this zone are expected tohave a minor effect on the final NOx emissions, but may affect fuel burnout and CO emissions.Specifically, high unburned fuel losses and high CO emissions may result if insufficientresidence time and poor mixing conditions are allowed in the final stage of reburning.
Reburning can utilize any hydrocarbon reburn fuel, including coal, oil or natural gas, withgenerally varying NOx reduction results. In a coal-fired boiler, coal reburning has an advantageover natural gas reburning since using the same fuel as the primary fuel and the reburn fueleliminates the need for multiple fuel utilization. Nevertheless, there is a general perception thatcoal as a reburn fuel may not be as effective as natural gas, possibly generating higher NOx
emissions and higher unburned fuel losses. That is not necessarily the case, as evident inrecent pilot-scale and full-scale studies demonstrating that coal reburning is capable ofgenerating low NOx emissions that are competitive with those achievable with natural gasreburning. The potential increase in unburned fuel losses due to the application of coalreburning can be controlled using finer grind reburn fuel, which is the motivation behind theevolution of micronized coal reburning. Micronized coal is typically defined as coal pulverizedto a size consistency of at least 80% passing 325 mesh (44 microns), corresponding to anoverall average particle diameter of 15-30 microns.
The DOE Clean Coal Technology Program included three commercial demonstrations of coalreburning. The first pulverized coal reburn demonstration was conducted at the WisconsinPower and Light 110 MW cyclone-fired Nelson Dewey Unit 2 boiler ("Demonstration of CoalReburning for Cyclone Boiler NOx Control," Report DOE/PC/89659-T16, DE94013052,

6
Babcock & Wilcox, Alliance, Ohio, 1994). The reburn system reduced NOx emissions from0.83 to 0.39 lb/MM Btu using 18% reburn fuel. Fly ash loss on ignition was maintained closeto baseline levels by increasing the reburn coal fineness from 80% to 95% passing 200 mesh.A second demonstration utilizing micronized coal reburning is in progress at the New YorkState Electric & Gas 150 MW tangentially-fired Milliken Unit 1 boiler equipped with low-NOx
burners (DeAngelo, J. G., and Chang, S. S., "Meeting the Title I NOx Requirements: AComprehensive Approach," Proceedings of the 1997 International Joint Power GenerationConference, ASME, New York, New York, Vol. 1, pp. 125-145, 1997). NOx emissionsdropped from 0.35 to 0.26 lb/MM Btu using 15% reburn fuel. A third demonstration utilizingmicronized coal reburning was completed at the Eastman Kodak Cyclone-Fired Boiler 15,and is the study reported here.
Kodak Boiler 15 and the Micronized Coal Reburn System
The Kodak Boiler 15 is a Babcock & Wilcox cyclone-fired boiler built in 1956. It is equippedwith two cyclones, eight feet in diameter each. The boiler was designed to produce steam at1425 psi and 900 EF at the superheater outlet, with a maximum continuous rating of 400 kpphof steam and a peak capacity of 440 kpph. The boiler was retrofitted with a micronized coalreburn system consisting of two mills, reburn fuel injectors, a flue gas recirculation system totransport the reburn fuel, and over fire air injectors. The reburn system was designed toprovide up to 30% of the boiler peak load heat input.
A Fuller MicroMillTM, with a product capacity of 8 kpph, is utilized to pulverize the reburn coalto a micronized size consistency exceeding 90% passing 325 mesh. The mill is a centrifugal-pneumatic pulverizer which reduces the coal size by particle-to-particle attrition. The raw fuelis fed from the main bunker though a variable speed screw feeder and is pneumaticallyconveyed into a hot primary air stream transporting a recycled coal stream for size reductionin the mill. The primary air and the coal enter the lower portion of a cone where the surfacemoisture evaporates, and the fuel is picked up in a swirling air flow created by the rotation ofan impeller and is pushed towards the wall of the cone by centrifugal forces. As the air and thefuel move up in the cone, the cross-sectional area increases and the velocity drops until themass of the coal particles prevents further movement up in the cone. That results in bands ofparticles that become denser and finer travelling up the cone. The smaller particles whichpossess higher velocities travel up through the cone, pass though the bands of the larger andslower-moving particles, and break them up as the particles collide. The particles which aresmall enough to be drawn out of the centrifugal bands pass through the impeller and into aclassifier, where the small particles pass though orifices into a collection system, and theoversized particles return to the mill feed system in a recycle stream.
The micronized reburn fuel exits the pulverizer and is distributed among eight coal injectorslocated just downstream of the slag screen, including six equally spaced across the rear walland one in each side wall. The micronized reburn fuel is transported from the micronizer to theboiler by hot recirculated flue gas (350 ± 20 EF) taken from the electrostatic precipitator outlet

7
duct. An over fire air stream of up to 140 kpph is extracted from the secondary air ducts anddistributed among four injectors equally spaced across the furnace front wall above the reburnzone.
In a cyclone-fired boiler, the heat generated from the cyclone burners must be sufficient for theash to remain in a molten state until it drains from the furnace into the slag tank. For KodakBoiler 15, the minimum boiler load required to maintain satisfactory operation is 320 kpph ofsteam or 80% of full load. Consequently, at full boiler load and 20% reburn heat input, thecyclones operate near their minimum load, and further turn down in load cannot be achievedwithout reducing the reburn fuel feed at the expense of less NOx reduction by reburning. Thus,typical boiler load variations are accomplished by maintaining the cyclone heat input at theminimum level (315-320 kpph) and adding micronized coal reburn fuel to achieve the desiredboiler load. That results in higher NOx emissions at reduced boiler loads when the reburnsystem is in use.
The micronized coal reburn system was started in January 1997. Several operationalproblems were resolved prior to the optimization testing. Several examples are listed below.
1) Micronized coal feed pluggage resulting in reburn feed interruption was mitigatedusing air lances.
2) Reburn fuel injector slagging was mitigated by improving the distribution of the reburnfuel and the transport gas among the injectors.
3) Leakage problems in the flue gas recirculation system used to transport the reburn fuelwere corrected.

8
4) Inaccurate boiler O2 measurements were corrected utilizing a six-point monitoringsystem in which three meters on each half of the boiler (east and west) would beaveraged to control the operation of the respective cyclone burner.
5) The original process control system controlled the cyclone coal feeds according to theboiler O2. This created reducing conditions in the cyclones in cases of reburn feedinterruption (e.g. coal pluggage in wet periods). A reducing environment is destructiveto the cyclone tubing and makes slag tapping more difficult due to the formation of pigiron in the slag. The control system was subsequently modified for better control of thestoichiometries. Specifically, the air-to-fuel ratio delivered to each cyclone burner wascontrolled independently of the boiler O2, and the over fire air flow was controlledbased on the boiler O2 while maintaining it above a minimum level (theoreticalrequirement).
After establishing reliable operation of the micronized coal reburn system, optimization testingby Babcock & Wilcox followed to identify the operating limits of the reburn system, to optimizeNOx reduction, and to obtain the information necessary for automatic control of the system.The results of the optimization tests and additional tests conducted by CONSOL were utilizedin evaluating the effectiveness of the reburn system in reducing NOx emissions.
Evaluation Test Program
The objective of the evaluation test program was to demonstrate the effectiveness ofmicronized coal reburning in reducing NOx emissions below the compliance limit of 0.6 lb/MMBtu in the Eastman Kodak cyclone-fired Boiler 15. The evaluation consisted of sequential testprograms conducted to assess the effects of several operating variables on NOx emissionsand unburned carbon losses (measured as fly ash carbon content). The test programsincluded the optimization testing conducted by Babcock & Wilcox, and additional testingconducted by CONSOL to further evaluate the effectiveness of the micronized coal reburnsystem in reducing NOx emissions. Although the optimization tests were not specificallydesigned to provide parametric information, the results were analyzed to assess the effectsof the operating variables on NOx emissions and the fly ash carbon content. The boiler and theoperating settings obtained from the optimization test results were used as a reference inconducting additional tests.
The evaluation test program consisted of a sequence of four series of tests: 1) Diagnostic, 2)Performance, 3) Long-Term, and 4) Validation. The diagnostic tests consisted entirely of theshort-term (1-3 hours) optimization tests conducted by Babcock & Wilcox, and the results(including coal and fly ash analyses) were utilized as reported to obtain parametric data. Theperformance tests were characterization tests assessing a detailed set of boiler variables.The long-term (two months) test assessed the long-term NOx emissions performance of thereburn system. The validation tests were short-term (1-3 hours) parametric tests re-evaluatingthe NOx performance of the reburn system following long-term testing.

9
The evaluation test program focused on micronized coal reburning, but also included baseline(no reburn) testing. The reburn and the baseline test results were compared to assess theimpact of the reburn system on NOx emissions and the fly ash carbon content. Throughout thetest program, a primary consideration was given to maintaining reliable boiler operation forpower generation. Consequently, when a set of test conditions could not maintain the requiredsteam conditions, the operating variables were adjusted accordingly or the test wasterminated as soon as sufficient data were collected.
Operating data and gas emissions measurements, including NOx emissions in lb/MM Btu,were obtained from the plant data acquisition system, collected as 15-minute averages. Theoperating variables which were evaluated in this study, with respect to their impact on NOx
emissions and the fly ash carbon content, included the cyclone heat input, and the threeprocess stoichiometries corresponding to the three combustion stages of reburning (primary,reburn and final). The stoichiometry, defined as the ratio of the actual air feed to the theoreticalair requirement for complete combustion of the fuel, was calculated from the plantmeasurements of coal and air flows. The cyclone heat input was utilized as a boiler loadparameter, calculated by multiplying the total boiler load by the fraction of the total coal fedthrough the cyclone burners.
Fly ash samples were collected from the ESP hoppers and analyzed for unburned carbon andash contents. The samples collected during the optimization and the validation tests wereobtained from the first hopper at the ESP inlet, since that allowed for sample extraction withina few minutes. The samples collected during the long-term test were composite samples fromall the ESP hoppers using a fly ash sampler operated for 30-60 minutes. During performancetesting, samples were collected using both sampling methods in addition to iso-kineticsampling using EPA Method 17 at the ESP inlet (part of ESP performance evaluation). Theresults from the three methods were subsequently compared.
High-volatile bituminous Pittsburgh seam coal was burned during the evaluation test program,using the same coal as both the primary fuel and the reburn fuel. Coal proximate and ultimateanalyses and micronized coal fineness data (for the reburn fuel), corresponding to differentphases of testing, are presented in Table 1. The coal burned during the validation testprogram was received from a different coal supplier and differed slightly in the analyses fromthose of the coal burned during the optimization, performance and long-term test programs.
Diagnostic Test Program
The goal of the diagnostic test program was to provide short-term (1-3 hours) parametric datawith respect to the effects of the boiler and the operating variables on NOx emissions and thefly ash carbon content. Constraints of time and resources necessitated using the optimizationtests conducted by Babcock & Wilcox as diagnostic tests rather than performing additionaltesting. The optimization tests were conducted during April 13-29, 1998, to identify theoperating boundaries of the micronized coal reburn system, to optimize the NOx reduction

10
performance, and to obtain the information necessary for automatic control of the system. Theresults of these tests were analyzed by CONSOL to assess the effects of several operatingvariables on NOx emissions and the fly ash carbon content. The operating variables includedthe cyclone heat input, and the two stoichiometries corresponding to the reburn and the finalcombustion stages of reburning.
A diagnostic matrix corresponding to 22 tests was obtained from the optimization test results,as presented in Table 2. The matrix excluded tests in which the air flows were unbalanced andincluded five data sets. Set 1 consisted of four baseline (no reburn) tests at various boilerloads (313-400 kpph). Set 2 consisted of four reburn tests representing normal operation inwhich the variation in the total boiler load was accomplished by maintaining the cyclone heatinput near the minimum level (315-320 kpph) and adding micronized coal reburn fuel toachieve the desired boiler load. Set 3 consisted of four reburn tests in which the total boilerload was maintained near the full level (400 kpph nominal), and the micronized coal reburnfeed was varied (up to 23% of the total heat input). Set 4 consisted of seven tests in which thecyclone and the reburn heat inputs were unchanged, and the mode of over fire air introductionwas varied to create various mixing patterns in the final stage of reburning. Set 5 consistedof two tests in which the over fire air flow was varied to assess variations in the finalstoichiometry.
The diagnostic matrix (Table 2) was analyzed to assess the effects of the cyclone heat input,the reburn stoichiometry and the final stoichiometry on NOx emissions and the fly ash carboncontent. The available information was insufficient to assess the effect of the primarystoichiometry. The effect of mixing in the final stage of reburning (Set 4) was assumed to beof minor significance relative to the effects of the other assessed variables.
The following observations were derived based on the results presented in Table 2. Underbaseline (no reburn) conditions (Set 1), reducing the boiler load generated lower NOx
emissions and higher fly ash carbon content. With reburning, increasing the contribution of thereburn fuel (Sets 2 and 3) reduced NOx emissions and increased the fly ash carbon content.The effect of reburning on the fly ash carbon content was more dramatic when higher reburnfuel feeds accompanied a decrease in the cyclone heat input (Set 3), compared to no changein the cyclone heat input (Set 2). Furthermore, in all three cases (Sets 1, 2 and 3), the increasein the fly ash carbon content was accompanied by a drop in the primary (cyclone)stoichiometry. Therefore, with the application of micronized coal reburning, three factors mighthave contributed to the increase in the fly ash carbon content relative to the baseline level: 1)lower cyclone heat inputs resulting in lower temperatures in the primary (cyclone) combustionzone, 2) lower primary stoichiometries resulting in lower excess O2 levels, and 3) fuel-stagedcombustion (reburning) resulting in shorter residence times under oxidizing conditions. In thereburn tests of Table 2, the cyclone stoichiometry generally varied in a range between 1.05and 1.09, which was not sufficiently large to assess the effect of this variable. The relativesignificance of the other two factors, namely, the cyclone heat input and the reburn level(measured as the reburn stoichiometry), was further investigated.

11
The effects of varying the cyclone heat input on NOx emissions and the fly ash carbon contentwere assessed for baseline (no reburn) and reburn applications (reburn stoichiometriesbetween 0.85 and 1.03) based on the optimization test results (Table 2). A graphicalpresentation of the results is shown in Figure 1. Lower cyclone heat inputs reduced NOx
emissions and increased the fly ash carbon content, attributed to lower temperatures in theprimary (cyclone) combustion zone resulting in less thermal NOx formation and less efficientchar burnout. The effect on NOx emissions was less significant with greater applications ofreburning corresponding to lower reburn stoichiometries. At the same cyclone heat input, thefly ash carbon content was not very different with or without reburning, as suggested by theclose proximity of the curves. Consequently, with reburning it may be possible to maintain thefly ash carbon content close to baseline levels by maintaining a high cyclone heat input. Thisconcept was tested during the validation test program.
The effects of varying the reburn stoichiometry between 0.82 and 1.03 on NOx emissions andthe fly ash carbon content were assessed based on the optimization test results (Table 2), asshown in Figure 2. The reburn stoichiometry had a dominant effect on NOx emissions, with nosignificant dependence on the cyclone heat input. NOx emissions dropped below 0.6 lb/MMBtu at reburn stoichiometries below 0.88. Furthermore, the reburn stoichiometry had asignificant effect on the fly ash carbon content and the effect strongly depended on the cycloneheat input. Within a narrow range of cyclone heat inputs (315-325 kpph), the sensitivity of thefly ash carbon content to variations in the reburn stoichiometry (slope of linear fit) wasestimated at -59. For example, a drop in the stoichiometry from 1.08 (no reburn) to 0.88(typical reburn) would increase the fly ash carbon content by 12% (absolute), which was theestimated increase attributed to staged combustion in reburning.
The effects of varying the final stoichiometry between 1.11 and 1.22 on NOx emissions andthe fly ash carbon content were assessed based on the optimization test results (Table 2), asshown in Figure 3. The reburn stoichiometry varied within a relatively narrow range between0.84 and 0.86. The final stoichiometry had minor effects on both NOx emissions and the fly ashcarbon content. The weak trends observed in Figure 3 were attributed to the uncontrolledvariations of other operating variables, such as the reburn stoichiometry.
Performance Test Program
The performance test program consisted of characterization tests assessing a detailed setof boiler and combustion parameters. The goal was to evaluate the impact of the micronizedcoal reburn system on boiler performance, including NOx emissions, the fly ash carbon contentand the boiler efficiency. The operating conditions for the performance tests were normaloperating conditions at full boiler load (400 kpph) based on the optimization test results andthe plant operating experience using the reburn system. Specifically, the reburn performancetest conditions were set to achieve NOx emissions below the compliance limit of 0.6 lb/MMBtu while maintaining the required steam conditions and reliable boiler operation. Thebaseline performance test conditions were set by turning off the micronized coal reburn feed

12
and increasing the cyclone coal feed to achieve full boiler load.
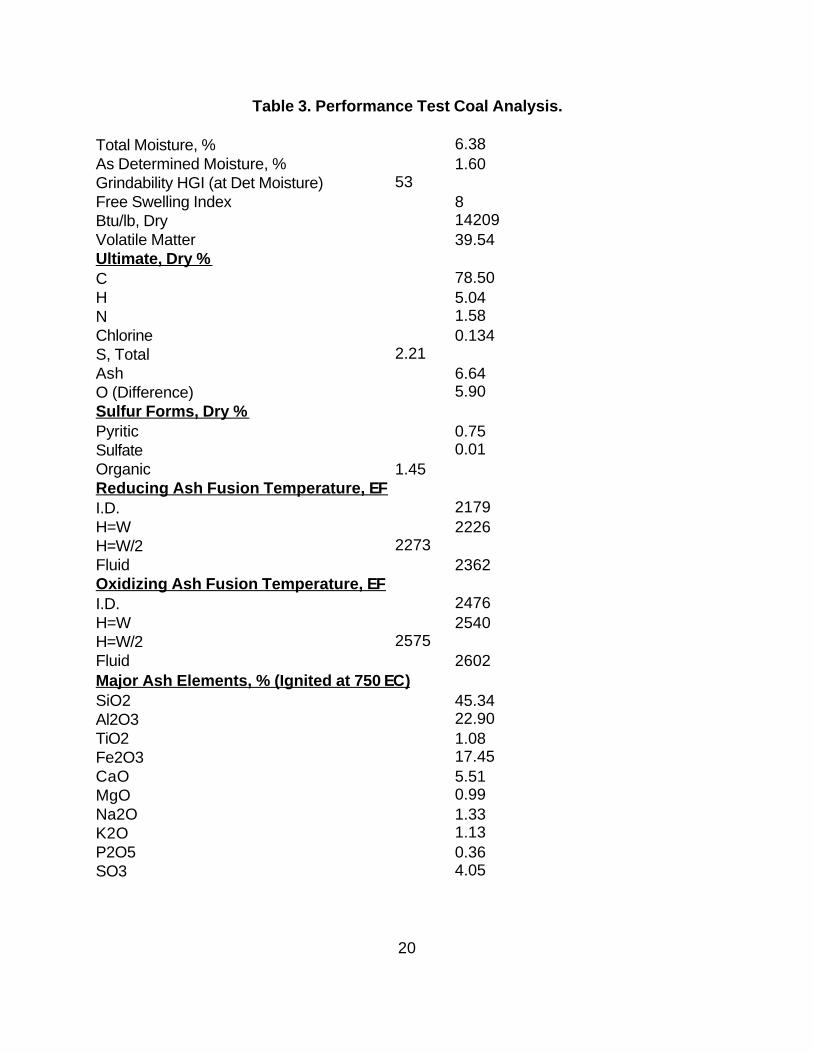
The performance tests were conducted during June 2-4, 1998, and included four micronizedcoal reburn and four baseline (no reburn) tests conducted over a three-day period. Dailycrushed coal samples were collected and analyzed for heating value, moisture, and proximateand ultimate compositions (Table 1). The daily coal samples were combined into a compositesample and detailed analyses were performed, including ash elemental composition and ashfusion temperatures, as presented in Table 3. Micronized coal samples were also collectedfor each reburn test and analyzed for heating value, moisture, proximate and ultimatecompositions, and fineness (wet screen) sizing (Table 1). Each performance test was twohours in duration (data collection period) and was coupled with an ESP performanceevaluation test which included EPA Method 17 sampling at the ESP inlet. During eachperformance test, three fly ash samples were collected: 1) a grab sample from the first hopperat the ESP inlet, 2) a composite sample from all ESP hoppers using a fly ash sampleroperated for 30-60 minutes, and 3) an iso-kinetic sample collected using EPA Method 17 atthe ESP inlet. The fly ash samples were analyzed for unburned carbon and ash contents.
The operating parameters, and the flue gas and fly ash results for the eight performance tests(four reburn and four baseline) are presented in Tables 4 and 5, respectively. The carboncontents of fly ash samples collected from the first ESP hopper (38-44% for reburn and 12-17% for baseline) were not significantly different from those collected from all ESP hoppers(37-42% for reburn and 13-18% for baseline excluding Test 1), but were higher than thosecollected iso-kinetically (34-39% for reburn and 7-15% for baseline). There was insufficientinformation to further assess these differences.
The boiler efficiency calculations, presented in Table 6, were based on the ASMEAbbreviated Efficiency Test and were conducted as part of the performance test program.Unburned carbon losses were calculated based on the assumption that under baseline (noreburn) conditions, 20% of the ash entering the cyclone escaped the furnace as fly ash and80% was tapped as bottom ash slag, whereas under reburning conditions, the split was 40%as fly ash and 60% as bottom ash. These assumptions match the average values calculatedin Table 5. The bottom ash slag was assumed to contain 1% unburned carbon. Micronizedcoal reburning reduced the boiler efficiency from a baseline of 87.7-88.0% to 86.9-87.5%(less than 1.3% drop).
The results of the four reburn and the four baseline performance tests were averaged andcompared, as shown in Table 7. Using 17.3% micronized coal reburn (reburn stoichiometryof 0.89) reduced NOx emissions from a baseline (no reburn) of 1.36 to 0.59 lb/MM Btu,corresponding to a reduction of 57%, and increased the fly ash carbon content from 11% to37%. The reburn system reduced the boiler efficiency from a baseline of 87.8% to 87.3%,mainly due to the increase in the fly ash carbon content.
13
Long-Term Test Program
The purpose of the long-term test program was to estimate the achievable annual NOx
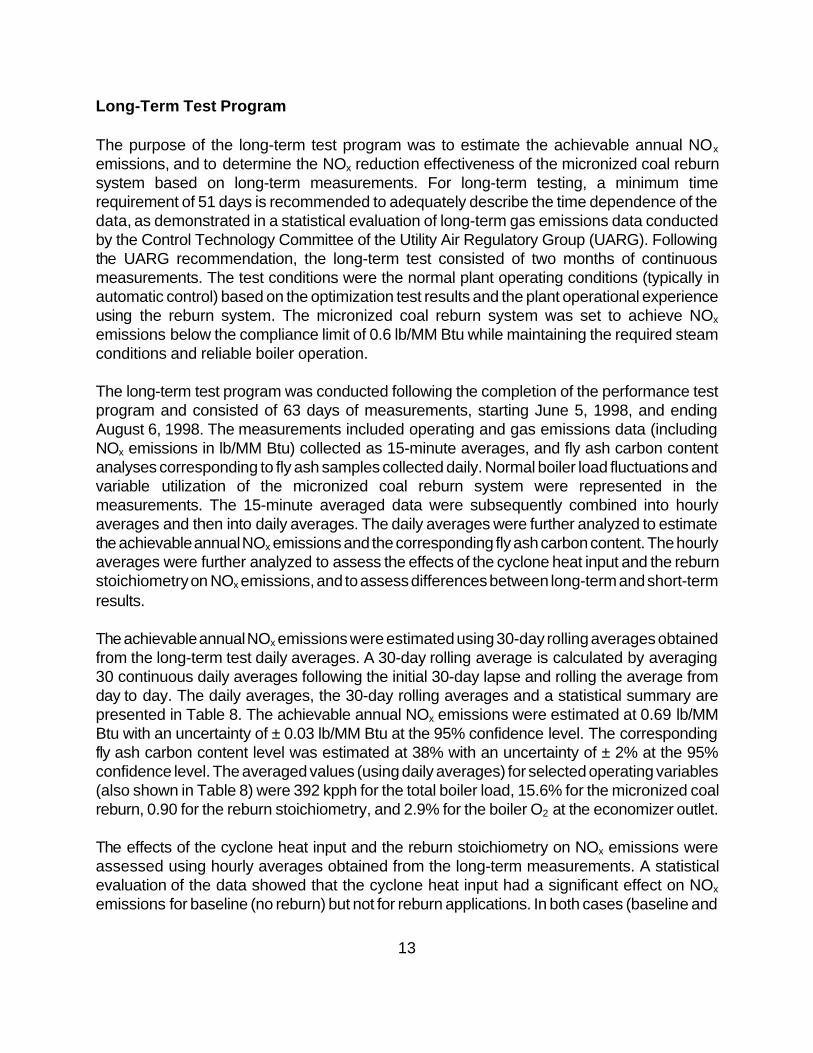
emissions, and to determine the NOx reduction effectiveness of the micronized coal reburnsystem based on long-term measurements. For long-term testing, a minimum timerequirement of 51 days is recommended to adequately describe the time dependence of thedata, as demonstrated in a statistical evaluation of long-term gas emissions data conductedby the Control Technology Committee of the Utility Air Regulatory Group (UARG). Followingthe UARG recommendation, the long-term test consisted of two months of continuousmeasurements. The test conditions were the normal plant operating conditions (typically inautomatic control) based on the optimization test results and the plant operational experienceusing the reburn system. The micronized coal reburn system was set to achieve NOx
emissions below the compliance limit of 0.6 lb/MM Btu while maintaining the required steamconditions and reliable boiler operation.
The long-term test program was conducted following the completion of the performance testprogram and consisted of 63 days of measurements, starting June 5, 1998, and endingAugust 6, 1998. The measurements included operating and gas emissions data (includingNOx emissions in lb/MM Btu) collected as 15-minute averages, and fly ash carbon contentanalyses corresponding to fly ash samples collected daily. Normal boiler load fluctuations andvariable utilization of the micronized coal reburn system were represented in themeasurements. The 15-minute averaged data were subsequently combined into hourlyaverages and then into daily averages. The daily averages were further analyzed to estimatethe achievable annual NOx emissions and the corresponding fly ash carbon content. The hourlyaverages were further analyzed to assess the effects of the cyclone heat input and the reburnstoichiometry on NOx emissions, and to assess differences between long-term and short-termresults.
The achievable annual NOx emissions were estimated using 30-day rolling averages obtainedfrom the long-term test daily averages. A 30-day rolling average is calculated by averaging30 continuous daily averages following the initial 30-day lapse and rolling the average fromday to day. The daily averages, the 30-day rolling averages and a statistical summary arepresented in Table 8. The achievable annual NOx emissions were estimated at 0.69 lb/MMBtu with an uncertainty of ± 0.03 lb/MM Btu at the 95% confidence level. The correspondingfly ash carbon content level was estimated at 38% with an uncertainty of ± 2% at the 95%confidence level. The averaged values (using daily averages) for selected operating variables(also shown in Table 8) were 392 kpph for the total boiler load, 15.6% for the micronized coalreburn, 0.90 for the reburn stoichiometry, and 2.9% for the boiler O2 at the economizer outlet.
The effects of the cyclone heat input and the reburn stoichiometry on NOx emissions wereassessed using hourly averages obtained from the long-term measurements. A statisticalevaluation of the data showed that the cyclone heat input had a significant effect on NOx
emissions for baseline (no reburn) but not for reburn applications. In both cases (baseline and

14
reburn), the reburn stoichiometry had a significant effect on NOx emissions. It should be notedthat for baseline, the reburn stoichiometry is also the cyclone (primary) stoichiometry, and thecyclone heat input is also the total boiler load. The data were grouped into three data sets forfurther evaluation, including 25 baseline cases at 320-340 kpph cyclone heat input, 41baseline cases at 390-410 kpph cyclone heat input and 1175 reburn cases at 310-410 kpphcyclone heat input. A graphical presentation of the results showing variations of NOx
emissions as a function of the reburn stoichiometry for the three data sets (shown as curve fitlines) is presented in Figure 4. Also shown in Figure 4 are the short-term optimization testresults (shown as data points). A good agreement between the long-term and the short-termresults was obtained.
Long-term compliance with the 0.6 lb/MM Btu NOx emissions limit requires a target of 0.57lb/MM Btu (accounting for 95% confidence level of 0.03 lb/MM Btu), which can be achievedat reburn stoichiometries below 0.87 (Figure 4). The required fraction of the total coal feed asmicronized coal reburn can be calculated by taking the ratio of reburn to cyclonestoichiometries and subtracting from one. For example, with a cyclone stoichiometry of 1.066(average from long-term test), reburn feeds above 18.4% would be expected to achieve thedesired goal.
Validation Test Program
The goal of the validation test program was to validate the previous results by re-assessingthe effects of selected process variables on NOx emissions and the fly ash carbon content,and to characterize any changes that might have occurred during the long-term test. Thevalidation test program was conducted following the completion of the long-term test toprovide short-term (1-3 hours) parametric data with respect to the effects of the variables ofinterest.
The validation test program was conducted during September 21-23, 1998, and consistedof 18 tests, as shown in Table 9. The duplicate fly ash analyses (for carbon content) shown inTable 9 corresponded to single samples, and averaged values were used in subsequentevaluations. The validation test matrix included a reference test, six test sets (Sets 1-6)assessing the effects of the variables of interest, and five miscellaneous reburn tests. Thereference test was conducted under typical operating conditions using the micronized coalreburn system, and the test conditions were similar to those utilized during the reburnperformance test program. The six test sets assessed the effects of the cyclone heat input withand without reburn (Sets 1 and 2, respectively), the cyclone (primary) stoichiometry with andwithout co-variation of the cyclone heat input (Sets 3 and 4, respectively), the reburnstoichiometry (Set 5) and the final stoichiometry (Set 6). Each set consisted of two testscorresponding to low and high levels of the variable of interest, relative to the reference test.Overall, the effects of the cyclone heat input, and the three process stoichiometriescorresponding to the three combustion stages of reburning (primary, reburn and final) on NOx
emissions and the fly ash carbon content were assessed.

15
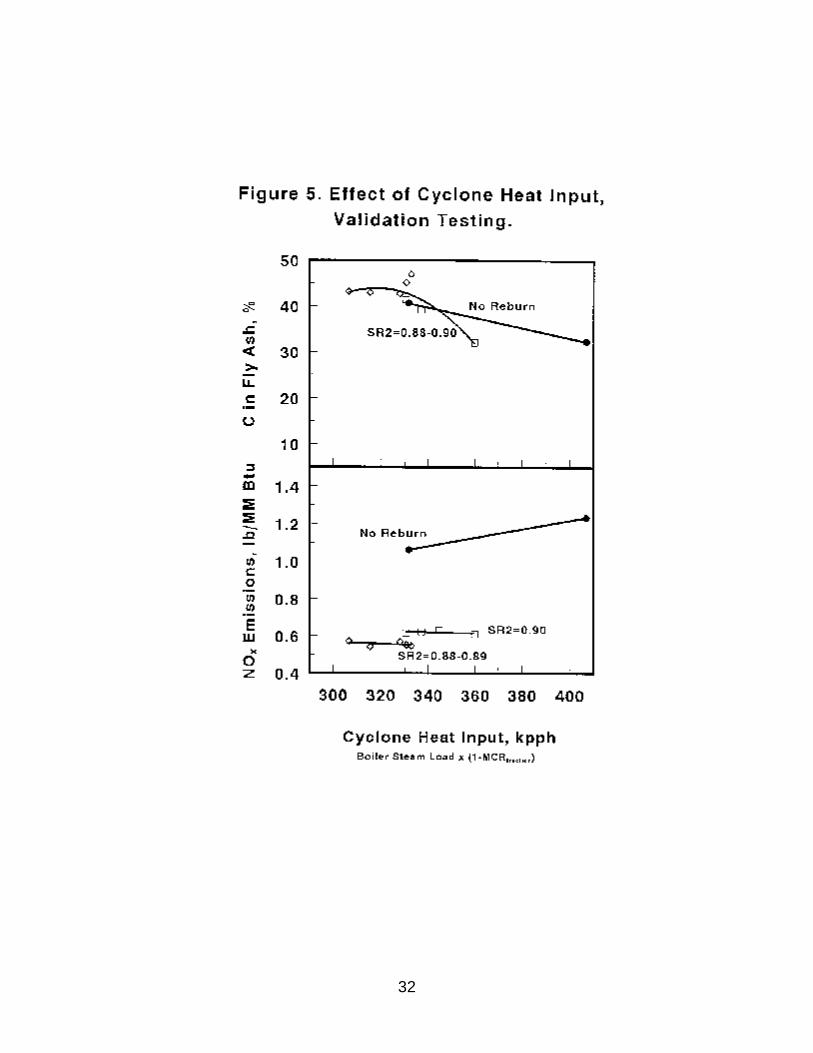
The effects of varying the cyclone heat input on NOx emissions and the fly ash carbon contentwere assessed for baseline (no reburn) and reburn applications at two reburn stoichiometrylevels (0.88-0.89 and 0.90) based on the validation test results (Table 9). A graphicalpresentation of the results is shown in Figure 5. The two reburn stoichiometry levels (0.88-0.89and 0.90) produced different NOx emissions, but no obvious differences in the fly ash carboncontent. Without reburning, lower cyclone heat inputs reduced NOx emissions and increasedthe fly ash carbon content, in agreement with the optimization test results. With reburning, thecyclone heat input had no significant effect on NOx emissions and a possible effect on the flyash carbon content. At the same cyclone heat input of about 330 kpph, the fly ash carboncontent with and without reburning was not significantly different, with values at 41-47% and41%, respectively. The increase in the fly ash carbon content due to micronized coal reburningwas estimated at less than 6% (absolute) relative to the baseline level, as compared to anestimate of less than 12% obtained from the optimization test results. A reburn test in whichthe cyclone heat input was maintained relatively high at 360 kpph (Set 1 in Table 9, alsoshown in Figure 5) generated a fly ash carbon content of 32%, which was similar to thebaseline levels of 32-41%. The results suggested that in applying the reburn system, it mightbe possible to maintain the fly ash carbon content low relative to baseline by maintaining highcyclone coal feeds.
The effects of varying the cyclone (primary) stoichiometry between 1.02 and 1.14 on NOx
emissions and the fly ash carbon content were assessed at two reburn stoichiometry levels(0.88-0.89 and 0.90) based on the validation test results (Table 9), as shown in Figure 6.Again, the two reburn stoichiometry levels (0.88-0.89 and 0.90) produced different NOx
emissions, but no obvious differences in the fly ash carbon content. Within the tested range,the cyclone stoichiometry had no significant effect on NOx emissions (less than 0.03 lb/MMBtu) and a minor effect on the fly ash carbon content. Specifically, lower stoichiometriesgenerated higher fly ash carbon contents. The sensitivity of the fly ash carbon content tovariations in the cyclone stoichiometry (slope of linear fit) was estimated at -44. For example,reducing the stoichiometry from 1.08 (typical setting) to 1.02 (low setting) increased the fly ashcarbon content less than 3% (absolute).
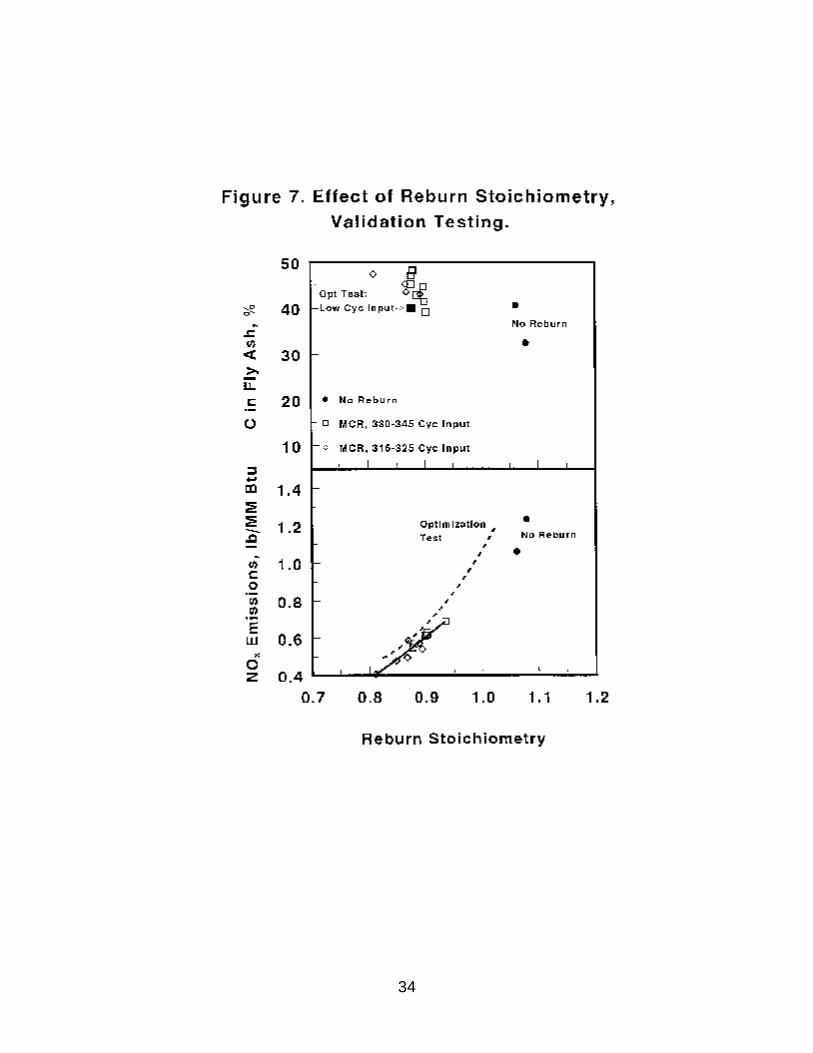
The effects of varying the reburn stoichiometry on NOx emissions and the fly ash carboncontent were assessed based on the validation test results (Table 9), as shown in Figure 7.Also shown in Figure 7 are some of the optimization test results. The reburn stoichiometry hada dominant effect on NOx emissions, in agreement with the optimization test results. However,the validation tests generated about 0.05 lb/MM Btu lower NOx emissions than theoptimization tests. The range of tested reburn stoichiometries (generally 0.87-0.90) was notsufficiently large to assess the effect on the fly ash carbon content (between 39% and 48%).Within a narrow range of cyclone heat inputs (315-325 kpph) and at the average reburnstoichiometry of 0.88, the average fly ash carbon content was 44% for the validation tests and40% (estimated from line fit in Figure 2) for the optimization tests. Therefore, the validationtests generated 4% higher fly ash carbon contents than the optimization tests. The differencesin the results (NOx emissions and the fly ash carbon content) between the validation and the

16
optimization test programs were partially due to differences in the coal properties and partiallydue to experimental variability between the two test periods. Specifically, the coal burnedduring the two test periods differed slightly in the analyses (Table 1), and the two testprograms were conducted differently as previously discussed.
The NOx reduction limit of the micronized coal reburn system was explored by utilizing a lowcyclone stoichiometry of 1.03 and a maximum reburn coal feed (8 kpph) to achieve a reburnstoichiometry of 0.81. NOx emissions dropped to 0.41 lb/MM Btu, corresponding to a fly ashcarbon content of 48%, which was not significantly higher than the typical level of 41-48%achieved at moderate reburn applications and corresponding to a reburn stoichiometry of0.88.
The effects of varying the final stoichiometry between 1.05 and 1.16 on NOx emissions andthe fly ash carbon content were assessed at a reburn stoichiometry level of 0.88-0.89 basedon the validation test results (Table 9), as shown in Figure 8. Variations in the finalstoichiometry had no significant effects on either NOx emissions or the fly ash carbon content,in agreement with the optimization test results.

17
TABLES AND FIGURES

18
Table 1. Test Program Coal Analyses.
Date Coal Total As Det Dry Dry Dry Dry Dry Dry Dry Sieve Mesh Size, %H2O H2O VM C H N S Ash -400 -325 -200% % % Btu/lb % % % % % % % %
Optimization Testing4/20/97 6.20 39.30 14184 78.80 5.20 1.50 2.40 6.90 91.7 99.0
Performance and Long-Term Testing6/2/98 Raw 5.89 1.74 39.87 14227 77.96 5.25 1.59 2.19 6.676/3/98 Raw 5.67 1.58 39.65 14206 78.71 5.25 1.58 2.19 6.666/4/98 Raw 7.62 1.53 39.96 14202 78.63 5.12 1.58 2.22 6.686/2/98 MCR 1 0.54 39.16 14116 78.13 5.13 1.57 2.21 6.79 87.7 94.1 98.96/2/98 MCR 2 0.62 39.12 14149 78.52 5.09 1.52 2.24 6.83 88.0 94.0 98.96/3/98 MCR 3 0.63 39.39 14150 78.33 4.81 1.49 2.27 6.72 86.8 94.1 98.86/3/98 MCR 4 0.58 39.52 14112 78.57 4.90 1.51 2.29 6.88 87.6 93.1 98.8
Validation Testing9/98 Raw 1.15 38.52 14015 78.51 4.99 1.53 2.02 7.60

19
Table 2. Optimization Test Matrix (Tests Conducted by Babcock & Wilcox).
Boiler MCR Cyc O2 SR1 SR2 SR3 NOx FlyLoad Input lb/ Ashkpph % kpph % MMBtu % C
Set 1: Baseline (No Reburn) Tests, Variable Boiler Load400 0.0 400 3.25 1.12 1.12 1.19 1.38 12.4 373 0.0 373 3.35 1.09 1.09 1.16 1.23 16.5 342 0.0 342 3.10 1.05 1.05 1.13 1.16 22.3 313 0.0 313 3.60 1.05 1.05 1.13 1.06 38.6
Set 2: Reburning Tests, Variable Boiler Load and Constant Cyclone Heat Input398 20.0 319 3.85 1.07 0.86 1.18 0.56 41.6 375 15.0 319 3.35 1.06 0.90 1.12 0.68 38.4 357 10.9 318 3.12 1.06 0.95 1.11 0.84 35.4 338 6.7 315 3.50 1.05 0.98 1.12 1.00 33.3
Set 3: Reburning Tests, Constant Boiler Load and Variable Cyclone Heat Input399 5.7 376 2.75 1.09 1.03 1.13 1.19 20.6 398 11.5 352 2.70 1.08 0.96 1.12 0.87 28.1 403 16.7 336 2.75 1.06 0.89 1.11 0.62 38.7 414 22.6 320 2.65 1.06 0.82 1.10 0.50 41.9
Set 4: Reburning Tests, Variable Over Fire Air Mixing Parameters400 19.4 323 3.55 1.07 0.86 1.13 0.57 41.5 399 19.5 321 3.80 1.05 0.85 1.16 0.54 44.2 400 19.4 322 3.90 1.05 0.85 1.16 0.55 47.5 401 19.4 323 3.50 1.03 0.83 1.14 0.52 37.5 402 19.5 323 3.75 1.05 0.84 1.16 0.52 43.2 399 19.7 321 3.75 1.05 0.85 1.16 0.55 44.2 398 20.0 319 3.85 1.07 0.86 1.18 0.56 36.7
Set 5: Reburning Tests, Variable Over Fire Air Flow399 19.9 320 4.40 1.05 0.84 1.22 0.57 42.8 402 19.9 322 2.70 1.07 0.86 1.11 0.54 40.3
Micronized Coal Reburn Recommended Setting398 19.8 319 3.25 1.05 0.85 1.11 0.51 37.9
20
Table 3. Performance Test Coal Analysis.
Total Moisture, % 6.38As Determined Moisture, % 1.60Grindability HGI (at Det Moisture) 53Free Swelling Index 8Btu/lb, Dry 14209Volatile Matter 39.54Ultimate, Dry %C 78.50H 5.04N 1.58Chlorine 0.134S, Total 2.21Ash 6.64O (Difference) 5.90Sulfur Forms, Dry %Pyritic 0.75Sulfate 0.01Organic 1.45Reducing Ash Fusion Temperature, EFI.D. 2179H=W 2226H=W/2 2273Fluid 2362Oxidizing Ash Fusion Temperature, EFI.D. 2476H=W 2540H=W/2 2575Fluid 2602Major Ash Elements, % (Ignited at 750 EC)SiO2 45.34Al2O3 22.90TiO2 1.08Fe2O3 17.45CaO 5.51MgO 0.99Na2O 1.33K2O 1.13P2O5 0.36SO3 4.05

21
Table 4. Performance Test Operating Parameters.
Micronized Coal Reburn Test Baseline (No Reburn) TestPerformance Test 1 2 3 4 1 2 3 4Test Date 6/2/98 6/2/98 6/3/98 6/3/98 6/3/98 6/4/98 6/4/98 6/4/98Test Start Time 10:30 13:30 08:30 11:45 17:00 08:15 10:30 15:00Test End time 12:30 15:30 10:30 13:45 19:00 10:15 12:30 17:00Boiler Load, kpph Steam 400 400 398 402 400 403 404 402Cyclone Coal Flow, kpph 30.5 30.5 29.7 29.9 36.8 37.4 37.6 36.8MCR Flow, kpph 6.1 6.1 6.5 6.7 0.0 0.0 0.0 0.0Micronized Coal Reburn, % 16.7 16.6 17.9 18.2 0.0 0.0 0.0 0.0Cyclone Heat Input, kpph Steam 333 334 327 329 400 403 404 402Cyclone Air Flow, kpph 328 328 321 324 402 409 410 403Over Fire Air Flow, kpph 72 68 69 67 22 22 22 21Calculated East Air-to-Fuel Ratio -- 11.0 11.0 11.0 11.0 11.0 11.0 10.9Calculated West Air-to-Fuel Ratio -- 10.7 10.7 10.7 10.8 11.0 10.8 10.7Cyclone Stoichiometry 1.08 1.08 1.08 1.08 1.09 1.09 1.09 1.09Reburn Stoichiometry 0.90 0.90 0.89 0.89 1.09 1.09 1.09 1.09Final Stoichiometry 1.10 1.08 1.08 1.07 1.15 1.15 1.15 1.15MCR Transport Gas Flow, kpph 16.3 16.2 16.5 16.5 17.2 17.9 17.9 17.9MCR Mill Current, Ampere 186 186 190 193 -- -- -- --MCR Feeder Motor Speed, rpm -- 646 690 709 -- -- -- --MCR Classifier Outlet Duct Temp, EF 300 302 289 285 330 324 329 330Feed Water Temperature, EF 407 406 407 407 406 409 409 408Back-Up Attemperator Water, kpph 0.0 0.0 0.0 0.0 23.6 25.8 26.9 22.1Secondary Superheater Press, psig 1425 1429 1427 1430 1422 1426 1426 1426Primary Super Heater Outlet Temp, EF 742 736 732 730 770 789 790 770Gas Temp at Economizer Outlet, EF 701 680 693 681 738 760 779 718Gas Temp at Air Heater Outlet, EF 342 341 335 335 354 358 368 355Opacity, % 10.0 10.4 7.5 9.0 8.3 11.4 14.4 4.2

22
Table 5. Performance Test Flue Gas and Fly Ash Results.
Micronized Coal Reburn Test Baseline (No Reburn) TestPerformance Test 1 2 3 4 1 2 3 4
Flue Gas EmissionsBoiler O2, % 2.5 2.5 2.5 2.5 3.2 3.2 3.0 3.4Plant CO2, % 13.3 13.2 13.6 13.5 13.0 13.2 13.4 13.2CO, ppm 30 42 39 41 2 4 0 1Gas H2O, % 7.5 8.8 8.1 8 8.1 7.2 7.7 7.7Plant NOx, ppm 354 351 382 382 821 870 877 777NOx, lb/MM Btu 0.57 0.57 0.61 0.61 1.35 1.42 1.41 1.27SO2, lb/MM Btu 2.72 2.88 2.97 2.97 2.95 2.91 2.92 2.92
Fly Ash EmissionsESP Inlet Particulate Loading, lb/h 1493 1756 1361 1400 526 468 520 611Fly Ash, % Inlet Ash 38.8 45.6 38.3 37.8 18.8 17.7 19.3 22.3
Fly Ash Analysis: Iso-Kinetic Sampling at the ESP Inlet%C 38.95 37.49 34.12 36.51 14.68 7.08 9.11 14.36%S 0.91 1.17 0.96 0.95 1.18 1.25 1.31 1.23%Ash 59.68 59.58 63.91 62.07 82.65 87.51 86.13 82.95
Fly Ash Analysis: Sampling the First ESP Hopper%C 40.03 43.75 38.16 41.05 17.35 12.06 12.48 15.06%Ash 59.51 54.74 60.47 58.45 81.39 86.72 85.41 83.37
Fly Ash Analysis: Sampling the ESP Silo (Composite)%C 42.41 38.14 36.78 39.19 23.88 14.50 17.64 13.04%Ash 55.04 61.36 60.26 59.65 73.80 83.45 80.83 84.64

23
Table 6. Performance Test Boiler Efficiency Calculations.
Micronized Coal Reburn Baseline (No Reburn)Performance Test 1 2 3 4 1 2 3 4ESP Inlet Temp EF 351 345 346 340 366 365 376 364Flue Gas Composition by Volume:CO2, % 15.0 15.7 15.6 15.8 15.1 15.2 15.3 15.1O2, % 3.7 3.0 3.0 2.8 3.6 3.6 3.4 3.7CO, ppm 30 42 39 41 2 4 0 1N2, % 81.3 81.3 81.4 81.4 81.3 81.2 81.3 81.2Coal Analysis, Dry Basis:% C 77.96 77.96 78.71 78.71 78.71 78.63 78.63 78.63% H 5.25 5.25 5.25 5.25 5.25 5.12 5.12 5.12% N 1.59 1.59 1.58 1.58 1.58 1.58 1.58 1.58% S 2.19 2.19 2.19 2.19 2.19 2.22 2.22 2.22% O 6.34 6.34 5.61 5.61 5.61 5.77 5.77 5.77% Ash 6.67 6.67 6.66 6.66 6.66 6.68 6.68 6.68Btu/lb 14227 14227 14206 14206 14206 14202 14202 14202H2O (Wet) 5.89 5.89 5.67 5.67 5.67 7.62 7.62 7.62Ash Analysis, Dry Basis:% Ash 59.68 59.58 63.91 62.07 82.65 87.51 86.13 82.95% C 38.95 37.49 34.12 36.51 14.68 7.08 9.11 14.36% S 0.91 1.17 0.96 0.95 1.18 1.25 1.31 1.23Calculations, Based on 1 lb of As-Fired Fuel, Dry Basis:Fly Ash, % Inlet 40 40 40 40 20 20 20 20Fly Ash, lb 0.042 0.042 0.039 0.040 0.015 0.014 0.014 0.015Bottom Ash, lb 0.038 0.038 0.038 0.038 0.051 0.050 0.050 0.050C Burnout, lb 0.717 0.718 0.729 0.727 0.740 0.725 0.725 0.724Gas, lb 12.27 11.82 12.02 11.87 12.60 12.31 12.17 12.35Heat Losses, %:1. Dry Gas 5.96 5.62 5.73 5.53 6.45 6.42 6.59 6.422. H2O in Fuel 0.52 0.51 0.49 0.49 0.50 0.68 0.69 0.683. H in Fuel 3.89 3.88 3.89 3.88 3.92 3.82 3.84 3.824. Flue Gas CO 0.01 0.01 0.01 0.01 0.00 0.00 0.00 0.005. Unburned C 1.82 1.75 1.49 1.64 0.30 0.17 0.20 0.296. Radiation 0.34 0.34 0.34 0.34 0.34 0.34 0.34 0.347. H2O in Air 0.12 0.12 0.12 0.12 0.12 0.12 0.12 0.128. Unmeasured 0.50 0.50 0.50 0.50 0.50 0.50 0.50 0.50
Efficiency, % 86.85 87.26 87.43 87.49 87.87 87.95 87.73 87.83

24
Table 7. Performance Test Summary.
MCR BaselineBoiler Load, kpph Steam 400 402Cyclone Coal Flow, kpph 30.1 37.1MCR Flow, kpph 6.3 0.0Micronized Coal Reburn, % 17.3 0.0Cyclone Heat Input, kpph Steam 331 402Cyclone Air Flow, kpph 325 406Over Fire Air Flow, kpph 69 22Calculated East Air-to-Fuel Ratio 11.0 11.0Calculated West Air-to-Fuel Ratio 10.7 10.8Cyclone Stoichiometry 1.08 1.09Reburn Stoichiometry 0.89 1.09Final Stoichiometry 1.08 1.15MCR Transport Gas Flow, kpph 16.4 17.7MCR Mill Current, Ampere 189 --MCR Feeder Motor Speed, rpm 682 --MCR Classifier Outlet Duct Temp, EF 294 328Feed Water Temperature, EF 407 408Back-Up Attemperator Water, kpph 0.0 24.6Secondary Super Heater Press, psig 1428 1425Primary Super Heater Outlet Temp, EF 735 780Gas Temp at Economizer Outlet, EF 689 748Gas Temp at Air Heater Outlet, EF 338 359Opacity, % 9.2 9.6Boiler O2, % 2.5 3.2Plant CO2, % 13.4 13.2CO, ppm 38 2Gas H2O, % Vol 8.1 7.7Plant NOx, ppm 367 837NOx, lb/MM Btu 0.59 1.36SO2, lb/MM Btu 2.89 2.93ESP Inlet Particulate Loading, lb/h 1503 531Fly Ash, % Inlet Ash 40.1 19.5C in Fly Ash, Iso-Kinetic, % 36.8 11.3C in Fly Ash, First ESP Hopper, % 40.7 14.2C in Fly Ash, ESP Silo, % 39.1 15.1Boiler Efficiency, % 87.3 87.8

25
Table 8. Long-Term test Daily and 30-Day Rolling Averages.
------------- Daily Averages ------------ 30-Day RollingDay Boiler MCR SR2 Boiler NOx Fly NOx Flyin Load O2 lb/ Ash lb/ Ash1998 kpph % % MMBtu % C MMBtu % C05-June 392 16.3 0.90 2.7 0.66 20.506-June 400 17.9 0.88 2.8 0.59 37.807-June 389 16.4 0.89 2.8 0.63 37.008-June 398 18.0 0.87 2.8 0.58 40.409-June 401 18.5 0.87 2.8 0.58 44.210-June 399 17.7 0.88 2.9 0.58 56.111-June 402 17.3 0.89 2.8 0.57 52.712-June 402 17.2 0.89 2.8 0.57 36.113-June 399 17.0 0.89 2.8 0.58 67.814-June 389 15.7 0.91 2.9 0.65 33.515-June 402 17.9 0.89 2.8 0.59 40.016-June 0.58 27.617-June 400 17.9 0.88 2.8 0.63 38.118-June 399 17.9 0.89 2.8 0.58 59.919-June 397 15.7 0.91 2.9 0.65 43.820-June 356 11.2 0.95 2.9 0.81 41.521-June 368 14.0 0.93 2.9 0.72 24.522-June 395 17.1 0.90 2.8 0.60 33.823-June 405 17.7 0.89 2.8 0.57 25.324-June 406 17.5 0.89 2.8 0.55 52.325-June 404 13.9 0.93 2.9 0.69 33.426-June 399 17.4 0.89 2.8 0.60 33.427-June 364 12.6 0.94 3.0 0.77 37.228-June 380 14.6 0.93 2.9 0.68 31.529-June 405 13.2 0.92 3.1 0.78 27.530-June 398 7.3 0.99 2.9 0.9701-July 374 12.0 0.94 2.9 0.83 32.602-July 376 14.6 0.91 2.9 0.77 49.903-July 388 16.6 0.89 2.9 0.69 47.704-July 380 17.1 0.89 2.9 0.66 39.5 0.66 39.505-July 385 16.5 0.91 3.0 0.65 29.4 0.66 39.806-July 394 17.2 0.90 3.0 0.69 34.1 0.66 39.707-July 364 9.9 0.96 3.3 0.86 30.0 0.67 39.408-July 390 12.7 0.93 3.0 0.78 27.3 0.67 39.009-July 398 17.3 0.88 3.1 0.61 26.5 0.68 38.4

26
Table 8 (Continued).
------------- Daily Averages ------------ 30-Day RollingDay Boiler MCR SR2 Boiler NOx Fly NOx Flyin Load O2 lb/ Ash lb/ Ash1998 kpph % % MMBtu % C MMBtu % C10-July 392 16.0 0.89 2.9 0.68 40.0 0.68 37.811-July 388 17.7 0.88 2.7 0.61 50.9 0.68 37.812-July 392 16.2 0.91 2.8 0.64 31.5 0.68 37.613-July 377 15.5 0.90 2.7 0.66 41.9 0.68 36.714-July 387 14.2 0.92 2.8 0.71 48.4 0.69 37.215-July 395 17.4 0.89 2.7 0.60 43.1 0.69 37.316-July 404 18.9 0.87 2.9 0.57 35.9 0.69 37.617-July 403 16.9 0.89 2.8 0.63 32.5 0.69 37.418-July 401 15.8 0.90 2.9 0.68 39.7 0.69 36.719-July 390 15.4 0.90 2.9 0.67 47.6 0.69 36.920-July 400 17.9 0.88 2.9 0.60 47.5 0.68 37.121-July 403 18.6 0.88 2.8 0.59 55.2 0.68 38.122-July 399 3.7 1.00 2.9 1.01 40.5 0.69 38.423-July 401 16.6 0.90 2.8 0.68 38.0 0.70 38.824-July 398 19.0 0.87 2.8 0.56 0.70 38.325-July 0.70 38.526-July 0.70 38.727-July 380 10.4 0.95 2.8 0.85 36.4 0.70 38.728-July 396 16.0 0.90 2.8 0.76 0.71 38.929-July 0.86 0.71 39.430-July 0.70 39.431-July 0.69 39.701-August 0.69 39.302-August 0.69 38.903-August 348 5.9 1.00 3.4 0.96 39.1 0.70 38.804-August 399 18.9 0.87 2.9 0.58 22.9 0.70 38.505-August 399 18.2 0.88 2.8 0.58 0.70 38.706-August 395 17.6 0.89 2.9 0.60 0.69 39.2
Statistical SummaryCount 55 55 55 55 57 51 34 34Minimum 348 3.7 0.87 2.7 0.55 20.5 0.66 36.7Maximum 406 19.0 1.00 3.4 1.01 67.8 0.71 39.8Average 392 15.6 0.90 2.9 0.67 38.9 0.69 38.4Standard Deviation 0.014 0.9295% Confidence Level 0.027 1.8

27
Table 9. Validation Test Matrix.
Date Time Period Boiler MCR Cyc O2 SR1 SR2 SR3 NOx Fly AshLoad Input lb/ 1 2kpph % kpph % MMBtu % C % C
Reference Test: Typical Operating Conditions09/21 13:45-14:45 405 17.7 333 3.0 1.07 0.88 1.12 0.55 46.0 48.0
Set 1: Cyclone Heat Input Variation (Reburn)09/22 14:00-15:00 371 17.3 307 3.0 1.07 0.89 1.09 0.57 42.8 43.5 09/22 12:15-12:45 437 17.7 360 3.0 1.10 0.90 1.14 0.61 27.4 36.6
Set 2: Cyclone Heat Input Variation (No Reburn)09/23 10:00-11:00 332 0.0 332 3.8 1.06 1.06 1.13 1.06 39.7 41.6 09/23 11:45-12:45 407 0.0 407 3.8 1.08 1.08 1.19 1.24 36.9 27.9
Set 3: Cyclone Stoichiometry Variation, Variable Cyclone Heat Input09/21 15:30-16:30 399 13.8 344 2.9 1.02 0.88 1.11 0.57 46.9 49.4 09/21 18:00-19:00 401 21.4 316 3.0 1.14 0.89 1.14 0.54 42.3 43.6
Set 4: Cyclone Stoichiometry Variation, Constant Cyclone Heat Input09/21 19:45-20:45 383 13.6 331 3.0 1.04 0.90 1.11 0.61 46.1 43.1 09/22 09:15-10:15 416 20.6 331 3.0 1.13 0.90 1.11 0.62 40.6 42.1
Set 5: Reburn Stoichiometry Variation09/22 17:30-18:00 399 21.1 315 3.0 1.03 0.81 1.11 0.41 47.1 47.6 09/22 15:30-16:30 404 19.9 323 3.0 1.08 0.87 1.12 0.50 44.3 46.2
Set 6: Final Stoichiometry Variation09/22 20:30-21:30 402 17.6 331 2.5 1.06 0.88 1.05 0.55 44.8 45.5 09/22 19:00-20:00 398 17.6 328 3.6 1.08 0.89 1.16 0.57 41.4 44.0
Miscellaneous Reburn Tests09/23 07:30-08:30 403 19.6 324 3.0 1.08 0.87 1.08 0.59 42.2 44.9 09/22 22:45-23:45 399 15.6 337 2.5 1.07 0.90 1.06 0.62 39.1 39.2 09/21 16:45-17:15 401 13.9 345 3.0 1.05 0.90 1.12 0.63 09/22 16:30-17:00 399 21.5 313 3.1 1.08 0.85 1.11 0.48 09/22 11:00-11:30 440 17.6 362 3.1 1.14 0.94 1.13 0.69

28

29

30

31
32

33
34

35


