25
Appendix 8.2 Marine Ecological Survey – Benthos
| Date post: | 04-May-2019 |
| Category: |
Documents |
| Upload: | hoangxuyen |
| View: | 215 times |
| Download: | 0 times |

Appendix 8.2
Marine Ecological Survey – Benthos

Kai Tak Development Engineering Study Cum Design and Construction of Advance Works
Investigation, Design and Construction
Marine Ecological Survey - Benthos
Report
Submitted to
MAUNSELL ENVIRONMENTAL MANAGEMENT CONSULTANTS LTD
By
W.Y. LAM
April 2007

Kai Tak Development Engineering Study Cum Design and Construction of Advance Works
W.Y. Lam Investigation, Design and construction
Page 2 of 24 April 2007
Table of Contents Table of Contents 2
List of Tables 3
List of Figures 3
1. Introduction 4
2. Methodology
2.1 Field Sampling 4
2.2 Laboratory Work 5
2.3 Data Analysis 5
3. Results
3.1 Sediment Characteristics 7
2.2 Macrobenthic Community 9
4. Discussion
4.1 Sediment Characteristics 12
4.2 Macrobenthic Community 12
4.2.1 Kowloon Bay group (Stations A and B) 13
4.2.2 Kwun Tong Typhoon Shelter group (Station C) 14
5. Summary 14
6. References 15
Appendix I The Sampling Stations for Macrobenthic Infauna Study 17
Appendix II Further Information for Data Analysis 18
Appendix III Photographic Records 19
Appendix IV List of specimens for each sampling station 20

Kai Tak Development Engineering Study Cum Design and Construction of Advance Works
W.Y. Lam Investigation, Design and construction
Page 3 of 24 April 2007
List of Tables
Table 2.1 GPS co-ordinates of sampling stations
5
Table 3.1 The species occurring at more than two sampling stations
9
Table 3.2 The representing species for Kowloon Bay group (stations A and B)
10
Table 3.3 The biological parameters of benthic community for each sampling station
11
Table 3.4 W statistic for each station 11
List of Figures
Figure 3.1 The sediment colour at sampling station A
7
Figure 3.2 The sediment colour at sampling station B
8
Figure 3.3 The sediment colour at sampling station C
8
Figure 3.4 Dendrogram of station groups
10
Kai Tak Development Engineering Study Cum Design and Construction of Advance Works
W.Y. Lam Investigation, Design and construction
Page 4 of 24 April 2007
1 INTRODUCTION
The present survey is part of the Environmental Impact Assessment for the project “Kai Tak
Development Engineering Study Cum Design and Construction of Advance Works
Investigation, Design and Construction” and aims to:
• Provide baseline marine benthic condition in Kowloon Bay, Victoria Harbour and Kwun
Tong Typhoon Shelter, and
• Identify presence (if any) of ecologically important species or habitats in the study area.
2 METHODOLOGY
2.1 Field Sampling
The survey was undertaken on 24 March 2007, at three sampling stations as proposed in the
Sub-consultancy Notes. Two sampling stations A and B located at Kowloon Bay, Victoria
Harbour (i.e. area nearby the abandoned Tai Tak airport runway) and one sampling station C
located at Kwun Tong Typhoon Shelter (see Appendix I). The co-ordinates for the three
stations were fixed by Global Positioning System (GPS) on board (Table 2.1).
At each station, five replicate sediment samples were collected using a 0.1 m2 van Veen
grab. Once one grab sample was collected, its volume of sediment was inspected for not less
than 2L so that 0.1m2 seabed substrate was sampled certainly. A photographic record of the
colour of the sediment surface at each station was taken prior to processing of the samples.
The sediment sample was washed with gentle seawater through a 0.5 mm sieves. Large
animals that were visible from the residues were hand-picked into a small plastic vial. All

Kai Tak Development Engineering Study Cum Design and Construction of Advance Works
W.Y. Lam Investigation, Design and construction
Page 5 of 24 April 2007
remains were then washed and transferred into a plastic container and preserved with 5%
borax-buffered formalin and stained with 1% Rose Bengal.
Table 2.1
GPS co-ordinates of sampling stations
Station Latitude Longitude A 22o 18.210’ N 114o 12.495’ E B 22o 17.943’ N 114o 13.041’ E C 22o 18.616’ N 114o 12.928’ E
2.2 Laboratory Work
Sorting of all residues remaining on the 0.5 mm sieve was carried out in the laboratory. For
quality assurance, the sediment residues of one third sorted samples were randomly re-
checked. No fauna was missed during the sorting.
For collected specimens, taxonomic identification was done to lowest taxonomic
resolution by a trained technician. Examination of the morphological features of the
specimens was undertaken with the aid of both stereoscopic and compound microscopes. The
taxonomic classification was according to the following references: Polychaetes: Day (1967),
Gallardo (1967), Fauchald (1977), Wu et al. (1997), Sun (2004); Crustaceans: Dai and Yang
(1991), Dong (1991); Molluscs: Qi (2004); Fishes: Li (2003). The number of individuals of
every species was recorded by counting the anterior portions of the fauna only. Total biomass
of every species was determined as preserved wet weight, after blotting the animals on filter
paper for three minutes before weighing to the nearest 0.0001 g.
2.3 Data Analysis
All data were stored in MS EXCEL format and were input into the PRIMER program
version 6 (Plymouth Marine Laboratory, UK) for subsequent statistical analyses. The data of
five replicate grab samples were pooled for each station.

Kai Tak Development Engineering Study Cum Design and Construction of Advance Works
W.Y. Lam Investigation, Design and construction
Page 6 of 24 April 2007
Cluster analysis (with SIMPROF permutation test) was employed to delineate spatial
patterns (if any) of macrobenthic community at the three stations. The species representing
each spatial group were determined by SIMPER analysis.
The Shannon-Weaver diversity (H’) and evenness (J) were calculated for each station by
using formula below:
s Shannon-Weaver Diversity (H’) = - � (Ni/N) ln (Ni/N) (Shannon and Weaver, 1963) 1 Species Evenness (J) = H’ / ln s (Pielou, 1966) where s = total number of species; N = total number of individuals; Ni = number of individuals of the ith species.
The status of community disturbance was assessed using the abundance/biomass
comparison (ABC) method and W statistic was generated (Warwick, 1986; Warwick and
Clarke, 1994).
ABC method is based on an ecological theory: when the benthic community is
approaching equilibrium under stable and unpolluted environment (‘undisturbed’), the
biomass will become increasingly dominated by few large species and abundance of each
species is less. In polluted environment (‘disturbed’), the reverse occurs that the abundance
was dominated by few small species and biomass of each species was small. The ABC
method plotted relative proportions of biomass and abundance attributable to each species for
every station. The species were ranked in order of importance on the x-axis (logarithmic
scale) with percentage dominances of abundance and biomass on the y-axis (cumulative
scale). Then W statistic was employed to measure the extent to which the biomass curve lies

Kai Tak Development Engineering Study Cum Design and Construction of Advance Works
W.Y. Lam Investigation, Design and construction
Page 7 of 24 April 2007
above the abundance curve (Clarke, 1990). In case biomass curve lying above abundance
curve, a positive W value was given that represented ‘undisturbed’ condition, and vice versa.
The W ranged from -1 to +1 that presented a continuum from ‘seriously disturbed’ to ‘purely
undisturbed’ conditions.
Further information about data analysis was included in Appendix II.
3 RESULTS
3.1 Sediment Characteristics
Through observation, two types of sediment were collected in present survey. At Kowloon
Bay, Victoria Harbour (stations A and B), the sediment was a deep grey matrix of ~30% silt-
clay fraction (<62µm in diameter) and ~70% course materials (i.e. sand, gravel, bivalve shells)
(Fig. 3.1 and 3.2). At Kwun Tong Typhoon Shelter (station C), the sediment was mainly silt-
clay fraction in black colour with pungent smell of hydrogen sulfide (H2S) (Fig. 3.3).
Figure 3.1. The sediment colour at sampling station A.

Kai Tak Development Engineering Study Cum Design and Construction of Advance Works
W.Y. Lam Investigation, Design and construction
Page 8 of 24 April 2007
Figure 3.2. The sediment colour at sampling station B.
Figure 3.3. The sediment colour at sampling station C.

Kai Tak Development Engineering Study Cum Design and Construction of Advance Works
W.Y. Lam Investigation, Design and construction
Page 9 of 24 April 2007
3.2 Macrobenthic Community
A total of 1,367 specimens were collected in present study while 50 of 54 taxa were
identified to genus or species levels. The most diverse phylum was annelids (36 polychaete
species + 1 oligochaete) followed by 12 species of arthropods, 3 species of mollusks, 1
species of nemertean and 1 species of fish. In number of individuals, 61%, 36%, 3% of
specimens were polychaetes, arthopods and other phyla respectively. Table 3.1 showed the
twenty most abundant species collected.
Table 3.1 The twenty most abundant species collected
No. ������������������������������������ ��� ��� ������ ��� ������ ��� ������ ��� ��� � � ������������� � �� � ������������� � �� � ������������� � �� � ������������� � �� � ����� ��� ����� ��� �� � ����� ��� ����� ��� �� � ����� ��� ����� ��� �� � ����� ��� ����� ��� �! �"�#"�#"�#"�#
� � ���%$�� � � ���&�� � ���%$�� � � ���&�� � ���%$�� � � ���&�� � ���%$�� � � ���&���' ���' ���' ���' �! ("�#"�#"�#"�#��� � ��� � ������ � ��� � ������ � ��� � ������ � ��� � ���
��$������������ �)��* #��$������������ �)��* #��$������������ �)��* #��$������������ �)��* #1 C +�,%-�.�/ -�0�1�2 3�4�3 56 7�7 8 56 9�32 P :<;�=�>@?�AB> =�C�>@?ED 3�3�9 FG6 9�H 3�I�6 F�I3 P JKA C�>@L MND�O P ; O<Q�-�6 R�I 56 F�F 4�6 3�H4 P ST> UVU�> WXL UVM�>�DYQ�-�6 I 8 56 F 4 I�6 4�I5 P Z\[ ]�?^> =�C�A`_a;EU b(DE=LTcXD A 8 9 56 5�7 7�6 8 F6 P Z\[ ]�?�A^UXDY?&d�> UeL U�> 8 I 56 4�5 8 6 4GR7 C fg[ h�dA�; Oab(D(haLG=�>@?�; O 3 8 FG6 3�4 36 I�H8 P ijh�d�>@L�CGUeL Mk;GOlDE=G_a;�P > W@UeLG=�O F^R 56 5�I FG6 9�59 N mgn�,�n�oVp nG2 F^R 56 F�F FG6 4 810 P qU�>@LG=L�O�hr>@LgMNDE[ M)_�UXAE=�> F 8 56 5�H FG6 7�H11 P s�dD^UV]�t!Q�-�6 FE3 56 5uF FG6 8 312 P qd�]�[ [@L�C�L�?�AYQ�-�6 F�F 56 5 8 FG6 3�713 P vYD^UVM!LP d�L�A<M�> =r;�P D 9 56 F 4 FG6 5�314 P :Td�[�A^U(OX> [�A DE=�> UXDld`wjDE=G_�dDE>�AE=�OX> O 9 56 F^R FG6 5�315 C s�] h�d�[@L�?�D^Ue?^> =L&huO<?�DE=�DE[ >@?�;�[ D�P D H FG6 FE3 56 H�H16 P xyUXDE=?&d�>@L M%MNDY?^> =G_a;�[�D�P D I 56 F�F 56 I�417 P qjL�AG?^> [@L�?&dD A�P ; O\d�]�O P U�>@? L�O�; O I 56 5uF 56 I�418 M zyd�L�C�L&hjA�P DE[�D<UeL�O&A D 7 56 5�H 56 7�719 M {yA(hr>�C�LG|�LG=�DB=�> h�haLG=�>@?�D 7 56 5�I 56 7�720 P }�?&d�> O P L MNA^U�> =G_uL�O\U^;GC�LG[ h�d�> 7 56 5�5 56 7�7
P = Polychaeta, C = Crustacea, M = Mollusca, N = Nemertea
Cluster analysis delineated two station groups with significant difference (Fig. 3.4).
Stations A and B belonged to one group (Kowloon Bay group) with 53.18% similarity while
station C was another group alone (Kwun Tong Typhoon Shelter group). According to the

Kai Tak Development Engineering Study Cum Design and Construction of Advance Works
W.Y. Lam Investigation, Design and construction
Page 10 of 24 April 2007
SIMPER analysis, the amphipods and polychaete Eunice indica were the representing species
of Kowloon Bay group (Table 3.2). SIMPER analysis could not be conducted for station C
since there was one set of data only. Only polychaetes Cirriformia sp., Nectoneanthes
oxypoda and oligochaetes were found at station C in very low abundance.
C A BStation
100
80
60
40
20
0
Bra
y C
urtis
Sim
ilarit
y
Figure 3.4. Dendrogram of station groups (solid lines represent significant delineation of groupings by SIMPROF test) Table 3.2 The representing species for Kowloon Bay group (stations A and B) (Species contributing the first 50% cumulative faunal similarity within the group) ~ o�0���- ��-�n � / n�Q ��nG2E��2E������1�2E��� n� ��06�/ ��1�/ ��/ 1���2���Q�,�� � �
+���n�o(2���nQ(/ ,�/ � 2Eo�/ p �
��� 0���p o�/ ����p / 0��%p 0��(2E��2��Q(/ ,�/ � 2Eo�/ p �%�g/ p .�/ ����o�0���-
� ��,%��� 2Ep / ��n � � 0���p o�/ ����p / 0��%p 0�(2E����2��jQ(/ ,�/ � 2Eo�/ p �%�g/ p .�/ ����o�0���-
C Amphipoda 423 19.68 43.65 43.65 P Eunice indica 344 10.87 24.10 67.75
P = Polychaeta, C = Crustacea
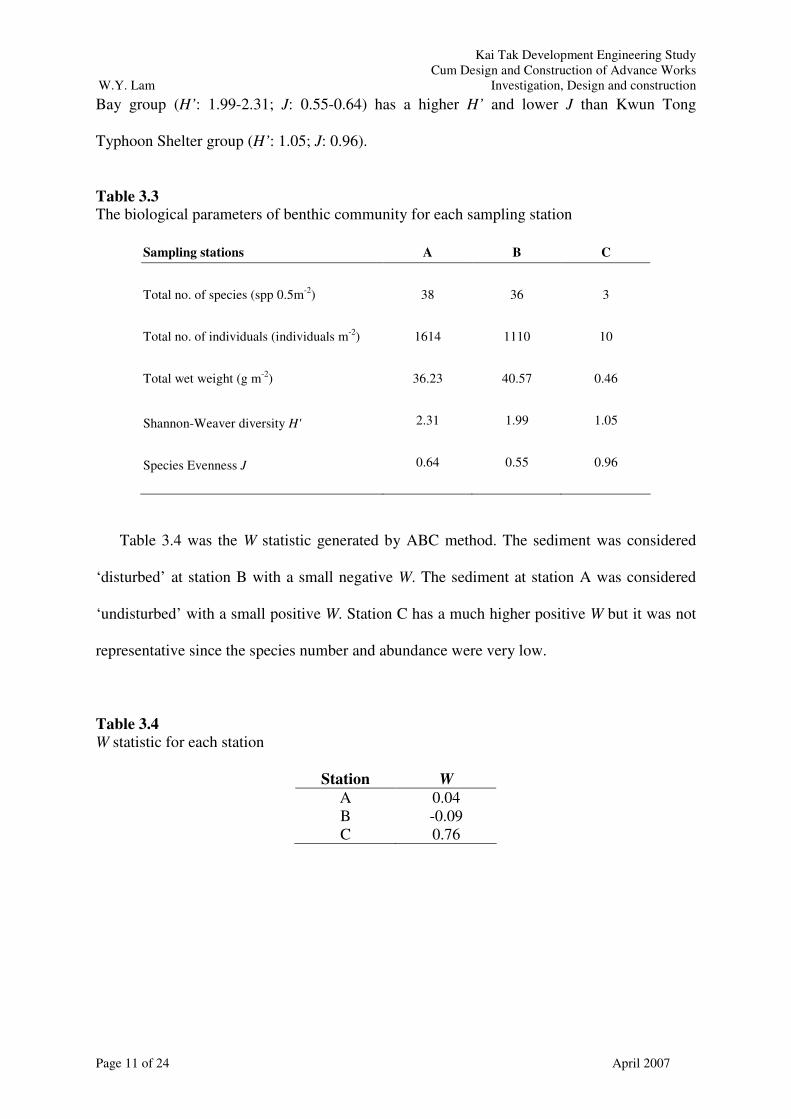
Table 3.3 summarized the biological parameters for each station. Kowloon Bay group
(stations A and B) was much higher in total number of species, total number of individuals
and total biomass relative to Kwun Tong Typhoon Shelter group (station C). The Kowloon
Kai Tak Development Engineering Study Cum Design and Construction of Advance Works
W.Y. Lam Investigation, Design and construction
Page 11 of 24 April 2007
Bay group (H’: 1.99-2.31; J: 0.55-0.64) has a higher H’ and lower J than Kwun Tong
Typhoon Shelter group (H’: 1.05; J: 0.96).
Table 3.3 The biological parameters of benthic community for each sampling station
Sampling stations A B C
Total no. of species (spp 0.5m-2) 38 36 3
Total no. of individuals (individuals m-2) 1614 1110 10
Total wet weight (g m-2) 36.23 40.57 0.46
Shannon-Weaver diversity H' 2.31 1.99 1.05
Species Evenness J 0.64 0.55 0.96
Table 3.4 was the W statistic generated by ABC method. The sediment was considered
‘disturbed’ at station B with a small negative W. The sediment at station A was considered
‘undisturbed’ with a small positive W. Station C has a much higher positive W but it was not
representative since the species number and abundance were very low.
Table 3.4 W statistic for each station
Station W A 0.04 B -0.09 C 0.76

Kai Tak Development Engineering Study Cum Design and Construction of Advance Works
W.Y. Lam Investigation, Design and construction
Page 12 of 24 April 2007
4 DISCUSSION
4.1 Sediment Characteristics
The sediment at Kowloon Bay, Victoria Harbour was the typical sediment along the channel
of Victoria Harbour. Similar type of sediment was also found in an EIA survey done in 2002
whose two of the sampling stations were located in North Point water nearby Kowloon Bay
(see EPD, 2004). Relative to other parts of Hong Kong waters, the sediment was coarser and
organic-enriched due to strong tidal flushing and long-term eutrophication respectively (Shin
et al. 2004).
The sediment at Kwun Tong Typhoon Shelter was believed in anoxic condition due to
black colour and hydrogen sulfate smell. Although the water quality of Victoria Harbour has
improved since the commencement of Harbour Area Treatment Scheme (HATS) Stage 1 in
2002, water mixing was minimized by the protected nature of typhoon shelter (Thompson
and Shin, 1983). Hence the anoxic condition persisted in the sediment.
Neither important ecological function nor habitat was provided at all sampling stations.
4.2 Macrobenthic Community
All species found in present survey were widely distributed along the coast of China. More
than 55% of abundance of collected fauna had been accounted by the first two abundant taxa
amphipods and polychaete Eunice indica. In previous survey conducted by Thompson and
Shin (1983), amphipod Melita sp. had been reported the representative species of benthic
community (the fifth abundant taxon occupying ~5% of total abundance) in eastern Victoria
Harbour where was polluted by sewage discharge. High abundance of amphipods was
believed to correlate with high organic loading in sediment since majority of amphipod
species relies on deposit-feeding of organic content (Aljetlawi et al., 2000). The polychaete

Kai Tak Development Engineering Study Cum Design and Construction of Advance Works
W.Y. Lam Investigation, Design and construction
Page 13 of 24 April 2007
Eunice indica is a widely distributed species globally (e.g. Indian Ocean, Pacific Ocean,
Japan, East Sea of China) (Yang and Sun, 1988) and locally (see CCPC, 2002). Compared
with other sampling stations around Hong Kong waters in a survey done by CCPC (2002),
the mean abundance of this polychaete species was much higher at Kowloon Bay. It was
believed polychaete Eunice indica liked inhabiting organic-enriched sediments since the
sediment at Victoria Harbour had higher organic loading than other parts of Hong Kong
waters (Shin et al., 2004). Moreover the third abundant polychaete Mediomastus sp. was a
characteristic opportunist (Grassle and Grassle, 1974; Fraser et al., 2006) whose presence
indicated a ‘disturbed’ environment. In general, the three most abundant species, which had
accounted for more than 60% of all specimens, indicated a ‘disturbed’ status of the
macrobenthic community.
4.2.1 Kowloon Bay group (Stations A and B)
The macrobenthic communities were the same pattern at stations A and B that coincided the
homogenous sediment nature. The macrobenthic communities were represented by
polychaete Eunice indica and amphipods. Both dominant species were recorded at one
nearby sampling station of benthic survey done in 2001 but their abundance was much less
(see CCPC, 2002). Also the amphipods were reported in moderate abundance in North Point
water from previous EIA survey (EPD, 2004). Same as mentioned above, the dominance of
amphipods and polychaete Eunice indica indicated a ‘disturbed’ community.
For comparison of H’ and J of macrobenthic community with previous EIA studies in
Victoria Harbour, the latest and suitable one was done by CCPC (2002) by considering same
number of grab replicates. The mean H’ and J at the stations A and B (mean H’: 2.15; mean J:
0.60) were higher than that at a station nearby North Point in previous study (H’: 1.23; J: 0.34)
(see CCPC, 2002). However the mean H’ and J at stations A and B were lower than the

Kai Tak Development Engineering Study Cum Design and Construction of Advance Works
W.Y. Lam Investigation, Design and construction
Page 14 of 24 April 2007
stations locating at two ends of the harbour in previous study (H’: 3.29, J: 0.75 at Tung Lung
Chau; H’: 2.66, J: 0.85 at Tsing Yi) (see CCPC, 2002).
The W statistic showed that the macrobenthic communities at stations A and B were
intermediate between ‘disturbed’ and ‘undisturbed’ status. It indicated the macrobenthic
communities at stations A and B were under mild stress.
Basing on present findings, it was believed that the benthic environment inside Victoria
Harbour was ‘disturbed’ due to long-term severe discharge of raw sewage and land
reclamation. The ecological significance was low at stations A and B.
4.2.2 Kwun Tong Typhoon Shelter group (Station C)
The macrobenthic community at station C was very low in species diversity, abundance and
biomass relative to other stations. The benthic environment was almost defaunated at station
C while the anoxic sediment was possibly the main cause. In a previous EIA study done by
Ove Arup & Partners Hong Kong Ltd. (2001), the benthic environment inside typhoon shelter
was also reported completely defaunated. Therefore station C had very low ecological value.
5 SUMMARY
A benthic survey was conducted to provide baseline marine benthic condition in Kowloon
Bay, Victoria Harbour and Kwun Tong Typhoon Shelter for evaluating its benthic ecological
significance.
According to the results, the benthic condition in Kowloon Bay (stations A and B) was
low in ecological value since the benthic community indicated ‘disturbed’ condition. The
benthic condition in Kwun Tong Typhoon Shelter (station C) had very low ecological value
due to almost defaunation in anoxic sediment. The benthic environment was under stress at
all stations due to long-term sewage discharge and land reclamation.

Kai Tak Development Engineering Study Cum Design and Construction of Advance Works
W.Y. Lam Investigation, Design and construction
Page 15 of 24 April 2007
6 REFERENCES Aljetlawi, A.A., Albertsson, J., Leonardsson, K., 2000. Effect of food and sediment pre-
treatment in experiments with a deposit-feeding amphipod, Monoporeia affinis. Journal of Experimental Marine Biology and Ecology 249, 263-280
Bray, J.R., Curtis, J.T., 1957. An ordination of upland forest communities of southern
Wisconsin. Ecological Monographs 27, 325-49. CCPC, 2002. Consultancy Study on Marine Benthic Communities in Hong Kong (Agreement
No. CE 69/2000) submitted to Agriculture, Fisheries and Conservation Department, Centre for Coastal Pollution and Conservation, City U Professional Services Limited.
Clark, K.R., 1990. Comparisons of dominance curves. Journal of Experimental Marine Biology
and Ecology 138, 143-157. Clark, K.R. Warwick, R.M., 2001. Changes in marine communities: An approach to statistical
analysis and interpretation. 2nd edition. PRIMER-E Ltd., Plymouth Marine Laboratory, UK.
Clarke, K.R., Gorley, R.N., 2006. PRIMER v6: User Manual/Tutorial. PRIMER-E Ltd.,
Plymouth Marine Laboratory, UK. Dai, A.Y., Yang, S.L., 1991. Crabs of the China Seas. China Ocean Press. Beijing. Day, J.H., 1967. A monograph on the polychaeta of South Africa. Trustees of the British
Museum (Natural History). London. Dong, Y.M., 1991. Fauna of ZheJiang Crustacea. Zhejiang Science and Technology
Publishing House. ZheJiang. EPD, 2004. Working Paper No. 9 for Environmental and Engineering Feasibility Assessment
Studies in relation to the Way Forward of the Harbour Area Treatment Scheme, Environmental Protection Department.
Fauchald, K., 1977. The polychaete worms. Definitions and keys to the orders, families and
genera. Natural History Museum of Los Angeles County, Science Series 28. Fraser, C., Hutchings, P., Williamson, J., 2006. Long-term changes in polychaete
assemblages of Botany Bay (NSW, Australia) following a dredging event. Marine Pollution Bulletin 52(9), 997-1010.
Gallardo, V., 1967. Polychaeta from the Bay of Nha Trang, South Viet Nam. Scripps Inst.
Oceangr. HAGA Report 4, 35-279. Grassle, J.F., Grassle, J.P., 1974. Opportunistic life histories and genetic systems in marine
benthic polychaetes. Journal of Marine Research 32(2), 253-284. Li, R.G.., 2003. Macrobenthos on the continental shelves and adjacent waters, China Sea.
China Ocean Press. Beijing.

Kai Tak Development Engineering Study Cum Design and Construction of Advance Works
W.Y. Lam Investigation, Design and construction
Page 16 of 24 April 2007
Ove Arup & Partners Hong Kong Ltd., 2001. Environmental Impact Assessment Report for
Agreement No. CE32/99 Comprehensive Feasibility Study for the Revised Scheme of South East Kowloon Development, Ove Arup & Partners Hong Kong Ltd.
Pielou, E.C., 1966. Shannon’s formula as a measure of species diversity: its use and misuse.
American Naturalist 100: 463-465. Qi, Z.Y., 2004. Seashells of China. China Ocean Press. Beijing, China. Shannon, C.E., Weaver, W., 1963. The Mathematical Theory of Communication. Urbana:
University of Illinois Press, USA. Shin, P.K.S., Huang, Z.G., Wu, R.S.S., 2004. An updated baseline of subtropical
macrobenthic communities in Hong Kong. Marine Pollution Bulletin 49, 119-141. Sun, R.P., Yang, D.J., 2004. Fauna Sinica. Phylum Annelida. Class Polychaeta II, Order
Nereidida. Science Press. Beijing. Thompson, G.B., Shin, P.K.S., 1983. Sewage pollution and the infaunal benthos of Victoria
Harbour, Hong Kong. Journal of Experimental Marine Biology and Ecology 67, 279-299.
Warwick, R.M., 1986. A new method for detecting pollution effects on marine macrobenthic
communities. Marine Biology 92, 557-562. Warwick, R.M., Clarke, K.R., 1994. Relearning the ABC: taxonomic changes and
abundance/biomass relationships in disturbed benthic communities. Marine Biology 118, 739-744.
Wu, B.L., Wu, Q.Q., Qiu, J.W., Lu, H., 1997. Fauna Sinica, Phylum Annelida, Class
Polychaeta, Order Phyllodocimorpha. Science Press. Beijing. Yang, D.J, Sun, R.P., 1988. Polychaetous annelids commonly seen from the Chinese waters.
China Agriculture Press, China
End of Report

Kai Tak Development Engineering Study Cum Design and Construction of Advance Works
W.Y. Lam Investigation, Design and construction
Page 17 of 24 April 2007
Appendix I The Sampling Stations for Macrobenthic Infauna Study

Kai Tak Development Engineering Study Cum Design and Construction of Advance Works
W.Y. Lam Investigation, Design and construction
Page 18 of 24 April 2007
Appendix II Further Information for Data Analysis
� Shannon-weaver diversity H’, measures the variety of species in a community taking
into account the number and relative abundance of species.
� Species evenness, J, examines how similar species and abundance is within a
community and varies between 0 (low evenness, i.e., few species dominate in terms of
abundance) to 1 (high evenness, i.e., all species have equal abundance).
� Cluster analysis is a computer-sorting technique to join sampling stations that have
similar faunal composition into a form of dendrogram (tree-like diagram). The
significance of the grouping of stations formed in cluster analysis is examined by the
Similarity Profile (SIMPROF) permutation tests.
� Similarity Percentage (SIMPER) analysis is to determine species representing the
groupings of macrobenthic community (Clarke and Gorley, 2006).

Kai Tak Development Engineering Study Cum Design and Construction of Advance Works
W.Y. Lam Investigation, Design and construction
Page 19 of 24 April 2007
Appendix III Photographic Records
0.1 m2 van Veen grab
The collected sediment was transferred to a tray
Wooden box of 0.5mm sieve
The collected sediment was washed with gentle seawater
The sediment residues was preserved in large plastic containers
The preserved macrofauna in sediment residues was sorted out in laboratory
Kai
Tak
Dev
elop
men
t Eng
inee
ring
Stu
dy
Cum
Des
ign
and
Con
stru
ctio
n of
Adv
ance
Wor
ks
W.Y
. Lam
Inv
estig
atio
n, D
esig
n an
d co
nstr
uctio
n
Page
20
of 2
4
Apr
il 20
07
App
endi
x IV
Lis
t of s
peci
men
s for
eac
h sa
mpl
ing
stat
ion
Sta
tion:
A
Sam
plin
g da
te: 2
4/03
/200
7
1 2
3 4
5 T
otal
In
d.
Wet
wt.
Ind.
W
et w
t. In
d.
Wet
wt.
Ind.
W
et w
t. In
d.
Wet
wt.
Ind.
W
et w
t. N
o G
roup
s S
peci
es
(0.1
m2 )
(g/0
.1m
2 ) (0
.1m
2 ) (g
/0.1
m2 )
(0.1
m2 )
(g/0
.1m
2 ) (0
.1m
2 ) (g
/0.1
m2 )
(0.1
m2 )
(g/0
.1m
2 ) (0
.5m
2 ) (g
/0.5
m2 )
1 P
A
mph
aret
e ac
utifr
ons
1 0.
00
2 0.
01
2 0.
00
5 0.
02
2 P
S
chis
toco
mus
sp.
2
0.00
2
0.00
3
P
Med
iom
astu
s sp
. 16
0.
04
20
0.06
10
0.
02
15
0.03
16
0.
04
77
0.19
4
P
Cirr
iform
ia s
p.
19
0.05
18
0.
07
5 0.
03
16
0.07
21
0.
18
79
0.40
5
P
Sch
isto
mer
ingo
s ru
dolp
hi
1 0.
00
3 0.
00
1 0.
00
5 0.
01
6 P
E
unic
e in
dica
10
6 1.
06
60
0.57
10
0.
15
33
0.41
61
0.
94
270
3.13
7
P
Lysi
dice
nin
etta
1
0.00
1
0.00
8
P
Gly
cera
chi
rori
12
0.34
8
0.10
3
0.09
12
0.
35
10
0.31
45
1.
18
9 P
G
lyce
ra s
ubae
nea
1 0.
03
1 0.
21
2 0.
24
10
P
Gly
cind
e gu
rjano
vae
14
0.01
22
0.
04
6 0.
01
4 0.
01
11
0.02
57
0.
09
11
P
Oph
iodr
omus
ang
utifr
ons
3 0.
00
3 0.
00
3 0.
00
3 0.
00
2 0.
01
14
0.02
12
P
Lu
mbr
iner
eis
shiin
oi
2 0.
00
1 0.
00
3 0.
01
13
P
Agl
aoph
amus
dib
ranc
his
1 0.
00
1 0.
00
14
P
Agl
aoph
amus
sin
ensi
s 3
0.01
1
0.00
1
0.00
5
0.01
15
P
O
phel
ina
acum
inat
a
1
0.00
1
0.00
16
P
P
hyllo
doce
sp.
4
0.01
2
0.00
4
0.03
4
0.02
14
0.
05
17
P
Poe
cilo
chae
tus
hyst
ricos
us
2 0.
01
3 0.
01
2 0.
01
7 0.
03
18
P
Har
mot
hoe
min
uta
3 0.
02
1 0.
00
1 0.
02
5 0.
04
19
P
Bra
nchi
omm
a ci
ngul
ata
3 0.
08
1 0.
00
1 0.
00
5 0.
09
P
= P
olyc
haet
a, C
= C
rust
acea
, M =
Mol
lusc
a, N
= N
emer
tea,
F =
Fis
h
- to
be c
ontin
ued
in n
ext p
age
-

Kai Tak Development Engineering Study Cum Design and Construction of Advance Works
W.Y. Lam Investigation, Design and construction
Page 21 of 24 April 2007
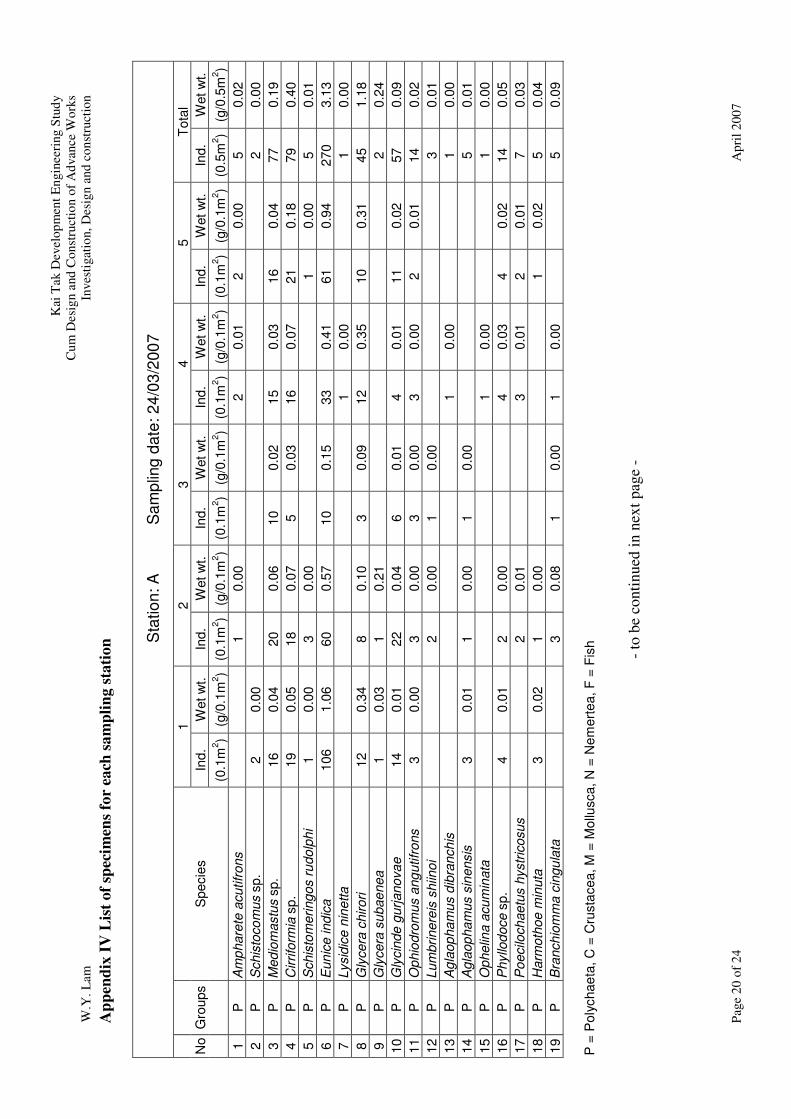
Appendix IV List of specimens for each sampling station
Station: A Sampling date: 24/03/2007
1 2 3 4 5 Total Ind. Wet wt. Ind. Wet wt. Ind. Wet wt. Ind. Wet wt. Ind. Wet wt. Ind. Wet wt. No Groups Species
(0.1m2) (g/0.1m2) (0.1m2) (g/0.1m2) (0.1m2) (g/0.1m2) (0.1m2) (g/0.1m2) (0.1m2) (g/0.1m2) (0.5m2) (g/0.5m2) 20 P Scalibregma inflatum 1 0.00 1 0.00 21 P Ehlersileanira hwanghaiensis 1 0.03 3 0.08 1 0.01 1 0.01 6 0.12 22 P Prionospio malmgreni 2 0.02 7 0.06 1 0.00 6 0.02 4 0.02 20 0.13 23 P Laonice cirrata 2 0.00 1 0.00 3 0.00 24 P Amaeana sp. 1 0.00 2 0.01 1 0.00 4 0.01 25 P Terebellidae sp. 1 0.00 1 0.00 26 P Paralacydonia paradox 1 0.00 1 0.00 2 0.00 27 N Nemertea 5 0.02 3 0.03 1 0.00 4 0.01 6 0.04 19 0.10 28 C Charybdis variegata 1 1.36 1 1.36 29 C Thalamita sima 1 4.61 1 1.31 2 5.93 30 C Typhlocarcinops canaliculata 2 0.58 1 0.16 3 0.74 31 C Xenophthalmus pinnotheroides 2 0.58 2 0.58 32 C Alpheus japonicus 2 0.08 3 0.23 5 0.31 33 C Clorida latreillei 1 2.94 1 2.94 34 C Amphipoda 36 0.09 26 0.03 57 0.04 12 0.01 3 0.01 134 0.18 35 C Copepoda 1 0.00 1 0.00 36 M Calyptraea morbida 1 0.04 1 0.00 2 0.04 37 M Rhodopetala rosea 1 0.02 1 0.02 38 F Tridentiger obscurus 1 0.12 1 0.12
Total 235 3.76 197 2.28 108 7.97 129 2.30 153 1.80 807 18.12 P = Polychaeta, C = Crustacea, M = Mollusca, N = Nemertea, F = Fish
Kai Tak Development Engineering Study Cum Design and Construction of Advance Works
W.Y. Lam Investigation, Design and construction
Page 22 of 24 April 2007
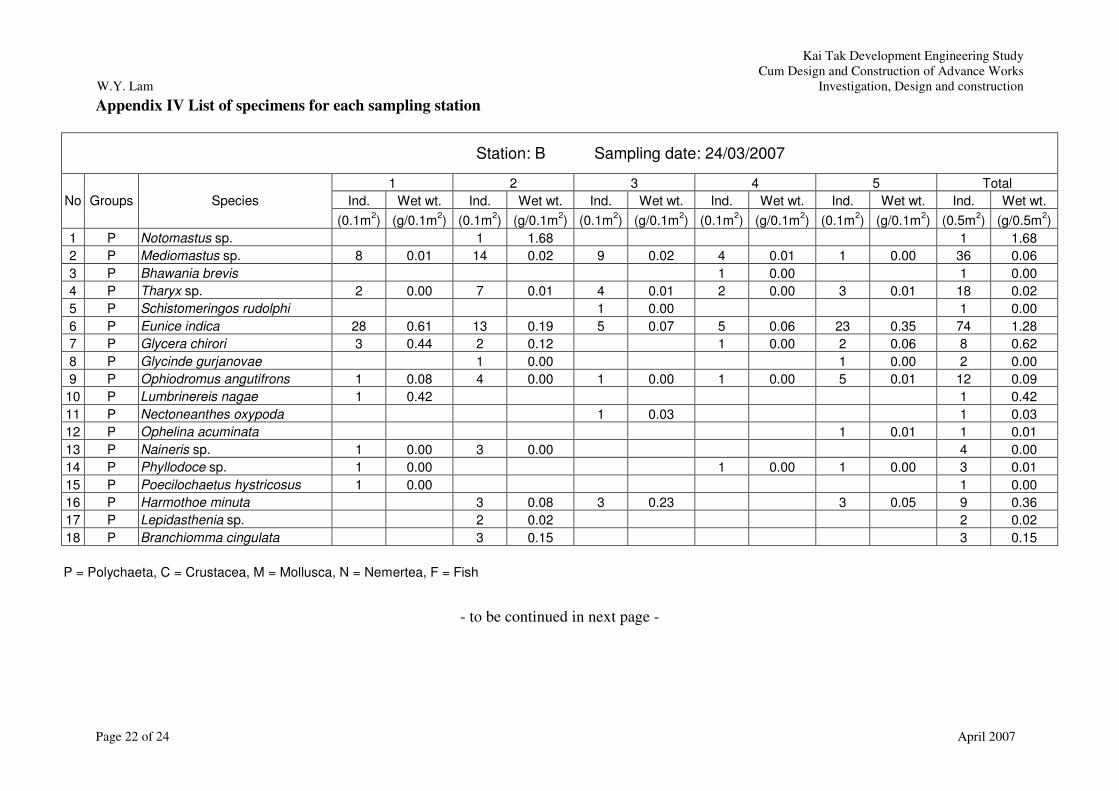
Appendix IV List of specimens for each sampling station
Station: B Sampling date: 24/03/2007
1 2 3 4 5 Total Ind. Wet wt. Ind. Wet wt. Ind. Wet wt. Ind. Wet wt. Ind. Wet wt. Ind. Wet wt. No Groups Species
(0.1m2) (g/0.1m2) (0.1m2) (g/0.1m2) (0.1m2) (g/0.1m2) (0.1m2) (g/0.1m2) (0.1m2) (g/0.1m2) (0.5m2) (g/0.5m2) 1 P Notomastus sp. 1 1.68 1 1.68 2 P Mediomastus sp. 8 0.01 14 0.02 9 0.02 4 0.01 1 0.00 36 0.06 3 P Bhawania brevis 1 0.00 1 0.00 4 P Tharyx sp. 2 0.00 7 0.01 4 0.01 2 0.00 3 0.01 18 0.02 5 P Schistomeringos rudolphi 1 0.00 1 0.00 6 P Eunice indica 28 0.61 13 0.19 5 0.07 5 0.06 23 0.35 74 1.28 7 P Glycera chirori 3 0.44 2 0.12 1 0.00 2 0.06 8 0.62 8 P Glycinde gurjanovae 1 0.00 1 0.00 2 0.00 9 P Ophiodromus angutifrons 1 0.08 4 0.00 1 0.00 1 0.00 5 0.01 12 0.09 10 P Lumbrinereis nagae 1 0.42 1 0.42 11 P Nectoneanthes oxypoda 1 0.03 1 0.03 12 P Ophelina acuminata 1 0.01 1 0.01 13 P Naineris sp. 1 0.00 3 0.00 4 0.00 14 P Phyllodoce sp. 1 0.00 1 0.00 1 0.00 3 0.01 15 P Poecilochaetus hystricosus 1 0.00 1 0.00 16 P Harmothoe minuta 3 0.08 3 0.23 3 0.05 9 0.36 17 P Lepidasthenia sp. 2 0.02 2 0.02 18 P Branchiomma cingulata 3 0.15 3 0.15 P = Polychaeta, C = Crustacea, M = Mollusca, N = Nemertea, F = Fish
- to be continued in next page -
Kai Tak Development Engineering Study Cum Design and Construction of Advance Works
W.Y. Lam Investigation, Design and construction
Page 23 of 24 April 2007
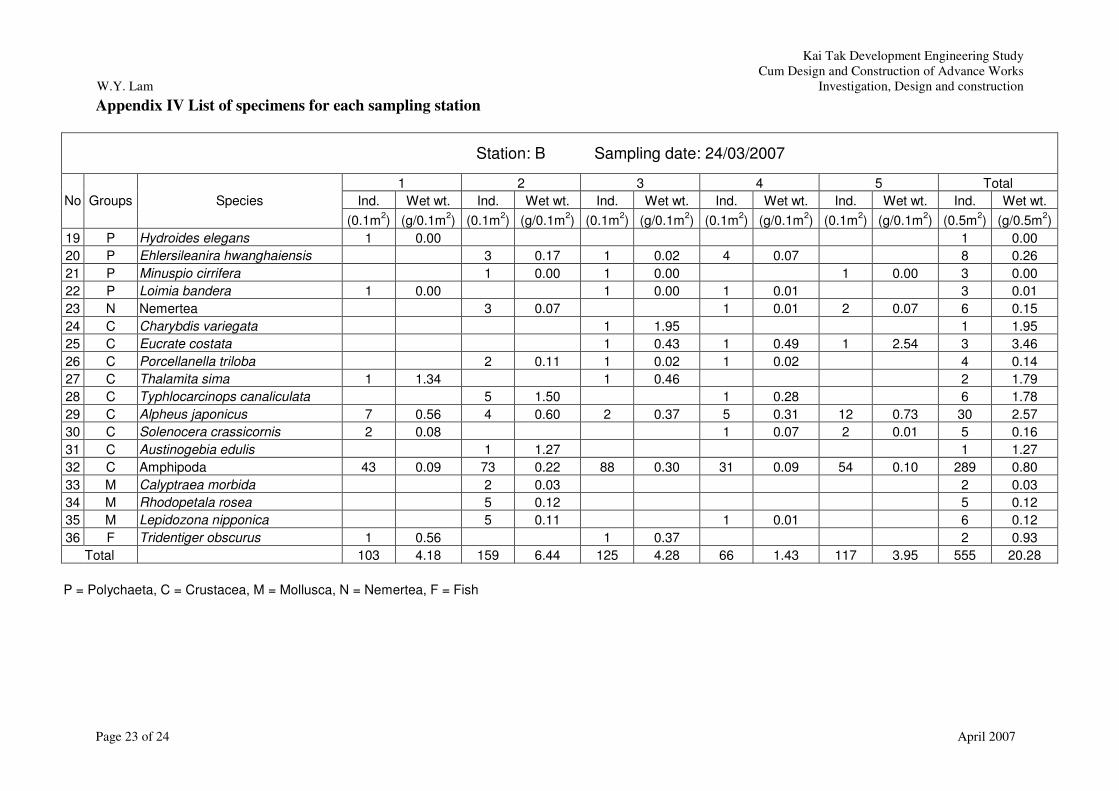
Appendix IV List of specimens for each sampling station
Station: B Sampling date: 24/03/2007
1 2 3 4 5 Total Ind. Wet wt. Ind. Wet wt. Ind. Wet wt. Ind. Wet wt. Ind. Wet wt. Ind. Wet wt. No Groups Species
(0.1m2) (g/0.1m2) (0.1m2) (g/0.1m2) (0.1m2) (g/0.1m2) (0.1m2) (g/0.1m2) (0.1m2) (g/0.1m2) (0.5m2) (g/0.5m2) 19 P Hydroides elegans 1 0.00 1 0.00 20 P Ehlersileanira hwanghaiensis 3 0.17 1 0.02 4 0.07 8 0.26 21 P Minuspio cirrifera 1 0.00 1 0.00 1 0.00 3 0.00 22 P Loimia bandera 1 0.00 1 0.00 1 0.01 3 0.01 23 N Nemertea 3 0.07 1 0.01 2 0.07 6 0.15 24 C Charybdis variegata 1 1.95 1 1.95 25 C Eucrate costata 1 0.43 1 0.49 1 2.54 3 3.46 26 C Porcellanella triloba 2 0.11 1 0.02 1 0.02 4 0.14 27 C Thalamita sima 1 1.34 1 0.46 2 1.79 28 C Typhlocarcinops canaliculata 5 1.50 1 0.28 6 1.78 29 C Alpheus japonicus 7 0.56 4 0.60 2 0.37 5 0.31 12 0.73 30 2.57 30 C Solenocera crassicornis 2 0.08 1 0.07 2 0.01 5 0.16 31 C Austinogebia edulis 1 1.27 1 1.27 32 C Amphipoda 43 0.09 73 0.22 88 0.30 31 0.09 54 0.10 289 0.80 33 M Calyptraea morbida 2 0.03 2 0.03 34 M Rhodopetala rosea 5 0.12 5 0.12 35 M Lepidozona nipponica 5 0.11 1 0.01 6 0.12 36 F Tridentiger obscurus 1 0.56 1 0.37 2 0.93
Total 103 4.18 159 6.44 125 4.28 66 1.43 117 3.95 555 20.28 P = Polychaeta, C = Crustacea, M = Mollusca, N = Nemertea, F = Fish

Kai Tak Development Engineering Study Cum Design and Construction of Advance Works
W.Y. Lam Investigation, Design and construction
Page 24 of 24 April 2007
Appendix IV List of specimens for each sampling station
Station: C Sampling date: 24/03/2007
1 2 3 4 5 Total Ind. Wet wt. Ind. Wet wt. Ind. Wet wt. Ind. Wet wt. Ind. Wet wt. Ind. Wet wt. No Groups Species
(0.1m2) (g/0.1m2) (0.1m2) (g/0.1m2) (0.1m2) (g/0.1m2) (0.1m2) (g/0.1m2) (0.1m2) (g/0.1m2) (0.5m2) (g/0.5m2) 1 P Cirriformia sp. 1 0.01 1 0.01 2 P Nectoneanthes oxypoda 1 0.15 1 0.07 2 0.22 3 O Oligochaeta 1 0.00 1 0.00 2 0.00
Total 0 0.00 2 0.15 0 0.00 3 0.08 0 0.00 5 0.23 P = Polychaeta, O = Oligochaeta


