50
J:\scopes\04w018\10000\FVD reports\Final EIA\r-EIA app.doc Appendix A Environmental Baseline Summary

J:\scopes\04w018\10000\FVD reports\Final EIA\r-EIA app.doc
Appendix A
Environmental Baseline Summary

OFFICES ACROSS AFRICA, ASIA, AUSTRALIA, EUROPE, NORTH AMERICA AND SOUTH AMERICA
KENNECOTT EAGLE MINERALS COMPANY EAGLE PROJECT
ENVIRONMENTAL BASELINE STUDY SUMMARY
Submitted to:
Kennecott Eagle Minerals Company 1004 Harbor Hills Drive
Marquette, Michigan 49855
Submitted by:
Golder Associates Inc. 44 Union Blvd., Suite 300
Lakewood, Colorado 80228 October 20, 2005 053-2288

October 20, 2005 -1- 033-2156
Golder Associates J:\03JOBS\033-2156EAGLE\FINAL BASELINE\BASELINESTUDYSUMM\ENVBASESTUDYSUMM-TEXT.DOC
TABLE OF CONTENTS
1.0 INTRODUCTION..............................................................................................................3 1.1 Project Description ............................................................................................................. 3 1.2 Environmental Baseline Study Objectives.......................................................................... 3 1.3 Environmental Baseline Study Team.................................................................................. 4 1.4 Reports Comprising the Environmental Baseline Study..................................................... 5
2.0 AIR QUALITY AND METEOROLOGY ........................................................................6 2.1 Objectives ........................................................................................................................... 6 2.2 Methods .............................................................................................................................. 6 2.3 Results................................................................................................................................. 7
3.0 QUATERNARY GEOLOGY AND HYDROLOGY ......................................................8 3.1 Data Collection Program .................................................................................................... 8 3.2 Quaternary Geology.......................................................................................................... 10 3.3 Hydrology ......................................................................................................................... 12
3.3.1 Surface Water Flow.................................................................................................... 13 3.3.2 Groundwater Flow...................................................................................................... 13 3.3.3 Hydraulic Characteristics of Quaternary Deposits ..................................................... 14 3.3.4 Water Quality ............................................................................................................. 14
4.0 BEDROCK GEOLOGY AND HYDROLOGY .............................................................17 4.1 Data Collection Program .................................................................................................. 17 4.2 Bedrock Geology .............................................................................................................. 17 4.3 Bedrock Hydrology........................................................................................................... 18
4.3.1 Static Conceptual Model ............................................................................................ 18 4.3.2 Dynamic Conceptual Flow Model ............................................................................. 19
4.4 Numerical Groundwater Monitoring ................................................................................ 20
5.0 SURFICIAL GEOLOGY AND TERRAIN ANALYSIS...............................................23 5.1 Results............................................................................................................................... 23
5.1.1 Geologic Conditions................................................................................................... 23 5.1.2 Geomorphology.......................................................................................................... 24 5.1.3 Terrain ........................................................................................................................ 24 5.1.4 Outwash Sample Geochemistry ................................................................................. 25
6.0 AQUATIC RESOURCES ...............................................................................................26 6.1 Objectives ......................................................................................................................... 26 6.2 Methods ............................................................................................................................ 26 6.3 Results............................................................................................................................... 27
6.3.1 Salmon Trout River .................................................................................................... 27 6.3.2 Cedar Creek................................................................................................................ 28 6.3.3 Yellow Dog River ...................................................................................................... 29
October 20, 2005 -2- 033-2156
Golder Associates J:\03JOBS\033-2156EAGLE\FINAL BASELINE\BASELINESTUDYSUMM\ENVBASESTUDYSUMM-TEXT.DOC
7.0 VEGETATION – WETLAND DELINEATION ...........................................................30 7.1 Objectives ......................................................................................................................... 30 7.2 Methods ............................................................................................................................ 30
7.2.1 Field Assessment........................................................................................................ 30 7.3 Results and Discussion ..................................................................................................... 31
8.0 THREATENED AND ENDANGERED SPECIES........................................................32 8.1 Objectives ......................................................................................................................... 32 8.2 Methods ............................................................................................................................ 32
8.2.1 Literature Review and Field Preparation.................................................................... 32 8.2.2 Field Assessment Methodologies............................................................................... 33
8.2.2.1 Vascular Plant Assessments............................................................................. 33 8.2.2.2 Wildlife Assessments....................................................................................... 33
8.3 Results............................................................................................................................... 34
9.0 WILDLIFE .......................................................................................................................35 9.1 Objectives ......................................................................................................................... 35 9.2 Methods ............................................................................................................................ 35
9.2.1 Literature Review and Field Preparation.................................................................... 35 9.3 Results............................................................................................................................... 36
9.3.1 Wildlife Communities ................................................................................................ 36
10.0 CULTURAL RESOURCES............................................................................................38 10.1 Objectives ......................................................................................................................... 38 10.2 Methods ............................................................................................................................ 38
10.2.1 Research Design......................................................................................................... 38 10.2.2 Archival Research Methods ....................................................................................... 39 10.2.3 Field Methods............................................................................................................. 39 10.2.4 Shovel Testing............................................................................................................ 39
10.3 Results............................................................................................................................... 40
11.0 REFERENCES.................................................................................................................41
LIST OF FIGURES
Figure 1 Project Location Figure 2 Groundwater Monitoring Locations Figure 3 Surface Water Monitoring Locations Figure 4 Aquatic Sample Station
LIST OF APPENDICES
Appendix A Environmental Baseline Study Project Team
October 20, 2005 -3- 033-2156
Golder Associates J:\03JOBS\033-2156EAGLE\FINAL BASELINE\BASELINESTUDYSUMM\ENVBASESTUDYSUMM-TEXT.DOC
1.0 INTRODUCTION
1.1 Project Description
In July of 2002, Kennecott Exploration Company (KEX) identified a high grade mineral deposit in
Michigamme Township, Marquette County approximately 30 miles northwest of the City of
Marquette in Michigan’s Upper Peninsula. The deposit (Eagle Project) is within an area of the Upper
Peninsula known as the Yellow Dog Plains, about ten miles from Lake Superior. Figure 1 depicts the
location of the Eagle Project in more detail, while Figure 2 presents regional topography and ore body
location. The identified resource is a high grade nickel-copper deposit.
In the wake of KEX’s discovery, Kennecott Eagle Minerals Company (Kennecott) initiated an
assessment of baseline environmental conditions and cultural resources in the area (the
Environmental Baseline Study or EBS). The EBS is actually comprised of several separate studies of
the various environmental conditions and cultural resources that could potentially be impacted if a
mine were developed at the Eagle Project site. Each of these studies culminated in production of a
detailed technical report addressing the resources that were the focus of the study. Taken together,
these study reports reflect an extensive and comprehensive analysis of baseline conditions in the
Eagle Project area. This EBS Summary summarizes the data collection process and key findings of
each of these underlying studies.
1.2 Environmental Baseline Study Objectives
The primary objective of the EBS was to comprehensively document pre-mining baseline conditions
in order to:
1. Assess potential impacts to the environment from mining operations;
2. Facilitate development of a mine design that minimizes environmental impacts to the greatest extent practicable; and
3. Support environmental permitting associated with the Eagle Project.
The EBS focused primarily on the following resources that could potentially be affected by mining at
the Eagle Project site:
• Air quality and meteorology;

October 20, 2005 -4- 033-2156
Golder Associates J:\03JOBS\033-2156EAGLE\FINAL BASELINE\BASELINESTUDYSUMM\ENVBASESTUDYSUMM-TEXT.DOC
• Surface water hydrology and quality;
• Quaternary and bedrock groundwater quality and hydrogeology,
• Surface geology and terrain analysis;
• Aquatic resources;
• Wildlife;
• Vegetation and wetlands;
• Threatened and endangered plant and animal species, species of concern, and unique or threatened plant communities; and
• Cultural resources.
Importantly, completion of the baseline study of these resource areas does not signal the end of
Kennecott’s assessment and ongoing monitoring activities. Kennecott will continue to collect data at
established monitoring points in the area as necessary in order to facilitate finalization of mine design,
prepare environmental permit applications, and respond to input from regulatory agencies and the
public.
1.3 Environmental Baseline Study Team
Kennecott engaged Golder Associates Inc. (Golder) to conduct portions of the EBS and coordinate
implementation of other portions of the EBS using local expertise. Accordingly, Golder used the
services of additional experts to assist in implementing the EBS. These experts are:
1. North Jackson Company (NJC) (surface water hydrology, water quality and Quaternary hydrogeology);
2. Fletcher Driscoll and Associates (FDA) (groundwater flow modeling in Quaternary deposits);
3. Wetland and Coastal Resources, Inc. (WCR) (assessment of biological resources); and
4. BHE Environmental, Inc. (BHE) (cultural resources).
A list of primary contact information for each of these firms is included as Appendix A to this EBS
Summary.

October 20, 2005 -5- 033-2156
Golder Associates J:\03JOBS\033-2156EAGLE\FINAL BASELINE\BASELINESTUDYSUMM\ENVBASESTUDYSUMM-TEXT.DOC
1.4 Reports Comprising the Environmental Baseline Study
The individual reports underlying the EBS and addressed in this EBS Summary are:
• Air quality and meteorology;
• Surface water hydrology and quality;
• Groundwater quality and hydrogeology, including bedrock hydrology;
• Surface geology and terrain analysis;
• Aquatic resources;
• Wildlife;
• Vegetation and wetlands;
• Threatened and endangered plant and animal species, species of concern, and unique or threatened plant communities; and
• Cultural resources.
The summary of the study objectives, data collection process and key findings of each of these reports
follows.

October 20, 2005 -6- 033-2156
Golder Associates J:\03JOBS\033-2156EAGLE\FINAL BASELINE\BASELINESTUDYSUMM\ENVBASESTUDYSUMM-TEXT.DOC
2.0 AIR QUALITY AND METEOROLOGY
Golder installed a solar-powered air quality and meteorological monitoring station in January 2004 to
measure and collect baseline ambient air quality and meteorological data. The station was fully
configured and operational by March 2004. The air quality and meteorological monitoring station is
located northeast relative to the proposed ore body and immediately west of the proposed surface
facilities.
2.1 Objectives
Objectives of air quality and meteorological monitoring were to develop a regional database for these
resources. The air and meteorological database would serve to establish existing conditions near the
proposed mine, and would be available, if needed, to support permitting requirements.
2.2 Methods
The overall scope of the 2004-2005 air quality and meteorological program was to document
temporal occurrences of particulate matter with aerodynamic size of 10 micrometers (μm) or less
(PM10), as well as selected meteorological parameters. The meteorological parameters include wind
speed and direction, temperature, relative humidity, solar radiation, and precipitation (rainfall and
snowfall) in the project area.
Regional meteorological data are available from the National Oceanographic and Atmospheric
Administration’s (NOAA) National Weather Service (NWS), that is currently being collected at the
closed Marquette County Airport (MQT) near Nagaunee, Michigan. Barometric pressure measured at
MQT was used to calculate standard temperature and pressure corrections for the PM10 concentrations
measured at the proposed mine site.
Golder performed biannual audits of the air quality and meteorological monitoring equipment. The
audits were performed in April (PM10 only) and May (Met only) 2004, November 2004, and May
2005 and were used to assess the precision and accuracy of data measured and recorded by the total
measurement system (sample collection, sample analysis, and data processing). The total
measurement system was validated and qualified by the performance audits.

October 20, 2005 -7- 033-2156
Golder Associates J:\03JOBS\033-2156EAGLE\FINAL BASELINE\BASELINESTUDYSUMM\ENVBASESTUDYSUMM-TEXT.DOC
2.3 Results
PM10 monitoring data have been collected at the Eagle Project on an hourly basis since March 2004.
None of the PM10 data exceeded EPA or Michigan Department of Environmental Quality (MDEQ)
24-hour standards. PM10 data indicate particulate concentrations vary seasonally due to factors such
as precipitation, local recreational and silvicultural activities, and biological activity (pollen, etc.).
Daily PM10 values are generally lower during winter months when snowfall reduces the airborne and
fugitive particulate material in remote, uninhabited rural areas. The maximum daily (24-hour) PM10
concentration for the period of record was 48 micrograms per cubic meter (µg/m3) on September 5,
2004, with the second highest daily (24-hour) concentration of 41 µg/m3 on September 4, 2004.
A key component of quality assurance (QA) data assessment is the amount of valid data collected
during the sampling period, defined as data capture. Data capture above 75 percent (or 45 minutes of
valid data per hour, 18 hours of data per day, etc.) is considered acceptable. Data capture for PM10
exceeded 90 percent for all months except November 2004 and April 2005. In November 2004, the
glass fiber filter tape broke, and subsequently, data were not collected from November 13th to the
18th. Data capture for November was still above the QA criteria of 75 percent. Data capture for
PM10 was 54.9 percent for April 2005 due to a faulty sample pump from March 30 through April 14,
2005.
Baseline air quality monitoring indicate that PM10 concentrations in the vicinity of the Eagle Project
are well below the daily (24-hour) EPA and MDEQ ambient standard of 150 µg/m3. Additionally, the
average PM10 concentration of 11.7 µg/m3 for the period of record is well below the annual EPA and
MDEQ ambient standard of 50 µg/m3.
Dominant wind was primarily from the southwest with an average horizontal deviation of wind
direction of 21°. The average horizontal wind speed was 6.9 miles per hour (mph). Average monthly
temperature ranged from 13.6 degrees Fahrenheit (ºF) in January 2005 to 62.1ºF in September 2004.
Average monthly relative humidity ranged from 60 percent in April to 87 percent in December.
Average monthly solar radiation ranged from 26 watts per square meter (W/m2) for December 2004
to 273 W/m2 for June 2004. Total precipitation ranged from 0.2 inches in January 2005 to 5.4 inches
in August 2004.

October 20, 2005 -8- 033-2156
Golder Associates J:\03JOBS\033-2156EAGLE\FINAL BASELINE\BASELINESTUDYSUMM\ENVBASESTUDYSUMM-TEXT.DOC
3.0 QUATERNARY GEOLOGY AND HYDROLOGY
3.1 Data Collection Program
North Jackson Company (NJC) initiated surface water quality and flow monitoring of the Salmon
Trout River and Yellow Dog River watersheds during November 2002. A third watershed (Cedar
Creek subwatershed of the Pine River) was included in the study area during 2003 to provide a
reference watershed located outside of the project area. In January 2004 the study was expanded as
part of a broader environmental baseline study. This expansion was performed in two stages, with the
first stage completed during January through May 2004 and the second stage from June 2004 through
May 2005. Figures 2 and 3 present groundwater and surface water monitoring station locations.
Hydrologic components of the study were designed to document baseline water quality and
hydrologic conditions in the watersheds, describe the relationship and interaction between
groundwater and surface water resources within the watersheds, and develop a groundwater flow
model as a quantitative assessment tool to simulate the interaction between groundwater and surface
water in the Yellow Dog Plains. Surface and groundwater samples representative of winter baseflow,
spring snowmelt runoff (recharge), summer baseflow, and fall rain runoff (recharge) hydrologic
events were collected. Primary components of the baseline hydrologic assessment included soil
coring and soil classification, piezometer and monitoring well installation, measurement of surface
water discharge, and water quality monitoring.
Soil Coring and Classification. Continuous soil cores were collected from Quaternary deposits at
15 locations using sonic drilling methods. Representative soil samples were collected from major
hydrostratigraphic units and submitted for analyses of grain size distribution with select samples of
finer-grained units submitted for permeability testing.
Piezometer and Monitoring Well Installation. Twenty-three galvanized piezometers were
hand-driven to shallow depths in the Plains wetland between the Yellow Dog River and Salmon Trout
River main branch to facilitate groundwater level measurement. Four stainless steel piezometers
were hand-driven in the same wetland area to allow for groundwater quality sample collection. Eight
additional stainless steel piezometers were placed at groundwater seeps that are tributary to the
Salmon Trout River (east branch and main branch) and Cedar Creek. Twenty monitoring wells
consisting of nine two-well nests and two single-well placements have been installed using sonic
drilling within the glacial deposits across a broad area of the Yellow Dog Plains.

October 20, 2005 -9- 033-2156
Golder Associates J:\03JOBS\033-2156EAGLE\FINAL BASELINE\BASELINESTUDYSUMM\ENVBASESTUDYSUMM-TEXT.DOC
The groundwater monitoring network was designed to provide both regional and local data. Well
nests consist of a water table well screened in the uppermost unconfined hydrostratigraphic unit and a
deeper well screened within a lower, confined hydrostratigraphic unit identified through coring work
described above. Three additional observation well nests of similar design and construction and two
pumping wells were installed for a multi-well pumping test.
Hydrology Data Collection. Hydrology data collected for the study includes surface water flow,
groundwater elevations, and aquifer hydraulic parameters. Monitoring locations were selected on the
Yellow Dog River, upper Salmon Trout River tributaries (the Main Branch, East Branch and West
Branch), and the Salmon Trout River main branch near its confluence with Lake Superior. Two
monitoring locations were also established on Cedar Creek. Continuous (hourly) stage recorders
(pressure transducers) were installed on the Yellow Dog River, Salmon Trout River Main Branch,
and East Branch at natural control points. Frequent flow measurements were recorded at these
locations to develop rating curves for surface water discharge. Ten surface erosion monitoring
stations were also established as part of the watershed monitoring network.
Groundwater levels were measured in monitoring wells and piezometers during spring snowmelt
runoff, summer baseflow and fall rain runoff monitoring periods of 2004 and winter baseflow and
spring snowmelt runoff periods of 2005. Because the monitoring network had been expanded with
each successive stage of investigation, not all wells have measurements recorded for each date.
Water level recorders (pressure transducers) were installed in a select set of wells and piezometers to
record water levels on an hourly basis.
Two constant-rate aquifer tests were conducted over a nine-day period (October 21-29, 2004) to
determine hydraulic characteristics of primary hydrostratigraphic units in the study area. A
preliminary aquifer test was also conducted in an exploration borehole from August 2 to 4, 2004.
Aquifer test locations were chosen to characterize primary hydrostratigraphic units near the Salmon
Trout River Main Branch, the Yellow Dog Plains wetland, and the project ore body.
Water Quality Monitoring
Surface Water Quality Monitoring. Monitoring locations generally coincide with surface water
flow measuring sites and were established on the Yellow Dog River, Upper Salmon Trout River
tributaries (West Branch, Main Branch and East Branch), the Salmon Trout River near its confluence

October 20, 2005 -10- 033-2156
Golder Associates J:\03JOBS\033-2156EAGLE\FINAL BASELINE\BASELINESTUDYSUMM\ENVBASESTUDYSUMM-TEXT.DOC
with Lake Superior, and Cedar Creek. Samples were analyzed for pH, dissolved oxygen, specific
conductance, and temperature in the field and also submitted to laboratories for analysis of a suite of
organic and inorganic parameters. Hardness was calculated using calcium and magnesium
concentrations in accordance with standard practice. Continuous water quality monitoring
instruments were installed at four locations to record temperature and conductivity. Continuous
temperature recorders were installed at an additional eight surface water monitoring stations.
Surface Erosion Monitoring. Monitoring was completed to characterize inputs to streams from
road-related surface erosion. The monitoring network consisted of traffic counters installed at four
locations, sediment traps constructed at 10 locations along representative roads and all-terrain vehicle
trails, and a series of road cross sections surveyed at 11 locations. The traffic counters recorded the
number of vehicle axles crossing the eastern and western boundaries of the Salmon Trout River
watershed on the two primary access roads within the study area—the AAA Road and Northwestern
Road. These locations were selected to characterize the relative influence of traffic on surface
erosion rates. Sediment trap and road cross section locations were selected to represent the range of
traffic use, parent road material, and road gradients that exist within the study area. The sediment
traps provide rates of surface erosion from roads, which can be used to estimate sediment delivery to
streams within the upper Salmon Trout River watershed. Road cross sections were surveyed in the
summer and early fall of 2004 and provide a rough measurement of long-term surface erosion that has
taken place over the life of the AAA Road and Northwestern Road. Detailed mapping of roads within
the area was completed during May and June of 2005 to provide a basis to estimate road density for
the upper Salmon Trout River watershed.
Groundwater Quality Monitoring. Samples were collected from selected wetland piezometers,
seep piezometers, Quaternary deposit monitoring wells, and a bedrock mineral exploration corehole.
Samples were analyzed for pH, dissolved oxygen, specific conductance, ferrous iron, and temperature
in the field and submitted to laboratories for analysis of a suite of inorganic parameters. Hardness
was calculated using calcium and magnesium concentrations. Continuous temperature recorders were
installed in two seep piezometers.
3.2 Quaternary Geology
The Quaternary geology of the Plains can be described as surficial deposits of unconsolidated glacial
outwash and till, and post-glacial sedimentation underlain by igneous and metamorphosed

October 20, 2005 -11- 033-2156
Golder Associates J:\03JOBS\033-2156EAGLE\FINAL BASELINE\BASELINESTUDYSUMM\ENVBASESTUDYSUMM-TEXT.DOC
sedimentary (metasedimentary) rocks of Precambrian age. These outwash deposits are described as a
large outwash-fan delta (Drexler 1981). Along the north terrace, surficial deposits are mapped as
coarse-textured glacial till of extremely heterogeneous particle size. This unit is referred to in
geologic literature as the Negaunee Moraine (Segerstrom 1964). Clay-rich, hard till is present
sporadically on the north terrace, but the surficial deposits are generally sandy with scattered boulders
and cobbles. Outwash deposits become finer and better sorted from the north toward the south.
The observed thickness of Quaternary deposits within the study area ranges from 0 to 255 feet. The
deposit thickens in all directions away from the peridotite outcrop, with the greatest thickness
observed east of the peridotite outcrop and northwest of the project area. The deposit thins toward the
north and south, terminating at the boundary of the Archean bedrock formation.
A surface soil layer (black with organic material and tree litter) was identified at most drilling
locations within the study area. This layer is generally less than one foot thick (and mapped
regionally as 0-2 inches thick on the plains). The major hydrostratigraphic units, from youngest to
oldest, identified within the Quaternary deposits were outwash and beach deposits, a transitional
deposit, a lacustrine deposit, outwash/ablation till, basal, and lower outwash units.
Outwash and Beach Deposits. Outwash and beach deposits are coarse-grained, comprised of well-
sorted, stratified fine- to medium-grained sand, with some gravel and minor quantities of silt and clay.
Excluding wetland locations where the water table is at or very near ground surface, the minimum
vadose zone thickness measured was about 5 to 8 feet near the Plains wetland. The maximum vadose
zone thickness measured was about 100 feet near the north terrace. An unconfined water table occurs
in the saturated portion of this deposit.
Transition Deposit. A gradational contact exists between the outwash sand and deeper deposits that
are finer grained. This contact includes a transitional zone that contains a mix of fine sand, silt, and
clay, fining downward to predominantly silt and clay, indicating a significant change in permeability.
Lacustrine Deposit. A laterally extensive, massive clay deposit was identified in samples from most
borings and was absent only near the peridotite outcrop (where a thick deposit of the transitional zone
is present). The lacustrine clay deposit is a lean clay with high plasticity. A sharp contact occurs at
both the top and bottom of this deposit. The top of the clay deposit was encountered in borings
between 1,315 and 1,399 feet above mean sea level and ranged in thickness from 7 to 63 feet, thickest

October 20, 2005 -12- 033-2156
Golder Associates J:\03JOBS\033-2156EAGLE\FINAL BASELINE\BASELINESTUDYSUMM\ENVBASESTUDYSUMM-TEXT.DOC
in the south/southeast part of the Plains and thinnest to absent in the north and northeast, respectively,
where this unit pinches out.
Outwash/Ablation Till. A deeper deposit of coarser-grained material was encountered beneath the
lacustrine deposit at most drilling locations. Predominantly fine- to medium-grained sand similar to
the uppermost outwash layer, this layer is more heterogeneous than the uppermost outwash layer. It
is also discontinuous, interrupted by shallow bedrock and pinched out between the fine-grained units
above and below, appearing to be confined or partially confined.
Basal Till. The basal till is glacial material deposited directly from the base of the ice sheet. The
material is poorly-sorted and consists of boulder- to sandy-sized clasts in a fine-grained matrix. This
is the lowermost Quaternary deposit identified in all but one boring within a radius of 3,000 feet of
the project. At two locations distant from the project area, lower outwash deposits of fine- to
medium-grained sand were found interlayered with the basal till.
Primary water-bearing zones in the area (the unconfined outwash and beach sand zone and the
confined outwash/ablation till zone) are separated by the fine-grained transitional deposit and the
lacustrine clay unit near the project area. Bedrock topographic highs in the area coincide with the
peridotite intrusive that appears to have been an erosionally resistant feature during the time of
Quaternary deposition. The fine-grained transitional deposit and the lacustrine clay unit are laterally
extensive across a broad area of the Plains, but pinch out into the glacial moraine at the northern edge
of the Plains. As a result of the pinch-out of the fine-grained deposits, the two primary water-bearing
zones become a single, unconfined hydrostratigraphic unit north of the peridotite outcrop.
3.3 Hydrology
From April to September most precipitation in the region occurs as rain, while from November to
mid-March it is usually in the form of snow. Precipitation stored in the form of snow throughout
winter months is released to streams and groundwater in late winter and early spring. From
June 2004 to May 2005 precipitation was 2.76 inches below the 1979 to 1998 average (35.39 inches).
Notable variations in average precipitation include drier than average conditions in September 2004
(1.64 inches of rain compared to 3.63 inches) and wetter than average conditions in December 2004
with 5.05 inches of precipitation (water equivalent of snowfall that month), compared to 2.38 inches
for the average.
October 20, 2005 -13- 033-2156
Golder Associates J:\03JOBS\033-2156EAGLE\FINAL BASELINE\BASELINESTUDYSUMM\ENVBASESTUDYSUMM-TEXT.DOC
3.3.1 Surface Water Flow
Peak flows occur during periods of snowmelt runoff and low flows occur in summer and winter.
Hydrographs for Salmon Trout River tributaries at the base of the north terrace show more attenuated
responses to runoff and precipitation events due to the influence of groundwater contribution from the
two outwash deposits. Surface runoff events at these locations appear to be relatively minor
compared to downstream locations where flows are affected by low permeability bedrock underlying
the stream beds.
The hydrograph for the Yellow Dog River shows higher peak flows and longer duration of surface
runoff in response to precipitation events than the Salmon Trout River tributaries. This suggests that
flow in the Yellow Dog River is influenced more by surface runoff from the bedrock highlands and
by wetland storage along its banks on the Plains.
Salmon Trout River tributaries gain considerable flow from groundwater seeps along the face of the
north terrace. The Salmon Trout River East Branch, Main Branch and West Branch originating from
the Plains and north terrace provide about 46 percent, 15 percent, and 12 percent, respectively, of the
total flow of the Salmon Trout River system. Approximately 27 percent of the remaining flow is
derived from runoff downstream of the upper Salmon Trout River watershed.
3.3.2 Groundwater Flow
Regional groundwater flow in the upper outwash and beach sand zone is generally to the north-
northeast. Localized capture of the outwash groundwater occurs on the Plains by the Salmon Trout
River Main Branch and the Yellow Dog River. A groundwater divide exists between these outwash
groundwater basins in the Yellow Dog Plains wetland. The Eagle Project is located entirely within
the Salmon Trout River groundwater basin.
The general horizontal flow direction in the lower outwash/ablation zone is also to the
north/northeast. The zone’s flow patterns are locally influenced by shallow bedrock creating
divergent flow patterns and thicker outwash deposits in buried bedrock channels creating convergent
flow patterns.
The Yellow Dog Plains wetland is hydrologically upgradient of the project site and is the uppermost
component of the groundwater basin. The wetland must therefore have a primary storage and

October 20, 2005 -14- 033-2156
Golder Associates J:\03JOBS\033-2156EAGLE\FINAL BASELINE\BASELINESTUDYSUMM\ENVBASESTUDYSUMM-TEXT.DOC
recharge function in relation to groundwater and must be supported by precipitation. Groundwater
discharge for most of the Yellow Dog Plains occurs to streams originating along the north terrace.
Groundwater levels in both outwash zones exhibit minor fluctuations in response to seasonal recharge
and discharge. The transitional and lacustrine layers separating the two outwash zones act as a
hydraulic barrier to vertical flow and, where present, provide a significant degree of separation of
flow between these units.
3.3.3 Hydraulic Characteristics of Quaternary Deposits
The average transmissivity of the lower outwash/ablation zone is approximately 815 square feet per
day (ft2/day) and is generally consistent throughout most of the study area. Transmissivities are likely
to decrease to the north/northeast and south/southeast as the outwash/ablation zone thins toward the
bedrock outcrop.
Transmissivity of the upper outwash and beach sand increases from northeast to southwest in the test
area, ranging from about 1,000 to 1,600 ft2/day. Because the saturated thickness of the
hydrostratigraphic unit is similar along the test well array, the apparent increase in transmissivity is
likely due to higher hydraulic conductivity of the sediments. Horizontal hydraulic conductivities in
the outwash zone range from 37 to 69 ft/day with an average of 50 ft/day, with the highest values in
the southwest part of the test area. The average vertical hydraulic conductivity is 1.9 ft/day or
approximately 26 times less than the average horizontal hydraulic conductivity value.
Water flow in the two primary hydrostratigraphic units (the two outwash zones) is predominantly
horizontal. The upper outwash and beach sand unit is unconfined. The lower outwash/ablation zone
is confined. Groundwater movement between the two zones is restricted by the transitional and
lacustrine soil layers acting as a hydraulic barrier.
3.3.4 Water Quality
Surface Water Quality
Surface water quality data were collected from November 2002 to May 2005. Surface water
monitoring results generally indicate good water quality at all monitoring locations. Calcium and
bicarbonate ions are the principal dissolved constituents in water at all locations monitored. The

October 20, 2005 -15- 033-2156
Golder Associates J:\03JOBS\033-2156EAGLE\FINAL BASELINE\BASELINESTUDYSUMM\ENVBASESTUDYSUMM-TEXT.DOC
streams can generally be described as soft (hardness <60 mg/L) to moderately hard (60-120 mg/L)
with neutral pH (ranging from weakly acidic to weakly alkaline) with a low degree of mineralization
and turbidity. Nutrient concentrations are generally low and dissolved oxygen is generally high.
Streams dominated by seepage from the north terrace exhibit water quality conditions indicative of
higher contributions from groundwater flow. These streams have somewhat higher specific
conductance values, higher hardness concentrations, warmer temperatures during winter, and cooler
temperatures during summer compared to the Yellow Dog River and Salmon Trout River and lower
reaches of the Salmon Trout River Main Branch. The streams at the base of the north terrace also
have less color and lower organic carbon content.
Continuously recorded specific conductance data show the periodic influence of increased surface
water contribution associated with snowmelt runoff and significant precipitation events. Further, total
mercury concentrations appear to increase during periods of increased surface runoff. Total mercury
was measured in all surface water samples at concentrations within the range of those typically found
in rivers and streams in the United States (1-7 nanogram per liter (ng/L), USEPA 1997). Based on
the comparison of total mercury concentrations measured in surface water samples collected at the
site to nationwide conditions cited above, mercury concentrations appear to be related to regional
atmospheric mercury deposition released to streams from surface runoff rather than localized sources
of mercury in the watershed. Somewhat higher turbidity and total suspended solids are also detected
in streams following snowmelt runoff.
Trace constituents detected in most streams include iron, arsenic, barium, manganese, and aluminum.
Trace concentrations of total copper, total zinc and total cadmium were infrequently detected in
samples from a few monitoring locations.
Surface Erosion
Road density was estimated to be about 7 mi/mi2 for the upper Salmon Trout River watershed. A
preliminary annual estimate of the rate of naturally-derived sediment delivery (from soil creep) to
streams is 8 tons/mi2. Extrapolation of sediment trap data suggests an annual estimate of sediment
delivery associated with surface erosion of roads of 43 tons/mi2. These findings suggest that under
baseline conditions, surface erosion associated with the current road network delivers an annual
sediment load to streams at a rate roughly six times higher than natural conditions.

October 20, 2005 -16- 033-2156
Golder Associates J:\03JOBS\033-2156EAGLE\FINAL BASELINE\BASELINESTUDYSUMM\ENVBASESTUDYSUMM-TEXT.DOC
Groundwater Quality
Groundwater quality data were collected from May 2004 to May 2005. Groundwater samples
collected from Quaternary deposits were soft to moderately hard and dominated by calcium and
bicarbonate ions. Dissolved oxygen concentrations generally decrease with depth and dissolved iron
and manganese increase in response to this redox condition. Total dissolved solids concentrations
tend to increase with depth. This pattern indicates that shallow water is dominated by precipitation
recharge and then becomes mineralized with depth and residence time.
Other than the vertical changes in hydrochemistry, there are some local variations found in major,
minor and trace constituents at specific monitoring points, but no apparent widespread pattern of
hydrochemical facies changes in the Quaternary system. This indicates that there are no distinct or
separate source waters for the Quaternary system.
Bedrock groundwater is dominated by sodium, potassium, and chloride ions, whereas Quaternary
deposit groundwater is dominated by calcium and bicarbonate ions. This provides further evidence of
poor hydraulic communication between the glacial deposits and bedrock.

October 20, 2005 -17- 033-2156
Golder Associates J:\03JOBS\033-2156EAGLE\FINAL BASELINE\BASELINESTUDYSUMM\ENVBASESTUDYSUMM-TEXT.DOC
4.0 BEDROCK GEOLOGY AND HYDROLOGY
4.1 Data Collection Program
Geophysical and flow logging was completed in six exploration boreholes to identify localized zones
of moderate to high hydraulic conductivity. Geophysical logging results were used to guide selection
of test intervals for subsequent hydraulic tests. Geophysical log tests included:
• Caliper to measure overall borehole diameter and locate coarse fracture zones;
• Fluid temperature and resistivity (FT/R) to help identify flow anomalies where fluid may be entering or exiting the borehole; and
• Heat Pulse Flow Meter (HPFM) under pumped and non-pumped conditions to measure the vertical flow volume in the well bore.
Geophysical logging was performed from September 29 to October 6, 2004. In each borehole, Fluid
Temperature and Fluid Resistivity (FT/R) logs were run first to acquire data in the boreholes with
minimal disturbance to the borehole fluid. Caliper logs were run next and then the HPFM tool was
used.
Hydraulic testing was performed to obtain quantitative estimates of hydraulic properties of the
bedrock groundwater system. Packer equipment was used to isolate select zones of the borehole. In
addition, a groundwater sample was collected in a localized zone of relatively moderate hydraulic
conductivity. Hydraulic testing was performed in four boreholes at selected intervals within each
boring.
4.2 Bedrock Geology
The Yellow Dog Plains in northern Marquette County is composed of Precambrian rocks overlain by
glacial Quaternary and post-glacial Quaternary sediments. Bedrock beneath the Plains is mostly
metasedimentary rocks of the Michigamme Formation, part of the Marquette Range Supergroup of
Proterozoic age rocks (roughly 2 billion years old). These metasedimentary rocks are contained in an
east-west trending structural trough known informally as the Baraga Basin. This trough is flanked on
the north, south, and east by gneiss and greenstone Archean basement rocks, older than 2.5 billion
years. Because of the extensive Quaternary deposit cover on the Plains, very little exposure of the

October 20, 2005 -18- 033-2156
Golder Associates J:\03JOBS\033-2156EAGLE\FINAL BASELINE\BASELINESTUDYSUMM\ENVBASESTUDYSUMM-TEXT.DOC
Michigamme Formation exists in this area. The Archean basement rocks have numerous outcrop
exposures surrounding the Baraga Basin.
The Michigamme Formation beneath the Yellow Dog Plains consists of fine-grained clastic rocks,
largely black slate and argillite as shown by core drilling. These rocks were deformed and
metamorphosed to the greenschist facies about 1.9 billion years ago, during the Penokean orogenic
event.
Emplaced into the Michigamme Formation are east to west-trending diabase dikes of early
Keweenawan age, intruded about 1.1 billion years ago. The Yellow Dog Peridotite is present in the
central Yellow Dog Plains, and is known from two outcrops located in T50N, R29W, Sections 11 and
12, along one of these dike trends. The Eagle nickel mineralization prospect is located within the
peridotite near the outcrop located in Section 11. The peridotite is generally undeformed and only
moderately serpentinized. The higher grade mineralization either post dates or is syn-deformation.
The deformation event is best characterized as a WNW-ESE trending dextral shear coupled with
evidence of dilation. The event may have been responsible for the location of, and controls the shape
of, the intrusive units including the massive and semi-massive sulfide mineralization. Major
structures could exist on the edges or contacts of the earlier intrusions, including gabbros,
pyroxenites, and peridotites containing disseminated sulfides.
4.3 Bedrock Hydrology
Main components of the conceptual model of groundwater flow in bedrock are divided into static and
dynamic components. The weathering zone is used as a generic rock mechanic description for the
enhanced fracturing that occurs in the upper portion of bedrock due to surface-related fractures.
Surface-related fractures include fractures developed during unloading, release of stored stress and
strain, creation of free surfaces or unsupported boundaries, and weathering in general.
4.3.1 Static Conceptual Model
The static hydrogeologic bedrock conceptual model has been simplified to three main components.
Analytical results of hydraulic tests show relatively moderate hydraulic conductivity for the upper
portion of the boreholes, attributed to enhanced fracturing due to weathering. Below the weathered
zone, hydraulic testing results show that the bulk of the rock mass has a relatively low hydraulic
conductivity proximal to what could be expected for the matrix of the formation. In two boreholes,

October 20, 2005 -19- 033-2156
Golder Associates J:\03JOBS\033-2156EAGLE\FINAL BASELINE\BASELINESTUDYSUMM\ENVBASESTUDYSUMM-TEXT.DOC
localized zones of relatively moderate hydraulic conductivity (water conductive fractures) were
identified with flow logging tools, attributed to flow in fractures, and quantified with hydraulic tests
in one borehole. The relative infrequency of these water conductive fractures below the weathered
zone suggests a relatively sparse distribution in the rock mass.
The weathered zone is approximately 300 feet thick with a hydraulic conductivity of approximately
2 x 10-06 cm/s. Hydraulic tests performed in the upper portion of four boreholes provide the basis for
defining the weathered zone.
The unweathered bedrock zone underlying the weathered zone has an average hydraulic conductivity
of approximately 5 x 10-08 cm/s. This value is relatively low and considered representative of the
rock matrix.
Two water conductive fractures were interpreted from data obtained below 300 feet over an
equivalent vertical distance of 4,662 feet and equivalent to a horizontal distance of 1,135 feet.
Therefore, these data suggests that water conductive fractures below approximately 300 feet are
sparsely distributed in the rock mass. A transmissivity of 3.14 x 10-04 cm2/s was estimated for the
water conductive fracture identified in one borehole. Testing was not performed for the other water
conductive fracture identified at the site. The water conductive fractures were encountered in the
shallowest dipping boreholes which are more likely to intersect sub-vertical water fractures compared
to the steeply dipping boreholes. One water conductive fracture was encountered in a north-south
(180° azimuth) trending borehole and the second water conductive fracture was identified in an
east-west (100° azimuth) trending borehole. Both water conductive zones were within a massive or
semi-massive sulfide unit.
4.3.2 Dynamic Conceptual Flow Model
The dynamic conceptual flow model addresses hydraulic communication between Quaternary
hydrostratigraphic units and the bedrock groundwater system. A pressure gauge installed in one
monitoring well completed in Quaternary sediments showed no response to packer testing in the
bedrock wells with one exception which was attributed to packer bypass. Therefore, monitoring
results indicate negligible direct hydraulic communication between Quaternary hydrostratigraphic
units and the bedrock groundwater system in the vicinity of the boreholes.

October 20, 2005 -20- 033-2156
Golder Associates J:\03JOBS\033-2156EAGLE\FINAL BASELINE\BASELINESTUDYSUMM\ENVBASESTUDYSUMM-TEXT.DOC
Water samples collected from bedrock between 845 and 854 feet in one borehole contained a TDS
concentration that was much higher than expected for the water quality of the Quaternary aquifers.
This large difference in chemistry also suggested that locally the Quaternary aquifers and the deep
bedrock groundwater systems are in poor hydraulic communication.
The matrix in basement rocks has essentially no effective porosity (Aguilera, 1995) and very low
hydraulic conductivity. Therefore, water conductive fractures encountered in unweathered bedrock
will potentially have a high inflow rate when a large hydraulic gradient is first applied to them that
will then decline with time. The rate of decline will be dependent on the storage capacity of the
fractures with a more rapid decline expected for water conductive fractures with relatively small
storage capacity. However, there are exceptions. For example, the rate would not be expected to
decline rapidly if the water conductive fractures were in good hydraulic communication with a source
of recharge such as the weathered zone, which has a much higher storativity and hydraulic
conductivity and would essentially behave as a constant pressure boundary.
4.4 Numerical Groundwater Monitoring
FDA was contracted to develop a numerical groundwater flow model to aid in the assessment of the
following:
• Groundwater flow field beneath Yellow Dog Plains; and
• Potential effects to groundwater and surface water flow as a result of mine dewatering.
The numerical groundwater flow model was developed using Visual MODFLOW (version 4.0) to
simulate groundwater flow in the study area. MODFLOW is a finite-difference code developed by
the U.S. Geological Survey that is widely accepted within the industry as a valid tool to simulate
groundwater flow conditions.
The numerical flow model was configured based on the conceptual hydrogeological model developed
by North Jackson Company. The general area covered by the numerical model includes the southern
75 percent of the Yellow Dog Plains. The finite-difference grid was configured to simulate an area
extending approximately 7.5 miles from northwest to southeast and 5 miles from northeast to
southwest. Horizontal dimensions of individual model cells are 164 feet by 164 feet. The model grid

October 20, 2005 -21- 033-2156
Golder Associates J:\03JOBS\033-2156EAGLE\FINAL BASELINE\BASELINESTUDYSUMM\ENVBASESTUDYSUMM-TEXT.DOC
was oriented to coincide with the predominant direction of groundwater flow (normal to the steep
faced terrace north of Yellow Dog Plains).
The model was configured with 13 layers to represent the following:
• Layer 1 – Upper A zone (coarse-grained outwash);
• Layer 2- Lower A zone (coarse-grained outwash);
• Layer 3 – B Zone (fine-grained outwash);
• Layer 4 – C Zone (fine-grained outwash);
• Layer 5 – D Zone (coarse-grained outwash);
• Layer 6 – E Zone (fine- and coarse-grained till and outwash);
• Layer 7 – Upper section of bedrock generally under Yellow Dog Plains;
• Layer 8 – Upper Bedrock generally under Yellow Dog Plains; coarse-textured till beneath and north of terrace slope;
• Layer 9 – Upper Bedrock generally under Yellow Dog Plains; coarse-textured till beneath and north of terrace slope;
• Layers 10 and 11 – Upper Bedrock; and
• Layers 12 and 13 – Lower Bedrock with occasional water conductive fractures.
Where applicable, initial horizontal and vertical hydraulic conductivity values were assigned based on
aquifer test results. Boundary conditions used in the model include no flow, constant head, drain,
river, and recharge packages. The various boundaries were set at locations to simulate features such
as hydrologic divides (no flow boundaries), seeps (drains), and rivers (river package), to approximate
the general geometry of the modeled area and allow for the accounting of water into and out of the
subsurface.
The preliminary groundwater model was executed under steady state conditions (no change in
groundwater storage). Future modeling efforts may include transient simulations to improve the
accuracy of the model. The model was calibrated by adjusting aquifer parameters (hydraulic
conductivity, layer thicknesses, etc.) and recharge rates until simulated head values closely matched
head values measured in the field and simulated streamflow values matched measured streamflow

October 20, 2005 -22- 033-2156
Golder Associates J:\03JOBS\033-2156EAGLE\FINAL BASELINE\BASELINESTUDYSUMM\ENVBASESTUDYSUMM-TEXT.DOC
values. Efforts were made to attain the best match between simulated heads and measured heads in
areas closest to the proposed mine facility and underground workings.
The current numerical groundwater model has a mass balance error of less than 0.01 percent, which
suggests an excellent match between water entering the model and water leaving the model.
Simulated river outflow was 27.79 cfs, which closely matches the total baseflow measured at four
gaging stations during October 2004 of 27.84. The model is considered to be an additional tool that
will be used to assess potential impacts of proposed mining activities on groundwater resources in the
area and help predict operational considerations for the mine.
October 20, 2005 -23- 033-2156
Golder Associates J:\03JOBS\033-2156EAGLE\FINAL BASELINE\BASELINESTUDYSUMM\ENVBASESTUDYSUMM-TEXT.DOC
5.0 SURFICIAL GEOLOGY AND TERRAIN ANALYSIS
During June 2004, Golder conducted an examination of surficial geologic and terrain conditions
within an approximate two square mile area surrounding the proposed mine site. Specific objectives
of the surface geologic and terrain analyses include the following:
• Document the types and general geotechnical properties of the geologic materials (e.g., glacial deposits vs. bedrock) that will underlay key features such as buildings, foundations, excavations, conduits, and waste management units;
• Identify and delineate topographic conditions that could have an effect on possible future development. Examples include lineaments, steep terrain, or other visible large-scale features that could be indicative of particular geologic features;
• Identify on-site glacial deposits that could be of value during construction and operations (e.g., sand, clay); and
• Identify areas where ground engineering and future geotechnical borings may be required due to unsuitable substrates (e.g., peat).
5.1 Results
Results of Golder’s surface geology and terrain analysis, including laboratory analysis of select metal
constituents in glacial outwash samples, are summarized below:
5.1.1 Geologic Conditions
The Yellow Dog Plains are a broad, flat sheet of Quaternary (i.e., ca. 10,000 years old) glacial
outwash that is underlain by the metasedimetary Michigamme Formation, and that is situated between
outcroppings of granitic Precambrian bedrock to the north and south.
Sandy outwash was encountered at every waypoint where samples were collected. A majority of the
soil samples fall into a classification of poorly graded sand (SP), along with a minority of samples
that include:
• Poorly graded sand with silt (SP-SM);
• Silty sand (SM);
• Well graded sand (SW);

October 20, 2005 -24- 033-2156
Golder Associates J:\03JOBS\033-2156EAGLE\FINAL BASELINE\BASELINESTUDYSUMM\ENVBASESTUDYSUMM-TEXT.DOC
• Poorly/well graded sand with gravel.
Laboratory measurements indicate that nine of the ten samples analyzed contained over 50 percent
fine sand, and less than 5 percent silt. Cobbles are ubiquitous where the outwash is exposed along the
site’s unpaved roads and on erosional surfaces. Below a depth of approximately 1 foot, the fine sandy
outwash is typically dense, of varying degrees of reddish brown hue. The small fraction of fines in
the outwash indicates that precipitation would infiltrate rapidly into the subsurface.
5.1.2 Geomorphology
Regionally, the Yellow Dog Plains formed as glacial materials were preferentially deposited over the
Michigamme Formation, the surface of which is low relative to the granitic terrain to the south and
north. The regionally flat surface of the Yellow Dog Plains is the result of glacial melt water having
deposited the upper stratum of fine sandy outwash in a nearly level configuration. Within the study
area, the two peridotite exposures, being resistant igneous intrusive bodies into the Michigamme
Formation, have withstood erosion during the last glacial advance.
Within the surface geology study area, the geomorphologic features of note are the moderate to steep
terraces that formed in Section 11 due to post-glacial melt water and modern erosion along the
Salmon Trout River, and due to glacial melt water in the southern portion of Section 12. Neither
feature will impede development of conceptual mining facilities above ground in the northwest
quadrant of Section 12.
5.1.3 Terrain
According to the MDEQ, the Yellow Dog Plains have been heavily impacted by historic logging and
silviculture activities. A 2004 archeological study documented two historical logging camps within
the study area dating from as early as 1939. Golder’s field reconnaissance indicates that the majority
of the surface geology study area has been logged within the past 10 to 20 years. Golder encountered
ubiquitous remains of branches and stumps that were not included as part of the timber harvest.
Some areas exhibit a more mature state of regrowth (e.g., >30 years). Much of the terrain is typically
flat-lying and deeply furrowed due to mechanized harvesting and replanting. These logged areas are
characterized by numerous historical and current logging roads.

October 20, 2005 -25- 033-2156
Golder Associates J:\03JOBS\033-2156EAGLE\FINAL BASELINE\BASELINESTUDYSUMM\ENVBASESTUDYSUMM-TEXT.DOC
The terrain north, east and west of the east peridotite bedrock exposure is topographically well-suited
for the development of surface facilities. The terrain is essentially flat and has been nearly entirely
logged. The flat terrain minimizes the potential for runoff of possible liquid process wastes.
Based on field observations, Golder anticipates that a well-drained fine sand substrate free of peat or
other types of unstable materials will be encountered north of the east peridotite exposure. Golder
does not anticipate difficulties in excavating into the sandy outwash, as there are no indications of
large boulders. A thin zone of indurated sand within 1 to 1.5 feet of the ground surface may be
encountered at some locations.
5.1.4 Outwash Sample Geochemistry
Soil pH conditions in the northwest quarter of Section 12 of the study area are naturally acidic. A
total of 26 samples produced pH values ranging from 4.2 to 6.6. Of the 26 samples tested,
25 exhibited pH values less than 5.5, including 7 less than 5.0. These acidic conditions are consistent
with and conducive to the abundant growth of blueberries on the sandy soil of the Yellow Dog Plains.
Local concentrations of some metals in study area soil samples are naturally elevated with respect to
statewide averages. Mean concentrations exceed MDEQ-published Statewide Default Background
Concentration criteria for the following metals: aluminum, barium, chromium, iron, and selenium.
Maximum concentrations exceed the same statewide criteria for the following metals: aluminum,
arsenic, barium, cobalt, chromium, iron, mercury, lithium, manganese, selenium, and zinc.
Maximum metal concentrations tend to be associated with the lowest soil pH values. Of the
26 samples that were analyzed, 5 exhibited pH values of 4.8 or less. These 5 samples collectively
yielded the highest concentrations for 23 of the 48 metals tested. One sample alone accounted for
13 of those 23 maximum concentrations. This indicates that these heavy metals are associated with
acidic soils or tend to accumulate in zones where they have been mobilized from overlying horizons
under acidic conditions in the root zone.

October 20, 2005 -26- 033-2156
Golder Associates J:\03JOBS\033-2156EAGLE\FINAL BASELINE\BASELINESTUDYSUMM\ENVBASESTUDYSUMM-TEXT.DOC
6.0 AQUATIC RESOURCES
This section presents the findings of WCR’s assessments for aquatic organisms and aquatic habitats.
Figure 4 identifies the five stations sampled. Three stations were sampled within the project area on
the Salmon Trout River and two stations (Cedar Creek and Yellow Dog River) were sampled outside
of the project area (Figure 4).
6.1 Objectives
The purpose of conducting the aquatic assessments was to: (1) characterize the physical
characteristics and quality of the streams at the locations sampled, (2) identify the macroinvertebrate
and fish communities that inhabit the streams, and (3) document baseline conditions for use in
monitoring.
6.2 Methods
Methods used to assess the biological integrity of the streams at each sampling location are those set
forth in Great Lakes and Environmental Assessment Section (GLEAS) Procedure #51, Qualitative
Biological and Habitat Survey Protocols for Wadable Streams and Rivers (1997), with 2002 revisions
(Procedure 51) (MDEQ 1997). Procedure 51 is accepted by both federal and state agencies as an
accurate, consistent, and repeatable sampling and analytical protocol for Michigan streams.
The survey protocols detail evaluation of the macroinvertebrate community, the fish community, and
habitat quality. The results are used as indicators of water quality and biological integrity. Analysis
is made according to a set of selected metrics (measurements) that are made in the field. Under
protocols for Procedure 51, biological integrity of a stream is based on results of fish and
macroinvertebrate community sampling. However, fish community scores are not calculated for
coldwater streams. Instead, sampling is used to evaluate whether a stream meets coldwater
designation. To meet this designation, the proportion of salmonids to the total number of fish must
exceed 1 percent. Therefore, the biological integrity at each station is based upon the scores for
macroinvertebrates only.
October 20, 2005 -27- 033-2156
Golder Associates J:\03JOBS\033-2156EAGLE\FINAL BASELINE\BASELINESTUDYSUMM\ENVBASESTUDYSUMM-TEXT.DOC
6.3 Results
6.3.1 Salmon Trout River
The Salmon Trout River flows south to north through the center of the study area. North of AAA
Road, the river is narrow and flows through a steep valley with high gradients and substrates
dominated by sand and coarse material. These substrates are suitable spawning habitat for brook
trout. Numerous groundwater seeps are present on the valley slopes, and vegetation adjacent to the
channel is dominated by dense woody plants, which provide shade and cover.
The character of the river upstream of AAA Road is significantly different than downstream reaches.
These are the upper headwaters where adjacent wetland complexes provide expansive floodplain
areas that function to stabilize flow and filter sediment. This area of the river has been significantly
impacted by beaver dams, which have created impoundments over 5 feet deep and greater than
30 feet wide. Stream substrates consist of fine materials, and flow velocities are low.
Habitat assessments associated with the stream resulted in a rating of excellent at all three stations
sampled. Flows appear to be very stable, and the stream banks are well vegetated with little evidence
of erosion, despite the presence of clear-cut logging operations within the watershed. Water
temperature was conducive to survival of coldwater organisms, including trout, during August
sampling. In-stream habitat is diverse, with an abundance of hard substrates and woody debris.
Even though the stations on the Salmon Trout River received high scores for habitat, excessive
deposition of sediment was found at all three stations. Causes of sedimentation were not investigated;
however, likely sources include local roads and logging operations within the watershed.
Habitat surveys previously conducted by the MDEQ and MDNR on the Salmon Trout River resulted
in similar findings (MDEQ 2002, Madison 1998). Assessments by the MDEQ downstream of the
project study area resulted in a habitat score of excellent using Procedure 51. Habitat assessments by
Madison (1998) were limited to general observations and measurements of stream morphology at two
sites on the river (MDNR Survey Sites 7 and 8), one that coincides with Station 3 sampled by WCR.
MDNR observations found similar conditions including the presence of spawning substrates, dense
bank cover, and impacts from sand deposition. Logging activities and road infrastructure within the
watershed were identified as primary sources of sedimentation.

October 20, 2005 -28- 033-2156
Golder Associates J:\03JOBS\033-2156EAGLE\FINAL BASELINE\BASELINESTUDYSUMM\ENVBASESTUDYSUMM-TEXT.DOC
The Salmon Trout River is designated by the MDNR as a coldwater stream supporting populations of
naturally reproducing brook trout. Fish surveys at the three stations on the Salmon Trout River
support this designation within the study area. A total of 65 fish were collected with the majority of
the catch consisting of brook trout (76.9 percent). Water temperatures at sample locations were 60º F
or lower during sampling in August 2004. A self-sustaining population of migratory, or “coaster,”
brook trout is also known to exist in the Salmon Trout River; however, there are a number of
impassable dams and waterfalls located approximately five miles downstream from the project area
that prevent movement upstream to the project area. Therefore, all brook trout collected as part of
this study are assumed to be non-migratory.
6.3.2 Cedar Creek
Cedar Creek, upstream of Northwestern Road, resembles the Yellow Dog River at Station 5
(Figure 4) in its size and physical attributes, while areas downstream of Northwestern Road more
closely match the Salmon Trout River at Station 3 (Figure 4). Cedar Creek was established as a
control site outside the influence of the project area.
Habitat at Station 4 (Figure 4) was rated as good when combining both glide-pool and riffle-run
scores. Although sediment covers many areas of the stream bed, dense bank cover, stable banks, and
natural riparian zones account for the higher scores. Road grading activities, steep road slopes, and
clear-cutting within the watershed are likely the primary sources of sediment.
Fish surveys on Cedar Creek resulted in collection of only 13 fish, in spite of extending the length of
the sample reach to 300 ft (91 m). All fish collected were brook trout, and two individuals exceeded
legal size limits for harvest. These results are similar to those found at Stations 1 and 3 on the
Salmon Trout River. However, fish densities were much lower in Cedar Creek, which is likely the
result of habitat differences between stations.
Macroinvertebrate sampling in Cedar Creek resulted in a rating of acceptable. Pollution-intolerant
species and a diversity of taxa were collected. However, wider stream reaches are expected to have a
greater amount and diversity of habitat and are scored more critically. The score at the Cedar Creek
Station is likely a result of a lesser amount of preferred habitat (substrates) due to sedimentation.
October 20, 2005 -29- 033-2156
Golder Associates J:\03JOBS\033-2156EAGLE\FINAL BASELINE\BASELINESTUDYSUMM\ENVBASESTUDYSUMM-TEXT.DOC
6.3.3 Yellow Dog River
The Yellow Dog River is located south and east of the study area. It flows west and discharges into
Lake Independence. Much of the river south of the site is surrounded by a large, high-quality wetland
system. Observations at road crossings downstream of Station 5 (Figure 4) show the river to consist
of a variety of habitats desirable for trout and other coldwater organisms.
Assessment of habitat in the Yellow Dog River resulted in a good, or slightly impaired, rating. Like
the Salmon Trout River and Cedar Creek, sediment appears to be negatively affecting aquatic habitat
on the Yellow Dog River. Sources of sediment were not investigated; however, road grading
activities, steep road slopes, and clear-cutting are expected to be primary sources of sediment.
Although Yellow Dog River at Station 5 received an acceptable macroinvertebrate score, it had the
lowest number of macroinvertebrates collected and the lowest overall score of the five stations
sampled. Results likely reflect the presence of sediment and resulting loss of preferred habitat.
However, many of the macroinvertebrates associated with Station 5 have a moderate to high tolerance
to pollution, indicating good water quality and that some existing habitats are suitable for
colonization.
Macroinvertebrate sampling conducted by MDEQ in 2002 showed conflicting results downstream of
Station 5 at County Road 510 (MDEQ 2002). Both habitat and the macroinvertebrate community
were rated as excellent by MDEQ. These results reflect habitat differences between stations and are
consistent with observations of downstream areas by WCR, where higher quality in-stream habitat
was observed.
Sampling for fish at Station 5 did not result in collection of any trout species; however, two species of
fish were collected that are both indicators of good water quality. The lack of trout in the catch does
not allow for coldwater designation under Procedure 51. Still, trout populations are known to be
prevalent in the Yellow Dog River, and water temperatures are conducive to year-round survival.
The Yellow Dog River is, therefore, designated as a coldwater trout stream by the MDNR.

October 20, 2005 -30- 033-2156
Golder Associates J:\03JOBS\033-2156EAGLE\FINAL BASELINE\BASELINESTUDYSUMM\ENVBASESTUDYSUMM-TEXT.DOC
7.0 VEGETATION – WETLAND DELINEATION
WCR was contracted by Golder to perform wetland delineations within the project study area. WCR
conducted field assessments and delineations within the study area during the 2004 and 2005 field
seasons.
7.1 Objectives
The purpose of conducting the wetland delineations was to identify the size and location of wetlands
and to provide field flagging for survey of boundaries, if necessary.
7.2 Methods
7.2.1 Field Assessment
Two Professional Wetland Scientists from WCR delineated all wetland boundaries in the spring and
summer of 2004 and the spring of 2005. Delineations were completed by placing high visibility
glow-pink flagging tape at the upland/wetland interface. Flags were sequentially lettered and
numbered, and the approximate location of each wetland was sketched on aerial photographs.
Delineation methodology was based on statutory language and rules found in Part 303, Wetland
Protection, of the Natural Resource and Environmental Protection Act (NREPA), 1994 PA 451, as
amended, and guidance manuals and procedures set forth by the MDEQ for delineating wetlands in
Michigan.
These methods identify wetland boundaries based on the following:
• Predominance of wetland vegetation;
• Visual signs of wetland hydrology:
○ Buttressed root systems ○ Hummocked ground surface ○ Dark stained leaves ○ Saturated soils within 12 inches of the surface ○ Water standing above ground surface
• Visual topographic breaks;

October 20, 2005 -31- 033-2156
Golder Associates J:\03JOBS\033-2156EAGLE\FINAL BASELINE\BASELINESTUDYSUMM\ENVBASESTUDYSUMM-TEXT.DOC
• Presence of hydric soil:
○ Dark surface soil with subsurface A horizon soils having a reduced matrix (chroma 2 or less) and redoximorphic concentrations within 12 inches of the surface
○ Dark surface soils with subsurface A horizon soils having a reduced matrix (chroma 1 or less) within 12 inches of the surface
○ Any hydric soil indicator listed in “Field Indicators of Hydric Soils in the United States” (USDA 1998).
Visual signs of wetland hydrology and a predominance of wetland vegetation were the primary
wetland indicators used during the delineations. In the absence of visual signs of wetland hydrology,
soil was examined to assess whether hydric soil was present and/or signs of wetland hydrology were
present within the soil profile. Areas not having a dominance of wetland vegetation and/or lacking
visual signs of wetland hydrology or signs of hydrology within the soil profile were classified as
upland.
7.3 Results and Discussion
Twenty-six wetland areas were delineated within the study area. The areas were delineated using
over 8,000 delineation flags. The wetlands ranged from expansive systems associated with the
Salmon Trout and Yellow Dog Rivers to small, isolated wetlands impacted by timbering activities.
There are no wetlands present within the area of proposed mining surface facilities.

October 20, 2005 -32- 033-2156
Golder Associates J:\03JOBS\033-2156EAGLE\FINAL BASELINE\BASELINESTUDYSUMM\ENVBASESTUDYSUMM-TEXT.DOC
8.0 THREATENED AND ENDANGERED SPECIES
The purpose of this evaluation is to collect baseline environmental data and to document existing
habitat conditions related to the presence/absence of Threatened and Endangered (T&E) Species,
species of concern, and unique or threatened plant communities. The T&E assessments were
conducted at a number of different times from May through October 2004 to coincide with the
optimum times for the target habitats and species.
8.1 Objectives
Objectives of conducting the T&E assessments were: (1) to determine if threatened, endangered,
and/or special concern plant or animal species are present within the study area and (2) to determine if
habitat is present that could potentially support threatened, endangered, and/or special concern plant
and animal species.
8.2 Methods
8.2.1 Literature Review and Field Preparation
Prior to conducting field investigations, WCR obtained available information to provide initial
direction and focus for field assessments. The USDA Soil Survey information for Marquette County,
Michigan Department of Natural Resources’ (MDNR) Marquette County Element List, and U.S. Fish
and Wildlife Service (USFWS) National Wetland Inventory (NWI) maps were obtained to assist with
field assessments. Records and information on T&E species, species of concern, and unique or
threatened plant communities within or near the project area were obtained from Michigan Natural
Features Inventory (MNFI).
Specific target habitat and species were identified based on information received from MDNR, MNFI
and literature reviews conducted by WCR. Target species are those species listed as threatened,
endangered, or species of concern by MDNR and MNFI, with documented occurrences near the study
area. Target natural communities are those identified in correspondence from MNFI, and target
habitats are those habitats identified in the literature that support the target species.
Field assessments were scheduled to ensure that target habitats and species were assessed during
optimum times for viewing and/or identification, whenever possible. Information regarding optimal

October 20, 2005 -33- 033-2156
Golder Associates J:\03JOBS\033-2156EAGLE\FINAL BASELINE\BASELINESTUDYSUMM\ENVBASESTUDYSUMM-TEXT.DOC
sampling periods and habitats was obtained from professional experience and MNFI abstracts.
Descriptions of habitat and key species identification features were disseminated to all WCR
biologists prior to conducting field assessments.
8.2.2 Field Assessment Methodologies
Field assessments required a minimum of two biologists to visually inspect all of the project area and
to record all observations and sightings of terrestrial and aquatic plant and animal species present.
Assessments were conducted in accordance with Section 365, of National Resources and
Environmental Protection Act (NREPA), P.A. 451 of 1994, as amended, and “Guidelines for
Conducting Endangered and Threatened Species Surveys,” as set forth by the MDNR Wildlife
Division Endangered Species Coordinator.
8.2.2.1 Vascular Plant Assessments
Habitat types were identified and differentiated based on plant communities and physical features
associated with each habitat. An extensive search was conducted in an attempt to document all plants
species within each habitat type. Boundaries of each habitat were documented on aerial photographs.
The MDNR’s Floristic Quality Assessment (FQA) program was used to assess floristic quality. This
program calculates several metrics based on the diversity of plant species present within a given area.
These metrics are used to identify the significance of upland and wetland plant communities and their
potential to harbor state or federally threatened, endangered, candidate, or special concern plant
species.
8.2.2.2 Wildlife Assessments
During the initial site survey, seven permanent wildlife sampling transects were established and
surveyed with a GPS. The transects were established to conduct wildlife assessments within a
continuum of habitat types and to include assessment of the habitat types present throughout the site,
including those areas where mining surface facilities may be established. Transects were also
established to sample known locations for comparison with potential future studies. Along each
transect, three sampling stations were established, creating a total of 21 sampling stations. These
stations were used to sample small mammals and birds.

October 20, 2005 -34- 033-2156
Golder Associates J:\03JOBS\033-2156EAGLE\FINAL BASELINE\BASELINESTUDYSUMM\ENVBASESTUDYSUMM-TEXT.DOC
In addition to the 21 sampling stations discussed above, 3 frog and toad survey stations were also
established. These stations were separate from the 21 stations and 7 transects and were chosen based
on the presence of specific habitat types preferred by species that may occur on site.
In addition to data collected at the sampling stations, wildlife data were collected throughout the site
by recording visual signs of wildlife including direct observation, tracks, scat, or other evidence.
These data were collected strictly through incidental observation, and the general location of the
observation was recorded.
A minimum of two WCR biologists were present during all sampling periods in May, June, and
October, 2004. Bird assessments were conducted during all three months to cover spring and fall
migration and summer nesting. Small mammals were assessed during the initial site investigations in
May 2004. Frogs and toads were sampled during spring breeding periods in May and June 2004.
Field assessments were scheduled so that the majority of bird and frog species with potential to use
the property were assessed at least once during their optimal time periods.
8.3 Results
T&E species assessments commenced at the beginning of May 2004 and continued through the end of
October 2004. Thirteen habitat areas were identified within the study area. One state-threatened
plant species, narrow-leaved gentian (Gentiana linearis), and one sate-threatened bird species, bald
eagle (Haliaeetus leucocephalus), were observed within the project area. A plant specimen that
resembles the state-endangered small yellow pond-lily (Nuphar pumila; a.k.a. N. microphylla) was
observed, but could not be positively identified due to lack of flowers or fruit. In addition, although
no evidence of the presence of the state- and federally-threatened gray wolf (Canis lupis) was
documented, the species is known to occur widely throughout Michigan’s Upper Peninsula. While
habitat is present that could support additional protected plant and animal species, none were
observed.

October 20, 2005 -35- 033-2156
Golder Associates J:\03JOBS\033-2156EAGLE\FINAL BASELINE\BASELINESTUDYSUMM\ENVBASESTUDYSUMM-TEXT.DOC
9.0 WILDLIFE
This section presents a summary of the baseline wildlife species assessment within the study area,
focusing on lands that may be used for future mining activities. Habitat types on site range from
clear-cut with little plant regeneration to mature forest. WCR conducted field assessments of
individual birds, small mammals, frogs and toads, large mammals, and Threatened and Endangered
species along with their preferred habitats, during spring, summer, and fall of 2004 and spring of
2005. The wildlife survey was designed to be a comprehensive baseline assessment and not limited
to Threatened and Endangered species.
9.1 Objectives
Objectives of conducting baseline wildlife assessments were to: (1) identify species that inhabit, use,
or otherwise occupy lands within the project area and (2) provide information on wildlife use and
habitats to assist in the development of a site layout plan.
9.2 Methods
9.2.1 Literature Review and Field Preparation
Prior to field investigations, WCR sought and obtained available data and information to provide
initial direction and to focus the wildlife assessments on specific habitat types. Sources included the
USDA, MDNR, MDEQ, Whitefish Point Bird Observatory, Marquette County Plat Book, USFWS,
and NWI. In addition, a literature search was undertaken, and copies of existing environmental
studies and inventories conducted within or near the project area were obtained for background data.
9.2.2 Field Assessment Methodologies
During the initial site survey, seven permanent wildlife sampling transects were established and
surveyed with a GPS. The transects were established to conduct wildlife assessments within a
continuum of habitat types and to include assessment of the habitat types present throughout the site,
including those areas where mining operations may be established. Transects were also established to
sample known locations for comparison with potential future studies.
The seven transects are located within various habitat types found throughout the project area.
Locations of the stations were chosen to include all habitat types along the transects, and avoid
October 20, 2005 -36- 033-2156
Golder Associates J:\03JOBS\033-2156EAGLE\FINAL BASELINE\BASELINESTUDYSUMM\ENVBASESTUDYSUMM-TEXT.DOC
overlap of bird sightings between stations. Each station was uniquely labeled with identification of
the transect number and bird and small mammal sample plots.
The small mammal and bird sampling stations covered multiple habitat types including clear-cut areas
with multiple stages of succession, mature upland coniferous forest, mature forest with coniferous and
deciduous overstory, and spruce bog. Four stages of clear-cut habitats were noted, which include:
1) no overstory or shrub layer, 2) young red pine with sparse herbaceous layer, 3) young jack pine
with sparse understory, and 4) mix of young deciduous and coniferous forest with sparse herbaceous
layer. The mature forest and spruce bog habitats consist of old cut with mixture of deciduous and
coniferous, open-stand coniferous with sparse understory, mature coniferous woods with scattered
deciduous trees and sparse understory, and black spruce bog. These habitat types encompass the
majority of ecotypes found in the study area, excluding some of the wetland complexes near the
Salmon Trout River.
9.3 Results
9.3.1 Wildlife Communities
Birds
The project area is used by migrating bird species in the spring and fall and by resident species for
nesting, resting, and feeding. No rare or unique small bird species were noted during surveys, though
results show bird diversity to be high for the size of the study area. The diverse population reflects
the variety of habitat types found on the site, which ranges from clear-cut areas to mature forest and
bogs. Clear-cut areas were found to have a similar diversity of bird species as the forested areas.
However, results indicate that lower overall numbers of birds utilize the clear-cut areas.
Small Mammals
The number of small mammals collected in forested areas was higher than in clear-cut areas. This is
a result of habitat preference and requirements that are present in the forested areas and lacking in cut
areas. Due to the low number of individuals captured, no statistical comparison of capture between
sample sites was performed.
Although only four species of small mammals were collected, additional species are likely present on
site based on the presence of available habitat. Such species might include southern bog lemmings

October 20, 2005 -37- 033-2156
Golder Associates J:\03JOBS\033-2156EAGLE\FINAL BASELINE\BASELINESTUDYSUMM\ENVBASESTUDYSUMM-TEXT.DOC
(Synaptomys cooperi), masked shrews (Sorex cinereus), and woodland jumping mice (Napaeozapus
insignis), among others.
Frogs and Toads
Survey results suggest the beaver ponds of the Salmon Trout River contain healthy populations of
frogs, as evidenced by the survey results. Northern spring peepers were the most common frog
species observed. Frog species and density of individuals may be greater than reported. The selected
May and June 2004 sampling dates may not have corresponded with peak breeding times of all
species, though it likely covered the majority of species.
Large Mammals
The site contains habitat suitable for white-tailed deer, eastern coyote, fox, black bear, American
beaver, and moose. Based on observed tracks and scat, the area exhibiting the highest large mammal
use is a clear-cut area with aspen regeneration, located south of AAA Road and east of the Salmon
Trout River, and portions of the black spruce bog immediately west of the clear-cut area. The young
aspen are providing excellent feeding habitat for large mammals, and the bog provides dense cover.
Clear-cut areas lacking deciduous tree regeneration have few large mammal tracks or droppings.
Eastern coyote scat was identified on site, and it is likely that red fox (Vulpes vulpes) and gray fox
(Urocyon cinereoargenteus) also traverse the property. American beaver cuttings and dams were
observed near the Salmon Trout River south of AAA Road.
Other Wildlife and Habitat
Large wetland areas are present within the western half of the study area, along the Salmon Trout
River. The plant composition and physical features of these wetlands provide valuable wildlife
habitat and stream cover.
Forested bog habitats dominated by black spruce are present within the southeastern and southwestern
portions of the study area. These wetlands are part of larger systems that continue south to the
Yellow Dog River and provide significant wildlife habitat and water quality functions that protect and
maintain the quality of the river.

October 20, 2005 -38- 033-2156
Golder Associates J:\03JOBS\033-2156EAGLE\FINAL BASELINE\BASELINESTUDYSUMM\ENVBASESTUDYSUMM-TEXT.DOC
10.0 CULTURAL RESOURCES
This section details the objectives and results of a Phase I archaeological survey for the proposed
Eagle Project. The study included a 73-acre area, defined as the primary area of potential effect
(areas that may be have surficial disturbance associated with proposed mining facilities), within a
larger 199-acre study area. In addition to the formal, set-interval Phase I survey conducted by BHE
on the 73 acres, accessible portions of the 199-acre study area were subjected to a cursory visual
inspection (mostly roads and recreational trails) for surficial evidence of cultural properties.
BHE’s Phase I survey involved the implementation of a variety of archaeological and archival
methods, including a literature review pertaining to the region, an inventory of all previously
identified cultural resources within one mile of the project area, and a field reconnaissance of the
property as defined by the project area boundaries. Methods employed by BHE during this project
were designed to comply with over 30 years of federal regulation governing cultural resources
surveys. Specifically, these regulations include the National Historic Preservation Act (Public Law
89-665, as amended by Public Law 96-515) and the guidelines set forth by the Michigan Historic
Preservation Office (MHPO). The study was completed with field assessments in June 2004 and July
2005.
10.1 Objectives
The goal of the Phase I cultural resources survey was the identification and delineation of all cultural
resources that could potentially be impacted during construction activities within the project area.
10.2 Methods
10.2.1 Research Design
In an attempt to efficiently and effectively complete a Phase I archeological survey at the project area,
a research design was developed to guide field reconnaissance. Phase I was assembled by examining
a variety of factors relevant to the project, a wooded upland plateau in a remote portion of Marquette
County, Michigan. Factors involved in this analysis include:
• Existing and prehistoric environmental conditions and vegetation patterns;
• Known archaeological record of the region, both prehistoric and historic;

October 20, 2005 -39- 033-2156
Golder Associates J:\03JOBS\033-2156EAGLE\FINAL BASELINE\BASELINESTUDYSUMM\ENVBASESTUDYSUMM-TEXT.DOC
• Previous archaeological and cultural resource management related experience of the staff of BHE; and
• Modern land use and development of the area immediate to the project.
Through the development of the research design, several questions can be posed, relevant to the
survey, which can then be answered by the actual field reconnaissance of the project area.
10.2.2 Archival Research Methods
During June 2004, archaeologists from BHE conducted background research in an effort to better
understand the known prehistoric and historic record of the region in general and the survey areas in
particular. This work focused on review of the published and inventoried archaeological data
collected at the MHPO in East Lansing, Michigan and was supplemented by visits to archives local to
the project area, especially the library at Northern Michigan University in Marquette.
10.2.3 Field Methods
The field survey of the proposed project area was conducted using standard archaeological
reconnaissance methods, as outlined by the MHPO. These methods included visual surface
inspection and shallow subsurface shovel testing. The project area was subdivided into fields, and
each field was further subdivided into linear transects and given alphabetical designations. Across
each transect the area was surveyed at 15-meter increments. Within each sample location, notation
was made regarding topography, condition, type of survey method implemented, and the presence or
absence of cultural materials.
10.2.4 Shovel Testing
Shovel testing was used in areas in which the ground surface visibility was less than 75 percent, or
where the depth of soil deposits may preclude an adequate sample having been exposed by plowing.
Shovel tests were arranged at 15-meter intervals, dependent upon local topography, level of modern
deflation of soils, and potential for cultural resources. Individual shovel tests were a minimum of
50 cm in diameter, or 50 cm by 50 cm square, and extended to a depth of 10 cm into sterile deposits,
where such could be identified. All soil removed from each test was screened through 6 millimeter
mesh hardware cloth, and any artifacts recovered were placed in plastic sample bags marked with the
appropriate segment, shovel test, and depth designations.

October 20, 2005 -40- 033-2156
Golder Associates J:\03JOBS\033-2156EAGLE\FINAL BASELINE\BASELINESTUDYSUMM\ENVBASESTUDYSUMM-TEXT.DOC
Pedestrian Inspection
A systematic pedestrian inspection was performed across portions of the four survey areas where
surface visibility was 75 percent or better. In addition, the larger study area was subjected to a casual
windshield and pedestrian inspection. Specifically, visual survey was conducted along heavily
utilized recreational trails, where modern construction activities were readily discernable, or where
standing water was present.
10.3 Results
Based upon the intensive 15-meter interval Phase I survey of 73 acres it was determined that no
cultural properties potentially eligible or eligible to the National Register of Historic Places (NRHP)
exist within the proposed construction footprint of the project.
BHE’s Phase I survey failed to identify any NRHP-eligible cultural resources within the 73-acre area.
The cursory visual inspection of the larger 199-acre area did, however, delineate three previously
unrecorded areas of cultural activity: one prehistoric site and a pair of logging camps of indeterminate
age and association. The pre-historic site consisted of a small scatter of prehistoric lithic debris
identified from the surface of a graded recreational trail. The historic-era logging camps each
contained extant structural remnants, but artifacts were not collected from the site area. As BHE’s
visual identification of these sites did not include any intensive level of survey (such as shovel testing
or pedestrian artifact collection) and the current scope of the project does not involve any ground
disturbance within (or adjacent to) any of the site areas, an assessment of these sites eligibility for the
NRHP has not been provided.

October 20, 2005 -41- 033-2156
Golder Associates J:\03JOBS\033-2156EAGLE\FINAL BASELINE\BASELINESTUDYSUMM\ENVBASESTUDYSUMM-TEXT.DOC
11.0 REFERENCES
Madison, G. 1998. Salmon Trout River Watershed, Marquette County. Michigan Department of Natural Resources. Status of the Fishery Resource, Draft Report.
Michigan Natural Features Inventory, Michigan’s Natural Communities, Draft List and Descriptions. 2003. http://web4.msue.msu.edu/mnfi/data/MNFI_Natural_Communities.pdf
Michigan Department of Environmental Quality (MDEQ) 2002. Biological Surveys of Lake Superior
Coastal Tributaries in Northern Marquette County. Michigan Department of Environmental Quality, Surface Water Quality Division. Report Number MI/DEQ/SWQ-02/017.
Michigan Department of Environmental Quality, 1997. Qualitative Biological and Habitat Survey
Protocols for Wadable Streams and Rivers, GLEAS Procedure Number 51. Michigan Department of Environmental Quality, Surface Water Quality Division, Lansing, Michigan.
Michigan Department of Environmental Quality. 2000. MDEQ wetland identification manual: A
technical manual for identifying wetlands in Michigan. EQ2787. March 2001. United States Department of Agriculture, Natural Resources Conservation Service. 1998. Field
Indicators of Hydric Soils in the United States, Version 4.0. G.W. Hurt, Whited, P.M., and Pringle, R.F. (eds.). USDA, NRCS, Fort Worth, Texas.
US Environmental Protection Agency (USEPA). 1997. Mercury Study Report to Congress. Volume III: Fate and Transport of Mercury in the Environment. Prepared by the Office of Air Quality and Planning and Standards and Office of Research and Development.

Golder Associates J:\03JOBS\033-2156EAGLE\FINAL BASELINE\BASELINESTUDYSUMM\ENVBASESTUDYSUMM-TEXT.DOC
FIGURES

I:/20
03/0
33-2
156/
map
ping
/MX
D/S
oils
/Site
_loc
atio
n_11
x17.
mxd
LEGEND
Digital data provided by Michigan Center for Geographic Information (CGI)(http://www.michigan.gov/cgi) and ESRI. Datum: NAD 83 Projection: Michigan GeoRef (Meters)
REFERENCE
LAKE SUPERIOR
KEWEENAW BAY FINLANDER BAY
L'ANSE INDIANRESERVATION
[_Triple A Road
WISCONSINCounty Road 510
tuM 35
tuM 28
tuM 94
tuM 95
tuM 553
tuUS 41
tuM 35
tuM 35
tuM 94
tuUS 41
County Road 550
Gwinn
K. I. Sawyer AFB
Big Bay
Republic
Harvey
Michigamme
West Ishpeming
Trowbridge Park
Palmer
Negaunee
Marquette
Ishpeming
Ely Twp
Wells Twp
Forsyth Twp
Powell Twp
Republic Twp
Tilden Twp
Champion Twp
Turin Twp
Michigamme Twp
Humboldt Twp
Sands Twp
Ishpeming Twp
Skandia Twp
Ewing Twp
Chocolay Twp
Richmond Twp
Marquette Twp
Negaunee Twp
West Branch Twp
tuUS 141
tuUS 41
tuM 38
tuM 28
LANSE
BARAGA
Lanse Twp
Spurr Twp
Arvon Twp
Baraga Twp
Covington Twp
tuM 69
Harris TwpSpalding Twp
Meyer Twp
tuUS 141
tuUS 2
tuM 69
tuUS 2
Crystal Falls
ALPHA
Crystal Falls Twp
Hematite Twp
Mastodon Twp
Mansfield Twp
Bates Twp
Stambaugh Twp
Crystal Falls
tuM 69
tuM 95
tuM 69Felch Twp
Sagola Twp
Breen Twp
West Branch Twp
Norway Twp
Breitung Twp Waucedah Twp
tuUS 41
tuUS 2
tuM 35
tuM 35
Masonville TwpNahma Twp
Baldwin Twp
Maple Ridge Twp
Cornell Twp
Ensign Twp
Brampton Twp
tuM 94
tuM 67
tuUS 41
tuM 28
tuMunising
Munising
CHATHAM Au Train Twp
Onota Twp
Mathias Twp
Rock River Twp
Limestone Twp
Munising Twp
Grand Island Twp
Grand Island TwpMARQUETTE COUNTY
IRON COUNTY
BARAGA COUNTY
DELTA COUNTY
ALGER COUNTY
DICKINSON COUNTY
MENOMINEE COUNTY
HOUGHTON COUNTY ³ US HIGHWAY
REV. 0DESIGN
SITE LOCATION MAP
FIGURE: 1
PROJECT No. 033-2156C SCALE: 1:500,000
PROJECT
TITLE
GIS
REVIEW
TNKG 19 Aug. 2004
CHECK
EAGLE PROJECT BASELINE ENVIRONMENTAL STUDY
KENNECOTT MINERALS COMPANY
24 Aug. 2004
10 0 105
SCALE: 1:500,000 MILES
KG 24 Aug. 2004JM
COUNTY ROAD
MINOR ROAD
AIRPORT
HYDROGRAPHY
CENSUS DESIGNATED PLACE
TOWNSHIP
COUNTY
INDIAN RESERVATION
MUNICIPAL BOUNDARY
PROPOSED EAGLE PROJECT[_
Reference Map of Michigan
[_
³
25 Aug. 2004

I:/20
03/0
33-2
156/
map
ping
/MX
D/S
um
mar
y_R
epor
t_K
MC
/FIG
_2_1
1x17
.mxd
LEGEND
DRG provided by Michigan DNR. Monitoring locations from North Jackson Company.Datum: NAD 83 Projection: Transverse Mercator Coordinate System: UTM Zone 16
REFERENCE
#I
#I
#I
#I
#I
#I
#I
#I
#I
#I
#I
’4’4
’4’4
’4’4
’4’4’4’4
’4’4
hg
hg
hghghg
hg hg
hg
hg
hg
hg
hg
hg hg
hg
hg
hg
hg
hghg
hg
hg
hg
’4’4
’4’4
’4’4
’4
hg
hg
hg
hghg
hg
hg
hg
’4
#I
QAL021
QAL020
QAL019 QAL018
QAL017
QAL016
QAL015
QAL022
QAL006A/B
QAL005A/D QAL004A/D
QAL003A/B
QAL002A/D
QAL001A/D
QAL010A
QAL009A/D
QAL008A/D
QAL007A/D
QAL023BWLD023
WLD022
WLD021
WLD020
WLD019
WLD018
WLD017
WLD016
WLD015
WLD014WLD013
WLD012WLD011
WLD010
WLD009
WLD008
WLD007WLD006
WLD005
WLD004
WLD003
WLD002
WLD001
Triple A Road
Salmon Trout R
iver
Yellow Dog River
Northwestern Road
STRE002STRM004
CDRA002
YDRM003YDRM002
YDRM001
STRE001
STRW001
STRM003
STRM002
STRM001
STRE006
427000
427000
428000
428000
429000
429000
430000
430000
431000
431000
432000
432000
433000
433000
434000
434000
435000
435000
436000
436000
437000
437000
5174
000
5174
000
5175
000
5175
000
5176
000
5176
000
5177
000
5177
000
5178
000
5178
000
5179
000
5179
000
5180
000
5180
000
5181
000
5181
000
5182
000
5182
000
REV. 0DESIGN
GROUNDWATER MONITORINGLOCATIONS
FIGURE: 2
PROJECT No. 033-2156C SCALE AS SHOWN
PROJECT
GIS
REVIEW
TNSM 4 Oct. 2005
CHECK
EAGLE PROJECT BASELINE ENVIRONMENTAL STUDY
KENNECOTT MINERALS COMPANY
3,000 0 3,000
SCALE: 1: 35,000 FEET
4 Oct. 2005
TITLE
ORE BODY
OUTCROP³ MONITORING WELL
PIEZOMETER
’4
SELECT SURFACE WATER MONITORING LOCATIONS
hg
#I
EAGLE PROJECT

I:/20
03/0
33-2
156/
map
ping
/MX
D/S
um
mar
y_R
epor
t_K
MC
/FIG
_3_1
1x17
.mxd
LEGEND
DRG and watersheds provided by Michigan DNR. Sub-watersheds delineated by Golder Associates Ltd. from Michigan DNR digital elevation model. Surface water data fromNorth Jackson Company. Datum: NAD 83 Projection: Transverse Mercator Coordinate System: UTM Zone 16
REFERENCE
REV. 0DESIGN
SURFACE WATERMONITORING LOCATIONS
FIGURE: 3
PROJECT No. 033-2156C SCALE AS SHOWN
PROJECT
GIS
REVIEW
TNSM 4 Oct. 2005
CHECK
EAGLE PROJECT BASELINE ENVIRONMENTAL STUDY
KENNECOTT MINERALS COMPANY
SCALE: 1: 70,000 FEET
4 Oct. 2005
TITLE
ORE BODY
OUTCROP
SURFACE WATER MONITORING LOCATION#I
EAGLE PROJECT
#I
#I
#I
#I
#I
#I#I
#I
#I
#I
#I
#I
#I
#I
#I
#I
#I#I
#I
#I#I
#I
#I
#I#I
#I
#I
#I
HURON RIVERWATERSHED
CEDAR CREEKWATERSHED
EAST BRANCH
WEST BRANCH
MAINSTEM
SALMON TROUT RIVERWATERSHED
PINE RIVERWATERSHED
YELLOW DOG RIVER WATERSHED
Triple A Road
Northwestern Road
Salm
on T
rout
Riv
er
Yello
w Dog R
iver
STRM009
STRE014
STRE013
STRE011
STRE010
STRE009
STRE008
STRE007
STRE006STRM008
STRE012
STRE005
STRE004
STRE003
STRE002
STRM007
STRM005
CDRA002
YDRM003YDRM002
YDRM001
STRE001
STRM003
STRM002
STRM001
STRM004
CDRM004
STRW001
422000
422000
424000
424000
426000
426000
428000
428000
430000
430000
432000
432000
434000
434000
436000
436000
438000
438000
440000
440000
442000
442000
5174
000
5174
000
5176
000
5176
000
5178
000
5178
000
5180
000
5180
000
5182
000
5182
000
5184
000
5184
000
5186
000
5186
000
5188
000
5188
000
5190
000
5190
000
5,000 0 5,000
³STATE DEFINED SURFACE WATERSHED BOUNDARY
PRELIMINARY SURFACE SUB-WATERSHED BOUNDARY

I:/20
03/0
33-2
156/
map
ping
/MX
D/S
um
mar
y_R
epor
t_K
MC
/FIG
_4_1
1x17
.mxd
LEGEND
DRG provided by Michigan DNR. Aquatic sampling stations provided by Wetland and Coastal Resources, Inc.Datum: NAD 83 Projection: Transverse Mercator Coordinate System: UTM Zone 16
REFERENCE
Triple A Road
Salm
on
Trou t
RiverYello
w Dog River
Triple A Road
Northwestern Road
Cedar Creek
3
2
4
5
1
Triple A Road
426000
426000
427000
427000
428000
428000
429000
429000
430000
430000
431000
431000
432000
432000
433000
433000
434000
434000
435000
435000
436000
436000
437000
437000
5175
000
5175
000
5176
000
5176
000
5177
000
5177
000
5178
000
5178
000
5179
000
5179
000
5180
000
5180
000
5181
000
5181
000
5182
000
5182
000
5183
000
5183
000
5184
000
5184
000
REV. 0DESIGN
AQUATIC SAMPLE LOCATIONS
FIGURE: 4
PROJECT No. 033-2156C SCALE AS SHOWN
PROJECT
GIS
REVIEW
TNSM 4 Oct. 2005
CHECK
EAGLE PROJECT BASELINE ENVIRONMENTAL STUDY
KENNECOTT MINERALS COMPANY
4,000 0 4,000
4 Oct. 2005
TITLE
³ ORE BODY
OUTCROP
KMC/MDNR PROPERTY
AQUATIC SAMPLING STATION
SCALE: 1: 40,000 FEET

Golder Associates J:\03JOBS\033-2156EAGLE\FINAL BASELINE\BASELINESTUDYSUMM\ENVBASESTUDYSUMM-TEXT.DOC
APPENDIX A
ENVIRONMENTAL BASELINE STUDY PROJECT TEAM
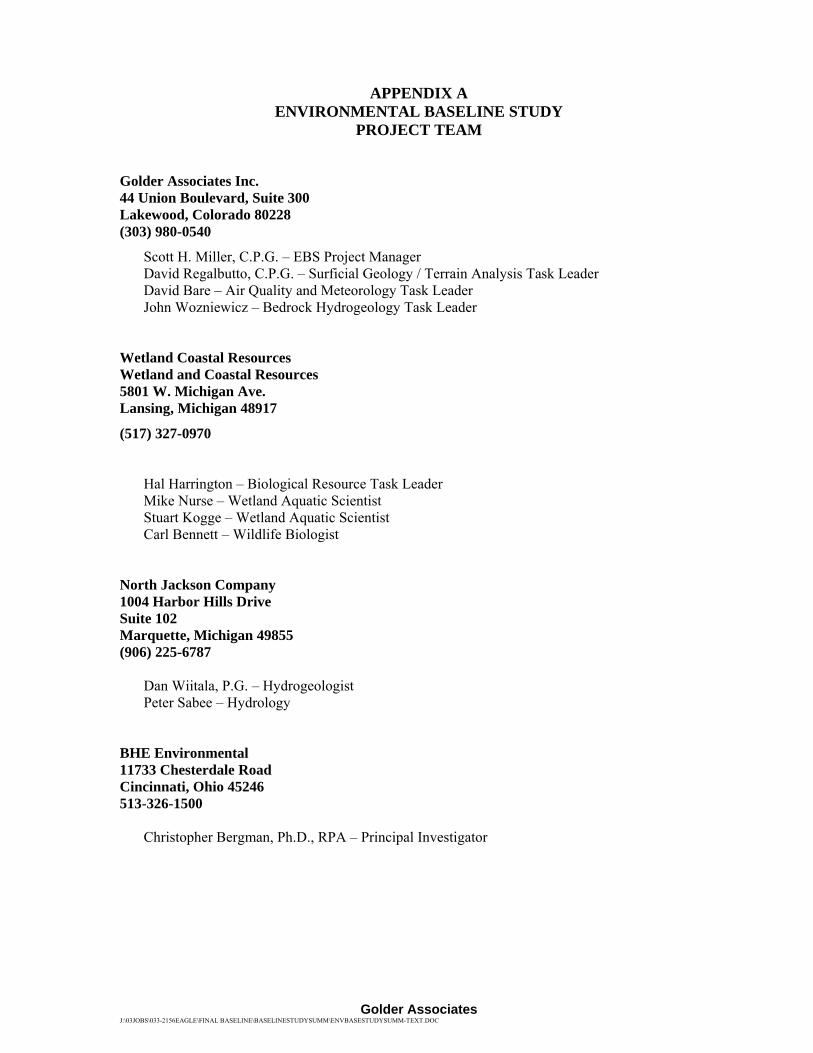
Golder Associates J:\03JOBS\033-2156EAGLE\FINAL BASELINE\BASELINESTUDYSUMM\ENVBASESTUDYSUMM-TEXT.DOC
APPENDIX A ENVIRONMENTAL BASELINE STUDY
PROJECT TEAM Golder Associates Inc. 44 Union Boulevard, Suite 300 Lakewood, Colorado 80228 (303) 980-0540
Scott H. Miller, C.P.G. – EBS Project Manager David Regalbutto, C.P.G. – Surficial Geology / Terrain Analysis Task Leader David Bare – Air Quality and Meteorology Task Leader John Wozniewicz – Bedrock Hydrogeology Task Leader
Wetland Coastal Resources Wetland and Coastal Resources 5801 W. Michigan Ave. Lansing, Michigan 48917
(517) 327-0970
Hal Harrington – Biological Resource Task Leader Mike Nurse – Wetland Aquatic Scientist Stuart Kogge – Wetland Aquatic Scientist Carl Bennett – Wildlife Biologist
North Jackson Company 1004 Harbor Hills Drive Suite 102 Marquette, Michigan 49855 (906) 225-6787
Dan Wiitala, P.G. – Hydrogeologist Peter Sabee – Hydrology
BHE Environmental 11733 Chesterdale Road Cincinnati, Ohio 45246 513-326-1500
Christopher Bergman, Ph.D., RPA – Principal Investigator


