Myths of the City: Supplementary Material Fabio Boschetti 1,2,* , Claire Gaffier 3 , Jennifer Price 1 , Magnus Moglia 1 & Iain Walker 1 A. Appendix A – Factor Analysis Analyses were conducted with the corpus of 98 litanies using the R software. A.1 Preliminary analysis We first calculated the Bartlett test of sphericity (pvalue<0.001, df=4753, Chi 2 =27 280.87) and the KMO index (0.95). Both measures were within recommended ranges indicating the data were appropriate for the factor analysis. A.2 Number of factors Then, the correlation matrix was computed and we assessed the number of factors to retain in Exploratory Factor Analysis (EFA). This stage is critical because extracting too many or too few factors leads to an erroneous interpretation of the results (Ledesma and Valero-Mora 2007). We conducted several methods among the different ways proposed to clarify the number of factors. A first approach baized on Cattell’s scree test (Cattell 1966) consists in inspecting the scree-plot and determines the point at which the last significant drop takes place. The scree-plot revealed a clear break after the third component. Secondly, a Comparison Data method (Ruscio and Roche 2012) was performed and also gave 3 factors as a result. Thirdly, the Kaiser’s criteria indicated 18 eigenvalues greater than 1. However, this method is not recommended (Ledesma and Valero-Mora 2007). Finally, the parallel analysis was performed using maximum likelihood extraction, whereby observed eigenvalues are compared with the mean of eigenvalues randomly generated from a Monte Carol simulation process (Horn 1965). The results suggested the number of factors with eigenvalues greater that the 95 th percentile of the distribution of eigenvalues computed is 8. Using both Cattell’s scree test and Comparison Data method, it was decided to retain 3 factors for further investigation. 1
Transcript
Myths of the City: Supplementary Material
Fabio Boschetti1,2,*, Claire Gaffier3, Jennifer Price1, Magnus Moglia1 & Iain Walker1
A. Appendix A – Factor AnalysisAnalyses were conducted with the corpus of 98 litanies using the R software.
A.1 Preliminary analysis
We first calculated the Bartlett test of sphericity (pvalue<0.001, df=4753, Chi 2=27 280.87) and the KMO index (0.95). Both measures were within recommended ranges indicating the data were appropriate for the factor analysis.
A.2 Number of factors
Then, the correlation matrix was computed and we assessed the number of factors to retain in Exploratory Factor Analysis (EFA). This stage is critical because extracting too many or too few factors leads to an erroneous interpretation of the results (Ledesma and Valero-Mora 2007). We conducted several methods among the different ways proposed to clarify the number of factors. A first approach baized on Cattell’s scree test (Cattell 1966) consists in inspecting the scree-plot and determines the point at which the last significant drop takes place. The scree-plot revealed a clear break after the third component. Secondly, a Comparison Data method (Ruscio and Roche 2012) was performed and also gave 3 factors as a result. Thirdly, the Kaiser’s criteria indicated 18 eigenvalues greater than 1. However, this method is not recommended (Ledesma and Valero-Mora 2007). Finally, the parallel analysis was performed using maximum likelihood extraction, whereby observed eigenvalues are compared with the mean of eigenvalues randomly generated from a Monte Carol simulation process (Horn 1965). The results suggested the number of factors with eigenvalues greater that the 95th percentile of the distribution of eigenvalues computed is 8. Using both Cattell’s scree test and Comparison Data method, it was decided to retain 3 factors for further investigation.
A.3 Exploratory factor analysis (EFA)
The 98 litanies (or items or variables) were subject to Exploratory Factor Analysis specifying the number of factors equal to 3 and using maximum likelihood extraction. The analysis was perform stipulating an oblique rotation (we used the oblimin rotation argument in R), as we expected some correlations among factors.
The result of the EFA showed the loadings of items on each factor. It revealed that several items loaded substantially on more than one factor and others failed to load on any one factor. Yet we aimed for variables that load heavily on a single factor.
For that purpose, we used several criteria to decide whether an item should be kept or not for explaining a factor. Tabachnick and all (2001) indicate 0.32 as a good rule of thumb for the minimum loading of an item. In alignment with Osborne and Costello (2009) who cite that 0.5 or strongly loading items are desirable and indicate a strong factor, we decided not to allow cross-loadings between items and kept for the analysis those with loadings greater than 0.5 on only one factor. In
1
summary, an item was accepted if it met all the following conditions: loading greater than 0.5 on only one factor, the ratio of the two highest loadings greater than 3, and item community greater than 0.3.
The first EFA suggested that 63 items could be eliminated according to these criteria. Subsequently, the analysis was performed again on the remaining 35 items and indicated 7 more items to be deleted. Eventually, the last EFA was performed and revealed that the 28 remained items met all the criteria stated above.
shows the rotated pattern matrix, with those 28 items that loaded substantially and uniquely marked in bold. The factor 1, the factor 2 and the factor 3 had a Cronbach alfa of .89, .85 and .83 respectively and consisted in 14, 7 and 7 litanies.
A.4 Confirmatory Factor Analysis (CFA)
Confirmatory factor analyses were performed to assess whether the hypothesized model of myths of the cities emerging from the rotated pattern matrix differed from the data. There is a variety of fit indices to help the researcher to do so. Comparative Fit Index (CFI) and Tucker Lewis Index (TLI) are good indicators of fit (Hooper, Coughlan, and Mullen 2008). A cut-off criterion of CFI ≥ 0.90 was initially advanced, however, a value >0.95 is presently recognized as indicative of good fit (Hu and Bentler 1999). The Root Mean Square Error of Approximation (RMSEA) is also an interesting indicator to assess model fit. Steiger (2007) cites the upper limit to 0.07.
The cfa function of the lavaan package in R was used indicating the maximum likelihood estimator.
Firstly, model fit was assessed for each of the three factors separately. Good model fit was not achieved, except for the third myth. Subsequently, item number were reduced using the following steps: we sought the highest correlation between two items and build a new model without one of the two items. CFA was performed again to assess if the fit of the new model presented an improvement. For each of the three myths, this process was conducted until each model presented good indicators of fit (see
Error: Reference source not found), reasonable number of items and interpretability.
Then, a structural equation model was assessed for all three myths of the cities dimensions as latent variables. We authorized factors to be correlated by specifying orthogonal = FALSE in the cfa function. The Chi-square tests of goodness of fit were outside recommended ranges but the lower p-values can be attributed to the large sample size. Incremental measures of model fit comparing the proposed model to the null model indicated fit greater than .90 (CFI=0.93; TLI= 0.92). Furthermore, measures of absolute fit indicated a good model fit (RMSEA = 0.049; 90% CI=0.043, 0.057).
The items included in the final model of three myths of the cities are shown in Table 4.
2
Table 1. Pattern matrix for maximum likelihood factor analysis with the direct oblimin rotation of three-factor solution of myths of cities items.
Item Rotated pattern matrix
Communalities
Factor 1
Factor 2
Factor 3
Initial
Extracted
Cities contribute to social alienation 0.68 0.03 0.04 0.47 0.48The population in cities has grown to unsustainable levels 0.66 -0.04 -0.01 0.44 0.42
People in cities are more likely to be unhappy and depressed 0.65 -0.11 0.05 0.43 0.42
People become part of the faceless crowd when they live in cities 0.63 0.12 -0.09 0.47 0.44
Urban development has resulted in disadvantage and inequality 0.62 0.00 -0.02 0.38 0.38
Cities are responsible for the depletion of natural resources 0.62 0.09 0.04 0.41 0.41
Although there are many things to do in cities, people don’t have enough time to enjoy them 0.61 0.05 0.03 0.41 0.40
Although there are many things to do in cities, few of them are affordable 0.60 -0.07 0.04 0.40 0.35
Urban development is not working very well 0.59 -0.06 -0.06 0.36 0.33City people are less friendly than people from the countryside 0.58 0.11 -0.10 0.40 0.37
City life leads to stress 0.58 0.15 -0.10 0.39 0.38Although there may be freedom of choice in cities, these choices are rarely actually accessible 0.57 -0.03 0.14 0.42 0.36
Because of globalization, cities have lost their identity and look the same 0.57 -0.14 0.12 0.34 0.34
Segregation is a serious problem in cities 0.56 -0.01 0.06 0.33 0.33Entertainment and culture make cities more attractive -0.09 0.77 0.09 0.53 0.60Cities are source of entertainment opportunities 0.03 0.72 0.08 0.52 0.55Natural areas in cities make them more attractive places to live 0.05 0.70 -0.05 0.52 0.50
Natural areas in cities help improve the health of people 0.12 0.66 -0.06 0.52 0.48
Architecture and heritage buildings are an important component of a city 0.10 0.66 -0.15 0.45 0.47
Cities are places of cultural diversity -0.05 0.63 0.07 0.43 0.39As cities grow, citizens are exposed to more ideas and cultures -0.07 0.57 0.12 0.36 0.33
People in cities are more concerned about protecting the environment 0.02 -0.13 0.71 0.44 0.51
Larger cities are more appealing than small cities and towns -0.02 0.01 0.67 0.41 0.45
As cities grow, they become better places to live -0.09 0.12 0.67 0.44 0.46Cities work best when they are high density and built-up 0.03 -0.01 0.67 0.40 0.45
The population in cities is healthier and more health- 0.03 0.06 0.65 0.41 0.44
3
conscious People in cities tend to exercise more 0.10 0.02 0.60 0.37 0.38With better technology we can solve all problems in cities 0.08 0.09 0.55 0.35 0.33
Table 2. Indicators of fit for initial and final models (three myths separately and the complete model)
Myth Cities 1 Because of globalisation, cities have lost their
identity and look the same 1
Urban development is not working very well 0.88 0.08 10.86 0.000 Urban development has resulted in
disadvantage and inequality 0.96 0.08 11.44 0.000
Although there are many things to do in cities, people don't have enough time to enjoy them 0.98 0.09 11.17 0.000
People in cities are more likely to be unhappy and depressed 0.99 0.09 11.12 0.000
Although there are many things to do in cities, few of them are affordable 0.98 0.09 10.78 0.000
The population in cities has grown to unsustainable levels 1.05 0.09 11.86 0.000
Cities contribute to social alienation 1.03 0.09 11.92 0.000 Cities are responsible for the depletion of
natural resources 0.99 0.09 11.52 0.000
Segregation is a serious problem in cities 0.93 0.09 10.76 0.000
Myth Cities 2 As cities grow, citizens are exposed to more
ideas and cultures 1
6
Cities are places of cultural diversity 1.03 0.09 11.31 0.000 Natural areas in cities make them more
attractive places to live 1.11 0.10 11.350.000
Architecture and heritage buildings are an important component of a city 1.10 0.10 11.40
0.000 Entertainment and culture make cities more
attractive 1.23 0.10 12.160.000
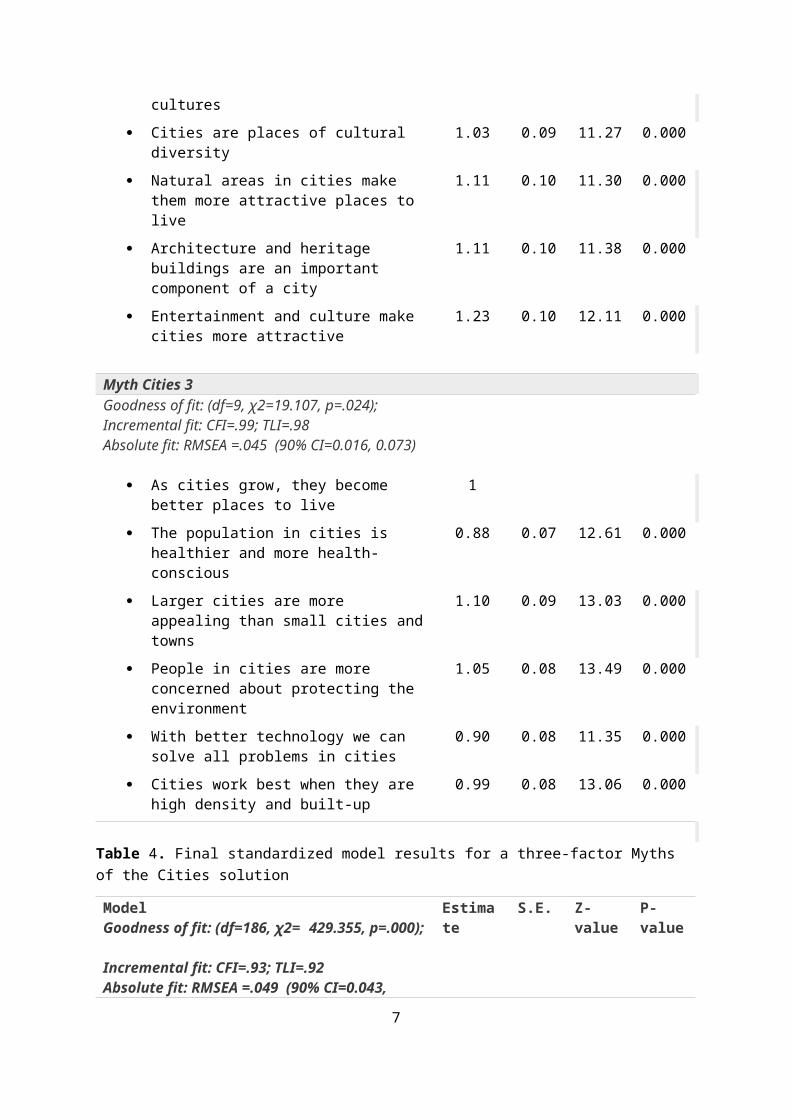
Myth Cities 3 As cities grow, they become better places to
live 1
The population in cities is healthier and more health-conscious 0.88 0.07 12.65 0.000
Larger cities are more appealing than small cities and towns 1.10 0.09 13.02 0.000
People in cities are more concerned about protecting the environment 1.05 0.08 13.44 0.000
With better technology we can solve all problems in cities 0.91 0.08 11.46 0.000
Cities work best when they are high density and built-up 0.99 0.08 13.06 0.000
7
Table 5. Means and standard deviations for, and correlations among, the 3 myths of the cities scales
Alpha’s Cronbach
Mean (SD)
Myth 1 Myth 2 Myth 3
Myth 1 0.857 3.36 (0.98)
1
Myth 2 0.794 4.01 (0.85)
0.12** 1
Myth 3 0.815 2.96 (1.02)
0.16*** 0.11** 1
* p < .05 ** p < .01 *** p < .001
Cattell, Raymond B. 1966. “The Scree Test for the Number of Factors.” Multivariate Behavioral Research 1 (2): 245–276.
Hooper, Daire, Joseph Coughlan, and Michael Mullen. 2008. “Structural Equation Modelling: Guidelines for Determining Model Fit.” Articles, 2.
Horn, John L. 1965. “A Rationale and Test for the Number of Factors in Factor Analysis.” Psychometrika 30 (2): 179–185.
Hu, Li‐tze, and Peter M. Bentler. 1999. “Cutoff Criteria for Fit Indexes in Covariance Structure Analysis: Conventional Criteria versus New Alternatives.” Structural Equation Modeling: A Multidisciplinary Journal 6 (1): 1–55. doi:10.1080/10705519909540118.
Ledesma, Rubén Daniel, and Pedro Valero-Mora. 2007. “Determining the Number of Factors to Retain in EFA: An Easy-to-Use Computer Program for Carrying out Parallel Analysis.” Practical Assessment, Research & Evaluation 12 (2): 1–11.
Osborne, Jason W., and Anna B. Costello. 2009. “Best Practices in Exploratory Factor Analysis: Four Recommendations for Getting the Most from Your Analysis.” Pan-Pacific Management Review 12 (2): 131–146.
Ruscio, John, and Brendan Roche. 2012. “Determining the Number of Factors to Retain in an Exploratory Factor Analysis Using Comparison Data of Known Factorial Structure.” Psychological Assessment 24 (2): 282.
Steiger, James H. 2007. “Understanding the Limitations of Global Fit Assessment in Structural Equation Modeling.” Personality and Individual Differences, Special issue on Structural Equation Modeling, 42 (5): 893–98. doi:10.1016/j.paid.2006.09.017.
Tabachnick, Barbara G, Linda S Fidell, and Steven J Osterlind. 2001. “Using Multivariate Statistics.”
8
B. Appendix B – Additional Results
B.1 First impressions about Australian cities
To assess the spontaneous and intuitive impressions of large cities, we analyse the first question of the questionnaire ’What are the first five words that come to mind when you think about major Australian cities?’. Words with similar meaning or related topic were grouped into different categories (Table 6, first column). The detail of the quoted words can be found in Appendix C. The occurrences of words belonging to specific categories drops fairly quickly (Table 6, third column), suggesting that the first impressions about large cities are widely shared among respondents. Cities are seen as beautiful places, rich with opportunities for entertainment and culture. On the other hand, they are also seen as big, busy and crowded. On average, one out of four respondents quoted a word reflecting a negative description. These results are consistent with the three Myths of the City described above. In addition, the words the respondents provided are aligned with the topics we selected to guide the choice of litanies. This gives us confidence that the choice of topics and of litanies, as well as the result of the factor analysis, are meaningful.
For what regards the relation between the topics we chose to select the litanies and the categories which emerged from the words provided by the respondents, a few observations stand out. First, the economy and political organisation have a fairly low occurrence. We obtained similar results in studying the perceptions about urban resilience (Boschetti et al., 2016b). Second, innovation, technology, and education have a low occurrence, which is surprising given the international standing Australian cities hold for university education (which attract a large number of overseas students) and research performance. Third, safety, which ranks as one of the top concerns in perceptions of the resilience of Australian cities (Boschetti et al., 2016b), also has a fairly low occurrence in this list. Finally, the issue of geographical isolation received low but noticeable mentions, which is probably not surprising for Australian cities (particularly Perth).
Table 6. Categories associated to ‘Australian major cities’. Occurrence represents the percentage of respondents who included the keyword as one of the five available options (thus the sums of occurrence=500%).
CATEGORIES Examples of words in the category Occurrence (%)
Alignment with the topics for the
litanies1 Cities labels Sydney, Melbourne, Perth 95 -2 Beautiful city Beautiful, fun, clean, good, etc. 68 Culture & urban life3 Big city Crowded, bigness, over-populated,
large, etc. 54 Growth
4 Busy city Busy, noisy, vibrant, fast, etc. 40 Culture & urban life5 Entertainment and
cultureCulture, tourism, shopping, restaurants, etc. 37 Entertainment
6 Transport Traffic, congested, transport, parking, etc. 36 Transport &
communication7 Buildings and
placesHousing, building, infrastructure, harbour, etc. 23
Housing – Spatial organisation &
urban development9
8 Urban pessimist Pollution, dirty, boring, poverty, etc. 23 Health
9 Geographic and weather conditions
Coastal, beach, sun, hot, etc. 18 Environment
10
People People, life, public, family, etc. 17 Social interactions
11
Diverse City Multicultural, diverse, cosmopolitan, unique, etc. 17 Culture & urban life
12
Cost of living Expensive, cost, unaffordable, etc. 14 Housing
13
Economy Jobs, business, work, employment, etc. 12 Economy
14
Environment Liveable, green, nature, environment, etc. 10 Environment
15
Modern City Modern, innovative, technology, etc. 8 Innovation &
technology16
Safety Safe, security, crime, unsure, etc. 7 Crime & security
17
Isolated Distance, isolated, remote, etc. 4 -
18
Politic Government, parliament 2 Political organisation
19
Common city Common, similar, etc. 1 -
20
Education Education, universities, etc. 1 Education
21
Other Organised, Aborigines, word-class, etc. 14 -
Total 500
B.2 Most agreed on Litanies
The factor analysis discussed in Appendix A focusses on explaining the common variance in the data. Litanies with small variance may be disregarded by the factor analysis because they reflect issues on which the majority of the respondents agree upon and thus offer little discriminatory power. Nevertheless, there are situations in which the identification of these issues may be useful. Table 7 shows the litanies on which respondents agree the most. They focus mostly on the problems caused by traffic and poor health, the high cost of living, the desire for more green areas, the importance of culture, entertainment and diversity.
Table 7. Litanies on which respondents agree the most, as shown by higher mean score (≥4) and low values of the standard deviation.
Litany Mean score
Standard Deviation
Traffic and congestion in cities cause real problems and stress 4.30 0.83There should be more parks, trees, and vegetation in cities 4.19 0.86Cities have high costs of living 4.16 0.85Architecture and heritage buildings are an important component of a city 4.14 0.85
10
Natural areas in cities make them more attractive places to live 4.09 0.86Entertainment and culture make cities more attractive 4.00 0.84
B.3 Who makes things happen in cities
In the first section of the questionnaire (Section 1 in Appendix B), we explored perceptions of power relations within cities by asking ‘Who makes things happen in major Australian cities?’. For each candidate source of power (City councils, Federal government, State/Territory government, Corporations, Big business, City residents, Neighbour communities, Rich people, No one), respondents could express their perception via a Likert scale ranging from ‘Not at all’ to ‘Certainly’. Results are shown in Figure 1. City councils, State/Territory government, and Big business are perceived to hold the most power in Australian cities, but in general, power is perceived to be distributed among many players. Of particular interest is the right-most column; very few people believe that no one holds power, which we tentatively interpret as providing an anthropomorphic perception of agency in cities; things in cities don’t just ‘happen’ as if driven by an invisible hand resulting from the emergent properties of their networks of interaction; rather, according to our respondents, things happen because of diverse human forces.
City co
uncil
Federa
l gov
ernmen
t
State/T
errito
ry go
vernm
ent
Corpora
tions
Big bu
siness
City re
siden
ts
Neighb
our c
ommun
ities
Rich pe
ople
No one
0.0
0.2
0.4
0.6
0.8
1.0
Who makes things happen in major Australian cities?
5. Certainly
4
3. Somewhat
2
1. Not at all
Prop
ortio
n of
resp
onde
nts
Figure 1. Perception of power relations in cities. Answers to the question ‘Who makes things happen in major Australian cities?’ for each power players listed on the X-axis. The Y-axis shows the cumulative percentage of responders for the available choices ranging from ‘Not at all’ to ‘Certainly’
Not surprisingly, a factor analysis of the results in Figure 1 revealed the existence of 3 factors: an Economic Power factor (including Big business, Corporations and Rich people); a Government Power factor (State/Territory government, City councils and Federal government) and a Citizens Power factor (Neighbour communities and City residents). The correlations between perceptions of power distribution and the Myth of the City are shown in Table 8, where we also include the correlation with the belief that No one holds power in cities. Most correlations are statistically significant. Each myth has a different source of power it perceives as most prominent: the Anti-Urban Myth sees
11
power as held mostly by economic forces; the Cultural City Myth perceives power mostly as held by government and the Mighty City Myth by citizens. Finally, Table 8 shows that the minority of people believing that no one really holds power in a city are likely to be related to the Anti-Urban Myth and Mighty City Myth.
Table 8. Correlations between perceptions of power distribution and the Myth of the City
Anti-Urban Myth Cultural City Myth Mighty City MythEconomic Power 0.46** 0.19** 0.15**Government Power -0.02 0.40** 0.13*Power Citizens 0.08 0.15** 0.31**No one 0.11 -0.31** 0.28**
B.4 Time horizon
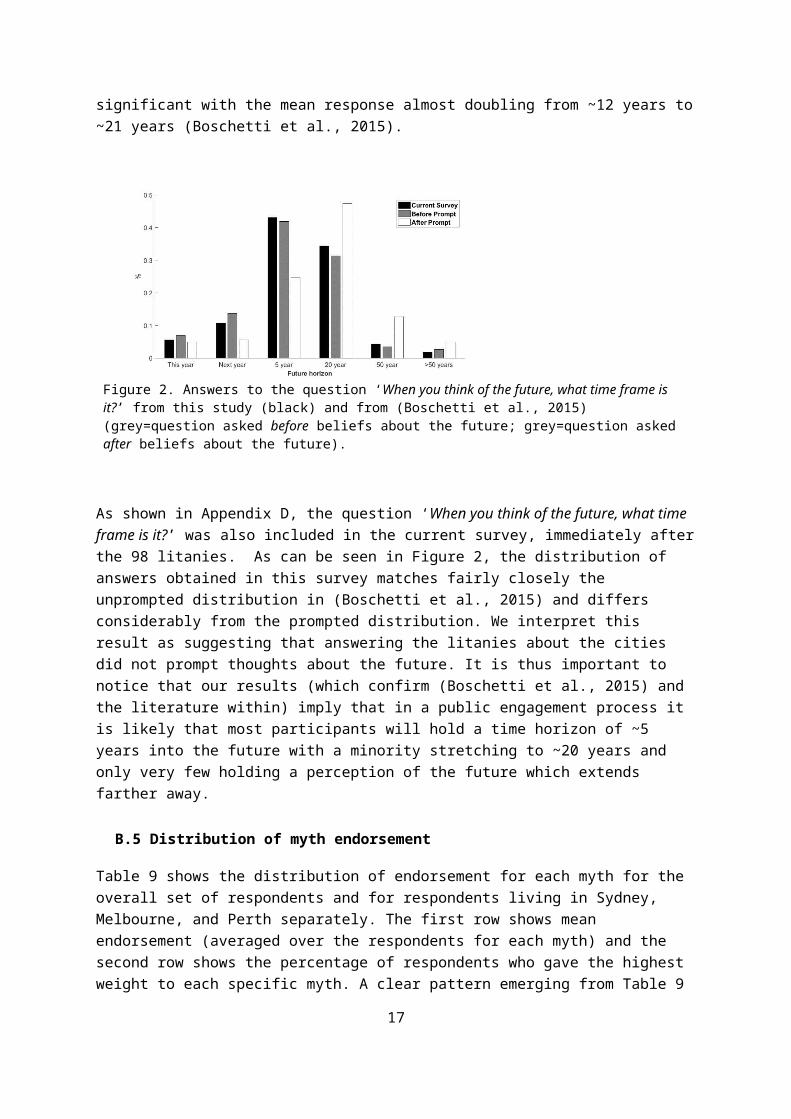
In a previous survey, we found that the act of answering a number of questions about the future significantly changed the perception of the future time horizon, that is the perception of when the future will ‘occur’
(Boschetti et al., 2015). As shown in Figure 2, answers to the question ‘When you think of the future, what time frame is it?’ were dependent on whether the question was asked before (grey in Figure 2) or after (white) a number of question about beliefs and perceptions about the future. Because the act of asking questions about the future prompts respondents to think about the future, in (Boschetti et al., 2015) we defined the questions unprompted or prompted depending on whether they were asked before or after questions about the future. The difference between unprompted or prompted results was statistically significant with the mean response almost doubling from ~12 years to ~21 years (Boschetti et al., 2015).
Figure 2. Answers to the question ‘When you think of the future, what time frame is it?’ from this study (black) and from (Boschetti et al., 2015) (grey=question asked before beliefs about the future; grey=question asked after beliefs about the future).
As shown in Appendix D, the question ‘When you think of the future, what time frame is it?’ was also included in the current survey, immediately after the 98 litanies. As can be seen in Figure 2, the distribution of answers obtained in this survey matches fairly closely the unprompted distribution in
12
(Boschetti et al., 2015) and differs considerably from the prompted distribution. We interpret this result as suggesting that answering the litanies about the cities did not prompt thoughts about the future. It is thus important to notice that our results (which confirm (Boschetti et al., 2015) and the literature within) imply that in a public engagement process it is likely that most participants will hold a time horizon of ~5 years into the future with a minority stretching to ~20 years and only very few holding a perception of the future which extends farther away.
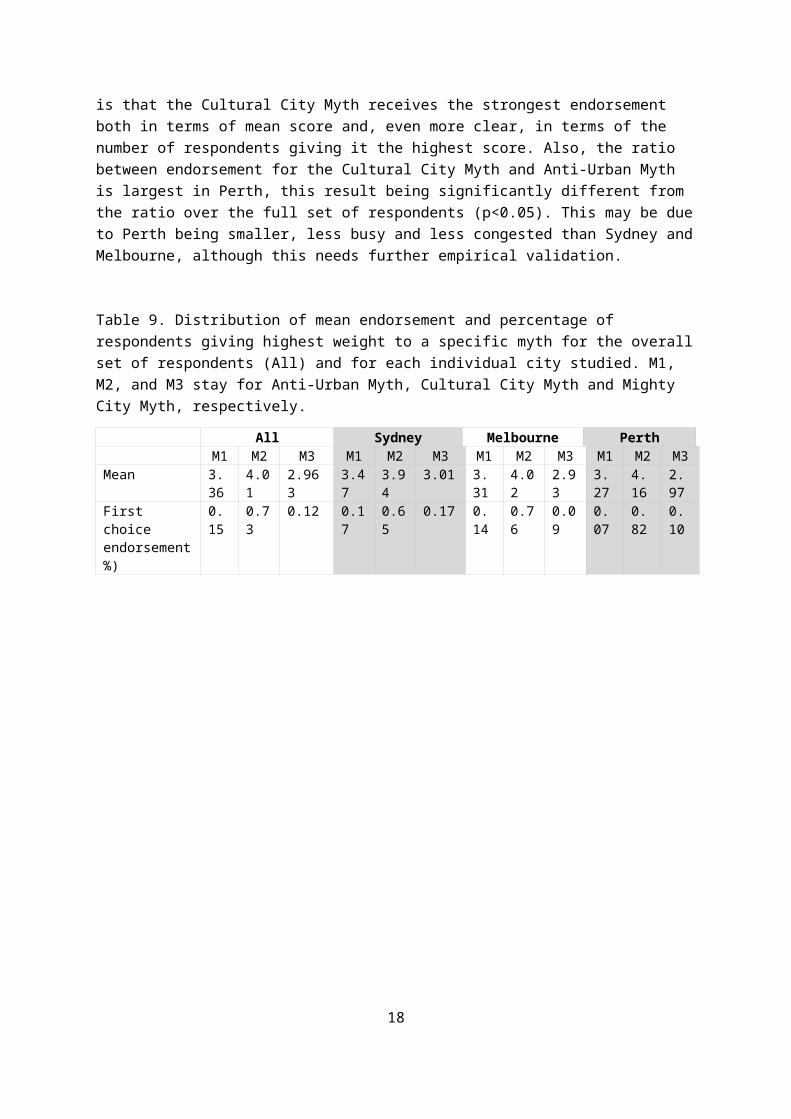
B.5 Distribution of myth endorsement
Table 9 shows the distribution of endorsement for each myth for the overall set of respondents and for respondents living in Sydney, Melbourne, and Perth separately. The first row shows mean endorsement (averaged over the respondents for each myth) and the second row shows the percentage of respondents who gave the highest weight to each specific myth. A clear pattern emerging from Table 9 is that the Cultural City Myth receives the strongest endorsement both in terms of mean score and, even more clear, in terms of the number of respondents giving it the highest score. Also, the ratio between endorsement for the Cultural City Myth and Anti-Urban Myth is largest in Perth, this result being significantly different from the ratio over the full set of respondents (p<0.05). This may be due to Perth being smaller, less busy and less congested than Sydney and Melbourne, although this needs further empirical validation.
Table 9. Distribution of mean endorsement and percentage of respondents giving highest weight to a specific myth for the overall set of respondents (All) and for each individual city studied. M1, M2, and M3 stay for Anti-Urban Myth, Cultural City Myth and Mighty City Myth, respectively.
All Sydney Melbourne PerthM1 M2 M3 M1 M2 M3 M1 M2 M3 M1 M2 M3
In this section, we start by describing the approach we employed to select the candidate litanies. Next, we describe the overall questionnaire. This also includes a number of constructs which allow us to further clarify the meaning of the Myths of the City and to anchor our results to the broader social cognition literature. Finally, we describe how the survey was run and how the responders have been selected.
C.1 The litanies
To select the litanies for inclusion in the questionnaire we followed a two-step approach as described in (Boschetti et al., 2015). The first step consisted of a broad literature review in order to identify the core issues commonly associated with the public discourse about cities. This review included the academic literature related to urban studies (topics: urban economy, urban geography, urban sociology, urban development, urban anthropology, etc.) as well as foresight studies describing scenarios of future urban development and future challenges for urban planning and design (journals: Future Cities and Environment, International Journal of Urban and Regional Research, Journal of Cultural Geography and Journal of Environmental Psychology). In addition, we reviewed the general literature (city councils’ websites, Catapult and 100 Resilient Cities websites, Australian newspapers, think-tank web pages or blogs which discuss research findings and ideas and provide information related to urban processes and development) to gain a layman perspective of these issues.
In our previous work related to attitudes towards the environment and attitudes towards the future (Boschetti et al., 2014; Boschetti et al., 2015; Boschetti et al., 2012; Boschetti et al., 2016c; Price et al., 2014a), we could rely on well-established frameworks describing a fairly small number of core ‘issues’ pertinent to the analyses. For example, environmental discourse can be framed with a STEEP (Society, Technology, Environment, Economy, and Politics) framework (Hunt et al., 2012) or a fairly small number of narratives (Dryzek, 1997; Hajer, 1995). Similarly, political ideology studies focus on a relatively small number of issues which have long being identified as significant in revealing political views (Feygina et al., 2010; Jost and Amodio, 2012; Kahan et al., 2011). However, we found it difficult to identify a short, well-established list of issues pertaining to cities, their management, development, and livability. For example, Woolcock (2009) uses the following criteria to describe the quality of urban life: stability and security, healthcare, culture and environment, education and infrastructure. (Victorian Competition and Efficiency Commission, 2008) use safety, sense of community, cultural diversity, access to services. (Stolper, 2011) adopts seventeen indicators: urban aesthetics, cleanliness, recreational outdoor venues, cultural venues, public transport, road network, safety, natural environment, sustainability, healthcare services, education facilities, affordable housing, housing diversity, employment opportunities, the standard of living, local climate and social diversity. (Namazi-Rad et al., 2016) group 22 attributes into six factors: home, neighbourhood, transport, entertainment, services, and work. Interviews with a number of majors of large US cities highlight 10 issues: economic development, public safety, budgets, infrastructure, education,
14
housing, energy/environment, demographic/diversity/inclusiveness, technology/data and health Care (FactCoExist, 2016). Since no established, broadly accepted list was found in the literature, we focussed on 14 main topics or issues related to urban development and urban life: growth, economy, resources, spatial organisation & urban development, social interactions, political & administrative organisation, transport & communication, housing, health, education, innovation & technology, crime & security, environment and culture & urban life.
The second step consists in selecting a number of litanies for each identified topic. These were either developed originally or adapted from the reviewed literature, resulting in a total of 98 litanies. While in principle the number of candidate litanies should be as large as possible to ensure the majority of views in the public discourse are included, a pragmatic compromise needs to be found between the number of litanies and the number of other constructs in the questionnaire to ensure the survey does not exceed 25-30 minutes to complete, as we discuss in the next section. The selected 98 litanies were finally listed in random order and included in the questionnaire. Respondents were asked to indicate their level of agreement with each litany by using a Likert scale (1 = strongly disagree to 5 = strongly agree).
The full list of candidate litanies is found in Section 2 of the questionnaire in Appendix B.
C.2 Other Constructs
In addition to the litanies as described in the previous section, the questionnaire also includes a number of questions to explore perceptions about cities, a number of constructs from the social cognition literature and some basic demographics.
First impressions (Section 1 in Appendix B). The purpose of this component of the survey was to gauge the general public’s perception of a city, what they understand a city to be, how it functions and its relation with the environment. We first asked respondents to list five words they freely associate with Australian major cities. Then a set of definitions of the city was presented requesting respondents to choose the statement which best reflected their opinion. Next, participants were asked to answer whether they consider Australian cities to be part of nature and if the wilderness can exist in the city. The section also includes questions related to the spatial boundary and power relations in cities.
Time frame (Section 3 in Appendix B). In order to assess what time horizon respondents have in mind when they think about the future, we included a question from (Boschetti et al., 2016c): ‘When you think of the future, what time frame is it?’ Response options were: ‘later this year’, ‘next year’, ‘5 years from now’, ‘20 years from now’, ‘50 years from now’, ‘more than 50 years from now’, and ‘other’.
Future cities perception (Section 4 in Appendix B). We assessed participants’ expectations about the future of major Australian cities. The items were developed from (Kashima et al., 2011) and adapted for the city context. We asked whether people believe that major Australian cities will be more or less safe, healthy, friendly, honest, skilled, green/eco-friendly and open-minded. We also included a question about how they thought the standards of living will be. The time frame was purposely not defined to let the respondents choose their own time horizon.
Up to this point, it was clearly specified that the questions referred to Australian major cities in general, rather than the specific city where the respondents live. In addition, a map of Australia with
15
cities labels (Sydney, Canberra, Brisbane, Melbourne, Perth, Adelaide, Darwin and Hobart) was displayed as an introduction to each page of the relevant sections.
Myths of the future (Section 5 in Appendix B). Among the five Myths of the Future identified in (Boschetti et al., 2015), three dimensions were included in the questionnaire: Social crisis, Techno-Optimism, Power and Economic inequality. The Social Crisis myth describes a belief on a future in which social values are likely to decrease. The Techno-Optimism myth illustrates the belief that the quality of life in society will improve thanks to innovation. Lastly, the Power and Economic Inequality myth describes a future in which imbalance in economic and political power leads to social inequality. These three Myths of the Future were chosen because of their strong statistical significance. The remaining two myths were omitted to keep the overall questionnaire within a 25-30 minute length.
Myths of Nature (Section 6 in Appendix B). As in (Price et al., 2014a), we used the Cultural Environmental Bias measure of environmental worldview to assess the Myths of Nature construct. The rationale for this choice is discussed in (Price and al., 2014). To keep the questionnaire within the required length, we included only the seven statements which compose the Environment as Ductile scale, which describes the belief that collective action is required to protect the environment.
Where do you live? (Section 7 in Appendix B) While the previous questions explored the participants’ attitudes and beliefs towards large Australian cities in general, the following questions refer specifically to the city they live in. This was prompted by asking the city of residence at this point in the questionnaire.
Place attachment (Section 8 in Appendix B). Place attachment is considered as a relevant component that shapes people’s concerns toward their environment (Zia et al. 2014). The personal relationship with the urban environment individuals experience or have experienced influences their perception of cities. For example, it has been showed in (Félonneau, 2004) that people who feel strongly connected to their city have a tendency to overestimate uncivil behaviour in the city. We assessed feelings of place attachment by using four statements from (Walton and al., 2014). This included items like “I feel that I belong to this city” or “I would like to be living in this city in three year time”.
Attitude to urban growth (Section 9 in Appendix B). We included a question about respondents’ attitude to urban growth by asking them if they reject, tolerate, accept, approve of or embrace it.
Social Dominance Orientation (Section 10 in Appendix B). To assess political ideology, we included four items from the Social Dominance theory (Pratto and al., 2013). The scale measures the extent to which people endorse social order controlled by a dominating group.
Concern for Future Consequences (CFC) (Section 11 in Appendix B). We used seven statements from the measurement of the construct described in Strathman et al. (1994). This subscale weights the extent to which people consider distant consequences in choosing actions or behaviours.
Demographics (Section 12 in Appendix B). The survey also asked questions some standard demographics questions.
16
C.3 The survey
The survey was conducted in May 2016 with 612 participants from three capital cities in Australia (Sydney, Melbourne, and Perth) using an on-line research-only internet panel1. The online panel consisted of a group of community members who have explicitly agreed to take part in web-based surveys from time to time. In return, they are offered a small non-cash incentive for completing such tasks, such as points towards shopping credits. The gender and age profile of the sample accords with the known population characteristics of Australians. Of the 612 participants, 553 provided reliable answers to all questions and were included in the analysis.
D. Appendix D - The questionnaire
D.1 First impressions
What are the first five words that come to mind when you think about major Australian cities?
1. 2. 3. 4. 5.
Which of the following statements best reflects your opinion about what defines major Australian cities?
[__] An urban location exceeding a certain population size
[__] An urban location exceeding a certain physical size
[__] An urban location that is important economically or culturally
[__] An urban location that is a collection of smaller suburbs and towns
[__] An urban location with its own government and administration
[__] An urban location with its own unique type of inhabitants
[__] Other (please specify)
Do you consider major Australian cities to be a part of nature? Please use the scale below.
1 = Cities are completely separate from nature
2. 3 = Cities are sometimes part of nature
4. 5 = Cities are always part of nature
Can the wilderness exist in major Australian cities? Please use the scale below.
1 The panel used is administered by ORU, an online fieldwork company with QSOAP 'Gold Standard' and the new Global ISO 26362 standard accreditation. The ORU has a database of over 300,000 individuals from across Australia (http://www.theoru.com/).
Where would you place the spatial boundary of the city?
1. Between the inner city and the suburbs [__]
2. Between the suburbs and the larger metropolitan area [__]
3. Beyond the urban region [__]
4. Other (please specify) _______________________
Who makes things happen in major Australian cities? Please use the scale below.
1 = Not at all 2. 3 = Somewhat 4. 5 = Certainly
1. City councils [__]
2. Federal government [__]
3. State/Territory government [__]
4. Corporations [__]
5. Big business [__]
6. City residents [__]
7. Neighbour communities
8. Rich people [__]
9. No one [__]
10. Other (please specify) ___________________________
What does urban resilience mean?
1. I don’t know [__]2. I have a rough idea, it is about (give three key-words) [__] [__] [__]
3. To my understanding, I would explain as (explain in a few words) __________________
What does city liveability mean?
1. I don’t know [__]2. I have a rough idea, it is about (give three key-words) [__] [__] [__]
3. To my understanding, I would explain as (explain in a few words) __________________
18
D.2 Litanies
Think about major Australian cities today. Please read each of the statements below and indicate whether you agree or disagree on a scale of one to five.
1 = Strongly disagree
2 = Moderately disagree
3 = Neither agree nor disagree
4 = Moderately agree
5 = Strongly agree
GROWTH
1. The larger the city, the more the average citizen consumes (in terms of energy, fuel, commodities, shopping, etc) [__]
2. The larger the city, the more the average citizen produces and creates [__]3. As cities grow, citizens are exposed to more ideas and cultures [__]4. Cities cannot grow indefinitely [__]5. Larger cities are more exposed to risks of natural disasters and extreme events [__]6. Larger cities are more likely to be well connected in the global economic market [__]7. Cities need to grow in order to create employment and job opportunities [__]8. Larger cities are more appealing than small cities and towns [__]9. The population in cities has grown to unsustainable levels [__]10. As cities grow, they become better places to live [__]11. Urbanisation should be encouraged as a strategy for economic growth [__]
ECONOMY
12. Cities help the national economy grow [__] 13. Cities are a drain on the national economy [__] 14. To find a good job, you often need to move to a city [__]15. Cities should become more competitive in the global economy to attract investment [__] 16. The welfare of cities is dependent on global and national decisions [__]17. Cities are symbols of consumption and capitalism [__]18. Cities are wealthy places with higher average incomes [__]
RESOURCES
19. If needed, cities could use stormwater and recycle water to meet all their needs [__]20. If needed, cities could use renewable energy technologies to produce their own electricity [__]21. If needed, cities could produce most of their food within their own boundaries [__]22. If needed, cities could reuse all their waste [__]23. Cities are dependent on food, water, materials and/or energy from elsewhere [__]
SPATIAL ORGANISATION - URBAN DEVELOPMENT
19
24. Cities work best when they are high density and built-up [__]25. Cities work best when they are low density and spread-out [__]26. High-density cities are overcrowded, resulting in low quality of life and poor health [__]27. Low-density cities are sprawling, resulting in low quality of life and social isolation [__]28. Jobs opportunities and wealth are not distributed evenly across different city suburbs [__]29. Urban development has resulted in disadvantage and inequality [__]30. Urban development is not working very well [__]
SOCIAL – PEOPLE INTERACTIONS
31. Cities contribute to social alienation [__]32. Segregation is a serious problem in cities [__] 33. People living in cities are very competitive [__] 34. People become part of the faceless crowd when they live in cities [__]35. People in cities are always in a rush [__]36. People can better express their individuality in large cities [__]37. People in cities are more tolerant of social diversity [__] 38. Cities have many diverse communities that people may engage with [__]39. People in cities are more progressive and open-minded [__]40. City people are less friendly than people from the countryside [__]41. People in cities do not have time for meaningful social interactions [__] 42. Income inequality is a real problem in cities [__]43. The gap between rich and poor continues to grow in cities [__]
POLITICAL ORGANIZATION / ADMINISTRATION
44. The way cities are managed leads to wasting lots of taxpayers' money [__]45. Political decisions in cities are becoming more about the benefit of big businesses rather than
the public interest [__]46. State and Federal government spend too much money on cities at the expense of towns and
regions [__]47. Greater public participation can improve urban planning processes in cities [__]
MOVEMENT
48. The internet has reduced the need for travel to and from cities [__]49. Cities should be active night and day, with around the clock transport and retail [__]50. Traffic and congestion in cities cause real problems and stress [__]
HOUSING
20
51. Affordable housing is only available far from the city centre [__]52. Housing availability is a problem in cities [__]53. Cities have high costs of living [__] 54. Some suburbs in Australian cities risk becoming 21st-century slums [__]
INNOVATION AND TECHNOLOGY
55. Cities are the most important hubs of innovation [__]56. With better technology, we can solve all problems in cities [__]57. Digital innovations have changed the way people live in cities [__]
CRIME, INSECURITY
58. There is a high risk of crime in cities [__]59. Cities are as safe as other places [__] 60. Increased law and order are needed to make cities safer [__]61. Citizens of all ages and walks of life can feel secure in cities [__]
EDUCATION
62. Cities are not good places to raise children [__]63. Cities enrich the life of children as well as adults [__]64. There is good access to high-quality education in cities [__]65. People in cities are usually better educated [__]66. Thanks to technological innovation, quality education is also available outside large cities [__]
HEALTH
67. People in cities are more likely to be unhappy and depressed [__]68. City life leads to stress [__]69. Air quality in cities has a negative effect on people’s health [__]70. People in cities are exposed to many toxic chemicals [__]71. There is good access to quality healthcare in cities [__]72. The population in cities is healthier and more health-conscious [__] 73. Drug and alcohol problems in cities are worse than those in rural areas [__]74. Noise is a major problem in cities [__] 75. People in cities tend to exercise more [__]76. Health services are not distributed evenly between the rich and poor in the city [__]
21
ENVIRONMENT
77. Cities produce so much waste that they also affect the countryside [__]78. Cities are responsible for the depletion of natural resources [__]79. Natural areas in cities make them more attractive places to live [__]80. Natural areas in cities help improve the health of people [__]81. Global or regional environmental crises affect cities as well [__]82. People in cities are more concerned about protecting the environment [__]83. People in cities don’t feel connected with the environment [__]84. There should be more parks, trees, and vegetation in cities [__]85. As long as there is money, cities will be able to afford all the resources they need [__]
CULTURE – URBAN LIFE
86. Cities are places of cultural diversity [__]87. Entertainment and culture make cities more attractive [__]88. Cities are source of entertainment opportunities [__]89. Cities are exciting places [__]90. Although there may be freedom of choice in cities, these choices are rarely actually accessible
[__]91. Cities foster creativity [__]92. The culture that develops in cities improves society as a whole [__]93. Most Australians live in cities, so the culture that urban dwellers develop is representative of
Australia [__]94. Although there are many things to do in cities, few of them are affordable [__]95. Although there are many things to do in cities, people don’t have enough time to enjoy them
[__]96. Because of globalisation, cities have lost their identity and look the same [__]97. Architecture in cities is too influenced by corporations and business [__]98. Architecture and heritage buildings are an important component of a city [__]
D.3 Timeframe
When you think of the future, what time frame is it?
1. Later this year [__]2. Next year [__]3. 5 years from now [__]4. 20 years from now [__]5. 50 years from now [__]6. More than 50 years from now [__]7. Other (please specify) _________________
22
D.4 Future cities perception
Think about the future… Read each statement and decide how much you think future major Australian cities will compare to now.
1 = Much less than now
2 = Less than now 3 = More or less as now
4 = More than now
5 = Much more than now
1. How safe do you think Australian cities will be? [__]
2. How healthy do you think Australian cities will be? [__]
3. How friendly do you think Australian cities will be? [__]
4. How honest do you think Australian cities will be? [__]
5. How skilled do you think Australian cities will be? [__]
6. How do you think the standards of living in Australian cities will be? [__]
7. How green/ eco-friendly do you think Australian cities will be? [__]
8. How open-minded do you think Australian cities will be? [__]
Please answer the question using the following scale.
1 = Strongly disagree 2 = Moderately disagree
3 = Neither agree nor disagree
4 = Moderately agree
5 = Strongly agree
I found difficult to answer the previous questions because Australian cities are too diverse [__]
D.5 Myth of the Future
Think about Australia’s future… Please read each statement and decide whether you agree or disagree with each statement as follows.
1 = Strongly disagree 2 = Moderately disagree
3 = Neither agree nor disagree
4 = Moderately agree
5 = Strongly agree
Social crisis:
1. Crime and drug abuse will increase [__]2. Traditional morals and family values will decline [__]3. Society will be so involved in the internet and virtual world that it will lose touch with reality [__]4. Law and order will decline [__]5. Society will become more ignorant because of changes in technology and education [__]
Techno-Optimism:
1. Genetic technology will create more effective medicine and agriculture [__]2. Scientific innovations will improve medicine so that it is preventive and personalized [__]3. The coming decades will see new exciting economic markets emerge [__]4. There will be new improved ways to produce food and feed the world [__]
23
5. The internet will make education available for all [__]
Power and Economic inequality:
1. Multi-national corporations will become alarmingly powerful [__]2. Continued economic growth will result in social inequality [__]3. Companies and governments will collect public data to control or influence people [__]4. A poorly regulated financial sector will result in another global economic crisis [__]5. The difference between the rich and poor will continue to grow [__]
D.6 Myth of Nature – Ductile Environment
Think about Australia’s future… Please read each statement and decide whether you agree or disagree with each statement as follows.
1 = Strongly disagree 2 = Moderately disagree
3 = Neither agree nor disagree
4 = Moderately agree
5 = Strongly agree
1. The natural environment will become unstable if humans exceed the limits identified by experts [__]
2. When pushed beyond the limits identified by experts the natural environment will not recover [__]
3. The natural environment can be managed if there are clear rules about what is allowed [__]4. If the balance of the natural environment is upset the whole system will collapse [__]5. Conservation and protection are the most rational strategy for managing the natural
environment [__]6. We all have a moral obligation to protect the environment and consume fewer resources [__]
D.7 Where do you live?
What is the city where you live in?
1. Sydney [__]2. Perth [__]3. Darwin [__]4. Adelaide [__]5. Melbourne [__]6. Brisbane [__]7. Hobart [__]8. Canberra [__]
D.8 Place attachment
Think about the city where you live. Please read each statement and decide whether you agree or disagree with each statement as follows.
1 = Strongly disagree
2 = Moderately disagree
3 = Neither agree nor disagree
4 = Moderately agree
5 = Strongly agree
24
1. I feel that I belong to this city [__]2. I am pleased to come back to this city, if I go away [__]3. Overall, I feel very attached to this city [__]4. I would like to be living in this city in three year time [__]
D.9 Attitude to urban growth
Which of the following best describes your attitude to urban growth?
1. I reject it [__]2. I tolerate it [__]3. I accept it [__]4. I approve of it [__]5. I embrace it[__]6. N/A [__]
D.10 Social dominance orientation
Read each statement and decide whether you agree or disagree with each statement as follows.
1 = Strongly disagree
2 = Moderately disagree
3 = Neither agree nor disagree
4 = Moderately agree
5 = Strongly agree
1. In setting priorities, we must consider all groups [__]2. Group equality should be our ideal [__]3. Superior groups should dominate inferior groups [__]4. We should not push for equality between groups [__]
D.11 Consideration of future consequences scale – CFC Future subscale
Read each statement and decide whether you agree or disagree with each statement as follows.
1 = Strongly disagree
2 = Moderately disagree
3 = Neither agree nor disagree
4 = Moderately agree
5 = Strongly agree
1. I consider how things might be in the future, and try to influence those things with my day to day behaviour [__]
2. Often I engage in a particular behaviour in order to achieve outcomes that may not result for many years [__]
3. I am willing to sacrifice my immediate happiness or well-being in order to achieve future outcomes [__]
4. I think it is important to take warnings about negative outcomes seriously even if the negative outcome will not occur for many years [__]
5. I think it is more important to perform a behaviour with important distant consequences than a behaviour with less important immediate consequences [__]
25
6. When I make a decision, I think about how it might affect me in the future [__]7. My behaviour is generally influenced by future consequences [__]
D.12 Demographics
What is your year of birth? [__]
What is your gender? [__]
What is the highest level of education you have achieved?
Primary School [__] High school / Tertiary school [__] Trade / TAFE qualification [__] Undergraduate degree [__] Postgraduate qualification [__]
What is your postcode? [__]
What best describes your life situation?
1. Student [__]2. Single household [__]3. Family with no children [__]4. Family with small children [__]5. Family with older children [__]6. Retired [__]7. Other (please specify) ___________________________________
How long have you been living in your current city?
1. Less than 1 year [__]2. Between 1 to 5 year [__]3. Between 5 to 10 year [__]4. More than 10 years [__]
Where do you live?
1. In the inner city [__]2. In the suburban area [__]3. In the metropolitan fringe [__]4. In the countryside [__]5. Other (Please specify) ___________________
Where did you grow up?
1. In the inner city [__]2. In the suburban area [__]3. In the metropolitan fringe [__]4. In the countryside [__]5. Other (Please specify) ___________________
Where do you think you’re going to live in 15 years?
1. In the inner city [__]
26
2. In the suburban area [__]3. In the metropolitan fringe [__]4. In the countryside [__]5. Other (Please specify) ___________________
In an average week, how many hours do you spend travelling or commuting?
1. Less than one hour [__]2. Two to three hours [__]3. Four to Five hours [__]4. Six to seven hours [__]5. More than seven hours a week [__]
27
1. Appendix C – Text analysis
Table 10. Most quoted keywords for the identified categories associated with ‘Australian major cities’. Words are sorted by category and in different columns depending on the average percentage of respondents who quoted the word.
Average percentage of respondents who quoted the word