11
Appendix A GIS Data Sources
| Date post: | 08-Jun-2018 |
| Category: |
Documents |
| Upload: | phungthuan |
| View: | 215 times |
| Download: | 0 times |

Appendix A
GIS Data Sources
Appendix A
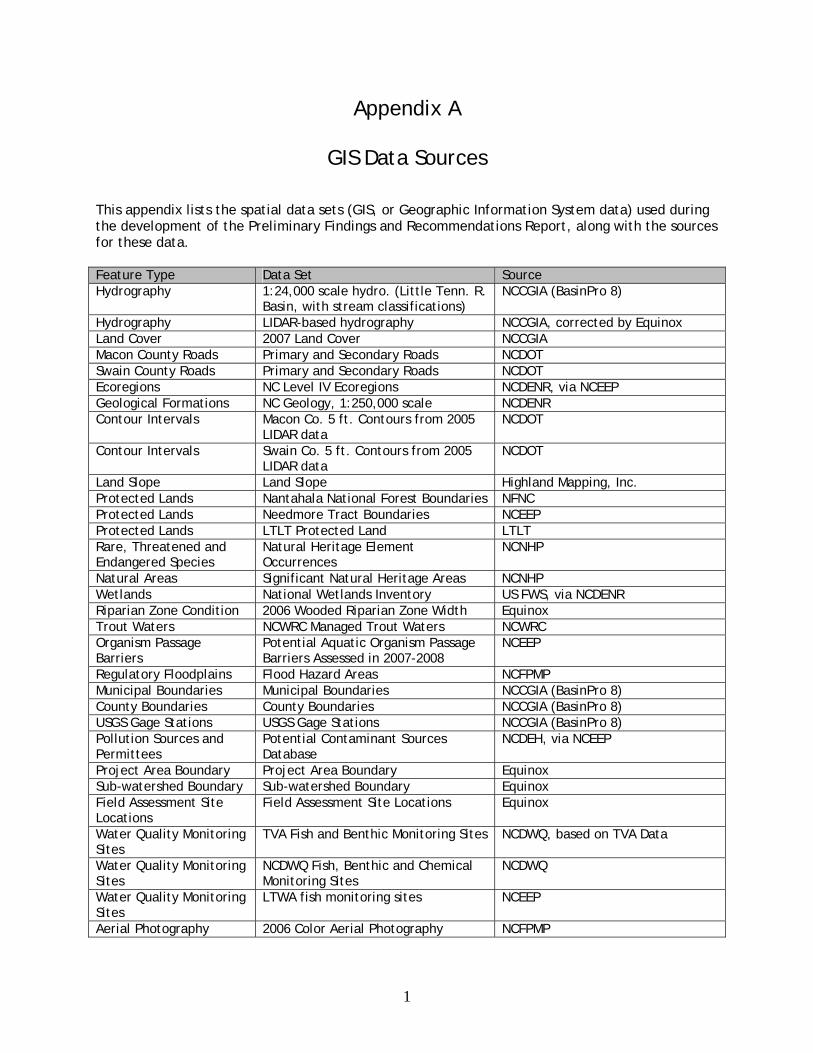
GIS Data Sources This appendix lists the spatial data sets (GIS, or Geographic Information System data) used during the development of the Preliminary Findings and Recommendations Report, along with the sources for these data. Feature Type Data Set Source Hydrography 1:24,000 scale hydro. (Little Tenn. R.
Basin, with stream classifications) NCCGIA (BasinPro 8)
Hydrography LIDAR-based hydrography NCCGIA, corrected by Equinox Land Cover 2007 Land Cover NCCGIA Macon County Roads Primary and Secondary Roads NCDOT Swain County Roads Primary and Secondary Roads NCDOT Ecoregions NC Level IV Ecoregions NCDENR, via NCEEP Geological Formations NC Geology, 1:250,000 scale NCDENR Contour Intervals Macon Co. 5 ft. Contours from 2005
LIDAR data NCDOT
Contour Intervals Swain Co. 5 ft. Contours from 2005 LIDAR data
NCDOT
Land Slope Land Slope Highland Mapping, Inc. Protected Lands Nantahala National Forest Boundaries NFNC Protected Lands Needmore Tract Boundaries NCEEP Protected Lands LTLT Protected Land LTLT Rare, Threatened and Endangered Species
Natural Heritage Element Occurrences
NCNHP
Natural Areas Significant Natural Heritage Areas NCNHP Wetlands National Wetlands Inventory US FWS, via NCDENR Riparian Zone Condition 2006 Wooded Riparian Zone Width Equinox Trout Waters NCWRC Managed Trout Waters NCWRC Organism Passage Barriers
Potential Aquatic Organism Passage Barriers Assessed in 2007-2008
NCEEP
Regulatory Floodplains Flood Hazard Areas NCFPMP Municipal Boundaries Municipal Boundaries NCCGIA (BasinPro 8) County Boundaries County Boundaries NCCGIA (BasinPro 8) USGS Gage Stations USGS Gage Stations NCCGIA (BasinPro 8) Pollution Sources and Permittees
Potential Contaminant Sources Database
NCDEH, via NCEEP
Project Area Boundary Project Area Boundary Equinox Sub-watershed Boundary Sub-watershed Boundary Equinox Field Assessment Site Locations
Field Assessment Site Locations Equinox
Water Quality Monitoring Sites
TVA Fish and Benthic Monitoring Sites NCDWQ, based on TVA Data
Water Quality Monitoring Sites
NCDWQ Fish, Benthic and Chemical Monitoring Sites
NCDWQ
Water Quality Monitoring Sites
LTWA fish monitoring sites NCEEP
Aerial Photography 2006 Color Aerial Photography NCFPMP
1
Table Notes: LTLT = Land Trust for the Little Tennessee LTWA = Little Tennessee Watershed Association NCCGIA = NC Center for Geographic Information and Analysis NCDEH = NC Division of Environmental Health NCDOT = NC Department of Transportation NCEEP = NC Ecosystem Enhancement Program NCDENR = NC Department of Environment and Natural Resources NCFPMP = NC Floodplain Mapping Program NCNHP = NC Natural Heritage Program NCDWQ = NC Division of Water Quality NCWRC = NC Wildlife Resources Commission NFNC = National Forests in NC (US Forest Service) USGS = US Geological Survey USFWS = US Fish and Wildlife Service TVA = Tennessee Valley Authority BasinPro 8 is a set of custom data layers and ArcView tools developed by NCCGIA for the
NC Clean Water Management Trust Fund. ‘Equinox’ indicates data set was created by Equinox Environmental Consultation and Design, Inc.
for this project.
2
Appendix B Supplemental Figures
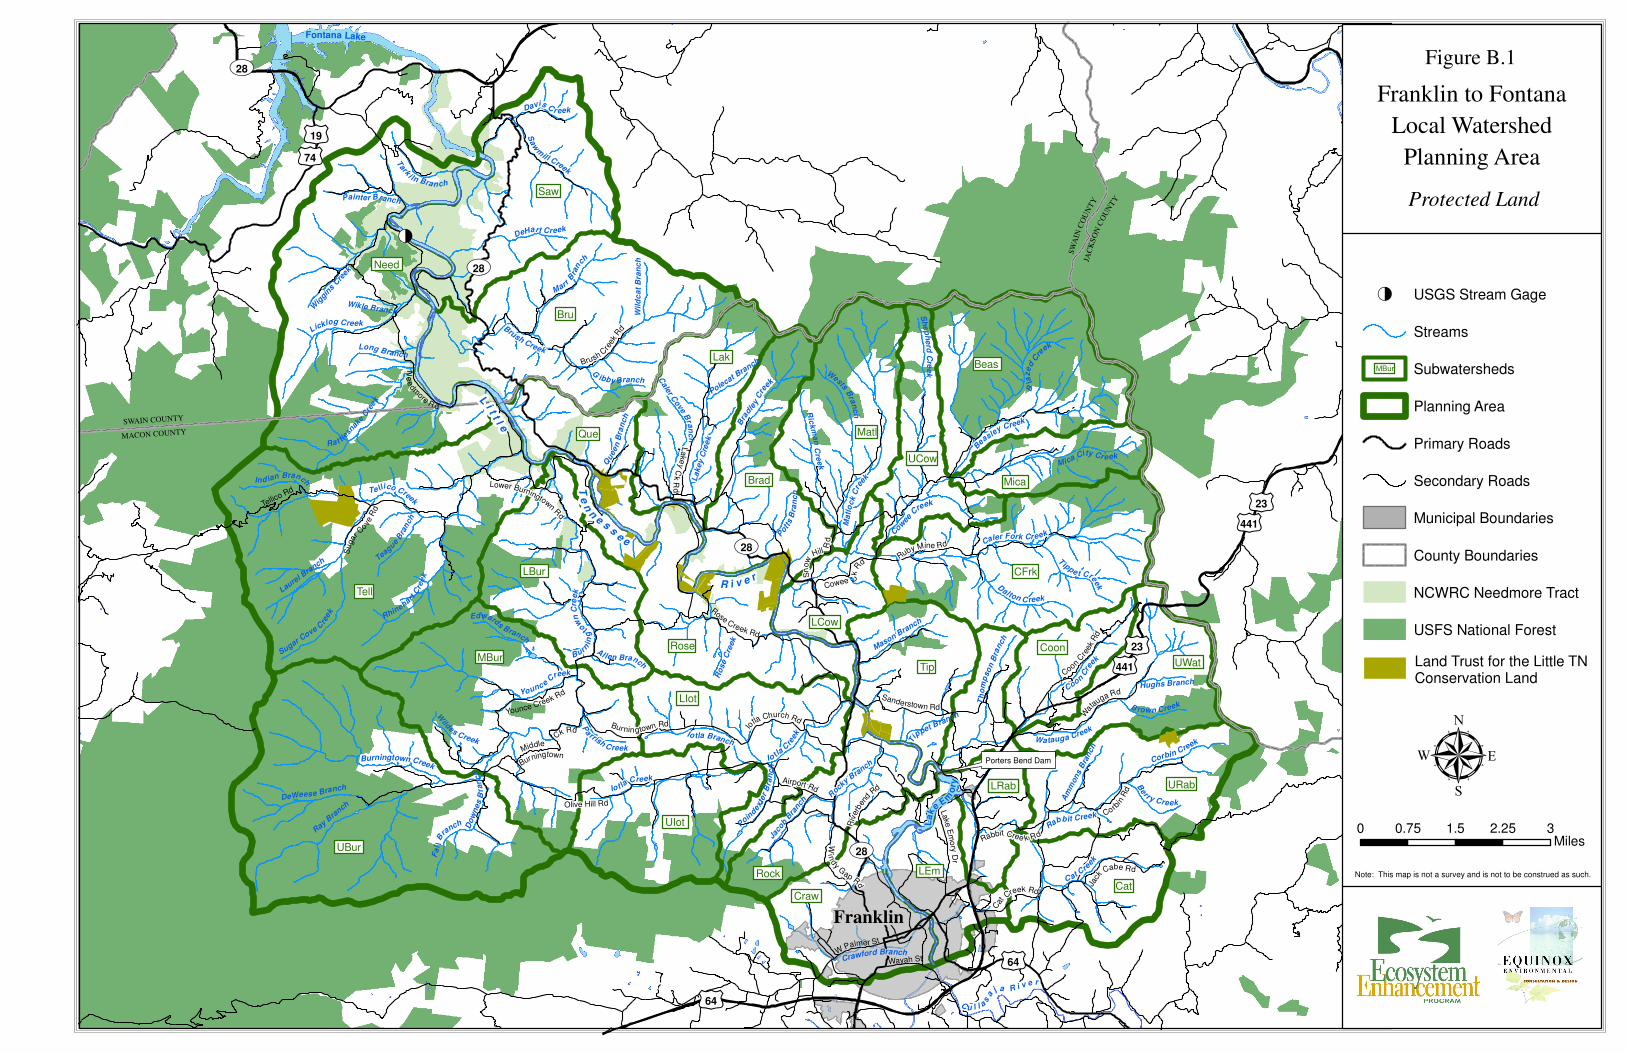
Figure B.1. Protected Lands in the Franklin to Fontana Project Area
!<
Brush Creek
Burningtown Creek
Burnin
g
to
wn
Cre
ek
Do
wn
es B
ran
ch
Crawford Branch
Sh
ep
he
rd C
r eek
Cow
ee C
reek
Wests B
ran
ch
Mica City Creek
Bla
ze
d C
re
ek
Te llico Creek
Wa tauga Creek
Ma
tlo
ck C
reekL
akey C
reek
Coon Cre
ek
Io tla C
reek
Bra
dley C
re
ek
C at Cre
ek
Caler Fork Creek
Licklog Creek
Rabb it Creek
Sugar Cove C
reek
Io tla Branch
Saw
mil l Creek
Mar r B
ran
ch
Dalton C reek
Rhinehart
Cre
ek
Ric
km
an
Cre
ek
R
ock
y Bra
nch
Bea
sley Creek
Ra t tlesn
ake
Cre
ek
Corbin Creek
Wig
gins
Cre
ek
DeHart Creek
Tippe t Cree
k
DeWeese Branch
Mason Bra
nch
Laurel B
ranch
Th
om
pso
n B
ranch
Painter Branch
Wildes Creek
Caler C
ove
Bra
nc
h
Pott
s B
ran
ch
Davis C r eek
Fa
l l B
ranch
Long Branch
B rown Creek
Teague
Bra
nch
Qu
een
Bra
nch
Tark
i ln Branch
Ind ian Branch
Tip
pet Branch
Berry Creek
Am
mons B
ranch
Younce Creek
Ray Bra
nch
P
oind
exte
r B
ran
ch
Pa
rrish C reek
Wil
dc
at
Bra
nc
h
Al len Branch
Polecat Bra
nch
Hughs Branch
Jaco
b Bra
nch
Edwards Branch
Wikle Branch
Ro
se C
reek
Iot la Creek
Gibby Branch
tu19
tu74
��28
��28
tu64
tu23
tu441
Franklin to Fontana
Local Watershed
Planning Area
Tellico Rd
Suga
r Co ve
Rd
Burningtown Rd
Airport RdW
indy G
ap Rd
W Palmer St
Jack
Cabe Rd
Co rbin
Rd
Rabbit Cree k Rd
Cat
Creek Rd
Wat
auga RdSanderstown Rd
Coon C
reek
Rd
Rose Creek Rd
Ruby Mine Rd
Brush C
reek
Rd
Younce Creek Rd
Olive Hill Rd
M
iddle
Burningtown
Ck Rd
Io
tla Church Rd
Riv
erben
d Rd
Wayah St
Lake
Em
ory
Dr
Cowee Ck R
d
Sn
ow
Hill R
d
��28
SWAIN COUNTY
MACON COUNTY
SW
AIN
CO
UN
TY
Franklin
Fontana Lake
La
k
e E
mo
ry
Note: This map is not a survey and is not to be construed as such.
Miles0 0.75 1.5 2.25 3
µ
��28
tu23
tu441
!< USGS Stream Gage
Streams
Subwatersheds
Planning Area
Primary Roads
Secondary Roads
Municipal Boundaries
County Boundaries
NCWRC Needmore Tract
USFS National Forest
JAC
KS
ON
CO
UN
TY
Ne
edm
ore R d
Lower Burningtown R
d
tu64
Lake
y Ck R
d
Porters Bend Dam
Protected LandSaw
Need
Bru
Tell
Que
Lak
Brad
Rose
LBur
MBur
UBur
LIot
UIot
Rock
Tip
Craw
LEm
Cat
URab
UWat
Coon
LCow
Mica
Beas
UCow
Matl
CFrk
MBur
L i t t l e
T e
n n e s s e e
R i v e r
C u l l a
s a
j a R i v e r
Land Trust for the Little TN Conservation Land
LRabLRab
Figure B.1
Appendix C Supplemental Tables
Table C.1. 2006 Riparian Zone Data for the Franklin to Fontana Planning Area, by
Subwatershed Table C.2. Water Quality Data Collected by NCDWQ in the Franklin to Fontana
Planning Area, July – September 2008. Table C.3. Initial Subwatershed Ecological Condition Ratings and Primary Attribute
Data Table C.4. Derivation of Final Subwatershed Ratings Table C.5. Selected Supplemental Data Considered in Adjusting Initial Ratings
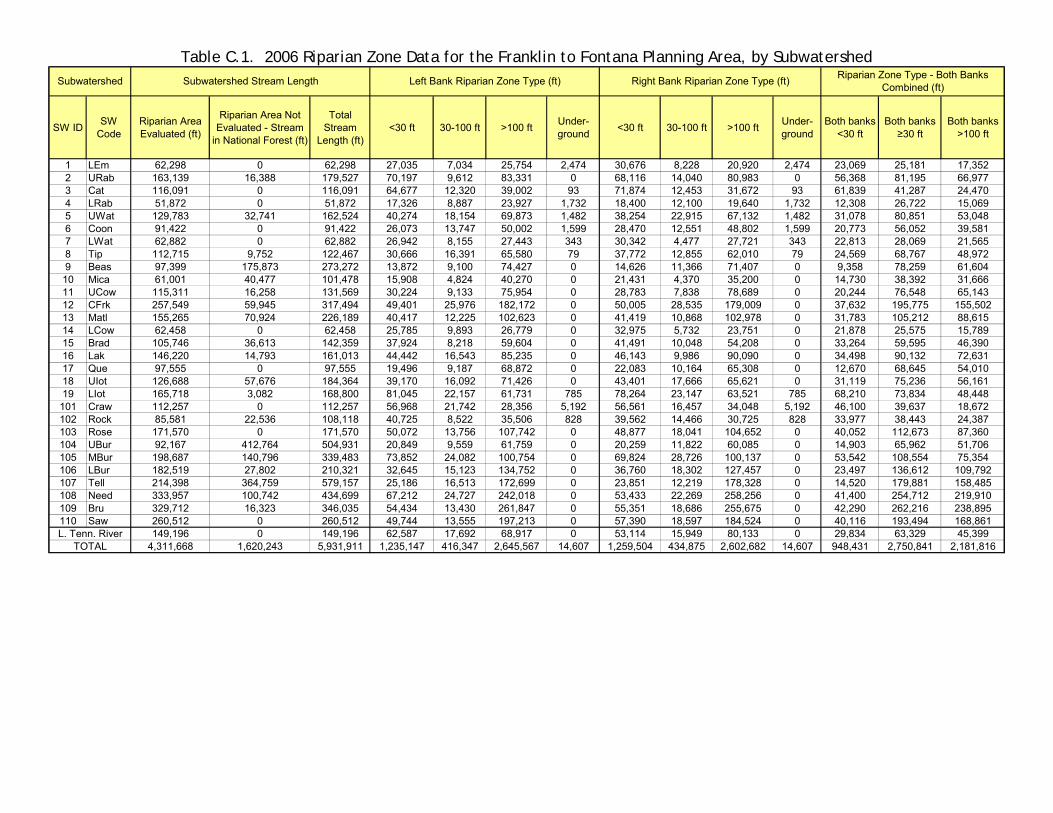
Table C.1. 2006 Riparian Zone Data for the Franklin to Fontana Planning Area, by Subwatershed
SW ID SW Code
Riparian Area Evaluated (ft)
Riparian Area Not Evaluated - Stream
in National Forest (ft)
Total Stream
Length (ft)<30 ft 30-100 ft >100 ft Under-
ground <30 ft 30-100 ft >100 ft Under-ground
Both banks <30 ft
Both banks ≥30 ft
Both banks >100 ft
1 LEm 62,298 0 62,298 27,035 7,034 25,754 2,474 30,676 8,228 20,920 2,474 23,069 25,181 17,3522 URab 163,139 16,388 179,527 70,197 9,612 83,331 0 68,116 14,040 80,983 0 56,368 81,195 66,9773 Cat 116,091 0 116,091 64,677 12,320 39,002 93 71,874 12,453 31,672 93 61,839 41,287 24,4704 LRab 51,872 0 51,872 17,326 8,887 23,927 1,732 18,400 12,100 19,640 1,732 12,308 26,722 15,0695 UWat 129,783 32,741 162,524 40,274 18,154 69,873 1,482 38,254 22,915 67,132 1,482 31,078 80,851 53,0486 Coon 91,422 0 91,422 26,073 13,747 50,002 1,599 28,470 12,551 48,802 1,599 20,773 56,052 39,5817 LWat 62,882 0 62,882 26,942 8,155 27,443 343 30,342 4,477 27,721 343 22,813 28,069 21,5658 Tip 112,715 9,752 122,467 30,666 16,391 65,580 79 37,772 12,855 62,010 79 24,569 68,767 48,9729 Beas 97,399 175,873 273,272 13,872 9,100 74,427 0 14,626 11,366 71,407 0 9,358 78,259 61,60410 Mica 61,001 40,477 101,478 15,908 4,824 40,270 0 21,431 4,370 35,200 0 14,730 38,392 31,66611 UCow 115,311 16,258 131,569 30,224 9,133 75,954 0 28,783 7,838 78,689 0 20,244 76,548 65,14312 CFrk 257,549 59,945 317,494 49,401 25,976 182,172 0 50,005 28,535 179,009 0 37,632 195,775 155,50213 Matl 155,265 70,924 226,189 40,417 12,225 102,623 0 41,419 10,868 102,978 0 31,783 105,212 88,61514 LCow 62,458 0 62,458 25,785 9,893 26,779 0 32,975 5,732 23,751 0 21,878 25,575 15,78915 Brad 105,746 36,613 142,359 37,924 8,218 59,604 0 41,491 10,048 54,208 0 33,264 59,595 46,39016 Lak 146,220 14,793 161,013 44,442 16,543 85,235 0 46,143 9,986 90,090 0 34,498 90,132 72,63117 Que 97,555 0 97,555 19,496 9,187 68,872 0 22,083 10,164 65,308 0 12,670 68,645 54,01018 UIot 126,688 57,676 184,364 39,170 16,092 71,426 0 43,401 17,666 65,621 0 31,119 75,236 56,16119 LIot 165,718 3,082 168,800 81,045 22,157 61,731 785 78,264 23,147 63,521 785 68,210 73,834 48,448
101 Craw 112,257 0 112,257 56,968 21,742 28,356 5,192 56,561 16,457 34,048 5,192 46,100 39,637 18,672102 Rock 85,581 22,536 108,118 40,725 8,522 35,506 828 39,562 14,466 30,725 828 33,977 38,443 24,387103 Rose 171,570 0 171,570 50,072 13,756 107,742 0 48,877 18,041 104,652 0 40,052 112,673 87,360104 UBur 92,167 412,764 504,931 20,849 9,559 61,759 0 20,259 11,822 60,085 0 14,903 65,962 51,706105 MBur 198,687 140,796 339,483 73,852 24,082 100,754 0 69,824 28,726 100,137 0 53,542 108,554 75,354106 LBur 182,519 27,802 210,321 32,645 15,123 134,752 0 36,760 18,302 127,457 0 23,497 136,612 109,792107 Tell 214,398 364,759 579,157 25,186 16,513 172,699 0 23,851 12,219 178,328 0 14,520 179,881 158,485108 Need 333,957 100,742 434,699 67,212 24,727 242,018 0 53,433 22,269 258,256 0 41,400 254,712 219,910109 Bru 329,712 16,323 346,035 54,434 13,430 261,847 0 55,351 18,686 255,675 0 42,290 262,216 238,895110 Saw 260,512 0 260,512 49,744 13,555 197,213 0 57,390 18,597 184,524 0 40,116 193,494 168,861
149,196 0 149,196 62,587 17,692 68,917 0 53,114 15,949 80,133 0 29,834 63,329 45,3994,311,668 1,620,243 5,931,911 1,235,147 416,347 2,645,567 14,607 1,259,504 434,875 2,602,682 14,607 948,431 2,750,841 2,181,816
L. Tenn. RiverTOTAL
Subwatershed Left Bank Riparian Zone Type (ft)Subwatershed Stream Length Right Bank Riparian Zone Type (ft) Riparian Zone Type - Both Banks Combined (ft)
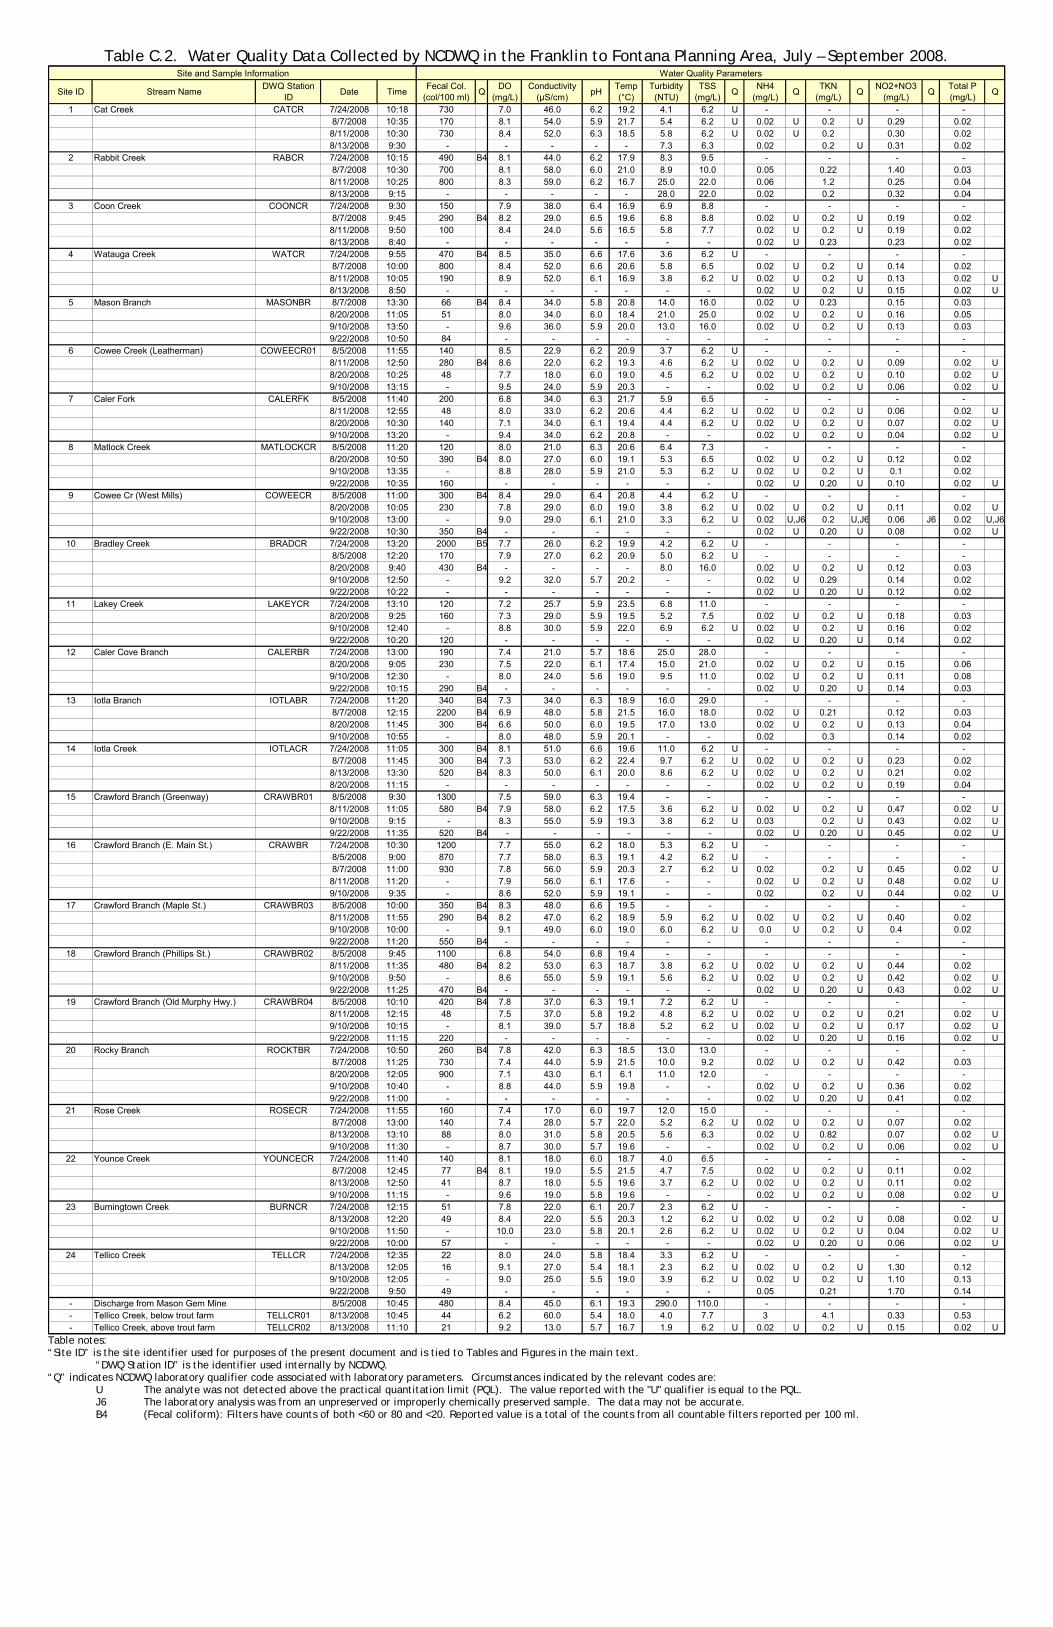
Table C.2. Water Quality Data Collected by NCDWQ in the Franklin to Fontana Planning Area, July – September 2008.
Site ID Stream Name DWQ Station ID Date Time Fecal Col.
(col/100 ml) Q DO (mg/L)
Conductivity (µS/cm) pH Temp
(°C)Turbidity
(NTU)TSS
(mg/L) Q NH4 (mg/L) Q TKN
(mg/L) Q NO2+NO3 (mg/L) Q Total P
(mg/L) Q
1 Cat Creek CATCR 7/24/2008 10:18 730 7.0 46.0 6.2 19.2 4.1 6.2 U - - - -8/7/2008 10:35 170 8.1 54.0 5.9 21.7 5.4 6.2 U 0.02 U 0.2 U 0.29 0.028/11/2008 10:30 730 8.4 52.0 6.3 18.5 5.8 6.2 U 0.02 U 0.2 0.30 0.028/13/2008 9:30 - - - - - 7.3 6.3 0.02 0.2 U 0.31 0.02
2 Rabbit Creek RABCR 7/24/2008 10:15 490 B4 8.1 44.0 6.2 17.9 8.3 9.5 - - - -8/7/2008 10:30 700 8.1 58.0 6.0 21.0 8.9 10.0 0.05 0.22 1.40 0.038/11/2008 10:25 800 8.3 59.0 6.2 16.7 25.0 22.0 0.06 1.2 0.25 0.048/13/2008 9:15 - - - - - 28.0 22.0 0.02 0.2 0.32 0.04
3 Coon Creek COONCR 7/24/2008 9:30 150 7.9 38.0 6.4 16.9 6.9 8.8 - - - -8/7/2008 9:45 290 B4 8.2 29.0 6.5 19.6 6.8 8.8 0.02 U 0.2 U 0.19 0.028/11/2008 9:50 100 8.4 24.0 5.6 16.5 5.8 7.7 0.02 U 0.2 U 0.19 0.028/13/2008 8:40 - - - - - - - 0.02 U 0.23 0.23 0.02
4 Watauga Creek WATCR 7/24/2008 9:55 470 B4 8.5 35.0 6.6 17.6 3.6 6.2 U - - - -8/7/2008 10:00 800 8.4 52.0 6.6 20.6 5.8 6.5 0.02 U 0.2 U 0.14 0.028/11/2008 10:05 190 8.9 52.0 6.1 16.9 3.8 6.2 U 0.02 U 0.2 U 0.13 0.02 U8/13/2008 8:50 - - - - - - - 0.02 U 0.2 U 0.15 0.02 U
5 Mason Branch MASONBR 8/7/2008 13:30 66 B4 8.4 34.0 5.8 20.8 14.0 16.0 0.02 U 0.23 0.15 0.038/20/2008 11:05 51 8.0 34.0 6.0 18.4 21.0 25.0 0.02 U 0.2 U 0.16 0.059/10/2008 13:50 - 9.6 36.0 5.9 20.0 13.0 16.0 0.02 U 0.2 U 0.13 0.039/22/2008 10:50 84 - - - - - - - - - -
6 Cowee Creek (Leatherman) COWEECR01 8/5/2008 11:55 140 8.5 22.9 6.2 20.9 3.7 6.2 U - - - -8/11/2008 12:50 280 B4 8.6 22.0 6.2 19.3 4.6 6.2 U 0.02 U 0.2 U 0.09 0.02 U8/20/2008 10:25 48 7.7 18.0 6.0 19.0 4.5 6.2 U 0.02 U 0.2 U 0.10 0.02 U9/10/2008 13:15 - 9.5 24.0 5.9 20.3 - - 0.02 U 0.2 U 0.06 0.02 U
7 Caler Fork CALERFK 8/5/2008 11:40 200 6.8 34.0 6.3 21.7 5.9 6.5 - - - -8/11/2008 12:55 48 8.0 33.0 6.2 20.6 4.4 6.2 U 0.02 U 0.2 U 0.06 0.02 U8/20/2008 10:30 140 7.1 34.0 6.1 19.4 4.4 6.2 U 0.02 U 0.2 U 0.07 0.02 U9/10/2008 13:20 - 9.4 34.0 6.2 20.8 - - 0.02 U 0.2 U 0.04 0.02 U
8 Matlock Creek MATLOCKCR 8/5/2008 11:20 120 8.0 21.0 6.3 20.6 6.4 7.3 - - - -8/20/2008 10:50 390 B4 8.0 27.0 6.0 19.1 5.3 6.5 0.02 U 0.2 U 0.12 0.029/10/2008 13:35 - 8.8 28.0 5.9 21.0 5.3 6.2 U 0.02 U 0.2 U 0.1 0.029/22/2008 10:35 160 - - - - - - 0.02 U 0.20 U 0.10 0.02 U
9 Cowee Cr (West Mills) COWEECR 8/5/2008 11:00 300 B4 8.4 29.0 6.4 20.8 4.4 6.2 U - - - -8/20/2008 10:05 230 7.8 29.0 6.0 19.0 3.8 6.2 U 0.02 U 0.2 U 0.11 0.02 U9/10/2008 13:00 - 9.0 29.0 6.1 21.0 3.3 6.2 U 0.02 U,J6 0.2 U,J6 0.06 J6 0.02 U,J69/22/2008 10:30 350 B4 - - - - - - 0.02 U 0.20 U 0.08 0.02 U
10 Bradley Creek BRADCR 7/24/2008 13:20 2000 B5 7.7 26.0 6.2 19.9 4.2 6.2 U - - - -8/5/2008 12:20 170 7.9 27.0 6.2 20.9 5.0 6.2 U - - - -8/20/2008 9:40 430 B4 - - - - 8.0 16.0 0.02 U 0.2 U 0.12 0.039/10/2008 12:50 - 9.2 32.0 5.7 20.2 - - 0.02 U 0.29 0.14 0.029/22/2008 10:22 - - - - - - - 0.02 U 0.20 U 0.12 0.02
11 Lakey Creek LAKEYCR 7/24/2008 13:10 120 7.2 25.7 5.9 23.5 6.8 11.0 - - - -8/20/2008 9:25 160 7.3 29.0 5.9 19.5 5.2 7.5 0.02 U 0.2 U 0.18 0.039/10/2008 12:40 - 8.8 30.0 5.9 22.0 6.9 6.2 U 0.02 U 0.2 U 0.16 0.029/22/2008 10:20 120 - - - - - - 0.02 U 0.20 U 0.14 0.02
12 Caler Cove Branch CALERBR 7/24/2008 13:00 190 7.4 21.0 5.7 18.6 25.0 28.0 - - - -8/20/2008 9:05 230 7.5 22.0 6.1 17.4 15.0 21.0 0.02 U 0.2 U 0.15 0.069/10/2008 12:30 - 8.0 24.0 5.6 19.0 9.5 11.0 0.02 U 0.2 U 0.11 0.089/22/2008 10:15 290 B4 - - - - - - 0.02 U 0.20 U 0.14 0.03
13 Iotla Branch IOTLABR 7/24/2008 11:20 340 B4 7.3 34.0 6.3 18.9 16.0 29.0 - - - -8/7/2008 12:15 2200 B4 6.9 48.0 5.8 21.5 16.0 18.0 0.02 U 0.21 0.12 0.038/20/2008 11:45 300 B4 6.6 50.0 6.0 19.5 17.0 13.0 0.02 U 0.2 U 0.13 0.049/10/2008 10:55 - 8.0 48.0 5.9 20.1 - - 0.02 0.3 0.14 0.02
14 Iotla Creek IOTLACR 7/24/2008 11:05 300 B4 8.1 51.0 6.6 19.6 11.0 6.2 U - - - -8/7/2008 11:45 300 B4 7.3 53.0 6.2 22.4 9.7 6.2 U 0.02 U 0.2 U 0.23 0.028/13/2008 13:30 520 B4 8.3 50.0 6.1 20.0 8.6 6.2 U 0.02 U 0.2 U 0.21 0.028/20/2008 11:15 - - - - - - - 0.02 U 0.2 U 0.19 0.04
15 Crawford Branch (Greenway) CRAWBR01 8/5/2008 9:30 1300 7.5 59.0 6.3 19.4 - - - - - -8/11/2008 11:05 580 B4 7.9 58.0 6.2 17.5 3.6 6.2 U 0.02 U 0.2 U 0.47 0.02 U9/10/2008 9:15 - 8.3 55.0 5.9 19.3 3.8 6.2 U 0.03 0.2 U 0.43 0.02 U9/22/2008 11:35 520 B4 - - - - - - 0.02 U 0.20 U 0.45 0.02 U
16 Crawford Branch (E. Main St.) CRAWBR 7/24/2008 10:30 1200 7.7 55.0 6.2 18.0 5.3 6.2 U - - - -8/5/2008 9:00 870 7.7 58.0 6.3 19.1 4.2 6.2 U - - - -8/7/2008 11:00 930 7.8 56.0 5.9 20.3 2.7 6.2 U 0.02 0.2 U 0.45 0.02 U8/11/2008 11:20 - 7.9 56.0 6.1 17.6 - - 0.02 U 0.2 U 0.48 0.02 U9/10/2008 9:35 - 8.6 52.0 5.9 19.1 - - 0.02 0.2 U 0.44 0.02 U
17 Crawford Branch (Maple St.) CRAWBR03 8/5/2008 10:00 350 B4 8.3 48.0 6.6 19.5 - - - - - -8/11/2008 11:55 290 B4 8.2 47.0 6.2 18.9 5.9 6.2 U 0.02 U 0.2 U 0.40 0.029/10/2008 10:00 - 9.1 49.0 6.0 19.0 6.0 6.2 U 0.0 U 0.2 U 0.4 0.029/22/2008 11:20 550 B4 - - - - - - - - - -
18 Crawford Branch (Phillips St.) CRAWBR02 8/5/2008 9:45 1100 6.8 54.0 6.8 19.4 - - - - - -8/11/2008 11:35 480 B4 8.2 53.0 6.3 18.7 3.8 6.2 U 0.02 U 0.2 U 0.44 0.029/10/2008 9:50 - 8.6 55.0 5.9 19.1 5.6 6.2 U 0.02 U 0.2 U 0.42 0.02 U9/22/2008 11:25 470 B4 - - - - - - 0.02 U 0.20 U 0.43 0.02 U
19 Crawford Branch (Old Murphy Hwy.) CRAWBR04 8/5/2008 10:10 420 B4 7.8 37.0 6.3 19.1 7.2 6.2 U - - - -8/11/2008 12:15 48 7.5 37.0 5.8 19.2 4.8 6.2 U 0.02 U 0.2 U 0.21 0.02 U9/10/2008 10:15 - 8.1 39.0 5.7 18.8 5.2 6.2 U 0.02 U 0.2 U 0.17 0.02 U9/22/2008 11:15 220 - - - - - - 0.02 U 0.20 U 0.16 0.02 U
20 Rocky Branch ROCKTBR 7/24/2008 10:50 260 B4 7.8 42.0 6.3 18.5 13.0 13.0 - - - -8/7/2008 11:25 730 7.4 44.0 5.9 21.5 10.0 9.2 0.02 U 0.2 U 0.42 0.038/20/2008 12:05 900 7.1 43.0 6.1 6.1 11.0 12.0 - - - -9/10/2008 10:40 - 8.8 44.0 5.9 19.8 - - 0.02 U 0.2 U 0.36 0.029/22/2008 11:00 - - - - - - - 0.02 U 0.20 U 0.41 0.02
21 Rose Creek ROSECR 7/24/2008 11:55 160 7.4 17.0 6.0 19.7 12.0 15.0 - - - -8/7/2008 13:00 140 7.4 28.0 5.7 22.0 5.2 6.2 U 0.02 U 0.2 U 0.07 0.028/13/2008 13:10 88 8.0 31.0 5.8 20.5 5.6 6.3 0.02 U 0.82 0.07 0.02 U9/10/2008 11:30 - 8.7 30.0 5.7 19.6 - - 0.02 U 0.2 U 0.06 0.02 U
22 Younce Creek YOUNCECR 7/24/2008 11:40 140 8.1 18.0 6.0 18.7 4.0 6.5 - - - -8/7/2008 12:45 77 B4 8.1 19.0 5.5 21.5 4.7 7.5 0.02 U 0.2 U 0.11 0.028/13/2008 12:50 41 8.7 18.0 5.5 19.6 3.7 6.2 U 0.02 U 0.2 U 0.11 0.029/10/2008 11:15 - 9.6 19.0 5.8 19.6 - - 0.02 U 0.2 U 0.08 0.02 U
23 Burningtown Creek BURNCR 7/24/2008 12:15 51 7.8 22.0 6.1 20.7 2.3 6.2 U - - - -8/13/2008 12:20 49 8.4 22.0 5.5 20.3 1.2 6.2 U 0.02 U 0.2 U 0.08 0.02 U9/10/2008 11:50 - 10.0 23.0 5.8 20.1 2.6 6.2 U 0.02 U 0.2 U 0.04 0.02 U9/22/2008 10:00 57 - - - - - - 0.02 U 0.20 U 0.06 0.02 U
24 Tellico Creek TELLCR 7/24/2008 12:35 22 8.0 24.0 5.8 18.4 3.3 6.2 U - - - -8/13/2008 12:05 16 9.1 27.0 5.4 18.1 2.3 6.2 U 0.02 U 0.2 U 1.30 0.129/10/2008 12:05 - 9.0 25.0 5.5 19.0 3.9 6.2 U 0.02 U 0.2 U 1.10 0.139/22/2008 9:50 49 - - - - - - 0.05 0.21 1.70 0.14
- Discharge from Mason Gem Mine 8/5/2008 10:45 480 8.4 45.0 6.1 19.3 290.0 110.0 - - - -- Tellico Creek, below trout farm TELLCR01 8/13/2008 10:45 44 6.2 60.0 5.4 18.0 4.0 7.7 3 4.1 0.33 0.53- Tellico Creek, above trout farm TELLCR02 8/13/2008 11:10 21 9.2 13.0 5.7 16.7 1.9 6.2 U 0.02 U 0.2 U 0.15 0.02 U
Site and Sample Information Water Quality Parameters
Table notes: “Site ID” is the site identifier used for purposes of the present document and is tied to Tables and Figures in the main text. “DWQ Station ID” is the identifier used internally by NCDWQ. “Q” indicates NCDWQ laboratory qualifier code associated with laboratory parameters. Circumstances indicated by the relevant codes are: U The analyte was not detected above the practical quantitation limit (PQL). The value reported with the "U" qualifier is equal to the PQL. J6 The laboratory analysis was from an unpreserved or improperly chemically preserved sample. The data may not be accurate. B4 (Fecal coliform): Filters have counts of both <60 or 80 and <20. Reported value is a total of the counts from all countable filters reported per 100 ml.
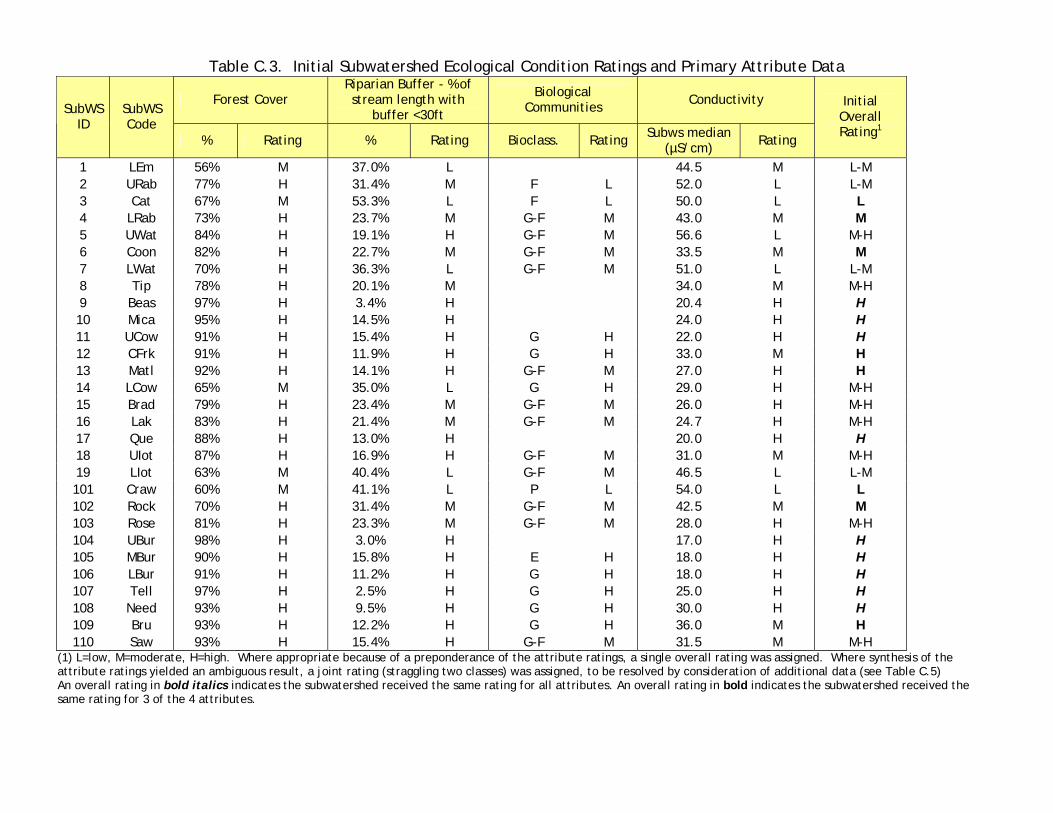
Table C.3. Initial Subwatershed Ecological Condition Ratings and Primary Attribute Data
Forest Cover Riparian Buffer - % of stream length with
buffer <30ft
Biological Communities Conductivity
SubWS ID
SubWS Code
% Rating % Rating Bioclass. Rating Subws median (µS/cm) Rating
Initial Overall Rating1
1 LEm 56% M 37.0% L 44.5 M L-M2 URab 77% H 31.4% M F L 52.0 L L-M3 Cat 67% M 53.3% L F L 50.0 L L 4 LRab 73% H 23.7% M G-F M 43.0 M M 5 UWat 84% H 19.1% H G-F M 56.6 L M-H6 Coon 82% H 22.7% M G-F M 33.5 M M 7 LWat 70% H 36.3% L G-F M 51.0 L L-M8 Tip 78% H 20.1% M 34.0 M M-H9 Beas 97% H 3.4% H 20.4 H H 10 Mica 95% H 14.5% H 24.0 H H 11 UCow 91% H 15.4% H G H 22.0 H H 12 CFrk 91% H 11.9% H G H 33.0 M H 13 Matl 92% H 14.1% H G-F M 27.0 H H 14 LCow 65% M 35.0% L G H 29.0 H M-H15 Brad 79% H 23.4% M G-F M 26.0 H M-H16 Lak 83% H 21.4% M G-F M 24.7 H M-H17 Que 88% H 13.0% H 20.0 H H 18 UIot 87% H 16.9% H G-F M 31.0 M M-H19 LIot 63% M 40.4% L G-F M 46.5 L L-M101 Craw 60% M 41.1% L P L 54.0 L L 102 Rock 70% H 31.4% M G-F M 42.5 M M 103 Rose 81% H 23.3% M G-F M 28.0 H M-H104 UBur 98% H 3.0% H 17.0 H H 105 MBur 90% H 15.8% H E H 18.0 H H 106 LBur 91% H 11.2% H G H 18.0 H H 107 Tell 97% H 2.5% H G H 25.0 H H 108 Need 93% H 9.5% H G H 30.0 H H 109 Bru 93% H 12.2% H G H 36.0 M H 110 Saw 93% H 15.4% H G-F M 31.5 M M-H
(1) L=low, M=moderate, H=high. Where appropriate because of a preponderance of the attribute ratings, a single overall rating was assigned. Where synthesis of the attribute ratings yielded an ambiguous result, a joint rating (straggling two classes) was assigned, to be resolved by consideration of additional data (see Table C.5) An overall rating in bold italics indicates the subwatershed received the same rating for all attributes. An overall rating in bold indicates the subwatershed received the same rating for 3 of the 4 attributes.
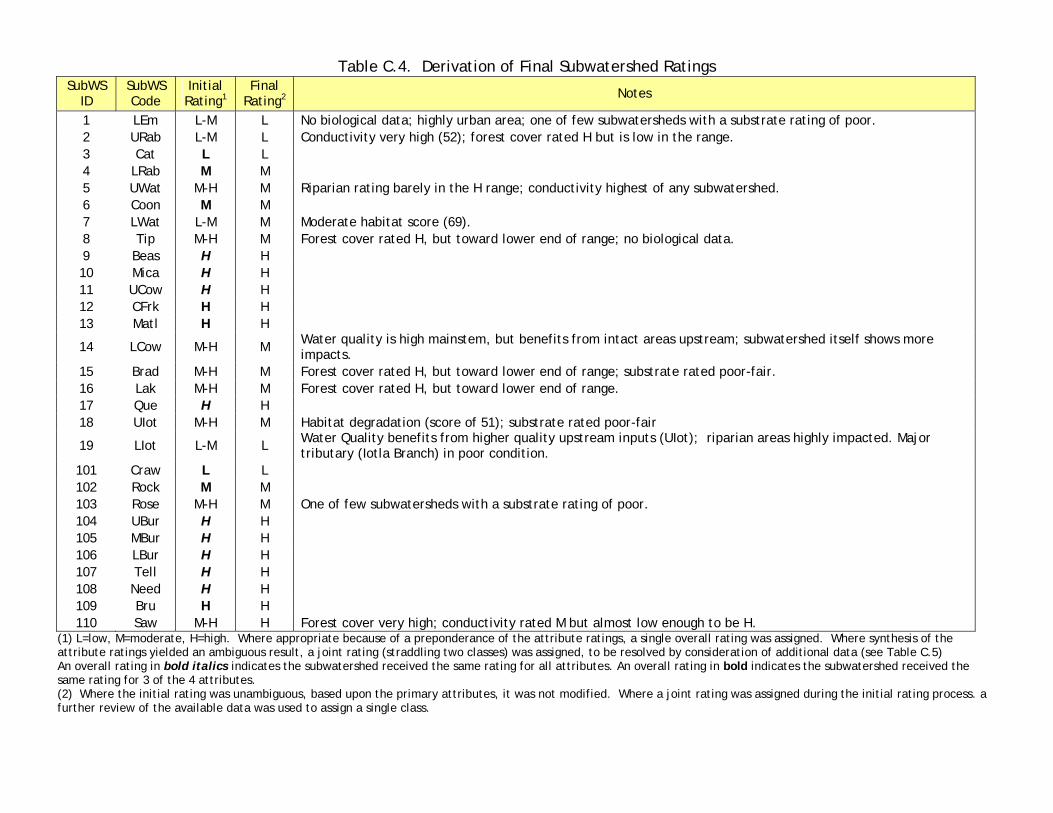
Table C.4. Derivation of Final Subwatershed Ratings SubWS
ID SubWS Code
Initial Rating1
Final Rating2 Notes
1 LEm L-M L No biological data; highly urban area; one of few subwatersheds with a substrate rating of poor. 2 URab L-M L Conductivity very high (52); forest cover rated H but is low in the range. 3 Cat L L 4 LRab M M5 UWat M-H M Riparian rating barely in the H range; conductivity highest of any subwatershed. 6 Coon M M 7 LWat L-M M Moderate habitat score (69). 8 Tip M-H M Forest cover rated H, but toward lower end of range; no biological data. 9 Beas H H 10 Mica H H11 UCow H H12 CFrk H H13 Matl H H
14 LCow M-H M Water quality is high mainstem, but benefits from intact areas upstream; subwatershed itself shows more impacts.
15 Brad M-H M Forest cover rated H, but toward lower end of range; substrate rated poor-fair. 16 Lak M-H M Forest cover rated H, but toward lower end of range. 17 Que H H 18 UIot M-H M Habitat degradation (score of 51); substrate rated poor-fair
19 LIot L-M L Water Quality benefits from higher quality upstream inputs (UIot); riparian areas highly impacted. Major tributary (Iotla Branch) in poor condition.
101 Craw L L 102 Rock M M103 Rose M-H M One of few subwatersheds with a substrate rating of poor. 104 UBur H H 105 MBur H H106 LBur H H107 Tell H H108 Need H H109 Bru H H110 Saw M-H H Forest cover very high; conductivity rated M but almost low enough to be H.
(1) L=low, M=moderate, H=high. Where appropriate because of a preponderance of the attribute ratings, a single overall rating was assigned. Where synthesis of the attribute ratings yielded an ambiguous result, a joint rating (straddling two classes) was assigned, to be resolved by consideration of additional data (see Table C.5) An overall rating in bold italics indicates the subwatershed received the same rating for all attributes. An overall rating in bold indicates the subwatershed received the same rating for 3 of the 4 attributes. (2) Where the initial rating was unambiguous, based upon the primary attributes, it was not modified. Where a joint rating was assigned during the initial rating process. a further review of the available data was used to assign a single class.
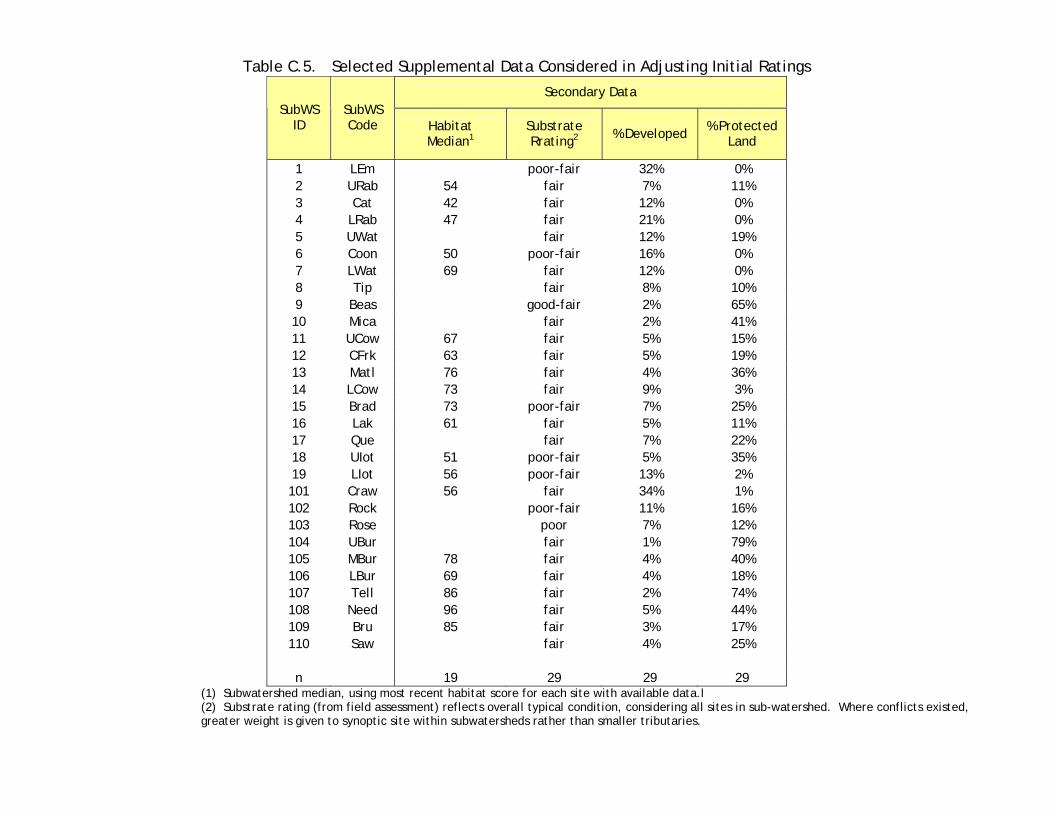
Table C.5. Selected Supplemental Data Considered in Adjusting Initial Ratings
Secondary Data SubWS
ID SubWS Code Habitat
Median1Substrate Rrating2 % Developed % Protected
Land
1 LEm poor-fair 32% 0%2 URab 54 fair 7% 11%3 Cat 42 fair 12% 0%4 LRab 47 fair 21% 0%5 UWat fair 12% 19%6 Coon 50 poor-fair 16% 0%7 LWat 69 fair 12% 0%8 Tip fair 8% 10%9 Beas good-fair 2% 65%10 Mica fair 2% 41%11 UCow 67 fair 5% 15%12 CFrk 63 fair 5% 19%13 Matl 76 fair 4% 36%14 LCow 73 fair 9% 3%15 Brad 73 poor-fair 7% 25%16 Lak 61 fair 5% 11%17 Que fair 7% 22%18 UIot 51 poor-fair 5% 35%19 LIot 56 poor-fair 13% 2%101 Craw 56 fair 34% 1%102 Rock poor-fair 11% 16%103 Rose poor 7% 12%104 UBur fair 1% 79%105 MBur 78 fair 4% 40%106 LBur 69 fair 4% 18%107 Tell 86 fair 2% 74%108 Need 96 fair 5% 44%109 Bru 85 fair 3% 17%110 Saw fair 4% 25%
n 19 29 29 29
(1) Subwatershed median, using most recent habitat score for each site with available data.l (2) Substrate rating (from field assessment) reflects overall typical condition, considering all sites in sub-watershed. Where conflicts existed, greater weight is given to synoptic site within subwatersheds rather than smaller tributaries.


