Appendix A Overview of Software A.1 Introduction Quite extensive software tools have become available over the past 20 years. A brief overview over some of the main tools which are oriented towards offshore/oil and gas applications are presented in this appendix. These tools have been categorised into the following: • QRA software • QRA software tools for scenario and probability analysis • QRA software tools for consequence analysis • Risk management software • Qualitative risk assessment software • Reporting and analysis of incidents and accidents Brief summaries are presented as an overview, followed by brief sections presenting some of the main characteristics of these products. These summaries have been prepared by the software vendors. Only those products are detailed where a response was received from the vendors. The descriptions are structured as follows: • Name and purpose of software • Scope of software • License conditions, pricing etc. It should be stressed that there is a large amount of general software tools for CFD from many different suppliers. These have not been included in the presentations that follow throughout this appendix. Some of these may have quite valid applications during estimation of loads from fire or explosion, or for gas dispersion or oil slick movements. Because there are so many software tools available in this category, it becomes impossible to give an overview of all relevant tools. None of these are therefore included. Software tools that are only directed at onshore usage are not included in the reviews, neither are tools for production/transport regularity analysis. J.-E. Vinnem, Offshore Risk Assessment vol 1, Springer Series in Reliability Engineering, DOI: 10.1007/978-1-4471-5207-1, Ó Springer-Verlag London 2014 855
Transcript
Appendix AOverview of Software
A.1 Introduction
Quite extensive software tools have become available over the past 20 years. Abrief overview over some of the main tools which are oriented towards offshore/oiland gas applications are presented in this appendix. These tools have beencategorised into the following:
• QRA software• QRA software tools for scenario and probability analysis• QRA software tools for consequence analysis• Risk management software• Qualitative risk assessment software• Reporting and analysis of incidents and accidents
Brief summaries are presented as an overview, followed by brief sectionspresenting some of the main characteristics of these products. These summarieshave been prepared by the software vendors. Only those products are detailedwhere a response was received from the vendors. The descriptions are structured asfollows:
• Name and purpose of software• Scope of software• License conditions, pricing etc.
It should be stressed that there is a large amount of general software tools forCFD from many different suppliers. These have not been included in thepresentations that follow throughout this appendix. Some of these may have quitevalid applications during estimation of loads from fire or explosion, or for gasdispersion or oil slick movements. Because there are so many software toolsavailable in this category, it becomes impossible to give an overview of allrelevant tools. None of these are therefore included.
Software tools that are only directed at onshore usage are not included in thereviews, neither are tools for production/transport regularity analysis.
J.-E. Vinnem, Offshore Risk Assessment vol 1, Springer Series in Reliability Engineering,DOI: 10.1007/978-1-4471-5207-1, � Springer-Verlag London 2014
855
All software tools that are mentioned in the following are commerciallyavailable from the vendor as listed (Table A.1).
A.2 Electronic Contacts
The following is a listing of electronic contacts to the software providers (Table A.2):
Table A.1 Overview of software for quantitative risk analysis
Software Purpose Contact
ASAP� 3D geometrical description and analysisof a fixed set of event trees
Lilleaker Consulting, Oslo,Norway
COSAC� Risk assessment tool for early project phasesof a field development for concept evaluationand screening. The tool can also be usedas an aid for HAZID of offshore platforms
The following is a brief description of this software, the function, vendor, pricingand main features (Table A.3).
• Function 3D geometrical description and analysis of a fixed set of event trees• Vendor Lillesoft a.s., Baerum, Norway• Pricing License fee using ASAP� on the Lillesoft Terminal Server:
NOK 190,000 (12 months)NOK 65,000 (3 months)NOK 30,000 (1 month)
ASAP� is a computer analysis package that calculates the risk related to HCleaks, fires and explosions on oil and gas installations. The first ASAP� versionwas released in 1988 and has been continuously developed since then (Table A.4).
Complex interactions in horizontal and vertical directions are taken care of byadjusting the models to three-dimensional geometry. Scenarios such as gas and
Table A.2 Overview of QRA software for scenario and probability risk analysis
Software Purpose Contact
BlowFAM� Evaluation of blowout risk during specific welloperations
Scandpower RiskManagement,Kjeller, Norway
COAST� Shipping traffic database, using GIS for userinterface and graphical pres. of information onshipping routes and vessel characteristics
Safetec Nordic,Trondheim, Norway
COLLIDE� Analysis of collision risk between vessels andplatforms
Safetec Nordic,Trondheim, Norway
EGRESS� Mustering and evacuation simulationfor evacuation/rescue modelling
ESR Technology, UK
LEAK� Calculation of the frequency of leaks atan installation
DNV Software, London,UK
R–DAT Plus� Bayesian data analysis PredictionTechnologies, MD,USA
CARA–FaultTree�
Fault tree analysis and construction ExproSoft AS,Trondheim, Norway
US OffshoreEnergyModelTM
A fully probabilistic risk model that quantifiesprospective risk from hurricanes in the Gulf ofMexico
EQECAT, USA
BlockSim� System analysis with RBDs or fault trees ReliaSoft, USARENO� Probabilistic event and risk analysis ReliaSoft, USARiskSpectrum�
HRAHuman reliability analysis tool to evaluate and
quantify the probability of human errorsScandpower AB,
Stockholm, Sweden
Appendix A: Overview of Software 857
liquid jets followed by gas dispersion and fire development can be seen in 3Dgraphic, giving a good interpretation of the accident (Table A.5).
The calculation of gas dispersion, detection and ignition is transient such thatthe effect of safety barriers (detection, ignition control, shutdown and blowdown)forms part of the analysis. The latest feature of the program is that moduleventilation and gas dispersion results from CFD codes (like e.g. FLACS�) can beimported into ASAP� to improve the accuracy of the risk calculations (Table A.6).
A.3.2 COSAC�
The following is a brief description of this software, the function, vendor, pricingand main features.
• Function Risk assessment tool for early project phases of a field developmentfor concept evaluation and screening
Table A.3 Overview of QRA software for consequence analysis
Software Purpose Contact
FIREX� Empirical prediction of main fire characteristicsand responses
Scandpower RiskManagement,Kjeller, Norway
FLACS� Explosion simulation Gexcon, Bergen,Norway
KAMELEONFireEx–KFX�
Fire and gas dispersion simulation ComputIT, Trondheim,Norway
OLGA� Transient multiphase flow simulator for systemscomprising flow lines, risers and processequipment.
SPT Group, Kjeller,Norway
PHAST� Windows-based toolkit for determination ofconsequences of accidental releases of hazardousmaterial
DNV Software,London, UK
SAFERTRACETM
Consequence Analysis for chemical facility SAFER Systems, USA
USFOS/FAHTS Structural fire and explosion analysis USFOS AS, NorwayPIPENETTM Pressure loss and flowrate model for offloading,
firewater and ventilation systemsSunrise System Ltd,
UKVessFire Heat transfer, depressurisation and stress modelling
from firesPetrell AS, Norway
HYENA Fire sprinkler/hydrant analysis ACADS-BSG,Australia
ANSYS Fluent Physical modeling of flow, turbulence, heat transfer,and reactions for industrial applications
ANSYS, USA
ANSYS CFX Fluid dynamics program to solve wide-ranging fluidflow problems
ANSYS, USA
858 Appendix A: Overview of Software
• Vendor Scandpower Risk Management, Kjeller, Norway• Pricing Available on request.
COSAC� is a computerised tool for efficient risk assessment in the early projectphases of a field development.
COSAC� analysis and results are tailor-made for concept evaluation andscreening. Its aim is to increase the safety of new offshore developments byutilising 20 years of experience gained from risk analyses. Some of the mainfeatures of COSAC� include reducing uncertainty, improving the quality andefficiency of early phase safety evaluations. COSAC� provides a safety score forevery risk factor associated with an offshore field development concept. A lowscore indicates safety concerns and/or lack of documentation of important safetyissues. Therefore, a low safety score in COSAC� puts these issues in focus. Inaddition the user is provided with information on how to resolve the problemsidentified by COSAC�.
COSAC� has a unique explosion risk prediction model which calculatesexplosion loads for a variety of module configurations. The predictions are basedon FLACS� simulations for comparable geometries.
A.3.3 Safeti Offshore�
The following is a brief description of this software, the function, vendor, pricingand main features.
• Function Offshore risk analysis• Vendor DNV Software, London, UK• Pricing Available upon request
Safeti Offshore� is the successor to Neptune and OHRAT, and was released in2012. Safeti Offshore� is a comprehensive software tool for designing, calculating
Table A.4 Overview of software for qualitative risk analysis
Software Purpose Contact
HAZOP Manager HAZOP Tool Lihou Technical & Software Services, UK
Table A.5 Overview of software for accident/incident analysis
Software Purpose Contact
DNVBSCATTM
Modern risk-based safety management approachesto systematic root cause incident investigation
CGE Risk ManagementSolutions, TheNetherlands
Appendix A: Overview of Software 859
and providing full traceability of a quantitative risk assessment. The systemarchitecture has been designed to provide a methodological approach to riskanalyses using best practice techniques. Safeti Offshore� contains models forcalculation of discharge, dispersion, pool formation and evaporation, flammableand toxic effects and impact. Also contained with Safeti Offshore� are modelsdesigned for the specific needs of offshore installations, such as inventorycalculation from isolatable sections, safety systems for isolation and blowdown,fire and blast wall success and failure, event escalation, smoke generation,evacuation, endangerment of muster areas, collision with ships, in moduledispersion, ignition and explosion and many more. Safeti Offshore� offers flexiblemodelling of hazards and risks through a wide range of analytic capabilitiesincluding consequence modelling, leak frequency calculations, sensitivity andwhat-if analysis. Safeti Offshore� operates under MS-Windows�.
Table A.6 Overview of risk management software
Software Purpose Contact
ViewRisk Risk summation and presentation tool,including outputs of risk contours,F–N data, risk transects and a listingof dominant events
Environmental ResourcesManagement (ERM),London, UK
Synergi RBI� Onshore and offshore risk basedinspection tool
DNV Software, London,UK
BowTieXP� Management of major risks to people, theenvironment, assets and reputation bymeans of A bowtie@ graphicalinterface diagram
CGE Risk ManagementSolutions, TheNetherlands
THESIS Management of major risks to people, theenvironment, assets and reputation bymeans of ‘‘bow-tie’’ graphicalinterface diagram
ABS Consulting,Warrington, UK
BowTie ProTM Qualitative, semi-quantitative &illustrative risk analysis and riskmanagement
Reduce major accident risk withoperations and context focused KPImanagement for barrier & processsafety improvements and reducedown-time events. Convert complexmulti-systems information intoindicators, supporting risk awarenessand safer operations decisions
Presight Solutions AS,Norway
Synergi Life Complete business solution for risk andQHSE management, managing allnon-conformances, incidents, risk, riskanalyses, audits, assessments andimprovement suggestions
DNV Software, London,UK
SafeGuard Visualisation of status of major accidentrisk in a plant
Safetec Nordic,Trondheim, Norway
860 Appendix A: Overview of Software
A.3.4 PLATO�
The following is a brief description of this software, the function, vendor, pricingand main features.
• Function 3D geometrical platform model including representation of safetyrelated engineering components and design features, analysingexplicitly development and timing of escalating hazards, fire,explosion and structural collapse
Optional annual maintenance: GBP 3,000 per year (telephonesupport and free minor software revisions).
PLATO� uses a 3D model of the platform in which all safety relatedengineering components and design features are explicitly represented. Thedevelopment and timing of escalating hazards such as fire, explosion and structuralcollapse are simulated with automatic generation of scenarios where safety relatedcomponents affect the outcome. Results can be processed not only for the overalllevel of societal and individual risk but also to determine the primary escalationmechanisms and key safety critical equipment. The primary benefits over eventtree methods are modelling realism, auditability, explicit representation ofgeometry/time and ease of update for evaluation of design options or platformmodifications.
A.3.5 RiskSpectrum� PSA
The following is a brief description of this software, the function, vendor, pricingand main features.
• Function Fault tree and event tree software• Vendor Scandpower AB, Stockholm, Sweden• Pricing On request.
RiskSpectrum� PSA offers Fault Tree and Event Tree modelling interface,analysis, reliability data management and quality assurance all in one application.The separate MCS and BDD Engine—RSAT—is used for the conversion of FaultTrees, Sequences and Consequences to MCS or BDD to enable quantification ofe.g. CDF and LERF.
RiskSpectrum� PSA is the complete linked Fault Tree and Event Tree tool. Itsbasic blocks of functionality are:
• Fault Tree editor• Event Tree editor• Analysis Tool (MCS generator)
Appendix A: Overview of Software 861
All data are stored in a relational database, which makes it easy to browse, findrelations and update—data is never repeated but only stored in one place.RiskSpectrum� PSA has also a system for storing information about each recordsstatus—edit, review and approve status.
A.3.6 RISK�
The following is a brief description of this software, the function, vendor, pricingand main features.
• Function Comprehensive offshore quantitative risk assessment tool• Vendor ESR Technology, UK• Pricing Not available.
RISK� is a linked spreadsheet QRA model developed on EXCEL�. It enablesusers to clearly identify the key stages of the risk assessment process and followindividual major hazard events from their initiation, through accidentdevelopment, to the contribution they make to accident scenarios, TRImpairment, individual risk and PLL. Key features of RISK� are:
• Developed using industry standard spreadsheet software package (EXCEL�).• Is user friendly and can be interrogated by engineers without the need for formal
training.• Is easy to tailor to meet specific project requirements.• Is transparent and focuses on key scenarios at an appropriate level of detail.
A.3.7 SAFETI�
The following is a brief description of this software, the function, vendor, pricingand main features.
• Function Comprehensive QRA software tool for flammable, explosive andtoxic impact
• Vendor DNV Software, London, UK• Pricing Available on request.
SAFETI� (Software for the Assessment of Flammable, Explosive and ToxicImpact) is the most comprehensive and widely used onshore QRA packageavailable. It is a Windows� based system that provides a user friendly, industrystandard method for quantifying major chemical risks. It enables analysis of thelikelihood and severity of major hazards and makes use of the PHAST� models topredict the consequence of major releases. By combining these with theirfrequencies and taking account of population location and density, along with
862 Appendix A: Overview of Software
ignition source location for flammable and explosive effects, a number ofpresentations of ‘risk’ are possible. These include risk contours, F/N curves, risktransects and risk ranking at specific points. Additionally, effect exceedance resultsincluding flammable radiation and explosion overpressure provide completesupport for occupied building analysis. Safeti� performs 3D explosion calculationsusing the Multi-Energy and Baker Strehlow Tang explosion methodologies.
A.4 QRA Tools for Scenario and Probability Analysis
A.4.1 BlowFAM�
The following is a brief description of this software, the function, vendor, pricingand main features.
• Function Evaluation of blowout risk during specific well operations throughassessment of approximately 300 elements, which influence theprobability of a blowout
• Vendor Scandpower Risk Management, Kjeller, Norway• Pricing Available on request
BlowFAM� is a PC-tool for evaluation of blowout risk during specific welloperations. BlowFAM� has been developed in close cooperation with drilling/wellintervention professionals in the participating companies. In addition, drillingspecialists from several contractor companies have contributed.
The BlowFAM� model has identified approximately 300 elements, thatinfluence the probability of a blowout. Many of these are applicable for the wholewell life while others are only relevant for a specific well phase, e.g. drilling of thewell. These elements are rated in regard to their importance to the risk. Main riskcontributors for a specific development can be identified and cost-efficient riskreducing measures may be implemented.
The BlowFAM� model is also a valuable tool for communicating risk elementsto the drilling professionals involved in the well operations.
A.4.2 COAST�
The following is a brief description of this software, the function, vendor, pricingand main features.
• Function Shipping traffic database holding details on regular shipping trafficon the Norwegian and UK Continental Shelves as well as other areasof the world. Includes graphical presentation of information onshipping routes and vessel characteristics using GIS
Appendix A: Overview of Software 863
• Vendor Safetec Nordic, Norway• Pricing Not available.
The Computer Assisted Shipping Traffic (COAST�) database was firstdeveloped by Safetec in 1996 under the funding of the HSE, UKOOA andDETR. Later it was increased to include the entire Norwegian continental shelf,under funding from the Norwegian Oil and Gas. Using COAST� you are able toidentify all regular shipping traffic within a defined area both on the British andNorwegian continental shelves.
The COAST� database is based on a number of sources including Lloyd’s PortLog Data, radar data from offshore and onshore radar stations, manual vesseltraffic surveys, operator information etc. By combining these data, Safetec is ableto identify both the location and width of shipping routes, the number of ships ineach route, and the distribution of these ships within the route etc. The trafficpatterns are displayed on electronic raster charts for easy identification.
The information from COAST� are used in several ways, includingidentification of the shipping traffic pattern in an area, calculation of the risk ofcollisions between ship and offshore installations, input to emergencypreparedness analyses and assessment of threats to the marine environment.
COAST� was first released in 2002. Safetec recognised that the routing on theNCS will evolve and therefore continuous updates of the route database areundertaken. As changes to shipping routes are recognised (e.g. due tothe installation of new offshore platforms) they are incorporated by Safetec andthe new route database is issued. The most recent main update of COAST� wasperformed based on Lloyd’s port log data, AIS data provided by Statoil MarineSandsli and Ekofisk Radar (ConocoPhillips) and offshore vessel movements(supply, SBV and shuttle tanker routes) provided by the operators.
Recently, AIS data has become the most prominent data source to offer bespoketraffic survey services worldwide using the COAST� methodology.
A.4.3 COLLIDE�
The following is a brief description of this software, the function, vendor, pricingand main features.
• Function Analysis of collision risk between vessels and platforms• Vendor Safetec Nordic, Norway• Pricing Not available.
The COLLIDE� software tool is mainly used for calculating collisionfrequencies and energies between approaching vessels and offshore installations,windfarms, etc. COLLIDE� is capable of modelling both passing and driftingvessels, as well as other drifting substances. The results of a COLLIDE� analysisis often used as input to risk analyses of offshore installations.
864 Appendix A: Overview of Software
Field related traffic mainly consists of supply and standby vessels, in addition toshuttle tankers.
• Supply vessels—In recent years, supply vessels have been increasing in size andbecome more advanced, making them a threat to an offshore installation bothduring approach, and loading and unloading operations. The importance ofhaving proper procedures and safety management systems in place to be able tocope with this threat has thus been strengthened.
• Shuttle tankers—Operating close to the installations when they are loading, anddue to their size, even a low speed collision of a shuttle tanker can causesubstantial material damage.
A.4.4 Egress�
The following is a brief description of this software, the function, vendor, pricingand main features.
• Function Mustering and evacuation simulation for evacuation/rescuemodelling
• Vendor ESR Technology, UK• Pricing Not available.
The Egress� code allows the movement of large numbers of personnel, such aswhen mustering on an installation, to be simulated. The platform layout ismodelled as a matrix of interconnecting cells. The code covers both the physicalmovement and behavioural decision-making of personnel. The output is graphicaland the movement watched as a real-time graphical representation. It wasdeveloped as part of a joint industry project in the UK between ESR Technology,Shell, Texaco, Exxon, and the Health and Safety Executive.
The code has been used both offshore and onshore for the oil and gas and otherindustries to provide assessments of the movement of people during incidents.
A.4.5 LEAK�
The following is a brief description of this software, the function, vendor, pricingand main features.
• Function Calculation of the frequency of leaks at an installation• Vendor DNV Software, London, UK• Pricing Available on request.
LEAK� is a software tool which calculates the frequency of leaks at aninstallation, typically an oil platform. Each installation is broken down into anumber of areas which are themselves split into a number of segments each
Appendix A: Overview of Software 865
containing a list of equipment groups. Each equipment group is built up of baseelements such as valves, flanges, pipes, etc. LEAK� will calculate the leakfrequency for the installation, area, segment or equipment group based on built-inhistorical leak frequency data. The total frequency for each user defined categoryis reported together with each contributor. The model used expresses the frequencyof a leak being larger than a certain size as a continuous function of the equivalenthole size diameter. The historical data used in the calculations is read from adatabase, enabling the most up-to-date data to be included.
A.4.6 R–DAT Plus�
The following is a brief description of this software, the function, vendor, pricingand main features.
• Function Bayesian data analysis• Vendor Prediction Technologies, MD, USA• Pricing Not available.
http://www.prediction-technologies.com/products/r-dat.brochure.pdf, R–DATPlus� is a full-featured Bayesian data analysis package for risk and reliabilityanalysts. It is designed for users who need to perform system specific analyses, butwho also have a need to develop generic prior distributions based on industry data.
R–DAT Plus� provides the user with a powerful, yet simple and flexibleenvironment for storing and organising many types of reliability data and relatedinformation. A hierarchical structure enables the user to develop functional orstructural or any other type of breakdown, at any level of detail. The elementsof this hierarchy act as folders containing the reliability data and the results ofBayesian analyses performed on the data sets.
With R–DAT Plus� the user may specify the prior distribution in manydifferent ways depending on the type and level of information available. Theseinclude a wide variety of parametric distributions (e.g. lognormal, beta andloguniform) using any of a number of input options such as lower and upperbounds, mean and variance, or the distribution parameters. Furthermore, R–DATPlus� enables the user to develop generic distributions based on industry data(counts of failures in other applications) as well as expert estimates. The resultingdistributions will represent the plant-to-plant variability of failure rate of a givenclass of components or initiating events, and can be used in a plant-specificanalysis in order to perform the Two-Stage Bayesian procedure.
The following is a brief description of this software, the function, vendor, pricingand main features.
• Function Fault tree analysis and construction• Vendor ExproSoft AS (www.exprosoft.com)• Pricing The price for a single user license is NOK 30,000 (approximately
USD 5000/EUR 4000).
CARA–FaultTree� is a tool for fault tree construction and analysis. A fault treeis a logical diagram that displays the interrelationships between a potential criticalevent (accident) in a system and the reasons for this event. By constructing a faulttree you analyse how a system can fail, and the analysis also gives you insight intohow the components contributes to the system reliability. With its intuitivegraphical user interface, the program lets you create fault trees quickly andefficiently. A total of six system performance measures and six measures ofcomponent importance are available, along with enhanced report utilities.
A.4.8 US Offshore Energy ModelTM
The following is a brief description of this software, the function, vendor, pricingand main features.
• Function A fully probabilistic risk model that quantifies prospective risk fromhurricanes in the Gulf of Mexico
• Vendor EQECAT, US• Pricing Available on request.
US Offshore Energy ModelTM is a fully probabilistic risk model that quantifiesprospective risk from hurricanes in the Gulf of Mexico. The model is part ofEQECAT’s global multi-peril catastrophe modeling platform, RQETM (RiskQuantification & Engineering). Since the initial release of the model in 2007, themodel has been enhanced and updated to incorporate improvements tovulnerability functions, wave modelling, exposure definition, data processingfunctionality, and the application of complex insurance policy structures.
The model analyzes risk in the Bureau of Ocean Energy Management (BOEM)planning regions, as well as in US lease waters. Meanwhile, onshore oil and gasdelivery points and processing facilities are modeled for wind and storm surgedamage (and for effects on shut-in oil and gas production).
The model handles the risks derived from the following hazards:
• Wind: Gust and sustained wind speeds, as defined by the probabilistic event set.
• Waves: A separate wave module calculates wave heights from complex hazardelements, including key hurricane wind parameters, water depth, sea-floor slope,wind duration and ocean fetch.
• Landslides and sub-sea currents: These perils threaten sub-surface equipmentand pipelines. Hazard is derived from hurricane and wave parameters, sea-floorslope and water depth. Regions of mudslide hazard to pipelines are defined.
A.4.9 BlockSim�
The following is a brief description of this software, the function, vendor, pricingand main features.
• Function System analysis with reliability block diagrams (RBDs) or FaultTrees
BlockSim� provides a comprehensive platform for system reliability,availability, maintainability and related analyses. The software offers asophisticated graphical interface that allows you to model the simplest or mostcomplex systems and processes using reliability block diagrams (RBDs) or faulttree analysis (FTA), or a combination of both approaches. BlockSim� supports anextensive array of RBD configurations and FTA gates and events, includingadvanced capabilities to model complex configurations, load sharing, standbyredundancy, phases and duty cycles. Using exact computations and/or discreteevent simulation, BlockSim� facilitates a wide variety of analyses for bothrepairable and non-repairable systems. This includes:
• System Reliability Analysis• Identification of Critical Components• Optimum Reliability Allocation• System Maintainability Analysis• System Availability Analysis• Throughput Calculation
A.4.10 RENO�
The following is a brief description of this software, the function, vendor, pricingand main features.
• Function Probabilistic Event and Risk Analysis• Vendor ReliaSoft, US
868 Appendix A: Overview of Software
• Pricing Single User License: €1.795,50
RENO� is a powerful and user-friendly platform for building and runningcomplex analyses for any probabilistic or deterministic scenario using an intuitiveflowchart modeling approach and simulation. Flowchart models can be created forcomplex reliability analyses, risk and safety analyses, decision making ormaintenance planning. Users can also build models for other applications, suchas optimizing your stock portfolio or testing your blackjack strategy.
RENO� can be used for a wide variety of applications including, but not limitedto:
The following is a brief description of this software, the function, vendor, pricingand main features.
• Function Human Reliability Analysis (HRA) tool• Vendor Scandpower AB, Stockholm, Sweden• Pricing Available on request.
RiskSpectrum� HRA is a human reliability analysis tool to evaluate andquantify the probability of human errors.
RiskSpectrum� HRA helps the user standardize HRA analysis process: bygoing through necessary steps to generate human error probabilities for humanfailure events, and to document important assumptions, conditions, inputs andresults in the HRA process at the same time. With the tool the user can consistentlyconduct HRA and produce results of high quality, good traceability anddocumentation.
RiskSpectrum� HRA can help the HRA analysis meet the requirements of theASME PSA Standard and NRC HRA Good Practices. RiskSpectrum� HRAincludes a number of commonly-used HRA methods, such as THERP, ASEP,HCR/ORE, SPAR-H and HEART, etc.
For each human failure event, multiple methods can be used in quantification.Different results from different methods could therefore be compared.Conservative screening value can be defined and assigned to the selected humanfailure events.
Appendix A: Overview of Software 869
A.5 QRA Tools for Consequence Analysis
A.5.1 Firex�
The following is a brief description of this software, the function, vendor, pricingand main features.
• Function Prediction of main fire characteristics and responses of fire scenariosbased on empirical correlations
• Vendor Scandpower Risk Management, Kjeller, Norway• Pricing Available on request.
The program system FIREX� is capable of predicting the main firecharacteristics and responses of six fire scenarios:
• Pool fire in the open• Pool fire in enclosure• Fire on sea surface• Jet fire• Diffusive flare fire• Fireball/BLEVE.
FIREX� is based on well known prediction methods, which have beencompared and verified against experimental data. FIREX� predicts:
• Incident heat radiation onto targets not engulfed by the flames, as a function ofthe distance from the fire.
• Heat flux to targets engulfed by the flames as a function of time from the onsetof the fire.
• Temperature response of steel structures as a function of time and degree andtype of insulation.
• Smoke production and visibility in smoke as a function of time from themoment of ignition.
• Pool fire hazard ranges.• Fireball hazard ranges.• For pool fires in enclosures; ceiling temperature, development of hot gas.
A.5.2 FLACS�
The following is a brief description of this software, the function, vendor, pricingand main features.
• Function 3D CFD software tool for analysing gas and air flows in industrialenvironments as well as in the atmosphere. Major application areasinclude ventilation, dispersion and gas explosions and subsequentblast effects
The development of FLACS� has been carried out continuously since 1980with the co-operation, support, direction and funding of ten international oil andgas companies as well as legislative bodies of three countries. Application specificvalidation, wide applicability and efficiency when using FLACS� has been givenhigh priority in the development work.
FLACS� has been the leading tool for explosion consequence prediction on off-shore and onshore petrochemical installations for more than a decade. Every yearFLACS� is used in safety studies and risk assessments on more than one hundredoffshore and onshore facilities worldwide. In addition, FLACS� is now approvedfor LNG Vapor Dispersion Modeling under U.S. Federal Regulations (49 CFR193.2059).
The full FLACS-Standard version can handle explosion, dispersion, ventilation,mitigation and pool modelling. Separate modules/subset of FLACS-Standardinclude:
• Quantitative risk assessments• Accident/incident investigations• Identify/evaluate worst-case• Safety evaluation of modifications• Explosion venting of coupled and non-standard vessels• Room/module layout optimization• Predicting the effect of mitigation• Blast waves and control rooms• Drag loads on piping• Exhaust pipe explosions• Toxic gas dispersion• Heli-deck studies• LNG dispersion studies• Gas detector optimization• Planning and QA of experiments• Assist certification processes
Appendix A: Overview of Software 871
A.5.3 KAMELEON FireEx–KFX�
The following is a brief description of this software, the function, vendor, pricingand main features.
• Function CFD-based tool for prediction of gas dispersion and fire character-istics and response in complex geometries, as well as fire mitigationand extinguishment analysis and design
• Vendor ComputIT, Trondheim, Norway• Pricing Short and long term leasing contracts, licenses ranging from
academic to commercial licenses.
Kameleon FireEx–KFX� is an advanced simulator dedicated to gas dispersionand fire simulation with the following main characteristics:
• Three-dimensional transient finite—volume CFD code.• Includes CAD import capabilities (PDS, PDMS, IGES, Flacs macro, others).• Interfaced with the finite—element structure response codes Fahts/Usfos for
dynamic structural response analysis.• Includes detailed Lagragian models for fire mitigation by water systems, for
instance water mist systems, water curtains, deluge, sprinklers.• Includes efficient and user—friendly pre- and post processor capabilities,
including options for animation of simulation results and ‘‘moving cameras’’through simulations.
• Originally developed by ComputIT/NTNU/SINTEF with the partners Statoil(N), Total (F), ENI-group (I), Hydro, ConocoPhillips (N,USA), Gaz de France(F), Ruhrgas (D) and Sandia National Laboratories (USA).
• Extensively validated against small and large scale experimental data.• Used for a large number of industrial analyses world wide for more than 20
years.
Industrial analyses performed by KFX� can typically be:
• Simulation of all kind of fires; pool fires, jet fires, spray fires, flares, fire inenclosures, in complex geometries, in open space, in still air or in windyconditions. This includes detailed calculation of temperatures, radiation, smoke,visibility, concentrations of species, toxic gases, noise etc.
• Fire impact on structures and process equipment• Optimization of passive fire protection• Fire temperature, radiation and smoke impact on humans• Evaluation of escape routes• Simulation and evaluation of fire mitigation by water systems; sprinklers,
deluge, mist, curtains• Flare simulations; radiation, noise (not standard KFX� version), detailed tip
simulations, ignition, startup• Dispersion of gas• Calculation of explosive cloud sizes
872 Appendix A: Overview of Software
• Gas and fire detection systems• Simulation and evaluation of LNG spills, including dispersion of LNG vapour
and LNG fires• Combustion in incinerators, furnaces, engines, burners and other combustion
devices• Reduction of emissions; CO, NOx, others• HVAC (ventilation simulations)• Turbulent flow analysis with respect to safe helicopter operation• Fluid flow and combustion in general• 3D visualization, animations, contour plot in real CAD geometry.
A.5.4 OLGA�
The following is a brief description of this software, the function, vendor, pricingand main features.
• Function Transient multiphase flow simulator covering both hydraulic andthermal phenomena. Simulation of wells, flow lines, risers andprocess equipment separately or as an integrated system. OLGA� isalso used extensively for blowout simulation and relief well design.A separate OLGA� ABC (Advanced Blow-Out Control) tool is astand-alone version specifically for this application area
• Vendor SPT Group, Kjeller, Norway• Pricing Available as lease for a limited period or as a permanent licence.
OLGA� is a simulator for transient multi-phase flow phenomena. OLGA� canmodel general networks of wells, flowlines, risers as well as process equipment.OLGA� is also used extensively for blowout simulation and relief well design.A separate OLGA� ABC (Advanced Blow-Out Control) tool is a stand-aloneversion specifically for this application area.
OLGA� is accurate in predicting pressure gradients, liquid hold-up, flowregimes and flow rates. OLGA�’s ability to predict release behaviour fromcondensate pipeline (reflecting bottom topography), is of significant importance inrisk analysis of offshore installations.
OLGA� is verified and validated against more than 10,000 experiments at thetwo and three-phase-flow test loop operated by SINTEF in Trondheim and IFE atKjeller. Additionally OLGA� is verified by the largest database of multiphasewells and pipeline data in OLGA� Verification and Improvement Project (OVIP).
Appendix A: Overview of Software 873
A.5.5 PHAST�
The following is a brief description of this software, the function, vendor, pricingand main features.
• Function Windows-based toolkit for determination of consequences ofaccidental releases of hazardous material
• Vendor DNV Software, London, UK• Pricing Available on request.
PHAST� (Process Hazard Analysis Software Tools) is a Windows-basedtoolkit, which determines the consequences of accidental releases of hazardousmaterial. It examines the progress of a potential incident from initial release,through formation of a cloud, with or without a pool, to its dispersion. Theprogram uses DNV’s unique Unified Dispersion Model (UDM) to apply theappropriate entrainment and dispersion models as the conditions change and tointegrate the relevant individual models such that the transition from onebehaviour pattern to another is smooth, continuous and automatic. The discharge,pool formation and vapour and gas dispersion results are used to automaticallycalculate toxic dose, probit and lethality, flammable effects including pool fire,fireball, jet fire, flash fire and Multi Energy and Baker Strehlow Tang explosions.Access to specific calculations at any step is also possible for detailed analysis ofindividual phenomena. It is applicable to all stages of design and operation acrossa range of process and chemical industry sectors and may be used to identifysituations which present potential hazards to life, property or the environment.
A.5.6 SAFER TRACETM
The following is a brief description of this software, the function, vendor, pricingand main features.
• Function Consequence Analysis for chemical facility• Vendor SAFER Systems, USA• Pricing Available on request.
TRACETM is a consequence assessment solution that allows for rapidvisualization of a potential failure involving airborne hazardous material. Itallows engineers to study how incremental mitigation techniques may improvesafety and help them focus on what must be put in place to mitigate the hazard.This, in turn, helps assess the value and need to conduct an intensive processhazard analysis.
TRACETM incorporates an intelligent wizard feature that allows the user toeasily and rapidly describe a scenario. Once processed, results can be viewed intabular or graphical formats. Output information can be exported to otherapplications like word processors, spreadsheets and presentation managers.
874 Appendix A: Overview of Software
TRACETM can be used in a wide variety of applications, including:
• Accidental Release Modeling• Hazards Identification• Risk Management Planning• Human Response Modeling• Regulatory Modeling Requirements• Evaluation of Mitigation Systems• Population Exposure Assessment• Worst-Case/Alternative Scenario Studies
A.5.7 USFOS�/FAHTS�
The following is a brief description of this software, the function, vendor, pricingand main features.
• Function Structural fire and explosion analysis• Vendor USFOS AS, Norway• Pricing Available on request.
USFOS� is a computer program for collapse analyses and accidental loadanalyses of fixed offshore structures, intact or damaged. The program simulates thecollapse process of space frame structures, from the initial yielding, through tothe formation of a complete collapse mechanism and on to the final toppling of thestructure.
The USFOS� program has been in commercial use since 1985 by oil companiesand engineering consultants all over the world. The program has been extensivelyused in areas such as inspection planning, lifetime extension and integrityassessment of ageing structures, and in fire protection assessment for new designs.It is verified through participation in extensive benchmark activities both inEurope and USA, through comparison with experiments and through extensivescientific publication.
The particular characteristic features of USFOS� include:
• The program traces the entire collapse and post collapse behavior of thestructure, including global unloading, member unloading and redistribution offorces.
• The program requires only one finite element per physical member of thestructure.
• The program employs efficient solution algorithms (SPARSE technology),performing complete collapse analyses or time-domain dynamic analyses inshort time.
• Robust incremental/iterative solution procedures are implemented, withautomatic step scaling and verification of numerical solution accuracy.
Appendix A: Overview of Software 875
• The program comes with an extremely powerful and versatile graphical postprocessor with full 3D graphics and image plots.
FAHTS� is a specialized tool for framed structures. The technology is based onnon-linear finite element technique with a special handling of boundary conditions(such as insulation etc).
FAHTS� has an interface to Kameleon Fire Ex� (KFX), which ensureseffecttive and accurate transfer of data to the structure. The software is used toprepare temperature data for structural response analysis with USFOS�.
FAHTS� can be used in the following applications:
• Evaluation of need for thermal insulation (passive fire protection of steel andaluminum structures
• Simulation of pipelines and pressurized vessels exposed to fire• Optimization of Passive Fire Protection, PFP• Estimation of structural integrity during fire (together with USFOS�)• Evaluation of effect from deluge
A.5.8 PIPENETTM
The following is a brief description of this software, the function, vendor, pricingand main features.
• Function Pressure loss and flowrate model for offloading, firewater andventilation systems
• Vendor Sunrise System Ltd, Cambridge, UK• Pricing Available on request.
PIPENETTM is extensively used in the field of flow analysis of pipe and ductnetworks in the steady state as well as dynamic state. The software can be used forhydrocarbon fluids, water, gases and steam. It is used around the globe in the oiland gas, power, petrochemical and shipbuilding industries.
The following three modules of PIPENETTM are used extensively:
• PIPENETTM Spray Sprinkler Module is exceptional for the design of fireprotection systems especially in the oil and gas and process plant industries—deluge, ringmain, sprinkler or foam concentrate systems complying with theNFPA and other rules.
• PIPENETTM Transient Module is ideal for unsteady flow calculations for ‘waterhammer’, ‘steam hammer’, control systems and hydraulic forces for pipe stressanalysis and other safety related applications.
• PIPENETTM Standard Module is the tool for solving general flow problems withliquids, gases or steam—in pipe and duct networks—cooling water systems,steam distribution systems, HVAC systems.
876 Appendix A: Overview of Software
Typical applications include:
• Design of fire protection systems for offshore platforms, FPSOs, onshoreterminals, refineries, power stations and ships.
• Pipelines, loading/unloading systems, water injection systems, crude oil transferlines, main steam lines in power stations, reheat lines, cooling water systems andfuel oil lines.
• Steam distribution systems, utility systems, ventilation systems and waterdistribution systems.
A.5.9 VessFire�
The following is a brief description of this software, the function, vendor, pricingand main features.
• Function Heat transfer, depressurisation and stress modelling from fires• Vendor Petrell AS, Norway• Pricing Available on request.
VessFire� is a simulation program for time-dependent non-linear analysis ofthermo-mechanical response during blow-down of process segments and processequipment exposed and unexposed to fire. VessFire� solves the problem of heattransfer, conduction, thermodynamics of object contents and stress using a coupledapproach. VessFire� is based on a coupled solution of problems using a combinednumerical and analytical approach to simulate:
• Heat transfer from the fire onto the vessel, flow line, heat exchanger and/or pipework surface.
• Heat transfer through the fire protective coating, thermal insulation or protectiveshield.
• Heat conduction through the object shell.• Heat transfer from the inner object surface to the object contents.• Thermodynamics of the object contents.• Variation of pressure in the object due to depressurization counter-acted by the
increase of the pressure due to evaporation, boiling and expansion of objectcontents.
• Stress in the object shell.• Temperature in the depressurization pipe work for material selection.• Time to object failure.
Appendix A: Overview of Software 877
A.5.10 HYENA�
The following is a brief description of this software, the function, vendor, pricingand main features.
• Function Fire sprinkler/hydrant analysis• Vendor ACADS-BSG• Pricing Available on request.
HYENA� can be used to analyze automatic fire sprinkler systems with a simpleend, side or center fed configuration or more complicated looped and griddedsystems. It may also be used to analyze fire hydrant and hose reel installations orcombined sprinkler, hydrant and/or hose reel systems or any other systems wherethe discharges can be represented by a k factor and minimum flow. With a givensized network the program performs a complete hydraulic analysis determining thewater flow in, and pressure drop though, each pipe in the entered network takingaccount of all fittings entered by the user.
Main features of HYENA� include:
• The program is capable of analysing looped and gridded systems as well as themore conventional tree configurations.
• The program can be used to carry out a sprinkler system analysis in accordancewith NFPA, NZ4541, AS2118 or SSPC52 (Singapore) or GB50084 (China) orto carry out an analysis of hydrant systems with or without hoses or hose reels
• The piping system can have up to 10 input points and these can be modelled as afixed pressure, a town mains water supply or a pump.
• The program can work in a wide range of units including Metric and British orUS and uses the Hazen-Williams formula for the hydraulic analysis.
• The program can also analyse mist systems in accordance with NFPA750 orA54587 using the Darcy Weisbach formula. This also allows the analysis ofsystems using fluids other than water.
• The program operates under WINDOWS� and all input data is via a series ofscreens with numerous features including drop down lists, selection lists,various sort options, etc; to facilitate easy data input.
• All nodes that are not nominated as discharges, or input points are automaticallyassigned as reference nodes to save input, the user only having to assignelevations.
A.5.11 ANSYS Fluent�
The following is a brief description of this software, the function, vendor, pricingand main features.
• Function Physical modeling of flow, turbulence, heat transfer, and reactionsfor industrial applications
878 Appendix A: Overview of Software
• Vendor ANSYS, USA• Pricing Available on request.
ANSYS Fluent� software contains the broad physical modeling capabilitiesneeded to model flow, turbulence, heat transfer, and reactions for industrialapplications ranging from air flow over an aircraft wing to combustion in afurnace, from bubble columns to oil platforms, from blood flow to semiconductormanufacturing, and from clean room design to wastewater treatment plants.
User-defined functions allow the implementation of new user models and theextensive customization of existing ones. The interactive solver setup, solution andpost-processing capabilities of ANSYS Fluent� make it easy to pause acalculation, examine results with integrated post-processing, change any setting,and then continue the calculation within a single application.
Case and data files can be read into ANSYS CFD-Post� for further analysiswith advanced post-processing tools and side-by-side comparison of differentcases.
A.5.12 ANSYS CFX�
The following is a brief description of this software, the function, vendor, pricingand main features.
• Function Fluid dynamics program to solve wide-ranging fluid flow problems• Vendor ANSYS, USA• Pricing Available on request.
ANSYS CFX� software is a fluid dynamics program that has been applied tosolve wide-ranging fluid flow problems for over 20 years. The highly parallelizedsolver is the foundation for an abundant choice of physical models to capturevirtually any type of phenomena related to fluid flow. The solver and its manyphysical models are wrapped in a modern, intuitive, and flexible GUI and userenvironment, with extensive capabilities for customization and automation usingsession files, scripting and a powerful expression language.
Modeling Capabilities of ANSYS CFX� include the following:
• Laminar and turbulent• Steady-state and transient• Incompressible to fully compressible (subsonic, transonic, supersonic)• Ideal and real gases• Newtonian and non-Newtonian fluids• Heat transfer• Radiation• Rotating and stationary
Appendix A: Overview of Software 879
• Eulerian multiphase• Free surfaces (VoF)• Lagrangian particle tracking• Chemical reactions and combustion• Mesh motion and remeshing• Immersed solids• Fluid structure interaction
A.6 Qualitative Risk Assessment Software
A.6.1 HAZOP Manager�
The following is a brief description of this software, the function, vendor, pricingand main features.
• Function HAZOP Tool• Vendor Lihou Technical & Software Services, UK• Pricing Available on request.
HAZOP Manager� is a comprehensive Personal Computer program for themanagement of Hazard and Operability Studies (HAZOPs) and other similarsafety-related reviews (e.g. PHA, HAZID, FEMA, SIL, etc.) It is extensively usedto conduct more efficient and effective studies.
HAZOP Manager� incorporates features and facilities that:
• Serve as a framework within which preparation for the review can be structured.• Ease the task of recording the meeting minutes, and help to maintain the team’s
focus of attention and interest.• Give speedy access to material useful to the study team, such as previously
identified problems, failure rate data and other such historical information.• Allow professionally formatted reports to be produced with the minimum of
effort.• Permit additional management information to be extracted from the study
records.• Provide a comprehensive and easy to use system for effective action follow-up
and close-out, without the significant administrative burden that this usuallyentails.
880 Appendix A: Overview of Software
A.7 Reporting and Analysis of Incidents and Accidents
A.7.1 DNV BSCATTM
The following is a brief description of this software, the function, vendor, pricingand main features.
• Function Modern risk-based safety management approaches to systematic rootcause incident investigation
• Vendor CGE Risk Management Solutions, The Netherlands• Pricing Available on request.
The BSCATTM method refers to a method that links modern risk-based safetymanagement approaches to systematic root cause incident investigation. The ‘‘B’’refers to barrier-based as each barrier identified in bowtie risk assessments is testedfor why it failed.
SCAT (Systematic Cause Analysis Technique) is a well-established root causeanalysis approach which incorporates the DNV loss causation model. The model isa sequence of dominos establishing the hierarchy of accident progression from thetype of event, to the immediate cause back to fundamental root causes and systemfailures, and hence to necessary actions for improvement.
In short, BSCATTM is the barrier based extension to DNV’s SCAT method. TheSCAT model was developed to help incident investigators apply the DNV losscausation model to actual events. This is done by means of the SCAT chart. Thechart was created to build-out an event using standardized event descriptions thatcan fit the whole range of incidents and near misses. Due to using standardizedcategories, this assists investigators to assess events in a systematic manner andmaking these suitable for aggregation, leading to more insight into the weak areasof the safety management system and the underpinning risk assessment. Thebarrier-based accident investigation still applies the SCAT model but now it isapplied to each barrier separately, not to the incident as a whole.
The BSCATTM software allows investigators to reuse and link existing riskassessment information (bowties) and to do full integration of incident analysisand risk analysis. If applicable bowtie diagrams are available for use during theinvestigation, the analysis can bring events and barriers from the bowtie directlyinto the BSCATTM analysis. This means that every incident investigation refersback to the risk assessment—a feature not present in other investigation methods.
By reusing the Bowtie risk analysis and/or describing the barriers in theincident analyses, more value is extracted from the incident analyses. Incidentshighlight weaknesses in barriers and these in turn may indicate the risk assessmentis too optimistic and that specified risk targets are not being met. This informationis beyond that normally identified in incident investigations.
Appendix A: Overview of Software 881
This entire process makes it possible to gauge barrier effectiveness andavailability based on real operations and linked to ongoing incident analyses. Thisprocess is potentially the richest source of barrier performance informationavailable to a facility.
In general, BSCATTM is a well proven root cause analysis technique which usesstandardized immediate and basic cause categories, and this allows incidentanalyses to aggregate for trends, leading to more insight into the weak areas of thefacility safety management system. It has been updated to link it directly to facilityrisk assessments and thereby combines root cause analysis and risk assessmentinto a single tool.
A.8 Risk Management Software
A.8.1 ViewRisk�
The following is a brief description of this software, the function, vendor, pricingand main features.
• Function Risk summation and presentation tool, including outputs of riskcontours, F–N data, risk transects and a listing of dominant events
• Vendor Environmental Resources Management (ERM), London, UK• Pricing License terms available from ERM on request.
ViewRisk� is a risk summation and presentation tool. A regulatory version iscurrently being developed for UK HSE. Outputs include risk contours, F–N data,risk transects and a listing of dominant events. The risk for each scenario iscalculated, accounting for:
• wind direction, speed and stability• the number of people affected in specified time periods• whether populations are indoors/outdoors, fixed (e.g. within dwellings) or
mobile (e.g. motorists)• topographic effects (e.g. the presence of hills or cliffs)• whether event locations are at a fixed point, multiple points or distributed along
a line source (e.g. pipeline).
A.8.2 Synergi RBI�
The following is a brief description of this software, the function, vendor, pricingand main features.
• Function Onshore and Offshore risk based inspection tool• Vendor DNV Software, Høvik, Norway• Pricing Available upon request.
882 Appendix A: Overview of Software
Synergi RBI� are software tools that use DNV’s Risk Based Inspection (RBI)techniques to help users optimise their inspection management programme.DNV’s RBI technique, as described in DNV RP–G 101 ‘‘Recommended Practicefor Risk-Based Inspection of Topsides Static Mechanical Equipment’’, is used tocalculate the risk due to corrosion, erosion and cracking for pressure equipment ina marine environment. DNV’s onshore RBI method fully comprises API 580 and581 and goes further, providing complete support for a best practice approach torisk based inspection for onshore facilities.
Synergi RBI� is designed to help users sustain high productivity and reliabilityof their offshore platforms by minimising lost production and downtime througheffective inspection and maintenance. It assists in the management of safety andequipment integrity to user specified levels.
It helps users to achieve these objectives systematically and efficiently. It allowsyou to quantify the risk for process and utility systems and equipment on topsidesand FPSOs. Risk can be defined in terms of potential loss of life, cost, or both. Acost-effective inspection programme can then be devised based on the greatest riskreduction per cost of inspection.
A.8.3 BowTieXP�
The following is a brief description of this software, the function, vendor, pricingand main features.
• Function Management of major risks to people, the environment, assets andreputation by means of ‘bow-tie’ graphical interface diagram
• Vendor CGE Risk Management Solutions, the Netherlands• Pricing Available on request
The Bowtie method is a risk evaluation method that can be used to analyze anddemonstrate causal relationships in high risk scenarios. The method takes its namefrom the shape of the diagram that you create, which looks like a men’s Bowtie.A Bowtie diagram does two things. First of all, a Bowtie gives a visual summary ofall plausible accident scenarios that could exist around a certain Hazard. Secondly,by identifying control measures, the Bowtie displays what a company does tocontrol those scenarios.
However, this is just the beginning. Once the control measures are identified,the Bowtie method takes it one step further and identifies the ways in whichcontrol measures fail. These factors or conditions are called Escalation factors.There are possible control measures for Escalation factors as well, which is whythere is also a special type of control called an Escalation factor control, which hasan indirect but crucial effect on the main Hazard. By visualizing the interactionbetween Controls and their Escalation factors one can see how the overall systemweakens when Controls have Escalation factors.
Appendix A: Overview of Software 883
Besides the basic Bowtie diagram, management systems should also beconsidered and integrated with the Bowtie to give an overview of which activitieskeep a Control working and who is responsible for a Control. Integrating themanagement system in a Bowtie demonstrates how Hazards are managed by acompany. The Bowtie can also be used effectively to assure that Hazards aremanaged to an acceptable level (ALARP).
By combining the strengths of several safety techniques and the contribution ofhuman and organizational factors, Bowtie diagrams facilitate workforceunderstanding of Hazard management and their own role in it. It is a methodthat can be understood by all layers of the organization due to its highly visual andintuitive nature, while it also provides new insights to the HSE professional.
A.8.4 THESIS
The following is a brief description of this software, the function, vendor, pricingand main features.
• Function Management of major risks to people, the environment, assets andreputation by means of ‘Bowtie’ graphical interface diagram
• Vendor ABS Consulting, Warrington, UK• Pricing GBP 500–2,000 per licence depending upon numbers of licences and
software variants required
THESIS BowTieTM (THESIS) delivers simplified, integrated risk managementfor entire business portfolio. Enhanced visuals in THESIS make the elements inmanagement process readily understandable at all levels across the organization.
Backed by ABS Consulting, THESIS helps clients analyze and manage thehazards and risks to which their business is exposed. Through a rich graphicalinterface, the software displays the relationship between hazards, controls, riskreduction measures and business activities. While communicating criticalprocedures and individual responsibilities to employees, the softwaredemonstrates compliance clearly across all levels—senior management,regulators, principal investors and the public.
In response to corporate governance requirements across global corporations afully web based version of THESIS has also been created to supplement the moretraditional standalone version.
Areas where THESIS can be used:
• High level hazard identification (hazard register) and risk assessment• Detailed HAZID—derivation of threats, consequences and controls• GAP analysis• Management of controls (safety critical elements and soft/non hardware types)• Derivation of tasks and procedures• Document management• Shortfall and Remedial Action tracking
884 Appendix A: Overview of Software
• Focusing on personnel critical tasks• As a complement to the Safety Case, HSE Case or HSEIA• Incident investigation• Illustrates the status and management of risk within a business to senior
management, the workforce and regulators• Enterprise Risk Management• As the Safety/Live Risk module
A.8.5 BowTie ProTM
The following is a brief description of this software, the function, vendor, pricingand main features.
• Function Qualitative, semi-quantitative and illustrative risk analysis and riskmanagement
• Vendor BowTie Pro, Aberdeen, UK• Pricing Available on request.
BowTie ProTM is a tool to facilitate the creation of risk assessments utilizing thelatest Microsoft.NET technology. The bowtie diagram is a powerful visualpresentation of the risk assessment process that can be readily understood by thenon-specialist.
BowTie ProTM can have up to 6 diagrams open at once allowing the copy andpaste between diagrams and tailor each diagram by reordering and changing thedisplay properties. BowTie ProTM also allows a great deal of detailed informationto be recorded against the controls such as tasks, task assignment, documents,hyperlinks, verification method etc. There is also the facility to link the controls toincident investigation packages and record BRFs etc.
The analysis features of BowTie ProTM include:
• Risk Profiling allows an interactive version of the hazard register to be analysedand modified on the screen.
• Risk Profiling Matrix allows the user to see how the risks have been assessedand how many times each item has been used.
• Critical Task Listings allows the visibility, filtering and use of tasks in an easy touse screen across a BowTie ProTM file.
• The People Matrix displays responsibilities for items across a BowTie ProTM
file.• Deficiency Analysis allows a range of functions to analyse any deficiencies
identified when creating a diagram.• The Layers of Protection allow a numerical analysis of each strand of a BowTie
ProTM diagram.• The Quality Check module ensures that the data is relevant based on various
criteria.
Appendix A: Overview of Software 885
• The Document Matrix shows where a reference document is used within aBowTie ProTM file.
• The Permitted Operations and Permitted boundary operations modules allow thecreation of a matrix based on various criteria similar. This allows the creation ofthe Manual of Permitted Operation (MOPO).
• File Searching searches for all instances of a word within the current BowTieProTM file. These can easily be edited by double clicking on the item. There isalso Report Searching where you search for the text within a report.
A.8.6 Presight� Operations and Barrier Safety KPI Management
The following is a brief description of this software, the function, vendor, pricingand main features.
• Function Reduce major accident risk with operations and context focused KPImanagement for barrier and process safety improvements and reducedown-time events. Convert complex multi-systems information intoindicators, supporting risk awareness and safer operations decisions
• Vendor Presight Solutions AS, Norway (www.presight.com)• Pricing Available on request.
Presight Solutions context-based barrier and technical safety KPI managementsoftware offers the enterprise the difference between a fit-for-purpose and a fit-for-use approach to barrier safety and prevention of major accidents happening.Presight removes the chance that critical process, technical, organization andhuman factor KPI’s are ‘aggregated away’ from a major accident preventionperspective across the organization.
Keeping it simple for end-users improves risk awareness in operations.Recognizing users ‘another management system’ fatigue and their desire to just‘get on with the job’ interests—Presight combines all safety and risk relevantMTO data from multiple sources such as maintenance, ERP, rotation andcertificates, control systems, weather data and performance standards, to deliveruseful operations and end-user focused indicators. Drill-down to underlyingindicators, bowtie visualization or source system to identify the specific safetycritical equipment, process, organization or human factor performance failures forfollow up and action between off- and onshore units.
Early warning when status today and trend is not enough. The Energy Institutesuggests that ‘‘most well-run organizations can state how many accidents occurredover a certain period in the past, but the ‘‘real challenge’’ is to assess thelikelihood of an incident happening tomorrow.’’ Prevent the escalation of majoraccident risk scenarios through use of Presight advanced control and forecastindicators in decision making situations. Implement automatic barrier fail andearly warnings notifications to responsible person or role, off- and onshore—through web, email or mobile devices—for corrective and preventive actions.
Track deviations and override decisions against individual indicators. Easilycompare different indicators against period for performance analysis andexperience transfer opportunities. Identify underlying causes and focus areas foroperations safety performance improvement initiatives.
Enterprise strength KPI administration features. Presight off-the-shelf approachto development includes administration features to meet regional and globaloperations and regulatory standards. Presight is language and measure of unitindependent, SharePoint ready, data integrity status, log of all changes, powerfulsearch and multi-indicator edit and copy features for global and multi-assetoperations.
A.8.7 Synergi Life�
The following is a brief description of this software, the function, vendor, pricingand main features.
• Function Complete business solution for risk and QHSE management,managing all non-conformances, incidents, risk, risk analyses,audits, assessments and improvement suggestions
• Vendor DNV Software, London, UK• Pricing Available on request.
The Synergi Life� software (previously named Synergi) is a complete businesssolution for risk and QHSE management, managing all non-conformances,incidents, risk, risk analyses, audits, assessments and improvement suggestions.
The Synergi Life� software covers every workflow process, such as reporting,processing, analysing, corrective actions, communication, experience transfer,trending and KPI monitoring.
Synergi Life� is a module based HSE and Risk Management solutiondeveloped with a full set of optional modules for the various business needsrelevant to our clients. These modules can be used as stand-alone solutions, or incombination to fit the exact needs and focus of each individual client and user. It isthe combinations of several modules that contribute to a total risk and QHSEManagement solution. Modules in the Synergi Life software package include:
The following is a brief description of this software, the function, vendor, pricingand main features.
• Function Visualisation of status of major accident risk in a plant• Vendor Safetec Nordic, Trondheim, Norway• Pricing Available upon request.
SafeGuard� is an analysis tool and a visualisation tool for monitoring the statusof major accident risk in a plant or on an offshore installation. The analysis isclosely linked to risk analysis models and the risk picture at the installation andpresents the status of all key factors influencing risk, from operations andtechnology at the ‘‘sharp end’’ to high-level organizational factors and evenexternal influencing factors as required. The visualisation is intuitive and can betailor-made for individual roles within the company and also for specific situationswhere information about risk is required. Operational management offshore canget information about e.g. activity level, status of technical systems, competenceof available personnel etc before deciding on what actions to take. Similarly, high-level managers can see how their decisions can have an impact on e.g. operationsand then on to major accident risk. The tool can also be used as a key element inmonitoring the integrity of barriers in a plant, but combining this with other keyinformation that is relevant for evaluating risk and making decisions.
888 Appendix A: Overview of Software
Appendix BOverview of Fatalities in NorwegianSector
An overview of all fatalities in the Norwegian sector of North Sea and NorwegianSea is presented. The focus is on a statistical overview, split in occupational andmajor accidents, diving accidents and helicopter accidents.
B.1 Introduction
B.1.1 Background
The research programme ‘Safety Offshore’ (SPS) established the first overview ofall fatalities in the Norwegian offshore industry. But this effort stopped when theprogramme ended after a five year period from 1978 until 1983. The author wasable to obtain a printout from the SPS project team, which was the starting point ofwork conducted in Safetec Nordic AS, partially funded by the NorwegianResearch Council, until the author left the company. The records were given to theauthor from Safetec Nordic AS, and the work has been continued by the authorsince 1993, financed by Preventor AS. This work has been the source of overviewspresented annually by PSA in the Risk Level project (PSA 2012).
The first well was spudded in the Norwegian sector in July 1966 using theOcean Traveler mobile drilling unit. The first serious accident occurred on 6.November 1966, when the supply vessel Smith Lloyd 8 rammed into OceanTraveler, puncturing 2 columns. Over 50 persons jumped overboard, whereas fivepersons remained onboard and managed to stabilize the installation before itcapsized. All personnel in the sea were rescued by the supply vessel, and nofatalities occurred.
The first fatal accident occurred in 1967, this was a diving accident. The firstaccident on a mobile installation occurred in 1969, when the drilling manager waskilled during testing of a manometer onboard Glomar Grand Isle. The first fatalityon a production installation occurred in 1974, in a crane accident on Ekofisk Binstallation, when the crane fell overboard.
J.-E. Vinnem, Offshore Risk Assessment vol 1, Springer Series in Reliability Engineering,DOI: 10.1007/978-1-4471-5207-1, � Springer-Verlag London 2014
889
B.1.2 Limitations
The fatalities included in the tables in this appendix are limited mainly to whatfalls under the petroleum law, with some additions. This implies that the followingare included in the statistics:
• Fatalities on offshore production installations• Fatalities on offshore mobile installations when operating at an offshore field• Fatalities on attending vessels when operating within the safety zone of an
offshore installation• Fatalities on attending vessels when operating in association with offshore
installations• Fatalities on crane and pipe laying vessels when operating in association with
offshore installations• Helicopter fatalities during all phases of helicopter transportation to/from shore.
The implications of what is listed above are that the following are excluded inthe statistics:
• Fatalities on production installations during construction inshore or yard• Fatalities on production installations during inshore decommissioning activities
Table B.1 Fatalities on production installations, Norwegian sector, 1974–2012
• Fatalities on mobile installations during transit between offshore fields or to/from shore
• Fatalities on supply vessels when en route from shore to offshore installations• Diving accidents during inshore training and testing
B.2 Production Installations
Table B.1 presents the overview of fatalities on production installations since thefirst fatality in 1974, until 31.12.2012. 1974 was the first year with manhourslogged on production installations. The fatalities are split in occupational accidentsand major accidents.
It should be noted that the three occupational fatalities in 1991 occurred when ahelicopter was employed on Ekofisk to replace a flare tip. The rotor hit thestructure causing a crash of the helicopter in the sea, and the three persons onboardperished. This accident is not associated with transport of personnel by helicopter,and does not belong in the section with helicopter fatalities during helicopter
Appendix B: Overview of Fatalities in Norwegian Sector 891
Table B.3 Fatalities on attending vessels and pipe laying vessels, Norwegian sector, 1972–2012
892 Appendix B: Overview of Fatalities in Norwegian Sector
transportation of personnel. It has therefore been included with the occupationalaccidents.
It should further be noted that the Alexander Kielland accident has beenclassified as production installation, although the Alexander Kielland installationwas a mobile installation, a flotel, which was connected to a fixed installation.
There are two accidents after year 2000, on Gyda in 2002 (falling object) andOseberg B (fall to lower level) in 2009.
B.3 Mobile Installations
Table B.2 presents the overview of fatalities on mobile installations since the firstfatality in 1969, until 31.12.2012. The fatalities are split in occupational accidentsand major accidents.
It should be noted that the six fatalities in a major accident in 1976 (groundingof Deep Sea Driller) occurred when the unit was towed to shore, just outside Fedje(north of Bergen). This accident should not be included if the criteria listed inSect . B.1 are strictly adhered to, but this accident has for a long time been countedas an offshore accident.
There is only one accident after year 2000, on Byford Dolphin (falling object inthe derrick) in 2002.
Table B.5 Fatalities during helicopter transportation of personnel to/from shore, Norwegiansector, 1967–2012
Year Fatalities in helicopter accidents Year Fatalities in helicopter accidents
Appendix B: Overview of Fatalities in Norwegian Sector 893
B.4 Vessels
Table B.3 presents the overview of fatalities on attending and pipe laying vesselssince the first fatality in 1972, until 31.12.2012. The fatalities are split on attendingvessels and pipe laying vessels separately. Attending vessels include supplyvessels, standby vessels as well as anchor handling and tug vessels.
There were quite a number of fatal accidents on attending vessels in the periodfrom 1994 until 2001. As a result of these eight fatalities, the authorities pushedthe industry to focus on risk reduction, and it can be seen to have paid off, with nofatalities on attending vessels after 2001.
There are three accidents after year 2000, on Viking Queen in 2001 (hit by steelwire during anchor handling operations) and two on Saipem 7000 (falling objectand fall overboard) in 2003 and 2007.
B.5 Shuttle Tankers
There has only been one fatal accident on shuttle tankers during the period fromstart of operations. The fatality occurred on the shuttle tanker Polytraveller on 1stAugust 1980, during off-loading on the Statfjord field. The mooring line failed,thus causing the loading hose to rupture and spill crude oil. The spill was ignitedand the tanker captain who was positioned in the stern of the vessels was fatallyinjured by the fire.
No other fatalities have occurred during off-loading or during transit to onshoreterminals and refineries.
B.6 Diving Accidents
Table B.4 presents the overview of diving fatalities in the Norwegian offshoreoperations since the first fatality in 1967, until 31.12.2012. No diving fatalitieshave occurred after 1987, but the volume of manned diving has been considerablyreduced from the volume in the 1970s and 1980s. Use of Remote Operated Vehicle(ROV) has replaced the use of divers to a large extent.
It should be noted that fatalities during diving training inshore and similaractivities have not been included. There are no diving accidents after 1987.
B.7 Helicopter Accidents
Table B.5 presents the overview of fatalities during helicopter transport ofpersonnel between offshore installations and heliports onshore in the Norwegian
894 Appendix B: Overview of Fatalities in Norwegian Sector
sector the first fatality in 1973, until 31.12.2012. No fatalities have occurred after1997.
The fatal accident in 1997 occurred while the Norne FPSO was in thecommissioning phase, prior to start-up of production operations. Personnel werebeing shuttled on a daily basis between shore and the FPSO on location, due tolimited accommodation capacity onboard. Shuttling of personnel on such a scalewas criticized after the accident, and has not been practiced since then. There hasbeen a significant focus from the authorities to limit as far as possible the use ofshuttling.
Reference
PSA (2012) Trends is risk levels, Main report 2011 (In Norwegian only),Petroleum Safety Authority; 24 April 2012
Appendix B: Overview of Fatalities in Norwegian Sector 895
Appendix CNetwork Resources
An overview of network resources that may be used for offshore risk assessment ispresented, including data sources, investigation organisations and some recentinvestigation reports.
C.1 Data Sources
An overview of data sources is presented in Sect. 14.9. The following is anoverview of the network accessible resources:
• All types of events
– Oil and gas producers—http://www.ogp.org.uk/– RNNP—http://www.ptil.no/rnnp– Hazards Intelligence (HInt)—http://www.saunalahti.fi/ility/
Accidental Event (AE) Event or a chain of events that may cause loss of life ordamage to health, assets or the environment.
Accidental Effect The result of an accidental event, expressed as heat flux,impact force or energy, acceleration, etc. which is thebasis for the safety evaluation.
Acute release The abrupt or sudden release in the form of a discharge,emission or exposure, usually due to incidents oraccidents.
Area exposedby the accidentalevent (AEAE)
Area(s) on the facility (or its surroundings) exposed by theaccidental event.
Area risk Risk personnel located in an area is exposed to during adefined period of time.
As Low as ReasonablyPracticable (ALARP)
ALARP expresses that the risk shall be reduced to a levelthat is as low as reasonably practicable.
Average individualrisk (AIR)
Risk an average individual is exposed to during a definedperiod of time.
Barrier element Physical, technical or operational component in a barriersystem.
Barrier function Function planned to prevent, control, or mitigate unde-sired or accidental events.
The following definitions are coordinated with NORSOK Z-013 (which reflectsISO terminology (ISO/IEC Guide 73:2002 and ISO31000:2009) where relevant,except that ‘risk tolerance criteria’ replaces ‘risk acceptance criteria’, inaccordance with what is used internationally.
J.-E. Vinnem, Offshore Risk Assessment vol 1, Springer Series in Reliability Engineering,DOI: 10.1007/978-1-4471-5207-1, � Springer-Verlag London 2014
901
Barrier (or risk)influencing factor
Conditions that influence on the performance of barriersystems.
Barrier system System designed and implemented to perform one ormore barrier function.
BLEVE Boiling Liquid Expanding Vapour Explosion, isdefined as rupture of a hydrocarbon containing vesseldue to being heated by fire loads.
Causal analysis The process of determining potential combinations ofcircumstances leading to a top event.
Consequence Outcome of and event.
Consequence evaluation Assessment of physical effects due to accidents, such asfire and explosion loads.
Contingency planning Planning provision of facilities, training and drilling forthe handling of emergency conditions, including theactual institution of emergency actions.
Control (of hazards) Limiting the extent and/or duration of a hazardous eventto prevent escalation.
Cost/benefitevaluation
Quantitative assessment and comparison of costs andbenefits. In the present context often related to safetymeasures or environmental protection measures wherethe benefits are reduced safety or environmentalhazard.
Chronic release The continuous or ongoing release in the form of adischarge, emission or exposure.
Defined situationsof hazard and accident(DSHA)
Selection of hazardous and accidental events that willbe used for the dimensioning of the emergency pre-paredness for the activity.
Design Accidental Event Accidental events that serve as the basis for layout,dimensioning and use of installations and the activity atlarge, in order to meet the defined risk tolerancecriteria.
Design Accidental Load Chosen accidental load that is to be used as the basis fordesign.
Dimensioning AccidentalEvent (DAE)
Accidental events that serve as the basis for layout,dimensioning and use of installations and the activity atlarge.
902 Glossary
Dimensioning accidentalload (DAL)
Most severe accidental load that the function or systemshall be able to withstand during a required period oftime, in order to meet the defined risk tolerance criteria.
EmergencyPreparedness
Technical, operational and organisational measures,including necessary equipment that are planned to beused under the management of the emergency organi-sation in case hazardous or accidental situations occur,in order to protect human and environmental resourcesand assets.
Emergencypreparednessanalysis (EPA)
Analysis which includes establishment of DSHA,including major DAEs, establishment of emergencyresponse strategies and performance requirements foremergency preparedness and identification of emer-gency preparedness measure, including environmentalemergency and response measures.
Emergencypreparednessassessment
Overall process of performing a emergency prepared-ness assessment including: establishment of the con-text, performance of the EPA, identification andevaluation of measures and solutions and to recom-mend strategies and final performance requirements,and to assure that the communication and consultationsand monitoring and review activities, performed priorto, during and after the analysis has been executed, aresuitable and appropriate with respect to achieving thegoals for the assessment.
Emergencypreparednessorganisation
Organisation which is planned, established and trainedin order to handle occurrences of hazardous or acci-dental situations.
Emergencypreparednessphilosophy
Overall guidelines and principles for establishment ofemergency response based on the operator vision, goals,values and principles.
Emergencyresponse
Action taken by personnel, on or off the installation, tocontrol or mitigate a hazardous event or initiate andexecute abandonment.
Emergencyresponsestrategy
Specific description of emergency response actions foreach DSHA.
Environment Surroundings in which an organization operates,including air, water, land, natural resources, flora,fauna, humans and their interrelation.
Glossary 903
Environmentalimpact
Any change to the environment, whether adverse orbeneficial, wholly or partially resulting from an organi-zation’s activities, products or services.
Environmentalresource
Includes a stock or a habitat, defined as:.
Stock: A group of individuals of a stockpresent in a defined geographical areain a defined period of time.
Alternatively: The sum of individuals within a specieswhich are reproductively isolatedwithin a defined geographical area.
Habitat: A limited area where several species arepresent and interact. Example: a beach.
EnvironmentSafety
Safety relating to protection of the environment fromaccidental spills which may cause damage.
Escalation Escalation has occurred when the area exposed by theaccidental event (AEAE) covers more than one fire areaor more than one main area.
Escalation factor Conditions that lead to increased risk due to loss ofcontrol, mitigation or recovery capabilities.
Escape Actions by personnel on board surface installations (aswell as those by divers) taken to avoid the area ofaccident origin and accident consequences to reach anarea where they may remain in shelter.
Escape way Routes of specially designated gangways from theplatform, leading from hazardous areas to muster areas,lifeboat stations, or shelter area.
Escape route Route from an intermittently manned or permanentlymanned area of a facility leading to safe area(s).
Establishmentof emergencypreparedness
Systematic process which involves selection and plan-ning of suitable emergency preparedness measures onthe basis of risk and emergency preparedness analysis.
Essentialsafety system
System which has a major role in the control and mit-igation of accidents and in any subsequent EERactivities.
Evacuation Planned method of leaving the facility in an emergency.
904 Glossary
Event tree analysis Inductive analysis in order to determine alternativepotential scenarios arising from a particular hazardousevent. It may be used quantitatively to determine theprobability or frequency of different consequencesarising from the hazardous event.
Explosion load Time dependent pressure or drag forces generated byviolent combustion of a flammable atmosphere.
External escalation When the area exposed by the accidental event (AEAE)covers more than one main area, external escalation hasoccurred.
Facility Offshore or onshore petroleum installation, facility orplant for production of oil and gas.
Fault Tree Analysis Deductive quantitative analysis technique in order toidentify the causes of failures and accidents and quan-tify the probability of these.
Fire area Area separated from other areas on the facility, either byphysical barriers (fire/blast partition) or distance, whichwill prevent a dimensioning fire to escalate.
Functional requirementsto safety and emergencypreparedness
Verifiable requirements to the effectiveness of safetyand emergency preparedness measures which shallensure that safety objectives, risk tolerance criteria,authority minimum requirements, and establishednorms are satisfied during design and operation.
Group individualrisk (GIR)
Average IR for a defined group.
Hazard Potential source of harm.
Hazardous event Incident which occurs when a hazard is realized.
Immediate vicinity ofthe scene of accident
Main area(s) where an accidental event (AE) has itsorigin.
Individual risk (IR) Risk an individual is exposed to during a defined periodof time.
Inherently safer design In inherently safer design, the following concepts areused to reduce risk:
• reduction, e.g. reducing the hazardous inventories orthe frequency or duration of exposure;
• substitution, e.g. substituting hazardous materialswith less hazardous ones (but recognizing that therecould be some trade-offs here between plant safetyand the wider product and lifecycle issues);
Glossary 905
• attenuation, e.g. using the hazardous materials orprocesses in a way that limits their hazard potential,such as segregating the process plant into smallersections using ESD valves, processing at lowertemperature or pressure;
• simplifications, e.g. making the plant and processsimpler to design, build and operate, hence less proneto equipment, control and human failure.
Internal control All administrative measures which are implemented toensure that the work is in accordance with all require-ments and specifications.
Internal escalation When the area exposed by the accidental event (AEAE)covers more than one fire area within the same mainarea, internal escalation has occurred.
Main area Defined part of the facility with a specific functionalityand/or level of risk.
Main loadbearingstructures
Structure, which when it loses its main load carryingcapacity, may result in a collapse or loss of either themain structure of the installation or the main supportframes for the deck.
Main safety function Most important safety functions that need to be intact inorder to ensure the safety for personnel and/or to limitpollution.
Major accident Acute occurrence of an event such as a major emission,fire, or explosion, which immediately or delayed, leadsto serious consequences to human health and/or fatali-ties and/or environmental damage and/or larger eco-nomical losses.
Material Damage Safety Safety of the installation, its structure, and equipmentrelating to accidental consequences in terms of pro-duction delay and reconstruction of equipment andstructures.
Mitigation Limitation of any negative consequence of a particularevent.
MOB-boat Man Over Board Boat.
Muster Station A place where personnel may gather in a Safe Havenprior to evacuation or abandonment from emergencysituations.
906 Glossary
Muster area Area on the platform where the personnel may besheltered from accidental conditions until they embarkinto the lifeboats.
Normalisation The normalisation phase starts when the developmentof a situation of hazard or accident has stopped.
Occupational Accidents Accidents relating to hazards that are associated withthe work places (falls, slips, crushing etc.), thus otherhazards than hydrocarbon gas or oil under pressure.These accidents are normally related to a singleindividual.
Performancerequirements forsafety and emergencypreparedness
Requirements to the performance of safety and emer-gency preparedness measures which ensure that safetyobjectives, RAC, authority minimum requirements andestablished norms are satisfied during design andoperation.
Personnel Safety Safety for all personnel involved in the operation of afield.
Probability Extent to which an event is likely to occur.
Recovery time Time from an accidental event causing environmentaldamage occurs until the biological features haverecovered to a pre-spill state or to a new stable statetaking into consideration natural ecological variations,and are providing ecosystem services comparable to thepre-spill services.
Reliability Analysis Analysis of causes and conditions of failure, inspection,maintenance and repair, and the quantitative assessmentof up-times and down-times.
ResidualAccidentalEvent
Accidental event which the installation is not designedagainst, therefore it will be part of the risk level for theinstallation.
Residual risk Risk remaining after risk treatment.
Risk Combination of the probability of occurrence of harmand the severity of that harm.
Risk acceptance Decision to accept a risk.
Risk analysis Structured use of available information to identify haz-ards and to describe risk.
Glossary 907
Risk assessment Overall process of performing a risk assessmentincluding: Establishment of the context, performance ofthe risk analysis, risk evaluation, and to assure that thecommunication and consultations, monitoring andreview activities, performed prior to, during and afterthe analysis has been executed, are suitable andappropriate with respect to achieving the goals for theassessment.
Risk avoidance Decision not to become involved in, or action to with-draw from, a risk situation.
Risk control Actions implementing risk management decisions.
Risk evaluation Judgement, on the basis of risk analysis and RAC, ofwhether a risk is tolerable or not.
Risk identification Process to find, list and characterise elements of risk.
Risk management Coordinated activities to direct and control an organi-sation with regard to risk.
Risk managementsystem
Set of elements of an organisation’s management systemconcerned with managing risk.
Risk perception Way in which a stakeholder views a risk, based on a setof values or concerns.
Risk picture Synthesis of the risk assessment, with the intention toprovide useful and understandable information to rele-vant decision makers.
Risk reduction Actions taken to lessen the probability, negative con-sequences, or both, associated with a risk.
Risk tolerancecriteria (RAC)
Criteria that are used to express a risk level that isconsidered as the upper limit for the activity in questionto be tolerable.
Risk transfer Sharing with another party the burden of loss or benefitof gain, for a risk.
Risk treatment Process of selection and implementation of measures tomodify risk.
Rooms of significanceto combating accidentalevents
CCR and other equivalent room(s) that are essential forsafe shutdown, blowdown and emergency response.
908 Glossary
Safe area(s) Area(s) which, depending on each specific defined sit-uation of hazard and accident (DSHA), are defined assafe until the personnel are evacuated or the situation isnormalized.
Safety barrier Physical or non-physical means planned to prevent,control, or mitigate undesired events or accidents.
Safety function Measures which reduce the probability of a situation ofhazard and accident occurring, or which limit the con-sequences of an accident.
Safety Goals Concrete targets against which the operations ofinstallations at the field are measured with respect tosafety.These targets shall contribute to avoidance of accidentsor resistance against accidental consequences.
Safety objective Objective for the safety of personnel, environment andassets towards which the management of the activitywill be aimed.
Serious Accidents See major accidents.
Shelter Area An area on the platform where the crew will remain safefor a specific period of time in an emergency situation.
Stakeholder Any individual, group or organization that can affect, beaffected by, or perceive itself to be affected by, a risk.
System Common expression for installation(s), plant(s), sys-tem(s), activity/activities, operation(s) and/or phase(s)subjected to the risk and/or emergency preparednessassessment.
System basis Inputs (regarding the system subjected to assessment)used as basis for the assessment.
System boundaries System boundaries defines what shall and what shall notbe subjected to the assessment.
Working Accidents Accidents relating to other hazards than hydrocarbon gasor oil under pressure (falls, crushing etc.) normallyrelated to a single individual.
Worst case consequence The worst possible HSE consequences resulting from ahazardous event. For this to occur, all critical defencesin place must have failed.
Glossary 909
Index
AAbandonment, 53, 166, 167, 170, 196, 436,
456Acceptable environmental risk, 12Acceptability of installation riskAccident
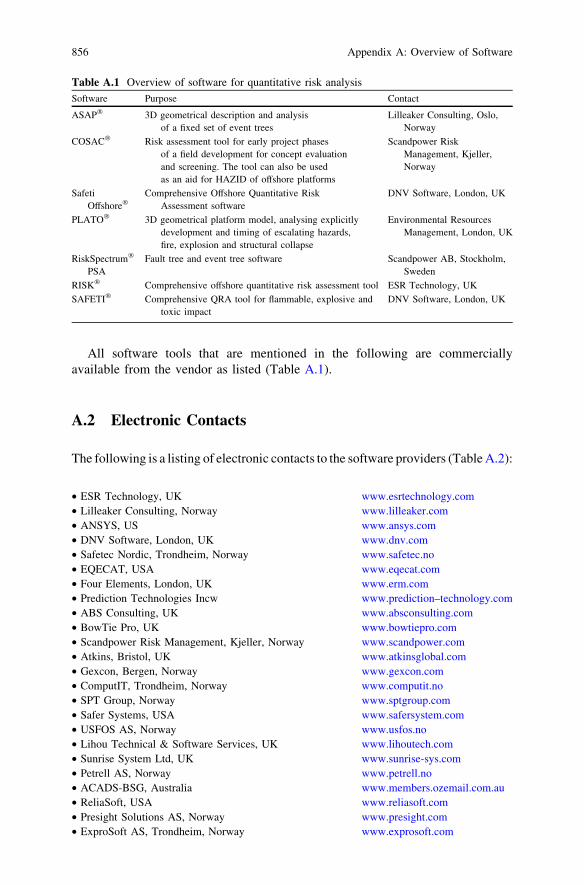
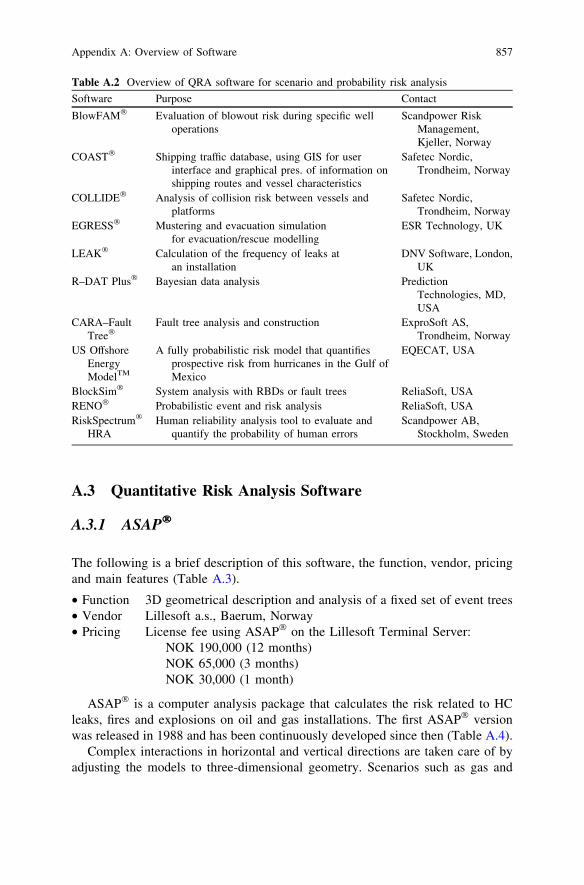
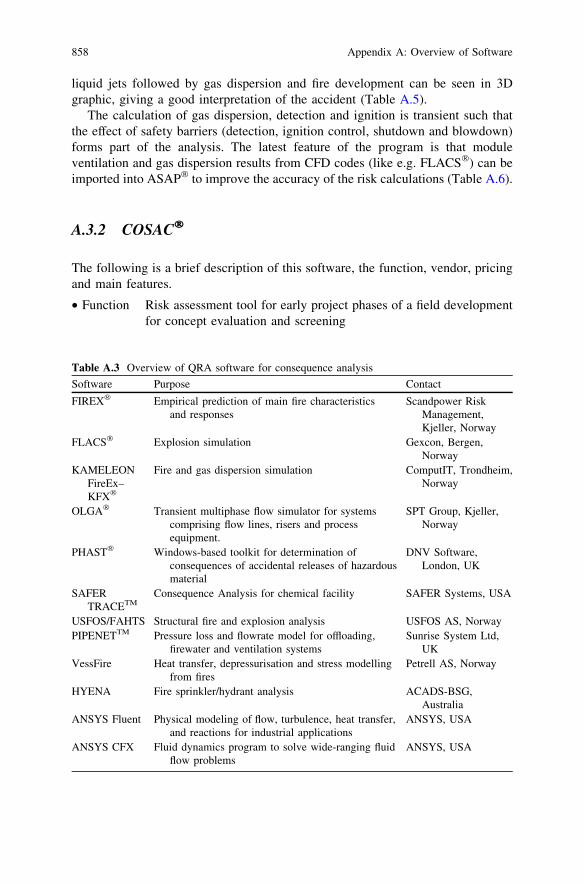
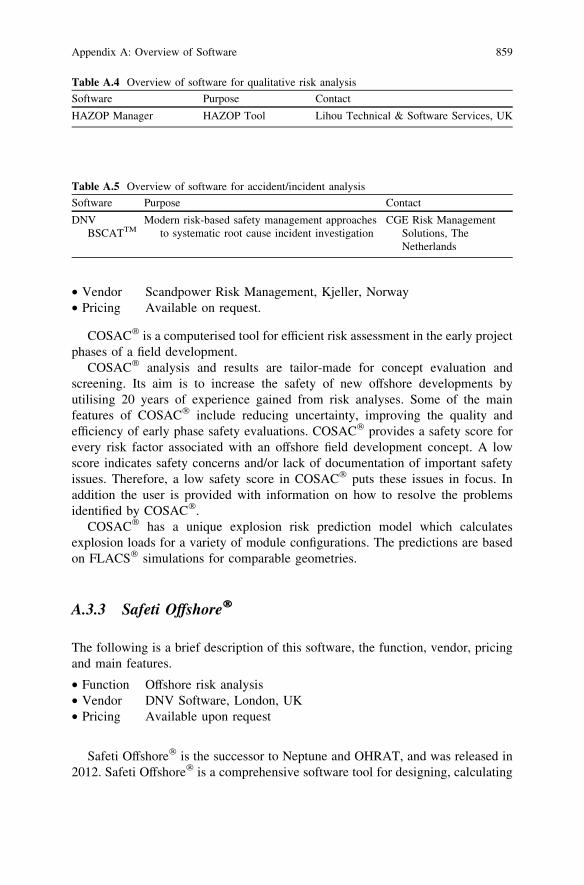


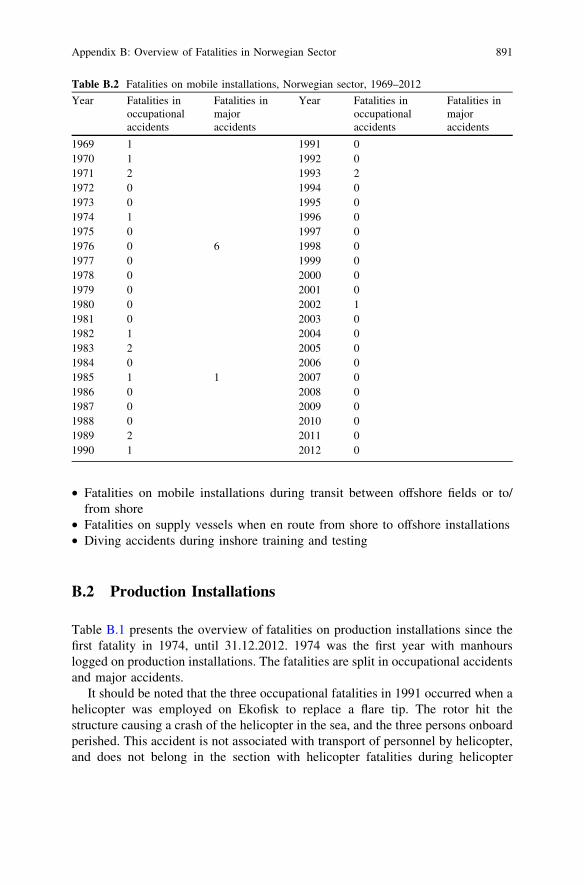


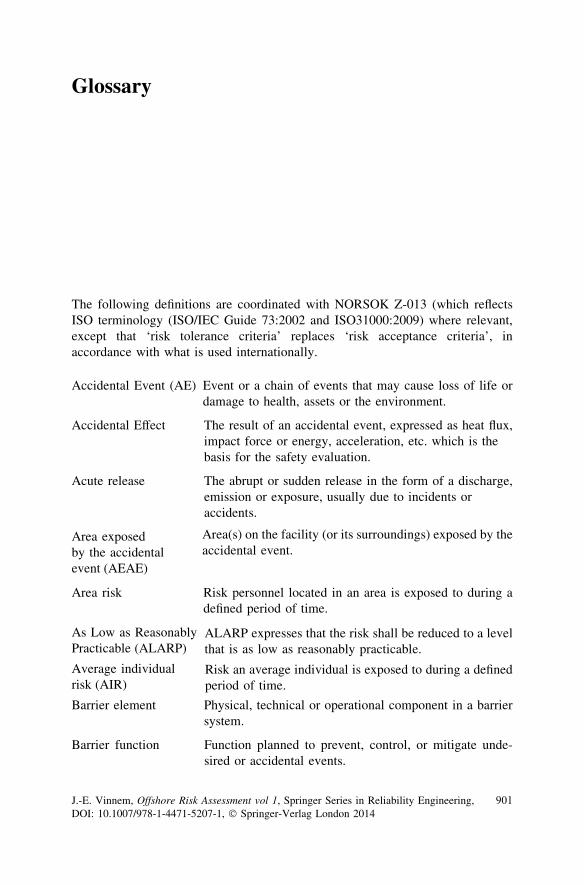


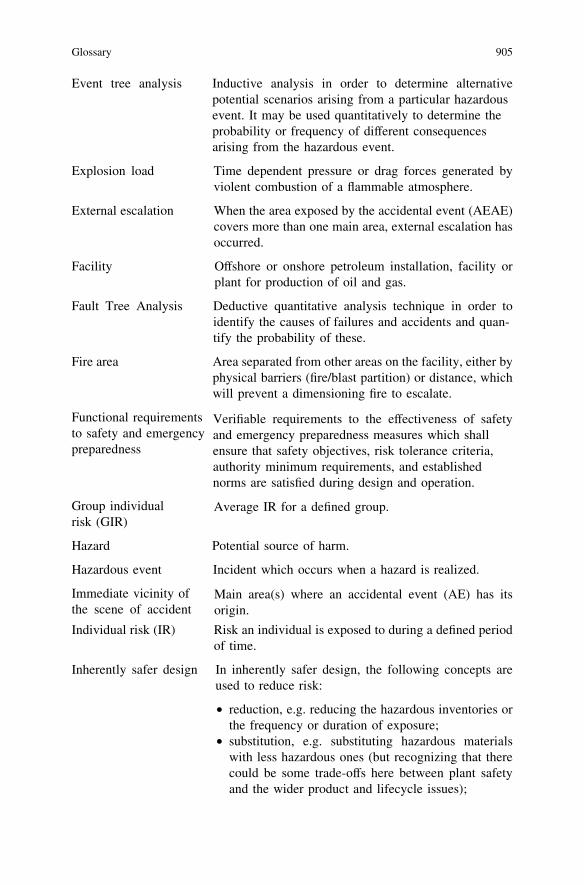


![International Finance and Trade [Emba]5207 2011 Edition](https://static.documents.pub/doc/80x56/553530ec5503468e2b8b4664/international-finance-and-trade-emba5207-2011-edition.jpg)


