34
Appendix A STSE

Appendix A
STSE
170 EARTH SYSTEMS 3209 INTERIM CURRICULUM GUIDE
APPENDIX A
Important Notes 1. These STSE modules are intended for teacher
reference. Each is designed to target specifi c outcomes within Earth Systems 3209. It should be noted that the activities associated with each module are NOT mandatory. They are suggested activities to be used at the discretion of the teacher.
2. There STSE modules and the associated supplements can be found at http://www.ed.gov.nl.ca/edu/k12/curriculum/guides/science/index.html#es3209

171
APPENDIX A
EARTH SYSTEMS 3209 INTERIM CURRICULUM GUIDE
The Search for Other Solar Systems
Outcomes:1. explain the roles of evidence, theories and paradigms in the development of scientifi c knowledge
(114-2)2. analyse why and how a particular technology was developed and improved over time (115-5)3. describe and evaluate the design of technological solutions and the way they function, using scientifi c
principles (116-6)4. analyse why scientifi c and technological activities take place in a variety of individual and group
settings (117-6)5. analyse examples of Canadian contributions to science and technology (117-11)
Introduction
For most of human history we have looked at the night sky and pondered the question “Are we alone in the universe?” Medieval scholars speculated that other worlds must exist and that some would harbour other forms of life. New technologies have allowed us to begin the fi rst steps in the search for extraterrestrial life. The fi rst step in this process is the detection of solar systems around stars other than our own sun.Most of the planets we have found orbiting other stars have been large gas giants like Jupiter. Some of them have also been found very close to their parent star, unlike our own solar system. However, for the fi rst time, we have been able to detect earth sized planets orbiting inside the habitable zone of other solar systems, where liquid water can exist on their surfaces. New observations have forced us to re-examine our theories of solar system formation and expand the range of possible solar systems that could support life.
How do we fi nd other solar systems?
Nearly 1500 other solar systems have been detected so far. There are fi ve methods to detect the presence of planets orbiting other stars.
Radial velocity method The tug of gravity on a star by the planets orbiting it causes it to wobble back and forth. This wobble can be detected by measurements of the Doppler shift of the light emitted from the star. The shift of the stars spectrum towards the blue as it moves toward us and then towards the red as it moves away can be detected easily by large telescopes.
Figure 1: Spectral shifts. (Source: http://innumerableworlds.wordpress.com/2009/03/)

172 EARTH SYSTEMS 3209 INTERIM CURRICULUM GUIDE
APPENDIX A
Transit photometry method This method detects planets by measuring the dimming of a star as the orbiting planet passes between it and the Earth. The passage of a planet between a star and the Earth is called a “transit.” If such a dimming is detected at regular intervals, then it is very probable that a planet is orbiting the star and passing in front of it once every orbit.
Figure 2: Transiting planet and dip in star brightness (Source: http://www.astro.wisc.edu/~townsend/static.php?ref=diploma-2)
Astrometry method The wobble of a star due to the gravitational tug of a planet as it orbits the star is seen directly by making very precise observations of the star as
it slowly moves across the sky.
Figure 3: Wobble of a star. Courtesy: NASA/Kepler mission.
Microlensing methodEinstein predicted that when a heavy object passed in front of a distant star the gravity of the planet could bend the light and act like a lens. This would magnify the star’s image and make it briefl y look brighter. Large telescopes have been able to measure this brightening in very distant stars.
Figure 4: Microlensing method. (Source: http://wise-obs.tau.ac.il/news/exoplanets.html)
Direct imaging Extrasolar planets are relatively small and do not make their own light. They are easily lost in the brilliant glare of the stars they orbit. Scientists have used a coronograph to block most of the star’s central light to directly photograph an exoplanet for the fi rst time.
Figure 5: Direct imaging of 3 planets orbiting a star. Courtesy: Gemini Observatory/Association of Universities for Research in Astronomy
173
APPENDIX A
EARTH SYSTEMS 3209 INTERIM CURRICULUM GUIDE
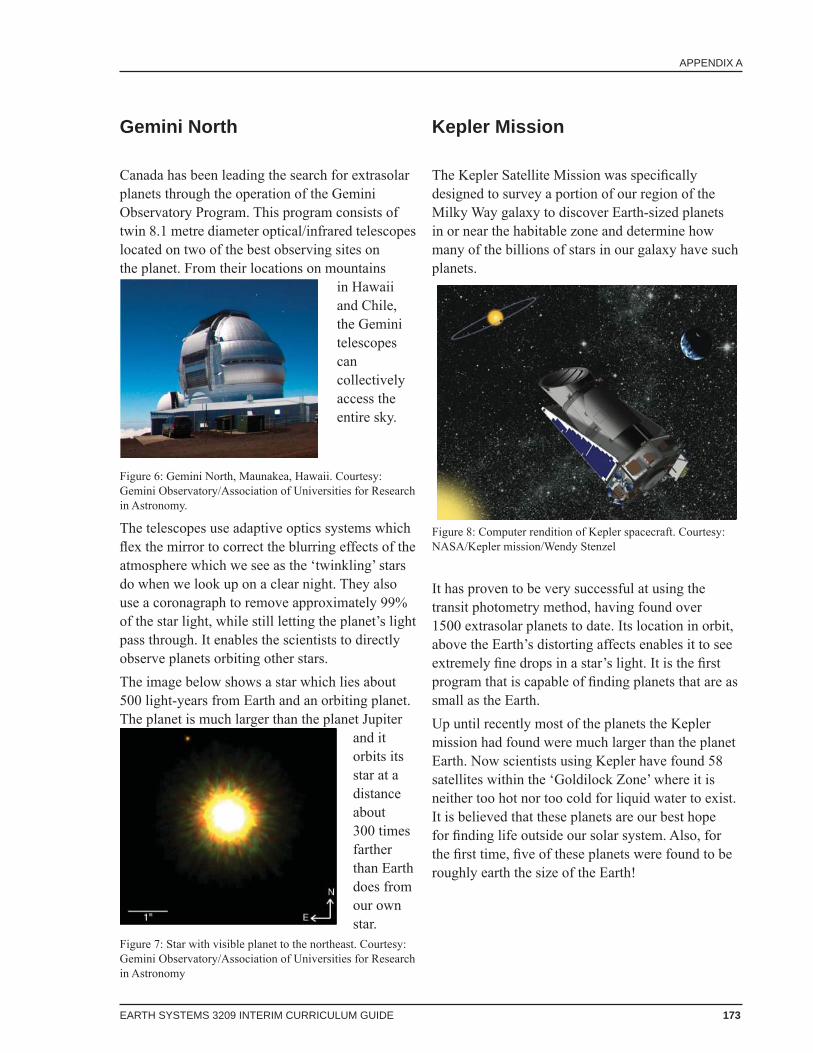
Gemini North
Canada has been leading the search for extrasolar planets through the operation of the Gemini Observatory Program. This program consists of twin 8.1 metre diameter optical/infrared telescopes located on two of the best observing sites on the planet. From their locations on mountains
in Hawaii and Chile, the Gemini telescopes can collectively access the entire sky.
Figure 6: Gemini North, Maunakea, Hawaii. Courtesy: Gemini Observatory/Association of Universities for Research in Astronomy.
The telescopes use adaptive optics systems which fl ex the mirror to correct the blurring effects of the atmosphere which we see as the ‘twinkling’ stars do when we look up on a clear night. They also use a coronagraph to remove approximately 99% of the star light, while still letting the planet’s light pass through. It enables the scientists to directly observe planets orbiting other stars.The image below shows a star which lies about 500 light-years from Earth and an orbiting planet. The planet is much larger than the planet Jupiter
and it orbits its star at a distance about 300 times farther than Earth does from our own star.
Figure 7: Star with visible planet to the northeast. Courtesy: Gemini Observatory/Association of Universities for Research in Astronomy
Kepler Mission
The Kepler Satellite Mission was specifi cally designed to survey a portion of our region of the Milky Way galaxy to discover Earth-sized planets in or near the habitable zone and determine how many of the billions of stars in our galaxy have such planets.
Figure 8: Computer rendition of Kepler spacecraft. Courtesy: NASA/Kepler mission/Wendy Stenzel
It has proven to be very successful at using the transit photometry method, having found over 1500 extrasolar planets to date. Its location in orbit, above the Earth’s distorting affects enables it to see extremely fi ne drops in a star’s light. It is the fi rst program that is capable of fi nding planets that are as small as the Earth.Up until recently most of the planets the Kepler mission had found were much larger than the planet Earth. Now scientists using Kepler have found 58 satellites within the ‘Goldilock Zone’ where it is neither too hot nor too cold for liquid water to exist. It is believed that these planets are our best hope for fi nding life outside our solar system. Also, for the fi rst time, fi ve of these planets were found to be roughly earth the size of the Earth!
174 EARTH SYSTEMS 3209 INTERIM CURRICULUM GUIDE
APPENDIX A
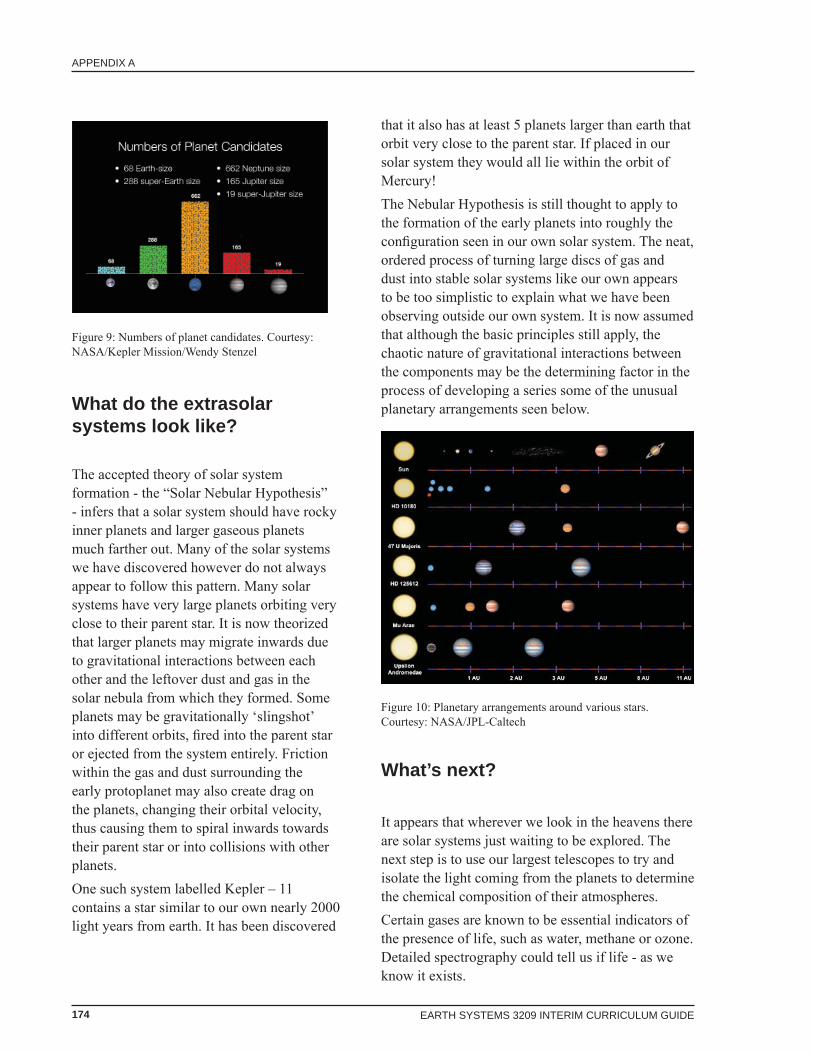
Figure 9: Numbers of planet candidates. Courtesy: NASA/Kepler Mission/Wendy Stenzel
What do the extrasolar systems look like?
The accepted theory of solar system formation - the “Solar Nebular Hypothesis” - infers that a solar system should have rocky inner planets and larger gaseous planets much farther out. Many of the solar systems we have discovered however do not always appear to follow this pattern. Many solar systems have very large planets orbiting very close to their parent star. It is now theorized that larger planets may migrate inwards due to gravitational interactions between each other and the leftover dust and gas in the solar nebula from which they formed. Some planets may be gravitationally ‘slingshot’ into different orbits, fi red into the parent star or ejected from the system entirely. Friction within the gas and dust surrounding the early protoplanet may also create drag on the planets, changing their orbital velocity, thus causing them to spiral inwards towards their parent star or into collisions with other planets.One such system labelled Kepler – 11 contains a star similar to our own nearly 2000 light years from earth. It has been discovered
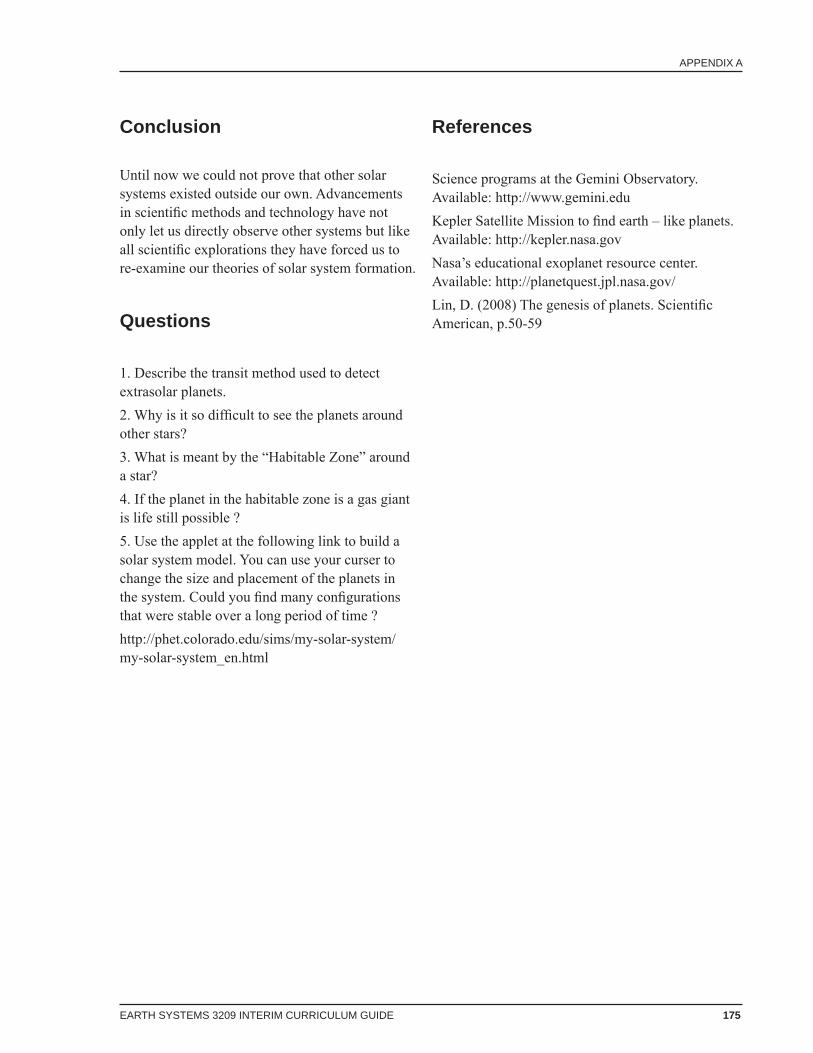
that it also has at least 5 planets larger than earth that orbit very close to the parent star. If placed in our solar system they would all lie within the orbit of Mercury!The Nebular Hypothesis is still thought to apply to the formation of the early planets into roughly the confi guration seen in our own solar system. The neat, ordered process of turning large discs of gas and dust into stable solar systems like our own appears to be too simplistic to explain what we have been observing outside our own system. It is now assumed that although the basic principles still apply, the chaotic nature of gravitational interactions between the components may be the determining factor in the process of developing a series some of the unusual planetary arrangements seen below.
Figure 10: Planetary arrangements around various stars. Courtesy: NASA/JPL-Caltech
What’s next?
It appears that wherever we look in the heavens there are solar systems just waiting to be explored. The next step is to use our largest telescopes to try and isolate the light coming from the planets to determine the chemical composition of their atmospheres. Certain gases are known to be essential indicators of the presence of life, such as water, methane or ozone. Detailed spectrography could tell us if life - as we know it exists.
175
APPENDIX A
EARTH SYSTEMS 3209 INTERIM CURRICULUM GUIDE
Conclusion
Until now we could not prove that other solar systems existed outside our own. Advancements in scientifi c methods and technology have not only let us directly observe other systems but like all scientifi c explorations they have forced us to re-examine our theories of solar system formation.
Questions
1. Describe the transit method used to detect extrasolar planets. 2. Why is it so diffi cult to see the planets around other stars?3. What is meant by the “Habitable Zone” around a star?4. If the planet in the habitable zone is a gas giant is life still possible ?5. Use the applet at the following link to build a solar system model. You can use your curser to change the size and placement of the planets in the system. Could you fi nd many confi gurations that were stable over a long period of time ?http://phet.colorado.edu/sims/my-solar-system/my-solar-system_en.html
References
Science programs at the Gemini Observatory. Available: http://www.gemini.eduKepler Satellite Mission to fi nd earth – like planets. Available: http://kepler.nasa.govNasa’s educational exoplanet resource center. Available: http://planetquest.jpl.nasa.gov/Lin, D. (2008) The genesis of planets. Scientifi c American, p.50-59

176 EARTH SYSTEMS 3209 INTERIM CURRICULUM GUIDE
APPENDIX A

177
APPENDIX A
EARTH SYSTEMS 3209 INTERIM CURRICULUM GUIDE
Outcomes:1. explain the importance of communicating the results of a scientifi c or technological endeavour using
appropriate language and conventions (114-9)2. distinguish between scientifi c questions and technological problems (115-1)3. analyse and describe examples where scientifi c understanding was enhanced or revised as a result of
the invention of technology (116-2)4. analyse and describe examples where technologies were developed based on scientifi c understanding
(116-4)5. analyse the knowledge and skills acquired in their study of science to identify areas of further study
related to science and technology (117-9)6. identify limitations of a given classifi cation system and identify alternative ways to classify to
accommodate anomalies (214-2) 7. identify and explain sources of error and uncertainty in measurement and express results in a form that
acknowledges the degree of uncertainty (214-10)8. explain the appropriate applications of absolute and relative dating (332-6)
Labrador Zircons and their Link to Radiometric Dating and Absolute Time
Introduction
One of the basic tenets of geology is that the Earth, Solar System and Universe, are very, very old; 4.55 billion years old in fact. This tenet, however, has only been developed over past 250 years. Prior to the development of modern scientifi c thought, most estimates about the age of the Earth relied on religious interpretations. All religions have creation stories which describe the origin of the planet and many suggest that the Earth is at most thousands of years old. For example, in a book published in 1658, James Ussher, the Archbishop of Ireland, using the bible as his data source, back-calculated the creation of the Earth to Saturday, October 22, 4004 BC. A basic concept for geologists is that “the present is the key to the past”. This concept
simply means that the natural, geological processes we see happening today also happened throughout geological history. To understand the Earth’s past, one can look at present processes and extrapolate back through time. From this concept we can infer that geological processes are very slow, occurring over very long periods of time. Geochronology is the fi eld of Earth science which is concerned with dating geological events and rock formations. When communicating ages, geologists use the terms relative and absolute time. Relative time refers to dating rocks in relation to their position with respect to other rocks and it has limited use in the study of geological processes. Absolute time refers to defi ning the actual age of a rock. As will be discussed later, absolute time is determined using chemical processes and has great use when studying events that occurred in the Earth’s development.
178 EARTH SYSTEMS 3209 INTERIM CURRICULUM GUIDE
APPENDIX A
Relative Time
Some of the principles from which geologists came to understand relative time were developed by 17th century scientist Nicolas Steno (1638-1686). In a book published in 1669, he defi ned three principles upon which stratigraphy and relative geochronology are based. These principles were: • law of lateral continuity - sedimentary rock
layers (strata) are continuous across the Earth’s surface unless blocked by other rock bodies;
• law of original horizontality - all strata were originally deposited horizontally;
• law of superposition - in layered strata the oldest rocks are always on bottom and the youngest are on top.
Steno’s law of superposition is essentially the basic principle of relative age dating. In any sequence of undisrupted strata, the oldest rocks are always on the bottom. James Hutton (1726-1797), often referred to as the father of modern geology, studied rocks in Scotland and came across places where fl at-lying strata lay on top of tilted strata. He recognized that the fl at-lying strata were younger than the tilted strata and, based on the law of superposition, that within the fl at strata, the oldest layers were on bottom, just above the tilted strata. He termed the actual contact zone between tilted and fl at strata an unconformity and noted that it represented an undefi nable time gap between when the tilted layers were tilted and when the fl at lying strata were laid down. Around the same time, the Industrial Revolution was beginning in Europe. Harnessing steam energy was at the heart of this revolution. Heating water to create steam required a tremendous release of the energy. Energy obtained from the burning of coal. For the countries of Europe, easy, consistent access to coal was a necessity
for their societies to advance into the technological future. Consequently, considerable efforts were expended to fi nd accessible coal. William “Strata” Smith (1769-1839) was a pioneering geologist who mapped coal-bearing layers. As he studied the layers, it became apparent to him that the various strata were in the same relative positions and thus, through the law of superposition, their relative ages could be determined. Smith and others also noted that different strata layers contained distinctive and unique fossil assemblages that always had the same stratigraphic relationships with each other.
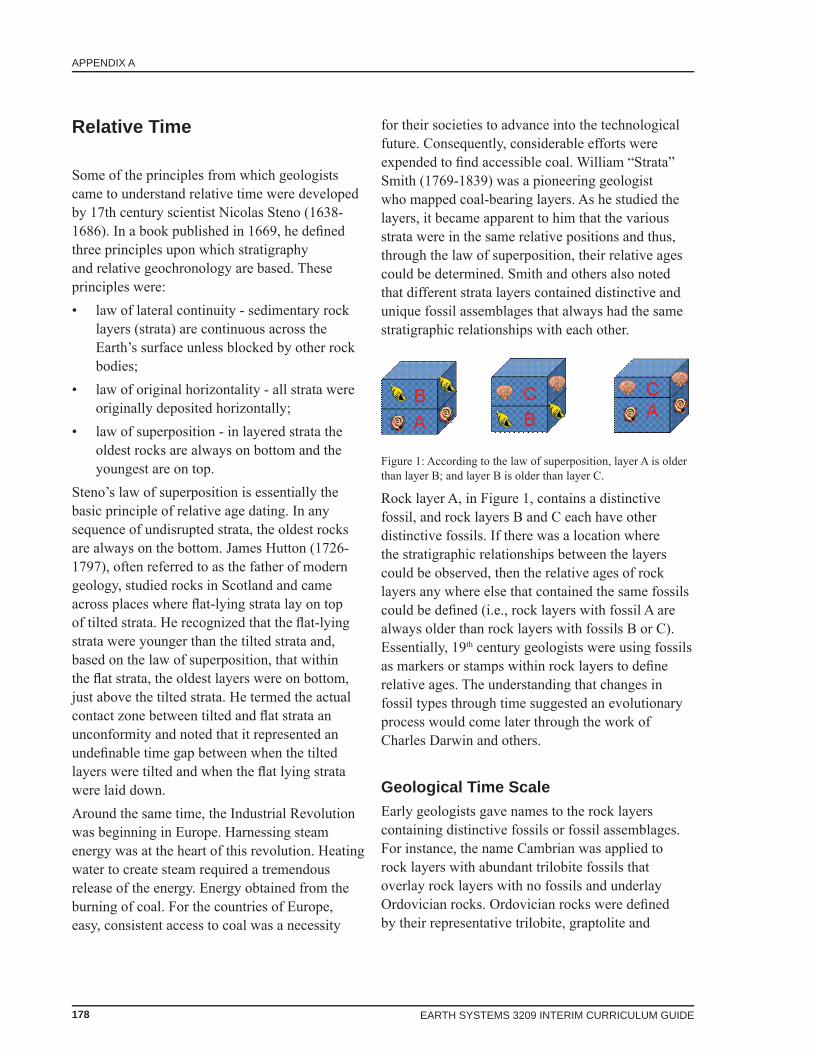
Figure 1: According to the law of superposition, layer A is older than layer B; and layer B is older than layer C.
Rock layer A, in Figure 1, contains a distinctive fossil, and rock layers B and C each have other distinctive fossils. If there was a location where the stratigraphic relationships between the layers could be observed, then the relative ages of rock layers any where else that contained the same fossils could be defi ned (i.e., rock layers with fossil A are always older than rock layers with fossils B or C). Essentially, 19th century geologists were using fossils as markers or stamps within rock layers to defi ne relative ages. The understanding that changes in fossil types through time suggested an evolutionary process would come later through the work of Charles Darwin and others.
Geological Time ScaleEarly geologists gave names to the rock layers containing distinctive fossils or fossil assemblages. For instance, the name Cambrian was applied to rock layers with abundant trilobite fossils that overlay rock layers with no fossils and underlay Ordovician rocks. Ordovician rocks were defi ned by their representative trilobite, graptolite and
179
APPENDIX A
EARTH SYSTEMS 3209 INTERIM CURRICULUM GUIDE
conodont fossils. In this manner, the geological time scale was defi ned (see Figure 2). All rock layers younger than the start of the Cambrian are part of the Phanerozoic eon which is defi ned as containing evidence for an abundance of life. The Phanerozoic eon is further subdivided into the Paleozoic era (ancient life), Mesozoic era (middle life) and the Cenozoic era (new life). Rock layers older than the Cambrian period are termed Precambrian; the big difference being that Precambrian rocks do not contain macrofossils and thus cannot be readily distinguished from each other by their fossil contents.For sedimentary rocks from the Phanerozoic eon, the geological time scale provides a relative geochronology in that identifi cation of a diagnostic fossil or fossil assemblage within the rock layer could allow the layer to be classifi ed as belonging to a certain period. The actual age range of the periods cannot be determined using relative time, all one could say is that Cambrian rocks are older than Devonian rocks. The fossil-based geological time scale provides defi nitive information on sedimentary rock layers, but does not provide direct data on igneous rocks (formed from the cooling of magmas), metamorphic rocks (formed from the application of great heat and pressure on other rocks), or non-fossil-bearing sedimentary rocks. The relative ages of these non-fossiliferous rocks could be defi ned indirectly. For example, if a sequence of Cambrian rocks were cut by an igneous dyke and an overlaying sequence of Ordovician rocks were not cut by the same dyke, one could infer that the dyke was younger than the Cambrian rocks, yet older than the Ordovician rocks.
Rocks of Newfoundland and LabradorMost of the rocks on the island of Newfoundland are Phanerozoic and the ages of the sedimentary rocks are, in general, readily assigned their relative geological ages based on their contained fossils.
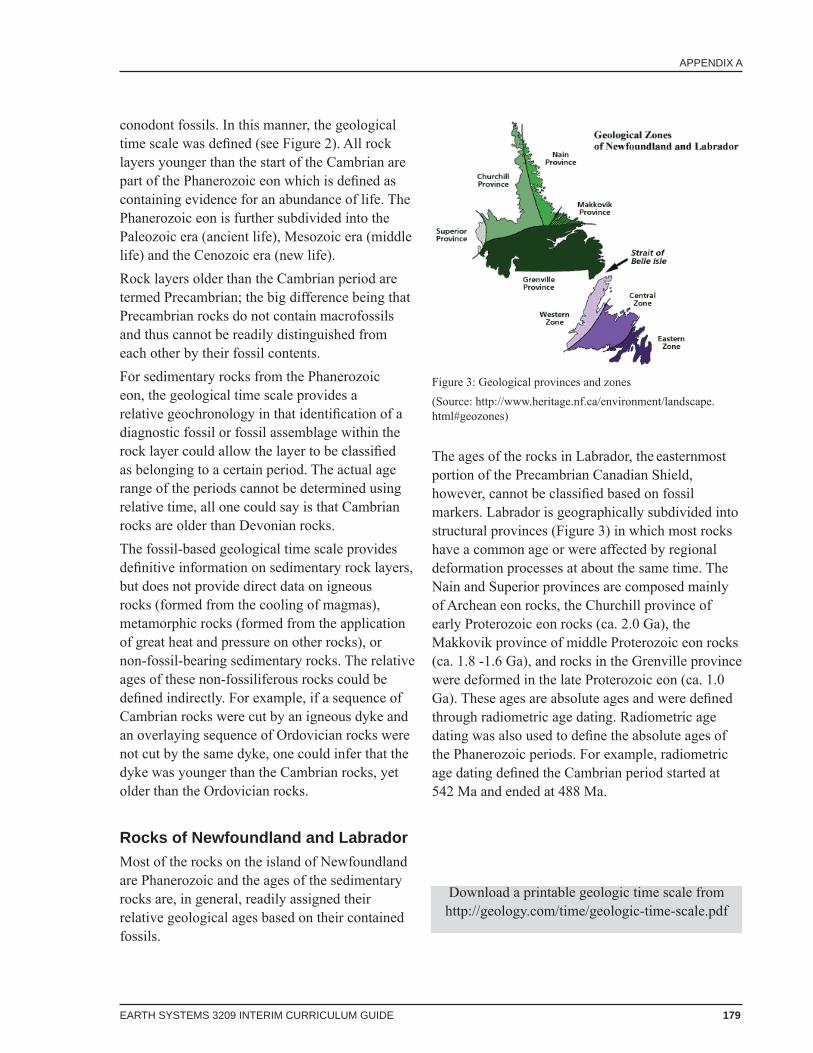
The ages of the rocks in Labrador, the easternmost portion of the Precambrian Canadian Shield, however, cannot be classifi ed based on fossil markers. Labrador is geographically subdivided into structural provinces (Figure 3) in which most rocks have a common age or were affected by regional deformation processes at about the same time. The Nain and Superior provinces are composed mainly of Archean eon rocks, the Churchill province of early Proterozoic eon rocks (ca. 2.0 Ga), the Makkovik province of middle Proterozoic eon rocks (ca. 1.8 -1.6 Ga), and rocks in the Grenville province were deformed in the late Proterozoic eon (ca. 1.0 Ga). These ages are absolute ages and were defi ned through radiometric age dating. Radiometric age dating was also used to defi ne the absolute ages of the Phanerozoic periods. For example, radiometric age dating defi ned the Cambrian period started at 542 Ma and ended at 488 Ma.
Download a printable geologic time scale from http://geology.com/time/geologic-time-scale.pdf
Figure 3: Geological provinces and zones (Source: http://www.heritage.nf.ca/environment/landscape.html#geozones)
180 EARTH SYSTEMS 3209 INTERIM CURRICULUM GUIDE
APPENDIX A
have an atomic weight of 1, the isotope with one neutron would have an atomic weight of 2, and the one with two neutrons would have an atomic weight of 3.In elements with lower atomic numbers, the effect of having extra neutrons, mainly just affects their atomic weight. In other elements with higher atomic numbers and thus heavier atoms, the extra mass provided by the neutrons can be catastrophic for the stability of that element. For example, although uranium has an atomic number of 92, its two naturally occurring isotopes have atomic weights of 235 and 238, meaning that the atomic nuclei contain 143 and 145 neutrons respectively, in addition to its 92 protons. When referring to isotopes of an element, the isotope is represented by the atomic weight as a superscript on the upper left of the elemental symbol for that element. In the case of uranium, the symbol for the element is U and thus the two isotopes are signifi ed as 235U and 238U.In some isotopes, the weight contributed by large numbers of neutrons makes the atom energetically unstable. To achieve stability, the atom has to expel some of the excess mass, essentially emitting particles and/or energy from the nucleus. This emission of mass/energy is termed radioactivity. Neutrons, protons, and in some elements, electrons, can be ejected from the nucleus of a radioactive isotope. This changes the atomic number of the atom and thus transforms the atom from one element to that of another element. The atom which was too heavy and expelled mass is termed the parent isotope. The new atom formed from the expulsion of excess mass is termed the daughter isotope. A daughter isotope is said to be radiogenic as it had its origin in the radioactive decay of a parent isotope.The rate of decay for of a specifi c radiogenic parent to a daughter isotope is one of the few absolute constants in nature. The rate cannot be sped up or slowed down; it is the same on Earth as it is in the furthest reaches of the solar system and surrounding galaxies. The rate has not changed since the origin
Radiometric Dating and Absolute Ages
Radiometric age dating is based on the radioactive decay of a parent isotope of an element to a daughter isotope of another element. Elements are the building blocks of matter and constitute the most basic form of a substance. Elements are defi ned by their atoms. While atoms consists of subatomic particles, the atom itself is what defi nes an element. For example, an atom of the simplest element, hydrogen, consists of one proton in its nucleus surrounded by one electron. A proton has a positive electrical charge and the electron has a negative charge. Within the atom, proton and electron charges balance each other out such that the atom has no charge. The next simplest element, helium, contains a nucleus of two protons surrounded by two electrons. The largest naturally occurring element, uranium, contains ninety-two protons in its nucleus surrounded ninety-two electrons. Each element is defi ned by its atomic number which is the number of protons (and electrons) that it contains. Thus, hydrogen is atomic number 1, helium atomic number 2 and uranium, atomic number 92. The nucleus of an atom can also contain another subatomic particle called a neutron. A neutron is particle that has no electrical charge and is slightly larger than a proton with the same weight. The atoms of some elements, while defi ned by their atomic number (i.e., number of protons), can contain variable numbers of neutrons. Such atoms with a common atomic number, but different numbers of neutrons, are termed isotopes of the element. For example hydrogen, atomic number 1, has three isotopes; one contains no neutrons, one contains one neutron, and the third contains two neutrons. These isotopes differ in their atomic weights. The hydrogen isotope with no neutrons would
181
APPENDIX A
EARTH SYSTEMS 3209 INTERIM CURRICULUM GUIDE
of the Universe. Rates of decay are expressed as the half-life of the parent isotope which means the length of time it takes for one half of the parent isotopes in a given system to radioactively decay to the daughter isotopes. After the time period of one half-life, half of the atoms of the parent isotope have decayed. After the time period of a second half-life, another half (or a quarter of the original parent isotope atoms) have decayed to the daughter isotope. Eventually all of the parent isotope will decay to the daughter isotope. The principle of radiometric dating therefore is that, if the concentrations of a parent isotope and a daughter isotope can be accurately measured in a rock and/or mineral phase, and knowing the decay rate (i.e, half-life of the parent isotope), the absolute age of the rock or mineral can be calculated.
Radiogenic Isotope PairsThere are a number of radiogenic isotope pairs that are used in geochronological studies. These include:• 87Rb (Rubidium) which decays to 87Sr
(Strontium) with a half-life of 4.88 × 10¹⁰ years;
• 147Sm (Samarium) to 143Nd (Neodymium) with a half-life of 1.06 x 10¹¹ years; and
• 187Re (Rhenium) to 187Os (Osmium) with a half-life of 41.6 x 10⁹ years.
When the parent and daughter isotopes of a radiogenic pair are measured, a third isotope is also measured. This third isotope is a second isotope of the daughter element that does not have a radioactive parent (i.e., a non-radiogenic isotope). This non-radiogenic isotope is analysed to serve as a measure of the amount of radiogenic daughter isotope produced by radioactive decay in the system of interest. The basic form of the age-dating equation is:
(RADD / NONRADD)* = RADP (eλt-1) / NONRADD ; where RADD = the amount of the radiogenic Daughter isotope, NONRADD = the amount of the non-radiogenic Daughter isotope, RADP = the amount of the radiogenic Parent isotope, and λ = the half-life of the parent isotope, and t = the age. In the case of Rb-Sr for instance, the age-dating equation would be: (87Sr / 86Sr) = 87Rb (eλt-1) /86Sr ; where 86Sr is the non-radiogenic isotope of the daughter element. The most widely used system for the geochronology, however, is that of uranium (U) and lead (Pb). The main reason for its extensive use is that they are actually two pairs; 238U decays to 206Pb with a half-life of 4.47 Ga, and 235U decays to 207Pb with a half-life of 704 Ma. It must be noted that these radiogenic relationships are not direct but actually represent a decay chain in which the parent U isotopes decay through a range of intermediary isotopes before fi nally stabilizing as the Pb isotope. Because there are two parent-daughter pairs in the U-Pb system, each analysis can provide two chronometers rather than just one. The two chronometers can be compared with each other to provide a better assessment of the analytical veracity. The relatively rapid decay rates of the two pairs compared to other systems also means that more precise geochronological calculations can be made because the relative destruction of parent isotope and creation of daughter isotopes can be measured in much greater detail (i.e., a shorter half-life means that there are more readily detectable concentrations of the daughter isotopes).
Limitation of Radiometric Age Dating In any given radioactive system, a parent isotope decays to a daughter isotope and the daughter isotope is said to be radiogenic as it has its origin in the decay of the parent. However, the daughter isotope will also be present in nature, thus when measuring the amount of such an isotope there will two be components, the original amount present when the Earth formed and the radiogenic amount derived by
182 EARTH SYSTEMS 3209 INTERIM CURRICULUM GUIDE
APPENDIX A
radioactive decay. As has been described above, the portion derived from radioactive decay is said to be radiogenic. The original portion, present since the Earth formed, is called common. Thus, in a “daughter” isotope there will be truly radiogenic amounts and common amounts. In determining a radiometric age date, the relative amounts of common vs. radiogenic components must be minimized to yield a correct age. Measurable amounts of the common variety of an isotope will produce an incorrect age which will be older than the correct age. If the common isotope is abundant the analytical technique can’t distinguish between it and truly radiogenic amounts, hence all amounts will be attributed to radioactive decay. The solution to this problem is to date a mineral which contains the parent isotope only and does not contain appreciable quantities of the daughter isotope at all (i.e. no common amounts).Another factor that can affect the accuracy of an age date is the loss of parent and/or daughter isotopes from the mineral being dated. In the Rb-Sr system for instance, common minerals which contain these elements such as feldspars and carbonates can be easily affected by later deformation or the fl ow of hydrothermal fl uids. By removing portions of one or both isotopes in the radiogenic pair, the age date derived may actually have been reset from the age of mineralization.
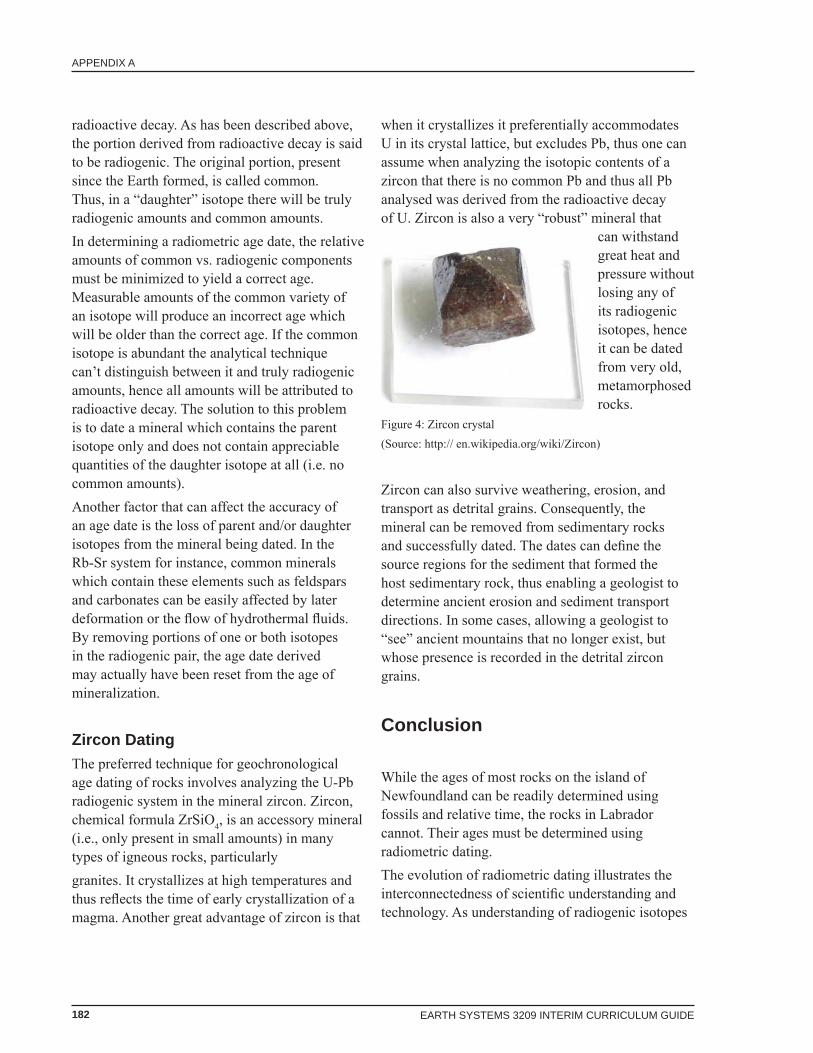
Zircon DatingThe preferred technique for geochronological age dating of rocks involves analyzing the U-Pb radiogenic system in the mineral zircon. Zircon, chemical formula ZrSiO4, is an accessory mineral (i.e., only present in small amounts) in many types of igneous rocks, particularly granites. It crystallizes at high temperatures and thus refl ects the time of early crystallization of a magma. Another great advantage of zircon is that
when it crystallizes it preferentially accommodates U in its crystal lattice, but excludes Pb, thus one can assume when analyzing the isotopic contents of a zircon that there is no common Pb and thus all Pb analysed was derived from the radioactive decay of U. Zircon is also a very “robust” mineral that
can withstand great heat and pressure without losing any of its radiogenic isotopes, hence it can be dated from very old, metamorphosed rocks.
Figure 4: Zircon crystal (Source: http:// en.wikipedia.org/wiki/Zircon)
Zircon can also survive weathering, erosion, and transport as detrital grains. Consequently, the mineral can be removed from sedimentary rocks and successfully dated. The dates can defi ne the source regions for the sediment that formed the host sedimentary rock, thus enabling a geologist to determine ancient erosion and sediment transport directions. In some cases, allowing a geologist to “see” ancient mountains that no longer exist, but whose presence is recorded in the detrital zircon grains.
Conclusion
While the ages of most rocks on the island of Newfoundland can be readily determined using fossils and relative time, the rocks in Labrador cannot. Their ages must be determined using radiometric dating. The evolution of radiometric dating illustrates the interconnectedness of scientifi c understanding and technology. As understanding of radiogenic isotopes

183
APPENDIX A
EARTH SYSTEMS 3209 INTERIM CURRICULUM GUIDE
evolved, it led to the development of radiometric dating technologies. These technological processes were then used to determine the absolute age of rock and mineral samples. Evidence from these processes has enhanced and revised our understanding of the age of the Earth and is the basis for the current accepted age, 4.55 billion years old. Radiometric age dating is not without error, as discussed in relation to the U-Pb system. However, the inaccuracies caused by this technological process spurred the development of a new process involving analyzing the U-Pb radiogenic system in the mineral zircon. The presence of zircon in the rocks of Labrador has enabled them to be defi ned as Precambrian rocks ranging from 1 to 2 billion years old.
References
http://en.wikipedia.org/wiki/Age_of_the_Earthhttp://en.wikipedia.org/wiki/Zirconhttp://en.wikipedia.org/wiki/Radiometric_datinggeology.com/minerals/zircon.shtml
Questions
1. Explain how the phase “the present is the key to the past” relates to this STSE.
2. Describe the difference between relative and absolute time and their usage.
3. Describe how the society’s need for coal during the Industrial Revolution led to enhancement in scientifi c knowledge
4. Explain how for sedimentary rock layers, the identifi cation of a fossil within it, allows the layer to be classifi ed.
5. Identify some limitations of classifying rock layers on the basis of identifi ed fossils.
6. Explain how the rocks from the island of Newfoundland differ from those in Labrador.
7. Describe the process of radiometric dating.8. Why is the U-Pb system the most widely used
system of geochronology?9. From the STSE, describe an example where
scientifi c understanding was enhanced as a result of the invention of technology.

184 EARTH SYSTEMS 3209 INTERIM CURRICULUM GUIDE
APPENDIX A

185
APPENDIX A
EARTH SYSTEMS 3209 INTERIM CURRICULUM GUIDE
Introduction
Diamonds are part of our everyday lives but, what do you really know about diamonds?Did you know:• most diamonds are 3 billion years old and
made of carbon• diamonds formed deep within the Earth’s
upper mantle, approximately 150 km below the surface.
• diamonds are thought to have been fi rst recognized in India 3000 - 6000 years ago
• diamonds were fi rst mined in South Africa• the fi rst Canadian diamond was found in
1920, near Peterborough, Ontario, by a railroad worker digging a railroad cut.
• Canada’s fi rst diamond mine opened in the Northwest Territories in 1998. This mine now supplies 6 percent of the world’s diamonds.
• the largest rough diamond ever found was the Cullinan Diamond. Found in South Africa in 1905, it weighed 3106 carats. Stones cut from the Cullinan Diamond are part of the British crown jewels
• the Orlov Diamond, found in India, was shaped like half a pigeon’s egg and weighed 300 carats.
• a carat equals 0.2 grams. One carat is divided into 100 points so therefore, a diamond of 75 points weighs 0.75 carats.
• diamond is a mineral found in intrusive (plutonic) igneous rock called kimberlite.
• diamond is the most transparent and hardest mineral on Earth. In fact, only diamond itself can cut another diamond.
Diamond Formation and Properties
Figure 1: Ekati Canadian Diamond Mine, Northwest Territories, 4 open pit mines visible (Source: en.wikipedia.org/Ekati_Diamond_Mine)
Outcomes:1. relate personal activities and various scientifi c and technological endeavours to specifi c science
disciplines and interdisciplanary studies (114-6)2. analyse and describe examples where scientifi c understanding was enhanced or revised as a result of
the invention of technology (116-2)3. describe the functioning of domestic and industrial technology, using scientifi c principles (116-5)4. analyse society’s infl uence on scientifi c and technological endeavours (117-2)5. debate the merits of funding specifi c scientifi c or technological endeavours and not others (117-4)6. classify rocks according to their structure, chemical composition, and method of formation (330-2)7. describe the formation of kimberlite and its relationship with diamond deposits
186 EARTH SYSTEMS 3209 INTERIM CURRICULUM GUIDE
APPENDIX A
• diamonds have uses that extend beyond jewelry.
• diamonds are used in studded rotary bits to drill oil wells, mine minerals, and build tunnels.
• dentists use the hard edges of diamonds to drill through tooth enamel and doctors perform surgery with diamond-edged scalpels.
• diamond is an excellent conductor of heat. Due to its high thermal conductance, it is used in the manufacturing of semiconductors to prevent silicon and other materials from overheating.
• diamond repels water and is attracted to grease. Processing diamonds is done over a greased table. The grease attracts the diamonds and the repelled water moves over the table taking away waste materials.
• diamonds are NOT forever. While diamond is the hardest mineral on Earth, it only ranks between fair and good in terms of toughness. Areas of weak bonding exist within the diamond crystal lattice and the atomic arrangement changes over time once it moves to the surface. Of course, these changes take place over geologic time and not the span of a human life.
Diamond Formation
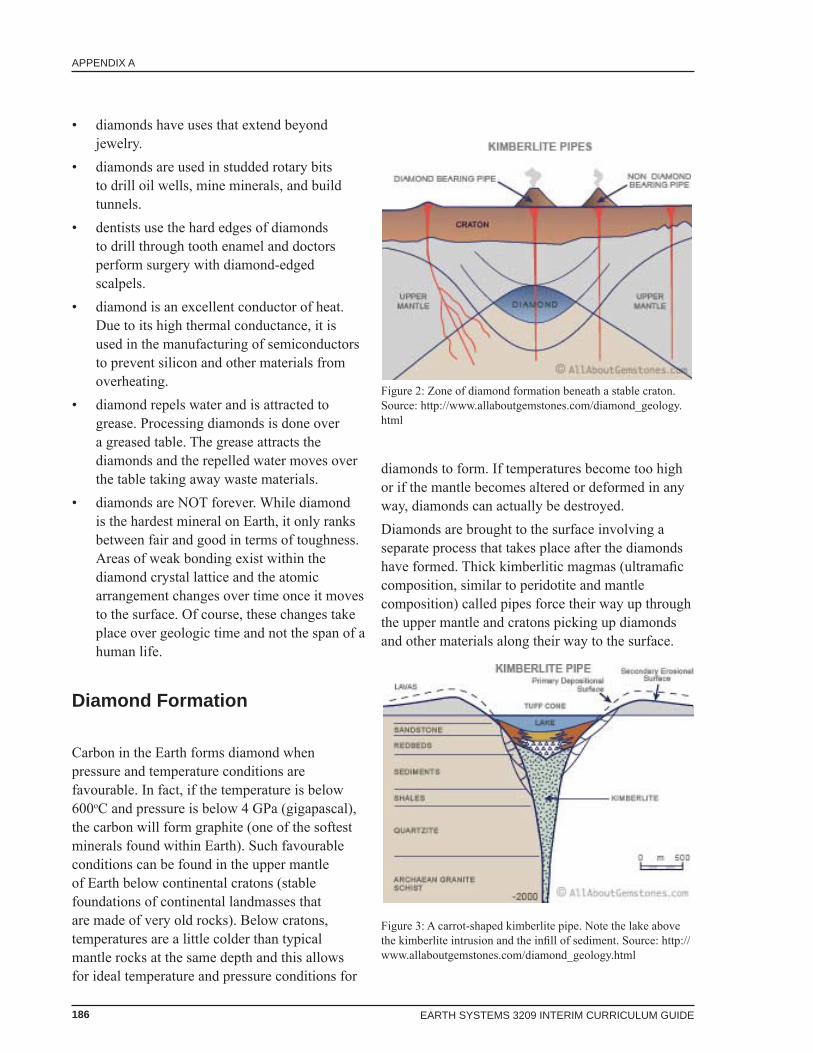
Carbon in the Earth forms diamond when pressure and temperature conditions are favourable. In fact, if the temperature is below 600oC and pressure is below 4 GPa (gigapascal), the carbon will form graphite (one of the softest minerals found within Earth). Such favourable conditions can be found in the upper mantle of Earth below continental cratons (stable foundations of continental landmasses that are made of very old rocks). Below cratons, temperatures are a little colder than typical mantle rocks at the same depth and this allows for ideal temperature and pressure conditions for
diamonds to form. If temperatures become too high or if the mantle becomes altered or deformed in any way, diamonds can actually be destroyed. Diamonds are brought to the surface involving a separate process that takes place after the diamonds have formed. Thick kimberlitic magmas (ultramafi c composition, similar to peridotite and mantle composition) called pipes force their way up through the upper mantle and cratons picking up diamonds and other materials along their way to the surface.
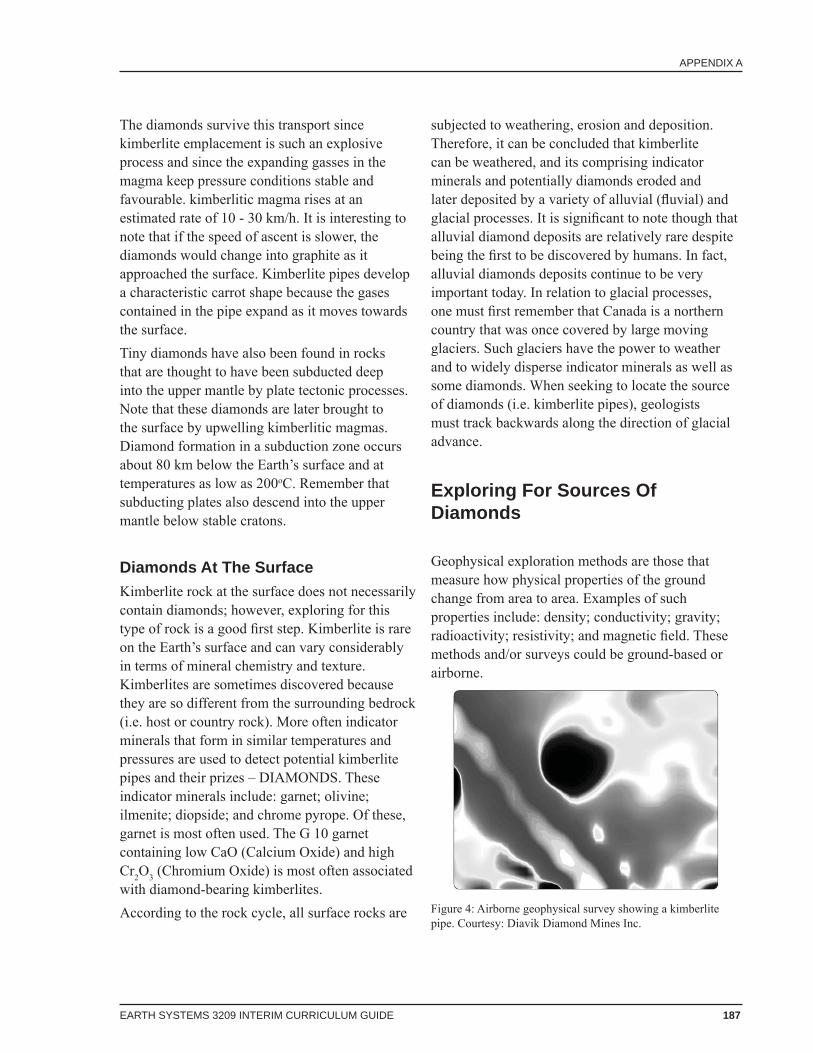
Figure 3: A carrot-shaped kimberlite pipe. Note the lake above the kimberlite intrusion and the infi ll of sediment. Source: http://www.allaboutgemstones.com/diamond_geology.html
Figure 2: Zone of diamond formation beneath a stable craton. Source: http://www.allaboutgemstones.com/diamond_geology.html
187
APPENDIX A
EARTH SYSTEMS 3209 INTERIM CURRICULUM GUIDE
The diamonds survive this transport since kimberlite emplacement is such an explosive process and since the expanding gasses in the magma keep pressure conditions stable and favourable. kimberlitic magma rises at an estimated rate of 10 - 30 km/h. It is interesting to note that if the speed of ascent is slower, the diamonds would change into graphite as it approached the surface. Kimberlite pipes develop a characteristic carrot shape because the gases contained in the pipe expand as it moves towards the surface. Tiny diamonds have also been found in rocks that are thought to have been subducted deep into the upper mantle by plate tectonic processes. Note that these diamonds are later brought to the surface by upwelling kimberlitic magmas. Diamond formation in a subduction zone occurs about 80 km below the Earth’s surface and at temperatures as low as 200oC. Remember that subducting plates also descend into the upper mantle below stable cratons.
Diamonds At The SurfaceKimberlite rock at the surface does not necessarily contain diamonds; however, exploring for this type of rock is a good fi rst step. Kimberlite is rare on the Earth’s surface and can vary considerably in terms of mineral chemistry and texture. Kimberlites are sometimes discovered because they are so different from the surrounding bedrock (i.e. host or country rock). More often indicator minerals that form in similar temperatures and pressures are used to detect potential kimberlite pipes and their prizes – DIAMONDS. These indicator minerals include: garnet; olivine; ilmenite; diopside; and chrome pyrope. Of these, garnet is most often used. The G 10 garnet containing low CaO (Calcium Oxide) and high Cr2O3 (Chromium Oxide) is most often associated with diamond-bearing kimberlites.According to the rock cycle, all surface rocks are
subjected to weathering, erosion and deposition. Therefore, it can be concluded that kimberlite can be weathered, and its comprising indicator minerals and potentially diamonds eroded and later deposited by a variety of alluvial (fl uvial) and glacial processes. It is signifi cant to note though that alluvial diamond deposits are relatively rare despite being the fi rst to be discovered by humans. In fact, alluvial diamonds deposits continue to be very important today. In relation to glacial processes, one must fi rst remember that Canada is a northern country that was once covered by large moving glaciers. Such glaciers have the power to weather and to widely disperse indicator minerals as well as some diamonds. When seeking to locate the source of diamonds (i.e. kimberlite pipes), geologists must track backwards along the direction of glacial advance.
Exploring For Sources Of Diamonds
Geophysical exploration methods are those that measure how physical properties of the ground change from area to area. Examples of such properties include: density; conductivity; gravity; radioactivity; resistivity; and magnetic fi eld. These methods and/or surveys could be ground-based or airborne.
Figure 4: Airborne geophysical survey showing a kimberlite pipe. Courtesy: Diavik Diamond Mines Inc.
188 EARTH SYSTEMS 3209 INTERIM CURRICULUM GUIDE
APPENDIX A
In Canada, and particularly in the Northwest Territories, the kimberlites located within the stable craton are diffi cult to fi nd. One characteristic of kimberlites in this area that aids exploration is that they tend to erode faster than the surrounding bedrock (i.e. host or country rock). As a result, they tend to form circular depressions (i.e. lows), which often form round lakes. In geophysical surveys, these circular features (i.e. kimberlite pipes) appear as round targets, or bull’s-eyes, in a regional pattern of more smoothly varying contours.
Diamond Properties
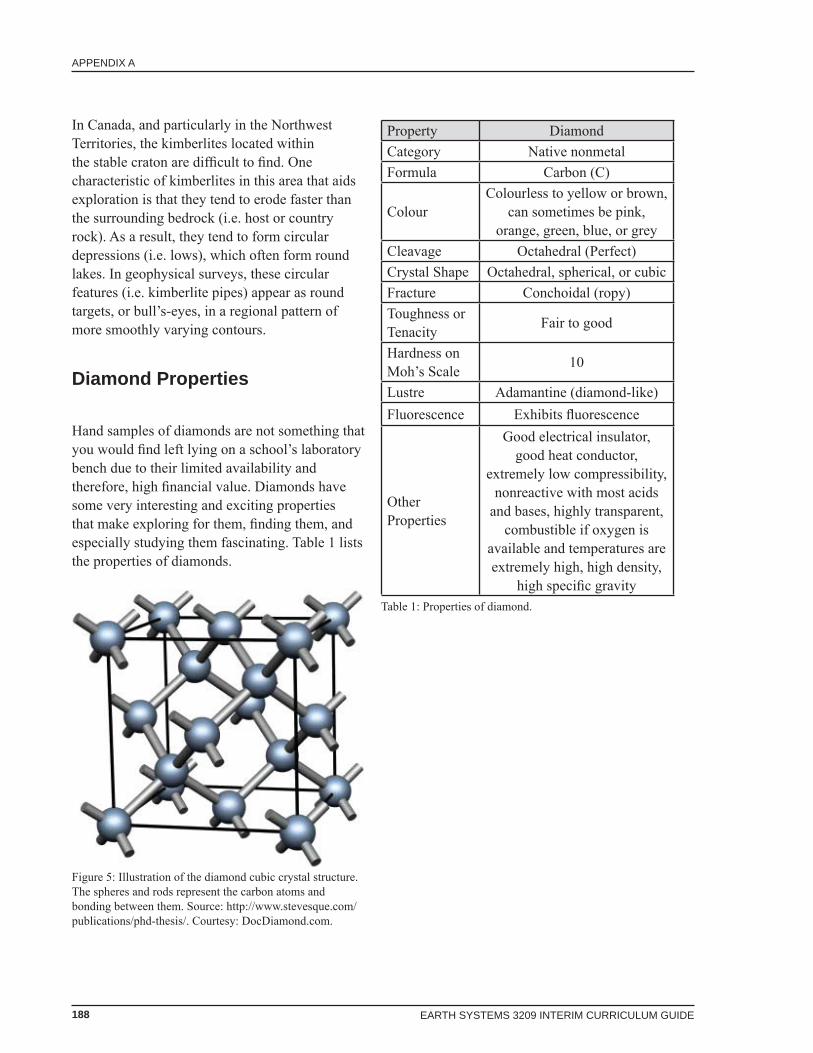
Hand samples of diamonds are not something that you would fi nd left lying on a school’s laboratory bench due to their limited availability and therefore, high fi nancial value. Diamonds have some very interesting and exciting properties that make exploring for them, fi nding them, and especially studying them fascinating. Table 1 lists the properties of diamonds.
Property DiamondCategory Native nonmetalFormula Carbon (C)
ColourColourless to yellow or brown,
can sometimes be pink, orange, green, blue, or grey
Cleavage Octahedral (Perfect)Crystal Shape Octahedral, spherical, or cubicFracture Conchoidal (ropy)Toughness or Tenacity Fair to good
Hardness on Moh’s Scale 10
Lustre Adamantine (diamond-like)Fluorescence Exhibits fl uorescence
Other Properties
Good electrical insulator, good heat conductor,
extremely low compressibility, nonreactive with most acids
and bases, highly transparent, combustible if oxygen is
available and temperatures are extremely high, high density,
high specifi c gravityTable 1: Properties of diamond.
Figure 5: Illustration of the diamond cubic crystal structure. The spheres and rods represent the carbon atoms and bonding between them. Source: http://www.stevesque.com/publications/phd-thesis/. Courtesy: DocDiamond.com.

189
APPENDIX A
EARTH SYSTEMS 3209 INTERIM CURRICULUM GUIDE
Figure 6: High quality gem diamonds. Courtesy:Diavik Diamond Mines.
Questions
1. What possible igneous textures could the rock kimberlite exhibit given the location of crystal formation and cooling rate?
2. Determine the weight of the 3106 carat Cullinan Diamond in grams [1 carat = 0.2 grams].
3. Could diamonds be discovered along mid-ocean ridges (e.g. Mid-Atlantic Ridge), located along divergent plate boundaries? Explain.
4. At which location would you expect to discover a kimberlite pipe? Explain your reasoning.
A: the middle of the landmass of Australia B: the middle of the Pacifi c Ocean5. Pretend you are a prospector with the
Government of Newfoundland and Labrador and your job is to fi nd diamonds in northern Labrador. Briefl y describe two techniques or methods that you could use (or follow) to fi nd them.
6. Predict the colour of the rock kimberlite to be based on its described composition.
7. List three indicator minerals and explain why they are given the term “indicator”.
8. Of all the properties of the mineral diamond, why should geologists not focus on colour?
9. How do geologists describe diamonds’ extremely low compressibility?
10. Explain how graphite (extremely soft carbon) could be formed instead of diamond (extremely hard carbon)?
Research Question1. If you were to enter a jewelry store for the
purpose of buying a polished diamond ring, which four criteria could be used to determine its value?
References
http://whaton.uwaterloo.ca/f04_diamonds.htmlhttp://www.northerninkltd.nt.ca/http://www.pdac.ca/miningmatters/educators/secondary-kits.aspx#Grades_10_–_12

190 EARTH SYSTEMS 3209 INTERIM CURRICULUM GUIDE
APPENDIX A

191
APPENDIX A
EARTH SYSTEMS 3209 INTERIM CURRICULUM GUIDE
Outcomes:1. use appropriate evidence to describe the geologic history of an area (330-12)2. describe the geology of the island of Newfoundland3. analyse evidence for plate tectonics theory. (332-8)4. describe the evidence which supports plate tectonics theory5. describe examples of Canadian contributions to science and technology (117-10)6. analyse examples of Canadian contributions to science (117-11)7. explain how scientifi c knowledge evolves as new evidence comes to light and as laws and theories are
tested and subsequently restricted, revised or replaced (115-7)8. identify new questions or problems that arise from what is learned (214-17)
The Geology of the Island of Newfoundland
Introduction
If you take a trip across the island of Newfoundland you will go from one ancient continent to another and have crossed an entire ocean in between. This may seem impossible, however it is true geologically. As you drive west across the Avalon Peninsula you are passing rock outcrops that were once part of an old African continent called Avalonia. Between Clarenville and Gander you cross the Dover Fault and leave this ancient continent behind. As you continue west you will encounter rocks that were formed in an ancient ocean called Iapetus. Just past the Baie Verte Junction you leave this zone and fi nd yourself on the edge of an old North American continent. The rocks exposed here formed on a continental margin about 500 million years ago. With your drive across the island of Newfoundland complete, you have indeed crossed an ocean and travelled from one ancient continent to another.
New Evidence for Plate Tectonics
In the 1960s, a Canadian geologist named J. Tuzo Wilson was becoming more and more convinced that the ideas of Wegener and others were indeed correct. Evidence continued to point to opening and closing oceans, sea fl oor spreading and continental collisions. At that time a young Newfoundland geologist joined him in this thinking. Harold (Hank) Williams brought Wilson to the island of Newfoundland, where plenty of rocks are exposed at shorelines, river valleys and inland. Here these scientists along with many others spent their summers studying the rocks and trying to see how the island of Newfoundland could fi t into this ‘new’ model called plate tectonics. Based on their observations, they were able to group rocks into three zones according to their origin, age and degree of deformation. These zones are called the Avalon Platform, Central Mobile Belt, and Western Platform.
192 EARTH SYSTEMS 3209 INTERIM CURRICULUM GUIDE
APPENDIX A
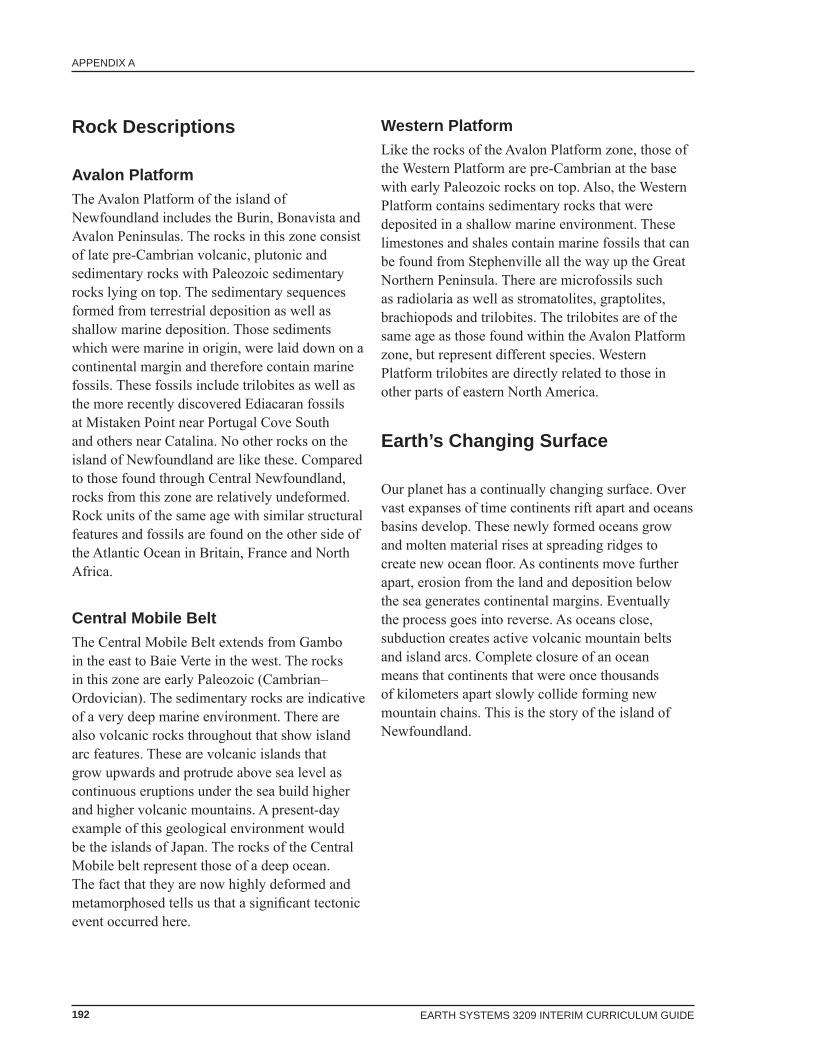
Rock Descriptions
Avalon PlatformThe Avalon Platform of the island of Newfoundland includes the Burin, Bonavista and Avalon Peninsulas. The rocks in this zone consist of late pre-Cambrian volcanic, plutonic and sedimentary rocks with Paleozoic sedimentary rocks lying on top. The sedimentary sequences formed from terrestrial deposition as well as shallow marine deposition. Those sediments which were marine in origin, were laid down on a continental margin and therefore contain marine fossils. These fossils include trilobites as well as the more recently discovered Ediacaran fossils at Mistaken Point near Portugal Cove South and others near Catalina. No other rocks on the island of Newfoundland are like these. Compared to those found through Central Newfoundland, rocks from this zone are relatively undeformed. Rock units of the same age with similar structural features and fossils are found on the other side of the Atlantic Ocean in Britain, France and North Africa.
Central Mobile BeltThe Central Mobile Belt extends from Gambo in the east to Baie Verte in the west. The rocks in this zone are early Paleozoic (Cambrian–Ordovician). The sedimentary rocks are indicative of a very deep marine environment. There are also volcanic rocks throughout that show island arc features. These are volcanic islands that grow upwards and protrude above sea level as continuous eruptions under the sea build higher and higher volcanic mountains. A present-day example of this geological environment would be the islands of Japan. The rocks of the Central Mobile belt represent those of a deep ocean. The fact that they are now highly deformed and metamorphosed tells us that a signifi cant tectonic event occurred here.
Western PlatformLike the rocks of the Avalon Platform zone, those of the Western Platform are pre-Cambrian at the base with early Paleozoic rocks on top. Also, the Western Platform contains sedimentary rocks that were deposited in a shallow marine environment. These limestones and shales contain marine fossils that can be found from Stephenville all the way up the Great Northern Peninsula. There are microfossils such as radiolaria as well as stromatolites, graptolites, brachiopods and trilobites. The trilobites are of the same age as those found within the Avalon Platform zone, but represent different species. Western Platform trilobites are directly related to those in other parts of eastern North America.
Earth’s Changing Surface
Our planet has a continually changing surface. Over vast expanses of time continents rift apart and oceans basins develop. These newly formed oceans grow and molten material rises at spreading ridges to create new ocean fl oor. As continents move further apart, erosion from the land and deposition below the sea generates continental margins. Eventually the process goes into reverse. As oceans close, subduction creates active volcanic mountain belts and island arcs. Complete closure of an ocean means that continents that were once thousands of kilometers apart slowly collide forming new mountain chains. This is the story of the island of Newfoundland.
193
APPENDIX A
EARTH SYSTEMS 3209 INTERIM CURRICULUM GUIDE
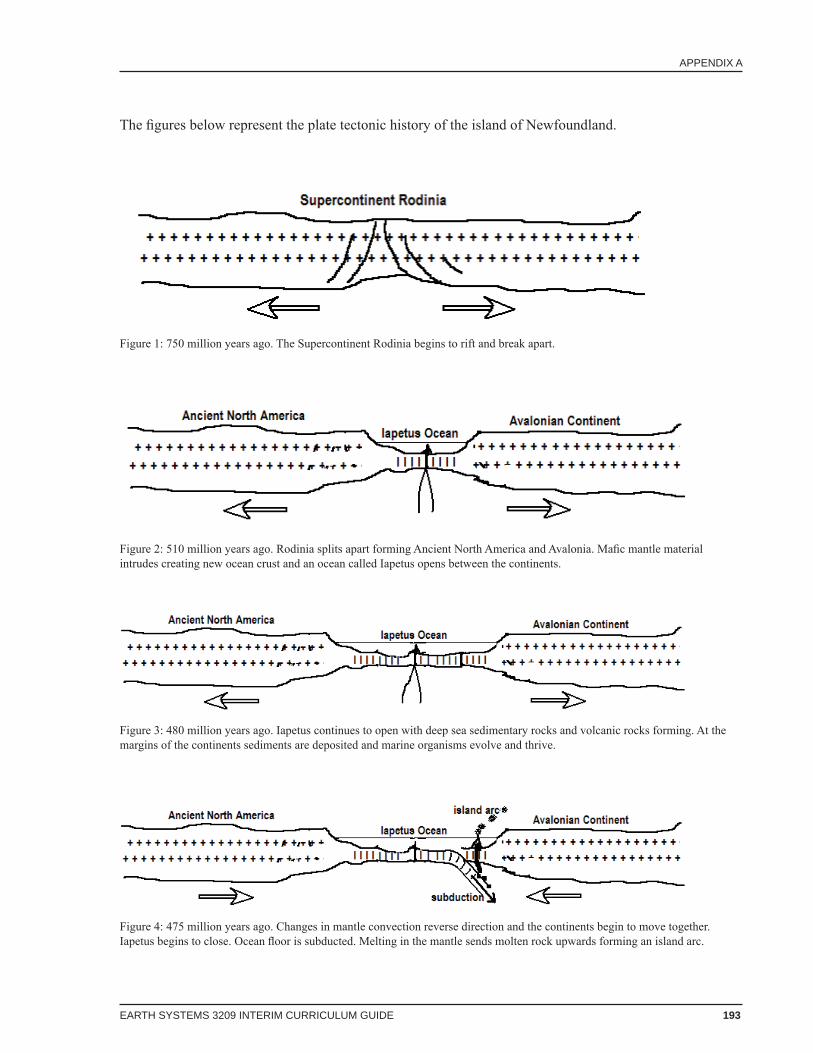
The fi gures below represent the plate tectonic history of the island of Newfoundland.
Figure 1: 750 million years ago. The Supercontinent Rodinia begins to rift and break apart.
Figure 2: 510 million years ago. Rodinia splits apart forming Ancient North America and Avalonia. Mafi c mantle material intrudes creating new ocean crust and an ocean called Iapetus opens between the continents.
Figure 3: 480 million years ago. Iapetus continues to open with deep sea sedimentary rocks and volcanic rocks forming. At the margins of the continents sediments are deposited and marine organisms evolve and thrive.
Figure 4: 475 million years ago. Changes in mantle convection reverse direction and the continents begin to move together. Iapetus begins to close. Ocean fl oor is subducted. Melting in the mantle sends molten rock upwards forming an island arc.
194 EARTH SYSTEMS 3209 INTERIM CURRICULUM GUIDE
APPENDIX A
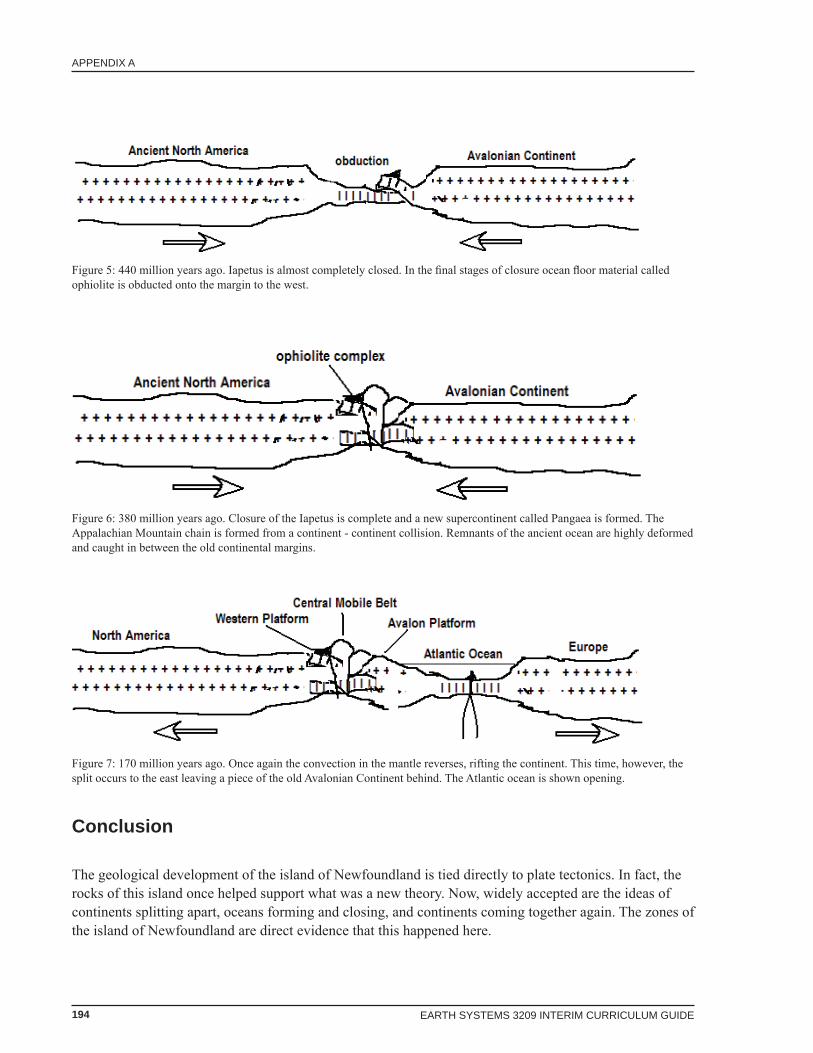
Figure 5: 440 million years ago. Iapetus is almost completely closed. In the fi nal stages of closure ocean fl oor material called ophiolite is obducted onto the margin to the west.
Figure 6: 380 million years ago. Closure of the Iapetus is complete and a new supercontinent called Pangaea is formed. The Appalachian Mountain chain is formed from a continent - continent collision. Remnants of the ancient ocean are highly deformed and caught in between the old continental margins.
Figure 7: 170 million years ago. Once again the convection in the mantle reverses, rifting the continent. This time, however, the split occurs to the east leaving a piece of the old Avalonian Continent behind. The Atlantic ocean is shown opening.
Conclusion
The geological development of the island of Newfoundland is tied directly to plate tectonics. In fact, the rocks of this island once helped support what was a new theory. Now, widely accepted are the ideas of continents splitting apart, oceans forming and closing, and continents coming together again. The zones of the island of Newfoundland are direct evidence that this happened here.
195
APPENDIX A
EARTH SYSTEMS 3209 INTERIM CURRICULUM GUIDE
Questions
1. In what type of environment did the Avalon Platform rocks develop?
2. How are the rocks found on the Western Platform similar to those of the Avalon Platform? What makes them different?
3. Give two ways that the rocks in the Central Mobile Belt are different from those in the other two zones.
4. i) When did the supercontinent Rodinia rift and break apart?
ii) For how many million years did Iapetus open?
iii) What mountain chain formed once Iapetus completely closed?
iv) What supercontinent formed with the closure of Iapetus?
References
Cawood, P., Barnes, C., & Botsford, J. (1998). Field Excursion Guide Book. Vth International Symposium on the Ordovician System. St. John’s: Memorial University.Hodych, J. P. (1989). Rocks and Time - geological overview of the Island of Newfoundland. Newfoundland Journal of Geological Education , 1-16.King, A. (1989). Geological evolution of the Avalon Peninsula, Newfoundland. Newfoundland Journal of Geological Education , 17-32.Knight, I. (1989). The ancient tropical continental shelf of western Newfoundland. Newfoundland Journal of Geological Education , 63-76.Scotese, C. (2003, February 02). Paleomap Project. Retrieved February 10, 2011, from http://www.scotese.comWicander, R. a. (1993). Historical Geology. St. Paul: West Publishing Company.
Extension Activity
Follow the steps below to create a geological map of the island of Newfoundland.
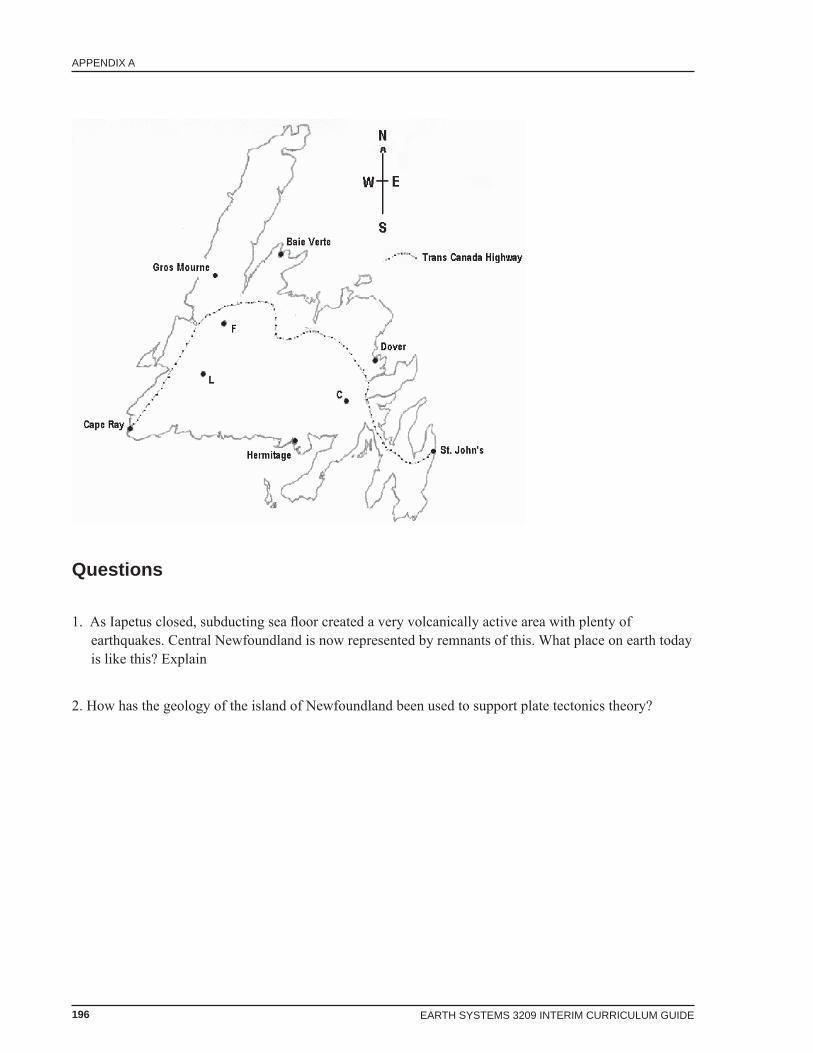
i) Draw a line from Dover through point C to Hermitage. Label this line the Hermitage - Dover Fault and label the area to the east the Avalon Platform.
ii) Draw a line from Baie Verte through points F and L to Cape Ray. Label this line the Cape Ray – Baie Verte Line Fault. Label the area to the west the Western Platform.
iii) Label the area between the fault lines the Central Mobile Belt.iv) Label Gros Morne as the site of an ophiolite complex.
196 EARTH SYSTEMS 3209 INTERIM CURRICULUM GUIDE
APPENDIX A
Questions
1. As Iapetus closed, subducting sea fl oor created a very volcanically active area with plenty of earthquakes. Central Newfoundland is now represented by remnants of this. What place on earth today is like this? Explain
2. How has the geology of the island of Newfoundland been used to support plate tectonics theory?
197
APPENDIX A
EARTH SYSTEMS 3209 INTERIM CURRICULUM GUIDE
Well Logging
Outcomes:1. analyse and describe examples where scientifi c understanding was enhanced or revised as a result of
the invention of technology (116-2)2. interpret patterns and trends in data, and infer of calculate linear and non-linear relationships among
variables (214-5)3. explain how data support or refute the hypothesis or prediction (214-12)4. synthesize information from multiple sources or from complex and lengthy texts and make inferences
based on this information (215-3)5. describe the processes and techniques involved in developing an Earth resource, from exploration to
extraction to refi ning (330-10)
Introduction
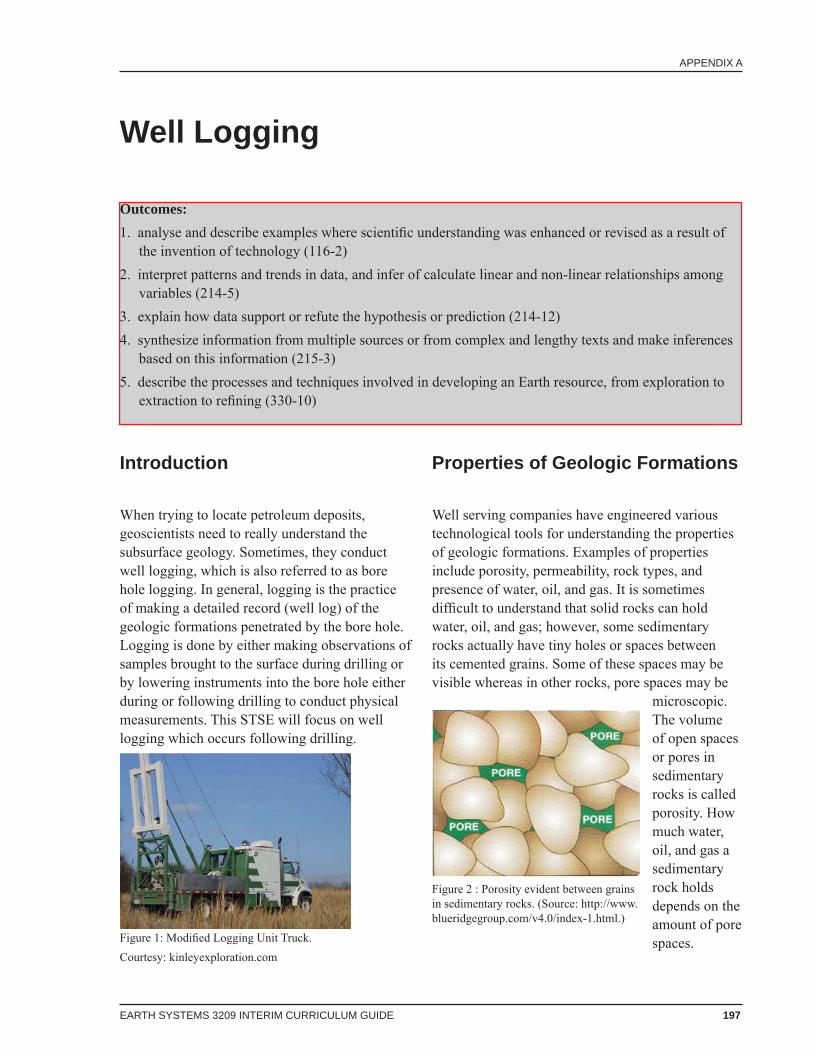
When trying to locate petroleum deposits, geoscientists need to really understand the subsurface geology. Sometimes, they conduct well logging, which is also referred to as bore hole logging. In general, logging is the practice of making a detailed record (well log) of the geologic formations penetrated by the bore hole. Logging is done by either making observations of samples brought to the surface during drilling or by lowering instruments into the bore hole either during or following drilling to conduct physical measurements. This STSE will focus on well logging which occurs following drilling.
Properties of Geologic Formations
Well serving companies have engineered various technological tools for understanding the properties of geologic formations. Examples of properties include porosity, permeability, rock types, and presence of water, oil, and gas. It is sometimes diffi cult to understand that solid rocks can hold water, oil, and gas; however, some sedimentary rocks actually have tiny holes or spaces between its cemented grains. Some of these spaces may be visible whereas in other rocks, pore spaces may be
microscopic. The volume of open spaces or pores in sedimentary rocks is called porosity. How much water, oil, and gas a sedimentary rock holds depends on the amount of pore spaces.
Figure 2 : Porosity evident between grains in sedimentary rocks. (Source: http://www.blueridgegroup.com/v4.0/index-1.html.)
Figure 1: Modifi ed Logging Unit Truck.Courtesy: kinleyexploration.com

198 EARTH SYSTEMS 3209 INTERIM CURRICULUM GUIDE
APPENDIX A
It is one thing to have water, oil, and gas stored in sedimentary rocks, but these fl uids have to be able to move. This requires the pore spaces in the sedimentary rocks to be connected and large enough to allow fl ow. Permeability of a material is its ability to transmit fl uids
Some sedimentary rocks have much greater porosity and permeability than others. It is important to realize that the existence and fl ow of water, oil, and gas in rocks depends on the properties of porosity and permeability. The clastic sedimentary rock sandstone and the chemical sedimentary rock limestone comprise the major known worldwide oil and gas reserves. Rocks that store large quantities of oil and gas are referred to as reservoir rocks. For water, oil, and gas to be found in large quantities in reservoir rocks, it must be effectively trapped by cap rocks, which are characterized by low permeability. It is important to realize that cap rocks can have low or high porosity. For example, the clastic sedimentary rock shale is commonly porous but because of the fi ne grain size, fl ow in the rock is restricted (i.e. impermeable).
Well Logging
There are a variety of techniques that well servicing companies use to evaluate bore hole geology. The technique used is dependent on the type of information desired. The following table lists examples of formation evaluation techniques and their applications.
Figure 3: Permeability evident as a result of pore spaces being connected. (Source: www.blueridgegroup.com/v4.0/index-1.html)
Formation Evaluation Technique Application
natural gamma rays radioactivitynormal resistivity porosity
magnetic susceptibility water-bearing zonessingle point resistance
(SPR)fracture zone identifi cation
induced polarization (IP) cavity dimension measurement
neutron porosity density porosity
Natural Gamma Ray LogsNatural gamma ray logging directly relates to rock type and density, which is indirectly related to the properties of porosity and permeability. Rock types are determined based on the amount of electromagnetic radiation (i.e. gamma rays) in the rock types and the amount of light emissions acquired. Three possible sources of electromagnetic radiation are potassium-40, uranium-235, and uranium-238. These radioactive elements are located in rock types such as sand and clay. It is probably obvious that sand is the sediment name for the sedimentary rock sandstone; however, it may not be as obvious that clay is the sediment name for the sedimentary rock shale. The light emissions result from crystals (e.g. thallium-doped sodium iodide) that react with the radioactive elements (i.e. gamma rays) and are dropped down the drilled well on a wire-line. Light emissions are displayed as counts per second (CPS) versus depth on a graph. Clay shows high counts per second, whereas sand shows low counts per second. It is crucial to realize that clay, which forms shale, could serve as cap rock, whereas sand could serve as a reservoir rock. If the light emission CPS is around 60 to 90, then it is more than likely clay, whereas if it is around 20 to 45, then it is more than likely sand. The actual calibrated tool used by well serving companies provides a read out in API units (American Petroleum Unit) based on the natural amount of electromagnetic radiation (i.e. gamma rays) and therefore, counts per second (CPS).
199
APPENDIX A
EARTH SYSTEMS 3209 INTERIM CURRICULUM GUIDE
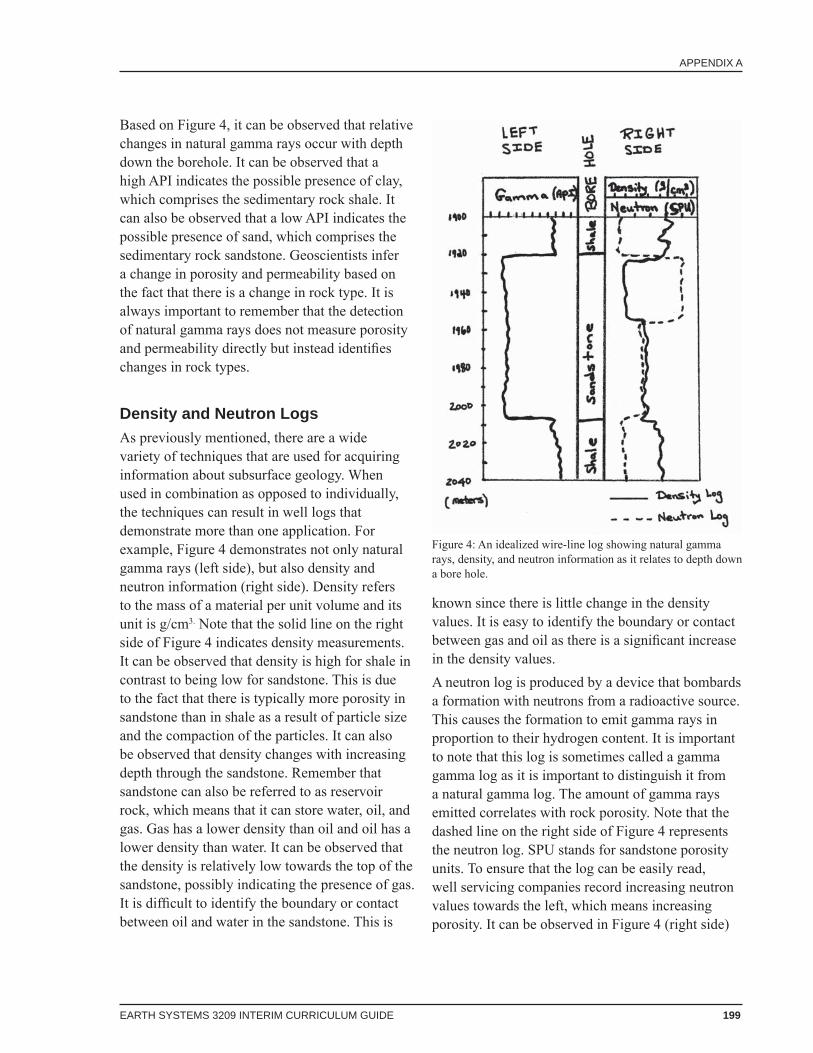
Based on Figure 4, it can be observed that relative changes in natural gamma rays occur with depth down the borehole. It can be observed that a high API indicates the possible presence of clay, which comprises the sedimentary rock shale. It can also be observed that a low API indicates the possible presence of sand, which comprises the sedimentary rock sandstone. Geoscientists infer a change in porosity and permeability based on the fact that there is a change in rock type. It is always important to remember that the detection of natural gamma rays does not measure porosity and permeability directly but instead identifi es changes in rock types.
Density and Neutron LogsAs previously mentioned, there are a wide variety of techniques that are used for acquiring information about subsurface geology. When used in combination as opposed to individually, the techniques can result in well logs that demonstrate more than one application. For example, Figure 4 demonstrates not only natural gamma rays (left side), but also density and neutron information (right side). Density refers to the mass of a material per unit volume and its unit is g/cm3. Note that the solid line on the right side of Figure 4 indicates density measurements. It can be observed that density is high for shale in contrast to being low for sandstone. This is due to the fact that there is typically more porosity in sandstone than in shale as a result of particle size and the compaction of the particles. It can also be observed that density changes with increasing depth through the sandstone. Remember that sandstone can also be referred to as reservoir rock, which means that it can store water, oil, and gas. Gas has a lower density than oil and oil has a lower density than water. It can be observed that the density is relatively low towards the top of the sandstone, possibly indicating the presence of gas. It is diffi cult to identify the boundary or contact between oil and water in the sandstone. This is
known since there is little change in the density values. It is easy to identify the boundary or contact between gas and oil as there is a signifi cant increase in the density values.A neutron log is produced by a device that bombards a formation with neutrons from a radioactive source. This causes the formation to emit gamma rays in proportion to their hydrogen content. It is important to note that this log is sometimes called a gamma gamma log as it is important to distinguish it from a natural gamma log. The amount of gamma rays emitted correlates with rock porosity. Note that the dashed line on the right side of Figure 4 represents the neutron log. SPU stands for sandstone porosity units. To ensure that the log can be easily read, well servicing companies record increasing neutron values towards the left, which means increasing porosity. It can be observed in Figure 4 (right side)
Figure 4: An idealized wire-line log showing natural gamma rays, density, and neutron information as it relates to depth down a bore hole.
200 EARTH SYSTEMS 3209 INTERIM CURRICULUM GUIDE
APPENDIX A
that porosity is higher for shale than it is for sandstone. This is alarming! Should the porosity in sandstone not be higher than the porosity in shale? What you are observing may be incorrect as it is very common for shale to contain bonded water, which contains hydrogen, in the small pore spaces in shale. The neutron log is extremely sensitive to hydrogen content. It can also be observed that the hydrogen content of oil and water are equal whereas, the hydrogen content of gas is higher than both oil and water. This causes an opposite effect on the neutron log. You can observe in Figure 4 (right side) that there is gas present towards the top of the sandstone since the hydrogen content is high and the neutron log value is low. Also note the large separation between the neutron and density logs for the gas zone. You cannot distinguish between oil and water in the sandstone since there is little change in the neutron log values with increasing depth. As well, there is little separation between the neutron and density logs for both oil and water.
Questions
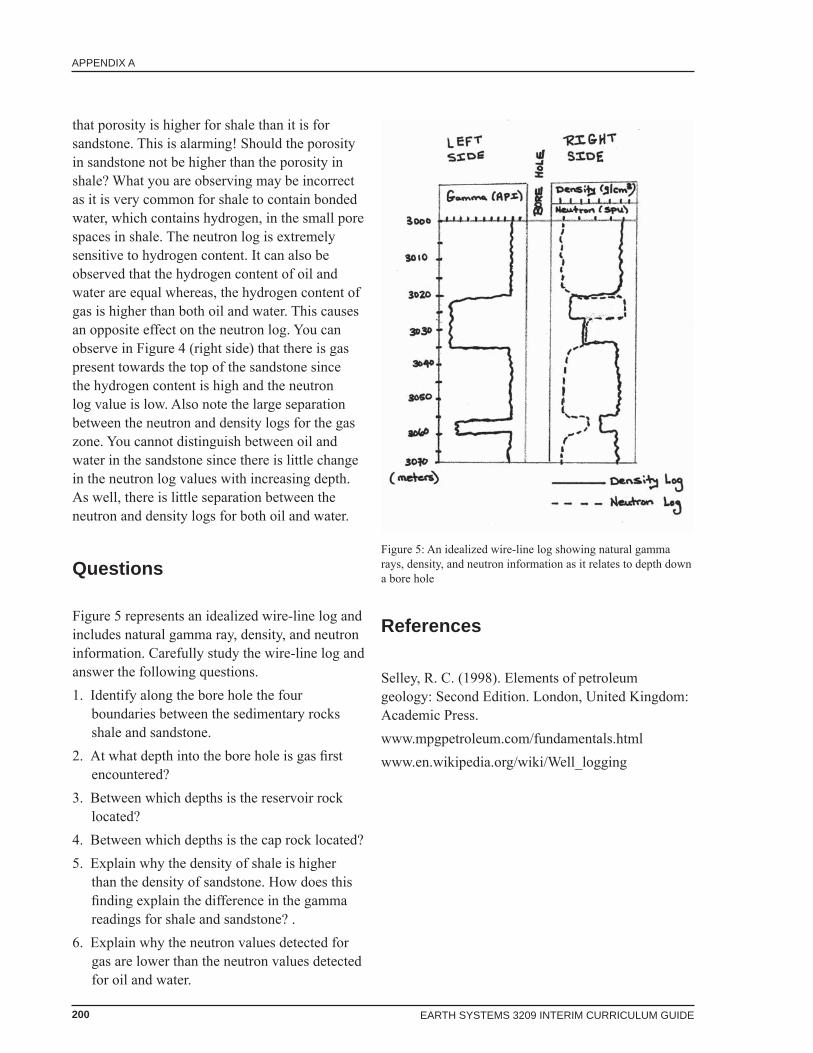
Figure 5 represents an idealized wire-line log and includes natural gamma ray, density, and neutron information. Carefully study the wire-line log and answer the following questions. 1. Identify along the bore hole the four
boundaries between the sedimentary rocks shale and sandstone.
2. At what depth into the bore hole is gas fi rst encountered?
3. Between which depths is the reservoir rock located?
4. Between which depths is the cap rock located? 5. Explain why the density of shale is higher
than the density of sandstone. How does this fi nding explain the difference in the gamma readings for shale and sandstone? .
6. Explain why the neutron values detected for gas are lower than the neutron values detected for oil and water.
References
Selley, R. C. (1998). Elements of petroleum geology: Second Edition. London, United Kingdom: Academic Press.www.mpgpetroleum.com/fundamentals.htmlwww.en.wikipedia.org/wiki/Well_logging
Figure 5: An idealized wire-line log showing natural gamma rays, density, and neutron information as it relates to depth down a bore hole

201
APPENDIX A
EARTH SYSTEMS 3209 INTERIM CURRICULUM GUIDE
Figure 6: An idealized wire-line log showing natural gamma rays, density, and neutron information as it relates to depth down a bore hole
Answer Key
Questions
1. See Figure 62. See Figure 63. See Figure 64. See Figure 65. It can be observed that density is high for shale in contrast to being low for sandstone due to the fact
that there is typically more porosity in sandstone than in shale as a result of particle size and the compaction of the particles..
6. The neutron log is extremely sensitive to hydrogen content. The hydrogen content of oil and water are relatively equal whereas, the hydrogen content of gas is higher than both oil and water, thereby making the neutron log value lower than for oil and water. Remember the opposite effect in terms of hydrogen content and neutron log values.

202 EARTH SYSTEMS 3209 INTERIM CURRICULUM GUIDE
APPENDIX A


