35
143 Appendix A: Supplementary Materials for Chapter 3 * * This appendix is available as supplementary material for the published manuscript in Current Biology in 2011.

143
Appendix A: Supplementary Materials for Chapter 3*
*This appendix is available as supplementary material for the published manuscript in Current Biology in 2011.
144
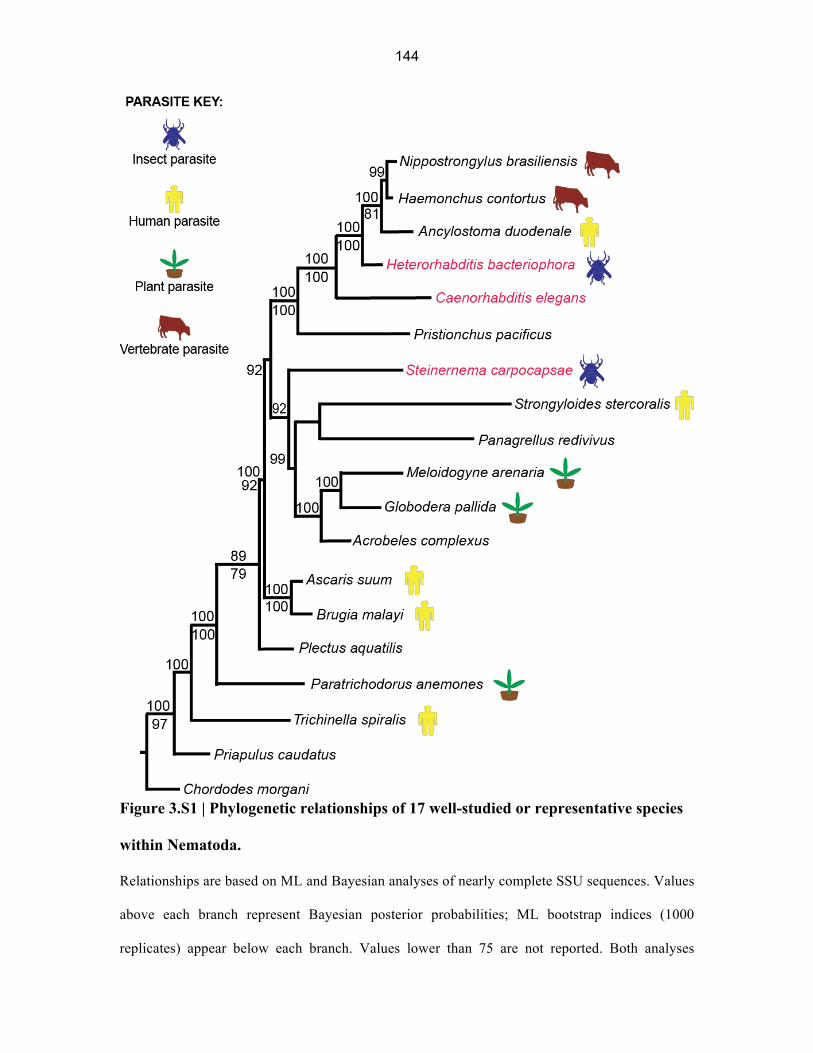
Figure 3.S1 | Phylogenetic relationships of 17 well-studied or representative species
within Nematoda.
Relationships are based on ML and Bayesian analyses of nearly complete SSU sequences. Values
above each branch represent Bayesian posterior probabilities; ML bootstrap indices (1000
replicates) appear below each branch. Values lower than 75 are not reported. Both analyses

145
produced concordant tree topologies. The ecologies of parasitic taxa are represented by colored
icons. Priapulus (a priapulid) and Chordodes (a nematomorph) were defined as outgroups.
Figure 3.S2 | CO2 response across species. A. The CO2 chemotaxis assay. Nematodes are

146
placed in the center of the plate, and allowed to distribute in the CO2 gradient. The number of
worms in each scoring region is then counted. Inner boundaries of scoring regions are indicated
by the horizontal lines. The chemotaxis index (C.I.) is calculated as indicated (bottom). B. The
odor-evoked jumping assay. Individual or populations of nematodes are placed on a piece of filter
paper inside a Petri dish. A non-beveled syringe with an attached needle is brought to within 2
mm of an individual nematode that is standing, and a small puff of stimulus is delivered. The
percentage of animals that jump within 8 sec. is scored. A jumping index (J.I.) is then calculated
as indicated (right) such that the J.I. is normalized to a scale of -1 to +1. The orange box shows an
enlarged view of the standing IJ and stimulus syringe. C–D. H. bacteriophora and S.
carpocapsae IJs are attracted to CO2 across concentrations. n = 6–12 trials. E. CO2 also
stimulates jumping in S. carpocapsae IJs at concentrations as low as 0.08%. The atmospheric
concentration of CO2 (0.04%) is indicated by the dashed line. Saturation was achieved at 0.1%
CO2; CO2 concentrations of 0.1% to 15% evoked similar levels of jumping (data not shown). The
jumping index was calculated as described in Figure S2B. n = 3–7 trials; for each trial, ~ 60
individual IJs were tested. F. C. elegans dauers are attracted to CO2. n = 5–10 trials. For C–F, *,
P < 0.05; **, P < 0.01, one-way ANOVA with Dunnett’s post-test. G. Identification of BAG
neurons in H. bacteriophora and S. carpocapsae. Nomarski images of the left side of a C. elegans
larva and parasitic IJs. Arrowheads indicate left BAG neurons. Anterior is to the left; dorsal is up.
In C. elegans as well as the parasites, BAG neuron cell bodies are located laterally within the
body just anterior to the nerve ring. H. BAG neurons are required for acute CO2 avoidance in the
necromenic nematode Pristionchus pacificus. The acute assay for CO2 avoidance was performed
as previously described [1]. The avoidance index was calculated as a.i. = (fraction of worms that
reversed in response to CO2)—(fraction of worms that reversed in response to air control). n =
17–19 worms for each treatment. **, P < 0.01, Fisher’s exact test. For all graphs, error bars
represent SEM. We note that for all experiments, assay chambers were open to the external
147
environment; thus the same ambient level of CO2 (~ 0.04%) was present in all experiments.
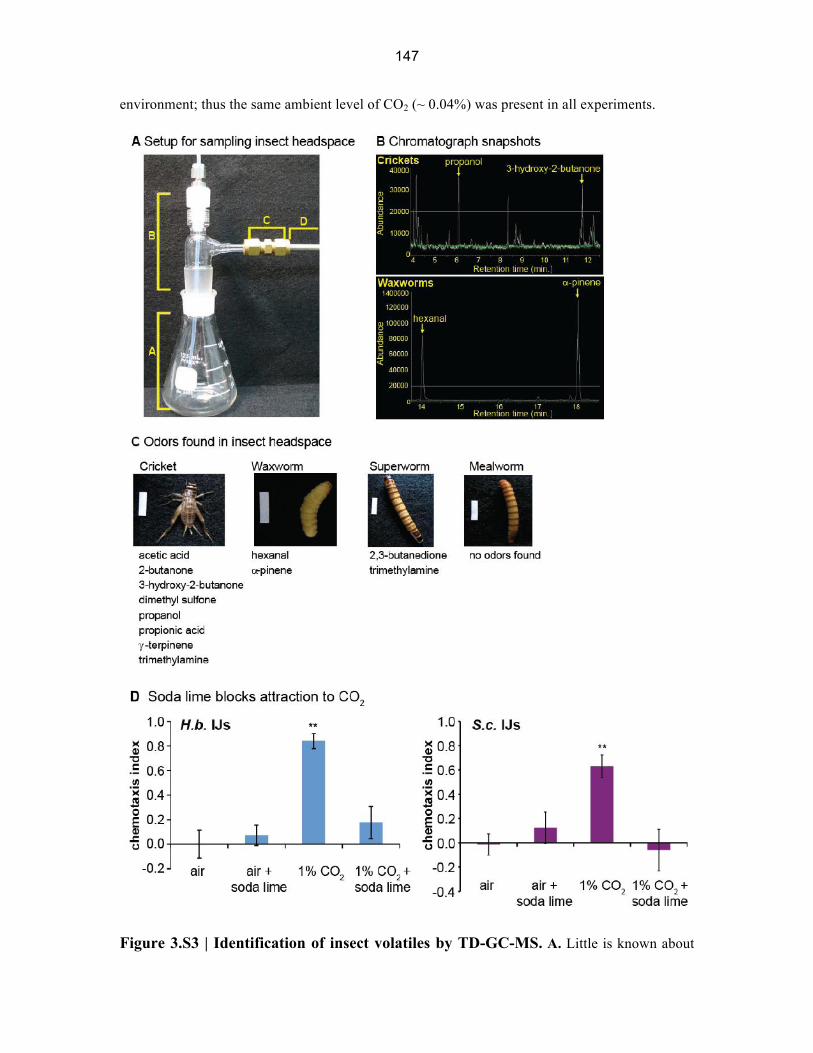
Figure 3.S3 | Identification of insect volatiles by TD-GC-MS. A. Little is known about

148
the odorants emitted by insect larvae. We therefore performed TD-GC-MS to identify odorants
emitted by three species of insect larvae (Galleria mellonella, Zophobas morio, and Tenebrio
molitor), as well as young adult crickets (Acheta domesticus). A. The unit used to sample insect
headspace. (A) is a 125 ml glass Erlenmeyer flask. (B) is a hand-blown glass adaptor with a
ground glass attachment fit into the flask, a Teflon top piece fit to accommodate a 1/8” O.D.
Teflon tube for air flow, and a small side neck tapered to 1/4” O.D. (C) is a 1/4” female/female
Swagelok compression fitting for the attachment of the thermal desorption tube to the flask,
where air and any volatiles flow out of the set-up. (D) is the thermal desorption tube. For each
species, six experimental replicates and three control replicates were obtained. The number of
insects sampled in each run, and the average population weights (± SEM), are as follows: A
domesticus: 50 insects, 8.64 g (± 0.15); G. mellonella: 100 insects, 28.89 g (± 2.79); Z. morio: 40
insects, 27.48 g (± 0.65); T. molitor: 50 insects, 17.0 g (± 0.61). Control samples did not contain
insects. B. Representative snapshots of the ion chromatograph data acquired from cricket (upper
trace) and waxworm (lower trace) headspace. White traces represent insect headspace samples
and green traces represent controls. Compounds identified in multiple traces at relative
abundances of > 20,000, and that were not present in the controls at detectable levels, were then
positively identified. Compounds meeting these criteria are indicated with yellow arrows. C.
Compounds identified from the four insect species tested. Scale bars in insect photographs are 1
cm x 2.5 mm. D. A soda lime assay for examining the responses to host volatiles besides CO2.
The assay is a modified version of the host chemotaxis assay in which the airstream containing
host volatiles is passed through a column of soda lime before entering the assay plate. As a
control, here we show that for both H. bacteriophora IJs (left graph) and S. carpocapsae IJs (right
graph), soda lime alone does not elicit a behavioral response and passing an airstream containing
1% CO2 through a column of soda lime eliminates the attractive response to CO2. Thus, a soda
lime column can be used to chemically remove CO2 from an airstream. n = 8–16 trials. **, P <
0.01, one-way ANOVA with Dunnett’s post-test.
149

150
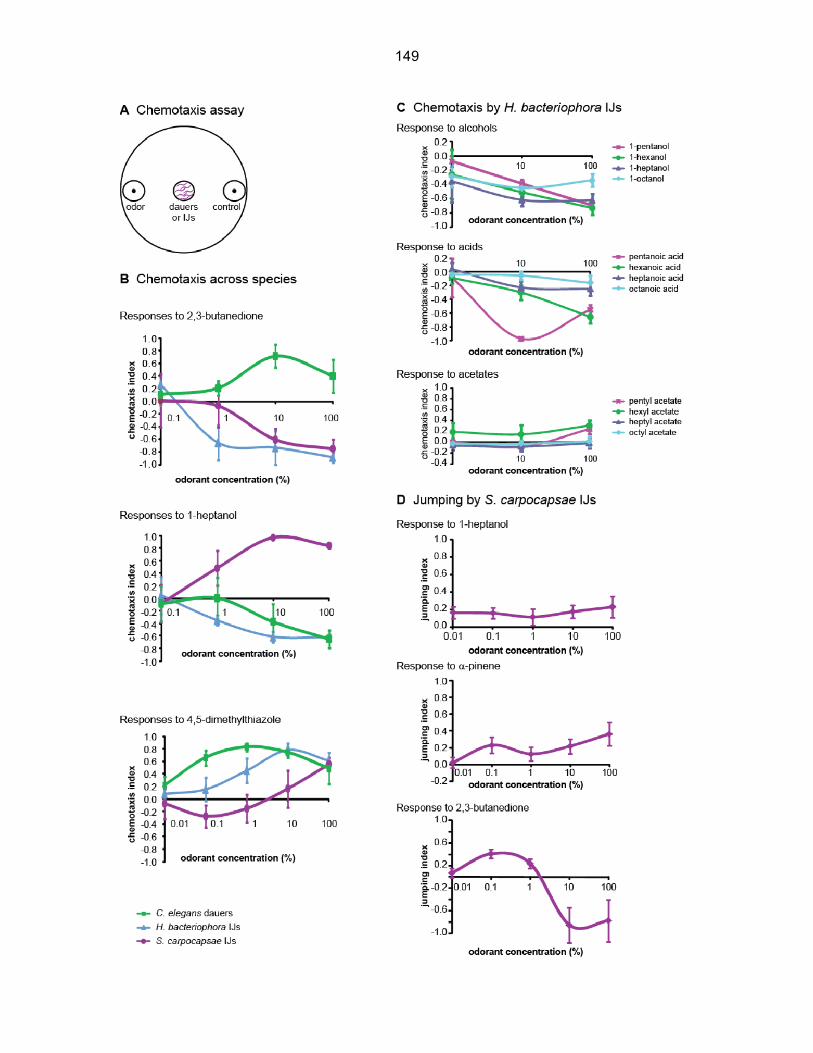
Figure 3.S4 | Dose-response analysis across species. A. A schematic of the chemotaxis
assay. Nematodes are placed in the center of the plate, and allowed to distribute in the odor
gradient. After three hours, the number of worms in each scoring region is counted. Scoring
regions are indicated by the circles at either side of the plate. The chemotaxis index (C.I.) is then
calculated as indicated (bottom). B. Responses to increasing concentrations of 2,3-butanedione,
1-heptanol, and 4,5-dimethylthiazole in a chemotaxis assay. n = 5–33 trials. C. Responses of H.
bacteriophora to alcohols, acids, and acids. n = 5–33 trials. Error bars represent SEM. Responses
to 1-heptanol are from B. D. Jumping responses of S. carpocapsae to increasing concentrations of
1-heptanol, a-pinene, and 2,3-butanedione in a jumping assay. n = 3–8 trials; for each trial, ~ 60
individual IJs were tested. For all graphs, error bars represent SEM.
Table 3.S1 | Odorants tested in chemotaxis and jumping assays. Odorants were selected
based on their chemical diversity and ecological relevance. All of the odorants tested are present
either in plants or bacteria [2–5], and many have been shown to elicit responses from free-living
adult nematodes [6–9]. Eleven of the odorants were identified in insect headspace (Figure 2.S7).
In addition, hexadecanoic and octadecanoic acid have been identified in larval cuticular extracts
from insect larvae [10]; acetic, propionic, and pentanoic acids have been identified in cricket
excreta [11]; benzaldehyde and linalool have been identified in butterfly wing extracts [12]; and
nonanal, undecanal, and nonanol are emitted by adult wax moths [13, 14]. Product numbers are
from Sigma-Aldrich, except for ethanol (Pharmco-AAPER), ethyl acetate (Mallinckrodt
chemicals), and acetic acid (J.T. Baker).

151

152
Table 3.S1 | Mean values for the chemotaxis index (C.I.) and jumping index (J.I.) of each
species in response to each tested stimulus. The number of trials (n) is shown. SEM, standard
error of the mean. Odorants were selected based on their chemical diversity and ecological
relevance. All of the odorants tested are present either in plants or bacteria [2–5], and many have
been shown to elicit responses from free-living adult nematodes [6–9]. Eleven of the odorants
were identified in insect headspace (Figure 5). In addition, hexadecanoic and octadecanoic acid
have been identified in larval cuticular extracts from insect larvae [10]; acetic, propionic, and
pentanoic acids have been identified in cricket excreta [11]; benzaldehyde and linalool have been
identified in butterfly wing extracts [12]; and nonanal, undecanal, and nonanol are emitted by
adult wax moths [13, 14]. Product numbers are from Sigma-Aldrich, except for ethanol
(Pharmco-AAPER), ethyl acetate (Mallinckrodt chemicals), and acetic acid (J.T. Baker).
Supplemental Methods
Nematodes. H. bacteriophora were from the inbred strain M31e [15, 16], S. carpocapsae
were from the inbred strain ALL [17], and C. elegans were from the standard N2
(“Bristol”) strain, unless otherwise indicated. Other H. bacteriophora strains tested were
HP88 [18], GPS11 [19], NC1 [20], and a strain we designate as “BU” that was derived
from commercially available nematodes that were originally obtained from Becker-
Underwood (http://www.beckerunderwood.com). The other S. carpocapsae strain tested
was an inbred wild isolate that we designate as Base [17]. Other C. elegans strains tested
were the wild isolate CB4856 (“Hawaii”) and CX11697 [kyIs536[flp-17::p17::s12GFP,
elt-2::mCherry]; kyIs538[glb-5::p12::s12GFP, elt-2::mCherry]], which contains a
genetic ablation of the BAG neurons. P. pacificus were from the PS312 (“California”)
strain.
Nematode culture. H. bacteriophora was cultured at 27°C on either nutrient agar +
cholesterol plates (23 g nutrient agar + 1 ml of 5 mg/ml cholesterol in 1 L) or lipid agar +

153
cholesterol plates [21] seeded with either TT01 or RET16 bacteria. RET16 is a GFP-
labeled derivative of P. temperata strain NC1 mutated with HiMarGM (a hyperactive
mariner transposon with gentamicin resistance) [15]. Photorhabdus was grown in PP3
broth (20 g proteose peptone #3 (Difco) in 1 L dH20) and on either nutrient agar +
cholesterol plates or lipid agar + cholesterol plates. IJs were stored in 0.85% NaCl (w/v)
or dH20 at room temperature or 15°C prior to use. Prior to behavioral testing, IJs were
washed in dH20. For Figure 1A, H. bacteriophora was cultured on plates seeded with
GFP-labeled P. luminescens, as previously described [16].
S. carpocapsae was cultured as previously described [22]. Briefly, 5 last-instar Galleria
mellonella larvae (American Cricket Ranch, Lakeside, CA) were placed in a 5 cm Petri
dish with a 55 mm Whatman 1 filter paper acting as a pseudo-soil substrate in the bottom
of the dish. ≤ 250 µl containing 500–1000 IJs suspended in water was evenly distributed
on the filter paper. After 7–10 days the insect cadavers were placed on White traps [23].
Emerging IJs were harvested, washed for 10 minutes in 0.4% Hyamine 1622 solution
(Fluka), and rinsed 3 times with water. To prevent differences in inbreeding between
batches of IJs, the same stock population of IJs was used to generate all test batches of IJs.
Stock populations were stored at 15°C and propagated in G. mellonella every 10 days to
produce fresh test batches of IJs. Test batches were stored at room temperature and used
in behavioral assays within 12 days of emergence. In some cases, S. carpocapsae used
for chemotaxis assays were cultured at 27°C on nutrient agar + cholesterol or lipid agar +
cholesterol plates as described above, except that plates were seeded with X. nematophila
strain HGB081 [24]. For Figure 1B, S. carpocapsae were cultured on plates seeded with
GFP-labeled X. nematophila, as previously described [25]. X. nematophila was grown in
LB broth containing 0.1% sodium pyruvate, and on either nutrient agar + cholesterol or
lipid agar + cholesterol plates.
C. elegans was cultured on NGM plates seeded with E. coli OP50 according to standard
methods [26]. C. elegans dauers were grown primarily in liquid culture, although in some
cases dauers were collected from the lids of starved plates. For dauers grown in liquid
culture, embryos were collected as previously described and diluted to 10 eggs/ml in

154
S complete media [27]. E. coli HB101 bacteria was added at a final concentration of 0.5
mg/ml and worms were grown on a carousel at 20°C for 6 days to generate dauers (L.R.
Baugh and P.W. Sternberg, unpublished). If necessary, the bacterial concentration was
adjusted to generate populations of nearly 100% dauers. Dauers were stored in dH2O at
15°C prior to use. For CO2 assays, dauers were SDS-treated [28]; SDS treatment did not
affect CO2 response. For all other assays, dauers were not treated with SDS; in these
cases, a small population sample was treated with SDS, and worms were only used for
behavioral assays if nearly all of the sample population survived SDS treatment.
P. pacificus was grown on NGM plates seeded with E. coli OP50 bacteria at room
temperature.
Phylogenetic analysis. Small subunit ribosomal DNA (SSU rDNA) sequences for all
analyses were obtained from GenBank for all taxa included in the present study
(accession numbers: AJ920356, AJ920348, AJ417024, EU086375, AF036593,
AY268117, U81584, AF083007, AF279916, AF036604, AY284620, AY284621,
AY284671, U94367, AF036588, U61761, AF036600, U60231, EU344798, X87984, and
AF036639). Most of these sequences have been used in previous phylogenetic analyses
[29, 30]. The SSU sequences for C. elegans, S. carpocapsae, H. bacteriophora, and C.
morgani (a nematomorph) were used for the neighbor-joining (NJ) tree in Figure 4C. The
sequences were first trimmed to 1783 characters and then aligned using MUSCLE [31].
The subsequent NJ analysis was done using the ‘Dnadist’ and ‘Neighbor’ programs from
the PHYLIP 3.68 package [32] using default settings with C. morgani defined as the
outgroup. A total of 19 nematode species and 2 outgroup taxa (a priapulid and a
nematomorph) were used in the analyses for Figure S1. In order to facilitate comparison
of the SSU sequences of varying lengths, the ends were trimmed by hand, prior to
alignment, in MacClade 4 [33] to a maximum length of 1152 characters, which is the
length of the taxon with the shortest sequence, Parastrongyloides trichosuri. Sequences
were then aligned using MUSCLE [31], resulting in 1313 characters (including gaps).
The TIM2+I+G model was selected as the best-fit model of substitution for all analyses
using the AIC and AICc model selection criteria in the program jModelTest [34, 35].

155
Maximum likelihood and bootstrap (1000 replicates) analyses were carried out in PhyML
3.0 [35] using the parameters for base frequencies, substitution rate matrix, proportion of
invariable sites, number of substitution categories, and shape distribution parameter
determined as the best-fit by jModelTest (freqA = 0.2684, freqC = 0.1835, freqG =
0.2501, freqT = 0.2981, Ra(AC) = 1.6751, Rb(AG) = 2.5642, Rc(AT) = 1.6751, Rd(CG)
= 1.0000, Re(CT) = 4.5613, Rf(GT) = 1.0000, p-inv = 0.1710, and gamma shape =
0.5840). Bayesian analysis was carried out using MrBayes 3.1.2 [36]. The number of
substitution categories, substitution rate matrix, shape and proportion of invariant sites
were based on the parameters determined by jModelTest (as above). The parameters for
base frequencies and relative rates were allowed to vary throughout the analysis. The
parameters were unlinked to allow for more flexibility in searching tree space. Trees were
sampled every 1000 generations. The burn-in value was set to 2000 trees. The total
number of generations was set to 8 million. Four parallel chains (one cold and three
heated) were used. A majority-rule consensus tree was reconstructed after discarding the
burn-in.
Thermal desorption-gas chromatography-mass spectrometry (TD-GC-MS).
Appropriately staged insects (adult Acheta domesticus and last-instar larvae of Zophobas
morio, Galleria mellonella, and Tenebrio molitor) were placed in a 125 ml glass beaker
and sampled for 30 minutes with a stream of air (10% oxygen, 90% nitrogen) flowing
into the flask and out through a thermal desorption tube (Sigma-Aldrich 20913-U) at a
flow rate of approximately 104 ml/min. Experiments were done in pairs and replicated 3
times, with an empty control flask being run each time. To prevent carry-over of odors
between experiments, all tubing used was Nalgene Teflon tubing, connected with
Swagelok compression fittings, and flasks were cleaned and sterilized after each use.
The contents of the thermal desorption tubes were transferred to a HP 6890 GC–5973 MS
system (Agilent Technologies, US) with an Eclipse 4660 purge and trap sampler
equipped with an airtube desorber accessory (OI Analytical, College Station, TX,
US.). Tubes were desorbed at 200°C for 15 minutes and transferred via a flow of helium
to an internal trap held at room temperature. After desorption, the internal trap was heated

156
to 200°C. This trap was brought in line with the GC carrier gas flow as the trap reached
180°C. The trap was then taken offline and subjected to a bake-out procedure. The
sample flowed to a GC via a transfer line held at 120°C where it entered a split-splitless
injector held at 200°C. The injector was operated in split mode with a split ratio of 30:1,
and a 1 mm liner was installed to optimize chromatographic resolution. Separation was
achieved with a HP-624 capillary column (30 m x 0.320 mm) where a volumetric flow of
1 ml/min was maintained with electronic pressure control. The transfer line to the mass
spectrometer was held at 200°C, the ion source at 250°C and the quadrupole at 100°C.
The mass spectrometer is equipped with an electron impact source. Electron energy was
set to 70 eV to obtain the best possible library spectrum matches. The quadrupole mass
spectrometer was operated with a full width at half maximum of 0.65 m/z. Mass
calibration was verified weekly. The GC oven was ramped from 30°C to 260°C and run
for 42 minutes. Data was analyzed with both Chemstation and Masshunter software.
Mass spectra were searched against the Wiley library (275,000 spectra) of electron
impact mass spectra. Only compounds that were found in multiple traces (≥ 2), with a
relative abundance ≥ 20,000, and not present in the control traces were considered in this
study. Compounds identified in this way were then positively confirmed by running the
pure compound (Table S1) and comparing the retention time and mass spectra of the
assay-identified compound to the known compound. In cases where the retention time
was off by ≥ 0.5 minutes or the mass spectra did not match, the assay-identified
compound was considered uncertain and not used in behavioral assays. All insects tested
were obtained from commercial sources (American Cricket Ranch, Lakeside CA).
Data Analysis
Statistical analysis was performed using GraphPad InStat. Heat maps and dendrograms
were generated using PAST [37].
References
1. Hallem, E.A., and Sternberg, P.W. (2008). Acute carbon dioxide avoidance in Caenorhabditis elegans. Proc Natl Acad Sci U S A 105, 8038–8043.

157
2. TNO (2004). Volatile compounds in food: qualitative and quantitative data.
3. O'Leary W, M. (1962). The Fatty Acids of Bacteria. Bacteriol Rev 26, 421–447.
4. Malo, E.A., Medina-Hernandez, N., Virgen, A., Cruz-Lopez, L., and Rojas, J.C. (2002). Electroantennogram and field responses of Spodoptera frugiperda males (Lepidoptera: Noctuidae) to plant volatiles and sex pheromone. Folia Entomol. Mex. 41, 329–338.
5. Ali, J.G., Alborn, H.T., and Stelinski, L.L. (2010). Subterranean Herbivore-induced Volatiles Released by Citrus Roots upon Feeding by Diaprepes abbreviatus Recruit Entomopathogenic Nematodes. J. Chem. Ecol. 36, 361–368.
6. Bargmann, C.I., Hartwieg, E., and Horvitz, H.R. (1993). Odorant-selective genes and neurons mediate olfaction in C. elegans. Cell 74, 515–527.
7. Hong, R.L., and Sommer, R.J. (2006). Chemoattraction in Pristionchus nematodes and implications for insect recognition. Current biology: CB 16, 2359–2365.
8. Hong, R.L., Svatos, A., Herrmann, M., and Sommer, R.J. (2008). Species-specific recognition of beetle cues by the nematode Pristionchus maupasi. Evolution & development 10, 273–279.
9. Rasmann, S., Kollner, T.G., Degenhardt, J., Hiltpold, I., Toepfer, S., Kuhlmann, U., Gershenzon, J., and Turlings, T.C. (2005). Recruitment of entomopathogenic nematodes by insect-damaged maize roots. Nature 434, 732–737.
10. Golebiowski, M., Malinski, E., Bogus, M.I., Kumirska, J., and Stepnowski, P. (2008). The cuticular fatty acids of Calliphora vicina, Dendrolimus pini and Galleria mellonella larvae and their role in resistance to fungal infection. Insect Biochem Mol Biol 38, 619–627.
11. McFarlane, J.E., Steeves, E., and Alli, I. (1983). Aggregation of larvae of the house cricket, Acheta domesticus (L.), by propionic acid present in the excreta. J. Chem. Ecol. 9, 1307–1315.
12. Honda, K. (1980). Odor of a papilionid butterfly: odoriferous substances emitted by Atrophaneura alcinous alcinous (Lepidoptera: Papilionidae). J. Chem. Ecol. 6, 867–873.
13. Leyrer, R.L., and Monroe, R.E. (1973). Identification and isolation of the scent of the moth, Galleria mellonella, and a revaluation of its sex pheromone. J. Insect Physiol. 19, 2267–2271.
14. Romel, K.E., Scott-Dupree, C.D., and Carter, M.H. (1992). Qualitative and quantitative analyses of volatiles and pheromone gland extracts collected from Galleria mellonella (L.) (Lepidoptera: Pyralidae). J. Chem. Ecol. 18, 1255–1268.
158
15. Hallem, E.A., Rengarajan, M., Ciche, T.A., and Sternberg, P.W. (2007). Nematodes, bacteria, and flies: a tripartite model for nematode parasitism. Current biology: CB 17, 898–904.
16. Ciche, T.A., Kim, K.S., Kaufmann-Daszczuk, B., Nguyen, K.C., and Hall, D.H. (2008). Cell invasion and matricide during Photorhabdus luminescens transmission by Heterorhabditis bacteriophora nematodes. Applied and environmental microbiology 74, 2275–2287.
17. Bilgrami, A.L., Gauger, R., Shapiro-Ilan, D.I., and Adams, B.J. (2006). Source of trait deterioration in entomopathogenic nematodes Heterorhabditis bacteriophora and Steinernema carpocapsae during in vivo culture. Nematology 8, 397–409.
18. Poinar, G.O., Jr. (1990). Taxonomy and biology of Steinernematidae and Heterorhabditidae. In Entomopathogenic Nematodes in Biological Control, R. Gaugler and H.K. Kaya, eds. (Boca Raton: CRC Press), pp. 23–61.
19. Grewal, P.S., Grewal, S.K., Malik, V.S., and Klein, M.G. (2002). Differences in the susceptibility of introduced and native white grub species to entomopathogenic nematodes from various geographic localities. Biol. Contr. 24, 230–237.
20. Stock, S.P., and Kaya, H.K. (1996). A Multivariate Analysis of Morphometric Characters of Heterorhabditis Species (Nemata:Heterorhabditidae) and the Role of Morphometrics in the Taxonomy of Species of the Genus. J. Parasitol. 82, 806–813.
21. Vivas, E.I., and Goodrich-Blair, H. (2001). Xenorhabdus nematophilus as a model
for host-bacterium interactions: rpoS is necessary for mutualism with nematodes. J Bacteriol 183, 4687–4693.
22. Kaya, H.K., and Stock, S.P. (1997). Techniques in insect nematology. In Manual of techniques in insect pathology, L. Lacey, ed. (San Diego, CA: Academic Press Limited).
23. White, G.F. (1927). A Method for Obtaining Infective Nematode Larvae from Cultures. Science 66, 302–303.
24. Richards, G.R., Vivas, E.I., Andersen, A.W., Rivera-Santos, D., Gilmore, S., Suen, G., and Goodrich-Blair, H. (2009). Isolation and characterization of Xenorhabdus nematophila transposon insertion mutants defective in lipase activity against Tween. J Bacteriol 191, 5325–5331.
25. Martens, E.C., Heungens, K., and Goodrich-Blair, H. (2003). Early colonization events in the mutualistic association between Steinernema carpocapsae nematodes and Xenorhabdus nematophila bacteria. J Bacteriol 185, 3147–3154.
26. Brenner, S. (1974). The genetics of Caenorhabditis elegans. Genetics 77, 71–94.

159
27. Lewis, J.A., and Fleming, J.T. (1995). Basic culture methods. In Caenorhabditis elegans: Modern Biological Analysis of an Organism, Volume 48, H.F. Epstein and D.C. Shakes, eds. (San Diego: Academic Press), pp. 4–27.
28. Cassada, R.C., and Russell, R.L. (1975). The dauerlarva, a post-embryonic developmental variant of the nematode Caenorhabditis elegans. Dev Biol 46, 326–342.
29. Blaxter, M.L., De Ley, P., Garey, J.R., Liu, L.X., Scheldeman, P., Vierstraete, A., Vanfleteren, J.R., Mackey, L.Y., Dorris, M., Frisse, L.M., et al. (1998). A molecular evolutionary framework for the phylum Nematoda. Nature 392, 71–75.
30. Meldal, B.H., Debenham, N.J., De Ley, P., De Ley, I.T., Vanfleteren, J.R., Vierstraete, A.R., Bert, W., Borgonie, G., Moens, T., Tyler, P.A., et al. (2007). An improved molecular phylogeny of the Nematoda with special emphasis on marine taxa. Molecular phylogenetics and evolution 42, 622–636.
31. Edgar, R.C. (2004). MUSCLE: a multiple sequence alignment method with reduced time and space complexity. BMC Bioinformatics 5, 113.
32. Felsenstein, J. (1989). PHYLIP—Phylogeny Inference Package (Version 3.2). Cladistics 5, 164–166.
33. Maddison, W.P., and Maddison, D.R. (1989). Interactive analysis of phylogeny and character evolution using the computer program MacClade. Folia Primatol (Basel) 53, 190–202.
34. Posada, D. (2009). Selection of models of DNA evolution with jModelTest. Methods Mol Biol 537, 93–112.
35. Guindon, S., and Gascuel, O. (2003). A simple, fast, and accurate algorithm to estimate large phylogenies by maximum likelihood. Syst Biol 52, 696–704.
36. Huelsenbeck, J.P., and Ronquist, F. (2001). MRBAYES: Bayesian inference of phylogenetic trees. Bioinformatics 17, 754–755.
37. Hammer, Ø., Harper, D.A.T., and Ryan, P.D. (2001). PAST: Paleontological Statistics Software Package for Education and Data Analysis. Palaeontol Electronica 4, 9.
160
Appendix B: Supplementary Materials for Chapter 4*
*This appendix is available as supplementary material for the published manuscript in PNAS in 2012.

161
162
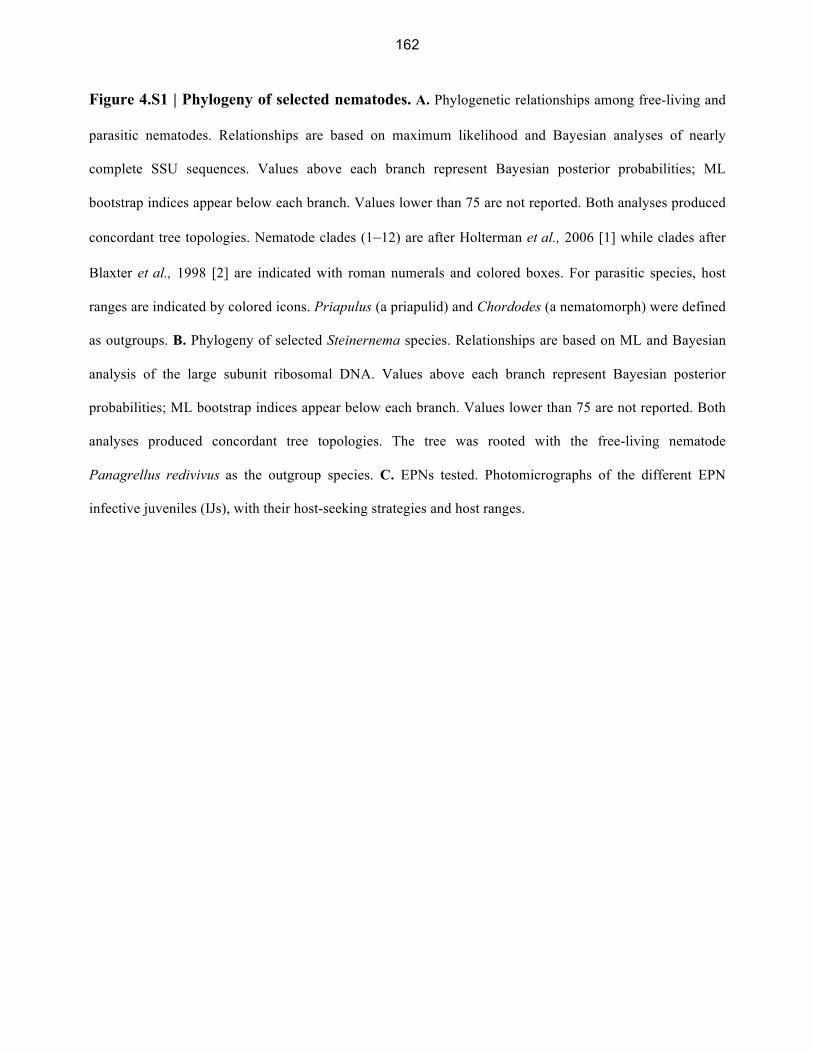
Figure 4.S1 | Phylogeny of selected nematodes. A. Phylogenetic relationships among free-living and
parasitic nematodes. Relationships are based on maximum likelihood and Bayesian analyses of nearly
complete SSU sequences. Values above each branch represent Bayesian posterior probabilities; ML
bootstrap indices appear below each branch. Values lower than 75 are not reported. Both analyses produced
concordant tree topologies. Nematode clades (1–12) are after Holterman et al., 2006 [1] while clades after
Blaxter et al., 1998 [2] are indicated with roman numerals and colored boxes. For parasitic species, host
ranges are indicated by colored icons. Priapulus (a priapulid) and Chordodes (a nematomorph) were defined
as outgroups. B. Phylogeny of selected Steinernema species. Relationships are based on ML and Bayesian
analysis of the large subunit ribosomal DNA. Values above each branch represent Bayesian posterior
probabilities; ML bootstrap indices appear below each branch. Values lower than 75 are not reported. Both
analyses produced concordant tree topologies. The tree was rooted with the free-living nematode
Panagrellus redivivus as the outgroup species. C. EPNs tested. Photomicrographs of the different EPN
infective juveniles (IJs), with their host-seeking strategies and host ranges.

163
Figure 4.S2 | Sampling site from which the majority of potential hosts were collected. A.
Diagram of the sampling site at Caltech. B. Photograph of the same sampling site. The sampling site is the
small, shady grass plot visible in the foreground. Earwigs, pillbugs, and slugs were collected from the upper
layers of moist soil in the vicinity of a leaky sprinkler. Flatheaded borers were collected from inside the
wood of nearby rose bushes.

164
Figure 4.S3 | Preference of S. carpocapsae IJs for mole cricket odor vs. CO2. A. Responses of S.
carpocapsae IJs to volatiles from an individual mole cricket and to different concentrations of CO2 in a
chemotaxis assay. Data are from Figs. 4.1B and 4.3A. B. Responses of S. carpocapsae IJs to volatiles
from an individual mole cricket vs. different concentrations of CO2 in a competition chemotaxis assay. A
positive C.I. indicates attraction to CO2; a negative C.I. indicates attraction to mole cricket odor. n = 3–9
trials for each condition. The response to mole cricket odor when tested against an air control was not
significantly different from the response to mole cricket odor when tested against 1% CO2 (unpaired t test).
The response to 1% CO2 when tested against an air control was significantly different from the response to
1% CO2 when tested against mole cricket odor (***, P < 0.001); however, responses to 2.5% CO2 and 5%

165
CO2 when tested against an air control vs. mole cricket odor were not significantly different (two-factor
repeated measures ANOVA).
Figure 4.S4 | Identification of host-derived odorants by GC-MS. A. A representative trace
showing SPME-GC-MS data obtained from live house crickets. B. A representative trace showing
TD-GC-MS data obtained from live mole crickets. For both graphs, the x-axis indicates the relative
abundance in control air, and the y-axis indicates relative abundance in host air. Odorants found

166
exclusively in host air are indicated in blue, odorants found exclusively in control air are indicated
in red, and odorants found in both host air and control air are indicated in green. Of the odorants
found exclusively in host air, only those identified in multiple experimental replicates at a relative
abundance of ≥ 20,000 and with a library match of ≥ 95% confidence are labeled, with the
exception of p-dichlorobenzene from house crickets, which was identified with a library match of ~
90%.

167
Figure 4.S5 | Dose-response analysis for selected host-derived odorants. A. Chemotaxis

168
behavior across concentrations. n = 4–8 trials for each EPN-odorant combination. B. Jumping
behavior across concentrations. n = 2 trials for each EPN-odorant combination.
Materials and Methods
Nematodes. H. bacteriophora were from the inbred strain M31e [3–5]. S. carpocapsae were
from the inbred strain ALL [4, 6, 7]. C. elegans were the wild isolate CB4856 (“Hawaii”). O.
carolinensis were the YEW strain [8]. S. glaseri were from the inbred NC strain [9]. S.
scapterisci were inbred from the FL strain [10]. S. riobrave were inbred from the TX strain [11].
Nematode culturing. All nematodes were cultured as previously described [4]. Briefly, 5 last
instar Galleria mellonella larvae (American Cricket Ranch, Lakeside, CA) were placed in a 5 cm
Petri dish with a 55 mm Whatman 1 filter paper acting as a pseudo-soil substrate in the bottom of
the dish. ≤ 250 ml containing 500–1000 IJs suspended in water was evenly distributed on the filter
paper. After 7–10 days the insect cadavers were placed on White traps [12]. Steinernema glaseri
was placed onto a modified White trap containing plaster of Paris as previously described [13].
Emerging IJs were harvested and rinsed 3 times with water. S. scapterisci was also cultured
by infecting house crickets and mole crickets using similar techniques. IJs were stored at either
room temperature or 15°C and tested within 2 months of emergence. C. elegans was cultured
on NGM plates seeded with E. coli OP50 according to standard methods [14], and dauer larvae
were collected from the lids of plates from which the nematodes had exhausted their bacterial food
supply (i.e., “starved plates”).
Nematode phylogeny. Small subunit ribosomal DNA (SSU rDNA) sequences for the large
phylogenetic analysis were obtained from GenBank for all taxa included in the present study
(accession numbers: AJ920356, EU086375, AF036593, AY268117, U81584, AF083007,
169
AF279916, AF036604, AY284620, AY284621, AY284671, U94367, AF036588, U61761,
AF036600, U60231, EU344798, X87984, AF036589, AF519234, AJ920348, FJ547240, AJ417024,
U81581, and AF036639). A total of 23 nematode species and 2 outgroup taxa (a priapulid and a
nematomorph) were used in the analyses for Figure 4.S1A. Sequences were aligned using ProAlign
[15] with 1500 Mb of memory allotted, bandwidth set to 1500 with HMM model parameters being
estimated from the data. We excluded characters aligned with posterior probability values under
60%, resulting in 1330 aligned characters for subsequent analysis. The TIM2+I+G model was
selected as the best-fit model of substitution for all analyses using the AIC and BIC model
selection criteria in the program jModelTest [16, 17]. Maximum likelihood and bootstrap (1000
replicates) analyses were carried out in PhyML 3.0 [18] using the parameters for base frequencies,
substitution rate matrix, proportion of invariable sites, number of substitution categories, and shape
distribution parameter determined as the best-fit by jModelTest (freqA = 0.2618, freqC = 0.1850,
freqG = 0.2443, freqT = 0.3089, Ra(AC) = 1.4966, Rb(AG) = 2.4339, Rc(AT) = 1.4966, Rd(CG) =
1.0000, Re(CT) = 3.7721, Rf(GT) = 1.0000, p-inv = 0.1150, and gamma shape = 0.5290). Bayesian
analysis was carried out using MrBayes 3.1.2 [19]. The number of substitution categories and
shape was based on the parameters determined by jModelTest (as above). The parameters for base
frequencies, relative rates, substitution rate matrix, and proportion of invariant sites were
allowed to vary throughout the analysis. The parameters (shape, statefreq, and revmat) were
unlinked to allow for more flexibility in searching tree space. Trees were sampled every 1000
generations. The burn-in value was set to 2000 trees. The total number of generations was set to
8 million. Four parallel chains (one cold and three heated) were used. A majority-rule consensus
tree was reconstructed after discarding the burn-in.
For the four Steinernema species phylogeny (Figure 4.S1B), large subunit ribosomal DNA (LSU
rDNA) sequences were obtained from GenBank (AF331908, AF331898, AF331893, AF331900,
170
and DQ145647). Sequences were aligned using ProAlign [15] with 1050 Mb of memory allotted,
bandwidth set to 1000 with HMM model parameters being estimated from the data. We excluded
characters aligned with posterior probability values under 60%, resulting in 883 aligned characters
for subsequent analysis. The TIM3+G model was selected as the best-fit model of substitution for
all analyses using both the AIC and BIC model selection criteria in the program jModelTest [16,
17]. Maximum likelihood and bootstrap (1000 replicates) analyses were carried out in PhyML
3.0 [18] using the parameters for substitution rate matrix, proportion of invariable sites, number of
substitution categories, and shape distribution parameter determined as the best-fit by jModelTest
(Ra(AC) = 0.3610, Rb(AG) = 1.1251, Rc(AT) = 1.0, Rd(CG) = 0.3610, Re(CT) = 3.9194,
Rf(GT) = 1.0000, gamma shape = 0.5.650). Base frequencies were estimated empirically and the p-
invar parameter was optimized from the data. Bayesian analysis was carried out using MrBayes
3.1.2 [19]. The number of substitution categories was based on the parameters determined by
jModelTest (as above). Other parameters, such as base frequency, relative rates, substitution rate
matrix, and proportion of invariant sites were allowed to vary throughout the analysis. The
parameters (shape, statefreq, and revmat) were unlinked to allow for more flexibility in searching
tree space. Trees were sampled every 1000 generations. The burn-in value was set to 2000 trees.
The total number of generations was set to 8 million. Four parallel chains (one cold and three
heated) were used. A majority-rule consensus tree was reconstructed after discarding the burn-in.
Collection of potential hosts. Mole crickets, earwigs, flatheaded borers, pillbugs, and slugs were
collected from their natural habitats in the greater Los Angeles area and tested within a few
weeks of collection. The majority of the earwigs, flatheaded borers, pillbugs, and slugs were
collected from the campus of the California Institute of Technology (Figure 4.S2). Mole crickets
were collected from the Rio Hondo golf course in Downey, California. Waxworms and house
crickets were purchased commercially from either American Cricket Ranch or Petco®. For

171
potential hosts collected from natural habitats, species identities were confirmed by analysis of
18S ribosomal DNA sequence, knowledge of habitat distributions in Southern California, and
analysis of diagnostic external morphological features.
Chemotaxis assays. Host, CO2, and odorant chemotaxis assays were performed as previously
described [4]. Briefly, assays were performed on standard chemotaxis assay plates [20]. Scoring
regions consisted of 2 cm diameter circles on each side of the plate along the diameter, with the
center of the circle 1 cm from the edge of the plate. For host chemotaxis assays, live hosts (1
animal in the case of mole crickets, and 4–6 animals for all other hosts) were placed into a 50
ml gastight syringe, and a control syringe was filled with room air. Syringes were depressed at a
rate of 0.5 ml/min using a syringe pump. Host air was delivered to one side of the assay plate
and room air was delivered to the other side of the assay plate through holes drilled into the plate
lids directly above the center of the scoring regions. For CO2 chemotaxis assays, gastight
syringes were instead filled with either a certified CO2 mixture containing the test concentration
of CO2, 10% O2, and the balance N2, or a control air mixture containing 10% O2 and 90% N2. For
odorant chemotaxis assays, 1 ml of 1 M sodium azide was placed in the center of each scoring
region as an anesthetic. 5 ml of odorant was then placed in the center of one scoring region, while
5 ml of a control (either paraffin oil, dH2O, or ethanol) was placed in the center of the other scoring
region. For all assays, ~ 2 ml of worm pellet containing ~ 50–150 nematodes was then placed in
the center of the assay plate. Assay plates were left undisturbed on a vibration-reducing platform
and scored after either 1 hour (for host and CO2 chemotaxis assays) or 3 hours (for odorant
assays). If at least 3 worms moved into the scoring regions, a chemotaxis index was then
calculated as C.I. = (# worms at CO2 - # worms at air)/(# worms at CO2 + # worms at air). For
the soda lime host chemotaxis assay, gas mixtures were passed through a 6 inch column

172
containing 2–5 mm soda lime pellets (Sigma-Aldrich 72073) before entering the assay plate, as
previously described [4]. Solid odorants were dissolved as follows: 3-hydroxy-2-butanone and
dimethyl sulfone, 1 g in 4 ml dH2O; 4-methylphenol and p-dichlorobenzene, 0.1 g in 5 ml paraffin
oil; and p-benzoquinone, 0.1 g in 5 ml ethanol.
For the mixture assay shown in Figure 4.7A, the control assay (left bar) had 5 ml of an odorant mix
containing 10-1 dilutions of p-dichlorobenzene, hexanal, and γ-terpinene on one side of the
chemotaxis plate and 5 ml of paraffin oil control on the other side. The experimental assay (right
bar) had 5 ml of odorant mix containing 10-1 dilutions of p-dichlorobenzene, hexanal, and
γ-terpinene on one side of the chemotaxis plate and 5 ml of odorant mix containing 10-1 dilutions
of p-dichlorobenzene, hexanal, γ-terpinene, and 3-hydroxy-2-butanone on the other side. The soil
assay shown in Figure 4.7B used a modified version of the CO2 and host chemotaxis assays. For
the control assay (left bar), one syringe contained 3 g of soil (collected from the sampling site
shown in Figure 4.S2) and the other syringe contained air. For the experimental assay (right bar),
one syringe contained 3 g of soil + 5 ml paraffin oil on a small piece of filter paper and the other
syringe contained 3 g of soil + 5 ml of 4-methylphenol (dissolved as described above) on a small
piece of filter paper.
Jumping assay. Jumping assays were performed as previously described [4]. Briefly, 100 IJs
suspended in 200 ml water were evenly distributed onto a 55 mm Whatman 1 filter paper on the
bottom of a 5 cm Petri dish. For host jumping assays, a single live host was placed into a 10 ml
gastight syringe and a control syringe was filled with room air. For CO2 jumping assays,
syringes were filled with either a certified CO2 mixture or air control as described above. For
odorant jumping assays, a small piece of filter paper containing 5 ml of undiluted odorant was
placed inside the syringe. The needle from the syringe was inserted through a 1.25 mm hole in the

173
side of the dish such that the tip of the needle was within ~ 2 mm of a standing IJ. A small puff
of air from the syringe (~ 0.5 ml volume) was then administered directly at the IJ, and a
jumping response was scored if the IJ jumped within 8 s. ~ 20 IJs were tested from the same arena.
A normalized jumping index (J.I.) that ranged from -1 to +1 was then calculated. For stimuli that
evoked higher levels of jumping than the control, the J.I. and SEM were calculated as J.I. =
(fraction jumped to stimulus – fraction jumped to control)/(1 – fraction jumped to control)
and SEM = √[(SEM for stimulus)2 – (SEM for control)
2]/(1 – fraction jumped to control). For
stimuli that evoked lower levels of jumping than the control, the J.I. and SEM were calculated as
J.I. = (fraction jumped to stimulus – fraction jumped to control)/(fraction jumped to control) and
SEM = √[(SEM for stimulus)2 – (SEM for control)
2]/(fraction jumped to control). For soda lime
host jumping assays, the assay setup is as described above, but gas mixtures were passed through a
2 inch column of Nalgene (8050–0250) FTP 3/16” OD tubing containing 2–5 mm soda lime
pellets (Sigma-Aldrich 72073) before entering the assay arena. The column was held between 2
female-ended Swagelok compression fittings. To securely attach the column to the syringe and
needle, the Swagelok fittings were filled with a male (on the needle end) and female (on the
syringe end) biomedical luer fitting.
Virulence assay. Individual hosts were placed into either 5 cm Petri dishes (all hosts except mole
crickets) or small glass baby food jars with an air hole drilled into the lid (mole crickets)
containing a 55 mm Whatman 1 filter paper at the bottom. 100 IJs suspended in 200 ml water were
then evenly distributed onto the filter paper. Hosts were exposed to IJs for 48 hours at room
temperature, and host survival was then scored by response to gentle prodding. To assay EPN
growth and reproduction in host cadavers, the cadavers were dissected at 5 days post-exposure and
scored for the presence of either adult EPNs only (growth but not reproduction) or adults and

174
young larvae (growth and reproduction). To assay emergence from host cadavers, cadavers were
placed onto standard White traps [12] at either 10 days post-exposure (all hosts except house
crickets) or 5 days post-exposure (house crickets) and scored for the presence of IJs in the trap at
20 days post-exposure. For potential hosts that desiccate easily (mole crickets, house crickets,
pillbugs, and slugs), 200 ml water was added to the filter paper each day to prevent desiccation.
Identification of host-derived odorants by TD-GC-MS and SPME-GC-MS. TD-GC-MS was
performed as previously described [4]. TD-GC-MS data for waxworms and house crickets was
from Hallem et al., 2011 [4]. Both the collection of volatile organic compounds (VOCs) and
subsequent solid phase microextraction (SPME) analysis were modified from Villaverde et al.,
2007 [21]. Briefly, VOCs were collected for SPME analysis by placing insects into 10 ml glass
vials, sealed with a Teflon septum (SUPLECO 27529). The larger and potentially cannibalistic
insects (mole crickets and house crickets) were placed individually into sampling vials whereas
all other, smaller species (waxworms, flat-headed borers, pillbugs, and earwigs) were sampled with
four individuals per sampling vial. Experiments were done in pairs and replicated 3 times, with
an empty control sampling vial being run each time. Clean, sterile vials were used each time.
After 12 hrs, volatiles secreted were sampled from the head space, corresponding to the gaseous
phase in contact with the insect sample. VOCs were sampled for 15 minutes using
carboxen/polydimethylsiloxane (CAR/PDMS) fiber (75 mm film thickness) (SUPELCO 504831).
Selection of fibers was based on manufacturer’s recommendations for sampling volatiles of low to
intermediate polarity and from data reported by Villaverde et al., 2007 [21]. Fibers were
preconditioned in accordance with the manufacturer’s instructions. Quantitative analysis was
performed using a Hewlett Packard 6890 GC–5973 MS gas chromatograph–mass spectrometer
(Agilent Technologies, US) employing a non-polar DB-5 capillary column (30m x 0.25mm, 0.25
micron film thickness) (Agilent). The injector was operated in the splitless mode at 250°C and
175
the oven temperature was programmed (40°C for 3 min, 5°C/min to 80°C, 20°C/min to 150°C, and
30°C/min to 250°C, with a holding time of 10 min at the final temperature). The transfer line
temperature was set at 280°C and the ion source was held at 250°C. VOC identification was
performed by CGC–MS analysis with an Eclipse 4660 purge and trap sampler with
chromatographic conditions similar to the CGC; the ion source was set at 200°C and the
transfer line at 275°C. VOC were tentatively identified by interpretation of their mass spectral
fragmentation. Data was analyzed with both Chemstation and Masshunter software. Mass spectra
were also compared to data from the Wiley library (275,000 spectra) of electron impact mass
spectra. Only compounds that were found in multiple traces (≥ 2) with a relative abundance ≥
20,000, were not present in the control traces, and had library matches of ≥ 95% were considered
in this study.
Data analysis. Statistical analysis was performed using either GraphPad InStat, GraphPad Prism,
or PAST [22]. Two-factor ANOVAs with Bonferroni post-tests were used to compare the
responses of the different EPNs to the different hosts or host-derived odorants. P values from the
ANOVAs (factor 1, factor 2, and the interaction between the factors) are given in the figure
legends; P values from the post-tests are given in the supplemental tables. For example, when
examining the responses of the different EPNs to the different hosts, we show that EPNs
respond differently to different hosts (P < 0.0001 for factor one), different hosts evoke different
overall responses from EPNs (P < 0.0001 for factor two), and different EPNs show different odor
response profiles (P < 0.0001 for the interaction). Heatmaps were generated using Heatmap Builder
[23].
Supplemental Data. The original published version of this work, Dillman et al. [24], has 14
supplemental data sets associated with it. Those data sets are available online
(http://www.pnas.org/content/109/35/E2324/suppl/DCSupplemental).
176
1. Holterman, M., van der Wurff, A., van den Elsen, S., van Megen, H., Bongers, T., Holovachov, O., Bakker, J., and Helder, J. (2006). Phylum-wide analysis of SSU rDNA reveals deep phylogenetic relationships among nematodes and accelerated evolution toward crown clades. Molecular Biology and Evolution 23, 1792–1800.
2. Blaxter, M.L., De Ley, P., Garey, J.R., Liu, L.X., Scheldeman, P., Vierstraete, A., Vanfleteren, J.R., Mackey, L.Y., Dorris, M., Frisse, L.M., et al. (1998). A molecular evolutionary framework for the phylum Nematoda. Nature 392, 71–75.
3. Ciche, T.A., Kim, K.S., Kaufmann-Daszczuk, B., Nguyen, K.C., and Hall, D.H. (2008). Cell invasion and matricide during Photorhabdus luminescens transmission by Heterorhabditis bacteriophora nematodes. Applied and environmental microbiology 74, 2275–2287.
4. Hallem, E.A., Dillman, A.R., Hong, A.V., Zhang, Y., Yano, J.M., DeMarco, S.F., and Sternberg, P.W. (2011). A sensory code for host seeking in parasitic nematodes. Current Biology 21, 377–383.
5. Hallem, E.A., Rengarajan, M., Ciche, T.A., and Sternberg, P.W. (2007). Nematodes, bacteria, and flies: a tripartite model for nematode parasitism. Current biology: CB 17, 898–904.
6. Bilgrami, A.L., Gauger, R., Shapiro-Ilan, D.I., and Adams, B.J. (2006). Source of trait deterioration in entomopathogenic nematodes Heterorhabditis bacteriophora and Steinernema carpocapsae during in vivo culture. . Nematology 8, 397–409.
7. Chaston, J.M., Dillman, A.R., Shapiro-Ilan, D.I., Bilgrami, A.L., Gaugler, R., Hopper, K.R., and Adams, B.J. (2011). Outcrossing and crossbreeding recovers deteriorated traits in laboratory cultured Steinernema carpocapsae nematodes. Int J Parasitol 41, 801–809.
8. Ye, W.M., Torres-Barragan, A., and Cardoza, Y.J. (2010). Oscheius carolinensis n. sp (Nematoda: Rhabditidae), a potential entomopathogenic nematode from vermicompost. Nematology 12, 121–135.
9. Li, X., Cowles, E.A., Cowles, R.S., Gaugler, R., and Cox-Foster, D.L. (2009). Characterization of immunosuppressive surface coat proteins from Steinernema glaseri that selectively kill blood cells in susceptible hosts. Molecular and biochemical parasitology 165, 162–169.
10. Nguyen, K.B., and Smart, G.C. (1991). Pathogenicity of Steinernema scapterisci to Selected Invertebrates. J. Nematol. 23, 7–11.
11. Canhilal, R., Reid, W., Kutuk, H., and El-Bouhssini, M. (2007). Susceptibility of Sunn Pest, Eurygaster integriceps Puton (Hemiptera: Scutelleridae), to Various Entomopathogenic Nematodes (Rhabditida: Steinernematidae and Heterorhabditidae). J Agr Urban Entomol 24, 19–26.
177
12. White, G.F. (1927). A Method for Obtaining Infective Nematode Larvae from Cultures. Science 66, 302–303.
13. Kaya, H.K., and Stock, S.P. (1997). Techniques in insect nematology. In Manual of techniques in insect pathology, L. Lacey, ed. (San Diego, CA: Academic Press Limited).
14. Brenner, S. (1974). The genetics of Caenorhabditis elegans. Genetics 77, 71–94.
15. Loytynoja, A., and Milinkovitch, M.C. (2003). A hidden Markov model for progressive multiple alignment. Bioinformatics 19, 1505–1513.
16. Guindon, S., and Gascuel, O. (2003). A simple, fast, and accurate algorithm to estimate large phylogenies by maximum likelihood. Syst Biol 52, 696–704.
17. Posada, D. (2009). Selection of models of DNA evolution with jModelTest. Methods Mol Biol 537, 93–112.
18. Guindon, S., Dufayard, J.F., Lefort, V., Anisimova, M., Hordijk, W., and Gascuel, O. (2010). New algorithms and methods to estimate maximum-likelihood phylogenies: Assessing the performance of PhyML 3.0. Systematic Biology 59, 307–321.
19. Huelsenbeck, J.P., and Ronquist, F. (2001). MRBAYES: Bayesian inference of phylogenetic trees. Bioinformatics 17, 754–755.
20. Bargmann, C.I., Hartwieg, E., and Horvitz, H.R. (1993). Odorant-selective genes and neurons mediate olfaction in C. elegans. Cell 74, 515–527.
21 Villaverde, M.L., Juarez, M.P., and Mijailovsky, S. (2007). Detection of Tribolium castaneum (Herbst) volatile defensive secretions by solid phase micro extraction-capillary gas chromatography (SPME-CGC). J Stored Prod Res 43, 540–545.
22. Hammer, Ø., Harper, D.A.T., and Ryan, P.D. (2001). PAST: Paleontological Statistics Software Package for Education and Data Analysis. Palaeontol Electronica 4, 9.
23. King, J.Y., Ferrara, R., Tabibiazar, R., Spin, J.M., Chen, M.M., Kuchinsky, A., Vailaya, A., Kincaid, R., Tsalenko, A., Deng, D.X., et al. (2005). Pathway analysis of coronary atherosclerosis. Physiological genomics 23, 103–118.
24. Dillman, A.R., Guillermin, M.L., Lee, J.H., Kim, B., Sternberg, P.W., and Hallem, E.A. (2012). Olfaction shapes host-parasite interactions in parasitic nematodes. Proc Natl Acad Sci U S A 109, E2324–2333.


