31
Appendix B Evaluation of Potential Impacts of Cedar Springs Dam (Silverwood Lake) and Mojave River Dam on Downstream Mojave River Flows and Groundwater Recharge

Appendix B
Evaluation of Potential Impacts of Cedar
Springs Dam (Silverwood Lake) and Mojave
River Dam on Downstream Mojave River
Flows and Groundwater Recharge

FINAL REPORT Conceptual Hydrogeologic Model and Assessment of Water Supply and Demand Todd Engineers Centro and Baja Subareas, Mojave River Groundwater Basin Page Bi Appendix B Evaluation of Dam Impacts
Table of Contents Page
1.1 Introduction .................................................................................................................................................... B1 1.2 Purpose and Objectives .................................................................................................................................. B1 1.3 Headwaters of the Mojave River .................................................................................................................... B3 1.4 Review of Previous Studies ............................................................................................................................. B5 1.5 Evaluation of Streamflow Data related to Cedar Springs Dam ..................................................................... B12 1.6 Evaluation of Streamflow Data related to Mojave River Dam ...................................................................... B20 1.7 Conclusions ................................................................................................................................................... B28 1.8 References .................................................................................................................................................... B29
List of Tables
Table B1 Annual Measured Inflow above Cedar Springs Dam vs. Annual Flow at West Fork Mojave River near Hesperia ............................................................................................ B15
Table B2 Summary of Mojave River Flows when Mean Daily Flow above Mojave River Dam exceeds 7,300 cfs ............................................................................................................ B21
List of Figures
Figure B1 Schematic Diagram of Surface Water Flow in the Mojave River Headwaters ................. B2
Figure B2 Key Technical Reports of Mojave River Hydrology and Upstream Dams ......................... B6
Figure B3 Annual Measured Inflow above Cedar Springs Dam vs. Annual Flow at West Fork Mojave River near Hesperia (a) natural (pre‐dam) conditions, WY 1960‐61 to 1969‐70 (b) post‐dam conditions, WY 1971‐72 to 1976‐77 and WY 1995‐96 to 2007‐08, not
including WY 2002‐03 and WY 2004‐05. ........................................................................ B13
Figure B4 Cumulative Annual Flows at Deep Creek near Hesperia vs. West Fork Mojave River near Hesperia (WY 1930‐31 to WY 2009‐10) .................................................................. B16
Figure B5 Comparison of Mean Daily Flow at Deep Creek near Hesperia and West Fork Mojave River near Hesperia for 43 Largest Storms on Record (WY 1930‐31 to WY 2009‐10) .... B18
Figure B6 Occurrences of Mean Daily Discharge exceeding 7,300 cfs (WY 1930‐31 to WY 2009‐10) West Fork Mojave River near Hesperia plus Deep Creek near Hesperia ........................ B19
Figure B7 Summary of Mojave River Flows when Mean Daily Flow above Mojave River Dam exceeds 7,300 cfs ............................................................................................................ B23
Figure B8 Comparison of Maximum Mean Daily Flows above Mojave River Dam (above 7,300 cfs) and Associated Maximum Mean Daily Flow at Barstow (WY 1930‐31 to WY 2009‐10) ................................................................................................................... B24
Figure B9 Cumulative Mean Departure for San Bernardino Mountain Precipitation (WYs 1910‐11 to 2007‐08) .............................................................................................. B25
Figure B10 Comparison of Maximum Mean Daily Flows above Mojave River Dam (above 7,300 cfs) and Associated Maximum Mean Daily Flow at Lower Narrows and Barstow – January and February, 1993 .......................................................................... B27

FINAL REPORT Conceptual Hydrogeologic Model and Assessment of Water Supply and Demand Todd Engineers Centro and Baja Subareas, Mojave River Groundwater Basin Page B1 Appendix B Evaluation of Dam Impacts
1.1 Introduction
Streamflow losses from the Mojave River represent the primary source of groundwater recharge in the
Mojave River Groundwater Basin. The Mojave River is fed primarily by storm runoff on the northern
slopes of the San Bernardino Mountains. In the summer of 1971, the construction of two dams in the
headwaters of the Mojave River was completed. Cedar Springs Dam was constructed in the upper
portion of the West Fork of the Mojave River (West Fork) by the Department of Water Resources (DWR)
and formed Silverwood Lake, a key storage reservoir and regulating facility for the State Water Project
(SWP) (Figure B1).
At approximately the same time, the U.S. Army Corp of Engineers (USACE) completed construction of
the Mojave River Dam at the confluence of West Fork and Deep Creek, approximately 5 miles
downstream of Cedar Springs Dam at a location known locally as The Forks (for this reason, the Mojave
River Dam has also been referred to previously by others as Forks Dam). The primary purpose of the
Mojave River Dam was to provide flood protection to the cities of Victorville and Barstow,
approximately 19,000 acres of agricultural land, and important highways and railroads located along the
banks of the Mojave River (USACE, 1981). While it is widely accepted that the natural flow regime was
altered at both dam sites, questions remain as to the potential impact of the dams on downstream
Mojave River flows and groundwater recharge despite efforts by investigators to resolve this issue.
1.2 Purpose and Objectives
Numerous technical studies have been conducted over the past several decades characterizing the
hydrology of the Mojave River and the evolution of surface water‐groundwater interactions along its
100‐mile course across the Mojave River Basin. While pertinent hydrologic information and insights into
the factors that affect downstream flows have been presented in several studies, the strength of
conclusions on the downstream impact of the dams have varied depending on the method of analysis
and period of hydrologic record evaluated. A literature review reveals that the magnitude and duration
of flows in the downstream portions of the basin are controlled by several inter‐related natural and
anthropogenic factors. The degree by which each factor has influenced downstream flows and
groundwater recharge has been difficult to quantify, especially considering that data are limited to a
handful of wet periods that have produced significant stormflows. Additionally, varying perceptions of
the function, design characteristics, and operational history of the upstream dams has historically been
a source of confusion. Finally, given that many of the key studies on this issue were conducted more
than 30 years ago (i.e., only a few years after the completion of the dams), this study presented an
opportunity to use a more current hydrologic dataset to substantiate previous findings.
The primary objectives of this evaluation are described below.

�
�������������� �
�
��������������
�� ����������
������������������������������� �!!�"
#��������������������������� �$��"
%�������& ����� '����(�'���������"
���)��������*'� ���+��� ���,��-���� ������������������ �
+���������
+��������������(����������� �!��"
�. ����'�����"�/�0� ������1������� �
2�3���������
����������������
�������������������
���������
��������������(����������� �����4���� �5!�"
(�����6��&���,������'���,��'�����"
���0��������������� ������������������� �7��"
�'00����1� �,����6
�������������������� ��!��� �"������ #$��$%!�
�& �
� �
��
����'�
���
(��$���)�%����!�%����������"
�$�"�%����!���( �����!���������������
*�����!���
����'��,����8
*9++�#�:;�##��. �0���<��� �&����
&'�'+�������������-��3����� ��+����������'�� �� ��+���������2�.�=�2�3����������.���,
2�+�=�2������ ����������+���������.�.�=������ ��������.���6����������.���,�)12�+�=����)�������1� �,�2'����� �������.���,�:-�.�=����:�������-����������.���,

FINAL REPORT Conceptual Hydrogeologic Model and Assessment of Water Supply and Demand Todd Engineers Centro and Baja Subareas, Mojave River Groundwater Basin Page B3 Appendix B Evaluation of Dam Impacts
1. Describe the history of surface water flow conditions in the Mojave River headwaters both prior
to and following the construction of the Cedar Springs Dam and Mojave River Dam
2. Document the data, methods of analysis, and key findings from previous studies that directly or
indirectly address the potential impact of the dams on downstream flows and groundwater
recharge, and
3. Present updated conclusions on the downstream impact of the dams incorporating previous
studies with additional evaluation of streamflow data collected through the 2009‐10 water year.
1.3 Headwaters of the Mojave River
In order to evaluate the potential impact of the Cedar Springs Dam and Mojave River Dam on
downstream flows and groundwater recharge, it is essential to understand the surface water flow
regime of the Mojave River headwaters. Figure B1 shows a schematic diagram of the headwaters region.
Depicted on the figure are the locations of the major natural tributary drainages in relation to the two
dams and historical stream gaging stations. The hydrologic relationship between key features and the
relevant design characteristics of the two dams and associated reservoirs are described below.
Complete design specifications for the Mojave River Dam and Cedar Springs Dam are presented in
USACE (1966) and DWR (1974), respectively.
As shown in the lower portion of Figure B1, the Mojave River is formed by two smaller streams, West
Fork and Deep Creek. These streams converge above the Mojave River Dam at The Forks, located
approximately 14 miles south (upstream) of the City of Victorville. The elevation of the stream channel
at the Mojave River Dam site is 2,972 feet msl. The Mojave River Dam is an earthfill structure with a
height of 200 feet and crest length of 2,200 feet. The dam outlet works is ungated (USACE, 1966). The
dam was designed to provide a sufficient reservoir capacity to reduce the reservoir design (standard
project) flood from a peak inflow of 94,000 cubic feet per second (cfs) to a peak outflow of 23,500 cfs
and pass the spill‐way design (maximum probable) flood with a peak inflow of 186,000 cfs and a peak
outflow of 131,300 cfs. When the inflow above the dam is less than 7,300 cfs, water flows through the
outlet works effectively unimpeded. For periods when inflows above the dam exceed 7,300 cfs, flow
through the outlet works is weir‐controlled (i.e., a portion of the inflow is detained above the Mojave
River Dam creating a temporary reservoir (Forks Reservoir) that attenuates peak downstream flows. The
net capacity of the Forks Reservoir at the spillway crest is 78,700 AF, taking into consideration 11,000 AF
for accumulated sediment. The reservoir is designed to empty within 2.33 and 3.33 days following the
standard project flood and maximum probable flood, respectively (USACE, 1970).
Since 1930, the USGS has monitored flows above the Mojave River Dam at two locations: West Fork
near Hesperia (USGS Station No. 10261000/10260950, labeled “D” on Figure B1) and Deep Creek near
Hesperia (USGS Station No. 10260500; labeled “E” on Figure B1). The sum of the flows for these two

FINAL REPORT Conceptual Hydrogeologic Model and Assessment of Water Supply and Demand Todd Engineers Centro and Baja Subareas, Mojave River Groundwater Basin Page B4 Appendix B Evaluation of Dam Impacts
gaging stations effectively represents the total inflow above the Mojave River Dam. Since 1930, flows
from Deep Creek and West Fork have respectively contributed 67 and 33 percent to the total flows
above the Mojave River Dam.
Flows in Deep Creek are not regulated by any flow control structures; conversely, a portion of the
natural flows in the West Fork of the Mojave River have been altered by the construction of Cedar
Springs Dam and by historical diversions. Cedar Springs Dam is a zoned‐earth and rock‐filled structure
with a height of 213 feet and a crest length of 2,250 feet. The dam outlet works include valves that are
used to control the releases of imported SWP water and natural runoff from Silverwood Lake. The
construction of Cedar Springs Dam formed Silverwood Lake, a 995‐acre recreational lake that represents
the highest reservoir in the SWP at 3,350 feet msl.
The conveyance of SWP‐designated water into and out of Silverwood Lake area is depicted by the red
colored arrows on Figure B1. SWP water that flows down the California Aqueduct is discharged and
stored in Silverwood Lake through the Mojave Siphon Powerplant. State Water Contractors that accept
SWP water deliveries from Silverwood Lake include the following:
Mojave Water Agency (MWA)
Crestline‐Lake Arrowhead Water Agency (CLAWA)
Metropolitan Water District (MWD)
San Bernardino Valley Municipal Water District (SBVMWD)
San Gorgonio Pass Water Agency (SGPWA)
Depending on the request, SWP water from Silverwood Lake is either pumped through the San
Bernardino Tunnel to the Devil Canyon Powerplant and into the East Branch Extension (MWD,
SBVMWD, and SGPWA), released through Cedar Springs Dam into the West Fork of the Mojave River
(MWA), or pumped through a separate turnout and outlet works owned by CLAWA. As of 2011, MWA
has accepted 107,000 AF of SWP deliveries from Silverwood Lake.
When the Department of Water Resources (DWR) constructed Cedar Springs Dam, it impounded a
portion of the natural flows that would have otherwise flowed downstream in the West Fork of the
Mojave River. To protect prior downstream surface water rights (including those appropriated by
Summit Valley Ranch), DWR computes the amount of natural runoff that would have passed the dam
site in the absence of Silverwood Lake and releases sufficient water to restore natural flows in the West
Fork of the Mojave River. The method relies on the correlation of gaged inflows on two tributaries above
Cedar Springs Dam: East Fork of West Fork (USGS Station No. 10260700; labeled “A” on Figure B1) and
West Fork of the Mojave River above Cedar Springs Dam (USGS Station No. 10260550; labeled “B” on
Figure B1) and gaged outflow at the dam site at West Fork of the Mojave River below Cedar Springs
gage (USGS Station No. 10260800; labeled “C” on Figure B1) prior to the construction of the dam from
WY 1960‐61 through WY 1969‐70. For higher flows, a change‐in‐storage method is used. In 1989, DWR

FINAL REPORT Conceptual Hydrogeologic Model and Assessment of Water Supply and Demand Todd Engineers Centro and Baja Subareas, Mojave River Groundwater Basin Page B5 Appendix B Evaluation of Dam Impacts
entered into an agreement with CLAWA to provide non‐SWP water from Silverwood Lake to CLAWA
through its separate turnout and outlet works to satisfy up to 1,302 AFY of prior surface water rights
from Houston Creek, a tributary to Silverwood Lake. Additionally, a portion of the natural flows in West
Fork below the Cedar Springs Dam site was utilized by Summit Valley Ranch (formerly Las Flores Ranch)
prior to the dam’s construction. The Summit Valley Ranch diversion structure was removed during the
construction of the dam. Since then, DWR has satisfied the prior surface water right of Summit Valley
Ranch by delivering SWP water directly from the Mojave Siphon Powerplant through a 3,290‐foot
pipeline to the ranch. The pipeline has a flow capacity of 23 cfs, similar to the original ranch diversion
structure. Prior to the construction of the dam, the estimated average annual water diversion by
Summit Valley Ranch was estimated at 1,622 AFY (Bookman‐Edmonston Engineering, Inc., 1978).
DWR is obligated to release natural runoff entering Silverwood Lake to the West Fork of the Mojave
River within a 48‐hour period and typically does so within 24 hours in order to maintain a normal
operating water level range to support SWP operations (MWA, 2011). Downstream releases into West
Fork are typically made from the Mojave Siphon via an outlet on the Summit Valley Ranch diversion
structure. SWP water from the siphon is released at the same time an equal amount of natural inflow to
the reservoir is booked over to the SWP account. Downstream releases between 23 and 5,000 cfs are
usually released through the outlet works. Flows above 5,000 cfs either are temporarily stored in the
reservoir for later release within the 48‐hour period or discharged over the spillway (DWR, 1974).
As shown on Figure B1, releases from Silverwood Lake combine with ungaged flows from other
contributing watershed areas of West Fork through Horsethief Canyon above the West Fork gage near
Hesperia. Minor streamflow losses occur in the reach between Cedar Springs Dam and the West Fork
gage near Hesperia. Notwithstanding these losses, a comparison between the releases from Silverwood
Lake to flows at the West Fork gage near Hesperia from 1975 to 2008 indicates that releases from
Silverwood Lake contribute 70 percent of the total flow in West Fork near Hesperia, while the remaining
30 percent is derived from natural runoff from Horsethief Canyon (MWA, 2011). Due to its location, the
influence of anthropogenic activities in the West Fork watershed, including the operation of Silverwood
Lake, diversion practices related to Summit Valley Ranch, and other land use changes, are captured in
the streamflow records for the West Fork gage near Hesperia.
1.4 Review of Previous Studies
For this evaluation, technical reports prepared by the Department of Water Resources (DWR), U.S.
Geological Survey (USGS), and private consultants over the past 50 years, as well as various memoranda
and presentations prepared to support implementation of the Mojave Basin Area Judgment were
reviewed. A timeline of key publications related to Mojave River flows and the potential downstream
impacts of the Cedar Springs Dam and Mojave River Dam, including dam and reservoir design manuals,
technical investigations, and position papers is presented in Figure B2.
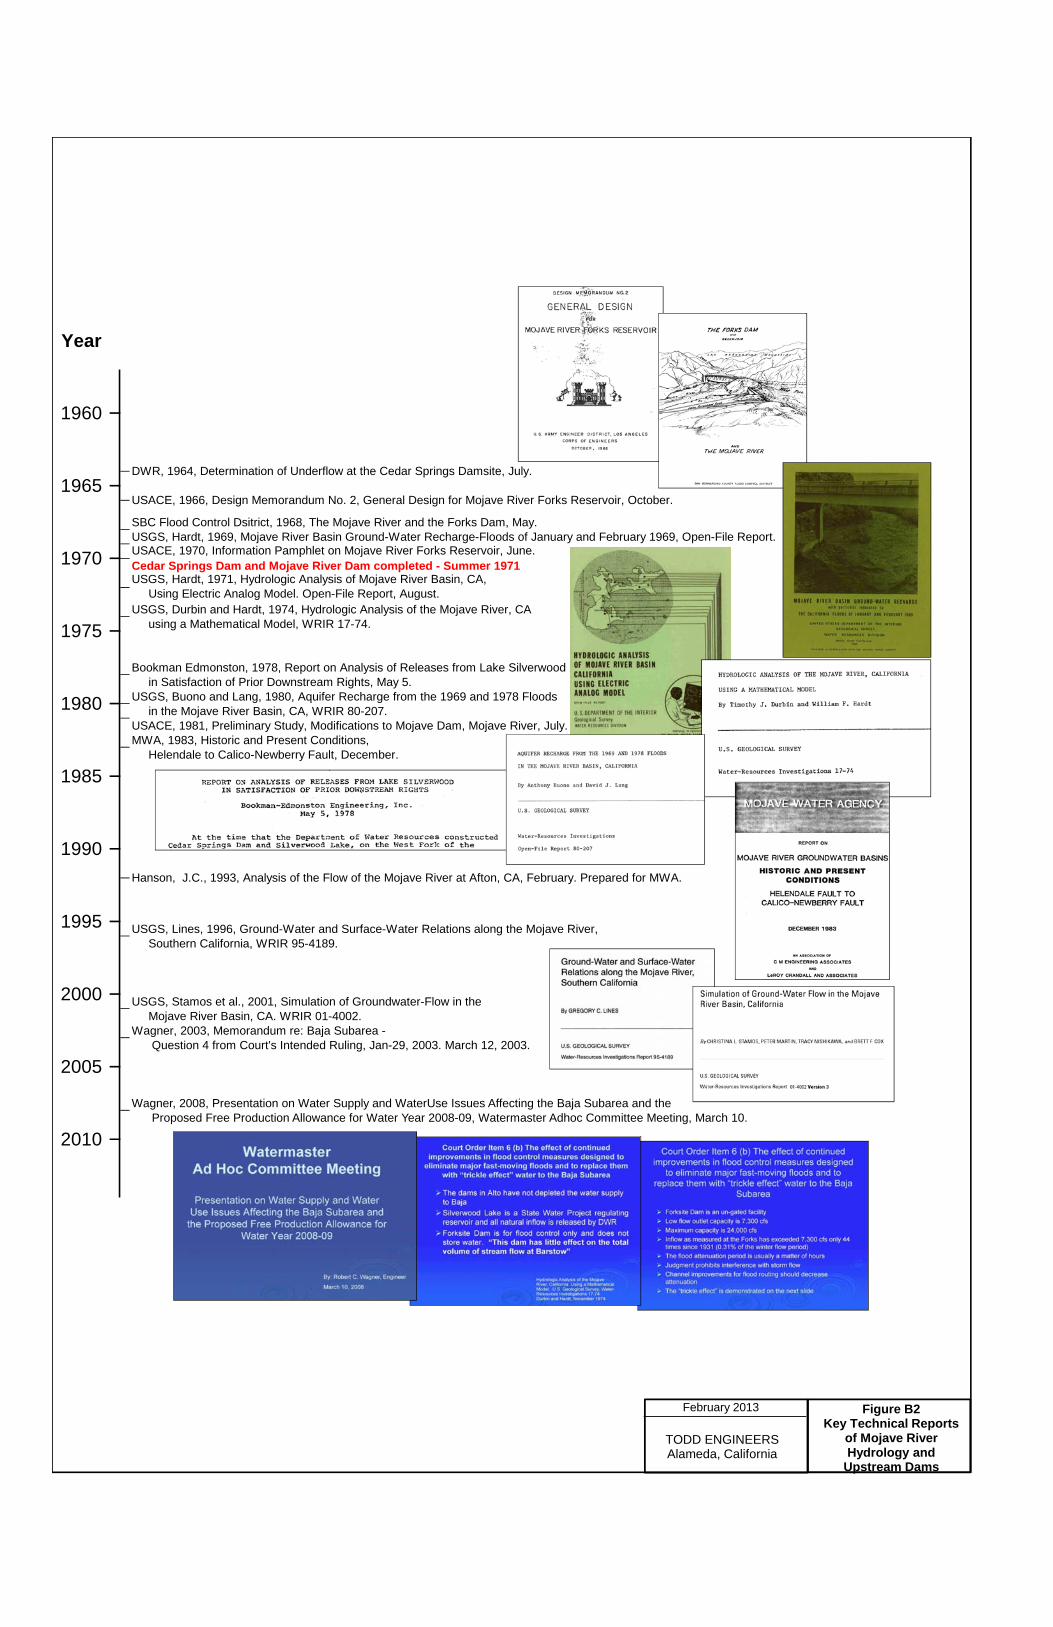
SBC Flood Control Dsitrict, 1968, The Mojave River and the Forks Dam, May.USGS, Hardt, 1969, Mojave River Basin Ground-Water Recharge-Floods of January and February 1969, Open-File Report.USACE, 1970, Information Pamphlet on Mojave River Forks Reservoir, June.Cedar Springs Dam and Mojave River Dam completed - Summer 1971USGS, Hardt, 1971, Hydrologic Analysis of Mojave River Basin, CA, Using Electric Analog Model. Open-File Report, August.USGS, Durbin and Hardt, 1974, Hydrologic Analysis of the Mojave River, CA using a Mathematical Model, WRIR 17-74.
Bookman Edmonston, 1978, Report on Analysis of Releases from Lake Silverwood in Satisfaction of Prior Downstream Rights, May 5.USGS, Buono and Lang, 1980, Aquifer Recharge from the 1969 and 1978 Floods in the Mojave River Basin, CA, WRIR 80-207.USACE, 1981, Preliminary Study, Modifications to Mojave Dam, Mojave River, July.MWA, 1983, Historic and Present Conditions, Helendale to Calico-Newberry Fault, December.
USGS, Lines, 1996, Ground-Water and Surface-Water Relations along the Mojave River, Southern California, WRIR 95-4189.
USGS, Stamos et al., 2001, Simulation of Groundwater-Flow in the Mojave River Basin, CA. WRIR 01-4002.Wagner, 2003, Memorandum re: Baja Subarea - Question 4 from Court's Intended Ruling, Jan-29, 2003. March 12, 2003.
Wagner, 2008, Presentation on Water Supply and WaterUse Issues Affecting the Baja Subarea and the Proposed Free Production Allowance for Water Year 2008-09, Watermaster Adhoc Committee Meeting, March 10.
Hanson, J.C., 1993, Analysis of the Flow of the Mojave River at Afton, CA, February. Prepared for MWA.
2000
2005
2010
1975
1980
1985
1990
1995
Year
1960
1965
1970
DWR, 1964, Determination of Underflow at the Cedar Springs Damsite, July.
USACE, 1966, Design Memorandum No. 2, General Design for Mojave River Forks Reservoir, October.
Figure B2Key Technical Reports
of Mojave RiverHydrology and
Upstream Dams
TODD ENGINEERSAlameda, California
February 2013

FINAL REPORT Conceptual Hydrogeologic Model and Assessment of Water Supply and Demand Todd Engineers Centro and Baja Subareas, Mojave River Groundwater Basin Page B7 Appendix B Evaluation of Dam Impacts
Of the previous studies related to flows in the Mojave River, only one study (Bookman‐Edmonston
Engineering, Inc., 1978) quantifies the potential downstream impacts from Cedar Springs Dam, and only
one other study (Durbin and Hardt, 1974) quantifies the potential downstream impacts from the Mojave
River Dam. Several other studies (Hardt, 1969; Hardt, 1971; Buono and Lang, 1980; Lines, 1996; Stamos,
et al., 2001) provide valuable information and insights that have advanced the understanding of the
factors that have influenced the frequency and magnitude of downstream flows in the Mojave River and
groundwater recharge along its 100‐mile course across the Mojave River Basin. A summary of the key
reports, including description of the data, methods of analysis, and principal findings, is presented below
in chronological order.
Hardt (1969) estimated the amount of groundwater recharge in the Mojave River Basin during the 1969
winter floods. Two methods were used to estimate groundwater recharge: 1) a surface water loss
method based on changes in surface water flows between the six USGS stream gaging stations located
between the headwaters of the Mojave River and Afton, and 2) groundwater level change method
based on water level changes in selected wells along the Mojave River and estimates of specific yield.
Evaluation of stormflows for individual flood events in January and February 1969 indicate that the
antecedent moisture content of the river‐channel sediments played a key role in the volume of
stormflows reaching the downstream portions of the basin and exiting Afton Canyon. Data and analyses
from this study are later incorporated in the study by Buono and Lang (1980) which compared
streamflows during the winter floods of 1969 and 1978.
Hardt (1971) developed the first groundwater flow model in the Mojave River Basin using an electric
analog model. As part of his study, Hardt used the USGS streamflow records to develop double‐mass
curve diagrams to depict and identify changes in streamflow characteristics between the headwaters
and Barstow. The diagrams illustrated that stormflows reaching Lower Narrows and Barstow began to
decrease beginning as early as 1946 through 1968 (the end of the dataset). Such decreases are
correlated to dry conditions in the headwaters from 1945 to 1965. No explanation is provided as to
whether such decreases in downstream flows are indicative of any factor other than lower storm runoff
volumes generated in the headwaters during the drought period.
Durbin and Hardt (1974) developed a mathematical model for the primary objective of evaluating the
ability of the Mojave River channel to convey water downstream from Silverwood Lake. A secondary
objective of the study was to evaluate and estimate the effects of the Mojave River Dam on the natural
streamflow of the Mojave River.
The development of the mathematical model was based in part on the evaluation of streamflow
depletion between USGS stream gaging stations during 18 floods that produced flow at Barstow from
1930 to 1972. Results of the evaluation indicate that the infiltration rate for two reaches (The Forks to
Lower Narrows and Lower Narrows to Barstow) varies widely for similar inflow rates at the upstream

FINAL REPORT Conceptual Hydrogeologic Model and Assessment of Water Supply and Demand Todd Engineers Centro and Baja Subareas, Mojave River Groundwater Basin Page B8 Appendix B Evaluation of Dam Impacts
gage of the respective reach. However, infiltration rates in both reaches increased after 1958 and are
correlated to 1) the extended drought period that began in 1947 and 2) lower water levels (and
increased available storage beneath the river channel) due to increased production in the basin.
The model was also based in part on findings from a controlled release from Silverwood Lake that was
conducted by MWA in November 1972. Upon completion of the dam, MWA requested the release of
the accumulated 3,100 AF at the maximum permissible rate to minimize flood damage. The release was
performed during a time when the channel was dry which corresponds to maximum infiltration rates.
The release was adjusted upward to a maximum of 1,950 cfs and was maintained at this rate for 18.5
hours. The discharge was measured at various locations resulting in approximately 13 percent of the
water infiltrating along the reach between Cedar Springs Dam and the Mojave River Dam. The remaining
87 percent infiltrated into the alluvium below the Mojave River Dam with the majority infiltrating within
5 miles of the dam. The primary reasons given for the large river losses for the 5 miles reach below the
Mojave River Dam are the high permeability of material in the river channel and a relatively low channel
gradient at this location.
Simulation results related to imported water releases from Silverwood Lake indicate that the channel of
the Mojave River can be used to efficiently convey water to the Barstow area only when the absorption
capacity of the channel has been reduced by an antecedent flood. The volume of flow that can reach
Barstow is dependent on the volume and duration of antecedent flooding, as well as the volume and
rate at which water is released from Silverwood Lake. Without antecedent flooding, the absorption
capacity of the channel is so great that only a small portion of water released from Silverwood Lake
would reach the Barstow area. The absorption capacity of the channel is a function of the intrinsic
characteristics of the unsaturated zone sediments (e.g., effective porosity and hydraulic conductivity)
and at any given time the depth to the water table, local and regional hydraulic gradients in the shallow
aquifer system, and any water held in the unsaturated zone (i.e., from antecedent floods).
Simulated release rates from Silverwood Lake were capped at 2,000 cfs in the study because higher
release rates were considered to increase the likelihood of flood damages and because the
mathematical model does not account for channel storage (the volume of water contained within the
banks of the river channel during a flood). Channel storage represents the natural flood attenuation
potential of the river channel and causes a reduction in peak discharge in the downstream direction
independent of the depletion caused by infiltration. Its effect increases with increasing peak discharge
and decreasing duration of flow. Although not directly evaluated in the study, the significance of
channel storage on downstream flows is revealed in the tentative conclusion presented in the report
that the volume of water that would reach Barstow, given a release rate from Silverwood Lake greater
than 2,000 cfs, would not be much greater than the volume reaching Barstow at a release rate of 2,000
cfs. Even without the incorporation of channel storage, simulation results indicate that incremental

FINAL REPORT Conceptual Hydrogeologic Model and Assessment of Water Supply and Demand Todd Engineers Centro and Baja Subareas, Mojave River Groundwater Basin Page B9 Appendix B Evaluation of Dam Impacts
increases in the release rate from Silverwood Lake up to 2,000 cfs provide diminishing returns with
respect to the increased volume of flow reaching Barstow.
To quantify the effects of the Mojave River Dam on the natural streamflow of the Mojave River, two
historical floods were simulated using the model under two conditions: 1) without the dam and 2) with
the dam. The first flood which occurred December 3‐12, 1966 and represents a relatively small flood
with a total volume of 40,600 AF measured at the Mojave River Dam. The second flood occurred January
20‐29, 1969 and represents a relatively large flood with a total volume of 101,000 AF measured at the
Mojave River Dam. The results of the model simulations indicate that while the dam reduces the peak
discharge and increases the total flood duration at Barstow on the order of less than one day, the dam
has no effect on the total volume of streamflow at Barstow for both floods. Given that the primary
limitation of the model acknowledged by the authors is that the effective area (or wetted perimeter) of
the river channel is a fixed parameter in the model (i.e., independent of discharge rates in the channel),
the conclusions on the effect of the Mojave River Dam presented in this report are in one respect
conservative, given that the area through which infiltration occurs was probably larger than captured in
the model for the unregulated stormflows in 1969 compared to the regulated stormflows in 1978. If the
wetted perimeter was allowed to vary in the model, the simulated volume of downstream flows for the
“without dam” scenario would probably be lower than reported and lower than the “with dam”
scenario. A specific determination of the impacts of the Mojave River Dam on groundwater recharge
was not included in the analysis.
Bookman‐Edmonston Engineering, Inc. (1978) conducted an analysis on behalf of the MWA to evaluate
releases made from Silverwood Lake to satisfy prior downstream water rights. The analysis included a
detailed review of the hydrology of the Mojave River and of the procedure used by DWR to determine
the amount of the releases to satisfy these rights. The principal focus of the analysis was to evaluate the
DWR method of estimating natural inflow to the Silverwood Lake. The study also included a review of
releases for the downstream water rights of Las Flores Ranch (now Summit Valley Ranch) compared to
historical diversions as measured by DWR for a short period of record. The principal findings from the
study are summarized below:
The modified DWR correlation curve produces reasonable estimates of natural inflow at a 50
percent confidence level. However, it was recommended that a correlation curve developed by
the report author be adopted that would result in estimates at a 95 percent confidence level.
A change in storage method for estimating natural inflow was recommended for certain
conditions. It was reported that DWR was in the process of developing such a procedure that
would result in the correlation method being used for low flows and the change in storage
method used for high flows.

FINAL REPORT Conceptual Hydrogeologic Model and Assessment of Water Supply and Demand Todd Engineers Centro and Baja Subareas, Mojave River Groundwater Basin Page B10 Appendix B Evaluation of Dam Impacts
Additional investigation would be required to determine if net use by Las Flores Ranch has
increased since the construction of Cedar Springs Dam.
Other questions were addressed resulting in the conclusion that apparent seepage into the San
Bernardino Tunnel, underflow cut off at the dam site, and inaccuracies in upstream gaging
stations would not result in any significant reduction in downstream flows.
Buono and Lang (1980) conducted an evaluation to assess and compare estimates of groundwater
recharge resulting from the floods that occurred during the 1969 and 1978 water years. Included in the
study was a comparison of the results of a previous study by Hardt (1969) that was limited to the flood
of 1969. The same methods used by Hardt (1969) for determining aquifer recharge (surface water loss
method and groundwater level change method) were applied. The results of the study show
groundwater recharge in the uppermost reach between the Forks and Lower Narrows was
approximately three times greater in 1978 (139,330 AF) compared to 1969 (45,411 AF) even though
flows measured at the Forks were similar. Thus, while the total volume of groundwater recharge for the
entire 100‐mile reach between The Forks and Afton was larger in 1978, groundwater recharge in the
lower two reaches from Lower Narrows to Barstow and from Barstow to Afton were smaller in volume
in 1978 (despite being slightly higher in 1978 when calculated as a percentage of inflow to the
respective upper stream gaging station). Flow conditions were attributed to 1) more evenly distributed
precipitation in 1978 compared to 1969, 2) lower groundwater levels in 1978 providing more available
storage for recharge, and 3) the attenuated flood peaks and longer flood durations in 1978 as a result of
the slower release of water through the Cedar Springs and Mojave River dams. However, no evidence is
provided that substantiates or quantifies the effect of either the Cedar Springs Dam or Mojave River
Dam relative to other factors cited.
Lines (1996) conducted an evaluation of the flow characteristics in the Mojave River. As part of the
study, the question of the potential impact of both the Cedar Springs and Mojave River dams on
downstream flows was qualitatively considered by examining flow‐duration curves for three Mojave
River stream gaging stations (Lower Narrrows, Barstow, and Afton) and separating mean daily flow
records into pre‐dam (1930 to 1971) and post‐dam (1972 to 1994) periods. It is observed that the
duration of the largest discharges (greater than 1,000 cfs) at each of the three stream gaging stations
increased for the post‐dam period dataset, suggesting that the dams have not decreased the frequency
of large discharges from reaching downstream portions of the Mojave River, despite acknowledgement
that both dams have attenuated flood peaks. Although the data certainly cannot be used to prove
downstream impacts from the dams, because rainfall conditions during the pre‐dam and post‐dam
periods were not incorporated in the analysis, conclusions that can be drawn from the flow‐duration
curves are limited in terms of proving that the dams have not impacted downstream flows.

FINAL REPORT Conceptual Hydrogeologic Model and Assessment of Water Supply and Demand Todd Engineers Centro and Baja Subareas, Mojave River Groundwater Basin Page B11 Appendix B Evaluation of Dam Impacts
Stamos, et al. (2001) used the Mojave River Basin groundwater model to simulate historical conditions
to assess the influence of historical groundwater production in the upper portions of the basin on the
frequency and magnitude of intermittent Mojave River flows and groundwater level declines in the
Centro and Baja subareas. While no determination was made on the effect of the dams, this is the only
study that quantifies the impact of pumping and the lowering of water levels along the river in the upper
basin on downstream flows and recharge. As part of the evaluation, pumping in the upper region of the
basin (Alto, Transition Zone, Este, and Oeste subareas) was turned off in the model for the base
simulation period from 1931 to 1990. Simulation results show that groundwater recharge from the
Mojave River increased on average 13,110 and 3,800 AFY for the Centro (not including Harper Lake) and
Baja subareas, respectively. With respect to the Baja Subarea, 3,800 AFY represents approximately one‐
quarter of the 855,500 AF lost from storage during the simulation period from 1931 to 1990. Changes
are attributable to simulated hydraulic heads in the Alto and Transition Zone subareas being near the
altitude of the streambed throughout the upper region, which causes potential recharge from the
Mojave River to be rejected in the upper region thereby allowing more streamflow to reach and
recharge the lower region.
Wagner and Bonsignore (2003) summarizes in a MBA Watermaster‐related memorandum the design
characteristics and operational history of the Mojave River Dam and relevant stream gage data through
2002 and cites key findings from pertinent technical reports (all of which are included on Figure B2). This
information is used to support his opinion that the Mojave River Dam “has not had a material effect on
downstream water supply.” Additionally, the comparison of groundwater recharge downstream from
Barstow in 1969 and 1978 as a percentage of flow at Barstow as reported in Buono and Lang (1980) is
cited to suggest that the Mojave River Dam may have had a positive effect on downstream recharge.
While the following revision would not change the conclusions made in the memorandum, it is
important to recognize that this statement is misleading. It is more appropriate to compare for the two
periods either 1) the volume of flow at Barstow as a percentage of flow measured at The Forks or 2) the
volume of losses (groundwater recharge) between Barstow and Afton. In 1978, reported flows for the
Barstow gage represented 29 percent of the flow measured at The Forks, while reported flows at
Barstow in 1969 were higher (46 percent of the flow measured at The Forks). Estimated losses between
Barstow and Afton in 1969 (73,575 AF) were higher than in 1978 (53,387 AF). Thus a higher percentage
of the flow at The Forks reached Barstow and a larger volume of groundwater recharge between
Barstow and Afton was observed in 1969 prior to the construction of the Mojave River Dam. Based on
these comparisons, it seems appropriate to state that while the 1969 and 1978 data reported by Buono
and Lang cannot be used to conclusively implicate the Mojave River Dam as having a negative impact on
Centro and Baja water supply, the data do not support the assertion that the Mojave River Dam may
have had a positive impact on Centro and Baja water supply.

FINAL REPORT Conceptual Hydrogeologic Model and Assessment of Water Supply and Demand Todd Engineers Centro and Baja Subareas, Mojave River Groundwater Basin Page B12 Appendix B Evaluation of Dam Impacts
Wagner and Bonsignore (2010) reviewed streamflow data through 2009 and presents statistics
regarding the dates and maximum mean daily flow of storm events for which the Mojave River Dam
regulated flows. These data and review of design characteristics of the dam are used to support his
earlier opinion that the dam has not had a significant impact of downstream water supply.
1.5 Evaluation of Streamflow Data related to Cedar Springs Dam
Although the conclusions drawn from previous studies provide a strong foundation of knowledge in
regards to the potential downstream impacts of the dams, more recent streamflow data were evaluated
using alternative methods of analysis in an effort to address (at least in part) remaining uncertainties.
This section describes the evaluation of the effect of Cedar Springs Dam on downstream flows.
Based on the evaluation by Bookman‐Edmonston Engineering, Inc. (1978) and given the operational
guidelines for natural runoff releases through the dam, the Cedar Springs Dam site may have affected
downstream flows in West Fork if 1) the DWR correlation procedure incorrectly estimates the volume of
natural flow past the Cedar Springs Dam site or 2) the detainment of natural inflows into Silverwood
Lake is not released in a manner that restores downstream flow rates. Previous investigators (Buono and
Lang, 1980 and Lines, 1996) cite the flood attenuation effect of the collective dams, but no evidence is
provided that substantiates the effect of Cedar Springs Dam or illustrates the degree of flood
attenuation provided by Silverwood Lake. For these reasons, stream gage data collected through WY
2009‐10 were analyzed using alternative methods to determine whether the volume or timing of
releases from Silverwood Lake has adequately restored natural (pre‐dam) flows below Cedar Springs
Dam. Analyses are based on the premise that any significant downstream impacts from the construction
and operation of Silverwood Lake would be manifested in flow records at the West Fork gage near
Hesperia, the nearest downstream gage that has been in operation since 1930. Likewise, any significant
changes in water diversions by the Summit Valley Ranch since the construction of Silverwood Lake are
also addressed in this analysis. The evaluation reasonably assumes that land use in the contributing
watershed areas above Horsethief Canyon and the Deep Creek gage near Hesperia have remained
relatively unchanged over time.
With respect to volume, downstream impacts from Cedar Springs Dam would be manifested in changes
to the following relationships from pre‐dam to post‐dam conditions:
1. The volume of flow at the West Fork gage near Hesperia compared to the volume of measured
inflows above the Cedar Springs Dam site
2. The volume of flow at West Fork near Hesperia compared to the volume of flow at Deep Creek
near Hesperia
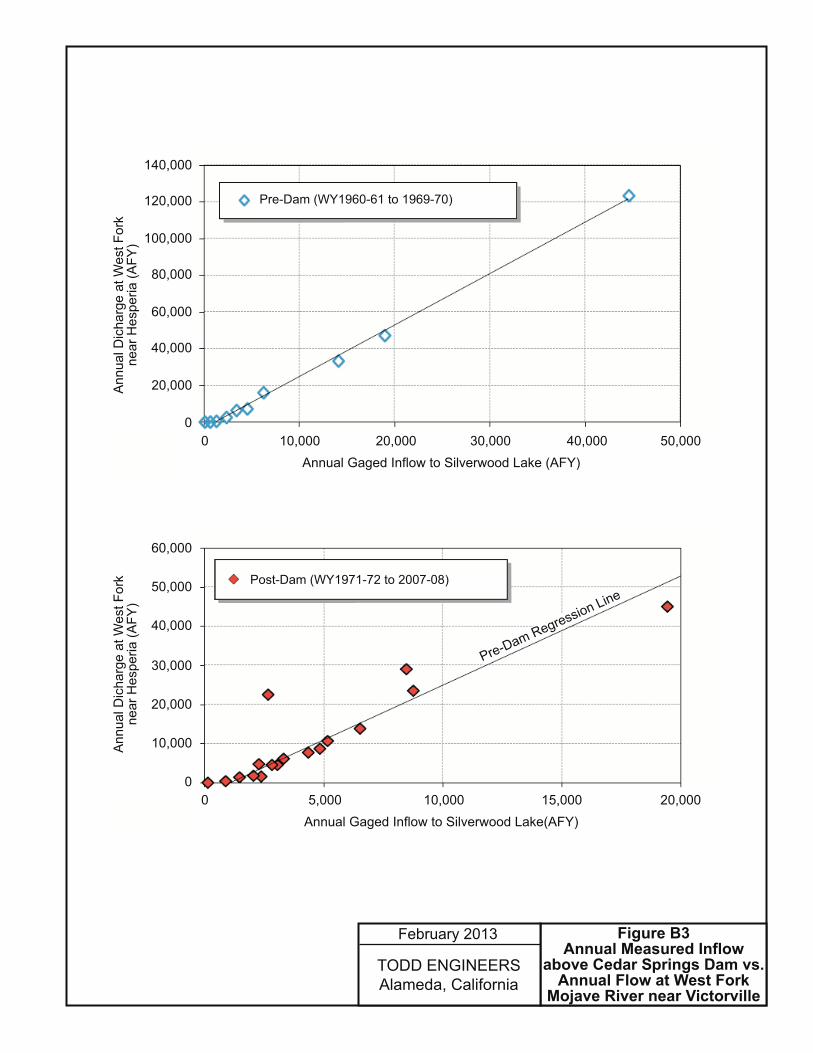
Figure B3 shows the annual measured inflows above Cedar Springs Dam (represented by the sum of
flows in East Fork of West Fork and West Fork above Cedar Springs) plotted against the annual flow at
������������� �������������������������
�������������������������
���� �!���������
������������� ��������������������������
�������������������������
���� �!���������
""
#$""" %"$""" %#$""" &"$"""
%"$"""
&"$"""
'"$"""
("$"""
#"$"""
)"$"""
""
%"$""" '"$""" ("$""" #"$"""
&"$"""
("$"""
)"$"""
*"$"""
%""$"""
%&"$"""
&"$"""
%("$"""
����������� ���� ������������
�������� ����������� ��������� ������� ����������
��! ���"������� ��#�$��������
�+����,�&"%'
-.���/0��0//1����2��$�3��� �����
4���5��2����%67%57&����&""75"*�
4�5��2����%6)"5)%����%6)657"�
4�5��
2�1�
��������
�

FINAL REPORT Conceptual Hydrogeologic Model and Assessment of Water Supply and Demand Todd Engineers Centro and Baja Subareas, Mojave River Groundwater Basin Page B14 Appendix B Evaluation of Dam Impacts
West Fork near Hesperia. Annual values are summarized in Table B1. The upper chart in Figure B3
presents the data reported by Bookman‐Edmonston, Engineering, Inc. (1978) for available pre‐dam
water years (WY) (WY 1960‐61 to WY 1968‐69). As illustrated by the tight clustering of data points
around the best‐fit linear regression line in the upper chart, there is a strong correlation between the
volume of measured inflows above Cedar Springs Dam and the volume of flows below the West Fork
gage near Hesperia under natural (pre‐dam) conditions. The lower chart shows the data points for the
post‐dam period (WY 1971‐72 to WY 2007‐08) in relation to the pre‐dam regression line. It is noted that
there is a long gap in records in gaged inflows to Silverwood Lake from WY 1997‐78 to WY 1994‐95 and
for one or both inflow gages in WY 2002‐03 and WY 2004‐05. The scale has been reduced in the lower
chart to more clearly illustrate the relationship between the pre‐dam and post‐dam periods. As shown
in the lower chart, the post‐dam points also closely cluster around the pre‐dam linear regression line,
indicating that the volume of releases through Cedar Springs Dam is consistent with natural flows that
would have flowed past the dam site if the dam were not constructed.
Flow volumes at West Fork near Hesperia were compared to flow volumes at the Deep Creek gage near
Hesperia for pre‐dam and post‐dam periods. The data are listed below and depicted on Figure B4.
Period
Deep Creek West Fork Total
AF % of Total AF % of Total
AFY
Total 1930‐31 to 2008‐09 3,781,270 67.3% 1,837,028 32.7% 5,618,298
Pre‐Dam 1930‐31 to 1970‐71 1,672,095 66.8% 831,449 33.2% 2,503,543
Post‐Dam 1974‐75 to 2008‐09 2,028,442 67.6% 971,470 32.4% 2,999,913
The table above shows that for the total period of record, the contribution from Deep Creek and West
Fork was 67.3 and 32.7 percent, respectively. Comparison of pre‐dam and post‐dam datasets shows that
contributions from West Fork have decreased marginally (by 0.8 percent) following construction of the
dam. Given that the error for estimated mean daily discharges for the Deep Creek and West Fork gages
average about 20 and 15 percent , respectively, (as reported in 1996 by Lines based on communication
with the USGS) calculated differences are clearly within the margin of error of the gages and may not be
significant.
Figure B4 compares the annual volume of flows at Deep creek versus West Fork pre‐dam (1930‐31 to
1970‐71) and post‐dam (1974‐75 to 2008‐2009) periods (the West Fork gage was inactive from 1971‐72
to 1973‐74). As shown in the figure, the slopes of the best‐fit linear regression lines for the pre‐dam
dataset and post‐dam dataset are virtually identical within the range of flow volumes observed in both
periods. Given the relatively large scatter of data points both above and below the best‐fit regression

AFY AFY
1960 ‐ 1961 73 60
1961 ‐ 1962 6,174 16,302
1962 ‐ 1963 609 85
1963 ‐ 1964 1,289 732
1964 ‐ 1965 3,355 6,329
1965 ‐ 1966 14,069 33,672
1966 ‐ 1967 18,944 47,166
1967 ‐ 1968 4,462 7,548
1968 ‐ 1969 44,495 123,730
1969 ‐ 1970 2,273 2,895
West Fork gage total for WY 1960‐61 is from Apr. through Sep 1961
West Fork gage total for WY 1969‐70 is from Oct. 1969 through Mar. 1970
AFY AFY
1971 ‐ 1972 2,384 1,602
1972 ‐ 1973 8,767 23,668
1973 ‐ 1974 4,852 8,839
1974 ‐ 1975 3,058 4,683
1975 ‐ 1976 3,307 6,204
1976 ‐ 1977 2,067 1,850
1995 ‐ 1996 4,355 7,840
1996 ‐ 1997 5,158 10,660
1997 ‐ 1998 19,421 45,260
1998 ‐ 1999 1,479 1,472
1999 ‐ 2000 2,286 4,843
2000 ‐ 2001 2,830 4,660
2001 ‐ 2002 155 0
2003 ‐ 2004 2,682 22,585
2005 ‐ 2006 8,484 29,061
2006 ‐ 2007 901 442
2007 ‐ 2008 6,534 13,952
Flows from 1971‐72 through 1973‐74 estimated from West Fork below
Mojave River Dam gage
Records for total gaged inflows to Silverwood Lake are incomplete for:
WY 1977‐78 to 1994‐95; 2002‐03, 2004‐05
Table B1. Annual Measured Inflow above Cedar Springs Dam vs. Annual Flow at West Fork Mojave River near Hesperia
Pre-Dam Period
Water
Year
Annual Gaged Inflow
to Silverwood Lake
Annual Discharge at West
Fork near Hesperia
Post-Dam Period
Water
Year
Annual Gaged Inflow
to Silverwood Lake
Annual Discharge at West
Fork near Hesperiaa

����������� ������������������������� ����������������
���
�������� ������
���
�����
�����
����
�� ��
�����
����
�����
�
����������� ����������� �� ������
�������������������������������������������������������
��������
�!����"�����
#$���%&'(&%%)*����+�������, �-��
���� ����������� �� ���� ������������������������������������������������������
!�"�#$%&'%#�����"�(&&)'&$*
���������
��./�����
��/������
���/�����
���������
./�����
/������
�/�����
/������� ��������������������/������ ��/��������������� ��������� ��/������ 0��������
1 ���������.0�./�� ���������
1���������������� ���.��.��
+�,�&�-&(-.
+�,�&�/%/.

FINAL REPORT Conceptual Hydrogeologic Model and Assessment of Water Supply and Demand Todd Engineers Centro and Baja Subareas, Mojave River Groundwater Basin Page B17 Appendix B Evaluation of Dam Impacts
lines for both datasets, the volume of releases through Cedar Springs Dam appear to be consistent with
natural flows that would have flowed past the dam site if the dam were not constructed.
On Figure B5, a double mass curve showing cumulative annual flows for Deep Creek versus West Fork
for pre‐dam (1930‐31 to 1970‐71) and post‐dam (1974‐75 to 2008‐2009) periods was developed to
examine the potential impact of Cedar Springs Dam on the volumes of downstream flows in West Fork.
As shown in the figure, the slope of the best‐fit linear regression line for the pre‐dam dataset indicates
that the annual volume of flow at the West Fork gage was historically 50.25 percent of the annual
volume of flow at the Deep Creek gage prior to the construction of the dams. Whereas, since the
construction of Cedar Springs Dam, the annual volume of flow at the West Fork gage has been 47.37
percent (2.88 percent less) than the annual volume of flow at the Deep Creek gage prior to the dam.
While the calculated difference shown on the double mass curve may reflect negative impacts from
Silverwood Lake or other anthropogenic activities on flows above the West Fork gage near Hesperia, the
statistical significance of the calculated difference cannot be made from this chart. Notwithstanding this
uncertainty, to provide some perspective, the 2.88 percent difference is equivalent to a potential loss of
27,800 AF (or 780 AFY on average) of West Fork flows over the 35‐year post‐dam period evaluated.
While measurable, these volumes represent only 0.93 percent of the nearly 3,000,000 AF (85,200 AFY)
of combined flows for the two gages and would not likely have any significant impact on Mojave River
flows to the Centro and Baja subareas.
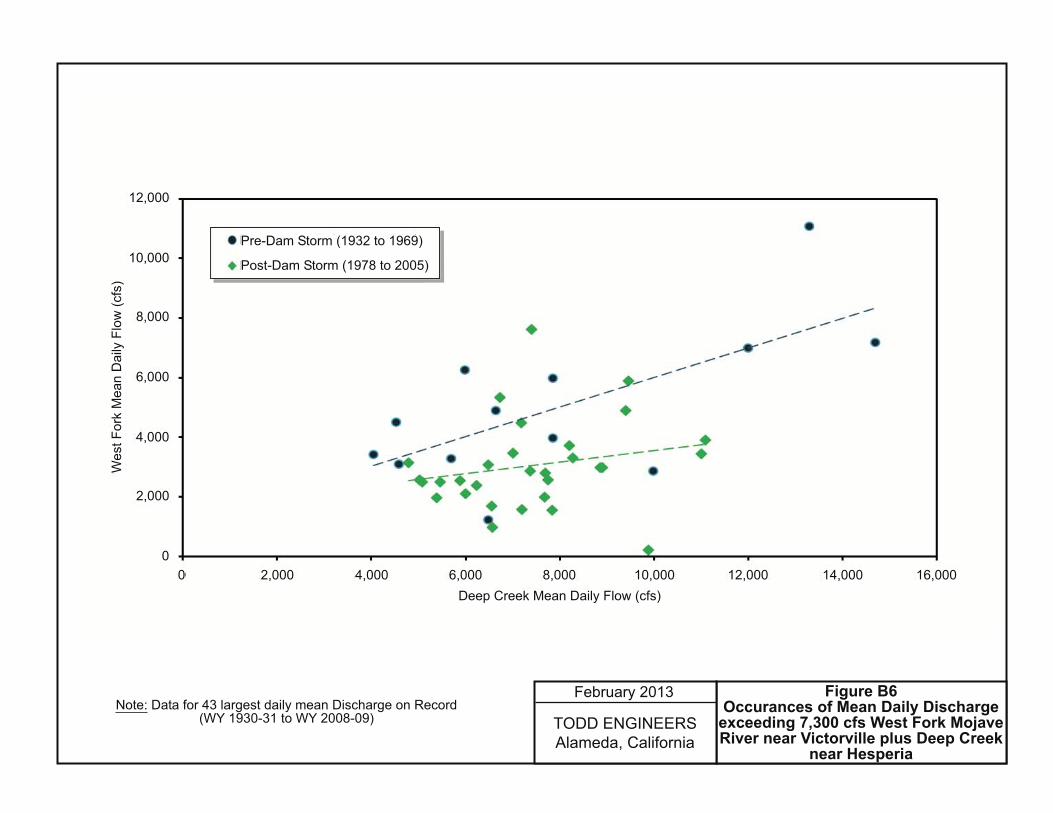
Although the operation of Silverwood Lake does not appear to have changed the natural volume of
flows in West Fork, the flood attenuation effect of Silverwood Lake on flow rates in West Fork has not
been verified in previous studies. To do so, selected mean daily flows for West Fork near Hesperia were
compared to same‐day mean daily flow rates at Deep Creek near Hesperia for pre‐dam and post‐dam
periods. Since the attenuation effect of Silverwood Lake was most likely to have been greatest during
large storm events, dates associated with the largest combined discharge from the two gages were
selected for evaluation. Figure B6 shows the comparison of mean daily flows for the West Fork and
Deep Creek gages above the Mojave River Dam for the 43 largest discharges on record, which range
from 7,370 to 24,400 cfs (data from storms producing combined discharge at The Forks above 7,300 cfs
were also later used in the evaluation of the downstream effect of Mojave River Dam). Data points and
the best‐fit linear regression line in blue color represent pre‐dam conditions, while data points and the
best‐fit linear regression line in green color represent post‐dam conditions. While some data scatter
around respective best‐fit linear regression lines are evident in both datasets, the relative locations of
the regression lines indicates that the operation of Silverwood Lake has decreased mean daily flows in
the West Fork compared to natural (pre‐dam) conditions during large storm events. The divergence of
the regression lines in the direction of increasing flow rate for Deep Creek further indicates that the
attenuation effect of Silverwood Lake increases with larger storm events.

����������� ����� �������� ���������������� �������������������� ���������������� ��
���
����
���
���
����
����
�����
����
����
�����
����
��� �
�!
������������"����#������������������������������ ��!
$������ �$������������ �$������������ �$������������
%���"�� ������������&��&�!
%���"�� ��&'�&$������(���!
�
$�����
�������
�$�����
�������
�������
��������� ������������������������������������������������������������������
������� ������������������
��)���*�����
+,""�-./0.--12�������#� ����
.��3�"�����'�����������������1������ �������������������(���!
���������������� ��� ��������
������
��������� ��� ��������
�� ����� ����� ����� ����� ������ ������ ������ ������
�����
�����
�����
�����
������
������
������������ ���������� ��� ��������� ���
�������������������������������� !�"�!����� ��#�����!�����$�������$�%����
�� ��&��$���
�� �!������"
#$���%&'(&%%)*+ ,�-��� ������
&���.���������"� �/����-� ��,�������0�/�����)����-��1��2"�3"������1�����3�2�
4��3�,�*���,���2"������2�2�
4���3�,�*���,���25��������6�

FINAL REPORT Conceptual Hydrogeologic Model and Assessment of Water Supply and Demand Todd Engineers Centro and Baja Subareas, Mojave River Groundwater Basin Page B20 Appendix B Evaluation of Dam Impacts
The results of the analyses conducted with respect to Cedar Springs Dam indicate that the operation of
Silverwood Lake has little to no effect on the volume of flow in West Fork. However, the attenuation
effect of Silverwood Lake is measurable, at least for larger storm events. While comparisons of
maximum mean daily flows for Deep Creek and West Fork illustrate this effect, detailed accounting of
flows before and after maximum mean daily discharges are needed to quantify and track the
attenuation effect of Silverwood Lake downstream to the Mojave River Dam. While such an evaluation
was beyond the scope of this study, considering that natural inflows to Silverwood Lake during larger
storms are released typically within 24 and less than 48 hours (i.e., similar to the detention times
calculated by Durbin and Hardt [1974] in their analysis of downstream impacts from the Mojave River
Dam), it seems likely that the impact of stormflow detention in Silverwood Lake on downstream flows
would be similar to the impact of the Mojave River Dam on the volume of flows at Barstow, which were
found by Durbin and Hardt to be minimal.
1.6 Evaluation of Streamflow Data related to Mojave River Dam
While collective evidence from previous studies suggests that the effect of Mojave River Dam on
downstream flows and groundwater recharge is relatively small, the examination of more recent data
has not been performed. As stated in the dam design manual, the Mojave River Dam regulates
discharges that exceed 7,300 cfs (USACE, 1966). Any flows below 7,300 cfs result in no significant
reservoir storage, and discharge through the outlet works is effectively unrestricted.
As an initial step, the long‐term streamflow record under pre‐dam and post‐dam conditions was
reviewed to identify the frequency at which combined inflow above the Mojave River Dam exceeds
7,300 cfs. Measured inflow above the Mojave River Dam is represented by the sum of mean daily flows
for Deep Creek at Hesperia and West Fork Mojave River near Hesperia. Based on a review of peak
discharges for West Fork and Deep Creek reported by Durbin and Hardt (1974) and Buono and Lang
(1980), it is recognized that there are some additional periods in which the peak inflow above the
Mojave River Dam exceeds 7,300 cfs, while the mean daily inflow does not. However, because these
instances are likely to have resulted in only minor storage in the Forks Reservoir over short periods of
time, these periods were not further considered.
Table B2 shows streamflow data for the dates when the mean daily inflow above The Forks exceeded
7,300 cfs from 1930 through 2010. Shown in the table are the maximum mean daily flows at The Forks
and the associated with maximum daily discharge measured at the downstream gaging stations at
Lower Narrows, Barstow, and Afton. Discharges shown in the table for the downstream gages do not
necessarily occur on the same date as the reported discharge at The Forks. Inspection of the table shows
that since 1930 mean daily inflows at The Forks have exceeded 7,300 cfs on 43 days, of which 30 days
occurred after the Mojave River Dam was completed. Consecutive days exceeding 7,300 cfs are grouped
into 26 storm events in the table. The table reveals the largest two gaps in time between large storm

Storm # Day # The ForksLower
NarrowsBarstow Afton
1931-32 1 1 1932-Feb-09 7,480 7,830 2,410 1,430 2 1938-Mar-02 19,000
3 1938-Mar-03 9,000 1942-43 3 4 1943-Jan-23 13,850 12,200 7,380 NA1957-58 4 5 1958-Apr-03 7,710 5,010 2,500 340
6 1965-Nov-23 7,710 4,180 576 6
7 1965-Dec-29 11,550 5,060 2,460 1,170 1966-67 6 8 1966-Dec-06 12,860 6,860 3,370 403
9 1969-Jan-25 21,890 10 1969-Jan-26 11,840 11 1969-Feb-24 12,250 12 1969-Feb-25 24,400
13 1969-Feb-26 9,050 14 1978-Feb-09 10,250 15 1978-Feb-10 14,300
10 16 1978-Mar-02 8,260 6,850 3,800 2,470 17 1978-Mar-04 14,450
18 1978-Mar-05 11,870 12 19 1980-Jan-29 9,690 4,450 50 NA
20 1980-Feb-16 7,940 21 1980-Feb-17 10,520
14 22 1980-Feb-19 9,560 8,500 7,450 NA23 1983-Mar-01 11,590
24 1983-Mar-02 11,670 16 25 1993-Jan-07 10,117 2,390 475 209 17 26 1993-Jan-14 7,370 5,010 993 1
27 1993-Jan-16 9,410 28 1993-Jan-17 10,340 29 1993-Jan-18 7,980
19 30 1993-Feb-08 11,900 10,200 4,850 1,060 31 1993-Feb-19 15,020
32 1993-Feb-20 8,440 1994-95 21 33 1994-Feb-15 8,780 3,410 600 1
34 1998-Feb-23 7,600
35 1998-Feb-24 7,620 23 36 2004-Oct-20 7,567 676 0 2 24 37 2004-Dec-29 8,630 1,420 2 1
38 2005-Jan-08 10,500 39 2005-Jan-09 15,030 40 2005-Jan-10 12,080 41 2005-Jan-11 15,370 42 2005-Feb-21 11,930 43 2005-Feb-22 8,120
1 Flow above The Forks Dam equals combined flow at West Fork and Deep Creek stream gages2 Date of peak mean daily flow at The Forks that exceeds 7,300 cfs (above Mojave River Dam since 1971) Peak mean daily flows at Lower Narrows, Barstow, and Afton associated with peak flow above the Mojave River Dam and do not necessarily occur on the date shown in the tableNA = Flow at Afton gage not recorded
1,000
1997-98 22 8,000 4,100 162
2004-05 25 14,000 16,300 8,470
3,700
20 13,800 12,500 10,000
2,200
1979-80 13 10,000 8,280 NA
Pos
t-M
ojav
e R
iver
For
ks D
am
1977-78
9 9,700 3,330
1982-83 15 8,950 7,520
1992-9318 7,720 4,060
26 4,500 4,950
4,950
11 7,560 4,900 5,870
Pre
-Moj
ave
Riv
er F
orks
Dam 1937-38 2 16,000 18,000
17,500 11,100
8 21,000 14,800
NA
1965-66 5
1968-69
7 6,050
9,500
Table B2Summary of Mojave River Flows
when Mean Daily Flow above the Mojave River Forks Dam exceeds 7,250 cfs
Period Water Year
Flow above Forks Dam
exceeds 7,250 cfs1
Date2Maximum Mean Daily Flow (cfs)
FINAL REPORT Conceptual Hydrogeologic Model and Assessment of Water Supply and Demand Todd Engineers Centro and Baja Subareas, Mojave River Groundwater Basin Page B22 Appendix B Evaluation of Dam Impacts
events from 1943 to 1958 and from 1969 to 1978, the latter of which coincides with the construction of
the dams. Figure B7 depicts the storm days in order based on magnitude. The figure shows that for the
43 largest discharges on record, flow above the Mojave River Dam ranged from 7,370 to 24,400 cfs. Of
the 43 days, only 4 days exceed 15,000 cfs. All of the flows rates are well below the flow rate for the
standard project flood (94,000 cfs), which is applied over a 3‐day period. Thus, while the reservoir
following a standard project flood is designed to empty in 2.33 days, it is reasonable to assume that
flows associated with 26 largest storms on record were detained on the order of 1 day or less.
If the Mojave River Dam has played a significant role in increasing streamflow losses in the upper basin
(above the Barstow gage) at the expense of downstream flows, the attenuation of discharge rates in the
downstream direction should be greater following the construction of the dams. Figure B7 depicts the
maximum mean daily flows at each of the four gaging stations for the same 26 storm events shown on
Table B2. The figure reveals a significant amount of variability in the attenuation of maximum mean
daily flows measured at The Forks in the downstream direction, and no trend in attenuation is readily
observed between pre‐dam and post‐dam storm events in the chart. The variability in attenuation for
each storm is illustrated also in the plot of the maximum mean daily flow measured at The Forks versus
associated maximum mean daily flow at Barstow (Figure B8). Again no trend is observed between pre‐
dam and post‐dam data in Figure B8. The figures indicate that while the Mojave River Dam is known to
reduce the flow entering the Mojave River during large storms, the attenuation of flow in the
downstream direction is not significantly controlled by the effect of the dam.
In order to identify the key factor causing the variability of downstream attenuation during large storm
events, the examination of mean daily flows during individual storms must be evaluated within the
context of overall rainfall conditions in the headwaters of the river over time. Figure B9 shows the
cumulative mean departure (CMD) curve of precipitation in the Mojave River headwaters from WY
1910‐11 through WY 2007‐08. The CMD curve represents the cumulative difference (departure) in
precipitation relative to mean annual precipitation for the period of record (40.75 inches) and is a useful
method for identifying trends. Positively‐sloped sections of the CMD curve represent periods of above‐
average precipitation, while negatively‐sloped sections of the curve represent periods of below‐average
precipitation. The dashed straight red line represents zero departure from the mean, a condition that
would result if precipitation for every year was equal to the mean precipitation. The area above the
dashed red line represents surplus precipitation, while the area below the dashed red line represents
deficit precipitation. Because the CMD curve is a measure of cumulative conditions relative to the long‐
term average, the CMD curve begins and ends at zero. The CMD curve indicates that climatic conditions
were very wet from 1936 to 1945, which corresponded to in a large surplus in precipitation. This was
followed by an extended dry period that lasted over 20 years until the record flood of 1969. By the end
of the dry period, any gains in precipitation prior to 1945 were effectively erased. Since 1969, wet years
(e.g., 1980, 1983, 1993, and 2005) have yielded significantly above‐average precipitation but are

���������� ��
������
������
������
������
�����
�
�������
��������
���������
���������
���� !���
��������
������""
�������"#
������"#
������$�
�������$�
�������$�
���������
��������
��������
�������#�
�������#�
�������#�
������#�
������#�
������#�
������#�
���%�&���
���%�&���
���������
��������
����������� ��������� ��������������
������� ��� �������� �������� ���������� �
��������� !!�����
���'��(�����
)%���*�+,�**-.�/�01���2�/� ����
���� ��������� ��������������"#$�%& !' %�(��#$�)!!&'%!*
,� / 3��� !�� 4�!�-�!����0
5 3������ 3�
6���& 3
� & �
7 �&�� 4�!�-�!����07��� 4�!�-�!����0
$������ �
��������&�3����/ 3��� !�� 4�!�-�!����0�8�1��$������ �

����������� �����������������������
������
������
����� ���������������������������������������
��������� ��������������� � ������������������������������������� ��������� ��!������� � �����������������!����!��
��������� !"
#$���%&'(&%%�)�����*�+���������
,* ! * !,* � * " * �,*
�*
-*
.*
/*
! *
!�*
!-*
!.*
!/*
� *
0���1�����!23-13,����� /1 2�
0�1�����!2" 1"!����!23 13!�

����������� ��������������������
���������������������������������������
����������
���������������������������� ��
�!��
�!�
�! �
�!"�
�!#�
�!$�
�!%�
�!&�
�!!�
���
'�(��)���
���
*���+
�+
���+
��+
��+
�,�-��.�/�(�(��
*��+
"��+

FINAL REPORT Conceptual Hydrogeologic Model and Assessment of Water Supply and Demand Todd Engineers Centro and Baja Subareas, Mojave River Groundwater Basin Page B26 Appendix B Evaluation of Dam Impacts
infrequent and separated by longer periods of below‐average precipitation. Over the period of record,
the frequency and duration of deficit precipitation (when the CMD curve is below the zero line) has
been low and short, due to the large surplus developed through the mid‐1940s and large single‐year
precipitation in more recent times.
Examination of the peak discharges during the winter floods of 1993, which occurred after a 10‐year
period of below‐average precipitation, is particularly revealing. As shown in Table B2, in January and
February of 1993, five storms produced stormflows on eight days that exceeded 7,300 cfs at The Forks.
In addition, significant flows less than 7,300 cfs (not shown) occurred on several other days. Figure B10
depicts the maximum mean daily discharges measured at the Lower Narrows and Barstow gages for
these 5 storm events. Flows are measured as a percentage of flow at The Forks. The figure shows that
for each of the five storm events, the maximum mean daily flow rate at The Forks is more preserved at
Lower Narrows than further downstream at Barstow, as indicated by the data points for Lower Narrows
plotting above the data points for Barstow. The positive trajectory of both lines over time also indicate
that the maximum mean daily flow rate at The Forks is preserved at a higher and higher percentage at
Lower Narrows and Barstow from storm to storm. Also, a large increase is observed first at Barstow
from the first storm (January 7) to the second storm (January 14), and then later at Barstow from the
second storm (January 14) to the third storm (January 16‐18). This trend represents the process by
which the river channel is progressively saturated in the downstream direction by each successive flood
allowing for a higher and higher percentage of discharge at The Forks to flow to downstream reaches.
Table B2 shows that during the first storm event (January 7), the associated maximum mean daily flow
at Lower Narrows and Barstow respectively represents only 24 and 5 percent of the maximum mean
daily flow at The Forks. However, by the fifth storm event, the associated maximum mean daily flow at
Lower Narrows and Barstow respectively represents 92 and 83 percent of the maximum mean daily flow
at The Forks. This chart confirms the importance of antecedent flooding to downstream flows under
current conditions. A closer examination of Table B2 and Figure B7 also shows that for the three storms
prior to 1958, the maximum mean daily flows were fairly well preserved at Lower Narrows and Barstow
during the first and only large storm. The preservation of flows indicates that historically higher
groundwater levels beneath the river channel precluded the need for antecedent flooding of large
magnitude and long duration to convey flows from The Forks to downstream portions of the Mojave
River Basin.

������������ ������� �������������������� ������������������������������� �!�"����#�!� ������� ���������������#�$�����%�������!�&��#��
'�������!�����������())�
����������� ����
���������������
�������
����������������
��������
!�
"!�
#!�
$!�
%!�
�!!�
���������
����"����
���� ����
�&��!���
�&�"!���
�&������"!�
'(���)*+,*))-.�����/�0���������
��*����&(������������� ������� ������������������� �����������������!�"����#�!
������� ���������������#�$�����%������!�&��#���+�'�������!�����������())�
1����*������
2������
�!/��3����
3/ 3!����
�!/ #!����
��/�!!����
�4/!"!����
�� �������������������&�5��-����

FINAL REPORT Conceptual Hydrogeologic Model and Assessment of Water Supply and Demand Todd Engineers Centro and Baja Subareas, Mojave River Groundwater Basin Page B28 Appendix B Evaluation of Dam Impacts
1.7 Conclusions
Previous studies on the potential impact of the Cedar Springs Dam and Mojave River Dam advanced the
understanding of the factors that influence downstream Mojave River flow and groundwater recharge
along specific reaches within the Mojave River Basin. While no single study presents conclusive evidence
to quantify the effect of the Cedar Springs Dam (Silverwood Lake) and Mojave River Dam on
downstream flows and groundwater recharge, key findings from previous studies and results from the
evaluation of recent streamflow data provide multiple lines of evidence that support the following
conclusions:
1. The construction and operation of Cedar Springs Dam and Silverwood Lake has resulted in little
to no impact on the volume of water that naturally flows in the West Fork of the Mojave River.
2. The construction and operation of the Mojave River Dam has likely resulted in little to no impact
on the volume of flows reaching downstream areas of the basin.
3. The temporary detention of natural inflows (or flood attenuation) in Silverwood Lake during
large flows is measurable for large storm events. To reliably quantify the attenuation effect of
Silverwood Lake on downstream flows, detailed surface water modeling of flows preceding and
following periods of maximum discharge is necessary. However, with similar detention times for
both dams (less than 1 to 2 days), the impact of stormflow detention in Silverwood Lake on
downstream flows is expected to be similar to that of the Mojave River Dam on downstream
flows (i.e., minimal).
4. The effects of the Cedar Springs Dam and Mojave River Dam together represent one potential
factor among several known factors that have influenced the frequency, magnitude, and
duration of downstream stormflows over time.
5. As a percentage of total flow at The Forks, streamflow losses in the two upper‐gaged reaches in
the basin (The Forks to Lower Narrows and Lower Narrows to Barstow) began to increase by
1958 – more than a decade before the construction of the dams. This trend has the proportional
effect of decreasing the volume of flow in the downstream direction.
6. The detention effect of the dams on the volume of flows reaching downgradient portions of the
basin is likely to be small compared to the effect of groundwater level declines beneath the river
channel beginning in the late 1940s/early 1950s, which has increased the absorption potential
of the Mojave River. Groundwater level declines can be attributed to increased groundwater
production in the floodplain and regional aquifers from the late 1940s combined with decreased
storm runoff entering the Mojave River from its headwaters due to dry conditions from 1945 to
1965.

FINAL REPORT Conceptual Hydrogeologic Model and Assessment of Water Supply and Demand Todd Engineers Centro and Baja Subareas, Mojave River Groundwater Basin Page B29 Appendix B Evaluation of Dam Impacts
7. Any minor potential net increase in streamflow losses in the upper portion of the basin as a
consequence of flood attenuation by the upstream dams is offset to some degree by the minor
reduction in stormflow exiting Afton Canyon for the same reason. The net effect of both
processes on downstream water supply has not been quantified, and further examination of
available data for this purpose is not likely to yield conclusive results given the multitude of
factors that affect flow between The Forks and Afton Canyon.
8. Streamflow simulations based on reservoir and river flow routing analyses are highly sensitive to
the subjective river infiltration functions incorporated in the adopted models. However, more
rigorous analysis is not likely to increase the certainty of conclusions on the effect of the dams
on downstream flows and groundwater recharge.
1.8 References
(See master reference list in main report)


