126
APPENDIX B FIELD TESTING RESULTS .

APPENDIX B
FIELD TESTING RESULTS
.
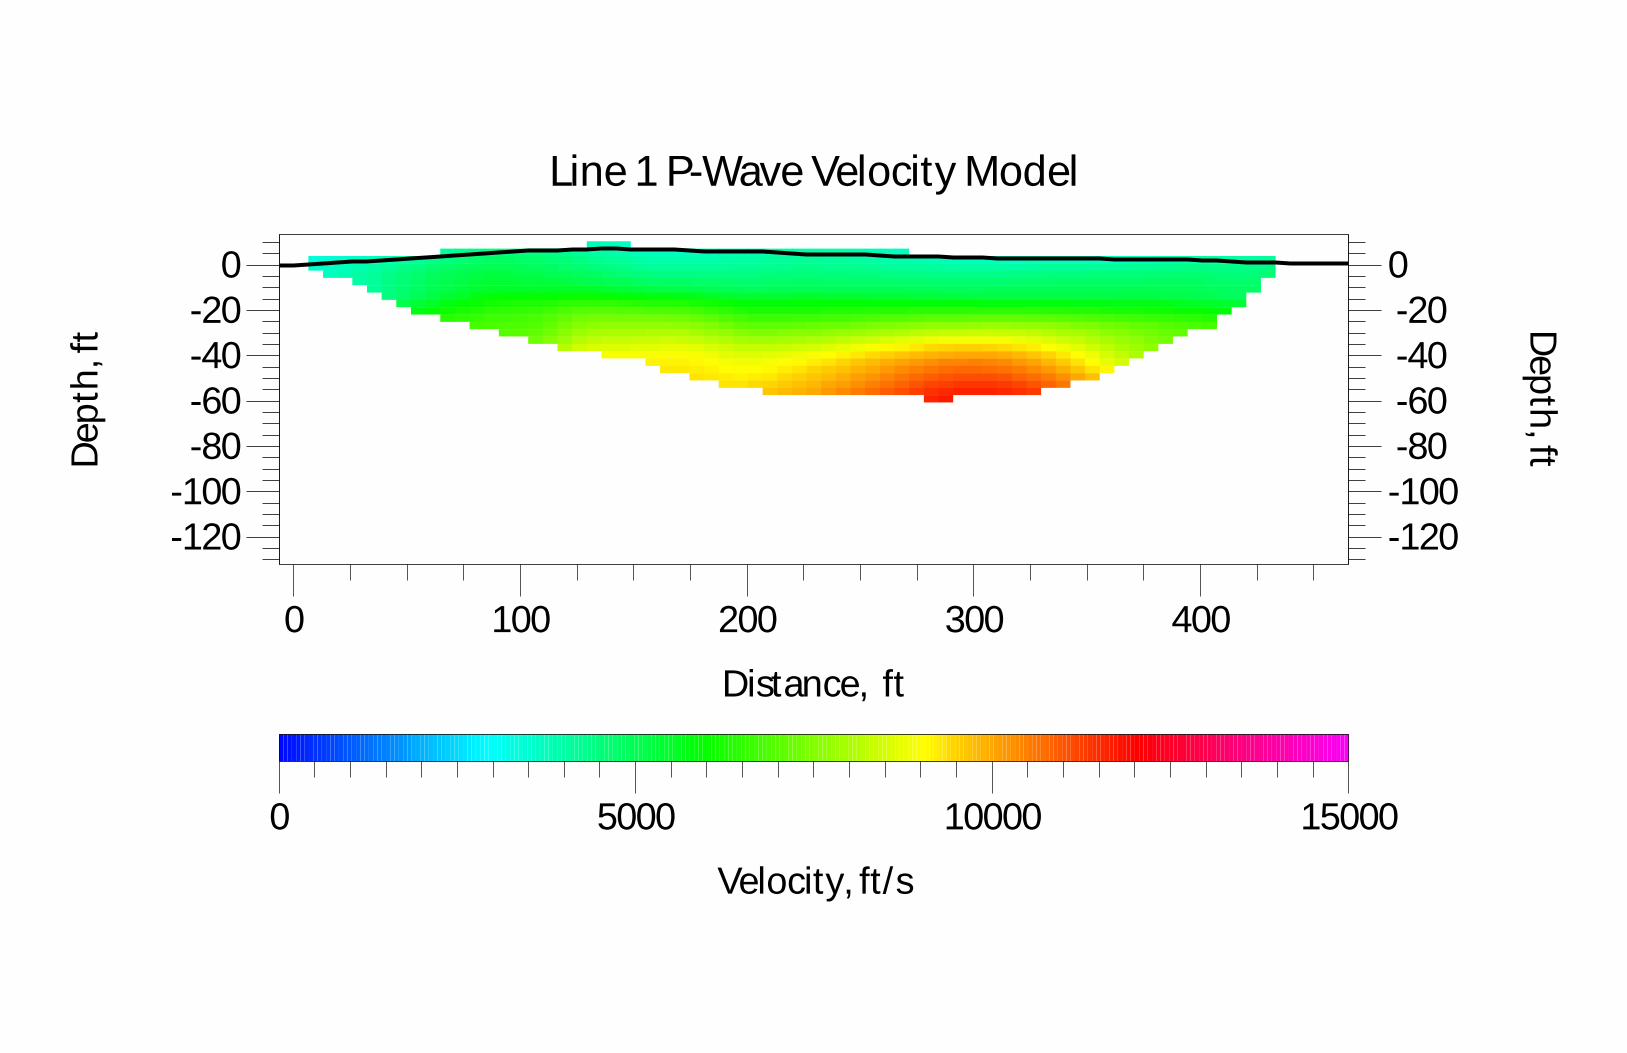
Line 1 P-Wave Velocity Model
0 100 200 300 400
Distance, ft
-120-100 -80 -60 -40 -200
Depth, ft
-120-100 -80 -60 -40 -20
0
Dep
th, f
t
0 5000 10000 15000
Velocity, ft/s

Line 2 P-Wave Velocity Model
0 100 200 300
Distance, ft
-80
-60
-40
-20
0
Depth, ft
-80
-60
-40
-20
0
Dep
th, f
t
0 5000 10000 15000
Velocity, ft/s

Line 3 P-Wave Velocity Model
0 100 200 300
Distance, ft
-80
-60
-40
-20
0
Depth, ft
-80
-60
-40
-20
0
Dep
th, f
t
0 5000 10000 15000
Velocity, ft/s

Line 4 P-Wave Velocity Model
0 100 200 300
Distance, ft
-100
-80
-60
-40
-20
0
Depth, ft
-100
-80
-60
-40
-20
0
Dep
th, f
t
0 5000 10000 15000
Velocity, ft/s

Line 5 P-Wave Velocity Model
0 100 200 300
Distance, ft
-80
-60
-40
-20
0
Depth, ft
-80
-60
-40
-20
0
Dep
th, f
t
0 5000 10000 15000
Velocity, ft/s

Line 6 P-Wave Velocity Model
0 200 400 600
Distance, ft
-150
-100
-50
0
Depth, ft
-150
-100
-50
0
Dep
th, f
t
0 5000 10000 15000
Velocity, ft/s

Line 7 P-Wave Velocity Model
0 50 100 150 200
Distance, ft
-60
-40
-20
0
Depth, ft
-60
-40
-20
0
Dep
th, f
t
0 5000 10000 15000
Velocity, ft/s

Line 8 P-Wave Velocity Model
0 50 100 150 200
Distance, ft
-60
-40
-20
0
Depth, ft
-60
-40
-20
0
Dep
th, f
t
0 5000 10000 15000
Velocity, ft/s

Line 9 P-Wave Velocity Model
0 50 100 150
Distance, ft
-40
-20
0
Depth, ft
-40
-20
0
Dep
th, f
t
0 5000 10000 15000
Velocity, ft/s

Line 10 P-Wave Velocity Model
0 50 100 150 200
Distance, ft
-60
-40
-20
0
Depth, ft
-60
-40
-20
0
Dep
th, f
t
0 5000 10000 15000
Velocity, ft/s

www.colog.com
PROJECT: US HW-60
DATE LOGGED: 15 November 2010
COMPANY: Terracon
WELL: Cut 12
COLOG Main Office Optical Televiewer Image Plot 810 Quail Street, Suite E, Lakewood, CO, 80215
Phone: (303) 279-0171, Fax: (303) 278-0135
Depth1ft:10ft
Optical Televeiwer0° 0°180°90° 270°
Projections0° 0°180°90° 270°
Tadpoles0 90 8
9
10
11
12
13
14
15
Page 1

Depth1ft:10ft
Optical Televeiwer0° 0°180°90° 270°
Projections0° 0°180°90° 270°
Tadpoles0 90
16
17
18
19
20
21
22
23Page 2

Depth1ft:10ft
Optical Televeiwer0° 0°180°90° 270°
Projections0° 0°180°90° 270°
Tadpoles0 90 23
24
25
26
27
Page 3

Stereonet Diagram – Schmidt Projection Optical Televiewer Features
US HW-60 Cut 12
Terracon 15 December 2010
All directions are with respect to magnetic north.

Stereonet Diagram – Schmidt Projection Optical Televiewer Features
US HW-60 Cut 12
Terracon 15 December 2010
All directions are with respect to magnetic north.

Rose Diagram – Dip Directions Optical Televiewer Features
US HW-60 Cut 12
Terracon 15 December 2010
All directions are with respect to magnetic north.

Rose Diagram – Dip Angles Optical Televiewer Features
US HW-60 Cut 12
Terracon 15 December 2010

Orientation Summary Table
Optical Televiewer Features
US HW-60
Cut 12
Terracon
15 December 2010
Feature Depth Depth Dip Dip Feature
No. Direction Angle Rank
(meters) (feet) (degrees) (degrees) (0 to 5)
1 2.90 9.5 9 27 1
2 3.06 10.1 160 7 1
3 3.44 11.3 239 5 1
4 3.48 11.4 225 3 0
5 3.54 11.6 133 3 1
6 3.68 12.1 32 2 1
7 3.79 12.4 79 3 0
8 3.87 12.7 79 5 1
9 3.94 12.9 110 7 0
10 4.05 13.3 94 30 2
11 4.22 13.8 284 28 0
12 4.25 14.0 217 83 1
13 4.27 14.0 128 68 0
14 4.29 14.1 89 5 0
15 4.33 14.2 107 7 1
16 4.37 14.3 271 23 2
17 4.61 15.1 12 3 0
18 4.70 15.4 311 8 1
19 4.88 16.0 22 12 1
20 5.00 16.4 89 10 0
21 5.11 16.8 145 10 0
22 5.23 17.2 35 2 0
23 5.28 17.3 233 85 1
24 5.32 17.4 84 3 0
25 5.51 18.1 15 3 0
26 5.56 18.3 56 5 1
27 5.65 18.5 322 3 0
28 5.71 18.7 326 5 0
29 6.04 19.8 276 5 0
30 6.14 20.2 103 2 1
31 6.31 20.7 22 3 0
32 6.60 21.6 202 9 0
33 6.68 21.9 106 9 0
34 6.89 22.6 234 5 0
35 7.00 23.0 126 36 1
36 7.01 23.0 295 38 1
37 7.08 23.2 51 23 1
38 7.38 24.2 324 8 0
39 7.39 24.3 146 5 0
40 7.53 24.7 228 3 0
41 7.57 24.8 274 9 0
42 7.72 25.3 265 5 1
43 7.79 25.6 160 5 0
44 7.91 25.9 278 17 1
45 8.01 26.3 261 3 0
46 8.09 26.5 264 5 0
All directions are with respect to magnetic north.
Page 1

www.colog.com
PROJECT: US HW-60
DATE LOGGED: 15 December 2010
COMPANY: Terracon
WELL: Cut 16
COLOG Main Office Optical Televiewer Image Plot 810 Quail Street, Suite E, Lakewood, CO, 80215
Phone: (303) 279-0171, Fax: (303) 278-0135
Depth1ft:10ft
Optical Televiewer0° 0°180°90° 270°
Projections0° 0°180°90° 270°
Tadpoles0 90 0
1
2
3
4
5
6
7
Page 1

Depth1ft:10ft
Optical Televiewer0° 0°180°90° 270°
Projections0° 0°180°90° 270°
Tadpoles0 90
8
9
10
11
12
13
14
15Page 2

Depth1ft:10ft
Optical Televiewer0° 0°180°90° 270°
Projections0° 0°180°90° 270°
Tadpoles0 90 15
16
17
18
19
20
21
22
Page 3

Depth1ft:10ft
Optical Televiewer0° 0°180°90° 270°
Projections0° 0°180°90° 270°
Tadpoles0 90
23
24
25
26
27
28
29
Page 4

www.colog.com
PROJECT: US HW-60
DATE LOGGED: 15 December 2010
COMPANY: Terracon
WELL: Cut 16
COLOG Main Office Acoustic Televiewer Image Plot 810 Quail Street, Suite E, Lakewood, CO, 80215
Phone: (303) 279-0171, Fax: (303) 278-0135
Depth1ft:10ft
Acoustic Image0° 0°180°90° 270°
Projections0° 0°180°90° 270°
Tadpoles0 90
7
8
9
10
11
12
13
Page 1
Depth1ft:10ft
Acoustic Image0° 0°180°90° 270°
Projections0° 0°180°90° 270°
Tadpoles0 90
14
15
16
17
18
19
20
21
Page 2

Depth1ft:10ft
Acoustic Image0° 0°180°90° 270°
Projections0° 0°180°90° 270°
Tadpoles0 90
22
23
24
25
26
27
28
29
Page 3
Depth1ft:10ft
Acoustic Image0° 0°180°90° 270°
Projections0° 0°180°90° 270°
Tadpoles0 90
30
31
32
33
34
35
36
37
Page 4

Depth1ft:10ft
Acoustic Image0° 0°180°90° 270°
Projections0° 0°180°90° 270°
Tadpoles0 90
38
39
40
41
42
43
44
45Page 5

Depth1ft:10ft
Acoustic Image0° 0°180°90° 270°
Projections0° 0°180°90° 270°
Tadpoles0 90 45
46
47
48
49
50
51
52
Page 6

Depth1ft:10ft
Acoustic Image0° 0°180°90° 270°
Projections0° 0°180°90° 270°
Tadpoles0 90
53
54
55
56
57
58
59
60
Page 7

Depth1ft:10ft
Acoustic Image0° 0°180°90° 270°
Projections0° 0°180°90° 270°
Tadpoles0 90
61
62
63
64
65
66
67
68
Page 8

Depth1ft:10ft
Acoustic Image0° 0°180°90° 270°
Projections0° 0°180°90° 270°
Tadpoles0 90
Page 9

Stereonet Diagram – Schmidt Projection Optical & Acoustic Televiewer Features
US HW-60 Cut 16
Terracon 15 December 2010
All directions are with respect to magnetic north.

Stereonet Diagram – Schmidt Projection Optical & Acoustic Televiewer Features
US HW-60 Cut 16
Terracon 15 December 2010
All directions are with respect to magnetic north.

Rose Diagram – Dip Directions Optical & Acoustic Televiewer Features
US HW-60 Cut 16
Terracon 15 December 2010
All directions are with respect to magnetic north.

Rose Diagram – Dip Angles Optical & Acoustic Televiewer Features
US HW-60 Cut 16
Terracon 15 December 2010

Orientation Summary TableOptical Acoustic Televiewer Features
US HW-60Cut 16
Terracon15 December 2010
All directions are with respect to magnetic north.Page 1
Feature Depth Depth Dip Dip FeatureNo. Direction Angle Rank
(meters) (feet) (degrees) (degrees) (0 to 5)1 2.81 9.2 269 7 12 2.98 9.8 233 6 13 3.18 10.4 200 2 14 3.22 10.6 83 2 15 3.32 10.9 256 21 16 3.54 11.6 104 7 17 3.62 11.9 172 7 18 3.72 12.2 245 7 09 3.79 12.4 210 14 0
10 3.85 12.6 155 7 111 4.04 13.2 251 9 112 4.13 13.5 61 7 113 4.48 14.7 144 7 114 4.55 14.9 164 14 115 4.87 16.0 148 17 016 5.00 16.4 29 72 117 5.05 16.6 215 2 018 5.17 17.0 222 7 119 5.24 17.2 232 7 120 5.37 17.6 200 7 121 5.47 18.0 235 6 122 5.54 18.2 249 4 023 5.86 19.2 246 69 124 5.87 19.3 96 2 125 6.05 19.8 67 65 126 6.25 20.5 184 2 027 6.75 22.1 155 4 128 6.91 22.7 354 26 229 6.94 22.8 336 27 230 7.08 23.2 55 2 031 7.79 25.6 250 4 032 8.42 27.6 0 0 033 8.66 28.4 215 4 034 8.75 28.7 152 2 035 9.00 29.5 334 4 136 9.21 30.2 206 3 037 9.50 31.2 155 1 138 9.65 31.7 185 3 039 9.72 31.9 232 3 040 9.79 32.1 257 6 041 9.92 32.6 232 4 242 10.07 33.0 125 8 143 10.28 33.7 145 1 244 10.74 35.2 0 0 045 10.88 35.7 288 1 046 11.06 36.3 320 4 0

Orientation Summary TableOptical Acoustic Televiewer Features
US HW-60Cut 16
Terracon15 December 2010
All directions are with respect to magnetic north.Page 2
Feature Depth Depth Dip Dip FeatureNo. Direction Angle Rank
(meters) (feet) (degrees) (degrees) (0 to 5)47 11.15 36.6 112 29 148 11.32 37.1 97 9 149 11.45 37.6 271 4 250 11.67 38.3 0 0 151 11.69 38.4 238 3 052 11.88 39.0 269 3 053 12.03 39.5 186 3 054 12.15 39.9 0 0 055 12.31 40.4 87 1 156 12.50 41.0 75 4 157 12.58 41.3 74 3 158 12.77 41.9 33 3 059 13.19 43.3 137 12 060 13.26 43.5 75 3 061 13.31 43.7 322 3 062 13.47 44.2 298 0 063 13.58 44.6 128 1 064 13.85 45.5 92 3 065 14.05 46.1 186 1 066 14.18 46.5 359 11 167 14.28 46.9 206 4 168 14.36 47.1 0 0 069 14.94 49.0 102 1 170 15.17 49.8 62 7 171 15.30 50.2 211 1 172 15.58 51.1 0 0 073 15.72 51.6 134 3 074 15.91 52.2 0 0 175 16.02 52.6 88 1 076 16.25 53.3 108 9 077 16.39 53.8 0 0 178 16.49 54.1 260 1 279 16.65 54.6 215 9 080 16.83 55.2 145 1 081 16.94 55.6 68 3 182 17.10 56.1 232 6 083 17.29 56.7 161 1 084 17.56 57.6 176 1 085 17.70 58.1 317 0 086 17.79 58.4 142 1 087 17.95 58.9 237 1 088 18.11 59.4 0 0 189 18.34 60.2 0 0 090 18.47 60.6 147 4 091 18.59 61.0 194 1 092 18.69 61.3 113 1 0

Orientation Summary TableOptical Acoustic Televiewer Features
US HW-60Cut 16
Terracon15 December 2010
All directions are with respect to magnetic north.Page 3
Feature Depth Depth Dip Dip FeatureNo. Direction Angle Rank
(meters) (feet) (degrees) (degrees) (0 to 5)93 18.74 61.5 210 1 094 19.00 62.4 240 7 195 19.36 63.5 273 3 196 19.45 63.8 195 1 097 19.66 64.5 214 1 098 19.85 65.1 213 1 099 20.04 65.7 347 5 1
100 20.10 65.9 190 3 0

PROJECT: US HW-60
www.colog.comDATE LOGGED: 15 December 2010
COMPANY: Terracon
WELL: Cut 19
COLOG Main Office 810 Quail Street, Suite E, Lakewood, CO, 80215
Optical Televiewer Image Plot
Phone: (303) 279-0171, Fax: (303) 278-0135
Depth1ft:10ft
Optical Televiewer0° 0°180°90° 270°
Projections0° 0°180°90° 270°
Tadpoles0 90 2
3
4
5
6
7
8
9
Page 1

Depth1ft:10ft
Optical Televiewer0° 0°180°90° 270°
Projections0° 0°180°90° 270°
Tadpoles0 90
10
11
12
13
14
15
16
17Page 2

Depth1ft:10ft
Optical Televiewer0° 0°180°90° 270°
Projections0° 0°180°90° 270°
Tadpoles0 90 17
18
19
20
21
22
23
24
Page 3

Depth1ft:10ft
Optical Televiewer0° 0°180°90° 270°
Projections0° 0°180°90° 270°
Tadpoles0 90
25
26
27
28
29
30
31
32
Page 4

Depth1ft:10ft
Optical Televiewer0° 0°180°90° 270°
Projections0° 0°180°90° 270°
Tadpoles0 90
33
34
35
36
37
38
39
40
Page 5

Depth1ft:10ft
Optical Televiewer0° 0°180°90° 270°
Projections0° 0°180°90° 270°
Tadpoles0 90
41
42
43
44
45
46
47
48
Page 6

Depth1ft:10ft
Optical Televiewer0° 0°180°90° 270°
Projections0° 0°180°90° 270°
Tadpoles0 90
49
50
51
52
53
54
55
56Page 7

Depth1ft:10ft
Optical Televiewer0° 0°180°90° 270°
Projections0° 0°180°90° 270°
Tadpoles0 90 56
57
58
59
60
61
62
Page 8

Stereonet Diagram – Schmidt Projection Optical Televiewer Features
US HW-60 Cut 19
Terracon 15 December 2010
All directions are with respect to magnetic north.

Stereonet Diagram – Schmidt Projection Optical Televiewer Features
US HW-60 Cut 19
Terracon 15 December 2010
All directions are with respect to magnetic north.

Rose Diagram – Dip Directions Optical Televiewer Features
US HW-60 Cut 19
Terracon 15 December 2010
All directions are with respect to magnetic north.

Rose Diagram – Dip Angles Optical Televiewer Features
US HW-60 Cut 19
Terracon 15 December 2010

Orientation Summary TableOptical Televiewer Features
US HW-60Cut 19
Terracon15 December 2010
All directions are with respect to magnetic north.Page 1
Feature Depth Depth Dip Dip FeatureNo. Direction Angle Rank
(meters) (feet) (degrees) (degrees) (0 to 5)1 4.93 16.2 102 19 02 5.18 17.0 315 15 03 5.24 17.2 152 21 04 5.52 18.1 117 11 15 6.03 19.8 327 4 06 6.14 20.2 327 2 07 6.26 20.5 302 2 08 6.46 21.2 116 2 09 6.57 21.6 195 2 1
10 6.70 22.0 177 7 011 7.16 23.5 140 4 012 7.21 23.6 288 2 013 7.56 24.8 125 2 014 7.68 25.2 38 4 015 8.05 26.4 33 2 016 8.14 26.7 92 4 017 8.26 27.1 75 7 018 8.41 27.6 274 19 119 8.88 29.1 42 4 120 8.93 29.3 306 2 021 8.96 29.4 107 2 022 9.01 29.6 283 2 023 9.12 29.9 0 0 024 9.26 30.4 347 2 025 9.32 30.6 35 2 026 9.81 32.2 0 0 027 10.18 33.4 0 0 028 10.74 35.2 305 2 029 11.07 36.3 252 2 030 11.38 37.4 270 2 131 11.42 37.5 288 2 032 12.07 39.6 318 2 033 12.27 40.3 307 2 034 12.52 41.1 6 2 035 12.80 42.0 0 0 036 12.95 42.5 185 2 037 13.24 43.4 79 2 038 13.34 43.8 275 38 139 13.62 44.7 223 4 040 13.77 45.2 171 7 041 14.34 47.1 142 2 042 14.63 48.0 152 2 043 14.98 49.1 78 9 044 15.08 49.5 327 14 145 15.12 49.6 185 27 146 15.92 52.2 0 0 1

Orientation Summary TableOptical Televiewer Features
US HW-60Cut 19
Terracon15 December 2010
All directions are with respect to magnetic north.Page 2
Feature Depth Depth Dip Dip FeatureNo. Direction Angle Rank
(meters) (feet) (degrees) (degrees) (0 to 5)47 16.47 54.1 197 35 148 16.53 54.2 190 28 149 16.98 55.7 240 31 150 17.12 56.2 282 25 151 17.68 58.0 325 16 152 17.81 58.4 329 2 053 18.32 60.1 37 2 0

PROJECT: US HW-60
www.colog.comDATE LOGGED: 15 December 2010
COMPANY: Terracon
WELL: Cut 22
COLOG Main Office 810 Quail Street, Suite E, Lakewood, CO, 80215
Optical Televiewer Image Plot
Phone: (303) 279-0171, Fax: (303) 278-0135
Depth1ft:10ft
Optical Televiewer0° 0°180°90° 270°
Projections0° 0°180°90° 270°
Tadpoles0 90
1
2
3
4
5
6
7
Page 1

Depth1ft:10ft
Optical Televiewer0° 0°180°90° 270°
Projections0° 0°180°90° 270°
Tadpoles0 90
8
9
10
11
12
13
14
15Page 2

Depth1ft:10ft
Optical Televiewer0° 0°180°90° 270°
Projections0° 0°180°90° 270°
Tadpoles0 90
16
17
18
19
20
21
22
Page 3

Depth1ft:10ft
Optical Televiewer0° 0°180°90° 270°
Projections0° 0°180°90° 270°
Tadpoles0 90
23
24
25
26
27
28
29
30
Page 4

Depth1ft:10ft
Optical Televiewer0° 0°180°90° 270°
Projections0° 0°180°90° 270°
Tadpoles0 90
31
32
Page 5

Stereonet Diagram – Schmidt Projection Optical Televiewer Features
US HW-60 Cut 22
Terracon 15 December 2010
All directions are with respect to magnetic north.

Stereonet Diagram – Schmidt Projection Optical Televiewer Features
US HW-60 Cut 22
Terracon 15 December 2010
All directions are with respect to magnetic north.

Rose Diagram – Dip Directions Optical Televiewer Features
US HW-60 Cut 22
Terracon 15 December 2010
All directions are with respect to magnetic north.

Rose Diagram – Dip Angles Optical Televiewer Features
US HW-60 Cut 22
Terracon 15 December 2010

Orientation Summary TableOptical Televiewer Features
US HW-60Cut 22
Terracon15 December 2010
All directions are with respect to magnetic north.Page 1
Feature Depth Depth Dip Dip FeatureNo. Direction Angle Rank
(meters) (feet) (degrees) (degrees) (0 to 5)1 1.06 3.5 167 85 12 1.71 5.6 278 4 03 1.96 6.4 0 0 04 2.29 7.5 69 9 05 2.70 8.9 77 7 06 2.86 9.4 197 44 07 2.91 9.6 205 9 08 3.32 10.9 162 4 09 3.54 11.6 186 7 0
10 3.96 13.0 159 7 211 4.02 13.2 284 25 112 4.05 13.3 283 23 113 4.49 14.7 183 41 114 4.77 15.6 139 4 015 5.18 17.0 152 33 116 5.24 17.2 161 23 117 5.42 17.8 223 80 218 6.05 19.9 115 2 019 6.13 20.1 115 11 020 6.33 20.8 124 17 021 6.50 21.3 99 21 022 6.59 21.6 134 31 023 6.77 22.2 235 10 124 6.87 22.5 240 9 125 6.95 22.8 249 17 126 7.03 23.1 246 9 127 7.16 23.5 205 7 128 7.69 25.2 134 10 129 7.73 25.4 280 70 130 8.19 26.9 259 23 131 8.24 27.0 89 2 032 8.38 27.5 86 4 133 8.76 28.8 289 2 034 9.13 30.0 120 2 035 9.33 30.6 145 2 0

APPENDIX C
LABORATORY TESTING
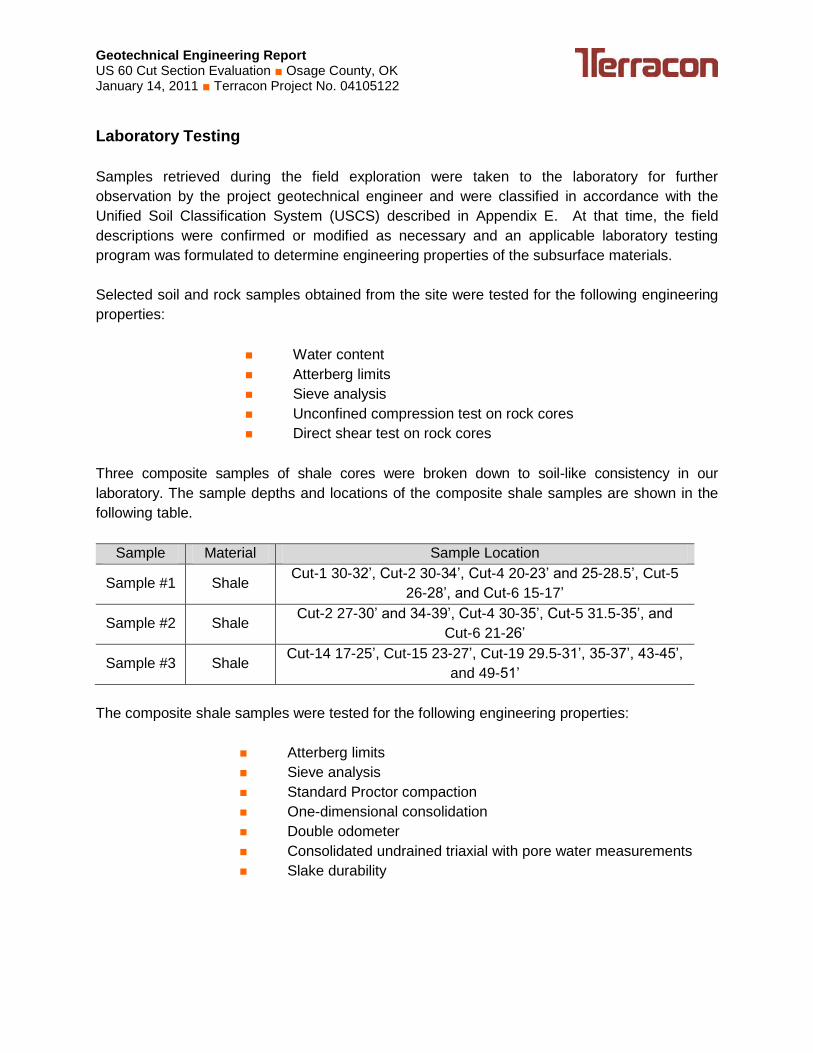
Geotechnical Engineering Report US 60 Cut Section Evaluation ■ Osage County, OK January 14, 2011 ■ Terracon Project No. 04105122
Laboratory Testing
Samples retrieved during the field exploration were taken to the laboratory for further
observation by the project geotechnical engineer and were classified in accordance with the
Unified Soil Classification System (USCS) described in Appendix E. At that time, the field
descriptions were confirmed or modified as necessary and an applicable laboratory testing
program was formulated to determine engineering properties of the subsurface materials.
Selected soil and rock samples obtained from the site were tested for the following engineering
properties:
Water content
Atterberg limits
Sieve analysis
Unconfined compression test on rock cores
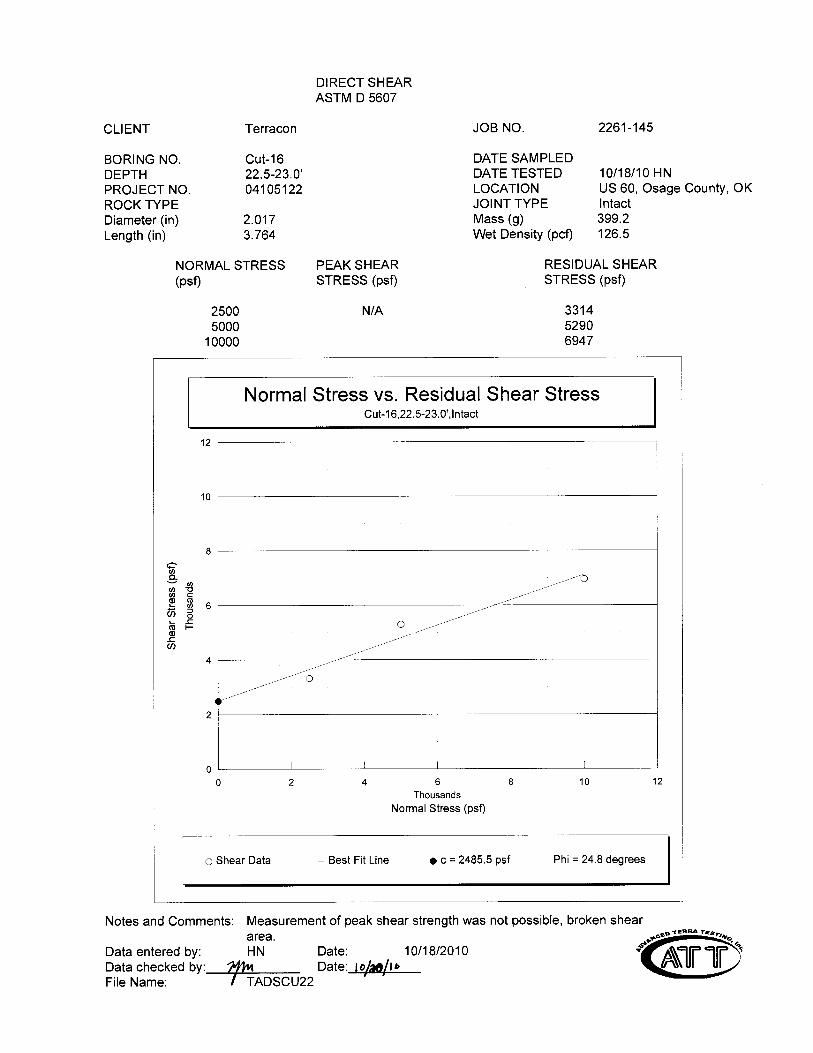
Direct shear test on rock cores
Three composite samples of shale cores were broken down to soil-like consistency in our
laboratory. The sample depths and locations of the composite shale samples are shown in the
following table.
Sample Material Sample Location
Sample #1 Shale Cut-1 30-32‟, Cut-2 30-34‟, Cut-4 20-23‟ and 25-28.5‟, Cut-5
26-28‟, and Cut-6 15-17‟
Sample #2 Shale Cut-2 27-30‟ and 34-39‟, Cut-4 30-35‟, Cut-5 31.5-35‟, and
Cut-6 21-26‟
Sample #3 Shale Cut-14 17-25‟, Cut-15 23-27‟, Cut-19 29.5-31‟, 35-37‟, 43-45‟,
and 49-51‟
The composite shale samples were tested for the following engineering properties:
Atterberg limits
Sieve analysis
Standard Proctor compaction
One-dimensional consolidation
Double odometer
Consolidated undrained triaxial with pore water measurements
Slake durability

Geotechnical Engineering Report US 60 Cut Section Evaluation ■ Osage County, OK January 14, 2011 ■ Terracon Project No. 04105122
Also, three composite samples of sandstone and limestone rock cores were chosen from the
following locations and depths shown in the following table:
Sample Material Sample Location
Sample #4 Limestone Cut-11 15-27‟, Cut-15 11-20‟, Cut-16 10-20‟, and Cut-23 0.5-8‟
Sample #5 Sandstone Cut-1 15-25‟, Cut-2 20-24‟, Cut-4 15-19‟, Cut-5 10-25‟, Cut-6
13-15‟, and Cut-22 3.5-13‟
Sample #6 Sandstone Cut-14 7-16‟, Cut-17 17-22‟, Cut-18 11-22.5‟, Cut-19 15-19‟,
and Cut-20 15-20‟
Those composite samples of sandstone and limestone rock cores were tested for the following
engineering properties:
Los Angeles Abrasion
Aggregate Durability Index

1 3/4 1/23/8
LL PL
4
coarse
D100
coarse
2006P
ER
CE
NT
FIN
ER
BY
WE
IGH
T
medium
GRAIN SIZE IN MILLIMETERS
90
45
50
55
60
65
70
75
85
30
95
100 10 1 0.1 0.01 0.001
100
80
40
35
0
5
10
15
20
25
PI
%SiltD30
Cu
fine
50
Cc3.5ft3.5ft3.5ft3.5ft3.5ft
D60
3
Specimen Identification
00000
Classification
3.5ft
%Sand
706456
GRAIN SIZE DISTRIBUTION
3.5ft3.5ft
38
3.5ft
25D10
Project: US Highway 60Site: 2 Miles East of SH-99 extending East 6 Miles Osage County, OKJob #: 04105122Date: 11-11-10
3.5ft
18
Specimen Identification
fine
HYDROMETER
47
U.S. SIEVE NUMBERS
25444131
20222623
U.S. SIEVE OPENING IN INCHES
CUT-19
GRAVEL SANDSILT OR CLAY
4
CUT-15CUT-16
CUT-18
14
9.52
9.54.75
CUT-17
CUT-17
TC_G
RA
IN_S
IZE
CU
T B
OR
ING
LO
GS
.GP
J T
ER
RA
CO
N.G
DT
11/
11/1
060
%Gravel %Clay
COBBLES
CUT-16
0
CUT-18CUT-19
100 1403 2
CUT-15
FAT CLAY(CH)
98100888796
LEAN CLAY(CL)LEAN CLAY(CL)
4.75
FAT CLAY(CH)
0
16
FAT CLAY(CH)
1.5
12134
20 30 40
00
6 810
00
1

3/81/23/41 4
LL
mediumcoarse
GRAIN SIZE IN MILLIMETERS
PL
5
PE
RC
EN
T FI
NE
R B
Y W
EIG
HT
75
80
85
90
95
65
60
100 10 1 0.1 0.01 0.001
100
20
0
70
15
25
30
35
40
45
50
55
10
50
fine
D30
3.5ft
Cu
0
PI Cc
6
Classification
0
3
0
3.5ft
D10
575951
GRAIN SIZE DISTRIBUTION
3.5ft3.5ft
3.5ft 24
Project: US Highway 60Site: 2 Miles East of SH-99 extending East 6 Miles Osage County, OKJob #: 04105122Date: 11-11-10
3.5ft
%Sand %Silt
Specimen Identification
Specimen Identification
1927
HYDROMETERU.S. SIEVE OPENING IN INCHES U.S. SIEVE NUMBERS
333232
fine
CUT-7
100 1403 2
CUT-6
%Clay
COBBLESGRAVEL SAND
SILT OR CLAY
4 16TC
_GR
AIN
_SIZ
E C
UT
BO
RIN
G L
OG
S.G
PJ
TE
RR
AC
ON
.GD
T 1
1/11
/10
200
coarse
CUT-6
D60
CUT-24
60
%Gravel
CUT-7
D100
99
6 810
00
CUT-24 96
82
FAT CLAY(CH)FAT CLAY(CH)
FAT CLAY with SAND(CH)
01
14
4.754.75
4
1.5
18
20 30 40
2

SIEVE DIAMETER, PASS,SIZE mm %
1.5" 37.5 1001" 25.0 100
3/4" 19.0 1001/2" 12.5 1003/8" 9.50 98#4 4.75 92
#10 2.00 85#20 0.850 81#40 0.425 80#60 0.250 80#140 0.106 79#200 0.075 77.1
SAMPLE USCS UNIFIED NATID DESCRIPTION SYMBOL M% LL PL PI
PROJECT US 60
JOB NO. DATE
N:\Projects\2010\04105122\Lab Results\Sample-1 Shale Testing on Remolded Sample\[04105122 GradALPlot Sample 1 - B.xlsm]REPORT
04105122 10/18/2010
BORINGID
DEPTH,feet
CL1LEAN CLAY WITH SAND
GRAY WITH LIGHT BROWN
GRAIN SIZE DISTRIBUTION CURVE
14
ATTERBERG LIMITS
30 16
0
10
20
30
40
50
60
70
80
90
100
0.010.1110100
PA
SS
ING
, %
PARTICLE DIAMETER, mm

SIEVE DIAMETER, PASS,SIZE mm %
1.5" 37.5 1001" 25.0 100
3/4" 19.0 1001/2" 12.5 1003/8" 9.50 100#4 4.75 100
#10 2.00 98#20 0.850 96#40 0.425 93#60 0.250 91#140 0.106 90#200 0.075 89.6
SAMPLE USCS UNIFIED NATID DESCRIPTION SYMBOL M% LL PL PI
PROJECT US 60
JOB NO. DATE
N:\Projects\2010\04105122\Lab Results\Sample-2 Shale Testing on Remolded Sample\[04105122 GradALPlot Sample 2.xlsm]REPORT
04105122 10/14/2010
BORINGID
DEPTH,feet
CL2LEAN CLAY
GRAY AND DARK BROWN
GRAIN SIZE DISTRIBUTION CURVE
16
ATTERBERG LIMITS
40 24
0
10
20
30
40
50
60
70
80
90
100
0.010.1110100
PA
SS
ING
, %
PARTICLE DIAMETER, mm

SIEVE DIAMETER, PASS,SIZE mm %
1.5" 37.5 1001" 25.0 100
3/4" 19.0 1001/2" 12.5 993/8" 9.50 99#4 4.75 95
#10 2.00 90#20 0.850 87#40 0.425 86#60 0.250 85#140 0.106 85#200 0.075 83.7
SAMPLE USCS UNIFIED NATID DESCRIPTION SYMBOL M% LL PL PI
PROJECT US 60
JOB NO. DATE
N:\Projects\2010\04105122\Lab Results\Sample-3 Shale Testing on Remolded Sample\[04105122 GradALPlot Sample 3 - B.xlsm]REPORT
04105122 10/18/2010
BORINGID
DEPTH,feet
CL3LEAN CLAY WITH SAND
GRAY AND DARK GRAY
GRAIN SIZE DISTRIBUTION CURVE
14
ATTERBERG LIMITS
35 21
0
10
20
30
40
50
60
70
80
90
100
0.010.1110100
PA
SS
ING
, %
PARTICLE DIAMETER, mm


Laboratory Compaction Characteristics of Soil 13910 West 96th TerraceLenexa, Kansas 66215913-492-7777
Client Name: Oklahoma Department of Transportation Project No.: 04105122 Date: 10/14/2010Project Name: US 60Location: US 60 From 2 Miles East of Jct. US-60/SH-99
Extending East 6 Miles TEST RESULTS
Source Material: SAMPLE #1 Maximum Dry Unit Wt.: 118.0 pcf Optimum Water Content: 12.3 %
Sample Description: LEAN CLAY WITH SAND (WEATHERED SHALE), GRAY WITH LIGHT BROWN
Material Designation: Sample date: Liquid Limit: 30 Plastic Limit: 16Test Method: AASHTO T99 (STANDARD) Plasticity Index: 14Test Procedure: Method A Natural Moisture, %:Sample Preparation: Dry Preparation % passing # 200 sieve: 66.6Rammer: X Mechanical Manual Reviewed by: XC
Zero air voids for specific gravity of 2.70
121
123
N:\Projects\2010\04105122\Lab Results\Sample-1 Shale Testing on Remolded Sample\[04105122 ProctorReport Sample 1rev.xlsx]REPORT
103
105
107
109
111
113
115
117
119
121
123
3 5 7 9 11 13 15 17 19 21 23
Dry
Uni
t Wei
ght,
pcf
Water Content, %Data Points Max. Dry Unit Wt. and Opt. Water Content - - - - Zero Air

Laboratory Compaction Characteristics of Soil 13910 West 96th TerraceLenexa, Kansas 66215913-492-7777
Client Name: Oklahoma Department of Transportation Project No.: 04105122 Date: 10/14/2010Project Name: US 60Location: US 60 From 2 Mile East of Jct. US-60/SH-99
Extending East 6 Miles TEST RESULTS
Source Material: SAMPLE #2 Maximum Dry Unit Wt.: 116.3 pcf Optimum Water Content: 14.6 %
Sample Description: LEAN CLAY (WEATHERED SHALE), GRAY &DARK BROWN
Material Designation: Sample date: Liquid Limit: 40 Plastic Limit: 24Test Method: AASHTO T99 (STANDARD) Plasticity Index: 16Test Procedure: Method A Natural Moisture, %:Sample Preparation: Dry Preparation % passing # 200 sieve: 89.6Rammer: X Mechanical Manual Reviewed by: XC
Zero air voids for specific gravity of 2.70
121
123
N:\Projects\2010\04105122\Lab Results\Sample-2 Shale Testing on Remolded Sample\[04105122 ProctorReport Sample 2.xlsx]REPORT
103
105
107
109
111
113
115
117
119
121
123
5 7 9 11 13 15 17 19 21 23 25
Dry
Uni
t Wei
ght,
pcf
Water Content, %Data Points Max. Dry Unit Wt. and Opt. Water Content - - - - Zero Air

Laboratory Compaction Characteristics of Soil 13910 West 96th TerraceLenexa, Kansas 66215913-492-7777
Client Name: Oklahoma Department of Transportation Project No.: 04105122 Date: 10/14/2010Project Name: US 60Location: US 60 From 2 Mile East of Jct. US-60/SH-99
Extending East 6 Mile TEST RESULTS
Source Material: SAMPLE #3 Maximum Dry Unit Wt.: 116.7 pcf Optimum Water Content: 13.7 %
Sample Description: LEAN CLAY WITH SAND (WEATHERED SHALE), GRAY & DARK GRAY
Material Designation: Sample date: Liquid Limit: 35 Plastic Limit: 21Test Method: AASHTO T99 (STANDARD) Plasticity Index: 14Test Procedure: Method A Natural Moisture, %:Sample Preparation: Dry Preparation % passing # 200 sieve: 32.7Rammer: X Mechanical Manual Reviewed by: XC
Zero air voids for specific gravity of 2.70
121
123
N:\Projects\2010\04105122\Lab Results\Sample-3 Shale Testing on Remolded Sample\[04105122 ProctorReport Sample 3rev.xlsx]REPORT
103
105
107
109
111
113
115
117
119
121
123
5 7 9 11 13 15 17 19 21 23 25
Dry
Uni
t Wei
ght,
pcf
Water Content, %Data Points Max. Dry Unit Wt. and Opt. Water Content - - - - Zero Air

ONE-DIMENSIONAL CONSOLIDATION PROPERTIES OF COHESIVE SOILSASTM D2435
DIAMETER, mm 63.57 HEIGHT, mm 19.00 PROPERTY BEFORE TEST AFTER TEST OVERBURDEN PRESSURE, tsf NA MOISTURE, % 11.4 15.1 PRECONSOL. PRESSURE, tsf 1.36 DRY DENSITY, pcf 110.3 120.3 OVER CONSOLIDATION RATIO NA SATURATION, % 58 105 COMPRESSION INDEX 0.16 VOID RATIO 0.529 0.385 REBOUND INDEX 0.031 SAMPLE TYPE RECOMPACTED LIQUID LIMIT PLASTIC LIMIT PLASTICITY INDEX SPECIFIC GRAVITY 2.7 ESTIMATED SAMPLE DESCRIPTION LEAN CLAY WITH SAND (WEATHERED SHALE), GRAY WITH LIGHT BROWN BORING NO. COMPOSITE SAMPLE SAMPLE NO. SAMPLE #1 DEPTH, feet
TESTED BY KJL
APPROVED BY XC
N:\Projects\2010\04105122\Lab Results\Sample-1 Shale Testing on Remolded Sample\[04105122 Consolidation -SAMPLE 1rev.xlsx]REPORT elogP
30 16 14
10/15/2010
US 60
04105122
0.32
0.34
0.36
0.38
0.40
0.42
0.44
0.46
0.48
0.50
0.52
0.54
0.1 1 10 100
VOID
RAT
IO, e
PRESSURE, tsf

US 60
0410512210/15/2010
ADDITIONAL CONSOLIDATION DATA
COMPOSITE SAMPLESAMPLE #1
PRESSURE, Cv50, Cv90, Av, Mv, k,tsf cm2/sec cm2/sec cm2/g cm2/g cm/sec
00.5 3.34E-06 2.19E-060.75 2.26E-03 2.27E-03 4.34E-05 2.84E-05 6.42E-08
1 1.07E-03 1.08E-03 3.26E-05 2.15E-05 2.30E-082 2.81E-03 2.83E-03 3.53E-05 2.34E-05 6.58E-084 2.22E-03 2.24E-03 2.07E-05 1.40E-05 3.12E-088 1.93E-03 1.94E-03 1.19E-05 8.27E-06 1.59E-0816 2.92E-03 2.93E-03 6.19E-06 4.46E-06 1.30E-08
AVERAGE 2.20E-03 2.21E-03 2.19E-05 1.46E-05 3.55E-08
N:\Projects\2010\04105122\Lab Results\Sample-1 Shale Testing on Remolded Sample\[04105122 Consolidation -SAMPLE 1rev.xlsx]REPORT elogP

ONE-DIMENSIONAL CONSOLIDATION PROPERTIES OF COHESIVE SOILSASTM D2435
DIAMETER, mm 63.60 HEIGHT, mm 19.10 PROPERTY BEFORE TEST AFTER TEST OVERBURDEN PRESSURE, tsf NA MOISTURE, % 13.6 15.2 PRECONSOL. PRESSURE, tsf 2.00 DRY DENSITY, pcf 109.4 122.6 OVER CONSOLIDATION RATIO NA SATURATION, % 68 102 COMPRESSION INDEX 0.17 VOID RATIO 0.540 0.413 REBOUND INDEX 0.041 SAMPLE TYPE RECOMPACTED LIQUID LIMIT PLASTIC LIMIT PLASTICITY INDEX SPECIFIC GRAVITY 2.7 ESTIMATED SAMPLE DESCRIPTION LEAN CLAY (WEATHERED SHALE), GRAY AND DARK BROWN BORING NO. COMPOSITE SAMPLE SAMPLE NO. SAMPLE 2 DEPTH, feet
TESTED BY KJL
APPROVED BY XC
N:\Projects\2010\04105122\Lab Results\Sample-2 Shale Testing on Remolded Sample\[04105122 Consolidation -SAMPLE 2.xlsx]REPORT elogP
40 24 16
10/15/2010
US 60
04105122
0.34
0.36
0.38
0.40
0.42
0.44
0.46
0.48
0.50
0.52
0.54
0.56
0.1 1 10 100
VOID
RAT
IO, e
PRESSURE, tsf

US 60
0410512210/15/2010
ADDITIONAL CONSOLIDATION DATA
COMPOSITE SAMPLESAMPLE 2
PRESSURE, Cv50, Cv90, Av, Mv, k,tsf cm2/sec cm2/sec cm2/g cm2/g cm/sec
00.81 9.04E-04 9.09E-04 2.30E-05 1.49E-05 1.35E-08
1.5 1.97E-03 1.98E-03 2.59E-05 1.69E-05 3.32E-082 7.62E-04 7.67E-04 2.68E-05 1.76E-05 1.34E-084 1.21E-03 1.22E-03 2.34E-05 1.55E-05 1.88E-088 8.38E-04 8.42E-04 1.31E-05 8.97E-06 7.51E-0916 1.20E-02 1.21E-02 6.78E-06 4.79E-06 5.77E-08
AVERAGE 2.95E-03 2.97E-03 1.99E-05 1.31E-05 2.40E-08
N:\Projects\2010\04105122\Lab Results\Sample-2 Shale Testing on Remolded Sample\[04105122 Consolidation -SAMPLE 2.xlsx]REPORT elogP
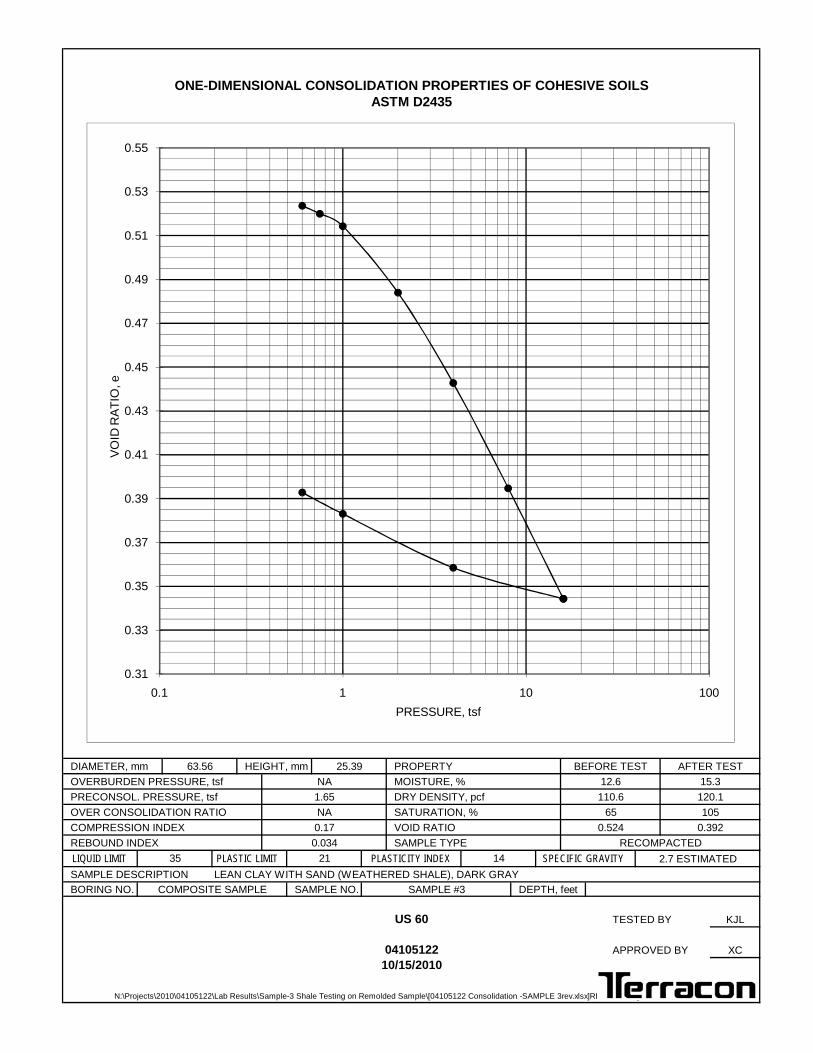
ONE-DIMENSIONAL CONSOLIDATION PROPERTIES OF COHESIVE SOILSASTM D2435
DIAMETER, mm 63.56 HEIGHT, mm 25.39 PROPERTY BEFORE TEST AFTER TEST OVERBURDEN PRESSURE, tsf NA MOISTURE, % 12.6 15.3 PRECONSOL. PRESSURE, tsf 1.65 DRY DENSITY, pcf 110.6 120.1 OVER CONSOLIDATION RATIO NA SATURATION, % 65 105 COMPRESSION INDEX 0.17 VOID RATIO 0.524 0.392 REBOUND INDEX 0.034 SAMPLE TYPE RECOMPACTED LIQUID LIMIT PLASTIC LIMIT PLASTICITY INDEX SPECIFIC GRAVITY 2.7 ESTIMATED SAMPLE DESCRIPTION LEAN CLAY WITH SAND (WEATHERED SHALE), DARK GRAY BORING NO. COMPOSITE SAMPLE SAMPLE NO. SAMPLE #3 DEPTH, feet
TESTED BY KJL
APPROVED BY XC
N:\Projects\2010\04105122\Lab Results\Sample-3 Shale Testing on Remolded Sample\[04105122 Consolidation -SAMPLE 3rev.xlsx]REPORT elogP
35 21 14
10/15/2010
US 60
04105122
0.31
0.33
0.35
0.37
0.39
0.41
0.43
0.45
0.47
0.49
0.51
0.53
0.55
0.1 1 10 100
VOID
RAT
IO, e
PRESSURE, tsf

US 60
0410512210/15/2010
ADDITIONAL CONSOLIDATION DATA
COMPOSITE SAMPLESAMPLE #3
PRESSURE, Cv50, Cv90, Av, Mv, k,tsf cm2/sec cm2/sec cm2/g cm2/g cm/sec
00.6 7.79E-07 5.11E-070.75 4.06E-04 4.08E-04 2.49E-05 1.64E-05 6.63E-09
1 9.89E-04 9.94E-04 2.31E-05 1.52E-05 1.50E-082 3.65E-03 3.67E-03 3.10E-05 2.05E-05 7.47E-084 2.12E-03 2.13E-03 2.10E-05 1.42E-05 3.00E-088 1.38E-03 1.39E-03 1.23E-05 8.50E-06 1.18E-0816 3.27E-02 3.29E-02 6.44E-06 4.62E-06 1.51E-07
AVERAGE 6.87E-03 6.91E-03 1.71E-05 1.14E-05 4.82E-08
N:\Projects\2010\04105122\Lab Results\Sample-3 Shale Testing on Remolded Sample\[04105122 Consolidation -SAMPLE 3rev.xlsx]REPORT elogP

ONE-DIMENSIONAL CONSOLIDATION PROPERTIES OF COHESIVE SOILSASTM D2435 - MODIFIED
DIAMETER, mm 63.55 HEIGHT, mm 25.37 PROPERTY BEFORE TEST AFTER TEST OVERBURDEN PRESSURE, tsf NA MOISTURE, % 13.3 13.9 PRECONSOL. PRESSURE, tsf 1.61 DRY DENSITY, pcf 111.2 120.0 OVER CONSOLIDATION RATIO NA SATURATION, % 70 95 COMPRESSION INDEX 0.17 VOID RATIO 0.516 0.394 REBOUND INDEX 0.031 SAMPLE TYPE RECOMPACTED LIQUID LIMIT PLASTIC LIMIT PLASTICITY INDEX SPECIFIC GRAVITY 2.7 ESTIMATED SAMPLE DESCRIPTION LEAN CLAY WITH SAND (WEATHERED SHALE), GRAY & DARK GRAY BORING NO. COMPOSITE SAMPLE SAMPLE NO. SAMPLE #3 - DRY DEPTH, feet
TESTED BY KJL
APPROVED BY XC
N:\Projects\2010\04105122\Lab Results\Sample-3 Shale Testing on Remolded Sample\[04105122 Consolidation -SAMPLE 3 dry rev.xlsx]REPORT elogP
35 21 14
11/4/2010
US 60
04105122
0.31
0.33
0.35
0.37
0.39
0.41
0.43
0.45
0.47
0.49
0.51
0.53
0.55
0.1 1 10 100
VOID
RAT
IO, e
PRESSURE, tsf

US 60
0410512211/4/2010
ADDITIONAL CONSOLIDATION DATA
COMPOSITE SAMPLESAMPLE #3 - DRY
PRESSURE, Cv50, Cv90, Av, Mv, k,tsf cm2/sec cm2/sec cm2/g cm2/g cm/sec
00.25 2.48E-06 1.64E-060.5 6.20E-07 4.09E-071 4.77E-03 4.80E-03 1.33E-05 8.80E-06 4.20E-082 5.15E-03 5.18E-03 2.19E-05 1.45E-05 7.46E-084 7.80E-03 7.84E-03 2.37E-05 1.60E-05 1.24E-078 1.17E-02 1.18E-02 1.35E-05 9.39E-06 1.10E-0716 2.50E-03 2.51E-03 6.18E-06 4.45E-06 1.11E-08
AVERAGE 6.39E-03 6.43E-03 1.17E-05 7.88E-06 7.25E-08
N:\Projects\2010\04105122\Lab Results\Sample-3 Shale Testing on Remolded Sample\[04105122 Consolidation -SAMPLE 3 dry rev.xlsx]REPORT elogP

SAMPLE TYPE RECOMPACTED LIQUID LIMIT PLASTIC LIMIT PLASTICITY INDEX SPECIFIC GRAVITY 2.7 ESTIMATED SAMPLE DESCRIPTION LEAN CLAY WITH SAND (WEATHERED SHALE), GRAY & DARK GRAY BORING NO. COMPOSITE SAMPLE SAMPLE NO. SAMPLE #3 DEPTH, feet
TESTED BY KJL
APPROVED BY XC
N:\Projects\2010\04105122\Lab Results\Sample-3 Shale Testing on Remolded Sample\[04105122 ConsolCurveConbined-SAMPLE 3.xlsx]REPORT elogP
11/4/2010
US 60
04105122
ONE-DIMENSIONAL CONSOLIDATION PROPERTIES OF COHESIVE SOILSASTM D2435 - MODIFIED
35 21 14
0.31
0.33
0.35
0.37
0.39
0.41
0.43
0.45
0.47
0.49
0.51
0.53
0.55
0.1 1 10 100
VOID
RAT
IO, e
PRESSURE, tsf
Dry Series Inundated Series

EFFECTIVE STRESS --- ANGLE OF INTERNAL FRICTION, deg
TOTAL STRESS ANGLE OF INTERNAL FRICTION, deg
SPECIMEN ID: A B C
WATER CONTENT, % 12.3 12.7 11.9
DRY DENSITY, pcf 111.4 110.9 112.0
SATURATION, % 65 66 64
VOID RATIO 0.51 0.52 0.50
WATER CONTENT, % 18.1 17.2 15.3
DRY DENSITY, pcf 113.2 115.1 119.2
SATURATION (B PARAMETER) 0.96 0.98 0.96
VOID RATIO 0.49 0.46 0.41
FINAL BACK PRESSURE, psi 100.5 100.2 100.4
MINOR PRINCIPAL STRESS, psi 7.4 15.1 29.3
EFFECTIVE STRESS PEAK AT % STRAIN 3.0 3.0 3.0
EFF. DEVIATOR STRESS AT PEAK STRAIN, psi 6.7 12.2 23.1
TOTAL STRESS PEAK AT % STRAIN 3.0 3.0 3.0
TOTAL DEVIATOR STRESS AT PEAK STRAIN, psi 6.7 12.2 23.1
CONTROLLED - STRAIN TEST ULTIMATE DEVIATOR STRESS (15% STR), psi 8.8 15.3 29.3
SAMPLE TYPE: TIME TO 50% PRIMARY CONSOLIDATION, min 1.60 1.10 1.10
DESCRIPTION OF SPECIMENS: 7.94 8.08 8.10
INITIAL DIAMETER, inch 1.999 2.001 1.996
INITIAL HEIGHT, inch 4.047 4.046 4.050
LL 30 PL 16 PI 14 Gs 2.7 EST. AREA AFTER CONSOLIDATION, inch2 3.101 3.062 2.994
PROJECT:
BORING #:
SAMPLE #:
DEPTH, feet:
N:\Projects\2010\04105122\Lab Results\Sample-1 Shale Testing on Remolded Sample\[04105122 Triaxial CU SAMPLE 1rev.xlsx]REPORT
TERRACON - LENEXALABORATORY:
DATE: 10/15/2010
LEAN CLAY WITH SAND (WEATHERED SHALE), GRAY WITH LIGHT BROWN
US 60
STRAIN RATE, % / hour
BE
FOR
E S
HE
AR
28.3
15.8
COMPOSITE SAMPLE
SAMPLE #1
INIT
IAL
PROCEDURE: ASTM D4767, CONSOLIDATED-UNDRAINED TRIAXIAL COMPRESSION TEST ON COHESIVE SOILS
PROJECT NO. 04105122
RECOMPACTED
0.2
0.4
COHESION, psi
COHESION, psi
0
5
10
15
20
25
30
35
0 5 10 15 20
DEVIATOR
STRESS,
PSI
STRAIN, %
0
10
20
30
40
50
0 10 20 30 40 50 60 70 80 90 100 110 120 130 140 150
SHEAR
STRESS,
psi
NORMAL STRESS, psi

US 60
04105122 COMPOSITE SAMPLE SAMPLE #1
REMARKS:
SPECIMENS SATURATED BY THE WET METHOD.
EFFECTIVE STRESS FAILURE DATA BASED ON 3 % STRAIN.
EFFECTIVE STRESS MOHR'S CIRCLES DRAWN AT 3 % STRAIN.
TOTAL STRESS FAILURE DATA BASED ON 3 % STRAIN.
TOTAL STRESS MOHR'S CIRCLES DRAWN AT 3 % STRAIN.
DEVIATOR STRESSES CORRECTED FOR MEMBRANE AND FILTER PAPER EFFECTS.
AREA AFTER CONSOLIDATION CALCULATED AS PER SECTION 10.3.2.1 METHOD A
STANDARD PROCTOR = 118pcf @ 12.3% MOISTURE
REMOLDED TO 111.4 pcf @ 12.3% MOISTURE REMOLDED TO 94.4% COMPACTION
N:\Projects\2010\04105122\Lab Results\Sample-1 Shale Testing on Remolded Sample\[04105122 Triaxial CU SAMPLE 1rev.xlsx]REPORT
FAILURE SKETCH FAILURE SKETCH FAILURE SKETCH
SPECIMEN A SPECIMEN B SPECIMEN C
0.0
0.5
1.0
1.5
2.0
2.5
3.0
3.5
0 5 10 15 20
PRINCIPAL
STRESS
RATIO
STRAIN, %

US 60
04105122 COMPOSITE SAMPLE SAMPLE #1
N:\Projects\2010\04105122\Lab Results\Sample-1 Shale Testing on Remolded Sample\[04105122 Triaxial CU SAMPLE 1rev.xlsx]REPORT
0.0
0.1
0.2
0.3
0.4
0.5
0.6
0.7
0.8
0 5 10 15 20
PORE
PRESSURE
/
DEVIATOR
STRESS
STRAIN, %
0
10
20
30
0 10 20 30 40 50 60 70 80 90 100
SHEAR
STRESS,
PSI
NORMAL STRESS, PSI
A B C
0
2
4
6
8
10
12
14
16
18
20
0 5 10 15 20
PORE
PRESSURE,
PSI
STRAIN, %

EFFECTIVE STRESS --- ANGLE OF INTERNAL FRICTION, deg
TOTAL STRESS ANGLE OF INTERNAL FRICTION, deg
SPECIMEN ID: A B C
WATER CONTENT, % 14.8 15.0 14.6
DRY DENSITY, pcf 109.7 109.7 109.3
SATURATION, % 75 75 73
VOID RATIO 0.54 0.54 0.54
WATER CONTENT, % 17.6 18.8 16.0
DRY DENSITY, pcf 114.1 111.7 117.6
SATURATION (B PARAMETER) 0.98 0.97 0.97
VOID RATIO 0.48 0.51 0.43
FINAL BACK PRESSURE, psi 99.8 100.2 100.4
MINOR PRINCIPAL STRESS, psi 8.0 14.5 29.2
EFFECTIVE STRESS PEAK AT % STRAIN 3.0 3.0 3.0
EFF. DEVIATOR STRESS AT PEAK STRAIN, psi 6.7 10.4 22.7
TOTAL STRESS PEAK AT % STRAIN 3.0 3.0 3.0
TOTAL DEVIATOR STRESS AT PEAK STRAIN, psi 6.7 10.4 22.7
CONTROLLED - STRAIN TEST ULTIMATE DEVIATOR STRESS (15% STR), psi 7.6 11.7 25.8
SAMPLE TYPE: TIME TO 50% PRIMARY CONSOLIDATION, min 1.20 1.20 1.20
DESCRIPTION OF SPECIMENS: 8.08 8.10 8.24
INITIAL DIAMETER, inch 2.000 1.997 2.002
INITIAL HEIGHT, inch 4.041 4.046 4.053
LL 40 PL 24 PI 16 Gs 2.7 EST. AREA AFTER CONSOLIDATION, inch2 3.034 3.113 2.986
PROJECT:
BORING #:
SAMPLE #:
DEPTH, feet:
N:\Projects\2010\04105122\Lab Results\Sample-2 Shale Testing on Remolded Sample\[04105122 Triaxial CU SAMPLE 2.xlsx]REPORT
TERRACON - LENEXALABORATORY:
DATE: 10/15/2010
LEAN CLAY (WEATHERED SHALE), GRAY & DARK BROWN
US 60
STRAIN RATE, % / hour
BE
FOR
E S
HE
AR
27.7
16.2
COMPOSITE SAMPLE
SAMPLE #2
INIT
IAL
PROCEDURE: ASTM D4767, CONSOLIDATED-UNDRAINED TRIAXIAL COMPRESSION TEST ON COHESIVE SOILS
PROJECT NO. 04105122
RECOMPACTED
0.0
0.0
COHESION, psi
COHESION, psi
0
5
10
15
20
25
30
0 5 10 15 20
DEVIATOR
STRESS,
PSI
STRAIN, %
0
10
20
30
40
50
0 10 20 30 40 50 60 70 80 90 100 110 120 130 140 150
SHEAR
STRESS,
psi
NORMAL STRESS, psi

US 60
04105122 COMPOSITE SAMPLE SAMPLE #2
REMARKS:
SPECIMENS SATURATED BY THE WET METHOD.
EFFECTIVE STRESS FAILURE DATA BASED ON 3 % STRAIN.
EFFECTIVE STRESS MOHR'S CIRCLES DRAWN AT 3 % STRAIN.
TOTAL STRESS FAILURE DATA BASED ON 3 % STRAIN.
TOTAL STRESS MOHR'S CIRCLES DRAWN AT 3 % STRAIN.
DEVIATOR STRESSES CORRECTED FOR MEMBRANE AND FILTER PAPER EFFECTS.
AREA AFTER CONSOLIDATION CALCULATED AS PER SECTION 10.3.2.1 METHOD A
STANDARD PROCTOR = 116.3pcf @ 14.6% MOISTURE
REMOLDED TO 109.6 pcf @ 14.8% MOISTURE REMOLDED TO 94.2% COMPACTION
N:\Projects\2010\04105122\Lab Results\Sample-2 Shale Testing on Remolded Sample\[04105122 Triaxial CU SAMPLE 2.xlsx]REPORT
FAILURE SKETCH FAILURE SKETCH FAILURE SKETCH
SPECIMEN A SPECIMEN B SPECIMEN C
0.0
0.5
1.0
1.5
2.0
2.5
3.0
3.5
0 5 10 15 20
PRINCIPAL
STRESS
RATIO
STRAIN, %

US 60
04105122 COMPOSITE SAMPLE SAMPLE #2
N:\Projects\2010\04105122\Lab Results\Sample-2 Shale Testing on Remolded Sample\[04105122 Triaxial CU SAMPLE 2.xlsx]REPORT
-0.1
0.0
0.1
0.2
0.3
0.4
0.5
0.6
0.7
0.8
0.9
0 5 10 15 20
PORE
PRESSURE
/
DEVIATOR
STRESS
STRAIN, %
0
10
20
30
0 10 20 30 40 50 60 70 80 90 100
SHEAR
STRESS,
PSI
NORMAL STRESS, PSI
A B C
-2
0
2
4
6
8
10
12
14
16
18
20
0 5 10 15 20
PORE
PRESSURE,
PSI
STRAIN, %

EFFECTIVE STRESS --- ANGLE OF INTERNAL FRICTION, deg
TOTAL STRESS ANGLE OF INTERNAL FRICTION, deg
SPECIMEN ID: A B C
WATER CONTENT, % 13.3 13.8 13.2
DRY DENSITY, pcf 110.7 110.2 111.2
SATURATION, % 69 71 69
VOID RATIO 0.52 0.53 0.52
WATER CONTENT, % 18.4 17.4 15.5
DRY DENSITY, pcf 112.5 114.6 118.7
SATURATION (B PARAMETER) 1.01 0.95 1.00
VOID RATIO 0.50 0.47 0.42
FINAL BACK PRESSURE, psi 101.4 100.4 100.3
MINOR PRINCIPAL STRESS, psi 7.1 14.5 29.3
EFFECTIVE STRESS PEAK AT % STRAIN 3.0 3.0 3.0
EFF. DEVIATOR STRESS AT PEAK STRAIN, psi 7.0 11.3 21.1
TOTAL STRESS PEAK AT % STRAIN 3.0 3.0 3.0
TOTAL DEVIATOR STRESS AT PEAK STRAIN, psi 7.0 11.3 21.1
CONTROLLED - STRAIN TEST ULTIMATE DEVIATOR STRESS (15% STR), psi 7.9 13.3 25.9
SAMPLE TYPE: TIME TO 50% PRIMARY CONSOLIDATION, min 0.79 1.20 1.10
DESCRIPTION OF SPECIMENS: 8.07 8.11 8.24
INITIAL DIAMETER, inch 1.998 1.999 1.997
INITIAL HEIGHT, inch 4.045 4.041 4.035
LL 40 PL 24 PI 16 Gs 2.7 EST. AREA AFTER CONSOLIDATION, inch2 3.100 3.058 2.997
PROJECT:
BORING #:
SAMPLE #:
DEPTH, feet:
N:\Projects\2010\04105122\Lab Results\Sample-3 Shale Testing on Remolded Sample\[04105122 Triaxial CU SAMPLE 3rev.xlsx]REPORT
TERRACON - LENEXALABORATORY:
DATE: 10/15/2010
LEAN CLAY (WEATHERED SHALE), GRAY & DARK GRAY
US 60
STRAIN RATE, % / hour
BE
FOR
E S
HE
AR
26.3
14.0
COMPOSITE SAMPLE
SAMPLE #3
INIT
IAL
PROCEDURE: ASTM D4767, CONSOLIDATED-UNDRAINED TRIAXIAL COMPRESSION TEST ON COHESIVE SOILS
PROJECT NO. 04105122
RECOMPACTED
0.7
0.9
COHESION, psi
COHESION, psi
0
5
10
15
20
25
30
0 5 10 15 20
DEVIATOR
STRESS,
PSI
STRAIN, %
0
10
20
30
40
50
0 10 20 30 40 50 60 70 80 90 100 110 120 130 140 150
SHEAR
STRESS,
psi
NORMAL STRESS, psi

US 60
04105122 COMPOSITE SAMPLE SAMPLE #3
REMARKS:
SPECIMENS SATURATED BY THE WET METHOD.
EFFECTIVE STRESS FAILURE DATA BASED ON 3 % STRAIN.
EFFECTIVE STRESS MOHR'S CIRCLES DRAWN AT 3 % STRAIN.
TOTAL STRESS FAILURE DATA BASED ON 3 % STRAIN.
TOTAL STRESS MOHR'S CIRCLES DRAWN AT 3 % STRAIN.
DEVIATOR STRESSES CORRECTED FOR MEMBRANE AND FILTER PAPER EFFECTS.
AREA AFTER CONSOLIDATION CALCULATED AS PER SECTION 10.3.2.1 METHOD A
STANDARD PROCTOR = 116.7pcf @ 13.7% MOISTURE
REMOLDED TO 110.7 pcf @ 13.5% MOISTURE REMOLDED TO 94.9% COMPACTION
N:\Projects\2010\04105122\Lab Results\Sample-3 Shale Testing on Remolded Sample\[04105122 Triaxial CU SAMPLE 3rev.xlsx]REPORT
FAILURE SKETCH FAILURE SKETCH FAILURE SKETCH
SPECIMEN A SPECIMEN B SPECIMEN C
0.0
0.5
1.0
1.5
2.0
2.5
3.0
3.5
4.0
0 5 10 15 20
PRINCIPAL
STRESS
RATIO
STRAIN, %

US 60
04105122 COMPOSITE SAMPLE SAMPLE #3
N:\Projects\2010\04105122\Lab Results\Sample-3 Shale Testing on Remolded Sample\[04105122 Triaxial CU SAMPLE 3rev.xlsx]REPORT
0.0
0.1
0.2
0.3
0.4
0.5
0.6
0.7
0.8
0.9
0 5 10 15 20
PORE
PRESSURE
/
DEVIATOR
STRESS
STRAIN, %
0
10
20
30
0 10 20 30 40 50 60 70 80 90 100
SHEAR
STRESS,
PSI
NORMAL STRESS, PSI
A B C
0
2
4
6
8
10
12
14
16
18
20
0 5 10 15 20
PORE
PRESSURE,
PSI
STRAIN, %

NATURAL MOISTURE CONTENT, %
MASS OF DRUM, grams
MASS OF DRUM PLUS OVEN-DRIED SPECIMEN BEFORE THE FIRST CYCLE, grams
MASS OF DRUM PLUS OVEN-DRIED SPECIMEN RETAINED AFTER THE SECOND CYCLE, grams
WATER TEMPERATURE OF FIRST CYCLE, deg F
WATER TEMPERATURE OF SECOND CYCLE, deg F
AVERAGE WATER TEMPERATURE, deg F
DESCRIPTION OF THE APPEARANCE OF THE FRAGMENTS RETAINED IN THE DRUM
SLAKE DURABILTY INDEX
N:\Projects\2010\04105122\Lab Results\Sample-1 Shale Testing on Remolded Sample\[04105122 Slake Durability SAMPLE 1.xlsx]REPORT and DATA
7.5
1214.0
1705.8
1533.9
69
OVEN-DRIED BEFORE FIRST CYCLE OVEN-DRIED AFTER SECOND CYCLE
SAMPLE #1
69
69
65.0
TYPE 2
SLAKE DURABILITY OF SHALES AND SIMILAR WEAK ROCKSASTM D4644
US 6004105122

SAMPLE #2Sample 2 is Clayey Shale.
Our visual observation indicates it is not durable, therefore ASTM D4644 was not performed on this sample
SLAKE DURABILITY OF SHALES AND SIMILAR WEAK ROCKSASTM D4644
US 6004105122

NATURAL MOISTURE CONTENT, %
MASS OF DRUM, grams
MASS OF DRUM PLUS OVEN-DRIED SPECIMEN BEFORE THE FIRST CYCLE, grams
MASS OF DRUM PLUS OVEN-DRIED SPECIMEN RETAINED AFTER THE SECOND CYCLE, grams
WATER TEMPERATURE OF FIRST CYCLE, deg F
WATER TEMPERATURE OF SECOND CYCLE, deg F
AVERAGE WATER TEMPERATURE, deg F
LARGE AND SMALL FRAGEMENTS
SLAKE DURABILTY INDEX
N:\Projects\2010\04105122\Lab Results\Sample-3 Shale Testing on Remolded Sample\[04105122 Slake Durability SAMPLE 3.xlsx]REPORT and DATA
SLAKE DURABILITY OF SHALES AND SIMILAR WEAK ROCKSASTM D4644
US 6004105122
8.5
1214.6
1710.3
1362.6
OVEN-DRIED BEFORE FIRST CYCLE OVEN-DRIED AFTER SECOND CYCLE
SAMPLE #3
69
69
29.9
TYPE 2
69


APPENDIX D
SLOPE STABILITY ANALYSIS

Drawn by: DGO
Designed by: DGO
Scale: Shown
Terracon Project No. 04105122
FN: Stability Analysis Figures D-1
Date:12/04/2010
STATION 1044+00 STABILITY ANALYSISUS-60 Cut Section Report
ODOT Engineering Contract No. EC-1267G
Osage County Oklahoma
10930 East 56th Street Tulsa, Oklahoma 74146
1.31.3
W
W
1.31.3
Material Name ColorUnit Weight
(lbs/ft3)Strength Type
Cohesion(lb/ft2)
PhiCohesionChange
Cutoff Datum Cohesion 2 Phi 2Angle (ccw
to 1)Water Surface Hu Type Ru
Sandstone 137 Anisotropic function Water Surface Constant
Shale 135 Anisotropic function None 0
Limestone 176 Anisotropic s trength 0 32 0 1 0 0 45 0 None 0
Roadway Fi l l 130 Mohr-Coulomb 0 35 None 0
43.3
Pro
posed U
S-6
0 C
ente
rlin
e
20.0
1.5 : 1 (H:V)
Global Minimum
gle/morgenstern-price
US-60 Station 1044+00
N:\Geotechnical\2010\Oklahoma Projects\04105122 US -60\Stabili ty Analysis\S tation 1044 1.5 to 1 slope path srch anstrp no h2o.slim
4 : 1 (H:V)
Assumed localized bedding dip adverse to cut slope
Path Search Used for Analysis
10
50
10
00
95
09
00
85
0
-250 -200 -150 -100 -50 0 50 100 150

Drawn by: DGO
Designed by: DGO
Scale: Shown
Terracon Project No. 04105122
FN: Stability Analysis Figures D-2
Date:12/04/2010
STATION 1044+00 STABILITY ANALYSISUS-60 Cut Section Report
ODOT Engineering Contract No. EC-1267G
Osage County Oklahoma
10930 East 56th Street Tulsa, Oklahoma 74146
2.6
2.7
2.6
W
W
2.6
2.7
2.6
43
Global Minimum
gle/morgenstern-price
Material Name ColorUnit Weight
(lbs/ft3)Strength Type
Cohesion(lb/ft2)
PhiCohesionChange
Cutoff Datum Cohesion 2 Phi 2Angle (ccw
to 1)Water Surface Hu Type Ru
Sandstone 137 Anisotropic function Water Surface Constant
Shale 135 Anisotropic function None 0
Limestone 176 Anisotropic s trength 0 32 0 1 0 0 45 0 Water Surface Constant
Roadway Fi l l 130 Mohr-Coulomb 0 35 None 0
Block Search Analysis
Pro
posed U
S-6
0 C
ente
rlin
e
1.5:1 (H:V)
US-60 Station 1044+00
N:\Geotechnical\2010\Oklahoma Projects\04105122 US-60\Stability Analysis\Station 1044 1.5 to 1 slope blk srch anstrp.slim
11
00
10
50
10
00
95
09
00
85
0
-300 -250 -200 -150 -100 -50 0 50 100 150

Drawn by: DGO
Designed by: DGO
Scale: Shown
Terracon Project No. 04105122
FN: Stability Analysis Figures D-3
Date:12/04/2010
STATION 1076+00 STABILITY ANALYSISUS-60 Cut Section Report
ODOT Engineering Contract No. EC-1267G
Osage County Oklahoma
10930 East 56th Street Tulsa, Oklahoma 74146
2.32.3
W
W
2.32.3
Material Name ColorUnit Weight
(lbs/ft3)Strength Type
Cohesion(lb/ft2)
PhiCohesionChange
Cutoff Datum Cohesion 2 Phi 2Angle (ccw
to 1)Water Surface Hu Type Ru
Sandstone 137 Anisotropic function Water Surface Constant
Shale 135 Anisotropic function None 0
Roadway Fi l l 135 Mohr-Coulomb 0 35 None 0
US-60 Station 1076+00
Sandstone
Shale
Sandstone
Shale
4:1 (H:V)
20.0
28.5
1.5:1 (H:V)
Pro
posed U
S-6
0 C
ente
rlin
e
Global Minimum
gle/morgenstern-price
N:\Geotechnical\2010\Oklahoma Projects\04105122 US -60\Stabili ty Analysis\S tation 1076 1.5 to 1 blk anstrp.slim
88
08
60
84
08
20
80
07
80
-120 -100 -80 -60 -40 -20 0 20 40

Drawn by: DGO
Designed by: DGO
Scale: Shown
Terracon Project No. 04105122
FN: Stability Analysis Figures D-4
Date:1/13/2011
STATION 1076+00 STABILITY ANALYSISUS-60 Cut Section Report
ODOT Engineering Contract No. EC-1267G
Osage County Oklahoma
10930 East 56th Street Tulsa, Oklahoma 74146

Drawn by: DGO
Designed by: DGO
Scale: Shown
Terracon Project No. 04105122
FN: Stability Analysis Figures D-5
Date:12/05/2010
STATION 1093+00 STABILITY ANALYSISUS-60 Cut Section Report
ODOT Engineering Contract No. EC-1267G
Osage County Oklahoma
10930 East 56th Street Tulsa, Oklahoma 74146
1.31.3
W W
1.31.3
Material Name ColorUnit Weight
(lbs/ft3)Strength Type
Cohesion(lb/ft2)
PhiCohesionChange
Cutoff Datum Cohesion 2 Phi 2Angle (ccw
to 1)Water Surface Hu Type Ru
Limestone 176 Anisotropic s trength 0 32 0 1 0 0 45 0 None 0
Shale 135 Anisotropic function Water Surface Constant
Weathered Shale/Lean Clay 125 Mohr-Coulomb 100 22 None 0
Roadway Fi l l 135 Mohr-Coulomb 0 35 None 0
US-60 Station 1093+00
3:1 (H:V)
1.5:1 (H:V)
20.0
40.04:1 (H:V)
Path Search Analysis
Global Minimum
gle/morgenstern-price
N:\Geotechnical\2010\Oklahoma Projects\04105122 US -60\Stabili ty Analysis\S tation 1093 1.5 to 1 path srch anstrp phi 0.slim
Pro
posed U
S-6
0 C
ente
rlin
e
88
08
60
84
08
20
80
07
80
76
0
-180 -160 -140 -120 -100 -80 -60 -40 -20 0 20

Drawn by: DGO
Designed by: DGO
Scale: Shown
Terracon Project No. 04105122
FN: Stability Analysis Figures D-6
Date:12/05/2010
STATION 1093+00 STABILITY ANALYSISUS-60 Cut Section Report
ODOT Engineering Contract No. EC-1267G
Osage County Oklahoma
10930 East 56th Street Tulsa, Oklahoma 74146
2.22.2
W W
2.22.2
Material Name ColorUnit Weight
(lbs/ft3)Strength Type
Cohesion(lb/ft2)
PhiCohesionChange
Cutoff Datum Cohesion 2 Phi 2Angle (ccw
to 1)Water Surface Hu Type Ru
Limestone 176 Anisotropic s trength 0 32 0 1 0 0 45 0 None 0
Shale 135 Anisotropic function Water Surface Constant
Weathered Shale/Lean Clay 125 Mohr-Coulomb 100 22 None 0
Roadway Fi l l 135 Mohr-Coulomb 0 35 None 0
US-60 Station 1093+00
3:1 (H:V)
1.5:1 (H:V)
20.0
40.04:1 (H:V)
Block Search Analysis
Global Minimum
gle/morgenstern-price
N:\Geotechnical\2010\Oklahoma Projects\04105122 US -60\Stabili ty Analysis\S tation 1093 1.5 to 1 blk anstrp phi 0.sl im
Pro
posed U
S-6
0 C
ente
rlin
e
88
08
60
84
08
20
80
07
80
76
0
-180 -160 -140 -120 -100 -80 -60 -40 -20 0 20 40

Drawn by: DGO
Designed by: DGO
Scale: Shown
Terracon Project No. 04105122
FN: Stability Analysis Figures D-7
Date:12/05/2010
STATION 1124+00 STABILITY ANALYSISUS-60 Cut Section Report
ODOT Engineering Contract No. EC-1267G
Osage County Oklahoma
10930 East 56th Street Tulsa, Oklahoma 74146
1.31.3
W W
1.31.3
Material Name ColorUnit Weight
(lbs/ft3)Strength Type
Cohesion(lb/ft2)
PhiCohesionChange
Cutoff Datum Cohesion 2 Phi 2Angle (ccw
to 1)Water Surface Hu Type Ru
Sandstone 137 Anisotropic function None 0
Shale 135 Anisotropic function None 0
Limestone 176 Anisotropic s trength 0 32 0 1 0 0 45 0 Water Surface Constant
Roadway Fi l l 135 Mohr-Coulomb 0 35 None 0
US-60 Station 1124+00
Sandstone
Shale
4:1 (H:V)
1.5:1 (H:V)
28.3
20.0
Path Search Analysis
Global Minimum
gle/morgenstern-price
Limestone
N:\Geotechnical\2010\Oklahoma Projects\04105122 US -60\Stabili ty Analysis\S tation 1124 1.5 to 1 path srch anstrp.slim
Pro
posed U
S-6
0 C
ente
rlin
e
94
09
20
90
08
80
86
08
40
-140 -120 -100 -80 -60 -40 -20 0 20 40

Drawn by: DGO
Designed by: DGO
Scale: Shown
Terracon Project No. 04105122
FN: Stability Analysis Figures D-8
Date:12/05/2010
STATION 1124+00 STABILITY ANALYSISUS-60 Cut Section Report
ODOT Engineering Contract No. EC-1267G
Osage County Oklahoma
10930 East 56th Street Tulsa, Oklahoma 74146
2.32.3
W W
2.32.3
Material Name ColorUnit Weight
(lbs/ft3)Strength Type
Cohesion(lb/ft2)
PhiCohesionChange
Cutoff Datum Cohesion 2 Phi 2Angle (ccw
to 1)Water Surface Hu Type Ru
Sandstone 137 Anisotropic function None 0
Shale 135 Anisotropic function None 0
Limestone 176 Anisotropic s trength 0 32 0 1 0 0 45 0 Water Surface Constant
Roadway Fi l l 135 Mohr-Coulomb 0 35 None 0
US-60 Station 1124+00
Sandstone
Shale
4:1 (H:V) 1.5:1 (H:V)
28.3
20.0
Path Search Analysis
Global Minimum
gle/morgenstern-price
Limestone
N:\Geotechnical\2010\Oklahoma Projects\04105122 US-60\Stability Analysis\Station 1124 1.5 to 1 blk srch anstrp.slim
Pro
posed U
S-6
0 C
ente
rlin
e
92
09
00
88
08
60
84
08
20
-120 -100 -80 -60 -40 -20 0 20 40

Drawn by: DGO
Designed by: DGO
Scale: Shown
Terracon Project No. 04105122
FN: Stability Analysis Figures D-9
Date:12/05/2010
STATION 1161+00 STABILITY ANALYSISUS-60 Cut Section Report
ODOT Engineering Contract No. EC-1267G
Osage County Oklahoma
10930 East 56th Street Tulsa, Oklahoma 74146
Material Name ColorUnit Weight
(lbs/ft3)Strength Type
Cohesion(lb/ft2)
PhiCohesionChange
Cutoff Datum Cohesion 2 Phi 2Angle (ccw
to 1)Water Surface Hu Type Ru
Sandstone 137 Anisotropic function Water Surface Constant
Shale 135 Anisotropic function None 0
Limestone 176 Anisotropic s trength 0 32 0 1 0 0 45 0 None 0
Roadway Fi l l 130 Mohr-Coulomb 0 35 None 0
Weathered Shale/Si l ts tone 125 Mohr-Coulomb 100 22 None 0
1.21.2
W
W
1.21.2
69
29
US-60 Station 1161+00
Pro
posed U
S-6
0 C
ente
rlin
e
1.5:1 (H:V)
4:1 (H:V)
N:\Geotechnical\2010\Oklahoma Projects\04105122 US-60\Stability Analysis\Station 1161 1.5 to 1 slope path srch anstrp 2.slim
10
00
95
09
00
85
08
00
-50 0 50 100 150 200 250 300 350

Drawn by: DGO
Designed by: DGO
Scale: Shown
Terracon Project No. 04105122
FN: Stability Analysis Figures D-10
Date:12/05/2010
STATION 1161+00 STABILITY ANALYSISUS-60 Cut Section Report
ODOT Engineering Contract No. EC-1267G
Osage County Oklahoma
10930 East 56th Street Tulsa, Oklahoma 74146
Material Name ColorUnit Weight
(lbs/ft3)Strength Type
Cohesion(lb/ft2)
PhiCohesionChange
Cutoff Datum Cohesion 2 Phi 2Angle (ccw
to 1)Water Surface Hu Type Ru
Sandstone 137 Anisotropic function Water Surface Constant
Shale 135 Anisotropic function None 0
Limestone 176 Anisotropic s trength 0 32 0 1 0 0 45 0 None 0
Roadway Fi l l 130 Mohr-Coulomb 0 35 None 0
Weathered Shale/Si l ts tone 125 Mohr-Coulomb 100 22 None 0
2.2
2.2
2.2
W
W
2.2
2.2
2.2
69
29
US-60 Station 1161+00
Pro
posed U
S-6
0 C
ente
rlin
e
1.5:1 (H:V)
4:1 (H:V)
N:\Geotechnical\2010\Oklahoma Projects\04105122 US-60\Stability Analysis\Station 1161 1.5 to 1 slope blk srch anstrp 2.slim
Block Search
Gobal Minimum
gle/morgenstern-price
97
59
50
92
59
00
87
58
50
82
58
00
0 25 50 75 100 125 150 175 200 225 250 275 300

Drawn by: DGO
Designed by: DGO
Scale: Shown
Terracon Project No. 04105122
FN: Stability Analysis Figures D-11
Date:12/05/2010
STATION 1169+00 STABILITY ANALYSISUS-60 Cut Section Report
ODOT Engineering Contract No. EC-1267G
Osage County Oklahoma
10930 East 56th Street Tulsa, Oklahoma 74146
1.31.3
W W
1.31.3
68.5
US-60 Station 1169+00
Global Minimum
gle/morgenstern-price
3:1 (H:V) Slope
1.5 : 1 (H:V) Slope
4:1 (H:V) Slope
20.0
Path Search Analysis
Material Name ColorUnit Weight
(lbs/ft3)Strength Type
Cohesion(lb/ft2)
PhiCohesionChange
Cutoff Datum Cohesion 2 Phi 2Angle (ccw
to 1)Water Surface Hu Type Ru
Sandstone 137 Anisotropic function Water Surface Constant
Shale 135 Anisotropic function None 0
Weathered Shale/Clay 125 Mohr-Coulomb 100 22 None 0
Roadway Fi l l 135 Mohr-Coulomb 0 35 None 0
Pro
posed U
S-6
0 C
ente
rlin
e
N:\Geotechnical\2010\Oklahoma Projects\04105122 US -60\Stabili ty Analysis\S tation 1169 1.5 to 1 anistrop path srch l imits 2.sl im
97
59
50
92
59
00
87
58
50
82
58
00
-225 -200 -175 -150 -125 -100 -75 -50 -25 0 25 50 75

Drawn by: DGO
Designed by: DGO
Scale: Shown
Terracon Project No. 04105122
FN: Stability Analysis Figures D-12
Date:12/05/2010
STATION 1169+00 STABILITY ANALYSISUS-60 Cut Section Report
ODOT Engineering Contract No. EC-1267G
Osage County Oklahoma
10930 East 56th Street Tulsa, Oklahoma 74146
1.61.6
W W
1.61.6
68.5
US-60 Station 1169+00
Block Search
Global Minimum
gle/morgenstern-price
3:1 (H:V) Slope
1.5 : 1 (H:V) Slope
4:1 (H:V) Slope
20.0
Material Name ColorUnit Weight
(lbs/ft3)Strength Type
Cohesion(lb/ft2)
PhiCohesionChange
Cutoff Datum Cohesion 2 Phi 2Angle (ccw
to 1)Water Surface Hu Type Ru
Sandstone 137 Anisotropic function Water Surface Constant
Shale 135 Anisotropic function None 0
Weathered Shale/Clay 125 Mohr-Coulomb 100 22 None 0
Roadway Fi l l 135 Mohr-Coulomb 0 35 None 0
Pro
posed U
S-6
0 C
ente
rlin
e
N:\Geotechnical\2010\Oklahoma Projects\04105122 US -60\Stabili ty Analysis\S tation 1169 1.5 to 1 anistrop blk srch.sl im
94
09
20
90
08
80
86
08
40
82
08
00
-200 -180 -160 -140 -120 -100 -80 -60 -40 -20 0 20 40

Drawn by: DGO
Designed by: DGO
Scale: Shown
Terracon Project No. 04105122
FN: Stability Analysis Figures D-13
Date:1/13/2011
STATION 1187+00 STABILITY ANALYSISUS-60 Cut Section Report
ODOT Engineering Contract No. EC-1267G
Osage County Oklahoma
10930 East 56th Street Tulsa, Oklahoma 74146

Drawn by: DGO
Designed by: DGO
Scale: Shown
Terracon Project No. 04105122
FN: Stability Analysis Figures D-14
Date:1/13/2011
STATION 1187+00 STABILITY ANALYSISUS-60 Cut Section Report
ODOT Engineering Contract No. EC-1267G
Osage County Oklahoma
10930 East 56th Street Tulsa, Oklahoma 74146

APPENDIX E
SUPPORTING DATA

GENERAL NOTES
DRILLING & SAMPLING SYMBOLS:
SS: Split Spoon - 1-3/8" I.D., 2" O.D., unless otherwise noted HS: Hollow Stem Auger
ST: Thin-Walled Tube – 2” O.D., 3" O.D., unless otherwise noted PA: Power Auger (Solid Stem)
RS: Ring Sampler - 2.42" I.D., 3" O.D., unless otherwise noted HA: Hand Auger
DB: Diamond Bit Coring - 4", N, B RB: Rock Bit
BS: Bulk Sample or Auger Sample WB Wash Boring or Mud Rotary
The number of blows required to advance a standard 2-inch O.D. split-spoon sampler (SS) the last 12 inches of the total 18-inch penetration with a 140-pound hammer falling 30 inches is considered the “Standard Penetration” or “N-value”.
WATER LEVEL MEASUREMENT SYMBOLS:
WL: Water Level WS: While Sampling BCR: Before Casing Removal
WCI: Wet Cave in WD: While Drilling ACR: After Casing Removal
DCI: Dry Cave in AB: After Boring N/E: Not Encountered
Water levels indicated on the boring logs are the levels measured in the borings at the times indicated. Groundwater levels at other times and other locations across the site could vary. In pervious soils, the indicated levels may reflect the location of groundwater. In low permeability soils, the accurate determination of groundwater levels may not be possible with only short-term observations. DESCRIPTIVE SOIL CLASSIFICATION: Soil classification is based on the Unified Soil Classification System. Coarse Grained Soils
have more than 50% of their dry weight retained on a #200 sieve; their principal descriptors are: boulders, cobbles, gravel or sand. Fine Grained Soils have less than 50% of their dry weight retained on a #200 sieve; they are principally described as clays if they are plastic, and silts if they are slightly plastic or non-plastic. Major constituents may be added as modifiers and minor constituents may be added according to the relative proportions based on grain size. In addition to gradation, coarse-grained soils are defined on the basis of their in-place relative density and fine-grained soils on the basis of their consistency.
CONSISTENCY OF FINE-GRAINED SOILS RELATIVE DENSITY OF COARSE-GRAINED SOILS
Unconfined Compressive
Strength, Qu, psf
Standard Penetration or N-value (SS)
Blows/Ft. Consistency
Standard Penetration or N-value (SS)
Blows/Ft. Relative Density
< 500 0 - 1 Very Soft 0 – 3 Very Loose
500 – 1,000 2 - 4 Soft 4 – 9 Loose
1,000 – 2,000 4 - 8 Medium Stiff 10 – 29 Medium Dense
2,000 – 4,000 8 - 15 Stiff 30 – 50 Dense
4,000 – 8,000 15 - 30 Very Stiff > 50 Very Dense
8,000+ > 30 Hard
RELATIVE PROPORTIONS OF SAND AND GRAVEL GRAIN SIZE TERMINOLOGY
Descriptive Term(s) of other constituents
Percent of Dry Weight
Major Component of Sample
Particle Size
Trace < 15 Boulders Over 12 in. (300mm)
With 15 – 29 Cobbles 12 in. to 3 in. (300mm to 75mm)
Modifier ≥ 30 Gravel 3 in. to #4 sieve (75mm to 4.75mm)
Sand #4 to #200 sieve (4.75 to 0.075mm)
Silt or Clay Passing #200 Sieve (0.075mm)
RELATIVE PROPORTIONS OF FINES PLASTICITY DESCRIPTION
Descriptive Term(s) of other constituents
Percent of Dry Weight
Term Plasticity
Index
Trace < 5 Non-plastic 0
With 5 – 12 Low 1-10
Modifier > 12 Medium 11-30
High > 30

Form 111—6/98
UNIFIED SOIL CLASSIFICATION SYSTEM
Criteria for Assigning Group Symbols and Group Names Using Laboratory TestsA Soil Classification
Group Symbol
Group NameB
Coarse Grained Soils
More than 50% retained
on No. 200 sieve
Gravels More than 50% of coarse fraction retained on No. 4 sieve
Clean Gravels Less than 5% finesC
Cu 4 and 1 Cc 3E GW Well-graded gravelF
Cu 4 and/or 1 Cc 3E GP Poorly graded gravelF
Gravels with Fines More than 12% finesC
Fines classify as ML or MH GM Silty gravelF,G, H
Fines classify as CL or CH GC Clayey gravelF,G,H
Sands 50% or more of coarse fraction passes No. 4 sieve
Clean Sands Less than 5% finesD
Cu 6 and 1 Cc 3E SW Well-graded sandI
Cu 6 and/or 1 Cc 3E SP Poorly graded sandI
Sands with Fines More than 12% finesD
Fines classify as ML or MH SM Silty sandG,H,I
Fines Classify as CL or CH SC Clayey sandG,H,I
Fine-Grained Soils 50% or more passes the No. 200 sieve
Silts and Clays Liquid limit less than 50
inorganic PI 7 and plots on or above “A” lineJ CL Lean clayK,L,M
PI 4 or plots below “A” lineJ ML SiltK,L,M
organic Liquid limit - oven dried 0.75 OL
Organic clayK,L,M,N
Liquid limit - not dried Organic siltK,L,M,O
Silts and Clays Liquid limit 50 or more
inorganic PI plots on or above “A” line CH Fat clayK,L,M
PI plots below “A” line MH Elastic SiltK,L,M
organic Liquid limit - oven dried 0.75 OH
Organic clayK,L,M,P
Liquid limit - not dried Organic siltK,L,M,Q
Highly organic soils Primarily organic matter, dark in color, and organic odor PT Peat
A Based on the material passing the 3-in. (75-mm) sieve
B If field sample contained cobbles or boulders, or both, add “with cobbles or boulders, or both” to group name.
C Gravels with 5 to 12% fines require dual symbols: GW-GM well-graded gravel with silt, GW-GC well-graded gravel with clay, GP-GM poorly graded gravel with silt, GP-GC poorly graded gravel with clay.
D Sands with 5 to 12% fines require dual symbols: SW-SM well-graded sand with silt, SW-SC well-graded sand with clay, SP-SM poorly graded sand with silt, SP-SC poorly graded sand with clay
E Cu = D60/D10 Cc =
6010
2
30
DxD
)(D
F If soil contains 15% sand, add “with sand” to group name.
G If fines classify as CL-ML, use dual symbol GC-GM, or SC-SM.
HIf fines are organic, add “with organic fines” to group name.
I If soil contains 15% gravel, add “with gravel” to group name.
J If Atterberg limits plot in shaded area, soil is a CL-ML, silty clay.
K If soil contains 15 to 29% plus No. 200, add “with sand” or “with gravel,” whichever is predominant.
L If soil contains 30% plus No. 200 predominantly sand, add “sandy” to group name.
M If soil contains 30% plus No. 200, predominantly gravel,
add “gravelly” to group name. N PI 4 and plots on or above “A” line.
O PI 4 or plots below “A” line.
P PI plots on or above “A” line.
Q PI plots below “A” line.

GENERAL NOTES Description of Rock Properties
WEATHERING
Fresh Rock fresh, crystals bright, few joints may show slight staining. Rock rings under hammer if crystalline.
Very slight Rock generally fresh, joints stained, some joints may show thin clay coatings, crystals in broken face show bright. Rock rings under hammer if crystalline.
Slight Rock generally fresh, joints stained, and discoloration extends into rock up to 1 in. Joints may contain clay. In granitoid rocks some occasional feldspar crystals are dull and discolored. Crystalline rocks ring under hammer.
Moderate Significant portions of rock show discoloration and weathering effects. In granitoid rocks, most feldspars are dull and discolored; some show clayey. Rock has dull sound under hammer and shows significant loss of strength as compared with fresh rock.
Moderately severe All rock except quartz discolored or stained. In granitoid rocks, all feldspars dull and discolored and majority show kaolinization. Rock shows severe loss of strength and can be excavated with geologist’s pick.
Severe All rock except quartz discolored or stained. Rock “fabric” clear and evident, but reduced in strength to strong soil. In granitoid rocks, all feldspars kaolinized to some extent. Some fragments of strong rock usually left.
Very severe All rock except quartz discolored or stained. Rock “fabric” discernible, but mass effectively reduced to “soil” with only fragments of strong rock remaining.
Complete Rock reduced to ”soil”. Rock “fabric” not discernible or discernible only in small, scattered locations. Quartz may be present as dikes or stringers.
HARDNESS (for engineering description of rock – not to be confused with Moh’s scale for minerals)
Very hard Cannot be scratched with knife or sharp pick. Breaking of hand specimens requires several hard blows of geologist’s pick.
Hard Can be scratched with knife or pick only with difficulty. Hard blow of hammer required to detach hand specimen.
Moderately hard Can be scratched with knife or pick. Gouges or grooves to ¼ in. deep can be excavated by hard blow of point of a geologist’s pick. Hand specimens can be detached by moderate blow.
Medium Can be grooved or gouged 1/16 in. deep by firm pressure on knife or pick point. Can be excavated in small chips to pieces about 1-in. maximum size by hard blows of the point of a geologist’s pick.
Soft Can be gouged or grooved readily with knife or pick point. Can be excavated in chips to pieces several inches in size by moderate blows of a pick point. Small thin pieces can be broken by finger pressure.
Very soft Can be carved with knife. Can be excavated readily with point of pick. Pieces 1-in. or more in thickness can be broken with finger pressure. Can be scratched readily by fingernail.
Joint, Bedding and Foliation Spacing in Rocka
Spacing Joints Bedding/Foliation
Less than 2 in. Very close Very thin 2 in. – 1 ft. Close Thin 1 ft. – 3 ft. Moderately close Medium 3 ft. – 10 ft. Wide Thick More than 10 ft. Very wide Very thick
Rock Quality Designator (RQD)b Joint Openness Descriptors
RQD, as a percentage Diagnostic description Openness Descriptor
Exceeding 90 Excellent No Visible Separation Tight 90 – 75 Good Less than 1/32 in. Slightly Open 75 – 50 Fair 1/32 to 1/8 in. Moderately Open 50 – 25 Poor 1/8 to 3/8 in. Open Less than 25 Very poor 3/8 in. to 0.1 ft. Moderately Wide Greater than 0.1 ft. Wide
a. Spacing refers to the distance normal to the planes, of the described feature, which are parallel to each other or nearly so. b. RQD (given as a percentage) = length of core in pieces 4 in. and longer/length of run.
References: American Society of Civil Engineers. Manuals and Reports on Engineering Practice - No. 56. Subsurface Investigation for Design and Construction of Foundations of Buildings. New York: American Society of Civil Engineers, 1976.
U.S. Department of the Interior, Bureau of Reclamation, Engineering Geology Field Manual.


