19
APPENDIX B FINANCIAL PERFORMANCE AND EVALUATION

APPENDIX B FINANCIAL PERFORMANCE AND
EVALUATION

1 of 2
BASIS FY 17 Financial Performance Response
2a. Net Income
Per the consolidated audited financials for FY 2017, the net surplus for the year fell below the
$1 threshold primarily due to the GAAP effect of our capital restructuring, as shown by Exhibit
1. Multiple schools were refinanced into our obligated group structure in FY 2017 with the aim
of increasing the amount of money spent in BASIS classrooms. This process resulted in
$4,105,155 in non-cash expenses related to the write-off of loan issuance costs and
prepayment penalties being recorded in the statement of activities. In FY 2017, we also had an
unrealized loss on investment of $284,587, as shown by Exhibit 1. This unrealized loss is
resulting from non-cash investment activity of our debt service reserve funds. Debt service
reserve funds are a required feature of our obligated group structure. In addition to the above
activity, FY 2017 also had a non-cash capitalized interest amount of $893,684 associated with it,
as shown in Exhibit 2.
To negate the non-cash expenses associated with the above activity, the following items are
added back to get an adjusted net surplus figure:
1. Write-off of loan issuance costs and prepayment of penalties, per Exhibit 1: ($4,105,155)
2. Unrealized gain/loss on investments, per Exhibit 1:($284,587)
3. Non-cash capitalized interest expense, per Exhibit 2 :($893,684)
4. Total non-cash add backs not including depreciation & amortization: ($5,283,426)
To demonstrate the positive cash flow and NPV for each bond series referenced above,
please see Exhibit 3 through Exhibit 7, included with this response and summarized as
follows:
Exhibit School NPV Savings
Exhibit 3 BASIS Tucson Primary $590,543
Exhibit 4 BASIS Tucson North $863,072
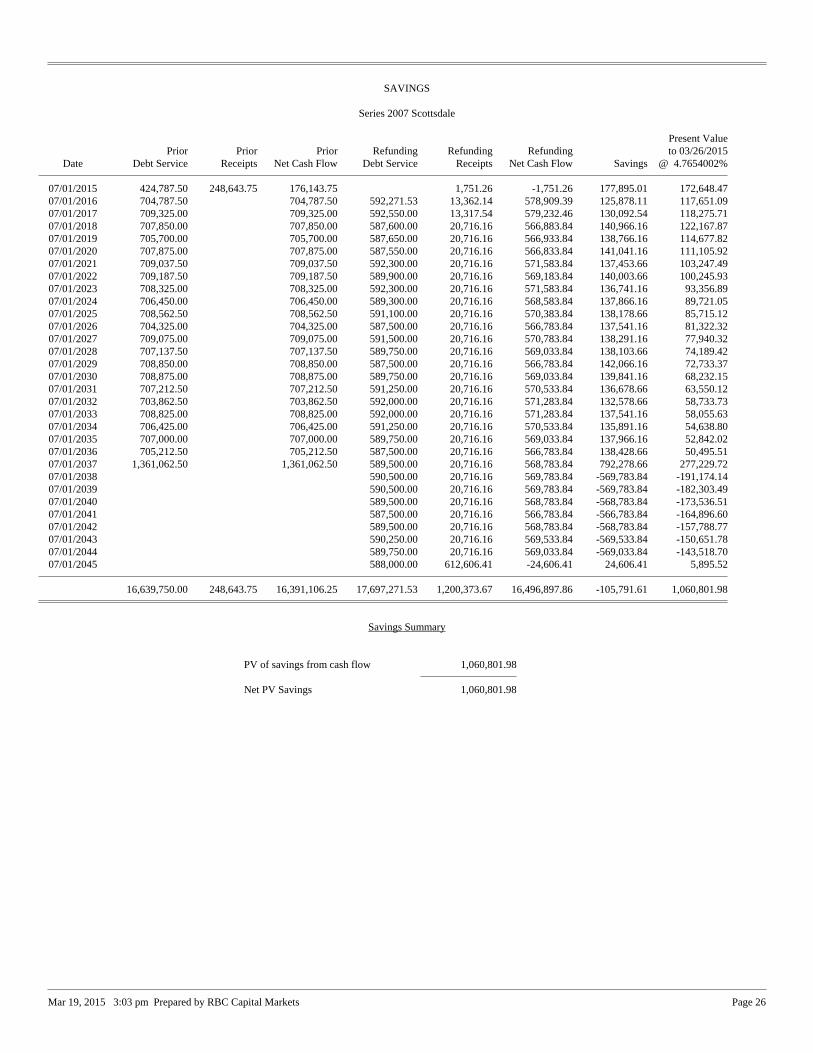
Exhibit 5 BASIS Scottsdale $1,060,802
Exhibit 6 BASIS Oro Valley $943,018
Exhibit 7 BASIS DC $6,629,297
Refinancing these five schools generated over $10 million in positive NPV for BASIS Charter
Schools, Inc. (BCSI). We also ask the Board to consider the NPV savings from our financings in
early fiscal year 2017:
Exhibit Bond Series NPV Savings
Exhibit 8 2017AB $448,642

2 of 2
In further support of the net income measure, we ask the Board to consider that focusing on the “net book value” of the land and buildings is inaccurate when analyzing BCSI financials. It is more accurate to consider the market value of the land and buildings, which captures reality rather than an accounting calculation called net book value. This is the approach used by the public markets and if applied here, BCSI net assets would turn positive by over $10 million. The difference between the market value and the book value of the BCSI real estate portfolio at June 30, 2017 is at least +$47 million USD using appraisals from the last 3 years, with the exception that one appraisal is from 2013. This is one of the reasons that the BCSI bond offerings across the last three years have received buy orders that are 5x over the available supply. The Board can confirm this by comparing the most recent appraisal values from the 2018A bond series, attached here as Exhibit 9 (Table A-2-4), to Note 5 on the audit report, attached here as Exhibit 10. Please note that Exhibit 9 was provided as a part of the entire 2018A Limited Offering Memorandum (LOM) in a previous submission, but we are presenting only this table as a part of this submission for your convenience. If the Board wants the entire 2018A LOM submitted again as a part of this submission, we are happy to provide it. The real property market value of the schools in operation at June 30, 2017 per Exhibit 9 as compared to the Land and improvements, Building and leasehold improvements, and Accumulated Depreciation of those same schools from Exhibit 10 shows at least +$47 million in net assets. As a part of our submission, we have also included internally prepared, unaudited FY 2018 consolidated statements as Exhibit 11. These statements show a net surplus after taking into account the preliminary extinguishment of debt amounts. As noted in previous submissions to the Board, BASIS expects the net surplus to run negative due to the capital restructuring activities associated with refinancing all the BASIS Charter Schools. 2c. Fixed Charge Coverage Ratio
FY 2017 FCC ratio for BCSI schools was 0.61, per the Financial Performance dashboard. Given
the non-recurring nature of some of the activities on the consolidated statement of activities,
we request the adjustments for the write-off of loan issuance cost be made to the net surplus
figure before arriving at the net surplus available to cover any fixed charges. The adjusted FCC
for FY 2017 is shown in Exhibit 12. We are pleased to report a strong improvement in this
measure over the last year with the ratio calculating to be 0.90 when the non-cash non-
recurring entries described in our response to 2a above are removed. We believe that this
demonstrates strong improvement over the 0.40 FCC from FY 2016 and ask the Board to
consider our year over year improvement. As additional support of BCSI’s ability to cover fixed
charges, we ask the Board to consider a similar calculation framework that is required annually
by our bond holders and Standard and Poors during their rating evaluations done prior to each
bond offering. The calculation is performed annually by the same firm which completes the
audit report and is included here as Exhibit 13. This calculation reveals a Debt Service Coverage
Ratio of 1.25, which exceeds our debt covenants and meets the expectations required by the
municipal bond market for additional debt.

BASIS SCHOOLS, INC.
CONSOLIDATED STATEMENT OF ACTIVITIES
Year Ended June 30, 2017
UnrestrictedTemporarilyRestricted Total
Revenue and support:State revenues $ 102,108,223 $ 102,108,223Federal revenues 1,488,171 1,488,171Local revenues 11,175,856 $ 5,873,543 17,049,399
Net assets released from restrictions 5,206,651 (5,206,651)Total revenue and support 119,978,901 666,892 120,645,793
Expenses:Primary and secondary education 107,082,573 107,082,573General and administrative 17,803,500 17,803,500Fundraising 533,656 533,656
Total expenses 125,419,729 125,419,729
Change in net assets (deficit) before unrealized loss and write-off of loan issuance costs and prepayment penalties (5,440,828) 666,892 (4,773,936)
Unrealized loss (284,587) (284,587)Write-off of loan issuance costs and prepayment penalties (4,105,155) (4,105,155)
Change in net assets (deficit) (9,830,570) 666,892 (9,163,678)
Net assets (deficit), beginning of year (27,232,983) 4,243,559 (22,989,424)
Net assets (deficit), end of year $ (37,063,553) $ 4,910,451 $ (32,153,102)
The accompanying notes are an integral part of these statements.5

Jan 25, 2017 2:13 pm Prepared by RBC Capital Markets Page 5
NET DEBT SERVICE
Arizona Industrial Development AuthorityEducation Revenue Bonds (BASIS Schools Projects), Series 2017A and 2017B (Taxable)
***************************FINAL
CapitalizedInterest Fund
Period Total Debt Service (through NetEnding Principal Interest Debt Service Reserve Fund 1/1/2018) Debt Service
07/01/2017 225,000 1,646,325.83 1,871,325.83 893,684.41 977,641.4207/01/2018 640,000 3,965,887.50 4,605,887.50 1,079,618.75 3,526,268.7507/01/2019 600,000 3,932,287.50 4,532,287.50 4,532,287.5007/01/2020 640,000 3,907,600.00 4,547,600.00 4,547,600.0007/01/2021 665,000 3,882,000.00 4,547,000.00 4,547,000.0007/01/2022 690,000 3,855,400.00 4,545,400.00 4,545,400.0007/01/2023 725,000 3,820,900.00 4,545,900.00 4,545,900.0007/01/2024 760,000 3,784,650.00 4,544,650.00 4,544,650.0007/01/2025 800,000 3,746,650.00 4,546,650.00 4,546,650.0007/01/2026 840,000 3,706,650.00 4,546,650.00 4,546,650.0007/01/2027 880,000 3,664,650.00 4,544,650.00 4,544,650.0007/01/2028 930,000 3,619,550.04 4,549,550.04 4,549,550.0407/01/2029 975,000 3,571,887.52 4,546,887.52 4,546,887.5207/01/2030 1,030,000 3,521,918.78 4,551,918.78 4,551,918.7807/01/2031 1,080,000 3,469,131.26 4,549,131.26 4,549,131.2607/01/2032 1,135,000 3,413,781.28 4,548,781.28 4,548,781.2807/01/2033 1,190,000 3,355,612.52 4,545,612.52 4,545,612.5207/01/2034 1,250,000 3,294,625.02 4,544,625.02 4,544,625.0207/01/2035 1,310,000 3,230,562.52 4,540,562.52 4,540,562.5207/01/2036 1,385,000 3,163,425.02 4,548,425.02 4,548,425.0207/01/2037 1,460,000 3,092,443.76 4,552,443.76 4,552,443.7607/01/2038 1,525,000 3,017,618.76 4,542,618.76 4,542,618.7607/01/2039 1,610,000 2,937,556.26 4,547,556.26 4,547,556.2607/01/2040 1,695,000 2,853,031.26 4,548,031.26 4,548,031.2607/01/2041 1,780,000 2,764,043.76 4,544,043.76 4,544,043.7607/01/2042 1,875,000 2,670,593.76 4,545,593.76 4,545,593.7607/01/2043 1,970,000 2,572,156.26 4,542,156.26 4,542,156.2607/01/2044 2,085,000 2,468,731.26 4,553,731.26 4,553,731.2607/01/2045 2,190,000 2,359,268.76 4,549,268.76 4,549,268.7607/01/2046 1,815,000 2,244,293.76 4,059,293.76 4,059,293.7607/01/2047 9,610,000 2,149,006.26 11,759,006.26 11,759,006.2607/01/2048 10,115,000 1,644,481.26 11,759,481.26 11,759,481.2607/01/2049 10,460,000 1,100,800.02 11,560,800.02 11,560,800.0207/01/2050 10,020,000 538,575.02 10,558,575.02 4,553,731.26 6,004,843.76
75,960,000 102,966,094.95 178,926,094.95 4,553,731.26 1,973,303.16 172,399,060.53

Mar 19, 2015 3:03 pm Prepared by RBC Capital Markets Page 28
SAVINGS
Series 2013 Tucson Primary
Present ValuePrior Prior Prior Refunding Refunding Refunding to 03/26/2015
Date Debt Service Receipts Net Cash Flow Debt Service Receipts Net Cash Flow Savings @ 4.7654002%
07/01/2015 320,423.75 108,271.93 212,151.82 3,877.38 -3,877.38 216,029.20 212,089.7307/01/2016 755,847.50 5,547.84 750,299.66 725,121.53 16,389.61 708,731.92 41,567.74 37,558.5607/01/2017 758,890.00 12,482.64 746,407.36 724,450.00 16,334.90 708,115.10 38,292.26 35,632.9307/01/2018 756,327.50 19,417.44 736,910.06 723,450.00 25,409.84 698,040.16 38,869.90 34,494.9307/01/2019 758,462.50 19,417.44 739,045.06 722,300.00 25,409.84 696,890.16 42,154.90 35,578.6907/01/2020 754,992.50 19,417.44 735,575.06 726,000.00 25,409.84 700,590.16 34,984.90 28,326.0607/01/2021 756,220.00 19,417.44 736,802.56 724,400.00 25,409.84 698,990.16 37,812.40 29,108.8607/01/2022 756,842.50 19,417.44 737,425.06 725,400.00 25,409.84 699,990.16 37,434.90 27,498.4307/01/2023 756,860.00 19,417.44 737,442.56 721,000.00 25,409.84 695,590.16 41,852.40 29,222.0307/01/2024 761,272.50 19,417.44 741,855.06 721,400.00 25,409.84 695,990.16 45,864.90 30,463.9307/01/2025 758,875.00 19,417.44 739,457.56 721,400.00 25,409.84 695,990.16 43,467.40 27,566.3407/01/2026 754,875.00 19,417.44 735,457.56 726,000.00 25,409.84 700,590.16 34,867.40 21,213.3607/01/2027 755,175.00 19,417.44 735,757.56 722,250.00 25,409.84 696,840.16 38,917.40 22,504.2307/01/2028 754,425.00 19,417.44 735,007.56 723,000.00 25,409.84 697,590.16 37,417.40 20,656.2307/01/2029 757,625.00 19,417.44 738,207.56 723,000.00 25,409.84 697,590.16 40,617.40 21,329.6107/01/2030 754,425.00 19,417.44 735,007.56 722,250.00 25,409.84 696,840.16 38,167.40 19,140.2407/01/2031 755,175.00 19,417.44 735,757.56 725,750.00 25,409.84 700,340.16 35,417.40 16,966.0407/01/2032 754,525.00 19,417.44 735,107.56 723,250.00 25,409.84 697,840.16 37,267.40 16,989.3907/01/2033 757,475.00 19,417.44 738,057.56 725,000.00 25,409.84 699,590.16 38,467.40 16,696.3907/01/2034 758,675.00 19,417.44 739,257.56 725,750.00 25,409.84 700,340.16 38,917.40 16,088.0607/01/2035 757,212.50 19,417.44 737,795.06 725,500.00 25,409.84 700,090.16 37,704.90 14,852.5507/01/2036 753,937.50 19,417.44 734,520.06 724,250.00 25,409.84 698,840.16 35,679.90 13,394.6507/01/2037 758,850.00 19,417.44 739,432.56 722,000.00 25,409.84 696,590.16 42,842.40 15,255.8707/01/2038 756,225.00 19,417.44 736,807.56 723,750.00 25,409.84 698,340.16 38,467.40 13,053.9907/01/2039 756,425.00 19,417.44 737,007.56 724,250.00 25,409.84 698,840.16 38,167.40 12,318.6407/01/2040 754,087.50 19,417.44 734,670.06 723,500.00 25,409.84 698,090.16 36,579.90 11,226.8907/01/2041 754,212.50 19,417.44 734,795.06 721,500.00 25,409.84 696,090.16 38,704.90 11,282.7407/01/2042 756,437.50 19,417.44 737,020.06 723,250.00 25,409.84 697,840.16 39,179.90 10,847.3207/01/2043 1,115,400.00 574,201.19 541,198.81 723,500.00 25,409.84 698,090.16 -156,891.35 -41,502.7607/01/2044 722,250.00 25,409.84 696,840.16 -696,840.16 -175,753.8207/01/2045 724,500.00 751,405.33 -26,905.33 26,905.33 6,443.10
21,860,176.25 1,185,939.60 20,674,236.65 21,709,421.53 1,474,072.90 20,235,348.63 438,888.02 590,543.21
Savings Summary
PV of savings from cash flow 590,543.21
Net PV Savings 590,543.21

Mar 19, 2015 3:03 pm Prepared by RBC Capital Markets Page 27
SAVINGS
Series 2012 Tucson North
Present ValuePrior Prior Prior Refunding Refunding Refunding to 03/26/2015
Date Debt Service Receipts Net Cash Flow Debt Service Receipts Net Cash Flow Savings @ 4.7654002%
07/01/2015 470,575.00 263,661.81 206,913.19 3,881.96 -3,881.96 210,795.15 205,009.3307/01/2016 824,587.50 8,050.00 816,537.50 789,018.75 17,840.73 771,178.02 45,359.48 41,269.2907/01/2017 828,337.50 18,112.50 810,225.00 785,900.00 17,781.18 768,118.82 42,106.18 39,423.2507/01/2018 831,462.50 28,175.00 803,287.50 789,450.00 27,659.62 761,790.38 41,497.12 37,081.1407/01/2019 833,962.50 28,175.00 805,787.50 787,700.00 27,659.62 760,040.38 45,747.12 38,844.7707/01/2020 830,837.50 28,175.00 802,662.50 785,800.00 27,659.62 758,140.38 44,522.12 36,090.3607/01/2021 832,400.00 28,175.00 804,225.00 788,750.00 27,659.62 761,090.38 43,134.62 33,384.7307/01/2022 833,337.50 28,175.00 805,162.50 788,950.00 27,659.62 761,290.38 43,872.12 32,378.9907/01/2023 828,650.00 28,175.00 800,475.00 788,750.00 27,659.62 761,090.38 39,384.62 27,852.8307/01/2024 827,250.00 28,175.00 799,075.00 788,150.00 27,659.62 760,490.38 38,584.62 26,048.2007/01/2025 825,137.50 28,175.00 796,962.50 787,150.00 27,659.62 759,490.38 37,472.12 24,155.6507/01/2026 827,312.50 28,175.00 799,137.50 785,750.00 27,659.62 758,090.38 41,047.12 25,137.6807/01/2027 823,418.76 28,175.00 795,243.76 786,000.00 27,659.62 758,340.38 36,903.38 21,661.2707/01/2028 828,812.50 28,175.00 800,637.50 785,500.00 27,659.62 757,840.38 42,797.12 23,826.2307/01/2029 827,781.26 28,175.00 799,606.26 789,250.00 27,659.62 761,590.38 38,015.88 20,289.1707/01/2030 825,681.26 28,175.00 797,506.26 787,000.00 27,659.62 759,340.38 38,165.88 19,429.7707/01/2031 832,512.50 28,175.00 804,337.50 789,000.00 27,659.62 761,340.38 42,997.12 20,781.0107/01/2032 822,562.50 28,175.00 794,387.50 790,000.00 27,659.62 762,340.38 32,047.12 14,963.6107/01/2033 771,900.00 28,175.00 743,725.00 785,000.00 27,659.62 757,340.38 -13,615.38 -5,048.0407/01/2034 762,660.00 28,175.00 734,485.00 789,250.00 27,659.62 761,590.38 -27,105.38 -10,253.6307/01/2035 767,680.00 28,175.00 739,505.00 787,250.00 27,659.62 759,590.38 -20,085.38 -7,069.4707/01/2036 625,850.00 28,175.00 597,675.00 789,250.00 27,659.62 761,590.38 -163,915.38 -59,575.8507/01/2037 437,900.00 28,175.00 409,725.00 785,000.00 27,659.62 757,340.38 -347,615.38 -121,166.7007/01/2038 1,437,900.00 28,175.00 1,409,725.00 789,750.00 27,659.62 762,090.38 647,634.62 217,253.4507/01/2039 1,432,400.00 28,175.00 1,404,225.00 788,000.00 27,659.62 760,340.38 643,884.62 205,877.7507/01/2040 1,436,615.00 28,175.00 1,408,440.00 790,000.00 27,659.62 762,340.38 646,099.62 196,889.3107/01/2041 1,434,412.50 28,175.00 1,406,237.50 785,500.00 27,659.62 757,840.38 648,397.12 188,299.1107/01/2042 1,435,792.50 833,175.00 602,617.50 789,750.00 27,659.62 762,090.38 -159,472.88 -44,292.7907/01/2043 787,250.00 27,659.62 759,590.38 -759,590.38 -200,925.6907/01/2044 788,250.00 27,659.62 760,590.38 -760,590.38 -191,832.3807/01/2045 787,500.00 817,934.26 -30,434.26 30,434.26 7,289.45
25,097,728.78 1,799,199.31 23,298,529.47 23,633,868.75 1,604,247.87 22,029,620.88 1,268,908.59 863,071.81
Savings Summary
PV of savings from cash flow 863,071.81
Net PV Savings 863,071.81
Mar 19, 2015 3:03 pm Prepared by RBC Capital Markets Page 26
SAVINGS
Series 2007 Scottsdale
Present ValuePrior Prior Prior Refunding Refunding Refunding to 03/26/2015
Date Debt Service Receipts Net Cash Flow Debt Service Receipts Net Cash Flow Savings @ 4.7654002%
07/01/2015 424,787.50 248,643.75 176,143.75 1,751.26 -1,751.26 177,895.01 172,648.4707/01/2016 704,787.50 704,787.50 592,271.53 13,362.14 578,909.39 125,878.11 117,651.0907/01/2017 709,325.00 709,325.00 592,550.00 13,317.54 579,232.46 130,092.54 118,275.7107/01/2018 707,850.00 707,850.00 587,600.00 20,716.16 566,883.84 140,966.16 122,167.8707/01/2019 705,700.00 705,700.00 587,650.00 20,716.16 566,933.84 138,766.16 114,677.8207/01/2020 707,875.00 707,875.00 587,550.00 20,716.16 566,833.84 141,041.16 111,105.9207/01/2021 709,037.50 709,037.50 592,300.00 20,716.16 571,583.84 137,453.66 103,247.4907/01/2022 709,187.50 709,187.50 589,900.00 20,716.16 569,183.84 140,003.66 100,245.9307/01/2023 708,325.00 708,325.00 592,300.00 20,716.16 571,583.84 136,741.16 93,356.8907/01/2024 706,450.00 706,450.00 589,300.00 20,716.16 568,583.84 137,866.16 89,721.0507/01/2025 708,562.50 708,562.50 591,100.00 20,716.16 570,383.84 138,178.66 85,715.1207/01/2026 704,325.00 704,325.00 587,500.00 20,716.16 566,783.84 137,541.16 81,322.3207/01/2027 709,075.00 709,075.00 591,500.00 20,716.16 570,783.84 138,291.16 77,940.3207/01/2028 707,137.50 707,137.50 589,750.00 20,716.16 569,033.84 138,103.66 74,189.4207/01/2029 708,850.00 708,850.00 587,500.00 20,716.16 566,783.84 142,066.16 72,733.3707/01/2030 708,875.00 708,875.00 589,750.00 20,716.16 569,033.84 139,841.16 68,232.1507/01/2031 707,212.50 707,212.50 591,250.00 20,716.16 570,533.84 136,678.66 63,550.1207/01/2032 703,862.50 703,862.50 592,000.00 20,716.16 571,283.84 132,578.66 58,733.7307/01/2033 708,825.00 708,825.00 592,000.00 20,716.16 571,283.84 137,541.16 58,055.6307/01/2034 706,425.00 706,425.00 591,250.00 20,716.16 570,533.84 135,891.16 54,638.8007/01/2035 707,000.00 707,000.00 589,750.00 20,716.16 569,033.84 137,966.16 52,842.0207/01/2036 705,212.50 705,212.50 587,500.00 20,716.16 566,783.84 138,428.66 50,495.5107/01/2037 1,361,062.50 1,361,062.50 589,500.00 20,716.16 568,783.84 792,278.66 277,229.7207/01/2038 590,500.00 20,716.16 569,783.84 -569,783.84 -191,174.1407/01/2039 590,500.00 20,716.16 569,783.84 -569,783.84 -182,303.4907/01/2040 589,500.00 20,716.16 568,783.84 -568,783.84 -173,536.5107/01/2041 587,500.00 20,716.16 566,783.84 -566,783.84 -164,896.6007/01/2042 589,500.00 20,716.16 568,783.84 -568,783.84 -157,788.7707/01/2043 590,250.00 20,716.16 569,533.84 -569,533.84 -150,651.7807/01/2044 589,750.00 20,716.16 569,033.84 -569,033.84 -143,518.7007/01/2045 588,000.00 612,606.41 -24,606.41 24,606.41 5,895.52
16,639,750.00 248,643.75 16,391,106.25 17,697,271.53 1,200,373.67 16,496,897.86 -105,791.61 1,060,801.98
Savings Summary
PV of savings from cash flow 1,060,801.98
Net PV Savings 1,060,801.98

Dec 10, 2015 10:01 am Prepared by RBC Capital Markets Page 13
SAVINGS
Oro Valley Primary Refunding************************
Refund to 1/1/2018 at 103 Redemption Price
Present ValuePrior Prior Prior Refunding Refunding Refunding to 01/05/2016
Date Debt Service Receipts Net Cash Flow Debt Service Receipts Net Cash Flow Savings @ 4.8097371%
07/01/2016 399,434.38 47,500.00 351,934.38 240,020.00 240,020.00 111,914.38 108,252.9307/01/2017 707,931.26 707,931.26 645,950.00 8,174.79 637,775.21 70,156.05 66,727.1807/01/2018 706,368.76 706,368.76 646,300.00 22,991.60 623,308.40 83,060.36 75,215.3107/01/2019 704,493.76 704,493.76 646,500.00 22,991.60 623,508.40 80,985.36 69,945.0107/01/2020 707,306.26 707,306.26 646,550.00 22,991.60 623,558.40 83,747.86 68,908.4407/01/2021 704,493.76 704,493.76 646,450.00 22,991.60 623,458.40 81,035.36 63,595.1907/01/2022 706,368.76 706,368.76 649,450.00 22,991.60 626,458.40 79,910.36 59,806.9507/01/2023 707,618.76 707,618.76 647,050.00 22,991.60 624,058.40 83,560.36 59,576.4507/01/2024 708,243.76 708,243.76 649,450.00 22,991.60 626,458.40 81,785.36 55,611.1707/01/2025 708,243.76 708,243.76 646,450.00 22,991.60 623,458.40 84,785.36 54,925.5707/01/2026 705,918.76 705,918.76 648,250.00 22,991.60 625,258.40 80,660.36 49,840.3507/01/2027 707,868.76 707,868.76 647,500.00 22,991.60 624,508.40 83,360.36 49,074.8607/01/2028 708,731.26 708,731.26 646,250.00 22,991.60 623,258.40 85,472.86 47,944.6407/01/2029 708,506.26 708,506.26 644,500.00 22,991.60 621,508.40 86,997.86 46,500.4507/01/2030 707,193.76 707,193.76 647,250.00 22,991.60 624,258.40 82,935.36 42,277.0907/01/2031 704,793.76 704,793.76 644,250.00 22,991.60 621,258.40 83,535.36 40,576.7707/01/2032 706,306.26 706,306.26 645,750.00 22,991.60 622,758.40 83,547.86 38,671.6607/01/2033 706,368.76 706,368.76 646,500.00 22,991.60 623,508.40 82,860.36 36,547.4607/01/2034 704,981.26 704,981.26 646,500.00 22,991.60 623,508.40 81,472.86 34,242.9307/01/2035 707,143.76 707,143.76 645,750.00 22,991.60 622,758.40 84,385.36 33,773.1807/01/2036 706,218.76 706,218.76 649,250.00 22,991.60 626,258.40 79,960.36 30,491.6707/01/2037 703,387.50 703,387.50 646,750.00 22,991.60 623,758.40 79,629.10 28,912.3307/01/2038 703,650.00 703,650.00 648,500.00 22,991.60 625,508.40 78,141.60 27,012.0807/01/2039 706,625.00 706,625.00 649,250.00 22,991.60 626,258.40 80,366.60 26,436.5807/01/2040 706,931.26 706,931.26 649,000.00 22,991.60 626,008.40 80,922.86 25,328.9507/01/2041 704,568.76 704,568.76 647,750.00 22,991.60 624,758.40 79,810.36 23,764.3207/01/2042 704,537.50 704,537.50 645,500.00 22,991.60 622,508.40 82,029.10 23,230.5607/01/2043 706,456.26 706,456.26 647,250.00 22,991.60 624,258.40 82,197.86 22,133.4107/01/2044 704,943.76 704,943.76 647,750.00 22,991.60 624,758.40 80,185.36 20,518.0907/01/2045 632,000.00 22,991.60 609,008.40 -609,008.40 -150,195.4307/01/2046 1,695,750.00 688,498.23 1,007,251.77 -1,007,251.77 -236,627.54
20,175,634.62 47,500.00 20,128,134.62 20,685,420.00 1,340,437.82 19,344,982.18 783,152.44 943,018.63
Savings Summary
PV of savings from cash flow 943,018.63Plus: Refunding funds on hand 16,585.38
Net PV Savings 959,604.01

Dec 10, 2015 10:01 am Prepared by RBC Capital Markets Page 14
SAVINGS
DC Refunding************************
Present ValuePrior Refunding Refunding Refunding to 01/05/2016
Date Debt Service Debt Service Receipts Net Cash Flow Savings @ 4.8097371%
07/01/2016 1,163,750.00 790,557.77 790,557.77 1,163,750.00 1,150,647.6707/01/2017 2,182,500.00 2,152,050.00 26,976.01 2,125,073.99 57,426.01 82,095.5707/01/2018 2,200,000.00 2,156,000.00 75,870.04 2,080,129.96 119,870.04 135,059.9707/01/2019 2,300,000.00 2,149,350.00 75,870.04 2,073,479.96 226,520.04 222,737.1107/01/2020 2,300,000.00 2,152,400.00 75,870.04 2,076,529.96 223,470.04 210,099.1007/01/2021 2,387,500.00 2,149,850.00 75,870.04 2,073,979.96 313,520.04 271,098.6107/01/2022 2,605,000.00 2,155,850.00 75,870.04 2,079,979.96 525,020.04 420,580.7607/01/2023 2,605,000.00 2,155,650.00 75,870.04 2,079,779.96 525,220.04 401,411.3107/01/2024 2,605,000.00 2,149,450.00 75,870.04 2,073,579.96 531,420.04 387,131.3207/01/2025 2,692,500.00 2,152,450.00 75,870.04 2,076,579.96 615,920.04 424,201.1907/01/2026 2,810,000.00 2,154,250.00 75,870.04 2,078,379.96 731,620.04 477,902.5407/01/2027 2,810,000.00 2,152,500.00 75,870.04 2,076,629.96 733,370.04 456,989.6707/01/2028 2,810,000.00 2,154,000.00 75,870.04 2,078,129.96 731,870.04 435,205.0507/01/2029 2,897,500.00 2,153,500.00 75,870.04 2,077,629.96 819,870.04 462,443.3707/01/2030 2,915,000.00 2,151,000.00 75,870.04 2,075,129.96 839,870.04 451,653.6407/01/2031 2,415,000.00 2,151,500.00 75,870.04 2,075,629.96 339,370.04 181,555.9007/01/2032 2,415,000.00 2,154,750.00 75,870.04 2,078,879.96 336,120.04 171,901.1407/01/2033 21,402,500.00 2,155,500.00 75,870.04 2,079,629.96 19,322,870.04 8,786,981.4607/01/2034 2,153,750.00 75,870.04 2,077,879.96 -2,077,879.96 -867,911.8007/01/2035 2,154,500.00 75,870.04 2,078,629.96 -2,078,629.96 -827,665.1707/01/2036 2,152,500.00 75,870.04 2,076,629.96 -2,076,629.96 -788,233.8407/01/2037 2,152,750.00 75,870.04 2,076,879.96 -2,076,879.96 -751,478.2007/01/2038 2,155,000.00 75,870.04 2,079,129.96 -2,079,129.96 -717,110.8607/01/2039 2,154,000.00 75,870.04 2,078,129.96 -2,078,129.96 -683,237.8507/01/2040 2,154,750.00 75,870.04 2,078,879.96 -2,078,879.96 -651,498.6107/01/2041 2,152,000.00 75,870.04 2,076,129.96 -2,076,129.96 -620,179.0807/01/2042 2,150,750.00 75,870.04 2,074,879.96 -2,074,879.96 -590,777.3507/01/2043 2,150,750.00 75,870.04 2,074,879.96 -2,074,879.96 -563,095.1507/01/2044 2,141,750.00 75,870.04 2,065,879.96 -2,065,879.96 -534,373.7407/01/2045 1,949,000.00 75,870.04 1,873,129.96 -1,873,129.96 -461,852.4107/01/2046 4,546,500.00 2,271,977.13 2,274,522.87 -2,274,522.87 -534,343.34
63,516,250.00 67,558,607.77 5,213,872.03 62,344,735.74 1,171,514.26 6,537,937.99
Savings Summary
PV of savings from cash flow 6,537,937.99Plus: Refunding funds on hand 91,359.83
Net PV Savings 6,629,297.82

Jan 25, 2017 2:13 pm Prepared by RBC Capital Markets Page 6
SAVINGS
Arizona Industrial Development AuthorityEducation Revenue Bonds (BASIS Schools Projects), Series 2017A and 2017B (Taxable)
***************************FINAL
Present ValuePrior Prior Prior Refunding Refunding Refunding to 02/02/2017
Date Debt Service Receipts Net Cash Flow Debt Service Receipts Net Cash Flow Savings @ 5.3019470%
07/01/2017 1,387,625.00 583,262.36 804,362.64 757,322.36 757,322.36 47,040.28 33,535.7407/01/2018 2,400,875.00 2,400,875.00 1,920,400.00 1,920,400.00 480,475.00 449,169.3807/01/2019 2,406,625.00 2,406,625.00 2,218,050.00 2,218,050.00 188,575.00 168,809.7807/01/2020 2,411,000.00 2,411,000.00 2,234,562.50 2,234,562.50 176,437.50 149,972.3307/01/2021 2,398,500.00 2,398,500.00 2,235,362.50 2,235,362.50 163,137.50 131,681.9107/01/2022 2,400,062.50 2,400,062.50 2,235,362.50 2,235,362.50 164,700.00 126,061.1007/01/2023 2,399,750.00 2,399,750.00 2,234,362.50 2,234,362.50 165,387.50 120,084.7107/01/2024 2,402,562.50 2,402,562.50 2,237,112.50 2,237,112.50 165,450.00 113,960.4007/01/2025 2,403,187.50 2,403,187.50 2,233,362.50 2,233,362.50 169,825.00 110,919.1607/01/2026 2,406,506.26 2,406,506.26 2,233,362.50 2,233,362.50 173,143.76 107,197.3707/01/2027 2,406,618.76 2,406,618.76 2,231,862.50 2,231,862.50 174,756.26 102,564.2407/01/2028 2,403,525.02 2,403,525.02 2,238,037.52 2,238,037.52 165,487.50 92,130.4207/01/2029 2,402,225.00 2,402,225.00 2,237,162.52 2,237,162.52 165,062.48 87,104.5607/01/2030 2,407,362.52 2,407,362.52 2,239,493.76 2,239,493.76 167,868.76 83,941.6007/01/2031 2,403,225.00 2,403,225.00 2,234,775.00 2,234,775.00 168,450.00 79,814.3007/01/2032 2,405,168.76 2,405,168.76 2,233,262.52 2,233,262.52 171,906.24 77,160.4207/01/2033 2,402,481.26 2,402,481.26 2,234,700.02 2,234,700.02 167,781.24 71,343.6407/01/2034 2,405,162.50 2,405,162.50 2,233,831.26 2,233,831.26 171,331.24 68,992.5407/01/2035 2,407,500.00 2,407,500.00 2,230,656.26 2,230,656.26 176,843.74 67,429.1107/01/2036 2,404,750.00 2,404,750.00 2,235,175.02 2,235,175.02 169,574.98 61,180.6607/01/2037 2,405,625.00 2,405,625.00 2,236,875.00 2,236,875.00 168,750.00 57,592.0507/01/2038 2,399,375.00 2,399,375.00 2,230,756.26 2,230,756.26 168,618.74 54,417.9407/01/2039 2,401,000.00 2,401,000.00 2,235,643.76 2,235,643.76 165,356.24 50,435.9207/01/2040 2,404,375.00 2,404,375.00 2,237,118.76 2,237,118.76 167,256.24 48,215.8307/01/2041 2,403,750.00 2,403,750.00 2,230,181.26 2,230,181.26 173,568.74 47,300.2307/01/2042 2,398,750.00 2,398,750.00 2,235,093.76 2,235,093.76 163,656.24 42,039.1807/01/2043 2,404,000.00 2,404,000.00 2,231,068.76 2,231,068.76 172,931.24 41,988.8007/01/2044 2,408,000.00 2,408,000.00 2,238,368.76 2,238,368.76 169,631.24 38,814.6907/01/2045 2,236,206.26 2,236,206.26 -2,236,206.26 -507,332.8107/01/2046 2,234,843.76 2,234,843.76 -2,234,843.76 -480,929.3707/01/2047 2,234,018.76 2,234,018.76 -2,234,018.76 -455,996.9007/01/2048 2,238,468.76 2,238,468.76 -2,238,468.76 -433,363.8307/01/2049 2,235,268.76 2,235,268.76 -2,235,268.76 -410,431.8407/01/2050 2,091,693.76 2,067,043.89 24,649.87 -24,649.87 -4,536.01
66,289,587.58 583,262.36 65,706,325.22 74,033,822.62 2,067,043.89 71,966,778.73 -6,260,453.51 391,267.26
Savings Summary
PV of savings from cash flow 391,267.26Plus: Refunding funds on hand 57,375.10
Net PV Savings 448,642.36


BASIS Schools, Inc.
NOTES TO CONSOLIDATED FINANCIAL STATEMENTS
June 30, 2017
NOTE 5 - PROPERTY AND EQUIPMENT, NET
Property and equipment at June 30, 2017 consists of the following:
Land and improvements $ 50,977,876Buildings and leasehold improvements 129,021,208Vehicles, furniture and equipment 9,591,836Textbooks 5,452,340Software 5,291Construction in progress 17,843,129
Total 212,891,680
Less accumulated depreciation 19,180,011
Property and equipment, net $ 193,711,669
Depreciation for the year ended June 30, 2017 totaled $5,968,909.
NOTE 6 - LONG-TERM DEBT
Long-term debt consists of the following at June 30, 2017:
Education Revenue Bonds (BASIS Ahwatukee, Series 2013) were issuedby the Industrial Development Authority of the City of Phoenix, Arizonain the aggregate principal amount of $8,835,000. The proceeds of thebonds were loaned to the Firm pursuant to a loan agreement, datedFebruary 1, 2013. The loan matures over 30 years with an interest rate of6.75%. Annual principal and interest payments vary, and principalpayments range from a minimum of $115,000 to a maximum of$665,000, commencing on July 1, 2016. The loan proceeds were used bythe Firm for the following purposes: (i) to pay the costs of acquiring,constructing, improving, and equipping facilities; (ii) to pay forcapitalized interest; and, (iii) to pay loan issuance costs. The loan issecured by BASIS Ahwatukee's personal property and revenues,including revenues received from the State of Arizona under the BASISAhwatukee charter, and a deed of trust on real property located at theBASIS Ahwatukee site. $ 8,720,000
11

TotalState Revenues $120,314,819Federal Revenues $2,011,512Local Revenues $21,502,695Total Revenues $143,829,026
Primary and Secondary Education $122,445,730General & Administrative $20,359,829
Fundraising $573,516Defeased Interest & Extinguishment of Debt $5,015,512
Total Expenses $148,394,587
Total Net Surplus ‐$4,565,561
* FY 2018 Audit is NOT complete. These preliminary unaudited financials are provided only for ASBCS Board consideration
FY 2018 BCSI Unaudited Preliminary Statement of Activities*
Page 1 of 2

AssetsCurrent Assets
Cash & Cash Equivalents $17,551,935Accounts Receivable & Other Current Assets $27,387,849
Total Current Assets $44,939,784
Non-Current AssetsFixed Assets $341,569,888Less Accumulated Depreciation ‐$17,806,915
Total Non-Current Assets $323,762,973
Total Assets $368,702,757
Liabilities and Net AssetsLiabilities
Current LiabilitiesAccounts Payable $9,487,574Other Current Liabilities $22,748,656Total Current Liabilities $32,236,230
Non-Current Liabilities Long Term Liabilities $373,185,190Total Non-Current Liabilities $373,185,190
Total Liabilities $405,421,420
Net AssetsBeginning Net Assets ‐$32,153,102Net Surplus ‐$4,565,561
Total Net Assets ‐$36,718,663
Total Liabilities and Net Assets $368,702,757
FY 2018 BCSI Unaudited Preliminary Statement of Financial Position*
* FY 2018 Audit is NOT complete. These preliminary unaudited financials are provided only for ASBCS Board consideration
Page 2 of 2

Beginning Net Surplus(Deficit)-Per Audit -$9,163,678
Debt Refinancing adjustment $4,105,155
Debt Reserve Fund Investment adjustment $284,587
Ending Net Surplus(Deficit) -$4,773,936
Given the above changes, the Fixed Coverage Ratio(FCC) will be calculated as follows
Ending Net Surplus(Deficit) -$4,773,936
Add Amortization $144,212
Add Depreciation $5,968,909
Add Interest $12,274,983
Total Net Surplus net of Depreciation, amortization of loan issuance cost, interest expense $13,614,168
Total Current Year Interest + Current Maturities of Long-Term Debt $15,139,983
Fixed Coverage Ratio 0.90
Fixed Coverage Ratio

BASIS SCHOOLS, INC.
SERIES 2015, 2016, and 2017 (BASIS Schools Projects)
DEBT SERVICE COVERAGE RATIO
Year Ended June 30, 2017
Covenants
Series 2015, 2016, 2017
Net income available for debt service:Pledged revenue 103,463,098$ Interest earnings 222,765
Total operating expenses: 107,082,366$ Net income (loss) (3,396,503) Add: depreciation 5,137,328 Add: amortization 186,674
Add: interest expense 10,699,678 Subtotal 12,627,177
Total non-recurring expenses: (4,389,742) Add back:
Extraordinary items - Gain/loss on extinguishment of debt 4,105,155
Unrealized loss 284,587 Proceeds of new debt -
Proceeds of insurance policies - Subtotal -
Net income available for debt service: 12,627,177
YearFiscal year debt service requirement: 2016-17 10,120,037$
DEBT SERVICE COVERAGE RATIO: 1.25
NOTE 1:
Debt Service Coverage Ratio: The Obligated Group Representative shall deliver to the Master Trustee an Officer'sCertificate, no later than six months after the close of each fiscal year, setting forth the Debt Service CoverageRatio as of the end of any such Fiscal Year.
Pursuant to the Series 2017 loan agreement definition of "Pledged Revenue" and "Operating Expenses" only the revenues and expenses of BASIS - Chandler, Chandler Primary North, Chandler Primary South, DC, Flagstaff, Goodyear, Goodyear Primary, Oro Valley, Oro Valley Primary, Peoria, Peoria Primary, Phoenix, Phoenix Central, Phoenix South Primary, Prescott, San Antonio North Central, Scottsdale, Scottsdale Primary, Tucson North, and Tucson Primary are used to determine compliance with the debt service coverage ratio requirement.
Page 1 of 2
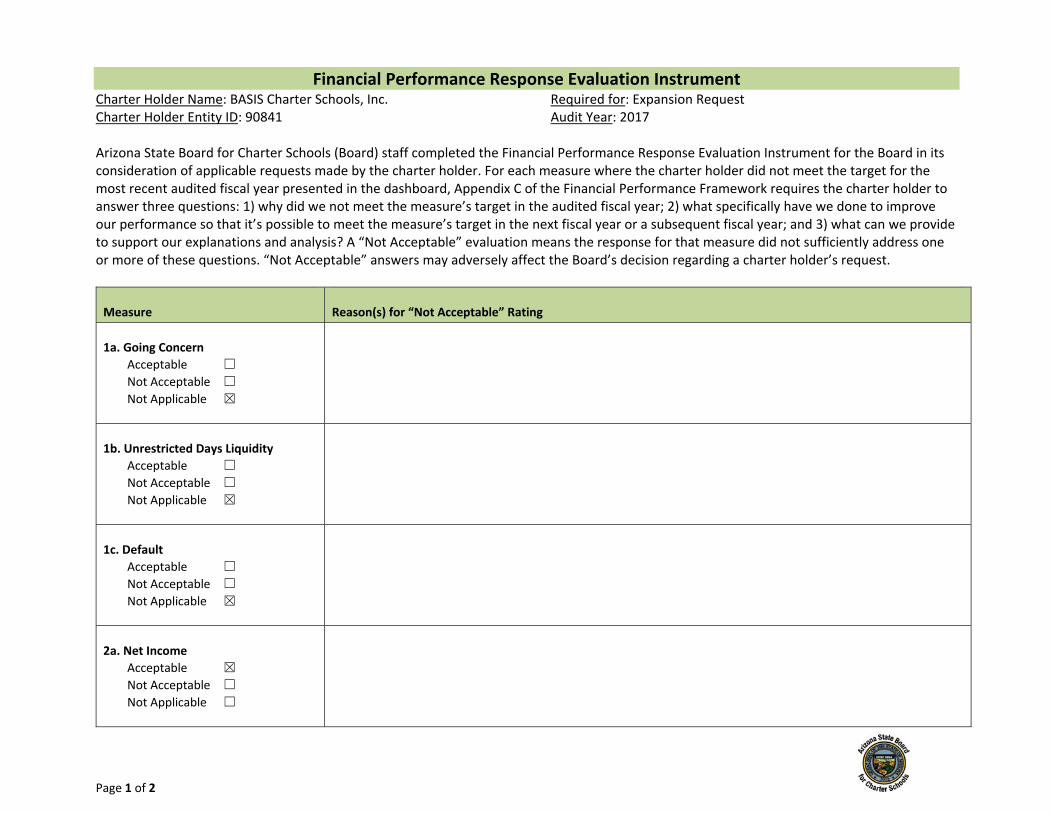
Financial Performance Response Evaluation Instrument Charter Holder Name: BASIS Charter Schools, Inc. Charter Holder Entity ID: 90841
Required for: Expansion Request Audit Year: 2017
Arizona State Board for Charter Schools (Board) staff completed the Financial Performance Response Evaluation Instrument for the Board in its consideration of applicable requests made by the charter holder. For each measure where the charter holder did not meet the target for the most recent audited fiscal year presented in the dashboard, Appendix C of the Financial Performance Framework requires the charter holder to answer three questions: 1) why did we not meet the measure’s target in the audited fiscal year; 2) what specifically have we done to improve our performance so that it’s possible to meet the measure’s target in the next fiscal year or a subsequent fiscal year; and 3) what can we provide to support our explanations and analysis? A “Not Acceptable” evaluation means the response for that measure did not sufficiently address one or more of these questions. “Not Acceptable” answers may adversely affect the Board’s decision regarding a charter holder’s request. Measure
Reason(s) for “Not Acceptable” Rating
1a. Going Concern Acceptable ☐ Not Acceptable ☐ Not Applicable ☒
1b. Unrestricted Days Liquidity Acceptable ☐ Not Acceptable ☐ Not Applicable ☒
1c. Default Acceptable ☐ Not Acceptable ☐ Not Applicable ☒
2a. Net Income Acceptable ☒ Not Acceptable ☐ Not Applicable ☐

Page 2 of 2
Measure
Reason(s) for “Not Acceptable” Rating
2b. Cash Flow Acceptable ☐ Not Acceptable ☐ Not Applicable ☒
2c. Fixed Charge Coverage Ratio Acceptable ☒ Not Acceptable ☐ Not Applicable ☐
For future reference, the Board’s current financial framework does not remove the write‐off of loan issuance costs and prepayment penalties from the change in net assets used in the ratio’s calculation or add these costs back to the ratio’s numerator. When the ratio is calculated using the current financial framework’s formula, BASIS’s performance on this measure improves from 0.41 in 2016 to 0.61 in 2017 (instead of to 0.90 as identified in the response) and is projected to improve to approximately 0.85 in 2018.


