50 PEW RESEARCH CENTER www.pewresearch.org Appendix B: National Survey of Latinos Methodology Results for this study are based on telephone interviews conducted by SSRS, an independent research company, among a nationally representative sample of 1,520 Latino respondents ages 18 and older. It was conducted on cellular and landline telephones from September 11 through October 9, 2014. For the full sample, a total of 682 respondents were native born (including Puerto Rico), and 838 were foreign born (excluding Puerto Rico). Of the foreign born, 359 were U.S. citizens, 215 were legal residents, and 248 were neither U.S. citizens nor legal residents. For results based on the total sample, one can say with 95% confidence that the error attributable to sampling is plus or minus 3.2 percentage points. For this survey, SSRS used a staff of Spanish-speaking interviewers who, when contacting a household, were able to offer respondents the option of completing the survey in Spanish or English. A total of 826 respondents (54%) were surveyed in Spanish, and 694 respondents (46%) were interviewed in English. Any person ages 18 or older of who said they were of Latino origin or descent was eligible to complete the survey. To ensure the highest possible coverage of the eligible population, the study employed a dual- frame landline/cellular telephone design. The sample consisted of a landline sampling frame (yielding 481 completed interviews) and a cell phone sampling frame (1,039 interviews). 8 Both the landline and cell phone sampling frames used a stratified sampling design, oversampling areas with higher densities of Latino residents. Overall the study employed six strata. 8 According to calculations by the National Center for Health Statistics National Health Interview Survey (NHIS), from July to December 2013, 53% of Hispanic adults were living in wireless-only households and 17% were in wireless-mostly households (Blumberg and Luke, 2014). 2014 National Survey of Latinos details Sample size Margin of error 95% confidence level Total Latinos 1,520 +/- 3.2% points Native born (incl. PR) 682 +/- 5.0% points Foreign born (excl. PR) 838 +/- 4.2% points Registered voters 733 +/- 4.8% points PEW RESEARCH CENTER
Transcript
50
PEW RESEARCH CENTER
www.pewresearch.org
Appendix B: National Survey of Latinos Methodology
Results for this study are based on telephone interviews conducted by SSRS, an independent
research company, among a nationally representative sample of 1,520 Latino respondents ages 18
and older. It was conducted on cellular and landline telephones from September 11 through
October 9, 2014.
For the full sample, a total of 682 respondents were native born (including Puerto Rico), and 838
were foreign born (excluding Puerto Rico). Of the foreign born, 359 were U.S. citizens, 215 were
legal residents, and 248 were neither U.S. citizens nor legal residents. For results based on the
total sample, one can say with 95% confidence that the error attributable to sampling is plus or
minus 3.2 percentage points.
For this survey, SSRS used a staff of Spanish-speaking interviewers who, when contacting a
household, were able to offer respondents the option of completing the survey in Spanish or
English. A total of 826 respondents (54%) were surveyed in Spanish, and 694 respondents (46%)
were interviewed in English. Any person ages 18 or older of who said they were of Latino origin or
descent was eligible to complete the survey.
To ensure the highest possible coverage of the eligible population, the study employed a dual-
frame landline/cellular telephone design. The sample consisted of a landline sampling frame
(yielding 481 completed interviews) and a cell phone sampling frame (1,039 interviews).8 Both the
landline and cell phone sampling frames used a stratified sampling design, oversampling areas
with higher densities of Latino residents. Overall the study employed six strata.
8 According to calculations by the National Center for Health Statistics National Health Interview Survey (NHIS), from July to December 2013,
53% of Hispanic adults were living in wireless-only households and 17% were in wireless-mostly households (Blumberg and Luke, 2014).
For the landline sampling frame, the sample was compared with InfoUSA and Experian landline
household databases, and phone numbers associated with households that included persons with
known Latino surnames were subdivided into a Surname stratum. The remaining, unmatched and
unlisted landline sample was used to generate a stratum with a high incidence of Latinos, based
upon the share of Latinos in the sample telephone exchange.
Marketing System Group’s (MSG) GENESYS sample generation system was used to generate cell
phone sample, which was divided into High and Medium strata, based upon the share of Latinos
in the sample telephone area code.
Samples for the low-incidence landline and low-incidence cell strata were drawn from previously
interviewed respondents in SSRS’s weekly dual-frame Excel omnibus survey. Respondents who
indicated they were Latino on the omnibus survey were eligible to be re-contacted for the present
survey. Altogether, a total of 315 previously-interviewed respondents were included in this sample.
It is important to note that the existence of a surname stratum does not mean the survey was a
surname sample design. The sample is RDD, with the randomly selected telephone numbers
divided by whether or not they were found to be associated with a Spanish surname. This was done
simply to increase the number of strata and to ease administration by allowing for more effective
assignment of interviewers and labor hours.
Interviews by Strata
Landline Cellphone
Total Interviews* Estimated % among U.S.
Latino population** Total Interviews* Estimated % among U.S.
Latino population**
Surname 226 (47%) 33%
High 88 (18%) 33% 628 (60%) 36%
Medium 263 (25%) 24%
Low 167 (35%) 33% 148 (14%) 40%
Total 481 1039
Note: *Total interviews includes the prescreened omnibus interviews that were not subject to geographic stratification. **The estimated
population breakdown is based on counts from Claritas provided by Marketing System Group (MSG). The over- or under-sampling of strata
was corrected in weighting.
PEW RESEARCH CENTER
52
PEW RESEARCH CENTER
www.pewresearch.org
A multi-stage weighting procedure was used to ensure an accurate representation of the national
Hispanic population.
An adjustment was made for all persons found to possess both a landline and a cell phone, as
they were more likely to be sampled than were respondents who possessed only one phone
type.
The sample was corrected for a potential bias associated with re-contacting previously
interviewed respondents in certain strata.
The sample was corrected for the likelihood of within-household selection, which depended
upon the number of Latino adults living in the household.
The sample was corrected for the oversampling of telephone number exchanges known to have
higher densities of Latinos and the corresponding undersampling of exchanges known to have
lower densities of Latinos.
Finally, the data were put through a post-stratification sample balancing routine. The post-
stratification weighting utilized estimates of the U.S. adult Hispanic population based on the
2013 U.S. Census Bureau’s Current Population Survey, March Supplement, on gender, age,
education, Census region, heritage, years in the U.S., phone status (i.e., cell phone only, cell
phone mostly, mixed/landline only/landline mostly) and density of the Latino population.
53
PEW RESEARCH CENTER
www.pewresearch.org
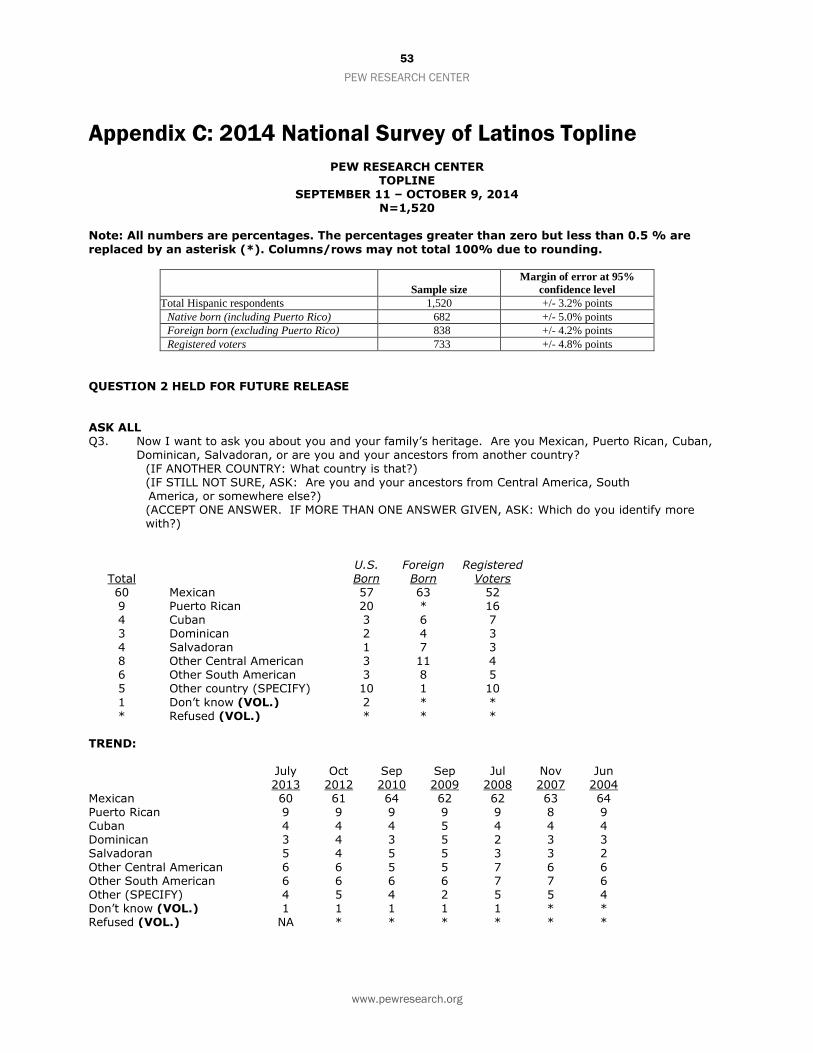
Appendix C: 2014 National Survey of Latinos Topline
PEW RESEARCH CENTER TOPLINE
SEPTEMBER 11 – OCTOBER 9, 2014 N=1,520
Note: All numbers are percentages. The percentages greater than zero but less than 0.5 % are
replaced by an asterisk (*). Columns/rows may not total 100% due to rounding.
Sample size
Margin of error at 95%
confidence level
Total Hispanic respondents 1,520 +/- 3.2% points
Native born (including Puerto Rico) 682 +/- 5.0% points
Foreign born (excluding Puerto Rico) 838 +/- 4.2% points
Registered voters 733 +/- 4.8% points
QUESTION 2 HELD FOR FUTURE RELEASE ASK ALL Q3. Now I want to ask you about you and your family’s heritage. Are you Mexican, Puerto Rican, Cuban,
Dominican, Salvadoran, or are you and your ancestors from another country? (IF ANOTHER COUNTRY: What country is that?) (IF STILL NOT SURE, ASK: Are you and your ancestors from Central America, South
America, or somewhere else?) (ACCEPT ONE ANSWER. IF MORE THAN ONE ANSWER GIVEN, ASK: Which do you identify more with?)
Total U.S. Born
Foreign Born
Registered Voters
60 Mexican 57 63 52 9 Puerto Rican 20 * 16 4 Cuban 3 6 7 3 Dominican 2 4 3 4 Salvadoran 1 7 3 8 Other Central American 3 11 4 6 Other South American 3 8 5 5 Other country (SPECIFY) 10 1 10
Other Central American 6 6 5 5 7 6 6 Other South American 6 6 6 6 7 7 6 Other (SPECIFY) 4 5 4 2 5 5 4 Don’t know (VOL.) 1 1 1 1 1 * * Refused (VOL.) NA * * * * * *
54
PEW RESEARCH CENTER
www.pewresearch.org
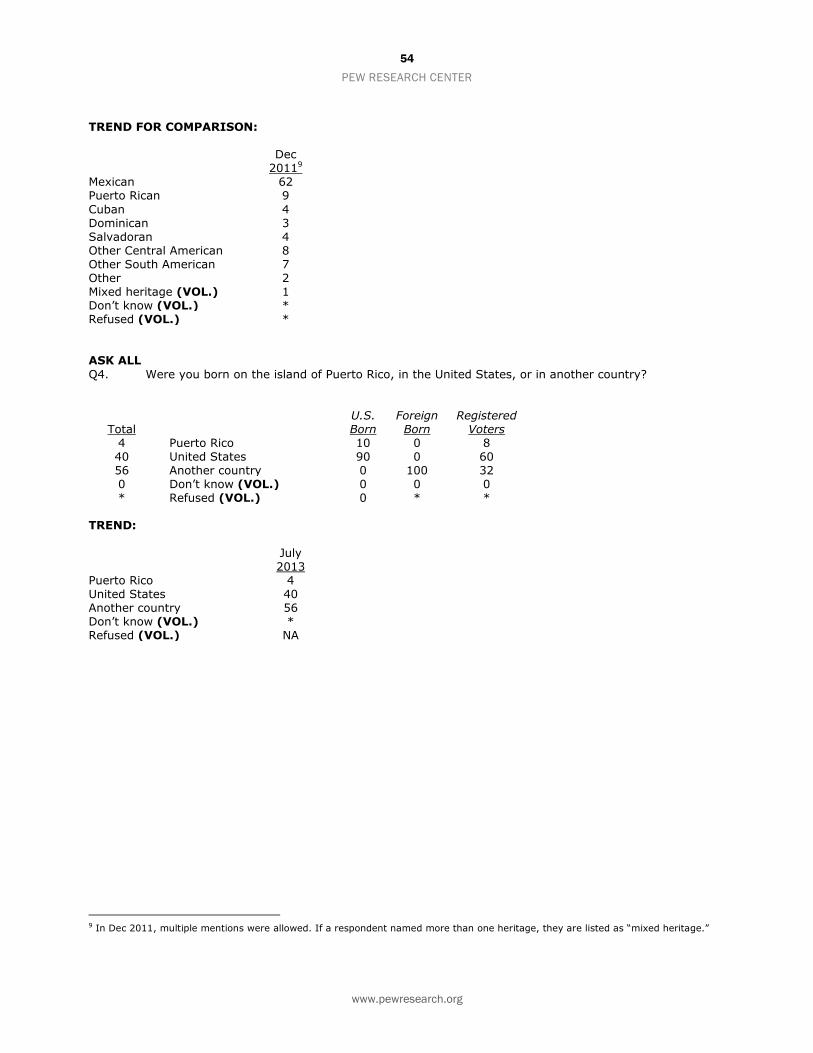
TREND FOR COMPARISON:
Dec
20119 Mexican 62 Puerto Rican 9
Cuban 4 Dominican 3 Salvadoran 4 Other Central American 8 Other South American 7 Other 2 Mixed heritage (VOL.) 1 Don’t know (VOL.) * Refused (VOL.) * ASK ALL
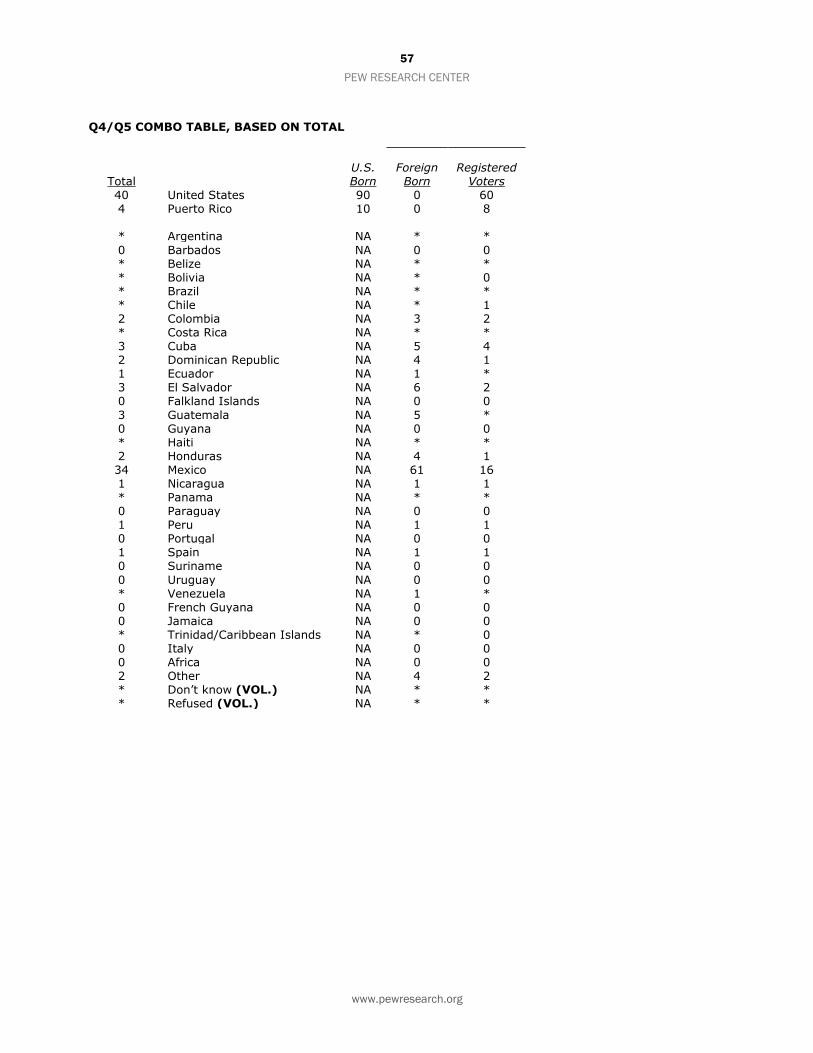
Q4. Were you born on the island of Puerto Rico, in the United States, or in another country?
Total U.S. Born
Foreign Born
Registered Voters
4 Puerto Rico 10 0 8 40 United States 90 0 60 56 Another country 0 100 32 0 Don’t know (VOL.) 0 0 0 * Refused (VOL.) 0 * *
TREND:
July 2013
Puerto Rico 4 United States 40 Another country 56 Don’t know (VOL.) * Refused (VOL.) NA
9 In Dec 2011, multiple mentions were allowed. If a respondent named more than one heritage, they are listed as “mixed heritage.”
55
PEW RESEARCH CENTER
www.pewresearch.org
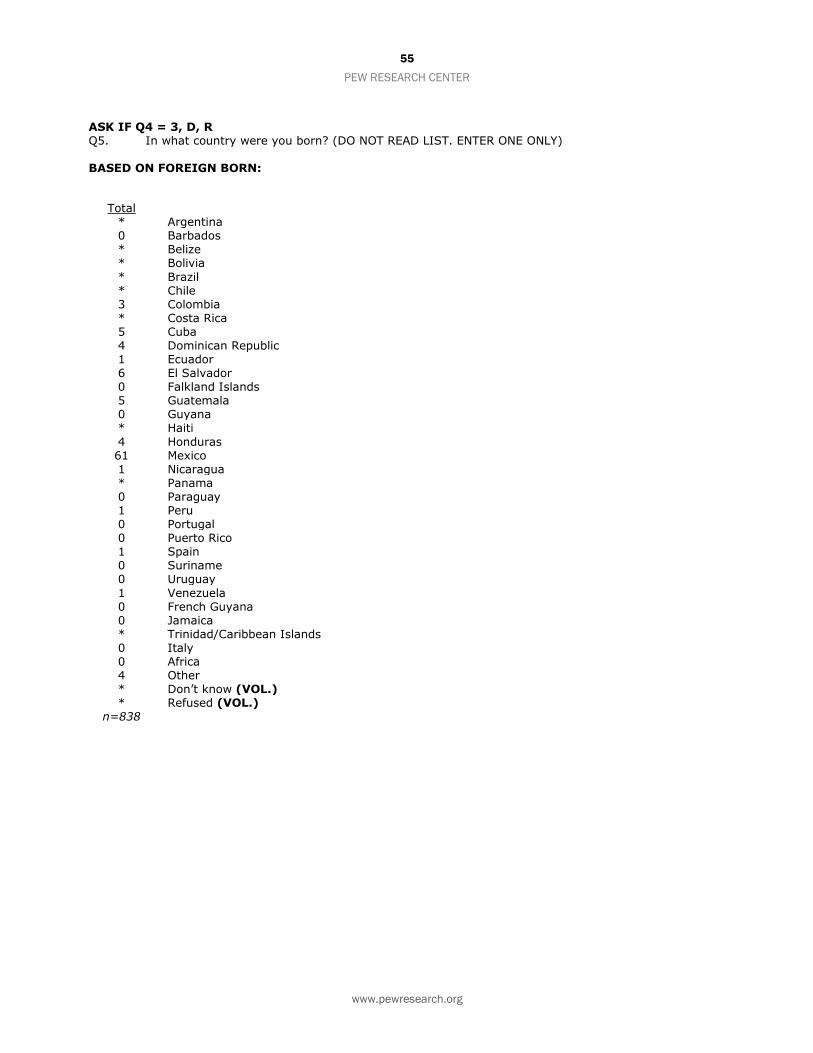
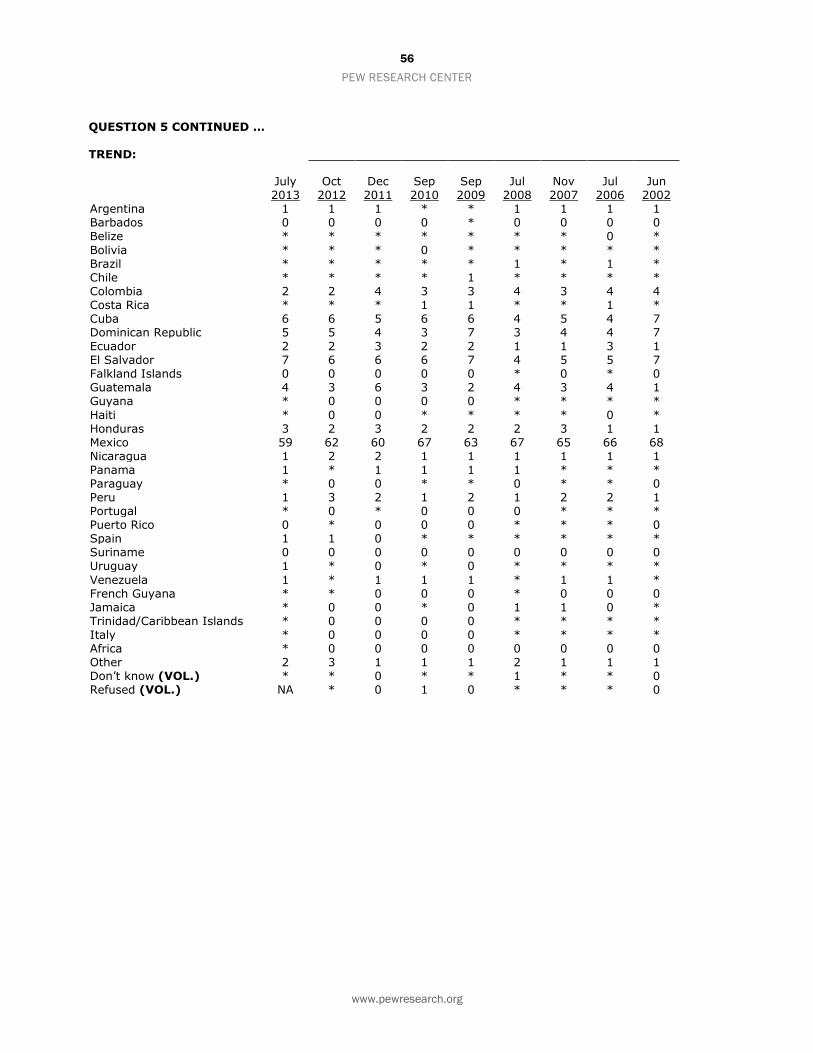
ASK IF Q4 = 3, D, R Q5. In what country were you born? (DO NOT READ LIST. ENTER ONE ONLY) BASED ON FOREIGN BORN:
Total * Argentina 0 Barbados * Belize * Bolivia
* Brazil * Chile 3 Colombia * Costa Rica 5 Cuba 4 Dominican Republic 1 Ecuador 6 El Salvador 0 Falkland Islands 5 Guatemala 0 Guyana * Haiti
4 Honduras 61 Mexico 1 Nicaragua * Panama 0 Paraguay 1 Peru 0 Portugal 0 Puerto Rico 1 Spain 0 Suriname 0 Uruguay
1 Venezuela 0 French Guyana 0 Jamaica * Trinidad/Caribbean Islands 0 Italy 0 Africa 4 Other * Don’t know (VOL.) * Refused (VOL.)
40 United States 90 0 60 4 Puerto Rico 10 0 8 * Argentina NA * *
0 Barbados NA 0 0 * Belize NA * * * Bolivia NA * 0 * Brazil NA * * * Chile NA * 1 2 Colombia NA 3 2 * Costa Rica NA * * 3 Cuba NA 5 4 2 Dominican Republic NA 4 1 1 Ecuador NA 1 * 3 El Salvador NA 6 2 0 Falkland Islands NA 0 0
3 Guatemala NA 5 * 0 Guyana NA 0 0 * Haiti NA * * 2 Honduras NA 4 1 34 Mexico NA 61 16 1 Nicaragua NA 1 1 * Panama NA * * 0 Paraguay NA 0 0 1 Peru NA 1 1 0 Portugal NA 0 0 1 Spain NA 1 1 0 Suriname NA 0 0
0 Uruguay NA 0 0 * Venezuela NA 1 * 0 French Guyana NA 0 0 0 Jamaica NA 0 0 * Trinidad/Caribbean Islands NA * 0 0 Italy NA 0 0 0 Africa NA 0 0 2 Other NA 4 2 * Don’t know (VOL.) NA * * * Refused (VOL.) NA * *
58
PEW RESEARCH CENTER
www.pewresearch.org
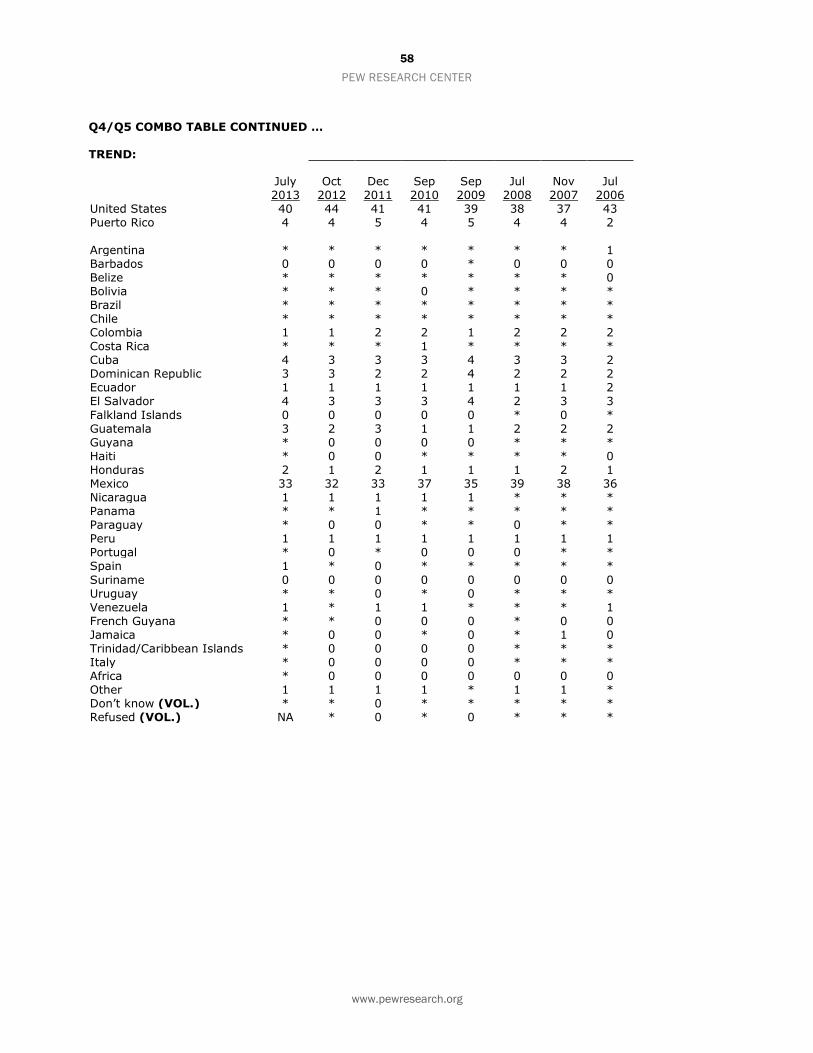
Q4/Q5 COMBO TABLE CONTINUED … TREND:
July 2013
Oct 2012
Dec 2011
Sep 2010
Sep 2009
Jul 2008
Nov 2007
Jul 2006
United States 40 44 41 41 39 38 37 43 Puerto Rico 4 4 5 4 5 4 4 2
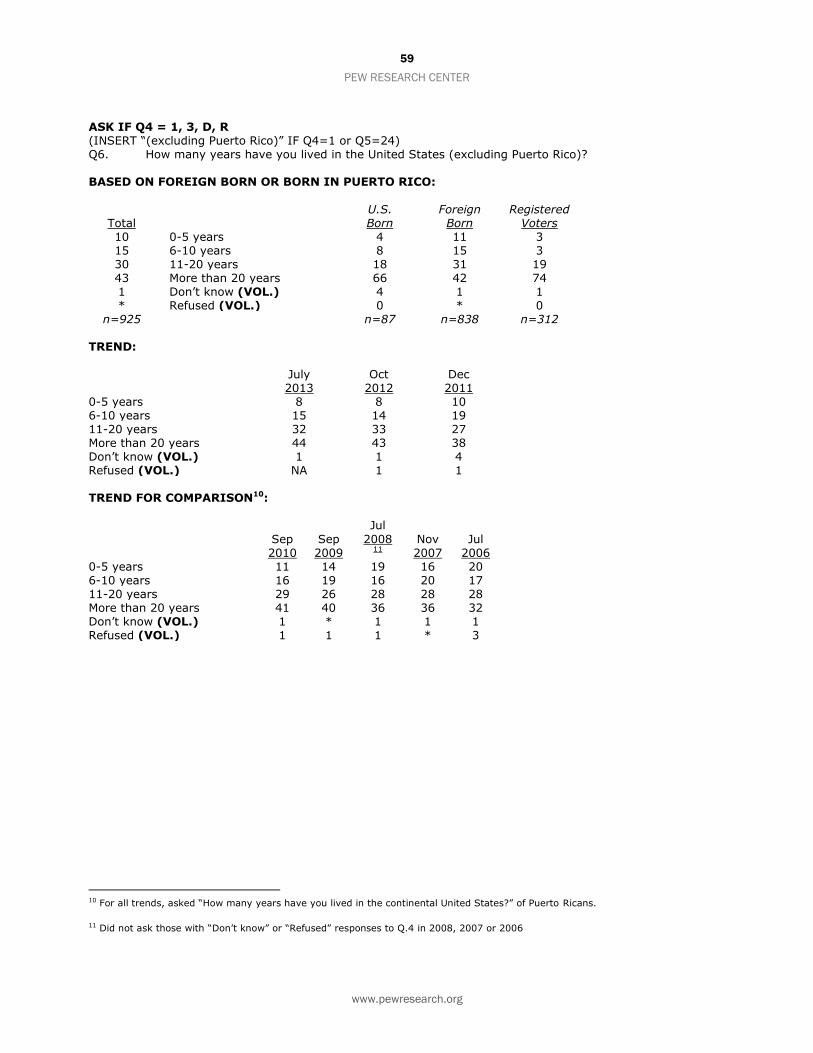
ASK IF Q4 = 1, 3, D, R (INSERT “(excluding Puerto Rico)” IF Q4=1 or Q5=24) Q6. How many years have you lived in the United States (excluding Puerto Rico)? BASED ON FOREIGN BORN OR BORN IN PUERTO RICO:
Total U.S. Born
Foreign Born
Registered Voters
10 0-5 years 4 11 3 15 6-10 years 8 15 3 30 11-20 years 18 31 19 43 More than 20 years 66 42 74 1 Don’t know (VOL.) 4 1 1 * Refused (VOL.) 0 * 0
n=925 n=87 n=838 n=312 TREND:
July 2013
Oct 2012
Dec 2011
0-5 years 8 8 10 6-10 years 15 14 19 11-20 years 32 33 27 More than 20 years 44 43 38 Don’t know (VOL.) 1 1 4 Refused (VOL.) NA 1 1 TREND FOR COMPARISON10:
Sep 2010
Sep 2009
Jul
200811
Nov 2007
Jul 2006
0-5 years 11 14 19 16 20 6-10 years 16 19 16 20 17 11-20 years 29 26 28 28 28 More than 20 years 41 40 36 36 32 Don’t know (VOL.) 1 * 1 1 1 Refused (VOL.) 1 1 1 * 3
10 For all trends, asked “How many years have you lived in the continental United States?” of Puerto Ricans. 11 Did not ask those with “Don’t know” or “Refused” responses to Q.4 in 2008, 2007 or 2006
60
PEW RESEARCH CENTER
www.pewresearch.org
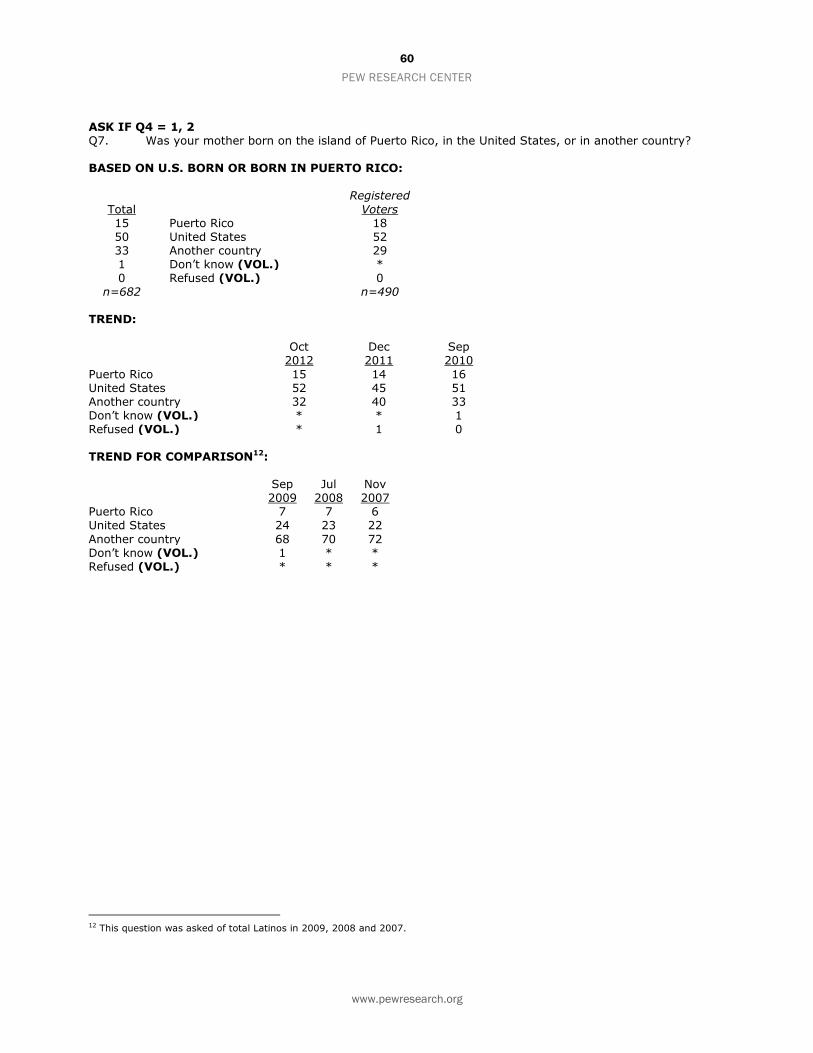
ASK IF Q4 = 1, 2 Q7. Was your mother born on the island of Puerto Rico, in the United States, or in another country? BASED ON U.S. BORN OR BORN IN PUERTO RICO:
Total
Registered
Voters 15 Puerto Rico 18 50 United States 52 33 Another country 29 1 Don’t know (VOL.) * 0 Refused (VOL.) 0
n=682 n=490 TREND:
Oct
2012 Dec 2011
Sep 2010
Puerto Rico 15 14 16 United States 52 45 51 Another country 32 40 33 Don’t know (VOL.) * * 1 Refused (VOL.) * 1 0 TREND FOR COMPARISON12:
Sep 2009
Jul 2008
Nov 2007
Puerto Rico 7 7 6 United States 24 23 22
Another country 68 70 72 Don’t know (VOL.) 1 * * Refused (VOL.) * * *
12 This question was asked of total Latinos in 2009, 2008 and 2007.
61
PEW RESEARCH CENTER
www.pewresearch.org
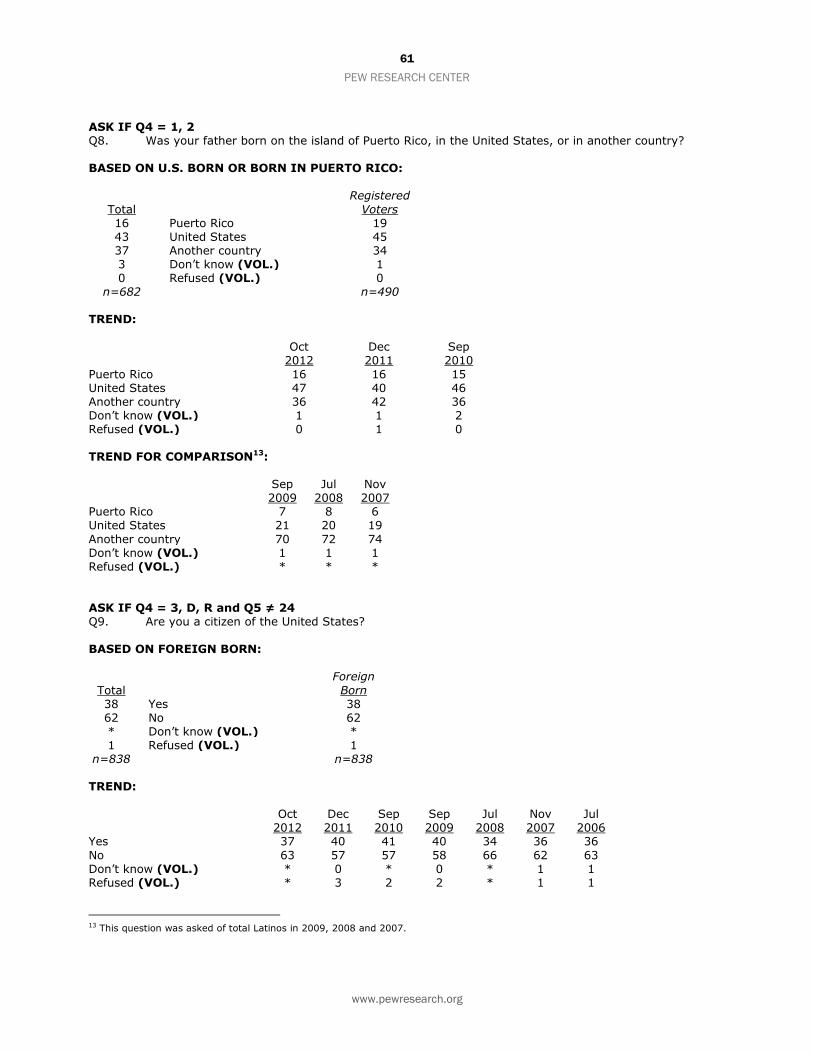
ASK IF Q4 = 1, 2 Q8. Was your father born on the island of Puerto Rico, in the United States, or in another country? BASED ON U.S. BORN OR BORN IN PUERTO RICO:
Total
Registered
Voters 16 Puerto Rico 19 43 United States 45 37 Another country 34 3 Don’t know (VOL.) 1 0 Refused (VOL.) 0
n=682 n=490 TREND:
Oct
2012 Dec 2011
Sep 2010
Puerto Rico 16 16 15 United States 47 40 46 Another country 36 42 36 Don’t know (VOL.) 1 1 2 Refused (VOL.) 0 1 0 TREND FOR COMPARISON13:
Sep 2009
Jul 2008
Nov 2007
Puerto Rico 7 8 6 United States 21 20 19
Another country 70 72 74 Don’t know (VOL.) 1 1 1 Refused (VOL.) * * * ASK IF Q4 = 3, D, R and Q5 ≠ 24 Q9. Are you a citizen of the United States? BASED ON FOREIGN BORN:
Total
Foreign
Born 38 Yes 38 62 No 62 * Don’t know (VOL.) * 1 Refused (VOL.) 1
14 The question was rotated with a question regarding approval ratings of Obama in 2013, but was not rotated in 2012 and earlier.
15 “Don’t know” and “Refused” were a combined category in the Nov 2013, July 2013 and Mar 2006 polls.
63
PEW RESEARCH CENTER
www.pewresearch.org
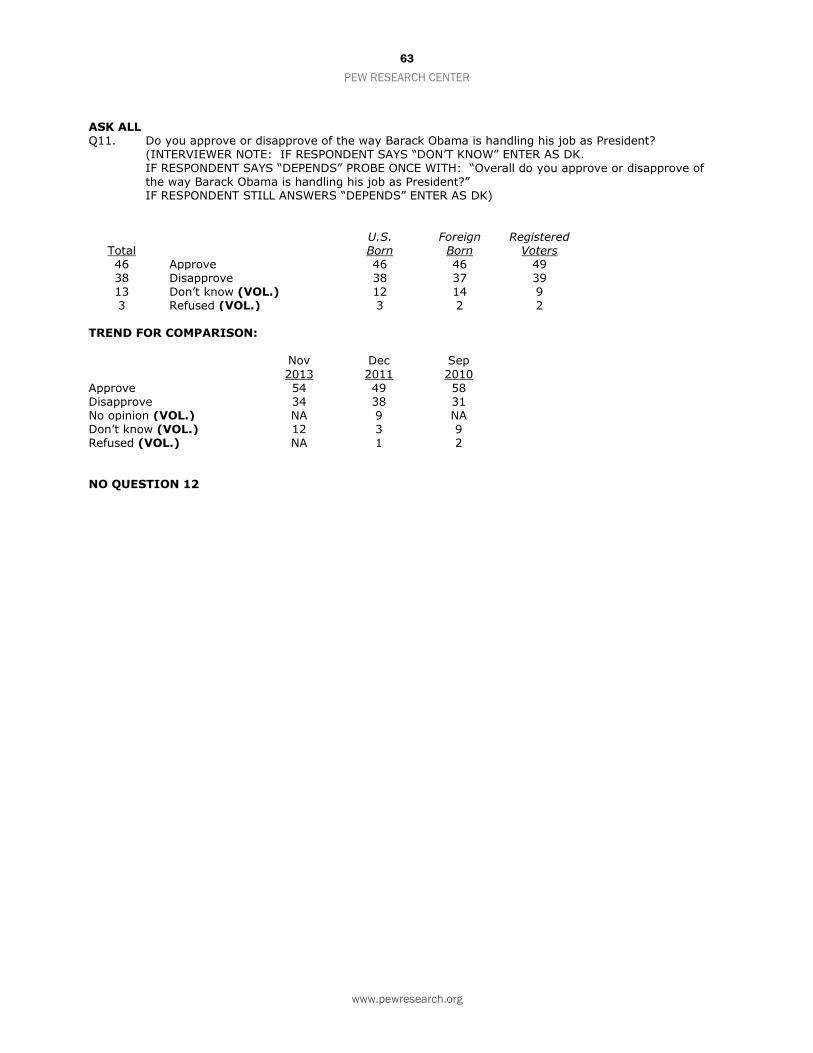
ASK ALL Q11. Do you approve or disapprove of the way Barack Obama is handling his job as President? (INTERVIEWER NOTE: IF RESPONDENT SAYS “DON’T KNOW” ENTER AS DK. IF RESPONDENT SAYS “DEPENDS” PROBE ONCE WITH: “Overall do you approve or disapprove of
the way Barack Obama is handling his job as President?” IF RESPONDENT STILL ANSWERS “DEPENDS” ENTER AS DK)
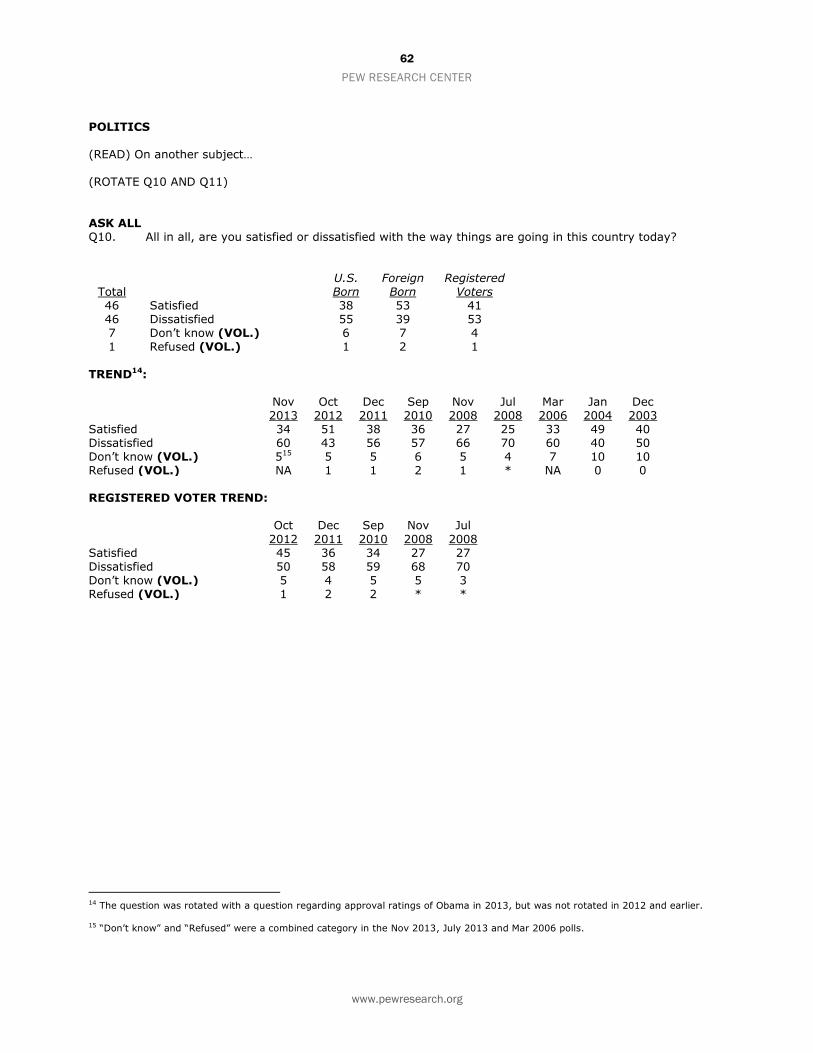
2010 Approve 54 49 58 Disapprove 34 38 31 No opinion (VOL.) NA 9 NA Don’t know (VOL.) 12 3 9 Refused (VOL.) NA 1 2 NO QUESTION 12
64
PEW RESEARCH CENTER
www.pewresearch.org
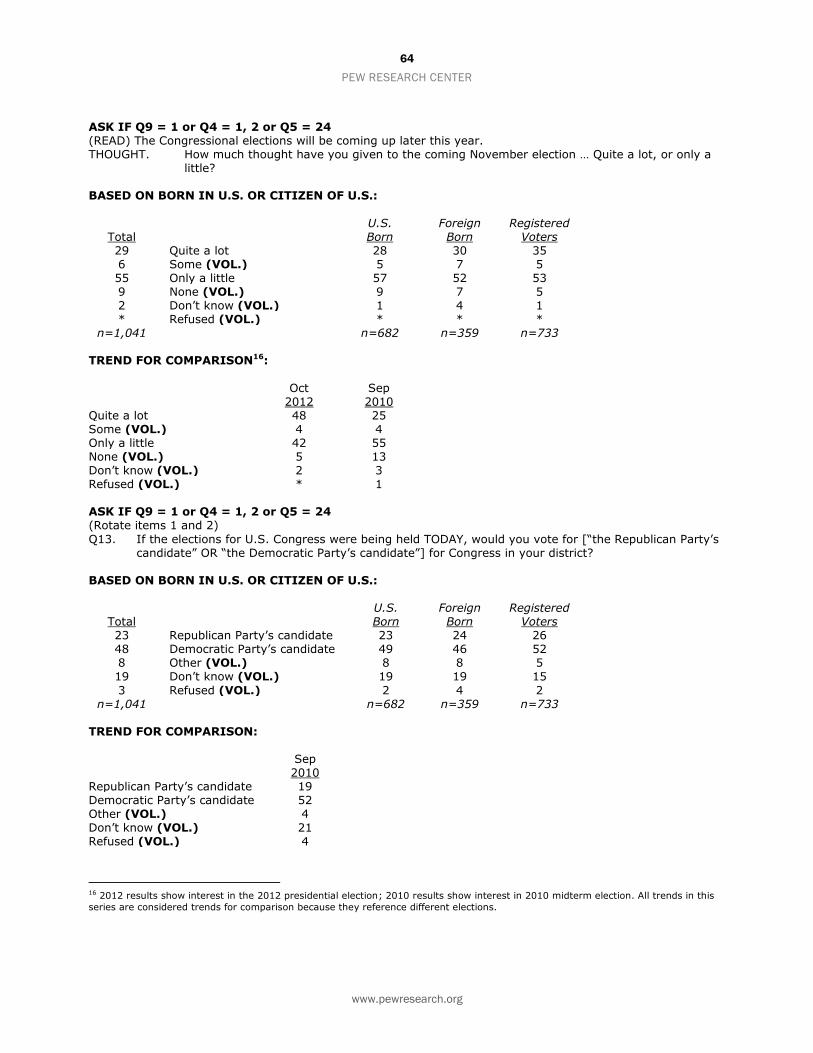
ASK IF Q9 = 1 or Q4 = 1, 2 or Q5 = 24 (READ) The Congressional elections will be coming up later this year. THOUGHT. How much thought have you given to the coming November election … Quite a lot, or only a
little? BASED ON BORN IN U.S. OR CITIZEN OF U.S.:
Total U.S. Born
Foreign Born
Registered Voters
29 Quite a lot 28 30 35 6 Some (VOL.) 5 7 5 55 Only a little 57 52 53 9 None (VOL.) 9 7 5 2 Don’t know (VOL.) 1 4 1 * Refused (VOL.) * * *
n=1,041 n=682 n=359 n=733 TREND FOR COMPARISON16:
Oct
2012 Sep 2010
Quite a lot 48 25 Some (VOL.) 4 4 Only a little 42 55 None (VOL.) 5 13 Don’t know (VOL.) 2 3 Refused (VOL.) * 1 ASK IF Q9 = 1 or Q4 = 1, 2 or Q5 = 24 (Rotate items 1 and 2)
Q13. If the elections for U.S. Congress were being held TODAY, would you vote for [“the Republican Party’s candidate” OR “the Democratic Party’s candidate”] for Congress in your district?
16 2012 results show interest in the 2012 presidential election; 2010 results show interest in 2010 midterm election. All trends in this
series are considered trends for comparison because they reference different elections.
65
PEW RESEARCH CENTER
www.pewresearch.org
ASK IF Q13 = 3, D, R (Rotate response options in same order as Q13) Q14. As of TODAY, do you LEAN more to the [READ IN SAME ORDER AS Q13; IF NECESSARY: “for U.S.
Congress in your district”] BASED ON OTHER/DON’T KNOW/REFUSED RESPONSES TO Q13:
Lean Republican Party’s candidate 13 Lean Democratic Party’s candidate 30 Undecided17 (VOL.) 35 Don’t know (VOL.) 16 Refused (VOL.) 7 Q13/Q14 COMBO TABLE BASED ON BORN IN U.S. OR CITIZEN OF U.S.:
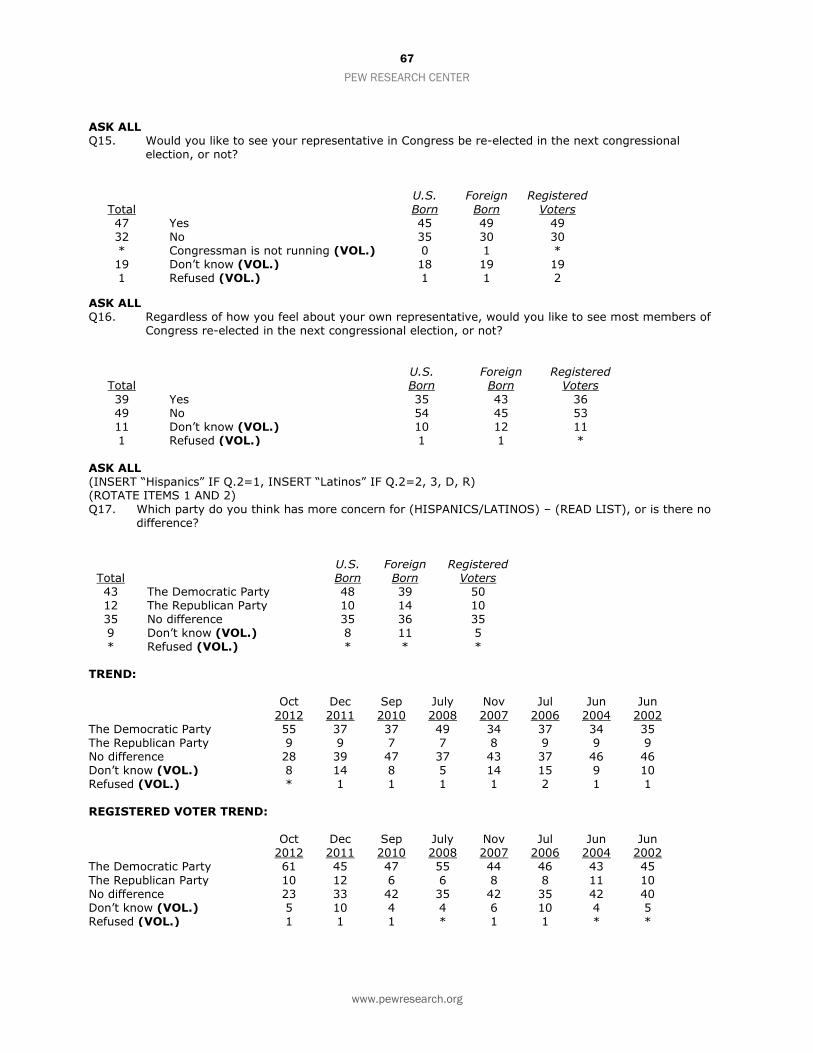
ASK ALL (INSERT “Hispanics” IF Q.2=1, INSERT “Latinos” IF Q.2=2, 3, D, R) (ROTATE ITEMS 1 AND 2) Q17. Which party do you think has more concern for (HISPANICS/LATINOS) – (READ LIST), or is there no
difference?
Total U.S. Born
Foreign Born
Registered Voters
43 The Democratic Party 48 39 50 12 The Republican Party 10 14 10 35 No difference 35 36 35 9 Don’t know (VOL.) 8 11 5 * Refused (VOL.) * * *
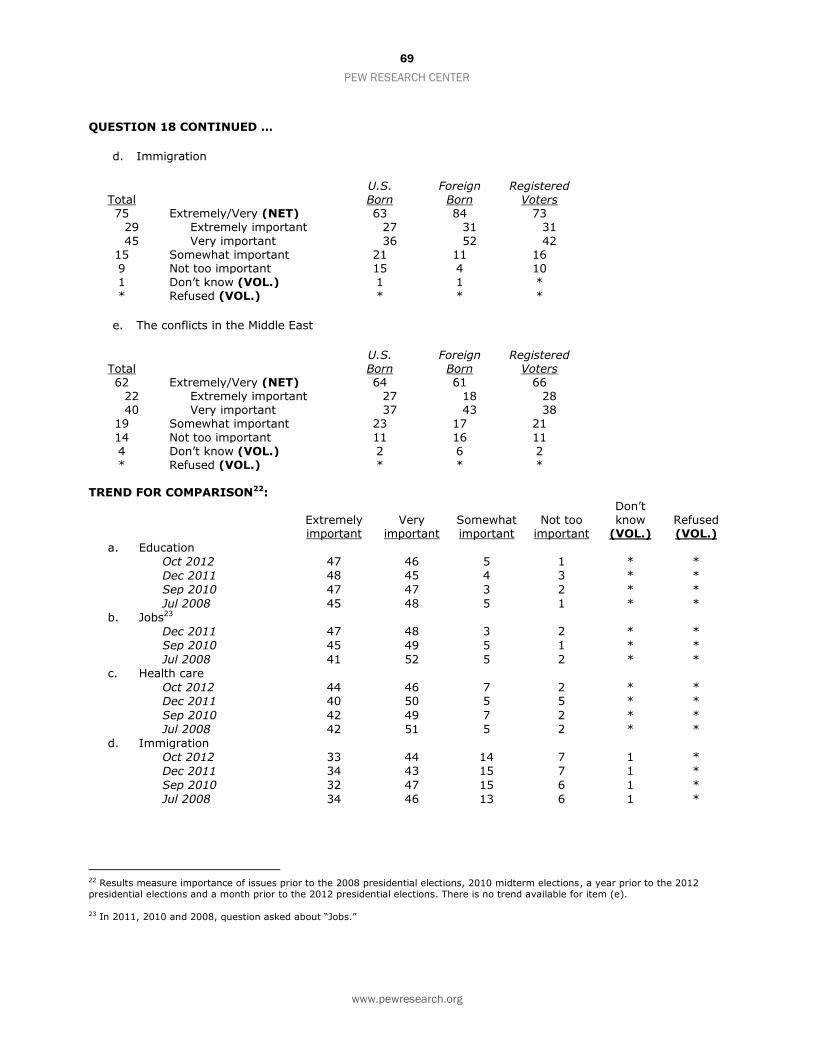
45 Very important 36 52 42 15 Somewhat important 21 11 16 9 Not too important 15 4 10 1 Don’t know (VOL.) 1 1 * * Refused (VOL.) * * *
e. The conflicts in the Middle East
Total U.S. Born
Foreign Born
Registered Voters
62 Extremely/Very (NET) 64 61 66 22 Extremely important 27 18 28 40 Very important 37 43 38
19 Somewhat important 23 17 21
14 Not too important 11 16 11 4 Don’t know (VOL.) 2 6 2 * Refused (VOL.) * * *
TREND FOR COMPARISON22:
Extremely important
Very important
Somewhat important
Not too important
Don’t know
(VOL.) Refused (VOL.)
a. Education
Oct 2012 47 46 5 1 * *
Dec 2011 48 45 4 3 * *
Sep 2010 47 47 3 2 * *
Jul 2008 45 48 5 1 * *
b. Jobs23
Dec 2011 47 48 3 2 * *
Sep 2010 45 49 5 1 * *
Jul 2008 41 52 5 2 * *
c. Health care
Oct 2012 44 46 7 2 * *
Dec 2011 40 50 5 5 * *
Sep 2010 42 49 7 2 * *
* Jul 2008 42 51 5 2 * *
d. Immigration
Oct 2012 33 44 14 7 1 *
Dec 2011 34 43 15 7 1 *
Sep 2010 32 47 15 6 1 *
Jul 2008 34 46 13 6 1 *
22 Results measure importance of issues prior to the 2008 presidential elections, 2010 midterm elections, a year prior to the 2012 presidential elections and a month prior to the 2012 presidential elections. There is no trend available for item (e).
23 In 2011, 2010 and 2008, question asked about “Jobs.”
70
PEW RESEARCH CENTER
www.pewresearch.org
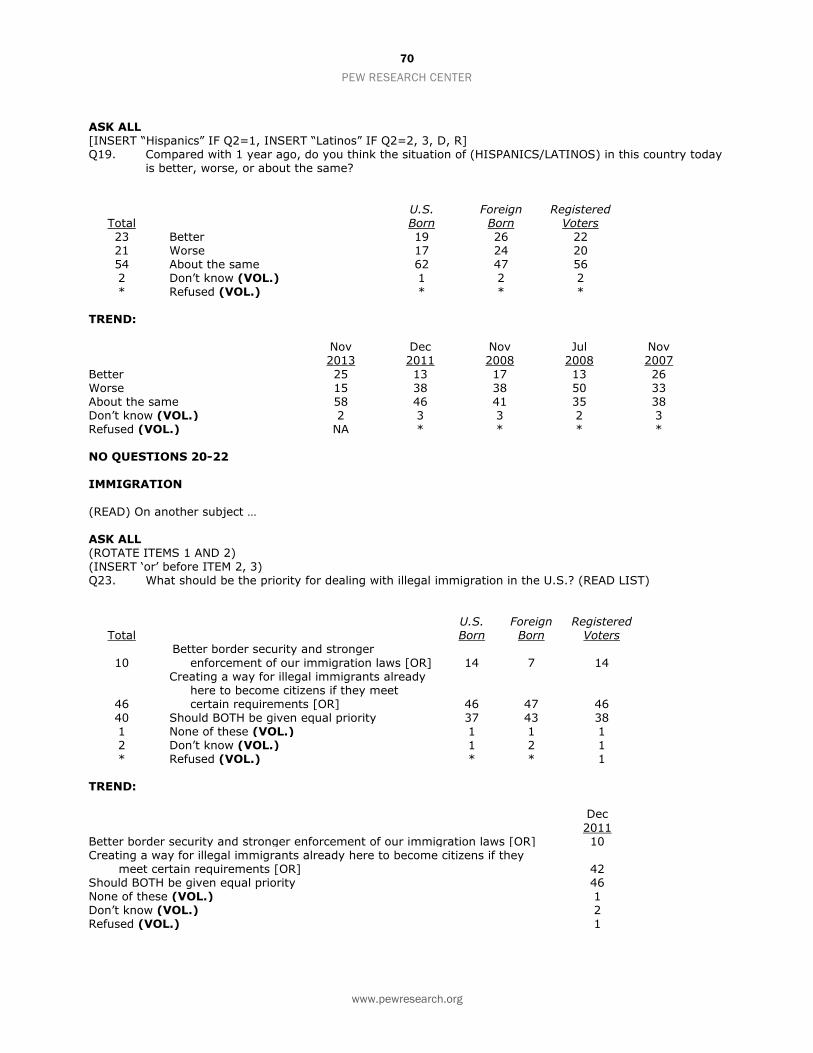
ASK ALL [INSERT “Hispanics” IF Q2=1, INSERT “Latinos” IF Q2=2, 3, D, R] Q19. Compared with 1 year ago, do you think the situation of (HISPANICS/LATINOS) in this country today
is better, worse, or about the same?
Total U.S. Born
Foreign Born
Registered Voters
23 Better 19 26 22 21 Worse 17 24 20 54 About the same 62 47 56 2 Don’t know (VOL.) 1 2 2 * Refused (VOL.) * * *
TREND:
Nov 2013
Dec 2011
Nov 2008
Jul 2008
Nov 2007
Better 25 13 17 13 26 Worse 15 38 38 50 33 About the same 58 46 41 35 38 Don’t know (VOL.) 2 3 3 2 3 Refused (VOL.) NA * * * * NO QUESTIONS 20-22 IMMIGRATION
(READ) On another subject … ASK ALL (ROTATE ITEMS 1 AND 2) (INSERT ‘or’ before ITEM 2, 3) Q23. What should be the priority for dealing with illegal immigration in the U.S.? (READ LIST)
Total U.S. Born
Foreign Born
Registered Voters
10
Better border security and stronger
enforcement of our immigration laws [OR] 14 7 14
46
Creating a way for illegal immigrants already here to become citizens if they meet certain requirements [OR] 46 47 46
40 Should BOTH be given equal priority 37 43 38 1 None of these (VOL.) 1 1 1 2 Don’t know (VOL.) 1 2 1 * Refused (VOL.) * * 1
TREND:
Dec
2011 Better border security and stronger enforcement of our immigration laws [OR] 10 Creating a way for illegal immigrants already here to become citizens if they
meet certain requirements [OR] 42 Should BOTH be given equal priority 46 None of these (VOL.) 1 Don’t know (VOL.) 2 Refused (VOL.) 1
71
PEW RESEARCH CENTER
www.pewresearch.org
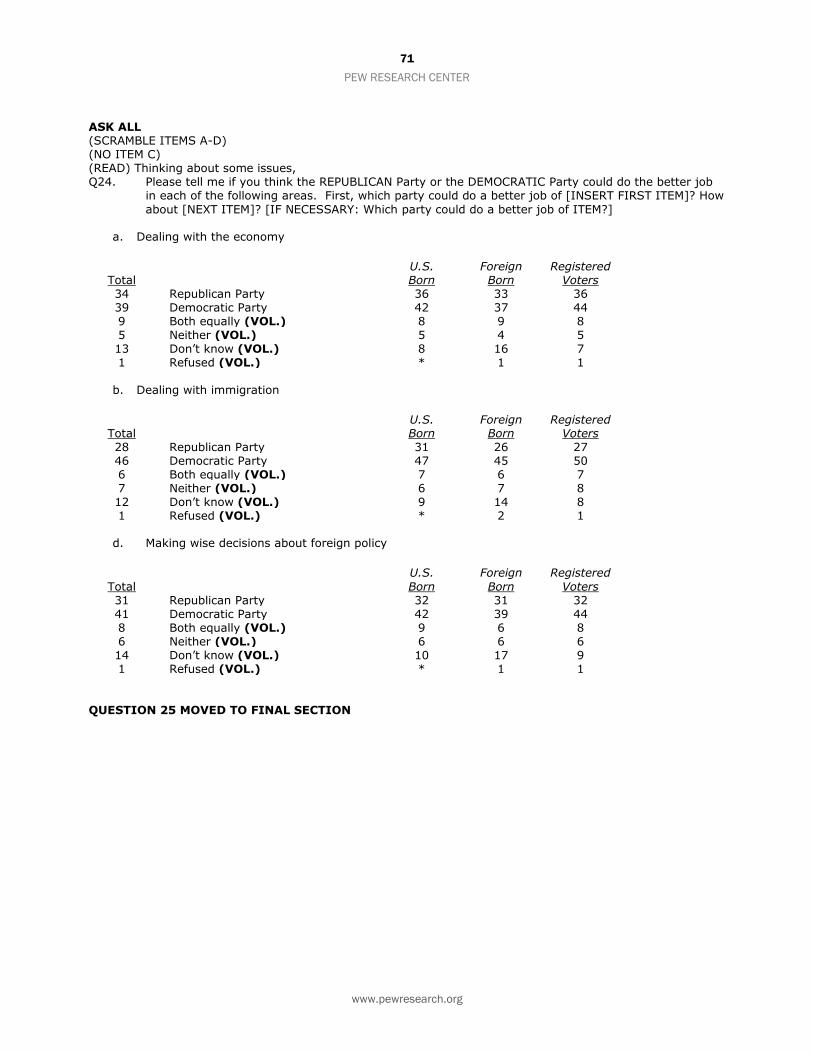
ASK ALL (SCRAMBLE ITEMS A-D) (NO ITEM C) (READ) Thinking about some issues, Q24. Please tell me if you think the REPUBLICAN Party or the DEMOCRATIC Party could do the better job
in each of the following areas. First, which party could do a better job of [INSERT FIRST ITEM]? How
about [NEXT ITEM]? [IF NECESSARY: Which party could do a better job of ITEM?]
INTRO FOR Q26, Q27 (READ INTRO) As you may know, the president and Congress have not passed significant new immigration legislation this year. ASK ALL
Q26. How important is it to you that the president and Congress pass significant new immigration legislation soon – extremely important, very important, somewhat important, not too important, or not important at all?
(INTERVIEWER NOTE: IF R SAYS “IMPORTANT” PROBE FOR RESPONSE CATEGORY)
Total U.S. Born
Foreign Born
Registered Voters
74 Extremely/Very (NET) 61 84 66 32 Extremely important 25 38 30 42 Very important 35 47 36
17 Somewhat important 24 11 22
5 Not too important 7 3 6 4 Not important at all 6 2 6 1 Don’t know (VOL.) 1 * * 1 Refused (VOL.) 1 * 1
TREND FOR COMPARISON:
Nov
201324 Extremely/Very (NET) 69
Extremely important 38 Very important 31
Somewhat important 19 Not too important 6 Not important at all 4 Don’t know (VOL.) 2 Refused (VOL.) NA ASK ALL (INSERT “or” before ITEM 2, 3; SCRAMBLE 1-3) Q27. Just your best guess, who do you think is most responsible that the president and Congress have
NOT passed significant new immigration legislation so far? (READ ITEMS)
Total U.S. Born
Foreign Born
Registered Voters
40 The Republicans in Congress [OR] 43 39 45 15 The Democrats in Congress [OR] 14 16 14 24 President Obama 24 24 20 1 The Democrats in Congress AND President Obama equally (VOL.) 1 1 * 4 Both Republicans in Congress AND Democrats in Congress (VOL.) 5 4 5 1 Both Republicans in Congress AND President Obama (VOL.) * 1 * 4 All of these (VOL.) 4 5 5 2 None of these (VOL.) 2 1 1
8 Don’t know (VOL.) 6 10 8 * Refused (VOL.) 1 * 1
24 In November 2013, question asked for the importance of passing significant new immigration legislation “this year.”
73
PEW RESEARCH CENTER
www.pewresearch.org
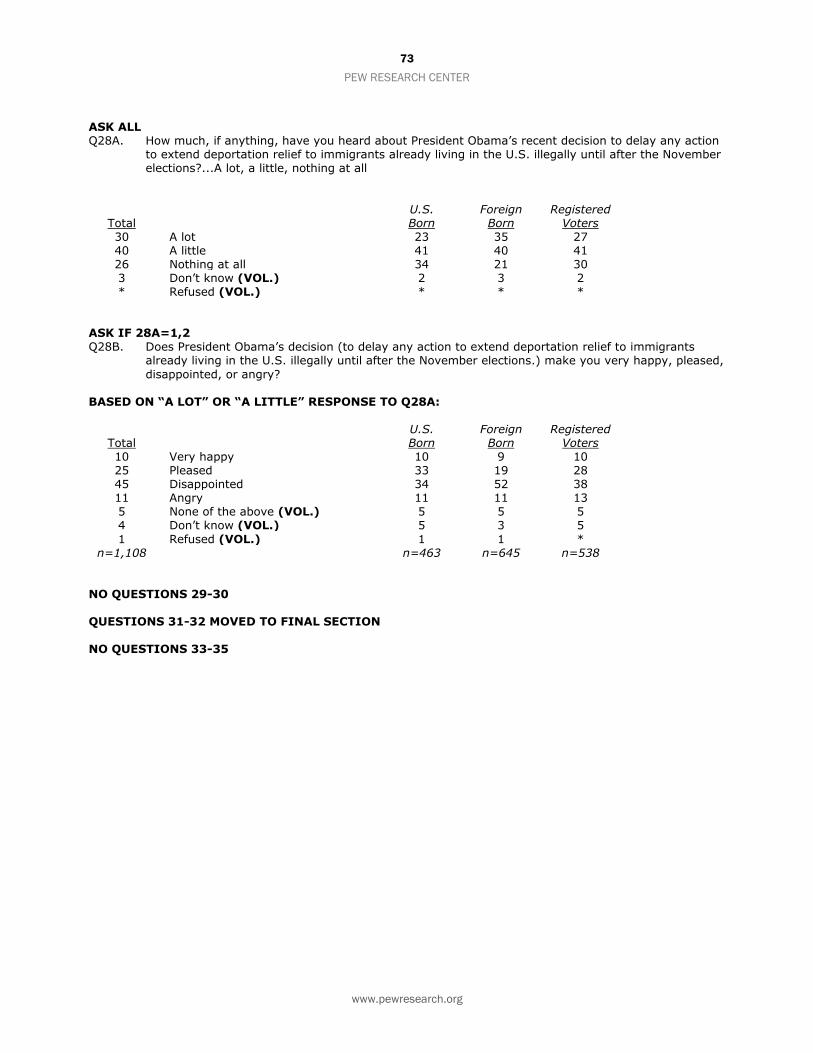
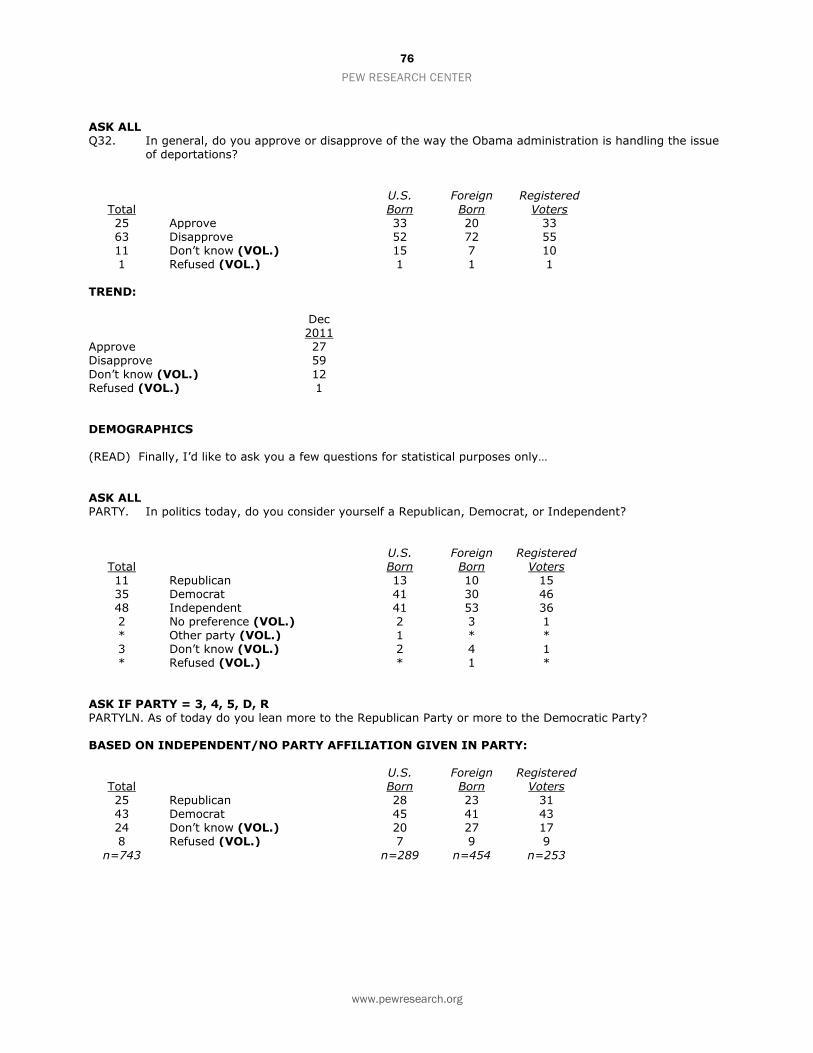
ASK ALL Q28A. How much, if anything, have you heard about President Obama’s recent decision to delay any action
to extend deportation relief to immigrants already living in the U.S. illegally until after the November elections?...A lot, a little, nothing at all
Total U.S. Born
Foreign Born
Registered Voters
30 A lot 23 35 27 40 A little 41 40 41 26 Nothing at all 34 21 30 3 Don’t know (VOL.) 2 3 2 * Refused (VOL.) * * *
ASK IF 28A=1,2 Q28B. Does President Obama’s decision (to delay any action to extend deportation relief to immigrants
already living in the U.S. illegally until after the November elections.) make you very happy, pleased,
disappointed, or angry? BASED ON “A LOT” OR “A LITTLE” RESPONSE TO Q28A:
Being able to live and work in the U.S. legally without the threat of being deported [OR] 55 Having a pathway to citizenship for those who meet certain requirements 35 Neither (VOL.) 1 Both equally (VOL.) 6 Don’t know (VOL.) 2 Refused (VOL.) NA
NO QUESTION 37 QUESTIONS 38-42 HELD FOR FUTURE RELEASE NO QUESTION 43 QUESTIONS 44-25 HELD FOR FUTURE RELEASE NO QUESTION 46
QUESTIONS 47-38 HELD FOR FUTURE RELEASE NO QUESTION 49 QUESTIONS 50-50A HELD FOR FUTURE RELEASE NO QUESTION 51 QUESTIONS 52-59 HELD FOR FUTURE RELEASE NO QUESTIONS 60-69
75
PEW RESEARCH CENTER
www.pewresearch.org
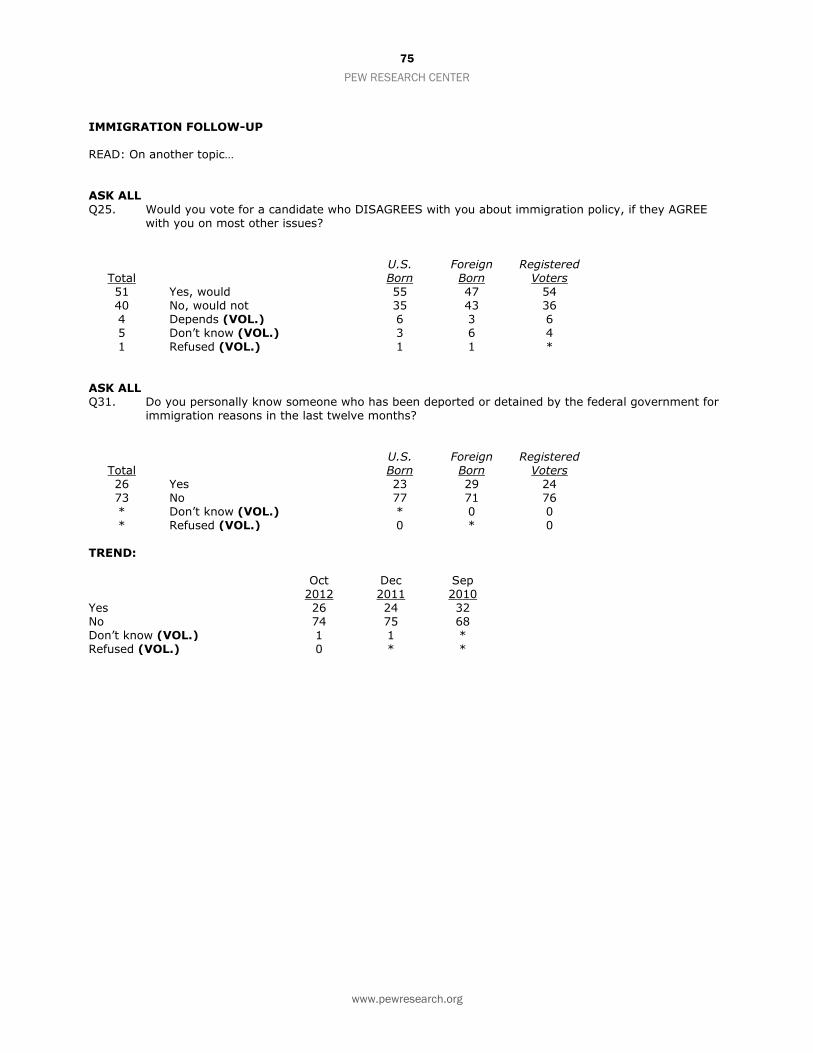
IMMIGRATION FOLLOW-UP READ: On another topic… ASK ALL
Q25. Would you vote for a candidate who DISAGREES with you about immigration policy, if they AGREE with you on most other issues?
Total U.S. Born
Foreign Born
Registered Voters
51 Yes, would 55 47 54 40 No, would not 35 43 36 4 Depends (VOL.) 6 3 6 5 Don’t know (VOL.) 3 6 4 1 Refused (VOL.) 1 1 *
ASK ALL Q31. Do you personally know someone who has been deported or detained by the federal government for
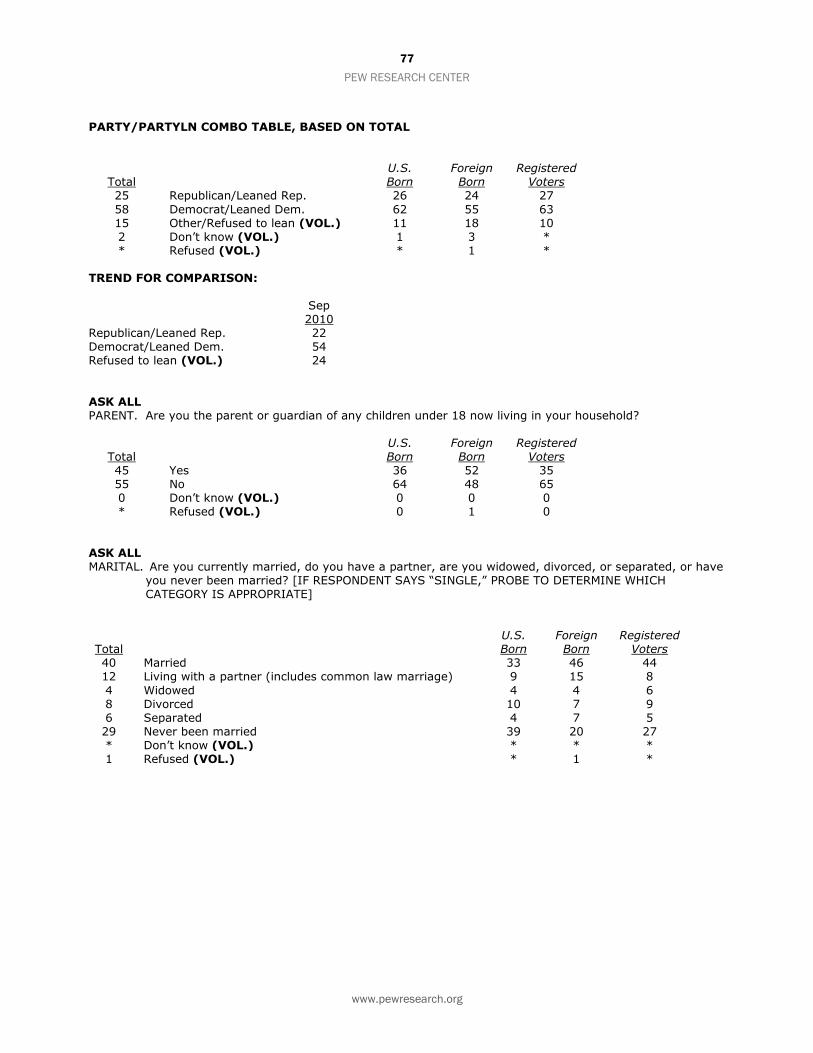
Don’t know (VOL.) 12 Refused (VOL.) 1 DEMOGRAPHICS (READ) Finally, I’d like to ask you a few questions for statistical purposes only… ASK ALL PARTY. In politics today, do you consider yourself a Republican, Democrat, or Independent?
ASK IF PARTY = 3, 4, 5, D, R PARTYLN. As of today do you lean more to the Republican Party or more to the Democratic Party? BASED ON INDEPENDENT/NO PARTY AFFILIATION GIVEN IN PARTY:
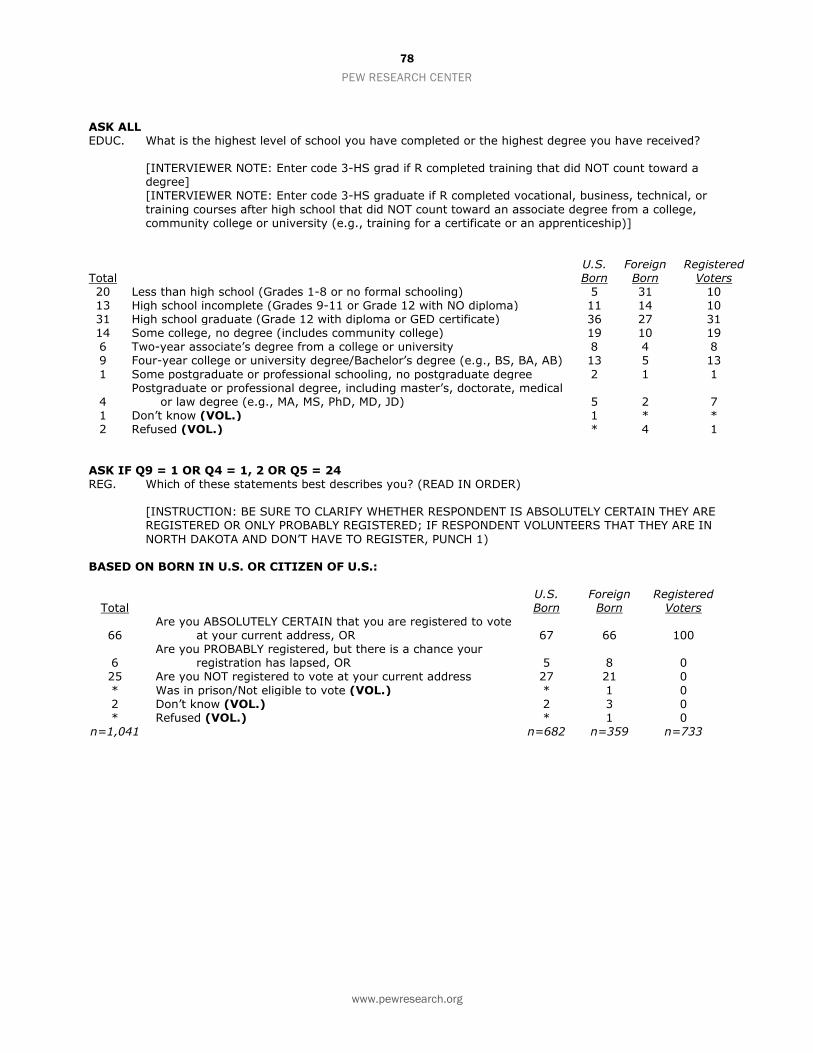
ASK ALL EDUC. What is the highest level of school you have completed or the highest degree you have received? [INTERVIEWER NOTE: Enter code 3-HS grad if R completed training that did NOT count toward a
degree] [INTERVIEWER NOTE: Enter code 3-HS graduate if R completed vocational, business, technical, or
training courses after high school that did NOT count toward an associate degree from a college, community college or university (e.g., training for a certificate or an apprenticeship)]
Total U.S. Born
Foreign Born
Registered Voters
20 Less than high school (Grades 1-8 or no formal schooling) 5 31 10 13 High school incomplete (Grades 9-11 or Grade 12 with NO diploma) 11 14 10 31 High school graduate (Grade 12 with diploma or GED certificate) 36 27 31 14 Some college, no degree (includes community college) 19 10 19 6 Two-year associate’s degree from a college or university 8 4 8 9 Four-year college or university degree/Bachelor’s degree (e.g., BS, BA, AB) 13 5 13
1 Some postgraduate or professional schooling, no postgraduate degree 2 1 1
4 Postgraduate or professional degree, including master’s, doctorate, medical
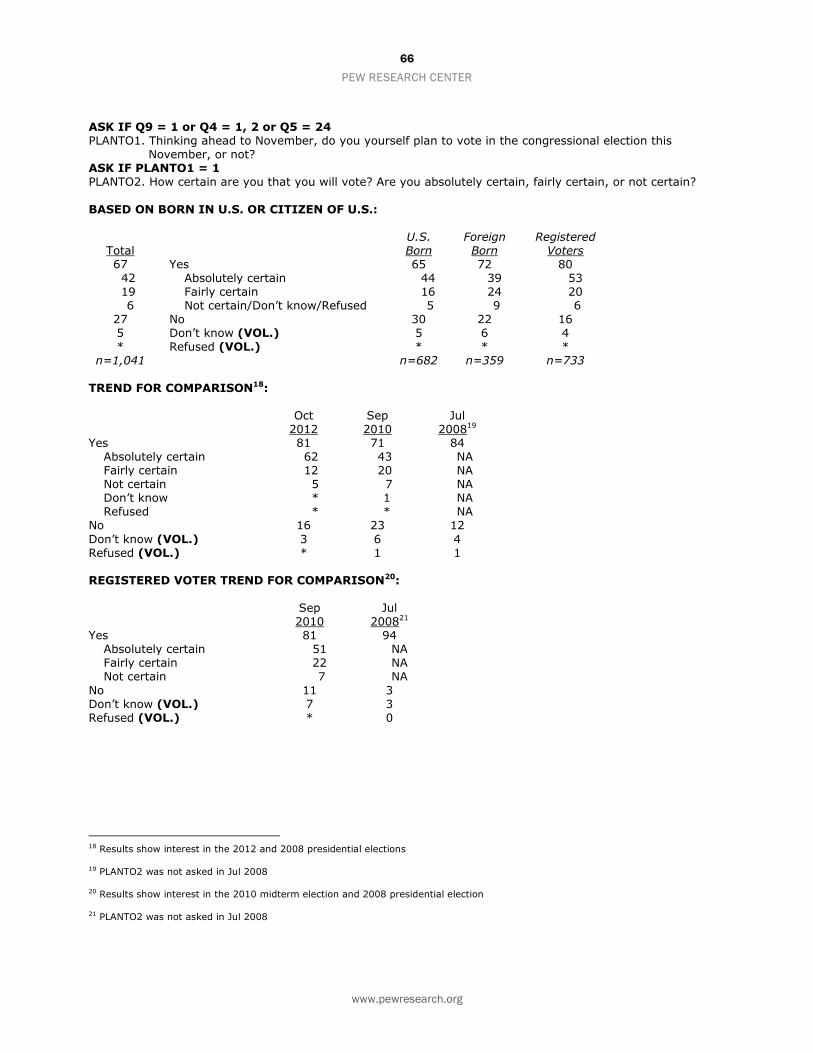
ASK IF Q9 = 1 OR Q4 = 1, 2 OR Q5 = 24 REG. Which of these statements best describes you? (READ IN ORDER) [INSTRUCTION: BE SURE TO CLARIFY WHETHER RESPONDENT IS ABSOLUTELY CERTAIN THEY ARE
REGISTERED OR ONLY PROBABLY REGISTERED; IF RESPONDENT VOLUNTEERS THAT THEY ARE IN
NORTH DAKOTA AND DON’T HAVE TO REGISTER, PUNCH 1) BASED ON BORN IN U.S. OR CITIZEN OF U.S.:
Total U.S. Born
Foreign Born
Registered Voters
66 Are you ABSOLUTELY CERTAIN that you are registered to vote
at your current address, OR 67 66 100
6 Are you PROBABLY registered, but there is a chance your
registration has lapsed, OR 5 8 0 25 Are you NOT registered to vote at your current address 27 21 0
* Was in prison/Not eligible to vote (VOL.) * 1 0 2 Don’t know (VOL.) 2 3 0 * Refused (VOL.) * 1 0
n=1,041 n=682 n=359 n=733
79
PEW RESEARCH CENTER
www.pewresearch.org
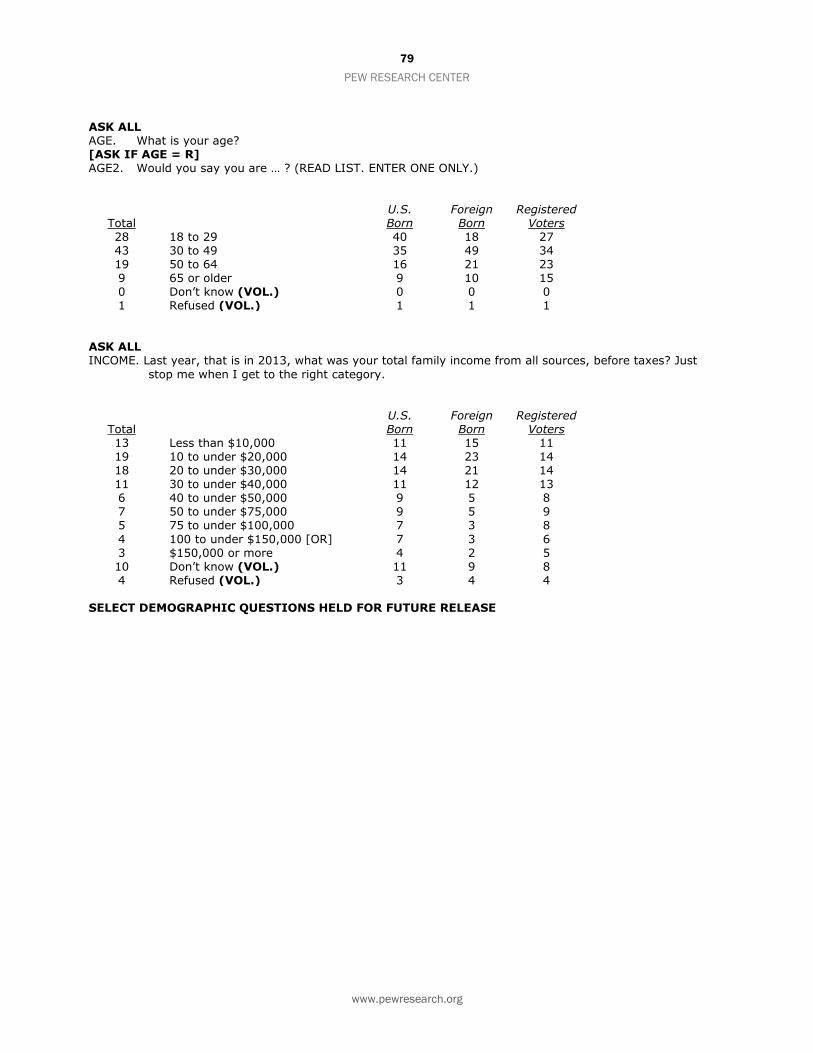
ASK ALL AGE. What is your age? [ASK IF AGE = R] AGE2. Would you say you are … ? (READ LIST. ENTER ONE ONLY.)
ASK ALL INCOME. Last year, that is in 2013, what was your total family income from all sources, before taxes? Just
stop me when I get to the right category.
Total U.S. Born
Foreign Born
Registered Voters
13 Less than $10,000 11 15 11 19 10 to under $20,000 14 23 14 18 20 to under $30,000 14 21 14 11 30 to under $40,000 11 12 13 6 40 to under $50,000 9 5 8 7 50 to under $75,000 9 5 9 5 75 to under $100,000 7 3 8
4 100 to under $150,000 [OR] 7 3 6 3 $150,000 or more 4 2 5 10 Don’t know (VOL.) 11 9 8 4 Refused (VOL.) 3 4 4
SELECT DEMOGRAPHIC QUESTIONS HELD FOR FUTURE RELEASE