40
B-1 APPENDIX B. SELECTION STUDY REPORT

B-1
APPENDIX B. SELECTION STUDY REPORT

B-2
TABLE OF CONTENTS Table of Contents .................................................................................................................... B-2 List of Tables .......................................................................................................................... B-3 List of figures ......................................................................................................................... B-4 1.0 Introduction ..................................................................................................................... B-5 2.0 SELECTED LABORATORY CONDITIONS FOR SIMULATING lONG-TERM AGING ............................................................................................................................ B-6
2.1 Temperature .................................................................................................................. B-6 2.2 Atmosphere ................................................................................................................... B-6 2.3 Duration ........................................................................................................................ B-6 2.4 Quantity ........................................................................................................................ B-7
3.0 EXPERIMENTAL APPROACH AND MATERIALS ...................................................... B-7 3.1 Approach ...................................................................................................................... B-7 3.2 Materials ....................................................................................................................... B-9
4.0 DEVELOPMENT OF LONG-TERM AGING TESTS ...................................................... B-9 4.1 Modified German Rotating Flask .................................................................................. B-9 4.2 Stirred Air Flow Test ................................................................................................... B-14
5.0 VISCOSITY EFFECTS EXPERIMENT ......................................................................... B-18 5.1 Design ......................................................................................................................... B-18 5.2 Statistical Analysis ...................................................................................................... B-19 5.3 Engineering Analysis ................................................................................................. B-29
6.0 SUMMARY AND CONCLUSIONS ............................................................................. B-31 7.0 RECOMMENDATIONS ............................................................................................... B-33
7.1 Phase II of Project 9-36 ............................................................................................... B-33 7.2 Additional Future Research ......................................................................................... B-36
8.0 VISCOSITY EFFECTS EXPERIMENT TEST DATA .................................................. B-37
B-3
LIST OF TABLES Table 1. Summary of Conditions for the Selection Study. ...................................................... B-7 Table 2. Summary of Conditions Investigated During the Selection Study. ............................ B-8 Table 3. AASHTO M320 Properties for the Binders Used in the Selection Study. .................. B-9 Table 4. Summary of Long-Term Rotating Flask Configurations Tested. ............................. B-11 Table 5. Summary of Long-Term Stirred Air Flow Test Configurations Tested. ................... B-14 Table 6. Testing Conditions for the Long-Term Stirred Air Flow Test. ................................. B-19 Table 7. Summary of Statistical Analysis of High Pavement Temperature DSR Data. .......... B-24 Table 8. Summary of Statistical Analysis of Intermediate Pavement
Temperature DSR Data. ................................................................................................ B-27 Table 9. Summary of Statistical Analysis of Intermediate Pavement
Temperature DSR Data. ................................................................................................ B-29 Table 10. Comparison of Long-Term Stirred Air Flow Test Bias
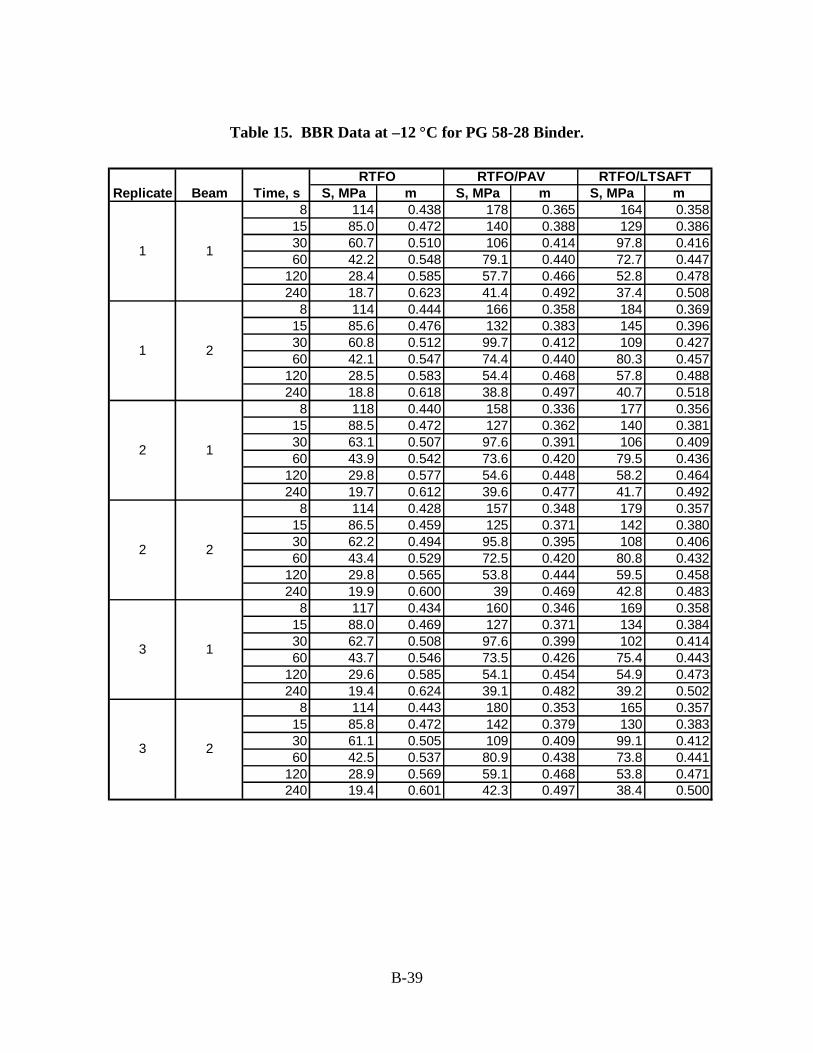
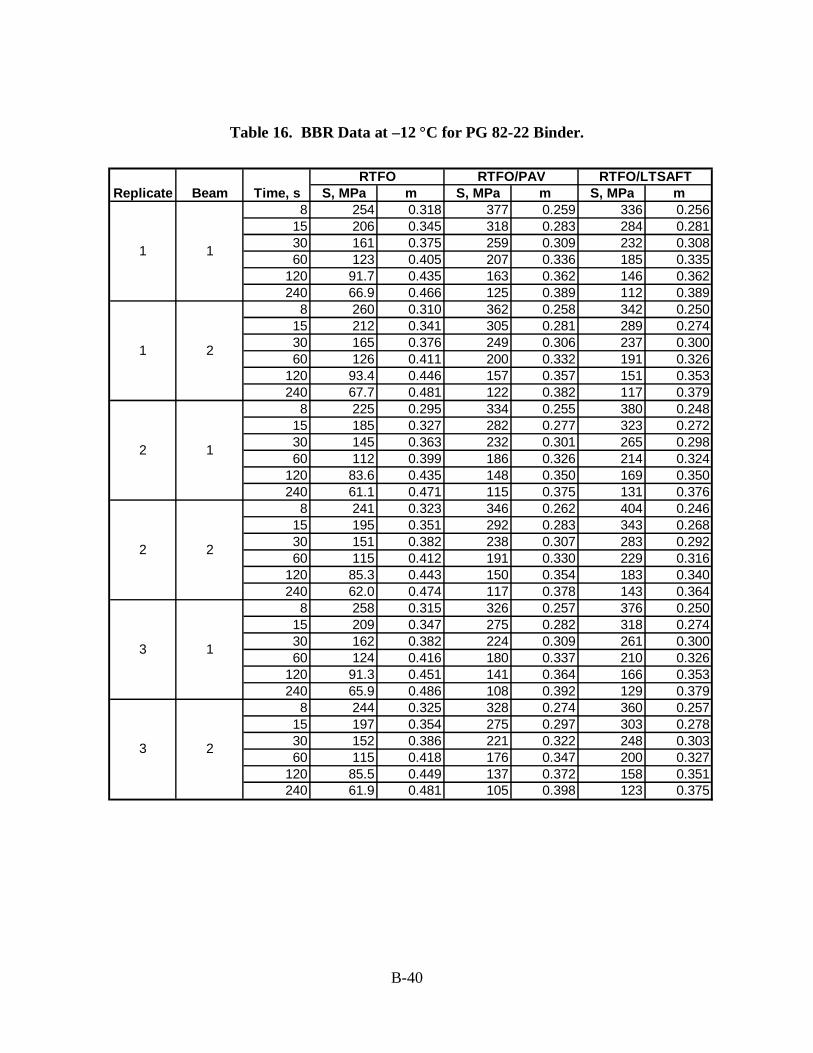
With DSR and BBR Precision. ...................................................................................... B-30 Table 11. Comparison of Stirred Air Flow Test and RTFOT. ............................................... B-33 Table 12. Comparison of Stirred Long-Term Stirred Air Flow Test and PAV. ...................... B-36 Table 13. DSR Frequency Sweep Data for the PG 58-28 Binder. ......................................... B-37 Table 14. DSR Frequency Sweep Data for the PG 82-22 Binder. ......................................... B-38 Table 15. BBR Data at –12 °C for PG 58-28 Binder. ............................................................ B-39 Table 16. BBR Data at –12 °C for PG 82-22 Binder. ............................................................ B-40
B-4
LIST OF FIGURES Figure 1. Relative Aging from Equation 1 for Various Long-Term Rotating Flask
Configurations............................................................................................................... B-11 Figure 2. Schematic of 2,000 ml Morton Flask with 3 Steel Balls. ........................................ B-12 Figure 3. Schematic of 2,000 ml Round Flask With Two Football Shaped Rollers. .............. B-12 Figure 4. Schematic of 2,000 ml Round Flask With Single Scraper. ..................................... B-13 Figure 5. Schematic of 2,000 ml Round Flask With Double Scraper..................................... B-13 Figure 6. Relative Aging From Equation 1 for Various Long-Term Stirred Air Flow Test
Configurations............................................................................................................... B-15 Figure 7. Schematic of Long-Term Stirred Air Flow Test With Original Impeller. ............... B-15 Figure 8. Schematic of Long-Term Stirred Air Flow Test With Helix Impeller. ................... B-16 Figure 9. Schematic of Long-Term Stirred Air Flow Test With Helix/Turbine Impeller. ...... B-16 Figure 10. Relative Aging From Equation 1 for Final Iteration of the Long-Term Stirred
Air Flow Test (Helix/8 Bladed Turbine, 200 rpm, 36 l/hr air-flow,100 °C, 40 hours). .... B-18 Figure 11. 60 °C Shear Modulus Data, Full Range. .............................................................. B-23 Figure 12. 60 °C Shear Modulus Data, Expanded Scale. ....................................................... B-23 Figure 13. 60 °C Phase Angle Data. ...................................................................................... B-23 Figure 14. 25 °C Shear Modulus Data, Full Range. .............................................................. B-26 Figure 15. 25 °C Shear Modulus Data, Expanded Scale. ...................................................... B-26 Figure 16. 25 °C Phase Angle Data. ...................................................................................... B-27 Figure 17. -12 °C Creep Modulus Data. ............................................................................... B-28 Figure 18. –12 °C m-Value Data. ........................................................................................ B-28

B-5
1.0 INTRODUCTION This report documents the Selection Study completed during Phase II of National Cooperative
Highway Research Program (NCHRP) Project 9-36, Improved Procedure for Laboratory Aging
of Asphalt Binders in Pavements. The Selection Study was included in Phase II of Project 9-36
to select either the Modified German Rotating Flask (MGRF) or the Stirred Air Flow Test
(SAFT) for further development during the remainder of the project. As documented in the
Interim Report, the literature review and review of research in progress conducted during Phase I
concluded that both of these tests are promising approaches for an improved short-term aging
procedure to be used in the United States with AASHTO M320, Performance Graded Asphalt
Binder. The equipment required for both tests is relatively inexpensive, and they are easy to
perform, applicable to both neat and modified binders, and reasonably reproduce the level of
aging that occurs in AASHTO T240 Effect of Heat and Air on a Moving Film of Asphalt (Rolling
Thin Film Oven Test), (RTFOT). The major issue unresolved through the Phase I literature
review and review of research in progress was which of these two tests is best suited to extension
to long-term aging. Only limited data was available on a long-term version of the German
Rotating Flask, and no long-term aging data was available for the SAFT. The Selection Study
documented in this report was designed to investigate the feasibility of extending these tests to
long-term aging. Since cost, complexity, and ability to simulate the RTFOT were judged to be
similar for the two tests, the extendibility to long-term aging became an important factor in
selecting the short-term test method to be further developed in Project 9-36.
This report includes six sections in addition to this brief introduction. Section 2 discusses the
aging conditions that were considered appropriate for a long-term aging test. The approach and
materials used in the Selection Study are presented in Section 3. Sections 4 and 5 describe the
laboratory testing and analysis that was included in the Selection Study. Section 4 presents
various modifications to the MGRF and the SAFT that were made while attempting to develop
prototype long-term versions of these tests, and compares the degree of aging in each to that
obtained in AASHTO R28, Accelerated Aging of Asphalt Binder Using a Pressurized Aging
Vessel (PAV), (PAV). Section 5 presents the results of a formal experiment addressing the effect

B-6
of viscosity on the degree of aging, a critical factor in the development of a long-term aging test.
Finally, Section 6 presents conclusions and recommendations drawn from the Selection Study.
2.0 SELECTED LABORATORY CONDITIONS FOR SIMULATING LONG-TERM AGING
2.1 Temperature The aging of asphalt binders, whether in the field or during accelerated laboratory aging, is a
very complex process that has received considerable attention by researchers for many years.
Previous studies indicate that the long-term aging mechanism is more reliably simulated when
the accelerated aging is conducted as close as possible to the service temperature. Research
conducted during the Strategic Highway Research Program (SHRP) clearly demonstrated that
the aging mechanisms that occur in the laboratory during simulated aging change significantly
when the aging temperature rises above approximately 110° C. Based on this past research, a
temperature of 100 °C was used in the Selection Study.
2.2 Atmosphere Pure oxygen, high pressure, and the combination of these have been used in the past to
accelerate the aging process in long-term laboratory aging tests. For safety reasons, pure oxygen
should not be used in tests intended for non-research testing laboratories. Additionally, some
researchers have questioned the use of high air pressure to accelerate the aging process.
Therefore, for the Selection Study, air at atmospheric pressure was used.
2.3 Duration The long-term aging must be accelerated by some means in order to meet the needs of both
the producers and users of the asphalt binder. Currently both pressure and temperature are used
to accelerate the aging process in the PAV, resulting in a 20-hour test. During SHRP, a 144-hour
test conducted at 60° C was proposed. Industry strongly objected to this protocol and
consequently, the aging temperature was increased to 100° C. Based on discussions at the
October 28, 2003 panel meeting, a maximum duration of 48 hours was used in the Selection
Study to simulate long-term aging.

B-7
2.4 Quantity Sufficient material must be available for characterizing the physical properties of the asphalt
binder after long-term aging. Additionally, it may be desirable in the future to obtain samples at
various times during the long-term aging to quantify aging rates. For grading according to
AASHTO MP1a, at least 140 g of long-term oven aged binder should be available. The current
procedures for the MGRF and the SAFT use 200 and 250 g of binder, respectively for the short-
term aging test. After removal of a sample for short-term aged dynamic shear rheometer (DSR)
testing, these sizes provide sufficient material for testing after long-term aging and for removing
DSR samples for characterizing aging rates if desired. Sample sizes of 200 g for the MGRF and
250 g for the SAFT were, therefore, used in the Selection Study.
Table 1 presents a summary of the conditions selected by the research team for developing
prototype versions of long-term aging tests based on the MGRF and the SAFT.
Table 1. Summary of Conditions for the Selection Study.
Condition Value Temperature 100 °C max Atmosphere Air at atmospheric pressure Duration < 48 hours Quantity Per current short-term testing protocol Degree of Aging Approximate PAV aging
3.0 EXPERIMENTAL APPROACH AND MATERIALS
3.1 Approach The Selection Study was conducted in two parts. The first part of the study was an
assessment of various modifications that could easily be made to the MGRF and the SAFT to
produce prototype long-term versions of these tests. The goal in this effort was to obtain
approximately the same degree of aging that occurs in the PAV subject to the constraints on
temperature, atmosphere, and time given in Table 1. The binders used in this part of the study
were a neat PG 58-28, a styrene-butadiene-styrene (SBS) modified PG 82-22, and a low density
polyethylene (LDPE) modified PG 76-22. Table 2 presents the test conditions that were varied
during this first part of the Selection Study. Section 4 presents a detailed discussion of the
conditions investigated for each procedure.

B-8
Table 2. Summary of Conditions Investigated During the Selection Study.
Test Conditions Investigated MGRF Morton versus smooth flask
Rotational speed Mixing enhancers Scrapers
SAFT Impeller type Position of air supply Rotational speed of impeller
The suitability of each of the various configurations was assessed based on:
• The degree of aging obtained relative to the PAV for the PG 58-28 and the PG 82-22.
• Visual assessment of the degree of mixing during the test.
• Visual assessment of separation for the two polymer modified binders.
• Potential for implementation as a specification test.
The second part of the Selection Study was a formal experiment designed to address whether
the degree of aging in the prototype long-term versions of the tests is affected by the large
differences in viscosities for neat and modified binders at the selected aging temperature of
100 °C. To emphasize the significance of the “viscosity effect” in the PAV condition the
unmodified binder has the consistency of light cream whereas the modified binder has the
consistency of molasses. Versions of the long-term tests judged successful based on the first part
of the Selection Study were subjected to this formal experiment. In this experiment, the
PG 58-28 and the SBS modified PG 82-22 were aged in the prototype long-term versions of the
tests and in the PAV. Rheological measurements at high, intermediate and low pavement
temperatures were used to compare the level of aging to that produced by the PAV. Replication
was included in this experiment to permit statistical analysis of the differences in aging that were
observed. The results and analysis of this experiment are presented in detail in Section 5.

B-9
3.2 Materials As discussed above, three binders were used in the Selection Study: a neat PG 58-28, a SBS
modified PG 82-22, and an LDPE modified PG 76-22. Table 3 presents AASHTO M320 data
for the binders.
Table 3. AASHTO M320 Properties for the Binders Used in the Selection Study. Condition Test Method PG 58-28 PG 82-22 PG 76-22 Unaged Viscosity at 135 oC ASTM D4402 0.23 Pa·s 3.19 Pa·s 2.06 Pa·s
G*/sinδ at 10 rad/sec AASHTO T315 1.22 kPa at 58 oC
1.94 kPa at 82 oC
1.61 kPa at 76 oC
RTFO Aged Residue Mass Change, % AASHTO T240 -0.358 -0.183 -0.192 G*/sinδ, at 10 rad/sec AASHTO T315 2.72 kPa
at 58 oC 3.72 kPa at 82 oC
2.71 kPa at 76 oC
PAV Aged Residue
G*sinδ, at 10 rad/sec AASHTO T315 2792 kPa at 19 oC
3999 kPa at 25 oC
4841 kPa at 25 oC
Creep Stiffness, at 60 sec AASHTO T313 218 MPa at –18 oC
177 MPa at –12 oC
218 MPa at –18 oC
m-value at 60 sec AASHTO T313 0.372 at –18 oC
0.335 at –12 oC
0.319 at –12 oC
The PG 58-28 and the PG 82-22 were obtained from the Paulsboro, New Jersey refinery of
the Citgo Asphalt Refining Company (Citgo). The PG 82-22 binder is supplied under the trade
name Citgoflex SP. Based on information provided on the Material Safety Data Sheet for this
product, Citgoflex SP is produced with SBS polymer. The PG 76-22 binder was obtained from
one of Advanced Asphalt Technologies, LLC’s 2003 on-site blending projects. The PG 76-22
binder is supplied under the trade name NOVOPHALT. This particular sample contains PG 64-
22 binder obtained from the Perth Amboy, New Jersey refinery of Chevron Products Co., and 6
percent LDPE.
4.0 DEVELOPMENT OF LONG-TERM AGING TESTS
4.1 Modified German Rotating Flask Attempts to develop a prototype long-term version of the MGRF that approximates the aging
produced in the PAV focused on methods to enhance mixing and to create a film that is
continuously renewed within the flask. This was accomplished by adding various mixers and
scrapers and varying the rotational speed of the flask. For all of this testing, a temperature of 100
B-10
°C, an air-flow rate of 36 l/hr, and an aging time of 48 hours were used. Table 4 summarizes the
chronological order of the various configurations that were attempted. Figure 1 compares the
degree of aging achieved with each configuration relative to the aging obtained with the PAV.
Schematic diagrams of selected configurations are shown in Figures 2 through 5. The measure
of the degree of aging shown in Figure 1 is defined by Equation 1. The relative aging according
to this equation is simply the change in viscosity above RTFOT aging caused by the prototype
long-term test divided by the increase in viscosity that occurs during PAV aging. For all
equipment configurations and binders, relative aging is reported based on the dynamic viscosity
measured at 60 °C and 0.1 rad/sec.
%100**
**×
−
−=
RTFOTPAV
RTFOTiRAηη
ηη (1)
where:
RA = relative long-term aging
i
*η = dynamic viscosity for configuration i, measured at 60 °C, 0.1 rad/sec.
RTFOT
*η = dynamic viscosity for RTFOT aged, measured at 60 °C, 0.1 rad/sec.
PAV*η = dynamic viscosity for PAV aged, measured at 60 °C, 0.1 rad/sec.
The investigation of various alternatives for a long-term version of the MGRF procedure
started with the current MGRF, which uses a 2,000 ml Morton flask. The alternatives that were
investigated included a 2,000 ml round flask with the addition of steel balls and rollers to
enhance mixing and formation of a film and the use of scrapers to create and renew the film. As
shown in Figure 1, the Morton flask was marginally successful for long-term aging for the PG
58-28, but was not successful for aging the PG 82-22. The use of a round flask with steel balls,
as used in Germany, increased the aging of the PG 82-22 slightly while the use of rollers that
conformed to the shape of the flask did not. The simple scrapers designed to fit in a round flask
appear to remove much of the viscosity effect, resulting in similar aging of the PG 58-28 and PG
82-22 binders, but the degree of aging after 48 hours is only one-third of that obtained in the
PAV.

B-11
Table 4. Summary of Long-Term Rotating Flask Configurations Tested. Number Flask Mixer Speed Figure Observations 1 Morton None 4 rpm Not
shown 1. Adequate film for PG 58-22 binder. 2. Does not produce a moving film for PG 82-22 binder. 3. Low relative aging for both binders.
2 Morton 3 Steel Balls 1 rpm Figure 2 1. Not used with PG 58-28 binder. 2. Does not produce a moving film for PG 82-22 binder. 3. Low relative aging for PG 82-22 binder
3 Round 1 Football Shaped Roller
1 rpm Not shown
1. Not used with PG 58-28 binder. 2. Does not produce a moving film for PG 82-22 binder. 3. Low relative aging for PG 82-22
4 Round 2 Football Shaped Rollers
1 rpm Figure 3 1. Not used with PG 58-28 binder. 2. Does not produce a moving film for PG 82-22 binder. 3. Low relative aging for PG 82-22
5 Round Single Scraper
1 rpm Figure 4 1. Does not produce a film for PG 58-28 binder. 2. Generated a renewed film for PG 82-22, but film
thickness increased with aging time. 3. Low relative aging for both binders.
6 Round Double Scraper
1 rpm Figure 5 1. Not used with PG 58-28 binder 2. Generated a renewed film for PG 82-22. Film
thickness relatively constant with aging time. 3. Low relative aging for PG 82-22 binders.
Figure 1. Relative Aging from Equation 1 for Various Long-Term Rotating Flask Configurations.
12%
15%
7%
32%
37%
55%
27%
0% 20% 40% 60% 80% 100% 120% 140%
Morton
Morton + 3 Balls
Round + 2 Rollers
Round + Scraper
Round + DoubleScraper
60 oC DYNAMIC VISCOSITY INCREASE, PERCENT OF PAV
PG 58-28PG 82-22
More Aged Than PAVLess Aged Than PAV

B-12
Figure 2. Schematic of 2,000 ml Morton Flask with 3 Steel Balls.
Figure 3. Schematic of 2,000 ml Round Flask With Two Football Shaped Rollers.

B-13
Figure 4. Schematic of 2,000 ml Round Flask With Single Scraper.
Figure 5. Schematic of 2,000 ml Round Flask With Double Scraper.
Air
Re
Top Clamp to hold Scraper stationary
Clamp to hold Scraper stationary
Re
Top

B-14
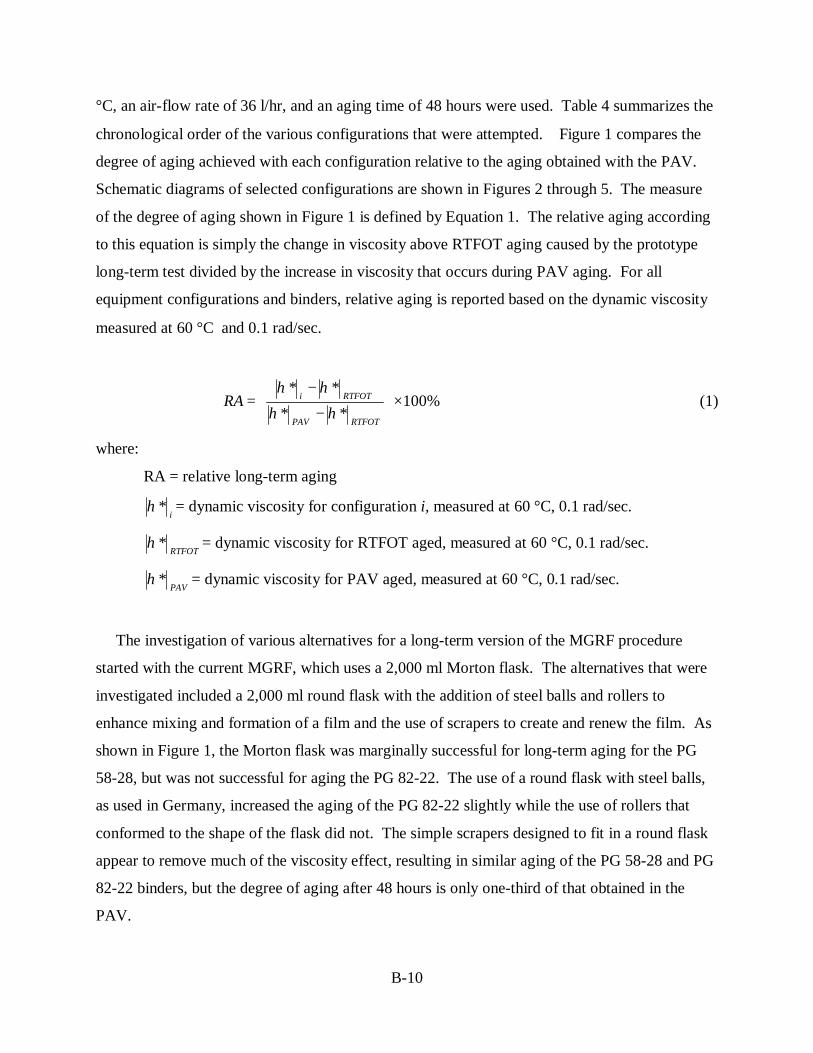
4.2 Stirred Air Flow Test Attempts to develop a prototype long-term version of the SAFT that approximates the aging
produced in the PAV focused on the design of an impeller that could efficiently mix the air with
the binders over a wide range of viscosities. The design proceeded from the impeller used in the
short-term version of the test, which is very efficient at mixing air with low viscosity binders, to
a helix impeller which is efficient at mixing highly viscous fluids, and finally to a helix/turbine
impeller which combines the benefits of both. For all of this testing, a temperature of 100 °C,
and an air-flow rate of 36 l/hr were used. Table 5 summarizes the chronological order of the
various configurations that were attempted. Figure 6 compares the degree of aging achieved
with each configuration relative to the aging achieved with the PAV. Schematic diagrams of
selected configurations are shown in Figures 7 through 9. The measure of the degree of aging
shown in Figure 6 is the same used in Figure 1 and defined in Equation 1. The relative aging
according to this equation is simply the change in viscosity above RTFOT aging caused by the
prototype long-term test divided by the increase in viscosity that occurs during PAV aging. The
dynamic viscosity was measured at 60 °C, 0.1 rad/sec.
Table 5. Summary of Long-Term Stirred Air Flow Test Configurations Tested. Number Impeller Speed Schematic Observations 1 Original 750
rpm Figure 7 1. Good mixing of PG 58-28 binder.
2. Could not stir PG 82-22 binder. 3. High relative aging for PG 58-28.
2 Helix 220 rpm
Figure 8 1. Good mixing of both PG 58-28 and PG 82-22 binders. 2. Better mixing of PG 82-22 binder occurs at lower speeds. 3. High relative aging of PG 82-22 binder. 4. Moderate relative aging of PG 58-28 binder.
3 Helix/ 4 bladed Turbine
350 rpm
Figure 9 1. Good mixing of PG 58-28, PG 82-22, and PG 76-22 binders. 2. Aging at 48 hrs exceeds PAV conditions for the PG 58-28 and
PG 82-22. 3. Less difference in aging between PG 58-28 and PG 82-22
than observed with Helix. 4 Helix/
8 bladed Turbine
350 rpm
Not shown 1. Good mixing of - PG 58-28, PG 82-22, and PG 76-22 binders. 2. PAV aging obtained at approximately 40 hours.

B-15
Figure 6. Relative Aging From Equation 1 for Various Long-Term Stirred Air Flow Test Configurations.
Figure 7. Schematic of Long-Term Stirred Air Flow Test With Original Impeller.
95%
40%
136%
71%
85%
65%
21%
125%
63%57%
0% 20% 40% 60% 80% 100% 120% 140%
Original 48 hrs
Helix 48 hrs
Helix 24 hrs
Helix/Turbine 48 hrs
Helix/Turbine 24 hrs
60 oC DYNAMIC VISCOSITY INCREASE, PERCENT OF PAV
PG 76-22 LDPEPG 58-28 NeatPG 82-22 SBS
More Aged Than PAVLess Aged Than PAV
600ml/min.Air
700rpm
HeatingMantle
Probe toTemp.Control
Temp.Probe
B-16
Figure 8. Schematic of Long-Term Stirred Air Flow Test With Helix Impeller.
Figure 9. Schematic of Long-Term Stirred Air Flow Test With Helix/Turbine Impeller. The original impeller worked well with the PG 58-28 binder, but it did not provide adequate
mixing of the PG 82-22 binder. When this impeller is used with extremely viscous materials the
entire mass of material spins with the impeller. The helix impeller, which is frequently used to
220 rpm
600ml/min.Air
HeatingMantle
Probe toTemp.Control
350 rpm
600ml/min.Air
BathWax
Clamp
View A3-D
A

B-17
mix very viscous and particulate filled fluids, worked well with the PG 82-22 binder, but
apparently did not disperse air as efficiently in the less viscous PG 58-28 binder. The
helix/turbine impeller, which includes a helix to move the binder vertically in the vessel, and a
turbine to mix air with the binder, resulted in the best performance over the range of binders
investigated. At 48 hours, the degree of aging obtained in the PG 58-28 and the PG 82-22 binder
exceeded that obtained in the PAV.
The last iteration of the impeller design was a helix/turbine impeller with 8 turbine blades.
With this impeller, PAV aging conditions were reached after approximately 40 hours. Figure 10
shows the degree of aging obtained with this configuration for the three binders included in the
Selection Study. The measure of the degree of aging shown in Figure 10 is the same used in
Figures 1 and 6 and defined in Equation 1. The relative aging according to this equation is
simply the change in viscosity above RTFOT aging caused by the prototype long-term test
divided by the increase in viscosity that occurs during PAV aging. The dynamic viscosity was
measured at 60 °C, 0.1 rad/sec. The degree of aging appears to increase with increasing binder
stiffness which is counterintuitive.

B-18
Figure 10. Relative Aging From Equation 1 for Final Iteration of the Long-Term Stirred Air Flow Test (Helix/8 Bladed Turbine, 200 rpm, 36 l/hr air-flow, 100 °C, 40 hours). Based on the testing above, the research team concluded that it is possible to extend the SAFT
to a long-term aging test. The following section discusses the viscosity effects experiment that
was conducted to quantify the significance of the differences between the aging of the PG 58-28
and the PG 82-22 binder shown in Figure 10.
5.0 VISCOSITY EFFECTS EXPERIMENT
5.1 Design Only the final iteration (a helix/turbine impeller with 8 turbine blades) of the long-term
version of the SAFT was subjected to the viscosity effects experiment. Table 6 summarizes the
testing conditions for the Long-Term SAFT.
1.15
0.93
0.80
0% 20% 40% 60% 80% 100% 120% 140%
82-22 SBS
76-22 LDPE
58-28 NEAT
60 oC DYNAMIC VISCOSITY INCREASE, PERCENT OF PAV
More Aged Than PAVLess Aged Than PAV

B-19
Table 6. Testing Conditions for the Long-Term Stirred Air Flow Test.
Condition Value Sample Size 250 g Aging Temperature 100 °C Impeller Type Helix + 8 Bladed Turbine Impeller Speed 350 rpm Air Flow Rate 36 l/hr Aging Time 40 hours
The viscosity effects experiment was designed to investigate the effect of viscosity on the
degree of aging that occurs in the Long-Term SAFT. This was accomplished by aging split
samples of RTFOT-aged PG 58-28 and PG 82-22 in the PAV and the Long-Term SAFT, and
comparing rheological properties at high, intermediate, and low pavement temperatures. The
following properties were measured for the RTFOT, PAV, and Long-Term SAFT:
• Shear modulus and phase angle from a DSR frequency sweep at 60 °C using
frequencies from 0.1 to 100 Hz.
• Shear modulus and phase angle from a DSR frequency sweep at 25 °C using
frequencies from 0.1 to 100 Hz.
• Creep stiffness and m-value at 60 sec from BBR tests conducted at –12 °C.
Three independent samples were aged in the Long-Term SAFT and the PAV and tested as
outlined above. The resulting data are presented in Section 8.
5.2 Statistical Analysis Regression analysis was used to analyze the data. The data were analyzed separately for each
property measured and at each test temperature as outlined below.
1. Compute averages for physical properties measured for the PAV and Long-Term
SAFT residue from the three replicate samples that were aged and tested.
2. Regress the Long-Term SAFT data against the PAV data using data from both the PG
82-22 and PG 58-28 binders and a linear model with the following form:

B-20
PLTSAFT = B1(PPAV) + B2(PPAV x AC) (2)
Where:
PLTSAFT = measured property for Long-Term SAFT conditions (average of
three replicate tests).
PPAV = measured property for PAV conditions (average of three replicate
tests).
AC = dummy variable for binder type (AC=0 for PG 82-22, AC=1 for
PG 58-28).
B1 and B2 = regression coefficients
The model given in Equation 2 reduces to the following models for the PG 82-22 and
the PG 58-28 binders.
For PG 82-22: PLTSAFT = B1(PPAV) (3a)
For PG 58-28: PLTSAFT = (B1 + B2)(PPAV ) (3b)
3. Use the regression coefficients and their standard errors from Step 2 to perform
hypothesis tests on the statistical significance of the slope coefficients. With the
results of the regression model check the hypothesis that the slope of the PG 82-22
data is significantly different from one, and the hypothesis that the slope of the
PG 82-22 data is significantly different from that for the PG 58-28.
Hypothesis Test for PG 82-22 Slope
Ho: B1 = 1.0, slope for 82-22 = 1.0
Ha: B1 ≠ 1.0, slope for 82-22 ≠ 1.0
Test Statistic: )(0.1
1
1
BSBt
e
−=
Where:
Se(B1) = standard error of B1

B-21
Region of Rejection: Reject Ho if t < -tα/2 or t > tα/2 for n-2 degrees of freedom.
Hypothesis Test for Difference Between PG 82-22 and PG 58-28 Slopes
Ho: B2 = 0, slope for 82-22 and PG 58-28 are the same
Ha: B2 ≠ 0, slope for 82-22 ≠ slope for PG 58-28
Test Statistic: )(0.0
2
0
BSBt
e
−=
Where:
Se(B2) = standard error of B2
Region of Rejection: Reject Ho if t < -tα/2 or t > tα/2 for n-2 degrees of freedom.
4. Regress the Long-Term SAFT data against the PAV data using only the data from the
PG 58-28 binder and a linear model with the following form:
PLTSAFT = B3(PPAV) (4)
5. Use the regression coefficient and its standard error from Step 4 to perform a
hypothesis test on the statistical significance of the slope coefficient. With this model
check if the slope for the PG 58-28 data is significantly different than one.
Hypothesis Test for PG 82-22 Slope
Ho: B3 = 1.0, slope for 58-28 = 1.0
Ha: B1 ≠ 1.0, slope for 58-28 ≠ 1.0
Test Statistic: )(0.1
3
3
BSBt
e
−=
Where:
Se(B3) = standard error of B3
Region of Rejection: Reject Ho if t < -tα/2 or t > tα/2 for n-2 degrees of freedom.
The sections that follow present and discuss the findings of these analyses for the three
temperature conditions.

B-22
High Pavement Temperature Properties Properties measured at the high pavement temperature included shear modulus and phase
angle for a frequency sweep conducted at 60 °C using frequencies from 0.1 to 100 Hz. Figures
11, 12, and 13 compare the shear modulus and phase angle data collected at 60 °C. Figures 11
and 12 present the shear modulus data. The scale is expanded in Figure 12 to better show the low
modulus data. The phase angle data are presented in Figure 13. In all of these figures averages
from three replicate tests on the residue from the Long-Term SAFT and the PAV are shown.
PG 58-28 Slope = 0.90
PG 82-22 Slope = 1.14
0
50
100
150
200
250
300
0 50 100 150 200 250 300
PAV 60 oC G*, kPa
LTSA
FT 6
0 o C
G*,
kPa
PG 82-22PG 58-28Equality
Figure 11. 60 °C Shear Modulus Data, Full Range.

B-23
PG 58-28 Slope = 0.90
PG 82-22 Slope = 1.14
0
5
10
15
20
25
30
35
40
45
50
0 5 10 15 20 25 30 35 40 45 50
PAV 60 oC G*, kPa
LTSA
FT 6
0 o C
G*,
kPa
PG 82-22PG 58-28Equality
Figure 12. 60 °C Shear Modulus Data, Expanded Scale.
Figure 13. 60 °C Phase Angle Data.
PG 58-28 Slope = 1.01
PG 82-22 Slope = 1.01
50
55
60
65
70
75
80
85
90
50 55 60 65 70 75 80 85 90
PAV 60 oC δ, kPa
LTSA
FT 6
0 o C
δ, k
Pa
PG 82-22PG 58-28Equality

B-24
The statistical analysis of these data is summarized in Table 7. This analysis produced the
following findings for the DSR data obtained at the high pavement temperature:
1. The shear modulus of the PG 82-22 binder is significantly higher when aged in the
Long-Term SAFT compared to PAV aging. The magnitude of the bias is 14 percent.
2. The shear modulus of the PG 58-28 binder is significantly lower when aged in the
Long-Term SAFT compared to PAV aging. The magnitude of the bias is 10 percent.
3. The relative aging measured by the shear modulus at 60 °C shows a significant binder
effect. The Long-Term SAFT ages the PG 58-28 binder less than the PAV, while it
ages the PG 82-22 binder more than the PAV.
4. The phase angle for both binders is significantly higher when aged in the Long-Term
SAFT compared to PAV aging. The magnitude of the bias is 1 percent. Although
this bias is statistically significant, from an engineering standpoint the phase angles
are essentially equivalent.
Table 7. Summary of Statistical Analysis of High Pavement Temperature DSR Data. Property Coefficient Value Se t dof tcr, α= 0.05 Conclusion
G*
B1 1.1411 0.00050 284.271 18 2.101 PG 82-22 Slope > 1.0 B2 -0.2369 0.00273 -86.880 18 -2.101 PG 58-28 Slope < PG 82-22 Slope B3 0.9042 0.00160 -60.024 8 -2.306 PG 58-28 Slope < 1.0
δ
B1 1.0094 0.0022 4.338 18 2.101 PG 82-22 Slope > 1.0 B2 0.0003 0.0025 0.124 18 2.102 PG 58-28 Slope = PG 82-22 Slope B3 1.0103 0.0010 10.210 8 2.306 PG 58-28 Slope > 1.0
Intermediate Pavement Temperature Properties Properties measured at the intermediate pavement temperature included of shear modulus and
phase angle for a frequency sweep conducted at 25 °C using frequencies from 0.1 to 100 Hz.
Figures 14, 15, and 16 compare the shear modulus and phase angle data collected at 25 °C.
Figures 14 and 15 present the shear modulus data. The scale is expanded in Figure 15 to better
show the low modulus data. The phase angle data are presented in Figure 16. In all of these
figures averages from three replicate tests of the residue of the Long-Term SAFT and the PAV
are shown.

B-25
The statistical analysis of these data is summarized in Table 8. This analysis produced the
following findings for the intermediate pavement temperature DSR data:
1. The shear modulus of the PG 82-22 binder is significantly higher when aged in the Long-
Term SAFT compared to PAV aging. The magnitude of the bias is 13 percent.
2. The shear modulus of the PG 58-28 binder is significantly lower when aged in the Long-
Term SAFT compared to PAV aging. The magnitude of the bias is 6 percent.
3. The relative aging measured by the shear modulus at 25 °C shows a significant binder
effect. The Long-Term SAFT ages the PG 58-28 binder less than the PAV, while it ages
the PG 82-22 binder more that the PAV.
4. The phase angle for the PG 82-22 binder is significantly lower when aged in the Long-
Term SAFT compared to PAV aging. The magnitude of the bias is 2 percent; statistically
significant but perhaps not significant from an engineering standpoint.
5. The phase angle for the PG 58-28 binder is significantly higher when aged in the Long-
Term SAFT compared to PAV aging. The magnitude of the bias is 1 percent; again
statistically significant but perhaps not significant from an engineering standpoint.
6. The relative aging measured by the phase angle at 25 °C shows a significant binder
effect. The Long-Term SAFT ages the PG 58-28 binder less than the PAV, while it ages
the PG 82-22 binder more that the PAV.

B-26
Figure 14. 25 °C Shear Modulus Data, Full Range.
Figure 15. 25 °C Shear Modulus Data, Expanded Scale.
PG 58-28 Slope = 0.94
PG 82-22 Slope =1.13
0
2000
4000
6000
8000
10000
12000
14000
16000
18000
0 2000 4000 6000 8000 10000 12000 14000 16000 18000
PAV 25 oC G*, kPa
LTSA
FT 2
5 o C
G*,
kPa
PG 82-22PG 58-28Equality
PG 58-28 Slope = 0.94
PG 82-22 Slope = 1.13
0
1000
2000
3000
4000
5000
6000
0 1000 2000 3000 4000 5000 6000
PAV 25 oC G*, kPa
LTSA
FT 2
5 o C
G*,
kPa
PG 82-22PG 58-28Equality

B-27
Figure 16. 25 °C Phase Angle Data.
Table 8. Summary of Statistical Analysis of Intermediate Pavement Temperature DSR Data.
Property Coefficient Value Se t dof tcr, α= 0.05 Conclusion
G* B1 1.1271 0.0035 36.366 18 2.101 PG 82-22 Slope > 1.0 B2 -0.1884 0.0120 -15.728 18 -2.101 PG 58-28 Slope < PG 82-22 Slope B3 0.9387 0.0035 17.384 8 2.306 PG 58-28 Slope < 1.0
δ
B1 0.9819 0.0032 -5.692 18 -2.101 PG 82-22 Slope < 1.0 B2 0.0308 0.0041 7.573 18 2.101 PG 58-28 Slope > PG 82-22 Slope B3 1.0127 0.0020 6.443 8 2.306 PG 58-28 Slope > 1.0
Low Temperature Properties The low pavement temperature properties included measurements of the creep modulus and
m-value at -12 °C. Data were collected at the six standard times (8, 15, 30, 60, 120, and 240 sec)
reported in the BBR test. Figures 17 and 18 compare the creep modulus and m-value data. In
both figures averages from six replicate beams prepared from material aged in the Long-Term
SAFT and the PAV are shown.
PG 82-22 Slope = 1.01
PG 58-28 Slope = 0.98
40
45
50
55
60
65
70
75
80
85
90
40 50 60 70 80 90
PAV 25 oC δ, kPa
LTSA
FT 2
5 o C
δ, k
Pa
PG 82-22PG 58-28Equality

B-28
Figure 17. -12 °C Creep Modulus Data.
PG 82-22 Slope = 0.97
PG 58-28 Slope = 1.03
0.200
0.250
0.300
0.350
0.400
0.450
0.500
0.550
0.600
0.200 0.250 0.300 0.350 0.400 0.450 0.500 0.550 0.600
PAV m-value
LTSA
FT m
-val
ue
PG 82-22PG 58-28Equality
Figure 18. –12 °C m-Value Data.
PG 82-22 Slope = 1.07
PG 58-28 Slope = 1.03
0
50
100
150
200
250
300
350
400
0 50 100 150 200 250 300 350 400
PAV S, MPa
LTSA
FT S
, MPa
PG 82-22PG 58-28Equality

B-29
The statistical analysis of these data is summarized in Table 9. This analysis produced the
following findings the low pavement temperature BBR data:
1. The creep modulus of the PG 82-22 binder is significantly higher when aged in the Long-
Term SAFT compared to PAV aging. The magnitude of the bias is 7 percent.
2. The creep modulus of the PG 58-28 binder is also significantly higher when aged in the
Long-Term SAFT compared to PAV aging. The magnitude of the bias is 3 percent.
3. The relative aging measured by the creep modulus at –12 °C shows a significant binder
effect. Although the Long-Term SAFT ages both binders more than the PAV, the bias is
less for the PG 58-28 binder compared to the PG 82-22 binder.
4. The m-value for the PG 82-22 binder is significantly lower when aged in the Long-Term
SAFT compared to PAV aging. The magnitude of the bias is 3 percent.
5. The m-value for the PG 58-28 binder is significantly higher when aged in the Long-Term
SAFT compared to PAV aging. The magnitude of the bias is 3 percent.
6. The relative aging measured by the m-value at -12 °C shows a significant binder effect.
The Long-Term SAFT ages the PG 58-28 binder less than the PAV, while it ages the PG
82-22 binder more than the PAV.
Table 9. Summary of Statistical Analysis of Low Pavement Temperature DSR Data.
Property Coefficient Value Se t dof tcr, α= 0.05 Conclusion
S B1 1.0683 0.0031 21.737 10 2.228 PG 82-22 Slope > 1.0 B2 -0.0366 0.0077 -4.737 10 -2.228 PG 58-28 Slope < PG 82-22 Slope B3 1.0317 0.0042 7.500 4 2.776 PG 58-28 Slope > 1.0
m
B1 0.9728 0.0019 -14.509 10 -2.101 PG 82-22 Slope < 1.0 B2 0.0550 0.0024 23.215 10 2.101 PG 58-28 Slope > PG 82-22 Slope B3 1.0278 0.0012 23.475 4 2.776 PG 58-28 Slope > 1.0
5.3 Engineering Analysis The statistical analysis of the viscosity effects experiment showed a difference in the degree
of aging for samples aged in the Long-Term SAFT and the PAV. For stiffness measurements,
the bias ranged from as high as 14 percent for high pavement temperature shear modulus
measurements to as low as 3 percent for low temperature creep modulus measurements. Bias in

B-30
the phase angle and m-value were generally smaller ranging from 1 to 3 percent. The regression
approach used in the analysis of the data is very effective at identifying bias between two
measurements. The phase angle bias was only 1 percent, and from an engineering perspective
has little effect on the AASHTO T320 specification measurements. The shear modulus, creep
stiffness, and m-value biases were larger. Table 10 compares these biases with single operator
precision statements as published in AASHTO T313 (BBR) and AASHTO T315 (DSR). The
biases are approximately two times the coefficient of variation for single operator tests.
Table 10. Comparison of Long-Term Stirred Air Flow Test Bias With DSR and BBR Precision.
Property Long-Term Stirred Air Flow Test Bias
AASHTO Single Operator Coefficient of Variation
G* at 60 °C -10 to +14 % 7.9 % G* at 25 °C -6 to +13 % 7.9 % S +3 to +7 % 3.2 % m -3 to +3 % 1.4 %
Probably more important than the finding that the aging is different between the two tests is
the fact that the two binders aged differently. The PG 82-22 binder aged more in the Long-Term
SAFT than in the PAV, while the PG 58-28 binder aged more in the PAV than in the Long-Term
SAFT. This difference is most evident in the high pavement temperature tests, but also occurs in
the intermediate and low pavement temperature tests that are used in AASHTO M320.
Differences between the aging produced by the Long-Term SAFT and the PAV appear to be
temperature dependent. The differences are greater at the upper grading temperature than at the
lower grading temperature. This implies that the two aging procedures produce materials that
are different rheologically.
There are two possible explanations for the binder effect. First, the helix/turbine impeller and
its rotational speed may not be properly optimized for lower viscosity binders. Second, the air
dispersion mechanism in the Long-Term SAFT test may age polymers more than or in a different
way than the high-pressure aging occurring in the PAV. Additional testing of neat and modified

B-31
binders, both having a wide range of consistency is needed to determine the cause of this effect
and to further improve the Long-Term SAFT.
6.0 SUMMARY AND CONCLUSIONS During Phase I of Project 9-36 it was concluded that both the MGRF and the SAFT are
promising approaches for an improved short-term aging procedure that can be used in the United
States in conjunction with AASHTO M320. Both tests require relatively inexpensive equipment,
are easy to perform, and are applicable to both neat and modified binders. Most importantly, they
reasonably reproduce the level of aging that occurs in the RTFOT. The major issue left
unresolved by the Phase I literature review and review of research in progress was which of these
two tests is best suited to further development as a long-term aging test. Since cost, complexity,
applicability to neat and modified binders, and the ability to simulate the RTFOT were all judged
to be similar for the two tests, the extendibility to long-term aging became an important factor in
selecting the test method that will be further developed in Project 9-36.
The Selection Study documented in this report was designed to investigate the extension of
these two tests to long-term aging. It was designed to examine the degree of long-term aging
that can be obtained in both tests using practical test conditions and to determine if the degree of
aging is significantly affected by the viscosity of the binder. Based on the testing and analysis
presented in this report, the following conclusions were drawn:
1. MGRF. It does not appear that further effort to extend the MGRF to long-term aging is
warranted. This method is designed to expose a thin film of binder to air or oxygen. The
amount of aging that occurs depends upon the thickness of the film and the thickness of
the film is dependent upon the degree of mixing that occurs during test. Unfortunately
both of these effects depend upon the viscosity of the binder. These effects are
exacerbated at the lower, long-term aging temperature where the viscosity of all binders is
much greater than at the short-term aging temperature. Consequently, mechanical mixing
is required to minimize the viscosity effect. Adding steel balls or rollers is only marginally
beneficial. There is a possibility that a mechanical wiper may provide a more uniform
film, but the viscosity of the binder is still likely to affect the effectiveness of the wiper.

B-32
This approach was found to be impractical with glass flasks because glass blowing
tolerances make it difficult to control the film thickness of the binder. Without some sort
of mechanical wiper and machined vessel, further effort to apply the thin film approach
does not appear warranted for long-termed aging. The Rolling Cylinder Aging Test uses a
heavy roller inside a cylindrical vessel to produce an approximately 2-mm thick film. This
test requires approximately 144 hours to produce levels of aging comparable to those
obtained in the PAV.
2. SAFT. It appears that with additional development, the SAFT can be modified for use as
a long-term aging test. This method is designed to bubble air through a mass of the binder,
thereby exposing the binder to oxygen. As with the MGRF, adequate mixing of the binder
is important and this is obtained through selection of a proper impeller. Additionally, the
impeller must adequately break-up or disperse the air to accelerate the long-term aging
process. During the Selection Study, a helix/turbine impeller was developed for the Long-
Term SAFT. With this impeller, aging comparable to that occurring in the PAV can be
obtained for a wide range of binders. Two modifications of the SAFT are needed to
extend it to long-term aging. First, different impellers are needed for the short- and long-
term tests. Second, the stirring motor used in the short-term test was inadequate and the
size of the motor must be increased substantially to accommodate the high torque required
to turn the helix/turbine impeller in highly viscous materials.
The duration of the procedure is somewhat long at 40 hours, and there is a binder effect.
For the same operating conditions, stiffer polymer modified binders tend to age more
relative to PAV aging than softer neat binders. It is likely that the duration of the test can
be further reduced through refinement of the impeller, use of enriched air, and
optimization of other operating parameters such as rotational speed and air flow rate.
Additional study is needed to determine the source of the binder effect and to further
modify the procedure to overcome this effect.

B-33
7.0 RECOMMENDATIONS
7.1 Phase II of Project 9-36 Based on the findings of the Phase I and the Selection Study, the research team recommends
that the SAFT be further developed as an improved short-term aging procedure in Phase II of
Project 9-36. The Phase I literature review and review of research in progress concluded the
Stirred Air Flow Test is relatively inexpensive, easy to perform, applicable to both neat and
modified binders, and reasonably reproduces the level of aging that occurs in the RTFOT. The
Selection Study reported in this document concluded that with additional developmental effort,
the SAFT can likely be extended to long-term aging. Two scenarios for using the SAFT in
AASHTO M320 are discussed below.
Stirred Air Flow Test as a Replacement for the RTFOT The first scenario is to replace the RTFOT with the SAFT as the short-term aging procedure
and to continue to use the PAV for long-term aging. Table 11 compares the SAFT test and the
RTFOT for short-term aging.
Table 11. Comparison of Stirred Air Flow Test and RTFOT.
Considerations Rolling Thin Film Oven Stirred Air Flow Test
Neat and Modified Binders No Yes Amount of Material 280 g (8 bottles) 250 g Equipment Cost $7,500 $6,500 Equipment Complexity Moderately Complex Moderately Complex Current Availability High Low Test Complexity Reasonable Reasonable Binder Recovery Difficult Easy Clean-up Ignition Oven Solvent Temperature 163 °C 163 °C Duration 85 min 45 min Atmosphere Air at 4 L/min Air at 2 L/min Measure Volatility Mass Change Volatile recovery system

B-34
The advantages of the SAFT for short-term aging are:
• Applicable to both neat and modified binders.
• Shorter test duration.
• Easier recovery of aged binder.
• Includes a volatile compound recovery system.
• Slightly lower equipment cost.
Of these, its applicability to both neat and modified binders and the potential for developing an
effective volatile recovery system are the most significant advantages. The well documented
problems associated with aging modified binders in the RTFOT were part of the justification for
Project 9-36. Research completed during the development of the SAFT at Texas A&M
University and work completed in Project 9-36 during the Selection Study shows that the test can
be used to age stiff, modified binders. With further refinement, the volatile compound recovery
system included in the SAFT represents an improvement over the mass change approach used in
the RTFOT.
The disadvantages of the SAFT for short-term aging are:
• There is currently only a single manufacturer of the equipment although this
disadvantage will likely be overcome if the procedure is adopted for specification use.
• Solvent clean-up is needed for components with bearings and mating machined
surfaces.
• Only a single binder can be aged during an equipment cycle.
This last disadvantage is probably the most serious. With the RTFOT, more than one binder can
be aged during each cycle in the aging oven . Although this of no significance when complete
AASHTO M320 or AASHTO MP1a grading is being performed, it is a consideration when a
quality control or acceptance program combines frequent DSR tests on short-term aged material
with a limited number of DSR and BBR tests on long-term aged material. For such a program,

B-35
the shorter duration of the SAFT is offset by the fact that multiple binders that can be aged
simultaneously in the RTFOT.
In summary, for complete AASHTO M320 and AASHTO MP1a grading, replacing the
RTFOT with the SAFT offers several advantages for short-term aging. The most important are
the SAFT can be used with both modified and unmodified binders and, with further
development, has the potential for providing a direct measurement of the volatile loss that occurs
during the aging process. The test also offers some operational advantages including a shorter
test duration, easier recovery of the aged binder, and a slightly lower equipment costs.
Stirred Air Flow Test as a Replacement for the RTFOT and the PAV The second scenario is to use the SAFT for both short and long-term aging. Based on the
limited testing performed during the Selection Study, it is possible to approximate PAV
conditions using the SAFT. Two modifications of the current device are needed to extend it to
long-term aging. First, different impellers are needed for the short- and long-term tests. Second,
the size of the motor must be increased substantially to accommodate the high torque required to
turn the impeller for the long-term test in highly viscous materials. Table 12 compares the
prototype version of the Long-Term SAFT and the PAV for long-term aging.
As shown in Table 12, there are two fundamental advantages that Long-Term SAFT has over
the PAV. First, the binder is aged at atmospheric pressure eliminating the safety concerns that
have been expressed for the PAV. Second, multiple sampling times can be included in the
procedure to assess aging kinetics. The basic device is also less expensive than the current
PAV. The major disadvantage of the SAFT for long-term aging is the test will likely require
longer than the 20 hour cycle time for the PAV and only a single binder can be aged during the
test. However, the cycle time should be less than 48 hours making it a two-day instead of a one-
day test.

B-36
Table 12. Comparison of Stirred Long-Term Stirred Air Flow Test and PAV.
Considerations PAV Long-Term Stirred Air Flow Test
Neat and Modified Binders Yes Yes Amount of Material 500 g (10 pans) 250 g Number of Binders per Equipment Cycle
2 1
Equipment Cost $12,500 $6,500 Equipment Complexity Simple Moderately Complex Availability High Low Test Complexity Reasonable Reasonable Safety Precautions High Air Pressure None Binder Recovery Easy Easy Clean-up Solvent Solvent Sampling During Test No Yes Temperature 90, 100, 110 °C ≥ 100 °C * Duration 20 hours Approx. 40 hours * Atmosphere Air pressurized to 2.1 MPa Air flowing at 36 L/hr *
* Conditions in italics are estimated based on limited testing.
7.2 Additional Future Research The expected products of Phase II of Project 9-36 will be an improved short-term binder
aging procedure based on the SAFT that produces the same degree of aging as the RTFOT for
neat binders, and a verification of the procedure for neat and modified binders using data from
oven-aged mixtures. Additional research beyond Phase II of Project 9-36 will clearly be needed
to adequately address long-term aging. While Project 9-36 is charged with developing a work
plan to extend the SAFT to long-term aging, other issues associated with long-term aging should
also be considered by the NCHRP. Based on work completed during the Selection Study, it
appears that long-term aging in the SAFT will likely take significantly longer (approximately 40
hours) than the PAV aging time of 20 hours. Therefore, the PAV may remain the long-term
aging test of choice for specification testing. Future research into long-term aging should
include work with the PAV in addition to the Long-Term SAFT and other alternatives that may
be identified in the future. This work should generally be directed at establishing operating
conditions for simulated laboratory aging tests that reproduce the degree of aging that occurs in
field pavements for typical binders. Mirza and Witczak’s Global aging model, while highly

B-37
empirical, provides an estimate of site specific aging based on an analysis of historical data.
Work in Project 9-23 that was reviewed during Phase I shows that the PAV operated at 100 °C
for 20 hours under 2.1 MPa air pressure produces aged binders with viscosities that are in
reasonable agreement with this model for a time of 10 years and moderate mean annual air
temperature conditions. Based on this finding the potential for the development of a long-term
aging procedure that represents a reasonable period of service in the field is encouraging.
8.0 VISCOSITY EFFECTS EXPERIMENT TEST DATA
Table 13. DSR Frequency Sweep Data for the PG 58-28 Binder.
Replicate Condition 0.10 0.22 0.46 1.00 2.15 4.64 10.00 21.54 46.41 100.00G*, Pa 23 48 105 225 477 1002 2073 4227 8505 16730
δ 89.6 88.6 89.2 88.3 87.3 86.1 84.7 83.4 82.0 80.7G*, Pa 10160 19760 37520 70580 130300 238400 430700 768200 1345000 2300000
δ 78.3 76.4 74.5 73.1 71.6 70.1 68.7 67.1 65.3 63.4G*, Pa 23 49 104 222 475 993 2054 4190 8431 16590
δ 91.2 91.3 89.4 88.3 87.5 86.1 84.7 83.4 82.0 80.7G*, Pa 10510 20410 38760 73060 134900 245500 441900 785200 1374000 2346000
δ 78.1 76.4 74.7 73.0 71.6 70.0 68.4 66.9 65.2 63.3G*, Pa 22 50 105 225 476 998 2063 4203 8447 16600
δ 88.3 89.2 89.0 88.4 87.3 86.0 84.7 83.3 81.9 80.6G*, Pa 10290 19940 37690 70690 131900 238700 429900 764300 1335000 2276000
δ 78.5 76.2 74.2 72.6 71.4 69.8 68.4 66.9 65.1 63.2G*, Pa 106 210 436 895 1809 3618 7105 13700 26020 48500
δ 82.5 84.6 84.5 83.6 82.2 80.4 78.5 76.7 75.0 73.5G*, Pa 52220 92570 162300 280200 478500 804100 1334000 2186000 3513000 5521000
δ 69.8 66.8 65.1 63.9 62.0 60.6 58.7 56.9 54.9 53.0G*, Pa 89 192 400 831 1693 3421 6758 13070 24880 46500
δ 88.7 87.8 85.8 84.8 83.2 80.7 78.9 77.0 75.3 73.8G*, Pa 50730 87900 154200 265800 454800 766100 1272000 2085000 3349000 5274000
δ 68.6 66.8 65.1 63.5 62.0 60.3 58.7 56.9 55.0 53.0G*, Pa 89 193 413 855 1742 3507 6919 13400 25500 47630
δ 89.5 87.2 86.0 84.9 82.9 80.9 78.9 77.0 75.3 73.7G*, Pa 46740 82460 145500 249200 424300 712400 1180000 1925000 3090000 4853000
δ 68.4 66.3 64.9 63.2 61.5 60.0 58.3 56.6 54.8 52.7G*, Pa 81 174 367 773 1581 3201 6356 12380 23730 44580
δ 88.0 88.6 87.3 85.4 83.5 81.6 79.6 77.7 76.0 74.5G*, Pa 47110 83880 147000 256900 436800 741400 1235000 2026000 3268000 5155000
δ 69.6 67.2 65.8 63.9 62.3 60.7 58.9 57.2 55.2 53.2G*, Pa 86 175 366 763 1546 3121 6187 12030 23020 43240
δ 88.3 86.7 85.3 83.7 82.8 81.2 79.3 77.6 75.8 74.3G*, Pa 40900 73260 129300 222900 382100 643800 1070000 1754000 2825000 4460000
δ 69.2 67.1 65.3 63.9 62.2 60.7 58.9 57.1 55.3 53.3G*, Pa 75 160 340 705 1459 2953 5861 11480 22040 41500
δ 88.5 86.8 86.9 85.2 83.7 81.8 79.9 78.0 76.2 74.7G*, Pa 52670 93670 164600 285500 486900 814000 1334000 2134000 3337000 4947000
δ 69.3 67.7 66.0 64.6 62.7 61.4 60.1 58.9 57.7 56.8
1
RTFOT
RTFOT
RTFOT
3
1
3
2
2
3
RTFOT/PAV
RTFOT/PAV
RTFOT/PAV
RTFOT/LTSAFT
RTFOT/LTSAFT
RTFOT/LTSAFT
1
2
60
25
Temp, C Property
60
25
25
60
25
60
25
Freq.(rad/s)
60
25
60
60
25
60
25
60
25

B-38
Table 14. DSR Frequency Sweep Data for the PG 82-22 Binder.
Replicate Condition 0.10 0.22 0.46 1.00 2.15 4.64 10.00 21.54 46.41 100.00G*, Pa 1036 1709 2788 4511 7375 12060 19830 32900 55120 93140
δ 58.2 58.1 57.8 57.8 58.0 58.5 59.3 60.4 61.5 62.7G*, Pa 103300 171300 285300 471600 782100 1282000 2078000 3317000 5206000 7920000
δ 58.7 59.0 59.2 59.1 58.4 57.7 56.5 55.1 53.5 51.7G*, Pa 1036 1709 2788 4511 7375 12060 19830 32900 55120 93140
δ 58.2 58.1 57.8 57.8 58.0 58.5 59.3 60.4 61.5 62.7G*, Pa 89360 148800 249500 411100 681000 1117000 1811000 2889000 4517000 6839000
δ 59.0 59.2 59.1 59.1 58.4 57.6 56.4 55.1 53.5 51.8G*, Pa 975 1595 2637 4278 7032 11520 18970 31530 52860 89420
δ 59.2 58.8 58.1 58.2 58.2 58.8 59.6 60.5 61.7 62.8G*, Pa 104400 172000 287500 477600 791800 1301000 2111000 3378000 5308000 8098000
δ 59.1 59.6 59.3 59.2 58.5 57.7 56.5 55.1 53.4 51.6G*, Pa 3614 5581 8680 13420 20920 32780 51730 82590 133500 217700
δ 51.7 51.7 52.0 52.3 53.0 53.7 54.7 55.8 56.9 57.7G*, Pa 357500 568000 902300 1410000 2184000 3334000 5018000 7451000 10890000 15620000
δ 54.0 53.5 52.7 51.6 50.3 48.9 47.4 45.7 44.0 42.1G*, Pa 4041 6203 9629 15010 23330 36460 57510 91830 148500 242400
δ 51.7 51.7 52.4 52.1 52.9 53.6 54.7 55.7 56.9 57.6G*, Pa 378700 602300 941600 1471000 2255000 3423000 5136000 7597000 11070000 15820000
δ 54.1 53.0 52.3 51.2 49.9 48.6 47.2 45.6 43.9 42.1G*, Pa 4395 6739 10420 15990 24900 38920 61370 97710 157300 255700
δ 51.6 51.2 51.4 52.3 52.5 53.4 54.4 55.5 56.6 57.2G*, Pa 409200 639000 998000 1554000 2374000 3591000 5358000 7888000 11440000 16290000
δ 53.2 52.4 52.3 50.4 49.3 47.9 46.4 44.7 43.1 41.2G*, Pa 5248 8124 12570 19410 30210 47150 74360 118300 190600 309100
δ 52.3 51.9 51.7 52.2 52.7 53.4 54.4 55.4 56.2 56.7G*, Pa 439100 704900 1098000 1707000 2586000 3919000 5827000 8547000 12350000 17500000
δ 54.1 52.7 52.2 50.4 48.7 47.6 46.0 44.4 42.6 40.7G*, Pa 4157 6435 10040 15570 24410 38400 60990 97320 157400 256900
δ 52.9 52.9 52.5 52.9 53.2 54.1 55.0 56.0 56.9 57.5G*, Pa 491300 776300 1208000 1835000 2783000 4148000 6110000 8848000 12630000 17710000
δ 53.3 52.2 50.4 49.3 47.7 46.2 44.6 43.0 41.3 39.4G*, Pa 3951 6112 9533 15030 23530 37100 58910 94480 153300 251300
δ 53.0 53.0 53.6 53.0 53.6 54.3 55.4 56.4 57.2 57.9G*, Pa 435200 702200 1098000 1717000 2629000 3989000 5960000 8772000 12720000 18090000
δ 54.2 53.2 52.8 51.0 49.7 48.1 46.5 44.8 43.0 41.0
Freq.(rad/s)
60
25
60
60
25
60
25
60
25
25
60
25
60
25
60
25
Temp, C Property
60
25
2
3
RTFOT/PAV
RTFOT/PAV
RTFOT/PAV
RTFOT/LTSAFT
RTFOT/LTSAFT
RTFOT/LTSAFT
1
2
3
1
3
2
1
RTFOT
RTFOT
RTFOT
B-39
Table 15. BBR Data at –12 °C for PG 58-28 Binder.
S, MPa m S, MPa m S, MPa m8 114 0.438 178 0.365 164 0.358
15 85.0 0.472 140 0.388 129 0.38630 60.7 0.510 106 0.414 97.8 0.41660 42.2 0.548 79.1 0.440 72.7 0.447
120 28.4 0.585 57.7 0.466 52.8 0.478240 18.7 0.623 41.4 0.492 37.4 0.508
8 114 0.444 166 0.358 184 0.36915 85.6 0.476 132 0.383 145 0.39630 60.8 0.512 99.7 0.412 109 0.42760 42.1 0.547 74.4 0.440 80.3 0.457
120 28.5 0.583 54.4 0.468 57.8 0.488240 18.8 0.618 38.8 0.497 40.7 0.518
8 118 0.440 158 0.336 177 0.35615 88.5 0.472 127 0.362 140 0.38130 63.1 0.507 97.6 0.391 106 0.40960 43.9 0.542 73.6 0.420 79.5 0.436
120 29.8 0.577 54.6 0.448 58.2 0.464240 19.7 0.612 39.6 0.477 41.7 0.492
8 114 0.428 157 0.348 179 0.35715 86.5 0.459 125 0.371 142 0.38030 62.2 0.494 95.8 0.395 108 0.40660 43.4 0.529 72.5 0.420 80.8 0.432
120 29.8 0.565 53.8 0.444 59.5 0.458240 19.9 0.600 39 0.469 42.8 0.483
8 117 0.434 160 0.346 169 0.35815 88.0 0.469 127 0.371 134 0.38430 62.7 0.508 97.6 0.399 102 0.41460 43.7 0.546 73.5 0.426 75.4 0.443
120 29.6 0.585 54.1 0.454 54.9 0.473240 19.4 0.624 39.1 0.482 39.2 0.502
8 114 0.443 180 0.353 165 0.35715 85.8 0.472 142 0.379 130 0.38330 61.1 0.505 109 0.409 99.1 0.41260 42.5 0.537 80.9 0.438 73.8 0.441
120 28.9 0.569 59.1 0.468 53.8 0.471240 19.4 0.601 42.3 0.497 38.4 0.500
1 1
1 2
2 1
2 2
3 1
3 2
RTFO/PAV RTFO/LTSAFTReplicate Beam Time, s
RTFO
B-40
Table 16. BBR Data at –12 °C for PG 82-22 Binder.
S, MPa m S, MPa m S, MPa m8 254 0.318 377 0.259 336 0.256
15 206 0.345 318 0.283 284 0.28130 161 0.375 259 0.309 232 0.30860 123 0.405 207 0.336 185 0.335
120 91.7 0.435 163 0.362 146 0.362240 66.9 0.466 125 0.389 112 0.389
8 260 0.310 362 0.258 342 0.25015 212 0.341 305 0.281 289 0.27430 165 0.376 249 0.306 237 0.30060 126 0.411 200 0.332 191 0.326
120 93.4 0.446 157 0.357 151 0.353240 67.7 0.481 122 0.382 117 0.379
8 225 0.295 334 0.255 380 0.24815 185 0.327 282 0.277 323 0.27230 145 0.363 232 0.301 265 0.29860 112 0.399 186 0.326 214 0.324
120 83.6 0.435 148 0.350 169 0.350240 61.1 0.471 115 0.375 131 0.376
8 241 0.323 346 0.262 404 0.24615 195 0.351 292 0.283 343 0.26830 151 0.382 238 0.307 283 0.29260 115 0.412 191 0.330 229 0.316
120 85.3 0.443 150 0.354 183 0.340240 62.0 0.474 117 0.378 143 0.364
8 258 0.315 326 0.257 376 0.25015 209 0.347 275 0.282 318 0.27430 162 0.382 224 0.309 261 0.30060 124 0.416 180 0.337 210 0.326
120 91.3 0.451 141 0.364 166 0.353240 65.9 0.486 108 0.392 129 0.379
8 244 0.325 328 0.274 360 0.25715 197 0.354 275 0.297 303 0.27830 152 0.386 221 0.322 248 0.30360 115 0.418 176 0.347 200 0.327
120 85.5 0.449 137 0.372 158 0.351240 61.9 0.481 105 0.398 123 0.375
1 1
1 2
2 1
2 2
3 1
3 2
RTFO RTFO/PAV RTFO/LTSAFTReplicate Beam Time, s


