Appendix C-2 - Energy Efficiency Analysis Summary Program Vendor Program Name Program Code Target Market Net Busbar MWh Net At-the- Meter MWh Program Cost (no adders) Utility Cost Test (UCT) (Discount Rate = 0) Cost of Conserved Energy ("CCE") [$/kWh] Units of 2016 2016 2016 w/adders no adders w/adders w/adders A B Measure C D E F G H I Previously Approved Programs ComEd Programs Home Energy Reports HER Residential Customers 1,500,000 390,233 351,498 27,707,074 $ Small Business Energy Services SmallBiz Small Commercial Sites 16,000 185,403 167,000 82,470,732 $ LED Streetlighting Street Small Commercial Fixtures 20,000 12,156 10,949 12,663,103 $ Residential Lighting ResLtg Residential Lamps 9,666,000 241,541 217,565 77,270,755 $ Third Party Programs Accelerate Group CUB Energy Saver Accelerate Residential Web Enrollments 10,000 19,884 17,910 1,375,000 $ PECI Small Commercial HVAC Tune-up PECI Small Commercial Tons cooling 82,333 12,170 10,962 5,817,777 $ CNT Retrofit Chicago Residential CNT Residential Sites 866 2,029 1,828 1,124,952 $ Shelton Solutions Energy Stewards Shelton Residential Participants 1,700 944 850 277,000 $ OneChange Door-to-Door Light Bulbs OneChange Residential Kits 25,000 1,255 1,130 2,153,400 $ National Theatre for Children Middle School take-home kits NTC Residential Kits 10,800 1,354 1,220 1,304,317 $ CLEAResult Direct Install - Schools CLEAR Small Commercial Schools 163 4,785 4,310 2,148,292 $ Matrix Energy Services Direct Install - Schools Matrix1 Small Commercial Schools 85 6,156 5,545 1,978,350 $ Matrix Energy Services Demand Control Ventilation Matrix2 Small Commercial Businesses 413 6,125 5,517 2,531,072 $ Sodexo Inc Demand Control Ventilation Sodexo Small Commercial Businesses 800 5,658 5,096 1,713,040 $ Weidt Group New Construction Weidt Small Commercial Businesses 50 4,677 4,213 1,749,776 $ Total 863,416 777,712 208,429,393 $ Newly-Submitted Programs ComEd Programs Total - ComEd Programs - - - Third Party Programs (Vendor listed) CLEAResult Luminaire-Level Lighting Control CLEAResult-LLLC Small Commercial Facilities 632 19,113 17,216 5,101,484 $ 4.39 4.81 9.82 0.030 $ CLEAResult Community-based CFL Distribution CLEAResult - CFL Dist Residential Bulbs 800,000 17,566 15,822 1,240,000 $ 3.01 3.36 3.36 0.019 $ Elevate Energy Assisted & Sr. Housing Elevate Small Commercial Housing Units 1,923 1,319 1,188 625,928 $ 1.60 1.74 3.83 0.069 $ Franklin Energy Rural Small Biz EE Kits Franklin Small Commercial Kits 3,750 1,078 971 582,970 $ 4.54 5.26 2.59 0.102 $ GDS Associates Agricultural EE GDS - Ag Small Commercial Measures 2,931 1,354 1,220 366,613 $ 1.64 1.78 3.01 0.043 $ GDS Associates Lit Signage GDS - Signage Small Commercial Measures 14,147 16,236 14,624 3,700,000 $ 3.06 3.97 2.12 0.031 $ MEEA Efficient Products MEEA Small Commercial Measures 7,120 3,711 3,343 778,179 $ 6.24 7.66 4.48 0.039 $ Power TakeOff Monitoring-based Commissioning PowerTO Small Commercial Measures 2,250 3,008 2,709 1,553,800 $ 1.67 1.83 2.39 0.082 $ SEDAC Enhanced Building Optimization SEDAC Small Commercial Buildings 200 12,274 11,056 2,500,000 $ 2.68 2.89 4.77 0.040 $ UIC-ERC Low-Income Kits ERC-Kits Residential Kits 15,000 4,555 4,103 1,439,246 $ 1.85 2.11 1.36 0.075 $ UIC-ERC Low-Income Multi-Family ERC Residential Measures 311,575 7,239 6,520 2,167,622 $ 4.44 5.40 4.03 0.047 $ Total - Third Party Programs 87,453 78,772 20,055,842 $ Combined Total 87,453 78,772 20,055,842 $ Total Passing UCT(0) 56,666 78,772 20,055,842 $ Number of Units TRC Test
Transcript
Appendix C-2 - Energy Efficiency Analysis Summary
Program Vendor Program Name Program Code Target MarketNet Busbar
MWhNet At-the-
Meter MWhProgram Cost (no
adders)
Utility Cost Test (UCT)
(Discount Rate = 0)
Cost of Conserved
Energy ("CCE") [$/kWh]
Units of 2016 2016 2016 w/adders no adders w/adders w/adders
A B Measure C D E F G H I Previously Approved ProgramsComEd Programs
Home Energy Reports HER Residential Customers 1,500,000 390,233 351,498 27,707,074$ Small Business Energy Services SmallBiz Small Commercial Sites 16,000 185,403 167,000 82,470,732$ LED Streetlighting Street Small Commercial Fixtures 20,000 12,156 10,949 12,663,103$ Residential Lighting ResLtg Residential Lamps 9,666,000 241,541 217,565 77,270,755$
Third Party ProgramsAccelerate Group CUB Energy Saver Accelerate Residential Web Enrollments 10,000 19,884 17,910 1,375,000$ PECI Small Commercial HVAC Tune-up PECI Small Commercial Tons cooling 82,333 12,170 10,962 5,817,777$ CNT Retrofit Chicago Residential CNT Residential Sites 866 2,029 1,828 1,124,952$ Shelton Solutions Energy Stewards Shelton Residential Participants 1,700 944 850 277,000$ OneChange Door-to-Door Light Bulbs OneChange Residential Kits 25,000 1,255 1,130 2,153,400$ National Theatre for Children Middle School take-home kits NTC Residential Kits 10,800 1,354 1,220 1,304,317$ CLEAResult Direct Install - Schools CLEAR Small Commercial Schools 163 4,785 4,310 2,148,292$ Matrix Energy Services Direct Install - Schools Matrix1 Small Commercial Schools 85 6,156 5,545 1,978,350$ Matrix Energy Services Demand Control Ventilation Matrix2 Small Commercial Businesses 413 6,125 5,517 2,531,072$ Sodexo Inc Demand Control Ventilation Sodexo Small Commercial Businesses 800 5,658 5,096 1,713,040$ Weidt Group New Construction Weidt Small Commercial Businesses 50 4,677 4,213 1,749,776$ Total 863,416 777,712 208,429,393$
Newly-Submitted ProgramsComEd Programs
Total - ComEd Programs - - - Third Party Programs (Vendor listed)CLEAResult Luminaire-Level Lighting Control CLEAResult-LLLC Small Commercial Facilities 632 19,113 17,216 5,101,484$ 4.39 4.81 9.82 0.030$ CLEAResult Community-based CFL Distribution CLEAResult - CFL Dist Residential Bulbs 800,000 17,566 15,822 1,240,000$ 3.01 3.36 3.36 0.019$ Elevate Energy Assisted & Sr. Housing Elevate Small Commercial Housing Units 1,923 1,319 1,188 625,928$ 1.60 1.74 3.83 0.069$ Franklin Energy Rural Small Biz EE Kits Franklin Small Commercial Kits 3,750 1,078 971 582,970$ 4.54 5.26 2.59 0.102$ GDS Associates Agricultural EE GDS - Ag Small Commercial Measures 2,931 1,354 1,220 366,613$ 1.64 1.78 3.01 0.043$ GDS Associates Lit Signage GDS - Signage Small Commercial Measures 14,147 16,236 14,624 3,700,000$ 3.06 3.97 2.12 0.031$ MEEA Efficient Products MEEA Small Commercial Measures 7,120 3,711 3,343 778,179$ 6.24 7.66 4.48 0.039$ Power TakeOff Monitoring-based Commissioning PowerTO Small Commercial Measures 2,250 3,008 2,709 1,553,800$ 1.67 1.83 2.39 0.082$ SEDAC Enhanced Building Optimization SEDAC Small Commercial Buildings 200 12,274 11,056 2,500,000$ 2.68 2.89 4.77 0.040$ UIC-ERC Low-Income Kits ERC-Kits Residential Kits 15,000 4,555 4,103 1,439,246$ 1.85 2.11 1.36 0.075$ UIC-ERC Low-Income Multi-Family ERC Residential Measures 311,575 7,239 6,520 2,167,622$ 4.44 5.40 4.03 0.047$ Total - Third Party Programs 87,453 78,772 20,055,842$ Combined Total 87,453 78,772 20,055,842$
Total Passing UCT(0) 56,666 78,772 20,055,842$
Number of Units TRC Test
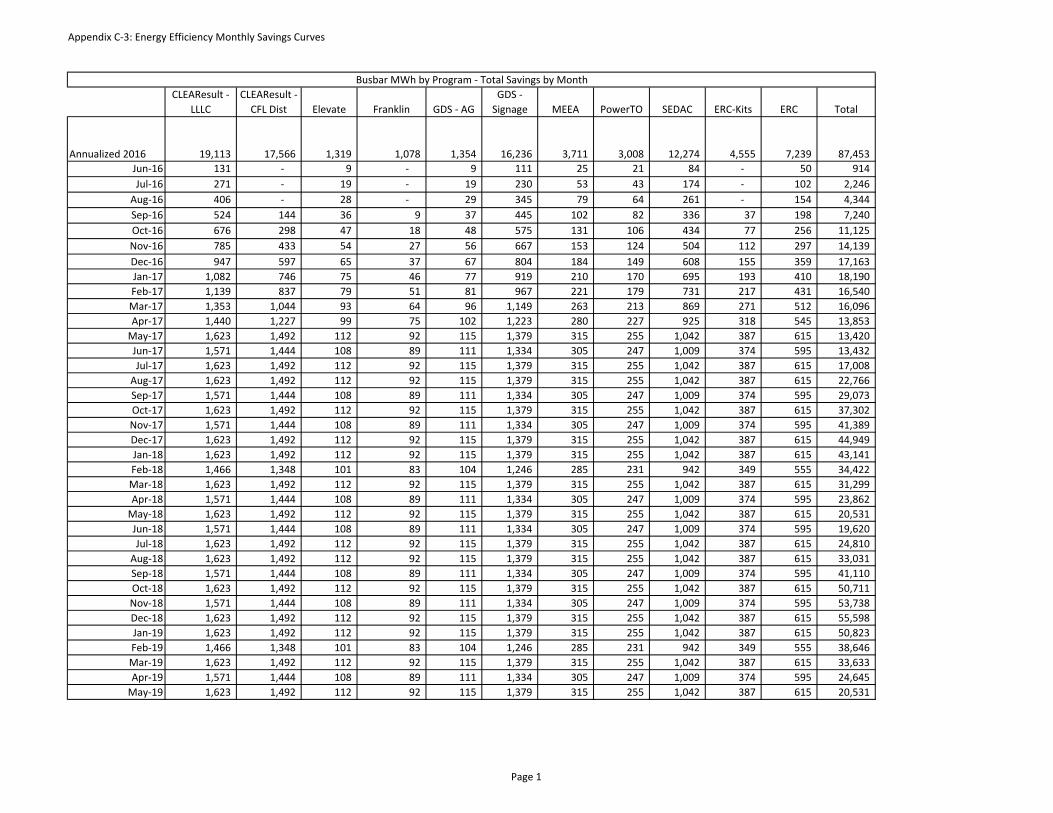
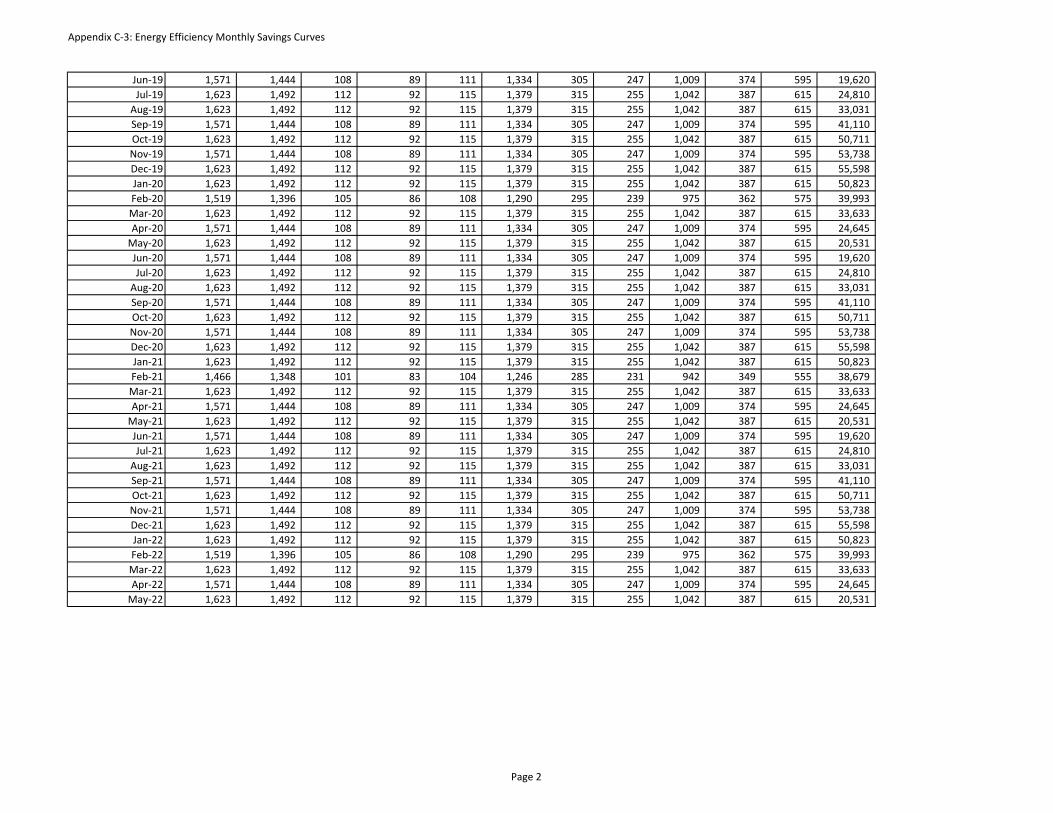
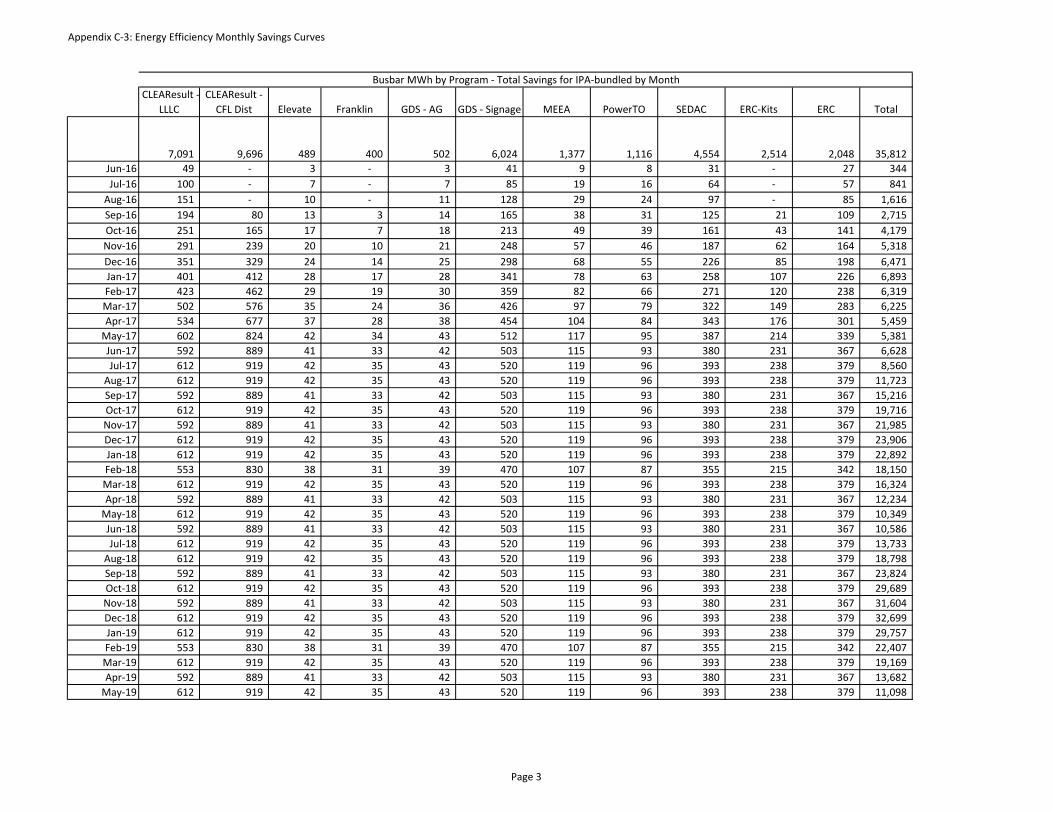
Appendix C‐3: Energy Efficiency Monthly Savings Curves
CLEAResult ‐ LLLC
CLEAResult ‐ CFL Dist Elevate Franklin GDS ‐ AG
GDS ‐ Signage MEEA PowerTO SEDAC ERC‐Kits ERC Total
Program Name CLEAResult – Luminaire Level Lighting Control (LLLC) Program
Program Description
CLEAResult’s proposed Luminaire Level Lighting Control (LLLC) Program will move the small commercial market toward advanced LED lighting and lighting controls solutions. The current ComEd advanced lighting controls offerings are very customized, and the specifications and requirements may be difficult for small commercial customers to navigate. LLLCs, a subset of advanced lighting controls, can offer a more simplified and accessible cost and level of functionality that is more appropriate for the small commercial market. The measures are particularly well-suited to the small commercial market if the process is simplified, streamlined and optimized for the trade allies who serve the market.
Program Duration June 2016 – May 2017
Collaboration None
Delivery Strategy CLEAResult will provide each trade ally with a customized version of an internally developed, tablet-based field assessment software, and one-one-one training on this software. Trade allies will use this software to support customers through a streamlined program participation process that includes:
• Performing walk-through facility assessments • Educating the customer about, and making recommendations for, LLLC systems • Generating a project proposal • Securing the customer’s commitment by obtaining their signature on the project proposal
Target Market The LLLCs Program will target a subset of ComEd’s small commercial and industrial (C&I) customers with a peak demand of 100kW or below. Offices and warehouses are the principal target facility types that make up that subset since CLEAResult are the best candidates for LLLCs based upon their occupancy patterns.
Marketing Strategy Using data analytics, CLEAResult will identify the geographies and market segments in ComEd’s service territories that contain the small commercial customers most likely to participate in the LLLC Program. Then, CLEAResult will provide their network of local trade allies with marketing and sales collateral to help them promote the program. CLEAResult will also conduct intensive training that will equip these trade allies to enroll customers in the program, perform energy assessments and properly install and commission the measures in customers’ facilities. CLEAResult will also work through the trade allies to provide customers documentation and training on the capabilities, operation and maintenance of the systems. Trade ally-specific training will include energy efficiency sales strategies and encourage them to use their existing relationships and knowledge of the local small commercial market to recruit participants. CLEAResult will work closely with local trade allies and the lighting supply chain that supports them to market this program to small and medium commercial customers. CLEAResult will assist trade allies using data analytics and market segmentation to identify eligible customers that are highly likely to participate in the program. Marketing and outreach will primarily take place through a qualified trade ally network and will be supplemented by dedicated outreach staff support.
Eligible Measures The proposed measures for the LLLC Program consist primarily of advanced and underutilized lighting and integrated lighting controls measures. These LLLC systems are true advanced lighting control systems (ALCS) that share the following characteristics:
1. Single multi-type sensor with both occupancy and photocell control 2. Distributed intelligence via an onboard controller 3. Continuous dimming capabilities, 4. Networking capabilities (wired or wireless) to facilitate 5. All proposed LLLC systems will be LED-based
Program Targets Participation Levels PY9 Total
No. of Facilities 632 632
Annual Savings Targets
PY9 Total
Gross MWh 18,122 18,122
Net MWh 17,216 17,216
Gross MW 5.66 5.66
Net MW 5.38 5.38
Program Budget
PY9 Total
Administration $450,838 $450,838
Implementation $194,624 $194,624
Incentives $3,938,315 $3,938,315
Marketing and Other $517,707 $517,707
Total $5,101,484 $5,101,484
Cost-Effectiveness Results
Test Results
TRC 4.81
UCT 10.95
CCE $0.027
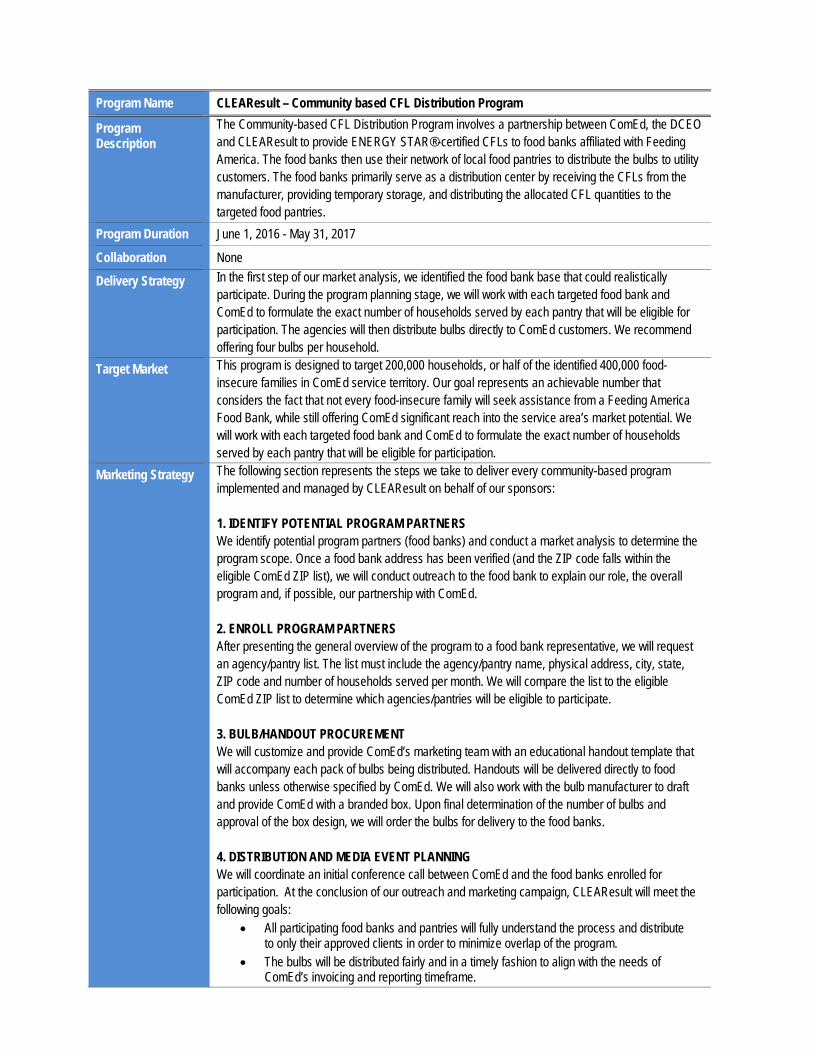
Program Name CLEAResult – Community based CFL Distribution Program
Program Description
The Community-based CFL Distribution Program involves a partnership between ComEd, the DCEO and CLEAResult to provide ENERGY STAR®-certified CFLs to food banks affiliated with Feeding America. The food banks then use their network of local food pantries to distribute the bulbs to utility customers. The food banks primarily serve as a distribution center by receiving the CFLs from the manufacturer, providing temporary storage, and distributing the allocated CFL quantities to the targeted food pantries.
Program Duration June 1, 2016 - May 31, 2017
Collaboration None
Delivery Strategy In the first step of our market analysis, we identified the food bank base that could realistically participate. During the program planning stage, we will work with each targeted food bank and ComEd to formulate the exact number of households served by each pantry that will be eligible for participation. The agencies will then distribute bulbs directly to ComEd customers. We recommend offering four bulbs per household.
Target Market
This program is designed to target 200,000 households, or half of the identified 400,000 food-insecure families in ComEd service territory. Our goal represents an achievable number that considers the fact that not every food-insecure family will seek assistance from a Feeding America Food Bank, while still offering ComEd significant reach into the service area’s market potential. We will work with each targeted food bank and ComEd to formulate the exact number of households served by each pantry that will be eligible for participation.
Marketing Strategy The following section represents the steps we take to deliver every community-based program implemented and managed by CLEAResult on behalf of our sponsors: 1. IDENTIFY POTENTIAL PROGRAM PARTNERS We identify potential program partners (food banks) and conduct a market analysis to determine the program scope. Once a food bank address has been verified (and the ZIP code falls within the eligible ComEd ZIP list), we will conduct outreach to the food bank to explain our role, the overall program and, if possible, our partnership with ComEd. 2. ENROLL PROGRAM PARTNERS After presenting the general overview of the program to a food bank representative, we will request an agency/pantry list. The list must include the agency/pantry name, physical address, city, state, ZIP code and number of households served per month. We will compare the list to the eligible ComEd ZIP list to determine which agencies/pantries will be eligible to participate. 3. BULB/HANDOUT PROCUREMENT We will customize and provide ComEd’s marketing team with an educational handout template that will accompany each pack of bulbs being distributed. Handouts will be delivered directly to food banks unless otherwise specified by ComEd. We will also work with the bulb manufacturer to draft and provide ComEd with a branded box. Upon final determination of the number of bulbs and approval of the box design, we will order the bulbs for delivery to the food banks. 4. DISTRIBUTION AND MEDIA EVENT PLANNING We will coordinate an initial conference call between ComEd and the food banks enrolled for participation. At the conclusion of our outreach and marketing campaign, CLEAResult will meet the following goals:
• All participating food banks and pantries will fully understand the process and distribute to only their approved clients in order to minimize overlap of the program.
• The bulbs will be distributed fairly and in a timely fashion to align with the needs of ComEd’s invoicing and reporting timeframe.
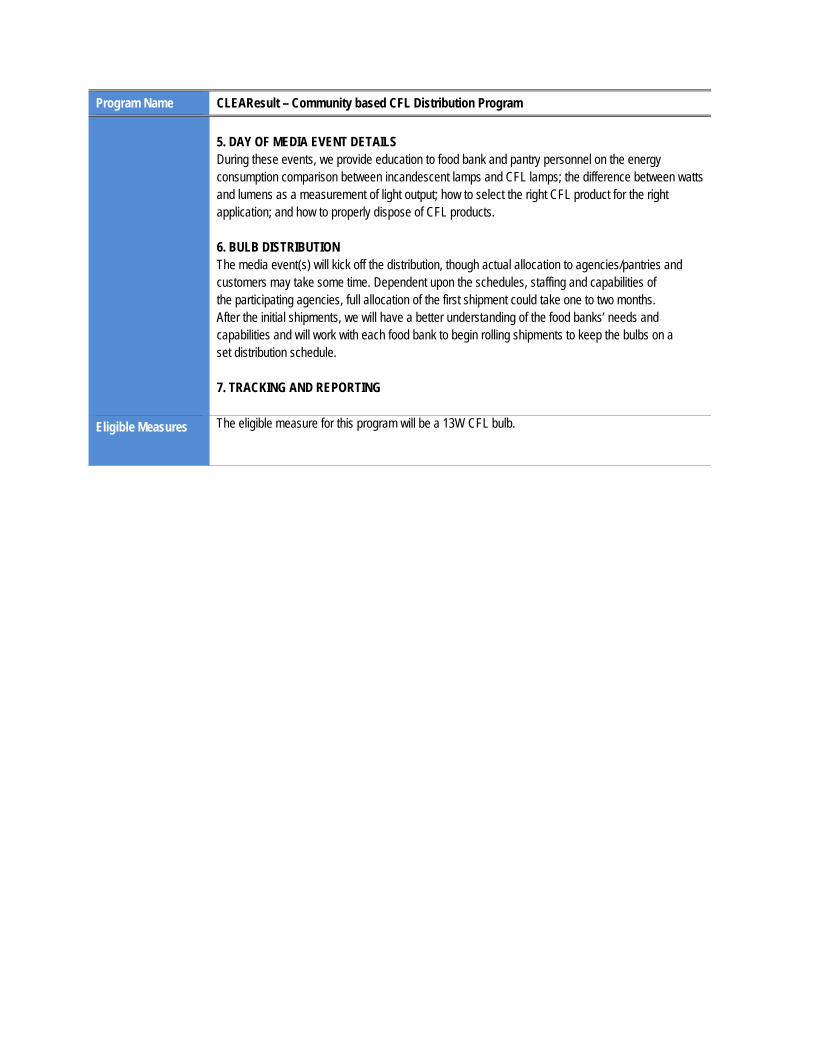
Program Name CLEAResult – Community based CFL Distribution Program 5. DAY OF MEDIA EVENT DETAILS During these events, we provide education to food bank and pantry personnel on the energy consumption comparison between incandescent lamps and CFL lamps; the difference between watts and lumens as a measurement of light output; how to select the right CFL product for the right application; and how to properly dispose of CFL products. 6. BULB DISTRIBUTION The media event(s) will kick off the distribution, though actual allocation to agencies/pantries and customers may take some time. Dependent upon the schedules, staffing and capabilities of the participating agencies, full allocation of the first shipment could take one to two months. After the initial shipments, we will have a better understanding of the food banks’ needs and capabilities and will work with each food bank to begin rolling shipments to keep the bulbs on a set distribution schedule. 7. TRACKING AND REPORTING
Eligible Measures The eligible measure for this program will be a 13W CFL bulb.
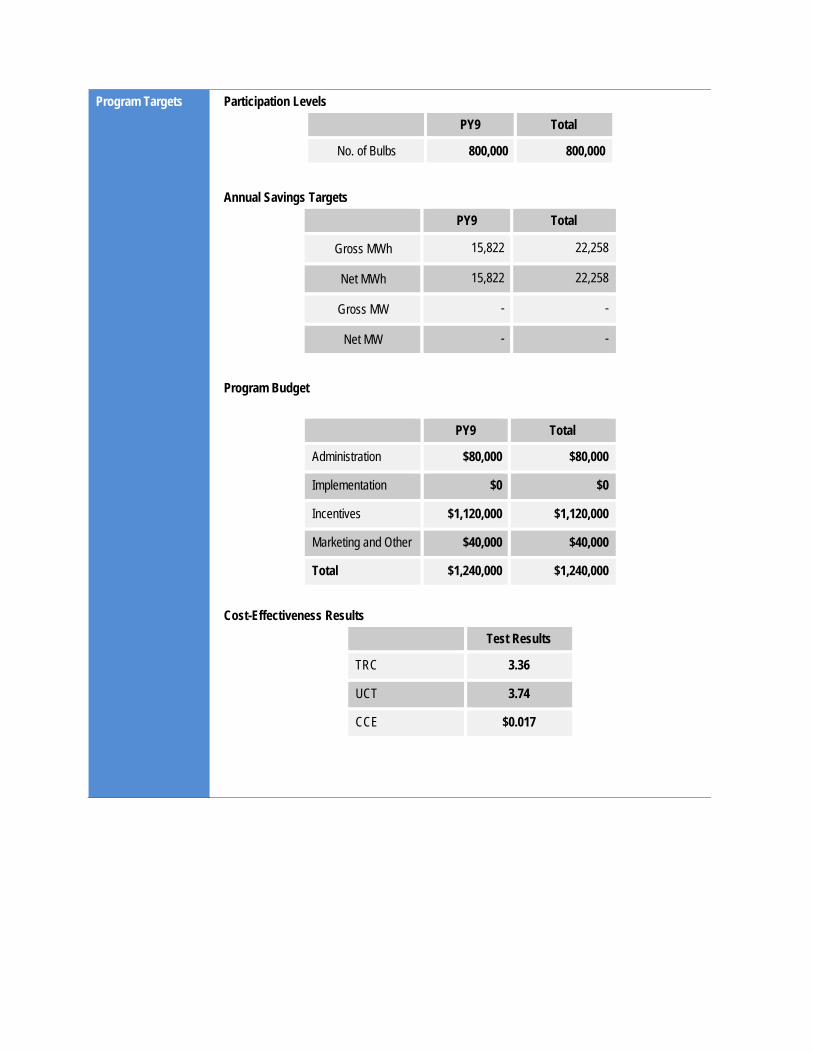
Program Targets Participation Levels PY9 Total
No. of Bulbs 800,000 800,000
Annual Savings Targets
PY9 Total
Gross MWh 15,822 22,258
Net MWh 15,822 22,258
Gross MW - -
Net MW - -
Program Budget
PY9 Total
Administration $80,000 $80,000
Implementation $0 $0
Incentives $1,120,000 $1,120,000
Marketing and Other $40,000 $40,000
Total $1,240,000 $1,240,000
Cost-Effectiveness Results
Test Results
TRC 3.36
UCT 3.74
CCE $0.017
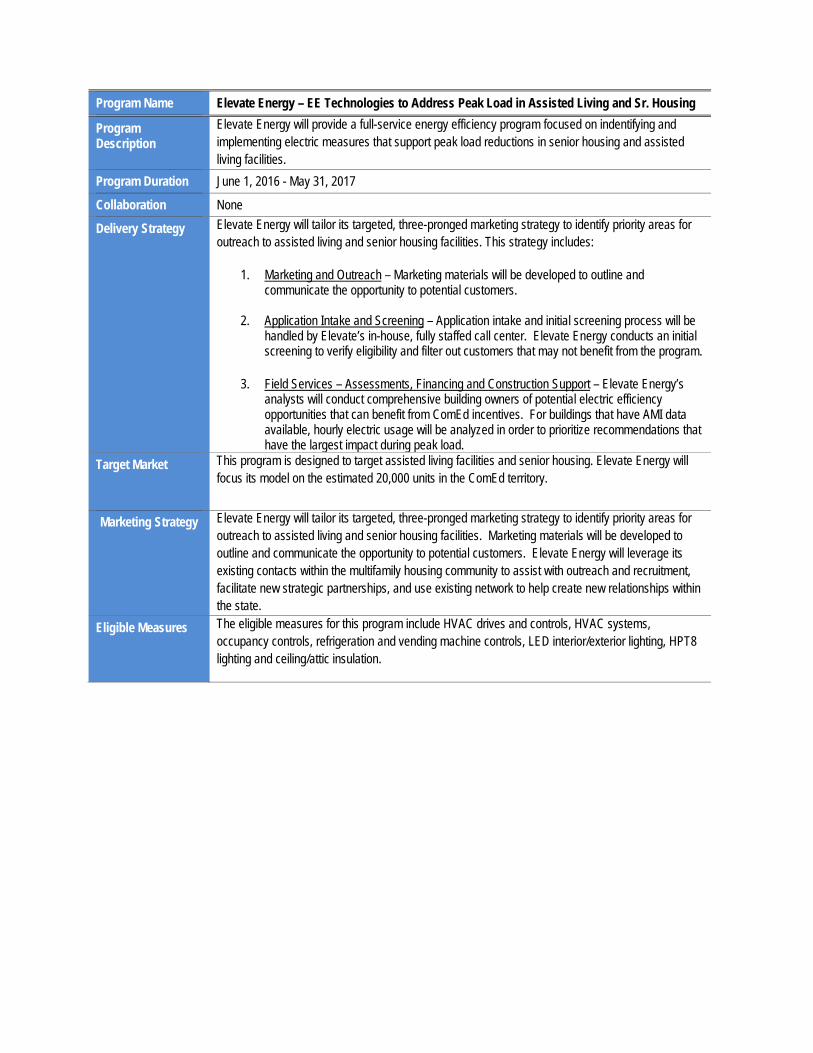
Program Name Elevate Energy – EE Technologies to Address Peak Load in Assisted Living and Sr. Housing
Program Description
Elevate Energy will provide a full-service energy efficiency program focused on indentifying and implementing electric measures that support peak load reductions in senior housing and assisted living facilities.
Program Duration June 1, 2016 - May 31, 2017
Collaboration None
Delivery Strategy Elevate Energy will tailor its targeted, three-pronged marketing strategy to identify priority areas for outreach to assisted living and senior housing facilities. This strategy includes:
1. Marketing and Outreach – Marketing materials will be developed to outline and
communicate the opportunity to potential customers.
2. Application Intake and Screening – Application intake and initial screening process will be handled by Elevate’s in-house, fully staffed call center. Elevate Energy conducts an initial screening to verify eligibility and filter out customers that may not benefit from the program.
3. Field Services – Assessments, Financing and Construction Support – Elevate Energy’s
analysts will conduct comprehensive building owners of potential electric efficiency opportunities that can benefit from ComEd incentives. For buildings that have AMI data available, hourly electric usage will be analyzed in order to prioritize recommendations that have the largest impact during peak load.
Target Market
This program is designed to target assisted living facilities and senior housing. Elevate Energy will focus its model on the estimated 20,000 units in the ComEd territory.
Marketing Strategy Elevate Energy will tailor its targeted, three-pronged marketing strategy to identify priority areas for outreach to assisted living and senior housing facilities. Marketing materials will be developed to outline and communicate the opportunity to potential customers. Elevate Energy will leverage its existing contacts within the multifamily housing community to assist with outreach and recruitment, facilitate new strategic partnerships, and use existing network to help create new relationships within the state.
Eligible Measures The eligible measures for this program include HVAC drives and controls, HVAC systems, occupancy controls, refrigeration and vending machine controls, LED interior/exterior lighting, HPT8 lighting and ceiling/attic insulation.
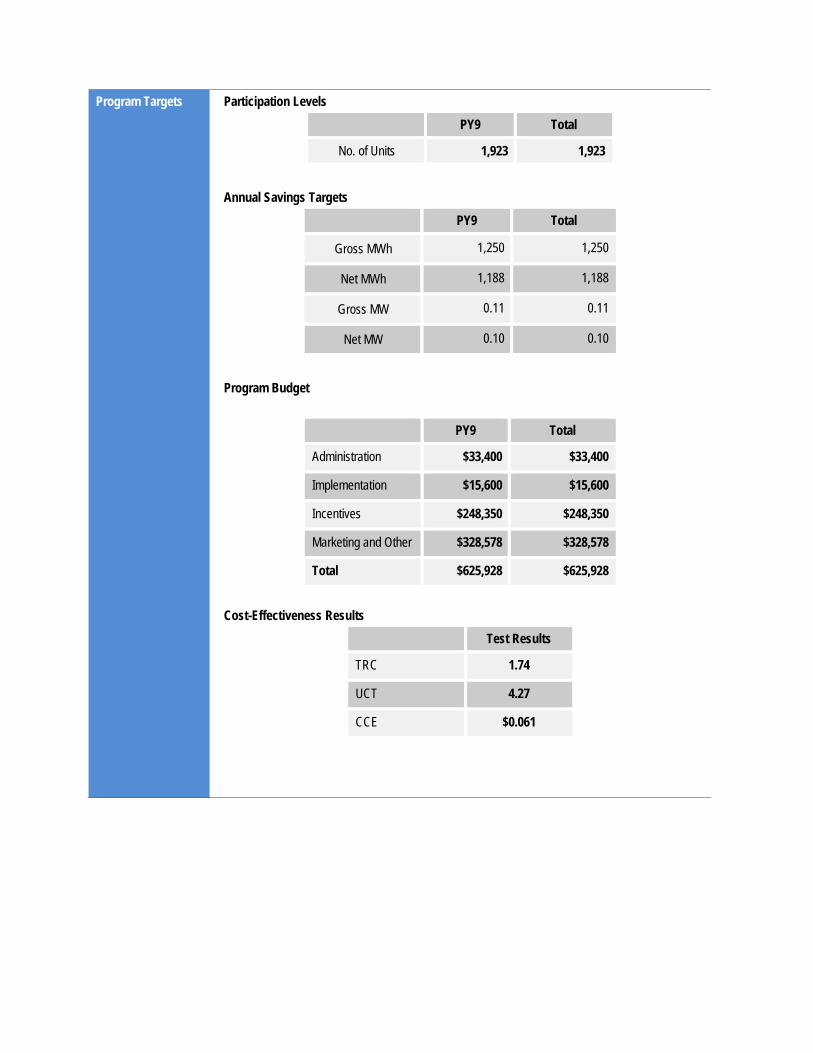
Program Targets Participation Levels PY9 Total
No. of Units 1,923 1,923
Annual Savings Targets
PY9 Total
Gross MWh 1,250 1,250
Net MWh 1,188 1,188
Gross MW 0.11 0.11
Net MW 0.10 0.10
Program Budget
PY9 Total
Administration $33,400 $33,400
Implementation $15,600 $15,600
Incentives $248,350 $248,350
Marketing and Other $328,578 $328,578
Total $625,928 $625,928
Cost-Effectiveness Results
Test Results
TRC 1.74
UCT 4.27
CCE $0.061
Program Name EnerPath Services – Super Trade Ally
Program Description
This program is designed to upgrade older, inefficient lighting with high-efficiency, long-life LED lighting for the hardest-to-reach small business segment. Small business owners rarely have the time or resources to devote to EE projects. Therefore, time required to evaluate alternatives, time needed to obtain contractor proposals, time needed to evaluate the value of a wide range of retrofit alternatives, and the requirement to lay out cash upfront all represent well-known barriers to adoption. Enerpath tries to eliminate these barriers and thereby achieve a high level of program acceptance and in the process enhance the end customer experience.
Program Duration June 2016 – May 2017
Collaboration None
Delivery Strategy Key elements of the delivery strategy for this Micro-Business Direct Install Program include: • Face-to-Face Contact: Professional Energy Service Representatives (ESR) engage
potential customers through door-to-door canvassing. This creates a trusted relationship. An iPad display ensures that only “qualified” businesses are contacted.
• Mobile Site-survey tools: A high-tech tool based on iPad is used to assess the energy needs at each site and a proposed upgrade is prepared and explained without delay. The customer can accept the proposal with an electronic signature and immediately have the products installed by the ESR or scheduled by an authorized contractor.
• High adoption and education: Customers are shown comparable sites and local endorsements, and they are educated about the value of energy efficient operation.
Target Market Businesses with average load of 50kW or less. Analysis of the service area around Chicago shows that nearly 20% are small medical facilities and legal offices. These are frequent adopters of energy efficiency programs. The highest adopters, service stations, convenience markets and auto dealerships make up 7% of the businesses and restaurants make up 4.3% of the facilities.
Marketing Strategy EnerPath will serve the smallest business customers (50kW or less) across the urban, suburban and rural service areas. EnerPath will focus its initial sales efforts in concentrated locations within the assigned ComEd service territory. Primary areas include high business concentration locations and community business districts such as exist in Arlington Heights, Des Plaines and Schaumburg. Following initial rollout, a secondary-phase effort will be executed in less concentrated areas, building on the initial phase which generates word-of-mouth program support.
Eligible Measures The program will focus on lighting-only and will solely deploy long life LED products. The offered measures will be screw-in or snap-in high quality upgrade items. These measures include linear LEDs and Solid State LED Lamps.
Program Targets Participation Levels PY9 Total
No. of Sites 3,875 3,875
Annual Savings Targets
PY9 Total
Gross MWh 24,722 24,722
Net MWh 23,486 23,486
Gross MW 6.31 6.31
Net MW 5.99 5.99
Program Budget
PY9 Total
Administration $0 $0
Implementation $4,382,500 $4,382,500
Incentives $0 $0
Marketing and Other $250,000 $250,000
Total $4,632,500 $4,632,500
Cost-Effectiveness Results
Test Results
TRC 5.64
UCT 7.94
CCE $0.024
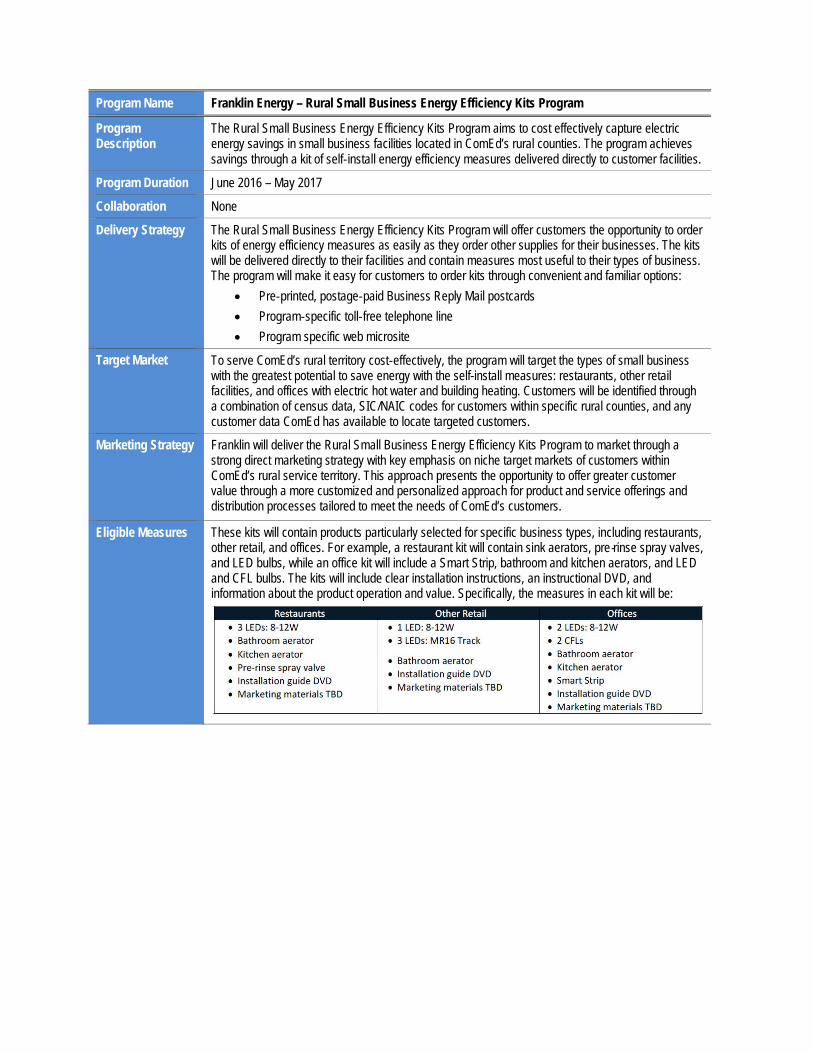
Program Name Franklin Energy – Rural Small Business Energy Efficiency Kits Program
Program Description
The Rural Small Business Energy Efficiency Kits Program aims to cost effectively capture electric energy savings in small business facilities located in ComEd’s rural counties. The program achieves savings through a kit of self‐install energy efficiency measures delivered directly to customer facilities.
Program Duration June 2016 – May 2017
Collaboration None
Delivery Strategy The Rural Small Business Energy Efficiency Kits Program will offer customers the opportunity to order kits of energy efficiency measures as easily as they order other supplies for their businesses. The kits will be delivered directly to their facilities and contain measures most useful to their types of business. The program will make it easy for customers to order kits through convenient and familiar options:
• Pre‐printed, postage‐paid Business Reply Mail postcards • Program‐specific toll‐free telephone line • Program specific web microsite
Target Market
To serve ComEd’s rural territory cost‐effectively, the program will target the types of small business with the greatest potential to save energy with the self-install measures: restaurants, other retail facilities, and offices with electric hot water and building heating. Customers will be identified through a combination of census data, SIC/NAIC codes for customers within specific rural counties, and any customer data ComEd has available to locate targeted customers.
Marketing Strategy Franklin will deliver the Rural Small Business Energy Efficiency Kits Program to market through a strong direct marketing strategy with key emphasis on niche target markets of customers within ComEd’s rural service territory. This approach presents the opportunity to offer greater customer value through a more customized and personalized approach for product and service offerings and distribution processes tailored to meet the needs of ComEd’s customers.
Eligible Measures These kits will contain products particularly selected for specific business types, including restaurants, other retail, and offices. For example, a restaurant kit will contain sink aerators, pre‐rinse spray valves, and LED bulbs, while an office kit will include a Smart Strip, bathroom and kitchen aerators, and LED and CFL bulbs. The kits will include clear installation instructions, an instructional DVD, and information about the product operation and value. Specifically, the measures in each kit will be:
Program Targets Participation Levels PY9 Total
No. of Kits 3,750 3,750
Annual Savings Targets
PY9 Total
Gross MWh 1,091 1,372
Net MWh 971 1,221
Gross MW 0.50 0.59
Net MW 0.44 0.52
Program Budget
PY9 Total
Administration $224,360 $224,360
Implementation $32,550 $32,550
Incentives $207,970 $207,970
Marketing and Other $118,090 $118,090
Total $582,970 $582,970
Cost-Effectiveness Results
Test Results
TRC 5.26
UCT 2.89
CCE $0.092
Program Name GDS Associates – Agricultural Energy Efficiency Program (CoAg)
Program Description
GDS Associates is pleased to provide a proposal for Agricultural Energy Efficiency Program to ComEd (CoAg) with the goal of achieving energy savings from ComEd residential and small commercial farm customers, with an initial focus on dairy, swine, and poultry production farms. The approach is designed to achieve energy efficiency within the hard‐to‐reach small and medium agriculture market and to provide the flexibility needed to meet the goals of the program.
Program Duration June 1, 2016 - May 31, 2017
Collaboration None
Delivery Strategy The CoAg Program will begin with the proactive customer engagement of residential and small commercial agricultural producers in ComEd’s service territory. With the initial engagement, agricultural energy advisors will identify the individual customer needs and energy consumption profile to determine whether the best service can be provided by technical support on a specific energy consuming system or through the creation of comprehensive agricultural energy management plan that meets the American Society of Agricultural and Biological Engineers (ASABE) S612 audit standards.
Target Market
This program is designed to focus on the various type of farms dairy, swine and poultry production. Other market segments include greenhouses, grain drying systems and aquaculture and other
Marketing Strategy The geographic scope of the marketing and outreach effort will ensure that the targeted segments of the agricultural market throughout ComEd’s service territory are made aware of the program and how to access more information or participate. Effective marketing will occur through segmentation of the market into key groups, and tailoring messages to meet the needs and priorities of the different agricultural audiences.
Eligible Measures The eligible measures for this program include standard measures currently offered through the ComEd Standard Program and agricultural measures including but not limited to: Energy free livestock water and geotube, plate coolers, HE water heaters, glazing materials and high pressure fogging or misting.
Program Targets Participation Levels PY9 Total
No. of Units 2,931 2,931
Annual Savings Targets
PY9 Total
Gross MWh 1,340 1,340
Net MWh 1,220 1,220
Gross MW 0.18 0.18
Net MW 0.16 0.16
Program Budget
PY9 Total
Administration $10,400 $10,400
Implementation $251,745 $251,745
Incentives $94,468 $94,468
Marketing and Other $10,000 $10,000
Total $366,613 $366,613
Cost-Effectiveness Results
Test Results
TRC 1.78
UCT 3.36
CCE $0.038
Program Name GDS Associates – Small Commercial Lit Signage
Program Description
GDS Associates is pleased to provide a proposal for a small business signage program with the goal of achieving energy savings from small commercial customers (100 kW or less peak electric load), focusing on lit signage and billboards.
Program Duration June 1, 2016 - May 31, 2017
Collaboration None
Delivery Strategy Eligible customers will receive a free lighting assessment from an approved Small Business Energy Advisor (SBEA) or local Small Business Trade Ally (SBTA). The free lighting assessment will evaluate the number and wattage of the current light fixtures, which will be used to construct a recommended energy efficiency plan, including lighting retrofits. Customers will be able to choose the measures to institute, and have the work done by an approved local contractor (SBTA) at a reduced cost. The program will pay the incentive directly to the SBTA and customers will be invoiced the difference by the SBTA.
Target Market
This program is designed to focus on lit signage and billboards for small commercial customers (100 kW or less peak electric load)
Marketing Strategy The marketing effort will highlight how Illinois’ small commercial customers can operate more profitably through the installation of affordable energy efficient signage lighting. Marketing efforts will be targeted specifically to appropriate market segments, including: chain restaurants, particularly fast food locations with drive thru menu boards; banks; small retail and services; offices; gas stations and convenience stores; hotels/motels; churches; and municipal buildings, among others. In addition, marketing will be directed to advertising associations such as: Outdoor Advertising Association of Illinois; Advertising Association Federation; and the Chicago Advertising Federation.
Eligible Measures The program expects to replace or retrofit predominantly HID fixtures, including metal halide and high pressure sodium, halogen spotlights, and fluorescent fixtures.
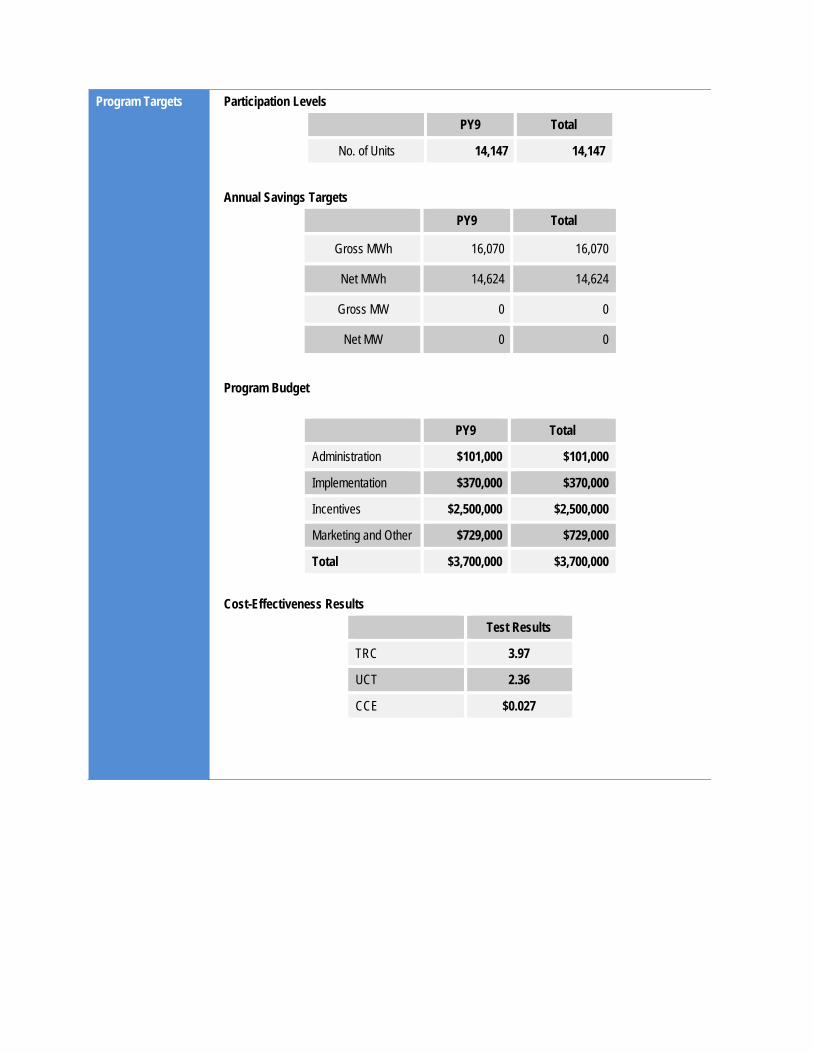
Program Targets Participation Levels PY9 Total
No. of Units 14,147 14,147
Annual Savings Targets
PY9 Total
Gross MWh 16,070 16,070
Net MWh 14,624 14,624
Gross MW 0 0
Net MW 0 0
Program Budget
PY9 Total
Administration $101,000 $101,000
Implementation $370,000 $370,000
Incentives $2,500,000 $2,500,000
Marketing and Other $729,000 $729,000
Total $3,700,000 $3,700,000
Cost-Effectiveness Results
Test Results
TRC 3.97
UCT 2.36
CCE $0.027
Program Name Matrix Energy Services, Inc. (Matrix) – Linear LED Lighting for Small Facilities Program
Program Description
Matrix is proposing the Linear LED Lighting Program for Small Facilities with high operating hours in response to the ComEd’s RFP for Third Party Efficiency Programs for PY9.This program targets those Small Commercial facilities with long operating hours within ComEd’s service area that have a monthly demand of less than 100 kW. The program savings are 100% in the area of Lighting. Through this program, Matrix will replace existing linear fluorescent fixtures with LED Linear bulbs in qualifying facilities.
Program Duration June 2016 – May 2017
Collaboration None
Delivery Strategy Matrix will be responsible for all aspects of the program implementation, i.e., marketing the program, performing energy audits of the facilities, providing savings report to the customer, and, once customers sign the Participation Agreement, installing the Linear LED bulbs. Matrix staff will also perform post-installation inspections at 100% of the installed sites.
Target Market
The proposed program will target areas with high concentrations of small businesses. Typically, these businesses are located in clusters such as strip malls, shopping centers, downtown areas, and commercial districts. Close proximity will minimize marketing and travel costs for the program. The businesses that constitute the lion’s share of the total qualified participants will include: convenience stores with long operating hours, gas stations, fast food restaurants and small diners. Also, great candidates for the program are police stations, fire stations, common areas/corridors of multi-family housing and small lodging facilities that remain lit for 24 hours a day.
Marketing Strategy This program is specifically designed for hard-to-reach and underserved small businesses. This market is considered hard-to-reach primarily due to their unresponsiveness towards conventional marketing methods such as advertising and organized events. Small business owners are generally savvy and receptive to ways which reduce their costs while improving the quality of service they offer their customers. Small businesses can be sold on energy efficiency if they are shown how improving their energy use contributes to improving other facets of their business, such as the comfort of their customers and the productivity of their employees. Until recently energy costs have not been significant enough to be noticed by small business owners. In the present economic climate, energy costs are substantial and need to be reduced. Customers do have energy-efficiency options, but have not implemented measures to any great extent. There is still a need to work with them to improve energy efficiency.
Eligible Measures For this program, the latest generation of linear LED lamps, which operate off of the existing ballast, where an internal transformer converts the output of the ballast into that which the LED can use. Therefore, this latest generation of Linear LEDs (type “C”) eliminates the safety hazard created by backsliding to fluorescents from type “B” LED tubes. Furthermore, type “C” linear LEDs still boast a very simplified installation. Some refer to this style of lamp as “plug-and-play” as no rewiring has to be done to the fixture or sockets, and the existing ballast configuration can be left alone. Together with low labor costs, low wattages, and long lifetimes, this technology is primed for mass penetration into the marketplace.
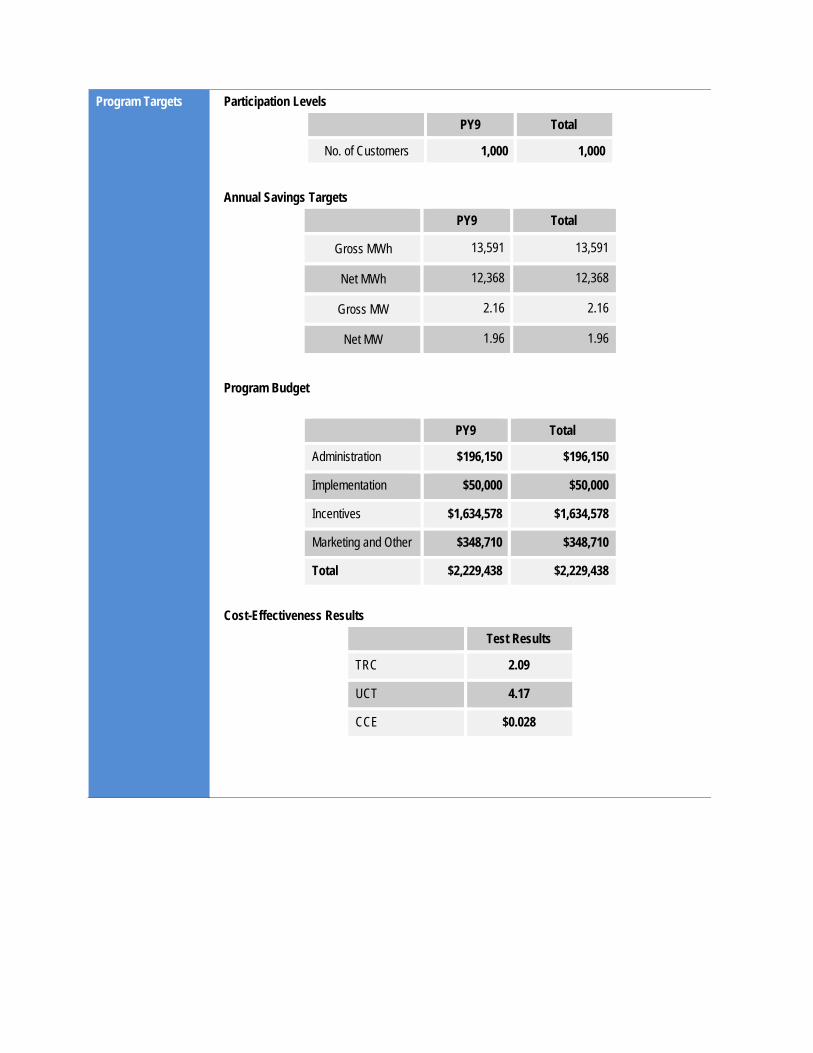
Program Targets Participation Levels PY9 Total
No. of Customers 1,000 1,000
Annual Savings Targets
PY9 Total
Gross MWh 13,591 13,591
Net MWh 12,368 12,368
Gross MW 2.16 2.16
Net MW 1.96 1.96
Program Budget
PY9 Total
Administration $196,150 $196,150
Implementation $50,000 $50,000
Incentives $1,634,578 $1,634,578
Marketing and Other $348,710 $348,710
Total $2,229,438 $2,229,438
Cost-Effectiveness Results
Test Results
TRC 2.09
UCT 4.17
CCE $0.028
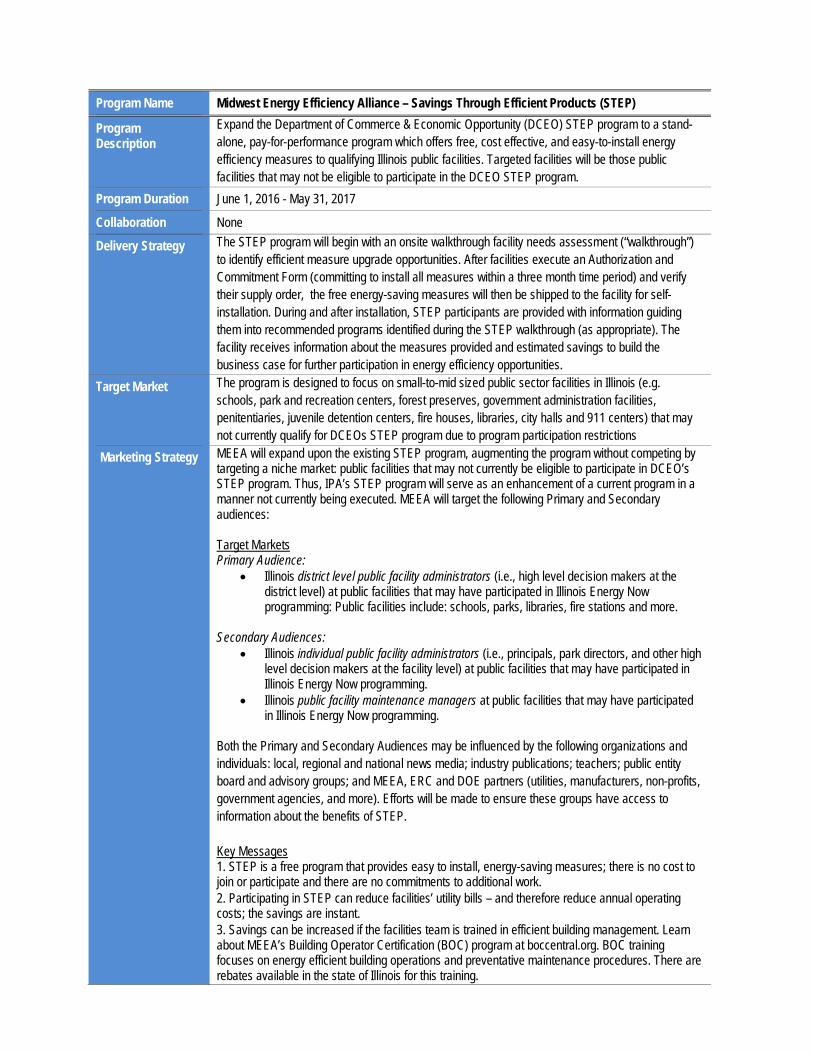
Program Name Midwest Energy Efficiency Alliance – Savings Through Efficient Products (STEP)
Program Description
Expand the Department of Commerce & Economic Opportunity (DCEO) STEP program to a stand-alone, pay-for-performance program which offers free, cost effective, and easy-to-install energy efficiency measures to qualifying Illinois public facilities. Targeted facilities will be those public facilities that may not be eligible to participate in the DCEO STEP program.
Program Duration June 1, 2016 - May 31, 2017
Collaboration None
Delivery Strategy The STEP program will begin with an onsite walkthrough facility needs assessment (“walkthrough”) to identify efficient measure upgrade opportunities. After facilities execute an Authorization and Commitment Form (committing to install all measures within a three month time period) and verify their supply order, the free energy-saving measures will then be shipped to the facility for self-installation. During and after installation, STEP participants are provided with information guiding them into recommended programs identified during the STEP walkthrough (as appropriate). The facility receives information about the measures provided and estimated savings to build the business case for further participation in energy efficiency opportunities.
Target Market
The program is designed to focus on small-to-mid sized public sector facilities in Illinois (e.g. schools, park and recreation centers, forest preserves, government administration facilities, penitentiaries, juvenile detention centers, fire houses, libraries, city halls and 911 centers) that may not currently qualify for DCEOs STEP program due to program participation restrictions
Marketing Strategy MEEA will expand upon the existing STEP program, augmenting the program without competing by targeting a niche market: public facilities that may not currently be eligible to participate in DCEO’s STEP program. Thus, IPA’s STEP program will serve as an enhancement of a current program in a manner not currently being executed. MEEA will target the following Primary and Secondary audiences: Target Markets Primary Audience:
• Illinois district level public facility administrators (i.e., high level decision makers at the district level) at public facilities that may have participated in Illinois Energy Now programming: Public facilities include: schools, parks, libraries, fire stations and more.
Secondary Audiences:
• Illinois individual public facility administrators (i.e., principals, park directors, and other high level decision makers at the facility level) at public facilities that may have participated in Illinois Energy Now programming.
• Illinois public facility maintenance managers at public facilities that may have participated in Illinois Energy Now programming.
Both the Primary and Secondary Audiences may be influenced by the following organizations and individuals: local, regional and national news media; industry publications; teachers; public entity board and advisory groups; and MEEA, ERC and DOE partners (utilities, manufacturers, non-profits, government agencies, and more). Efforts will be made to ensure these groups have access to information about the benefits of STEP. Key Messages 1. STEP is a free program that provides easy to install, energy-saving measures; there is no cost to join or participate and there are no commitments to additional work. 2. Participating in STEP can reduce facilities’ utility bills – and therefore reduce annual operating costs; the savings are instant. 3. Savings can be increased if the facilities team is trained in efficient building management. Learn about MEEA’s Building Operator Certification (BOC) program at boccentral.org. BOC training focuses on energy efficient building operations and preventative maintenance procedures. There are rebates available in the state of Illinois for this training.
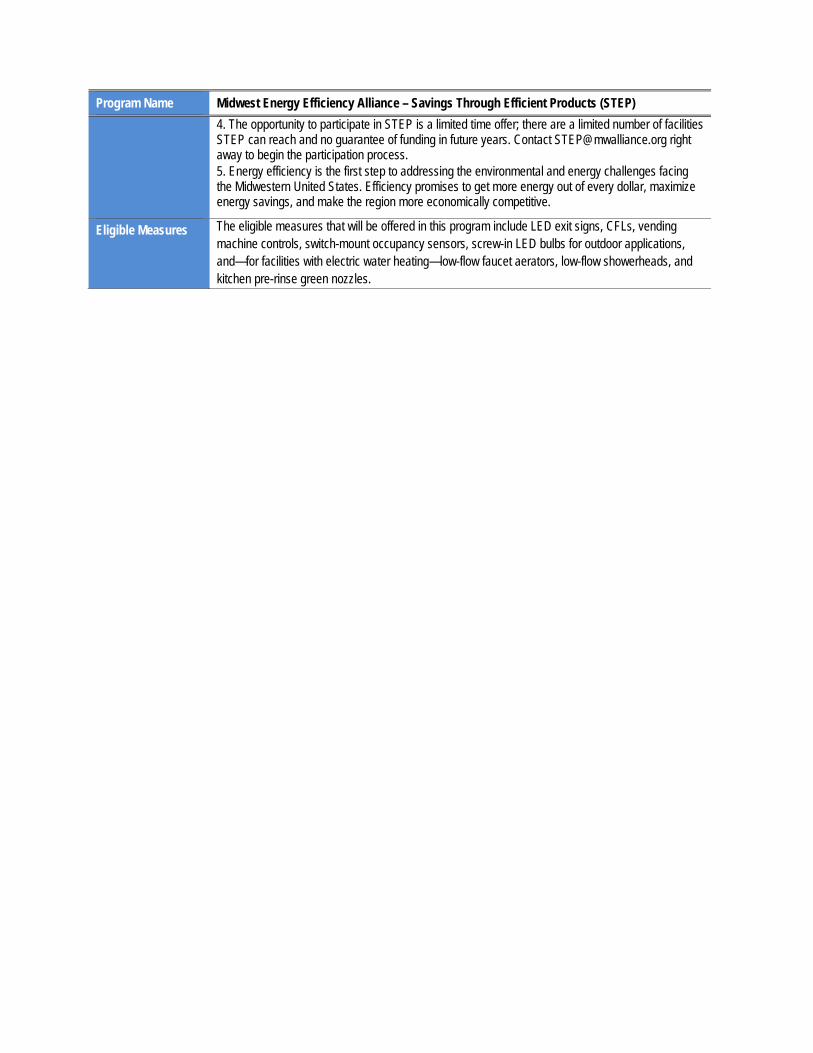
Program Name Midwest Energy Efficiency Alliance – Savings Through Efficient Products (STEP) 4. The opportunity to participate in STEP is a limited time offer; there are a limited number of facilities STEP can reach and no guarantee of funding in future years. Contact [email protected] right away to begin the participation process. 5. Energy efficiency is the first step to addressing the environmental and energy challenges facing the Midwestern United States. Efficiency promises to get more energy out of every dollar, maximize energy savings, and make the region more economically competitive.
Eligible Measures The eligible measures that will be offered in this program include LED exit signs, CFLs, vending machine controls, switch-mount occupancy sensors, screw-in LED bulbs for outdoor applications, and—for facilities with electric water heating—low-flow faucet aerators, low-flow showerheads, and kitchen pre-rinse green nozzles.
Program Targets Participation Levels PY9 Total
No. of Units 7,120 7,120
Annual Savings Targets
PY9 Total
Gross MWh 3,446 3,446
Net MWh 3,343 3,343
Gross MW 0.59 0.59
Net MW 0.57 0.57
Program Budget
PY9 Total
Administration $123,710 $123,710
Implementation $10,000 $10,000
Incentives $386,689 $386,689
Marketing and Other $257,780 $257,780
Total $778,179 $778,179
Cost-Effectiveness Results
Test Results
TRC 7.66
UCT 5.00
CCE $0.035
Program Name Power TakeOff – Small Business Monitoring Based Commissioning Program (MBCx)
Program Description
This program will provide a monitoring based commissioning (MBCx) approach which achieves behavioral energy savings, demand reduction, improved customer satisfaction, and identification of additional energy efficiency retrofit projects.
Program Duration June 1, 2016 - May 31, 2017
Collaboration None
Delivery Strategy This program is designed to leverage the investment that Commonwealth Edison is making in AMI deployment through data analytics and customer engagement to achieve energy savings. Our approach follows a step-by-step process to identify high opportunity customers, engage with them to better understand their operations, enroll them in the MBCx program, generate energy savings and demand reduction at their facilities, and identify additional retrofit opportunities which may receive financial incentives. Additionally, we will monitor customer satisfaction, their participation levels in existing DSM programming, and overall understanding of energy usage before and after participating in the program.
Target Market
While this MBCx program will be made available to all customers under 100 kW peak demand, there are a number of market segments that represent “high opportunity” potential participants for this MBCx offering. In terms of operating profiles – facilities which are M-F, single shift operations represents the greatest opportunity for behavior change improvements in addressing their load profiles during night and weekend hours. In terms of vertical markets – medical office buildings, small manufacturing/industrial facilities, hotels, and assisted living facilities represent the highest usage and peak demand within the <100 kW ratepayer population.
Marketing Strategy The marketing strategy for this program includes the following key elements:
• Geographic targeting in the communities where the AMI deployment has occurred
• Screening and filtering to identify high opportunity customers • Deployment of field representatives to provide customer engagement • Prioritization of receptive, multiple facility vertical markets • Program awareness campaign through Chambers of Commerce and trade
organizations • Communication of a customer value proposition
Eligible Measures This MBCx program will obtain kWh savings through the identification and implementation of low-
cost operational adjustments and behavioral modifications.
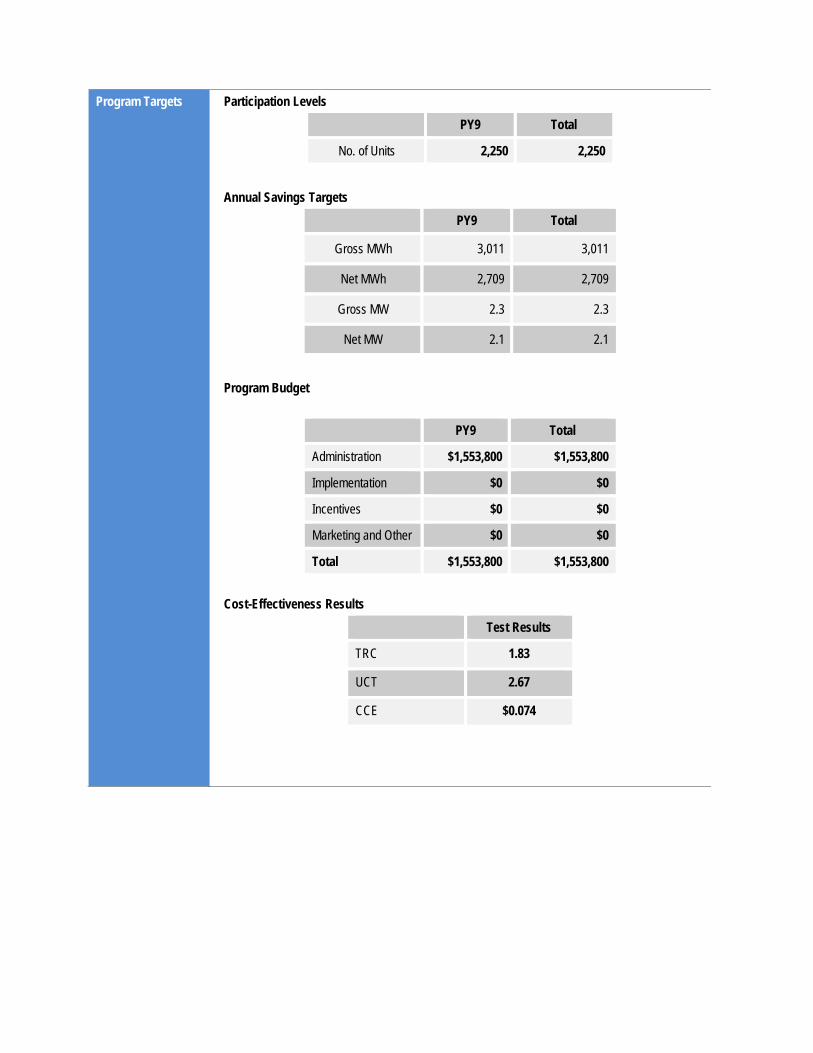
Program Targets Participation Levels PY9 Total
No. of Units 2,250 2,250
Annual Savings Targets
PY9 Total
Gross MWh 3,011 3,011
Net MWh 2,709 2,709
Gross MW 2.3 2.3
Net MW 2.1 2.1
Program Budget
PY9 Total
Administration $1,553,800 $1,553,800
Implementation $0 $0
Incentives $0 $0
Marketing and Other $0 $0
Total $1,553,800 $1,553,800
Cost-Effectiveness Results
Test Results
TRC 1.83
UCT 2.67
CCE $0.074
Program Name SEDAC – Enhanced Building Optimization Program
Program Description
The Public Sector Enhanced Building Optimization Program will focus on facilities that have not done preventative maintenance on their RTUs/split systems and have not taken part in the SEDAC mini retro-commissioning program so that an aggressive use of continuous monitoring of HVAC units, tune-ups and RCx-type scheduling and control measures will cost-effectively maximize kWh saved. The Program will provide a free comprehensive tune-up including adding high efficiency low pressure drop filters for all RTUs/split systems that have not had preventative maintenance done for the last 3 years. There will also be continuous monitoring of HVAC units.
Program Duration June 1, 2016 - May 31, 2017
Collaboration None
Delivery Strategy ComEd customer participants will go through the following program operational process:
Program Process for Participating Facilities
1. Discuss Enhanced Building Optimization Program with SEDAC staff or one of our pre-approved HVAC contractors.
2. Fill out our Application with assistance from SEDAC staff or a pre-approved HVAC contractor who will then submit the form to SEDAC staff. Supply 12- month’s electric utility bills. (Applications are accepted on a rolling basis)
3. Once the application has been approved by SEDAC staff as eligible, the pre-approved HVAC contractor and SEDAC will contact the facility to schedule a time for the first site visit.
4. Client must allow SEDAC staff and pre-approved HVAC contractor to have reasonable access to the building for walkthroughs.
5. First site visit: a. Pre-approved HVAC contractor will install continuous monitoring equipment on
sample of HVAC equipment specified by SEDAC staff b. SEDAC staff perform full building optimization investigation and basic functional
testing to identify RCx-type HVAC enhanced control measures c. SEDAC staff collected details and pictures of all RTUs/split systems and
determine which are eligible for inclusion in this Program. 6. SEDAC staff put together a Customer Selection Form (CSF) listing the measures
identified, energy savings, incentives and paybacks for quick submittal to client 7. SEDAC and the pre-approved HVAC contractor returns for a second site visit to tune-up
approved HVAC units and implement any customer agreed upon measures. SEDAC verifies implementation.
8. SEDAC Staff continue to monitor live feed from monitored equipment and provide additional recommendations to client.
9. SEDAC will distribute appropriate incentives to client based on work implemented and verified.
10. SEDAC will issue a follow-up survey to all program clients to gauge satisfaction with services and program process.
Target Market
The proposed Public Sector Enhanced Building Optimization Program will serve public sector (peak demand < 100 kW) buildings in the ComEd utility territory. The targeted public entities will focus on but are not limited to:
• Municipality Buildings • K-12 School • Park Districts • Government
Program Name SEDAC – Enhanced Building Optimization Program • Libraries • Community Colleges • Universities • Counties • Townships
Marketing Strategy SEDAC will market and deliver the Public Sector Enhanced Building Optimization Program both by utilizing a pool of pre-approved HVAC contractors as well as email and telephone marketing by SEDAC staff. The program will rely on these HVAC contractors to identify quality leads from their existing client base and relationships as well as SEDAC staff to tap into their large public sector network. For clients that come in from program staff outreach, SEDAC will provide an approved HVAC service providers list from which they can choose from. SEDAC enjoys great relationships with a wide-range of public sector organizations thanks to our previous work and has been heavily involved in state-wide organizations like the Illinois Parks and Recreation Association (IPRA) and Illinois Association of School Board Officials (IASBO) which will facilitate easy outreach and connections about the program.
SEDAC will put together targeted marketing materials that can be used by the approved HVAC service providers in their outreach. All ComEd branding will be approved by ComEd before use. SEDAC will also hold workshops and use other outreach tools such as e-blasts and social media messaging that have been so effective to reach public sector clients in the past.
Eligible Measures The eligible measures for this program will include those that are required for tuning up pre-approved
RTUs/Split systems such as: cleaning of evaporator coils, brush and/or blow out condenser coils, clean economizer screens, install high capacity filters, etc….
Program Targets Participation Levels PY9 Total
No. of Buildings 200 200
Annual Savings Targets
PY9 Total
Gross MWh 12,422.4 12,422.4
Net MWh 11,056 11,056
Gross MW 3.5 3.5
Net MW 3.1 3.1
Program Budget
PY9 Total
Administration $200,000 $200,000
Implementation $250,000 $250,000
Incentives $888,058 $888,058
Marketing and Other $1,161,942 $1,161,942
Total $2,500,000 $2,500,000
Cost-Effectiveness Results
Test Results
TRC 2.89
UCT 5.32
CCE $0.036
Program Name SmartWatt Energy– Integrated Energy Controls for Small Business (IECSB)
Program Description
The IECSB Program provides for installation of an intelligent control system that would reduce energy consumption and demand in light commercial buildings as part of a comprehensive energy saving retrofit project. The integrated nature of these projects means that, not only will customers save energy, these systems would also allow the customer to respond to demand response (DR) events using a signal received through the utility customer’s internet connected network or through a wireless AMI interface of their newly installed smart meters.
Program Duration June 2016 – May 2017
Collaboration None
Delivery Strategy The vast small business customer market segment has time and again proven to be very difficult to penetrate with conventional energy efficiency programs. The reluctance of this customer class to adopt even the most basic energy efficiency technologies means that a new approach is needed to incorporate the latest in controls technology to make their buildings smarter and capable of taking advantage of Smart Metering and Demand Response. The IECSB Program is designed to help customers understand how they use energy, familiarize them with opportunities for energy savings with advanced technologies, and demonstrate how they can utilize the latest energy management systems to save money through participation in ComEd’s Voluntary Load Reduction (VLR Tariff) Program.
Target Market
SmartWatt’s proposed Program offers eligible customers a no-cost facility audit and energy efficiency measures with a proven, easy to understand ROI and operational impacts, and valuable installation incentives. We have selected a limited set of Energy Efficiency Measures (EEMs) for the IECSB Program to accomplish energy efficiency improvements among the <100 kW Demand customers who are historically underserved by conventional utility energy efficiency programs. In our experience, these carefully selected measures achieve the prime objective of the ComEd Third Party Programs solicitation, to provide energy efficiency savings within the targeted customer segments.
Marketing Strategy Initial Program marketing will include two phases, each rooted in market research and analytics. In Phase 1 we research the quantity and location of target customers. In Phase 2, we test this assumption and gather analytics on tactics that work best and what type of collateral they are most likely to respond to. We use this intelligence to develop case studies, collateral and marketing campaigns tailored to the needs of specific vertical markets.
Eligible Measures Energy efficiency measures have been carefully selected to include only the latest energy efficient technologies:
SmartWatt will not be installing only simple demand reduction lighting and HVAC projects. A prerequisite for participation will be that all technologies installed will be tied into an advanced control system which makes every installed piece of equipment capable of participating in a demand response event.
Program Targets Participation Levels PY9 Total
No. of Units 17,695 17,695
Annual Savings Targets
PY9 Total
Gross MWh 10,004 10,004
Net MWh 9,003 9,003
Gross MW 1.15 1.15
Net MW 1.04 1.04
Program Budget
PY9 Total
Administration $0 $0
Implementation $3,000,000 $3,000,000
Incentives $0 $0
Marketing and Other $0 $0
Total $3,000,000 $3,000,000
Cost-Effectiveness Results
Test Results
TRC 3.31
UCT 4.50
CCE $0.040
Program Name Sterling Analytics – Energy Dashboard
Program Description
Sterling Analytics offers its comprehensive energy dashboard, powered by Noveda software. The system offers graphics that displays real-time and historic energy use on a facility or enterprise basis, and also displays data with graphics that aim to engage stakeholders. Additionally, Sterling Analytics can provide lighting upgrades and HVAC improvements to assist potential ComEd customers in meeting efficiency goals.
Program Duration June 2016 – May 2017
Collaboration Sterling Analytics recognizes that if it is mutually agreed that the likelihood of achieving cost-effective savings would be enhanced by marketing a program under the ComEd banner, there will be an opportunity for limited co-branding with ComEd. All marketing efforts and associated costs will be the responsibility of Sterling Analytics, and any co-branding with ComEd will be required to adhere to ComEd branding requirements and will be subject to ComEd’s internal review process as well as field visits and site inspections to ensure compliance. If approved for cobranding, Sterling Analytics agrees to develop a marketing plan outlining the marketing and outreach activities to be completed throughout the program year, provided to ComEd upon request.
Delivery Strategy Sterling Analytics proposes to deploy the Noveda Technologies energy dashboard in two phases: Phase 1 will focus on deploying the Noveda Technologies energy dashboard to collect and analyze energy data for a specially selected group of customers. Additionally, Sterling Analytics in consultation with Dr. Robert Somers, a leading energy information and integration expert, will work with these national accounts to identify energy opportunities. During Phase 1 the “Utility View” Dashboard (ComEd Generation and Load) will also be developed. Phase 2 will focus on adding new accounts and technology and implementing an integrated energy approach based on the Energy Dashboard information and recommendations from Phase 1. Additionally, the entire “Utility View” including all generation and customer load will be brought into view.
Target Market
We will work with local Chicago and ComEd service territory facilities from our national account customers and accounts suggested by ComEd to participate in the project. Target customers will be only those small commercial and industrial customers with no more than 100 kW of peak electric load. Use of the dashboard will aid in identifying opportunities for energy efficiency improvement and fine-tuning of operations to maximize energy performance.
Marketing Strategy Sterling Analytics plans to design and implement marketing campaigns necessary to attract the levels of qualified participants to meet the energy savings goals as established in their proposal. Sterling Planet will select the delivery channels (e.g., direct mail, telephone, internet, etc.) and develop the collateral, phone scripts, and other materials involved in the direct marketing campaigns. Sterling Analytics will submit drafts of marketing approaches and materials to ComEd for review before contacting customers, with the understanding that ComEd reserves the right to reject marketing material or tactics considered false, misleading, or inappropriate.
Eligible Measures Sterling Analytics will recruit small commercial customers from the ComEd service territory to implement the energy dashboard and energy efficiency improvement projects that will generate savings through LED lighting upgrades, use of advanced lighting controls such as daylighting , HVAC heatload reductions and HVAC improvement projects that include use of variable air volume controls, DDC controls, energy-efficient fan motors, energy-efficient DX equipment, and installation of heat pump systems, cooling tower replacements and new chillers. The provided measure list based on the TRC include:
• LED Lighting with Daylighting Controls • LED Replacement Tubes • Evaporative Cooling • Variable Refrigerant Flow Equipment
Program Targets Participation Levels PY9 Total
No. of Customers 200 200
Annual Savings Targets
PY9 Total
Gross MWh 58,079 58,079
Net MWh 58,079 58,079
Gross MW 18.6 18.6
Net MW 18.6 18.6
Program Budget
PY9 Total
Administration $1,525,000 $1,525,000
Implementation $150,000 $150,000
Incentives $5,075,000 $5,075,000
Marketing and Other $3,400,000 $3,400,000
Total $10,150,000 $10,150,000
Cost-Effectiveness Results
Test Results
TRC 2.27
UCT 8.66
CCE $0.022
Program Name Energy Resources Center (ERC) – Low Income Kit Energy (LIKE) Program
Program Description
The Low Income Kit Energy (LIKE) program provides income-qualified customers with a kit containing energy-saving devices and educational information on additional energy-saving actions they can take to reduce their energy bills.
Program Duration June 2016 – May 2017
Collaboration None
Delivery Strategy The Illinois LIKE program will use mailing as its primary delivery mechanism, like most of the programs of similar scope. The program could also experiment with the doorknob hanging approach and workshops to determine if they are effective and cost-effective.
Target Market
In Illinois approximately 934,000 households have incomes below 150% of the poverty level (the number under 80 AMI is slightly larger). Around 43% live in single family housing and another 21% in 2-4 unit housing. In ComEd’s territory, 361,000 low income households live in such housing units. Those households are the target for this program. The LIKE program is expected to reach 15,000 households in this target market in its first year.
Marketing Strategy ERC will design and implement the program, creating the educational and installation material. Anticipated marketing strategies will include (focus will be directed to the most effective channel)
• Direct mail campaign • Email marketing • Targeted geographical distribution (at the neighborhood level) • Utility bill inserts (if possible) • Website / landing page content
ERC will obtain a database of Illinois residents that qualify for Low Income LIHEAP funds to obtain access to a list of eligible customers. Cross-reference with ComEd’s database would refine the list to those customers that are both income-qualified and program eligible based on ComEd’s Third Party Efficiency Programs requirements. Every year, only a percentage of customers who apply for LIHEAP funds are served by the program (around 35-40%) due to funding limitations and only a fraction (around 0.5%) receive assistance from the Weatherization program. Since some of the customers who are below the 80% AMI threshold may be above the 150% poverty threshold, census data will be leveraged and cross-referenced with customer LIHEAP data to cover those otherwise excluded households. Program participation will be closely monitored and tracked to allow continuous assessment and necessary adjustments, regardless of the marketing channels utilized.
Eligible Measures Each LIKE energy kit will include a 7-plug Smart Strip, several CFLs of various sizes, a LED night light, and for households with electric hot water, low flow faucet aerators for the kitchen and bathroom and a low flow showerhead. ERC is looking into including some weather stripping or sealing materials and will continue to research additional cost-effective energy efficiency measures that could be included as part of a kit of simple to install energy efficiency measures. CFLs, LED night lights, low flow aerators and showerheads have all been proven energy savers. The Smart Strip is a newer technology that shuts off power when household electronics are no longer in use, reducing the “vampire” current. It has the added benefit of electrical surge protection.
Program Targets Participation Levels PY9 Total
No. of Kits 15,000 15,000
Annual Savings Targets
PY9 Total
Gross MWh 4,103 4,896
Net MWh 4,103 4,896
Gross MW 0.49 0.57
Net MW 0.49 0.57
Program Budget
PY9 Total
Administration $277,845 $277,845
Implementation $45,000 $45,000
Incentives $996,401 $996,401
Marketing and Other $120,000 $120,000
Total $1,439,246 $1,439,246
Cost-Effectiveness Results
Test Results
TRC 2.11
UCT 1.51
CCE $0.067
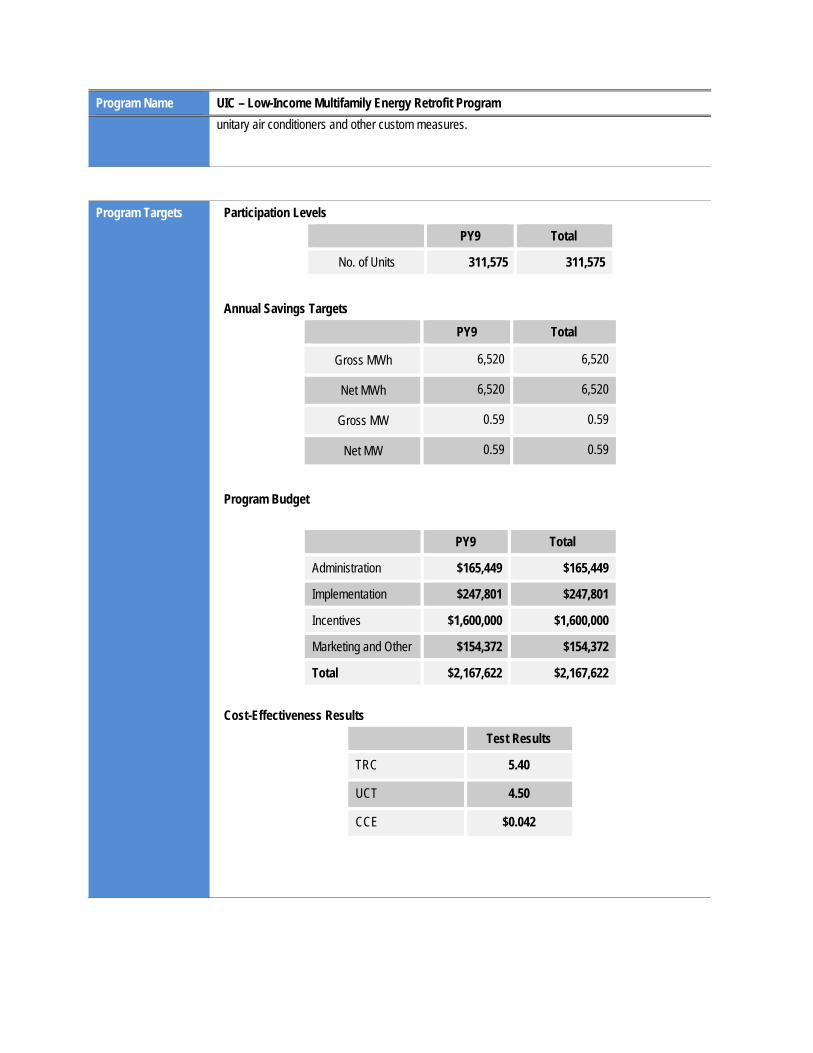
Program Name UIC – Low-Income Multifamily Energy Retrofit Program
Program Description
To provide technical assistance, capacity building, and incentives to ComEd customers residing in the United States Department of Housing and Urban Development (HUD) Section 8 Multifamily Project Based Rental Units, HUD Section 811 Supportive Housing for Persons with Disabilities, HUD Section 202 Supportive Housing for Elderly Persons, and the United States Department of Agriculture (USDA) 515 Rural Rental Housing Projects in the State of Illinois. This proposal will develop an innovative program that replicates the Illinois Public Housing Authority (ILPHA) Efficient Living Energy Program.
Program Duration June 1, 2016 - May 31, 2017
Collaboration None
Delivery Strategy Each applicant will be assigned a project staff member upon application acceptance, who will be responsible for seeing the project through from start to end and assisting the applicant as needed. The project leader will collect existing and replacement equipment inventory for any funded measures, check inventory for errors, and ensure all replacement equipment meets our energy efficiency requirements. A pre-award letter will be sent to notify the applicant of the approved measures and award amount. The applicant will develop specifications for bidding on approved measures to be reviewed by project staff. Once specifications have been approved, the applicant will then obtain quotes or bids on the approved measures. Finally, a post-implementation site visit will be conducted to ensure all measures were installed properly.
Target Market
The targeted market includes HUD Section 8 Multifamily Project Based Rental Units, HUD Section 811 Supportive Housing for Persons with Disabilities, HUD Section 202 Supportive Housing for Elderly Persons, and USDA 515 Rural Rental Housing Projects in the State of Illinois.
Marketing Strategy Information on eligible buildings for marketing and outreach will be provided by the HUD Chicago Multifamily Hub Office and by the State of Illinois USDA Rural Development Housing Office. The program team is experienced in marketing offerings and disseminating program information to target demographic using group presentations, individualized meetings and web based outreach. Group strategies to provide program information and market on-site technical assistance services include Lunch and Learn sessions and two low-income Trade Ally Programs to be conducted during the program year. The Lunch and Learn sessions will be developed specifically for the low-income building managers. Potential topics include available programs, building benchmarking, measures and verification, resident energy consumption behavioral patterns, and smart grid technologies. A one day ComEd Trade Ally Program which will focus on the low-income community will be held. This event will provide information on low-income housing and community development program. It will be designed to meet the specific needs of the low-income affordable housing community. DCEO Trade Alley energy efficiency professionals trained to deliver energy efficient building solutions will be invited to participate. Topics will be identified by service delivery needs such as (specific types of measures) and current issues (deployment of smart meters, smart technologies, and on-demand pricing). Individualized meetings will consist of face-to-face meetings and numerous teleconferences with potential customers and other constituencies regarding any program questions. Presentations may be delivered to state and federal agencies, Illinois Association of Housing Authorities, Illinois Housing Council, Illinois NAHRO and National NAHRO, and other entities as requested and needed. Print material dissemination may include press releases for newspapers, association newsletters, and regional publications to announce program accomplishments in order to attract publicity and generate additional program interest. The use of case studies and webinars will also be explored.
Eligible Measures The eligible measures for this program will include Energy Star CFLs, fluorescent delamping, high performance and reduced wattage T8, LED bulbs and fixtures, LED exit signs, beverage and snack machine controls, faucet Aerators, Showerheads, PTAC, PTHP, single-package and split system
Program Name UIC – Low-Income Multifamily Energy Retrofit Program unitary air conditioners and other custom measures.
Program Targets Participation Levels PY9 Total
No. of Units 311,575 311,575
Annual Savings Targets
PY9 Total
Gross MWh 6,520 6,520
Net MWh 6,520 6,520
Gross MW 0.59 0.59
Net MW 0.59 0.59
Program Budget
PY9 Total
Administration $165,449 $165,449
Implementation $247,801 $247,801
Incentives $1,600,000 $1,600,000
Marketing and Other $154,372 $154,372
Total $2,167,622 $2,167,622
Cost-Effectiveness Results
Test Results
TRC 5.40
UCT 4.50
CCE $0.042
1
Model Inputs
ComEd uses Integral Analytics’ DSMore software to conduct its cost-effectiveness testing. This software, which is an add-on to Microsoft Excel, uses a variety of data inputs to perform multiple analyses. The following data is used:
Avoided energy cost: In January 2013, ComEd provided a three-year price strip of hourly energy supply costs to Integral Analytics (IA). This forecast was developed by Northbridge, and uses energy future prices for the Northern Illinois Hub. Since these futures prices are only for monthly fixed block, on-peak or off-peak times, the prices are “shaped” by applying historical hourly price profiles to them; the resulting price profile more appropriately represents the expected hourly variations that occur in the day-ahead and real-time markets. ComEd provides this data, along with at least one year of hourly load data for each of ten customer classes, to IA. IA takes this data, along with 33 years of historic weather data for the Chicago-O’Hare weather station and develops class-based GARCH models, which become the basis for avoided energy cost calculations in the DSMore software.
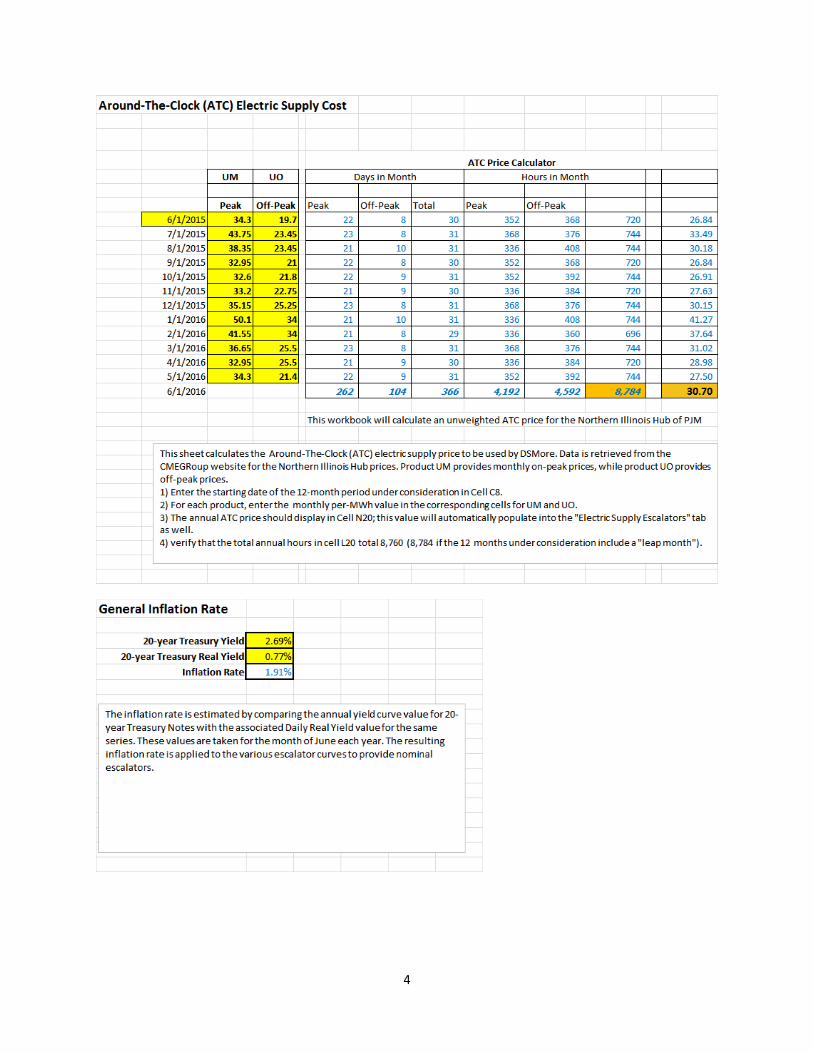
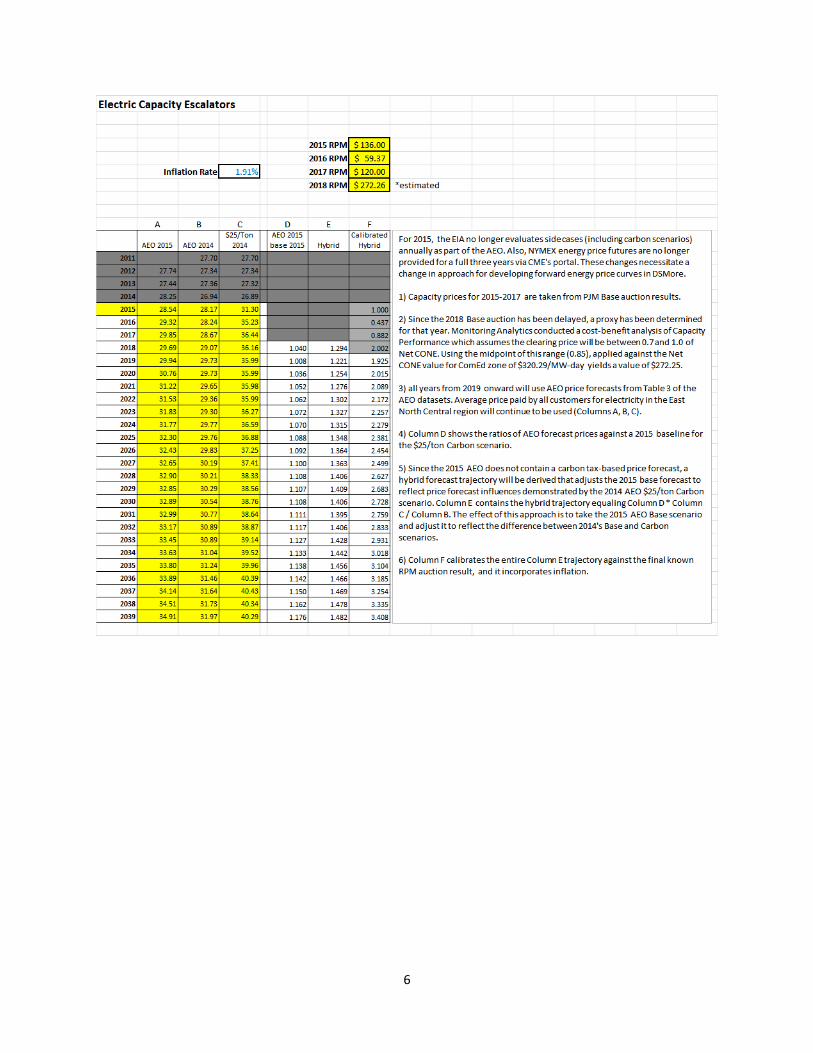
This profile development is completed every three years. Annually, on or around June 1 of each year, ComEd re-calibrates the cost model by obtaining new future prices from NYMEX for the Northern Illinois Hub and calculating an ATC cost. Page 4 shows the derivation of the current ATC price.
Carbon adder: The Illinois TRC test requires ComEd to include “reasonable estimates … of financial costs likely to be imposed by future regulations and legislation on emissions of greenhouse gases.” (20 ILCS 3855/1-10). The Energy Information Administration (“EIA”) evaluates the impacts of carbon costs on future energy prices as part of its Annual Energy Outlook (“AEO”); this approach reflects the effect that carbon adders would have on power plant construction, retirements and dispatch over time. ComEd uses the $25/ton carbon scenario from the AEO to reflect emissions costs over time. Rather than treat the carbon cost as an adder to energy supply costs, this cost was included in the escalator values as described below.
Avoided capacity cost: ComEd is a member of PJM Interconnect, and its costs for capacity are based on the Reliability Pricing Model (RPM); that is, PJM’s forward capacity market. ComEd exists in the ComEd zone within PJM market; this submarket was established by PJM for the first time in 2014, which means that there are potentially binding transmission constraints that would limit PJM’s ability to import power into the ComEd zone from other zones; such constraints tend to increase the cost of capacity within the constrained zone.
2
Avoided Transmission and Distribution Costs: ComEd conducted an updated analysis to place a value on the avoidance or deferral of new transmission and distribution capacity as a result of energy efficiency. The most recent analysis determined that an avoided T&D cost of $42/yr is appropriate for cost-effectiveness analysis.
Escalation Factors: All of the above values are determined either for one or three years, based on the time horizon for which market data is available. Since most energy efficiency measures have lives that will exceed this limited time horizon, ComEd relies on price forecasts from EIA to derive escalation factors over the remainder of the 25-year time horizon that DSMore uses. These factors are taken from the 2014 AEO report for the East North Central region of the country, and reflect the average retail price forecast for all customers. The EIA evaluates the impacts of carbon costs on future energy prices as part of its AEO; this approach reflects the effect that carbon adders would have on power plant construction, retirements and dispatch over time. Due to Federal budget cuts, no carbon scenarios were modeled for the AEO 2015. For this year’s analysis, ComEd uses data from the 2015 AEO base scenario, and for each year in the time horizon this data was multiplied by the ratio of the 2014 $25/ton carbon scenario to the 2014 base scenario. Pages 5-6 show the derivation of the current energy and capacity escalators.
Since the AEO values are provided in constant dollars, ComEd applies an inflation adjustment to these factors. This adjustment is derived annually by using the real and nominal 20-year yields from the U.S. Treasury web site.
Distribution losses: Since all avoided costs are based on “busbar” energy and capacity, DSMore uses distribution loss factors to take the measure savings and convert them to busbar values. In the past, ComEd relied exclusively on its Distribution Loss studies which are prepared in support of rate cases. These studies determine the average annual losses as a percentage of load, as well as the peak loss value. Based on guidance from NRDC, ComEd has conducted some empirical analyses to assess the marginal losses associated with energy efficiency. This type of analysis is rooted in the expectations that, since a significant fraction of distribution losses are non-linear (I2R losses), reducing the load on a given feeder, transformer or substation will reduce distribution losses for the remaining load. ComEd’s Capacity Planning department conducted a few scenario analyses using CYME power calculation software from Cooper Technologies. CYME can provide an 8,760 hour analysis using actual feeder data that has been collected through SCADA. These scenarios were limited to three individual feeders due to the complexity involved in modeling systems through CYME. The results of these analyses showed marginal/average loss ratios ranging from 0.9 to 2.1, with an averaged value around 1.65. This value was extrapolated to the remaining distribution system to arrive at a new value of 9.24% marginal distribution loss.
3
Unlike distribution losses, transmission losses are based solely on the average loss factors; this is due to the way the transmission system is managed by PJM – there is a substantial amount of non-native load on this system; as a result we see transmission peaks that do not coincide with distribution peak loads. This is likely due to available transmission capacity being recaptured to route power into and out of the ComEd zone of PJM. In other words, any reduction in transmission load due to energy efficiency would likely be repurposed for other revenue-generating power movement. While inclusion of average losses is needed to convert customer savings to busbar avoided costs, marginal losses at the transmission level would likely lead to an overstatement of avoided costs. We used the average loss factor of 1.78% for transmission losses.
The combined T&D loss factor is 9.24% plus 1.78%, or 11.02%.
Peak T&D loss ratio:
The 2011 Distribution loss study identified a peak T&D loss value of 14.46%, and an average loss value of 7.38%. The ratio of these two factors is 1.96, which represents the peak T&D loss ratio to be used by DSMore. We assume that this ratio contribution is equally applicable to marginal losses. Since DSMore does not allow direct entry of a peak T&D loss factor for avoided capacity cost purposes, ComEd treats the 1.96 ratio as a multiplier against the avoided capacity cost in its model.