47
Appendix C Assessment of Flows Passing Morelos Dam with Future Drop 2 Reservoir Operations June 2007
Appendix C Assessment of Flows Passing
Morelos Dam with Future Drop 2 Reservoir Operations
June 2007

U.S. Department of the Interior May 2007 Bureau of Reclamation
Assessment of Historical Flows Arriving at and Passing Morelos Diversion Dam
And Assessment of Potential Reductions
That May Result from Future Drop 2 Reservoir Operations
CONTRIBUTORS
Brown and Caldwell: Rubin Zubia, Sabre Duren, Robin Lee
Reclamation: Don Young, Bill Greer, Cynthia Hoeft, Scott Tincher
i

Table of Contents INTRODUCTION.............................................................................................................................1
BACKGROUND ...............................................................................................................................1
CURRENT RIVER OPERATIONS................................................................................................2
MEXICO DELIVERIES ..................................................................................................................3
LIMITROPHE REACH OF THE COLORADO RIVER ............................................................4
ASSESSMENT OF HISTORIC FLOWS .......................................................................................5
PERIOD OF ANALYSIS AND FLOW VALUES ..................................................................................7
DATA COLLECTION AND FLOW CALCULATIONS .............................................................7
WATER ARRIVING ABOVE THE MORELOS DIVERSION DAM .....................................................7 MEXICO’S SCHEDULED DELIVERIES AT MORELOS DIVERSION DAM .......................................7 MEXICO DIVERSIONS AT THE MORELOS DIVERSION DAM ........................................................8 NON-STORABLE FLOWS (NSFS) ...................................................................................................8 BASEFLOWS ARRIVING ABOVE THE MORELOS DIVERSION DAM..............................................8 PORTION OF HISTORIC NSFS DIVERTED BY MEXICO ................................................................8 PORTION OF HISTORIC NSFS THAT PASSED MORELOS DIVERSION DAM.................................8 OTHER SURFACE FLOWS THAT ENTER THE LIMITROPHE REACH............................................9
FINDINGS FROM HISTORIC FLOW ANALYSIS.....................................................................9
ADJUSTMENT TO RECONCILE DIFFERENCES BETWEEN THE REPORTED DAILY AND MONTHLY WATER DELIVERIES TO MEXICO ...................................................................15
CONSERVATION OF WATER IN DROP 2 RESERVOIR......................................................19
EFFECT OF CONSERVED WATER ON FLOWS PASSING MORELOS DIVERSION DAM..........................................................................................................................................................25
OTHER FLOWS ENTERING THE LIMITROPHE REACH ..................................................30
MODEL UNCERTAINTY AND OTHER CONSIDERATIONS ..............................................37
FINDINGS.......................................................................................................................................37
EXPLANATION OF DIFFERENCES IN VALUES FOUND IN TABLES 1, 7, 8 AND 11....41
ii
List of Tables and Figures
Tables
Table 1 Summary of Historic Annual Flow Values…………………………………...…....page 14 Table 2 Example of Adjustment of Daily Flow Values to Reconcile
NSFs with Monthly Accounting Process for Water Deliveries to Mexico at the Morelos Diversion Dam………………………………………….page 17
Table 3 Months Determined to be in Floodflow Conditions on the Colorado River and Gila River.………………………………………………….....page 21
Table 4 Record Period Adjustments for Floodflow Periods……………..............................page 22 Table 5 Comparison of NSFs, Conserved NSFs, and Residual NSFs.
(with Exclusion of Floodflow Periods)……………………………….…………....page 22 Table 6 Comparison of NSFs and Residual NSFs
(Adjusted For Monthly Accounting of Deliveries to Mexico And with Exclusion of Floodflow Periods) …………………………………...…...page 25
Table 7 Comparison of portion of NSFs and Residual NSFs Diverted By Mexico at the Morelos Diversion Dam (Adjusted for Monthly Accounting of Deliveries to Mexico and with Exclusion of Floodflow Periods)………………………………..………………………………....................page 26
Table 8 Comparison of Portion of NSFs Passing Morelos Diversion Dam (Without reservoir) and Portion of Residual NSFs Passing Morelos Diversion Dam with Drop 2 Reservoir (Adjusted for Monthly Accounting of Deliveries to Mexico and with Exclusion of Floodflow Periods)………………………………………………….…...................page 26
Table 9 Comparison of NSFs Arriving Above Morelos Diversion Dam, Portion of NSFs Diverted by Mexico, and Portion of NSFs That Pass Morelos Diversion Dam Without and With Drop 2 Reservoir (Inclusive of Floodflow Periods)……………….……….………………………….page 30
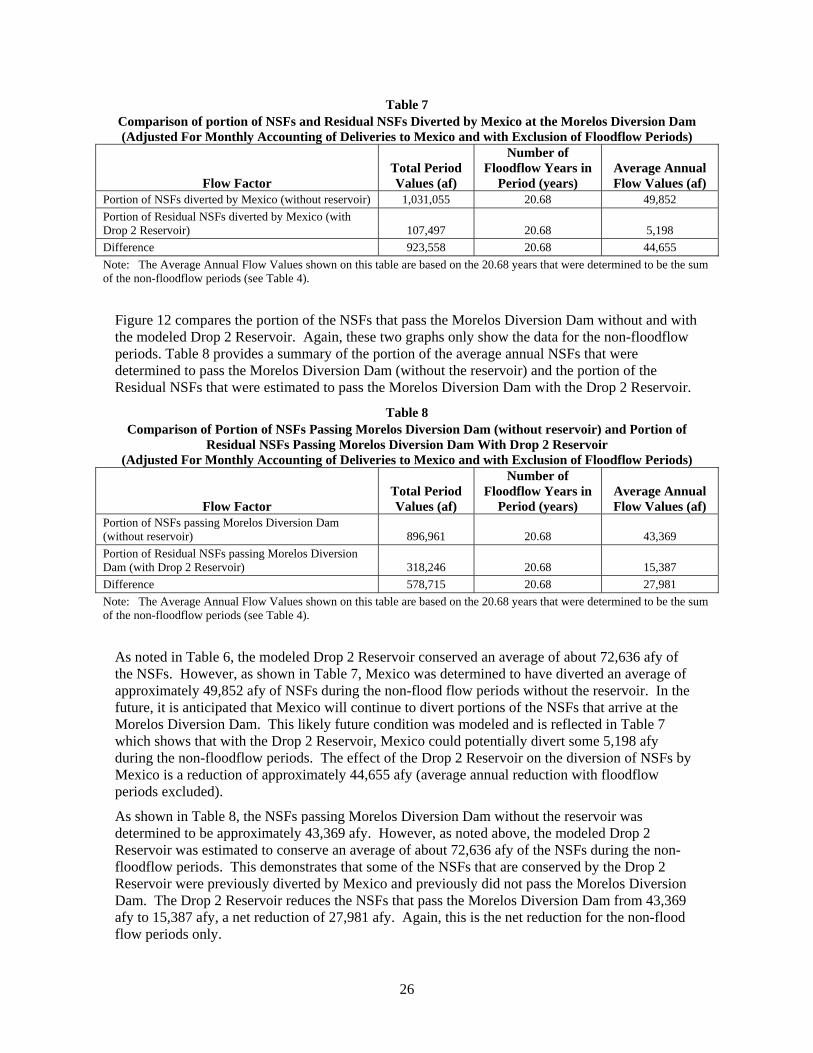
Table 10 Summary of Flows Discharged to Limitrophe Reach below Morelos Diversion Dam via 11-Mile and 21-Mile Wasteways for Period between 1974 and 2004………………………………………………....page 31
Table 11 Comparison of NSFs Arriving Above Morelos Diversion Dam, Portion of NSFs Diverted by Mexico and Portion of NSFs That Pass Morelos Diversion Dam Without and With Drop 2 Reservoir (With Floodflow Periods Excluded…………………………......page 38
Table 12 Comparison of NSFs Arriving Above Morelos Diversion Dam Portion of NSFs Diverted by Mexico, and Portion of NSFs That Pass Morelos Diversion Dam without and With Drop 2 Reservoir (Includes Floodflow Periods)…………………………………...page 38
Table 13 Periods with No Non-Storable Flows Passing Morelos Diversion Dam...................page 39
iii

Figures
Figure 1 General Location of Proposed Drop 2 Reservoir Site………………………………page 2 Figure 2 General Layout of Colorado River Facilities in the Yuma Area……………………page 6 Figure 3 Comparison of Gage Flow Readings to Calculated Flow in the Colorado River Channel below the Morelos Diversion Dam……………………...page 10 Figure 4 Comparison of Mexico’s Scheduled Deliveries at the Morelos Diversion Dam, Flows Arriving above the Morelos Diversion Dam and NSFs Arriving above the Morelos Diversion Dam (Unadjusted Flows)………………………………………………………………...page 11 Figure 5 Comparison of Mexico’s Scheduled Deliveries at the Morelos
Diversion Dam, Mexico Diversions at the Morelos Diversion Dam and Portion of NSFs Diverted by Mexico (No Adjustments)……………………...page 12
Figure 6 Comparison of Non-storable Flows Arriving above Morelos Diversion Dam, Portion of NSFs Diverted by Mexico and Portion of NSFs That pass Morelos Diversion Dam (No Adjustments)…………………………………………………………………..page 13
Figure 7 Comparison of Mexico’s Scheduled Deliveries at the Morelos Diversion Dam, Flows Arriving above the Morelos Diversion Dam and Total Nonstorable Flows Arriving above the Morelos Diversion Dam (Adjusted for Monthly Accounting of Deliveries to Mexico)…………………...…page 18
Figure 8 Comparison of Mexico’s Scheduled Deliveries at the Morelos Diversion Dam Flows Arriving above the Morelos Diversion Dam and NSFs Arriving above the Morelos Diversion Dam (Adjusted for Monthly Accounting of Deliveries to Mexico and with the Exclusion of Floodflow Periods)…………………….…………….....page 23
Figure 9 Comparison of NSFs, Conserved Portion of NSFs and Residual NSFs (Adjusted For Monthly Accounting of Deliveries to Mexico and with Exclusion of Floodflow Periods)……………….…page 24
Figure 10 Comparison of Non-storable Flows to Residual NSFs with Exclusion of Floodflow Periods (Residual NSF is portion of NSF that could not be captured by Drop 2 Reservoir)………………………..…………………………page 27
Figure 11 Comparison of Portion of NSFs Diverted by Mexico to Portion of Residual NSFs Diverted By Mexico with Exclusion of Floodflow Periods………………………………………………………………….page 28
Figure 12 Comparison of NSFs Passing Morelos Diversion Dam without and With Drop 2 Reservoir (Floodflow Periods Excluded)…..…………...page 29
Figure 13 Comparison of NSFs Passing the Morelos Diversion Dam Without and With Drop 2 Reservoir (Total Record Period Includes Floodflow Periods)……………………………..………………………...page 32
Figure 14 Deliveries to Colorado River Channel Via 11-Mile Wasteway…………………....page 33 Figure 15 Deliveries to Colorado River Channel Via 21-Mile Wasteway…………………....page 34 Figure 16 Deliveries to Colorado River Channel Below Morelos Diversion
Dam via MODE No. 3 Wasteway…………………………………….…………....page 35 Figure 17 Total Deliveries to Colorado River Channel below Morelos Diversion
Dam via 11-Mile, 21-Mile, and MODE No. 3 Wasteways………………………...page 36 Figure 18 Portion of Non-storable Flows Passing Morelos Diversion Dam
(5-year period between 2000 to 2004)……………………………………………..page 40
iv
INTRODUCTION This technical memorandum presents the results of an assessment of the historic Colorado River flows arriving at and passing the Morelos Diversion Dam. The assessment also considers how future flows at this location may change with the construction and future operation of the proposed Drop 2 Reservoir. This assessment considers the flows delivered by the U.S. Bureau of Reclamation (Reclamation) to the Northerly International Boundary (NIB) between the United States and Mexico, the diversions by Mexico at the Morelos Diversion Dam, and the surface water that passes Morelos Diversion Dam and enters the downstream portion of the Limitrophe Reach of the Colorado River. The Limitrophe Reach is the section of the river that extends between the NIB and the Southerly International Boundary (SIB) between the United States and Mexico.
The construction and future operation of the Drop 2 Reservoir is expected to increase Reclamation’s ability to re-regulate flows in the lower part of the Colorado River. This will improve Reclamation’s ability to manage the water of the lower Colorado River. The proposed Drop 2 Reservoir will facilitate conservation of flows that are currently considered to be non-storable due to inadequate re-regulating storage capacity in the lower part of the Colorado River. The future operation of the Drop 2 Reservoir may potentially affect the volumes of non-storable flows that arrive at NIB, the portion of the non-storable flows that are diverted by Mexico, and the portion of the non-storable flows that pass Morelos Diversion Dam. By definition, non-storable flows (NSFs) represent Colorado River or Gila River water that cannot be captured or put to beneficial uses in the United States at the time that it is in excess of the water demands of United States users and the United States’ Colorado River water delivery obligation to Mexico at NIB.
BACKGROUND Reclamation is evaluating the feasibility of constructing additional storage capacity that can be used to improve the management of the lower Colorado River water supply. The additional storage capacity will provide various benefits with the principal benefit being the enhancement of Reclamation’s ability to re-regulate the river flows in the river reach below Parker Dam. This enhancement will enable Reclamation and the various water users in the lower part of the river to conserve NSFs. The conserved water can then be made available to meet future beneficial use in the United States.
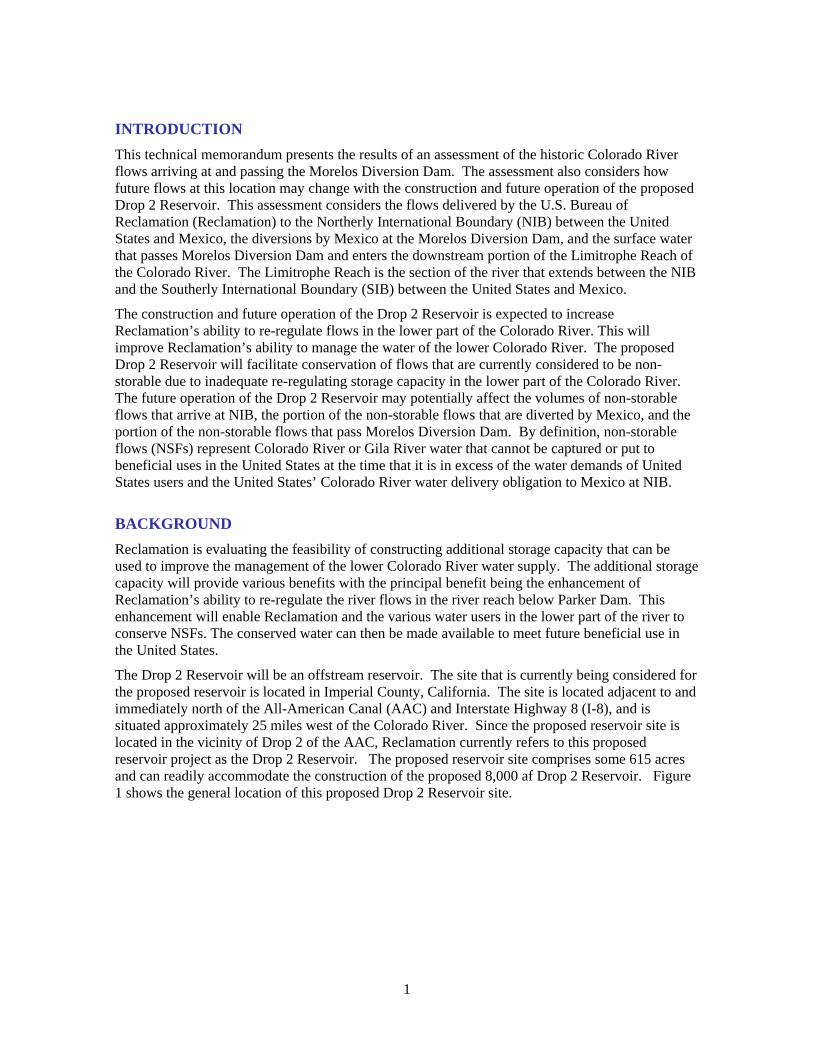
The Drop 2 Reservoir will be an offstream reservoir. The site that is currently being considered for the proposed reservoir is located in Imperial County, California. The site is located adjacent to and immediately north of the All-American Canal (AAC) and Interstate Highway 8 (I-8), and is situated approximately 25 miles west of the Colorado River. Since the proposed reservoir site is located in the vicinity of Drop 2 of the AAC, Reclamation currently refers to this proposed reservoir project as the Drop 2 Reservoir. The proposed reservoir site comprises some 615 acres and can readily accommodate the construction of the proposed 8,000 af Drop 2 Reservoir. Figure 1 shows the general location of this proposed Drop 2 Reservoir site.
1
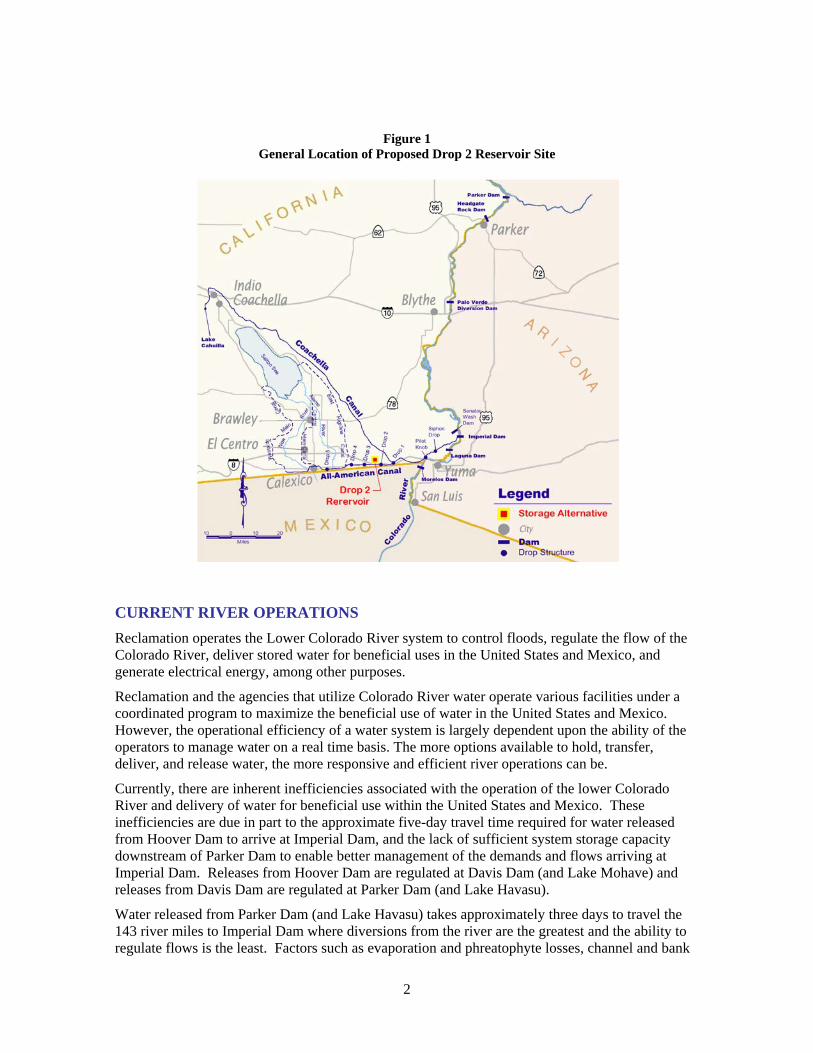
Figure 1 General Location of Proposed Drop 2 Reservoir Site
CURRENT RIVER OPERATIONS Reclamation operates the Lower Colorado River system to control floods, regulate the flow of the Colorado River, deliver stored water for beneficial uses in the United States and Mexico, and generate electrical energy, among other purposes.
Reclamation and the agencies that utilize Colorado River water operate various facilities under a coordinated program to maximize the beneficial use of water in the United States and Mexico. However, the operational efficiency of a water system is largely dependent upon the ability of the operators to manage water on a real time basis. The more options available to hold, transfer, deliver, and release water, the more responsive and efficient river operations can be.
Currently, there are inherent inefficiencies associated with the operation of the lower Colorado River and delivery of water for beneficial use within the United States and Mexico. These inefficiencies are due in part to the approximate five-day travel time required for water released from Hoover Dam to arrive at Imperial Dam, and the lack of sufficient system storage capacity downstream of Parker Dam to enable better management of the demands and flows arriving at Imperial Dam. Releases from Hoover Dam are regulated at Davis Dam (and Lake Mohave) and releases from Davis Dam are regulated at Parker Dam (and Lake Havasu).
Water released from Parker Dam (and Lake Havasu) takes approximately three days to travel the 143 river miles to Imperial Dam where diversions from the river are the greatest and the ability to regulate flows is the least. Factors such as evaporation and phreatophyte losses, channel and bank
2

storage gains or losses, weather conditions, unscheduled pumping from the river, and variations in return flows from water users can significantly affect water deliveries and river regulation. The limited regulating capacity that is available downstream of Parker Dam is located principally in Senator Wash Reservoir, and behind Imperial Dam. Since 1992, operating restrictions have been imposed on Senator Wash Reservoir. The operational restriction of Senator Wash Reservoir is associated with Safety of Dams concerns and has reduced the useable storage capacity from 12,259 acre-feet (af) to 7,567 af (approximately 4,700 af less storage capacity). These operational limitations imposed on Senator Wash Reservoir have made it much more difficult for the river operators to manage the differences between the water demands and water arriving at Imperial Dam.
Once released from Parker Dam, there is limited capacity to regulate river flows to accommodate changes in demand for water by downstream users in the United States. Water released from Parker Dam pursuant to a user’s order may be rejected by that user for the following reasons:
1. Unexpected changes in weather including rain, wind, or cooler than expected temperatures.
2. Unexpected damage or failure of canal facilities.
3. Unexpected changes in water requests from farmers due to on-farm irrigation system problems or unexpected on-farm management problems.
Any water released from Parker Dam that exceeds actual demands at the time of arrival at Imperial Dam is managed in one of the following ways:
1. Put in storage at Senator Wash Reservoir, or behind Imperial Dam.
2. Delivered to another water user needing to divert more water than it ordered for that day.
3. Delivered to Mexico as part of its scheduled delivery or as non-storable water.
4. Released from Imperial Dam and passed through the Laguna Desilting Basin and Laguna Dam to temporarily store the water and or slow down the travel time that it takes for the NSF’s to reach the Morelos Diversion Dam.
Flows above actual water user demands that are inadvertently delivered to Mexico in excess of Mexico’s total scheduled daily delivery at Morelos Diversion Dam are considered to be non-storable flows (NSFs). If the monthly sum of the daily NSFs cause the deliveries to Mexico to be in excess of their monthly order, then this water is in excess of Mexico’s scheduled delivery for the month. The United States receives no credit for water that is over delivered to Mexico.
NSFs may also result from infrequent and unregulated inflow from numerous desert washes that discharge into the Colorado River between Parker Dam and Imperial Dam and into the Gila River below Painted Rock Dam. Flood control releases from Hoover Dam and or Parker Dam are normally in excess of downstream demands and also result in NSFs.
The available regulatory storage capacity in Senator Wash Reservoir and behind Imperial Dam has been determined to be insufficient to adequately manage the NSFs. The limited storage capacity has been further exacerbated by the maximum water surface elevation restrictions that have been imposed on Senator Wash Reservoir on an indefinite basis.
MEXICO DELIVERIES Mexico is entitled to receive an aggregate of 1.5 million acre-feet per year (mafy) of Colorado River water delivered at the NIB and SIB consistent with the 1944 Treaty between the United States and Mexico (1944 Treaty). Of this amount, a minimum of 1.36 million acre-feet (maf) are required to be delivered in the bed of the Colorado River at the NIB and approximately 140,000 af
3

in aggregate of Colorado River water (normally consisting of return flows) are delivered in the section of the Limitrophe Reach located downstream of the Morelos Diversion Dam and at the SIB, to Mexico’s Sanchez Mejorada Canal.
In the event Lake Mead is in flood control or space building release conditions, Mexico may increase its annual water order by up to 200,000 af for a maximum total of 1.7 maf. In the event of a declared shortage, water deliveries to Mexico may be reduced in proportion to the reduced consumptive use in the United States.
In December of each year, Mexico provides the United States with an advance monthly water order for the following year. With the exception of emergency conditions, this water order can only be changed by providing the United States 30 days advance written notice, and each monthly water order can be increased or decreased by no more than 20 percent of the original monthly water order.
Mexico’s daily water orders are submitted to the schedulers at Imperial Dam on Wednesday for the following week which starts on Monday for scheduling purposes. Mexico’s daily water order cannot be changed once it is received by Reclamation. This order contains both Mexico’s total daily water order and their desired delivery at the SIB. The difference between Mexico’s total water order and their requested flow at SIB, plus estimated flow at the Cooper Wasteway is calculated and becomes the target water delivery for Mexico at the Morelos Diversion Dam.
LIMITROPHE REACH OF THE COLORADO RIVER The Limitrophe Reach of the Colorado River is the segment of the river that extends from the NIB to the SIB. This reach of the Colorado River serves as the international boundary between Mexico and the United States. The Limitrophe Reach has a meandering channel with extremely irregular channel geometry and significant variation in channel sinuosity and slope. In general, the invert slope decreases and the channel width increases downstream from NIB. The Limitrophe Reach is approximately 24 miles long.
Located 1.1 miles downstream of the NIB is the Morelos Diversion Dam. This dam functions as a diversion control structure for the Alamo Canal (also referred to as the Reforma Canal), which conveys water to Mexico. The Morelos Diversion Dam is an L-shaped structure consisting of the river portion that spans across the Colorado River channel in a westerly direction, and the adjoining intake structure (the intake to the Alamo Canal) that extends in a northerly direction and is used to control diversions westward to the canal system in Mexico. The Morelos Diversion Dam is operated and maintained by Mexico under the supervision of the International Boundary and Water Commission (IBWC). The IBWC is a bi-national organization responsible for administration of the provisions of the 1944 Treaty, which includes the Colorado River waters allotted to Mexico, protection of lands along the Colorado River from floods by levee and floodway construction projects, resolution of international boundary water sanitation and other water quality problems, and preservation of Colorado River as the international boundary. The IBWC consists of the United States Section (USIBWC) and the Mexican Section.
All or most of the water that arrives above the Morelos Diversion Dam, under normal conditions, is diverted by Mexico at the Morelos Diversion Dam and conveyed to water users on the Mexico side of the river. Typically, the water arriving above the Morelos Diversion Dam can comprise of:
1. United States delivery of Colorado River water to Mexico pursuant to water ordered by Mexico consistent with the 1944 Treaty, and
2. NSFs.
4

The NSFs result from differences between the water demand of users in the United Sates that take water from Imperial Dam and the actual water arriving above Imperial Dam. If the water arriving above Imperial Dam exceeds the demand of the of users for that day, and if this water cannot be stored in Senator Wash, or Imperial Reservoirs, then the water is categorized as NSF and this water is routed downstream to the NIB.
The United States has no control of the water once it arrives at the NIB. Mexico has the ability to, and often does, divert water in excess of their order (NSF’s) if such water is available. Any water that arrives at the NIB and that is not diverted by Mexico passes the river portion of the Morelos Diversion Dam and enters the portion of the Limitrophe Reach of the Colorado River that extends below the Morelos Diversion Dam.
Other active flow structures from the irrigation canal systems on the United States side of the river located within the Limitrophe Reach include the Cooper, 11-Mile and 21-Mile wasteways. The water entering the river from these wasteways generally consists of return flows from the Yuma Valley irrigation system. A fourth wasteway that can discharge from the Main Outlet Drain Extension (MODE) is referred to as MODE No. 3, which is located immediately downstream of the Morelos Diversion Dam on the United States side of the river. This wasteway is seldom used...
The Cooper Wasteway is located between the NIB and the Morelos Diversion Dam. The combined flows of the water arriving at the NIB plus the flows provided by the Cooper Wasteway comprise the flows that we hereinafter refer to as the flows arriving above the Morelos Diversion Dam.
ASSESSMENT OF HISTORIC FLOWS In order to determine whether the water that will be conserved by the proposed Drop 2 Reservoir will reduce the volume of water that enters the portion of the Limitrophe Reach that extends below the Morelos Diversion Dam, it is first necessary to evaluate and better understand the historic flows that have been observed in the part of the river located above and below the Morelos Diversion Dam. This part of the analysis was simplified by focusing on the flows that occur at the following three general locations:
1. Historic NSFs arriving above the Morelos Diversion Dam,
2. Portion of historic NSFs diverted by Mexico at the Morelos Diversion Dam, and
3. Portion of historic NSFs that passed the Morelos Diversion Dam.
In addition, the analysis also attempted to quantify the other surface flows that enter the Limitrophe Reach, i.e. discharges from the Cooper, MODE No. 3, 11-Mile and 21-Mile wasteways.
5

Figure 2 provides a schematic that shows the general layout of the main features of the Colorado River and the various conveyance facilities that divert from, or discharge to, the Colorado River in the Yuma area.
Figure 2
General Layout of Colorado River Facilities in the Yuma Area
Flow FromParker Dam
Senator WashReservoir
Imperial Dam
Laguna Dam To Gila Gravity Main Canal Users
Gila River
Siphon Drop Powerplant Main Outlet Drain Extension (MODE)
California WastewayTo Yuma Valley Users
Pilot Knob Powerplant and City of Yuma
To IID & All-American CanalCVWD Main Outlet Drain Extension (MODE)
Northerly International Boundary (NIB)Gage, Colorado River at NIB
Morelos Diversion Dam Cooper Wasteway
MEXICO MODE 3
Gage (Pre-1983), Colorado RiverBelow Morelos Diversion Dam
Alamo Canal(Reforma Canal)
11-Mile Wasteway
U.S. Bypass DrainDam
Gage 21-Mile Wasteway
Powerplant
Gage, Colorado River at SIB Southerly International Boundary (SIB)
MEXICOTo the Gulf of California
Legend
All-
Am
eric
an C
anal
Col
orad
o R
iver
Col
orad
o R
iver
6

Period of Analysis and Flow Values The analysis included an evaluation of available flow records for the Colorado River in the vicinity of the Morelos Diversion Dam. The goal was to provide a sufficiently large period of analysis to assess how the NSFs varied under different hydrologic and river operation conditions. The 31-year period from 1974 to 2004 was selected based on the availability of data, and the fact that the United States began operating the river under the provisions of Minute 242 with Mexico in 1974. The flow data analysis used mean daily flow values (in cubic feet per second [cfs]).
DATA COLLECTION AND FLOW CALCULATIONS Historic data was collected and/or calculated for flows on the Colorado River between Imperial Dam and the SIB (see Figure 2) as follows:
Water Arriving Above the Morelos Diversion Dam The water arriving above the Morelos Diversion Dam was calculated by adding the mean daily flow values reported at the NIB gage to the mean daily flow values reported for the Cooper Wasteway gage. The NIB gage is located within the mainstem of the Colorado River. The Cooper Wasteway discharges to the Colorado River at a location between NIB and Morelos Diversion Dam.
Mexico’s Scheduled Deliveries at Morelos Diversion Dam The mean daily values for the Mexico scheduled deliveries at the Morelos Diversion Dam had to be calculated for the period between 1974 through 1997. For the period between 1998 through 2004, the mean daily values for Mexico’s daily deliveries at the NIB were obtained from the Master Schedule of mean daily deliveries provided by Reclamation.
The mean daily values for Mexico’s scheduled deliveries at the Morelos Diversion Dam for the period between 1974 through 1997 were estimated by subtracting reported deliveries to Mexico at the SIB, Limitrophe Reach, and Tijuana from Mexico’s total scheduled daily water orders.
The general equation used in this calculation is as follows: Mexico’s Scheduled Mean Daily Delivery at Morelos Diversion Dam = Total Scheduled Mexican Mean Daily Delivery + Reported Mean Daily Flow at Cooper Wasteway – Mean Daily Deliveries to Mexico at other Locations Other than at the Morelos Diversion Dam
Where: Deliveries to Mexico at other Locations Other than at the Morelos Diversion Dam = Reported Mean Daily Flow at Cooper Wasteway + Reported Mean Daily Flow at 11-mile Wasteway + Reported Mean Daily Flow at 21-mile Wasteway + Reported Mean Daily Flow at West Main Canal Wasteway + Reported Mean Daily Flow at East Main Canal Wasteway + Reported Mean Daily Flow at Yuma Main Drain + Reported Mean Daily Flow at 242 Well Field + Reported Mean Daily Delivery at Tijuana
Also, for the period between January 1, 1974 and June 31, 1974, an additional mean daily flow of 131 cfs was assumed to be delivered to Mexico within the Colorado River channel at a point below the Morelos Diversion Dam. This was assumed to be delivered and discharged to the mainstream Colorado River channel at the MODE No. 3 Wasteway. For the period between January 1, 1974 through June 31, 1974, the 131 cfs was subtracted from the Total Scheduled Mexico Delivery along with the other deliveries to calculate Mexico’s scheduled deliveries at the NIB. This flow is intended to account for deliveries made to Mexico pursuant to Minute 241 of which its provisions were in effect between 1972 through June of 1974. Pursuant to Minute 241, the United States delivered approximately 95,000 acre-feet per year (afy) at the MODE No. 3 Wasteway (below the
7
Morelos Diversion Dam). These deliveries to Mexico at the MODE No. 3 Wasteway were included as part of the 1.5 maf of Colorado River water delivered to Mexico pursuant to the 1944 Treaty. The mean daily flow of 131 cfs discharged to the river via the MODE No. 3 Wasteway assumes that the 95,000 afy is provided as a continuous even flow throughout the year.
Mexico Diversions at the Morelos Diversion Dam Mexico’s diversions are the flow values reported at the inlet structure to the Alamo Canal which is located on Mexico’s side of the Morelos Diversion Dam.
Non-Storable Flows (NSFs) The NSFs were calculated by comparing the flows arriving above the Morelos Diversion Dam to Mexico’s scheduled deliveries at the Morelos Diversion Dam (NIB plus Cooper Wasteway flows). If the flows arriving above the Morelos Diversion Dam exceeded Mexico’s scheduled mean daily deliveries at the Morelos Diversion Dam, the difference was assumed to be the mean daily value of the NSF.
Baseflows Arriving Above the Morelos Diversion Dam The baseflows arriving above the Morelos Diversion Dam were calculated by subtracting the calculated NSF values from the water arriving above the Morelos Diversion Dam. This baseflow value is used in subsequent steps of the analysis.
Portion of Historic NSFs Diverted by Mexico The portion of historic NSFs diverted by Mexico were calculated by comparing Mexico’s diversions at the Morelos Diversion Dam to Mexico’s scheduled deliveries at the Morelos Diversion Dam. If the mean daily flow values of the Mexico diversions were greater than the mean daily flow values of the Mexico scheduled deliveries at the Morelos Diversion Dam, then the difference was assumed to represent the portion of the NSF diverted by Mexico at the Morelos Diversion Dam.
Portion of Historic NSFs that Passed Morelos Diversion Dam Prior to 1983, a stream gage recorded flows in the Colorado River channel below the Morelos Diversion Dam. However, in 1983, the gage was washed out during a flood and it has never been replaced. As such, two methods were used to determine the portion of the historic NSFs that pass the Morelos Diversion Dam and that enter the downstream reach of the Colorado River. First, for years 1974 to 1982, mean daily flow values reported for the gage located downstream of the Morelos Diversion Dam were assumed to represent the portion of the NSF that passed the Morelos Diversion Dam. However, prior to 1979, the MODE No. 3 Wasteway discharged flows into the mainstem at a location between the Morelos Diversion Dam and the gage located in the Colorado River channel downstream of Morelos Diversion Dam. As such, these mean daily flows were subtracted from the mean daily flow values reported for the gage located downstream of Morelos Diversion Dam to gain a more accurate representation of the portion of the historic NSFs that pass Morelos Diversion Dam.
As noted above, the gage that was used to record flows below the Morelos Diversion Dam was washed out in 1983. Since then, the portion of the NSF that pass Morelos Diversion Dam have been calculated by USIBWC by subtracting the Mexico’s Diversions from the water arriving above the Morelos Diversion Dam. A similar process was used in this analysis. For this analysis, the portion of the historic NSFs that pass the Morelos Diversion Dam were calculated by subtracting the portion of historic NSFs diverted by Mexico from the total calculated NSF value. An analysis
8
9
was made to ascertain how the flow values calculated using this second method compared to the actual flow measurements reported for the Pre-1983 gage. Figure 3 shows how the two flows are nearly the same.
For consistency purposes and in order not to mix data sources in this analysis, the portion of the historic NSFs that pass the Morelos Diversion Dam were calculated by subtracting the portion of historic NSFs diverted by Mexico from the total calculated NSF value. This method was used for the entire period of analysis (1974 to 2004).
Other Surface Flows That Enter the Limitrophe Reach There are three locations within the section of the Limitrophe Reach that extend from Morelos Diversion Dam to SIB where other surface flows are introduced into the Colorado River channel from the United States side of the river. These correspond to discharges from the MODE No. 3, 11-Mile and 21-Mile wasteways. The MODE No. 3 Wasteway is reported to have been substantially active only through 1979. Since then, only minor and infrequent discharges from this wasteway to the mainstem have been reported. Both the 11-Mile and 21-Mile Wasteways are still active and discharge to the river. The mean daily flow values for these facilities are the values reported for the gages at each respective facility.
FINDINGS FROM HISTORIC FLOW ANALYSIS Mean daily flow values were produced for each day within the 31-year period of analysis. This enabled an assessment of the frequency, magnitude, and source of flows at the above noted locations. Figure 4 presents a comparison of Mexico’s scheduled deliveries at the Morelos Diversion Dam to the water arriving above the Morelos Diversion Dam and also shows the daily values of the NSFs.
Figure 4 shows that under normal flow conditions, both the water arriving above the Morelos Diversion Dam and Mexico’s scheduled deliveries at the Morelos Diversion Dam are less than 5,000 cfs or less. However, the flows can be substantially higher than this amount under flood flow conditions.
Figure 5 presents a comparison of Mexico’s scheduled deliveries at the Morelos Diversion Dam to Mexico’s diversions at the Morelos Diversion Dam and also shows the portion of the NSFs that were diverted by Mexico. Figure 5 shows that Mexico’s daily diversions quite often exceed their orders. This is made possible by the fact that Mexico is able to divert a significant portion of the NSFs that arrive above the Morelos Diversion Dam.
Figure 6 presents a comparison of the total estimated NSFs to the portion of the NSFs that passed the Morelos Diversion Dam and also shows the portion of the NSFs that were diverted by Mexico.
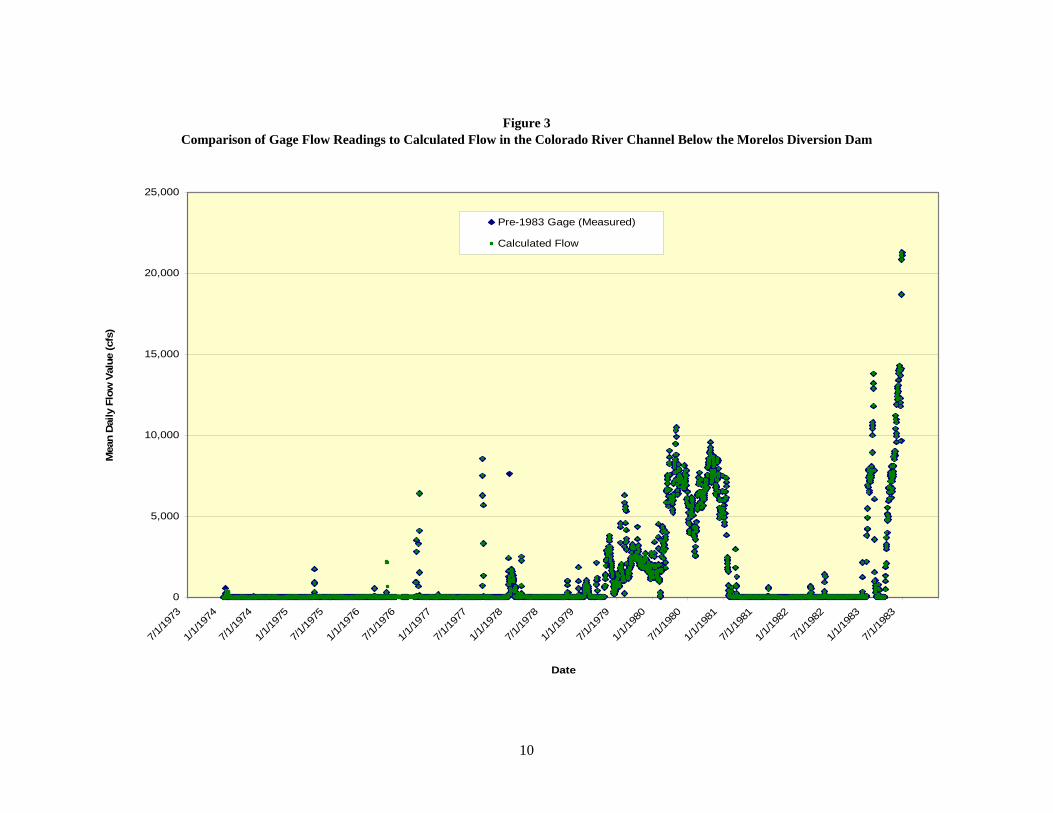
Figure 3 Comparison of Gage Flow Readings to Calculated Flow in the Colorado River Channel Below the Morelos Diversion Dam
0
5,000
10,000
15,000
20,000
25,000
7/1/19
731/1
/1974
7/1/19
741/1
/1975
7/1/19
751/1
/1976
7/1/19
761/1
/1977
7/1/19
771/1
/1978
7/1/19
781/1
/1979
7/1/19
791/1
/1980
7/1/19
801/1
/1981
7/1/19
811/1
/1982
7/1/19
821/1
/1983
7/1/19
83
Date
Mea
n D
aily
Flo
w V
alue
(cfs
)
Pre-1983 Gage (Measured)
Calculated Flow
10
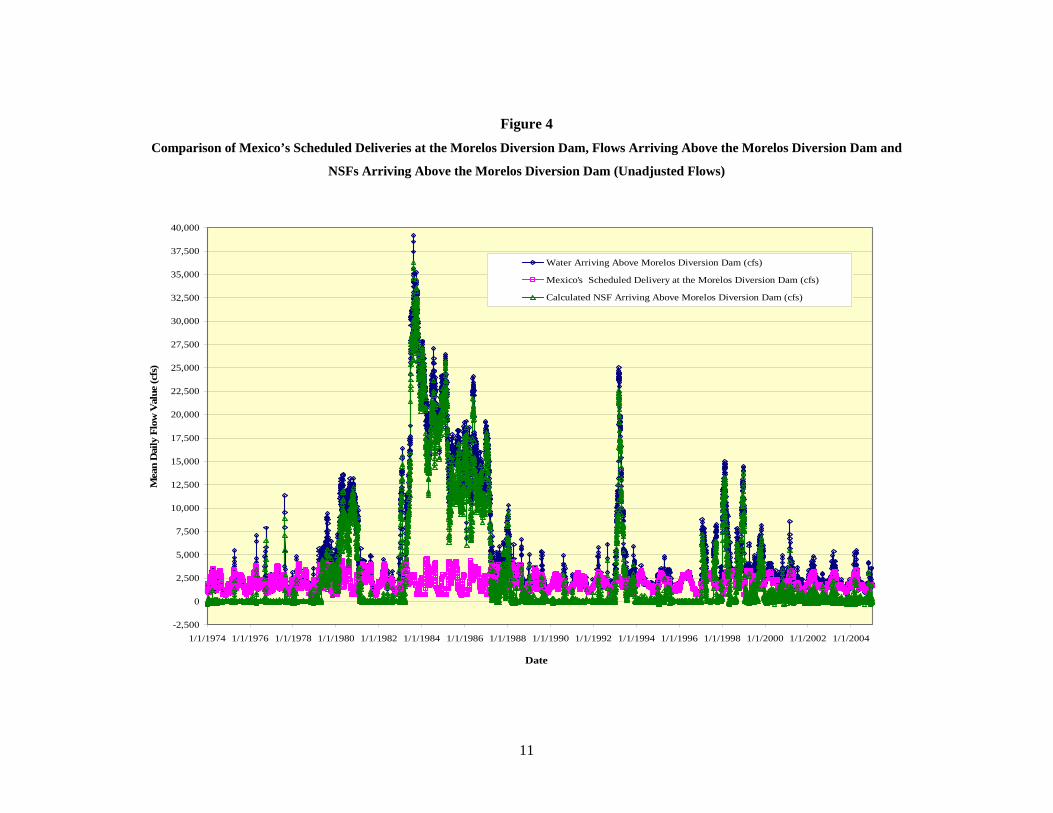
Figure 4 Comparison of Mexico’s Scheduled Deliveries at the Morelos Diversion Dam, Flows Arriving Above the Morelos Diversion Dam and
NSFs Arriving Above the Morelos Diversion Dam (Unadjusted Flows)
-2,500
0
2,500
5,000
7,500
10,000
12,500
15,000
17,500
20,000
22,500
25,000
27,500
30,000
32,500
35,000
37,500
40,000
1/1/1974 1/1/1976 1/1/1978 1/1/1980 1/1/1982 1/1/1984 1/1/1986 1/1/1988 1/1/1990 1/1/1992 1/1/1994 1/1/1996 1/1/1998 1/1/2000 1/1/2002 1/1/2004
Date
Mea
n D
aily
Flo
w V
alue
(cfs
)
Water Arriving Above Morelos Diversion Dam (cfs)
Mexico's Scheduled Delivery at the Morelos Diversion Dam (cfs)
Calculated NSF Arriving Above Morelos Diversion Dam (cfs)
11
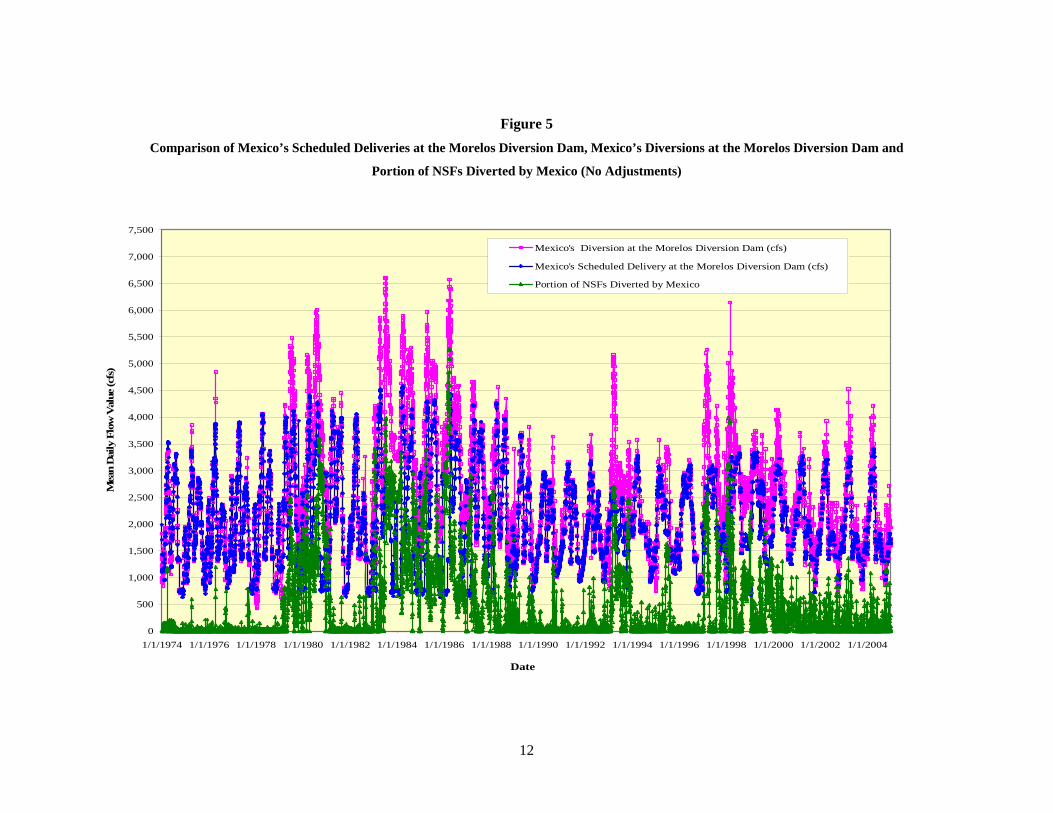
Figure 5 Comparison of Mexico’s Scheduled Deliveries at the Morelos Diversion Dam, Mexico’s Diversions at the Morelos Diversion Dam and
Portion of NSFs Diverted by Mexico (No Adjustments)
0
500
1,000
1,500
2,000
2,500
3,000
3,500
4,000
4,500
5,000
5,500
6,000
6,500
7,000
7,500
1/1/1974 1/1/1976 1/1/1978 1/1/1980 1/1/1982 1/1/1984 1/1/1986 1/1/1988 1/1/1990 1/1/1992 1/1/1994 1/1/1996 1/1/1998 1/1/2000 1/1/2002 1/1/2004
Date
Mea
n D
aily
Flo
w V
alue
(cfs
)
Mexico's Diversion at the Morelos Diversion Dam (cfs)
Mexico's Scheduled Delivery at the Morelos Diversion Dam (cfs)
Portion of NSFs Diverted by Mexico
12

0
2,500
5,000
7,500
10,000
12,500
15,000
17,500
20,000
22,500
25,000
27,500
30,000
32,500
35,000
37,500
40,000
1/1/1974 1/1/1976 1/1/1978 1/1/1980 1/1/1982 1/1/1984 1/1/1986 1/1/1988 1/1/1990 1/1/1992 1/1/1994 1/1/1996 1/1/1998 1/1/2000 1/1/2002 1/1/2004
Date
Mea
n D
aily
Flo
w V
alue
(cfs
)
Total NSFs Arriving Above Morelos Diversion Dam (cfs)
Portion of NSFs Passing Morelos Diversion Dam (cfs)
Portion of NSFs Diverted by Mexico
Comparison of Non-Storable Flows Arriving Above Morelos Diversion Dam, Portion of NSFs Diverted by Mexico, and Portion of NSFs That Pass Morelos Diversion Dam (No Adjustments)
Figure 6
13

Figure 6 confirms that Mexico diverts a significant portion of the NSFs that arrive above the Morelos Diversion Dam and also that under flood flow conditions, all or most of the NSFs pass Morelos Diversion Dam.
Table 1 provides a summary of the annual average historic flows at the different river locations that are of interest to this analysis. As noted before, Mexico’s average annual scheduled deliveries at the Morelos Diversion Dam during non-space building or non-flood release years is about 1.36 maf. As shown in Table 1, during the 31-year record period, the average annual flows arriving above the Morelos Diversion Dam was approximately 3.61 maf, which is 2.65 times the average annual scheduled deliveries to Mexico at the Morelos Diversion Dam. This high level of NSFs is principally due to the high magnitude of the flood flows that were observed in past years, particularly in the mid-1980s and again in the 1990s (see Figure 4). The proposed Drop 2 Reservoir is not expected to affect the frequency or magnitude of flood flows that arrive and/or pass the Morelos Diversion Dam and this is discussed further in a latter part of this report.
Table 1
Summary of Historic Annual Flow Values
Flow Factor Observed Values
Days in Period (1974 through 2004) 11,323 days
Years in Period (1974 through 2004) 31 years
Water Arriving Above the Morelos Diversion Dam 3,612,954 average annual afy
Mexico’s Diversion at the Morelos Diversion Dam 1,764,791 average annual afy
Mexico’s Scheduled Delivery at the Morelos Diversion Dam 1,463,685 average annual afy
Total NSF Arriving Above Morelos Diversion Dam 2,157,408 average annual afy
Portion of NSF Diverted by Mexico 321,149 average annual afy
Portion of NSF Passing Morelos Diversion Dam 1,848,163 average annual afy
The calculation of the daily NSFs and the portion thereof that is diverted by Mexico and that pass the Morelos Diversion Dam as shown in Table 1 were adjusted on a daily basis to account for differences between the reported flows at different river locations, inflow points, and diversions. In some cases, there were errors in the reported flows. For example, the reported water arriving above the Morelos Diversion Dam may have been reported to be lower than the water that was reportedly diverted by Mexico, a condition that cannot occur. Another source for these numeric differences are the under-deliveries that occur on the daily flow values but that are reconciled during the monthly accounting process for the Mexico deliveries. The process that is used to reconcile some of these differences between the reported daily and reported monthly deliveries to Mexico is discussed below. Lastly, the process used to determine if a NSF exist on any give day only considers those NSFs that are 10 cfs or greater. This was done to account for some of the inaccuracy of the stream gages and other flow measurement instruments used in the measurement of flows. This adjustment also helped to eliminate some of the differences that occurred as a result of conversion of data from metric to English units (cubic meters per second (cms) to cfs).
14

ADJUSTMENT TO RECONCILE DIFFERENCES BETWEEN THE REPORTED DAILY AND MONTHLY WATER DELIVERIES TO MEXICO As noted above, Mexico normally receives 1.5 mafy of Colorado River water pursuant to the 1944 Treaty. Of this amount, the United States is required to deliver a minimum of 1.36 mafy at the NIB. The additional 140,000 afy, in aggregate, of Colorado River water (normally consisting of return flows and wasteway flows) are delivered to Mexico at the Limitrophe Reach of the Colorado River downstream of the Morelos Diversion Dam, at the SIB, and at Tijuana. The water delivered to Mexico in Tijuana is done through a series of wheeling arrangements with various Southern California water agencies.
In December of each year, Mexico provides the United States with an advance monthly water order for the following year. This monthly water order can only be changed by providing the United States 30 days advance written notice, and each monthly water order can be increased or decreased by no more than 20 percent of the original monthly water order. While Mexico further provides the United States with a breakdown of daily water orders for each week, the accounting of the water delivered to Mexico occurs on a monthly basis pursuant to the 1944 Treaty. Therefore, there are some months where in part of that month the deliveries to Mexico at the Morelos Diversion Dam are less than what Mexico had scheduled and then for the other part of that month, the deliveries to Mexico at the Morelos Diversion Dam may be greater than what Mexico had scheduled. In such a case, the determination of an over- or under-delivery to Mexico occurs at the end of the month when the accounting for the total monthly deliveries to Mexico is reconciled. Typically when this occurs the end of month sum of the daily water deliveries (which may include daily over- or under-deliveries) normally results in an over-delivery for the month.
This end-of-month accounting process determines if the amount of water that was scheduled to be delivered to Mexico at the Morelos Diversion Dam is met or exceeded. Therefore, if the NSF values that were determined to exist on a daily basis using the historical flow data is used directly in the Drop 2 Reservoir water conservation analysis, then there is a possibility that the volume of non-storable flows can be overstated. This occurs because only the daily NSFs values are used as input for the reservoir model and therefore, the under-deliveries have to be accounted for in some other manner in the analysis. In order to account for the under-deliveries, a process was developed and used to adjust the calculated daily values of NSFs so that the end of month sum of the calculated daily values of NSFs is equal to the difference between the total monthly scheduled delivery to Mexico and the sum of the daily water deliveries, which may include daily over- and under-deliveries.
Table 2 provides an overview of the daily flow values and how the daily deliveries are summed to obtain a total monthly delivery amount for Mexico using the above monthly accounting process. The table is also used to illustrate how the daily flow values are adjusted to reconcile the daily NSF values with the end of month accounting process for the water delivered to Mexico at the Morelos Diversion Dam. The process is based on the assumption that NSFs occur on a daily basis and will be managed by the proposed Drop 2 Reservoir as they occur, which is on a daily basis.
In the example provided in Table 2, the flow values for the month of March 1974 are used. The daily values of the water arriving above the Morelos Diversion Dam are listed in Column B. The daily values of Mexico’s scheduled delivery at the Morelos Diversion Dam are listed in Column C. Under-deliveries occur when the daily values of the water arriving above the Morelos Diversion Dam is less than Mexico’s scheduled delivery value and these are listed in Column D. An over-delivery occurs when the daily value of the water arriving above the Morelos Diversion Dam is greater than Mexico’s scheduled delivery value and these are listed in Column E. The sum of the daily values for these columns and flow factors is provided in Row 34. As noted in Cell E34, the sum of the over-deliveries is 7,026 cfs (13,911 af) for the month and as noted in Cell F34, the
15
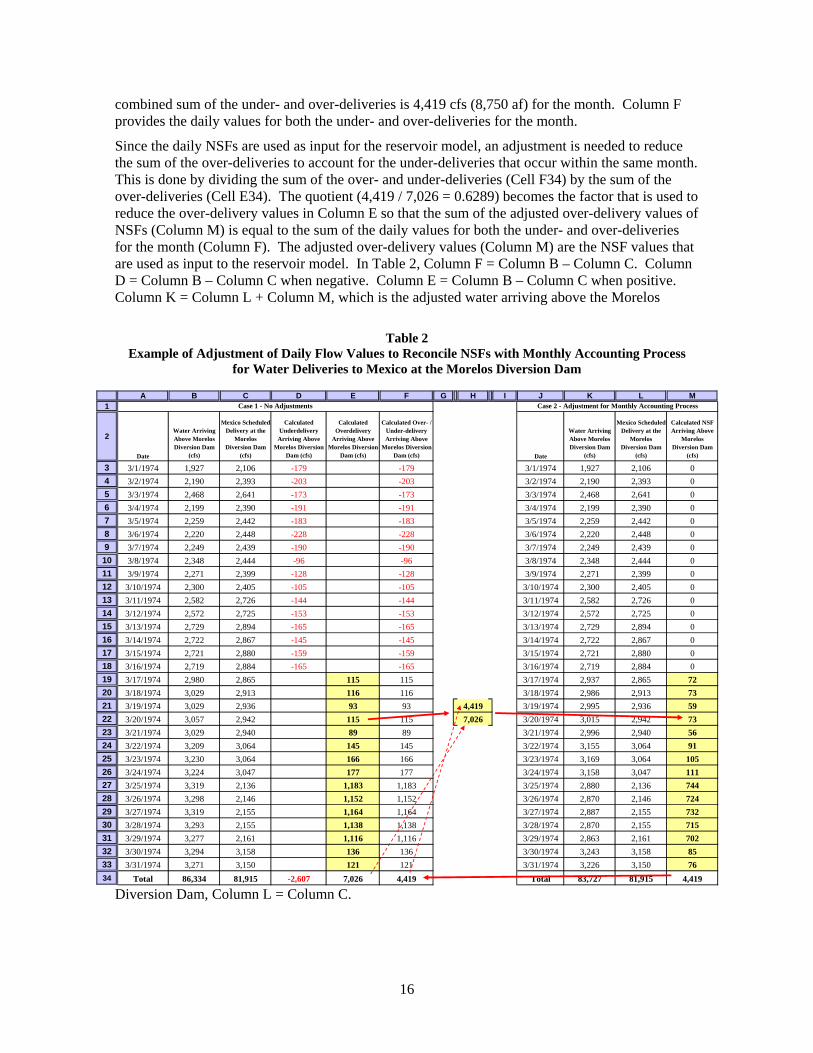
combined sum of the under- and over-deliveries is 4,419 cfs (8,750 af) for the month. Column F provides the daily values for both the under- and over-deliveries for the month.
Since the daily NSFs are used as input for the reservoir model, an adjustment is needed to reduce the sum of the over-deliveries to account for the under-deliveries that occur within the same month. This is done by dividing the sum of the over- and under-deliveries (Cell F34) by the sum of the over-deliveries (Cell E34). The quotient (4,419 / 7,026 = 0.6289) becomes the factor that is used to reduce the over-delivery values in Column E so that the sum of the adjusted over-delivery values of NSFs (Column M) is equal to the sum of the daily values for both the under- and over-deliveries for the month (Column F). The adjusted over-delivery values (Column M) are the NSF values that are used as input to the reservoir model. In Table 2, Column F = Column B – Column C. Column D = Column B – Column C when negative. Column E = Column B – Column C when positive. Column K = Column L + Column M, which is the adjusted water arriving above the Morelos
Diversion Dam, Column L = Column C.
Table 2 Example of Adjustment of Daily Flow Values to Reconcile NSFs with Monthly Accounting Process
for Water Deliveries to Mexico at the Morelos Diversion Dam
A B C D E F G H I J K L M1
2
Date
Water Arriving Above Morelos Diversion Dam
(cfs)
Mexico Scheduled Delivery at the
Morelos Diversion Dam
(cfs)
Calculated Underdelivery
Arriving Above Morelos Diversion
Dam (cfs)
Calculated Overdelivery
Arriving Above Morelos Diversion
Dam (cfs)
Calculated Over- / Under-delivery Arriving Above
Morelos Diversion Dam (cfs) Date
Water Arriving Above Morelos Diversion Dam
(cfs)
Mexico Scheduled Delivery at the
Morelos Diversion Dam
(cfs)
Calculated NSF Arriving Above
Morelos Diversion Dam
(cfs)
3 3/1/1974 1,927 2,106 3/1/1974 1,927 2,106 04 3/2/1974 2,190 2,393 3/2/1974 2,190 2,393 05 3/3/1974 2,468 2,641 3/3/1974 2,468 2,641 06 3/4/1974 2,199 2,390 3/4/1974 2,199 2,390 07 3/5/1974 2,259 2,442 3/5/1974 2,259 2,442 08 3/6/1974 2,220 2,448 3/6/1974 2,220 2,448 09 3/7/1974 2,249 2,439 3/7/1974 2,249 2,439 010 3/8/1974 2,348 2,444 3/8/1974 2,348 2,444 011 3/9/1974 2,271 2,399 3/9/1974 2,271 2,399 012 3/10/1974 2,300 2,405 3/10/1974 2,300 2,405 013 3/11/1974 2,582 2,726 3/11/1974 2,582 2,726 014 3/12/1974 2,572 2,725 3/12/1974 2,572 2,725 015 3/13/1974 2,729 2,894 3/13/1974 2,729 2,894 016 3/14/1974 2,722 2,867 3/14/1974 2,722 2,867 017 3/15/1974 2,721 2,880 3/15/1974 2,721 2,880 018 3/16/1974 2,719 2,884 3/16/1974 2,719 2,884 019 3/17/1974 2,980 2,865 115 115 3/17/1974 2,937 2,865 7220 3/18/1974 3,029 2,913 116 116 3/18/1974 2,986 2,913 7321 3/19/1974 3,029 2,936 93 93 4,419 3/19/1974 2,995 2,936 5922 3/20/1974 3,057 2,942 115 115 7,026 3/20/1974 3,015 2,942 7323 3/21/1974 3,029 2,940 89 89 3/21/1974 2,996 2,940 5624 3/22/1974 3,209 3,064 145 145 3/22/1974 3,155 3,064 9125 3/23/1974 3,230 3,064 166 166 3/23/1974 3,169 3,064 10526 3/24/1974 3,224 3,047 177 177 3/24/1974 3,158 3,047 11127 3/25/1974 3,319 2,136 1,183 1,183 3/25/1974 2,880 2,136 74428 3/26/1974 3,298 2,146 1,152 1,152 3/26/1974 2,870 2,146 72429 3/27/1974 3,319 2,155 1,164 1,164 3/27/1974 2,887 2,155 73230 3/28/1974 3,293 2,155 1,138 1,138 3/28/1974 2,870 2,155 71531 3/29/1974 3,277 2,161 1,116 1,116 3/29/1974 2,863 2,161 70232 3/30/1974 3,294 3,158 136 136 3/30/1974 3,243 3,158 8533 3/31/1974 3,271 3,150 121 121 3/31/1974 3,226 3,150 7634 Total 86,334 81,915 7,026 4,419 Total 83,727 81,915 4,419
Case 1 - No Adjustments Case 2 - Adjustment for Monthly Accounting Process
-179 -179-203 -203-173 -173-191 -191-183 -183-228 -228-190 -190-96 -96-128 -128-105 -105-144 -144-153 -153-165 -165-145 -145-159 -159-165 -165
-2,607
16

17
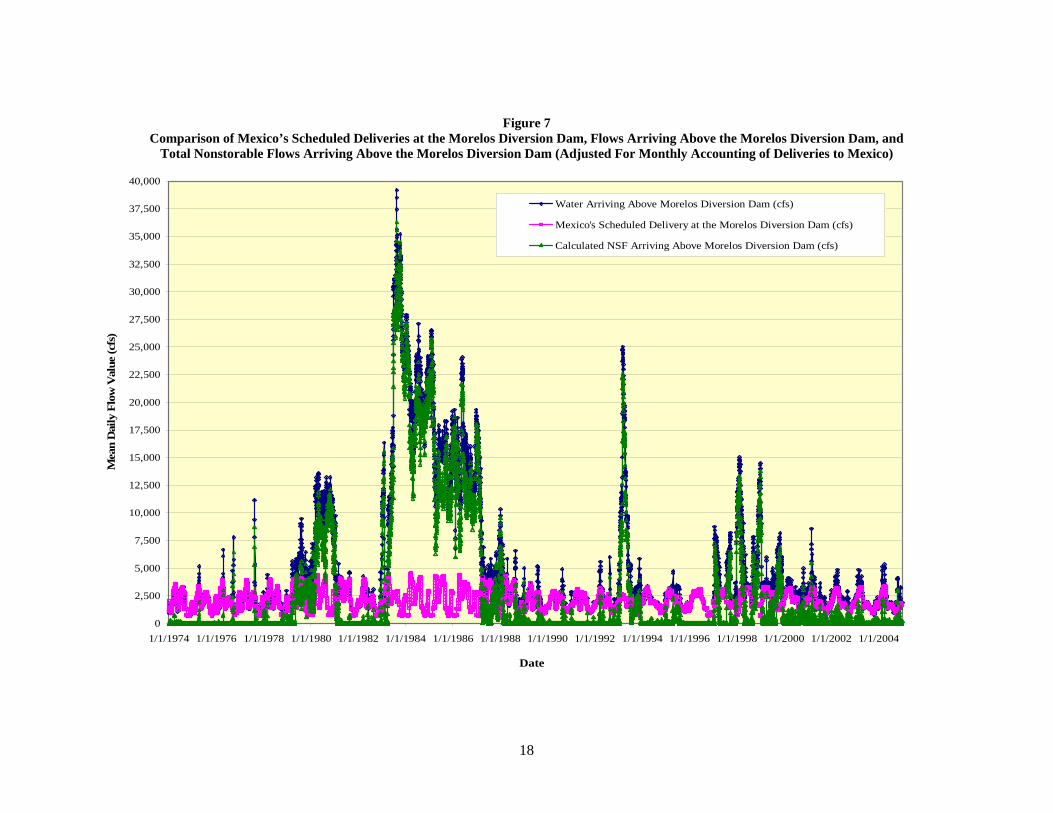
Using the above approach, the daily values of NSFs were adjusted so that the end of month sum of the calculated daily values of NSFs (Column M) is equal to the sum of the daily water deliveries, which may include daily over- or under-deliveries (Column F). Figure 7 provides a summary of the adjusted Mexico scheduled deliveries at the Morelos Diversion Dam, the flows arriving above the Morelos Diversion Dam, and the total NSFs arriving above the Morelos Diversion Dam. This figure is comparable to Figure 4 which presents the same data without the adjustments.
0
2,500
5,000
7,500
10,000
12,500
15,000
17,500
20,000
22,500
25,000
27,500
30,000
32,500
35,000
37,500
40,000
1/1/1974 1/1/1976 1/1/1978 1/1/1980 1/1/1982 1/1/1984 1/1/1986 1/1/1988 1/1/1990 1/1/1992 1/1/1994 1/1/1996 1/1/1998 1/1/2000 1/1/2002 1/1/2004
Date
Mea
n D
aily
Flo
w V
alue
(cfs
)
Water Arriving Above Morelos Diversion Dam (cfs)
Mexico's Scheduled Delivery at the Morelos Diversion Dam (cfs)
Calculated NSF Arriving Above Morelos Diversion Dam (cfs)
18
Figure 7 Comparison of Mexico’s Scheduled Deliveries at the Morelos Diversion Dam, Flows Arriving Above the Morelos Diversion Dam, and
Total Nonstorable Flows Arriving Above the Morelos Diversion Dam (Adjusted For Monthly Accounting of Deliveries to Mexico)
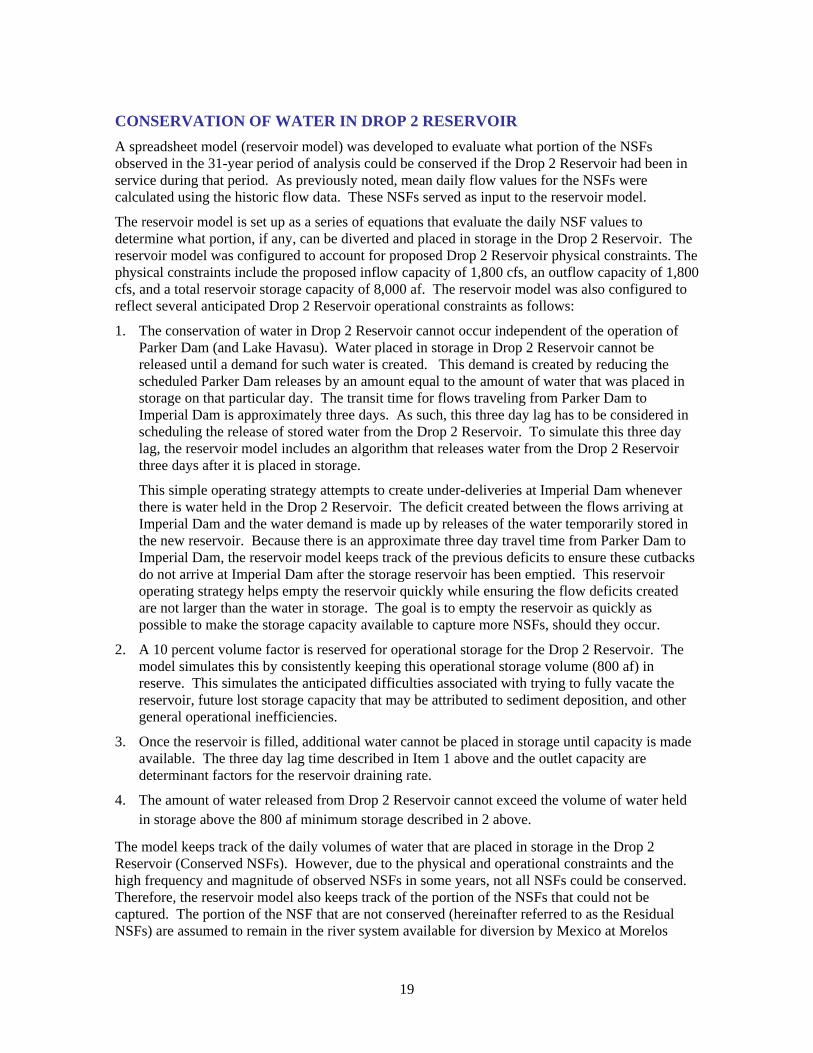
CONSERVATION OF WATER IN DROP 2 RESERVOIR A spreadsheet model (reservoir model) was developed to evaluate what portion of the NSFs observed in the 31-year period of analysis could be conserved if the Drop 2 Reservoir had been in service during that period. As previously noted, mean daily flow values for the NSFs were calculated using the historic flow data. These NSFs served as input to the reservoir model.
The reservoir model is set up as a series of equations that evaluate the daily NSF values to determine what portion, if any, can be diverted and placed in storage in the Drop 2 Reservoir. The reservoir model was configured to account for proposed Drop 2 Reservoir physical constraints. The physical constraints include the proposed inflow capacity of 1,800 cfs, an outflow capacity of 1,800 cfs, and a total reservoir storage capacity of 8,000 af. The reservoir model was also configured to reflect several anticipated Drop 2 Reservoir operational constraints as follows:
1. The conservation of water in Drop 2 Reservoir cannot occur independent of the operation of Parker Dam (and Lake Havasu). Water placed in storage in Drop 2 Reservoir cannot be released until a demand for such water is created. This demand is created by reducing the scheduled Parker Dam releases by an amount equal to the amount of water that was placed in storage on that particular day. The transit time for flows traveling from Parker Dam to Imperial Dam is approximately three days. As such, this three day lag has to be considered in scheduling the release of stored water from the Drop 2 Reservoir. To simulate this three day lag, the reservoir model includes an algorithm that releases water from the Drop 2 Reservoir three days after it is placed in storage.
This simple operating strategy attempts to create under-deliveries at Imperial Dam whenever there is water held in the Drop 2 Reservoir. The deficit created between the flows arriving at Imperial Dam and the water demand is made up by releases of the water temporarily stored in the new reservoir. Because there is an approximate three day travel time from Parker Dam to Imperial Dam, the reservoir model keeps track of the previous deficits to ensure these cutbacks do not arrive at Imperial Dam after the storage reservoir has been emptied. This reservoir operating strategy helps empty the reservoir quickly while ensuring the flow deficits created are not larger than the water in storage. The goal is to empty the reservoir as quickly as possible to make the storage capacity available to capture more NSFs, should they occur.
2. A 10 percent volume factor is reserved for operational storage for the Drop 2 Reservoir. The model simulates this by consistently keeping this operational storage volume (800 af) in reserve. This simulates the anticipated difficulties associated with trying to fully vacate the reservoir, future lost storage capacity that may be attributed to sediment deposition, and other general operational inefficiencies.
3. Once the reservoir is filled, additional water cannot be placed in storage until capacity is made available. The three day lag time described in Item 1 above and the outlet capacity are determinant factors for the reservoir draining rate.
4. The amount of water released from Drop 2 Reservoir cannot exceed the volume of water held in storage above the 800 af minimum storage described in 2 above.
The model keeps track of the daily volumes of water that are placed in storage in the Drop 2 Reservoir (Conserved NSFs). However, due to the physical and operational constraints and the high frequency and magnitude of observed NSFs in some years, not all NSFs could be conserved. Therefore, the reservoir model also keeps track of the portion of the NSFs that could not be captured. The portion of the NSF that are not conserved (hereinafter referred to as the Residual NSFs) are assumed to remain in the river system available for diversion by Mexico at Morelos
19
20
Diversion Dam or pass through the Morelos Diversion Dam, to the Limitrophe Division downstream...
As noted above, one of the operational constraints of the Drop 2 Reservoir is that the conservation of water in the Drop 2 Reservoir may not occur independent of the operation of Parker Dam (and Lake Havasu). Under this constraint, a portion of the water previously scheduled to be release from Parker Dam must be held back (in Lake Havasu) in order to facilitate the release of previously stored water from the Drop 2 Reservoir. Under flood flow conditions on the mainstem of the Colorado River, this process will be ineffective because Parker Dam and perhaps the other upstream reservoir may be operating under spill or flood release conditions. This means that the flows from Parker Dam cannot be regulated and therefore, water from Drop 2 Reservoir may not be released until this regulation capability at Parker Dam is regained (when no longer in a floodflow condition). Usually, these floodflow conditions can last for several weeks and sometimes months. In the case of the mid-1980s, the Colorado River floodflow conditions lasted almost five consecutive years.
A similar constraint may exist during floodflow conditions on the Gila River. If the floodflows are of high magnitude and sustained for prolonged periods of time, the ability of the river operators to conserve these flows using the Drop 2 Reservoir will also be limited. Table 3 shows the months when floodflow conditions existed either on the Colorado River, Gila River, or both.
It is noted that periods of NSFs that occurred when the Senator Wash Reservoir was not operational were included in the modeling analysis because it is likely that similar conditions for Senator Wash Reservoir will occur in the future.
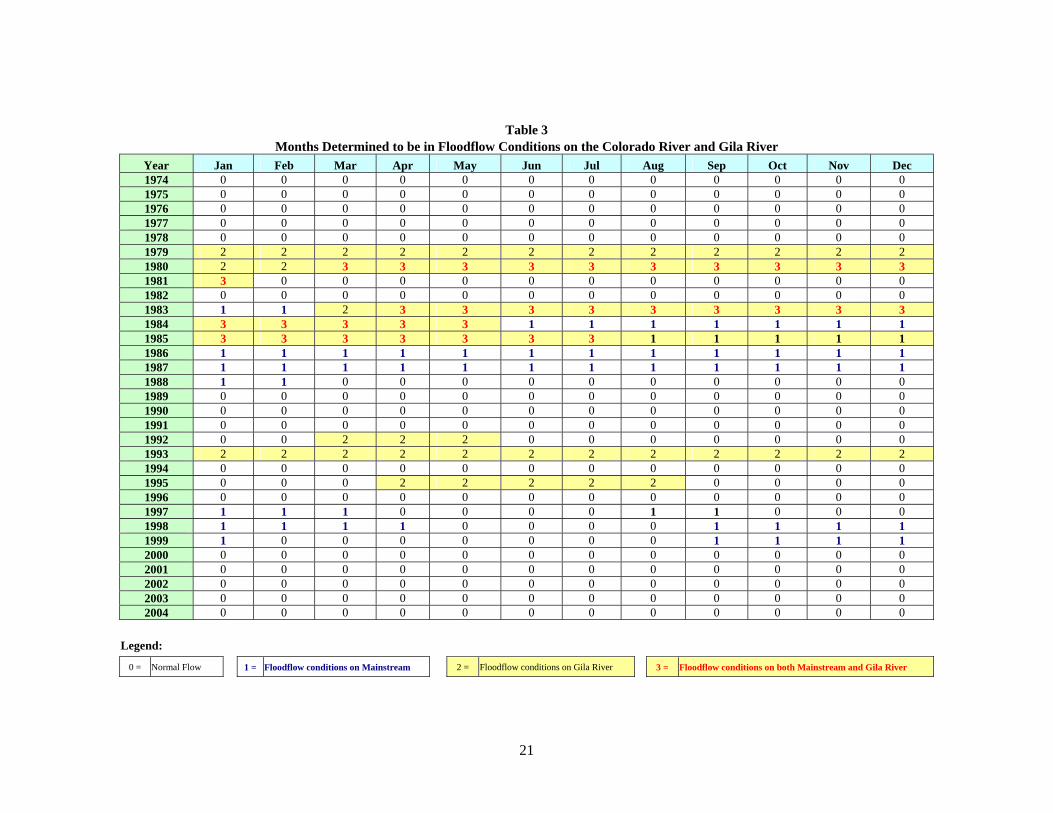
Table 3 Months Determined to be in Floodflow Conditions on the Colorado River and Gila River
Year Jan Feb Mar Apr May Jun Jul Aug Sep Oct Nov Dec 1974 0 0 0 0 0 0 0 0 0 0 0 0 1975 0 0 0 0 0 0 0 0 0 0 0 0 1976 0 0 0 0 0 0 0 0 0 0 0 0 1977 0 0 0 0 0 0 0 0 0 0 0 0 1978 0 0 0 0 0 0 0 0 0 0 0 0 1979 2 2 2 2 2 2 2 2 2 2 2 2 1980 2 2 3 3 3 3 3 3 3 3 3 3 1981 3 0 0 0 0 0 0 0 0 0 0 0 1982 0 0 0 0 0 0 0 0 0 0 0 0 1983 1 1 2 3 3 3 3 3 3 3 3 3 1984 3 3 3 3 3 1 1 1 1 1 1 1 1985 3 3 3 3 3 3 3 1 1 1 1 1 1986 1 1 1 1 1 1 1 1 1 1 1 1 1987 1 1 1 1 1 1 1 1 1 1 1 1 1988 1 1 0 0 0 0 0 0 0 0 0 0 1989 0 0 0 0 0 0 0 0 0 0 0 0 1990 0 0 0 0 0 0 0 0 0 0 0 0 1991 0 0 0 0 0 0 0 0 0 0 0 0 1992 0 0 2 2 2 0 0 0 0 0 0 0 1993 2 2 2 2 2 2 2 2 2 2 2 2 1994 0 0 0 0 0 0 0 0 0 0 0 0 1995 0 0 0 2 2 2 2 2 0 0 0 0 1996 0 0 0 0 0 0 0 0 0 0 0 0 1997 1 1 1 0 0 0 0 1 1 0 0 0 1998 1 1 1 1 0 0 0 0 1 1 1 1 1999 1 0 0 0 0 0 0 0 1 1 1 1 2000 0 0 0 0 0 0 0 0 0 0 0 0 2001 0 0 0 0 0 0 0 0 0 0 0 0 2002 0 0 0 0 0 0 0 0 0 0 0 0 2003 0 0 0 0 0 0 0 0 0 0 0 0 2004 0 0 0 0 0 0 0 0 0 0 0 0
Legend:
0 = Normal Flow 1 = Floodflow conditions on Mainstream 2 = Floodflow conditions on Gila River 3 = Floodflow conditions on both Mainstream and Gila River
21
22
To develop a more reasonable and accurate estimate of the NSFs that can be conserved with the Drop 2 Reservoir, the input data was adjusted to take into account the likely ineffectiveness of the Drop 2 Reservoir during floodflow conditions on both the mainstem of the Colorado River and the Gila River. Specifically, the mean daily flow values for the months that were identified as having been under floodflow conditions on either the Colorado River, Gila River, or both were deleted from the reservoir model. Again, these floodflow periods are those shown on Table 3.
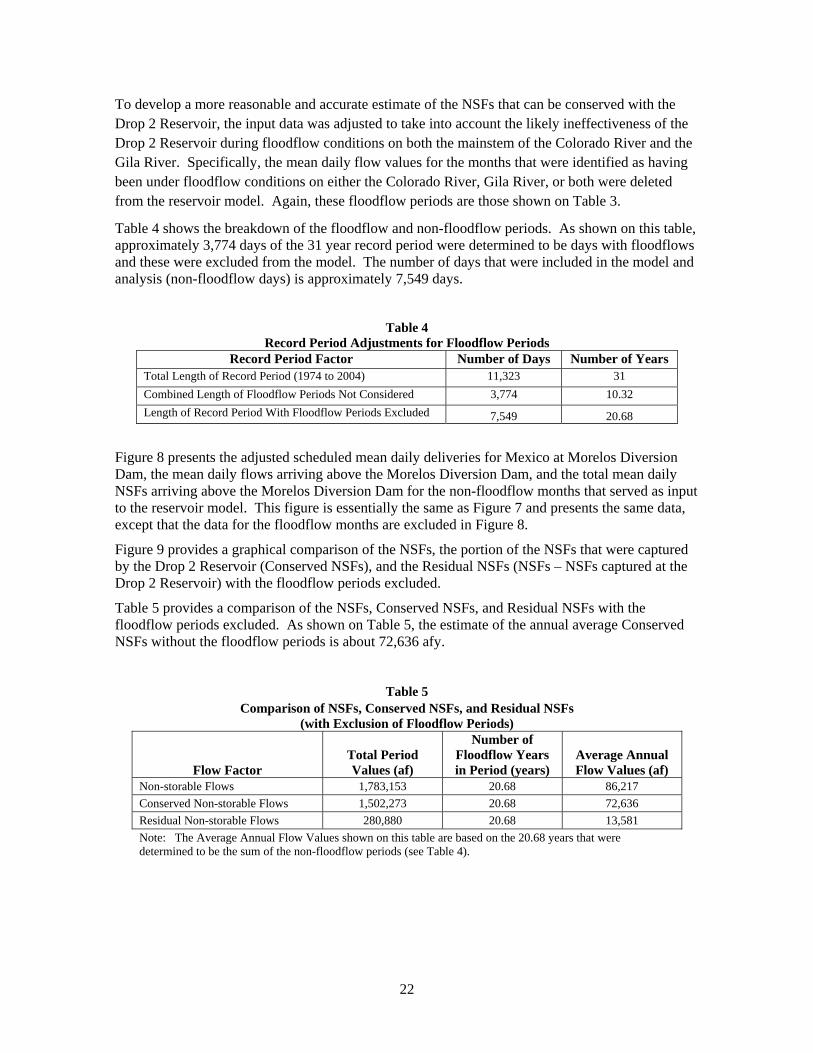
Table 4 shows the breakdown of the floodflow and non-floodflow periods. As shown on this table, approximately 3,774 days of the 31 year record period were determined to be days with floodflows and these were excluded from the model. The number of days that were included in the model and analysis (non-floodflow days) is approximately 7,549 days.
Table 4
Record Period Adjustments for Floodflow Periods Record Period Factor Number of Days Number of Years
Total Length of Record Period (1974 to 2004) 11,323 31 Combined Length of Floodflow Periods Not Considered 3,774 10.32 Length of Record Period With Floodflow Periods Excluded 7,549 20.68
Figure 8 presents the adjusted scheduled mean daily deliveries for Mexico at Morelos Diversion Dam, the mean daily flows arriving above the Morelos Diversion Dam, and the total mean daily NSFs arriving above the Morelos Diversion Dam for the non-floodflow months that served as input to the reservoir model. This figure is essentially the same as Figure 7 and presents the same data, except that the data for the floodflow months are excluded in Figure 8.
Figure 9 provides a graphical comparison of the NSFs, the portion of the NSFs that were captured by the Drop 2 Reservoir (Conserved NSFs), and the Residual NSFs (NSFs – NSFs captured at the Drop 2 Reservoir) with the floodflow periods excluded.
Table 5 provides a comparison of the NSFs, Conserved NSFs, and Residual NSFs with the floodflow periods excluded. As shown on Table 5, the estimate of the annual average Conserved NSFs without the floodflow periods is about 72,636 afy.
Table 5 Comparison of NSFs, Conserved NSFs, and Residual NSFs
(with Exclusion of Floodflow Periods)
Flow Factor Total Period Values (af)
Number of Floodflow Years in Period (years)
Average Annual Flow Values (af)
Non-storable Flows 1,783,153 20.68 86,217 Conserved Non-storable Flows 1,502,273 20.68 72,636 Residual Non-storable Flows 280,880 20.68 13,581 Note: The Average Annual Flow Values shown on this table are based on the 20.68 years that were determined to be the sum of the non-floodflow periods (see Table 4).
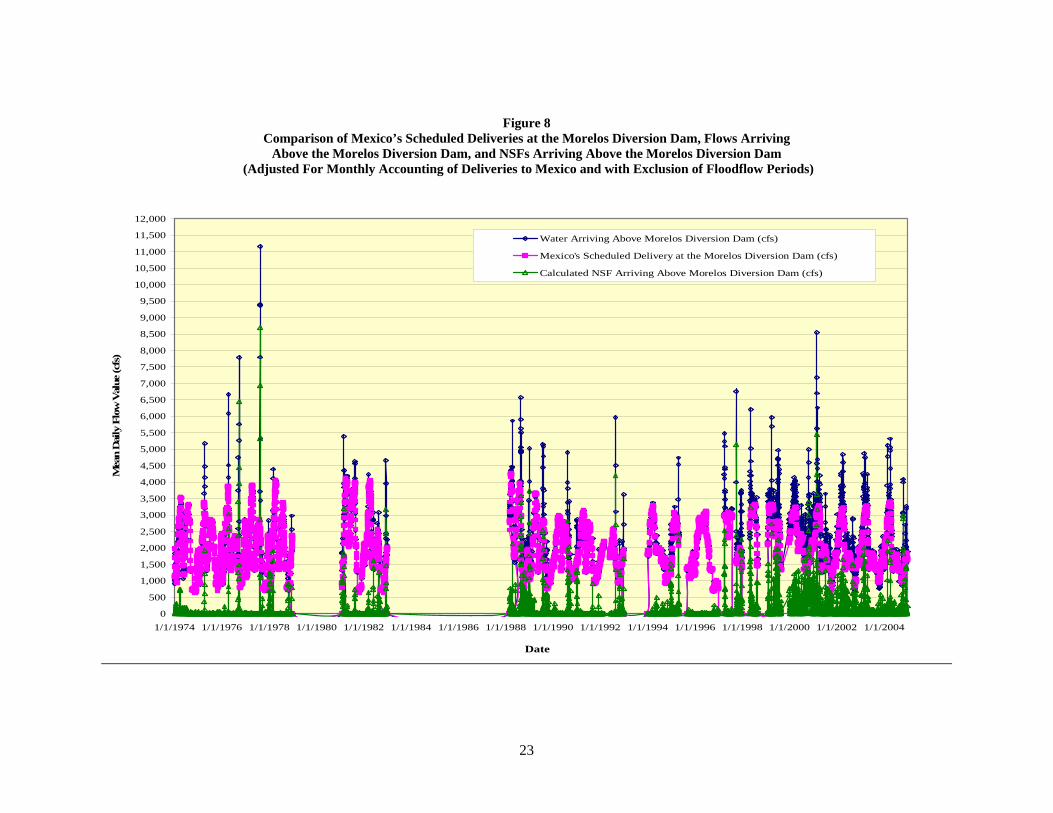
Figure 8 Comparison of Mexico’s Scheduled Deliveries at the Morelos Diversion Dam, Flows Arriving
Above the Morelos Diversion Dam, and NSFs Arriving Above the Morelos Diversion Dam (Adjusted For Monthly Accounting of Deliveries to Mexico and with Exclusion of Floodflow Periods)
0
500
1,000
1,500
2,000
2,500
3,000
3,500
4,000
4,500
5,000
5,500
6,000
6,500
7,000
7,500
8,000
8,500
9,000
9,500
10,000
10,500
11,000
11,500
12,000
1/1/1974 1/1/1976 1/1/1978 1/1/1980 1/1/1982 1/1/1984 1/1/1986 1/1/1988 1/1/1990 1/1/1992 1/1/1994 1/1/1996 1/1/1998 1/1/2000 1/1/2002 1/1/2004
Date
Mea
n D
aily
Flo
w V
alue
(cfs
)
Water Arriving Above Morelos Diversion Dam (cfs)
Mexico's Scheduled Delivery at the Morelos Diversion Dam (cfs)
Calculated NSF Arriving Above Morelos Diversion Dam (cfs)
23

0
500
1,000
1,500
2,000
2,500
3,000
3,500
4,000
4,500
5,000
5,500
6,000
6,500
7,000
7,500
8,000
8,500
9,000
1/1/1974 1/1/1976 1/1/1978 1/1/1980 1/1/1982 1/1/1984 1/1/1986 1/1/1988 1/1/1990 1/1/1992 1/1/1994 1/1/1996 1/1/1998 1/1/2000 1/1/2002 1/1/2004
Date
Mea
n D
aily
Flo
w V
alue
(cfs
)
Original NSF Arriving Above Morelos Diversion Dam (cfs)
Portion of NSF Conserved by Drop 2 Reservoir (cfs)
Residual NSF (cfs)
24
Figure 9 Comparison of NSFs, Conserved Portion of NSFs, and Residual NSFs
(Adjusted For Monthly Accounting of Deliveries to Mexico and with Exclusion of Floodflow Periods)
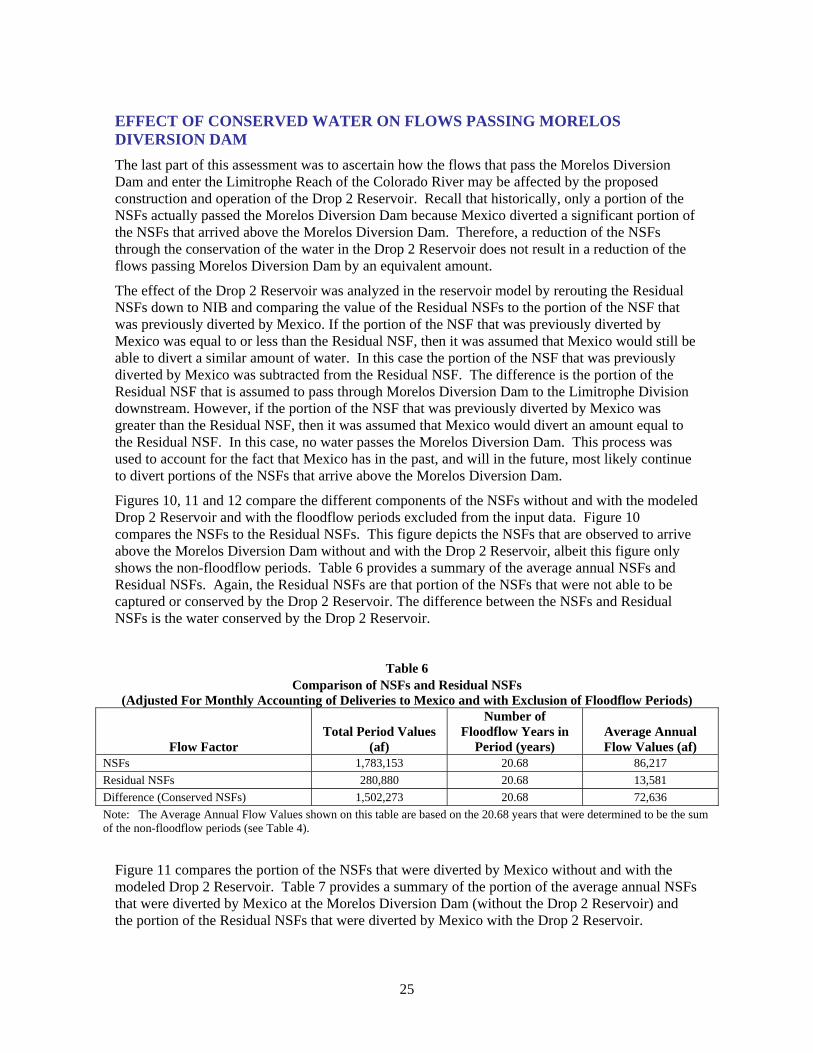
EFFECT OF CONSERVED WATER ON FLOWS PASSING MORELOS DIVERSION DAM The last part of this assessment was to ascertain how the flows that pass the Morelos Diversion Dam and enter the Limitrophe Reach of the Colorado River may be affected by the proposed construction and operation of the Drop 2 Reservoir. Recall that historically, only a portion of the NSFs actually passed the Morelos Diversion Dam because Mexico diverted a significant portion of the NSFs that arrived above the Morelos Diversion Dam. Therefore, a reduction of the NSFs through the conservation of the water in the Drop 2 Reservoir does not result in a reduction of the flows passing Morelos Diversion Dam by an equivalent amount.
The effect of the Drop 2 Reservoir was analyzed in the reservoir model by rerouting the Residual NSFs down to NIB and comparing the value of the Residual NSFs to the portion of the NSF that was previously diverted by Mexico. If the portion of the NSF that was previously diverted by Mexico was equal to or less than the Residual NSF, then it was assumed that Mexico would still be able to divert a similar amount of water. In this case the portion of the NSF that was previously diverted by Mexico was subtracted from the Residual NSF. The difference is the portion of the Residual NSF that is assumed to pass through Morelos Diversion Dam to the Limitrophe Division downstream. However, if the portion of the NSF that was previously diverted by Mexico was greater than the Residual NSF, then it was assumed that Mexico would divert an amount equal to the Residual NSF. In this case, no water passes the Morelos Diversion Dam. This process was used to account for the fact that Mexico has in the past, and will in the future, most likely continue to divert portions of the NSFs that arrive above the Morelos Diversion Dam.
Figures 10, 11 and 12 compare the different components of the NSFs without and with the modeled Drop 2 Reservoir and with the floodflow periods excluded from the input data. Figure 10 compares the NSFs to the Residual NSFs. This figure depicts the NSFs that are observed to arrive above the Morelos Diversion Dam without and with the Drop 2 Reservoir, albeit this figure only shows the non-floodflow periods. Table 6 provides a summary of the average annual NSFs and Residual NSFs. Again, the Residual NSFs are that portion of the NSFs that were not able to be captured or conserved by the Drop 2 Reservoir. The difference between the NSFs and Residual NSFs is the water conserved by the Drop 2 Reservoir.
Table 6 Comparison of NSFs and Residual NSFs
(Adjusted For Monthly Accounting of Deliveries to Mexico and with Exclusion of Floodflow Periods)
Flow Factor Total Period Values
(af)
Number of Floodflow Years in
Period (years) Average Annual Flow Values (af)
NSFs 1,783,153 20.68 86,217 Residual NSFs 280,880 20.68 13,581 Difference (Conserved NSFs) 1,502,273 20.68 72,636 Note: The Average Annual Flow Values shown on this table are based on the 20.68 years that were determined to be the sum of the non-floodflow periods (see Table 4).
Figure 11 compares the portion of the NSFs that were diverted by Mexico without and with the modeled Drop 2 Reservoir. Table 7 provides a summary of the portion of the average annual NSFs that were diverted by Mexico at the Morelos Diversion Dam (without the Drop 2 Reservoir) and the portion of the Residual NSFs that were diverted by Mexico with the Drop 2 Reservoir.
25
26
Table 7 Comparison of portion of NSFs and Residual NSFs Diverted by Mexico at the Morelos Diversion Dam (Adjusted For Monthly Accounting of Deliveries to Mexico and with Exclusion of Floodflow Periods)
Flow Factor Total Period Values (af)
Number of Floodflow Years in
Period (years) Average Annual Flow Values (af)
Portion of NSFs diverted by Mexico (without reservoir) 1,031,055 20.68 49,852 Portion of Residual NSFs diverted by Mexico (with Drop 2 Reservoir) 107,497 20.68 5,198 Difference 923,558 20.68 44,655 Note: The Average Annual Flow Values shown on this table are based on the 20.68 years that were determined to be the sum of the non-floodflow periods (see Table 4).
Figure 12 compares the portion of the NSFs that pass the Morelos Diversion Dam without and with the modeled Drop 2 Reservoir. Again, these two graphs only show the data for the non-floodflow periods. Table 8 provides a summary of the portion of the average annual NSFs that were determined to pass the Morelos Diversion Dam (without the reservoir) and the portion of the Residual NSFs that were estimated to pass the Morelos Diversion Dam with the Drop 2 Reservoir.
Table 8 Comparison of Portion of NSFs Passing Morelos Diversion Dam (without reservoir) and Portion of
Residual NSFs Passing Morelos Diversion Dam With Drop 2 Reservoir (Adjusted For Monthly Accounting of Deliveries to Mexico and with Exclusion of Floodflow Periods)
Flow Factor Total Period Values (af)
Number of Floodflow Years in
Period (years) Average Annual Flow Values (af)
Portion of NSFs passing Morelos Diversion Dam (without reservoir) 896,961 20.68 43,369 Portion of Residual NSFs passing Morelos Diversion Dam (with Drop 2 Reservoir) 318,246 20.68 15,387 Difference 578,715 20.68 27,981 Note: The Average Annual Flow Values shown on this table are based on the 20.68 years that were determined to be the sum of the non-floodflow periods (see Table 4).
As noted in Table 6, the modeled Drop 2 Reservoir conserved an average of about 72,636 afy of the NSFs. However, as shown in Table 7, Mexico was determined to have diverted an average of approximately 49,852 afy of NSFs during the non-flood flow periods without the reservoir. In the future, it is anticipated that Mexico will continue to divert portions of the NSFs that arrive at the Morelos Diversion Dam. This likely future condition was modeled and is reflected in Table 7 which shows that with the Drop 2 Reservoir, Mexico could potentially divert some 5,198 afy during the non-floodflow periods. The effect of the Drop 2 Reservoir on the diversion of NSFs by Mexico is a reduction of approximately 44,655 afy (average annual reduction with floodflow periods excluded).
As shown in Table 8, the NSFs passing Morelos Diversion Dam without the reservoir was determined to be approximately 43,369 afy. However, as noted above, the modeled Drop 2 Reservoir was estimated to conserve an average of about 72,636 afy of the NSFs during the non-floodflow periods. This demonstrates that some of the NSFs that are conserved by the Drop 2 Reservoir were previously diverted by Mexico and previously did not pass the Morelos Diversion Dam. The Drop 2 Reservoir reduces the NSFs that pass the Morelos Diversion Dam from 43,369 afy to 15,387 afy, a net reduction of 27,981 afy. Again, this is the net reduction for the non-flood flow periods only.

Figure 10
Comparison of Non-Storable Flows to Residual NSFs With Exclusion of Floodflow Periods
(Residual NSF is portion of NSF that could not be captured by Drop 2 Reservoir
0
500
1,000
1,500
2,000
2,500
3,000
3,500
4,000
4,500
5,000
5,500
6,000
6,500
7,000
7,500
8,000
8,500
9,000
1/1/1974 1/1/1976 1/1/1978 1/1/1980 1/1/1982 1/1/1984 1/1/1986 1/1/1988 1/1/1990 1/1/1992 1/1/1994 1/1/1996 1/1/1998 1/1/2000 1/1/2002 1/1/2004
Date
Mea
n D
aily
Flo
w V
alue
(cfs
)
Original NSF Arriving Above Morelos Diversion Dam (cfs)
Residual NSF (cfs)
27

Figure 11 Comparison of Portion of NSFs Diverted by Mexico to Portion of Residual NSFs Diverted By Mexico With Exclusion of Floodflow Periods
0
100
200
300
400
500
600
700
800
900
1,000
1,100
1,200
1,300
1,400
1,500
1,600
1,700
1,800
1,900
2,000
2,100
2,200
1/1/1974 1/1/1976 1/1/1978 1/1/1980 1/1/1982 1/1/1984 1/1/1986 1/1/1988 1/1/1990 1/1/1992 1/1/1994 1/1/1996 1/1/1998 1/1/2000 1/1/2002 1/1/2004
Date
Mea
n D
aily
Flo
w V
alue
(cfs
)
NSFs Diverted by Mexico Without Reservoir
NSFs Diverted by Mexico With Drop 2 Reservoir
28

0
500
1,000
1,500
2,000
2,500
3,000
3,500
4,000
4,500
5,000
5,500
6,000
6,500
7,000
7,500
8,000
8,500
9,000
1/1/1974 1/1/1976 1/1/1978 1/1/1980 1/1/1982 1/1/1984 1/1/1986 1/1/1988 1/1/1990 1/1/1992 1/1/1994 1/1/1996 1/1/1998 1/1/2000 1/1/2002 1/1/2004
Date
Mea
n D
aily
Flo
w V
alue
(cfs
)
NSFs Passing Morelos Divserion Dam Without Reservoir
NSFs Passing Morelos Divserion Dam With Drop 2 Reservoir
29
Figure 12 Comparison of NSFs Passing Morelos Diversion Dam Without and With Drop 2 Reservoir
(Floodflow Periods Excluded)

While the proposed Drop 2 Reservoir has the potential to reduce the flows that pass the Morelos Diversion Dam, the reservoir will only affect the NSFs that occur during non-floodflow periods. The NSFs that occur during the floodflow periods will be unaffected due to the ineffectiveness of the Drop 2 Reservoir during floodflow conditions. Recall that the total annual average NSFs that pass the Morelos Diversion Dam during the 31-year record period (inclusive of the floodflow periods) were determined to be approximately 1.85 mafy (see Table 1) and the reduction of flows passing the Morelos Diversion Dam attributed to the Drop 2 reservoir was 27, 981 afy with the floodflow periods excluded (Table 8). Therefore, if one considers the NSFs that occur during floodflow and non-floodflow conditions, the reduction of the NSFs that pass the Morelos Diversion Dam attributed to the Drop 2 Reservoir amounts to about 1.5 percent of the total volume in the 31-year record period. Table 9 compares the NSFs arriving above the Morelos Diversion Dam, the portion of the NSFs diverted by Mexico, and the flows passing the Morelos Diversion Dam without and with the Drop 2 Reservoir (includes floodflow periods). Figure 13 shows the NSFs that pass the Morelos Diversion Dam without the reservoir and with the Drop 2 Reservoir during the combined floodflow and non-floodflow periods. It is noted that even with future increases in the upper basin consumptive use and extended drought conditions on the Colorado River, periods of flood flow conditions are still expected to occur. For example, flood flow periods may result from sidewash inflow and from spills or flood control releases from Alamo Dam and Painted Rock Dam, conditions which occurred as recently as 2005. The exclusion of the flood flow periods from the analysis enables us to quantify the reduction in NSFs passing the Morelos Diversion Dam.
Table 9
Comparison of NSFs Arriving Above Morelos Diversion Dam, Portion of NSFs Diverted by Mexico, and Portion of NSFs That Pass Morelos Diversion Dam Without and With Drop 2 Reservoir (Inclusive of
Floodflow Periods) Total Period
Flow Factor Without
Reservoir With Drop 2
Reservoir Total
Difference
No. of Years in Period
Average Annual
Difference NSF Arriving Above Morelos Diversion Dam (af) 112,001,571 110,499,298 (1,502,273) 31 (48,460) Portion of NSF Diverted by Mexico at the Morelos Diversion Dam (af) 9,955,619 9,032,061 (923,558) 31 (29,792) Flow Passing Morelos Diversion Dam (af) 57,293,064 56,714,349 (578,715) 31 (18,668)
The values presented in Table 9 can be contrasted with the values presented in Tables 6, 7 and 8 which exclude the floodflow periods and use the sum of the non-floodflow periods (20.68 years) as the denominator for determining the average annual values.
OTHER FLOWS ENTERING THE LIMITROPHE REACH As noted before, NSFs are only one part of the flows that enter the Limitrophe Reach of the Colorado River below the Morelos Diversion Dam. Other flows includes the groundwater that intersects the channel in the upper two thirds of the Limitrophe Reach, surface flows that occur as a result of gate leakage at the Morelos Diversion Dam, and discharge from the MODE No. 3, 11-Mile and 21-Mile wasteways. These flows will not be affected by the Drop 2 Reservoir.
The groundwater that enters the channel is not readily quantifiable but may be responsible for the majority of the flows that are observed in the upper portion of the river channel most of the time. The gate leakage at the Morelos Diversion Dam has been reported to range between 35 to 55 cfs according to the USIBWC. The MODE No. 3 Wasteway has only been used a few times since the Bypass Drain was completed in 1978. The 11-Mile and 21-Mile wasteways routinely discharge
30
water to river channel. The water discharged from these wasteways comprise mostly of return flows from the United States side of the river. Figures 14, 15, and 16 show the daily discharge from 11-Mile, 21-Mile, and MODE No. 3 wasteways for the period between 1974 through 2004. Figure 17 shows the sum of the total flows discharged to the Colorado River from the 11-Mile, 21-Mile, and MODE No. 3 wasteways. Table 10 provides a summary of the maximum, average and median values of flows from the 11-Mile and 21-Mile wasteways, and the sum of the flows from these two wasteways. The flows from the MODE No. 3 are not included in Table 10 because MODE No. 3 has essentially been inactive since 1979 and there are currently no plans to reactivate the use of this wasteway except for occasional emergency spills and short term spills that may be required for maintenance work on the MODE or the Bypass Drain.
Table 10 Summary of Flows Discharged to Limitrophe Reach Below Morelos Diversion Dam
Via 11-Mile and 21-Mile Wasteways for Period Between 1974 to 2004
Flow Factor Deliveries Via 11-
Mile Wasteway (cfs) Deliveries Via 21-
Mile Wasteway (cfs)
Total Deliveries 11-Mile and 21-Mile Wasteways (cfs)
Maximum Mean Daily Flow (cfs) 99.9 47.7 120.4 Median Mean Daily Flow (cfs) 0.4 0.0 0.4 Average Mean Daily Flow (cfs) 4.0 1.4 5.4 Total Period Flow Volume (af) 90,767 31,361 122,128 Years in Period 31 31 31 Average Annual Flow Volume (af) 2,928 1,012 3,940
31
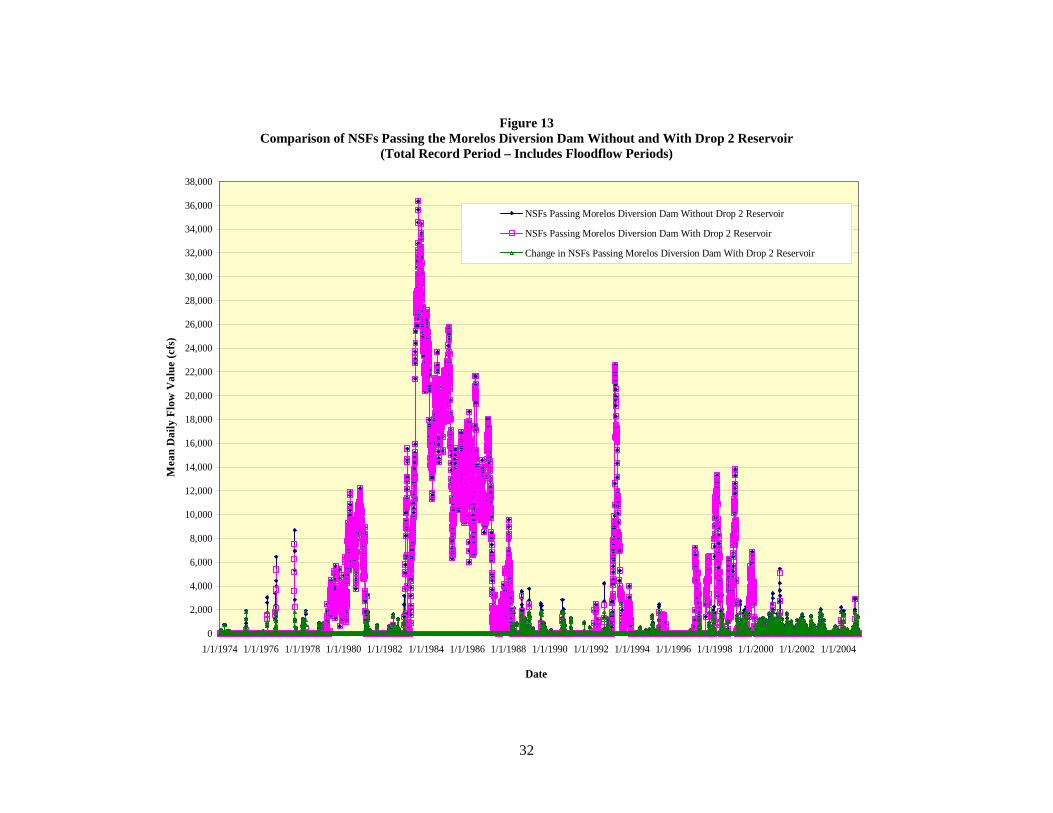
Figure 13 Comparison of NSFs Passing the Morelos Diversion Dam Without and With Drop 2 Reservoir
(Total Record Period – Includes Floodflow Periods)
0
2,000
4,000
6,000
8,000
10,000
12,000
14,000
16,000
18,000
20,000
22,000
24,000
26,000
28,000
30,000
32,000
34,000
36,000
38,000
1/1/1974 1/1/1976 1/1/1978 1/1/1980 1/1/1982 1/1/1984 1/1/1986 1/1/1988 1/1/1990 1/1/1992 1/1/1994 1/1/1996 1/1/1998 1/1/2000 1/1/2002 1/1/2004
Date
Mea
n D
aily
Flo
w V
alue
(cfs
)
NSFs Passing Morelos Diversion Dam Without Drop 2 Reservoir
NSFs Passing Morelos Diversion Dam With Drop 2 Reservoir
Change in NSFs Passing Morelos Diversion Dam With Drop 2 Reservoir
32
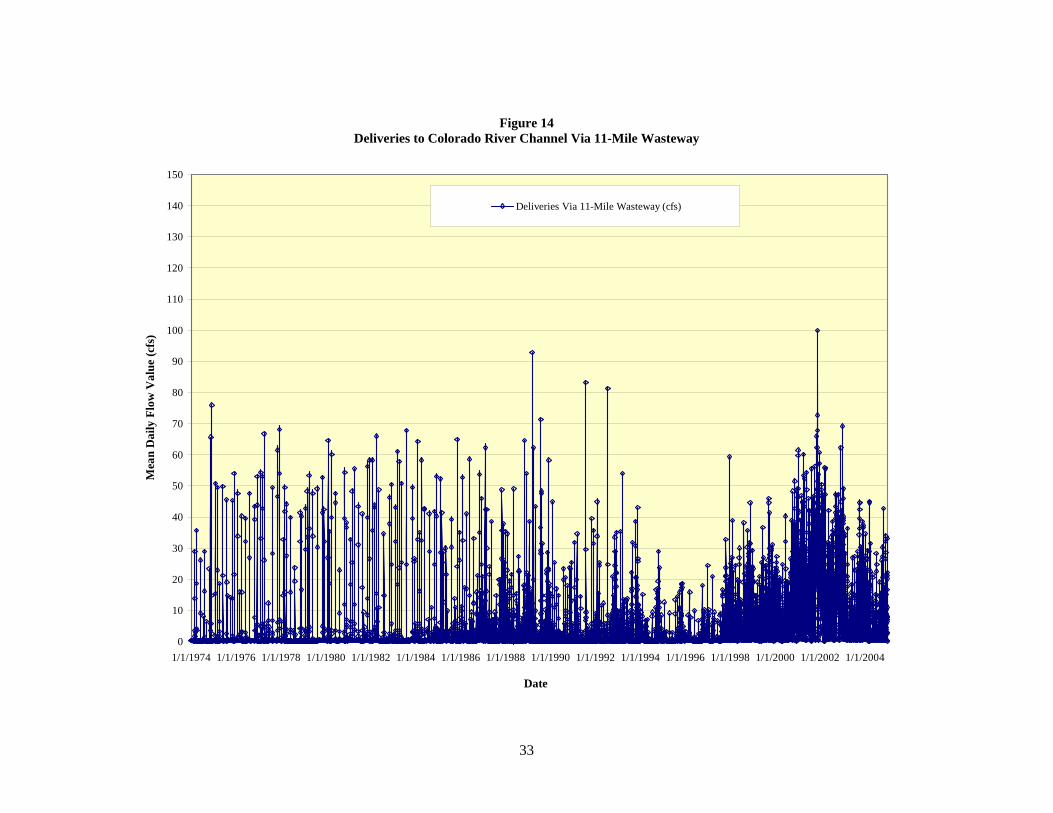
Figure 14 Deliveries to Colorado River Channel Via 11-Mile Wasteway
0
10
20
30
40
50
60
70
80
90
100
110
120
130
140
150
1/1/1974 1/1/1976 1/1/1978 1/1/1980 1/1/1982 1/1/1984 1/1/1986 1/1/1988 1/1/1990 1/1/1992 1/1/1994 1/1/1996 1/1/1998 1/1/2000 1/1/2002 1/1/2004
Date
Mea
n D
aily
Flo
w V
alue
(cfs
)
Deliveries Via 11-Mile Wasteway (cfs)
33
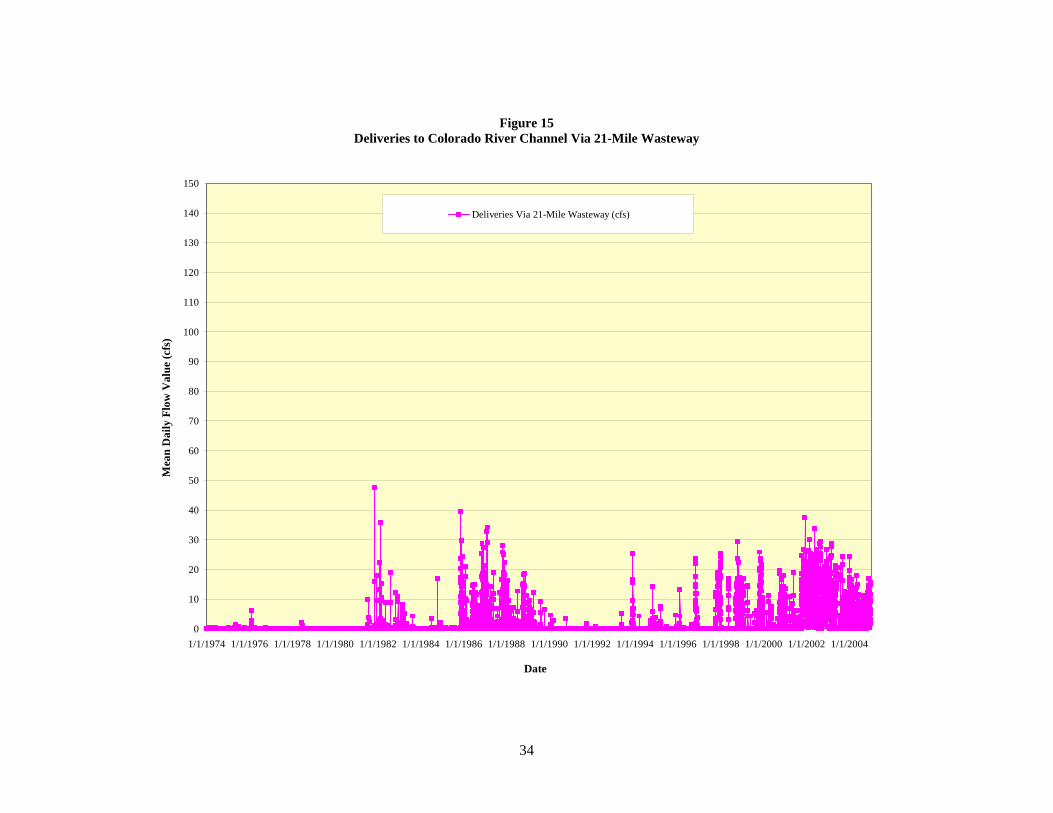
Figure 15 Deliveries to Colorado River Channel Via 21-Mile Wasteway
0
10
20
30
40
50
60
70
80
90
100
110
120
130
140
150
1/1/1974 1/1/1976 1/1/1978 1/1/1980 1/1/1982 1/1/1984 1/1/1986 1/1/1988 1/1/1990 1/1/1992 1/1/1994 1/1/1996 1/1/1998 1/1/2000 1/1/2002 1/1/2004
Date
Mea
n D
aily
Flo
w V
alue
(cfs
)
Deliveries Via 21-Mile Wasteway (cfs)
34
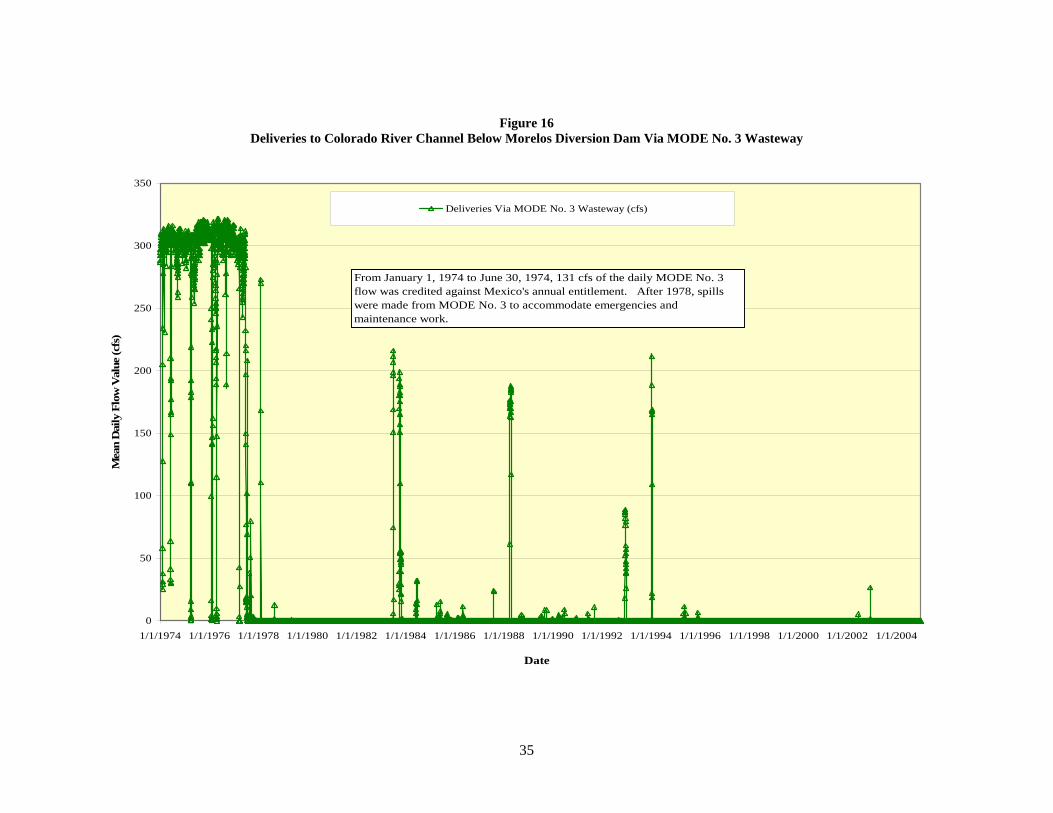
Figure 16 Deliveries to Colorado River Channel Below Morelos Diversion Dam Via MODE No. 3 Wasteway
0
50
100
150
200
250
300
350
1/1/1974 1/1/1976 1/1/1978 1/1/1980 1/1/1982 1/1/1984 1/1/1986 1/1/1988 1/1/1990 1/1/1992 1/1/1994 1/1/1996 1/1/1998 1/1/2000 1/1/2002 1/1/2004
Date
Mea
n D
aily
Flo
w V
alue
(cfs
)
Deliveries Via MODE No. 3 Wasteway (cfs)
From January 1, 1974 to June 30, 1974, 131 cfs of the daily MODE No. 3 flow was credited against Mexico's annual entitlement. After 1978, spills were made from MODE No. 3 to accommodate emergencies and maintenance work.
35
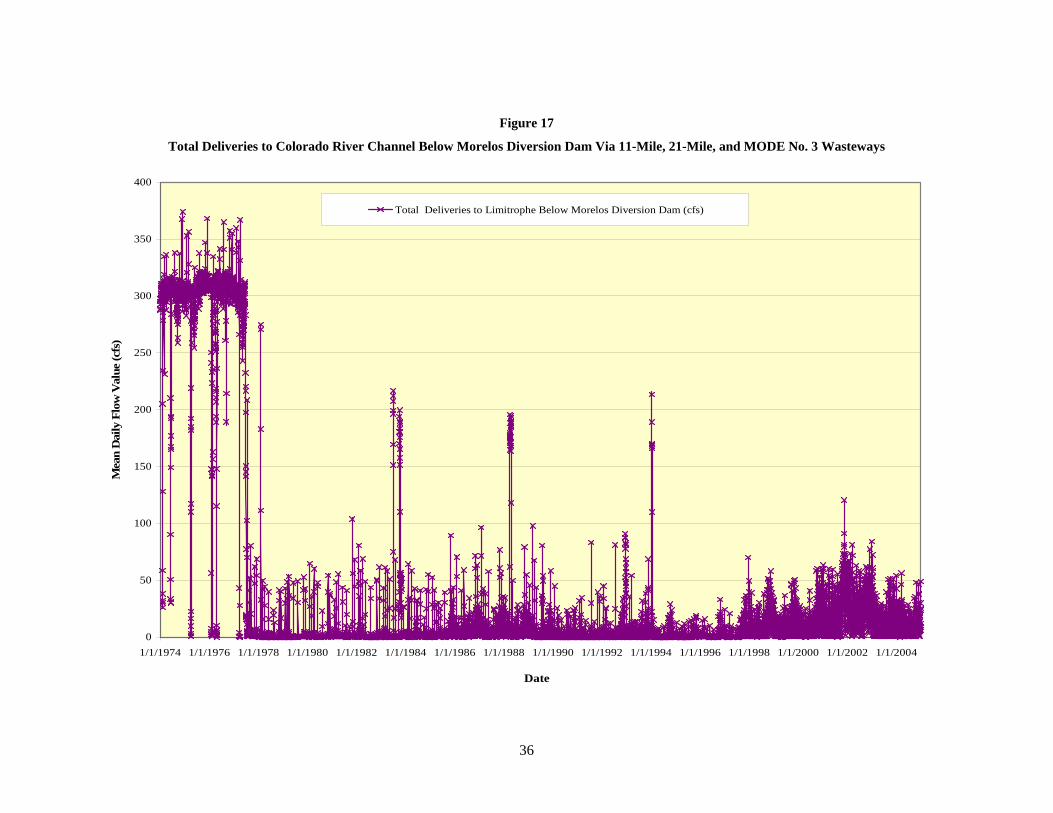
0
50
100
150
200
250
300
350
400
1/1/1974 1/1/1976 1/1/1978 1/1/1980 1/1/1982 1/1/1984 1/1/1986 1/1/1988 1/1/1990 1/1/1992 1/1/1994 1/1/1996 1/1/1998 1/1/2000 1/1/2002 1/1/2004
Date
Mea
n D
aily
Flo
w V
alue
(cfs
)
Total Deliveries to Limitrophe Below Morelos Diversion Dam (cfs)
Total Deliveries to Colorado River Channel Below Morelos Diversion Dam Via 11-Mile, 21-Mile, and MODE No. 3 Wasteways
Figure 17
36
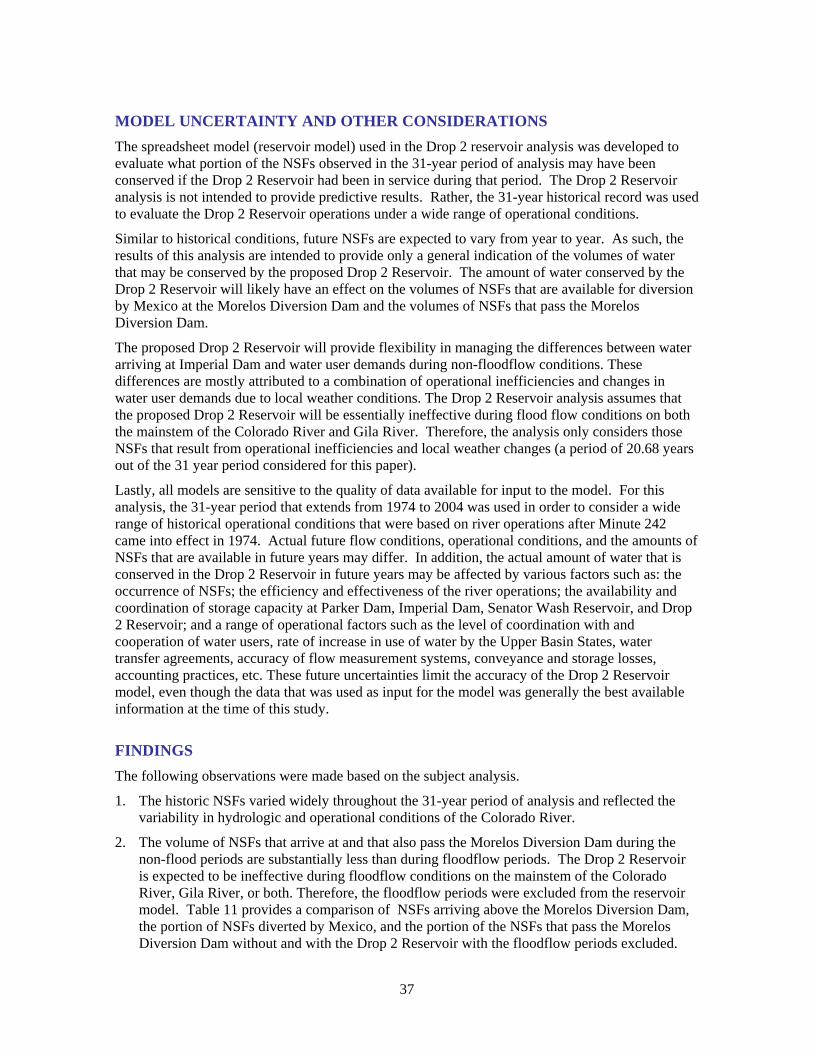
MODEL UNCERTAINTY AND OTHER CONSIDERATIONS The spreadsheet model (reservoir model) used in the Drop 2 reservoir analysis was developed to evaluate what portion of the NSFs observed in the 31-year period of analysis may have been conserved if the Drop 2 Reservoir had been in service during that period. The Drop 2 Reservoir analysis is not intended to provide predictive results. Rather, the 31-year historical record was used to evaluate the Drop 2 Reservoir operations under a wide range of operational conditions.
Similar to historical conditions, future NSFs are expected to vary from year to year. As such, the results of this analysis are intended to provide only a general indication of the volumes of water that may be conserved by the proposed Drop 2 Reservoir. The amount of water conserved by the Drop 2 Reservoir will likely have an effect on the volumes of NSFs that are available for diversion by Mexico at the Morelos Diversion Dam and the volumes of NSFs that pass the Morelos Diversion Dam.
The proposed Drop 2 Reservoir will provide flexibility in managing the differences between water arriving at Imperial Dam and water user demands during non-floodflow conditions. These differences are mostly attributed to a combination of operational inefficiencies and changes in water user demands due to local weather conditions. The Drop 2 Reservoir analysis assumes that the proposed Drop 2 Reservoir will be essentially ineffective during flood flow conditions on both the mainstem of the Colorado River and Gila River. Therefore, the analysis only considers those NSFs that result from operational inefficiencies and local weather changes (a period of 20.68 years out of the 31 year period considered for this paper).
Lastly, all models are sensitive to the quality of data available for input to the model. For this analysis, the 31-year period that extends from 1974 to 2004 was used in order to consider a wide range of historical operational conditions that were based on river operations after Minute 242 came into effect in 1974. Actual future flow conditions, operational conditions, and the amounts of NSFs that are available in future years may differ. In addition, the actual amount of water that is conserved in the Drop 2 Reservoir in future years may be affected by various factors such as: the occurrence of NSFs; the efficiency and effectiveness of the river operations; the availability and coordination of storage capacity at Parker Dam, Imperial Dam, Senator Wash Reservoir, and Drop 2 Reservoir; and a range of operational factors such as the level of coordination with and cooperation of water users, rate of increase in use of water by the Upper Basin States, water transfer agreements, accuracy of flow measurement systems, conveyance and storage losses, accounting practices, etc. These future uncertainties limit the accuracy of the Drop 2 Reservoir model, even though the data that was used as input for the model was generally the best available information at the time of this study.
FINDINGS The following observations were made based on the subject analysis.
1. The historic NSFs varied widely throughout the 31-year period of analysis and reflected the variability in hydrologic and operational conditions of the Colorado River.
2. The volume of NSFs that arrive at and that also pass the Morelos Diversion Dam during the non-flood periods are substantially less than during floodflow periods. The Drop 2 Reservoir is expected to be ineffective during floodflow conditions on the mainstem of the Colorado River, Gila River, or both. Therefore, the floodflow periods were excluded from the reservoir model. Table 11 provides a comparison of NSFs arriving above the Morelos Diversion Dam, the portion of NSFs diverted by Mexico, and the portion of the NSFs that pass the Morelos Diversion Dam without and with the Drop 2 Reservoir with the floodflow periods excluded.
37
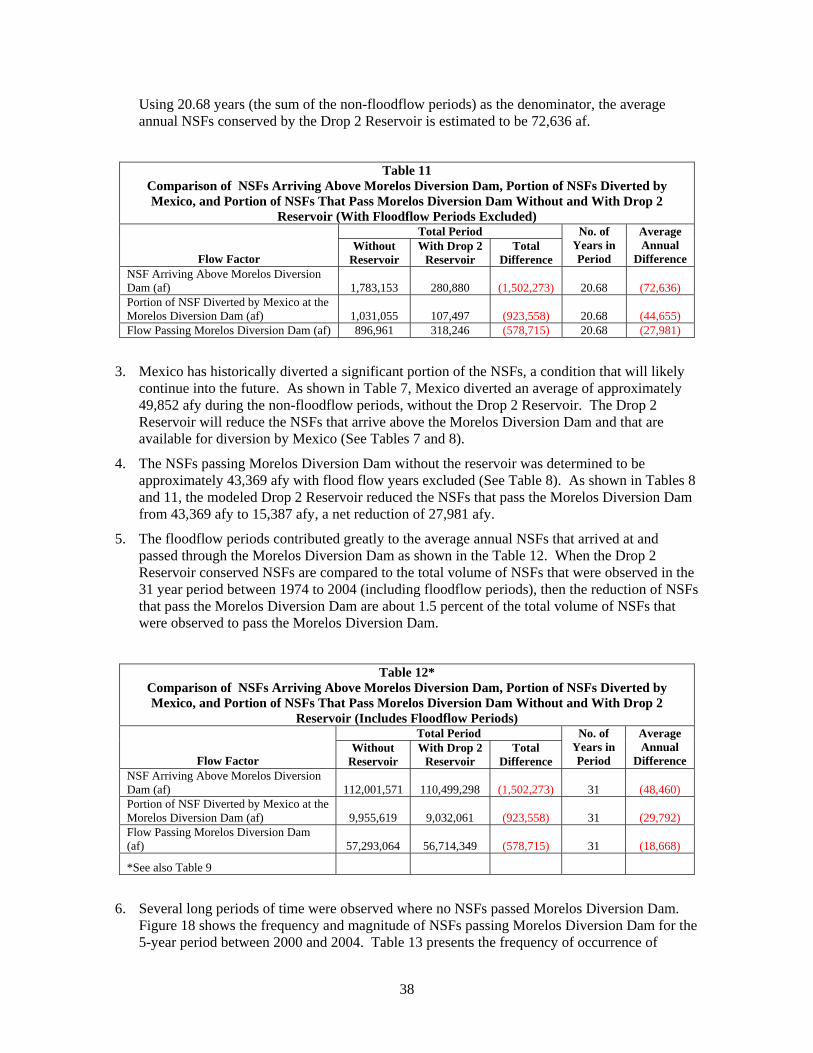
Using 20.68 years (the sum of the non-floodflow periods) as the denominator, the average annual NSFs conserved by the Drop 2 Reservoir is estimated to be 72,636 af.
Table 11 Comparison of NSFs Arriving Above Morelos Diversion Dam, Portion of NSFs Diverted by Mexico, and Portion of NSFs That Pass Morelos Diversion Dam Without and With Drop 2
Reservoir (With Floodflow Periods Excluded) Total Period
Flow Factor Without
Reservoir With Drop 2
Reservoir Total
Difference
No. of Years in Period
Average Annual
Difference NSF Arriving Above Morelos Diversion Dam (af) 1,783,153 280,880 (1,502,273) 20.68 (72,636) Portion of NSF Diverted by Mexico at the Morelos Diversion Dam (af) 1,031,055 107,497 (923,558) 20.68 (44,655) Flow Passing Morelos Diversion Dam (af) 896,961 318,246 (578,715) 20.68 (27,981)
3. Mexico has historically diverted a significant portion of the NSFs, a condition that will likely continue into the future. As shown in Table 7, Mexico diverted an average of approximately 49,852 afy during the non-floodflow periods, without the Drop 2 Reservoir. The Drop 2 Reservoir will reduce the NSFs that arrive above the Morelos Diversion Dam and that are available for diversion by Mexico (See Tables 7 and 8).
4. The NSFs passing Morelos Diversion Dam without the reservoir was determined to be approximately 43,369 afy with flood flow years excluded (See Table 8). As shown in Tables 8 and 11, the modeled Drop 2 Reservoir reduced the NSFs that pass the Morelos Diversion Dam from 43,369 afy to 15,387 afy, a net reduction of 27,981 afy.
5. The floodflow periods contributed greatly to the average annual NSFs that arrived at and passed through the Morelos Diversion Dam as shown in the Table 12. When the Drop 2 Reservoir conserved NSFs are compared to the total volume of NSFs that were observed in the 31 year period between 1974 to 2004 (including floodflow periods), then the reduction of NSFs that pass the Morelos Diversion Dam are about 1.5 percent of the total volume of NSFs that were observed to pass the Morelos Diversion Dam.
Table 12* Comparison of NSFs Arriving Above Morelos Diversion Dam, Portion of NSFs Diverted by Mexico, and Portion of NSFs That Pass Morelos Diversion Dam Without and With Drop 2
Reservoir (Includes Floodflow Periods) Total Period
Flow Factor Without
Reservoir With Drop 2
Reservoir Total
Difference
No. of Years in Period
Average Annual
Difference NSF Arriving Above Morelos Diversion Dam (af) 112,001,571 110,499,298 (1,502,273) 31 (48,460) Portion of NSF Diverted by Mexico at the Morelos Diversion Dam (af) 9,955,619 9,032,061 (923,558) 31 (29,792) Flow Passing Morelos Diversion Dam (af) 57,293,064 56,714,349 (578,715) 31 (18,668)
*See also Table 9
6. Several long periods of time were observed where no NSFs passed Morelos Diversion Dam. Figure 18 shows the frequency and magnitude of NSFs passing Morelos Diversion Dam for the 5-year period between 2000 and 2004. Table 13 presents the frequency of occurrence of
38
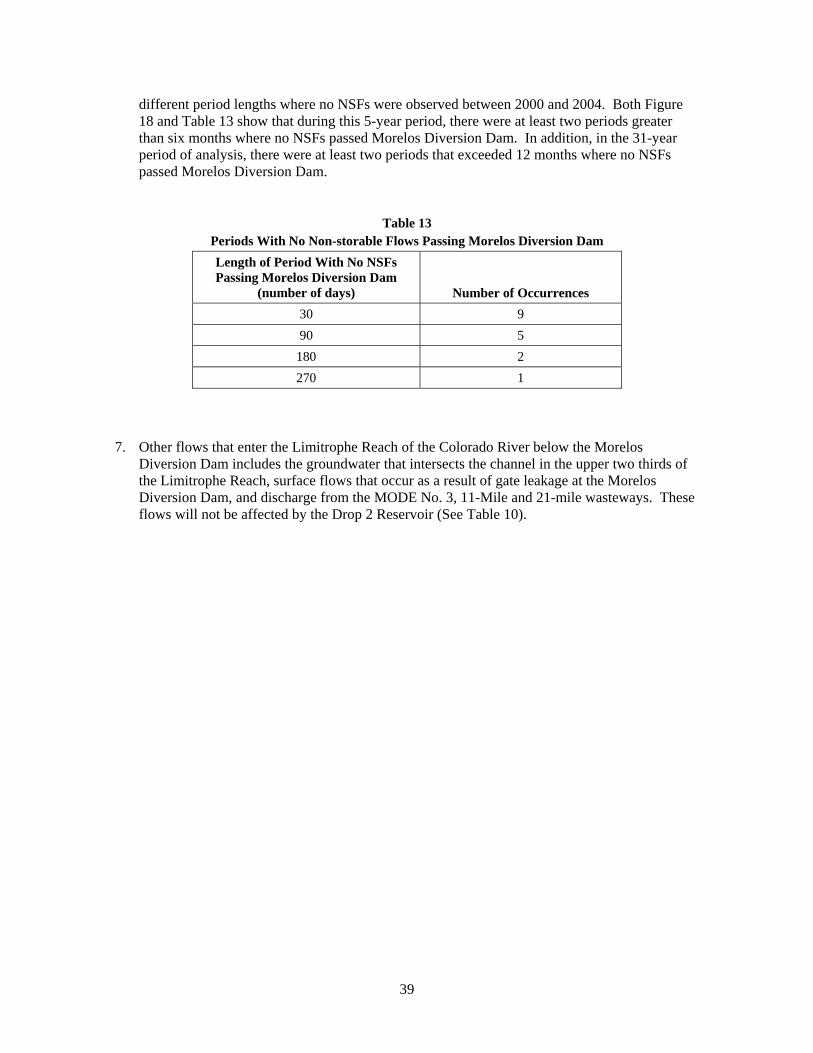
39
different period lengths where no NSFs were observed between 2000 and 2004. Both Figure 18 and Table 13 show that during this 5-year period, there were at least two periods greater than six months where no NSFs passed Morelos Diversion Dam. In addition, in the 31-year period of analysis, there were at least two periods that exceeded 12 months where no NSFs passed Morelos Diversion Dam.
Table 13 Periods With No Non-storable Flows Passing Morelos Diversion Dam Length of Period With No NSFs Passing Morelos Diversion Dam
(number of days) Number of Occurrences 30 9 90 5
180 2 270 1
7. Other flows that enter the Limitrophe Reach of the Colorado River below the Morelos Diversion Dam includes the groundwater that intersects the channel in the upper two thirds of the Limitrophe Reach, surface flows that occur as a result of gate leakage at the Morelos Diversion Dam, and discharge from the MODE No. 3, 11-Mile and 21-mile wasteways. These flows will not be affected by the Drop 2 Reservoir (See Table 10).
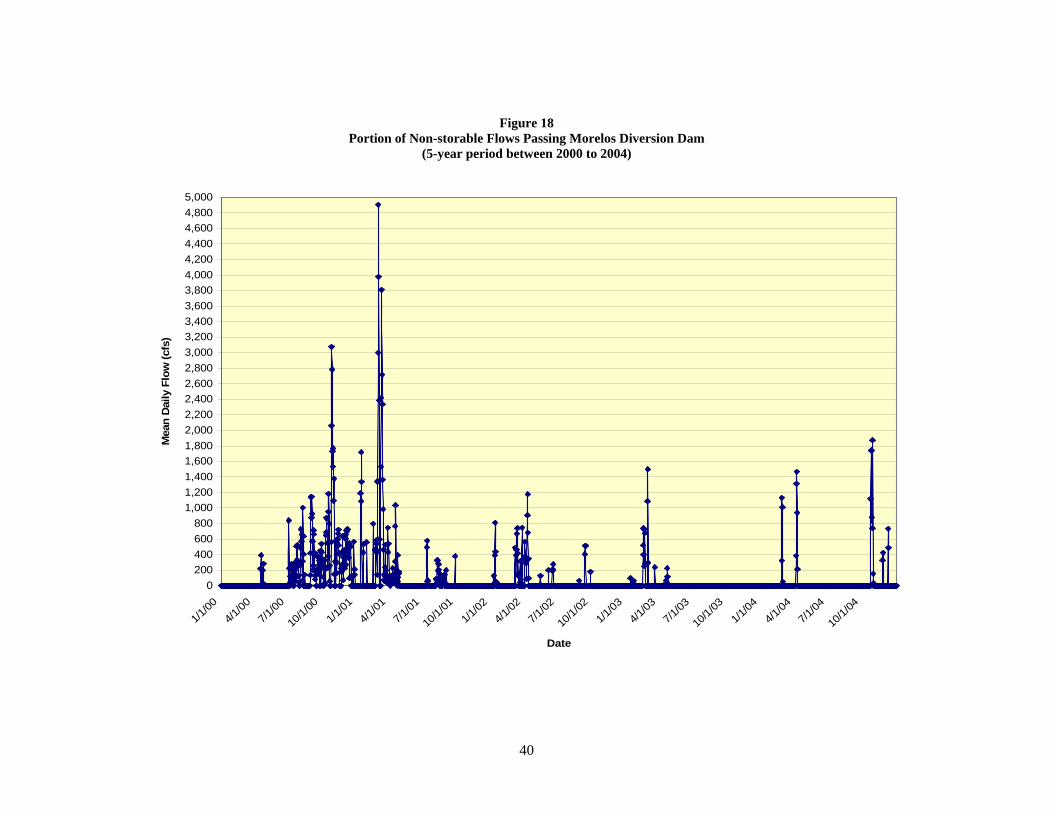
0200400600800
1,0001,2001,4001,6001,8002,0002,2002,4002,6002,8003,0003,2003,4003,6003,8004,0004,2004,4004,6004,8005,000
1/1/00
4/1/00
7/1/00
10/1/
001/1
/014/1
/017/1
/01
10/1/
011/1
/024/1
/027/1
/02
10/1/
021/1
/034/1
/037/1
/03
10/1/
031/1
/044/1
/047/1
/04
10/1/
04
Date
Mea
n D
aily
Flo
w (c
fs)
40
Figure 18 Portion of Non-storable Flows Passing Morelos Diversion Dam
(5-year period between 2000 to 2004)

EXPLANATION OF DIFFERENCES IN VALUES FOUND IN TABLES 1, 7, 8 AND 11 The calculation of the daily NSFs arriving at NIB and the portion of NSFS that were diverted by Mexico at the Morelos Diversion Dam and NSFs that passed through the Morelos Diversion Dam as shown in Tables 1,7,8 and 11 were adjusted on a daily basis. These adjustments were made to account for differences between reported flows in the river at NIB, inflows between NIB and the Morelos Diversion Dam, and diversions at Morelos Diversion Dam. For example, in some cases the reported water arriving above the Morelos Diversion Dam (NIB + Cooper Wasteway) may have been lower than the water that was reportedly diverted by Mexico at the Morelos Diversion Dam, a condition that cannot occur. Under this condition, the mean daily value of the reported water arriving above the Morelos Diversion Dam was adjusted upward so that this value would be equal to the reported mean daily diversion of water by Mexico at the Morelos Diversion Dam.
Another source for numeric differences in Tables 1, 7, 8 and 11 is that only NSFs of 10 cfs or greater were used in the model analysis. This was done to account for some of the inaccuracy of the stream gages and the use of different types of instruments for the measurement of flows at various sites. This adjustment also helped to eliminate some of the differences that occurred as a result of conversion of data from metric to English units (cms to cfs).
In addition, under-deliveries to Mexico that occur during several days in a considerable number of the months used for the model analysis were prorated and subtracted from the daily over deliveries that occurred during the month. This procedure was used as a means of taking into account daily under deliveries to Mexico, as is done in the monthly accounting of deliveries to Mexico by the USIBWC. However, this process may induce some error in the NSFs that the Model calculated.
Therefore, as a result of the measurement or reporting differences, discounting of flow values less than 10 cfs, averaging, conversion and rounding adjustments, and overall manipulation of the numbers required to run the Drop 2 Reservoir model, some of the values shown in Tables 1, 7, 8 and 11 do not add up. Thus, as a whole, the basic procedure used to model NSFs going to the Drop 2 Reservoir and downstream of Morelos Diversion Dam is considered to be reasonably sound.
41


