APPENDIX C DESIGN CALCULATIONS FOR SPECIMEN I LABORATORY BOX BEAMS Department of Civil and Architectural Engineering Lawrence Technological University Southfield, MI 48075-0134 November 2015
Transcript
231
APPENDIX C
DESIGN CALCULATIONS FOR SPECIMEN I LABORATORY BOX BEAMS
Department of Civil and Architectural Engineering
Lawrence Technological University
Southfield, MI 48075-0134
November 2015
232
Design Selection
Design of the side by side box beam bridge followed requirements described in the
MDOT Bridge Design Manual, MDOT Bridge Design Guides and the AASHTO LRFD
Bridge Design Specifications.
The proposed span length of the bridge is 60 feet. The width of the deck that was used in
design was 45 feet. This allows for one lane of traffic in each direction and two shoulders
with a width of 10 feet.
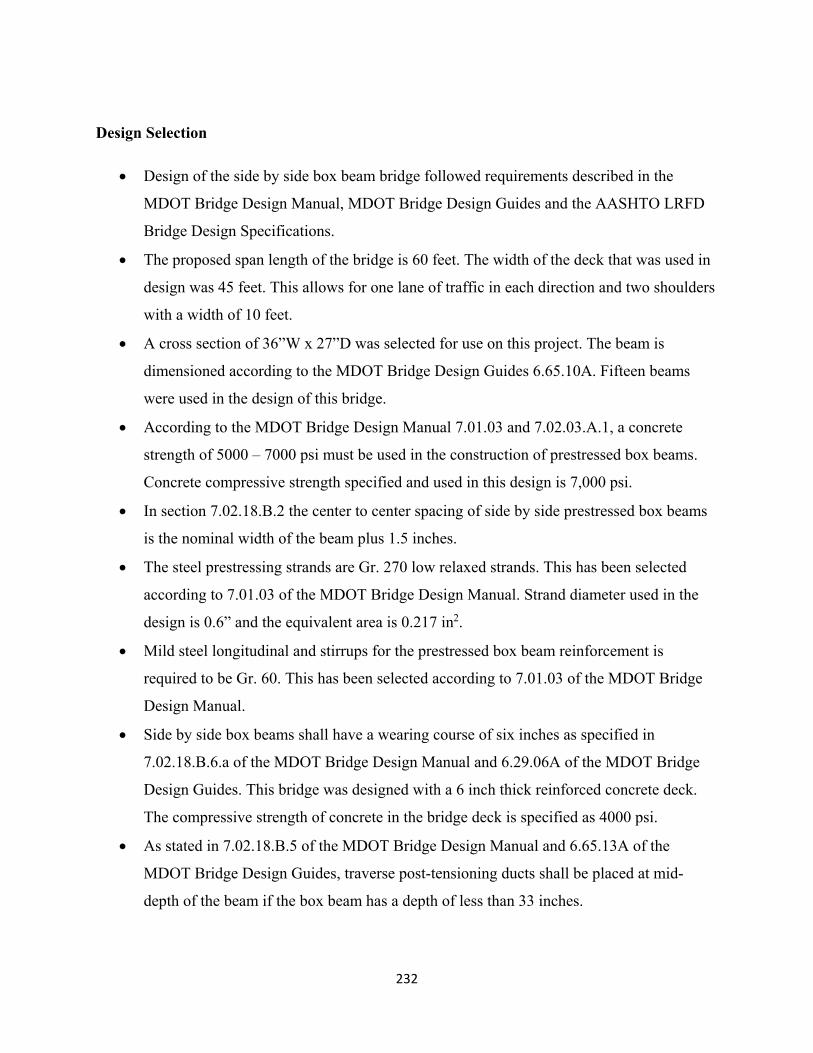
A cross section of 36”W x 27”D was selected for use on this project. The beam is
dimensioned according to the MDOT Bridge Design Guides 6.65.10A. Fifteen beams
were used in the design of this bridge.
According to the MDOT Bridge Design Manual 7.01.03 and 7.02.03.A.1, a concrete
strength of 5000 – 7000 psi must be used in the construction of prestressed box beams.
Concrete compressive strength specified and used in this design is 7,000 psi.
In section 7.02.18.B.2 the center to center spacing of side by side prestressed box beams
is the nominal width of the beam plus 1.5 inches.
The steel prestressing strands are Gr. 270 low relaxed strands. This has been selected
according to 7.01.03 of the MDOT Bridge Design Manual. Strand diameter used in the
design is 0.6” and the equivalent area is 0.217 in2.
Mild steel longitudinal and stirrups for the prestressed box beam reinforcement is
required to be Gr. 60. This has been selected according to 7.01.03 of the MDOT Bridge
Design Manual.
Side by side box beams shall have a wearing course of six inches as specified in
7.02.18.B.6.a of the MDOT Bridge Design Manual and 6.29.06A of the MDOT Bridge
Design Guides. This bridge was designed with a 6 inch thick reinforced concrete deck.
The compressive strength of concrete in the bridge deck is specified as 4000 psi.
As stated in 7.02.18.B.5 of the MDOT Bridge Design Manual and 6.65.13A of the
MDOT Bridge Design Guides, traverse post-tensioning ducts shall be placed at mid-
depth of the beam if the box beam has a depth of less than 33 inches.
233
Traverse post-tensioning tendons shall be placed at one (1) at each end of the beam, one
(1) at center span and one (1) at each quarter point for beams between 50 and 62 feet in
length. (MDOT Bridge Design Guides 6.65.13A) Post-tensioning tendons are arranged
according to this specification.
The size of the end block and intermediate diaphragms was determined in accordance
with 6.65.12, 6.65.12A and 6.65.13 of the MDOT Bridge Design Guides. Each end block
must have a minimum width of 2 feet (end block design was taken as 2 feet). The
intermediate diaphragms have a width of 1’-2”.
The loading placed on the bridge followed specification of section 3.6.1.2.2 and 3.6.1.2.4
of the AASHTO. This section states that a truck with two 32 kip axels and one 8 kip axel
spaced at 14 feet apart shall be placed on the bridge. A uniformly distributed load of 0.64
kips per linear foot in the longitudinal direction is also used in design.
In this design, the barrier wall placed on the bridge was assumed to be 400 pounds per
linear foot.
Shear stirrups shall project from the beams into the slab to provide composite action as
specified in section 7.02.18.B.6a. The stirrups will extend 2.75 inches above the top
flange of the box beams to develop a composite section with the deck slab.
Notation:
a = depth of the equivalent rectangular stress block
Ab = area of the beam
Ao = area enclosed by the centerline of the element
Aps = area of prestressing steel
Apst = total area of prestressing steel (all strands included)
Atr = transformed area (calculated by multiply by the modular ratio)
beff = lateral dimension of the effective bearing area (effective flange width)
bv = effective web width
234
c = distance from the extreme compression fiber and the neutral axis
dbeam = depth of the beam
de = effective depth from the extreme compression fiber to the centroid of the tensile
force in the tensile reinforcement
deckthick = thickness of the bridge deck
deckwidth = width of the bridge deck
DFM = distribution factor for moment on the interior girders
DFS = distribution factor for shear on the interior girders
dp = depth from the extreme compression fiber to the centroid of the tension steel
dstrand = diameter of the prestressing steel strand
dv = effective shear depth
e = eccentricity of the prestressing steel to the centroid of the cross section
Ecb = modulus of elasticity of the beam concrete
Eci = modulus of elasticity of the concrete at transfer
Ecs = modulus of elasticity of slab concrete
em = average eccentricity of the prestressing steel at midspan
Ep = modulus of elasticity of the prestressing steel tendons
fcb = concrete compressive strength of the beam
fcpe = compressive stress in concrete due to effective prestress force only
fcs = concrete compressive strength of the slab
fpe = effective stress in the prestressing steel after losses
235
fpi = stress in prestressing steel immediately prior to transfer
fps = average stress in prestressing steel at time in question
fpt = stress in prestressing steel immediately at transfer
fpu = specified tensile strength of prestressing steel
fpy = yield strength of prestressing steel
fr = modulus of rupture of the concrete
fts/cs = allowable stresses in the concrete at transfer and service
fys = minimum yield strength of compression reinforcment
H = average ambient humidity
IB3N = moment of inertia resisting superimposed dead loads
Ibeam = moment of inertia for the beam cross section
IN = moment of inertia resisting live loads
J = St. Venant torsional inertia
Mcr = cracking Moment
Mr = factored flexural resistance of a section in bending
Mu = factored moment at the section (applied moment)
n = modular ratio
Nb = number of beams
Ns = number of strands
Pe = effective prestressing force at midspan after losses
Pt = prestressing force at transfer
236
S = average spacing of mild steel reinforcement
Sb/St = section modulus of the beam (bottom or top, respectively)
SB3N/ST3N = section modulus of the beam resisting superimposed dead loads (bottom or top,
respectively)
SBN/STN = section modulus of the beam resisting live loads (bottom or top, respectively)
Span = span of the beam
Vc = nominal shear resistance provided by the tensile stresses in the concrete
Vp = applied shear of the effective prestressing force
Vs = shear resistance provided by shear reinforcement
Vu = factored shear force at section (applied shear)
yb/yt = distance from the neutral axis to the extreme tension or compression fiber
ytcs = distance to the extreme top fiber of the composite section
ΔfpES = loss in prestressing steel due to elastic shortening
ΔfpLT = long term prestress losses due to creep of concrete, shrinkage of concrete and
relaxation of steel strands
ΔfpR = an estimate of relaxation loss (taken as 2.4 ksi for low relaxation strands)
237
Design Calculations for a Box Beam used in Laboratory NDE Testing
Design Selections:
fcb 7 ksi Compressive Strength of Concrete for the Beam
fcs 4 ksi Compressive Strength of Concrete for the Bridge Deck
dstrand 0.6 in Diameter of Steel Prestressing Strand
fpu 270 ksi Tensile Strength of Steel Prestressing Strand
Span 60 ft deckwidth 45 ft
deckthick 6 in Side by Side Box Beam Bridges use a 6" Wearing Surface
Using a Box Beam with Dimensions of 36"W x 27"D the properties are as follows:
dbeam 27 in wbeam 36 in Wbeam 530lbf
ft
Ab 509 in2 yt 13.43 in yb 13.57 in
St 3520 in3 Sb 3480in
3 Ibeam 47300 in4
Figure 1: 36" W x 27" D Box Beam Section
238
Check Maximum Span to Depth Ratio:
Using Simple Span Adjacent Box Beams (AASHTO Table 2.5.2.6.3-1):
Mindepth 0.030 Span 21.6 in
if Mindepth dbeam deckthick "ok" "notok" "ok"
Composite Section Properties:
For adjacent box beam, the effective flange width is equal to the width of the section.
bspac 36 in
beff min bspac Span 36 in Section 4.6.2.6
Modulus of Elasticity:
Unitless values for use in elastic modulus equations
Composite Section Resisting Superimposed Dead Loads:
k 3
Atr
str deckthick
k54.427 in
2 Transformed area
Islab
str
3deckthick
3
12163.281 in
4 Moment of Inertia of the slab
239
Distance from bottom of section to thecentroid of the slab
yslab dbeam
deckthick
2 30 in
Element Area (in2) Y(in) AY (in3) AY2 (in3)
Ab 509 in2 yb 13.57 in Ab yb 6907.1 in
3 Ab yb2 93729.8 in
4Girder
Slab Atr 54.427 in2 yslab 30 in Atr yslab 1632.8 in
3 Atr yslab2 48984.2 in
4
A Ab Atr 563.427 in2
AY Ab yb Atr yslab 8.54 103 in
3
AY 2 Ab yb2 Atr yslab
2 142713.9 in4
ybar3NAY
A15.157 in
Iz Islab Ibeam AY 2 190177.2 in4
Moment of Inertia of Composite Section
I3N Iz A ybar3N2 60736.3 in
4
ytcs dbeam deckthick ybar3N 17.843 in Distance to Extreme Top Fiber ofComposite Section
SB3N
I3N
ybar3N4007.1 in
3 Bottom Section Modulus
ST3N
I3N
ytcs3404 in
3 Top Section Modulus
240
Composite Section Resisting Live Loads:
k 1
Atr
str deckthick
k163.281 in
2 Transformed area
Islab
str
kdeckthick
3
12489.842 in
4 Moment of Inertia of the slab
yslab dbeam
deckthick
2 30 in Distance from bottom of section to the
centroid of the slab
Element Area (in2) Y(in) AY (in3) AY2 (in3)
Ab 509 in2 yb 13.57 in Ab yb 6907.1 in
3 Ab yb2 93729.8 in
4Girder
Slab Atr 163.281 in2 yslab 30 in Atr yslab 4898.4 in
3 Atr yslab2 146952.6 in
4
A Ab Atr 672.281 in2
AY Ab yb Atr yslab 1.181 104 in
3
AY 2 Ab yb2 Atr yslab
2 240682.3 in4
ybarNAY
A17.56 in
Iz Islab Ibeam AY 2 288472.2 in4
IN Iz A ybarN2 81161.4 in
4 Moment of Inertia of CompositeSection
ytcs dbeam deckthick ybarN 15.44 in Distance to Extreme Top Fiber of Composite Section
SBN
IN
ybarN4621.8 in
3 Bottom Section Modulus
STN
IN
ytcs5256.7 in
3 Top Section Modulus
241
Determine Distribution Factors
In order to determine the equations for the load distribution factors a common decksuperstructure must be chosen from Table 4.6.2.2.1-1. For this design the typical crosssection f was chosen: precast solid, voided or cellular concrete boxes with shear keys andtraverse post-tensioning. The type of deck is cast in place overlay.
Determine the number of beams in the cross section:
deckwidth 45 ft wbeam 36 in
Nb
deckwidth
wbeam15 beams
Live Load Distribution Factors for Moment in an Interior Girder
Note: Exterior girders were not considered in this design. They are not required for thescope of the Non-Destructive evaluation covered in this project.
Using table 4.6.2.2.2b-1, determine if design criteria meets range of applicability requireme
if 35 in wbeam 60 in "ok" "not ok" "ok"
if 20 ft Span 120 ft "ok" "not ok"( ) "ok"
if 5 Nb 20 "ok" "not ok" "ok"
NEcb
Ecs1.323 Equation 4.6.2.2.1-2
Equation in Table 4.6.2.2.2b-1 ( Undersection, Concrete Beams used in Multibeam Decks as Type of Superstructure)
k max 2.5 Nb 0.2 1.5
1.5
Determine A o which is defined as the area enclosed by the centerlines of the elements.
Ao wbeam 4.5 in dbeam4.5 in
2
5 in2
700.875 in2
242
hhhhh
J4 Ao
2
s
t
Equation C4.6.2.2.1-3
s = length of a side element (in) s 27 in
t = thickness of plate-like element(in)
t 4.5 in
J4 Ao
2
2s
t
163741.9 in
4
One Lane Loaded (Live Load Distribution Factors for Moment):
The equation for live load moment distribution factors is found in Table 4.6.2.2.2b-1.
DFM1Lane kwbeam
33.3 Span
0.5
Ibeam
J
0.25
For this equation given in AASHTO, the constants are developed around specific units (sin feet and beam width in inches). Since Mathcad incorporates units, the equation below been simplified to take out the effect of units and obtain the correct live load factors.
DFM1Lane kwbeam
2.75 Span
0.5
Ibeam
J
0.25
0.148
Two Lane or More Lanes Loaded (Live Load Distribution Factors for Moment):
The equation for live load moment distribution factors is found in Table 4.6.2.2.2b-1
DFM2Lane kwbeam
305
0.6
wbeam
12 Span
0.2
Ibeam
J
0.06
For this equation given in AASHTO, the constants are developed around specific units (spin feet and beam width in inches). Since Mathcad incorporates units, the equation below hbeen simplified to take out the effect of units and obtain the correct live load factors.
DFM2Lane kwbeam
305 in
0.6
wbeam
Span
0.2
Ibeam
J
0.06
0.212
243
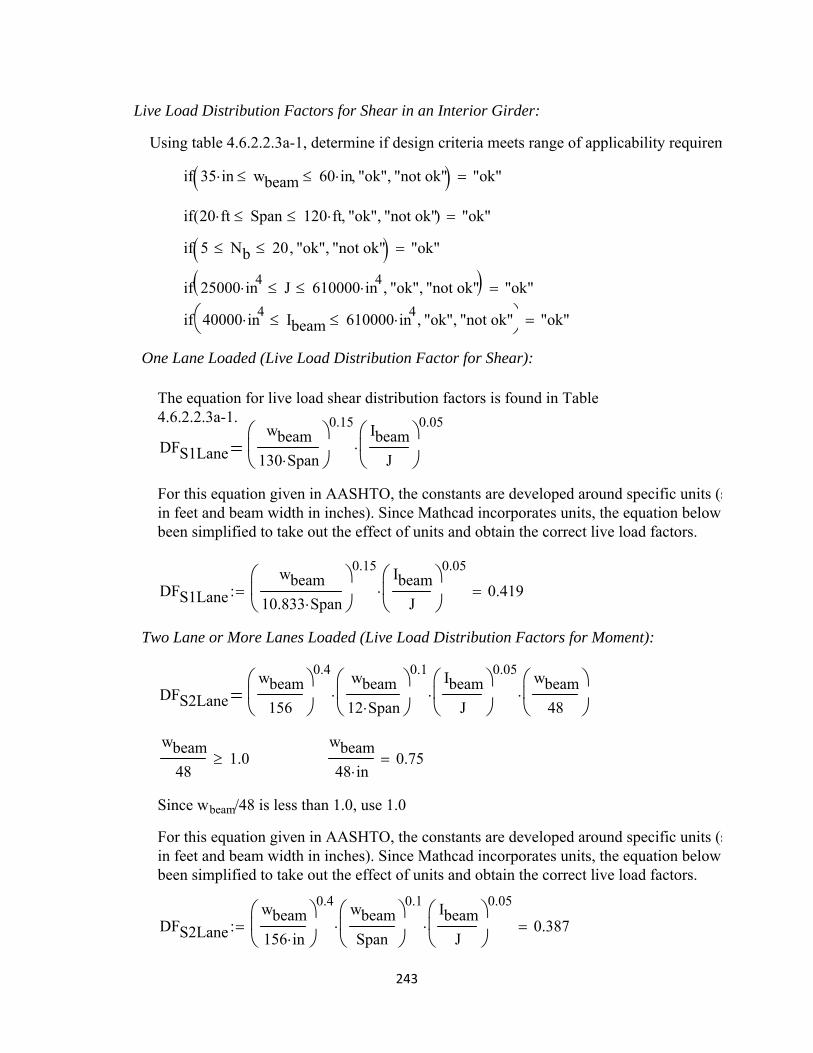
hhhhh Live Load Distribution Factors for Shear in an Interior Girder:
Using table 4.6.2.2.3a-1, determine if design criteria meets range of applicability requirem
if 35 in wbeam 60 in "ok" "not ok" "ok"
if 20 ft Span 120 ft "ok" "not ok"( ) "ok"
if 5 Nb 20 "ok" "not ok" "ok"
if 25000 in4 J 610000 in
4 "ok" "not ok" "ok"
if 40000 in4 Ibeam 610000 in
4 "ok" "not ok"
"ok"
One Lane Loaded (Live Load Distribution Factor for Shear):
The equation for live load shear distribution factors is found in Table4.6.2.2.3a-1.
DFS1Lane
wbeam
130 Span
0.15Ibeam
J
0.05
For this equation given in AASHTO, the constants are developed around specific units (sin feet and beam width in inches). Since Mathcad incorporates units, the equation below been simplified to take out the effect of units and obtain the correct live load factors.
DFS1Lane
wbeam
10.833 Span
0.15Ibeam
J
0.05
0.419
Two Lane or More Lanes Loaded (Live Load Distribution Factors for Moment):
DFS2Lane
wbeam
156
0.4wbeam
12 Span
0.1
Ibeam
J
0.05
wbeam
48
wbeam
481.0
wbeam
48 in0.75
Since w beam/48 is less than 1.0, use 1.0
For this equation given in AASHTO, the constants are developed around specific units (sin feet and beam width in inches). Since Mathcad incorporates units, the equation below been simplified to take out the effect of units and obtain the correct live load factors.
DFS2Lane
wbeam
156 in
0.4wbeam
Span
0.1
Ibeam
J
0.05
0.387
244
Live Load Distribution Factors Summary
Moment Factors: DFM1Lane 0.148 DFM2Lane 0.212
DFM max DFM1Lane DFM2Lane 0.212
Shear Factors: DFS1Lane 0.419 DFS2Lane 0.387
DFS max DFS1Lane DFS2Lane 0.419
Dead Load Moments on the Girder
Moment due to the Self Weight of the Beam:
beamWbeam Span
2
8238.5 ft kip
Moment due to the Weight of the Slab:
Wslab 150lbf
ft3
slabWslab wbeam deckthick Span
2
8101.25 kip ft
Load due to the Weight of the Wearing Surface:
Wws 0.025kip
ft2
WSdeckwidthWws
Nb0.075
kip
ft
Load due to the Weight of Barrier Wall:
Wbarrier 400lbf
ft
barrierWbarrier 2
Nb0.053
kip
ft
Non-composite Dead Load Moments:
MDC1 beam slab 339.75 kip ft
245
Composite Dead Load Moments:
MDC2barrier Span
28
24 kip ft
Moment due to the Wearing Surface Load:
MDWWS Span
22
135 kip ft
Moment due to Dead Load of Structural Components and Nonstructural attachments:
MDC MDC1 MDC2 363.75 kip ft
Live Load Moments on the Girders:
Using the AASHTO Design truck from section 3.6.1.2.2 the truck has two 32 kip axles one 8 kip axle spaced at 14 feet apart. This truck is placed at midspan of the beam todetermine the live load moment.
Figure 3: AASHTO DesignTruck
246
hhhhh
Figure 4: Influence Line for Maximum moment at Midspan
Design Lane Load Section 3.6.1.2.4:
This section states that the design lane load shall consist of a load of 0.64klf uniformdistributed in the longitude direction.
Dynamic Load Allowance Factors come from Table 3.6.2.1-1:
Fatigue and Fracture Limit State: IMfatigue 1.15
All other limit states: IM 1.33
MDT1 IM 8 kip
Span
214 ft
2
32 kipSpan
4
32 kip
Span
214 ft
2
MDT2
0.64kip
ft Span
2
8
MDT MDT1 MDT2 1352kip ft
Live Load Moment when distribution factors are taken into account.
MLLI MDT DFM 286.884 kip ft
247
Load Combinations for Moment:
All load combinations are obtained from Section 3.4.1, specifically Table 3.4.1-1 and Table 3.4
Strength I: Basic load combination relating the normal vehicular use of the bridge without
LCST1 1.25 MDC 1.50 MDW 1.75 MLLI 1159.2 kip ft
Strength IV: Load combination relating to very high dead load to live load force effect rati
LCST4 1.25 MDC 1.5 MDW 657.2 kip ft
Service III: Load combination for longitudinal analysis relating to tension in prestressedconcrete superstructures.
LCSV1 1.0 MDC 1.0 MDW 0.8 MLLI 728.3 kip ft
The governing load combination is Strength I with a design moment of 1159.2 kip-ft.
Mu max LCST1 LCST4 LCSV1 1159.2 kip ft
Dead Load Shears on Girders
Load due to Self Weight of the Beam:
beam Wbeam 0.53kip
ft
Load due to the Weight of the Slab:
Wslab 150lbf
ft3
slab Wslab wbeam deckthick 0.225kip
ft
Load due to the Wearing Surface:
Wws 0.025kip
ft2
WSdeckwidthWws
Nb0.075
kip
ft
248
Load due to the Weight of Barrier Wall:
Wbarrier 400lbf
ft
barrierWbarrier 2
Nb0.053
kip
ft
Non-composite Dead Loads:
DC1 beam slab 0.755kip
ft
Composite Dead Loads:
DC2 barrier 0.053kip
ft
Wearing Surface Load:
DW WS 0.075kip
ft
Shears due to Dead Load of Structural Components and Nonstructural attachments:
VDCDC1 DC2( ) Span
224.25 kip
Shears due to Dead Load of the Wearing Surface:
VDWDW Span
22.25 kip
Live Load Shears on the Girders:
Using the AASHTO Design truck from section 3.6.1.2.2 the truck has two 32 kip axles one 8 kip axle spaced at 14 feet apart. This truck is placed with the heavy axle at the enthe beam to determine the live load shear for the girder. A lane load of 0.64 kips/ft isapplied to the entire beam per 3.6.1.2.4. The distribution of loads on the girder is shownbelow in Figure 5.
Figure 5: Distribution of Loads to Determine Shear
249
Design Lane Load Section 3.6.1.2.4:
This section states that the design lane load shall consist of a load of 0.64klf unifordistributed in the longitude direction.
Dynamic Load Allowance Factors come from Table 3.6.2.1-1:
Fatigue and Fracture Limit State: IMfatigue 1.15
All other limit states: IM 1.33
VDT IM 32 kip 32 kipSpan 14 ft
Span
8 kipSpan 28 ft
Span
0.64
kip
ft Span
2
VDT 100.064 kip
Live Load Moment when distribution factors are taken into account.
VLLI VDT DFS 41.971 kip
Load Combinations for Shear:
All load combinations are obtained from Section 3.4.1, specifically Table 3.4.1-1 and Table 3.4
Strength I: Basic load combination relating the normal vehicular use of the bridge without w
LCST1 1.25 VDC 1.50 VDW 1.75 VLLI 107.1 kip
Strength IV: Load combination relating to very high dead load to live load force effect ratio
LCST4 1.25 VDC 1.5 VDW 33.7 kip
Service III: Load combination for longitudinal analysis relating to tension in prestressedconcrete superstructures.
LCSV1 1.0 VDC 1.0 VDW 0.8 VLLI 60.1 kip
The governing load combination is Strength I with a design shear of 107.1 kip.
Vu max LCST1 LCST4 LCSV1 107.1 kip
250
Prestressing Steel
Check the theoretical number of strands using the Service III Load Combination:
For this process, the ECE 5783 Lecture 5: Prestressed Concrete Superstructure Designdeveloped by Matt Chynoweth was followed.
fb
MDC1
Sb
MDC2 MDW
SBN
0.8 MLLI
SBN
2.18 ksi
Tensile stress limit at service after losses:
Limit found from Table 5.9.4.2.2-1. It is considered "Other than Segmentally Constructin an area that is not worse than moderate corrosion conditions for bonded prestressingtendons.
Tlimit 0.19fcb
ksi
ksi 0.503 ksi
Excess Tension in Bottom Fiber due to applied loads:
fp fb Tlimit 1.678 ksi
Assume a center of gravity location to be between 5% and 15% of beam depth. In this c8% has been assumed in the process of determining the number of strands.
ybs 0.08 dbeam 2.16 in from the bottom fiber of the beam
Determine the strand eccentricity:
yb 13.57 in Beam Center of Gravity
e yb ybs 11.41 in Strand Eccentricity
Determine Pe which is the effective final prestress force after all losses.
Fp
Pe
Ab
Pe e
Sb
Pe
Ab fp Sb
Sb Ab e
319.941 kip
Stress Limit Prior to Transfer:
This limit is found in Table 5.9.3-1. It is considered pretensioning low relaxed tendonimmediately prior to transfer.
fpi 0.75 fpu 202.5 ksi
251
Assume 25% final prestressing losses per 0.6" diameter strand
Apsc 0.20 in2 Conservative value used when determining the number of strands
Aps 0.217 in2 MDOT Standard Specifications Section 905.07
fpe Apsc fpi 1 0.25( ) 30.375 kip
Number of strands: Ns
Pe
fpe10.533 Use 12-0.6" Diameter Strands
Prestress Losses
Instantaneous Losses - Elastic Shortening
f pES
Ep
Ectfcgp AASHTO Equation 5.9.5.2.3
Ns 12
Apst Ns Aps 2.604 in2 Total Area of Prestressing Steel
fpi 0.75 fpu 202.5 ksi Stress in Prestressing Steel prior to Transfer
em yb 2 in 11.57 in Prestressing Steel Eccentricity at Midspan
Eci Ecb 5072.2 ksi Concrete Elastic Modulus at Transfer
Ep 28500 ksi Elastic Modulus of Prestressing Steel Tendon
Mbeam
Wbeam Span2
82862 kip in
f pES
Apst fpi Ibeam em2
Ab
em Mbeam Ab
Apst Ibeam em2
Ab
Ab Ibeam Eci
Ep
AASHTO EquationC5.9.5.2.3a-1
f pES 9.599 ksi
Prestress Force at Transfer
fpt fpi f pES 192.901 ksi
Pt Ns Aps fpt 502.3 kip
252
Time Dependant Losseshhhh H 75 AASHTO Figure 5.4.2.3.3-1
h 1.7 0.01 H AASHTO Equation 5.9.5.3-2
h 0.95
st5
1fcb
ksi
0.625 AASHTO Equation 5.9.5.3-3
f pR 2.4
f pLT 10fpi Apst
Ab h st 12 ksi h st f pR ksi AASHTO Equation
5.9.5.3-1
f pLT 15.676 ksi
Effective Prestressing Force at Midspan
fpe fpi f pLT f pES 177.225 ksi
Pe Ns Aps fpe 461.493 kip
Determine f'ci
f'ci is defined as the specified compressive strength of the concrete at time of transfer
and is assumed to be 0.8f' c
fci 0.8 fcb 5.6 ksi
fci1 0.8fcb
ksi 5.6 just a unitless value for ease of calculation
Allowable Stresses for Concrete
Initial allowable tensile stress is found in Table 5.9.4.1.2-1. This beam is consideredother than segmentally constructed in areas with bonded reinforcement sufficient toresist the tensile force in the concrete computed assuming an uncracked section.
ftsi 0.24 fci1 ksi 0.568 ksi
Initial allowable compressive stress is found in Section 5.9.4.1.1. It states that thecompressive stress limit for pretensioned concrete components is 0.60f' ci
fcsi 0.6 fci 3.36 ksi
253
hhhhh Final allowable tensile stress is found in Table 5.9.4.2.2-1. The bridge type is other tsegmentally constructed bridges. The location is assumed to be for components withbonded prestressing tendons or reinforcement that are subjected to not worse thanmoderate corrosion conditions.
ftsf 0.19 fci1 ksi 0.45 ksi
Final allowable compressive stress is found in Table 5.9.4.2.1-1. The location isassumed as other than segmentally constructed bridges due to the sum of effectiveprestress and permanent loads.
fcsf 0.45 fci 2.52 ksi
Initial Stresses at the End of the Beam
Stress in the Top of the Beam at Beam End
(for checks made at the end of the beam, the moment is zero)
MBend 0 kip ft e em 11.57 in
ftiend
Pt
Ab
Pt e
St
MBend
St 0.664 ksi
if ftiend ftsi "ok" "not ok" "not ok"
Try debonding 2 strands to lower stress at the end of the beam.
Ndebond 2
Nsend Ns Ndebond 10 Number of bonded strands at end of beam
Aps 0.217 in2
Pt2 Nsend Aps fpt 418.595 kip
ftiend2
Pt2
Ab
Pt2 e
St
MBend
St 0.554 ksi
if ftiend2 ftsi "ok" "not ok" "ok"
Stresses in the Bottom of the Beam at Beam End
fciend
Pt
Ab
Pt e
Sb
MBend
Sb 2.657 ksi
254
hh if fciend fcsi "ok" "not ok" "ok"
Check to Ensure Stresses are okay at Bottom of Beam when Two Strands are Debonded
fciend2
Pt2
Ab
Pt2 e
Sb
MBend
Sb
fciend2 2.214 ksi
if fciend2 fcsi "ok" "not ok" "ok"
Initial Stresses at the Midspan of the Beam
Stresses in top of the Beam at Midspan
Mbeam 238.5 kip ft
ftimid
Pt
Ab
Pt e
St
Mbeam
St
ftimid 0.149 ksi
if ftimid ftsi "ok" "not ok" "ok"
Stresses in Bottom of the Beam at Midspan
fcimid
Pt
Ab
Pt e
Sb
Mbeam
Sb
fcimid 1.834 ksi
if fcimid fcsi "ok" "not ok" "ok"
Final Stresses at the Midspan of the Beam
MDC1 339.75 kip ft MDW 135 kip ft
MDC2 24 kip ft MLLI 286.884 kip ft
255
Stresses in the Top of the Beam at Midspan
fcfmid
Pe
Ab
Pe e
St
MDC1
St
MDC2 MDW
SB3N
MLLI
SBN
fcfmid 1.769 ksi
if fcimid fcsf "ok" "not ok" "ok"
Stresses in the Bottom of the Beam at Midspan
ftfmid
Pe
Ab
Pe e
Sb
MDC1
Sb
MDC2 MDW
SB3N
MLLI
SBN
ftfmid 0.048 ksi
if ftfmid ftsf "ok" "not ok" "ok"
Check Flexural Resistance
Mu 1159.2 kip ft
Flexural Resistance Equation Considering just Prestressing Steel
Mn Aps Fps Dpa
2
Values needed to calculate the moment capacity.
Aps 0.217 in2 fpu 270 ksi
fcs 4 ksi b beff 36 in
Determine ß1 based on AASHTO Section 5.7.2.2
The factor ß 1 shall be taken as 0.85 for concrete strengths not exceeding 4.0 ksi. Fo
concrete strengths exceeding 4.0 ksi, ß1 shall be reduced at a rate of 0.05 for each
1.0 ksi of strength in excess of 4.0 ksi, except ß 1 shall not be taken less than 0.65.
1 0.85 for concretes less than or equal to 4ksi
k 2 1.04fpy
fpu
AASHTO Equation 5.7.3.1.1-2
256
h h fpy
fpu0.9 Table C5.7.3.1.1-1 for low relaxation strands
k 2 1.04 0.90( ) 0.28 Value can also be found on table C5.7.3.1.1-1
Determine the depth to the prestressing steel based on the beam depth plus the deckthickness
dp dbeam deckthick 2 in 31 in
Determine c: distance between the neutral axis and the compressive face for rectangularsections.
cAps Ns fpu
0.85 fcs 1 b k Aps Nsfpu
dp
AASHTO Equation 5.7.3.1.1-4
c 6.369 in
Determine the depth of the equivalent rectangular stress block. a is defined in Section5.7.3.2.2
a 1 c 5.414 in
a is within the slab so the rectangular section assumption is valid.
Determine the average stress in the prestressing steel
fps fpu 1 kc
dp
AASHTO Equation 5.7.3.1.1-1
fps 254.468 ksi
Determine the factored moment resistance
? is found based on Section 5.5.4.2.1. This section is considered a tension-controlledprestressed concrete sections.
1.0
Nominal Moment Resistance
Mn Apst fps dpa
2
AASHTO Equation 5.7.3.2.2-1
Mn 1562.3 kip ft
Factored Moment Resistance
Mr Mn 1562.3 kip ft
257
h h Calculate Minimum Reinforcement
The amount of prestressed and nonprestressed tensile reinforcement shall beadequate to develop a factored flexural resistance, Mr, at least equal to the lesser of1.2 time the cracking moment, Mcr, or 1.33 times the factored moment required bythe applicable strength load combinations. This is described in Section 5.7.3.3.2. Inequation form:
M n min 1.2 Mcr 1.33 Mu
Cracking Moment
Mcr Sc fr fcpe Mdnc
Sc
Snc1
Sc fr AASHTO Equation5.7.3.3.2-1
Determine the Modulus of Rupture
Modulus of ruputure for normal weight concrete shall be taken as 0.37(f'c)1/2 when
calculating the cracking moment of a member in Article 5.7.3.3.2. This is describin Section 5.4.2.6.
fr 0.37 fcb1 ksi 0.979 ksi
fcpe
Pt
Ab
Pt e
Sb 2.657 ksi
Mcr1 SBN fr fcpe MDC1
SBN
Sb1
1288.9 kip ft
Mcr2 SBN fr 377.037 kip ft
Mcr max Mcr1 Mcr2 1288.9 kip ft
1.2 Mcr 1546.7 kip ft
Determine the value for 1.33 times the factored moment required by the applicablestrength load combinations specified in Table 3.4.1-1
Mu133 1.33 Mu 1541.8 kip ft
Minimum ReinforcementCheck
if Mr max 1.2 Mcr 1.33 Mu "ok" "not ok" "ok"
Mr 1562.3 kip ft
258
Shear Design
Determine the Critical Section for Shear
Find dv which is defined as the effective shear depth. It is taken as the distance
measured perpendicular to the neutral axis, between the resultants of the tensile andcompressive forces due to flexture and can be taken less than the greater tof 0.9de o0.72h. This is defined in Section 5.8.3.9.
dv
Mn
Apst fps AASHTO Equation C5.8.2.9-1
dv 28.293 in
de
Apst fps dp
Apst fps31 in AASHTO Equation 5.8.2.9-2
dv can also be written as:
dv1 dea
2 28.293 in
0.9 de 27.9 in
0.72 dbeam deckthick 23.76 in
dv max dv1 0.9 de 0.72 dbeam deckthick 28.293 in
Assume that the shear at the end of the beam is equal to the shear in this section.
Vu 107.136 kip
Determine s value to use for shear and torsion
Found in section 5.5.4.2.1 under shear and torsion for normal weight concrete.
s 0.9
Shear Stress on the Concrete
vu
Vu V p
bv dvAASHTO Equation 5.8.2.9-1
Vp is described as the component of prestressing force in the direction of the sheforce. This force is considered to be 0 for straight tendons. (AASHTO Section5.8.2.4)
V p 0 kip Vp 0 kip
259
p p
h h Bv is the effective web withd taken as the minimum web width, measured parallel the neutral axis, between the resultants of the tensile and compressive forces due toflexure. This is found in Section 5.8.2.9 of the AASHTO Code.
bw 4.5 in
bv 2 bw 9 in
Shear stress on the concrete
vu
Vu V p
bv dv
vu 0.421 ksi
Ratio of applied factored shear to concrete cpmpressive strength
vu
fcb0.06
Determine ß and
These angles are determined based the the general procedure found in Section5.8.3.4.2. For sections containing the at least the minimum amout of reinforcementand can be found by.
4.8
1 750 sAASHTO Equation 5.8.3.4.2-1
29 3500 s AASHTO Equation 5.8.3.4.2-3
Determine the net longitudinal tensile strain in the section at the centriod of thetension reinforcement, s. s is required to determine ß and
s
Mu
dv0.5 Nu Vu Vp Aps fpo
Es As Ep ApsAASHTO Equation5.8.3.4.2-4
Determine the f po according to Section 5.8.3.4.2
fpo 0.7 fpu
To be conserative, the contribution from the mild steel is ignored.
Es As 0
Axial load is assumed to be 0
Nu 0
260
Determine e shh h
s
Mu
dv0.5 Nu Vu Vp Apst fpo
Ep Apst
s 0.00144
Determine ß
4.8
1 750 s 2.31
Determine
29 3500 s 34.03
Nominal Shear Resistance
Determine the nominal shear resistance provided by the tensile stresses in theconcrete.
Vc 0.0316 fcb1 ksi bv dv AASHTO Equation 5.8.3.3-3
Vc 49.182 kip
Determine the tensile stresses in the traverse reinforcement.
Vs
Av fy dv cot ( )
sAASHTO Equation C5.8.3.3-1
Determine if Shear Reinforcement is required in the cross-section of the beam.According to Section 5.8.2.4, reinforcement shall be provided where:
Vu 0.5 s Vc Vp AASHTO Equation 5.8.2.4-1
if Vu 0.5 s Vc Vp "shear stirrups required" "no stirrups" "shear stirrups required"
Determine Spacing of the Shear Reinforcement
The nominal shear resistance V n must be greater than or equal to applied shear V u
Vn Vu
Vn Vc Vs Vp AASHTO Equation 5.8.3.3-1
261
Shear stirrups are Grade 60 #04 Bars.
fys 60 ksi
As 0.2 in2
Determine the required spacing of shear stirrups.
Vs
Vu
sVc 69.858 kip
Av As 2 0.4 in2 There are two sections resisting shear
Reorganize the Vs equation (Equation C5.8.3.3-1) to determine spacing
sAv fys dv cot deg( )
Vs
s 14.395 in
Determine the maximum spacing based on Section 5.8.2.7
If vu 0.125 fcAASHTO Equation 5.8.2.7-1
Smax 0.8dv 24 in
If vu 0.125 fcAASHTO Equation 5.8.2.7-2
Smax 0.4dv 12 in
if vu 0.125 fcb min 0.8 dv 24 in "use Equation 5.8.2.7-2" 22.635 in
if vu 0.125 fcb min 0.4 dv 12 in "use Equation 5.8.2.7-1" "use Equation 5.8.2.7-1"
Therefore use spacing determined by Vs equation or the Maximum MDOT spacing
of 12" as defined in MDOT Bridge Design Guides 6.65.10A
s 12 in
Vs
Av fys dv cot deg( )
s83.799 kip
if Av 0.0316 fcb1 ksibv s
fys "ok" "not ok"
"ok"
Vn Vs Vc 132.981 kip
262
Bursting Reinforcement (Splitting Resistance)
The splitting resistance of pretensioned anchorage zones provided by reinforcement inthe ends of pretensioned beams shall be taken as:
Pr fs As AASHTO Equation 5.10.10.1-1
The resistance shall not be taken less than 4% of the prestressing force at transfer.
Pr 0.04 Pt 20.093 kip
Determine the stress in the steel. (not to exceed 20 ksi)
fs 20 ksi
Find the area of steel required to meet the minimum resistance.
Asb
Pr
fs1.005 in
2
Determine the number of stirrups
Nstb
Asb
Av2.512 use Nstb 3
For pretensioned box or tub girders, As shall be taken as the total area of
vertical reinforcement or horizontal reinforcement located within a distance h/4from the end of the member, where h is the lesser of the overall width or heightof the member (in).
xdbeam
46.75 in
Spacing of the bursting reinforcement
sbx
Nstb sb 2.25 in
Confinement Reinforcement
Confinement reinforcement must be provided for a distance 1.5d from the end of thebeam. This is stated in Section 5.10.10.2. For box beams, traverse reinforcementshall be provided and anchored by extending the leg of the stirrup into the web of thegirder.
Lc 1.5 dbeam 40.5 in Lc 3.375 ft
Space Stirrups at 6.0 in for 3.5 ft along the beam
263
264
265
APPENDIX D
SAMPLE CALCULATIONS FOR RESIDUAL STRENGTH OF MDOT SALVAGED BOX BEAM (J11)
Department of Civil and Architectural Engineering
Lawrence Technological University
Southfield, MI 48075-0134
November 2015
266
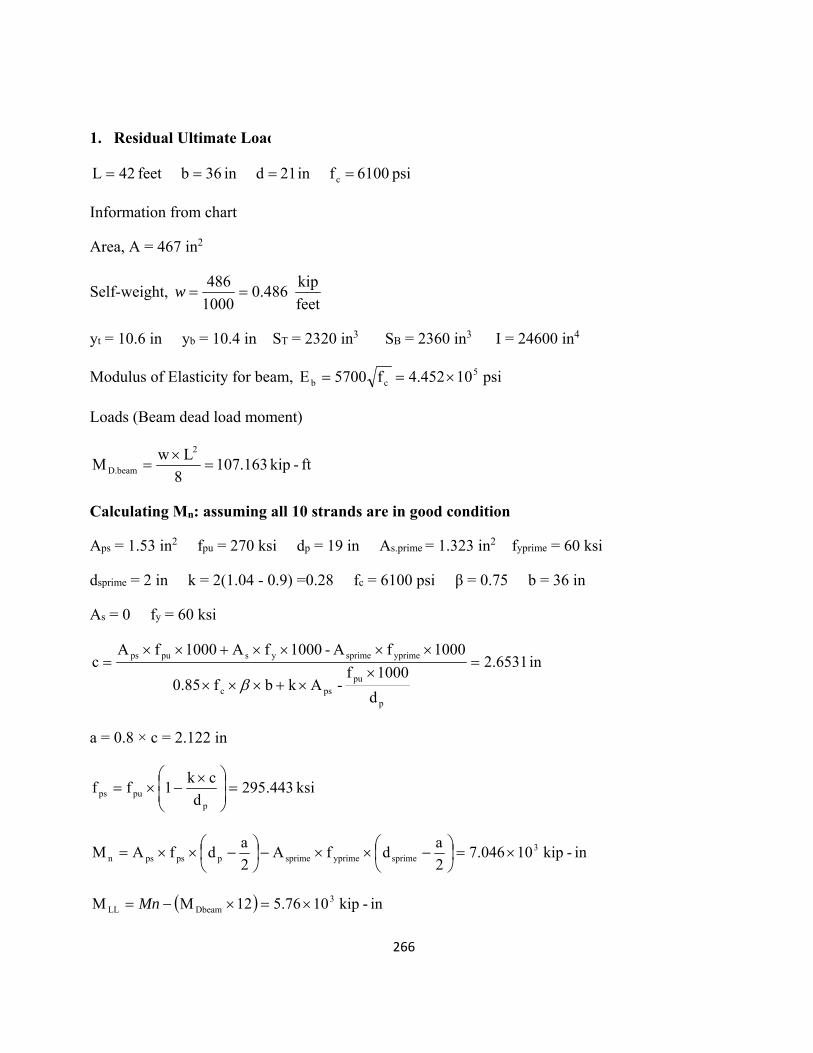
1. Residual Ultimate Load.
psi 6100 fin 21 din 36bfeet 42L c
Information from chart
Area, A = 467 in2
Self-weight, feet
kip 486.0
1000
486w
yt = 10.6 in yb = 10.4 in ST = 2320 in3 SB = 2360 in3 I = 24600 in4
Modulus of Elasticity for beam, psi 10452.4f5700E 5cb
Loads (Beam dead load moment)
ft-kip 163.1078
LwM
2
D.beam
Calculating Mn: assuming all 10 strands are in good condition