59
APPENDIX C OTHERS

AAPPPPEENNDDIIXX CC OOTTHHEERRSS
Appendix C-1
Geo-Technical Conditions
Detailed Design Study on Water Supply and Sewerage System for Astana City Final Report
C-1-1
APPENDIX C-1 GEO-TECHNICAL INVESTIGATION
C-1.1 General
In the Basic Design report, geo-technical characteristics were discussed mainly referring to
the results of field investigation in the Feasibility Study. Data obtained through field
investigations as of end of February supplemented previous data, which are the basis for
design of foundation of facilities.
Using consolidated data and information as mentioned above, geo-technical characteristics at
each premises of facility are discussed in this Appendix.
C-1.2 Methodology Applied
As mentioned in the Basic Design report, the methods applied for soil investigations
correspond to GOST and SNiP . Raw data of test are attached to this report as Annexes A to
D. Supplementary explanations on calculation method of bearing capacity including some
formulas are made in this sub-section.
The standard penetration test is generally applied for soil investigations in Japan and other
countries. This method is used to obtain the data on the geo-technical condition N-value
with undisturbed sample. This method, however, is not applied in the Republic of
Kazakhstan.
For the reference, converted N-value was calculated on the basis of the results of the static
penetration test, since the method and equipment applied is same as the Dutch cone
penetration test. In general, N-value is converted by using following formula:
qc = 4N
where, qc : static penetrate resistance (kgf/cm2)
However, it is suggested that different coefficient should be applied depending on geological
layers. In this report, following formulas are applied:
for clay layer : qc = 3N
for sandy layer : qc = 4N
Bearing capacity R0 for the spread foundation is calculated in accordance with SNiP and is
displayed in Table 1. The values are calculated under the condition of width b0 = 1m and
penetration depth d0 = 2m. For the purpose of comparison, allowable bearing capacity (qa)
is calculated using the result of static penetration test under the same condition with bearing
capacity R0. Formula applied is as follows:
qa = (1/40)*qc*B(1+Df/B)

Detailed Design Study on Water Supply and Sewerage System for Astana City Final Report
C-1-2
where, Df (penetration depth): 2m
B (width of foundation): 1m
qc(static penetration resistance): ton/m2
Mechanical properties are displayed in Table 1 and Annex B for raw data. In the column of
Cohesion, Angle of internal friction and Deformation module, both of values obtained during
Feasibility study in accordance with SNiP 2.02.02-83 and by tri-axial test during this study
are displayed. For the design purpose, it is recommended to utilize the latter value, if two
figures are obtained.
Investigation of ground corrosion activity was carried out in accordance with GOST 9.602-89
for steel and SNiP 2.03.11-85 for concrete. The level of soil aggressive impact on concrete
by cement types and on steel are determined on the basis of the results of chemical analysis of
soil moisture (see Tables 3 and 4, Annex C for raw data). Corrosion activity of soil is also
investigated using dried soil sample (see Table5). Water aggressiveness to the concrete is
determined on the basis of the results of chemical analysis of water samples (see Annex D).
C-1.3 Geo-technical Conditions of each Facility
(1) Water Treatment Plant (WTP)
1) General
The existing WTP constructed on the alluvial plain consisting of weathering Mesozoic crust,
is located in the eastern part of the Astana city. The elevation of land varies from 351 to
354mASL inclining slightly from south to north. During the feasibility study, geo-technical
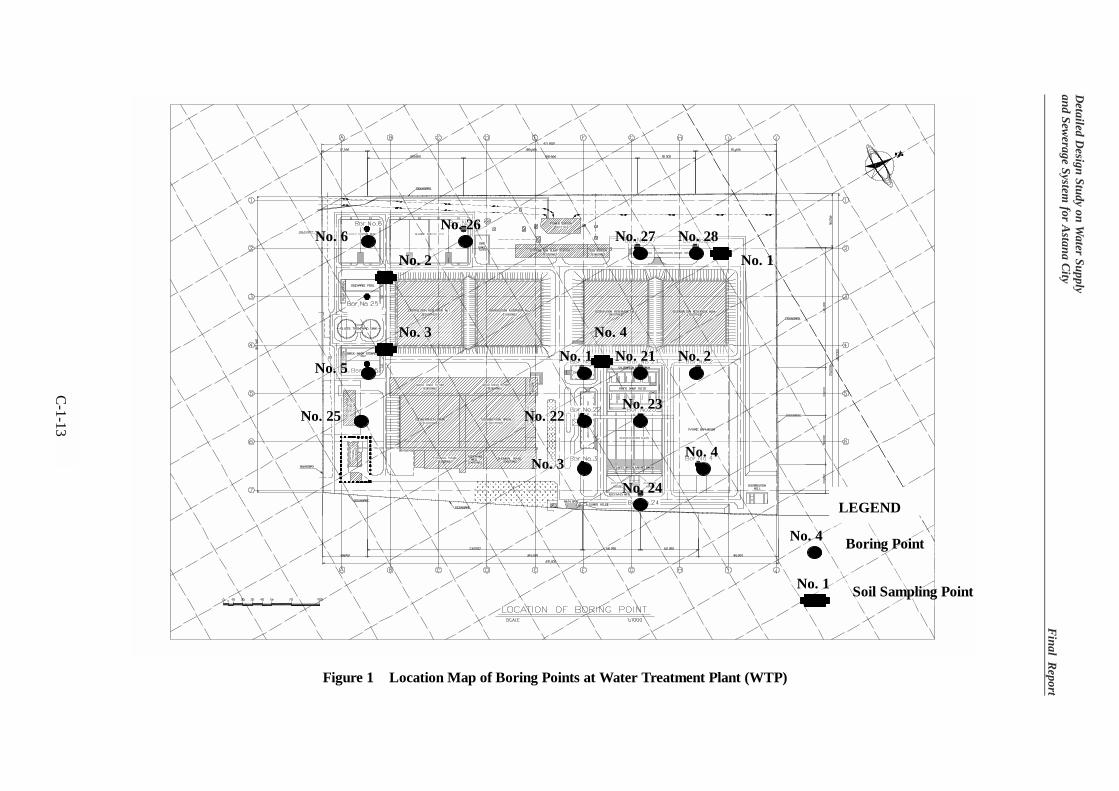
investigations were carried out at six points in the premise of WTP. Furthermore, additional
eight points were selected in order to obtain more detailed data on soil conditions. These
points were determined taking into account the plan of facilities to be constructed.
Locations of boring points and profiles are shown in Figure 1 and Figure 2(1)-(9),
respectively.
2) Geo-Technical Conditions
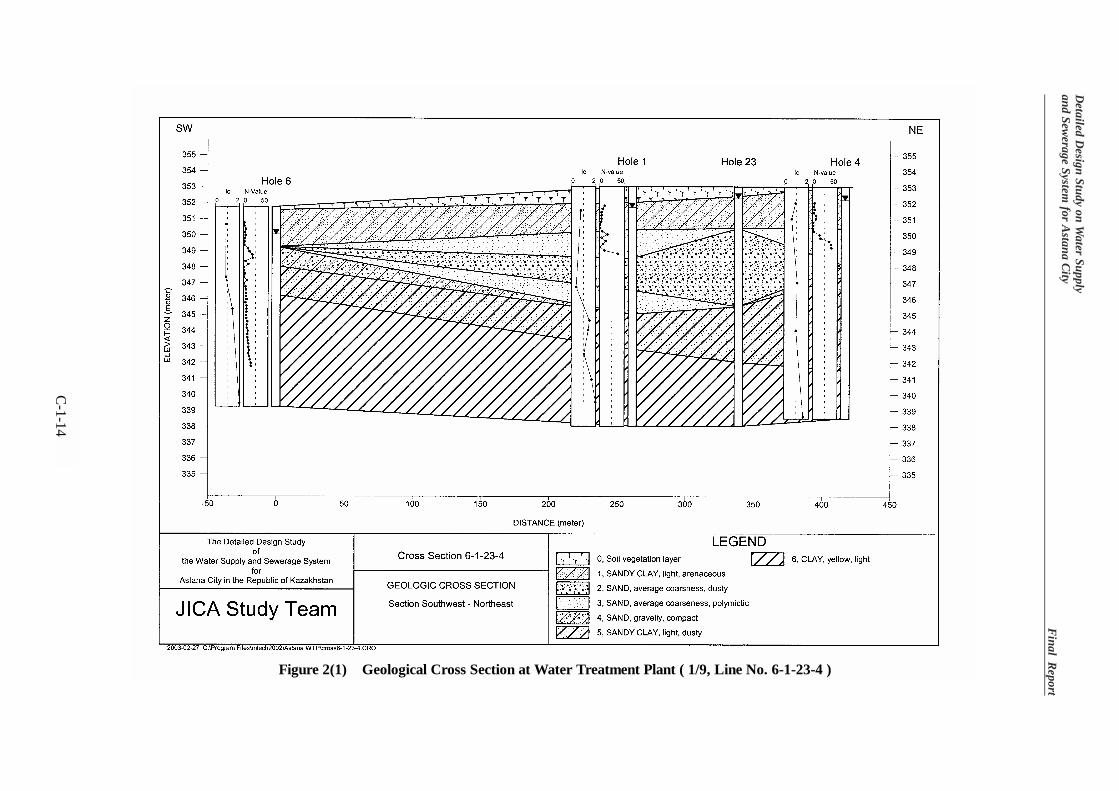
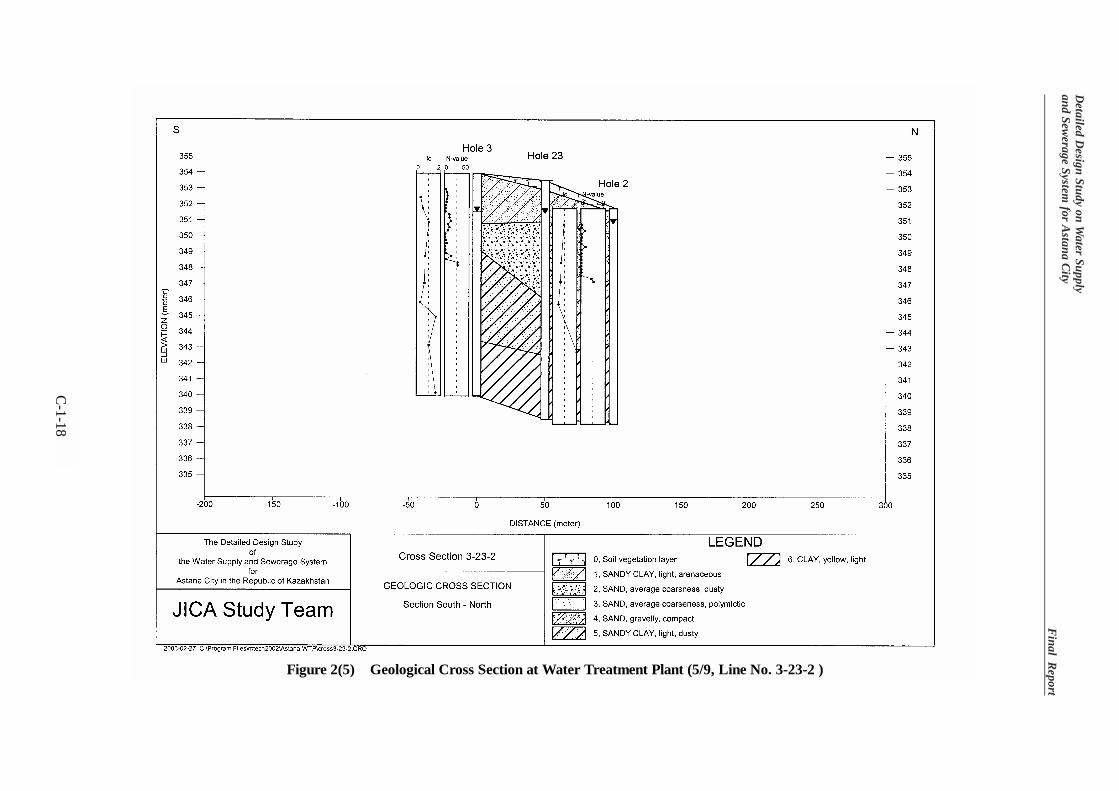
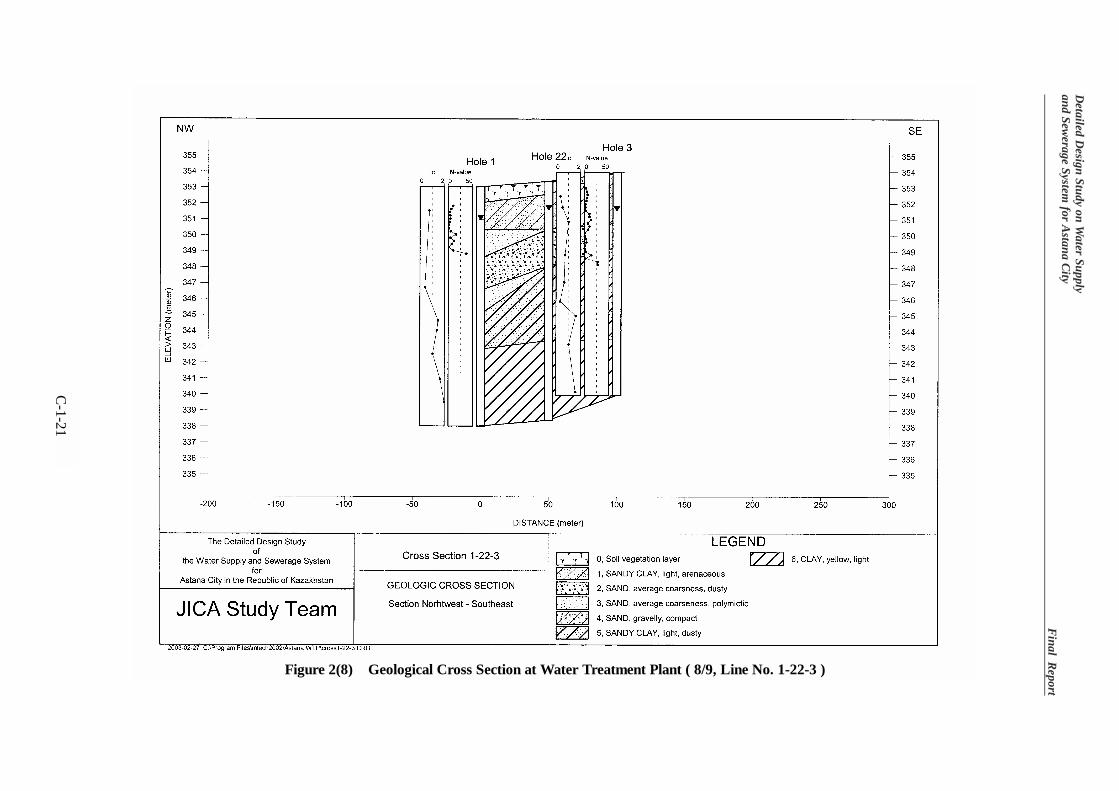
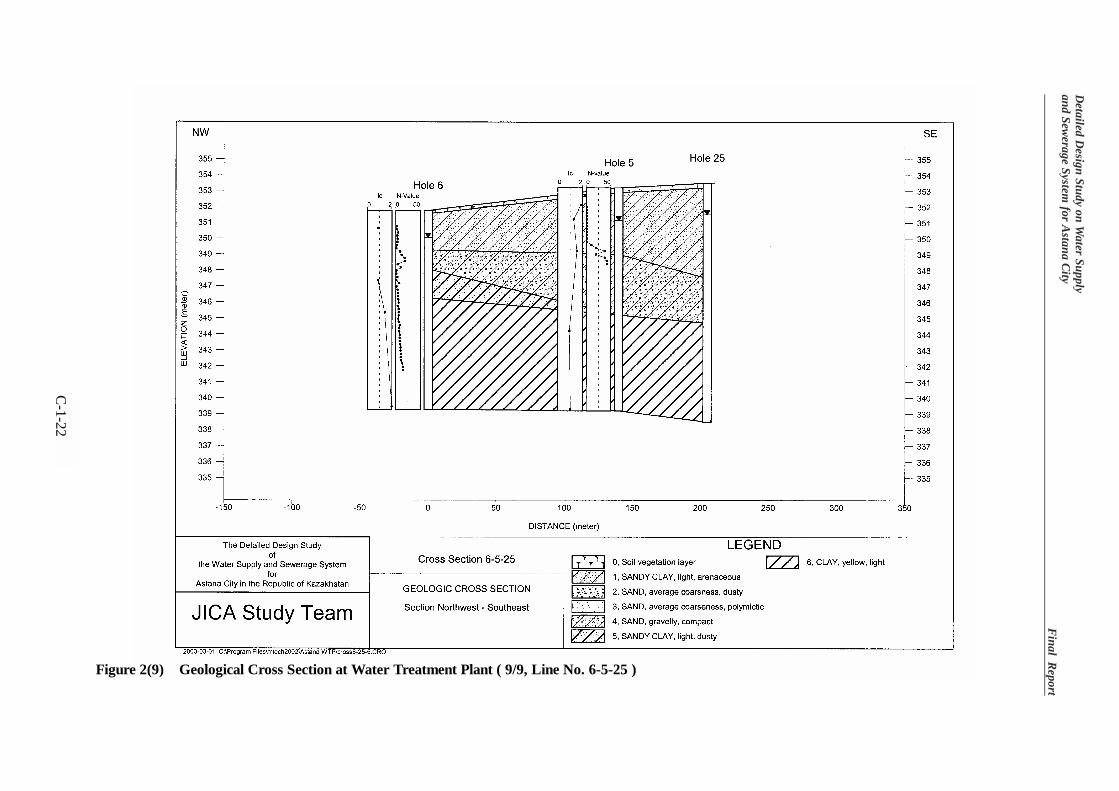
Based on the results of investigations, geological unit in this area was classified into seven
layers from the geo-technical point of view, which are (0 and 0a) soil vegetation layer and
sandy clay, (I) light arenaceous sandy clay, (II) dusty average coarseness sand, (III)
polymictic loamy average coarseness sand, (IV) compact gravelly sand, (V) light dusty sandy
clay, and (VI) clay (see Table 1). In this report, two surface layers are regarded as same
Detailed Design Study on Water Supply and Sewerage System for Astana City Final Report
C-1-3
layer.
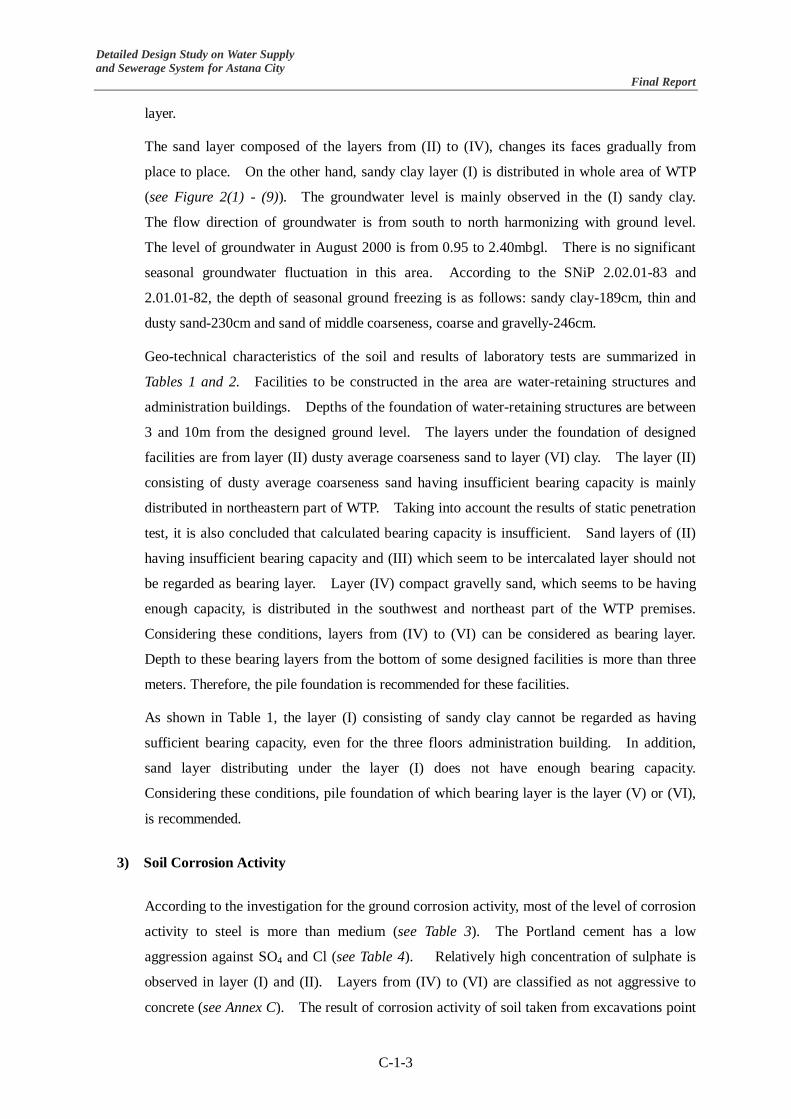
The sand layer composed of the layers from (II) to (IV), changes its faces gradually from
place to place. On the other hand, sandy clay layer (I) is distributed in whole area of WTP
(see Figure 2(1) - (9)). The groundwater level is mainly observed in the (I) sandy clay.
The flow direction of groundwater is from south to north harmonizing with ground level.
The level of groundwater in August 2000 is from 0.95 to 2.40mbgl. There is no significant
seasonal groundwater fluctuation in this area. According to the SNiP 2.02.01-83 and
2.01.01-82, the depth of seasonal ground freezing is as follows: sandy clay-189cm, thin and
dusty sand-230cm and sand of middle coarseness, coarse and gravelly-246cm.
Geo-technical characteristics of the soil and results of laboratory tests are summarized in
Tables 1 and 2. Facilities to be constructed in the area are water-retaining structures and
administration buildings. Depths of the foundation of water-retaining structures are between
3 and 10m from the designed ground level. The layers under the foundation of designed
facilities are from layer (II) dusty average coarseness sand to layer (VI) clay. The layer (II)
consisting of dusty average coarseness sand having insufficient bearing capacity is mainly
distributed in northeastern part of WTP. Taking into account the results of static penetration
test, it is also concluded that calculated bearing capacity is insufficient. Sand layers of (II)
having insufficient bearing capacity and (III) which seem to be intercalated layer should not
be regarded as bearing layer. Layer (IV) compact gravelly sand, which seems to be having
enough capacity, is distributed in the southwest and northeast part of the WTP premises.
Considering these conditions, layers from (IV) to (VI) can be considered as bearing layer.
Depth to these bearing layers from the bottom of some designed facilities is more than three
meters. Therefore, the pile foundation is recommended for these facilities.
As shown in Table 1, the layer (I) consisting of sandy clay cannot be regarded as having
sufficient bearing capacity, even for the three floors administration building. In addition,
sand layer distributing under the layer (I) does not have enough bearing capacity.
Considering these conditions, pile foundation of which bearing layer is the layer (V) or (VI),
is recommended.
3) Soil Corrosion Activity
According to the investigation for the ground corrosion activity, most of the level of corrosion
activity to steel is more than medium (see Table 3). The Portland cement has a low
aggression against SO4 and Cl (see Table 4). Relatively high concentration of sulphate is
observed in layer (I) and (II). Layers from (IV) to (VI) are classified as not aggressive to
concrete (see Annex C). The result of corrosion activity of soil taken from excavations point

Detailed Design Study on Water Supply and Sewerage System for Astana City Final Report
C-1-4
shows low to medium corrosive to portland cement (see Table 5 and Figure 1 for location).
Considering these conditions, it is recommended to take the relevant countermeasures against
soil aggressive property to steel and portland cement.
(2) Sewerage Treatment Plant (STP)
1) General
The STP is located in the southwestern part of Astana city. The treated water is discharged
into the Taldykol Lake located southward of the STP. The land of STP is almost flat and its
elevation is around 343mASL. During the feasibility study, geo-technical investigations
were carried out at seven points. Within the framework of this study, five points were
selected on the basis of the plan of the facilities to be constructed in order to obtain more
detailed information of the soil conditions of the area. Locations of these boring points and
profiles are shown in Figure 3 and Figure 4 (1)-(9), respectively.
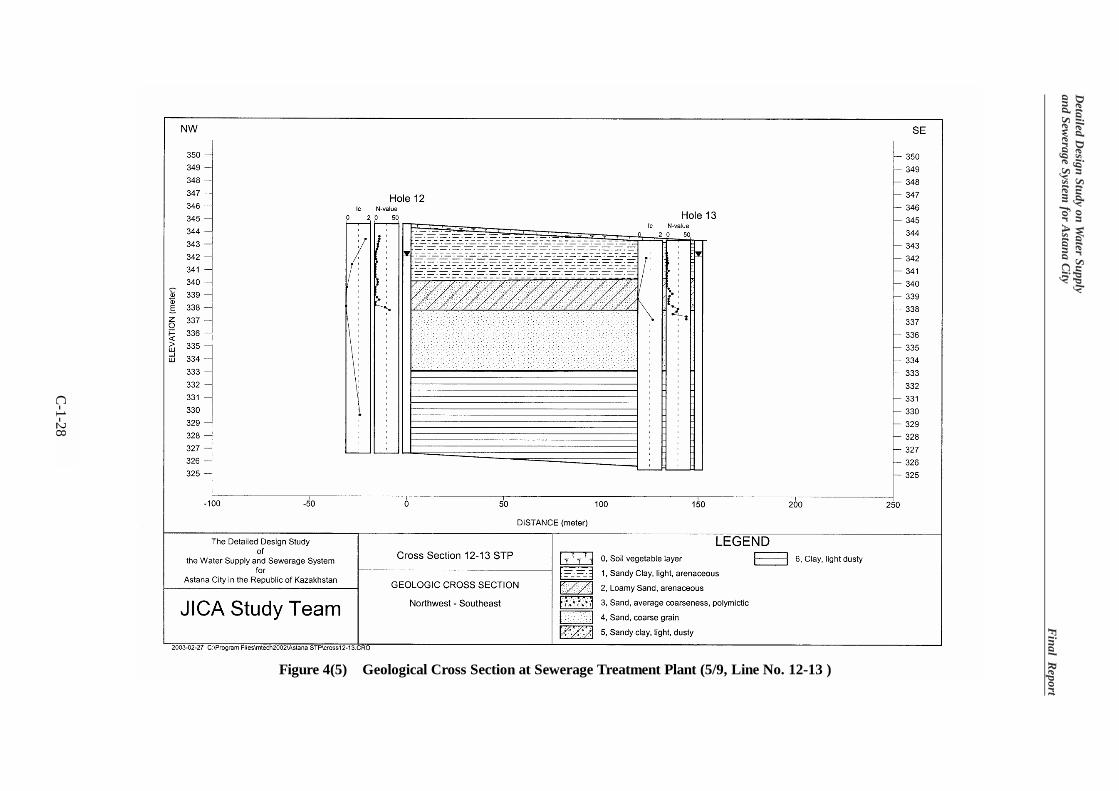
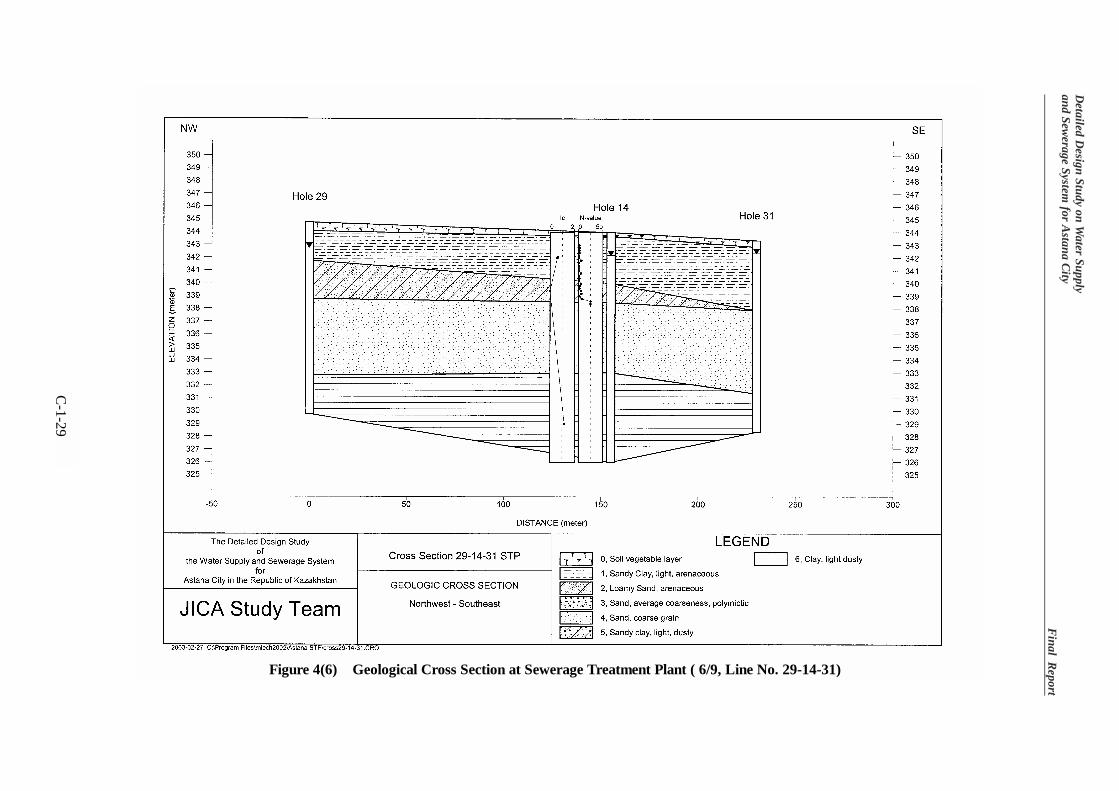
2) Geo-Technical Conditions
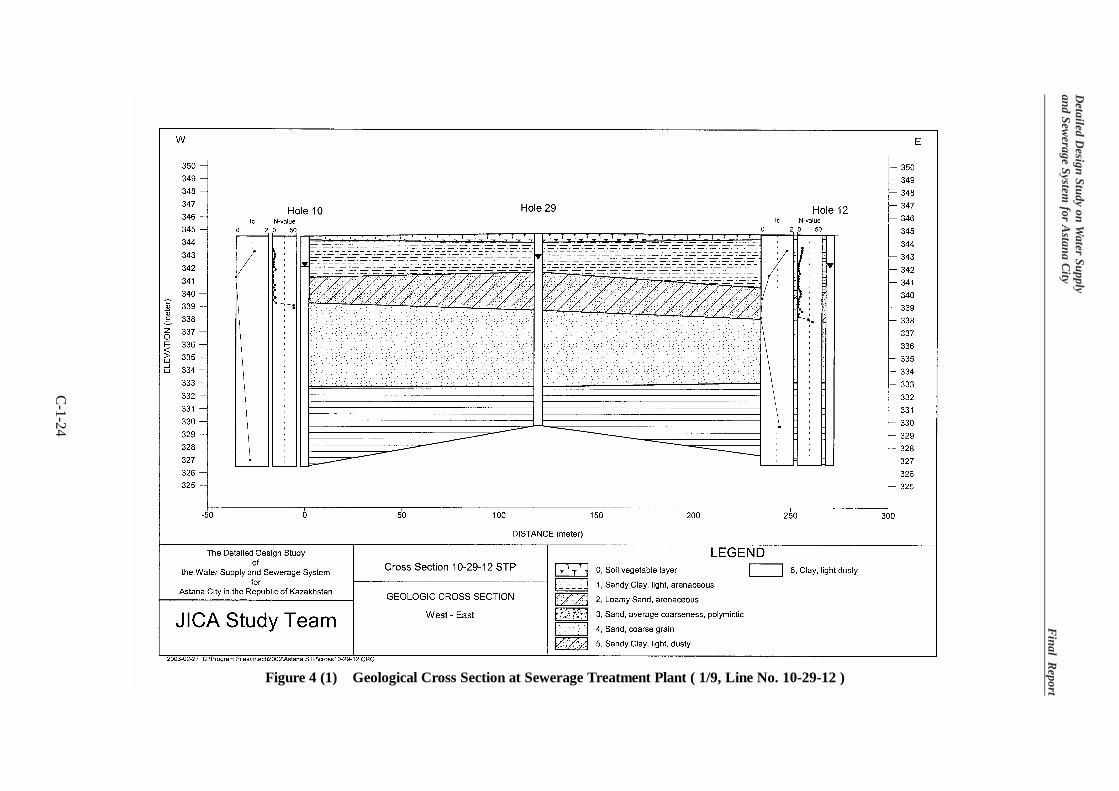
Based on the results of investigations, geological unit in this area was classified into seven
layers in terms of the geo-technical point, which are (0 and 0a) soil vegetation layer and sandy
clay, (I) light arenaceous sandy clay, (II) loamy arenaceous sand, (III) polymictic average
coarseness sand, (IV) polymictic coarse-grained sand, (V) light dusty gravelly sandy clay and
(VI) light dusty clay (see Table 1). In this report, two surface layers are regarded as one
layer.
The layer (I) consisting of arenaceous sandy clay is distributed in whole area. It is observed
that the lower part of the layer (I) arenaceous sandy clay is gradually changed to the layer (II)
loamy arenaceous sand from south to northe. Sand layers under the layer (II) loamy sand
mainly composed of polimictic coarse-grained sand, are distributed throughout premises of
STP. In the western part of premises (boring points are No.11, 15 and 16), the facies of
upper part of sand layer is gradually changed from the layer (IV) polimictic coarse-grained
sand to the layer (III) average coarseness sand. The intercalation of the layer (V) sandy clay
including organic remains (flora) is also observed between two sand layers (III and IV).
These indicate that the grain size of sand layer changes to finer in the western part of the
premises.
The elevation of groundwater in each boring point is almost same. Considering the location
of the Taldykol Lake, the groundwater within the premises of STP flows in the direction from
north to south in general, with very gentle inclination. The groundwater table is observed as
Detailed Design Study on Water Supply and Sewerage System for Astana City Final Report
C-1-5
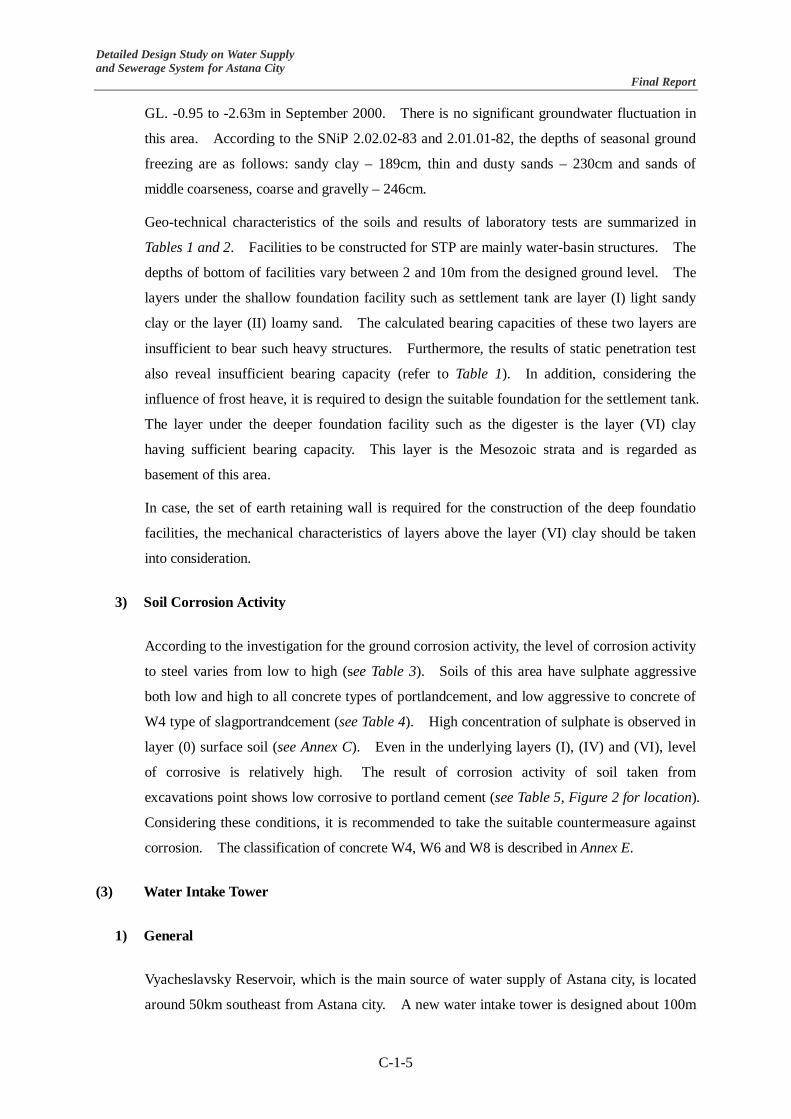
GL. -0.95 to -2.63m in September 2000. There is no significant groundwater fluctuation in
this area. According to the SNiP 2.02.02-83 and 2.01.01-82, the depths of seasonal ground
freezing are as follows: sandy clay – 189cm, thin and dusty sands – 230cm and sands of
middle coarseness, coarse and gravelly – 246cm.
Geo-technical characteristics of the soils and results of laboratory tests are summarized in
Tables 1 and 2. Facilities to be constructed for STP are mainly water-basin structures. The
depths of bottom of facilities vary between 2 and 10m from the designed ground level. The
layers under the shallow foundation facility such as settlement tank are layer (I) light sandy
clay or the layer (II) loamy sand. The calculated bearing capacities of these two layers are
insufficient to bear such heavy structures. Furthermore, the results of static penetration test
also reveal insufficient bearing capacity (refer to Table 1). In addition, considering the
influence of frost heave, it is required to design the suitable foundation for the settlement tank.
The layer under the deeper foundation facility such as the digester is the layer (VI) clay
having sufficient bearing capacity. This layer is the Mesozoic strata and is regarded as
basement of this area.
In case, the set of earth retaining wall is required for the construction of the deep foundatio
facilities, the mechanical characteristics of layers above the layer (VI) clay should be taken
into consideration.
3) Soil Corrosion Activity
According to the investigation for the ground corrosion activity, the level of corrosion activity
to steel varies from low to high (see Table 3). Soils of this area have sulphate aggressive
both low and high to all concrete types of portlandcement, and low aggressive to concrete of
W4 type of slagportrandcement (see Table 4). High concentration of sulphate is observed in
layer (0) surface soil (see Annex C). Even in the underlying layers (I), (IV) and (VI), level
of corrosive is relatively high. The result of corrosion activity of soil taken from
excavations point shows low corrosive to portland cement (see Table 5, Figure 2 for location).
Considering these conditions, it is recommended to take the suitable countermeasure against
corrosion. The classification of concrete W4, W6 and W8 is described in Annex E.
(3) Water Intake Tower
1) General
Vyacheslavsky Reservoir, which is the main source of water supply of Astana city, is located
around 50km southeast from Astana city. A new water intake tower is designed about 100m

Detailed Design Study on Water Supply and Sewerage System for Astana City Final Report
C-1-6
northeastward of the existing water intake. During the feasibility study, geo-technical
investigations were carried out at three points. According to the results, the bearing capacity
of the planned strata seems to be sufficient for supporting of the facility. In order to ensure
the sufficiency and sequence including an inclination of bearing layer, additional two points
were selected. Locations of boring points and profiles are shown in Figure 5 and Figure 6
(1) - (3), respectively.
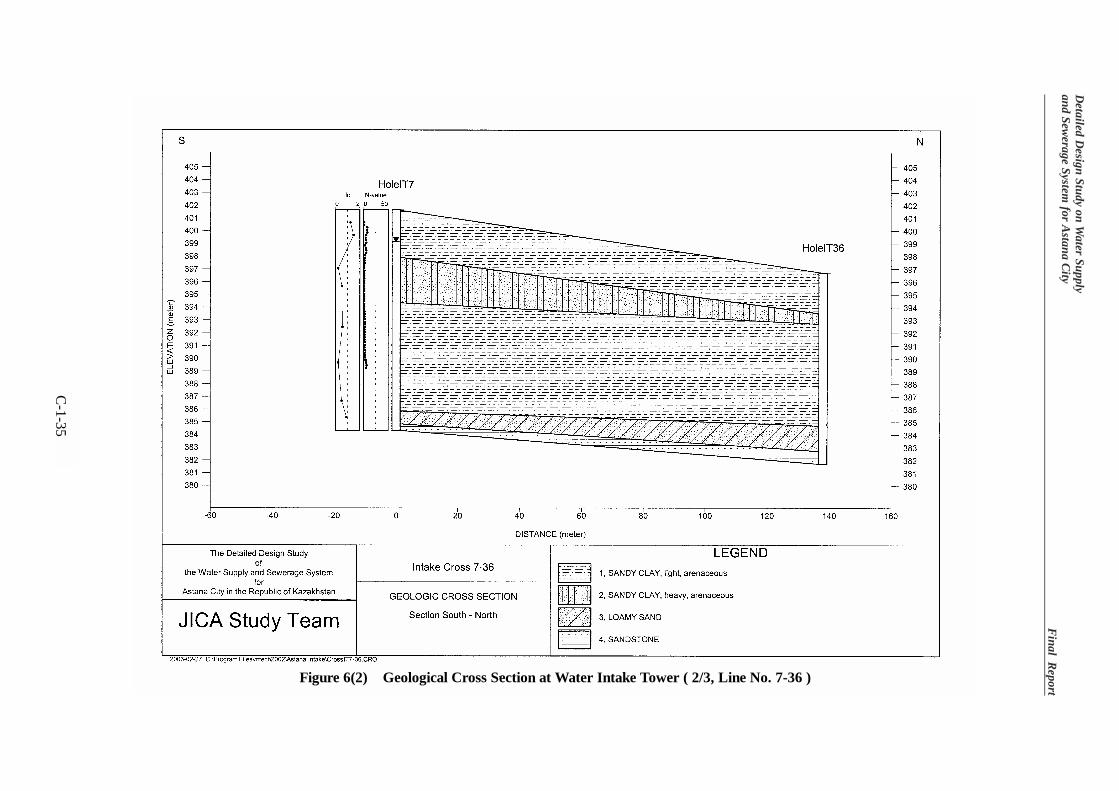
2) Geo-Technical Conditions
Based on the results of investigations, the geological units of this area were classified into
four layers, which are (I) light arenaceous sandy clay, (II) heavy arenaceous sandy clay with
interlayer of fine sand, (III) loamy sand with weathering sandstone, (IV) weathered
medium-grained sandstone.
From the geological point of view, the layer (II) sandy clay is considered as a part of layer (I)
light arenaceous sandy clay (see Figure 6 (1) - (3)). The layer (III) loamy sand with
weathering sandstone is regarded as a weathering part of layer (IV) sandstone. Elevations of
groundwater at three boring points were almost the same as that of the reservoir water.
According to the SNiP, the depth of seasonal ground freezing of sandy clay is 189cm.
Geo-technical characteristics of the soils and the results of laboratory tests are summarized in
Tables 1 and 2. Thickness of the layer (I) light arenaceous sandy clay with intercalation of
layer (II) is from 10 to 13m. Elevation of the bottom of layer (I) is around 386mASL. The
thin layer (III) consisting of loamy sand with weathering sandstone is distributed between
layer (I) and layer (IV). The layer (IV) consisting of Ordovician sandstone, which is
considered as a basement rock in this area, has a sufficient bearing capacity. The elevation
of top of the layer (IV) is around 385mASL plunging slightly into northeast.
Since the elevation of foundation of the facility is designed to reach to the layer (IV) with few
meters of penetration depth, the earth pressure of layer (I) and (II) should be taken into
consideration of facility designing.
3) Soil Corrosion Activity
According to the investigation for soil corrosion activity, the level of activity to steel varies
from low to high (see Table 3). Soil moisture is not aggressive to all types of concretes (see
Table 4). Concentration of sulphate of layer (I) and (II) is relatively low (see Annex C).
Considering these conditions, suitable corrosion proofing against sulphate is recommended.
(4) River Crossing Point
Detailed Design Study on Water Supply and Sewerage System for Astana City Final Report
C-1-7
1) General
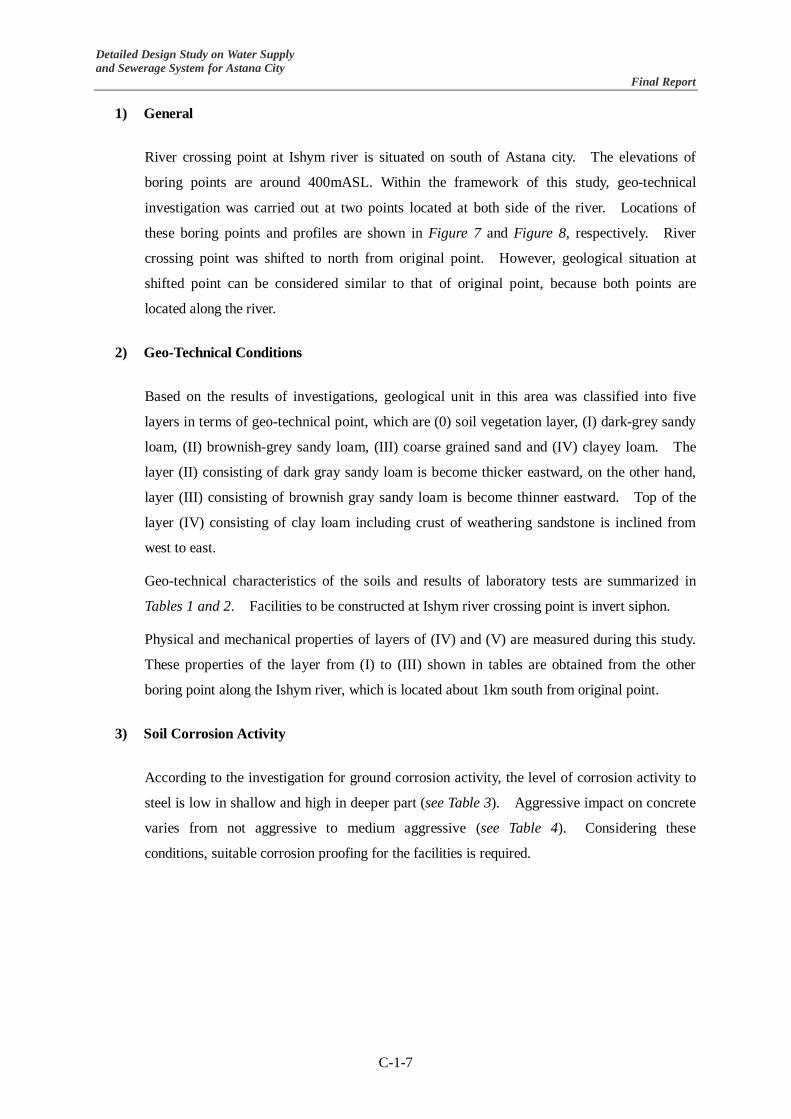
River crossing point at Ishym river is situated on south of Astana city. The elevations of
boring points are around 400mASL. Within the framework of this study, geo-technical
investigation was carried out at two points located at both side of the river. Locations of
these boring points and profiles are shown in Figure 7 and Figure 8, respectively. River
crossing point was shifted to north from original point. However, geological situation at
shifted point can be considered similar to that of original point, because both points are
located along the river.
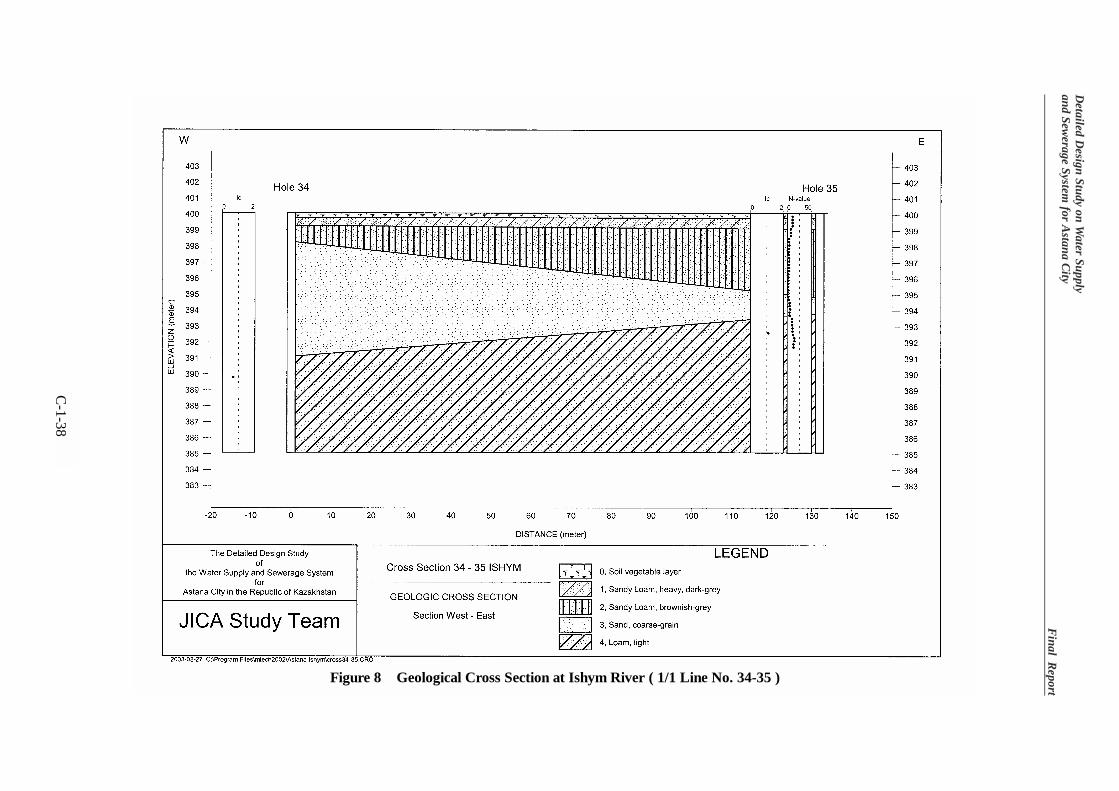
2) Geo-Technical Conditions
Based on the results of investigations, geological unit in this area was classified into five
layers in terms of geo-technical point, which are (0) soil vegetation layer, (I) dark-grey sandy
loam, (II) brownish-grey sandy loam, (III) coarse grained sand and (IV) clayey loam. The
layer (II) consisting of dark gray sandy loam is become thicker eastward, on the other hand,
layer (III) consisting of brownish gray sandy loam is become thinner eastward. Top of the
layer (IV) consisting of clay loam including crust of weathering sandstone is inclined from
west to east.
Geo-technical characteristics of the soils and results of laboratory tests are summarized in
Tables 1 and 2. Facilities to be constructed at Ishym river crossing point is invert siphon.
Physical and mechanical properties of layers of (IV) and (V) are measured during this study.
These properties of the layer from (I) to (III) shown in tables are obtained from the other
boring point along the Ishym river, which is located about 1km south from original point.
3) Soil Corrosion Activity
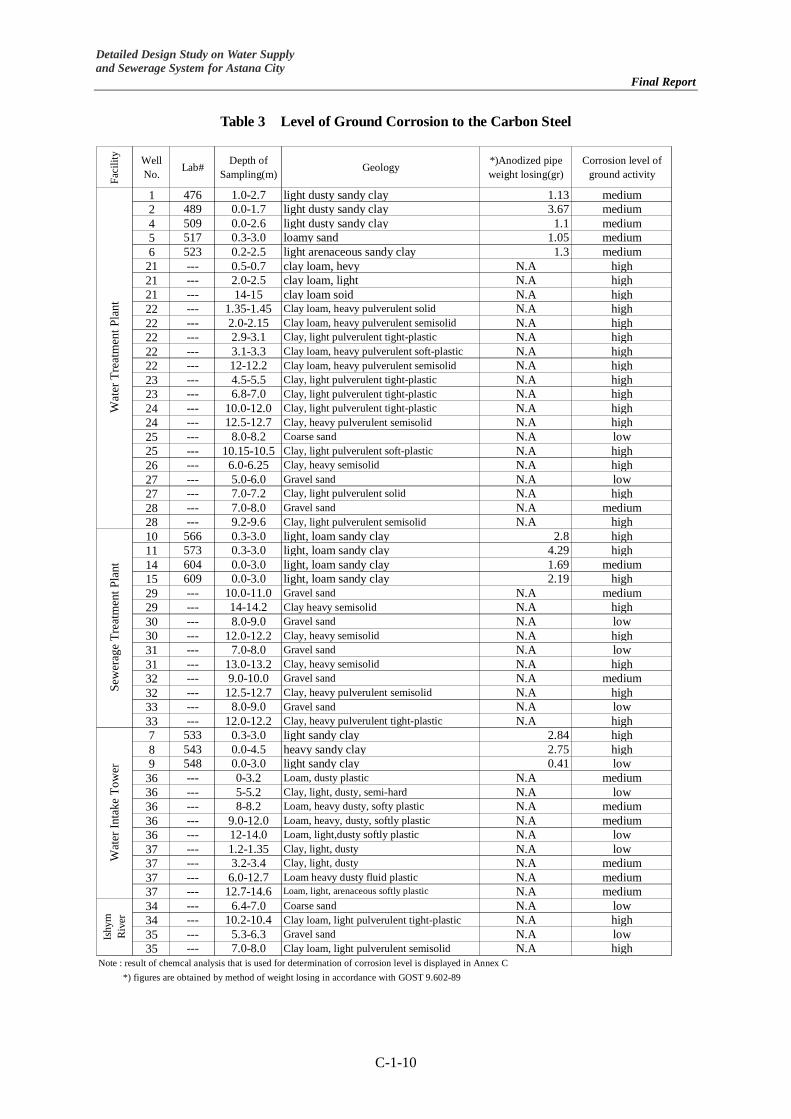
According to the investigation for ground corrosion activity, the level of corrosion activity to
steel is low in shallow and high in deeper part (see Table 3). Aggressive impact on concrete
varies from not aggressive to medium aggressive (see Table 4). Considering these
conditions, suitable corrosion proofing for the facilities is required.

C-1-8
Detailed D
esign Study on Water Supply
and Sewerage System for Astana City
Final Report
Table 1 Mechanical Properties and Calculated Bearing Capacity
Depth of layerbase
occurrenceLayer thickness
Coefficientof lateralPressure
Coefficient ofPermeability
k
Static penetrateresistance
Allowablebearingcapacity
Calcula tedresistance R0
m m 1)kgf/cm2 2)kgf/cm2 1)degree 2)degree 1)kgf/cm2 2)kgf/cm2 m/day kgf/cm2 ton/m2 1)ton/m2
0 Soil vegetation layer QIV 0.2 - 0.3 0.2 - 0.3 --- --- --- --- --- --- --- --- --- --- ---0a Sandy Clay, solid QIV 0.3 - 1.0 0.3 - 1.0 --- --- --- --- --- --- --- --- --- --- ---1 Sandy Clay, light, arenaceous QII-III 1.7 - 3.4 1.4 - 3.2 0.25 0.43 19 22 142 56 0.19 1)0.18 17 / 87 4 / 22 13 /65 252 Sand, average coarseness, dusty, polymictic QI-II 2.8 - 6.5 1.1 - 2.0 0.04 --- 30 --- 187 --- --- 0.71 13 3 10 103 Sand, average coarseness, polymictic QI-II 4.9 - 8.0 2.3 - 3.3 0.02 --- 38 --- 253 --- --- 0.70 45 11 34 404 Sand, gravelly, compact QI-II 3.7 - 8.0 0.7 - 3.8 0.01 --- 40 --- 309 --- --- 2.56 60 15 45 505 Sandy Clay, light, dusty QI-II 5.5 - 11.5 1.8 - 5.9 0.25 0.71 19 19 160 63 0.16 1)0.18 33 9 25 256 Clay, dusty, yellow Mz --- --- 0.33 0.58 19 24 336 65 0.14 --- 30 / (79) 8 / (20) 22 / (60) 70.5/106.5
0 Soil vegetation layer QIV 0.3 0.3 --- --- --- --- --- --- --- --- --- --- --- ---0a Sandy Clay, solid, low humid QIV 0.5 0.5 --- --- --- --- --- --- --- --- --- --- --- ---1 Sandy Clay, light, arenaceous QIII-IV 2.0 - 6.8 1.5 - 6.5 0.3 --- 22 --- 214 --- --- 1)0.18 12 3 9 24.52 Loamy Sand,, arenaceous QI-II 3.5 - 6.0 1.5 - 3.0 0.15 --- 26 --- 240 --- --- 1)0.18 14 / (91) 3 / (23) 11 / (68) 203 Sand, average coarseness, polymictic QI-II 5.5 - 8.8 1.5 - 2.8 0.02 --- 38 --- 400 --- --- 1.95 110 28 82 404 Sand, coarse-grained QI-II 10.2 - 11.8 1.7 - 6.6 0.01 --- 40 --- 400 --- --- 27.1 104 26 77 505 Sandy Clay, light, dusty QI-II 9.3 0.5 0.42 --- 25 --- 305 --- --- 1)0.18 --- --- --- 29.56 Clay, light, dusty Mz --- --- 0.39 0.69 21 18 170 53 0.14 --- (28) (9) (21) 37
1 Sandy Clay, light, arenaceous QII-III 13.5 - 15.8 10.6 - 13.5 0.25 0.78 21 18 150 46 0.17 1)0.18 17 / 14 4 13 / 11 212 Sandy Clay, heavy, arenaceous QII-III 7.3 - 7.5 3.6 - 4.3 0.22 0.61 18 9 120 25 0.16 1)0.18 3 1 2 193 Loamy Sand Mz 14.3 - 16.8 0.3 - 1.0 0.48 0.71 24 28 210 37 0.19 --- --- --- --- 304 Sandstone, medium-grained O1 ? --- --- --- --- --- --- --- --- --- --- --- --- --- 100
0 Soil vegetation layer QIV 0.1 - 0.2 0.1 - 0.2 --- --- --- --- --- --- --- --- --- --- --- ---1 Sandy Loam , heavy, dark-grey QIII 0.8 - 1.0 0.7 - 0.8 (0.25) --- (23) --- (170) --- --- --- 40 10 30 (23)2 Sandy Loam , brownish-grey QII-III 1.8 - 5.3 1.0 - 4.3 (0.13) --- (24) --- (100) --- --- --- 14 4 11 (24)3 Sand, coarse-grained QI-II 6.3 - 9.0 1.0 - 7.2 (0.01) --- (40) --- (400) --- --- 41.1 18 5 14 (50)4 Loam, light, dusty Mz --- --- --- 0.76 --- 23 --- 82 0.13 --- 46 11 34 ---
Note: " 1) " means figure obtained during the Feasibility Study in accordance with SNiP 2.02.02-83 " 2) " means the figure obtained by tri-axial test in this study"( figure )" m eans the figure obtained from only one sample
ISH
YM
RIV
ERC
RO
SSIN
G P
OIN
T
GeologicalTime
Cohesion Angle of internalfriction Converted N-
value
WA
TER
INTA
KE
WA
TER
TR
EATM
ENT
PLA
NT
SEW
ERA
GE
TR
EATM
ENT
PLA
NT
Geological DescriptionLayerFacilityDeformation module

C-1-9
Detailed D
esign Study on Water Supply
and Sewerage System for Astana City
Final Report
Table2 Physical Properties
LiquidLimit
PlasticLimit
PlasticityIndex
NaturalWater
Content
LiquidityIndex
ConsistencyIndex
Specificgravity of soil
particleWet Density Dry Density Void
RatioDegree ofSaturation
ρ ρd
m m g/cm3 g/cm3
0 Soil vegetation layer QIV 0.2 - 0.3 0.2 - 0.3 --- --- --- --- --- --- --- --- --- --- ---
0a Sandy Clay, solid QIV 0.3 - 1.0 0.3 - 1.0 --- --- --- --- --- --- --- --- --- --- ---
1 Sandy Clay, light, arenaceous QII-III 1.7 - 3.4 1.4 - 3.2 25.1 14.5 10.6 15.4 -0.09 0.93 2.72 2.06 1.78 0.52 0.81
2 Sand, average coarseness, dusty, polymictic QI-II 2.8 - 6.5 1.1 - 2.0 27.3 13.6 13.8 20.8 0.53 0.47 2.71 2.23 1.85 0.47 1.20
3 Sand, average coarseness, polymictic QI-II 4.9 - 8.0 2.3 - 3.3 --- --- --- 17.4 --- --- 2.70 2.23 1.90 0.42 1.10
4 Sand, gravelly, compact QI-II 3.7 - 8.0 0.7 - 3.8 --- --- --- --- (0.28) (0.72) 2.73 (2.16) (1.83) (0.47) (1.01)
5 Sandy Clay, light, dusty QI-II 5.5 - 11.5 1.8 - 5.9 32.6 19.1 13.4 20.8 0.08 0.92 2.72 2.08 1.73 0.58 0.95
6 Clay, dusty, yellow Mz --- --- 41.8 26.0 15.8 23.5 -0.33 1.33 2.73 1.97 1.61 0.71 0.90
0 Soil vegetation layer QIV 0.3 0.3 --- --- --- --- --- --- --- --- --- --- ---
0a Sandy Clay, solid, low humid QIV 0.5 0.5 --- --- --- --- --- --- --- --- --- --- ---
1 Sandy Clay, light, arenaceous QIII-IV 2.0 - 6.8 1.5 - 6.5 25.1 15.9 9.2 19.4 0.33 0.67 2.72 2.01 1.68 0.62 0.86
2 Loamy Sand,, arenaceous QI-II 3.5 - 6.0 1.5 - 3.0 20.6 15.4 5.2 21.3 1.12 -0.13 2.70 2.12 1.75 0.55 1.07
3 Sand, average coarseness, polymictic QI-II 5.5 - 8.8 1.5 - 2.8 --- --- --- --- --- --- --- --- --- --- ---
4 Sand, coarse-grained QI-II 10.2 - 11.8 1.7 - 6.6 --- --- --- --- --- --- 2.69 --- --- --- ---
5 Sandy Clay, light, dusty QI-II 9.3 0.5 28.0 16.0 12.0 16.7 0.06 0.94 2.72 2.12 1.82 0.50 0.91
6 Clay, light, dusty Mz --- --- 46.3 22.7 23.6 24.5 0.03 0.97 2.72 2.01 1.63 0.70 0.95
1 Sandy Clay, light, arenaceous QII-III 13.5 - 15.8 10.6 - 13.5 32.8 18.4 14.4 22.7 0.3 0.7 2.71 1.99 1.62 0.68 0.92
2 Sandy Clay, heavy, arenaceous QII-III 7.3 - 7.5 3.6 - 4.3 33.9 19.4 14.6 25.6 0.44 0.56 2.72 2.04 1.62 0.68 1.02
3 Loamy Sand Mz 14.3 - 16.8 0.3 - 1.0 20.2 13.1 7.1 16.4 0.5 0.5 2.69 2.12 1.82 0.48 0.91
4 Sandstone, medium-grained O1 ? --- --- --- --- --- --- --- --- --- --- --- --- ---
1 Soil vegetation layer QIV 0.1 - 0.2 0.1 - 0.2 --- --- --- --- --- --- --- --- --- --- ---
2 Sandy Loam, heavy, dark-grey QIII 0.8 - 1.0 0.7 - 0.8 *32 *19 *13 *20 *0.08 *0.92 *2.73 *1.88 *1.57 *0.74 *0.74
3 Sandy Loam, brownish-grey QII-III 1.8 - 5.3 1.0 - 4.3 *25 *18 *7 *19.6 *0.23 *0.77 *2.70 *1.86 *1.55 *0.74 *0.72
4 Sand, coarse-grained QI-II 6.3 - 9.0 1.0 - 7.2 --- --- --- 10.4 --- --- 2.71 --- --- --- ---
5 Loam, light, dusty Mz --- --- 30.9 17.0 14.0 18.8 0.19 0.89 2.71 2.07 1.75 0.57 0.9Note: "( figure )" means the data of a part of the formation, not particular figure of the formation.
" --- " means "not measured"." * " means that the data are from other boring points near the Ishym river which are located 1 km south from crossing point
W
WA
TER
INTA
KE
WA
TER
TR
EATM
ENT
PLA
NT
SEW
ERA
GE
TR
EATM
ENT
PLA
NT
Layer thicknessDepth of layerbase occurrenceGeological DescriptionLayerFacility
ISH
YM
RIV
ERC
RO
SSIN
G P
OIN
T
GeologicalTime
SrIL Ic Gs(ρs) eWL WP IP
Detailed Design Study on Water Supply and Sewerage System for Astana City Final Report
C-1-10
Table 3 Level of Ground Corrosion to the Carbon Steel Fa
cilit
y WellNo. Lab# Depth of
Sampling(m) Geology *)Anodized pipeweight losing(gr)
Corrosion level ofground activity
1 476 1.0-2.7 light dusty sandy clay 1.13 medium2 489 0.0-1.7 light dusty sandy clay 3.67 medium4 509 0.0-2.6 light dusty sandy clay 1.1 medium5 517 0.3-3.0 loamy sand 1.05 medium6 523 0.2-2.5 light arenaceous sandy clay 1.3 medium
21 --- 0.5-0.7 clay loam, hevy N.A high21 --- 2.0-2.5 clay loam, light N.A high21 --- 14-15 clay loam soid N.A high22 --- 1.35-1.45 Clay loam, heavy pulverulent solid N.A high22 --- 2.0-2.15 Clay loam, heavy pulverulent semisolid N.A high22 --- 2.9-3.1 Clay, light pulverulent tight-plastic N.A high22 --- 3.1-3.3 Clay loam, heavy pulverulent soft-plastic N.A high22 --- 12-12.2 Clay loam, heavy pulverulent semisolid N.A high23 --- 4.5-5.5 Clay, light pulverulent tight-plastic N.A high23 --- 6.8-7.0 Clay, light pulverulent tight-plastic N.A high24 --- 10.0-12.0 Clay, light pulverulent tight-plastic N.A high24 --- 12.5-12.7 Clay, heavy pulverulent semisolid N.A high25 --- 8.0-8.2 Coarse sand N.A low25 --- 10.15-10.5 Clay, light pulverulent soft-plastic N.A high26 --- 6.0-6.25 Clay, heavy semisolid N.A high27 --- 5.0-6.0 Gravel sand N.A low27 --- 7.0-7.2 Clay, light pulverulent solid N.A high28 --- 7.0-8.0 Gravel sand N.A medium28 --- 9.2-9.6 Clay, light pulverulent semisolid N.A high10 566 0.3-3.0 light, loam sandy clay 2.8 high11 573 0.3-3.0 light, loam sandy clay 4.29 high14 604 0.0-3.0 light, loam sandy clay 1.69 medium15 609 0.0-3.0 light, loam sandy clay 2.19 high29 --- 10.0-11.0 Gravel sand N.A medium29 --- 14-14.2 Clay heavy semisolid N.A high30 --- 8.0-9.0 Gravel sand N.A low30 --- 12.0-12.2 Clay, heavy semisolid N.A high31 --- 7.0-8.0 Gravel sand N.A low31 --- 13.0-13.2 Clay, heavy semisolid N.A high32 --- 9.0-10.0 Gravel sand N.A medium32 --- 12.5-12.7 Clay, heavy pulverulent semisolid N.A high33 --- 8.0-9.0 Gravel sand N.A low33 --- 12.0-12.2 Clay, heavy pulverulent tight-plastic N.A high7 533 0.3-3.0 light sandy clay 2.84 high8 543 0.0-4.5 heavy sandy clay 2.75 high9 548 0.0-3.0 light sandy clay 0.41 low
36 --- 0-3.2 Loam, dusty plastic N.A medium36 --- 5-5.2 Clay, light, dusty, semi-hard N.A low36 --- 8-8.2 Loam, heavy dusty, softy plastic N.A medium36 --- 9.0-12.0 Loam, heavy, dusty, softly plastic N.A medium36 --- 12-14.0 Loam, light,dusty softly plastic N.A low37 --- 1.2-1.35 Clay, light, dusty N.A low37 --- 3.2-3.4 Clay, light, dusty N.A medium37 --- 6.0-12.7 Loam heavy dusty fluid plastic N.A medium37 --- 12.7-14.6 Loam, light, arenaceous softly plastic N.A medium34 --- 6.4-7.0 Coarse sand N.A low34 --- 10.2-10.4 Clay loam, light pulverulent tight-plastic N.A high35 --- 5.3-6.3 Gravel sand N.A low35 --- 7.0-8.0 Clay loam, light pulverulent semisolid N.A high
Note : result of chemcal analysis that is used for determination of corrosion level is displayed in Annex C *) figures are obtained by method of weight losing in accordance with GOST 9.602-89
Wat
er T
reat
men
t Pla
ntSe
wer
age
Trea
tmen
t Pla
ntW
ater
Inta
ke T
ower
Ishy
mR
iver

Detailed Design Study on Water Supply and Sewerage System for Astana City Final Report
C-1-11
Table 4 Level of Aggressive Impact on Concrete and Ferroconcrete thinwalled Construction
W 4 W 6 W 8
Portlandcement Low Low nonSlagportlandcement non non non
Sulphate stable non non nonPortlandcement Low Low non
Slagportlandcement non non nonSulphate stable non non nonPortlandcement Low non non
Slagportlandcement non non nonSulphate stable non non nonPortlandcement Low non non
Slagportlandcement non non nonSulphate stable non non nonPortlandcement Low non non
Slagportlandcement non non nonSulphate stable non non non
Portlandcement Low Low LowSlagportlandcement non non non
Sulphate stable non non nonPortlandcement High High High
Slagportlandcement Low non nonSulphate stable non non nonPortlandcement High High High
Slagportlandcement Low non nonSulphate stable non non non
Portlandcement non non nonSlagportlandcement non non non
Sulphate stable non non nonPortlandcement non non non
Slagportlandcement non non nonSulphate stable non non nonPortlandcement non non non
Slagportlandcement non non nonSulphate stable non non nonPortlandcement non non non
Slagportlandcement non non nonSulphate stable non non nonPortlandcement non non non
Slagportlandcement non non nonSulphate stable non non non
Portlandcement Low non non
Slagportlandcement Low non non
Sulphate stable Low non non
Portlandcement M edium M edium Low
Slagportlandcement non non non
Sulphate stable non non non
Note: Level of aggressive is determined on the basis of the result of quality analysis of soil moisture
Ishym
Riv
erW
ater
Tre
atm
ent P
lant
Sew
erag
e Tre
atm
ent P
lant
Wat
er In
take
Tow
er
Level of aggressive impact on concrete bycement typesLab.
No.No. ofW ell
level of aggressiveimpact on a
ferroconcreteCement Type
Samplinginterval
(m)
476 1 1.0 - 2.7 non
489 2 0 - 1.7 Low
496 3 0 - 1.5 non
517 5 0.3 - 3.0 non
523 6 1.0 - 1.2 Low
573 11 0.3 - 3.0 N.A
604 14 0 - 0.3 N.A
609 15 0 - 0.3 N.A
- 36 0 - 3.2 non
- 36 9.0 - 12.0 Low
- 37 1.2 - 1.35 Low
- 37 3.2 - 3.4 Low
- 37 12.7 - 14.6 Low
- 34 6.4 - 7.0 non
- 35 5.3 - 7.3 non

Detailed Design Study on Water Supply and Sewerage System for Astana City Final Report
C-1-12
Table 5 Result of Soil Corrosion Analysis
SO42-
mg/kgof soil portland cement Portland slag
cementSuphate resistant
cement
1 25-Nov-02 2.9 0.04 non non non
2 25-Nov-02 3.0 484 Low non non
3 25-Nov-02 3.5 243 non non non
4 27-Nov-02 3.4 749 M edium non non
1 10-Oct-02 2.7 110 non non non
2 7-Oct-02 3.3 440 Low non non
3 7-Oct-02 2.8 243 non non non
1 --- --- 390 Low non non
2 --- --- 28 non non non
3 --- --- 3 non non non
Note: Lcation of sampling points are shown in Figure 1 for WTP, Figure 3 for STP and Figure 9 for pipe
along pipein City
Degree of corrosive of soil on concrete and ferroconcrete (SNiP 2.03.11-85 Corrosion Protection of Building
Components))
WaterTreatment
Plant
SewerageTreatment
Plant
SamplingDepth(m)
SamplingDateNo.Facilities
C-1-13
Detailed D
esign Study on Water Supply
and Sewerage System for Astana City
Final Report
Figure 1 Location Map of Boring Points at Water Treatment Plant (WTP)
No. 5
No. 25
No. 6
No. 22
No. 1
No. 28 No. 27 No. 26
No. 2
No. 3 No. 24
No. 4
No. 23
No. 21
No. 4 Boring Point
No. 1 Soil Sampling Point
LEGEND
No. 1
No. 3
No. 2
No. 4
C-1-14
Detailed D
esign Study on Water Supply
and Sewerage System for Astana City
Final Report
Figure 2(1) Geological Cross Section at Water Treatment Plant ( 1/9, Line No. 6-1-23-4 )

C-1-15
Detailed D
esign Study on Water Supply
and Sewerage System for Astana City
Final Report
Figure 2(2) Geological Cross Section at Water Treatment Plant ( 2/9, Line No. 6-26-27-28 )

C-1-16
Detailed D
esign Study on Water Supply
and Sewerage System for Astana City
Final Report
Figure 2(3) Geological Cross Section at Water Treatment Plant ( 3/9, Line No. 5-1-21-2 )

C-1-17
Detailed D
esign Study on Water Supply
and Sewerage System for Astana City
Final Report
Figure 2(4) Geological Cross Section at Water Treatment Plant ( 4/9, Line No. 3-4 )
C-1-18
Detailed D
esign Study on Water Supply
and Sewerage System for Astana City
Final Report
Figure 2(5) Geological Cross Section at Water Treatment Plant (5/9, Line No. 3-23-2 )

C-1-19
Detailed D
esign Study on Water Supply
and Sewerage System for Astana City
Final Report
Figure 2(6) Geological Cross Section at Water Treatment Plant ( 6/9, Line No. 28-2-4)

C-1-20
Detailed D
esign Study on Water Supply
and Sewerage System for Astana City
Final Report
Figure 2(7) Geological Cross Section at Water Treatment Plant ( 7/9, Line No. 27-21-23-24 )
C-1-21
Detailed D
esign Study on Water Supply
and Sewerage System for Astana City
Final Report
Figure 2(8) Geological Cross Section at Water Treatment Plant ( 8/9, Line No. 1-22-3 )
C-1-22
Detailed D
esign Study on Water Supply
and Sewerage System for Astana City
Final Report
Figure 2(9) Geological Cross Section at Water Treatment Plant ( 9/9, Line No. 6-5-25 )

C-1-24
Detailed D
esign Study on Water Supply
and Sewerage System for Astana City
Final Report
Figure 4 (1) Geological Cross Section at Sewerage Treatment Plant ( 1/9, Line No. 10-29-12 )

C-1-25
Detailed D
esign Study on Water Supply
and Sewerage System for Astana City
Final Report
Figure 4(2) Geological Cross Section at Sewerage Treatment Plant ( 2/9, Line No. 14-30-13 )

C-1-26
Detailed D
esign Study on Water Supply
and Sewerage System for Astana City
Final Report
Figure 4(3) Geological Cross Section at Sewerage Treatment Plant ( 3/9, Line No. 31-13 )

C-1-27
Detailed D
esign Study on Water Supply
and Sewerage System for Astana City
Final Report
Figure 4(4) Geological Cross Section at Sewerage Treatment Plant ( 4/9, Line No. 16-33 )
C-1-28
Detailed D
esign Study on Water Supply
and Sewerage System for Astana City
Final Report
Figure 4(5) Geological Cross Section at Sewerage Treatment Plant (5/9, Line No. 12-13 )
C-1-29
Detailed D
esign Study on Water Supply
and Sewerage System for Astana City
Final Report
Figure 4(6) Geological Cross Section at Sewerage Treatment Plant ( 6/9, Line No. 29-14-31)

C-1-30
Detailed D
esign Study on Water Supply
and Sewerage System for Astana City
Final Report
Figure 4(7) Geological Cross Section at Sewerage Treatment Plant ( 7/9, Line No. 10-11 )

C-1-31
Detailed D
esign Study on Water Supply
and Sewerage System for Astana City
Final Report
Figure 4(8) Geological Cross Section at Sewerage Treatment Plant ( 8/9, Line No. 15-33-10 )

C-1-32
Detailed D
esign Study on Water Supply
and Sewerage System for Astana City
Final Report
Figure 4(9) Geological Cross Section at Sewerage Treatment Plant ( 9/9, Line No. 32-31-30 )

C-1-33
Detailed D
esign Study on Water Supply
and Sewerage System for Astana City
Final Report
Figure 5 Location Map of Boring Points at Water Intake (Vyacheslavsky Reservoir)
No. 7
No. 36
No. 37
No. 8
No. 9

C-1-35
Detailed D
esign Study on Water Supply
and Sewerage System for Astana City
Final Report
Figure 6(2) Geological Cross Section at Water Intake Tower ( 2/3, Line No. 7-36 )

C-1-36
Detailed D
esign Study on Water Supply
and Sewerage System for Astana City
Final Report
Figure 6(3) Geological Cross Section at Water Intake Tower ( 3/3, Line No. 7-8-9 )

C-1-37
Detailed D
esign Study on Water Supply
and Sewerage System for Astana City
Final Report
Figure 7 Location Map of Boring Points at Ishym River
C-1-38
Detailed D
esign Study on Water Supply
and Sewerage System for Astana City
Final Report
Figure 8 Geological Cross Section at Ishym River ( 1/1 Line No. 34-35 )

C-1-39
Detailed D
esign Study on Water Supply
and Sewerage System for Astana City
Final Report
Figure 9 Location Map of Soil Sample Taken for Corrosion Test
A-1
A-3
A-2 1,000 M

Annex A(1) Result of Test for Physical Properties (WTP)
Plastisity % Solidity
Lob.
No.
Hol
e N
o.
Dep
th o
f Sam
plin
g
>70
70-4
0
40-2
0
20-1
0
10-5
5-2
2.0-
0.25
2.0-
1.0
1.0-
0.5
0.5-
0.25
0.25
-0.1
0.1-
0.00
5
0.25
-0.0
5
<0.
05
Liqu
id L
imit
Plas
tic L
imit
Plas
ticity
Inde
x
Nat
ural
Wat
er C
onte
nt
Liqu
idity
Inde
x(r
elat
ive
wat
er c
onte
nt)
Con
sist
ency
Inde
x
Spec
ific
grav
ityof
soil
parti
cle
Wet
Den
sity
Dry
Den
sity
Voi
d R
atio
Deg
ree
of S
atur
atio
n
Coe
ffic
ient
of P
erm
eabi
lity
Geology
m mm mm mm mm mm mm mm mm mm mm mm mm mm mm g/cm3 g/cm3 m/day
WL WP IP W IL Ic Gs(ρs) ρ ρd e Sr k
475 1 1.5 0 0 0 0 0 0 6.7 0 0 0 0 0 16.7 76.7 28 16 12 19 0.225 0.775 2.72 2.037 1.716 0.585 0.869 - light dusty sandy clay476 1 1.0-2.7 0 0 0 3 3 2 11 0 0 0 0 0 26 55 22 14 8 - -1.75 - 2.72 - - - - -477 1 3.0-4.5 0 0 0 4 2 5 0 9 23 14 24 3 0 16 - - - - - - 2.7 - - - - 0.6 middle coarseness sand478 1 5.0-6.0 0 0 0 0 1 2 0 3 12 27 26 2 0 27 - - - - - - 2.7 - - - - 0 dusty sand479 1 6.0-6.5 0 0 0 0 0 0 0 1 17 30 17 1 0 34 - - - - - - 2.7 - - - - 0.5 dusty sand480 1 6.0-6.5 0 0 0 0 0 0 23.3 0 0 0 0 0 20 56.7 28 17 11 24 0.586 0.409 2.72 2.355 1.907 0.426 1.497 - light sandy clay481 1 7.5 0 0 0 1.5 6.5 10 0 4 13.5 22 16.5 1.5 0 24.5 - - - 17 - - 2.7 2.229 1.899 0.422 1.112 - middle coarseness sand482 1 8.4 0 0 13.5 6 7 13 26.5 0 0 0 0 0 11.5 22.5 24 17 7 14 -0.495 1.5 2.7 2.171 1.912 0.412 0.8866 - dust gravelly sandy loam483 1 9 0 0 0 0 11 15 20 0 0 0 0 0 14 40 27 17 10 13 -0.403 1.4 2.72 2.158 1.91 0.424 0.8319 - light gravelly dusty sandy clay484 1 10.5 0 0 0 0 0 0 10 0 0 0 0 0 6.7 83.3 42 25 17 24 -0.06 1.059 2.73 1.949 1.572 0.737 0.8886 - heavy dusty sandy clay485 1 12.0-12.2 0 0 0 0 0 0 6.7 0 0 0 0 0 6.7 86.7 41 30 11 23 -0.678 1.682 2.72 1.973 1.61 0.689 0.8898 - light dusty sandy clay486 1 13.5 0 0 0 0 0 0 10 0 0 0 0 0 23.3 66.7 32 24 8 16 -1.04 2.038 2.72 2.151 1.86 0.463 0.9208 - light dusty sandy clay
487 2 1 0 0 0 0 0 0 6.7 0 0 0 0 0 23.3 70 26 15 11 16 0.045 0.955 2.72 2.105 1.822 0.493 0.8555 - light dusty sandy clay488 2 1.7-2.5 0 0 0 0 0 5 0 1 11 30 33 2 0 18 - - - - - - - - - - - 1.22 dusty sand489 2 0.0-1.7 0 0 0 0 0 0 16.7 0 0 0 0 0 16.7 66.7 34 24 10 - - - - - - - - - light dusty sandy clay490 2 2.8-4.0 0 0 0 12 13 15 0 4 9 10 15 5 0 17 - - - - - - - - - - - - gravelly sand491 2 3.4 0 0 0 0 0 0 43.3 0 0 0 0 0 16.7 40 22 16 6 18 0.276 0.717 2.7 2.157 1.833 0.473 1.008 - sandy loam492 2 4.0-4.3 0 0 0 2 2 11 0 7 36 16 8 2 0 16 coarse sand493 2 4.5-4.7 0 0 0 4 2 3 8 0 0 0 0 0 17 66 30 17 13 21 0.334 0.669 2.73 2.086 1.719 0.588 0.9908 - heavy dusty sandy clay494 2 6 0 0 0 0 0 0 3.3 0 0 0 0 0 3.3 93.3 32 22 10 27 0.502 0.5 2.72 2.088 1.644 0.655 1.122 - light dusty sandy clay495 2 9 0 0 0 0 0 0 16.7 0 0 0 0 0 13.3 70 35 28 7 17 -1.52 2.529 2.7 1.987 1.694 0.594 0.7877 - dust sandy loam
496 3 1.5 0 0 0 0 0 0 23.3 0 0 0 0 0 33.3 43.3 22 15 7 20 0.65 0.357 2.7 2.173 1.818 0.485 1.087 - sandy loam497 3 2.2 0 0 0 0 0 0 10 0 0 0 0 0 46.7 43.3 24 15 9 19 0.464 0.533 2.72 2.083 1.748 0.556 0.9374 - light sandy clay498 3 3.0-3.2 0 0 0 0 0 0 13.3 0 0 0 0 0 43.3 43.3 21 15 6 15 -0.018 1.017 2.7 2.096 1.824 0.48 0.8376 - sandy loam499 3 3.2-4.7 0 0 0 0 0 2 0 3 19 19 30 5 0 22 - - - - - - - - - - - 0.42 dusy sand500 3 5.2 0 0 0 6 3 6 18 0 0 0 0 0 16 51 30 19 11 22 0.262 0.736 2.72 2.052 1.684 0.616 0.9667 - light dusty sandy clay with gravel501 3 6.5-7.2 0 0 0 0 0 0 16.7 0 0 0 0 0 13.3 70 35 21 14 26 0.332 0.664 2.73 2.045 1.627 0.677 1.034 - heavy dusty sandy clay501 3 6.5-7.2 0 0 0 0 0 4 0 4 35 25 9 1 0 22 - - - - - - - - - - - - middle coarseness sand502 3 8.0-8.2 0 0 0 13 4.5 6 15.5 0 0 0 0 0 11 50 24 15 9 21 0.667 0.333 2.72 2.163 1.787 0.522 1.095 - light gravelly dusty sandy clay503 3 9 0 0 0 1 7 16 27 0 0 0 0 0 11 38 21 14 7 10 -0.61 1.61 2.7 2.301 2.097 0.287 0.9139 - dust sandy loam with gravel504 3 10.5-11.0 0 0 0 0 0 0 6.7 0 0 0 0 0 3.3 90 51 33 18 33 -0.029 1.028 2.74 1.89 1.432 0.914 0.9741 - light dusty clay505 3 13.7-14.0 0 0 0 0 0 0 10 0 0 0 0 0 10 80 38 25 13 17 -0.586 1.585 2.73 2.05 1.746 0.563 0.8428 - heavy dusty sandy clay
Note : These data are obtained during the Feasibility Study" - " : not measured
Grain Size
C-1-40

Annex A(1) Result of Test for Physical Properties (WTP)
Plastisity % Solidity
Lob.
No.
Hol
e N
o.
Dep
th o
f Sam
plin
g
>70
70-4
0
40-2
0
20-1
0
10-5
5-2
2.0-
0.25
2.0-
1.0
1.0-
0.5
0.5-
0.25
0.25
-0.1
0.1-
0.00
5
0.25
-0.0
5
<0.
05
Liqu
id L
imit
Plas
tic L
imit
Plas
ticity
Inde
x
Nat
ural
Wat
er C
onte
nt
Liqu
idity
Inde
x(r
elat
ive
wat
er c
onte
nt)
Con
sist
ency
Inde
x
Spec
ific
grav
ityof
soil
parti
cle
Wet
Den
sity
Dry
Den
sity
Voi
d R
atio
Deg
ree
of S
atur
atio
n
Coe
ffic
ient
of P
erm
eabi
lity
Geology
m mm mm mm mm mm mm mm mm mm mm mm mm mm mm g/cm3 g/cm3 m/day
WL WP IP W IL Ic Gs(ρs) ρ ρd e Sr k
Grain Size
Plastisity % Solidity
Lob.
No.
Hol
e N
o.
Dep
th o
f Sam
plin
g
>70
70-4
0
40-2
0
20-1
0
10-5
5-2
2.0-
0.25
2.0-
1.0
1.0-
0.5
0.5-
0.25
0.25
-0.1
0.1-
0.00
5
0.25
-0.0
5
<0.
05
Liqu
id L
imit
Plas
tic L
imit
Plas
ticity
Inde
x
Nat
ural
Wat
er C
onte
nt
Liqu
idity
Inde
x(r
elat
ive
wat
er c
onte
nt)
Con
sist
ency
Inde
x
Spec
ific
grav
ityof
soil
parti
cle
Wet
Den
sity
Dry
Den
sity
Voi
d R
atio
Deg
ree
of S
atur
atio
n
Coe
ffic
ient
of P
erm
eabi
lity
Geology
m mm mm mm mm mm mm mm mm mm mm mm mm mm mm g/cm3 g/cm3 m/day
WL WP IP W IL Ic Gs(ρs) ρ ρd e Sr k
507 4 1 0 0 0 0 0 0 10 0 0 0 0 0 16.7 73.3 27 15 12 15.7 0.054 0.942 2.72 1.964 1.698 0.602 0.7076 - light dusty sandy clay508 4 2 0 0 0 0 0 0 16.7 0 0 0 0 0 16.7 66.7 27 15 12 19.4 0.366 0.633 2.72 1.917 1.606 0.694 0.7599 -509 4 0.0-2.6510 4 2.6-4.5 0 0 0 0 0 0 0 0 1 58 22 1 0 18 - - - - - - - - - - - 0.8 middle coarseness sand511 4 4.9-5.6 0 0 0 3.5 6.5 18 0 10 20 15 5 8.5 0 13.5 - - - - - - - - - - - - gravelly sand512 4 6 0 0 0 0 0 0 16.7 0 0 0 0 0 26.7 56.7 28 18 10 17.2 -0.079 1.08 2.72 2.06 1.758 0.547 0.8553 - light sandy clay513 4 9 0 0 0 0 0 0 6.7 0 0 0 0 0 3.3 90 48 34 14 34.3 0.019 0.979 2.73 1.909 1.421 0.921 1.016 - heavy dusty sandy clay514 4 14.2-14.5 0 0 0 0 0 0 3.3 0 0 0 0 0 3.3 93.3 41 30 11 23.8 -0.564 1.564 2.72 1.913 1.545 0.76 0.8512 - light dusty sandy clay
515 5 1.0-1.2 0 0 0 0 0 0 36.7 0 0 0 0 0 26.7 36.7 20 15 5 10.6 -0.879 1.88 2.7 1.918 1.734 0.557 0.5139 - sandy loam516 5 2 0 0 0 2 3 5 26 0 0 0 0 0 31 33 19 14 5 12.5 -0.297 1.3 - - - - - - sandy loam517 5 0.3-3.0 - - - - - - - - - - - - - - - - - - - - - - - - - -518 5 4 0 0 0 11 8 18 21 0 0 0 0 0 9 33 21 15 6 11 -0.661 1.667 2.7 1.952 1.758 0.536 0.5563 - dust sandy loam with gravel519 5 4.5-8.0 0 0 0 14 7 16 0 5 14 12 7 6 0 19 - - - - - - - - - - - -520 5 9 0 0 0 0 0 0 6.7 0 0 0 0 0 6.7 86.7 43 32 11 32.6 0.058 0.945 2.72 1.892 1.426 0.907 0.9784 - light dusty sandy clay521 5 13.8-14.0 0 0 0 0 0 0 10 0 0 0 0 0 3.3 86.7 43 32 11 31.7 -0.03 1.027 2.72 1.908 1.449 0.877 0.982 - light dusty sandy clay
522 6 1.0-1.2 0 0 0 0 0 0 26.7 0 0 0 0 0 20 53.3 21 15 6 15.7 0.121 0.883 2.7 2.062 1.782 0.515 0.8239 - dust sandy loam523 6 0.2-2.5 0 0 0 0 2 3 21 0 0 0 0 0 30 44 30 16 14 - -1.14 - 2.73 - - - - - heavy sandy clay524 6 2.5-3.7 0 0 0 0 5 24 0 11 20 15 7 12 0 6 - - - - - - - - - - - 2.56 gravelly sand525 6 4.3-4.5 0 0 0 0 0 0 3.3 0 0 0 0 0 6.7 90 37 21 16 23 0.128 0.875 2.73 2.039 1.657 0.647 0.9718 - heavy dusty sandy clay526 6 6.2-6.5 0 0 0 0 0 0 26.7 0 0 0 0 0 6.7 66.7 41 30 11 25.4 -0.417 1.418 2.72 1.918 1.529 0.779 0.8875 - light dusty sandy clay527 6 12.2-12.4 0 0 0 0 0 0 23.3 0 0 0 0 0 33.3 43.3 41 30 11 16.3 -1.24 2.245 2.72 2.066 1.776 0.532 0.8358 - light sandy clay
Note : These data are obtained during the Feasibility Study" - " : not measured
Grain Size
C-1-41

Annex A(2) Result of Test for Physical Properties (WTP)
Plastisity % Solidity
Lob.
No.
Hol
e N
o.
Dep
th o
f Sam
plin
g
>70
70-4
0
40-2
0
20 -
10
10 -
5
5.0-
2.0
2.0-
1.0
1.0-
0.5
0.5-
0.25
0.25
-0.1
0.1-
0.05
0.05
-0.0
1
0.01
-0.0
05
<0.
005
Liqu
id L
imit
Plas
tic L
imit
Plas
ticity
Inde
x
Nat
ural
Wat
er C
onte
nt
Liqu
idity
Inde
x(r
elat
ive
wat
er c
onte
nt)
Con
sist
ency
Inde
x
Spec
ific
grav
ityof
soil
parti
cle
Wet
Den
sity
Dry
Den
sity
Voi
d R
atio
Deg
ree
of S
atur
atio
n
Coe
ffic
ient
of P
erm
eabi
lity
Geology
m mm mm mm mm mm mm mm mm mm mm mm mm mm mm g/cm3 g/cm3 m/day
WL WP IP W IL Ic Gs(ρs) ρ ρd e Sr k
21 0.5-0.7 0 0 0 0 0 0 0.3 3.1 16.7 15.8 6.7 21.8 8.2 27.4 29 13 17 18 0.3 0.69 2.71 2.02 1.71 0.58 0.83 - Clay loam, heavy pulverulent tight-21 2-2.5 0 0 0 0 0 0 0 1.1 11.8 24.3 25.8 7 5.5 24.5 22 10 12 16 0.5 0.5 2.68 2.13 1.83 0.47 0.93 - Clay loam, light pulverulent tight-21 14-15 0 0 0 0 0 0 0 0.2 2.3 11.7 16.1 26 15 28.7 33 19 14 10 -0.6 1.59 2.68 1.95 1.77 0.52 0.52 - Clay loam, heavy pulverulent solid
22 1.35-1.45 0 0 0 0 0 0.9 1.2 6.5 20.8 21.2 12.6 10.5 3.5 22.8 25 11 13 10 0.11 1.114 2.7 2.2 2 0.35 0.76 - Clay loam, heavy pulverulent solid22 2-2.15 0 0 0 0 0 0 0 2.4 11.1 17.2 16.1 14.8 5 33.4 25 10 15 11 0.05 0.945 2.72 2.17 1.95 0.39 0.77 - Clay loam, heavy pulverulent22 2.9-3.1 0 0 0 0 0 0 0 0.9 4.4 8 20.2 20.6 8.3 37.6 34 12 22 19 0.31 0.693 2.72 2.05 1.73 0.57 0.89 - Clay, light pulverulent tight-plastic22 3-3.3 0 0 0 0 0 0 0.4 3 11.8 21.4 19.8 17.5 5 21.1 23 10 13 17 0.52 0.484 2.72 2.11 1.8 0.51 0.9 - Clay loam, heavy pulverulent soft-22 12-12.2 0 0 0 0 0 0 0 0.4 0.8 6.4 12.7 38.4 9.4 31.9 37 20 17 21 0.05 0.952 2.76 2 1.65 0.67 0.88 - Clay loam, heavy pulverulent
23 4.5-5.5 0 0 0 0 1.3 5.9 3.4 8 12.4 2.9 5.7 17.9 9.4 33.1 31 13 18 22 0.48 0.514 2.72 - - - - - Clay, light pulverulent tight-plastic23 6.8-7.0 0 0 0 0 0 0 0 0.4 2.9 3.7 4.4 24.2 15.3 49.1 36 15 20 21 0.28 0.718 2.74 2.08 1.72 0.59 0.97 - Clay, light pulverulent tight-plastic
24 10-10.2 0 0 0 0 0 1.6 0.7 1.9 10.9 14.6 6.9 15 11.2 37.2 31 12 19 22 0.49 0.497 2.72 2.07 1.7 0.6 0.88 - Clay, light pulverulent tight-plastic24 12.5-12.7 0 0 0 0 0 1 0.5 0.7 1.4 1.9 3.5 7.5 13.4 70.1 53 17 36 22 0.12 0.879 2.72 2.15 1.77 0.54 1.08 - Clay, heavy pulverulent semisolid
25 8-8.2 0 0 0 17.2 13.7 15 7.7 14.7 22.7 5.6 0.6 0.8 0.5 1.5 - - - 5 - - 2.72 - - - - 67.5 Coarse sand25 10.15-10.5 0 0 0 0 0 0.6 0 0.4 0.8 4.1 10.9 27.5 16.3 39.4 46 25 22 37 0.59 0.405 2.72 1.85 1.35 1.02 1 - Clay, light pulverulent soft-plastic
26 6-6.25 0 0 0 0 0 0 0 0 0.4 1.2 5.8 28.9 20.5 43.2 50 23 27 26 0.13 0.868 2.78 1.97 1.56 0.79 0.93 - Clay, heavy semisolid
27 5.0-6.0 0 0 0 7.7 17.4 26.7 10.5 16.2 15.6 2 0.5 1 0.7 1.7 - - - 4 - - 2.77 - - - - 39.8 Gravel sand27 7.0-7.2 0 0 0 0 0 0 0 0.3 0.5 1.1 4.6 29.9 19.9 43.7 46 23 23 22 -0.02 1.017 2.78 2.03 1.66 0.67 0.92 - Clay, light pulverulent solid27 12 0 0 0 0 0 0 0 0 0.3 2.9 5.5 33 21.5 36.8 41 22 19 19 -0.16 1.16 2.71 2.02 1.7 0.59 0.87 - Clay loam, heavy pulverulent solid
28 7.0-8.0 0 0 0 4 12.9 22.1 11.4 20 20.2 4.4 0.6 1.4 0.6 2.4 - - - 8 - - 2.74 - - - - 32.8 Gravel sand28 9.2-9.6 0 0 0 0 0 0 0 0 0.8 5.8 10.1 27 17.6 38.7 44 20 24 23 0.13 0.869 2.77 1.95 1.58 0.75 0.97 - Clay, light pulverulent semisolid
Note: These data are obtained during this Study" - " : not measured
Grain Size
C-1-42

Annex A(3) Result of test for Physical Properties (STP)
Plastisity % Solidity
Lob.
No.
Hol
e
Dep
th o
f Sam
plin
g
>70
70-4
0
40-2
0
20-1
0
10-5
5-2
2.0-
0.25
2.0-
1.0
1.0-
0.5
0.5-
0.25
0.25
-0.1
0.1-
0.00
5
0.25
-0.0
5
<0.
05
Liqu
id L
imit
Plas
tic L
imit
Plas
ticity
Inde
x
Nat
ural
Wat
er C
onte
nt
Liqu
idity
Inde
x(r
elat
ive
wat
er c
onte
nt)
Con
sist
ency
Inde
x
Spec
ific
grav
ityof
soil
parti
cle
Wet
Den
sity
Dry
Den
sity
Voi
d R
atio
Deg
ree
of S
atur
atio
n
Coe
ffic
ient
of P
erm
eabi
lity
Geology
m mm mm mm mm mm mm mm mm mm mm mm mm mm mm g/cm3 g/cm3 m/day
WL WP IP W IL Ic Gs(ρs) ρ ρd e Sr k
565 10 1.1-1.3 0 0 0 0 0 0 20.3 0 0 0 0 0 43.3 36.3 22 14 8 13 -0.155 1.15 2.72 1.913 1.696 0.604 0.575 - light sandy clay566 10 0.3-3.0 - - - - - - - - - - - - - - - - - - - - - - - - - -567 10 3.2 0 0 0 0 0 0 15 0 0 0 0 0 47.7 37.3 23 16 7 23 0.996 0.0 2.7 2.061 1.676 0.611 1.015 - arenaceous loamy sand568 10 5.2-8.4 0 0 0 9.5 3.5 9.5 0 6 24.5 15.5 17 2.5 0 12 - - - - - - - - - - - 2.41 coarse sand569 10 8.5-11.8 0 0 0 6.5 11.5 27 0 11 17.5 8 8 1.5 0 9 - - - - - - - - - - - 3.09 gravelly sand570 10 17.5 0 0 0 0 0 0 7 0 0 0 0 0 18.3 74.7 58 27 31 30 0.098 0.903 2.74 1.878 1.444 0.897 0.917 - heavy clay
572 11 2 0 0 0 0 0 0 12 0 0 0 0 0 30 58 25 16 9 17 0.111 0.889 2.72 1.847 1.579 0.723 0.6395 - light sandy clay573 11 0.3-3.0 0 0 0 0 0 0 0 0 0 0 0 0 0 0 - - - - - - - - - - - -574 11 4.5 0 0 0 0 0 0 20 0 0 0 0 0 50.3 29.7 20 16 4 18 0.481 0.525 2.7 2.283 1.936 0.395 1.226 - arenaceous loamy sand575 11 4.0-6.0 0 0 0 0 0.5 2 0 2 22.5 36 19.5 2 0 15.5 - - - - - - - - - - - 1.75 average coarseness sand576 11 6.0-8.8 0 0 0 2 3.5 13.5 0 4.5 18.5 19.5 22.5 3 0 13 - - - - - - - - - - - 1.82 light gravelly dusty sandy clay577 11 8.8-9.3 0 0 0 0 8.5 20.3 22.1 0 0 0 0 0 9.4 39.7 28 16 12 17 0.06 0.942 2.72 2.121 1.817 0.497 0.9149 - light gravelly dusty sandy clay578 11 9.3-11.0 0 0 0 3.5 8.5 17 0 6.5 16.5 18 17.5 1.5 0 11 - - - - - - - - - - - 1.01 gravelly sand579 11 12.5 0 0 0 0 6.7 0 21 0 0 0 0 0 43 29.3 19 12 7 12 0.05 0.943 2.7 2.214 1.97 0.37 0.9003 - light sandy clay580 11 15.0-15.2 0 0 0 0 1 3.2 13.1 0 0 0 0 0 32.1 50.6 20 14 6 13 -0.161 1.167 2.7 2.181 1.93 0.399 0.8816 - dust sandy loam
588 12 1.2 0 0 0 0 0 0 10.3 0 0 0 0 0 51 38.7 25 18 7 14 -0.603 1.6 2.7 1.818 1.598 0.69 0.5393 - arenaceous loamy sand589 12 3.0-3.3 0 0 0 0 0 0 5 0 0 0 0 0 43.7 51.3 26 18 8 22 0.497 0.5 2.72 2.034 1.668 0.631 0.9473 - light sandy clay590 12 5 0 0 0 0 0 0 3.7 0 0 0 0 0 22.7 73.7 25 15 10 24 0.92 0.08 2.72 2.022 1.628 0.671 0.9811 - light gravelly dusty sand clay591 12 6.5 0 0 0 0 0 0 5.3 0 0 0 0 0 22.3 72.3 27 15 12 28 1.049 -0.05 2.72 2.005 1.572 0.731 1.027 -592 12 4.4-6.0 0 0 0 6 8.5 20.1 0 8.1 17.6 9.5 12.4 3.6 0 14.3 - - - - - - - - - - - - gravelly sand593 12 7.0-9.5 0 0 0 0 2.1 23.1 0 13.5 29.3 10.8 8.8 4.7 0 7.7 - - - - - - - - - - - 8.97594 12 9.5-11.5 0 0 0 0 3 26 0 17.6 25.7 8.6 7.6 2.9 0 8.6 - - - - - - - - - - - -595 12 15 0 0 0 0 3.1 6.1 12.4 0 0 0 0 0 15.9 62.5 45 27 18 24 -0.169 1.167 2.74 1.936 1.562 0.754 0.8704 - light dusty clay
596 13 1.3-1.5 0 0 0 0 0 0 14.1 0 0 0 0 0 46.4 39.5 23 15 8 18 0.311 0.688 2.72 2.137 1.818 0.496 0.9595 - light sandy clay597 13 4.5-4.8 0 0 0 0 0 0 10.3 0 0 0 0 0 42 47.7 20 15 5 21 1.132 -0.14 2.7 2.004 1.661 0.626 0.8918 - arenaceous loamy sand598 13 5.5 0 0 0 0 3.9 10.1 0 9 38.4 15.9 11 3.6 0 8.1 - - - - - - - - - - - - coarse sand599 13 7.6-10.2 0 0 0 0 8.4 25.4 0 11.5 20.7 12.5 10.7 3.2 0 7.6 - - - - - - - - - - - - gravelly sand600 13 12.5 0 0 0 0 0 6.4 10 0 0 0 0 0 26.6 57 43 25 18 21 -0.23 1.228 2.74 2.059 1.703 0.609 0.9393 - light dusty clay
Note: These data are obtained during the Feasibility Study" - " : not measured
Grain Size
C-1-43

Annex A(3) Result of test for Physical Properties (STP)
Plastisity % Solidity
Lob.
No.
Hol
e
Dep
th o
f Sam
plin
g
>70
70-4
0
40-2
0
20-1
0
10-5
5-2
2.0-
0.25
2.0-
1.0
1.0-
0.5
0.5-
0.25
0.25
-0.1
0.1-
0.00
5
0.25
-0.0
5
<0.
05
Liqu
id L
imit
Plas
tic L
imit
Plas
ticity
Inde
x
Nat
ural
Wat
er C
onte
nt
Liqu
idity
Inde
x(r
elat
ive
wat
er c
onte
nt)
Con
sist
ency
Inde
x
Spec
ific
grav
ityof
soil
parti
cle
Wet
Den
sity
Dry
Den
sity
Voi
d R
atio
Deg
ree
of S
atur
atio
n
Coe
ffic
ient
of P
erm
eabi
lity
Geology
m mm mm mm mm mm mm mm mm mm mm mm mm mm mm g/cm3 g/cm3 m/day
WL WP IP W IL Ic Gs(ρs) ρ ρd e Sr k
Grain Size
602 14 1.8-2.0 0 0 0 0 0 9.3 0 0 0 0 0 46.3 44.3 24 15 9 18 0.344 0.656 2.72 2.14 1.812 0.501 0.9829 - light sandy clay603 14 2 0 0 0 0 0 13.3 0 0 0 0 0 36 50.7 15 15 10 19 0.384 -0.38 2.72 2.098 1.766 0.541 0.9478 -604 14 0.0-3.0 - - - - - - - - - - - - - - - - - - - - - - - - -605 14 4.6-4.7 0 0 0 0 0 9 0 0 0 0 0 52.3 38.7 20 15 5 23 1.653 -0.66 2.7 2.11 1.712 0.577 1.088 - arenaceous loamy sand606 14 7.0-11.0 0 0 2.4 11.9 32.2 0 8.7 16.8 9 7.8 3 0 8.2 - - - - - - - - - - - 1.41 gravelly sand607 14 15 0 0 0 0 4.3 13.7 0 0 0 0 0 22.7 59.3 45 29 16 26 -0.189 1.188 2.73 1.937 1.537 0.776 0.9142 - heavy dusty sandy clay
608 15 1.5 0 0 0 0 0 8 0 0 0 0 0 42.7 49.3 29 18 11 23 0.413 0.591 2.72 2.049 1.672 0.626 0.9787 - light sandy clay609 15 0.0-3.0 - - - - - - - - - - - - - - - - - - - - - - - - -610 15 3.5-4.5 0 0 0 2.3 2 0 1.1 9.9 38.7 31.4 2.9 0 11.7 - - - - - - - - - - - 2.07 average caarseness sand611 15 4.5-5-5 0 0 0 0 10.9 0 6.6 24.4 23 23.5 3.8 0 7.8 - - - - - - - - - - - -612 15 5.5-8.0 0 0 1.5 4.3 26.9 0 13.1 24.7 13.2 10.3 2.5 0 3.5 - - - - - - - - - - - - gravelly sand613 15 8.0-10.3 0 0 0 5.9 25.5 0 12.5 27.2 13.7 10.2 2.8 0 2.2 - - - - - - - - - - - 14.3614 15 12 0 0 0 0 0 5.7 0 0 0 0 0 20.7 73.7 26 13 13 13 -0.012 1.015 2.73 2.267 2.009 0.359 0.9776 - heavy dusty sandy clay615 15 18 0 0 0 0 0 3.3 0 0 0 0 0 13.3 83.3 65 35 30 30 -0.172 1.173 2.74 1.89 1.456 0.882 0.9268 - heavy clay
616 16 3.2 0 0 0 0 0 7.3 0 0 0 0 0 54.3 38.3 20 15 5 22 1.353 -0.36 2.7 2.163 1.777 0.52 1.13 - arenaceous loamy sand617 16 4.5-5.8 0 0 0 2.2 7.5 0 4.8 16.2 19.3 22.2 6.3 0 21.5 - - - - - - - - - - - - fine sand618 16 5.8-8.0 0 0 5.6 11.7 18.2 0 8.4 21.8 15.7 10.9 2.9 0 4.7 - - - - - - - - - - - - gravelly sand619 16 8.0-10.2 0 0 3.8 14.3 34.7 0 8.7 10.5 7.9 8 6.2 0 5.9 - - - - - - - - - - - - gravel soil620 16 15 0 0 0 0 0 4.7 0 0 0 0 0 19.3 76 65 33 32 40 0.209 0.791 2.74 1.895 1.356 1.02 1.066 - heavy clay
Note: These data are obtained during the Feasibility Study" - " : not measured
C-1-44

Annex A(4) Result of test for Physical Properties (STP)
Plastisity % Solidity
Lob.
No.
Hol
e
Dep
th o
f Sam
plin
g
>70
70-4
0
40-2
0
20 -
10
10 -
5
5.0-
2.0
2.0-
1.0
1.0-
0.5
0.5-
0.25
0.25
-0.1
0.1-
0.05
0.05
-0.0
1
0.01
-0.0
05
<0.
005
Liqu
id L
imit
Plas
tic L
imit
Plas
ticity
Inde
x
Nat
ural
Wat
er C
onte
nt
Liqu
idity
Inde
x(r
elat
ive
wat
er c
onte
nt)
Con
sist
ency
Inde
x
Spec
ific
grav
ityof
soil
parti
cle
Wet
Den
sity
Dry
Den
sity
Voi
d R
atio
Deg
ree
of S
atur
atio
n
Coe
ffic
ient
of P
erm
eabi
lity
Geology
m mm mm mm mm mm mm mm mm mm mm mm mm mm mm g/cm3 g/cm3 m/day
WL WP IP W IL Ic Gs(ρs) ρ ρd e Sr k
29 10-11 0 0 0 6.4 14.3 31.1 12.5 12.8 12.7 6.3 0.1 1 0.7 2.1 - - - 4 - - 2.68 - - - - 58.2 Gravel sand29 14-14.2 0 0 0 0 0 0 0 0.3 0.2 0.5 3.9 15.6 17.1 62.4 51 21 30 27 0.21 0.789 2.74 1.98 1.56 0.76 0.98 - Clay heavy semisolid
30 8.0-9.0 0 0 0 6.2 10.3 25 13.8 21.6 18.8 2.8 0.8 0.3 0.1 0.3 - - - 3 - - 2.7 - - - - 57.8 Gravel sand30 12-12.2 0 0 0 0 0 0 0.1 0.1 0.3 0.6 3.1 14.1 14.9 66.8 50 21 30 26 0.18 0.819 2.7 1.99 1.58 0.71 0.99 - Clay, heavy semisolid
31 7.0-8.0 0 0 0 6.4 11.4 21.5 12.2 24.8 19.3 3.1 0.5 0.2 0.2 0.4 - - - 4 - - 2.7 - - - - 45.6 Gravel sand31 13-13.2 0 0 0 0 0.3 0.8 0.5 0.8 1.2 1.2 7.3 5.3 13.5 69.1 53 19 33 23 0.11 0.892 2.73 2.07 1.68 0.63 0.99 - Clay, heavy semisolid
32 9.0-10.0 0 0 0 6.9 10.7 21.8 12.3 21.6 19.2 3.4 1.3 0.3 0.6 1.9 - - - 3 - - 2.7 - - - - 39.2 Gravel sand32 12.5-12.7 0 0 0 0 0.2 0.2 0.2 0.3 0.6 1.6 4.2 20.7 9.2 62.8 51 20 31 27 0.22 0.785 2.72 1.98 1.56 0.74 0.99 - Clay, heavy pulverulent semisolid
33 8.0-9.0 0 0 0 7.9 12.4 29.4 15 20.7 10.2 3.2 0.1 0.5 0.2 0.4 - - - 3 - - 2.68 - - - - 65.7 Gravel sand33 12-12.2 0 0 0 0 0.4 2.2 0.6 1.4 8.9 4.9 5.5 9.8 7 59.3 57 22 35 32 0.29 0.71 2.68 1.92 1.46 0.84 1.02 - Clay, heavy pulverulent tight-
34 6.4-7.0 0 0 0 8 12.5 14.9 9.6 25 24.3 4.3 0.1 0.4 0.3 0.6 - - - 9 - - 2.7 - - - - 33.9 Coarse sand34 10.2-10.4 0 0 0 0 0 0.9 0.8 2.6 5 8.9 9.5 25.8 14.2 32.3 35 20 15 25 0.3 0.693 2.73 1.97 1.58 0.73 0.92 - Clay loam, light pulverulent tight-
35 5.3-6.3 0 0 0 4.7 12.5 25.7 15.4 21.8 10.7 3.6 0.7 2 0.7 2.2 - - - 12 - - 2.71 - - - - 48.2 Gravel sand35 7.0-8.0 0 0 0 0 2.1 1.1 0.8 3 16.9 22.5 10.1 23.5 5.9 14.1 27 14 13 13 0.08 1.079 2.69 2.17 1.92 0.4 0.87 - Clay loam, light pulverulent
Note: These data are obtained during this Study" - " : not measured
Grain Size
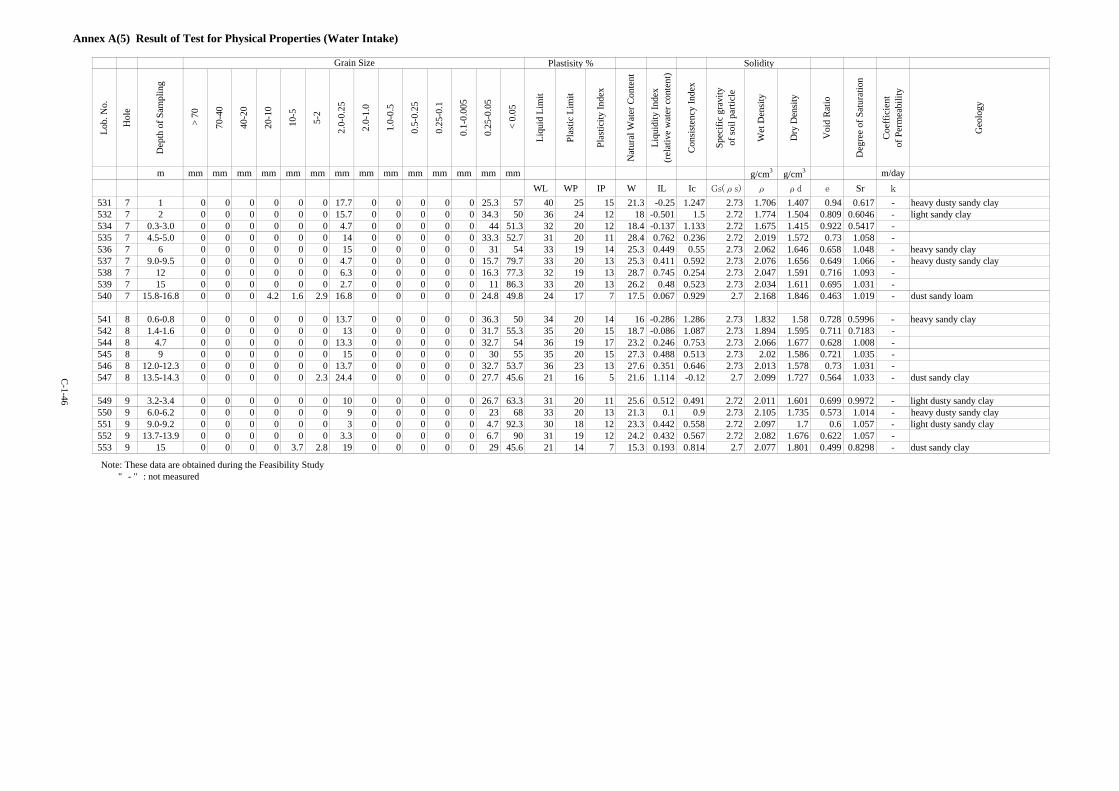
C-1-45
Annex A(5) Result of Test for Physical Properties (Water Intake)
Plastisity % Solidity
Lob.
No.
Hol
e
Dep
th o
f Sam
plin
g
>70
70-4
0
40-2
0
20-1
0
10-5
5-2
2.0-
0.25
2.0-
1.0
1.0-
0.5
0.5-
0.25
0.25
-0.1
0.1-
0.00
5
0.25
-0.0
5
<0.
05
Liqu
id L
imit
Plas
tic L
imit
Plas
ticity
Inde
x
Nat
ural
Wat
er C
onte
nt
Liqu
idity
Inde
x(r
elat
ive
wat
er c
onte
nt)
Con
sist
ency
Inde
x
Spec
ific
grav
ityof
soil
parti
cle
Wet
Den
sity
Dry
Den
sity
Voi
d R
atio
Deg
ree
of S
atur
atio
n
Coe
ffic
ient
of P
erm
eabi
lity
Geo
logy
m mm mm mm mm mm mm mm mm mm mm mm mm mm mm g/cm3 g/cm3 m/dayWL WP IP W IL Ic Gs(ρs) ρ ρd e Sr k
531 7 1 0 0 0 0 0 0 17.7 0 0 0 0 0 25.3 57 40 25 15 21.3 -0.25 1.247 2.73 1.706 1.407 0.94 0.617 - heavy dusty sandy clay532 7 2 0 0 0 0 0 0 15.7 0 0 0 0 0 34.3 50 36 24 12 18 -0.501 1.5 2.72 1.774 1.504 0.809 0.6046 - light sandy clay534 7 0.3-3.0 0 0 0 0 0 0 4.7 0 0 0 0 0 44 51.3 32 20 12 18.4 -0.137 1.133 2.72 1.675 1.415 0.922 0.5417 -535 7 4.5-5.0 0 0 0 0 0 0 14 0 0 0 0 0 33.3 52.7 31 20 11 28.4 0.762 0.236 2.72 2.019 1.572 0.73 1.058 -536 7 6 0 0 0 0 0 0 15 0 0 0 0 0 31 54 33 19 14 25.3 0.449 0.55 2.73 2.062 1.646 0.658 1.048 - heavy sandy clay537 7 9.0-9.5 0 0 0 0 0 0 4.7 0 0 0 0 0 15.7 79.7 33 20 13 25.3 0.411 0.592 2.73 2.076 1.656 0.649 1.066 - heavy dusty sandy clay538 7 12 0 0 0 0 0 0 6.3 0 0 0 0 0 16.3 77.3 32 19 13 28.7 0.745 0.254 2.73 2.047 1.591 0.716 1.093 -539 7 15 0 0 0 0 0 0 2.7 0 0 0 0 0 11 86.3 33 20 13 26.2 0.48 0.523 2.73 2.034 1.611 0.695 1.031 -540 7 15.8-16.8 0 0 0 4.2 1.6 2.9 16.8 0 0 0 0 0 24.8 49.8 24 17 7 17.5 0.067 0.929 2.7 2.168 1.846 0.463 1.019 - dust sandy loam
541 8 0.6-0.8 0 0 0 0 0 0 13.7 0 0 0 0 0 36.3 50 34 20 14 16 -0.286 1.286 2.73 1.832 1.58 0.728 0.5996 - heavy sandy clay542 8 1.4-1.6 0 0 0 0 0 0 13 0 0 0 0 0 31.7 55.3 35 20 15 18.7 -0.086 1.087 2.73 1.894 1.595 0.711 0.7183 -544 8 4.7 0 0 0 0 0 0 13.3 0 0 0 0 0 32.7 54 36 19 17 23.2 0.246 0.753 2.73 2.066 1.677 0.628 1.008 -545 8 9 0 0 0 0 0 0 15 0 0 0 0 0 30 55 35 20 15 27.3 0.488 0.513 2.73 2.02 1.586 0.721 1.035 -546 8 12.0-12.3 0 0 0 0 0 0 13.7 0 0 0 0 0 32.7 53.7 36 23 13 27.6 0.351 0.646 2.73 2.013 1.578 0.73 1.031 -547 8 13.5-14.3 0 0 0 0 0 2.3 24.4 0 0 0 0 0 27.7 45.6 21 16 5 21.6 1.114 -0.12 2.7 2.099 1.727 0.564 1.033 - dust sandy clay
549 9 3.2-3.4 0 0 0 0 0 0 10 0 0 0 0 0 26.7 63.3 31 20 11 25.6 0.512 0.491 2.72 2.011 1.601 0.699 0.9972 - light dusty sandy clay550 9 6.0-6.2 0 0 0 0 0 0 9 0 0 0 0 0 23 68 33 20 13 21.3 0.1 0.9 2.73 2.105 1.735 0.573 1.014 - heavy dusty sandy clay551 9 9.0-9.2 0 0 0 0 0 0 3 0 0 0 0 0 4.7 92.3 30 18 12 23.3 0.442 0.558 2.72 2.097 1.7 0.6 1.057 - light dusty sandy clay552 9 13.7-13.9 0 0 0 0 0 0 3.3 0 0 0 0 0 6.7 90 31 19 12 24.2 0.432 0.567 2.72 2.082 1.676 0.622 1.057 -553 9 15 0 0 0 0 3.7 2.8 19 0 0 0 0 0 29 45.6 21 14 7 15.3 0.193 0.814 2.7 2.077 1.801 0.499 0.8298 - dust sandy clay
Note: These data are obtained during the Feasibility Study" - " : not measured
Grain Size
C-1-46
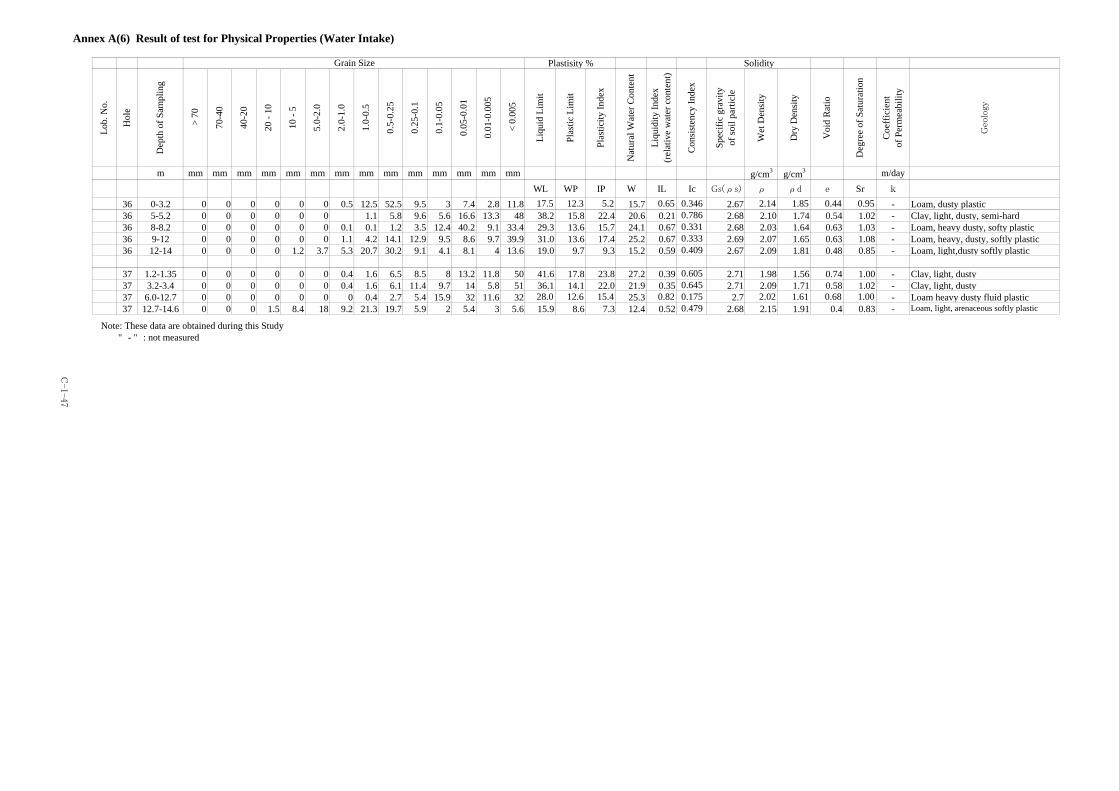
Annex A(6) Result of test for Physical Properties (Water Intake)
Plastisity % Solidity
Lob.
No.
Hol
e
Dep
th o
f Sam
plin
g
>70
70-4
0
40-2
0
20 -
10
10 -
5
5.0-
2.0
2.0-
1.0
1.0-
0.5
0.5-
0.25
0.25
-0.1
0.1-
0.05
0.05
-0.0
1
0.01
-0.0
05
<0.
005
Liqu
id L
imit
Plas
tic L
imit
Plas
ticity
Inde
x
Nat
ural
Wat
er C
onte
nt
Liqu
idity
Inde
x(r
elat
ive
wat
er c
onte
nt)
Con
sist
ency
Inde
x
Spec
ific
grav
ityof
soil
parti
cle
Wet
Den
sity
Dry
Den
sity
Voi
d R
atio
Deg
ree
of S
atur
atio
n
Coe
ffic
ient
of P
erm
eabi
lity
Geology
m mm mm mm mm mm mm mm mm mm mm mm mm mm mm g/cm3 g/cm3 m/day
WL WP IP W IL Ic Gs(ρs) ρ ρd e Sr k
36 0-3.2 0 0 0 0 0 0 0.5 12.5 52.5 9.5 3 7.4 2.8 11.8 17.5 12.3 5.2 15.7 0.65 0.346 2.67 2.14 1.85 0.44 0.95 - Loam, dusty plastic36 5-5.2 0 0 0 0 0 0 1.1 5.8 9.6 5.6 16.6 13.3 48 38.2 15.8 22.4 20.6 0.21 0.786 2.68 2.10 1.74 0.54 1.02 - Clay, light, dusty, semi-hard36 8-8.2 0 0 0 0 0 0 0.1 0.1 1.2 3.5 12.4 40.2 9.1 33.4 29.3 13.6 15.7 24.1 0.67 0.331 2.68 2.03 1.64 0.63 1.03 - Loam, heavy dusty, softy plastic36 9-12 0 0 0 0 0 0 1.1 4.2 14.1 12.9 9.5 8.6 9.7 39.9 31.0 13.6 17.4 25.2 0.67 0.333 2.69 2.07 1.65 0.63 1.08 - Loam, heavy, dusty, softly plastic36 12-14 0 0 0 0 1.2 3.7 5.3 20.7 30.2 9.1 4.1 8.1 4 13.6 19.0 9.7 9.3 15.2 0.59 0.409 2.67 2.09 1.81 0.48 0.85 - Loam, light,dusty softly plastic
37 1.2-1.35 0 0 0 0 0 0 0.4 1.6 6.5 8.5 8 13.2 11.8 50 41.6 17.8 23.8 27.2 0.39 0.605 2.71 1.98 1.56 0.74 1.00 - Clay, light, dusty37 3.2-3.4 0 0 0 0 0 0 0.4 1.6 6.1 11.4 9.7 14 5.8 51 36.1 14.1 22.0 21.9 0.35 0.645 2.71 2.09 1.71 0.58 1.02 - Clay, light, dusty37 6.0-12.7 0 0 0 0 0 0 0 0.4 2.7 5.4 15.9 32 11.6 32 28.0 12.6 15.4 25.3 0.82 0.175 2.7 2.02 1.61 0.68 1.00 - Loam heavy dusty fluid plastic37 12.7-14.6 0 0 0 1.5 8.4 18 9.2 21.3 19.7 5.9 2 5.4 3 5.6 15.9 8.6 7.3 12.4 0.52 0.479 2.68 2.15 1.91 0.4 0.83 - Loam, light, arenaceous softly plastic
Note: These data are obtained during this Study" - " : not measured
Grain Size
C-1-47

Annex A(7) Result of test for Physical Properties (Ishym River)
Plastisity % Solidity
Lob.
No.
Hol
e
Dep
th o
f Sam
plin
g
>70
70-4
0
40-2
0
20 -
10
10 -
5
5.0-
2.0
2.0-
1.0
1.0-
0.5
0.5-
0.25
0.25
-0.1
0.1-
0.05
0.05
-0.0
1
0.01
-0.0
05
<0.
005
Liqu
id L
imit
Plas
tic L
imit
Plas
ticity
Inde
x
Nat
ural
Wat
er C
onte
nt
Liqu
idity
Inde
x(r
elat
ive
wat
er c
onte
nt)
Con
sist
ency
Inde
x
Spec
ific
grav
ityof
soil
parti
cle
Wet
Den
sity
Dry
Den
sity
Voi
d R
atio
Deg
ree
of S
atur
atio
n
Coe
ffic
ient
of P
erm
eabi
lity
Geology
m mm mm mm mm mm mm mm mm mm mm mm mm mm mm g/cm3 g/cm3 m/day
WL WP IP W IL Ic Gs(ρs) ρ ρd e Sr k
34 6.4-7.0 0 0 0 8 12.5 14.9 9.6 25 24.3 4.3 0.1 0.4 0.3 0.6 - - - 9 - - 2.7 - - - - 33.9 Coarse sand34 10.2-10.4 0 0 0 0 0 0.9 0.8 2.6 5 8.9 9.5 25.8 14.2 32.3 35 20 15 25 0.3 0.693 2.73 1.97 1.58 0.73 0.92 - Clay loam, light pulverulent tight-
35 5.3-6.3 0 0 0 4.7 12.5 25.7 15.4 21.8 10.7 3.6 0.7 2 0.7 2.2 - - - 12 - - 2.71 - - - - 48.2 Gravel sand35 7.0-8.0 0 0 0 0 2.1 1.1 0.8 3 16.9 22.5 10.1 23.5 5.9 14.1 27 14 13 13 0.08 1.079 2.69 2.17 1.92 0.4 0.87 - Clay loam, light pulverulent
Note: These data are obtained during this Study" - " : not measured
Grain Size
C-1-48

Annex A(8) Result of Test for Physical Properties (Along the Ishym River)
Plastisity % Solidity
Lob.
No.
Hol
e
Dep
th o
f Sam
plin
g
>70
70-4
0
40-2
0
20-1
0
10-5
5-2
2.0-
0.25
2.0-
1.0
1.0-
0.5
0.5-
0.25
0.25
-0.1
0.1-
0.00
5
0.25
-0.0
5
<0.0
5
Liqu
id L
imit
Plas
tic L
imit
Plas
ticity
Inde
x
Nat
ural
Wat
er C
onte
nt
Liqu
idity
Inde
x(r
elat
ive
wat
er c
onte
nt)
Con
sist
ency
Inde
x
Spec
ific
grav
ityof
soil
parti
cle
Wet
Den
sity
Dry
Den
sity
Voi
d R
atio
Deg
ree
of S
atur
atio
n
Coe
ffic
ient
of P
erm
eabi
lity
Geo
logy
m mm mm mm mm mm mm mm mm mm mm mm mm mm mm g/cm3 g/cm3 m/dayWL WP IP W IL Ic Gs(ρs) ρ ρd e Sr k
631 19 1.5 3.7 - - - - - 17 79.3 32 19 13 20 0.077 0.923 2.73 1.883 1.569 0.739 0.7367 - Sandy Clay, heavy, dusty632 19 0.3-3.0633 19 4.5-6.0 1.4 1.2 - 1.2 9.8 22 43.3 3 0 18.1 1.97 Sand, fine grained634 19 6.0-8.0 2.4 12.2 20.9 - 9 22.6 12.4 13.7 1.2 0 5.7 Sand, coarse grained635 19 8.0-10.4 3.8 10.7 22.3 - 8.1 21.3 13.3 11.7 1.9 0 7.2
636 20 3 3.3 - - - - - 32 64.7 25 18 7 19.6 0.229 0.771 2.70 1.86 1.554 0.737 0.720 Sandy Loam, dusty637 20 6.7-8.5 2 5.3 16.9 - 8.1 23.8 15.3 15.8 2.7 0 10.3 Sand, coarse grained638 20 8.5-10.4 3 2.8 7.3 - 6.4 24.4 22 21.3 2.2 0 10.8 2.3 Sand, average coarseness
Note: These data are obtained during the Feasibility Study" - " : not measured
Grain Size
C-1-49
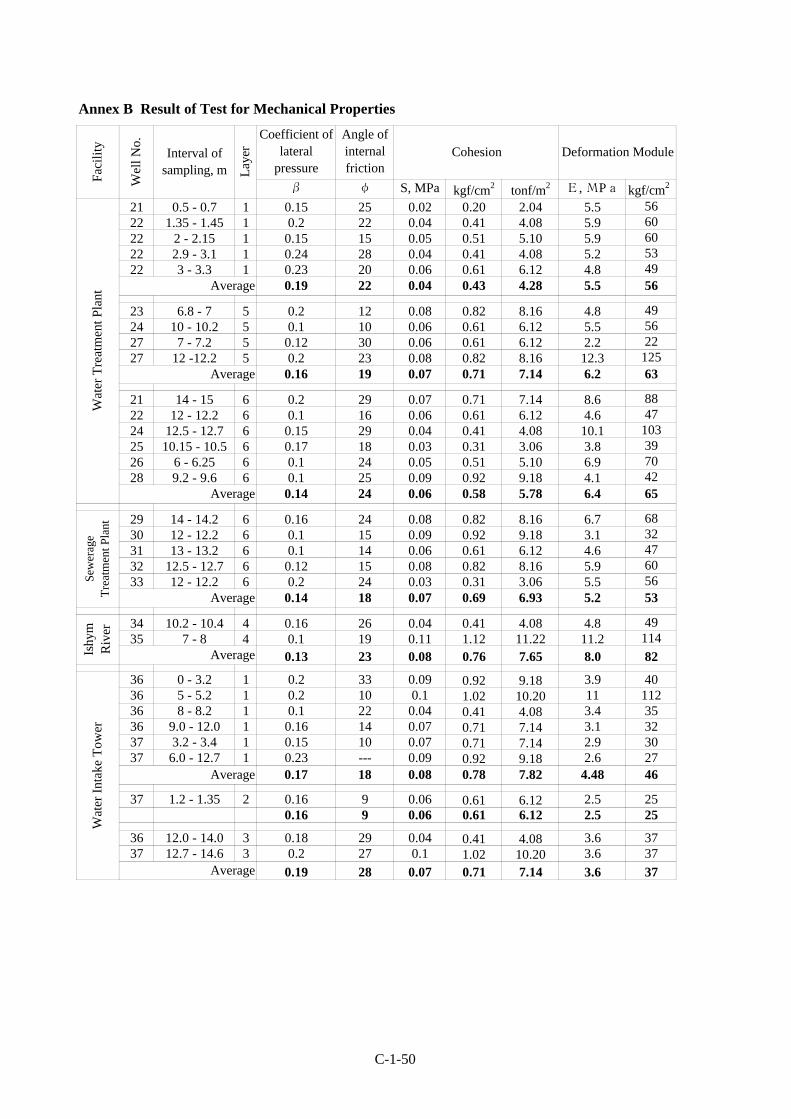
Annex B Result of Test for Mechanical Properties
Coefficient oflateral
pressure
Angle ofinternalfriction
β φ S, MPa kgf/cm2 tonf/m2 Е, МPа kgf/cm2
21 0.5 - 0.7 1 0.15 25 0.02 0.20 2.04 5.5 5622 1.35 - 1.45 1 0.2 22 0.04 0.41 4.08 5.9 6022 2 - 2.15 1 0.15 15 0.05 0.51 5.10 5.9 6022 2.9 - 3.1 1 0.24 28 0.04 0.41 4.08 5.2 5322 3 - 3.3 1 0.23 20 0.06 0.61 6.12 4.8 49
0.19 22 0.04 0.43 4.28 5.5 56
23 6.8 - 7 5 0.2 12 0.08 0.82 8.16 4.8 4924 10 - 10.2 5 0.1 10 0.06 0.61 6.12 5.5 5627 7 - 7.2 5 0.12 30 0.06 0.61 6.12 2.2 2227 12 -12.2 5 0.2 23 0.08 0.82 8.16 12.3 125
0.16 19 0.07 0.71 7.14 6.2 63
21 14 - 15 6 0.2 29 0.07 0.71 7.14 8.6 8822 12 - 12.2 6 0.1 16 0.06 0.61 6.12 4.6 4724 12.5 - 12.7 6 0.15 29 0.04 0.41 4.08 10.1 10325 10.15 - 10.5 6 0.17 18 0.03 0.31 3.06 3.8 3926 6 - 6.25 6 0.1 24 0.05 0.51 5.10 6.9 7028 9.2 - 9.6 6 0.1 25 0.09 0.92 9.18 4.1 42
0.14 24 0.06 0.58 5.78 6.4 65
29 14 - 14.2 6 0.16 24 0.08 0.82 8.16 6.7 6830 12 - 12.2 6 0.1 15 0.09 0.92 9.18 3.1 3231 13 - 13.2 6 0.1 14 0.06 0.61 6.12 4.6 4732 12.5 - 12.7 6 0.12 15 0.08 0.82 8.16 5.9 6033 12 - 12.2 6 0.2 24 0.03 0.31 3.06 5.5 56
0.14 18 0.07 0.69 6.93 5.2 53
34 10.2 - 10.4 4 0.16 26 0.04 0.41 4.08 4.8 4935 7 - 8 4 0.1 19 0.11 1.12 11.22 11.2 114
0.13 23 0.08 0.76 7.65 8.0 82
36 0 - 3.2 1 0.2 33 0.09 0.92 9.18 3.9 4036 5 - 5.2 1 0.2 10 0.1 1.02 10.20 11 11236 8 - 8.2 1 0.1 22 0.04 0.41 4.08 3.4 3536 9.0 - 12.0 1 0.16 14 0.07 0.71 7.14 3.1 3237 3.2 - 3.4 1 0.15 10 0.07 0.71 7.14 2.9 3037 6.0 - 12.7 1 0.23 --- 0.09 0.92 9.18 2.6 27
0.17 18 0.08 0.78 7.82 4.48 46
37 1.2 - 1.35 2 0.16 9 0.06 0.61 6.12 2.5 250.16 9 0.06 0.61 6.12 2.5 25
36 12.0 - 14.0 3 0.18 29 0.04 0.41 4.08 3.6 3737 12.7 - 14.6 3 0.2 27 0.1 1.02 10.20 3.6 37
0.19 28 0.07 0.71 7.14 3.6 37
Cohesion Deformation Module
Wat
er T
reat
men
t Pla
ntSe
wer
age
Trea
tmen
t Pla
nt
Average
Average
Average
Average
Laye
rInterval ofsampling, m
Average
Ishy
mR
iver
Wat
er In
take
Tow
er
Wel
l No.
Faci
lity
Average
Average
C-1-50
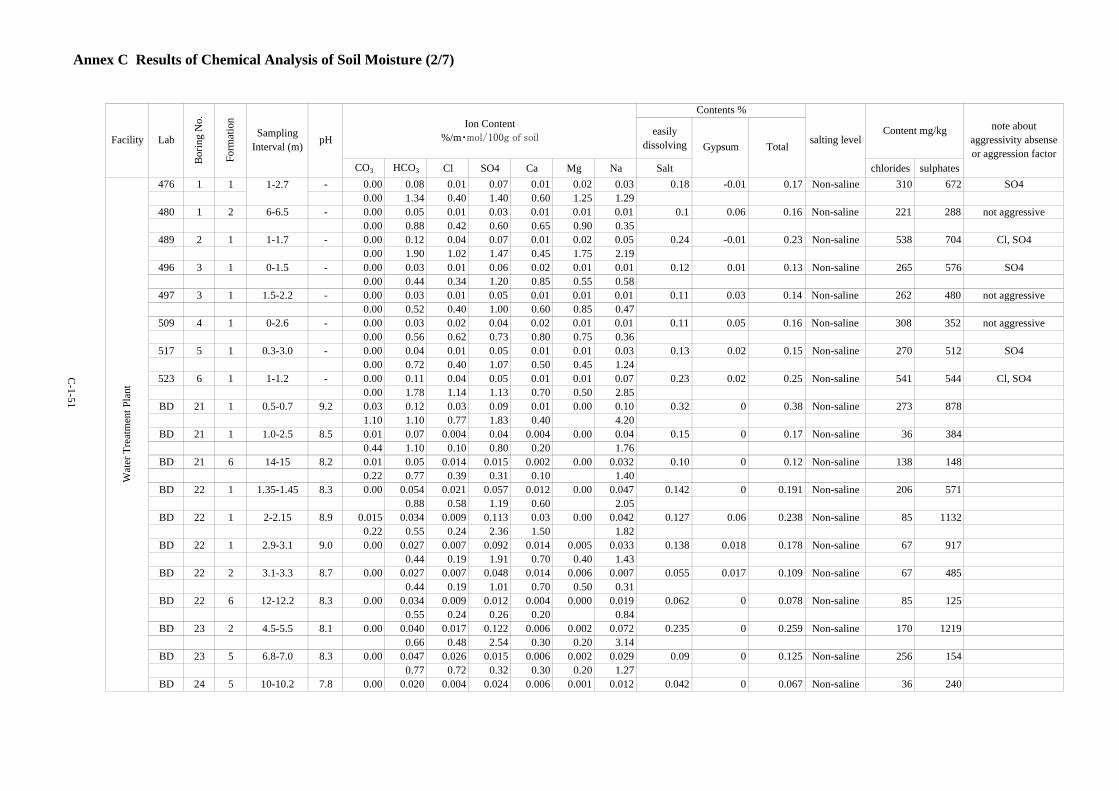
Annex C Results of Chemical Analysis of Soil Moisture (2/7)
easilydissolving
CO3 HCO3 Cl SO4 Ca Mg Na Salt chlorides sulphates476 1 1 1-2.7 - 0.00 0.08 0.01 0.07 0.01 0.02 0.03 0.18 -0.01 0.17 Non-saline 310 672 SO4
0.00 1.34 0.40 1.40 0.60 1.25 1.29480 1 2 6-6.5 - 0.00 0.05 0.01 0.03 0.01 0.01 0.01 0.1 0.06 0.16 Non-saline 221 288 not aggressive
0.00 0.88 0.42 0.60 0.65 0.90 0.35489 2 1 1-1.7 - 0.00 0.12 0.04 0.07 0.01 0.02 0.05 0.24 -0.01 0.23 Non-saline 538 704 Cl, SO4
0.00 1.90 1.02 1.47 0.45 1.75 2.19496 3 1 0-1.5 - 0.00 0.03 0.01 0.06 0.02 0.01 0.01 0.12 0.01 0.13 Non-saline 265 576 SO4
0.00 0.44 0.34 1.20 0.85 0.55 0.58497 3 1 1.5-2.2 - 0.00 0.03 0.01 0.05 0.01 0.01 0.01 0.11 0.03 0.14 Non-saline 262 480 not aggressive
0.00 0.52 0.40 1.00 0.60 0.85 0.47509 4 1 0-2.6 - 0.00 0.03 0.02 0.04 0.02 0.01 0.01 0.11 0.05 0.16 Non-saline 308 352 not aggressive
0.00 0.56 0.62 0.73 0.80 0.75 0.36517 5 1 0.3-3.0 - 0.00 0.04 0.01 0.05 0.01 0.01 0.03 0.13 0.02 0.15 Non-saline 270 512 SO4
0.00 0.72 0.40 1.07 0.50 0.45 1.24523 6 1 1-1.2 - 0.00 0.11 0.04 0.05 0.01 0.01 0.07 0.23 0.02 0.25 Non-saline 541 544 Cl, SO4
0.00 1.78 1.14 1.13 0.70 0.50 2.85BD 21 1 0.5-0.7 9.2 0.03 0.12 0.03 0.09 0.01 0.00 0.10 0.32 0 0.38 Non-saline 273 878
1.10 1.10 0.77 1.83 0.40 4.20BD 21 1 1.0-2.5 8.5 0.01 0.07 0.004 0.04 0.004 0.00 0.04 0.15 0 0.17 Non-saline 36 384
0.44 1.10 0.10 0.80 0.20 1.76BD 21 6 14-15 8.2 0.01 0.05 0.014 0.015 0.002 0.00 0.032 0.10 0 0.12 Non-saline 138 148
0.22 0.77 0.39 0.31 0.10 1.40BD 22 1 1.35-1.45 8.3 0.00 0.054 0.021 0.057 0.012 0.00 0.047 0.142 0 0.191 Non-saline 206 571
0.88 0.58 1.19 0.60 2.05BD 22 1 2-2.15 8.9 0.015 0.034 0.009 0.113 0.03 0.00 0.042 0.127 0.06 0.238 Non-saline 85 1132
0.22 0.55 0.24 2.36 1.50 1.82BD 22 1 2.9-3.1 9.0 0.00 0.027 0.007 0.092 0.014 0.005 0.033 0.138 0.018 0.178 Non-saline 67 917
0.44 0.19 1.91 0.70 0.40 1.43BD 22 2 3.1-3.3 8.7 0.00 0.027 0.007 0.048 0.014 0.006 0.007 0.055 0.017 0.109 Non-saline 67 485
0.44 0.19 1.01 0.70 0.50 0.31BD 22 6 12-12.2 8.3 0.00 0.034 0.009 0.012 0.004 0.000 0.019 0.062 0 0.078 Non-saline 85 125
0.55 0.24 0.26 0.20 0.84BD 23 2 4.5-5.5 8.1 0.00 0.040 0.017 0.122 0.006 0.002 0.072 0.235 0 0.259 Non-saline 170 1219
0.66 0.48 2.54 0.30 0.20 3.14BD 23 5 6.8-7.0 8.3 0.00 0.047 0.026 0.015 0.006 0.002 0.029 0.09 0 0.125 Non-saline 256 154
0.77 0.72 0.32 0.30 0.20 1.27BD 24 5 10-10.2 7.8 0.00 0.020 0.004 0.024 0.006 0.001 0.012 0.042 0 0.067 Non-saline 36 240
Wat
er T
reat
men
t Pla
ntContent mg/kg
Contents %Ion Content
%/m・mol/100g of soilGypsum Total salting level
note aboutaggressivity absenseor aggression factor
SamplingInterval (m) pHFacility Lab
Bor
ing
No.
Form
atio
n
C-1-51

Annex C Results of Chemical Analysis of Soil Moisture (3/7)
easilydissolving
CO3 HCO3 Cl SO4 Ca Mg Na Salt chlorides sulphates
Content mg/kg
Contents %Ion Content
%/m・mol/100g of soilGypsum Total salting level
note aboutaggressivity absenseor aggression factor
SamplingInterval (m) pHFacility Lab
Bor
ing
No.
Form
atio
n
0.33 0.10 0.50 0.30 0.10 0.51BD 24 6 12.5-12.7 8.2 0.00 0.040 0.007 0.020 0.008 0.000 0.020 0.047 0 0.095 Non-saline 71 197
0.64 0.20 0.41 0.40 0.87BD 25 4 8.0-8.2 7.6 0.00 0.020 0.002 0.015 0.008 0.001 0.004 0.018 0.004 0.049 Non-saline 18 149
0.33 0.05 0.31 0.40 0.10 0.19BD 25 6 10.15-10.5 8.1 0.004 0.034 0.017 0.015 0.006 0.001 0.025 0.078 0 0.102 Non-saline 170 154
0.13 0.55 0.48 0.32 0.30 0.10 1.08BD 26 6 6-6.25 7.6 0.00 0.013 0.014 0.036 0.010 0.002 0.013 0.048 0.02 0.088 Non-saline 138 365
0.22 0.39 0.76 0.50 0.20 0.57BD 27 4 5.0-6.0 8.2 0.004 0.027 0.005 0.005 0.006 0.001 0.009 0.033 0 0.057 Non-saline 50 53
0.12 0.44 0.14 0.11 0.30 0.10 0.39BD 27 5 7-7.2 8.1 0.003 0.020 0.009 0.017 0.004 0.002 0.014 0.053 0 0.069 Non-saline 85 173
0.10 0.33 0.24 0.36 0.20 0.20 0.62BD 28 5 7.0-8.0 8.1 0.00 0.040 0.014 0.050 0.010 0.001 0.013 0.07 0 0.083 Non-saline 138 48
0.66 0.39 0.10 0.50 0.10 0.55BD 28 6 9.2-9.6 7.9 0.00 0.020 0.009 0.012 0.008 0.001 0.007 0.03 0 0.057 Non-saline 85 125
Wat
er T
reat
men
t Pla
nt
C-1-52

Annex C Results of Chemical Analysis of Soil Moisture (4/7)
easilydissolving
CO3 HCO3 Cl SO4 Ca Mg Na Salt chlorides sulphates
Content mg/kg
Contents %Ion Content
%/m・mol/100g of soilGypsum Total salting level
note aboutaggressivity absenseor aggression factor
SamplingInterval (m) pHFacility Lab
Bor
ing
No.
Form
atio
n
566 10 1 1.1-1.3 - 0.00 0.05 0.02 0.03 0.01 0.01 0.01 0.11 0.07 0.18 Non-saline 298 256 not aggressive0.00 0.74 0.66 0.53 0.70 0.65 0.58
573 11 1 0.3-3.0 - 0.00 0.03 0.03 0.09 0.03 0.01 0.03 0.19 -0.04 0.15 Non-saline 507 864 Cl, SO40.00 0.54 0.82 1.80 1.35 0.70 1.11
604 14 0 0-0.3 - 0.00 0.09 0.07 0.31 0.02 0.01 0.18 0.64 -0.44 0.2 Non-saline 1486 3104 Cl, SO40.00 1.46 2.00 6.47 1.00 1.00 7.93
609 15 0 0-0.3 - 0.00 0.04 0.06 0.31 0.01 0.01 0.16 0.57 -0.44 0.13 Non-saline 1336 3072 Cl, SO40.00 0.60 1.60 6.40 0.50 1.00 7.10
BD 29 4 10.0-11.0 8 0.00 0.020 0.002 0.043 0.014 0.004 0.006 0.037 0.025 0.089 Non-saline 18 3980.33 0.05 0.83 0.70 0.30 0.27
BD 29 6 14-14.2 7.6 0.00 0.013 0.046 0.038 0.008 0.005 0.035 0.115 0.013 0.145 Non-saline 461.5 3840.22 1.30 0.80 0.40 0.40 1.53
BD 30 4 8.0-9.0 7.6 0.003 0.027 0.010 0.015 0.006 0.000 0.019 0.06 0 0.08 Non-saline 103 1630.10 0.44 0.29 0.31 0.30 0.84
BD 30 6 12-12.2 7.2 0.00 0.020 0.055 0.043 0.006 0.001 0.054 0.055 0 0.179 Non-saline 547 4270.33 1.54 0.89 0.30 0.10 2.36
BD 31 4 7.0-8.0 7.6 0.00 0.027 0.009 0.017 0.006 0.000 0.019 0.054 0 0.078 Non-saline 85 1730.44 0.24 0.36 0.30 0.84
BD 31 6 13-13.2 8 0.00 0.013 0.033 0.028 0.006 0.000 0.032 0.089 0 0.112 Non-saline 326.6 3780.22 0.92 0.58 0.30 1.43
BD 32 4 9.0-10.0 8.5 0.01 0.027 0.007 0.031 0.006 0.001 0.018 0.068 0 0.091 Non-saline 67 3070.22 0.44 0.19 0.64 0.30 0.10 0.77
BD 32 6 12.5-12.7 8 0.00 0.013 0.041 0.021 0.002 0.001 0.004 0.11 0 0.118 Non-saline 412 2110.22 1.16 0.44 0.10 0.10 1.74
BD 33 4 8.0-9.0 8 0.00 0.020 0.020 0.020 0.020 0.020 0.020 0.01 0 0.034 Non-saline 18 380.33 0.05 0.08 0.30 0.10 0.06
BD 33 6 12-12.2 8 0.00 0.027 0.034 0.009 0.002 0.002 0.030 0.096 0 0.104 Non-saline 341 91
WA
STE
WA
TER
TR
EATM
ENT
PLA
NT
C-1-53
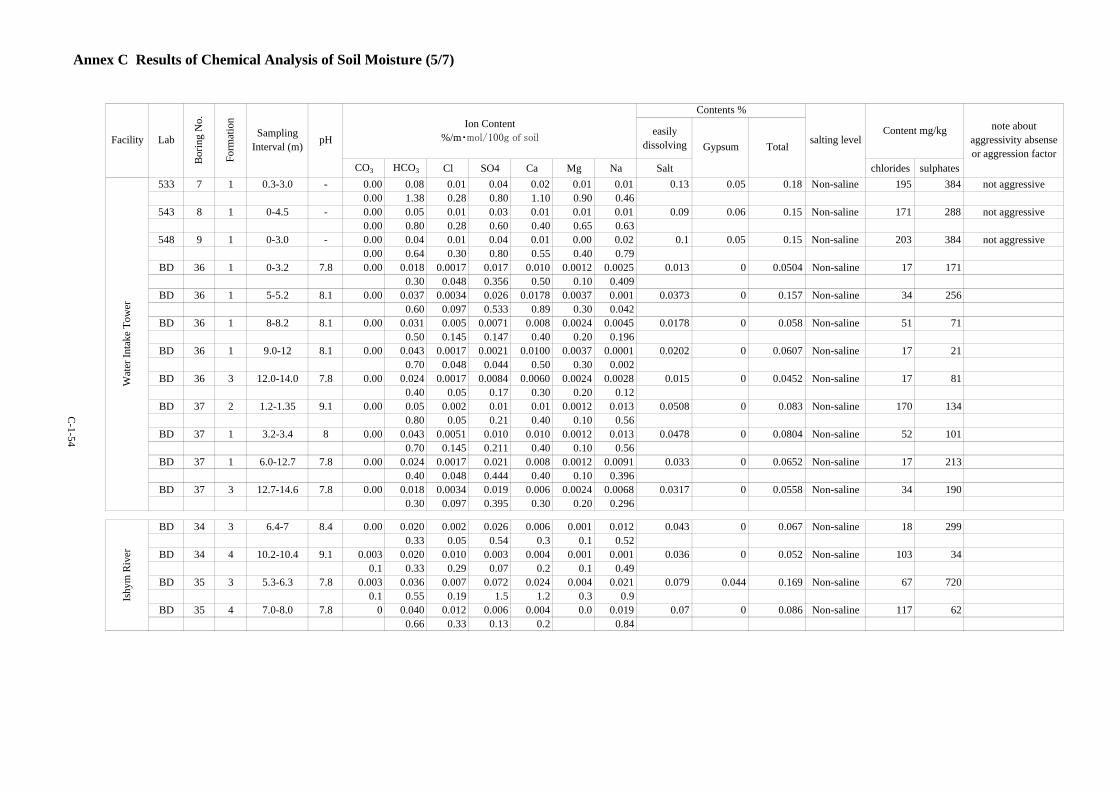
Annex C Results of Chemical Analysis of Soil Moisture (5/7)
easilydissolving
CO3 HCO3 Cl SO4 Ca Mg Na Salt chlorides sulphates
Content mg/kg
Contents %Ion Content
%/m・mol/100g of soilGypsum Total salting level
note aboutaggressivity absenseor aggression factor
SamplingInterval (m) pHFacility Lab
Bor
ing
No.
Form
atio
n
533 7 1 0.3-3.0 - 0.00 0.08 0.01 0.04 0.02 0.01 0.01 0.13 0.05 0.18 Non-saline 195 384 not aggressive0.00 1.38 0.28 0.80 1.10 0.90 0.46
543 8 1 0-4.5 - 0.00 0.05 0.01 0.03 0.01 0.01 0.01 0.09 0.06 0.15 Non-saline 171 288 not aggressive0.00 0.80 0.28 0.60 0.40 0.65 0.63
548 9 1 0-3.0 - 0.00 0.04 0.01 0.04 0.01 0.00 0.02 0.1 0.05 0.15 Non-saline 203 384 not aggressive0.00 0.64 0.30 0.80 0.55 0.40 0.79
BD 36 1 0-3.2 7.8 0.00 0.018 0.0017 0.017 0.010 0.0012 0.0025 0.013 0 0.0504 Non-saline 17 1710.30 0.048 0.356 0.50 0.10 0.409
BD 36 1 5-5.2 8.1 0.00 0.037 0.0034 0.026 0.0178 0.0037 0.001 0.0373 0 0.157 Non-saline 34 2560.60 0.097 0.533 0.89 0.30 0.042
BD 36 1 8-8.2 8.1 0.00 0.031 0.005 0.0071 0.008 0.0024 0.0045 0.0178 0 0.058 Non-saline 51 710.50 0.145 0.147 0.40 0.20 0.196
BD 36 1 9.0-12 8.1 0.00 0.043 0.0017 0.0021 0.0100 0.0037 0.0001 0.0202 0 0.0607 Non-saline 17 210.70 0.048 0.044 0.50 0.30 0.002
BD 36 3 12.0-14.0 7.8 0.00 0.024 0.0017 0.0084 0.0060 0.0024 0.0028 0.015 0 0.0452 Non-saline 17 810.40 0.05 0.17 0.30 0.20 0.12
BD 37 2 1.2-1.35 9.1 0.00 0.05 0.002 0.01 0.01 0.0012 0.013 0.0508 0 0.083 Non-saline 170 1340.80 0.05 0.21 0.40 0.10 0.56
BD 37 1 3.2-3.4 8 0.00 0.043 0.0051 0.010 0.010 0.0012 0.013 0.0478 0 0.0804 Non-saline 52 1010.70 0.145 0.211 0.40 0.10 0.56
BD 37 1 6.0-12.7 7.8 0.00 0.024 0.0017 0.021 0.008 0.0012 0.0091 0.033 0 0.0652 Non-saline 17 2130.40 0.048 0.444 0.40 0.10 0.396
BD 37 3 12.7-14.6 7.8 0.00 0.018 0.0034 0.019 0.006 0.0024 0.0068 0.0317 0 0.0558 Non-saline 34 1900.30 0.097 0.395 0.30 0.20 0.296
BD 34 3 6.4-7 8.4 0.00 0.020 0.002 0.026 0.006 0.001 0.012 0.043 0 0.067 Non-saline 18 2990.33 0.05 0.54 0.3 0.1 0.52
BD 34 4 10.2-10.4 9.1 0.003 0.020 0.010 0.003 0.004 0.001 0.001 0.036 0 0.052 Non-saline 103 340.1 0.33 0.29 0.07 0.2 0.1 0.49
BD 35 3 5.3-6.3 7.8 0.003 0.036 0.007 0.072 0.024 0.004 0.021 0.079 0.044 0.169 Non-saline 67 7200.1 0.55 0.19 1.5 1.2 0.3 0.9
BD 35 4 7.0-8.0 7.8 0 0.040 0.012 0.006 0.004 0.0 0.019 0.07 0 0.086 Non-saline 117 620.66 0.33 0.13 0.2 0.84
Ishy
m R
iver
Wat
er In
take
Tow
er
C-1-54
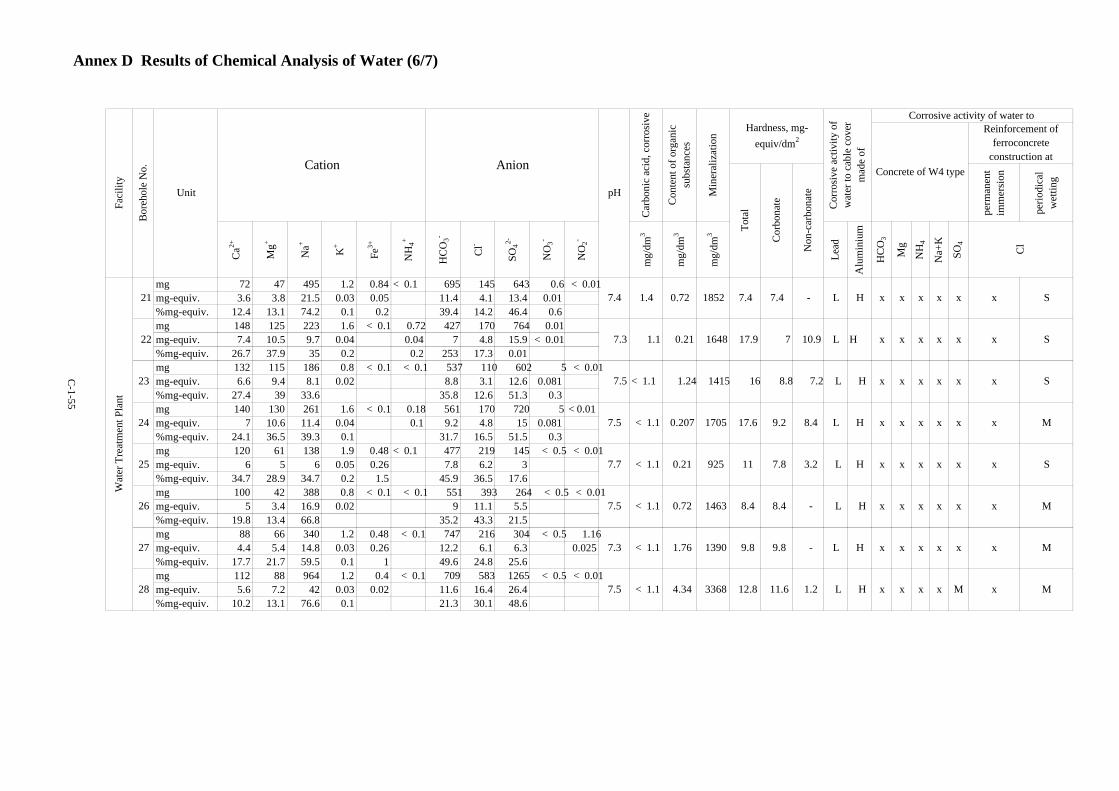
Annex D Results of Chemical Analysis of Water (6/7)
perm
anen
tim
mer
sion
perio
dica
lw
ettin
g
Ca2+
Mg+
Na+
K+
Fe3+
NH
4+
HC
O3-
Cl-
SO42-
NO
3-
NO
2-
mg/
dm3
mg/
dm3
mg/
dm3
Lead
Alu
min
ium
HC
O3
Mg
NH
4
Na+
K
SO4
mg 72 47 495 1.2 0.84 < 0.1 695 145 643 0.6 < 0.01mg-equiv. 3.6 3.8 21.5 0.03 0.05 11.4 4.1 13.4 0.01%mg-equiv. 12.4 13.1 74.2 0.1 0.2 39.4 14.2 46.4 0.6mg 148 125 223 1.6 < 0.1 0.72 427 170 764 0.01mg-equiv. 7.4 10.5 9.7 0.04 0.04 7 4.8 15.9 < 0.01%mg-equiv. 26.7 37.9 35 0.2 0.2 253 17.3 0.01mg 132 115 186 0.8 < 0.1 < 0.1 537 110 602 5 < 0.01mg-equiv. 6.6 9.4 8.1 0.02 8.8 3.1 12.6 0.081%mg-equiv. 27.4 39 33.6 35.8 12.6 51.3 0.3mg 140 130 261 1.6 < 0.1 0.18 561 170 720 5 <0.01mg-equiv. 7 10.6 11.4 0.04 0.1 9.2 4.8 15 0.081%mg-equiv. 24.1 36.5 39.3 0.1 31.7 16.5 51.5 0.3mg 120 61 138 1.9 0.48 < 0.1 477 219 145 < 0.5 < 0.01mg-equiv. 6 5 6 0.05 0.26 7.8 6.2 3%mg-equiv. 34.7 28.9 34.7 0.2 1.5 45.9 36.5 17.6mg 100 42 388 0.8 < 0.1 < 0.1 551 393 264 < 0.5 < 0.01mg-equiv. 5 3.4 16.9 0.02 9 11.1 5.5%mg-equiv. 19.8 13.4 66.8 35.2 43.3 21.5mg 88 66 340 1.2 0.48 < 0.1 747 216 304 < 0.5 1.16mg-equiv. 4.4 5.4 14.8 0.03 0.26 12.2 6.1 6.3 0.025%mg-equiv. 17.7 21.7 59.5 0.1 1 49.6 24.8 25.6mg 112 88 964 1.2 0.4 < 0.1 709 583 1265 < 0.5 < 0.01mg-equiv. 5.6 7.2 42 0.03 0.02 11.6 16.4 26.4%mg-equiv. 10.2 13.1 76.6 0.1 21.3 30.1 48.6
C-1-55
Unit
Bor
ehol
e N
o.
Faci
lity
Non
-car
bona
te
Cation Anion
Cor
rosi
ve a
ctiv
ity o
fw
ater
to c
able
cov
erm
ade
of
Concrete of W4 type
pH
Car
boni
c ac
id, c
orro
sive
Con
tent
of o
rgan
icsu
bsta
nces
Min
eral
izat
ion
Hardness, mg-equiv/dm2
Tota
l
Cor
bona
te
Cl
Reinforcement offerroconcrete
construction at
Corrosive activity of water to
23
24
25
26
27
28 M x Mx x x x
M
7.5 < 1.1 4.34 3368 12.8 11.6 1.2 L H
x x x xL H x x
x x M
7.3 < 1.1 1.76 1390 9.8 9.8 -
x x x x
x S
< 1.1 0.72 1463 8.4 8.4 - L H
x x x x
x M
7.7 < 1.1 0.21 925 11 7.8 3.2 L
x x xL H x x
H x
x x S
7.5 < 1.1 0.207 1705 17.6 9.2 8.4
x x x x
S
7.5 < 1.1 1.24 1415 16 8.8 7.2 L H
x x x xL H x x
x x S
7.3 1.1 0.21 1648 17.9 7 10.9
x x x x7.4 - L H1.4 0.72 1852 7.4
Wat
er T
reat
men
t Pla
nt
7.421
22
7.5

Annex D Results of Chemical Analysis of Water (7/7)
perm
anen
tim
mer
sion
perio
dica
lw
ettin
g
Ca2+
Mg+
Na+
K+
Fe3+
NH
4+
HC
O3-
Cl-
SO42-
NO
3-
NO
2-
mg/
dm3
mg/
dm3
mg/
dm3
Lead
Alu
min
ium
HC
O3
Mg
NH
4
Na+
K
SO4
Unit
Bor
ehol
e N
o.
Faci
lity
Non
-car
bona
te
Cation Anion
Cor
rosi
ve a
ctiv
ity o
fw
ater
to c
able
cov
erm
ade
of
Concrete of W4 type
pH
Car
boni
c ac
id, c
orro
sive
Con
tent
of o
rgan
icsu
bsta
nces
Min
eral
izat
ion
Hardness, mg-equiv/dm2
Tota
l
Cor
bona
te
Cl
Reinforcement offerroconcrete
construction at
Corrosive activity of water to
mg 160 245 931 0.4 < 0.1 < 0.1 1175 1202 738 < 0.5 0.46mg-equiv. 8 20 41 0.01 19.3 33.9 15.4 0.1%mg-equiv. 11.6 29 59.4 28.1 49.4 22.5mg 140 271 830 0.4 0.1 < 0.1 979 1205 720 < 0.5 < 0.01mg-equiv. 7 22 36 0.01 0.01 16.1 33.9 15%mg-equiv. 10.8 33.8 55.4 24.8 52.2 23mg 120 184.8 1247 1.5 < 0.1 0.18 1456 1120 970 < 0.5 < 0.01mg-equiv. 6 15.4 54.2 0.04 0.01 23.9 31.5 20.2%mg-equiv. 7.9 20.4 71.6 0.1 31.6 41.7 26.7mg 168 105 900 17.6 0.48 0.18 967 872 776 < 0.5 < 0.01mg-equiv. 8.4 8.6 39 0.45 0.03 0.01 15.9 24.6 16.2%mg-equiv. 14.9 15.2 69 0.8 0.1 28 43.4 28.6mg 76 127 794 0.8 < 0.1 5.4 808 539 983 36.2 0.6mg-equiv. 3.8 10.4 35 0.02 0.3 13.2 15.2 20.5 0.58 0.013%mg-equiv. 7.7 21 70.7 0.6 26.7 30.7 41.4 1.2
mg 156 53 48 5.4 < 0.1 0.82 470 229 4.8 < 0.5 < 0.01mg-equiv. 7.8 4.4 2.1 0.14 0.05 7.7 6.5 0.1%mg-equiv. 53.8 30.4 14.5 1 0.3 53.8 45.5 0.7mg 265 84 229 5.5 < 0.1 0.56 549 592 226 < 0.5 < 0.01mg-equiv. 13.2 7 10 0.14 0.03 9 16.7 4.7%mg-equiv. 43.5 23 32.9 0.5 0.1 29.6 54.9 15.5
Note: " x " means "not corrosive", " L " means "low corrosive", " S " means "slightly corrosive", " M " means "medium corrosive", " H " means "high corrosive"
C-1-56
Mx
x Sx x
M
29
30
31
x x xL H x x
x
7.4 < 1.1 42.1 1677 20.2 9 11.2
x xH7.2 1.1 0.72 966 12.2 7.7 4.5 L
x x x xL H x x
x x M
7.5 - 2.79 2963 14.2 13.2 1
x x x x
M
7.3 < 1.1 10.55 3322 17 15.9 1.1 L H
x x x xL H x x
x x M
7.3 < 1.1 4.86 4374 21.4 21.4 -
x x x x
M
7.2 < 1.1 3.83 3656 29 16.1 12.9 L H
x x x xL H x x7.2 < 1.1 5.38 3864 28 19.3 8.7
32
Sew
erag
e Tr
eatm
ent P
lant
Ishy
m R
iver
33
34
35

C-1-57
Annex E Concrete Permeability Attributes
Direct Indirect Conventional signs of a concrete permeability
attribute Concrete type according to
its water-proof ability
Filtration ratio, cm/s (at moisture equilibrium), Kf
Water absorption, % by
weight
Water-cement proportion,
not larger than
N – concrete of normal permeability W4 from 2 x 10⁻⁹
to 7 x 10⁻⁹ from 4.7 to 5.7 0.6
L – concrete of low permeability W6 from 6 x 10⁻¹⁰
to 2 x 10⁻⁹ from 4.2 to 4.7 0.55
V – concrete of very low permeability W8 from 1 x 10⁻¹⁰
to 6 x 10⁻¹⁰ up to 4.2 0.45
Note: 1. Filtration ratio and concrete type according to its water-proof ability should be defined by GOST 12730.5-84; concrete water-absorption – by GOST 12730.3-78
2. Water-absorption and water-cement proportion attributes (given in table 1) are referred to hard concrete. Light concrete water-absorption should be defined by multiplying of the values from table 1 by the coefficient, equal to the ratio of hard concrete medium density to light concrete medium density. Water-cement proportion of light concrete should be defined by multiplying of the value given in table 1 by 1.3.
3. Further on in the text, the value of concrete permeability is given according to the water-proof ability attribute.
Source: USSR(1986) SNiP 2.03.11-85 Protection from corrosion for building construction


