6
Appendix 13.1 Nonparametric Methods Using MINITAB Appendix 13.2 Nonparametric Methods Using MegaStat Chapter 13 Appendix

Appendix 13.1 Nonparametric Methods Using MINITAB
Appendix 13.2 Nonparametric Methods Using MegaStat
Chapter 13Appendix
bow83755_app13_001-006.qxd 9/6/08 9:05 PM Page 13A-1
13A-2 Chapter 13 Nonparametric Methods
APPENDIX 13.1 ■ Nonparametric Methods Using MINITABThe instruction blocks in this section each begin by describ-ing the entry of data in the MINITAB Data window.Alternatively, the data may be loaded directly from the datadisk included with the text. The appropriate data file name
is given at the top of each instruction block. Please refer toAppendix 1.1 for further information about entering data,saving data, and printing results.
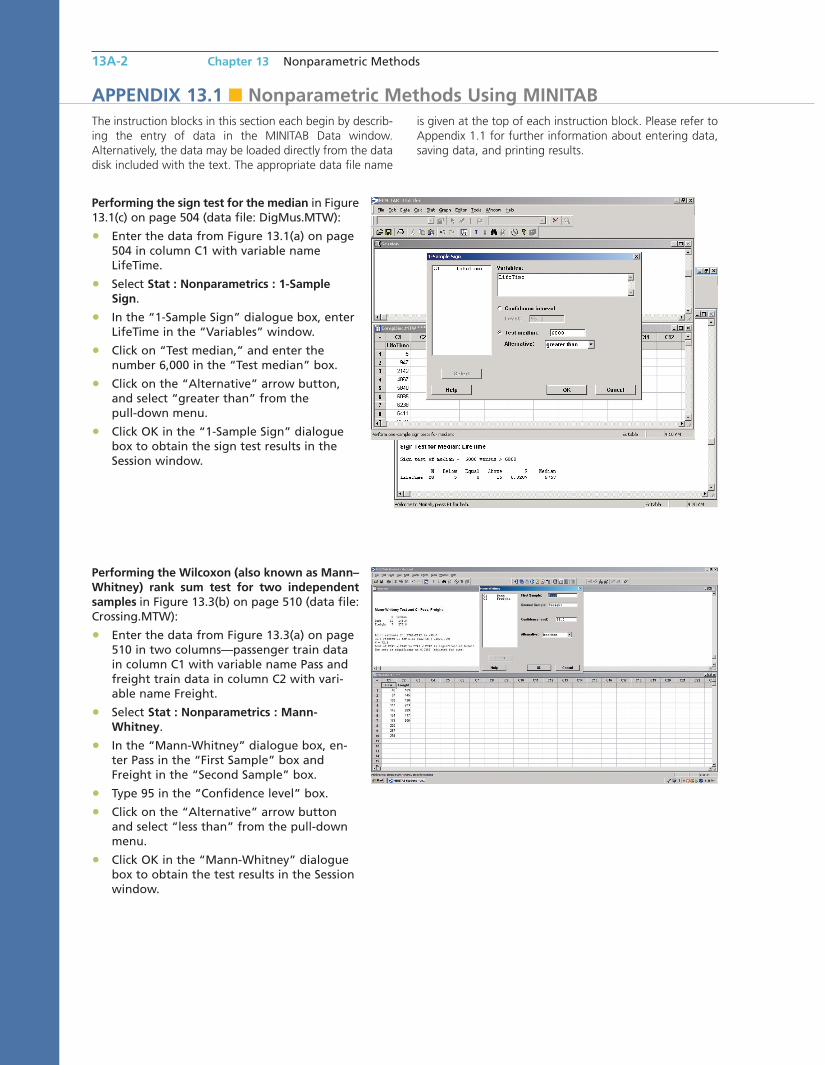
Performing the sign test for the median in Figure13.1(c) on page 504 (data file: DigMus.MTW):
• Enter the data from Figure 13.1(a) on page504 in column C1 with variable nameLifeTime.
• Select Stat : Nonparametrics : 1-SampleSign.
• In the “1-Sample Sign” dialogue box, enterLifeTime in the “Variables” window.
• Click on “Test median,” and enter thenumber 6,000 in the “Test median” box.
• Click on the “Alternative” arrow button,and select “greater than” from the pull-down menu.
• Click OK in the “1-Sample Sign” dialoguebox to obtain the sign test results in theSession window.
Performing the Wilcoxon (also known as Mann–Whitney) rank sum test for two independentsamples in Figure 13.3(b) on page 510 (data file:Crossing.MTW):
• Enter the data from Figure 13.3(a) on page510 in two columns—passenger train datain column C1 with variable name Pass andfreight train data in column C2 with vari-able name Freight.
• Select Stat : Nonparametrics : Mann-Whitney.
• In the “Mann-Whitney” dialogue box, en-ter Pass in the “First Sample” box andFreight in the “Second Sample” box.
• Type 95 in the “Confidence level” box.
• Click on the “Alternative” arrow buttonand select “less than” from the pull-downmenu.
• Click OK in the “Mann-Whitney” dialoguebox to obtain the test results in the Sessionwindow.
bow83755_app13_001-006.qxd 9/6/08 9:05 PM Page 13A-2

Appendix 13.1 Nonparametric Methods Using MINITAB 13A-3
Conducting the Wilcoxon signed ranks test forpaired differences in Figure 13.5(b) on page 514(data file: Repair.MTW):
• Enter the garage repair data from Figure 13.5(a) on page 514 in twocolumns—garage 1 cost estimates in column C1 with variable name Garage1and garage 2 cost estimates in column C2with variable name Garage2.
• Select Calc : Calculator.
• In the “Calculator” dialogue box, enter G1 � G2 in the “Store result in variable” box.
• Enter Garage1 � Garage2 in the”Expression” window.
• In the Calculator dialogue box, click OK tostore the repair cost differences in columns G1 and G2.
• Select Stat : Nonparametrics : 1-SampleWilcoxon.
• In the “1-Sample Wilcoxon” dialogue box,enter ‘G1 � G2’ in the “Variables” windowby selecting G1 � G2 from the variables list.
• In the “1-Sample Wilcoxon” dialogue box,select “Test median” and enter the number0 in the “Test median” box.
• Click the “Alternative” arrow button, andselect “less than” from the pull-downmenu.
• Click OK in the “1-Sample Wilcoxon” dia-logue box to obtain test results in theSession window.
Conducting the Kruskal–Wallis H test for com-paring several populations in Figure 13.6 onpage 518 (data file: TrainingTypes.MTW):
• Enter the training type data from Table13.8 (page 517) in two columns—learningscores in column C1 with variable nameScore and training type (A, B, or C) in col-umn C2 with variable name Type.
• Select Stat : Nonparametrics : Kruskal-Wallis.
• In the “Kruskal-Wallis” dialogue box, enterMileage in the “Response” box and Type inthe “Factor” box.
• Click OK in the “Kruskal-Wallis” dialoguebox to obtain test results in the Sessionwindow.
bow83755_app13_001-006.qxd 17/6/08 7:49 PM Page 13A-3


Appendix 13.2 Nonparametric Methods Using MegaStat 13A-5
Performing the Wilcoxon signed ranks testfor paired differences in Table 13.7 on page517 (data file: AdStudy.xls):
• Enter the advertising study data inTable 13.7. Enter the preexposure scoresin column A with label PreAttitude andthe postexposure scores in column B withlabel PostAttitude.
• Select MegaStat : Nonparametric Tests :Wilcoxon Signed Ranks Test.
• In the “Wilcoxon Signed Ranks Test”dialogue box, click in the “Group 1” boxto make it active, and use theAutoExpand feature to enter the rangeA1 to A11 in the “Group 1” box.
• Click in the “Group 2” box to make itactive, and use the AutoExpand featureto enter the range B1 to B11 in the“Group 2” box.
• Select the desired alternative (in this case“not equal”) from the drop-down menuin the “Alternative” box.
• Check the “Correct for ties” checkbox.
• Click OK in the “Wilcoxon Signed RanksTest” dialogue box.
Conducting the Kruskal–Wallis H test forcomparing several populations in Table13.12 on page 519 (data file: GolfBall.xls):
• Enter the golf ball durability data incolumns A, B, C, and D as shown in thescreenshot with labels Alpha, Best,Century, and Divot.
• Select MegaStat : Nonparametric Tests :Kruskal-Wallis Test.
• In the “Kruskal-Wallis Test” dialoguebox, enter (by dragging with themouse) the range A1 to D6. Each col-umn in the selected range will be con-sidered by MegaStat as a group to becompared to the other groups.
• Check the “Correct for ties” checkbox.
• Click OK in the “Kruskal-Wallis Test”dialogue box.
bow83755_app13_001-006.qxd 17/6/08 7:49 PM Page 13A-5

13A-6 Chapter 13 Nonparametric Methods
Finding the Spearman’s rank correlation co-efficient in Exercise 13.30 on page 522 (datafile: SalesRank.xls):
• Enter the sales data in Exercise 13.30 incolumns A and B. Enter the manager’srankings in column A with label“MgrRank, x” in cell A1 and the unitssold in column B with label “UnitSold,y” in cell B1.
• Select MegaStat : Nonparametric Tests :Spearman Coefficient of RankCorrelation.
• In the “Spearman Coefficient of RankCorrelation” dialogue box, enter (bydragging with the mouse) the rangeA1 to B11. Here each column in the se-lected range will be considered byMegaStat to be a separate variable.
• Check the “Correct for ties” checkbox.
• Click OK in the “Spearman Coefficientof Rank Correlation” dialogue box.
bow83755_app13_001-006.qxd 17/6/08 7:49 PM Page 13A-6


